QuickLinks -- Click here to rapidly navigate through this document
DOUGLAS EMMETT PORTFOLIO
PORTFOLIO AND MARKET EVALUATION
Prepared by:
![]()
September 1, 2006
DOUGLAS EMMETT PORTFOLIO
PORTFOLIO AND MARKET EVALUATION
| | | | ||
|---|---|---|---|---|
| TABLE OF CONTENTS | ||||
| • | EXECUTIVE SUMMARY | |||
| • | CALIFORNIA OVERVIEW | |||
| • | LOS ANGELES OVERVIEW | |||
| • | LOS ANGELES OFFICE MARKET OVERVIEW | |||
| • | LOS ANGELES OFFICE SUBMARKETS/ DOUGLAS EMMETT PORTFOLIO OVERVIEW | |||
| • | HAWAII OVERVIEW | |||
| • | HONOLULU OFFICE MARKET OVERVIEW | |||
| • | HONOLULU OFFICE SUBMARKETS/ DOUGLAS EMMETT PORTFOLIO OVERVIEW | |||
| • | MULTI-FAMILY HOLDINGS | |||
| • | LOS ANGELES MULTI-FAMILY MARKET OVERVIEW | |||
| • | OAHU MULTI-FAMILY MARKET OVERVIEW | |||
![]()
100 Wilshire Boulevard, Suite 1600, Santa Monica, CA 90401 -- (310) 526-2450 -- (310) 587-2578 fax
101 California Street, Suite 2950, San Francisco, CA 94111 -- (415) 228-2900 -- (415) 228-3023 fax
| | | | ||
|---|---|---|---|---|
| Roy H. March CEO | Jeffrey N. Weber Senior Managing Director | Shannon W. Ching Senior Vice President |
| | | |
|---|---|---|
| Greg M. Goldstein Associate | Ian T. McCullough Analyst |
EXECUTIVE SUMMARY
Eastdil Secured has been asked by Douglas Emmett Realty Advisors ("Douglas Emmett" or "the Company") to assist in the evaluation of its 11,554,297 square foot office and 2,868-unit multi-family portfolio (the "Portfolio"). In the following paragraphs and sections, Eastdil Secured has provided an evaluation of (1) the fundamental economic drivers within Los Angeles and Hawaii, (2) the office and multi-family markets within Los Angeles and Hawaii and (3) the Douglas Emmett individual assets relative to the markets in which they are located. The evaluation is based on research and information provided by third parties as well as Eastdil Secured's extensive real estate transaction experience and expertise within the office and multi-family capital markets.
PORTFOLIO SUMMARY: Douglas Emmett has acquired a portfolio of office and multi-family properties primarily located in major Los Angeles markets with a focus on the following prominent characteristics: 1) Markets that are most proximate to high-end, executive housing and key amenities; 2) Markets with significant barriers to entry; 3) Acquiring a critical mass in its markets in order to provide competitive advantages through operating and leasing leverage; 4) Broadly multi- tenanted buildings where tenants are less rent sensitive and where no single tenant commands excess leverage; and 5) Markets close to its own senior management to provide further competitive advantages. In all nine Los Angeles County markets in which Douglas Emmett has a presence, it has between 12% and 76% of the top tier office square footage. In four of these nine markets, Douglas Emmett's presence is greater than 50% of the top tier office footage. In aggregate, the Douglas Emmett portfolio enjoys a rental premium of 11.8% compared to the various Los Angeles markets in which they are located.
PORTFOLIO OPERATING SYNERGY: As the largest owner of Westside real estate, Douglas Emmett benefits from operating synergies, in leasing, operating costs, and in the ability of management to focus and react quickly to emerging market opportunities. Upon acquisition, Douglas Emmett has consistently been able to reduce operating costs. While it is unrealistic to assume monopoly control of a market pushes rents to above economic levels, Douglas Emmett's position in its core markets provides the company with advantages in information, relationships and leverage in tenant negotiations as well as a greater degree of flexibility in accommodating changing tenant needs. As a result, Douglas Emmett's assets run at premiums in both rent and occupancy to the broader class A markets in which they compete. Our calculations show that Douglas Emmett owns approximately 40% of the first tier assets in their core markets. We do not believe any other public company has attained such a market share in a gateway city. This is an important distinction when comparing Douglas Emmett to other office REITs.
LOS ANGELES: Los Angeles is one of the most important financial, trade and cultural centers in the United States, and benefits from one of the strongest and most diverse economies in the world. If the five-county Los Angeles area were a sovereign nation, it would rank as the world's 15th largest economy with $755 billion in gross domestic product in 2005. For comparison, the countries of Australia, the Netherlands, and Taiwan have gross products of $708, $625 and $346 billion, respectively.
WEST LOS ANGELES OFFICE MARKET: The "premier" Los Angeles office locations are found in a series of "edge cities" in the West Los Angeles area as opposed to the central business district. These West Los Angeles markets include Santa Monica, Westwood, Beverly Hills, Century City, the Olympic Corridor and Brentwood, which are distinguished by virtue of high-end, executive housing, superior amenities and coastal proximity. Collectively, these markets comprise 43.2 million square feet of Class A and B office space, and carry an average asking market rent of $36.00 per square foot per year, as compared to the Los Angeles County market's average asking rents of $29.17 per square foot per month.
1
SAN FERNANDO VALLEY OFFICE MARKET: The San Fernando Valley office market is located in the northwestern region of the Los Angeles metropolitan area and contains approximately 22.3 million square feet of Class A and B office space (average asking market rent of $26.76 per square foot per month). Benefiting from its close proximity to the West Los Angeles office market, the San Fernando Valley office market has historically been an affordable cost alternative location. However, in recent years the region has become more of a self-contained, sub-metropolis with the office market evolving into a major business center. Due to strict zoning regulations, the primary business districts are contained mainly within Woodland Hills, Sherman Oaks and Encino (most of the office inventory located outside of these areas is comprised of smaller mid- and low-rise buildings of less than 50,000 square feet). Additionally, the recent development of upscale, master-planned residential communities such as Santa Clarita, Valencia and Newhall, have attracted affluent, well-educated home buyers in search of more cost effective housing. As such, this migration of a high quality labor force has attracted a substantial number of businesses to the area, which have in turn increased demand for quality office space.
BARRIERS TO ENTRY: Unlike most other gateway cities, the most desired Los Angeles office markets are typically edge city markets—more specifically the markets containing the Douglas Emmett portfolio, which service high-margin businesses willing to pay premium rents for quality office space—are governed by strict development ordinances prohibiting future office development. Based on current zoning ordinances and city specific plans, which specify building height limits as well as FAR restrictions, many of the Douglas Emmett properties are irreplaceable. Even if these city ordinances were changed and permitted the physical duplication, the current high cost of land and construction make office development highly unlikely. These barriers enhance rent growth prospects and limit cyclical operating risk. We are not aware of any portfolio of comparison, public or private, that offers anything close to this level of market penetration within a tier one market with such a supply constrained setting. Additionally, since much of the best inventory is in what we believe to be long-term investors' hands, it is difficult to acquire single assets—let alone market positions of any consequence. We believe this scarcity value enhances the value of the Portfolio.
REPLACEMENT COST: While a majority of the Douglas Emmett assets are considered irreplaceable due to 1) a lack of developable land in the marketplace and 2) restrictive zoning ordinances/city specific plans, the high cost of development within Los Angeles and Hawaii further make these buildings cost prohibitive to replicate. Within Los Angeles, hard and soft construction costs range from $375 to $425 per square foot for buildings with structured/subterranean parking. Ascribing a West Los Angeles land value of $150 to $175 per FAR square foot (while developable land of size is rare in Los Angeles, currently there is a parcel of land entitled for 900,000 square feet of office space located in Playa Vista—West Los Angeles adjacent and considered an inferior location compared to Douglas Emmett assets—under contract for $125 per FAR square foot), replacement costs range from $525 to $600 per square foot, substantially higher than values ascribed to the Douglas Emmett portfolio. It is noteworthy to mention that development costs in Hawaii would be considerably higher due to additional transportation and labor costs as well as higher sales taxes.
OFFICE VS. RESIDENTIAL DEVELOPMENT: In addition to the limited developable land and prohibitive zoning regulations within the Douglas Emmett markets, the high cost of land and construction does not currently justify office development. New residential developments continue to generate significantly higher returns as compared to office developments. Condo buyers within the Westside are paying as much as $1,200 per square foot for luxury condos. In Century City, the Related Companies, a New York based condo converter, purchased the St. Regis Hotel in January 2005 for approximately $250 a FAR foot with projected condo sale prices of approximately $1,000 to $1,250 per square foot. In addition, in 2004 Westfield purchased Gateway West, a 14-story 280,500 square foot office building located adjacent to the Westfield Century City Shopping Center, to make way for a $500 million 42-story tower mixed-use development with six floors of retail/office and 260 luxury
2
condominiums. It is noteworthy to mention that Century City is less favored as a residential area as compared to Santa Monica, Brentwood and Westwood (where Douglas Emmett owns a majority of their assets). As such, existing office buildings on the Westside are insulated from future supply and are positioned to benefit from a captive market where rental rates are well short of a level required to justify new construction.
RELATIVE ASSET QUALITY—LOCALLY: The relative quality of Douglas Emmett's assets within each market is critical to portfolio valuation. For example, in Santa Monica, Douglas Emmett owns 11% of the class A and B market square footage, however it owns six of the 10 top tier office buildings in the market, and its market share in the downtown Santa Monica market is over 45%. Similarly, while Douglas Emmett owns 45% of the West San Fernando Valley class A and B market, its share of the top tier square footage in the Warner Center/Woodland Hills market, which is the largest and most prestigious concentration of Class A space in the West Valley, is over 75%. The next two largest Westside landlords, EOP and JP Morgan, each have Westside portfolios that are roughly 60% smaller than the Douglas Emmett portfolio. Furthermore, none of the Los Angeles based public REITs, (Kilroy, Maguire) have more than 3.2 million square feet of class A space in the Douglas Emmett markets.
EMBEDDED RENT GROWTH: The portfolio has significant embedded rent growth when comparing existing contractual rents to current market rents within both the residential and office portfolios. The estimated embedded rent growth in the office portfolio represents a potential increase of approximately 14.5% in rents, and embedded rent growth within the apartments represents a potential increase of 32.4% in rents.
MARKET RENTAL RATE GROWTH: According to Torto Wheaton Research's Winter 2006 Office Outlook Report, Greater Los Angeles rental rates are projected to increase 5.5% by year-end 2006 with both the West Los Angeles and San Fernando Valley markets projected to outperform the rental rate growth of the overall Los Angeles market. Torto Wheaton forecasts a strong future for the Los Angeles Office market with a 5 year, 2006 through 2010, average annual rental growth rate projection of 5.2%.
HAWAII STORY: Douglas Emmett has recently developed a presence in the Hawaii office and residential markets. Similar to the opportunities that Douglas Emmett has realized in West Los Angeles, the strategy appears to be to acquire the leverage of critical mass in a supply constrained market with excellent growth prospects. Douglas Emmett has acquired two major office buildings in Downtown Honolulu and two major apartment communities. Douglas Emmett has pursued this strategy with a local partner as a continuation of their emphasis on placing senior level management in close proximity to their assets and markets.
MULTI-FAMILY PORTFOLIO: As of June 30, 2006, 15.3% of Douglas Emmet's annualized rent comes from its multifamily portfolio of 2,868 units, which consists of four of the top ten apartment communities (containing over 50 units) on the Westside and two of the largest apartment assets in suburban Honolulu containing a combined 1,098 units. Douglas Emmett's presence in each market positions them as one of the largest apartment owners in the market. Additionally, based on current zoning and land use restrictions, three of their four major Westside assets cannot be duplicated. As a result of Los Angeles and Santa Monica's respective rent control ordinances (both of which allow for market rents upon tenant move-out), embedded rent growth is over 30%, indicating a significant opportunity for future rent growth.
PROXIMITY TO EXECUTIVE HOUSING: Many business executives choose to reside within the West Los Angeles coastal communities. To attract such executives, many businesses are located in office markets within close proximity of prime coastal residential neighborhoods. Thus, the most desired office locations are in the West Los Angeles area (the areas in which Douglas Emmett has focused
3
their acquisitions). By contrast, in cities such as New York and San Francisco, the CBD commands higher rents and is considered a prime location for businesses.
CALIFORNIA OVERVIEW
Background: Since entering the Union in 1850, California has achieved a reputation as a destination for opportunity, quality of life and advancement. As the source of major economic expansions, California continually proves its dominance as the center for diversity, innovation and trade within the United States. As the most populous state in the nation with over 36.5 million residents, California continues to experience growth levels above the national average, providing the human resources necessary to pioneer new industries and diversify its culture. According to Claritas, California's population is expected to grow by 2.3 million residents, or 6.3%, over the next five years, versus 4.8% expected for the United States over the same period.
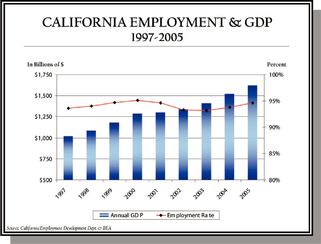
Gross Domestic Product ("GDP") and Employment: California's economic strength has been proven through its stable growth during volatile macroeconomic shifts. While the technology downturn in 2000 and the slowing of the economy over the last few years have largely impacted the rest of the nation, California continues to demonstrate steady growth. Since 1997, California has experienced consistent GDP growth, averaging approximately 6.0% per annum. Strong construction, agriculture and service-related industries have helped mitigate the economic slow down. According to the LAEDC, in 2005 California's GDP totaled over $1.6 trillion, a 6.9% increase from 2004. As illustrated in the table below, if California were a sovereign country, it would rank 8th in terms of GDP in the world, slightly behind Italy. In addition to this large and growing GDP, California has maintained a high employment rate. According to the California Employment Development Department, employment averaged 94% over the past five years within California. Moreover, during the same period, the population of California grew by 2.3 million people or approximately 6.6%, thus proving the economy's ability to absorb a significant immigration of new residents.
4
2005 Gross Product Comparisons
(2005 figures in billions of U.S. Dollars based on average exchange rates)
| Rank | Country/Economy | GDP | |||
|---|---|---|---|---|---|
| 1 | United States | $ | 12,486 | ||
| 2 | Japan | $ | 4,571 | ||
| 3 | Germany | $ | 2,797 | ||
| 4 | China (excluding Hong Kong) | $ | 2,225 | ||
| 5 | United Kingdom | $ | 2,202 | ||
| 6 | France | $ | 2,106 | ||
| 7 | Italy | $ | 1,766 | ||
| 8 | California | $ | 1,631 | ||
Source: LAEDC
*Theoretical ranking as if the area were a sovereign nation
Total Population & Growth
California vs United States
| Year | California Total | Rate* | United States, Total | Rate* | |||||
|---|---|---|---|---|---|---|---|---|---|
| 2000 | 33,871,648 | — | 281,421,906 | — | |||||
| 2006 | 36,579,455 | 298,021,266 | |||||||
| 2010 | 38,656,963 | 14.1 | % | 309,574,407 | 10.0 | % |
Source: Claritas 2006
*Rate over the previous 10-year period
Economic Landscape: California's broad economic base is anchored by Los Angeles in the South, San Francisco in the North and the agricultural stronghold of Central California. The following paragraphs outline the aforementioned economies and their individual strengths:
- •
- Home to over 18 million residents, the five-county Los Angeles area is the most populous metropolitan area in the nation. Recognized as a world-leading center of commerce, if the five-county Los Angeles area were a sovereign nation, it would rank as the world's 15th largest economy with $755 billion in GDP. The largest industry sectors, based on employment statistics, are business, financial, and professional management services, tourism, motion picture/television production, technology, bio-medical and international trade. The two major seaports of the Port of Los Angeles and the Port of Long Beach combined are considered to be the largest in North America, ranking first in tonnage and dollar volume. These two ports are also the primary entry points for trade with the Pacific Rim and therefore are the largest transfer points for products being shipped to and from China and Japan. Additionally, Los Angeles is considered to be the entertainment capital of the world, and is home to Hollywood as well as the movie and television studios of Warner Brothers, Universal, Fox and Disney.
- •
- The San Francisco Bay Area (the "Bay Area") is recognized as one of the nation's most important financial centers. The Bay Area serves as the national and regional headquarters for many of the world's leading financial institutions and corporations. In addition, the Bay Area is home to the Federal Reserve Bank of San Francisco and many private equity and venture capital firms that are key to fueling the region's economy. Surrounded on three sides by water, San Francisco houses approximately 750,000 residents in just 46.7 square miles.
- •
- California's core agricultural area lies in the Central Valley, where principal agricultural production includes raising cattle, avocados, broccoli, tomatoes, nuts, and raisins. The Central
5
Valley extends north to south nearly 450 miles from the Klamath Mountains to the Tehachapi Mountains between the Coastal and Sierra Nevada mountain ranges. This vast plain contains 75% of California's total irrigated agricultural area, and is the largest area of irrigated farmland west of the Rocky Mountains.
Affluent Population: California attracts a large portion of skilled labor, which invariably supports significantly higher wages than the United States average. For example, according to Claritas projections, 9.3% of households in California will earn over $150,000 in 2006 compared to the expected national average of 6.4%. In addition, California's mean household income is $74,900, a 14% premium above the United States mean household income of $65,800.
Percent of Household Income Levels
California vs U.S.
| Household Income | California | U.S. | |||
|---|---|---|---|---|---|
| Over $150,000 | 9.3 | % | 6.4 | % | |
| Over $250,000 | 2.8 | % | 2.0 | % | |
| Over $500,000 | 0.9 | % | 0.6 | % |
Source: Claritas 2006
SUMMARY
As the leader in international trade and advanced technology, California serves as a bellwether for the economic status of the United States. California's ability to maintain high employment levels, absorbing the continual influx of new residents, while fostering growth and prosperity prove its resilience to specific industry-based economic shifts.
LOS ANGELES OVERVIEW
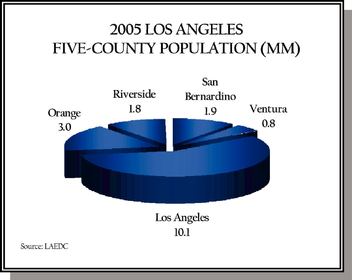
Widely recognized as a major financial, trade and cultural center, Los Angeles benefits from one of the strongest and most diverse economies in the world. As of December 31, 2005, the Los Angeles region had the largest metropolitan economy in California, the second largest metropolitan economy in the nation and accounted for more jobs than any U.S. region other than the New York metropolitan area. The largest industry sectors, based on employment statistics, are business, financial, and professional management services, tourism, motion picture/television production, technology, bio-medical and international trade. The Los Angeles area is comprised of five major counties totaling over 35,000 square miles. These counties include Los Angeles County (4,752 square miles), Orange County (948 square miles), Riverside County (7,304 square miles), San Bernardino County (20,106 miles) and Ventura County (2,208 miles).
If the five-county Los Angeles area were a sovereign nation, it would rank as the world's 15th largest economy with $755 billion in gross domestic product. Los Angeles County alone would rank 17th among the nations of the world with a GDP of $424 billion. The remaining framework of the five-county area includes Orange County ($162 billion), Riverside-San Bernadino Area ($129 billion), and Ventura County ($36 billion). For comparison, the countries of Australia, the Netherlands, and Taiwan have gross products of $708, $625 and $346 billion, respectively.
6
2005 GROSS PRODUCT COMPARISONS
(2005 figures in billions of U.S. Dollars based on average exchange rates)
| Rank | Country/Economy | GDP | |||
|---|---|---|---|---|---|
| 1 | United States | $ | 12,486 | ||
| 2 | Japan | $ | 4,571 | ||
| 3 | Germany | $ | 2,797 | ||
| 4 | China (excluding Hong Kong) | $ | 2,225 | ||
| 5 | United Kingdom | $ | 2,202 | ||
| 6 | France | $ | 2,106 | ||
| 7 | Italy | $ | 1,766 | ||
| 8 | Canada | $ | 1,130 | ||
| 9 | Spain | $ | 1,127 | ||
| 10 | South Korea | $ | 793 | ||
| 11 | Brazil | $ | 793 | ||
| 12 | India | $ | 775 | ||
| 13 | Mexico | $ | 768 | ||
| 14 | Russia | $ | 766 | ||
| 15* | Los Angeles 5-County Area | $ | 755 | ||
| 17* | Los Angeles County | $ | 424 | ||
Source: LAEDC
*Theoretical ranking as if the area were a sovereign nation
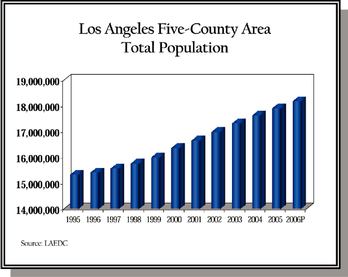
Population Growth: According to Claritas, if the Los Angeles five-county area were a separate state, it would have the fourth largest population in the United States with approximately 17.7 million residents. Only the states of California (36.2 million), Texas (22.7 million) and New York (19.3 million) would be more populous. Between 1995 and 2005, the five-county Los Angeles region experienced a gain of approximately 2.6 million residents, or a 16.8% total increase. This compares favorably to the nation as a whole, with the Los Angeles region outpacing the national average between 1995 and 2005 by 5.4%. In 2006, the LAEDC forecasts the Los Angeles five-county area's population to increase 1.5% to 18.2 million residents.
 |  |
Affluent Population: Los Angeles' position along the California coast combined with its diverse economy and temperate weather make it home to many of the nation's upscale communities. From 1995 to 2005, household income growth in Los Angeles County averaged 3.9% annually. The average
7
estimated 2006 household income in the City of Los Angeles is $64,000. In 2006, an estimated 7.5% of households have income over $150,000, 2.9% of households have income over $250,000 and 1.1% of households have income over $500,000.
Percent of Household Income Levels of Other Leading Cities
| Household Income | DE Markets | Los Angeles | New York | Washington, DC | San Francisco | U.S. | |||||||
|---|---|---|---|---|---|---|---|---|---|---|---|---|---|
| Over $150,000 | 17.8 | % | 7.5 | % | 7.7 | % | 11.0 | % | 16.1 | % | 6.4 | % | |
| Over $250,000 | 8.4 | % | 2.9 | % | 2.9 | % | 4.3 | % | 5.6 | % | 2.0 | % | |
| Over $500,000 | 3.9 | % | 1.1 | % | 1.1 | 1.6 | % | 2.1 | % | 0.6 | % |
Source: Claritas SiteReports 2006
As highlighted in the table below, income and education statistics for the Douglas Emmett markets reveal an educated, affluent, resident profile, well above the Los Angeles, California, and national averages.
Demographics
| Douglas Emmett Markets | 2006 E Mean HH Income | 2006E Median HH Income | 2005 Mean Home Price | Bachelor's Degree or higher | |||||||||
|---|---|---|---|---|---|---|---|---|---|---|---|---|---|
| Douglas Emmett Markets | |||||||||||||
| Beverly Hills | $ | 142,026 | $ | 81,567 | $ | 1,647,000 | 54.5 | % | |||||
| Brentwood1 | $ | 152,921 | $ | 98,193 | $ | 1,900,000 | 69.4 | % | |||||
| Westwood1 | $ | 100,394 | $ | 52,040 | $ | 1,598,000 | 66.4 | % | |||||
| Santa Monica | $ | 92,687 | $ | 58,715 | $ | 1,427,000 | 54.4 | % | |||||
| Sherman Oaks/Encino1 | $ | 83,450 | $ | 51,704 | $ | 885,000 | 38.1 | % | |||||
| Century City1 | $ | 124,692 | $ | 69,278 | $ | 795,000 | 48.7 | % | |||||
| Olympic Corridor1 | $ | 105,197 | $ | 67,675 | $ | 996,000 | 49.9 | % | |||||
| Woodland Hills | $ | 104,019 | $ | 74,188 | $ | 800,000 | 47.3 | % | |||||
| Burbank | $ | 71,115 | $ | 54,237 | $ | 662,000 | 29.0 | % | |||||
| Los Angeles—Long Beach—Santa Ana | $ | 68,908 | $ | 47,454 | $ | 529,000 | 2 | 24.5 | % | ||||
| San Francisco—Oakland—Freemont | $ | 94,558 | $ | 66,662 | $ | 716,000 | 2 | 44.6 | % | ||||
| New York—N. New Jersey—Long Island | $ | 65,505 | $ | 43,515 | $ | 445,000 | 2 | 27.2 | % | ||||
| Washington—Arlington—Alexandria | $ | 76,464 | $ | 48,347 | $ | 426,00 | 2 | 40.0 | % | ||||
| United States | $ | 65,849 | $ | 48,775 | $ | 219,000 | 2 | 24.6 | % | ||||
- 1.
- Unincorporated area, estimates based upon local Zip Codes
- 2.
- National Association of Realtors—median housing value
Source: Claritas Sitereports 2006 & Public Records
8
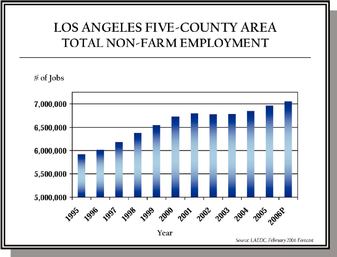
Job Growth: In addition to being one of the 15 largest economies in the world, the five-county Los Angeles area provides over 6.9 million jobs and is considered to have one of the most diverse employment bases. In fact, the Los Angeles-Long Beach-Santa Ana MSA accounts for more jobs than any other Metropolitan Statistical Area after the New York-Northern New Jersey-Long Island MSA. During the period from 1995 to 2005, total employment in the five-county Los Angeles region posted a net gain of over 1.0 million jobs, or a 17.7% total increase and is projected to increase by 1.3% to 7.1 million jobs in 2006. This statistic compares favorably to the nation as a whole, with the Los Angeles region outpacing the national average between 1995 and 2005 by 3.1%. Further more, according to the Los Angeles Economic Development Council, employment in the five-county area is estimated to have increased by 163,000 jobs from 2000 to 2004. For comparison, over the same period New York and San Francisco had net job losses of -181,000 and -94,700, respectively. We believe the economic future of Los Angeles is healthy with projected job growth of 1% over the 2006 through 2010 period, according to Torto Wheaton Research.
Los Angeles houses the international headquarters for many large companies including: Walt Disney, Occidental Petroleum, Northrop Grumman, Health-Net, Mattel, KB Home, Amgen Inc., and Hilton Hotels. Los Angeles is also home to numerous Fortune 500 companies and is recognized as the worldwide center of the entertainment industry.
Large and Diversified Economy: Los Angeles hosts an array of industries that include traditional and nontraditional sectors. Steel and iron co-exist with fiber optics and biogenetics. Los Angeles' ports and freeway system give the region a logistical advantage, which attracts firms whose footprints include the regional, national and international marketplaces. Firms have capitalized on this strength and have helped to grow the area into a hub of trade and logistics. The region is the nation's largest metro area for manufacturing. Los Angeles' largest manufacturing sectors are apparel and textiles, machinery and equipment, minerals and metals, and transportation equipment. Services which includes hospitality and leisure, healthcare, administrative and financial, legal and other professional service providers continue to be a main driver in Los Angeles, leading the way in total jobs. Other leading industries that drive the economy include trade, tourism and motion picture production. In addition, recent increases in federal defense spending have contributed to a sizable rebound by the aerospace industry. The economic base of the Los Angeles five-county area is summarized in the following table:
9
The Economic Base of the Los Angeles Five-County Area
2005 Annual Average of Non-Farm Employment (in 000s)
| Industry | LA County | Orange County | Riverside/ San Bernardino County | Ventura County | Five County Total | % | |||||||
|---|---|---|---|---|---|---|---|---|---|---|---|---|---|
| Total Nonfarm Employment | 4,020.1 | 1,483.1 | 1,173.2 | 287.2 | 6,963.6 | 100.0 | % | ||||||
| Mining | 4.1 | 0.6 | 1.2 | 0.7 | 6.6 | 0.1 | % | ||||||
| Construction | 145.9 | 95.5 | 118.9 | 18.4 | 378.7 | 5.4 | % | ||||||
| All Manufacturing* | 475.9 | 184.4 | 120.8 | 38.0 | 819.1 | 11.8 | % | ||||||
| Wholesale Trade | 212.6 | 82.8 | 45.4 | 11.8 | 352.6 | 5.1 | % | ||||||
| Retail Trade | 407.8 | 156.5 | 154.3 | 35.6 | 754.2 | 10.8 | % | ||||||
| Transport/Communications/Public Util. | 164.1 | 29.1 | 56.5 | 5.6 | 255.3 | 3.7 | % | ||||||
| Information | 213.2 | 32.7 | 13.6 | 6.8 | 266.3 | 3.8 | % | ||||||
| Finance Insurance/Real Estate | 245.5 | 132.6 | 46.4 | 23.5 | 448.0 | 6.4 | % | ||||||
| Services | 1,570.6 | 614.8 | 401.2 | 104.8 | 2,691.4 | 38.7 | % | ||||||
| Government | 580.4 | 154.1 | 214.9 | 42.0 | 991.4 | 14.2 | % |
Source: LAEDC
*Aerospace & Hi-Tech are included as part of Manufacturing.
Transportation and Foreign Trade: Los Angeles is the transportation and distribution hub for the southwest United States. The area is served by four major airports, two major seaports, 15 railroad companies, an extensive freeway network and an expanding Metro Rail mass transit system.
- •
- Air Transportation: The area's airports include: Los Angeles International Airport ("LAX"), Bob Hope Airport (Burbank/Glendale/Pasadena), Ontario International Airport, and Long Beach Airport. LAX is the 5th busiest airport in the world (behind Hartsfield-Jackson Atlanta International, Chicago O'Hare, London Heathrow, and Tokyo International) and has the 3rd largest passenger terminal in the United States, servicing over 75 major airlines and over 61 million passengers annually. Due to Los Angeles' strong presence as a place for international business and a tourist destination, over 17 million passengers traveled internationally through LAX in 2005.
| Airport | Location | 2005 Total Passengers | ||
|---|---|---|---|---|
| Hartsfield-Jackson Atlanta International | Atlanta | 85,907,423 | ||
| O'Hare International Airport | Chicago | 76,510,003 | ||
| London Heathrow Airport | London | 67,915,389 | ||
| Tokyo International (Haneda) Airport | Tokyo | 63,282,219 | ||
| Los Angeles International Airport | Los Angeles | 61,485,269 | ||
| Dallas-Fort Worth International Airport | Dallas | 59,064,360 | ||
| Charles De Gaulle International Airport | Paris | 53,756,200 | ||
| Frankfurt International Airport | Frankfurt | 52,219,412 | ||
| Las Vegas McCarran International Airport | Las Vegas | 44,280,190 | ||
| Schiphol Airport | Amsterdam | 44,163,098 |
Source: Airports Council International
- •
- Shipping: The area has two major seaports: the Port of Los Angeles and the Port of Long Beach. Combined, these ports are the largest in North America, ranking first in tonnage and dollar
10
volume. In fact, the Port of Los Angeles alone is the 8th busiest container port in the world. These two ports are also the primary entry points for trade with the Pacific Rim and therefore are the largest transfer points for products being shipped to and from Japan. The LAEDC forecasts that the total value of two-way international trade passing through the Los Angeles customs district will increase by 12.2% in 2006 over 2005 to $330.9 billion, with significant portions of this amount attributable to trade with Japan and China. Currently underway are two major redevelopment projects, totaling $1.1 and $1.3 billion, to enlarge both the Los Angeles and Long Beach Ports, respectively.
| Port | Tonnage CY 2005 | Annual Container Volume (in TEUs) CY 2005 | ||
|---|---|---|---|---|
| Los Angeles | 169.0 MMRTs | 7.5 Million TEUs | ||
| Long Beach | 80.7 MMTs | 6.7 Million TEUs |
- •
- Rail Transportation: The 15 railroads that link Southern California with the rest of the United States and Canada carry approximately eight billion tons of manufactured goods to and from the Los Angeles five-county area annually.
- •
- Metrolink and Metropolitan Transit Authority ("MTA"): Over $18 billion has been spent developing an approximate 530-mile, commuter rail system within the metropolitan area. Combined, the Metrolink and MTA rail system serves over 300,000 passengers daily.
- •
- Freeway Infrastructure: Los Angeles is recognized as having the largest and most utilized freeway system in the world. Over 900 miles of interstate and state freeways serve the metropolitan area, providing exceptional access for commerce and commuters.
SUMMARY
A world-leading center of commerce, Los Angeles is a vibrant metropolis attracting many people and businesses as a result of its economy, transportation systems, climate and cultural and recreational amenities. The area's unique role as a national trendsetter combined with its continuing population and economic growth indicates a long-term positive outlook for properties in the region.
11
LOS ANGELES OFFICE MARKET OVERVIEW
LOS ANGELES OFFICE MARKET
Los Angeles County contains approximately 368 million square feet of office space, the largest concentration of office space on the West Coast and the second largest in the nation. It is comprised of seven distinct regional markets: West Los Angeles, Downtown Los Angeles, South Bay, San Fernando Valley, Tri-Cities, the Hollywood/Wilshire Corridors, and the San Gabriel Valley.
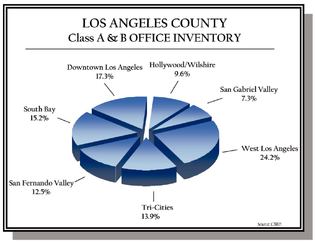
According to CB Richard Ellis, the combined class A and B office inventory is comprised of approximately 178.5 million square feet. As noted in the adjacent chart, the West Los Angeles market contains the greatest concentration of class A and B office space in Los Angeles County.
The table below summarizes the Los Angeles County office markets and highlights the performance of the Douglas Emmett markets versus the rest of Los Angeles County. As of second quarter 2006, the Douglas Emmett markets posted an average asking monthly rental rate of $32.14 per square foot and a vacancy rate of 6.8%, versus $26.14 and 12.2% for the markets where Douglas Emmett does not have a presence. According to Torto Wheaton Research's Winter 2006 Office Market Report, Greater Los Angeles rental rates are projected to increase 5.5% by year-end 2006, and the Douglas Emmett markets are projected to outperform the broader Los Angeles market. Furthering this trend, Torto Wheaton projects rental growth rates of 5.9%, 5.3%, 4.9%, and 4.2% in 2007, 2008, 2009, and 2010, respectively.
The table below highlights Class A and B statistics for the Douglas Emmett markets and the rest of Los Angeles County.
Los Angeles County Office Market—Class A & B
as of Second Quarter 2006
| Markets | Total Sq Ft. | % of Total | Asking Rental Rate/sf/mo | Occupancy | ||||||
|---|---|---|---|---|---|---|---|---|---|---|
| West Los Angeles | 43,183,281 | 24.2 | % | 36.00 | 93.1 | % | ||||
| San Fernando Valley | 22,291,618 | 12.5 | % | 26.76 | 92.8 | % | ||||
| Tri-Cities | 24,768,349 | 13.9 | % | 30.24 | 93.6 | % | ||||
| TOTAL | 90,243,248 | 50.6 | % | $ | 32.14 | 93.2 | % | |||
Downtown Los Angeles | 30,960,102 | 17.3 | % | 30.12 | 86.3 | % | ||||
| South Bay | 27,108,214 | 15.2 | % | 22.44 | 84.1 | % | ||||
| Hollywood/Wilshire | 17,194,280 | 9.6 | % | 25.68 | 90.7 | % | ||||
| San Gabriel Valley | 12,981,596 | 7.3 | % | 24.96 | 95.2 | % | ||||
| TOTAL | 88,244,192 | 49.4 | % | $ | 26.14 | 87.8 | % | |||
Total/Avg.(1) | 178,487,440 | 100.0 | % | $ | 29.17 | 90.5 | % | |||
Source: CB Richard Ellis
- (1)
- Weighted average based on total square feet of competitive office space.
12
It should also be noted that due to the climate and amenity base, most business executives choose to reside within the West Los Angeles coastal communities. As such, to avoid long commutes to work, many businesses are located in office markets within close proximity of prime coastal residential neighborhoods. Thus, many desired office locations are in the West Los Angeles area (Santa Monica, Beverly Hills, Century City, Brentwood and Westwood, the cities in which Douglas Emmett has focused their acquisitions), commanding the highest rent in the Greater Los Angeles area. This is highly irregular when compared to other cities like New York and San Francisco where the CBD commands higher rents and is considered a prime location for businesses.
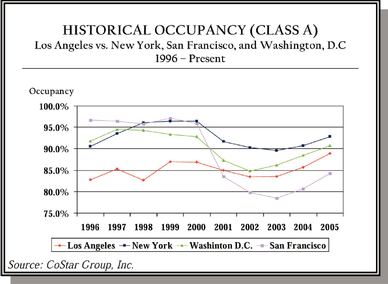
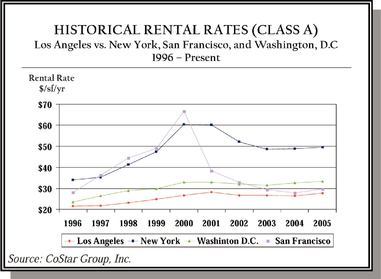
Nationally, major gateway cities such as Los Angeles, San Francisco, New York and Washington DC have historically experienced less volatile office rental rate and occupancy fluctuation; of course San Francisco's heavy dependence on technology caused it to experience record spikes in vacancy forcing dramatic decreases in rental rates. As highlighted in the graphs below from 4th quarter 2000 to 4th quarter 2003, San Francisco Class A office buildings experienced a rental rate decrease from approximately $66.74 per square foot per year to $29.49 per square foot per year, a 56% decrease, while vacancy increased significantly from 4.1% to 21.5%. After 9/11, Manhattan New York experienced a downturn in rental rates and occupancy; however, its resilient economy quickly recovered and stabilized in 2003. Washington DC has experienced similar stable rental rate trends to Los Angeles; however, its occupancy has substantially fluctuated in recent years. Overall Los Angeles has demonstrated the least volatility in rental rate and occupancy compared to the other major gateway cities—San Francisco, New York and Washington DC. This is directly attributed to Los Angeles' diverse economic base which is not overly exposed or dependent on any one specific industry.
 |  |
In addition to its seven major markets, the Los Angeles County office market is further defined by 59 distinct office submarkets located within the seven major markets according to CB Richard Ellis. These submarkets differ widely in terms of their desirability, tenant base, rental and occupancy rates and barriers to new construction and supply. Within Douglas Emmett's three Los Angeles County office markets (West Los Angeles, San Fernando Valley and Tri-Cities), Douglas Emmett has focused on what we believe are nine of the premier office submarkets in these markets and in Los Angeles County as a whole. Six of these submarkets, Santa Monica, Brentwood, Olympic Corridor, Westwood, Century City and Beverly Hills, are located in the West Los Angeles market. Two of these submarkets, Sherman Oaks/Encino and Warner Center/Woodland Hills, are located in the San Fernando Valley market, and one, the Burbank Media District, is located in the Tri-Cities market. These submarkets are distinguished by their high level of lifestyle amenities and proximity to high-end executive housing, features that have contributed to these submarkets historically achieving premium rents and higher occupancy levels than the other Los Angeles County office submarkets, as well as the Los Angeles County office market as a whole. The table below illustrates a comparison of the historical rental rates
13
and occupancy levels of Class-A office space in Douglas Emmett submarkets, the other Los Angeles County submarkets and the Los Angeles County office market as a whole.
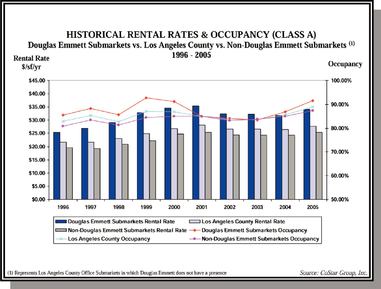
The decline in occupancies in Douglas Emmett's submarkets from 2000 to 2003 was the result of a combination of factors. A large amount of previously entitled office space was delivered to the market in 2000 and 2001, and such space, especially in Santa Monica and Century City, was largely occupied by firms created during the technology boom of the late 1990s. The combined impact of this new construction with the slowing of the technology sector and the general economic downturn that affected Los Angeles County as a whole in 2000 led to a decrease in office space absorption as well as increasing vacancies in Douglas Emmett submarkets from 2000 through 2003. Occupancy levels in these submarkets began to recover in 2004 and on average have significantly outperformed the Los Angeles County office market as a whole since then, with occupancy increasing from 83.4% in 2003 to 91.5% in 2005, or 8.1 percentage points, compared to the Los Angeles County market which increased from 83.6% to 88.9%, or 5.3 percentage points, and compared to the submarkets in which Douglas Emmett does not have a presence, which increased from only 83.7% to 87.4%, or 3.7 percentage points. Rental rates in Douglas Emmett submarkets began to recover in 2005, with annual rental rates increasing from $31.76 per square foot in 2004 to $34.04 per square foot in 2005, or an increase of 7.2%, compared to Los Angeles County, which increased from $26.53 per square foot to $27.71 per square foot, or an increase of 4.4%, and compared to the submarkets in which Douglas Emmett does not have a presence, which increased from $24.23 per square foot to $25.36 per square foot, or an increase of 4.7%. We project average Class-A office rental rate growth of approximately 10.0% per year for 2006 and 2007 across Douglas Emmett's nine Los Angeles County submarkets with a projected five year growth rate average of 6.9% from 2006 to 2010.
14
As outlined below, the highest sales per square foot transactions occur in the West Los Angeles markets. It is noteworthy to mention Trizec's purchase of 14 Southern California office assets from Arden Realty Trust in December 2005 for $1.6 billion, or $375 per square foot, and subsequent sale to Blackstone and Brookefield for $4.8 billion in June 2006. The majority of these assets are not located in Douglas Emmett markets and are generally in less desirable locations. Based on the average price per square foot, 2004-2006 office building transactions located within Santa Monica benefited from an approximate $107 per square foot premium, approximately 37% more, over downtown office buildings. As further evidence of Douglas Emmett's market strength, based on the data below, markets where Douglas Emmett has a presence enjoy a $391 per square foot average sale price versus $301 per square foot for markets where Douglas Emmett does not have a presence. Details of noteworthy Los Angeles office transactions are outlined in the following table.
2003-2006 Noteworthy Office Sales Activity
Los Angeles
| Date | Property | Sq. Ft. | Market | Buyer | Est. Price | $/SF | Comments | |||||||||
|---|---|---|---|---|---|---|---|---|---|---|---|---|---|---|---|---|
| Pending | Luckman Plaza | 308,698 | Beverly Hills* | Confidential | $ | 156,000,000 | $ | 505 | *Located in W. Hollywood, but included due to proximity to the entrance to Beverly Hills. | |||||||
| Pending | Maple Drive Collection | 600,000 | Beverly Hills | Confidential | $ | 325,000,000 | $ | 542 | ||||||||
| Jun-06 | Wilshire Rodeo Plaza | 246,916 | Beverly Hills | TIAA | $ | 194,950,000 | $ | 790 | Includes approx. 60k sf of high end urban retail. Office PSF approx $614, cap rate approx 5.2%. | |||||||
| Apr-06 | 9701 Wilshire | 109,757 | Beverly Hills | Kennedy Wilson | $ | 51,000,000 | $ | 465 | ||||||||
| Dec-05 | 9665 Wilshire | 169,000 | Beverly Hills | Trizec | 63,400,000 | $ | 375 | Part of 14 asset portfolio purchased from Arden | ||||||||
| Sep-05 | 407 N Maple Dr | 160,000 | Beverly Hills | Tishman Speyer | $ | 71,000,000 | $ | 444 | 100% vacant. | |||||||
| Sep-05 | 9465 Wilshire Blvd | 220,000 | Beverly Hills | Morgan Stanley | $ | 136,000,000 | $ | 618 | 90% occupancy. 40,000 sf of street retail. | |||||||
| Aug-05 | Maple Plaza | 285,000 | Beverly Hills | Tishman Speyer | $ | 106,000,000 | $ | 372 | 75% leased building. In-place cap rate below 5%, stabilized cap over 7%. | |||||||
| Jun-05 | Bank of America Building | 87,596 | Beverly Hills | Real Estate Capital Partners | $ | 31,200,000 | $ | 356 | 94% occupancy. | |||||||
| May-05 | Beverly Mercedes Pl. | 130,054 | Beverly Hills | Tishman Speyer | $ | 38,200,000 | $ | 294 | 63% leased. | |||||||
| Mar-05 | 450 N Roxbury Dr | 103,000 | Beverly Hills | Starpoint Properties | $ | 43,450,000 | $ | 422 | Owner to occupy remaining vacant space on top floor. 5.9% cap rate. | |||||||
| Aug-04 | Beverly Hills Medical Center | 100,413 | Beverly Hills | Douglas Emmett & Company | $ | 32,000,000 | $ | 319 | 100% leased building. | |||||||
| Apr-04 | 331 N Maple Dr | 82,193 | Beverly Hills | Bendheim/Kim | $ | 28,500,000 | $ | 347 | Dreamworks bought out of lease leaving building 33% occupied. | |||||||
| Subtotal: | 2,602,627 | $ | 1,276,700,000 | $ | 491 | |||||||||||
| Pending | Cornerstone Plaza | 163,909 | Santa Monica* | Confidential | $ | 65,600,000 | $ | 400 | *Located in West LA, included due to proximity to Santa Monica | |||||||
| Sep-05 | Courtyard on Wilshire | 86,000 | Santa Monica | Xemit Corp. | $ | 35,550,000 | $ | 413 | 96% occupancy. | |||||||
| Mar-05 | Tribecca Plaza | 151,000 | Santa Monica | Broadreach Capital Partners | $ | 30,500,000 | $ | 202 | Buyer planning $4 million renovation. 48% leased. | |||||||
| Dec-04 | Lantana Center | 331,739 | Santa Monica | Maguire Partners | $ | 120,800,000 | $ | 364 | Total sale $136.8mil included $16mil for 184,105sf addl entitlements. 7% cap rate. | |||||||
| Jul-04 | Colorado Center | 1,100,000 | Santa Monica | TIAA / EOP | $ | 460,000,000 | $ | 418 | Sale price is approx. a 7% stabilized cap rate. | |||||||
| Jun-04 | Arboretum Gateway | 201,000 | Santa Monica | ING Clarion Partners | $ | 98,000,000 | $ | 488 | Property is fully leased through 2016 to Universal Music. 7.5% cap rate. | |||||||
| Subtotal: | 2,033,648 | $ | 810,450,000 | $ | 399 | |||||||||||
*Real Capital Analytics, Pending Deals represent estimates by Eastdil Secured
15
2003-2006 Noteworthy Office Sales Activity
Los Angeles
| Date | Property | Sq. Ft. | Market | Buyer | Est. Price | $/SF | Comments | |||||||||
|---|---|---|---|---|---|---|---|---|---|---|---|---|---|---|---|---|
| Pending | Burbank Office Portfolio | 1,380,000 | Burbank | Confidential | $ | 565,740,000 | $ | 410 | M. David Paul Portfolio, Includes Pinnacle II, Central Park, and Media Studios North. | |||||||
| Dec-05 | Legacy Media Tower | 147,889 | Burbank | Legacy Partners | $ | 43,000,000 | $ | 291 | 36% occupancy. | |||||||
| Jul-05 | Buena Vista Plaza | 115,130 | Burbank | Behringer Harvard | $ | 36,000,000 | $ | 313 | 100% occupancy. | |||||||
| Jun-05 | Burbank Empire Center I-II | 230,000 | Burbank | CBRE Investors (State of Alaska) | $ | 70,250,000 | $ | 305 | Allianz (40%) credit for 12+ years, solid remainder of rent roll. 5.75% cap rate. | |||||||
| Aug-04 | 4 Media Center | 131,000 | Burbank | Palisades Associates | $ | 39,450,000 | $ | 293 | Net-leased to Liberty Media through 2016. 8% cap rate. | |||||||
| Jul-03 | The Tower Burbank | 493,803 | Burbank | Blackrock Real Estate | $ | 167,000,000 | $ | 338 | Disney lease for 95% of building expires in 2008. 6.1% cap rate. | |||||||
| Jul-03 | The Pinnacle | 393,776 | Burbank | DB Real Estate (RREEF) | $ | 145,000,000 | $ | 368 | Excellent project, location, term, and credit tenancy. 90% occupied, 7% cap rate. | |||||||
| Subtotal: | 2,891,598 | $ | 1,066,440,000 | $ | 331 | |||||||||||
| Dec-05 | 1940 Century Park | 46,856 | Century City | 1940 Century City LLC | $ | 22,500,000 | $ | 480 | 98% occupancy. | |||||||
| Aug-04 | Alcoa Building | 280,500 | Century City | Westfield of America Inc. | $ | 80,000,000 | $ | 285 | Class B building adjacent to Buyer's retail center. 88% leased. | |||||||
| Subtotal: | 327,356 | $ | 102,500,000 | $ | 313 | |||||||||||
| Pending | LNR Warner Center I-III | 808,000 | Woodland Hills | Confidential | $ | 310,000,000 | $ | 384 | Class-A suburban office building. | |||||||
| Jan-05 | The Trillium | 578,500 | Woodland Hills | Douglas Emmett & Company | $ | 153,500,000 | $ | 265 | Class A, 88% leased, suburban office building | |||||||
| Dec-04 | 21st Century Plaza | 517,638 | Woodland Hills | JP Morgan Fleming | $ | 130,000,000 | $ | 251 | Leasehold int. Ground lease has 70 yrs remaining. 7.25% cap rate. | |||||||
| Oct-04 | Warner Corporate Center | 253,698 | Woodland Hills | Arden Realty | $ | 64,500,000 | $ | 254 | Class-A multi-tenant office building. 7.2% cap rate. | |||||||
| Subtotal: | 2,157,836 | $ | 658,000,000 | $ | 305 | |||||||||||
| Feb-05 | Water's Edge | 250,000 | Marina Del Rey | Maguire Partners | $ | 85,500,000 | $ | 389 | Electronic Arts occupies entire bldg. Partial interest (88%) sale. | |||||||
| Mar-04 | Univision Building | 161,700 | Marina Del Rey | Univision Television Group | $ | 52,500,000 | $ | 325 | User purchase. | |||||||
| Subtotal: | 411,700 | $ | 138,000,000 | $ | 335 | |||||||||||
*Real Capital Analytics, Pending Deals represent estimates by Eastdil Secured
16
2003-2006 Noteworthy Office Sales Activity
Los Angeles
| Date | Property | Sq. Ft. | Market | Buyer | Est. Price | $/SF | Comments | |||||||||
|---|---|---|---|---|---|---|---|---|---|---|---|---|---|---|---|---|
| Jan-06 | One California Plaza | 974,000 | Downtown LA | Macquarie Office Trust | $ | 325,000,000 | $ | 334 | 96% occupancy. Part of six building portfolio. | |||||||
| Sep-05 | AON Center | 1,028,852 | Downtown LA | Broadway Partners (Confidential) | $ | 192,500,000 | $ | 187 | Class B+ office tower. Small floorplates with excellent views. 72% leased. | |||||||
| Oct-05 | Mellon Bank Center | 663,000 | Downtown LA | Tishman Speyer | $ | 245,600,000 | $ | 370 | 93% occupancy. | |||||||
| Jul-05 | Figueroa at Wilshire | 1,038,000 | Downtown LA | Trizec | $ | 356,700,000 | $ | 344 | Part of 14 asset portfolio purchased from Arden | |||||||
| Jul-05 | Figueroa at Wilshire | 1,040,000 | Downtown LA | Trizec Properties | $ | 365,000,000 | $ | 351 | Arguably the highest quality building in downtown. Occupancy to drop to 55% first year. Sub 8% IRR. | |||||||
| Dec-05 | Union Bank Plaza | 626,000 | Downtown LA | Hines | $ | 144,000,000 | $ | 230 | Union Bank occupies over half of building. 7.2% cap rate on 92% occupancy. | |||||||
| Jan-05 | 777 Tower | 1,004,522 | Downtown LA | Maguire Properties | $ | 345,000,000 | $ | 343 | Estimated price. Purchased as part of 10 bldg portfolio. 90% occupied. | |||||||
| Feb-05 | SBC Center | 885,768 | Downtown LA | Layton-Belling & Associates | $ | 129,000,000 | $ | 146 | 2-building complex. Recent SBC 10 yr lease for 225k sf. 90% leased. | |||||||
| Jul-05 | Bank of America Tower | 1,421,711 | Downtown LA | Trizec Properties | $ | 435,000,000 | $ | 306 | Class-A office tower with high quality rent roll. 6% cap rate, 92% occupied. | |||||||
| Subtotal: | 8,681,853 | $ | 2,537,800,000 | $ | 292 | |||||||||||
| Pending | Glendale Plaza | 532,815 | Glendale | Confidential | $ | 215,000,000 | $ | 404 | 98% occupied. | |||||||
| Aug-06 | Glendale Corp. Center | 114,450 | Glendale | Broadreach Capital | $ | 22,890,000 | $ | 200 | Part of 10 building portfolio | |||||||
| Mar-06 | 500 N Brand Blvd | 415,000 | Glendale | ING Clarion Partners | $ | 145,000,000 | $ | 349 | 80% occupancy. Includes 23,000 sf of retail. | |||||||
| Aug-05 | 505 N Brand Blvd | 311,787 | Glendale | LaSalle Investment Management | $ | 108,750,000 | $ | 349 | 85% occupancy. Yahoo! and United Healthcare are major tenants. | |||||||
| Jun-05 | Glendale City Center | 395,619 | Glendale | Principal Global Investors | $ | 104,300,000 | $ | 264 | Sold with 56% vacancy. | |||||||
| Mar-05 | 801 N Brand Blvd | 282,433 | Glendale | Maguire Properties | $ | 80,173,000 | $ | 284 | Estimated price. High quality suburban office building. Part of 10 building portfolio. 6.5% cap rate. | |||||||
| Subtotal: | 2,052,104 | $ | 676,113,000 | $ | 329 | |||||||||||
*Real Capital Analytics, Pending Deals represent estimates by Eastdil Secured
17
LOS ANGELES OFFICE SUBMARKETS/
DOUGLAS EMMETT PORTFOLIO OVERVIEW
LOS ANGELES OFFICE MARKETS
The Los Angeles office market is unique among gateway cities where the premier office locations are found in a series of "edge cities" in the West Los Angeles area and San Fernando Valley as opposed to the CBD (such as in New York, San Francisco, Washington, D.C., etc.). These markets include Santa Monica, Westwood, Beverly Hills, Century City, the Olympic Corridor, and Brentwood in West Los Angeles and Sherman Oaks, Encino and Warner Center/Woodland Hills in the West and Central San Fernando Valley; each is distinguished by virtue of their proximity to executive housing and superior amenities. These attributes are pillars of Douglas Emmett's strategy and consequently, their portfolio holdings are clustered in the premier West Los Angeles and San Fernando office markets and communities. Collectively, these nine submarkets comprise over 50 million square feet of Class A and B office space. As of June 30, 2006, the weighted average asking rental rates for Douglas Emmett's Los Angeles office portfolio was $35.28 per square foot, representing a premium of 11.8% over Douglas Emmett's nine submarkets' average asking rental rate of $31.56 per square foot. Excluding the Warner Center/Woodland Hills submarket, where properties with significant vacancies were acquired, Douglas Emmett's occupancy rate (as of June 30, 2006) was 96.1%, which reflects a 2.5 percentage point premium to Douglas Emmett's submarkets (including the Warner Center/Woodland Hills submarket, the occupancy rate reflects a 0.4 percentage point premium). Furthermore, each of these markets are highly supply-constrained as a result of a lack of competitive development sites, economic constraints, stringent legislative barriers, community-organized opposition to development and severe down-zoning (Proposition U and Specific Plans). Approximately 90% of the Douglas Emmett assets are considered to be irreplaceable under current zoning regulations. Approved in 1986, Proposition U decreased the development capacity of the city by roughly 50% and applies to the Brentwood, Olympic Corridor, Westwood and Sherman Oaks/Encino office submarkets. Additionally, Specific Plans governing development within Warner Center/Woodland Hills, Century City, Santa Monica and the Burbank Media District severely hinder or completely preclude future office development while development within the city of Beverly Hills is met with severe resident and public office anti-development opposition.
Overall, Douglas Emmett owns over 10.4 million square feet of Class A office space in the premier West Los Angeles and San Fernando Valley markets, over 20% of the total Class A and B inventory within submarkets where Douglas Emmett has a presence, and their position within the top ten buildings of each office submarket is even greater. We are not aware of any publicly owned portfolio of comparison that has attained such a high concentration of class A office space within a gateway city. The following table highlights the total square footage, average asking market rent and current occupancy for Douglas Emmett's aggregate holdings in each of their respective office markets.
Los Angeles Markets (Class A&B)/Portfolio Overview
Douglas Emmett Holdings by Office market(1)
| | | | Avg. Asking Rate ($/sf/yr) | | | |||||||||||
|---|---|---|---|---|---|---|---|---|---|---|---|---|---|---|---|---|
| | | | Occupancy %(2) | |||||||||||||
| Market | | | ||||||||||||||
| Sq. Ft. D.E. | Market | D.E. | Market | D.E. | Market | |||||||||||
| West Los Angeles | ||||||||||||||||
| Santa Monica | 860,159 | 7,619,589 | $ | 59.11 | $ | 41.76 | 99.2 | % | 94.8 | % | ||||||
| Brentwood | 1,390,625 | 3,331,731 | $ | 36.03 | $ | 33.72 | 95.7 | % | 92.8 | % | ||||||
| Olympic Corridor | 922,405 | 2,327,630 | $ | 29.81 | $ | 28.92 | 90.0 | % | 90.8 | % | ||||||
| Westwood | 396,728 | 3,365,978 | $ | 34.80 | $ | 41.28 | 95.2 | % | 92.7 | % | ||||||
| Century City | 866,039 | 9,574,342 | $ | 35.30 | $ | 35.16 | 93.0 | % | 89.3 | % | ||||||
| Beverly Hills | 571,869 | 6,503,630 | $ | 47.75 | $ | 37.20 | 97.8 | % | 94.8 | % | ||||||
| Total/ Weighted Average DE Submarkets(2) | 5,007,825 | 32,722,900 | $ | 39.96 | $ | 35.46 | 95.0 | % | 92.4 | % | ||||||
18
| | | | Avg. Asking Rate ($/sf/yr) | | | |||||||||||
|---|---|---|---|---|---|---|---|---|---|---|---|---|---|---|---|---|
| | | | Occupancy %(2) | |||||||||||||
| Market | | | ||||||||||||||
| Sq. Ft. D.E. | Market | D.E. | Market | D.E. | Market | |||||||||||
| Fox Hills/Culver City | 3,492,048 | $ | 31.56 | 94.0 | % | |||||||||||
| Marina Del Rey | 1,615,660 | $ | 25.08 | 92.9 | % | |||||||||||
| West Hollywood | 2,419,222 | $ | 34.92 | 96.8 | % | |||||||||||
| West LA | 2,933,451 | $ | 30.72 | 95.2 | % | |||||||||||
| Total/Weighted Average Non DE Submarkets | 10,460,381 | $ | 31.10 | 94.8 | % | |||||||||||
San Fernando Valley | ||||||||||||||||
| Sherman Oaks/Encino | 2,878,769 | 5,721,621 | $ | 33.11 | $ | 27.79 | 97.4 | % | 95.3 | % | ||||||
| Warner Center/Woodland Hills | 2,567,814 | 6,392,299 | $ | 28.28 | $ | 27.96 | 84.1 | % | 90.4 | % | ||||||
| Total/ Weighted Average DE Submarkets(2) | 5,446,583 | 12,113,920 | $ | 30.83 | $ | 27.87 | 91.1 | % | 93.0 | % | ||||||
Agoura Hills | 0 | 757,902 | NA | $ | 25.32 | NA | 83.7 | % | ||||||||
| Calabasas | 0 | 1,467,184 | NA | $ | 27.96 | NA | 97.0 | % | ||||||||
| Canoga Park | 0 | 157,704 | NA | $ | 19.80 | NA | 94.2 | % | ||||||||
| Chatsworth | 0 | 929,249 | NA | $ | 18.36 | NA | 85.3 | % | ||||||||
| Granada Hills | 0 | 101,000 | NA | $ | 27.00 | NA | 98.2 | % | ||||||||
| Mission Hills | 0 | 158,730 | NA | $ | 24.60 | NA | 97.7 | % | ||||||||
| Northridge | 0 | 521,419 | NA | $ | 24.60 | NA | 93.8 | % | ||||||||
| Palmdale | 0 | 41,500 | NA | $ | 14.40 | NA | 84.1 | % | ||||||||
| Panorama City | 0 | 175,642 | NA | $ | 18.60 | NA | 89.2 | % | ||||||||
| Tarzana | 0 | 579,000 | NA | $ | 22.56 | NA | 93.1 | % | ||||||||
| Valencia | 0 | 1,987,209 | NA | $ | 31.20 | NA | 90.6 | % | ||||||||
| Van Nuys | 0 | 1,025,752 | NA | $ | 24.24 | NA | 97.5 | % | ||||||||
| West Hills | 0 | 740,583 | NA | $ | 27.00 | NA | 93.6 | % | ||||||||
| Westlake Village (LAC) | 0 | 1,534,824 | NA | $ | 26.04 | NA | 97.2 | % | ||||||||
| Total/Weighted Average Non DE Submarkets | 0 | 10,177,698 | NA | $ | 25.90 | NA | 92.9 | % | ||||||||
Tri-Cities | ||||||||||||||||
| Burbank | 420,949 | 5,744,318 | $ | 37.20 | $ | 32.76 | 100.0 | % | 95.2 | % | ||||||
| Total/ Weighted Average DE Submarkets(2) | 420,949 | 5,744,318 | $ | 37.20 | $ | 32.76 | 100.0 | % | 95.2 | % | ||||||
Arcadia/Monrovia | 0 | 1,324,734 | NA | $ | 24.48 | NA | 95.5 | % | ||||||||
| Glendale | 0 | 6,392,484 | NA | $ | 29.76 | NA | 86.9 | % | ||||||||
| North Hollywood | 0 | 946,460 | NA | $ | 23.28 | NA | 97.3 | % | ||||||||
| Pasadena | 0 | 8,638,578 | NA | $ | 30.24 | NA | 96.6 | % | ||||||||
| Studio City | 0 | 316,085 | NA | $ | 31.20 | NA | 99.5 | % | ||||||||
| Universal City | 0 | 1,405,690 | NA | $ | 32.88 | NA | 93.5 | % | ||||||||
| Total/Weighted Average Non DE Submarkets | 0 | 19,024,031 | NA | $ | 29.54 | NA | 93.1 | % | ||||||||
TOTAL/WEIGHTED AVERAGE DE SUBMARKETS | 10,875,357 | 50,581,138 | $ | 35.28 | $ | 31.56 | 93.2 | % | 92.8 | % | ||||||
TOTAL/WEIGHTED AVERAGE NON- DE SUBMARKETS | 0 | 39,662,110 | $ | 29.02 | 93.5 | % | ||||||||||
TOTAL/WEIGHTED AVERAGE LOS ANGELES COUNTY(3) | 10,875,357 | 90,243,248 | $ | 35.28 | $ | 29.56 | 93.2 | % | 93.4 | % | ||||||
Source: CB Richard Ellis (other than Douglas Emmett data)
19
- (1)
- For Douglas Emmett properties, represents leases commenced on or before June 30, 2006 and calculated as rentable square feet less available square feet divided by rentable square feet.
- (2)
- Weighted average for both Douglas Emmett properties and submarket based on Douglas Emmett rentable square feet.
- (3)
- Weighted average based upon Douglas Emmett properties' square footage for Douglas Emmett submarkets, otherwise based upon the overall submarket square footage.
As outlined in the table below, over the past five years, new supply growth in Douglas Emmett's nine Los Angeles County office submarkets has been limited with approximately 3.1 million square feet of new additions from 2001 to 2005. This represents an average increase of only 1.1% per year in Class-A inventory across these submarkets. Of the 3.1 million total square feet delivered over the five-year period, approximately 60% of the total was concentrated in the Burbank and Century City submarkets. Additionally, over this time period, there were no new significant office deliveries in the Westwood, Brentwood and Sherman Oaks/Encino submarkets. Within Douglas Emmett's Los Angeles County submarkets, the following developments are expected over the three-year span from 2006 to 2008: 194,000 square feet planned in the Santa Monica submarket; two buildings totaling approximately 500,000 square feet planned in the Warner Center/Woodland Hills submarket; and one new building in the Century City submarket totaling 780,000 square feet of which 300,000 square feet has been pre-leased. In addition, in the Burbank submarket, where Douglas Emmett owns one building that is currently 100% leased to a single tenant through 2019, 180,000 square feet of new office space was completed in 2006, while an additional 1.1 million square feet is planned and 370,000 square feet is proposed over the three-year span from 2006 to 2008. Assuming all current planned and proposed construction in the Douglas Emmet submarkets is completed by 2008, this pipeline represents an increase in Class-A inventory of 3,124,000 square feet over the period or approximately 1.9% per year across the Douglas Emmett submarkets. Excluding the Burbank submarket, this increase would be 1,474,000 square feet over the period or approximately 1.1% per year. No other significant office space in the Douglas Emmett submarkets is currently under construction, planned to begin construction or proposed during this period.
Historical Los Angeles New Supply
Douglas Emmett Office Submarkets
| | 1996 | 1997 | 1998 | 1999 | 2000 | 2001 | 2002 | 2003 | 2004 | 2005 | Totals | |||||||||||
|---|---|---|---|---|---|---|---|---|---|---|---|---|---|---|---|---|---|---|---|---|---|---|
| Brentwood | — | — | — | — | — | — | — | — | — | — | — | |||||||||||
| Olympic Corridor | — | — | — | — | — | — | 151,019 | — | — | — | 151,019 | |||||||||||
| Century City | — | — | — | — | — | — | — | 775,037 | — | — | 775,037 | |||||||||||
| Santa Monica | 40,500 | — | — | 340,103 | 878,203 | — | — | — | 76,000 | — | 1,334,806 | |||||||||||
| Beverly Hills | — | — | — | — | 82,193 | 84,000 | — | 163,811 | — | — | 330,004 | |||||||||||
| Westwood | — | — | — | — | — | — | — | — | — | — | — | |||||||||||
| Sherman Oaks/Encino | — | — | — | — | — | — | — | — | — | — | — | |||||||||||
| Warner Center/Woodland Hills | — | — | — | — | 286,985 | 357,587 | 92,878 | 179,342 | — | 179,342 | 1,096,134 | |||||||||||
| Burbank | — | 95,400 | 215,000 | — | 95,700 | 155,000 | 621,597 | — | — | 269,231 | 1,451,928 | |||||||||||
| Total | 40,500 | 95,400 | 215,000 | 340,103 | 1,343,081 | 596,587 | 865,494 | 1,118,190 | 76,000 | 448,573 | 5,138,928 | |||||||||||
Source CoStar Group, Inc.
20
The following information is based on Eastdil Secured defined markets consisting of Class A office buildings considered to be most competitive to Douglas Emmett properties. In defining these markets, Eastdil Secured relied on its market expertise as well as analyzed raw market data from CoStar and CB Richard Ellis. Specific buildings have been excluded from the market due to quality or use in order to provide the most meaningful comparison.
Downtown Santa Monica: The CB Richard Ellis defined Santa Monica submarket consists of 7,619,589 square feet of Class A and B office space. Eastdil Secured separates Santa Monica into two distinct office submarkets: Downtown and East Santa Monica. The Eastdil Secured defined Downtown Santa Monica submarket consists of 1,894,305 square feet of Class A office space. Douglas Emmett owns 860,159 square feet of Class A office space in seven buildings within the Santa Monica submarket. All seven buildings are located in downtown Santa Monica, a market that commands the highest average asking rents of any office market in Los Angeles County. Downtown Santa Monica features numerous shopping, dining and entertainment attractions and is located near the executive housing areas of northern Santa Monica, Brentwood, Pacific Palisades, Malibu and is adjacent to the Pacific Ocean, public beaches and extensive restaurant and retail amenities. In addition, the City of Santa Monica adopted a plan in the mid-1980s that imposed stringent limits on development in the downtown area. Provisions include limiting new building heights to four stories and strict FAR restrictions. As a result, most of the new construction in Santa Monica has occurred in the eastern part of the city, a less desirable market compared to downtown. For example, new development entitlements that were granted in the late 1980s and that had a 10-year expiration allowed for the construction of 1.2 million square feet of new office space, Water Garden, that was completed between 1999 and 2000. This cluster of development lies just north of the 10 Freeway surrounding the Water Garden development at the intersection of Cloverfield and Colorado Boulevards. While Douglas Emmett's share of the overall CB Richard Ellis defined Santa Monica submarket is 11.3%, their share of the Eastdil Secured defined downtown submarket, where average asking rents are 17% higher than in eastern Santa Monica, is 45.4%.
The outlook for Santa Monica remains strong in terms of limited projected deliveries of new office space. Excluding the 194,000 square feet of new development (South and East phases of the Lantana office project), which represents 2.5% of the total Class A and B office inventory, there are no remaining specific plan office entitlements left in Santa Monica. As such, the combination of low vacancy rates and the absence of new supply will provide the opportunity for significant rental rate growth in the foreseeable future.
| | Market* | Douglas Emmett Holdings | % of Market/ Rental Rate Premium | ||||||
|---|---|---|---|---|---|---|---|---|---|
| Square Feet | 1,894,305 | 860,159 | 45.4 | % | |||||
| Average Asking Rents | $ | 52.52/yr | $ | 59.11/sf/yr | 12.5 | % | |||
*Eastdil Secured defined
21
Downtown Santa Monica—Top Tier Buildings
| Building | sf | Asking Rent $/sf/yr) | Owner | ||||
|---|---|---|---|---|---|---|---|
| 100 Wilshire | 256,968 | $ | 75.00 | Douglas, Emmett & Company | |||
| Portofino Plaza | 47,639 | $ | 57.00 | Mani Brothers Real Estate Investment | |||
| SeaRise | 124,116 | $ | 56.10 | Equity Office | |||
| First Federal Square | 221,181 | $ | 54.00 | Douglas, Emmett & Company | |||
| Palisades Promenade | 98,606 | $ | 54.00 | Douglas, Emmett & Company | |||
| Santa Monica Square | 77,375 | $ | 54.00 | Douglas, Emmett & Company | |||
| Second Street Plaza | 80,835 | $ | 54.00 | Douglas, Emmett & Company | |||
| Wilshire Palisades | 193,840 | $ | 51.00 | Equity Office | |||
| 1733 Ocean Ave | 84,724 | $ | 49.80 | Maguire Properties | |||
| Lincoln/Wilshire | 76,758 | $ | 47.40 | Douglas, Emmett & Company | |||
*Source: CoStar Group, Inc.
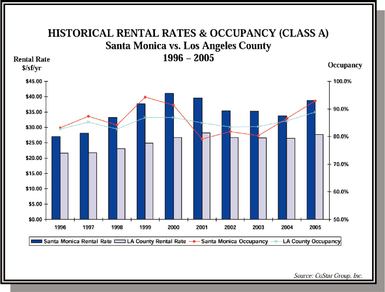
From 1996 to 2005, the 10-year average rental rate for Santa Monica was $35.01, a 38% premium over the Los Angeles County average of $25.39. Santa Monica's 10 year average occupancy is 86.2% versus 85.1% for Los Angeles County. As evidenced in the graph to the left, the Santa Monica market began a sustained recovery in occupancy rates beginning in 2004, followed by a significant recovery in rental rates beginning in 2005. Occupancy rates in this submarket increased from 80.3% in 2003 to approximately 93.0% in 2005 while rental rates increased from approximately $33.85 per square foot in 2004 to $38.80 per square foot in 2005, representing an increase of approximately 14.6%.
22
Santa Monica Demographics
| 2006 Population (estimated) | 89,191 | |||
| 1990 Population | 86,911 | |||
| Mean Household Income | $ | 92,687 | ||
| Median Household Income | $ | 58,715 | ||
| Mean Home Price | $ | 1,427,000 | ||
| Bachelor's Degree or higher | 54.4 | % |
Source: Claritas Site Reports 2006 & Public Records
Brentwood: The CB Richard Ellis defined Brentwood submarket consists of 3,331,731 square feet of Class A and B office space, while the Eastdil Secured defined Brentwood submarket consists of 2,614,664 square feet of Class A office space. Douglas Emmett owns 1,390,625 square feet of Class A office space in 13 buildings within the Brentwood submarket.
The Brentwood submarket consists of two primary segments (1) the San Vicente Corridor, which is largely comprised of low and mid-rise buildings in one of the premier restaurant and retail districts in Los Angeles, and (2) the Wilshire Corridor, which is comprised of a variety of mid- and high-rise buildings located along Wilshire Boulevard, west of its intersection with San Vicente. The San Vicente market is characterized by numerous small tenancies, prominently featuring medical, legal, entertainment, and accounting professionals who reside in the upscale neighborhoods that immediately surround the San Vicente Corridor. As such, these tenants place significant value upon an office location that is proximate to their homes and clients, and are resistant to relocating their premises. The mid- and high-rise buildings along Wilshire Boulevard are occupied by somewhat larger and more prototypical office users, but feature relatively small floor plans and high-margin, front office tenancies are the norm. Like on the San Vicente Corridor, most decision makers place a high value on their office location.
Based on the CB Richard Ellis defined Brentwood market, Douglas Emmett owns over 40% of the Class A and B office space, however based on the Eastdil Secured defined Brentwood market, Douglas Emmett's office concentration is even higher—71.5% of the San Vicente Corridor and 45.3% of the Wilshire Corridor. Strict zoning restrictions including Proposition U, influential neighborhood groups and specific, stringent design standards create significant barriers to new development of all kinds, but especially competitive office development. The height limit along San Vicente Boulevard is three stories and on most of Wilshire Boulevard, the height limit is between three and six stories. It is noteworthy to mention that there have been no new Class A office building deliveries in Brentwood over the past 10 years and currently there are no new office deliveries projected in Brentwood from 2006 through 2008. While the combination of low vacancy rates and the absence of new supply will provide the opportunity to significantly increase rental rate growth in the foreseeable future, Brentwood may be temporarily impacted by the eventual disposition and development of the large amount of undeveloped land located in the vicinity of the Santa Monica (405) Freeway and Wilshire Boulevard that is currently owned by the Veterans Administration. It is noteworthy to mention that the approximately 400 acres of land was donated to the government in 1888 and over the last 100+ years, the Veterans Administration
23
has left the land largely untouched with no immediate or long term plans to sell/develop any portion of the land.
| | Market* | Douglas Emett Holdings | % of Market/ Rental Rate Premium | |||||||
|---|---|---|---|---|---|---|---|---|---|---|
| Brentwood-San Vicente | ||||||||||
| Square Feet | 783,978 | 560,478 | 71.5 | % | ||||||
| Average Asking Rents | $ | 37.49/sf/yr | $ | 38.51/sf/yr | 2.7 | % | ||||
Brentwood-Wilshire | ||||||||||
| Square Feet | 1,830,686 | 830,147 | 45.3 | % | ||||||
| Average Asking Rents | $ | 36.38/sf/yr | $ | 34.35/sf/yr | -5.6 | % | ||||
Brentwood-Total | ||||||||||
| Square Feet | 2,614,664 | 1,390,625 | 53.2 | % | ||||||
| Average Asking Rents | $ | 36.71/sf/yr | $ | 36.03/sf/yr | -1.9 | % | ||||
*Eastdil Secured defined
Brentwood—Top Tier Buildings
| | sf | Asking Rent ($/sf/yr) | Owner | ||||
|---|---|---|---|---|---|---|---|
| Brentwood-San Vicente | |||||||
| Coral Plaza | 71,801 | $ | 37.20 | Douglas, Emmett & Company | |||
| 11777 San Vicente | 96,872 | $ | 37.20 | Douglas, Emmett & Company | |||
| Brentwood Executive Plaza | 89,660 | $ | 37.20 | Douglas, Emmett & Company | |||
| The Vintage Capital Bldg | 103,500 | $ | 37.20 | AIB Real Estate | |||
| Brentwood Square | 120,000 | $ | 33.00 | Brentwood Square L.P. | |||
Brentwood-Wilshire | |||||||
| World Savings Center | 482,974 | $ | 42.00 | Trizec Properties, Inc. | |||
| Wilshire Landmark I | 328,331 | $ | 36.95 | CA State Teachers Retirement System | |||
| Landmark II | 412,944 | $ | 35.40 | Douglas, Emmett & Company | |||
| 12400 Wilshire | 235,808 | $ | 33.60 | Douglas, Emmett & Company | |||
*Source: CoStar Group, Inc.
24
Brentwood Demographics
| 2006 Population (estimated) | 35,308 | |||
| 1990 Population | 33,521 | |||
| Mean Household Income | $ | 152,921 | ||
| Median Household Income | $ | 98,193 | ||
| Mean Home Price | $ | 1,900,000 | ||
| Bachelor's Degree or higher | 69.4 | % |
Source: Claritas Site Reports 2006 & Public Records
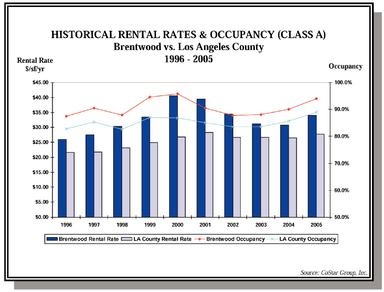
As shown in the above chart, over the last ten years, occupancy and rental rates in the Brentwood submarket have moved in line with and maintained their premium to the broader Los Angeles County market as a whole. From 1996 to 2005, the 10-year average rental rate for Brentwood was $32.74, a 29% premium over the Los Angeles County average of $25.39. Brentwood's 10-year average occupancy was 90.7% versus 85.1% for Los Angeles County. Due largely to the economic recovery that began in 2003, occupancy rates in this submarket have been growing steadily from 87.8% in 2002 to approximately 94.0% in 2005, representing an increase of 6.2%. Rental rates reached a five-year low in 2004 and began to recover significantly in 2005, increasing from $30.72 per square foot in 2004 to $34.03 per square foot in 2005, representing an increase of 10.8%.
Olympic Corridor: While the CB Richard Ellis defined Olympic Corridor submarket consists of 2,327,630 square feet of Class A and B office space, the Eastdil Secured defined Olympic Corridor submarket consists of 2,216,347 square feet of Class A office space. Douglas Emmett owns 922,405 square feet of Class A office space (nearly 40% of the total CB Richard Ellis defined Class A and B inventory) in four buildings within the Olympic Corridor submarket.
Located in West Los Angeles just west of the 405 Freeway and north of Interstate 10 and clustered near the intersection of Olympic and Sepulveda Boulevard, the Olympic Corridor is an office hub that offers relative affordability and access (both freeway and surface streets) to office users who require a Westside location, but can forego the greater prestige of Santa Monica or Brentwood. Olympic Boulevard is a main east-west artery developed and named in connection with the 1932 Olympics in Los Angeles, running from Santa Monica to Downtown Los Angeles. Buildings in this market have attracted a diverse, high-quality tenant base, including top law firms, investment banks, and prominent
25
companies in the entertainment, technology and media sectors. Tenants with a significant presence in the market include Manatt, Phelps & Phillips, Monster.com, and AT&T. The market features a broad array of amenities, including high-end restaurants, neighborhood-serving retail establishments, and several fitness centers. Douglas Emmett has developed a significant presence in this market, amassing four of what we consider to be the top six buildings in the market.
As a result of stringent limits on development imposed under Proposition U in 1986, new deliveries have been limited to approximately 150,000 square feet of Class A office building deliveries in the Olympic Corridor submarket over the past 10 years, all of which were delivered in 2002. Additionally, there are no new office deliveries projected in the Olympic Corridor from 2006 through 2008. As such, the combination of low vacancy rates and the absence of new supply will provide the opportunity for significant rental rate growth in the foreseeable future.
| | Market* | Douglas Emmett Holdings | % of Market/ Rental Rate Premium | ||||||
|---|---|---|---|---|---|---|---|---|---|
| Square Feet | 2,216,347 | 922,405 | 41.6 | % | |||||
| Average Asking Rents | $ | 29.25/sf/yr | $ | 29.81/sf/yr | 1.9 | % | |||
*Eastdil Secured defined
Olympic Corridor—Top Tier Buildings
| | sf | Asking Rent ($/sf/yr) | Owner | ||||
|---|---|---|---|---|---|---|---|
| Executive Tower | 240,331 | $ | 32.40 | Douglas, Emmett & Company | |||
| Bundy/Olympic | 110,902 | $ | 29.40 | Douglas, Emmett & Company | |||
| Westside Towers | 411,078 | $ | 28.80 | Douglas, Emmett & Company | |||
| Olympic Center | 160,094 | $ | 28.80 | Douglas, Emmett & Company | |||
| 11444 W Olympic Blvd | 237,034 | $ | 28.20 | Olympic Centinela Associates LLC | |||
| 11500 W Olympic Blvd | 243,500 | $ | 27.60 | 11500 W. Olympic, LLC | |||
*Source: CoStar Group, Inc.
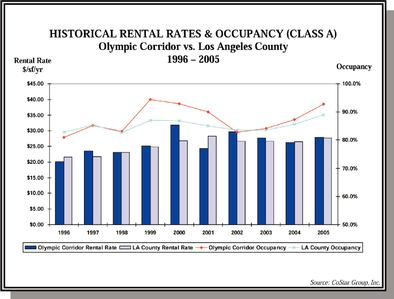
26
Olympic Corridor Demographics
| 2006 Population (estimated) | 24,313 | |||
| 1990 Population | 23,371 | |||
| Mean Household Income | $ | 105,197 | ||
| Median Household Income | $ | 67,675 | ||
| Mean Home Price | $ | 996,000 | ||
| Bachelor's Degree or higher | 49.9 | % |
Source: Claritas Site Reports 2006 & Public Records
From 1996 to 2005, the 10-year average rental rate for the Olympic Corridor was $25.95, a 2% premium over the Los Angeles County average of $25.39. The Olympic Corridor's 10-year average occupancy was 87.4% versus 85.1% for Los Angeles County. The Olympic Corridor submarket began a sustained recovery in occupancy rates beginning in 2003 followed by a recovery in rental rates beginning in 2005. Occupancy rates in this submarket increased from 82.8% in 2002 to approximately 92.8% in 2005, while rental rates increased from approximately $26.25 per square foot in 2004 to $27.93 per square foot in 2005, representing an increase of 6.4%.
Westwood: The CB Richard Ellis defined Westwood submarket consists of 3,365,978 square feet of Class A and B office space, while the Eastdil Secured defined Westwood submarket consists of 3,313,817 square feet of Class A office space. Douglas Emmett owns 396,728 square feet of Class A office space (nearly 12% of the total CB Richard Ellis defined Class A and B inventory) in two buildings within the Westwood submarket.
The Westwood office market is concentrated along Wilshire Boulevard east of the 405 Freeway and west of the city of Beverly Hills, just south of the UCLA campus in West Los Angeles. The market also extends south along Sepulveda Boulevard to its intersection with Santa Monica Boulevard. The Westwood market is dominated by high-rise buildings that range from 10 to 24 stories, with typical floor sizes of 15,000 to 20,000 square feet. The market is principally supported by University of California at Los Angeles ("UCLA")—the largest employer in West Los Angeles. The school and its research facilities attract many ancillary office users to the Westwood market. Other major tenants in the Westwood market include Lehman Brothers, Oppenheimer, BBDO, KB Homes, as well as many legal, accounting, financial services, entertainment and construction firms. The location draws strength from multiple demand sources, featuring proximity to Beverly Hills, UCLA, executive housing in Bel Air, Brentwood, and Beverly Hills, excellent freeway access, and a prestigious reputation as the location of some of greater Los Angeles' most luxurious high-rise condominium residences. Also, the Westwood area has ample retail, dining and entertainment amenities in the immediately adjacent Westwood Village neighborhood.
As a result of stringent limits on development imposed under Proposition U, there have been no new Class A office building deliveries in Westwood over the past 10 years. Additionally, the outlook for Westwood remains strong in terms of limited supply and no new office deliveries projected during the three year period from 2006 through 2008. As such, the combination of low vacancy rates and the
27
absence of new supply will provide the opportunity for significant rental rate growth in the foreseeable future.
| | Market* | Douglas Emmett Holdings | % of Market/ Rental Rate Premium | ||||||
|---|---|---|---|---|---|---|---|---|---|
| Square Feet | 3,313,817 | 396,728 | 12.0 | % | |||||
| Average Asking Rents | $ | 39.64/sf/yr | $ | 34.80/sf/yr | -12.2 | % | |||
*Eastdil Secured defined
Westwood—Top Tier Buildings
| Building | sf | Asking Rent $/sf/yr | Owner | ||||
|---|---|---|---|---|---|---|---|
| Westwood Center | 322,344 | $ | 49.50 | Trizec Properties | |||
| Center West | 344,000 | $ | 47.13 | Centurion Bancorp | |||
| Murdock Plaza | 219,715 | $ | 45.72 | Sumitomo Life Realty (N.Y.), Inc. | |||
| Westwood Gateway | 820,516 | $ | 39.71 | The Irvine Company | |||
| 10960 Wilshire Blvd | 576,018 | $ | 38.98 | Equity Office | |||
| The Tower | 205,347 | $ | 38.40 | Equity Office | |||
| Oppenheimer Tower | 534,047 | $ | 38.39 | Equity Office | |||
| One Westwood | 201,921 | $ | 34.80 | Douglas, Emmett & Company | |||
| Westwood Place | 194,807 | $ | 34.80 | Douglas, Emmett & Company | |||
| West Bldg | 100,041 | $ | 33.60 | Birtcher Properties | |||
Source: CoStar Group, Inc.
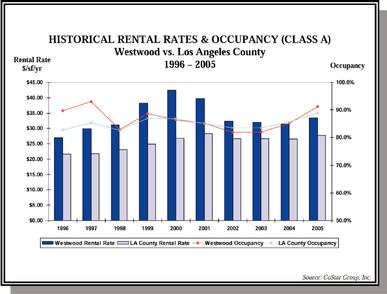
From 1996 to 2005, the 10-year average rental rate for Westwood was $33.75, a 33% premium over the Los Angeles County average of $25.39. Westwood's 10-year average occupancy was 86.6% versus 85.1% for Los Angeles County.
28
WESTWOOD DEMOGRAPHICS
| 2006 Population (estimated) | 47,310 | |||
| 1990 Population | 38,314 | |||
| Mean Household Income | $ | 100,394 | ||
| Median Household Income | $ | 52,040 | ||
| Mean Home Price | $ | 1,598,000 | ||
| Bachelor's Degree or higher | 66.4 | % |
Source: Claritas Site Reports 2006 & Public Records
Century City: The CB Richard Ellis defined Century City submarket comprises 9,574,342 square feet of Class A and B office space, in a fully developed master-planned development located southwest of Beverly Hills. The Eastdil Secured defined Century City submarket comprises 9,307,438 square feet of Class A office space. Douglas Emmett owns 866,039 square feet of Class A office space (approximately 9% of the total CB Richard Ellis defined Class A and B inventory) in two buildings.
Century City is the largest of the Westside office submarkets and has a high concentration of larger law and investment banking firms as key components of its tenancy. Century City has displaced downtown Los Angeles as the primary Los Angeles location of many high profile financial firms over the past decade and has become the de facto central business district. Morgan Stanley, Goldman Sachs, and Credit Suisse are prime examples of this trend. Historically developed from the back lot of 20th Century Fox Studios, Century City is also a hub of the entertainment industry, with Fox, Sony, and Creative Artists Agency each having 100,000+ square foot tenancies in the market.
Upon the completion of ABC Center, Century City is completely built-out as a result of significant down-zoning. The Century City South Specific Plan ("CCSSP") was enacted by the City of Los Angeles to set forth the zoning and land use law governing new development in Century City. Limitations were imposed on, among other things, building heights and size, density, and car-trips in and out of the area. Over the past 10 years, there has been only one new Class A office building, MGM Tower, delivered in Century City which added 775,000 square feet. Recently, the 600,000 square foot ABC Center was demolished and is being redeveloped. Upon completion, projected to be late 2006, ABC Center will offer 780,000 square feet of Class A office space (net 180,000 square feet of new supply). Based on the CCSSP, no new development is permitted within Century City. It is noteworthy to mention 240,000 square feet of office space is being removed from the Century City inventory. Westfield, who recently acquired the 240,000 square foot, Alcoa office building, plans to demolish the existing office building and rebuild a mixed-use retail/residential building that will connect to the adjacent Westfield Shoppingtown Mall.
| | Market* | Douglas Emmett Holdings | % of Market/ Rental Rate Premium | ||||||
|---|---|---|---|---|---|---|---|---|---|
| Square Feet | 9,307,438 | 866,039 | 9.3 | % | |||||
| Average Asking Rents | $ | 38.40/sf/yr | $ | 35.30/sf/yr | -8.1 | % | |||
*Eastdil Secured defined
29
Century City—Top Tier Buildings
| Building | SF | Asking Rent $/SF/YR | Owner | ||||
|---|---|---|---|---|---|---|---|
| Fox Plaza | 710,692 | $ | 45.26 | The Irvine Company | |||
| MGM Tower | 775,037 | $ | 44.28 | JMB | |||
| SunAmerica Center | 780,063 | $ | 41.31 | EOP | |||
| Century Plaza Towers | 2,249,438 | $ | 40.00 | JP Morgan | |||
| 10100 Santa Monica Blvd | 605,657 | $ | 39.83 | State of Florida | |||
| Eighteen Eighty Eight Bldg | 484,154 | $ | 38.33 | Beacon Capital | |||
| 1901 Avenue of the Stars | 492,139 | $ | 36.60 | Douglas, Emmett & Company | |||
| 1900 Avenue of the Stars | 605,942 | $ | 33.75 | John Anderson | |||
| Century Park Plaza | 373,900 | $ | 33.60 | Douglas, Emmett & Company | |||
*Source: CoStar Group, Inc.
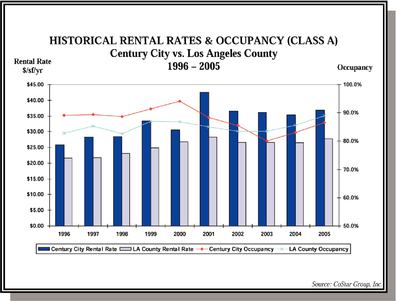
CENTURY CITY DEMOGRAPHICS
| 2006 Population (estimated) | 29,536 | |||
| 1990 Population | 28,186 | |||
| Mean Household Income | $ | 124,692 | ||
| Median Household Income | $ | 69,278 | ||
| Mean Home Price | $ | 795,000 | ||
| Bachelor's Degree or higher | 48.7 | % |
Source: Claritas Site Reports 2006 & Public Records
*1 mile Radius around 1901 Avenue of the Stars
From 1996 to 2005, the 10-year average rental rate for Century City was $33.40, a 32% premium over the Los Angeles County average of $25.39. Century City's 10 year average occupancy was 87.6% versus 85.1% for Los Angeles County. As noted in the above chart, occupancy rates in Century City peaked in 2000 and declined from 2000 to 2003, largely as a result of the downturn in the general economy and the technology industry, which also negatively impacted the legal and financial services firms that serviced the technology sector. The increase in new supply was exacerbated by the trend at the time for firms located in Century City to relocate their back-office functions to offices in other, less expensive markets. Occupancy rates in this submarket have recovered since 2003, increasing from 80.0% to approximately 86.6% in 2005, as the general economy recovered and vacant space was absorbed through leasing activity in this submarket. Despite the decline in occupancy, rental rates have remained relatively flat since 2002. Rental rate growth in Century City has been hindered by existing vacancy in the submarket and on-going road and infrastructure construction on Santa Monica Boulevard, a main east-west artery servicing the Century City submarket. The completion of the Santa Monica Boulevard improvements, expected later in 2006, will substantially enhance access between Century City and the San Diego (405) freeway.
30
Beverly Hills: The CB Richard Ellis defined Beverly Hills submarket comprises 6,503,630 square feet of Class A and B office space, while the Eastdil Secured defined Beverly Hills submarket consists of 6,324,389 square feet of Class A office space. Douglas Emmett owns 571,869 square feet of Class A office space (approximately 9% of the total CB Richard Ellis defined Class A and B inventory) in four buildings within the Beverly Hills submarket.
As one of the best known and most affluent cities in the United States, Beverly Hills is a separately incorporated city surrounded by the Westside of Los Angles. Surprisingly compact at 5.7 square miles, Beverly Hills is truly an infill real estate market, with a majority of its area developed in mixed-use, pedestrian friendly patterns that are characterized by smaller, older structures and highly dispersed ownership. This is particularly true of the neighborhood within Beverly Hills that is commonly referred to as the Golden Triangle, being bounded by Santa Monica Boulevard to the north, Wilshire Boulevard to the south and Crescent Drive on the east. Three of Douglas Emmett's four Beverly Hills buildings are located in the Golden Triangle, the commercial core of Beverly Hills. The centerpiece of this triangle is Rodeo Drive, arguably the most famous shopping district in the world. Beverly Hills has an exceptional demographic base and benefits from an international "upscale" reputation as a renowned retail location.
While Beverly Hills is not subject to Proposition U, the practical impact of the existing development restrictions is similarly prohibitive. Restrictive height and FAR limits, strict municipal oversight, community opposition and the difficulty of acquiring developable sites in Beverly Hills has severely limited office development. The only new Class A office building deliveries in Beverly Hills over the past 10 years consisted of three projects, totaling approximately 320,000 square feet that were delivered between 2000 and 2003. Additionally, there are no new office deliveries projected during the three-year period from 2006 through 2008 in Beverly Hills. As such, the combination of low vacancy rates and the absence of new supply will provide the opportunity for significant rental rate growth in the foreseeable future.
| | MARKET* | DOUGLAS EMMETT HOLDINGS | % OF MARKET/ RENTAL RATE PREMIUM | |||
|---|---|---|---|---|---|---|
| Square Feet | 6,324,389 | 571,869 | 9.0% | |||
| Average Asking Rents | $38.78/sf/yr | $47.75/sf/yr | 23.1% |
*Eastdil Secured defined
BEVERLY HILLS — TOP TIER BUILDINGS
| BUILDING | SF | ASKING RENT $/SF/YR | OWNER | ||||
|---|---|---|---|---|---|---|---|
| 9601 Wilshire | 301,849 | $ | 47.40 | Douglas, Emmett & Company | |||
| Village on Canon | 101,004 | $ | 46.20 | Douglas, Emmett & Company | |||
| Wilshire Triangle Center | 143,000 | $ | 45.56 | Assett Two | |||
| Beverly Hills Financial Center | 139,261 | $ | 43.86 | Wilshire-Canon Ltd. | |||
| 9595 Wilshire Blvd | 165,000 | $ | 43.80 | Cal STRS | |||
| 9701 Wilshire Blvd | 102,319 | $ | 43.73 | Kennedy Wilson | |||
| 9665 Wilshire Blvd | 158,684 | $ | 43.50 | Trizec Properties, Inc. | |||
| Wells Fargo Bldg | 181,479 | $ | 41.40 | Camden Properties | |||
| Wilshire Rodeo Plaza | 208,145 | $ | 39.00 | TIAA | |||
| Union Bank Bldg | 96,000 | $ | 37.20 | Beverly Union Company | |||
*Source: CoStar Group, Inc.
31
From 1996 to 2005, the 10-year average rental rate for Beverly Hills was $33.10, a 30% premium over the Los Angeles County average of $25.39. Beverly Hills' 10-year average occupancy was 88.0% versus 85.1% for Los Angeles County.
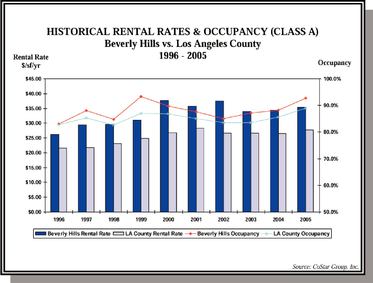
BEVERY HILL, CA
DEMOGRAPHICS
| 2006 Population (estimated) | 35,554 | |||
| 1990 Population | 31,972 | |||
| Mean Household Income | $ | 142,026 | ||
| Median Household Income | $ | 81,567 | ||
| Mean Home Price | $ | 1,647,000 | ||
| Bachelor's Degree or higher | 54.5 | % |
Source: Claritas Site Reports 2006 & Public Records
Sherman Oaks/Encino: The CB Richard Ellis defined Sherman Oaks/Encino submarket consists of 5,721,621 square feet of Class A and B office space, while the Eastdil Secured defined Sherman Oaks/Encino submarket consists of 5,346,182 square feet of Class A office space. Douglas Emmett owns 2,878,769 square feet of Class A office space (over 50% of the total CB Richard Ellis defined Class A and B inventory) in 13 buildings within the Sherman Oaks/Encino submarket.
This market runs east-west along Ventura Boulevard, which serves as the primary commercial corridor through the central San Fernando Valley. This market also serves as the primary overflow market for commercial and residential tenants on the Westside. Sherman Oaks/Encino also benefits from its proximity to the Burbank entertainment hub. Serving a very similar role in the San Fernando Valley as the San Vicente Corridor in the Brentwood/Santa Monica/West Los Angeles area, the Sherman Oaks/Encino market is characterized by numerous smaller tenancies from the legal, accounting and medical professions. This market is home to location sensitive residents who desire to have their offices in the immediate vicinity of their residences. Due to their expansive views, as well as their proximity to both the Westside and other parts of the San Fernando Valley, the hillside communities just above Ventura Boulevard are among the most upscale in the San Fernando Valley. Sherman Oaks and Encino benefit from tremendous regional access via the Santa Monica (405) and Ventura (101) freeways. The hub of this market is the intersection of Ventura Boulevard and Sepulveda Boulevard, the two main surface arteries in the area. Douglas Emmett owns properties on three of the
32
four corners of this intersection, including the largest property in the market, the recently redeveloped Sherman Oaks Galleria.
As a result of stringent limits on development imposed under Proposition U and active anti-development homeowners' associations, there have been no new Class A office building deliveries in the Sherman Oaks/Encino submarket over the past 10 years with the exception of the Douglas Emmett's Sherman Oaks Galleria redevelopment project completed in 2002. Additionally, there are no new office deliveries projected during the three-year period from 2006 through 2008. As such, the combination of low vacancy rates and the absence of new supply will provide the opportunity for significant rental rate growth in the foreseeable future.
| | MARKET* | DOUGLAS EMMETT HOLDINGS | % OF MARKET/ RENTAL RATE PREMIUM | |||
|---|---|---|---|---|---|---|
| Square Feet | 5,346,182 | 2,878,769 | 53.8% | |||
| Average Asking Rents | $31.27/sf/yr | $33.11/sf/yr | 5.9% |
*Eastdil Secured defined
SHERMAN OAKS/ENCINO — TOP TIER BUILDINGS
| BUILDING | SF | ASKING RENT $/SF/YR | OWNER | ||||
|---|---|---|---|---|---|---|---|
| Galleria Comerica Bank Bldg | 304,728 | $ | 34.80 | Douglas, Emmett & Company | |||
| Galleria Courtyard Office Bldg | 191,887 | $ | 34.80 | Douglas, Emmett & Company | |||
| Valley Executive Tower | 387,840 | $ | 33.60 | Douglas, Emmett & Company | |||
| Encino Plaza | 192,502 | $ | 31.80 | Douglas, Emmett & Company | |||
| Tower at Sherman Oaks | 164,310 | $ | 31.80 | Douglas, Emmett & Company | |||
| First Financial Plaza | 223,000 | $ | 29.40 | Glenborough Realty Trust Inc. | |||
| Encino Executive Plaza | 176,588 | $ | 28.80 | Jamison Properties | |||
| Woodrise-Encino | 90,000 | $ | 28.80 | M David Paul & Associates | |||
| The Encino Atrium | 159,285 | $ | 28.20 | Jamison Properties | |||
| Encino Corporate Plaza | 135,000 | $ | 27.77 | Milbank Real Estate Services | |||
| Ventura Woodley Bldg | 130,000 | NA | Gilbert Associates | ||||
*Source: CoStar Group, Inc.
From 1996 to 2005, the 10-year average rental rate for Sherman Oaks/Encino was $24.89 versus the Los Angeles County average of $25.39. Sherman Oaks/Encino's 10-year average occupancy was 89.3% versus 85.1% for Los Angeles County.
33
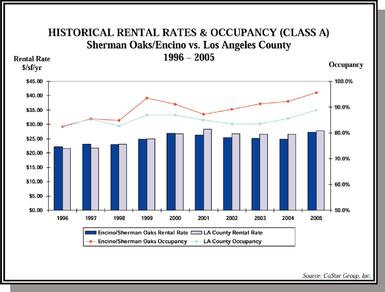
SHERMAN OAKS/ENCINO
DEMOGRAPHICS
| 2006 Population (estimated) | 165,100 | |||
| 1990 Population | 145,042 | |||
| Mean Household Income | $ | 83,450 | ||
| Median Household Income | $ | 51,704 | ||
| Mean Home Price | $ | 885,000 | ||
| Bachelor's Degree or higher | 38.1 | % |
Source: Claritas Site Reports 2006 & Public Records
Warner Center/Woodland Hills: The CB Richard Ellis defined Warner Center/Woodland Hills submarket consists of 6,392,299 square feet of Class A and B office space, while the Eastdil Secured defined Warner Center/Woodland Hills submarket consists of 6,300,867 square feet of Class A office space. Douglas Emmett currently owns two Class A office complexes totaling 2,567,814 square feet (over 40% of the total CB Richard Ellis defined Warner Center/Woodland Hills Class A and B office market) including the five high-rise towers of the Warner Center Towers and the Trillium office development.
The Warner Center/Woodland Hills office submarket is contained within the master-planned development in western San Fernando Valley and holds many parallels to Century City on the Westside. Developed on the site of the former Warner Ranch (of Warner Pictures fame), the 1.5 square mile master-planned community is being developed under the Warner Center Specific Plan (the "Plan"). Approved by the city of Los Angeles Planning Department in 1993 and amended in 2001, the Plan preserves and enhances the area's complementary land uses, establishing development standards for the land use, transportation improvements and architectural design. The Plan allows for up to 35.7 million square feet of phased nonresidential development with transportation improvements required in each phase. The Plan is required to be restudied, including an environmental analysis, and adopted by the year 2010 or after 21.5 million square feet has been entitled (whichever comes first). Although the Plan allows for the potential development of new office product, it prohibits the development of any additional high-rise space. To date, the area is 80% built out with 17.2 million square feet of entitlements, inclusive of the LNR Warner Center Phase IV and V office development, which in aggregate contains 492,000 square feet and is projected to be delivered in 2007/2008. Currently there are no other office sites within Warner Center that are entitled for office development.
34
Amenities in this area are numerous, including the Nordstrom-anchored Topanga Plaza regional mall and the dining and entertainment-oriented Promenade. While Woodland Hills itself is an upscale community, the area's office market benefits from its proximity to the growing population of the western San Fernando Valley and the adjacent Conejo Valley that extends into Ventura County. The Warner Center/Woodland Hills office submarket is a regional financial center with numerous tenants in the financial, accounting and legal services industries. In recent years, the submarket has matured into a more varied tenant mix, including significant tenancies in the healthcare and insurance industries. Warner Center is a primary office hub for the healthcare industry with major employers / tenants including 21st Century Insurance, Kaiser Permanente, Blue Cross and Prudential. Douglas Emmett's primary investment in this market, the five high-rise towers of the Warner Center Plazas office development, sits at the top location within this market.
| | MARKET* | DOUGLAS EMMETT HOLDINGS | % OF MARKET/ RENTAL RATE PREMIUM | |||
|---|---|---|---|---|---|---|
| Square Feet | 6,300,867 | 2,567,814 | 40.8% | |||
| Average Asking Rents | $28.27/sf/yr | $28.28/sf/yr | 0.0% |
*Eastdil Secured defined
WARNER CENTER/WOODLAND HILLS — TOP TIER BUILDINGS
| BUILDING | SF | ASKING RENT $/SF/YR | OWNER | ||||
|---|---|---|---|---|---|---|---|
| LNR Warner Center Phase III, Bldg G | 179,342 | $ | 32.40 | RREEF | |||
| LNR Warner Center Phase II, Bldg A | 92,878 | $ | 32.40 | RREEF | |||
| LNR Warner Center Phase I, Bldg C | 178,245 | $ | 32.40 | RREEF | |||
| Warner Center 1 | 368,168 | $ | 28.80 | Douglas, Emmett & Company | |||
| Warner Center 2 | 225,052 | $ | 27.60 | Douglas, Emmett & Company | |||
| Warner Center 3 | 611,047 | $ | 28.80 | Douglas, Emmett & Company | |||
| Warner Center 5 | 222,705 | $ | 27.60 | Douglas, Emmett & Company | |||
| Warner Center 6 | 470,576 | $ | 28.80 | Douglas, Emmett & Company | |||
| Trillium East | 298,340 | $ | 27.60 | Douglas, Emmett & Company | |||
| Trillium West | 307,700 | $ | 27.60 | Douglas, Emmett & Company | |||
| LNR Warner Center Phase I, Bldg B | 179,342 | NA | RREEF | ||||
| LNR Warner Center Phase III, Bldg H | 179,342 | NA | MP Warner Center LLC | ||||
*Source: CoStar Group, Inc.
35
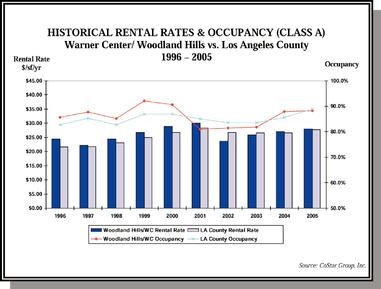
From 1996 to 2005, the 10-year average rental rate for Warner Center/Woodland Hills was $26.13, a 3% premium over the Los Angeles County average of $25.39. Warner Center/Woodland Hills' 10-year average occupancy was 86.2% versus 85.1% for Los Angeles County.
WARNER CENTER/WOODLAND HILLS
DEMOGRAPHICS
| 2006 Population (estimated) | 62,174 | |||
| 1990 Population | 56,824 | |||
| Mean Household Income | $ | 104,019 | ||
| Median Household Income | $ | 74,188 | ||
| Mean Home Price | $ | 800,000 | ||
| Bachelor's Degree or higher | 47.3 | % |
Source: Claritas Site Reports 2006 & Public Records
Burbank Media District: According to CB Richard Ellis, the Burbank submarket consists of 5,744,318 square feet of Class A and B office space and has historically been the rental rate and occupancy leader within the Tri-Cities' (Burbank, Glendale and Pasadena) office market due to its large, entertainment employment-base and central San Fernando Valley location.
Burbank is divided into two distinct office submarkets, the Airport District and Media District. The Eastdil Secured defined Airport District, adjacent to the Bob Hope Airport approximately two miles north of the Media District, contains approximately 2.3 million square feet of Class A office space. Historically an industrial area, the Airport District has undergone a substantial transformation and has become a major business hub attracting insurance, banking and media companies. Consisting entirely of low- and mid-rise office buildings, the Airport District is considered to be a low cost alternative to the Media District, Burbank's main business corridor. Typically, Class A asking rents within the Airport District are approximately 20% less than Class A asking rents in the Media District.
Studio Plaza, Douglas Emmett's only office holding in Burbank, is located in the Media District. The Eastdil Secured defined Media District, consists of approximately 4.6 million square feet of Class A office space and is the world headquarters of the entertainment industry with Disney/ABC, Warner Bros., NBC, and Universal based in the district. Combined, these studios control over 400 acres of land and provide a significant demand base for office. New supply within the Media District has
36
historically been aggressively absorbed by the consistently expanding entertainment companies that dominate the area.
Commercial development within the Media District is governed by the Media District Specific Plan (the "Plan"). Adopted in 1991, the Media District Specific Plan is a growth-control plan designed to dramatically reduce the amount of development, which could occur under existing codes. The Plan assures that all new development can be accommodated by infrastructure and public services and that new development will fund its fair share of the cost of these improvements, minimizing traffic on the local streets in the neighborhoods. The Plan also contains special land use and development requirements (specifies a maximum height restriction of 18-stories or 246 feet and a maximum 2:1 floor area ratio) designed to maximize compatibility of commercial and media businesses with nearby residences. This effectively prohibits any future high-rise office construction.
There is approximately 1.4 million square feet of low-rise office space under construction and/or planned to be developed over the three year period ending 2008 within Burbank. Planned development within the Media District are contained within two sites—NBC Studios which consists of 1,050,000 square feet of entitled office space and the Bob Hope office site which contains 50,000 square feet of entitled office space. The NBC Studios site is governed by the NBC Master Plan Development Agreement, which was approved by the city of Burbank in March 1997 (entitlements expired in 20 years). The Media NBC Master Plan Development Agreement, which is superceded by the Media District Specific Plan, defines the maximum amount of development allowed on the NBC Studios site along with the uses permitted, architectural design, landscaping as well as height and setbacks standards for new buildings. While the development of 1.1 million square feet of new office space will depress occupancy and rental rate growth within the Media District over the short term, Studio Plaza is 100% leased to Time Warner until 2019 and as such, will not be affected by this new supply.
| | MARKET* | DOUGLAS EMMETT HOLDINGS | % OF MARKET/ RENTAL RATE PREMIUM | |||
|---|---|---|---|---|---|---|
| Square Feet | 4,556,814 | 420,949 | 9.2% | |||
| Average Asking Rents | $35.75/sf/yr | $37.20/sf/yr | 4.1% |
*Eastdil Secured defined
BURBANK—TOP TIER BUILDINGS
| BUILDING | SF | ASKING RENT $/SF/YR | OWNER | ||||
|---|---|---|---|---|---|---|---|
| Central Park at Toluca Lake | 249,000 | $ | 39.00 | M. David Paul | |||
| Studio Plaza | 420,949 | $ | 37.20 | Douglas, Emmett & Company | |||
| Business Arts Plaza | 144,000 | $ | 36.00 | SAG Prod. Pension & Health Plan | |||
| Tower Burbank | 493,803 | $ | 35.40 | Tower Burbank LP | |||
| The Pinnacle at Media Center Gardens | 393,776 | $ | 35.40 | DB Real Estate | |||
| Legacy Media Tower | 147,889 | $ | 30.00 | Legacy Partners I Burbank LLC | |||
*Source: CoStar Group, Inc.
37
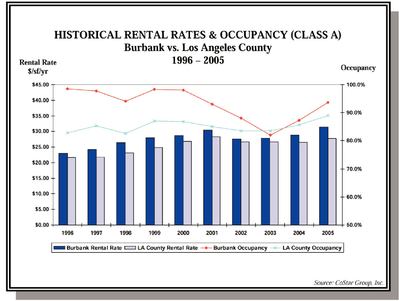
From 1996 to 2005, the 10-year average rental rate for Burbank was $27.63, a 9% premium over the Los Angeles County average of $25.39. Burbank's 10-year average occupancy was 93.1% versus 85.1% for Los Angeles County.
BURBANK, CA
DEMOGRAPHICS
| 2006 Population (estimated) | 105,895 | |||
| 1990 Population | 93,643 | |||
| Mean Household Income | $ | 71,115 | ||
| Median Household Income | $ | 54,237 | ||
| Mean Home Price | $ | 662,000 | ||
| Bachelor's Degree or higher | 29.0 | % |
Source: Claritas Site Reports 2006 & Public Records
38
The State of Hawaii is located in the mid-Pacific Ocean approximately 2,400 miles from the west coast of the mainland United States. The eight major islands of Hawaii are, in order from Northwest to Southeast, Niihau, Kauai, Oahu, Molokai, Lanai, Kahoolawe, Maui, and the Island of Hawaii. The Island of Oahu, also known as the City and County of Honolulu, is the most populous, with approximately 70% of Hawaii's population of 1.28 million people, and 70.3% of Hawaii's civilian workforce, as of June 30, 2006. The downtown area of Honolulu, Hawaii's capital city, is located at the southeast section of Oahu and represents the political, economic and cultural center of Hawaii. In recent years, continuing growth in tourism, trade, and investment in the islands has broadened Hawaii's role as a cultural and business hub between the United States and the Pacific Rim. The statistics below demonstrate that the Hawaiian economy has successfully recovered from the post-September 11th tourism downturn.
The following are key economic and demographic trends affecting Hawaii.
Personal Income—Total Hawaiian personal income has more than doubled on a nominal basis since 1985. Even after accounting for population growth and inflation, real personal income has made impressive gains over the past 20 years. According to the State of Hawaii Department of Business, Economic Development & Tourism (DBEDT), personal income grew 6.8% and 5.9% growth in 2004 and 2005, respectively.
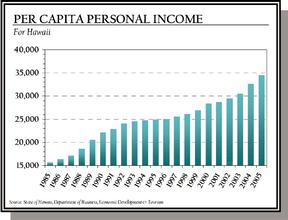
Population—DBEDT statistics show that population growth in both Oahu and Hawaii has been steady from 1995 to 2005 with aggregate increases of 2.7% and 6.6%, respectively.
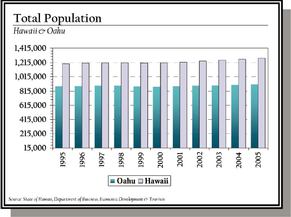
39
Gross State Product—Total economic output for the Aloha State has shown consistent growth over the past 20 years (1985-2004). Even in 2001, Hawaii's Gross State Product (adjusted to 1996 dollars) increased by 1.6%. The DBEDT projects growth in Hawaii's gross state product of 6.0% in 2006, following robust growth rates of 6.5% and 7.8% in 2005 and 2004, respectively.
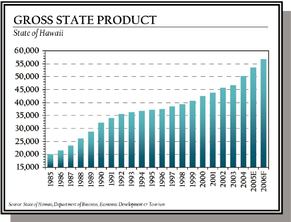
Wage & Salary Job Count—According to the U.S. Department of Labor Bureau of Labor Statistics, non-farm payroll employment in Hawaii expanded 5.1% over the year ending December 2005, one of the highest rates of increase in the United States. Historically, job growth in Oahu and Hawaii from 1995 to 2005 has been 8.6% and 13.0%, respectively. The Bureau of Labor Statistics reported that Hawaii's 2nd quarter 2006 unemployment rate averaged 3.1%, the third lowest in the nation.
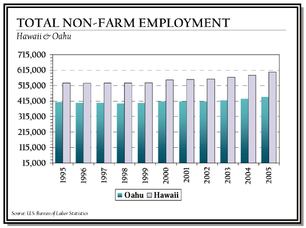
Employment by Industry—Despite the widespread misconception that tourism, construction, and a strong military presence are the only Hawaiian industries of note, the islands continue to derive more than a quarter of their employment from the fields of health care, finance, and trade. In addition, Hawaii is an emerging technology hub and has a significant military and government sector presence.
TOURISM
Tourist Activity—DBEDT statistics show that during 2005, both the total number of visitor arrivals and the average daily visitor expenditures were up strongly from 2004. The total number of visitors was up 6.8% to 7.4 million during 2005 after reporting over 6.9 million visitors in 2004. Hawaii has become a preferred destination as it is viewed by many as exotic and tropical, yet safe.
40
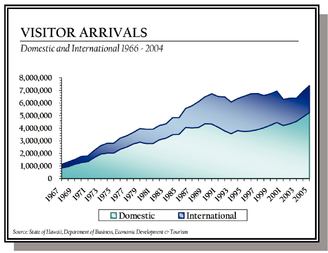
Visitor Expenditures—2005 visitor expenditures in Hawaii reached $11.5 billion, representing an 8.2% increase over 2004 expenditures of $10.7 billion. Using 2003 as a base year, Hawaii visitor expenditures have grown approximately 6.9% annually.
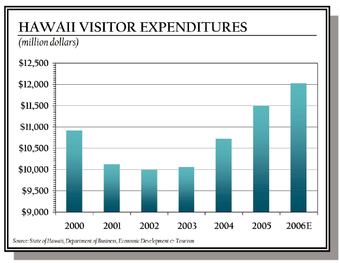
NEW INVESTMENT
A combination of new development projects, including high-rise condominiums, single-family housing, and retail projects demonstrate the strength of the local economy.
Construction
According to the DBEDT, year-end 2005 indicators of Hawaii's construction industry remained strong with wage and salary jobs in the natural resources, mining and construction industry totaling 34,000 professionals, up 11.3 percent from year-end 2004. The value of private building authorizations was up 59.9 percent from year-end 2004, representing an overall increase of over $765 million in future Hawaii construction. The robust construction sector coupled with a booming visitor market bodes well for the future of a healthy Hawaiian economy.
Home Prices
The market for residential homes in Hawaii has substantially increased in recent years. According to the Honolulu Board of Realtors, the average home price as of 2ndQuarter 2006 for Oahu is
41
$640,000, up 10.8% from 2nd quarter 2005. Posting similar gains, the 2nd quarter 2006 average condominium price is $305,000, up 18.7% from 2nd Quarter 2005.
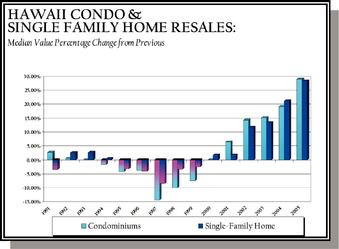
PUBLIC AND CULTURAL INFRASTRUCTURE
Education
Approximately 87% of the civilian work force has graduated from high school (in contrast to 80% for California and Massachusetts and 78% for New York), and over 25% has graduated from a four-year college, according to Claritas. The Hawaii State Department of Education operates the 10th largest U.S. school district, with 284 schools on seven islands and an enrollment of approximately 183,000 students. Hawaii also operates a state university system with 10 campuses, six of which are on Oahu. The University of Hawaii's principal campus, in Oahu's Manoa Valley, offers graduate programs in medicine, law, business management and engineering.
Military Presence
With its strategic military location in the heart of the Pacific, the Hawaiian economy generates over $4.5 billion annually from military installations such as Pearl Harbor Naval Base, Schofield Barracks, Hickam Air Force Base and Kaneohe Marine Corps Air Station. The federal military establishment in Hawaii has traditionally been the state's second largest source of income. The industry
42
supports over 98,000 military personnel and their dependents, directly providing jobs for approximately 20,000 civilians, according to the State of Hawaii DBEDT. New federal appropriations for Hawaii are described in more detail below.
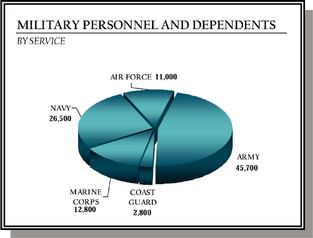
Military Housing—In Spring of 2004 the military began a $1.9 billion effort to reconstruct and refurbish over 9,000 homes on Oahu's various military bases. The University of Hawaii Economic Research Organization estimated that construction spending increased 17% in 2004 as a result, the beginning of an upward cycle that is projected to last over 10 years. Additional housing needs will be created by the Army's planned Stryker brigade, which is due to arrive in Hawaii over the next few years. This project will transform the land on Oahu and the Big Island with the creation of 71 miles of private trails, six new firing ranges, two airfield upgrades, and the purchase of 1,400 acres adjacent to Schofield Barracks. The new unit will be built around the 2nd Brigade at Schofield and another 810 soldiers will be added, bringing the total strength to 3,818.
Aircraft Carrier—The Pentagon is considering moving a nuclear aircraft carrier from the Continental United States to Pearl Harbor. The U.S. Navy currently has 12 nuclear aircraft carriers assigned to the Pacific and Atlantic Ocean. Three of the Pacific Fleet carriers are stationed in San Diego, two are in Puget Sound in Washington and one is in Japan while the remaining six carriers are stationed in the Atlantic Ocean. One of the three carriers in San Diego may be deployed and stationed at Pearl Harbor. The economic impact of stationing an aircraft carrier in Hawaii would be substantial. An aircraft carrier travels with over 8,800 crewmembers and carries approximately 80 aircraft. Based on a study conducted by the Chamber of Commerce of Hawaii, an aircraft carrier stationed at Pearl Harbor would create approximately 4,200 combined military and civilian jobs and have an annual economic impact of $375 million.
SUMMARY
Hawaii's excellent climate, unique topography and natural scenic beauty have made it a giant of the global tourism industry. Additionally, its strategic mid-Pacific location makes the state a critical military location. These inherent attributes, combined with a growing population, substantial private investment, and strong controls on land use will create growing demand for residential and commercial property, while further amplifying the scarcity of island real estate.
HONOLULU OFFICE OVERVIEW
Based on the Second Quarter 2006 CB Richard Ellis office report, the metropolitan Honolulu office market consists of approximately 11.6 million square feet in nine distinct markets. The central business district, with over 5.1 million square feet totaling over 44% of the total office inventory, is the
43
largest and most desirable market with the highest concentration of institutional quality properties. The central business district's combination of class A office inventory, superior amenity base, excellent transportation linkages, and proximity to local, state and federal government centers has attracted Honolulu's leading corporate and service sector tenants including law firms, healthcare companies, and financial service and accounting firms that provide services throughout the Hawaiian Islands and/or require proximity to the various state and local government agencies in the central business district. Though less desirable than the central business district, other markets with an institutional following include Kapiolani and Waikiki, which contain approximately 3.0 million square feet and 700,000 square feet, respectively. The remaining markets, which are more local in nature, include West Central (1.38 million square feet), Leeward (309,000 square feet), East Central (205,000 square feet), Windward (236,000 square feet), East Oahu (193,000 square feet), and West Oahu (369,000 square feet).
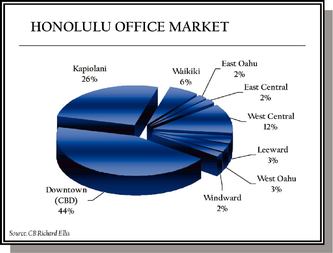
HONOLULU OFFICE MARKET
as of Second Quarter 2006
| | | | Vacancy | | | ||||||||
|---|---|---|---|---|---|---|---|---|---|---|---|---|---|
| Markets | Total Sq. Ft. | % of Total | Total Sq. Ft. | % | YTD 2006 Absorption | Asking Rental Rate/sf/yr | |||||||
| Downtown (CBD) | 5,140,907 | 44.4 | % | 400,991 | 7.8 | % | 94,808 | $ | 30.18 | ||||
| Kapiolani | 3,036,738 | 26.2 | % | 200,425 | 6.6 | % | 77,357 | $ | 31.38 | ||||
| Waikiki | 712,189 | 6.1 | % | 107,541 | 15.1 | % | (11,426 | ) | $ | 31.80 | |||
| East Oahu | 192,527 | 1.7 | % | 3,080 | 1.6 | % | 0 | $ | 31.20 | ||||
| East Central | 204,575 | 1.8 | % | 21,071 | 10.3 | % | (18,237 | ) | $ | 29.34 | |||
| West Central | 1,380,053 | 11.9 | % | 109,024 | 7.9 | % | (21,842 | ) | $ | 24.36 | |||
| Leeward | 308,780 | 2.7 | % | 8,646 | 2.8 | % | 98 | $ | 32.76 | ||||
| West Oahu | 369,238 | 3.2 | % | 27,693 | 7.5 | % | 3,100 | $ | 33.12 | ||||
| Windward | 235,607 | 2.0 | % | 7,539 | 3.2 | % | (3,914 | ) | $ | 29.40 | |||
| TOTAL HONOLULU | 11,580,614 | 100.0 | % | 886,010 | 7.6 | % | 119,944 | $ | 30.00 | ||||
Source: CB Richard Ellis
Government Centers—Honolulu's CBD contains a large federal, state, and local government center. The federal courthouse and Prince Kuhio Federal Building are located on the Nimitz Highway. The Hale Auaha and Keelikolani State office buildings and State Supreme Court are located immediately to the north of the Federal Government Center. Additionally, the State Capitol and Governor's residence are located on the eastern edge of the CBD. Finally, the City and County of Honolulu offices are
44
located just east of the State Capitol. Besides the government, the Honolulu CBD houses the largest public and private firms on Oahu. These major companies are outlined in the table below.
2005 LARGEST PUBLIC AND PRIVATE COMPANIES ON OAHU
| Rank | Company | Year Founded | Sales ($000)* | Employees | Location | ||||||
|---|---|---|---|---|---|---|---|---|---|---|---|
| 1 | BancWest Corp. | 1858/1974 | $ | 2,227 | 9,829 | CBD | |||||
| 2 | University of Hawaii System | 1907 | $ | 973 | 7,164 | Various | |||||
| 3 | Hawaii Pacific Health | 2001 | $ | 613 | 5,449 | CBD | |||||
| 4 | Kaiser Permanente Medical Care Program | 1958 | $ | 786 | 3,918 | CBD | |||||
| 5 | Hawaiian Electric Industries Inc. | 1891/1983 | $ | 1,924 | 3,354 | CBD | |||||
| 6 | Hawaiian Airlines Inc. | 1929 | $ | 764 | 3,300 | Airport | |||||
| 7 | Bank of Hawaii Corp. | 1897 | $ | 660 | 2,746 | CBD | |||||
| 8 | Alexander & Baldwin Inc. | 1870/1900 | $ | 1,490 | 2,056 | CBD | |||||
| 9 | Kamehameha Schools | 1884 | $ | 839 | 1735 | Various | |||||
| 10 | Hawaii Medical Service Assn. (HMSA) | 1938 | $ | 1,600 | 1553 | CBD/Kaiolani | |||||
*Based on sales in 2004, data may include sales and employment on the Mainland or abroad
VACANCY AND ABSORPTION
Absorption—Net absorption for Metropolitan Honolulu was approximately 238,000 square feet in 2005, a level not reached since 1992. Illustrating the market's continued demand for space, the CBD's net absorption for the year totaled 90,000 square feet, while Suburban Honolulu accounted for the remaining 148,000 square feet. Further evidencing the strength of the Honolulu CBD, absorption of 94,808 square feet occurred during year-to-date ending second quarter 2006. A surging tourist market, significant construction activity and a strong local economy combined to create such a significant level of absorption.
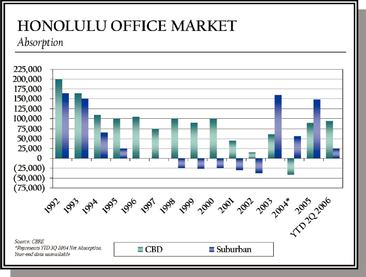
Vacancy—As of second quarter 2006, the vacancy rate for Metropolitan Honolulu was 7.6%, while the vacancy rate for the CBD was 7.8%. Vacancy rates, which previously remained flat, have now started to move downward again as the office market feeds off a strengthening economy. The availability rate (which includes sublease space in addition to direct availability) was 8.6% for Metropolitan Honolulu and 9.2% for the CBD as of second quarter 2006. A large portion of the difference between the availability rate and vacancy rate is due to a few large subleases that still have existing term.
45

NEW SUPPLY
Current average asking rental rates are well below a level that would support new construction, as a result new supply in the CBD is extremely limited in the near-term. Due to transportation, labor costs and higher sales taxes, construction in Hawaii is substantially more expensive than the Mainland. Hard and soft construction costs range from $425 to $475 per square foot for mid- and high-rise buildings with structured/subterranean parking. Ascribing land value of approximately $175 to $200 per FAR square foot, replacement costs range from $600 to $675 per square foot. Assuming Class A CBD office rents of $1.75 (NNN) per square foot per month, rental rates would have to increase to $4.25 (NNN) per square foot per month (assuming a 8.5% return on cost) to warrant new office development—more than a 140% increase. As such, there is no significant office development planned or projected in the foreseeable future. It is noteworthy to mention that when average asking rental rates finally return to levels that precipitate construction, developers will be faced with a limited number of fringe development sites on the perimeter of the core CBD area.
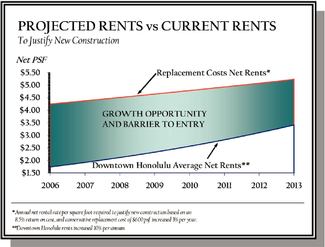
NOTEWORTHY HONOLULU SALES
Highlighted in the table below are the noteworthy institutional quality office sales since 2003. It is important to note that Landlords are typically long-term holders and institutional transactions are rare, as evidenced by the relatively few, at only nine, noteworthy transactions since 2003. Furthermore, of these nine sales, two were purchased by Douglas Emmett & Company.
46
2003-2006 Noteworthy Office Sales Activity
Honolulu, Hawaii
| Date | Property | Sq. Ft. | Market | Buyer | Est. Price | $/SF | Comments | |||||||||
|---|---|---|---|---|---|---|---|---|---|---|---|---|---|---|---|---|
| Feb-06 | Waikiki Trade Center | 204,000 | Honolulu | Daneshgar Family | $ | 30,000,000 | * | $ | 147 | Includes approximately 55k sf of high end urban retail. | ||||||
| Dec-05 | First Insurance Center | 210,000 | Honolulu | Shidler Group | $ | 45,000,000 | * | $ | 214 | 98% occupied at sale | ||||||
| Dec-04 | Bishop Place | 472,172 | Honolulu | Douglas Emmett & Company | $ | 118,000,000 | $ | 250 | 80% occupied at sale | |||||||
| Aug-04 | Harbor Court | 206,768 | Honolulu | Douglas Emmett & Company | $ | 27,000,000 | $ | 131 | 75% occupied at sale | |||||||
| Jun-04 | Waterfront Plaza | 515,000 | Honolulu | Shidler Group | $ | 70,875,000 | $ | 138 | Includes 90k sf of street level retail, subject to ground lease. | |||||||
| Dec-03 | Davies Pacific Center | 346,619 | Honolulu | Shidler Group | $ | 57,000,000 | * | $ | 164 | 84% occupied at sale | ||||||
| Dec-03 | First Hawaiian Center | 645,000 | Honolulu | First Hawaiian Bank | $ | 194,000,000 | $ | 301 | 95% occupied at sale | |||||||
| Subtotal: | 2,599,559 | $ | 541,875,000 | * | $ | 208 | ||||||||||
Source Real Capital Analystics
* Approximate
Downtown Honolulu Office Market: With an inventory of over 5.1 million square feet, Honolulu's central business district (CBD) is Hawaii's largest and most institutional office market. The market's combination of Class A inventory, amenity base, transportation linkages, and concentration of federal, state and local government centers has attracted Oahu's largest corporate and service sector tenants. Following two years of positive net absorption, the overall vacancy rate dropped to 7.8% at the end of second quarter 2006.
Current average asking rental rates are well below a level that would support new construction and new supply in the CBD is extremely limited in the near-term. As such, there is no significant office development planned or projected in the foreseeable future. It is noteworthy to mention that when average asking rental rates finally return to levels that precipitate construction, developers will be faced with a limited number of fringe development sites on the perimeter of the core CBD area.
The CBD tenant base is primarily made up of service sector tenants (law firms, healthcare companies, financial services, and accounting firms) that provide services throughout the Hawaiian Islands and/or require proximity to the various state and local government agencies in the CBD. The Honolulu CBD office market has experienced significant growth in both occupancy and rental rates as a result of strong demographics in terms of population growth and limited new supply. As of June 30, 2006, the average asking rental rate in the Honolulu CBD was $30.18 per square foot compared to $29.28 per square foot at year-end 2005 and the average occupancy level was 92.2% compared to 90.2% at year-end 2005. From 2003 to 2005, asking rental rates for office properties in the Honolulu CBD grew 10.2% while occupancy levels increased 0.6 percentage points.
| | MARKET* | DOUGLAS EMMETT HOLDINGS | % OF MARKET/ RENTAL RATE PREMIUM | |||||
|---|---|---|---|---|---|---|---|---|
| Square Feet | 5,140,907 | 678,940 | 13.2% | |||||
| Average Asking Rents | $ | 30.18/sf/yr | $ | 30.78/sf/yr | 2.0% | |||
* Eastdil Secured defined
47
HONOLULU CBD—TOP TIER BUILDINGS
| BUILDING | SF | ASKING RENT GROSS* ($/SF/YR) | OWNER | ||||
|---|---|---|---|---|---|---|---|
| Alii Place | 305,190 | $ | 32.40 | Bristol Group | |||
| Harbor Court | 206,768 | $ | 31.20 | Douglas, Emmett & Company | |||
| Bishop Place | 472,172 | $ | 30.60 | Douglas, Emmett & Company | |||
| Bishop Square Pauahi Tower | 438,596 | $ | 30.20 | Calpers/Commonwealth | |||
| First Hawaiian Center | 379,336 | $ | 30.00 | First Hawaiian Bank | |||
| Topa Financial Center | 477,045 | $ | 30.00 | John Anderson | |||
| Davies Pacific Center | 348,980 | $ | 30.00 | Shidler | |||
| Pacific Guardian Center | 582,048 | $ | 29.85 | Pacific Guardian Life | |||
| Central Pacific Bank | 209,821 | $ | 29.75 | Central Pacific Bank | |||
| City Financial Tower | 180,563 | $ | 29.60 | Hawaii ERS | |||
| Pioneer Plaza | 245,000 | $ | 29.59 | MW Group (Steve Metter) | |||
| Bishop Square ASB Tower | 483,455 | $ | 29.40 | Calpers/Commonwealth | |||
Source: CB Richard Ellis
* Estimated from quoted net rents
It is noteworthy to mention that the 12 "top tier" CBD office buildings outlined in the table above represent the entire Class A inventory. These 12 buildings contain approximately 4.3 million square feet (Douglas Emmett owns two of the twelve Class A office buildings which contain nearly 680,000 square feet or approximately 16% of the total Class A office inventory in the CBD).
As noted in the graph below, from 2003 to 2005 asking rental rates for office properties in the Honolulu CBD grew 10.2% while occupancy levels increased 0.6 percentage points.
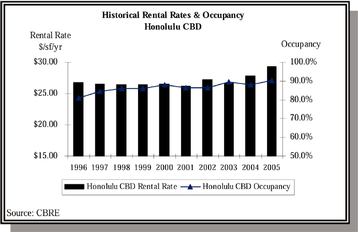
HONOLULU, HI DEMOGRAPHICS
| 2006 Population (estimated) | 379,336 | ||
| 1990 Population | 371,657 | ||
| Average Household Income | $ | 70,534 | |
| Median Household Income | $ | 49,418 | |
| Median Home Price | $ | 625,000 | |
| Bachelor's Degree or higher | 31.01% |
Source: Claritas Site Reports 2006 & Honolulu Board of Realtors
48
GREATER LOS ANGELES MULTI-FAMILY MARKET OVERVIEW
Population, employment and household income growth and rising housing values are the key drivers of the Greater Los Angeles multi-family market. Economic characteristics of the five-county Los Angeles area (including Los Angeles, Orange, Riverside, San Bernardino and Ventura Counties) fueling this multi-family market include:
Population—Population of nearly 18 million people in the five-county area—one of the most populous urban areas in the United States.
Economic Base—The five-county Los Angeles region produced GDP of $755 billion in 2005, representing a 7.4% increase from 2004. If the region were a separate country, it would rank fifteenth in total output.
Job Growth—Strong and diverse employment base continues to grow at a more rapid rate than almost anywhere else in the nation. As a result of this diverse economic base, the broader economic slowdown that occurred in 2001 did not impact the area to the degree experienced in most of the country. According to the LAEDC, Los Angeles experienced an average annual employment growth rate of 0.2% from 1999 to 2002, while many other metropolitan areas experienced increased unemployment. Moreover, according to Torto Wheaton Research's Winter 2006 Office Market Report, employment in the Los Angeles area is forecasted to grow 1% over the next five years.
Over the last five years, Los Angeles County has experienced an average occupancy rate of 96.6% and average annual rent growth of approximately 5.1%. Amplifying this trend, effective rental rates in the Los Angeles multi-family market increased 6.6% during the year ending second quarter 2006, the second largest increase since the year 2000. Limited apartment construction and continuing strong regional economic expansion have fueled the considerable strength of the countywide market, helping place Los Angeles as the third most expensive apartment market in the nation. On a per square foot basis, Los Angeles ranked behind only San Francisco and San Jose of the 57 metropolitan areas tracked by M/PF Research.
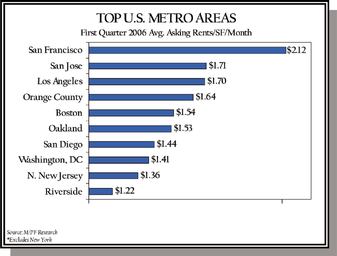
Historical occupancy rates demonstrate the stability of the Los Angeles multi-family market versus other major markets. As shown in the chart to the right, Los Angeles did not experience the same drop in occupancy levels as San Francisco or Washington, DC following the economic downturn of 2001. In addition, Los Angeles occupancy levels have not dipped below 96% since 2000. According to M/PF Research's second quarter 2006 report, Los Angeles' occupancy is 97.3%, the tenth highest occupancy level in the nation.
49
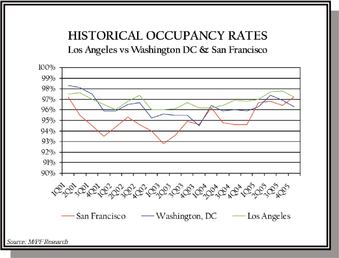
Within Los Angeles' multi-family market, the Westside of Los Angeles—which houses 62% of Douglas Emmett's multifamily portfolio—features strong fundamentals and consistently outperforms the greater metropolitan area. In-migration and job growth combined with barriers to entry for new supply continue to exacerbate the supply shortage in the area. According to the LAEDC, from 2000-2005, the Los Angeles county population increased by over 700,000 new residents while only 128,000 new residential building permits were issued. Approximately 54% of these permits were for apartment or multi-family units, a sign of the short supply of developable land in Los Angeles. Furthermore, high housing prices have made renting the only viable alternative for many Los Angeles residents. Los Angeles household income growth from 1995-2005 averaged 3.9%, while single-family home prices increased 11.4% annually or 194.1% over the period.
Consider the following specific points that bode well for the future strength of the Los Angeles economy and more specifically the Westside multi-family market:
Los Angeles County added approximately 100,000 new jobs during the seven-year period of 1998 to 2005 while unemployment averaged approximately 6.1% over that same period, according to the LAEDC. In addition, 2006 job growth is expected to reach approximately 1.0% with unemployment decreasing from 5.4% to 5.3%.
Los Angeles County is home to over 10.2 million residents—a greater number than the majority of states within the United States—and continues to add population at a greater rate than housing stock is developed. In fact, from 2000-2005 the Los Angeles County population increased by over 700,000 people, meanwhile, total housing permits issued were only 128,000.
The density of current development and the natural geographic constraints of the Westside (i.e. Pacific Ocean and Santa Monica Mountains) severely limit new development.
Over the past 5 years, the Westside multi-family market has maintained average occupancy levels of approximately 96.5%, with the highest quality assets closer to 100% occupied, according to M/PF Research.
Second quarter 2006 Westside average asking rents, already the highest in the Los Angeles area, have increased by 5.9% over second quarter 2005, to $1,948 per month, according to M/PF Research. For comparison, the U.S. average rental rate, as of second quarter 2006, inched up 4.1% to $965 per month.
Although new supply is being added to certain pockets within the Westside, namely Marina Del Rey, the overall strength of the market means that these projects are being added to address pent-up demand.
50
According to M/PF Research, Inc., as of second quarter 2006, all multi-family markets in Los Angeles County had average occupancy levels in excess of 97%, except for the Long Beach market, which had an average occupancy of 96.3%.
Consistent with the strong demand for housing in the area and a historically low level of housing affordability, M/PF Research, Inc. reports that the Los Angeles County multi-family market had an occupancy rate of 97.3% as of the second quarter 2006.
HOUSING OVERVIEW
As the national economy has recovered over the last few years, Los Angeles has continued to strengthen and diversify its economic base. Employment within Los Angeles has remained relatively stable while its population has continued to grow—from 2000 to 2005, the Los Angeles population increased by over 700,000 new residents. In an attempt to satiate housing demand, over 128,000 building permits were issued over 2000-2005 period, of which approximately half were for single-family homes, according to the LAEDC; however, with over a decade of undersupply and pent up demand, this new supply fell well short of demand and both average asking rental rates and home prices continue to rise. Overall, increases in single- and multi-family permitting activity in Los Angeles County have not kept pace with the population and employment growth rates, resulting in pent up demand.
LOS ANGELES COUNTY DEMOGRAPHIC TRENDS
2000-2006 FORECAST
| | 2000 | 2001 | 2002 | 2003 | 2004 | 2005 | 2006F | ||||||||
|---|---|---|---|---|---|---|---|---|---|---|---|---|---|---|---|
| Population (000s) | 9,519 | 9,663 | 9,823 | 9,979 | 10,108 | 10,227 | 10,342 | ||||||||
| Unemployment Rate | 5.4 | % | 5.7 | % | 6.8 | % | 7.0 | % | 6.6 | % | 5.4 | % | 5.3 | % | |
| Housing Permits Issued | 17,071 | 18,253 | 19,364 | 21,313 | 26,935 | 25,538 | 24,100 |
* LAEDC
Further evidencing the Los Angeles housing supply shortage, are the California Association of Realtors' Housing Affordability Indexes for Los Angeles, California and the United States. As illustrated in the adjacent graph, the 2005 housing affordability in Los Angeles, at 14%, is significantly less than both the California and United States, which are 16% and 50%, respectively.
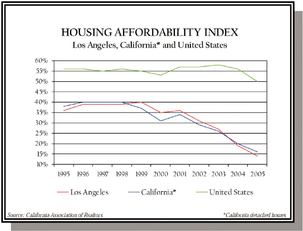
High Cost of Ownership: Within Los Angeles County, the Westside is the most coveted area in which to reside. The Pacific Ocean to the west and the Santa Monica Mountains to the north provide Westside residential communities with a temperate climate and better air quality. Furthermore, the
51
proximity to the mountains and ocean provide many homes with views of the ocean, coastline and the greater Los Angeles area. Westside home prices are among the most expensive executive housing areas within Los Angeles County, California and the nation.
DEMOGRAPHICS
| Area | Mean HH Income | Median HH Income | 2005 Mean Home Price | Bachelor's Degree or higher | |||||||||
|---|---|---|---|---|---|---|---|---|---|---|---|---|---|
| Douglas Emmett Markets | |||||||||||||
| Beverly Hills | $ | 142,026 | $ | 81,567 | $ | 1,647,000 | 54.5 | % | |||||
| Brentwood1 | $ | 152,921 | $ | 98,193 | $ | 1,900,000 | 69.4 | % | |||||
| Westwood1 | $ | 100,394 | $ | 52,040 | $ | 1,598,000 | 66.4 | % | |||||
| Santa Monica | $ | 92,687 | $ | 58,715 | $ | 1,427,000 | 54.4 | % | |||||
| Sherman Oaks/Encino1 | $ | 83,450 | $ | 51,704 | $ | 885,000 | 38.1 | % | |||||
| Century City1 | $ | 124,692 | $ | 69,278 | $ | 795,000 | 48.7 | % | |||||
| Olympic Corridor1 | $ | 105,197 | $ | 67,675 | $ | 996,000 | 49.9 | % | |||||
| Woodland Hills | $ | 104,019 | $ | 74,188 | $ | 800,000 | 47.3 | % | |||||
| Burbank | $ | 71,115 | $ | 54,237 | $ | 662,000 | 29.0 | % | |||||
| Non-Douglas Emmett Markets | |||||||||||||
| Fox Hills/Culver City | $ | 77,988 | $ | 59,823 | $ | 711,000 | 41.1 | % | |||||
| Marina Del Rey | $ | 100,301 | $ | 79,354 | $ | 1,558,000 | 61.9 | % | |||||
| West Hollywood | $ | 67,742 | $ | 45,745 | $ | 1,096,000 | 46.8 | % | |||||
| West LA1 | $ | 75,958 | $ | 54,894 | $ | 1,001,000 | 55.9 | % | |||||
| Agoura Hills | $ | 133,816 | $ | 97,365 | $ | 820,000 | 47.7 | % | |||||
| Calabasas | $ | 153,985 | $ | 108,442 | $ | 1,275,000 | 57.4 | % | |||||
| Canoga Park1 | $ | 67,471 | $ | 48,536 | $ | 571,000 | 22.5 | % | |||||
| Chatsworth1 | $ | 87,115 | $ | 69,256 | $ | 630,000 | 34.2 | % | |||||
| Granada Hills1 | $ | 89,678 | $ | 70,743 | $ | 575,000 | 32.6 | % | |||||
| Mission Hills | $ | 91,952 | $ | 71,221 | $ | 500,000 | 30.2 | % | |||||
| Northridge1 | $ | 91,467 | $ | 66,559 | $ | 633,000 | 39.7 | % | |||||
| Palmdale | $ | 61,761 | $ | 51,867 | $ | 325,328 | 13.6 | % | |||||
| Panorama City1 | $ | 44,942 | $ | 35,099 | $ | 460,000 | 14.2 | % | |||||
| Tarzana1 | $ | 98,121 | $ | 58,424 | $ | 1,005,000 | 41.3 | % | |||||
| Valencia1 | $ | 106,509 | $ | 89,773 | $ | 583,000 | 42.8 | % | |||||
| Van Nuys1 | $ | 51,073 | $ | 37,133 | $ | 539,000 | 20.1 | % | |||||
| West Hills1 | $ | 109,815 | $ | 86,445 | $ | 605,000 | 39.1 | % | |||||
| Westlake Village1 | $ | 129,388 | $ | 94,588 | $ | 1,015,000 | 48.5 | % | |||||
| Arcadia/Monrovia1 | $ | 79,801 | $ | 58,920 | $ | 762,000 | 35.0 | % | |||||
| Glendale | $ | 67,506 | $ | 46,789 | $ | 758,000 | 31.6 | % | |||||
| North Hollywood1 | $ | 51,594 | $ | 37,782 | $ | 578,000 | 20.1 | % | |||||
| Pasadena | $ | 80,031 | $ | 51,939 | $ | 690,000 | 40.8 | % | |||||
| Studio City1 | $ | 97,638 | $ | 65,456 | $ | 915,000 | 50.1 | % | |||||
| Universal City1 | $ | 46,291 | $ | 34,765 | $ | 514,000 | 14.9 | % | |||||
| Los Angeles — Long Beach — Santa Ana | $ | 73,593 | $ | 51,573 | $ | 529,000 | 2 | 26.1 | % | ||||
| San Francisco — Oakland — Freemont | $ | 96,333 | $ | 70,806 | $ | 716,000 | 2 | 38.2 | % | ||||
| New York — N. New Jersey — Long Island | $ | 80,690 | $ | 57,277 | $ | 445,000 | 2 | 30.1 | % | ||||
| Washington — Arlington — Alexandria | $ | 97,539 | $ | 73,796 | $ | 426,00 | 2 | 42.2 | % | ||||
| United States | $ | 65,849 | $ | 48,775 | $ | 219,000 | 2 | 24.6 | % | ||||
- 1.
- Unincorporated area, estimates based upon local Zip Codes
52
- 2.
- National Association of Realtors 2005—median housing value
- Source: Claritas Sitereports 2006 & Public Records
Although the Westside's affluent population can afford top quality executive housing, the high cost of home ownership in the area creates a bias toward renting for all but the area's most permanent residents. This remarkable dynamic creates a steady flow of renters who have the financial means to own but choose to rent.
As the chart below illustrates, the Los Angeles County multi-family market has significantly outpaced the national average over the past six years in terms of rental rate premiums and growth, as well as in occupancy levels. Furthermore, the west Los Angeles multi-family market has enjoyed similar occupancy levels as Los Angeles County as a whole, while achieving a consistent premium in rental rates with an average premium in rental rates of 50.7% from 2000 to 2005.

LOS ANGELES SALES
The Westside multi-family market is one of the most fundamentally strong markets in the nation and as such, one of the most coveted investment markets. Landlords are typically long-term holders and transactions are rare. In the past four years, there have been approximately 12 major institutional quality multi-family transactions on the Westside and only two transactions, Water Terrace which was a condominium conversion and Legacy at Westwood which sold over 36 months ago, are considered to be comparable in quality and location to the Douglas Emmett multi-family projects. Most Westside transactions have occurred in Marina Del Rey, which is considered an overflow city relative to the "premier cities" of Santa Monica, Westwood, Brentwood and Beverly Hills within the Westside (it is noteworthy to mention that all four Douglas Emmett multi-family projects are located within the Westside—two in Santa Monica and two in Brentwood). Within the premier cities of the Westside, multi-family properties have benefited from substantial pricing premiums relative to the Greater Los Angeles area. Douglas Emmett's strength within these premier cities is evidenced by a near 100%
53
occupancy level and an asking rental rate premium of 27.2% above the overall West Los Angeles market. Details of noteworthy institutional multi-family transactions are outlined in the following table:
NOTEWORTHY MULTI-FAMILY INSTITUTIONAL SALES ACTIVITY
LOS ANGELES
| Date | Property Name | City | Units | Price (mil) | $/Unit | Buyer | Comment | |||||||||
|---|---|---|---|---|---|---|---|---|---|---|---|---|---|---|---|---|
| West Los Angeles/South Bay | ||||||||||||||||
| Jun-06 | Playa Pacifica | Hermosa Beach | 285 | $ | 68.5 | * | $ | 240,351 | Equity Residential | 100% Occupied | ||||||
| Feb-06 | Crescent Park Apartments | Playa Vista | 214 | $ | 71.5 | * | $ | 334,112 | Cornerstone Realty Advisors | |||||||
| Jun-05 | Sweetzer Chalet Apts | Los Angeles | 56 | $ | 13.0 | $ | 232,143 | 1440 N Alta Vista LLC | 91% occ. | |||||||
| Mar-05 | Oakwood Marina Del Rey | Marina del Rey | 597 | $ | 78.2 | $ | 130,928 | Archstone | 15 bldgs, 3 stories | |||||||
| Jan-05 | Water Terrace | Marina del Rey | 450 | $ | 305.0 | $ | 677,778 | Colony Capital | Condo conversion | |||||||
| Jan-05 | Fiji Villas | Marina del Rey | 166 | $ | 49.4 | $ | 297,835 | Archstone | — | |||||||
| Jan-05 | Chateau Marina | Marina del Rey | 342 | $ | 101.9 | $ | 297,835 | Archstone | — | |||||||
| Dec-04 | Villa Azure | Los Angeles | 624 | $ | 137.0 | $ | 219,551 | BRE Properties | — | |||||||
| Apr-03 | Broadway Apartments | Santa Monica | 101 | $ | 25.4 | $ | 251,092 | Archstone | part of portfolio | |||||||
| Apr-03 | Promenade | Santa Monica | 58 | $ | 14.6 | $ | 251,092 | Archstone | part of portfolio | |||||||
| Sep-02 | Legacy at Westwood | Westwood | 187 | $ | 85.0 | $ | 454,545 | TIAA / AFL-CIO | — | |||||||
| Jul-02 | Marina Pointe Apts | Marina del Rey | 583 | $ | 117.2 | $ | 200,943 | SSR JV CalPERS | — | |||||||
| Nov-01 | Plaza at the Arboretum | Santa Monica | 351 | $ | 89.5 | $ | 254,986 | Heitman / CalSTRS | — | |||||||
| May-01 | SeaCastle Apartments | Santa Monica | 178 | $ | 48.0 | $ | 269,663 | SSR / CalPERS | — | |||||||
| Total: | 4,192 | $ | 1,204.2 | $ | 287,261 | |||||||||||
| Hollywood/Tri Cities | ||||||||||||||||
| Mar-06 | Academy Village | North Hollywood | 248 | $ | 48.5 | $ | 195,565 | Equity Residential | High rise, 99% leased | |||||||
| Mar-06 | Woodbridge Village | North Hollywood | 144 | $ | 15.0 | $ | 104,167 | Orange Partners | Garden style | |||||||
| Jul-05 | Oakwood Toluca Hills | Hollywood | 1,151 | $ | 150.7 | $ | 130,928 | Archstone | 3 stories | |||||||
| Jul-05 | Oakwood Pasadena | Pasadena | 96 | $ | 12.6 | $ | 130,928 | Archstone | 3 stories, 100% occ. | |||||||
| Jul-05 | Embassy Apartments | Hollywood | 59 | $ | 14.1 | $ | 238,983 | HC2 Investments | 1 bldg, 4 stories | |||||||
| May-05 | Clybourne Ct/Chateau Toluca | Burbank | 145 | $ | 32.6 | * | $ | 224,828 | Interstate Equities | 2 bldgs, 3 stories, 94% occ. | ||||||
| May-05 | The Meridian | Pasadena | 98 | $ | 21.5 | $ | 219,142 | Nevis Homes | 1 bldg, 3 stories | |||||||
| May-05 | Royal Equestrian Apts | Burbank | 270 | $ | 43.0 | * | $ | 159,259 | Silver / Capri | 6 bldgs, 3 stories, 88% occ. | ||||||
| Feb-05 | Palazzo East | Hollywood | 610 | $ | 199.3 | $ | 326,721 | AIMCO | 60% occ. | |||||||
| Feb-05 | The Wilshire at Western | Hollywood | 260 | $ | 57.5 | $ | 221,154 | Forest City/MacFarlan | 1 bldg, 22 stories | |||||||
| Jan-05 | Wilcox Apartments | Hollywood | 102 | $ | 13.6 | $ | 133,015 | 1865 Bush Investors | 3 stories, 95% occ. | |||||||
| Jan-05 | Sunset + Vine Apts | Hollywood | 300 | $ | 111.0 | $ | 370,000 | SSR / CalPERS | mid/highrise | |||||||
| Jan-05 | Del Mar Station | Pasadena | 347 | $ | 134.0 | * | $ | 386,167 | Archstone | 4 bldgs, 4-7 stories | ||||||
| Dec-04 | Hampshire Place | Hollywood | 259 | $ | 38.5 | * | $ | 148,649 | Equity Residential | 95% occ. | ||||||
| Nov-04 | Hollywood Regency | Hollywood | 54 | $ | 9.0 | $ | 166,667 | GTO Development | 98% occ. | |||||||
| Sep-04 | The Marlowe | Hollywood | 121 | $ | 52.0 | * | $ | 429,752 | SSR / CalPERS | 80% occ., mid/highrise | ||||||
| Total: | 4,264 | $ | 952.9 | $ | 223,476 | |||||||||||
54
| San Fernando Valley | ||||||||||||||||
| May-06 | Arbors at Warner Center | Woodland Hills | 250 | $ | 50.0 | $ | 200,000 | Real Estate Ptrs. Inc. | ||||||||
| May-06 | Plaza at Sherman Oaks | Sherman Oaks | 392 | $ | 82.4 | * | $ | 210,204 | Friedkin Realty Group | 99% occupied, mid/high rise | ||||||
| May-06 | Villa D'Este | Encino | 129 | $ | 37.0 | $ | 286,822 | BlackRock | 80% Occupied | |||||||
| Dec-05 | Renaissance | Woodland Hills | 477 | $ | 82.8 | $ | 173,555 | Rockwood/Bascom | 95% occupied, mid/high rise | |||||||
| Sep-05 | The Premiere of Sherman Oaks | Sherman Oaks | 392 | $ | 74.1 | $ | 189,031 | Archstone Smith | Mid-rise, part of portfolio | |||||||
| Jul-05 | Oakwood Woodland Hills East | Woodland Hills | 883 | $ | 115.6 | $ | 130,928 | Archstone | — | |||||||
| Jul-05 | Oakwood Thousand Oaks | Thousand Oaks | 154 | $ | 20.2 | $ | 130,928 | Archstone | 2 stories, 100% occ. | |||||||
| May-05 | Clybourne Court | Burbank | 145 | $ | 32.6 | * | $ | 224,828 | Interstate Equities | |||||||
| Dec-04 | Woodside Village | Ventura | 145 | $ | 26.6 | $ | 183,103 | Essex Property Trust | 29 bldgs, 2 stories | |||||||
| Dec-04 | Estates at Woodland Hills | Woodland Hills | 80 | $ | 26.5 | * | $ | 331,250 | Silverstone Communities | — | ||||||
| Feb-04 | Bella Vista at Warner Center | Woodland Hills | 315 | $ | 56.5 | $ | 179,407 | Equity Residential | partial interest, 13 bldgs | |||||||
| Total: | 3,362 | $ | 604.3 | $ | 179,744 | |||||||||||
| San Gabriel Valley | ||||||||||||||||
| Jul-05 | Tuscany Villas & Resort Apts | Covina | 250 | $ | 37.3 | $ | 149,000 | Pacific Property | 95% occ. | |||||||
| Jun-05 | Summer Glen Apts | Whittier | 116 | $ | 21.9 | $ | 188,362 | Whittier LLC | 7 bldgs, 2 stories, 95% occ. | |||||||
| Mar-05 | Victoria Woods | Rowland Heights | 392 | $ | 42.3 | $ | 107,781 | AEW / CalSTRS | — | |||||||
| Feb-05 | Lafayette Parc | West Covina | 259 | $ | 40.5 | $ | 156,178 | Carmel Partners | 65 bldgs, 2 stories, 95% occ. | |||||||
| Nov-04 | Sunset Crest Apts | West Covina | 140 | $ | 18.8 | $ | 134,286 | Pacific Prop. / SSR | 97% occ. | |||||||
| Nov-04 | Pacific Isle | West Covina | 138 | $ | 18.4 | $ | 132,971 | Pacific Prop. / SSR | 97% occ. | |||||||
| Total: | 1,295 | $ | 179.2 | $ | 138,378 | |||||||||||
| Downtown | ||||||||||||||||
| Jun-05 | Virgil Tower & Virgil Square | Los Angeles | 142 | $ | 20.7 | $ | 145,423 | Equity Residential | 2 bldgs, 4 stories | |||||||
| Apr-05 | Pegasus | Los Angeles | 322 | $ | 75.0 | $ | 232,919 | Lubert Adler | Internal recapitalization | |||||||
| Dec-04 | Wilshire Royale | Los Angeles | 193 | $ | 23.9 | * | $ | 123,834 | Redferb Family Trust | 1 bldg, 12 stories | ||||||
| Total: | 657 | $ | 119.6 | $ | 182,040 | |||||||||||
| East Los Angeles | ||||||||||||||||
| Jun-05 | Eucalyptus Apts | Bellflower | 52 | $ | 6.7 | * | $ | 128,846 | 2300 W El Segundo | 1 bldg, 1 story, 100% occ. | ||||||
| Jun-05 | Lakewood Colony | Lakewood | 52 | $ | 7.4 | $ | 142,308 | Howie Family LLC | 2 bldgs, 2 stories, 96% occ. | |||||||
| May-05 | Inglewood Properties | Inglewood | 55 | $ | 5.5 | $ | 100,000 | 3627 W. 104th St. LLC | 2 stories | |||||||
| Mar-05 | Stupin Andrews | Norwalk | 95 | $ | 12.1 | $ | 127,368 | NA | 1 bldg, 2 stories | |||||||
| Mar-05 | Lake Plaza Apts | Bellflower | 57 | $ | 7.7 | $ | 134,211 | Corinthian Prop. LLC | 2 stories, 100% occ. | |||||||
| Jan-05 | Barcelona Apts | Lakewood | 71 | $ | 9.4 | $ | 132,394 | 2444 Orangethorpe LLC | — | |||||||
| Jan-05 | Terramar Apts | Lakewood | 52 | $ | 7.1 | $ | 136,538 | Cottages Apts LLC | — | |||||||
| Dec-04 | Sahara Apts | Downey | 74 | $ | 8.0 | $ | 108,243 | Landmark Equity | 98% occ. | |||||||
| Oct-04 | Villas at Bonita | San Dimas | 102 | $ | 16.3 | $ | 159,314 | United Dominion | 9 bldgs, 3 stories | |||||||
| Total: | 610 | $ | 80.2 | $ | 131,475 | |||||||||||
Source: Real Capital Analytics
*Approximate
55
WEST LOS ANGELES MULTI-FAMILY OVERVIEW
Consistent with the strong demand for housing in the area, the Westside has sustained a healthy average annual occupancy rate of approximately 96.5% over the last seven years. This robust demand has supported rental growth that consistently exceeds inflation in the region and allows the West Los Angeles market to continually collect the highest rents in the Los Angeles region. Furthermore, many older properties have been converted into condominiums and, as a result, have further diminished West Los Angeles' supply of rentable housing. The West Los Angeles multifamily market is characterized by its coastal proximity, convenient access to the West Los Angeles office market and a broad level of lifestyle amenities. These submarkets also generally boast an affluent and highly educated population that is attracted to the better air quality and more temperate climate in these submarkets, as compared to the rest of Los Angeles County. Accordingly, the Westside has one of the most compelling stories in the nation and demand for multifamily rental housing should continue to rise as a result of the underlying strength of the regional economy, the area's quality of life, and the prohibitive cost of home ownership.
RENTAL RATES & OCCUPANCY
Douglas Emmett owns seven properties totaling 1,770 units in West Los Angeles, of which 820 units are located in Santa Monica and 950 units are located in Brentwood. In comparison to the 97.4% occupancy experienced by the overall West Los Angeles market, Douglas Emmett properties are virtually full, having reached an average 99.5% occupancy. The average West Los Angeles asking rent per unit per month is $1,948 while the average Douglas Emmett asking rent per unit per month is $2,477, representing a premium of 27.2%. These disparities, supported by multiple factors including location, size, and proximity to high-end amenities, reflect the strength of the Douglas Emmett multi-family properties within the Westside.
MONTHLY AVERAGE ASKING RENT
SECOND QUARTER 2006
| Market/Portfolio | Asking Rent | Occupancy | |||
|---|---|---|---|---|---|
| Douglas Emmett Properties | $ | 2,477/unit/mo | 99.5% | ||
| West Los Angeles | $ | 1,948/unit/mo | 97.4% | ||
| South Bay Cities | $ | 1,577/unit/mo | 97.4% | ||
| Tri Cities | $ | 1,534/unit/mo | 97.1% | ||
| Hollywood | $ | 1,491/unit/mo | 97.8% | ||
| Downtown Los Angeles | $ | 1,483/unit/mo | 98.2% | ||
| Los Angeles Area | $ | 1,431/unit/mo | 97.3% | ||
| San Fernando Valley | $ | 1,426/unit/mo | 97.8% | ||
| Long Beach | $ | 1,350/unit/mo | 96.3% | ||
| San Gabriel Valley | $ | 1,221/unit/mo | 97.5% | ||
| East Los Angeles | $ | 1,146/unit/mo | 97.9% | ||
Source: M/PF Research & Douglas Emmett
Although Douglas Emmett receives relatively high rents from its properties, all their properties, with the exception of 555 Barrington, are governed under rent control restrictions implemented in the 1970s. In 1999, statewide legislation allowed previously rent controlled units to be leased at market rates once the original tenant vacated; the legislation, however, still allows limits on annual rent increases. In 2003, Santa Monica passed an ordinance that amended the rent control regulations to permit owners to charge market rents where a tenant was not using the rent controlled unit as a primary residence. Effective September 1, 2006, Santa Monica increases in rent are limited to 4% with a cap at $54 per unit per month. Pacific Plaza and The Shores, both located in Santa Monica, have a
56
significant number of units leased under rent controlled levels, and thus, will realize large gains in rental income as the leases are brought to market levels. Barrington Plaza falls under the Los Angeles Rent Stabilization Ordinance, which is less stringent than Santa Monica's and allows 3%-8% annual rental increases as well as the adoption of market rental rates upon a vacancy. As of June 30, 2006, 355 units, or approximately 43% of Douglas Emmett's Santa Monica multifamily units, were under leases signed prior to 1999, resulting in an average discount to asking rents of $2,145 per unit. Over the past three years, an average of 35 of these rent-controlled units rolled over to market rents each year.
SUPPLY
Historical new multi-family completions in Los Angeles County have been very limited, with approximately 21,000 units, or a 0.3% average increase in available supply, completed from 2000 to 2005. During the same period, the rate of new supply of multi-family units in West Los Angeles has been consistent with Los Angeles County as a whole, with only approximately 3,260 new multi-family units completed, or a 0.4% average increase in available supply. In West Los Angeles, approximately 3,900 new multi-family units are proposed, planned or under construction between 2006 and 2008, the majority of which are located outside of Douglas Emmett's targeted West Los Angeles multi-family submarkets. Over this time period, there is no new supply projected in the Brentwood submarket and there are approximately 900 multi-family units either proposed, planned or under construction in Santa Monica. The new supply in Santa Monica is generally comprised of projects that are smaller in size and farther from the beach than Douglas Emmett's Santa Monica multi-family assets. We expect this space will be absorbed by the significant rental demand in this highly desirable rental submarket. Douglas Emmett's multi-family properties in the Brentwood market are all located in the premier multi-family areas from Wilshire Boulevard north to Sunset Boulevard. These properties contain a total of 950 units and operate at virtually full occupancy in a very supply constrained market. Few undeveloped lots remain in this submarket, and it is generally possible to build new multi-family properties only by replacing existing buildings. No new multi-family projects are under construction or planned or proposed for 2006 through 2008, with all new development activity in condominiums.
Aside from 555 Barrington, Douglas Emmett's multi-family properties are irreplaceable under current legislative restrictions. Thus, Douglas Emmett's leadership in high-end multi-family properties is protected from competitors through strong anti-development policies set forth by local governments and fervently supported by local residents. As highlighted in the table on the following page, Douglas Emmett owns four of the top tier institutional quality multifamily properties in Los Angeles.
57
TOP TIER LOS ANGELES MULTI-FAMILY PROPERTIES
AS OF SECOND QUARTER 2006
| Property | Address | Owner | Units | Ave. SF/Unit | Ave. Asking Rate ($/Mo) | Occupancy | Comments | ||||||||
|---|---|---|---|---|---|---|---|---|---|---|---|---|---|---|---|
| 1221 Ocean Avenue | 1221 Ocean Avenue, Santa Monica | Irvine Apartment Communities | 120 | 1,606 | $ | 8,790 | 96% | Ocean and City Views, Close to 3rd St. Promenade, Large Units | |||||||
| The Shores | 2720 Neilson Way, Santa Monica | Douglas Emmett & Company | 532 | 869 | $ | 3,552 | 100.0% | Ocean Views, excellent amenity base | |||||||
| 555 Barrington | 555 Barrington Ave., Los Angeles | Douglas Emmett & Company | 111 | 1,393 | $ | 3,698 | 98.2% | Exclusive neighborhood, large units | |||||||
| Legacy at Westwood | 10833 Wilshire Blvd., Los Angeles | TIAA | 187 | 1,302 | $ | 4,266 | 96% | New construction, high-end amenities, freeway access | |||||||
| Sea Castle | 1725 The Promenade, Santa Monica | BlackRock Realty | 178 | 495 | $ | 3,847 | 93% | Beachfront ocean views, 20% low income housing, average unit size | |||||||
| Pacific Plaza | 1431 Ocean Ave., Santa Monica | Douglas Emmett & Company | 288 | 541 | $ | 1,797 | 99.0% | Ocean Views, high-rise, 3rd St. Promenade adjacent | |||||||
| Santa Monica Collection | 1530 7th St. Santa Monica | JSM Construction | 430 | 753 | $ | 2,260 | 88% | New construction, close to 3rd St. Promenade | |||||||
| Barrington Plaza | 11740 Wilshire Blvd., Los Angeles | Douglas Emmett & Company | 712 | 750 | $ | 1,894 | 99.7% | Only high-rise residential property on Wilshire, West of the 405 Freeway | |||||||
| Archstone Santa Monica | 425 Broadway, Santa Monica | Archstone-Smith | 107 | 545 | $ | 2,017 | 96% | Average Size units, 3rd St. Promenade adjacent | |||||||
Source (other than Douglas Emmett): Real Facts
OAHU MULTI-FAMILY MARKET OVERVIEW
Oahu's population, diverse economic base, and strong growth prospects combined with a severely limited supply of developable land help create one of the nation's most unique and coveted multi-family markets. Rentals in this market are scattered among an inventory that is mainly comprised of individually owned condominium units, a few institutionally owned multi-family projects (Moanalua Hillside is the largest) and single-family rentals. Rental demand is driven not only by residents of Oahu but also by visitors to the island seeking short-term rentals. Douglas Emmett owns two of only five privately controlled multi-family projects over 100 units on the island.
Population—Approximately 905,000 people, or 71%, of Hawaii's total population of 1,275,000 people, are located in Honolulu County.
Economic Base—A broad range of industries comprise Hawaii's economy. In addition to thriving tourism and agriculture industries, approximately 25% of Hawaii's employment is within the fields of health care, finance, and trade.
Employment—Hawaii exhibits one of the strongest employment markets in the United States. From 2nd quarter 2005 to 2nd quarter 2006, Honolulu added 14,350 wage and salary jobs, an increase of 2.4%. Moreover, the Bureau of Labor Statistics reported that Hawaii's June 2006 unemployment rate was 3.1%, the third lowest in the nation.
Shrinking Base of Supply—Due to the scarcity of large institutional, multi-family projects, most of the available rental inventory comes from individually owned condominium units and to a lesser extent,
58
single-family rentals. Rising home/condo prices have led to the conversion of apartment projects into condominium units and the sale of rented condominiums to owner occupants.
A portion of the following information is supplemented with the 2003 Hawaii Housing Policy Study. This study is commissioned by the Housing and Community Development Corporation of Hawaii, the Department of Hawaiian Home Lands, City and County of Honolulu and the housing agencies of the Counties of Hawaii, Kauai and Maui. This study is not commissioned annually (the last two studies were completed in 1997 and 2003).
Rentals in Oahu are scattered among an inventory that is mainly comprised of individually owned condominium units, a few institutionally owned multi-family and single-family rentals. Douglas Emmett owns two institutional quality assets, the Moanolua Hillside Apartments and the Royal Kunia apartments, with a combined 1,098 units. Rental demand is driven not only by residents of Oahu but also by visitors to the island (approximately 4.7 million arrivals to the island annually, 31.6 million total visitor days) seeking short-term rentals.
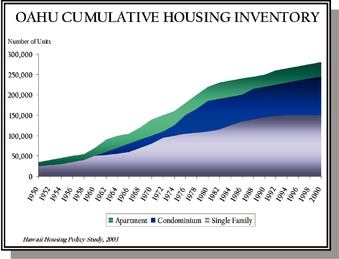
SUPPLY
As indicated in the table below, the apartment unit inventory in Honolulu County has actually decreased over the last 10 years. In addition, the available pool of condominiums and single-family residences for rent is also shrinking.
HONOLULU COUNTY HOUSING INVENTORY 2003
| Housing Unit Type | 1992 | 1997 | 2003 | |||
|---|---|---|---|---|---|---|
| Single Family | 137,229 | 145,078 | 150,957 | |||
| Condominium | 81,293 | 92,503 | 91,913 | |||
| Apartment | 40,535 | 43,732 | 39,602 | |||
| Military | 19,324 | 20,071 | 21,843 | |||
| Student | 4,392 | 4,405 | 4,270 | |||
| Cooperative | 2,714 | 3,684 | 2,881 |
Source: Hawaii Housing Policy Study 2003
The decreasing supply of units in the rental market is due to a number of different factors:
Housing prices are rising rapidly. According to the Honolulu Board of Realtors, the average home price as of 2ndquarter 2006 for metropolitan Oahu is $640,000, up 10.8% from 2nd quarter 2005. Posting similar gains, the 2ndquarter 2006 average condominium price is $305,000, up 18.7% from 2nd
59
quarter 2005. Rising home/condo prices have led to the conversion of apartment projects into condominium units and the sale to owner-occupants of single-family homes that had previously been in the rental pool. Data from the 2003 Hawaii Housing Policy Study indicates that 36% of condominiums and 69% of single-family homes are owner occupied.
Visitor demand for rental units is decreasing the rental supply available to Honolulu residents. As noted above, the visitor market in Hawaii and Oahu is strong. Once visitors arrive, a significant number stay in condominiums or single-family rentals. According to the Hawaii Department of Business, Economic Development, and Tourism, over 16% of visitors to Hawaii in 2005 stayed at least part of their stay in condominium units. As demand from visitors increases, rental units will exit the permanent resident pools as landlords seek out parties willing to pay a hefty premium for a short-term rental.
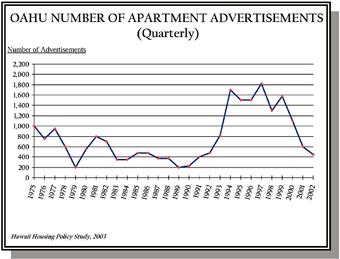
AIR ARRIVALS TO HAWAII
| Accommulation Plans | 2002 | 2003 | 2004 | 2005 | CAGR | ||||||
|---|---|---|---|---|---|---|---|---|---|---|---|
| Partial Condo Stay | 1,048,160 | 1,132,346 | 1,158,978 | 1,217,325 | 5.1 | % | |||||
| Condo Only | 821,834 | 857,771 | 882,741 | 932,690 | 4.3 | % |
Source: DBEDT
The supply of multi-family housing has been severely impacted by the popularity of condominium-conversions throughout the Oahu market. Due to significant increases in housing prices, the conversion of rental units to condominium units has become an attractive investment opportunity for many developers over the past seven years. As outlined in the table below, the number of housing units converted to condominiums has increased over six fold from 368 units in 1999 to 2,347 units in 2005.
HOUSING UNITS CONVERTED TO CONDOMINIUM UNITS—STATEWIDE
| Subject | 1999 | 2000 | 2001 | 2002 | 2003 | 2004 | 2005 | |||||||
|---|---|---|---|---|---|---|---|---|---|---|---|---|---|---|
| Projects | 73 | 55 | 44 | 58 | 92 | 116 | 135 | |||||||
| Housing Units | 368 | 342 | 454 | 591 | 740 | 1,422 | 2,347 |
Source: DBEDT
The high land value and cost of construction in Hawaii (approximately 1.5 times mainland cost) makes the construction of new units prohibitive and this is not expected to change for the foreseeable future. As shown by the chart to the right—even under the assumption that today's current asking rents are grown by 5.5% per year, asking rents will still not reach levels necessary to justify new construction.
60
The Hawaii Housing Policy Study of 2003 predicted no new multifamily construction in the next ten years.
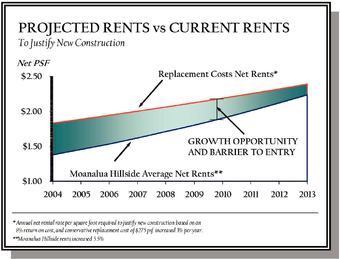
RENTAL RATES & OCCUPANCY
The Honolulu multifamily market has shown improvement in both rental rates and occupancy levels over the past six years. As illustrated in the adjacent chart, average rental rates have grown from $1,150 per unit per month in 2000 to $1,264 per unit per month in 2005, representing a 9.9% increase or an average compounded annual growth rate of 1.9%. Additionally, occupancy levels have risen from 92.9% in 2001 to 94.6% in 2005. As of June 30, 2006, the average monthly asking rent per unit and occupancy rate for Douglas Emmett's Honolulu multifamily properties was $1,547 (excluding income-restricted units) and 99.6%, respectively, compared to $1,283 and 95.2% for the Honolulu multifamily market as a whole.
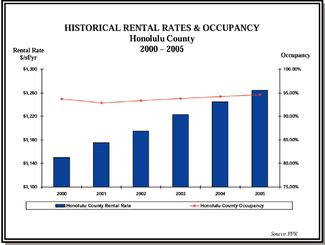
HONOLULU MULTIFAMILY RENT & OCCUPANCY
| Market | Asking Rents (per unit/months) | Occupancy | |||
|---|---|---|---|---|---|
| Honolulu | $ | 1,283 | 95.2% | ||
| Douglas Emmett Portfolio | $ | 1,547 | 99.6% | ||
Source (other than Douglas Emmett): Property & Portfolio Research
- (1)
- Excludes Douglas Emmett income restricted units
61
There are several reasons why rental asking rates for the market as a whole should continue to rise at or faster than inflation:
Despite a sharp increase in household income and median home prices, rents have remained relatively stable over the past ten years. Even with the recent average asking rental rate increases, current Honolulu asking rents are lower in relation to household incomes than they were ten years ago. This is a stark comparison to other supply constrained markets such as Los Angeles and San Francisco, where rents have increased significantly since 2000. In addition, Honolulu's for-sale housing market has become much less affordable. As illustrated in the graphs below, since 2000, the affordability of a condo or single-family Oahu home, as measured by the percent of income required to pay a mortgage on the median priced home, has decreased significantly. As a result, many potential homeowners have remained renters.
| | | |
|---|---|---|
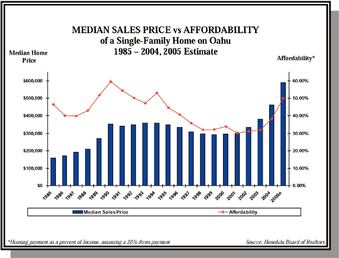 | 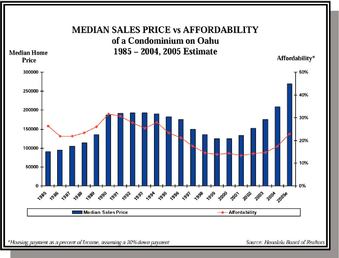 |
Average asking market rents have been deflated by a lack of large, institutional ownership and a large number of individual, income-sensitive owners. Many owners of individual condominium units cannot afford to have even one month of downtime for fear of missing a mortgage payment or a significant portion of their income. This causes a large number of landlords in the market to be overly cautious and conservative when raising rates. As housing prices rise, more and more of these rental units are being sold and converted to owner-occupied units. Even if a new owner wanted to buy a condominium and rent it out, the average asking rent would have to be much higher, given today's prices. For example, condominiums comparable to Douglas Emmett's Moanalua Hillside Apartments currently sell for $300,000. Assuming an investor required a 7% return, annual rent would have to be $21,000 or just over $2.18/sf/mo. for an 800 square foot condominium.
Increasing Military Rent Subsidies: Under the Basic Allowance for Housing (BAH) Program, the military provides tax-free housing subsidies covering the rental expenses for approximately 950,000 service members, according to rank and number of dependents. Resulting from the passing of the 2006 Defense Authorization Act, HR 1815 in December 2005 and later the 2006 Defense Appropriations Act in January 2006, the government increased the Military BAH Program's funding by $1.6 billion to $13.6 billion. Under the current plan, the BAH is estimated to cover 100 percent of the rental cost for an average rental in a given area, as estimated by Department of Defense (DoD) surveys of average housing costs in individual housing markets. DoD surveys yield data with a statistical confidence level of at least 95% and include research provided by Runzheimer International's nationwide housing cost data, current residential vacancies identified in local newspapers and real estate rental listings, telephone interviews and direct contacting of apartment and real estate management companies, and market updates from local real estate professionals. As a result of Oahu's increased apartment demand, decreased apartment supply, and a housing market beyond the affordability of many median income earners in Oahu, service members in Oahu receive some of the highest allowances in the nation. The BAH for Oahu service members will increase by significantly more than the current total average increase in funding of 5.9%. This translates into significant potential for future rental growth in the Oahu market.
62
The rental market in Oahu is spread throughout the island with the largest concentrations of rental units located in Pearl City/Ewa Plain and the southeast portion of the island near Metro Oahu, Diamond Head/Hawaii Kai, Kailua and Waikiki. A brief overview of the Oahu rental areas follows:
Central Oahu: Central Oahu, once a heavily forested region, is located on an elevated plateau nestled between two mountain ranges to the east and west and Pearl Harbor to the South. Central Oahu is close to both Pearl Harbor and Schofield Barracks and therefore is a desired location for the military. However it's still a fair distance from downtown and Waikiki. Central Oahu features the Castle & Cooke master-planned community of Mililani, a community popular among families. Due to its master planned nature, there are limited rentals in the area and to our knowledge no major rental developments are planned.
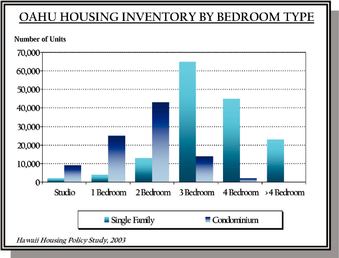
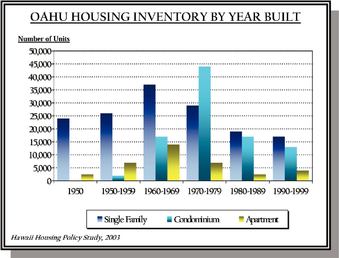
Leeward Coast: Home to the city of Kapolei and the Ko Olina resort, the leeward side of the island (West Oahu) is less traveled than the other areas of the island. The Leeward Coast, master planned and suburban in nature, is still a significant distance (1 hour) from downtown and Waikiki.
Windward Oahu—Kailua/Kaneohe: The southern side of Windward Oahu (Kailua) is home to suburban beach communities while the northern end (Kaneohe) is more rural. The majority of the housing inventory in Windward Oahu is located in Kailua, which mainly consists of high-end ($800,000 average price as of 2nd quarter 2006) single-family homes. Kailua is more easily accessible from
63
downtown and the airport, approximately 25 minutes away, while Kaneohe is a much farther drive via the H3; as much as 45 minutes, depending on traffic.
Diamond Head/Hawaii Kai: Located directly to the east of Waikiki, the communities of Diamond Head and Hawaii Kai are set against the striking background of Diamond Head along the Pacific Ocean. As of 2nd quarter 2006, Hawaii Kai includes some of the most expensive homes on the island at an average price of $965,000 while Diamond Head homes average $905,000. The majority of the housing inventory in this area is upscale, single-family. However, rentals are available, particularly in Hawaii Kai, and command the highest average asking rents in Oahu.
Waikiki: Waikiki is Oahu's most famous and most dense neighborhood. Occupying the southeast portion of Oahu along Waikiki Beach, the area is home to the majority of Oahu's hotel inventory as well as an abundance of condominium projects (44,000 units in the Metro Oahu/Waikiki area). Feeding off the momentum created by the strength of the visitor industry, Waikiki is currently undergoing a renaissance that includes a variety of condo conversions and Outrigger's $300 million Beachwalk multi-use project. A large majority of Waikiki's condos are short-term rentals to visitors.
North Shore: Oahu's North Shore is well known among residents and visitors alike for its world famous surfing locations at Sunset Beach, Banzai Pipeline and Waimea Bay. The North Shore has a relatively small inventory of housing units most of which are expensive, single family homes. Rentals are mainly used by visitors to the island as the North Shore's distance from Waikiki (over an hour), downtown (one hour) and the major military bases make it a less likely location for Oahu residents.
Ewa Plain: The Ewa Plain contains approximately 32,000 acres on the southwestern portion of Oahu. The area includes seven communities (Waipahu, Kapolei, Ewa, Ewa Beach, Makakilo, Nanakuli and Makaha). The Ewa Plain has been a focal point of recent growth on the island as more families have pushed out west as housing cost rose quickly along the south coast and metro Oahu. Because of the recent growth, the traffic from the Ewa Plain area into downtown and Waikiki is significant and travel time can be as much as an hour. The Ewa Plain includes a few rental projects, of which the majority are condominium projects.
Pearl City/Aiea: Pearl City, located on the edge of the Leeward Oahu region, lies along Highway H1 near the East and Middle lochs of Pearl Harbor. In addition to the commercial district along Highway H1, the area has several neighborhoods of condominium projects and single-family homes known as Pearl City Uplands, Waiau, Momilani and Pacific Palisades and Aiea. Pearl City/Aiea is located a short distance to the west of Moanalua Hillside and therefore derives some of the same benefits from its central location in between the military bases to the west and downtown and Waikiki to the southeast. However, Pearl City is also well known for its traffic, so travel time is quite a bit more cumbersome.
Metro Oahu/Downtown: Home to the majority of Oahu's office space (5.1 million square feet), downtown Honolulu also includes a number of high rise condominium projects and low rent apartment projects that are controlled by the city. The mountain (mauka) side of downtown includes the Maikiki/Manoa neighborhood—an area that includes a large variety of single-family rentals as well as smaller apartment and condo rentals. While downtown has gained some ground as a residential destination with the development of high profile condominium projects such as Harbor Court, it lacks the suburban amenities and coastal/mountain atmosphere found in other parts of the island.
Salt Lake/Moanalua: Located just to the northwest of downtown Honolulu, the Salt Lake/Moanalua area is classified as part of the Metro Oahu region. The Salt Lake neighborhood (directly adjacent to Moanalua) features a combination of upscale homes (average pricing between $500,000 and $600,000) and dense condominium projects. The hills of Moanalua are green and far less dense and feature single-family homes, condos and the Moanalua Hillside Apartments. The Salt Lake/Moanalua
64
area benefits from it central location just five minutes from the airport, 10 minutes from downtown and 20 minutes from Pearl Harbor.
MILITARY HOUSING & DEVELOPMENT
In Spring 2004 the military began a $2.3 billion joint-venture with Actus Lend-Lease to reconstruct nearly 8,000 homes on Oahu's various military bases. As of June 2006, the first of 5,388 planned homes was completed with additional plans to renovate and another 2,506 existing homes. These plantation style homes will range in size from 1,600 to 3,000 square feet and will be built on the Kalakaua Community at Schoelfield Barracks. The University of Hawaii Economic Research Organization estimated that construction spending increased 17% in 2004 as a result, the beginning of an upward cycle that is projected to last over 10 years. Additional housing needs have been created by the Army's planned Stryker brigade. This project includes the creation of 71 miles of private trails, six new firing ranges, two airfield upgrades, and the purchase of 1,400 acres adjacent to Schofield Barracks. The new unit should be fully functional by 2007 and will be built around the 2nd Brigade at Schofield and an additional 1,000 soldiers from other units, bringing the total strength to 4,000.
Aircraft Carrier—The Pentagon is considering moving a nuclear aircraft carrier from the Continental United States to Pearl Harbor. The U.S. Navy currently has 12 nuclear aircraft carriers assigned to the Pacific and Atlantic Ocean. Three of the Pacific Fleet carriers are stationed in San Diego, two are in Puget Sound in Washington and one is in Japan while the remaining six carriers are stationed in the Atlantic Ocean. One of the three carriers in San Diego may be deployed and stationed at Pearl Harbor. The economic impact of stationing an aircraft carrier in Hawaii would be substantial. An aircraft carrier travels with over 8,800 crewmembers and carries approximately 80 aircraft. Based on a study conducted by the Chamber of Commerce of Hawaii, an aircraft carrier stationed at Pearl Harbor would create approximately 4,200 combined military and civilian jobs and have an annual economic impact of $375 million.
HONOLULU SALES
Noteworthy institutional multi-family transactions are outlined in the following table. As illustrated by the relatively few transactions over the 2003-2006 period, it is important to note that institutional transactions in Oahu are quite rare:
NOTEWORTHY MULTI-FAMILY INSTITUTIONAL SALES ACTIVITY
| Date | Property Name | City | Units | Price (mil) | $/Unit | Buyer | Comments | |||||||||
|---|---|---|---|---|---|---|---|---|---|---|---|---|---|---|---|---|
| May-06 | Kukui Gardens | Honolulu | 882 | $ | 130.0 | * | $ | 147,392 | Carmel Partners | Garden Style, Sec.-8 | ||||||
| Mar-06 | Royal Kunia | Waipahu | 402 | $ | 114.3 | $ | 284,000 | Douglas Emmett & Company | 99% occupied at sale | |||||||
| Aug-05 | 1936 Wilder Ave. | Honolulu | 20 | $ | 13.4 | * | $ | 669,000 | Punahou Marquis | |||||||
| Jun-05 | Orion Housing | Kapolei | 516 | $ | 79.5 | $ | 154,000 | Carmel Partners | ||||||||
| Jan-05 | Moanalua Hillside Apartments | Honolulu | 696 | $ | 108.5 | $ | 156,000 | Douglas Emmett & Company | 96% occupied at sale | |||||||
| Feb-03 | Sunset Villa Apartments | Waipahu | 406 | $ | 32.2 | $ | 79,310 | Bascom Group | 98% occupied at sale | |||||||
| Total: | 2,040 | $ | 347.9 | $ | 171,000 | |||||||||||
Source: Real Capital Analytics
*Approximate
65
DOUGLAS EMMETT PORTFOLIO
The Economic Base of the Los Angeles Five-County Area 2005 Annual Average of Non-Farm Employment (in 000s)
Busiest Airports in the World