|
| | |
| Douglas Emmett, Inc. | | EXECUTIVE SUMMARY |
| |
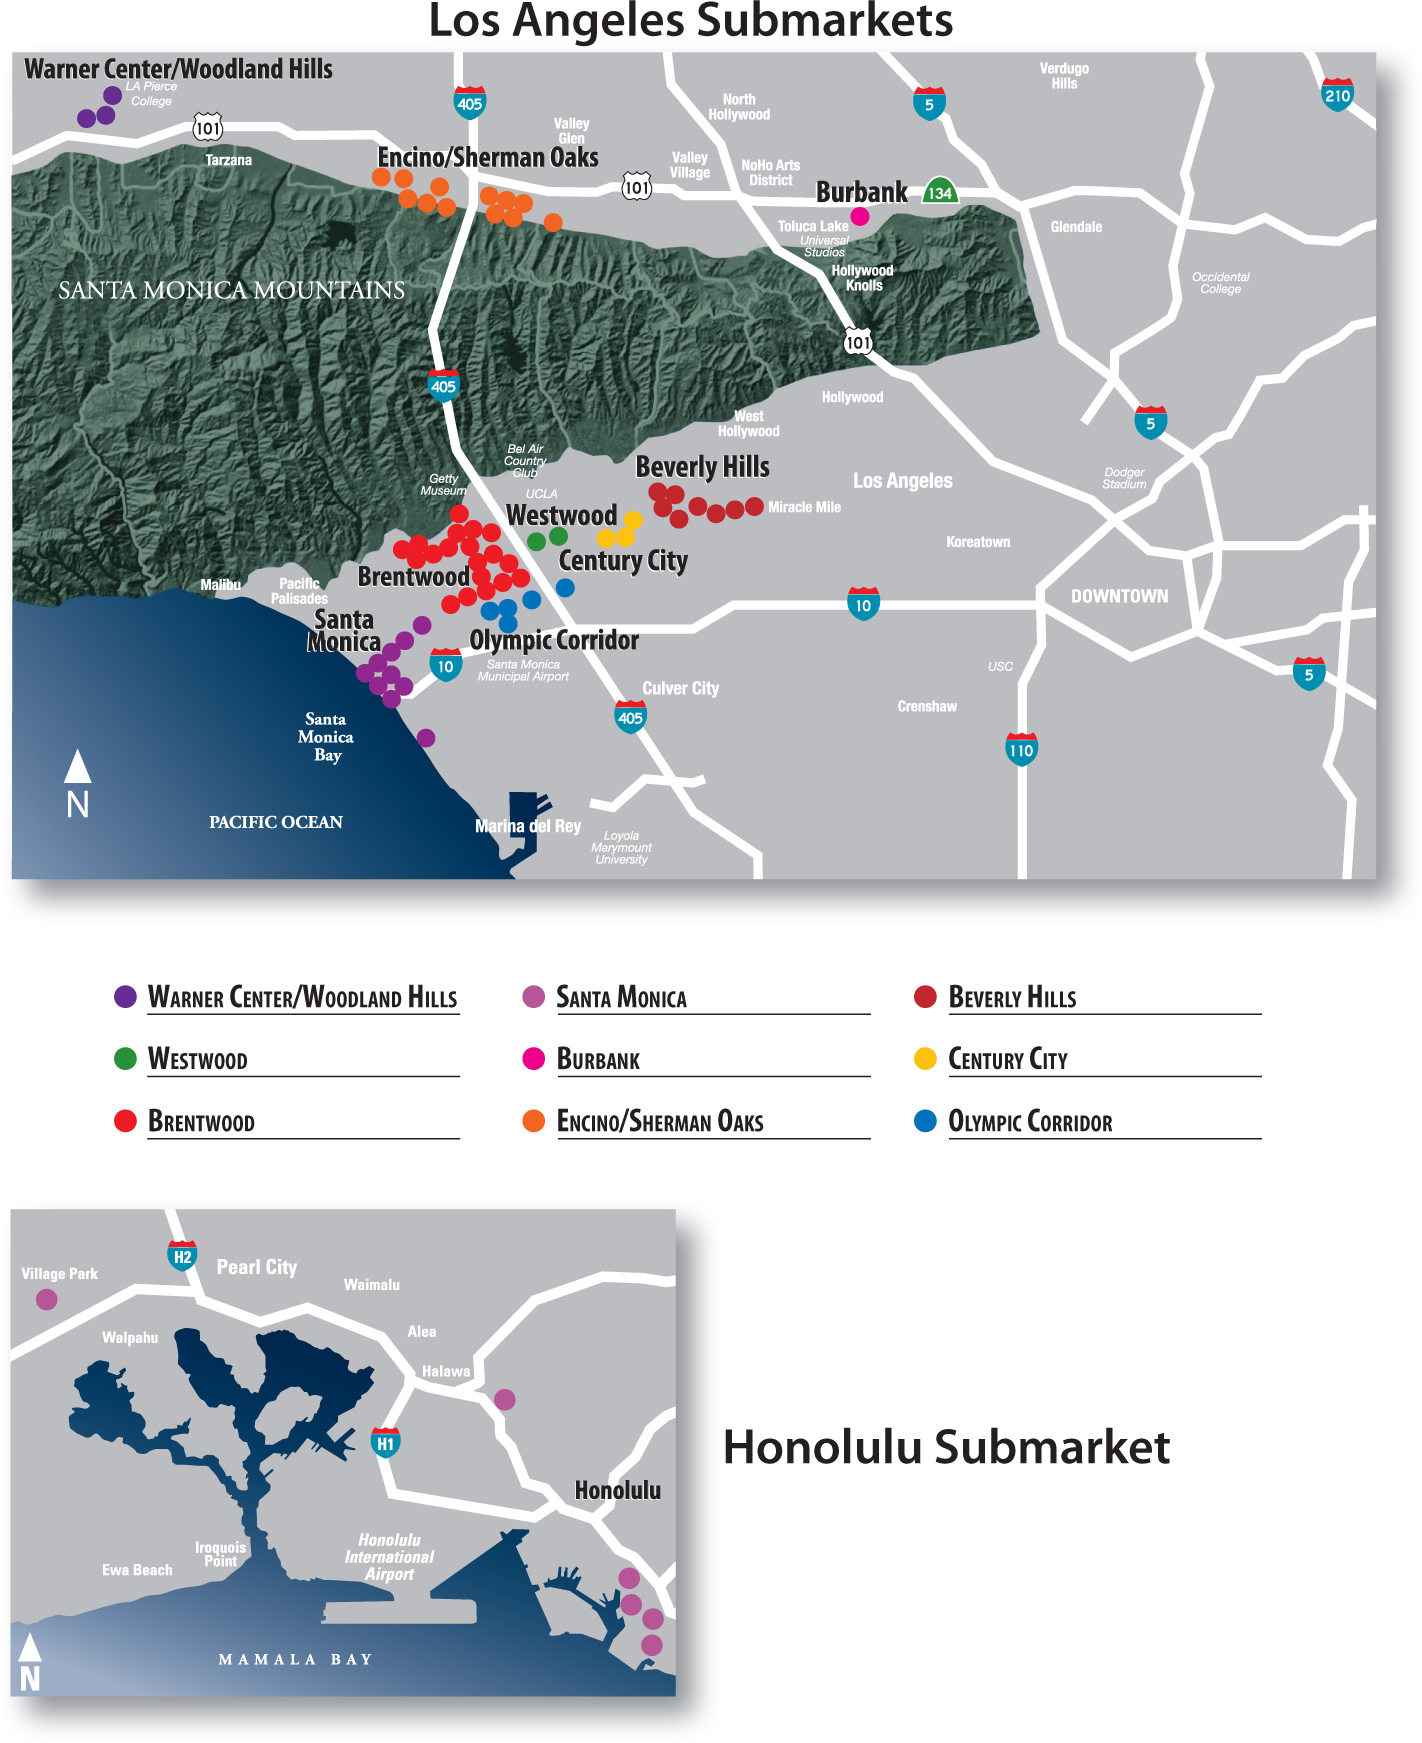
We are one of the largest owners and operators of high-quality office and multifamily properties located in the premier coastal submarkets of Southern California and Hawaii. Our properties are concentrated in ten submarkets - Beverly Hills, Brentwood, Burbank, Century City, Honolulu, Olympic Corridor, Santa Monica, Sherman Oaks/Encino, Warner Center/Woodland Hills and Westwood. We focus on owning and acquiring a substantial share of top-tier office properties and premier multifamily communities in neighborhoods with significant supply constraints, high-end executive housing and key lifestyle amenities. We operate as a REIT and we are listed on the New York Stock Exchange under the symbol DEI.
FOURTH QUARTER 2013 EXECUTIVE SUMMARY
| |
| • | Office Fundamentals: During the fourth quarter, we increased the leased rate of our total office portfolio by over 50 basis points to 92.2% and our occupied percentage by over 80 basis points to 90.4%. Excluding the impact of acquisitions, we increased our leased rate during the full year of 2013 by about 120 basis points and our occupied rate by about 100 basis points. We continue to achieve higher net effective rents year over year in all of our submarkets except for Warner Center, with an increasing number of our leases including annual rent bumps in excess of 3%. On a mark to market basis, the asking rents for our total office portfolio were on average 1.6% higher than our in-place rents. |
| |
| • | Multifamily Fundamentals: In our multifamily portfolio, which remains fully leased, our average asking rents were 5.3% higher than in the fourth quarter of 2012. |
| |
| • | Financial Results: For the fourth quarter, we increased our Funds From Operations (FFO) by 13.6% to $64.2 million, our Adjusted Funds From Operations (AFFO) by 14.3% to $51.5 million and our GAAP net income attributable to common stockholders by 48.0% to $8.8 million compared to the fourth quarter of 2012. We increased our 2013 FF0 per share to a record $1.49, up 9.6% from 2012 and 27.4% from 2007, our first full year as a public company (2012 FFO includes an adjustment for interest rate swaps terminated in 2011). In 2013, our AFFO per share increased to a record $1.18, up 12.4% from 2012 and 66.2% from 2007, while our GAAP net income per common share increased by 100.0% to $0.32 compared to 2012. |
| |
| • | Same Property Cash NOI: Our 2013 same property cash NOI increased by 1.7% compared to 2012. |
| |
| • | Debt: In December 2013, we closed a four year, $300 million secured revolving credit facility with interest at LIBOR+1.40%. We used $40 million from this facility, along with $110 million of our cash on hand, to pay off a loan scheduled to mature in April 2015. At year end, our net consolidated debt to enterprise value was 44%. |
| |
| • | Developments: We expect to break ground on an additional 452 apartments at our Moanalua Hillside Apartments in Honolulu by the middle of this year. Construction should take approximately 18 months and cost approximately $100 million, which includes the cost of upgrading the existing 696 apartments and building a brand new community center. In Brentwood, our high-rise apartment project is making good progress through the protracted development process. |
| |
| • | Dividends: We have increased our projected 2014 annualized dividend to $0.80 per share. With our continued strong AFFO growth, our 2014 projected AFFO payout ratio of 64% (based on the mid point of our current guidance), is among the best of comparable office REITs, giving us strong liquidity, as well as room for additional dividend growth. |
| |
| • | Guidance: We are establishing our 2014 full year FFO guidance range of $1.57 - $1.63 per diluted share, and our AFFO guidance range of $1.18 - $1.24 per diluted share. Please see our 2014 guidance detail on page 22. |
NOTE: Please see the page titled "Definitions" at the end of this Earnings Package for certain definitions.
|
| | |
| Douglas Emmett, Inc. | | TABLE OF CONTENTS |
| |
|
| |
| | PAGE |
| COMPANY OVERVIEW |
| |
| |
| |
| | |
| CONSOLIDATED FINANCIAL RESULTS |
| |
| |
| |
| |
| |
| |
| |
| | |
| PORTFOLIO DATA |
| |
| |
| |
| |
| |
| |
| |
| |
| |
| |
| | |
| |
___________________________________________________
Forward Looking Statements
This Fourth Quarter 2013 Earnings Results and Operating Information supplements the information provided in our reports filed with the Securities and Exchange Commission. It contains forward-looking statements within the meaning of Section 27A of the Securities Act of 1933, as amended, and Section 21E of the Securities Exchange Act of 1934, as amended, and we claim the protection of the safe harbor contained in the Private Securities Litigation Reform Act of 1995. Forward-looking statements presented in this Earnings Package, and those that we may make orally or in writing from time to time, are based on our beliefs and assumptions. Actual results will be affected by known and unknown risks, trends, uncertainties and factors, some of which are beyond our control or ability to predict, including, but not limited to: adverse economic and real estate developments in Southern California and Honolulu; a general downturn in the economy, such as the global financial crisis that started in approximately 2008; decreased rental rates or increased tenant incentives and vacancy rates; defaults on, early terminations of, or non-renewal of leases by tenants; increased interest rates and operating costs; failure to generate sufficient cash flows to service our outstanding indebtedness; difficulties in identifying properties to acquire and completing acquisitions; failure to successfully operate acquired properties and operations; failure to maintain our status as a REIT; possible adverse changes in rent control laws and regulations; environmental uncertainties; risks related to natural disasters; lack or insufficient amount of insurance; inability to successfully expand into new markets or submarkets; risks associated with property development; conflicts of interest with our officers; changes in real estate and zoning laws and increases in real property tax rates; the consequences of any possible future terrorist attacks; and other risks and uncertainties detailed in our Annual Report on Form 10-K and other documents filed with the Securities and Exchange Commission. Although we believe that our assumptions are reasonable, they are not guarantees of future performance and some will inevitably prove to be incorrect. As a result, our actual future results can be expected to differ from our expectations, and those differences may be material. Accordingly, investors should use caution in relying on previously reported forward-looking statements, which were based on results and trends at the time they were made, to anticipate future results or trends. This Earnings Package and all subsequent written and oral forward-looking statements attributable to us or any person acting on our behalf are expressly qualified in their entirety by the cautionary statements contained or referred to in this section. We do not undertake any obligation to release publicly any revisions to our forward-looking statements to reflect events or circumstances after the date of this Earnings Package.
|
| | |
| Douglas Emmett, Inc. | CORPORATE DATA |
| | as of December 31, 2013 |
|
| | | | | | | |
| | Office Portfolio | Consolidated | | Total Portfolio | |
| | Number of office properties | 52 |
| | 60 |
| |
| | Square feet (in thousands) | 13,271 |
| | 15,094 |
| |
| | Leased rate, including properties acquired during the year(1) | 92.2 | % | | 92.2 | % | |
| | Occupied rate, including properties acquired during the year(1) | 90.6 | % | | 90.4 | % | |
| | | | | | |
| | | | | | |
| | Multifamily Portfolio | | | | |
| | Number of multifamily properties | | | 9 |
| |
| | Number of multifamily units | | | 2,868 |
| |
| | Multifamily leased rate | | | 99.5 | % | |
| | | | | | |
|
| | | | | | |
| | Market Capitalization (in thousands, except price per share) | |
| | Closing price per share of common stock (NYSE:DEI) | | $ | 23.29 |
| |
| | Shares of common stock outstanding | | 142,605 |
| |
| | Fully diluted shares outstanding | | 174,957 |
| |
| | Equity capitalization(2) | | $ | 4,074,751 |
| |
| | Net debt(3) | | $ | 3,196,934 |
| |
| | Total enterprise value | | $ | 7,271,686 |
| |
| | Net debt/total enterprise value | | 44 | % | |
| | | | | |
__________________________________________
| |
| (1) | These statistics include the impact of property acquisitions during 2013, and so may not be directly comparable to statistics from prior quarters. We often seek to use our operating platform to create value by acquiring buildings with greater vacancy than our portfolio. Excluding the impact of acquisitions during 2013, the leased rate for our total office portfolio was 92.3% and the occupied rate was 90.6%. |
(2) Common equity capitalization represents our fully diluted shares multiplied by the closing price of our stock on December 31, 2013.
| |
| (3) | Net debt represents our consolidated debt, net of our cash and cash equivalents. It excludes the debt of our unconsolidated real estate funds. |
NOTE: Please see the page titled "Definitions" at the end of this Earnings Package for certain definitions.
|
| | |
| Douglas Emmett, Inc. | | PROPERTY MAP |
| | as of December 31, 2013 |
|
| | |
| Douglas Emmett, Inc. | BOARD OF DIRECTORS AND EXECUTIVE OFFICERS |
| | as of December 31, 2013 |
CORPORATE OFFICES
808 Wilshire Boulevard, Suite 200, Santa Monica, California 90401
Phone: (310) 255-7700
OUR BOARD OF DIRECTORS
______________________________________________________________________________________________________
|
| | |
| Dan A. Emmett | | Chairman of the Board – Douglas Emmett, Inc. |
| Jordan L. Kaplan | | Chief Executive Officer and President – Douglas Emmett, Inc. |
| Kenneth M. Panzer | | Chief Operating Officer – Douglas Emmett, Inc. |
| Christopher Anderson | | Retired Real Estate Executive and Investor |
| Leslie E. Bider | | Chief Executive Officer – PinnacleCare |
| Dr. David T. Feinberg | | Chief Executive Officer – University of California, Los Angeles (UCLA) Hospital System, Associate Vice Chancellor – UCLA Health Sciences |
| Thomas E. O’Hern | | Senior Executive Vice President, Chief Financial Officer & Treasurer – Macerich Company |
| William E. Simon, Jr. | | Co-chairman, William E. Simon & Sons, LLC |
OUR EXECUTIVE OFFICERS
______________________________________________________________________________________________________
|
| | |
| Dan A. Emmett | | Chairman of the Board |
| Jordan L. Kaplan | | Chief Executive Officer and President |
| Kenneth M. Panzer | | Chief Operating Officer |
| Theodore E. Guth | | Chief Financial Officer |
For more information, please visit our website at www.douglasemmett.com or contact:
Stuart McElhinney, Vice President, Investor Relations
(310) 255-7751
smcelhinney@douglasemmett.com
|
| | |
| Douglas Emmett, Inc. | | BALANCE SHEETS |
| | (unaudited and in thousands) |
|
| | | | | | | |
| | December 31, 2013 | | December 31, 2012 |
| | | | |
|
| Assets | |
| | |
|
| Investment in real estate: | |
| | |
|
| Land | $ | 867,284 |
| | $ | 851,679 |
|
| Buildings and improvements | 5,386,446 |
| | 5,244,738 |
|
| Tenant improvements and lease intangibles | 759,003 |
| | 690,120 |
|
| Investment in real estate, gross | 7,012,733 |
| | 6,786,537 |
|
| Less: accumulated depreciation | (1,495,819 | ) | | (1,304,468 | ) |
| Investment in real estate, net | 5,516,914 |
| | 5,482,069 |
|
| | | | |
| Cash and cash equivalents | 44,206 |
| | 373,203 |
|
| Tenant receivables, net | 1,760 |
| | 1,331 |
|
| Deferred rent receivables, net | 69,662 |
| | 63,192 |
|
| Acquired lease intangible assets, net | 3,744 |
| | 4,707 |
|
| Investment in unconsolidated real estate funds | 182,896 |
| | 149,478 |
|
| Other assets | 28,607 |
| | 29,827 |
|
| Total assets | $ | 5,847,789 |
| | $ | 6,103,807 |
|
| | | | |
| Liabilities | | | |
|
| Secured notes payable | $ | 3,241,140 |
| | $ | 3,441,140 |
|
| Interest payable, accounts payable and deferred revenue | 52,763 |
| | 45,171 |
|
| Security deposits | 35,470 |
| | 34,284 |
|
| Acquired lease intangible liabilities, net | 59,543 |
| | 67,035 |
|
| Interest rate contracts | 63,144 |
| | 100,294 |
|
| Dividends payable | 28,521 |
| | 25,424 |
|
| Total liabilities | 3,480,581 |
| | 3,713,348 |
|
| | | | |
| Equity | | | |
|
| Douglas Emmett, Inc. stockholders' equity: | | | |
|
| Common stock | 1,426 |
| | 1,412 |
|
| Additional paid-in capital | 2,653,905 |
| | 2,635,408 |
|
| Accumulated other comprehensive income (loss) | (50,554 | ) | | (82,991 | ) |
| Accumulated deficit | (634,380 | ) | | (574,173 | ) |
| Total Douglas Emmett, Inc. stockholders' equity | 1,970,397 |
| | 1,979,656 |
|
| Noncontrolling interests | 396,811 |
| | 410,803 |
|
| Total equity | 2,367,208 |
| | 2,390,459 |
|
| Total liabilities and equity | $ | 5,847,789 |
| | $ | 6,103,807 |
|
NOTE: Please see the page titled "Definitions" at the end of this Earnings Package for certain definitions.
|
| | |
| Douglas Emmett, Inc. | OPERATING RESULTS |
| (unaudited and in thousands, except per share data) |
|
| | | | | | | | | | | | | | | |
| | Three Months Ended December 31, | | Twelve Months Ended December 31, |
| | 2013 | | 2012 | | 2013 | | 2012 |
| | | | | | | | |
| Revenues: | |
| | |
| | |
| | |
|
| Office rental: | |
| | |
| | |
| | |
|
| Rental revenues | $ | 98,464 |
| | $ | 96,085 |
| | $ | 394,739 |
| | $ | 391,447 |
|
| Tenant recoveries | 10,974 |
| | 10,994 |
| | 45,144 |
| | 44,093 |
|
| Parking and other income | 18,738 |
| | 17,309 |
| | 74,717 |
| | 69,736 |
|
| Total office revenues | 128,176 |
| | 124,388 |
| | 514,600 |
| | 505,276 |
|
| | | | | | | | |
| Multifamily rental: | | | | | | | |
| Rental revenues | 18,063 |
| | 17,397 |
| | 71,209 |
| | 68,262 |
|
| Parking and other income | 1,437 |
| | 1,365 |
| | 5,727 |
| | 5,461 |
|
| Total multifamily revenues | 19,500 |
| | 18,762 |
| | 76,936 |
| | 73,723 |
|
| | | | | | | | |
| Total revenues | 147,676 |
| | 143,150 |
| | 591,536 |
| | 578,999 |
|
| | | | | | | | |
| Operating Expenses: | | | | | | | |
| Office expenses | 44,427 |
| | 43,041 |
| | 174,952 |
| | 170,725 |
|
| Multifamily expenses | 4,820 |
| | 4,812 |
| | 19,928 |
| | 19,672 |
|
| General and administrative | 5,890 |
| | 7,892 |
| | 26,614 |
| | 27,943 |
|
| Depreciation and amortization | 49,823 |
| | 45,778 |
| | 191,351 |
| | 184,849 |
|
| Total operating expenses | 104,960 |
| | 101,523 |
| | 412,845 |
| | 403,189 |
|
| | | | | | | | |
| Operating income | 42,716 |
| | 41,627 |
| | 178,691 |
| | 175,810 |
|
| | | | | | | | |
| Other income | 2,237 |
| | 794 |
| | 6,402 |
| | 2,821 |
|
| Other expenses | (1,422 | ) | | (438 | ) | | (4,199 | ) | | (1,883 | ) |
| Income (loss), including depreciation, from unconsolidated real estate funds | (237 | ) | | 1,054 |
| | 3,098 |
| | (1,710 | ) |
| Interest expense | (32,716 | ) | | (35,697 | ) | | (130,548 | ) | | (146,693 | ) |
| Acquisition-related expenses | (74 | ) | | — |
| | (607 | ) | | — |
|
| Net income | 10,504 |
| | 7,340 |
| | 52,837 |
| | 28,345 |
|
| Less: Net income attributable to noncontrolling interests | (1,661 | ) | | (1,366 | ) | | (7,526 | ) | | (5,403 | ) |
| Net income attributable to common stockholders | $ | 8,843 |
| | $ | 5,974 |
| | $ | 45,311 |
| | $ | 22,942 |
|
| | | | | | | | |
| Net income per common share – basic | $ | 0.06 |
| | $ | 0.04 |
| | $ | 0.32 |
| | $ | 0.16 |
|
| Net income per common share – diluted | $ | 0.06 |
| | $ | 0.04 |
| | $ | 0.31 |
| | $ | 0.16 |
|
| | | | | | | | |
| Weighted average shares of common stock outstanding - basic | 142,603 |
| | 140,795 |
| | 142,556 |
| | 139,791 |
|
| Weighted average shares of common stock outstanding - diluted | 174,600 |
| | 173,660 |
| | 174,802 |
| | 173,120 |
|
NOTE: Please see the page titled "Definitions" at the end of this Earnings Package for certain definitions.
|
| | |
| Douglas Emmett, Inc. | FUNDS FROM OPERATIONS AND |
| ADJUSTED FUNDS FROM OPERATIONS |
| | (unaudited and in thousands, except per share data) |
|
| | | | | | | | | | | | | | | |
| | Three Months Ended December 31, | | Twelve Months Ended December 31, |
| | 2013 | | 2012 | | 2013 | | 2012 |
| Funds From Operations (FFO) | | | | | | | |
| Net income attributable to common stockholders | $ | 8,843 |
| | $ | 5,974 |
| | $ | 45,311 |
| | $ | 22,942 |
|
| Depreciation and amortization of real estate assets | 49,823 |
| | 45,778 |
| | 191,351 |
| | 184,849 |
|
| Net income attributable to noncontrolling interests | 1,661 |
| | 1,366 |
| | 7,526 |
| | 5,403 |
|
| Adjustments attributable to consolidated joint venture and investment in unconsolidated real estate funds | 3,873 |
| | 3,401 |
| | 15,894 |
| | 13,311 |
|
| FFO (before adjustments for terminated swaps) | 64,200 |
| | 56,519 |
| | 260,082 |
| | 226,505 |
|
Amortization of accumulated other comprehensive income as a result of terminated swaps (1) | — |
| | — |
| | — |
| | 8,855 |
|
| FFO (after adjustments for terminated swaps) | $ | 64,200 |
| | $ | 56,519 |
| | $ | 260,082 |
| | $ | 235,360 |
|
| | | | | | | | |
| Adjusted Funds From Operations (AFFO) | | | | | | | |
| FFO (after adjustments for terminated swaps) | $ | 64,200 |
| | $ | 56,519 |
| | $ | 260,082 |
| | $ | 235,360 |
|
| Straight-line rent | (1,753 | ) | | (227 | ) | | (6,470 | ) | | (4,511 | ) |
| Amortization of acquired above and below market leases | (3,723 | ) | | (4,132 | ) | | (15,693 | ) | | (18,094 | ) |
| Amortization of loan premium | — |
| | — |
| | — |
| | (996 | ) |
| Amortization of interest rate contracts and deferred loan costs | 1,263 |
| | 948 |
| | 4,302 |
| | 4,248 |
|
| Recurring capital expenditures, tenant improvements and leasing commissions | (10,693 | ) | | (11,541 | ) | | (43,862 | ) | | (43,503 | ) |
| Non-cash compensation expense | 2,509 |
| | 3,788 |
| | 10,005 |
| | 10,583 |
|
| Adjustments attributable to consolidated joint venture and investment in unconsolidated real estate funds | (293 | ) | | (299 | ) | | (2,218 | ) | | (1,281 | ) |
| AFFO | $ | 51,510 |
| | $ | 45,056 |
| | $ | 206,146 |
| | $ | 181,806 |
|
| | | | | | | | |
| Weighted average share equivalents outstanding - diluted | 174,600 |
| | 173,660 |
| | 174,802 |
| | 173,120 |
|
| FFO per share- diluted | $0.37 | | $0.33 | | $1.49 | | $1.36 |
| AFFO per share- diluted | $0.30 | | $0.26 | | $1.18 | | $1.05 |
| AFFO payout ratio | 60.03 | % | | 56.97 | % | | 60.00 | % | | 54.06 | % |
| Dividends per share declared | $0.20 | | $0.18 | | $0.74 | | $0.63 |
__________________________________________________
| |
| (1) | In calculating FFO, we treated certain interest rate swaps as terminated for all purposes in 2011 when they were in fact terminated in connection with refinancing the underlying loans. In contrast, under GAAP, terminated swaps continue to impact net income over their original lives as if they were still outstanding. We had no swap terminations in 2012 or 2013, so this policy did not affect FFO in the last quarter of 2012 or in any quarter of 2013. |
NOTE: Please see the page titled "Definitions" at the end of this Earnings Package for certain definitions.
|
| | |
| Douglas Emmett, Inc. | SAME PROPERTY STATISTICAL AND FINANCIAL DATA |
| (unaudited and in thousands, except statistics) |
|
| | | | | | | |
| | | | | | |
| | | As of December 31, | |
| | | 2013 | | 2012 | |
| | Same Property Office Statistics(1) | | | | |
| | Number of properties | 49 |
| | 49 |
| |
| | Rentable square feet (in thousands) | 12,775 |
| | 12,774 |
| |
| | Ending % leased | 92.3 | % | | 91.4 | % | |
| | Ending % occupied | 90.7 | % | | 89.8 | % | |
| | Quarterly average % occupied | 90.5 | % | | 89.4 | % | |
| | | | | | |
| | Same Property Multifamily Statistics | | | | |
| | Number of properties | 9 |
| | 9 |
| |
| | Number of units | 2,868 |
| | 2,868 |
| |
| | Ending % leased | 99.5 | % | | 99.7 | % | |
| | | | | | |
|
| | | | | | | | | | | | |
| | | | | | | | |
| | | Three Months Ended December 31, | | % Favorable | |
| | | 2013 | | 2012 | | (Unfavorable) | |
| | Same Property Net Operating Income - GAAP Basis (1) | |
| | |
| | |
| |
| | Total office revenues | $ | 124,263 |
| | $ | 123,634 |
| | 0.5 | % | |
| | Total office expenses | (42,550 | ) | | (42,633 | ) | | 0.2 | % | |
| | Office NOI | 81,713 |
| | 81,001 |
| | 0.9 | % | |
| | | | | | | | |
| | Total multifamily revenues | 19,500 |
| | 18,762 |
| | 3.9 | % | |
| | Total multifamily expenses | (4,820 | ) | | (4,812 | ) | | (0.2 | )% | |
| | Multifamily NOI | 14,680 |
| | 13,950 |
| | 5.2 | % | |
| | | | | | | | |
| | Same Property NOI - GAAP basis | $ | 96,393 |
| | $ | 94,951 |
| | 1.5 | % | |
| | | | | | | | |
| | Same Property Net Operating Income - Cash Basis (1) | | | | | | |
| | Total office revenues | $ | 120,293 |
| | $ | 120,178 |
| | 0.1 | % | |
| | Total office expenses | (42,596 | ) | | (42,679 | ) | | 0.2 | % | |
| | Office NOI | 77,697 |
| | 77,499 |
| | 0.3 | % | |
| | | | | | | | |
| | Total multifamily revenues | 18,660 |
| | 17,920 |
| | 4.1 | % | |
| | Total multifamily expenses | (4,820 | ) | | (4,812 | ) | | (0.2 | )% | |
| | Multifamily NOI | 13,840 |
| | 13,108 |
| | 5.6 | % | |
| | | | | | | | |
| | Same Property NOI - cash basis | $ | 91,537 |
| | $ | 90,607 |
| | 1.0 | % | |
| | | | | | | | |
____________________________________________________
| |
| (1) | Our same property statistics and NOI exclude a 225 thousand square foot office property in Beverly Hills that we acquired in May 2013, a 191 thousand square foot office property in Encino that we acquired in August 2013, a 79 thousand square foot office property in Honolulu (in which we own a two thirds interest) which is currently undergoing a repositioning, and our unconsolidated real estate funds. |
NOTE: Please see the page titled "Definitions" at the end of this Earnings Package for certain definitions.
|
| | |
| Douglas Emmett, Inc. | RECONCILIATION OF SAME PROPERTY NOI |
| TO GAAP NET INCOME |
| | (unaudited and in thousands) |
|
| | | | | | | |
| | Three Months Ended December 31, |
| | 2013 | | 2012 |
| Same property office revenues - cash basis | $ | 120,293 |
| | $ | 120,178 |
|
| GAAP adjustments per definition of NOI - cash basis | 3,970 |
| | 3,456 |
|
| Same property office revenues - GAAP basis | 124,263 |
| | 123,634 |
|
| | | | |
| Same property office expenses - cash basis | (42,596 | ) | | (42,679 | ) |
| GAAP adjustments per definition of NOI - cash basis | 46 |
| | 46 |
|
| Same property office expenses - GAAP basis | (42,550 | ) | | (42,633 | ) |
| | | | |
| Office NOI - GAAP basis | 81,713 |
| | 81,001 |
|
| | | | |
| Same property multifamily revenues - cash basis | 18,660 |
| | 17,920 |
|
| GAAP adjustments per definition of NOI - cash basis | 840 |
| | 842 |
|
| Same property multifamily revenues - GAAP basis | 19,500 |
| | 18,762 |
|
| | | | |
| Same property multifamily expenses - cash basis | (4,820 | ) | | (4,812 | ) |
| GAAP adjustments per definition of NOI - cash basis | — |
| | — |
|
| Same property multifamily expenses - GAAP basis | (4,820 | ) | | (4,812 | ) |
| | | | |
| Multifamily NOI - GAAP basis | 14,680 |
| | 13,950 |
|
| |
|
| |
|
|
| Total same property Net Operating Income (NOI) - GAAP basis | 96,393 |
| | 94,951 |
|
| Non-comparable office revenues | 3,913 |
| | 754 |
|
| Non-comparable office expenses | (1,877 | ) | | (408 | ) |
| Total property NOI - GAAP basis | 98,429 |
| | 95,297 |
|
| General and administrative expenses | (5,890 | ) | | (7,892 | ) |
| Depreciation and amortization | (49,823 | ) | | (45,778 | ) |
| Operating income | 42,716 |
| | 41,627 |
|
| Other income | 2,237 |
| | 794 |
|
| Other expense | (1,422 | ) | | (438 | ) |
| (Loss) income, including depreciation, from unconsolidated real estate funds | (237 | ) | | 1,054 |
|
| Interest expense | (32,716 | ) | | (35,697 | ) |
| Acquisition-related expenses | (74 | ) | | — |
|
| Net income | 10,504 |
| | 7,340 |
|
| Less: Net income attributable to noncontrolling interests | (1,661 | ) | | (1,366 | ) |
| Net income attributable to common stockholders | $ | 8,843 |
| | $ | 5,974 |
|
NOTE: Please see the page titled "Definitions" at the end of this Earnings Package for certain definitions.
|
| | |
| Douglas Emmett, Inc. | | OPERATING RESULTS OF |
| | UNCONSOLIDATED REAL ESTATE FUNDS(1) |
| | | (unaudited and in thousands) |
|
| | | | | | | | | | | | | | | | |
| | | Three Months Ended December 31, | | Twelve Months Ended December 31, |
Summary Income Statement of Unconsolidated Real Estate Funds(2) | | 2013 | | 2012 | | 2013 | | 2012 |
| Office revenues | | $ | 16,349 |
| | $ | 15,547 |
| | $ | 63,976 |
| | $ | 61,475 |
|
| Office expenses | | (8,282 | ) | | (6,218 | ) | | (27,321 | ) | | (24,460 | ) |
| NOI | | 8,067 |
| | 9,329 |
| | 36,655 |
| | 37,015 |
|
| General and administrative | | (107 | ) | | (102 | ) | | (331 | ) | | (280 | ) |
| Depreciation and amortization | | (6,606 | ) | | (6,457 | ) | | (26,173 | ) | | (26,178 | ) |
| Operating income | | 1,354 |
| | 2,770 |
| | 10,151 |
| | 10,557 |
|
| Other income (expense) | | 28 |
| | (39 | ) | | 28 |
| | (37 | ) |
| Interest expense | | (2,931 | ) | | (2,575 | ) | | (10,980 | ) | | (19,412 | ) |
| Net income (loss) | | $ | (1,549 | ) | | $ | 156 |
| | $ | (801 | ) | | $ | (8,892 | ) |
| | | | | | | | | |
FFO of Unconsolidated Real Estate Funds (2) | | | | | | | | |
| Net income (loss) | | $ | (1,549 | ) | | $ | 156 |
| | $ | (801 | ) | | $ | (8,892 | ) |
| Add back: depreciation and amortization | | 6,606 |
| | 6,457 |
| | 26,173 |
| | 26,178 |
|
| FFO | | $ | 5,057 |
| | $ | 6,613 |
| | $ | 25,372 |
| | $ | 17,286 |
|
| | | | | | | | | |
| Douglas Emmett's Share of the Unconsolidated Real Estate Funds FFO | | | | | | | | |
| Our share of the unconsolidated real estate funds' net income (loss) | | $ | (982 | ) | | $ | 283 |
| | $ | (19 | ) | | $ | (4,892 | ) |
| Add back: our share of the funds' depreciation and amortization | | 3,856 |
| | 3,583 |
| | 15,189 |
| | 14,021 |
|
| Equity allocation and basis difference | | 745 |
| | 771 |
| | 3,117 |
| | 3,182 |
|
| Our share of the unconsolidated real estate funds' FFO | | $ | 3,619 |
| | $ | 4,637 |
| | $ | 18,287 |
| | $ | 12,311 |
|
__________________________________________________
| |
| (1) | We manage and own significant equity interests in two unconsolidated institutional real estate Funds which own eight Class A office properties, totaling 1.8 million square feet, in our submarkets. Our ownership interest entitles us to a pro rata share of any distributions based on our ownership (a weighted average of approximately 60% at December 31, 2013 based on square footage), additional distributions based on the total invested capital, and a carried interest if the investors’ distributions exceed a hurdle rate. We also receive fees and reimbursement of expenses for managing our unconsolidated Funds’ properties. |
| |
| (2) | These amounts represent 100% (not our pro-rata share) of amounts related to the Funds. |
NOTE: Please see the page titled "Definitions" at the end of this Earnings Package for certain definitions.
|
| | |
| Douglas Emmett, Inc. | | DEBT BALANCES |
| | (unaudited and in thousands) |
Consolidated Debt
|
| | | | | | | | |
| Maturity Date | | at December 31, 2013 (1) |
| | Principal Balance | Effective Annual Rate (2) | |
| 3/3/2014 | | $ | 16,140 |
| (3) | LIBOR + 1.85% | | |
| 2/1/2015 | | 111,920 |
| | DMBS + 0.707% | (4) | (Fannie Mae) |
| 3/1/2016 | | 82,000 |
| | LIBOR + 0.62% | | (Fannie Mae) |
| 6/1/2017 | | 18,000 |
| | LIBOR + 0.62% | | (Fannie Mae) |
| 10/2/2017 | | 400,000 |
| | 4.45% | (5) | |
| 4/2/2018 | | 510,000 |
| | 4.12% | (5) | |
| 8/1/2018 | | 530,000 |
| | 3.74% | (5) | |
| 8/5/2018 | | 355,000 |
| (6) | 4.14% | | |
| 2/1/2019 | | 155,000 |
| (7) | 4.00% | | |
| 6/5/2019 | | 285,000 |
| (8) | 3.85% | | |
| 3/1/2020 | (9) | 350,000 |
| (10) | 4.46% | | |
| 11/2/2020 | | 388,080 |
| | 3.65% | (5) | |
| Total Term Debt | | $ | 3,201,140 |
| | | | |
| 12/11/2017 | | 40,000 |
| | LIBOR + 1.40% | (11) | (Revolving credit facility) |
| | | $ | 3,241,140 |
| | | | |
____________________________________________________
| |
| (1) | As of December 31, 2013, (i) the weighted average remaining life of our outstanding debt was 4.8 years; (ii) of the $2.97 billion of debt on which the interest rate was fixed under the terms of the loan or a swap, the weighted average remaining life was 5.0 years, the weighted average remaining period during which interest was fixed was 3.4 years and the weighted average annual interest rate was 4.05%; and (iii) including the non-cash amortization of interest rate contracts and prepaid financing, the effective weighted average interest rate was 4.18%. Except as otherwise noted, each loan is secured by a separate collateral pool consisting of one or more properties, requiring monthly payments of interest only with outstanding principal due upon maturity. |
| |
| (2) | Includes the effect of interest rate contracts and excludes amortization of prepaid financing, all shown on an actual/360-day basis. |
| |
| (3) | The borrower is a consolidated entity in which our Operating Partnership owns a two-thirds interest. |
| |
| (4) | The loan has a $75.0 million tranche bearing interest at DMBS + 0.76% and a $36.9 million tranche bearing interest at DMBS + 0.60%. |
| |
| (5) | Interest rates effectively fixed through interest rate swaps until the following dates: $400.0 million loan, July 2015; $510.0 million loan, April 2016; $530.0 million loan, August 2016; and $388.1 million loan, November 2017. |
| |
| (6) | Interest-only until February 2016, with principal amortization thereafter based upon a 30-year amortization table. |
| |
| (7) | Interest-only until February 2015, with principal amortization thereafter based upon a 30-year amortization table. |
| |
| (8) | Interest only until February 2017, with principal amortization thereafter based upon a 30-year amortization table. |
| |
| (9) | We have 2 one-year extension options, which would extend the maturity to March 1, 2020 from March 1, 2018, subject to meeting certain conditions. |
| |
| (10) | Interest-only until March 2014, with principal amortization thereafter based upon a 30-year amortization table. |
| |
| (11) | Secured revolving credit facility under which we can borrow up to $300.0 million. |
Unconsolidated Debt
|
| | | | | | | | | | |
| | | at December 31, 2013 |
| Maturity Date | | Outstanding Principal | | Our Share of Principal | | Effective Annual Rate |
| 4/1/2016 | | $ | 53,180 |
| | $ | 12,898 |
| (1) | 5.67% |
| 5/1/2018 | | 325,000 |
| | 222,980 |
| (2) | 2.35% |
| | | $ | 378,180 |
| | $ | 235,878 |
| | |
______________________________________________________
| |
| (1) | Loan to one of our unconsolidated Funds secured by one property. Requires monthly payments of principal and interest. |
| |
| (2) | Loan to one of our unconsolidated Funds secured by six properties. Requires monthly payments of interest only, with outstanding principal due upon maturity. The swap fixing the rate on this loan expires on May 1, 2017. |
NOTE: Please see the page titled "Definitions" at the end of this Earnings Package for certain definitions.
|
| | |
| Douglas Emmett, Inc. | OFFICE PORTFOLIO SUMMARY |
| as of December 31, 2013 |
|
| | | | | | | | | | | | | | | | |
| | | | | | | | | | | | | |
| | Submarket | | Number of Properties | | Rentable Square Feet | | Percent of Square Feet of Our Total Portfolio | | Submarket Rentable Square Feet | | Our Market Share in Submarket | |
| | Beverly Hills | | 8 |
| | 1,643,911 |
| | 10.9 | % | | 7,741,422 | | 21.2 | % | |
| | Brentwood | | 14 |
| | 1,700,889 |
| | 11.3 |
| | 3,356,126 | | 50.7 |
| |
| | Burbank | | 1 |
| | 420,949 |
| | 2.8 |
| | 6,733,458 | | 6.3 |
| |
| | Century City | | 3 |
| | 916,060 |
| | 6.1 |
| | 10,064,599 | | 9.1 |
| |
| | Honolulu | | 4 |
| | 1,716,708 |
| | 11.4 |
| | 5,088,599 | | 33.7 |
| |
| | Olympic Corridor | | 5 |
| | 1,098,073 |
| | 7.3 |
| | 3,022,969 | | 36.3 |
| |
| | Santa Monica | | 8 |
| | 972,795 |
| | 6.4 |
| | 8,700,348 | | 11.2 |
| |
| | Sherman Oaks/Encino | | 12 |
| | 3,372,129 |
| | 22.3 |
| | 6,171,530 | | 54.6 |
| |
| | Warner Center/Woodland Hills | | 3 |
| | 2,855,911 |
| | 18.9 |
| | 7,203,647 | | 39.6 |
| |
| | Westwood | | 2 |
| | 396,808 |
| | 2.6 |
| | 4,443,398 | | 8.9 |
| |
| | Total | | 60 |
| | 15,094,233 |
| | 100.0 | % | | 62,526,096 | | 24.1 |
| |
| | | | | | | | | | | | | |
NOTE: Please see the page titled "Definitions" at the end of this Earnings Package for certain definitions.
|
| | |
| Douglas Emmett, Inc. | OFFICE PORTFOLIO PERCENT LEASED AND IN-PLACE RENTS |
| | as of December 31, 2013 |
|
| | | | | | | | | | | | | | | | | |
| | | | | | | | | | | |
| | Submarket | | Percent Leased(1) | | Annualized Rent | | Annualized Rent Per Leased Square Foot(2) | | Monthly Rent Per Leased Square Foot | |
| | Beverly Hills | | 95.7 | % | | $ | 62,970,420 |
| | $ | 41.88 |
| | $ | 3.49 |
| |
| | Brentwood | | 92.0 |
| | 54,913,679 |
| | 36.65 |
| | 3.05 |
| |
| | Burbank | | 100.0 |
| | 15,145,670 |
| | 35.98 |
| | 3.00 |
| |
| | Century City | | 98.9 |
| | 33,553,933 |
| | 37.61 |
| | 3.13 |
| |
| | Honolulu(3) | | 88.9 |
| | 46,125,696 |
| | 31.75 |
| | 2.65 |
| |
| | Olympic Corridor | | 92.8 |
| | 30,813,205 |
| | 30.79 |
| | 2.57 |
| |
| | Santa Monica(4) | | 97.2 |
| | 50,571,389 |
| | 54.01 |
| | 4.50 |
| |
| | Sherman Oaks/Encino | | 94.0 |
| | 98,238,825 |
| | 31.64 |
| | 2.64 |
| |
| | Warner Center/Woodland Hills | | 85.1 |
| | 65,198,413 |
| | 28.26 |
| | 2.35 |
| |
| | Westwood | | 92.6 |
| | 12,689,173 |
| | 35.19 |
| | 2.93 |
| |
| | Total / Weighted Average | | 92.2 |
| | $ | 470,220,403 |
| | 34.89 |
| | 2.91 |
| |
| | | | | | | | | | | |
| | Recurring Office Capital Expenditures per Rentable Square Foot | | | | | |
| | For the three months ended December 31, 2013 | | | | | | $ | 0.08 |
| |
| | For the twelve months ended December 31, 2013 | | | | | | $ | 0.24 |
| |
| | | | | | | | | | | |
_______________________________________________________________
| |
| (1) | Includes 267,944 square feet with respect to signed leases not yet commenced. |
| |
| (2) | Represents annualized rent divided by leased square feet (excluding signed leases not commenced). |
| |
| (3) | Includes $3,003,143 of annualized rent attributable to a health club that we operate. |
| |
| (4) | Includes $1,332,386 of annualized rent attributable to our corporate headquarters. |
NOTE: Please see the page titled "Definitions" at the end of this Earnings Package for certain definitions.
|
| | |
| Douglas Emmett, Inc. | MULTIFAMILY PORTFOLIO SUMMARY |
| as of December 31, 2013 |
|
| | | | | | | | | | | | | |
| | | | | | | | | |
| | Submarket | | Number of Properties | | Number of Units | | Units as a Percent of Total | |
| | Brentwood | | 5 | | 950 |
| | 33 | % | |
| | Honolulu | | 2 | | 1,098 |
| | 38 |
| |
| | Santa Monica | | 2 | | 820 |
| | 29 |
| |
| | Total | | 9 | | 2,868 |
| | 100 | % | |
| | | | | | | | | |
| | Submarket | | Percent Leased | | Annualized Rent | | Monthly Rent Per Leased Unit | |
| | Brentwood(1) | | 99.4 | % | | $ | 24,753,032 |
| | $ | 2,235 |
| |
| | Honolulu | | 99.5 |
| | 20,437,104 |
| | 1,560 |
| |
| | Santa Monica(2) | | 99.9 |
| | 24,334,284 |
| | 2,476 |
| |
| | Total / Weighted Average | | 99.5 | % | | $ | 69,524,420 |
| | 2,044 |
| |
| | | | | | | | | |
|
| | | | | |
| | | | |
| | Recurring Multifamily Capital Expenditures per Unit | | |
| | For the three months ended December 31, 2013 | $ | 133 |
| |
| | For the twelve months ended December 31, 2013 | $ | 354 |
| |
| | | | |
________________________________________________________________
| |
| (1) | In calculating the percentage of units leased, we removed from the numerator and denominator 21 units at one property which are temporarily unoccupied as a result of damage related to a fire, even though the lost rent from those units is being covered by insurance. |
| |
| (2) | Excludes 8,013 square feet of ancillary retail space generating annualized rent of $176,532. |
NOTE: Please see the page titled "Definitions" at the end of this Earnings Package for certain definitions.
|
| | |
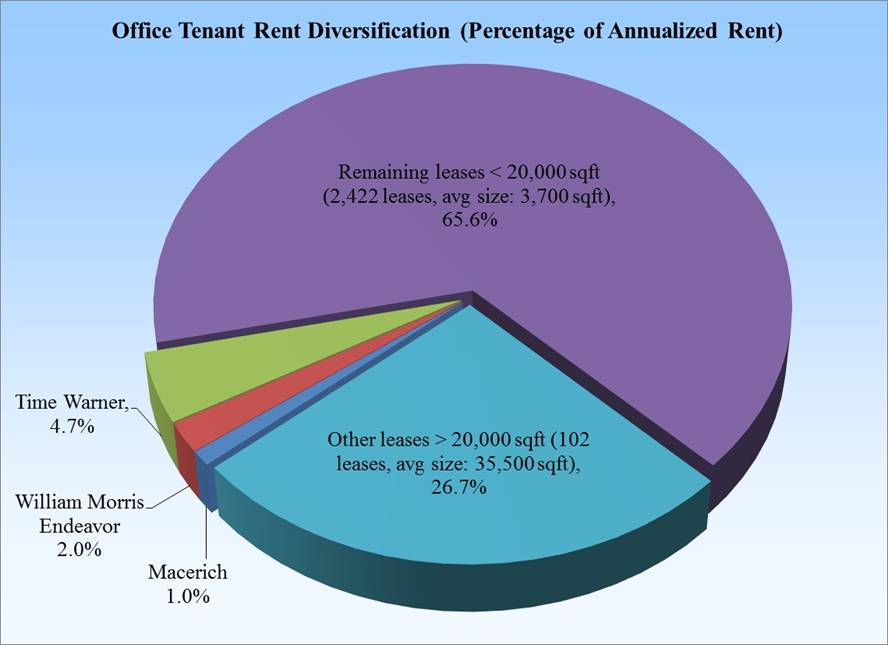
| Douglas Emmett, Inc. | OFFICE TENANT DIVERSIFICATION |
| as of December 31, 2013 |
|
| | | | | | | | | | | | | | | | | | | | | | | |
| | Individual tenants paying more than 1% of aggregate Annualized Rent(1): | |
| | | |
| | Tenant | | Number of Leases | | Number of Properties | | Lease Expiration(2) | | Total Leased Square Feet | | Percent of Rentable Square Feet | | Annualized Rent | | Percent of Annualized Rent | |
| | Time Warner(3) | | 4 |
| | 4 |
| | 2015-2023 | | 625,750 |
| | 4.1 | % | | $ | 22,316,440 |
| | 4.7 | % | |
| | William Morris Endeavor | | 1 |
| | 1 |
| | 2027 | | 180,967 |
| | 1.2 |
| | 9,308,348 |
| | 2.0 |
| |
| | The Macerich Partnership, L.P. | | 1 |
| | 1 |
| | 2018 | | 90,832 |
| | 0.6 |
| | 4,803,882 |
| | 1.0 |
| |
| | Total | | 6 |
| | 6 |
| | | | 897,549 |
| | 5.9 | % | | $ | 36,428,670 |
| | 7.7 | % | |
| | | | | | | | | | | | | | | | | |
| | | |
| | (1) Based on minimum base rent in leases expiring after December 31, 2013. | |
| | (2) Expiration dates are per leases and do not assume exercise of renewal, extension or termination options. For tenants with multiple leases, the range shown reflects all leases other than storage and similar leases. | |
| | (3) Includes a 10,000 square foot lease expiring in April 2015, a 150,000 square foot lease expiring in April 2016 (the existing subtenant has leased 101,000 square feet of this space commencing on expiration of the current lease and continuing until July 2023), a 421,000 square foot lease expiring in September 2019 and a 45,000 square foot lease expiring in December 2020. | |
| | | |
NOTE: Please see the page titled "Definitions" at the end of this Earnings Package for certain definitions.
|
| | |
| Douglas Emmett, Inc. | OFFICE LEASE DISTRIBUTION |
| | as of December 31, 2013 |
|
| | | | | | | | | | | | | | | | | | |
| | | | | | | | | | | | | | | |
| | Square Feet Under Lease | | Number of Leases | | Leases as a Percent of Total | | Rentable Square Feet | | Square Feet as a Percent of Total | | Annualized Rent | | Annualized Rent as a Percent of Total | |
| | 2,500 or less | | 1,294 |
| | 51.1% | | 1,778,018 |
| | 11.8% | | $ | 61,381,110 |
| | 13.1% | |
| | 2,501-10,000 | | 918 |
| | 36.3 | | 4,323,116 |
| | 28.6 | | 146,060,018 |
| | 31.1 | |
| | 10,001-20,000 | | 211 |
| | 8.3 | | 2,864,062 |
| | 19.0 | | 101,330,628 |
| | 21.5 | |
| | 20,001-40,000 | | 80 |
| | 3.2 | | 2,131,545 |
| | 14.1 | | 73,445,368 |
| | 15.6 | |
| | 40,001-100,000 | | 22 |
| | 0.9 | | 1,364,748 |
| | 9.1 | | 51,827,429 |
| | 11.0 | |
| | Greater than 100,000 | | 5 |
| | 0.2 | | 1,015,560 |
| | 6.7 | | 36,175,850 |
| | 7.7 | |
| | Subtotal | | 2,530 |
| | 100.0% | | 13,477,049 |
| (1) | 89.3% | | 470,220,403 |
| | 100.0% | |
| | Signed leases not commenced | | | | | | 267,944 |
| | 1.8 | | | | | |
| | Available | | | | | | 1,173,719 |
| | 7.8 | | | | | |
| | Building Management Use | | | | | | 109,383 |
| | 0.7 | | | | | |
| | BOMA Adjustment(2) | | | | | | 66,138 |
| | 0.4 | | | | | |
| | Total | | 2,530 |
| | 100.0% | | 15,094,233 |
| | 100.0% | | $ | 470,220,403 |
| | 100.0% | |
| | | | | | | | | | | | | | | |
| | | |
| | (1) Average tenant size is approximately 5,300 square feet. Median tenant size is approximately 2,400 square feet. | |
| | (2) Represents square footage adjustments for leases that do not reflect BOMA 1996 remeasurement. | |
| | | |
NOTE: Please see the page titled "Definitions" at the end of this Earnings Package for certain definitions.
|
| | |
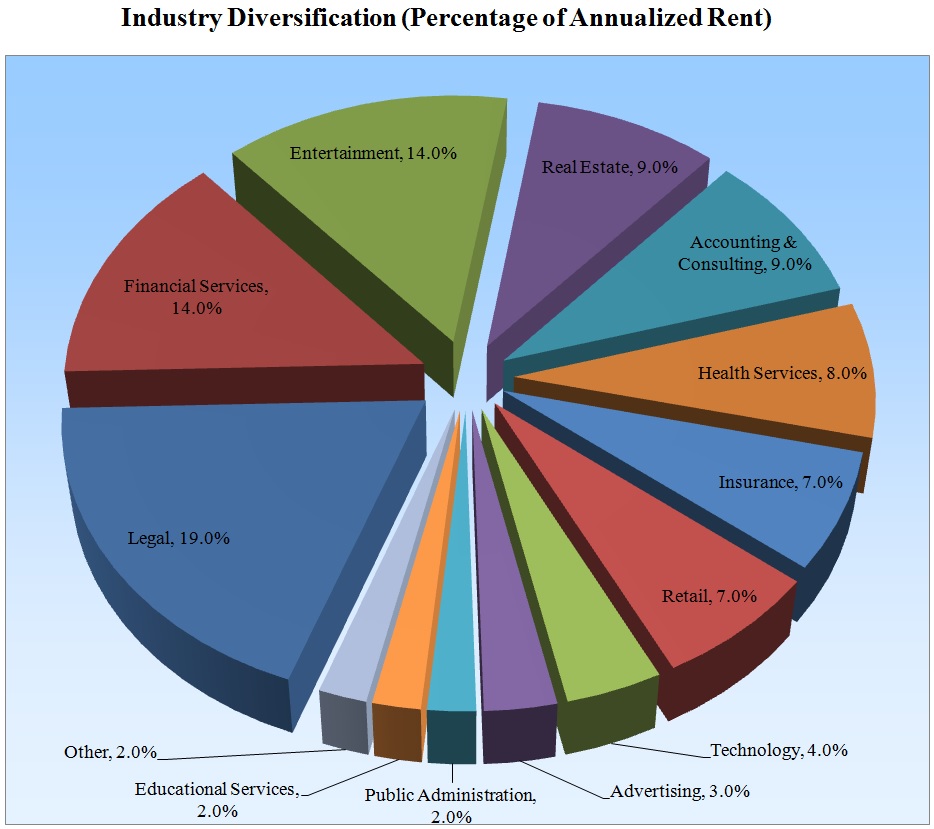
| Douglas Emmett, Inc. | INDUSTRY DIVERSIFICATION |
| | as of December 31, 2013 |
|
| | | | | | | |
| | | | | | | |
| | Industry | | Number of Leases | | Annualized Rent as a Percent of Total | |
| | Legal | | 508 | | 18.9 | % | |
| | Financial Services | | 328 | | 13.9 |
| |
| | Entertainment | | 177 | | 13.7 |
| |
| | Real Estate | | 193 | | 8.9 |
| |
| | Accounting & Consulting | | 307 | | 8.6 |
| |
| | Health Services | | 322 | | 8.1 |
| |
| | Insurance | | 122 | | 7.2 |
| |
| | Retail | | 191 | | 6.8 |
| |
| | Technology | | 110 | | 4.3 |
| |
| | Advertising | | 69 | | 2.6 |
| |
| | Public Administration | | 68 | | 2.3 |
| |
| | Educational Services | | 27 | | 1.7 |
| |
| | Other | | 108 | | 3.0 |
| |
| | Total | | 2,530 | | 100.0 | % | |
| | | | | | | |
NOTE: Please see the page titled "Definitions" at the end of this Earnings Package for certain definitions.
|
| | |
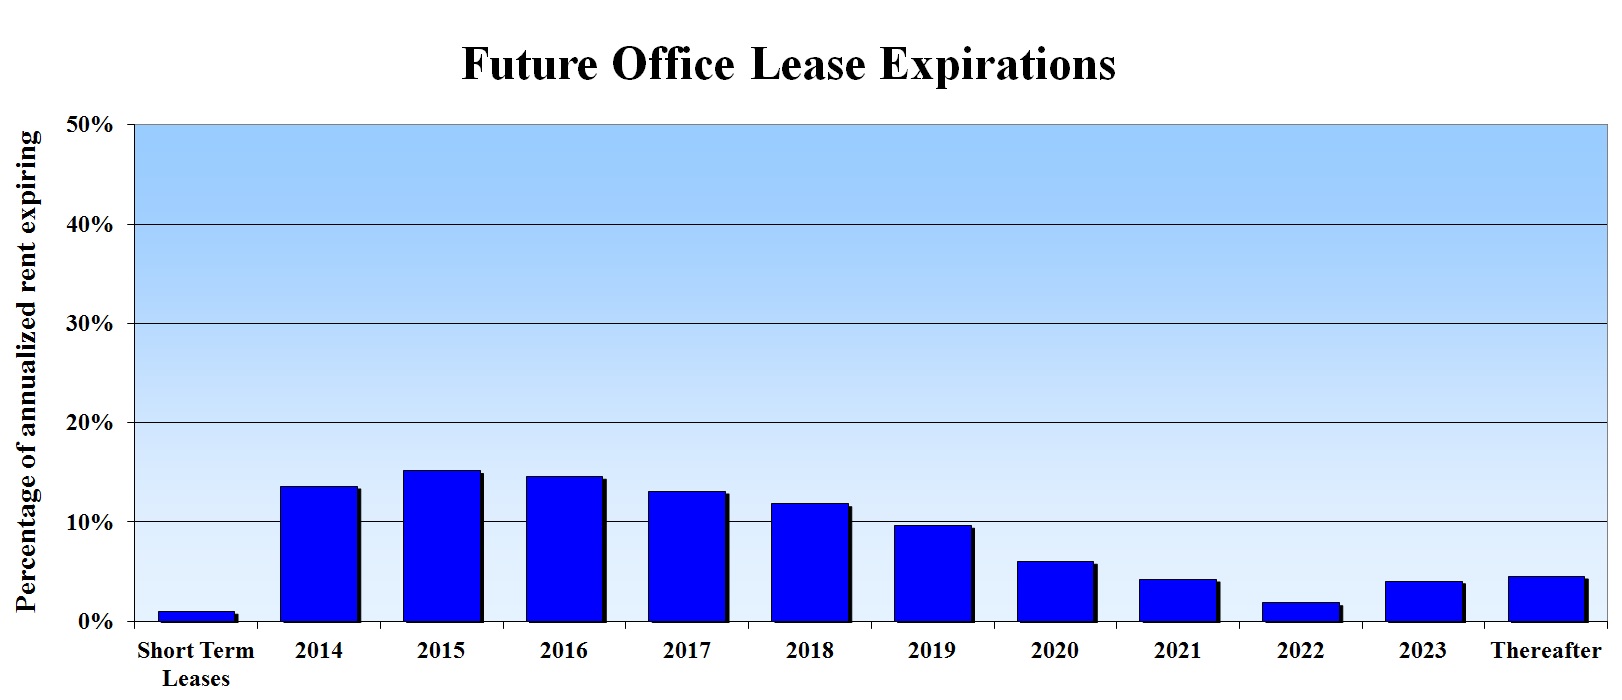
| Douglas Emmett, Inc. | OFFICE LEASE EXPIRATIONS |
| | as of December 31, 2013 |
|
| | | | | | | | | | | | | | | | | | | | | | | | | | |
| | | | | | | | | | | | | | | | | |
| | Year of Lease Expiration | | Number of Leases | | Rentable Square Feet | | Expiring Square Feet as a Percent of Total | | Annualized Rent at December 31, 2013 | | Annualized Rent as a Percent of Total | | Annualized Rent Per Leased Square Foot(1) | | Annualized Rent Per Leased Square Foot at Expiration(2) | |
| | Short Term Leases | | 52 |
| | 173,107 |
| | 1.1 | % | | $ | 4,769,138 |
| | 1.0 | % | | $ | 27.55 |
| | $ | 27.56 |
| |
| | 2014 | | 428 |
| | 1,803,879 |
| | 12.0 |
| | 64,135,175 |
| | 13.6 |
| | 35.55 |
| | 35.84 |
| |
| | 2015 | | 524 |
| | 2,082,865 |
| | 13.8 |
| | 71,433,311 |
| | 15.2 |
| | 34.30 |
| | 35.61 |
| |
| | 2016 | | 474 |
| | 2,027,372 |
| | 13.4 |
| | 68,788,818 |
| | 14.6 |
| | 33.93 |
| | 36.05 |
| |
| | 2017 | | 363 |
| | 1,855,611 |
| | 12.3 |
| | 61,793,054 |
| | 13.1 |
| | 33.30 |
| | 36.40 |
| |
| | 2018 | | 297 |
| | 1,500,769 |
| | 10.0 |
| | 55,734,008 |
| | 11.8 |
| | 37.14 |
| | 41.49 |
| |
| | 2019 | | 142 |
| | 1,309,462 |
| | 8.7 |
| | 45,536,634 |
| | 9.7 |
| | 34.78 |
| | 39.07 |
| |
| | 2020 | | 97 |
| | 831,153 |
| | 5.5 |
| | 28,512,523 |
| | 6.1 |
| | 34.30 |
| | 40.71 |
| |
| | 2021 | | 54 |
| | 542,391 |
| | 3.6 |
| | 20,081,388 |
| | 4.3 |
| | 37.02 |
| | 43.00 |
| |
| | 2022 | | 30 |
| | 260,547 |
| | 1.7 |
| | 8,812,190 |
| | 1.9 |
| | 33.82 |
| | 42.92 |
| |
| | 2023 | | 38 |
| | 601,060 |
| | 4.0 |
| | 19,171,875 |
| | 4.1 |
| | 31.90 |
| | 40.16 |
| |
| | Thereafter | | 31 |
| | 488,833 |
| | 3.2 |
| | 21,452,289 |
| | 4.6 |
| | 43.88 |
| | 59.61 |
| |
| | Subtotal/Weighted Average | | 2,530 |
| | 13,477,049 |
| | 89.3 |
| | 470,220,403 |
| | 100.0 |
| | 34.89 |
| | 38.53 |
| |
| | Signed leases not commenced | | 267,944 |
| | 1.8 |
| | | | | | | | | |
| | Available | | 1,173,719 |
| | 7.8 |
| | | | | | | | | |
| | Building Management Use | | 109,383 |
| | 0.7 |
| | | | | | | | | |
| | BOMA Adjustment(3) | | | | 66,138 |
| | 0.4 |
| | | | | | | | | |
| | Total/Weighted Average | | 2,530 |
| | 15,094,233 |
| | 100.0 | % | | $ | 470,220,403 |
| | 100.0 | % | | 34.89 |
| | 38.53 |
| |
| | | | | | | | | | | | | | | | | |
_________________________________________________________________
| |
| (1) | Represents annualized rent at December 31, 2013 divided by leased square feet. |
| |
| (2) | Represents annualized rent at expiration divided by leased square feet. |
| |
| (3) | Represents the square footage adjustments for leases that do not reflect BOMA 1996 remeasurement. |
NOTE: Please see the page titled "Definitions" at the end of this Earnings Package for certain definitions.
|
| | |
| Douglas Emmett, Inc. | QUARTERLY OFFICE LEASE EXPIRATIONS - NEXT FOUR QUARTERS |
| | as of December 31, 2013 |
|
| | | | | | | | | | | | | | | | | | |
| | | | | | | | | | | |
| | | | Q1 2014 | | Q2 2014 | | Q3 2014 | | Q4 2014 | |
| | Expiring SF(1) | | 285,078 | | 538,318 | | 371,045 | | 609,438 | |
| | Percentage of Portfolio | | 2.1 | % | | 4.0 | % | | 2.8 | % | | 4.5 | % | |
| | Expiring Rent per SF(2) | | $ | 39.75 |
| | $ | 34.35 |
| | $ | 36.68 |
| | $ | 34.83 |
| |
| | | | | | | | | | | |
|
| | | | | | | | | | | | | | | | | | | |
| | | | | | | | | | | | |
| | Detailed Submarket Data(3) | | | Q1 2014 | | Q2 2014 | | Q3 2014 | | Q4 2014 | |
| | Beverly Hills | Expiring SF(1) | | 21,475 |
| | 36,225 |
| | 32,086 |
| | 41,044 |
| |
| | | Expiring Rent per SF(2) | | $ | 32.88 |
| | $ | 44.63 |
| | $ | 47.85 |
| | $ | 38.11 |
| |
| | | | | | | | | | | | |
| | Brentwood | Expiring SF(1) | | 32,660 |
| | 59,126 |
| | 38,965 |
| | 73,926 |
| |
| | | Expiring Rent per SF(2) | | $ | 38.53 |
| | $ | 35.44 |
| | $ | 42.85 |
| | $ | 33.07 |
| |
| | | | | | | | | | | | |
| | Century City | Expiring SF(1) | | — |
| | 39,193 |
| | 15,510 |
| | 73,801 |
| |
| | | Expiring Rent per SF(2) | | $ | — |
| | $ | 36.44 |
| | $ | 39.80 |
| | $ | 44.34 |
| |
| | | | | | | | | | | | |
| | Honolulu | Expiring SF(1) | | 5,566 |
| | 22,226 |
| | 42,145 |
| | 37,262 |
| |
| | | Expiring Rent per SF(2) | | $ | 31.78 |
| | $ | 29.91 |
| | $ | 32.07 |
| | $ | 32.29 |
| |
| | | | | | | | | | | | |
| | Olympic Corridor | Expiring SF(1) | | 7,898 |
| | 67,677 |
| | 40,558 |
| | 26,786 |
| |
| | | Expiring Rent per SF(2) | | $ | 27.40 |
| | $ | 34.28 |
| | $ | 31.76 |
| | $ | 33.75 |
| |
| | | | | | | | | | | | |
| | Santa Monica | Expiring SF(1) | | 43,070 |
| | 15,050 |
| | 29,789 |
| | 37,295 |
| |
| | | Expiring Rent per SF(2) | | $ | 66.43 |
| | $ | 77.13 |
| | $ | 42.92 |
| | $ | 59.67 |
| |
| | | | | | | | | | | | |
| | Sherman Oaks/Encino | Expiring SF(1) | | 70,517 |
| | 92,901 |
| | 81,958 |
| | 95,062 |
| |
| | | Expiring Rent per SF(2) | | $ | 36.66 |
| | $ | 33.00 |
| | $ | 36.88 |
| | $ | 34.43 |
| |
| | | | | | | | | | | | |
| | Warner Center/Woodland Hills | Expiring SF(1) | | 97,940 |
| | 204,038 |
| | 83,740 |
| | 217,118 |
| |
| | | Expiring Rent per SF(2) | | $ | 32.54 |
| | $ | 29.78 |
| | $ | 31.21 |
| | $ | 28.00 |
| |
| | | | | | | | | | | | |
| | Westwood | Expiring SF(1) | | 5,952 |
| | 1,882 |
| | 6,294 |
| | 7,144 |
| |
| | | Expiring Rent per SF(2) | | $ | 57.29 |
| | $ | 32.51 |
| | $ | 36.86 |
| | $ | 36.33 |
| |
| | | | | | | | | | | | |
_________________________________________________________________
| |
| (1) | Includes leases with an expiration date in the applicable quarter where the space had not been re-leased as of December 31, 2013, other than 173,107 square feet of short term leases. The variations in this number from quarter to quarter primarily reflects the mix of buildings/submarkets involved, although it is also impacted by the varying terms and square footage of the individual leases involved. |
| |
| (2) | Includes the impact of rent escalations over the entire term of the expiring lease, and thus is not directly comparable to asking rents. |
| |
| (3) | Due to the small square footage of leases in each quarter in each submarket, and the varying terms and square footage of the individual leases and the individual buildings involved, these numbers should be extrapolated with caution. |
NOTE: Please see the page titled "Definitions" at the end of this Earnings Package for certain definitions.
|
| | |
| Douglas Emmett, Inc. | OFFICE PORTFOLIO LEASING ACTIVITY |
for the three months ended December 31, 2013
|
|
| | | | | | | | |
| | | | | | | | | |
| | | | | | Rentable Square feet | | Percentage | |
| | Net Absorption During Quarter(1) | | 79,551 | | 0.53% | |
| | | | | | | | | |
| | Office Leases Signed During Quarter | | Number of leases | | Rentable square feet | | Weighted Average Lease Term (months) | |
| | New leases | | 70 | | 267,797 | | 57 | |
| | Renewal leases | | 99 | | 320,570 | | 50 | |
| | All leases | | 169 | | 588,367 | | 53 | |
| | | | | | | | | |
|
| | | | | | | |
| | Change in Rental Rates for Office Leases Executed during the Quarter(2) | |
| | | | | | | | |
| | | Starting Cash Rent | | Straight-line Rent | | Expiring Cash Rent(3) | |
| | Leases executed during the quarter | $33.55 | | $34.46 | | N/A | |
| | Prior leases for same space | $33.58 | | $34.62 | | $36.88 | |
| | Percentage change | (0.1)% | | (0.5)% | | (9.0)% | |
| | | | | | | | |
|
| | | | | |
| | Average Office Lease Transaction Costs (Per Square Foot)(4) | |
| | | | | | |
| | | Lease Transaction Costs | | Lease Transaction Costs per Annum | |
| | New leases signed during quarter | $32.70 | | $6.91 | |
| | Renewal leases signed during quarter | $14.45 | | $3.46 | |
| | All leases signed during quarter | $22.76 | | $5.14 | |
| | | | | | |
________________________________________________________________
| |
| (1) | Excludes any properties acquired during the quarter. |
| |
| (2) | Represents the average initial stabilized cash rents and straight-line on new and renewal leases executed during the quarter compared to the prior lease on the same space, excluding short term leases and new leases on space which had not been leased for at least a year. |
| |
| (3) | The percentage change represents the difference in the starting cash rent on leases executed during the quarter compared to the expiring cash rent on the prior leases for the same space, which reflects the impact of rent escalations over the entire term of the expiring lease. The impact on cash revenues in the quarter was offset by the increase in cash revenues due to the annual rent escalations on the continuing in-place leases. |
| |
| (4) | Represents weighted average tenant improvements and leasing commissions. |
NOTE: Please see the page titled "Definitions" at the end of this Earnings Package for certain definitions.
|
| | |
| Douglas Emmett, Inc. | | 2014 GUIDANCE |
| |
2014 OUTLOOK:
|
| |
| Metric | 2014 Guidance |
| Funds From Operations (FFO) | $1.57 to $1.63 per share |
| Adjusted Funds From Operations (AFFO) | $1.18 to $1.24 per share |
| Office occupancy rate as of 12/31/2014 | 1.5% to 2.5% greater than at 12/31/13 |
| Residential leased rate as of 12/31/2014 | Essentially fully leased |
| Same property cash NOI growth rate | Up 2% to 3% from 2013 |
| G&A | $27 million to $28.5 million |
| Interest expense | $128 million to $129 million |
| FAS 141 revenue (from above/below market leases) | $22 million to $23 million(1) |
| Straight-line revenue | $4 million to $5.5 million |
| Recurring capex (Office) | $0.25 per square foot |
| Recurring capex (Multifamily) | $450 per unit |
| Weighted average diluted shares | 175 million to 176 million(2) |
____________________________________
| |
| (1) | Assumes that we exercise our option to purchase the land under one of our office buildings in Honolulu, which accelerates the remaining FAS 141 balance on our ground lease for that building. |
(2) The variation depends on the market price for our common stock and not on any stock issuances.
These projections are forward looking statements and reflect our views of current and future market conditions, including assumptions with respect to rental rates, occupancy levels and the impact of various events, some of which are referenced in this earnings package or during our quarterly conference calls. Except as disclosed, this guidance does not include the impact on operating results from possible future property acquisitions or dispositions, other possible capital markets activity and possible future impairment charges. There can be no assurance that our actual results will not differ materially from the estimates set forth above.
NOTE: Please see the page titled "Definitions" at the end of this Earnings Package for certain definitions.
|
| | |
| Douglas Emmett, Inc. | | DEFINITIONS |
| |
Adjusted Funds From Operations (AFFO): We calculate AFFO by subtracting from FFO (as adjusted for terminated swaps - see FFO definition below) straight-line rent, amortization of acquired above and below market leases, amortization of loan premiums, recurring capital expenditures, tenant improvements and leasing commissions, and adjustments attributable to consolidated joint ventures and investment in unconsolidated real estate funds, and by adding amortization of interest rate contracts and deferred loan costs and non-cash compensation expense. AFFO is a non-GAAP financial measure for which we believe that net income is the most directly comparable GAAP financial measure. AFFO is not intended to represent cash flow, but may provide an additional perspective on our operating results and ability to fund cash needs and pay dividends. As a widely reported measure of the performance of REITs, AFFO is also used by some investors to compare our performance with other REITs. However, other REITs may use different methodologies for calculating AFFO and, accordingly, our AFFO may not be comparable to that of other REITs. AFFO should be considered only as a supplement to net income as a measure of our performance.
Annualized Rent: Represents annualized monthly cash base rent (i.e., excludes tenant reimbursements, parking and other revenue) before abatements under leases commenced as of the measurement date (does not include 267,944 square feet with respect to signed leases not yet commenced at December 31, 2013). For our triple net Burbank and Honolulu office properties, annualized rent is calculated by adding expense reimbursements to base rent. Annualized rent does not include lost rent covered by insurance.
Diluted Shares: Diluted shares are calculated in accordance with accounting principles generally accepted in the United States (GAAP) and represent ownership in our company through shares of common stock, units in our Operating Partnership and other convertible equity instruments.
Funds From Operations (FFO): We calculate FFO before noncontrolling interests in accordance with the standards established by the National Association of Real Estate Investment Trusts (NAREIT). Although we adjust FFO, adjusted to treat debt interest rate swaps as terminated for all purposes in the quarter of termination (see footnote 1 on page 8 for details), that had no impact in the fourth quarter of 2012 or in any quarter in 2013. FFO is a non-GAAP financial measure which represents net income calculated in accordance with GAAP, excluding gains (or losses) from sales of depreciable operating property, real estate depreciation and amortization (other than amortization of deferred loan costs), and after adjustments for investments in unconsolidated real estate funds. We provide FFO as a supplemental performance measure because, by excluding real estate depreciation, amortization and gains and losses from property dispositions, some investors use it to illustrate trends in occupancy rates, rental rates and operating costs from year to year. We also believe that, as a widely recognized measure of the performance of REITs, FFO is used by some investors as a basis to compare our operating performance with that of other REITs. However, FFO has limitations as a measure of our performance because it excludes depreciation and amortization, and captures neither the changes in the value of our properties that result from use or market conditions, nor the level of capital expenditures, tenant improvements and leasing commissions necessary to maintain the operating performance of our properties, all of which have real economic effect and could materially impact our results from operations. Other equity REITs may not calculate FFO in accordance with the NAREIT definition and, accordingly, our FFO may not be comparable to other REITs. FFO should be considered only as a supplement to net income as a measure of our performance. FFO should not be used as a measure of our liquidity or cash flow, nor is it indicative of funds available to fund our cash needs, including our ability to pay dividends.
Net Operating Income (NOI): NOI is a non-GAAP measure consisting of the revenue and expense attributable to the real estate properties that we own and operate. We present two forms of NOI:
| |
| • | “NOI - GAAP basis” is calculated by excluding the following from our net income : general and administrative expense, depreciation and amortization expense, other income, other expense, income (or loss) including depreciation from unconsolidated real estate funds, interest expense, acquisition related expenses, and net income attributable to noncontrolling interests. |
| |
| • | “NOI - Cash basis” is calculated by excluding from GAAP basis NOI our straight-line rent and the amortization of acquired above and below market leases. |
|
| | |
| Douglas Emmett, Inc. | | DEFINITIONS |
| |
We provide NOI as a supplemental performance measure because, by excluding real estate depreciation and amortization expense and gains (or losses) from property dispositions, some investors use it to illustrate trends in occupancy rates, rental rates and operating costs from year to year. We also believe that, as a widely recognized measure of the performance of REITs, NOI is used by some investors as a basis to compare our operating performance with that of other REITs. However, NOI has limitations as a measure of our performance because it excludes depreciation and amortization expense, and captures neither the changes in the value of our properties that result from use or market conditions, nor the level of capital expenditures, tenant improvements and leasing commissions necessary to maintain the operating performance of our properties, all of which have real economic effect and could materially impact our results from operations. Other equity REITs may not calculate NOI in a similar manner and, accordingly, our NOI may not be comparable to those other REITs' NOI. NOI should be considered only as a supplement to net income as a measure of our performance and should not be used as a measure of our liquidity or cash flow, nor is it indicative of funds available to fund our cash needs, including our ability to pay dividends.
Occupancy Rate: Represents percent leased, not including signed leases not yet commenced, as of December 31, 2013.
Properties Owned: Our "Consolidated Portfolio" includes all properties included in our consolidated results, of which we own 100% except for a 79,000 square foot property owned by a joint venture in which we own a 66.67% interest. Our "Total Portfolio" includes our Consolidated Portfolio plus eight properties totaling 1.8 million square feet owned by our unconsolidated real estate Funds, in which we own a weighted average of approximately 60% based on square footage.
Quarterly Average Percent Occupied: Represents the average of the percentage occupied on the last day of the current and prior quarter.
Rentable Square Feet: Based on BOMA 1996 remeasurement. At December 31, 2013, total consists of 13,744,993 leased square feet (including 267,944 square feet with respect to signed leases not commenced), 1,173,719 available square feet, 109,383 building management use square feet and 66,138 square feet of BOMA 1996 adjustment on leased space.
Same Property NOI: To facilitate a comparison of NOI between reported periods, we calculate comparable amounts for a subset of our owned properties referred to as our “same properties.” Same property amounts are calculated as the amounts attributable to properties which have been owned and operated by us, and reported in our consolidated results, during the entire span of both periods compared. Therefore, any properties either acquired after the first day of the earlier comparison period or sold, contributed or otherwise removed from our consolidated financial statements before the last day of the later comparison period are excluded from same properties. We may also exclude from the same property set any property that is undergoing a major repositioning project that would impact the comparability of its results between two periods.
Shares of Common Stock Outstanding: Represents undiluted common shares outstanding as of December 31, 2013, and therefore excludes units in our Operating Partnership and other convertible equity instruments.
Short Term Leases: Represents leases that expired on or before the measurement date or had a term of less than one year, including, for example, hold over tenancies, month to month leases and other short term occupancies.