Exhibit 99.1

| 4Q and 2010 Earnings Call February 23, 2011 10:00 am ET Dial in: (866) 233-3843 (US) (651) 224-7472 (International) Passcode: 190758 |

| Safe Harbor Statement Certain statements made within this presentation contain forward-looking statements, within the meaning of the Private Securities Litigation Reform Act of 1995. Forward-looking statements are not guarantees of performance and by their nature are subject to inherent uncertainties. Actual results may differ materially. Any forward-looking information relayed in this presentation speaks only as of February 23, 2011, and the Company undertakes no obligation to update that information to reflect changed circumstances. Additional information concerning these statements is contained in the Company’s press release regarding its Fourth Quarter 2010 results issued on February 22, 2011, and the Risk Factors and Forward-Looking Statements sections of the Company’s 2009 Form 10-K, Second Quarter 2010 Form 10-Q and Third Quarter 2010 Form 10-Q. Copies of these filings are available from the SEC, the Hertz web site or the Company’s Investor Relations Department. |
| Definitions and reconciliations of these non-GAAP measures are provided at the end of the presentation. The following non-GAAP measures will be used in the presentation: Non-GAAP Measures EBITDA Corporate EBITDA Adjusted Pre-Tax Income Adjusted Net Income Adjusted Diluted Earnings Per Share Net Corporate Debt Net Fleet Debt Total Net Debt Adjusted Interest Expense Adjusted DOE Adjusted SGA Adjusted Depreciation of Revenue Earning Equipment Levered After-Tax Cash-Flow Before Fleet Growth Levered After-Tax Cash-Flow After Fleet Growth (Free Cash Flow After Fleet Growth) |

| 2 Year Trend 2008-2010 2010 Review Mark Frissora, Chairman and CEO Financial & Operating Results Overview Elyse Douglas, Executive VP and CFO Outlook & Guidance Mark Frissora, Chairman and CEO Questions & Answers Session Today’s Agenda |

| Opening Comments |
| 2008-2010 Milestones Toward Recovery Consolidated revenue +6.5% in 2010 vs decline of 16.7% in 2009 US RAC -1.5% over the two-year period from -10.0% 2009 vs. 2008 Consolidated adjusted direct operating and SG&A expenses down 11% each US RAC fleet efficiency +177 basis points vs. 2008 Consolidated adjusted depreciation costs reduced by 14.6% Cost savings achieved over last 24 months ~$1.2 billion Consolidated adjusted pre-tax margin up 182 basis points over 2008 US RAC 2010 adjusted pre-tax margin +645 bps vs. ‘08, +230 bps vs. ‘07 peak Corporate EBITDA margin up 166 basis points vs. 2008 Consolidated adjusted diluted earnings per share 24.3% higher than in 2008 Generated $452.5mm of free cash flow after fleet growth, supporting 9.6% total net debt reduction |
| Outperformed all guidance metrics for adjusted earnings 2010 revenue in line with guidance, +6.5% YoY Increased Efficiency and Productivity Lean/Six Sigma “Lighthouse” major airport locations & HERC branches 2010 completed = NA RAC:13, Europe RAC: 2, HERC: 3 2011 planned = NA RAC: 20, International RAC: 20, HERC: 15 Improved Capital Structure Capitalized on Diversified Growth Opportunities 2010 REVIEW 2010 Results 2010 Guidance Incremental to Guidance Adjusted Pre-tax Income $348.1 $315-$325 7.1% Corporate EBITDA $1,101.3 $1,080-$1,095 0.6% Adjusted EPS $0.52 $0.47-$0.48 8.3% 2010 Results 2009 Results YoY Change Adjusted Pre-tax Income $348.1 $198.9 75.0% Corporate EBITDA $1,101.3 $979.9 12.4% Adjusted EPS $0.52 $0.29 79.3% ($ in millions, except per share amounts) |
| 2010 COST SAVINGS $438mm total cost savings through multiple initiatives, i.e. Lean/Six Sigma Consolidated revenue per employee +6.6% over 2009; +28.6% vs. 2006 WW RAC fleet efficiency +23 basis points WW RAC depreciation per month per vehicle decreased 8.2% Improved consolidated adjusted pre-tax income & Corporate EBITDA margins by 180 bps and 80 bps, respectively, over 2009 2006 – 2010 U.S RAC +38.2% EU RAC + 33.6% WW HERC +16.2% Cost Savings Revenue Per Employee (at constant currency) +28.6% since 2006 |
| CAPITAL STRUCTURE Successfully refinanced U.S. fleet debt Blended interest rate on fixed-rate notes ~50 bps lower Blended interest margin on floating-rate notes ~1.6% lower European fleet debt new funding in place Successfully completed refinancing, despite volatile credit markets in E.U. last summer Funded majority of the debt with longer term fixed rate debt Blended rate up ~400bps at current floating rates Opportunistically capitalizing on strength of high-yield market Replaced higher coupon notes with new bonds, lowering combined interest rate by 2.15% 2010 generated ~$269.1 million levered after-tax cash flow after fleet growth; $85.7 million increase over 2009 Used to pay down revolving debt and invest in growth of business |
| Worldwide Advantage brand revenue +$90 million YoY to $140 million 21 locations added in 2010; Total: 46 locations and 14 affiliates worldwide U.S. Off Airport (OAP) – leisure, local business, monthly, insurance replacement Opened 230 net new locations; Total locations =1,928 Total OAP revenue +13.0% with same-store-revenue up 13.5% Adjusted pre-tax margin +630 bps over FY:09 Low-cost infrastructure, minimum overhead, more economical vehicles, and longer-length Inbound travel U.S. & abroad generates ~ $820mm annual revenue Global industry travel into U.S. +6% in 2010 Source: US Dept of Commerce, ITA, Hertz FY 2010 inbound U.S. corporate revenue +18.8% YoY; Revenue Per Transaction +6.3% – growing significantly faster than global travel industry Initiatives supported by 18.3% more advertising spending vs. 2009 Updates to facility investments – technology, new design 2010 RAC GROWTH INITIATIVES |
| 2010 U.S. RAC Performance Cost Savings Driving Profit Growth Over 2007 2010 Peak 2007 change Revenue $4,292.4 $4,566.2 -6.0% $ in millions Revenue +9.4% vs. 2009, but still down from 2007 peak 2010 adj. pre-tax profit margin 230 basis points higher than 2007 pre-recession high of 9.3% Adjusted pre-tax income 16.3% above 2007 peak |
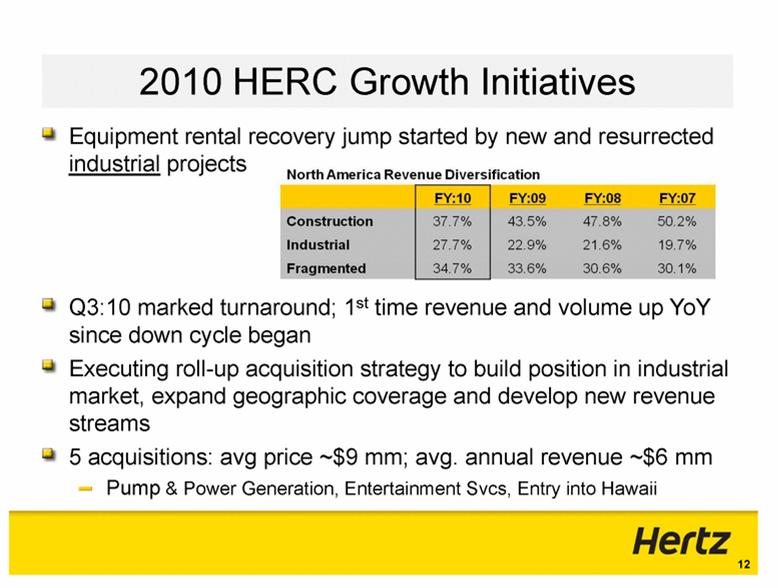
| 2010 HERC Growth Initiatives Equipment rental recovery jump started by new and resurrected industrial projects Q3:10 marked turnaround; 1st time revenue and volume up YoY since down cycle began Executing roll-up acquisition strategy to build position in industrial market, expand geographic coverage and develop new revenue streams 5 acquisitions: avg price ~$9 mm; avg. annual revenue ~$6 mm Pump & Power Generation, Entertainment Svcs, Entry into Hawaii |

| 2010 Performance |
| Definitions and reconciliations of these non-GAAP measures are provided at the end of the presentation. FY:10 Consolidated Financial Results GAAP FY 10 FY 09 $ Change Revenue $7,562.5 $7,101.5 + $461.0 Loss before income taxes ($13.6) ($171.0) + $157.4 Net loss attributable to HGH ($48.0) ($126.0) + $78.0 Diluted loss per share ($0.12) ($0.34) + $0.22 Net cash provided by operating activities $2,208.7 $1,693.3 - $515.4 Non-GAAP FY 10 FY 09 $ Change Margin Expansion Adjusted Pre-Tax Income $348.1 $198.9 + $149.2 180 bps Adjusted Net Income $212.4 $116.6 + $95.8 120 bps Corporate EBITDA $1,101.3 $979.9 + $121.4 80 bps Adjusted Diluted Earnings per Share $0.52 $0.29 + $0.23 $ in millions, except per share calculation |

| Rent-A-Car Metrics: Full Year 2010 % of WW RAC Total revenue FY:10 vs. FY:09 Total Revenue Rental Rate Revenue* Revenue Per Day (RPD) Trans. Days Revenue Per Transaction Transactions Trans Length (days) 66% U.S. (Hertz + Advantage) 9.4% 8.4% -0.1% 8.5% 1.0% 7.4% 1.1% U.S. (Hertz Classic) 7.3% 6.4% 0.7% 5.7% 1.5% 4.8% 0.8% 25% Europe 1.8% 5.6% 1.4% 4.1% 4.7% 0.8% 3.3% Worldwide 8.5% 7.3% -0.1% 7.3% 1.4% 5.8% 1.5% *Rental rate revenue exclude the effects of foreign currency . Rental revenue consists of all revenue, net of discounts, associated with the rental of cars including charges for optional insurance products, but excludes revenue derived from fueling and concession and other expense pass-throughs, NeverLost units in the U.S. and certain ancillary revenue. Adjusted pre-tax income: +38.2%; 2010 margin 9.9%, +210 bps yoy Corporate EBITDA: +35.7%; 2010 margin 11.7%, +230 bps yoy |
| U.S. Rent-A-Car* FY RPD Incl. Ancillary Sales Revenue Per Day (RPD) Reported RPD — time, mileage, insurance products Ancillary product/services - roadside SVC, Neverlost, parking, tolls, etc. Fuel Services Fully Loaded RPD FY:10 FY:09 %∆ $42.64 $42.36 +0.7% $5.29 $5.04 $2.27 $2.04 $50.20 $49.44 +1.5% *Excludes impact of Advantage |
| FY:10 U.S. RAC Operating Performance Fleet efficiency in line with 2009 at 79.5% 8.7% more fleet Monthly depreciation per car down 8.9% YoY Used-car residual values strong Net Promoter Score increased 490 bps to 51.1 YoY Adjusted pre-tax income improved 30.2% YoY Adjusted pre-tax margin +190bps Corporate EBITDA up 23.4% over FY:09 |
| FY:10 Europe RAC Performance Total revenue increased 1.8%, but up 7.1% excl. FX driven by: 4.1% higher volumes and 3.3% longer average rental length Improved revenue per day 1.4% vs. FY:09 9.4% YoY improvement in monthly fleet depreciation per unit Increased revenue per employee by 8.7% Adjusted pre-tax income +42.8% YoY and margin +190bps Net Promoter Score 11% better than 2009 Won 13 industry awards including "Best car rental company” in 5 countries |
| FY:10 Rental Car Fleet Mix 2010 2009 U.S. Risk % 72% 67% Europe Risk % 61% 65% Worldwide Risk % 72% 68% As of December 31, |
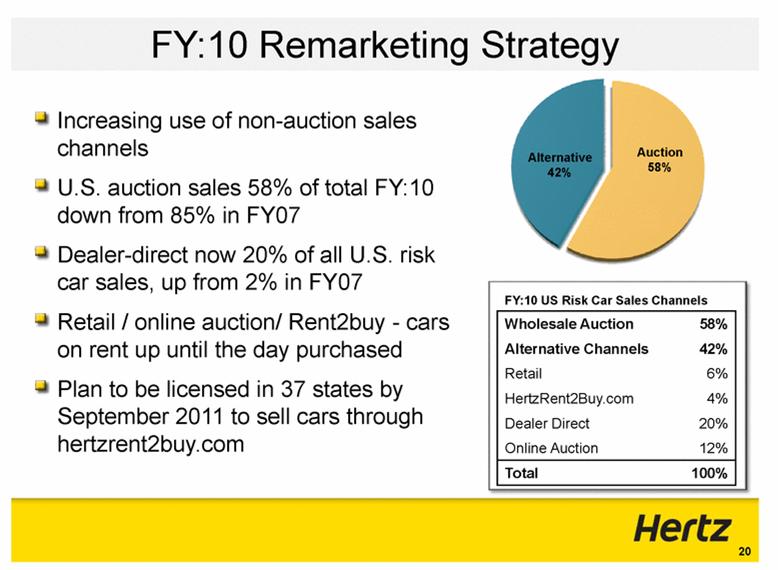
| Increasing use of non-auction sales channels U.S. auction sales 58% of total FY:10 down from 85% in FY07 Dealer-direct now 20% of all U.S. risk car sales, up from 2% in FY07 Retail / online auction/ Rent2buy - cars on rent up until the day purchased Plan to be licensed in 37 states by September 2011 to sell cars through hertzrent2buy.com FY:10 Remarketing Strategy FY:10 US Risk Car Sales Channels Wholesale Auction 58% Alternative Channels 42% Retail 6% HertzRent2Buy.com 4% Dealer Direct 20% Online Auction 12% Total 100% Auction 58% Alternative 42% |
| HERC FY:10 – Turnaround Begins Revenue down 3.7% FY:10 1.7% decrease in volume YoY 4.2% decrease in pricing YoY Time utilization* +210 bps to 59.3% vs. FY:09 Adjusted pre-tax income +2.1% YoY; margin improvement 40 bps Corporate EBITDA margin of 37.5% FY:10 *Time utilization: Calculated on unit average vs. weighted fleet cost basis |
| FY:10 HERC Peer Comparison 3-Yr Pricing Performance ‘07-’10 YoY Pricing Performance |

| Elyse Douglas CFO Q4:10 Results Balance Sheet Review Cash Flow Review |
| Definitions and reconciliations of these non-GAAP measures are provided at the end of the presentation. Q4:10 Consolidated Financial Results GAAP Q4 10 Q4 09 $ Change Revenue $1,835.8 $1,740.7 + $95.1 Loss before income taxes ($7.8) ($67.4) + $59.6 Net loss attributable to HGH ($29.2) ($30.9) + $1.7 Diluted loss per share ($0.07) ($0.08) + $0.01 Non-GAAP Q4 10 Q4 09 $ Change Margin Expansion Adjusted Pre-Tax Income $68.0 $39.2 + $28.8 140 bps Adjusted Net Income $40.4 $22.5 + $17.9 90 bps Corporate EBITDA $265.7 $221.0 + $44.7 180 bps Adjusted Diluted Earnings per Share $0.10 $0.06 + $0.04 $ in millions, except per share calculation |
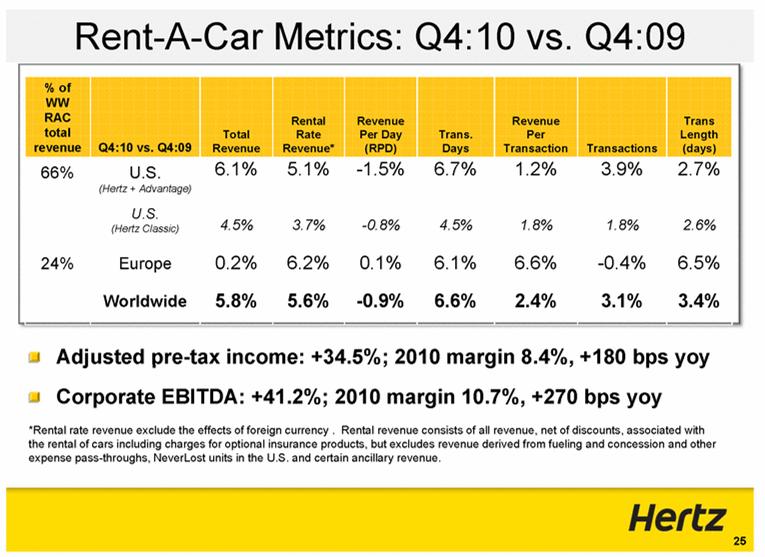
| Rent-A-Car Metrics: Q4:10 vs. Q4:09 % of WW RAC total revenue Q4:10 vs. Q4:09 Total Revenue Rental Rate Revenue* Revenue Per Day (RPD) Trans. Days Revenue Per Transaction Transactions Trans Length (days) 66% U.S. (Hertz + Advantage) 6.1% 5.1% -1.5% 6.7% 1.2% 3.9% 2.7% U.S. (Hertz Classic) 4.5% 3.7% -0.8% 4.5% 1.8% 1.8% 2.6% 24% Europe 0.2% 6.2% 0.1% 6.1% 6.6% -0.4% 6.5% Worldwide 5.8% 5.6% -0.9% 6.6% 2.4% 3.1% 3.4% *Rental rate revenue exclude the effects of foreign currency . Rental revenue consists of all revenue, net of discounts, associated with the rental of cars including charges for optional insurance products, but excludes revenue derived from fueling and concession and other expense pass-throughs, NeverLost units in the U.S. and certain ancillary revenue. Adjusted pre-tax income: +34.5%; 2010 margin 8.4%, +180 bps yoy Corporate EBITDA: +41.2%; 2010 margin 10.7%, +270 bps yoy |
| U.S. Rent-A-Car* Q4 RPD Incl. Ancillary Sales *Excludes impact of Advantage |
| Q4:10 U.S. RAC Operating Performance Total expenses down YoY as % of revenues Monthly depreciation per vehicle down 6.4% vs. Q4:07 Used-car residual values remain strong Q4 improved over Q3:10 due to seasonal decline in more expensive vehicles Adjusted pre-tax income improved 36.9% YoY Adjusted pre-tax margin +240bps Corporate EBITDA up 25.4% over Q4:09 Monthly Depreciation per Vehicle |
| Worldwide RAC Fleet Efficiency Fleet efficiency: % of days car is rented compared with avg. number vehicles available to rent. Formula: ((Annualized Transaction Days / 365) / Average Fleet)) Rebound in commercial travel Demand peaks mid-week; rental length typically only 3-4 days Leisure rentals avg 5-6 days Insurance replacement rentals avg 10 days Expansion of off-airport and Advantage network nationally, where rental length is extended Use of direct-to-dealer/direct-to-consumer sales channels keep cars on rent until point of sale Rent-A-Car Fleet Efficiency |
| Q4:10 Europe RAC Operating Performance Total revenue increased 0.2%, but up 7.3% excl. FX driven by: Volumes 6.1% higher, supported by 6.5% longer avg. rental length Revenue per day up slightly vs. Q4:09 at $46.10 6.8% improvement in monthly fleet depreciation per unit Increased revenue per employee by 8.4% YoY Signed 13 new accounts/partnerships, incremental $10M revenue Re-signed 36 accounts worth $51M annual revenue Net Promoters Score average of 44.4 for the quarter, up 10.5% |
| Q4:10 HERC Operating Performance Revenue increased 4.4% in Q4:10 Sequentially Q4:10 revenue up 1.7% vs. Q3:10 revenue Rental and rental related revenue +5.5% 10.0% increase in volume Q4:10 YoY Volume momentum: Sep +5.4%; Oct +10.2%, Nov +9.6%, Dec +10.5% Depreciation of REE down 3.2% Time utilization* +681 bps to 63.8% vs. Q4:09, and +100 bps vs. Q3:10 Adjusted pre-tax income +35.7% YoY; margin improvement 280 bps Corporate EBITDA Margin 40.1% Q4:10 *Time utilization: Calculated on unit average vs. weighted fleet cost basis 2009 2010 |
| Q4:10 HERC Peer Comparison 3-Yr Pricing Performance ‘07-’10 YoY Quarterly Pricing Performance |
| Q4:10 HERC Fleet Statistics WW HERC Fleet Size ($ in millions) WW HERC Fleet ($ in millions) Excludes FX Q4:10 Q4:09 Purchases $114.4 $35.9 Disposals $28.5 $30.9 Disposals $121.0 $53.5 (1st cost basis) FY:10 FY:09 Purchases $302.5 $85.9 Disposals $155.4 $171.5 Disposals $393.2 $397.2 (1st cost basis) Note: Comparatively, press release Table 6 “Equipment rental maintenance & growth cap ex” includes FX |
| ($ in millions) 2009 2010 2010 Cash Interest Expense Drivers Total Net Cash Interest $492.4 $578.5 Increased Higher fleet debt due to REE growth High yield pre-funding Lower ABS rate buydown benefit Full year impact of convertible debt Decreased Lower overall fleet rates Non-Cash Interest 171.9 182.6 Total Net Interest Expense $664.3 $761.1 2010 2011 EST 2011 Cash Interest Expense Drivers Total Cash Interest $578.5 $605-$615 Increase Fleet growth No benefit from ABS rate buydown Higher rates on corporate credit facility refinancing Decrease Full year impact of lower overall fleet rates High yield note refinancing benefit No high yield note pre-funding Non-Cash Interest 182.6 120-130 Total Net Interest Expense $761.1 $725-$745 2009-2010 Interest Expense and 2011 Guidance Note: Interest expense is net of interest income and excludes the $48.5 million gain in 2009 on debt repurchases and 2011 excludes the call premium paid on debt redemptions. |
| Restructuring & restructuring-related charges Q4:10 was $14.4mm and $13.6mm in cash vs. Q4:09 $34.5mm and $26.1mm in cash FY:10 was $67.9mm with $47.3mm in cash vs. FY:09 of $153.3mm and $129.1mm in cash Taxes FY:10 GAAP tax expense of $17.0mm vs. benefit of $59.7mm last year Annual adjusted tax rate normalized = 34% Q4:10 cash taxes paid: $9.3mm vs. $10.6mm in Q4:09 FY10 cash taxes $50.7mm vs. $31.3mm in 2009 primarily due to higher earnings Restructuring | Taxes |
| Capital Expenditures Estimated 2011 purchases: $200 to $215 million 2011 projects include: Information Technology Legacy systems for back office and operating functions, ERP, Global Planning System, Data Warehouse, and Ariba procurement roll-out (Efficiency) CRM and Rate engine upgrades (Growth) Replace obsolete network and telecommunications equipment (Maintenance) Facility expansion: Key growth and efficiency projects require investment Geographic growth includes Off-Airport, Connect, and Advantage (Growth) Customer service related upgrades to enhance differentiation (Efficiency / Maintenance) Full Year Purchases ($ in millions) 2010 2009 $ var % var Non-Fleet (PP&E) $178.4 $119.4 $59.0 49.4% |
| Improved earnings and working capital Increased fleet purchases for both RAC & HERC Q4:10 & Full Year Cash Flow Fourth Quarter Cash Flow ($ in millions) 2010 2009 $Δ Levered Cash Flow Before Fleet Growth ($30.3) ($45.2) $14.9 Levered Cash Flow After Fleet Growth $410.7 $5.3 $405.4 Full Year Cash Flow ($ in millions) 2010 2009 $Δ Levered Cash Flow Before Fleet Growth $421.8 $263.4 $158.4 Levered Cash Flow After Fleet Growth $269.1 $183.4 $85.7 |
| Working Capital Days Note: Net working capital days includes non-fleet receivables, HERC fleet receivables, fleet/other payables, inventories, prepaid and accrued liabilities. Receivables include customer receivables, subro receivables, warranty, and other misc. Better Improved performance under difficult economic conditions Needs update Working Capital Receivables DSO improved 16% since 2007 Working Capital Days improved 21% since 2007 |
| Fleet Financing Status Comment €400M Securitization €220M Revolving Credit Facility €400M Secured Note Refinanced European facilities $184M Series 2009-2 Subordinated ABS Incremental liquidity from existing collateral Hertz’s first ever subordinated rental car ABS $750M Series 2010-1 Senior & Subordinated ABS Incremental Fleet Financing for Fleet Growth Blended advance rate of 75% and weighted average interest rate below 4% First ever stand-alone 7-year rental car ABS $250M Australian Securitization AAA rated, refinanced remainder of Int’l ABS Facility $2.1B Variable Funding Note (Conduit) Facilities Significantly reduced credit spread saving estimated $20M in 2011 interest expense Corporate Financing $700M of 7.5% Notes due 2018 Extend maturity profile and lower interest cost by calling 10.5% subordinated notes and a portion of the 8.875% senior notes $500M of 7.375% Notes due 2021 Extend maturity profile and lower interest cost by calling additional 8.875% senior notes $500M of 6.750% Notes due 2019 (2011 event) Redeem a portion of the 8.875% Senior Dollar Notes due 2014 Closed Closed Closed Closed Closed Closed Closed Closed 2010 FINANCING UPDATE Successfully closed 9 deals totaling $5.8 billion fleet & corp. debt |
| Pro Forma Debt Maturity Profile Corporate Debt Fleet Debt Assumes corporate ABL and Term Loan maturing in 2012 are refinanced to 2016 and 2018, respectively. 2016 reflects unfunded ABL amount of $1,800 million. Unfunded ABL Term Loan 2011 2012 2013 2014 2015 2016 2017 2018 2019 2021 2028 Fleet Debt $460 $756 $2,365 $490 $1,182 $125 $77 $38 $ - $ - $ - $0.0 $500.0 $1,000.0 $1,500.0 $2,000.0 $2,500.0 $3,000.0 Debt Maturity Schedule - 12/31/10 2011 2012 2013 2014 2015 2016 2017 2018 2019 2021 2028 ABL & Term Loan $ - $ - $ - $ - $ - $1,800 $ - $1,350 $ - $ - $ - Corporate Debt $157 $125 $ - $1,420 $ - $ - $ - $700 $500 $500 $26 $0.0 $500.0 $1,000.0 $1,500.0 $2,000.0 $2,500.0 $3,000.0 Pro Forma Debt Maturity Schedule - 12/31/10 |
| Liquidity would be $1,984 mil when adjusted for the $1,144 mil of high yield notes called in January plus the call premium Liquidity Corporate Liquidity @ 12/31/10 ($ in millions) Actual Pro Forma ABL Availability: $ 796 $796 Unrestricted Cash: 2,374 1,188 Corporate Liquidity: $ 3,170 $1,984 Total net corporate debt $3.4 billion Total net fleet debt $5.4 billion |
| Full compliance with corporate covenants 4.42x (Max 4.75x) on consolidated leverage ratio 3.50x (Min 2.25x) on interest coverage ratio Leverage ratio of 3.38x, if adjusted for the $1,144 mil of high yield notes called in January Covenant Compliance NOTE: Covenant calculations do not include Convertible Notes issued under Hertz Global Holdings in May 2009, since covenants only apply to The Hertz Corporation results. Corporate Debt Covenants 2010 – 2012 Q1 Q2 Q3 Q4 Leverage Ratio (Max) 4.75x 5.25x 5.25x 4.75x Interest Coverage Ratio (Min) 2.25x 2.00x 2.00x 2.25x |

| 2011 Outlook |
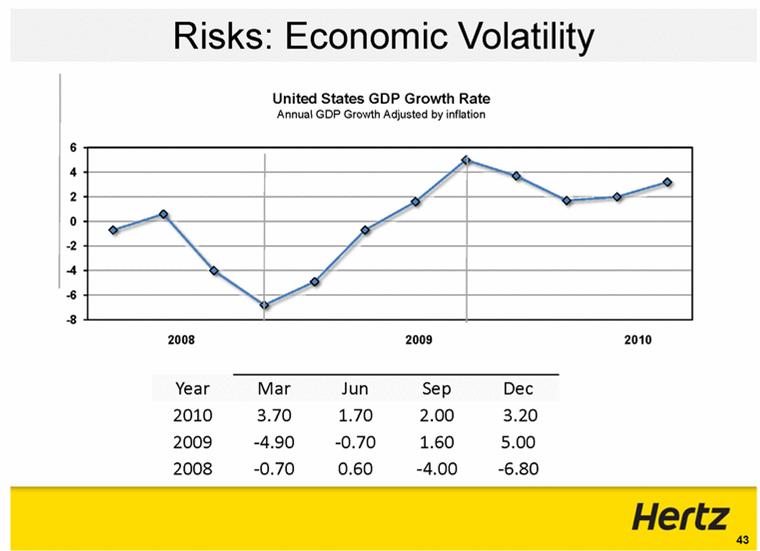
| Risks: Economic Volatility Year Mar Jun Sep Dec 2010 3.70 1.70 2.00 3.20 2009 -4.90 -0.70 1.60 5.00 2008 -0.70 0.60 -4.00 -6.80 |
| Optimistic 2011 another step closer to 2007 peak Experiencing a multi-year bull stock market Corporations enjoying healthy profit margins Recent tax measures positive Individuals reducing debt burden Cautious view driven by risks in advanced economies Growth remains subdued Household income weak Unemployment still high U.S. real estate market remains soft Middle East unrest Commodity prices rising Financial turbulence reemerged in parts of Europe Q4:10 Macro Economic Uncertainty |
| Corporate Locations Avg. Fleet YTD 12/31/10 Revenue ($mm ) U.S. 3,696 297,944 $4,292 Canada 127 8,498 $142 Puerto Rico & US VI 20 1,899 $25 Latin America 48 6,955 $86 Europe 957 109,542 $1,605 AU & NZ & China 94 20,363 $336 Sub-total Corporate 4,942 445,201 $6,486 Franchise Locations Avg. Fleet YTD 12/31/10 Revenue ($mm ) U.S. 274 11,184 $152 Canada 43 2,436 $38 Latin America 444 27,883 $256 EMEA 1,205 122,333 $1,082 Asia Pac & Japan 1,610 164,150 $1,926 Sub-total Franchise 3,576 327,986 $3,454 Total Network 8,518 773,187 $9,940 *Franchise revenue as declared by franchisees, where applicable. **Not reported in Hertz corporate Notes: Franchise information as reported to us by franchisees, and has not otherwise been confirmed by Hertz and is not reported in Hertz financial statements. This includes information for relationships for all third party entities under the “Hertz” brand Global Network Advantage |
| 3 Year Goals: 2010 – 2013 Leverage global brands, market position and investment to drive revenue growth Drive cost efficiencies to leverage earnings growth Utilize cash flow to deleverage 3 Year Goals Revenue Growth 7%-8% Fleet Cost % of Revenue 25%-26% OpEx & SG&A % of Revenue 60%-61% Corp. Interest % of Revenue 2.5%-3.0% Adjusted Pre-tax % of Revenue 11%-12% Corp. EBITDA % of Revenue 20%-21% Economic Model Strategy |
| Total Revenue: $7.95 to $8.1 bln RAC expectation is for: Advantage / off-airport grow through broader network, higher market share Expansion on-airport: more trans. days, longer rentals Industry est. another 6% increase inbound travel demand to the U.S. HERC expectation is for: 10% volume growth with potential upside from pricing improvements YoY price increase in 1H:11 as utilization of industrial equipment increases Industrial-driven recovery: Industrial accounts ~28% of equipment revenue vs. peers’ industrial exposure as high as 60% of their total revenue HERC could see slower pace of revenue growth due to higher exposure to non-residential construction market American Institute of Architects’ Billing Index, a leading indicator for future spending, went positive for first time in 2+ years Fleet refreshed by 2H:10; Expect overall age down 2-3 months by year end 2011 Revenue Guidance |
| Adj. pre-tax income of $525 million to $565 million Higher revenue and better cost mgmt will spur 62% increase YoY Cost management expectation: Global advertising costs +22%, as a percent of revenue is roughly 2.1% compared with 2010’s 1.8% level and 2009’s 1.6% ratio $25 - $35 million of higher incremental interest expense WW monthly net fleet depreciation per unit 3% to 4% lower than 2010 Better purchasing of both new and “like-new” vehicles, Targeted mix of 80% risk vehicles Larger percent of cars through higher-return sales channels Incremental $300 million cost savings 2011 Adjusted PreTax Guidance |
| 2011 Sensitivity to Adjusted Pre-tax Income 1 Percent change over FY:10 21.0% of total cost base excluding net depreciation Upside in volume and pricing in WW RAC and in global cost efficiencies Approximate Guidance Assumptions 2011 Pre-Tax Opportunity with 1% Improvement1 WWRAC Pricing -1% to 0% $50 Volume (Days) 6% to 7% $18 Net Depr per Unit -3% to -4% $15 WWHERC Pricing 0% to 1% $9 Volume 10% to 12% $3 Cost Efficiencies $300 mil $56 2 |
| Expect to generate 15-18% higher Corporate EBITDA of $1.265 billion to $1.305 billion For equipment rental specifically: Expect 42% Corporate EBITDA margin FY:11, weighted to back-half Double-digit revenue growth Scheduled return to normalized maintenance costs 2011 Corporate EBITDA Guidance |
| Forecast adjusted net income of $330mm - $355mm Quarterly share count will vary Volatility results from standard accounting rule: When GAAP net income is positive, potential exercise of options and impact of convertible debt is included in fully diluted share count If GAAP net loss, rule does not apply Hertz expects GAAP profitability in each of last three quarters of 2011 Treasury stock method: principal to be paid in cash at conversion; premium over conversion price to be paid in equity Expectation: First quarter: 413mm shares Second through fourth quarters: 450mm shares each Example: Full Year at 440mm average fully diluted shares HTZ adjusted EPS would be $0.81 p/s (high end of range) 2011 Adjusted Net Income Guidance |
| Example Share Count Calculation Q1 Q2 Q3 Q4 2011 Basic Shares at Dec. 31, 2010 413.5 413.5 413.5 413.5 413.5 Dilutive Shares: Convertible Debt 0.0 25.6 25.6 25.6 19.2 Options, RSU, PSU 0.0 9.6 9.6 9.6 7.2 Total Diluted Shares 413.5 448.7 448.7 448.7 439.9 Assumptions: stock price at $15 per share; Q1 net loss, and Q2 through Q4 net income Hertz uses the Treasury Stock method of accounting for convertible debt. This policy of settling the conversion of Convertible Senior Notes uses a combination settlement, which calls for settling the $1,000 in principal amount in cash and settling the excess conversion value, if any, in shares. For every dollar increase in share price, there are approximately 2mm additional dilutive shares |
| Total Revenue: $7.95 to $8.1 bln 7% Adjusted pre-tax income: $525 to $565mln 62% Reduction in WW monthly depreciation per car -4% Corporate EBITDA: $1.265 to $1.305 bln 19% Adjusted Net Income: $330 to $355 million 67% FY 2011 Financial Guidance YoY Increase* *Based on high end of range |
| U.S. & Europe RAC In U.S. RAC: Higher fleet capacity from addressing typical peak demand during week between Christmas and New Year’s -- Timing issue Impacted by winter storms across country, resulting in reservation cancellations and pricing pressure Now seeing demand bounce back as customers rebook travel Currently Hertz fleet tight, utilization up YoY, labor costs per transaction down In Europe rental car: Strong single-digit revenue growth so far in Q1:11 due to higher trans. days European fleet in line with demand HERC Expect double-digit revenue growth YoY Expect mid-30% Corporate EBITDA margin due to continued fleet maintenance (FY margin is expected to be 42%) Q1:11 Outlook |
Table 1
HERTZ GLOBAL HOLDINGS, INC.
CONDENSED CONSOLIDATED STATEMENTS OF OPERATIONS
(In millions, except per share amounts)
Unaudited
| | Three Months Ended | | As a Percentage | |
| | December 31, | | of Total Revenues | |
| | 2010 | | 2009 | | 2010 | | 2009 | |
Total revenues | | $ | 1,835.8 | | $ | 1,740.7 | | 100.0 | % | 100.0 | % |
| | | | | | | | | |
Expenses: | | | | | | | | | |
Direct operating | | 1,036.8 | | 1,021.7 | | 56.5 | % | 58.7 | % |
Depreciation of revenue earning equipment and lease charges | | 451.2 | | 463.1 | | 24.6 | % | 26.6 | % |
Selling, general and administrative | | 156.1 | | 153.1 | | 8.5 | % | 8.8 | % |
Interest expense | | 201.3 | | 182.0 | | 11.1 | % | 10.5 | % |
Interest and other income, net | | (1.8 | ) | (11.8 | ) | — | % | (0.7 | )% |
Total expenses | | 1,843.6 | | 1,808.1 | | 100.4 | % | 103.9 | % |
Loss before income taxes | | (7.8 | ) | (67.4 | ) | (0.4 | )% | (3.9 | )% |
Benefit (provision) for taxes on income | | (16.9 | ) | 39.8 | | (0.9 | )% | 2.3 | % |
Net loss | | (24.7 | ) | (27.6 | ) | (1.3 | )% | (1.6 | )% |
Less: Net income attributable to noncontrolling interest | | (4.5 | ) | (3.3 | ) | (0.2 | )% | (0.2 | )% |
Net loss attributable to Hertz Global Holdings, Inc. and Subsidiaries’ common stockholders | | $ | (29.2 | ) | $ | (30.9 | ) | (1.6 | )% | (1.8 | )% |
| | | | | | | | | |
Weighted average number of shares outstanding: | | | | | | | | | |
Basic | | 413.0 | | 410.0 | | | | | |
Diluted | | 413.0 | | 410.0 | | | | | |
| | | | | | | | | |
Loss per share attributable to Hertz Global Holdings, Inc. and Subsidiaries’ common stockholders: | | | | | | | | | |
Basic | | $ | (0.07 | ) | $ | (0.08 | ) | | | | |
Diluted | | $ | (0.07 | ) | $ | (0.08 | ) | | | | |
| | Year Ended | | As a Percentage | |
| | December 31, | | of Total Revenues | |
| | 2010 | | 2009 | | 2010 | | 2009 | |
Total revenues | | $ | 7,562.5 | | $ | 7,101.5 | | 100.0 | % | 100.0 | % |
| | | | | | | | | |
Expenses: | | | | | | | | | |
Direct operating | | 4,282.4 | | 4,084.2 | | 56.7 | % | 57.5 | % |
Depreciation of revenue earning equipment and lease charges | | 1,868.1 | | 1,931.4 | | 24.7 | % | 27.2 | % |
Selling, general and administrative | | 664.5 | | 641.1 | | 8.8 | % | 9.0 | % |
Interest expense | | 773.4 | | 680.3 | | 10.2 | % | 9.6 | % |
Interest and other income, net | | (12.3 | ) | (64.5 | ) | (0.2 | )% | (0.9 | )% |
Total expenses | | 7,576.1 | | 7,272.5 | | 100.2 | % | 102.4 | % |
Loss before income taxes | | (13.6 | ) | (171.0 | ) | (0.2 | )% | (2.4 | )% |
Benefit (provision) for taxes on income | | (17.0 | ) | 59.7 | | (0.2 | )% | 0.8 | % |
Net loss | | (30.6 | ) | (111.3 | ) | (0.4 | )% | (1.6 | )% |
Less: Net income attributable to noncontrolling interest | | (17.4 | ) | (14.7 | ) | (0.2 | )% | (0.2 | )% |
Net loss attributable to Hertz Global Holdings, Inc. and Subsidiaries’ common stockholders | | $ | (48.0 | ) | $ | (126.0 | ) | (0.6 | )% | (1.8 | )% |
| | | | | | | | | |
Weighted average number of shares outstanding: | | | | | | | | | |
Basic | | 411.9 | | 371.5 | | | | | |
Diluted | | 411.9 | | 371.5 | | | | | |
| | | | | | | | | |
Loss per share attributable to Hertz Global Holdings, Inc. and Subsidiaries’ common stockholders: | | | | | | | | | |
Basic | | $ | (0.12 | ) | $ | (0.34 | ) | | | | |
Diluted | | $ | (0.12 | ) | $ | (0.34 | ) | | | | |
Table 2
HERTZ GLOBAL HOLDINGS, INC.
CONDENSED CONSOLIDATED STATEMENTS OF OPERATIONS
(In millions)
Unaudited
| | Three Months Ended December 31, 2010 | |
| | As | | | | As | |
| | Reported | | Adjustments | | Adjusted | |
Total revenues | | $ | 1,835.8 | | $ | — | | $ | 1,835.8 | |
| | | | | | | |
Expenses: | | | | | | | |
Direct operating | | 1,036.8 | | (27.8 | )(a) | 1,009.0 | |
Depreciation of revenue earning equipment and lease charges | | 451.2 | | (3.7 | )(b) | 447.5 | |
Selling, general and administrative | | 156.1 | | (6.5 | )(c) | 149.6 | |
Interest expense | | 201.3 | | (37.8 | )(d) | 163.5 | |
Interest and other income, net | | (1.8 | ) | — | | (1.8 | ) |
Total expenses | | 1,843.6 | | (75.8 | ) | 1,767.8 | |
Income (loss) before income taxes | | (7.8 | ) | 75.8 | | 68.0 | |
Provision for taxes on income | | (16.9 | ) | (6.2 | )(e) | (23.1 | ) |
Net income (loss) | | (24.7 | ) | 69.6 | | 44.9 | |
Less: Net income attributable to noncontrolling interest | | (4.5 | ) | — | | (4.5 | ) |
Net income (loss) attributable to Hertz Global Holdings, Inc. and Subsidiaries’ common stockholders | | $ | (29.2 | ) | $ | 69.6 | | $ | 40.4 | |
| | Three Months Ended December 31, 2009 | |
| | As | | | | As | |
| | Reported | | Adjustments | | Adjusted | |
Total revenues | | $ | 1,740.7 | | $ | — | | $ | 1,740.7 | |
| | | | | | | |
Expenses: | | | | | | | |
Direct operating | | 1,021.7 | (f) | (44.3 | )(a) | 977.4 | |
Depreciation of revenue earning equipment and lease charges | | 463.1 | | (2.6 | )(b) | 460.5 | |
Selling, general and administrative | | 153.1 | | (9.0 | )(c) | 144.1 | |
Interest expense | | 182.0 | | (50.7 | )(d) | 131.3 | |
Interest and other income, net | | (11.8 | )(f) | — | | (11.8 | ) |
Total expenses | | 1,808.1 | | (106.6 | ) | 1,701.5 | |
Income (loss) before income taxes | | (67.4 | ) | 106.6 | | 39.2 | |
Benefit (provision) for taxes on income | | 39.8 | | (53.2 | )(e) | (13.4 | ) |
Net income (loss) | | (27.6 | ) | 53.4 | | 25.8 | |
Less: Net income attributable to noncontrolling interest | | (3.3 | ) | — | | (3.3 | ) |
Net income (loss) attributable to Hertz Global Holdings,Inc. and Subsidiaries’ common stockholders | | $ | (30.9 | ) | $ | 53.4 | | $ | 22.5 | |
| | Year Ended December 31, 2010 | |
| | As | | | | As | |
| | Reported | | Adjustments | | Adjusted | |
Total revenues | | $ | 7,562.5 | | $ | — | | $ | 7,562.5 | |
| | | | | | | |
Expenses: | | | | | | | |
Direct operating | | 4,282.4 | | (128.6 | )(a) | 4,153.8 | |
Depreciation of revenue earning equipment and lease charges | | 1,868.1 | | (14.3 | )(b) | 1,853.8 | |
Selling, general and administrative | | 664.5 | | (36.2 | )(c) | 628.3 | |
Interest expense | | 773.4 | | (182.6 | )(d) | 590.8 | |
Interest and other income, net | | (12.3 | ) | — | | (12.3 | ) |
Total expenses | | 7,576.1 | | (361.7 | ) | 7,214.4 | |
Income (loss) before income taxes | | (13.6 | ) | 361.7 | | 348.1 | |
Provision for taxes on income | | (17.0 | ) | (101.3 | )(e) | (118.3 | ) |
Net income (loss) | | (30.6 | ) | 260.4 | | 229.8 | |
Less: Net income attributable to noncontrolling interest | | (17.4 | ) | — | | (17.4 | ) |
Net income (loss) attributable to Hertz Global Holdings, Inc. and Subsidiaries’ common stockholders | | $ | (48.0 | ) | $ | 260.4 | | $ | 212.4 | |
| | Year Ended December 31, 2009 | |
| | As | | | | As | |
| | Reported | | Adjustments | | Adjusted | |
Total revenues | | $ | 7,101.5 | | $ | — | | $ | 7,101.5 | |
| | | | | | | |
Expenses: | | | | | | | |
Direct operating | | 4,084.2 | | (170.6 | )(a) | 3,913.6 | |
Depreciation of revenue earning equipment and lease charges | | 1,931.4 | | (14.3 | )(b) | 1,917.1 | |
Selling, general and administrative | | 641.1 | | (61.6 | )(c) | 579.5 | |
Interest expense | | 680.3 | | (171.9 | )(d) | 508.4 | |
Interest and other income, net | | (64.5 | ) | 48.5 | (g) | (16.0 | ) |
Total expenses | | 7,272.5 | | (369.9 | ) | 6,902.6 | |
Income (loss) before income taxes | | (171.0 | ) | 369.9 | | 198.9 | |
Benefit (provision) for taxes on income | | 59.7 | | (127.3 | )(e) | (67.6 | ) |
Net income (loss) | | (111.3 | ) | 242.6 | | 131.3 | |
Less: Net income attributable to noncontrolling interest | | (14.7 | ) | — | | (14.7 | ) |
Net income (loss) attributable to Hertz Global Holdings, Inc. and Subsidiaries’ common stockholders | | $ | (126.0 | ) | $ | 242.6 | | $ | 116.6 | |
(a) | Represents the increase in amortization of other intangible assets, depreciation of property and equipment and accretion of certain revalued liabilities relating to purchase accounting. For the three months ended December 31, 2010 and 2009, also includes restructuring and restructuring related charges of $9.5 million and $26.2 million, respectively. For the year ended December 31, 2010 and 2009, also includes restructuring and restructuring related charges of $52.6 million and $99.6 million. For the year ended December 31, 2009, also includes gasoline hedge gains of $5.0 million. |
(b) | Represents the increase in depreciation of revenue earning equipment based upon its revaluation relating to purchase accounting. |
(c) | Represents an increase in depreciation of property and equipment relating to purchase accounting. For the three months ended December 31, 2010 and 2009, also includes restructuring and restructuring related charges of $4.9 million and $8.3 million, respectively. For the year ended December 31, 2010 and 2009, also includes restructuring and restructuring related charges of $15.3 million and $53.7 million, respectively. For all periods presented, also includes other adjustments which are detailed in Table 5. |
(d) | Represents non-cash debt charges relating to the amortization of deferred debt financing costs and debt discounts. For the three months ended December 31, 2010 and 2009, also includes $12.0 million and $22.4 million, respectively, associated with the amortization of amounts pertaining to the de-designation of our interest rate swaps as effective hedging instruments. For the year ended December 31, 2010 and 2009, also includes $68.9 million and $74.6 million, respectively, associated with the amortization of amounts pertaining to the de-designation of our interest rate swaps as effective hedging instruments. |
(e) | Represents a provision for income taxes derived utilizing a normalized income tax rate (34% for 2010 and 2009). |
(f) | The three months and year ended December 31, 2009 includes a value added tax reclaim received, $8.2 million was recorded in Direct operating and $10.3 million was recorded in Interest and other income, net. |
(g) | Represents a gain (net of transaction costs) recorded in connection with the buyback of portions of our Senior Notes and Senior Subordinated Notes during the nine months ended September 30, 2009. |
Table 3
HERTZ GLOBAL HOLDINGS, INC.
SEGMENT AND OTHER INFORMATION
(In millions, except per share amounts)
Unaudited
| | Three Months Ended | | Year Ended | |
| | December 31, | | December 31, | |
| | 2010 | | 2009 | | 2010 | | 2009 | |
Revenues: | | | | | | | | | |
Car Rental | | $ | 1,548.0 | | $ | 1,463.7 | | $ | 6,486.2 | | $ | 5,979.0 | |
Equipment Rental | | 286.1 | | 274.0 | | 1,070.1 | | 1,110.9 | |
Other reconciling items | | 1.7 | | 3.0 | | 6.2 | | 11.6 | |
| | $ | 1,835.8 | | $ | 1,740.7 | | $ | 7,562.5 | | $ | 7,101.5 | |
| | | | | | | | | |
Depreciation of property and equipment: | | | | | | | | | |
Car Rental | | $ | 27.7 | | $ | 29.3 | | $ | 112.3 | | $ | 115.9 | |
Equipment Rental | | 8.3 | | 9.3 | | 34.3 | | 37.6 | |
Other reconciling items | | 1.8 | | 1.3 | | 7.4 | | 6.1 | |
| | $ | 37.8 | | $ | 39.9 | | $ | 154.0 | | $ | 159.6 | |
| | | | | | | | | |
Amortization of other intangible assets: | | | | | | | | | |
Car Rental | | $ | 6.9 | | $ | 7.3 | | $ | 30.2 | | $ | 32.5 | |
Equipment Rental | | 8.5 | | 8.3 | | 33.4 | | 32.8 | |
Other reconciling items | | 0.3 | | 0.3 | | 1.1 | | 0.7 | |
| | $ | 15.7 | | $ | 15.9 | | $ | 64.7 | | $ | 66.0 | |
| | | | | | | | | |
Income (loss) before income taxes: | | | | | | | | | |
Car Rental | | $ | 87.6 | | $ | 25.7 | | $ | 442.8 | | $ | 190.1 | |
Equipment Rental | | 16.9 | | 2.8 | | (14.6 | ) | (20.7 | ) |
Other reconciling items | | (112.3 | ) | (95.9 | ) | (441.8 | ) | (340.4 | ) |
| | $ | (7.8 | ) | $ | (67.4 | ) | $ | (13.6 | ) | $ | (171.0 | ) |
| | | | | | | | | |
Corporate EBITDA (a): | | | | | | | | | |
Car Rental | | $ | 165.1 | | $ | 116.9 | | $ | 759.9 | | $ | 560.1 | |
Equipment Rental | | 114.6 | | 111.0 | | 401.4 | | 459.2 | |
Other reconciling items | | (14.0 | ) | (6.9 | ) | (60.0 | ) | (39.4 | ) |
| | $ | 265.7 | | $ | 221.0 | | $ | 1,101.3 | | $ | 979.9 | |
| | | | | | | | | |
Adjusted pre-tax income (loss) (a): | | | | | | | | | |
Car Rental | | $ | 130.3 | | $ | 96.9 | | $ | 642.9 | | $ | 465.3 | |
Equipment Rental | | 35.0 | | 25.8 | | 78.0 | | 76.4 | |
Other reconciling items | | (97.3 | ) | (83.5 | ) | (372.8 | ) | (342.8 | ) |
| | $ | 68.0 | | $ | 39.2 | | $ | 348.1 | | $ | 198.9 | |
| | | | | | | | | |
Adjusted net income (loss) (a): | | | | | | | | | |
Car Rental | | $ | 86.0 | | $ | 63.9 | | $ | 424.3 | | $ | 307.1 | |
Equipment Rental | | 23.1 | | 17.0 | | 51.5 | | 50.4 | |
Other reconciling items | | (68.7 | ) | (58.4 | ) | (263.4 | ) | (240.9 | ) |
| | $ | 40.4 | | $ | 22.5 | | $ | 212.4 | | $ | 116.6 | |
| | | | | | | | | |
Adjusted diluted number of shares outstanding (a) | | 410.0 | | 407.7 | | 410.0 | | 407.7 | |
| | | | | | | | | |
Adjusted diluted earnings per share (a) | | $ | 0.10 | | $ | 0.06 | | $ | 0.52 | | $ | 0.29 | |
(a) | Represents a non-GAAP measure, see the accompanying reconciliations and definitions. |
Note: | “Other Reconciling Items” includes general corporate expenses, certain interest expense (including net interest on corporate debt), as well as other business activities such as our third-party claim management services. See Tables 5 and 6. |
Table 4
HERTZ GLOBAL HOLDINGS, INC.
SELECTED OPERATING AND FINANCIAL DATA
Unaudited
| | Three | | Percent | | Twelve | | Percent | |
| | Months | | change | | Months | | change | |
| | Ended, or as | | from | | Ended, or as | | from | |
| | of Dec. 31, | | prior year | | of Dec. 31, | | prior year | |
| | 2010 | | period | | 2010 | | period | |
| | | | | | | | | |
Selected Car Rental Operating Data | | | | | | | | | |
| | | | | | | | | |
Worldwide number of transactions (in thousands) | | 6,323 | | 3.1 | % | 25,970 | | 5.8 | % |
U.S. | | 4,666 | | 3.9 | % | 19,101 | | 7.4 | % |
International | | 1,657 | | 0.8 | % | 6,869 | | 1.7 | % |
| | | | | | | | | |
Worldwide transaction days (in thousands) | | 30,408 | | 6.6 | % | 127,159 | | 7.3 | % |
U.S. | | 20,784 | | 6.7 | % | 86,422 | | 8.5 | % |
International | | 9,624 | | 6.3 | % | 40,737 | | 4.9 | % |
| | | | | | | | | |
Worldwide rental rate revenue per transaction day (a) | | $ | 42.66 | | (0.9 | )% | $ | 43.76 | | 0.2 | % |
U.S. | | $ | 41.17 | | (1.5 | )% | $ | 42.16 | | (0.1 | )% |
International (b) | | $ | 45.88 | | 0.1 | % | $ | 47.15 | | 0.9 | % |
| | | | | | | | | |
Worldwide average number of company-operated cars during period | | 427,600 | | 3.1 | % | 445,200 | | 7.7 | % |
U.S. | | 285,700 | | 2.1 | % | 297,900 | | 8.7 | % |
International (b) | | 141,900 | | 5.2 | % | 147,300 | | 5.6 | % |
| | | | | | | | | |
Worldwide revenue earning equipment, net (in millions) | | $ | 7,235.7 | | 3.1 | % | $ | 7,235.7 | | 3.1 | % |
| | | | | | | | | |
Selected Worldwide Equipment Rental Operating Data | | | | | | | | | |
| | | | | | | | | |
Rental and rental related revenue (in millions) (a) (b) | | $ | 260.7 | | 5.5 | % | $ | 976.1 | | (4.5 | )% |
Same store revenue growth (decline), including initiatives (a) (b) | | 3.0 | % | N/M | | (5.4 | )% | N/M | |
Average acquisition cost of revenue earning equipment operated during period (in millions) | | $ | 2,741.1 | | (3.1 | )% | $ | 2,732.6 | | (4.9 | )% |
Worldwide revenue earning equipment, net (in millions) | | $ | 1,703.7 | | (7.0 | )% | $ | 1,703.7 | | (7.0 | )% |
| | | | | | | | | |
Other Financial Data (in millions) | | | | | | | | | |
| | | | | | | | | |
Cash flows provided by operating activities | | $ | 479.1 | | (3.9 | )% | $ | 2,208.7 | | 30.4 | % |
Levered after-tax cash flow after fleet growth (a) | | 410.7 | | N/M | | 269.1 | | 46.7 | % |
EBITDA (a) | | 693.3 | | 11.9 | % | 2,822.4 | | 6.9 | % |
Corporate EBITDA (a) | | 265.7 | | 20.2 | % | 1,101.3 | | 12.4 | % |
Selected Balance Sheet Data (in millions)
| | December 31, | | December 31, | |
| | 2010 | | 2009 | |
Cash and cash equivalents | | $ | 2,374.2 | | $ | 985.6 | |
Total revenue earning equipment, net | | 8,939.4 | | 8,851.6 | |
Total assets | | 17,332.2 | | 16,002.4 | |
Total debt | | 11,306.4 | | 10,364.4 | |
Net corporate debt (a) | | 3,364.5 | | 3,633.6 | |
Net fleet debt (a) | | 5,360.1 | | 5,380.0 | |
Total net debt (a) | | 8,724.6 | | 9,013.6 | |
Total equity | | 2,131.3 | | 2,097.4 | |
| | | | | | | |
(a) Represents a non-GAAP measure, see the accompanying reconciliations and definitions.
(b) Based on 12/31/09 foreign exchange rates.
N/M Percentage change not meaningful.
Table 5
HERTZ GLOBAL HOLDINGS, INC.
RECONCILIATION OF GAAP TO NON-GAAP EARNINGS MEASURES
(In millions, except per share amounts)
Unaudited
ADJUSTED PRE-TAX INCOME (LOSS) AND ADJUSTED NET INCOME (LOSS)
| | Three Months Ended December 31, 2010 | |
| | | | | | Other | | | |
| | Car | | Equipment | | Reconciling | | | |
| | Rental | | Rental | | Items | | Total | |
Total revenues: | | $ | 1,548.0 | | $ | 286.1 | | $ | 1.7 | | $ | 1,835.8 | |
Expenses: | | | | | | | | | |
Direct operating and selling, general and administrative | | 977.9 | | 192.0 | | 23.0 | | 1,192.9 | |
Depreciation of revenue earning equipment and lease charges | | 383.9 | | 67.3 | | — | | 451.2 | |
Interest expense | | 99.8 | | 9.9 | | 91.6 | | 201.3 | |
Interest and other income, net | | (1.2 | ) | — | | (0.6 | ) | (1.8 | ) |
Total expenses | | 1,460.4 | | 269.2 | | 114.0 | | 1,843.6 | |
Income (loss) before income taxes | | 87.6 | | 16.9 | | (112.3 | ) | (7.8 | ) |
Adjustments: | | | | | | | | | |
Purchase accounting (a): | | | | | | | | | |
Direct operating and selling, general and administrative | | 8.4 | | 9.2 | | 0.8 | | 18.4 | |
Depreciation of revenue earning equipment | | — | | 3.6 | | — | | 3.6 | |
Non-cash debt charges (b) | | 25.6 | | 1.8 | | 10.4 | | 37.8 | |
Restructuring charges (c) | | 4.6 | | 3.3 | | 1.2 | | 9.1 | |
Restructuring related charges (c) | | 4.3 | | 0.2 | | 0.8 | | 5.3 | |
Derivative (gains) losses (c) | | (0.2 | ) | — | | 0.9 | | 0.7 | |
Acquisition related costs (d) | | — | | — | | 0.9 | | 0.9 | |
Adjusted pre-tax income (loss) | | 130.3 | | 35.0 | | (97.3 | ) | 68.0 | |
Assumed (provision) benefit for income taxes of 34% | | (44.3 | ) | (11.9 | ) | 33.1 | | (23.1 | ) |
Noncontrolling interest | | — | | — | | (4.5 | ) | (4.5 | ) |
Adjusted net income (loss) | | $ | 86.0 | | $ | 23.1 | | $ | (68.7 | ) | $ | 40.4 | |
Adjusted diluted number of shares outstanding | | | | | | | | 410.0 | |
| | | | | | | | | |
Adjusted diluted earnings per share | | | | | | | | $ | 0.10 | |
| | Three Months Ended December 31, 2009 | |
| | | | | | Other | | | |
| | Car | | Equipment | | Reconciling | | | |
| | Rental | | Rental | | Items | | Total | |
Total revenues: | | $ | 1,463.7 | | $ | 274.0 | | $ | 3.0 | | $ | 1,740.7 | |
Expenses: | | | | | | | | | |
Direct operating and selling, general and administrative | | 964.2 | | 190.5 | | 20.1 | | 1,174.8 | |
Depreciation of revenue earning equipment and lease charges | | 393.6 | | 69.5 | | — | | 463.1 | |
Interest expense | | 92.0 | | 11.1 | | 78.9 | | 182.0 | |
Interest and other income, net | | (11.8 | ) | 0.1 | | (0.1 | ) | (11.8 | ) |
Total expenses | | 1,438.0 | | 271.2 | | 98.9 | | 1,808.1 | |
Income (loss) before income taxes | | 25.7 | | 2.8 | | (95.9 | ) | (67.4 | ) |
Adjustments: | | | | | | | | | |
Purchase accounting (a): | | | | | | | | | |
Direct operating and selling, general and administrative | | 8.5 | | 8.9 | | 0.8 | | 18.2 | |
Depreciation of revenue earning equipment | | — | | 2.6 | | — | | 2.6 | |
Non-cash debt charges (b) | | 39.8 | | 2.2 | | 8.7 | | 50.7 | |
Restructuring charges (c) | | 8.4 | | 9.3 | | 1.9 | | 19.6 | |
Restructuring related charges (c) | | 14.5 | | — | | 0.4 | | 14.9 | |
Derivative losses (c) | | — | | — | | 0.6 | | 0.6 | |
Adjusted pre-tax income (loss) | | 96.9 | | 25.8 | | (83.5 | ) | 39.2 | |
Assumed (provision) benefit for income taxes of 34% | | (33.0 | ) | (8.8 | ) | 28.4 | | (13.4 | ) |
Noncontrolling interest | | — | | — | | (3.3 | ) | (3.3 | ) |
Adjusted net income (loss) | | $ | 63.9 | | $ | 17.0 | | $ | (58.4 | ) | $ | 22.5 | |
| | | | | | | | | |
Adjusted diluted number of shares outstanding | | | | | | | | 407.7 | |
| | | | | | | | | |
Adjusted diluted earnings per share | | | | | | | | $ | 0.06 | |
| | Year Ended December 31, 2010 | |
| | | | | | Other | | | |
| | Car | | Equipment | | Reconciling | | | |
| | Rental | | Rental | | Items | | Total | |
Total revenues: | | $ | 6,486.2 | | $ | 1,070.1 | | $ | 6.2 | | $ | 7,562.5 | |
Expenses: | | | | | | | | | |
Direct operating and selling, general and administrative | | 4,058.6 | | 771.9 | | 116.4 | | 4,946.9 | |
Depreciation of revenue earning equipment and lease charges | | 1,594.6 | | 273.5 | | — | | 1,868.1 | |
Interest expense | | 401.3 | | 39.4 | | 332.7 | | 773.4 | |
Interest and other income, net | | (11.1 | ) | (0.1 | ) | (1.1 | ) | (12.3 | ) |
Total expenses | | 6,043.4 | | 1,084.7 | | 448.0 | | 7,576.1 | |
Income (loss) before income taxes | | 442.8 | | (14.6 | ) | (441.8 | ) | (13.6 | ) |
Adjustments: | | | | | | | | | |
Purchase accounting (a): | | | | | | | | | |
Direct operating and selling, general and administrative | | 37.0 | | 35.8 | | 3.2 | | 76.0 | |
Depreciation of revenue earning equipment | | — | | 14.3 | | — | | 14.3 | |
Non-cash debt charges (b) | | 133.3 | | 7.5 | | 41.8 | | 182.6 | |
Restructuring charges (c) | | 18.1 | | 34.7 | | 1.9 | | 54.7 | |
Restructuring related charges (c) | | 11.9 | | 0.3 | | 1.0 | | 13.2 | |
Derivative (gains) losses (c) | | (0.2 | ) | — | | 3.4 | | 3.2 | |
Acquisition related costs (d) | | — | | — | | 17.7 | | 17.7 | |
Adjusted pre-tax income (loss) | | 642.9 | | 78.0 | | (372.8 | ) | 348.1 | |
Assumed (provision) benefit for income taxes of 34% | | (218.6 | ) | (26.5 | ) | 126.8 | | (118.3 | ) |
Noncontrolling interest | | — | | — | | (17.4 | ) | (17.4 | ) |
Adjusted net income (loss) | | $ | 424.3 | | $ | 51.5 | | $ | (263.4 | ) | $ | 212.4 | |
| | | | | | | | | |
Adjusted diluted number of shares outstanding | | | | | | | | 410.0 | |
| | | | | | | | | |
Adjusted diluted earnings per share | | | | | | | | $ | 0.52 | |
| | Year Ended December 31, 2009 | |
| | | | | | Other | | | |
| | Car | | Equipment | | Reconciling | | | |
| | Rental | | Rental | | Items | | Total | |
Total revenues: | | $ | 5,979.0 | | $ | 1,110.9 | | $ | 11.6 | | $ | 7,101.5 | |
Expenses: | | | | | | | | | |
Direct operating and selling, general and administrative | | 3,873.2 | | 761.0 | | 91.1 | | 4,725.3 | |
Depreciation of revenue earning equipment and lease charges | | 1,614.2 | | 317.2 | | — | | 1,931.4 | |
Interest expense | | 316.1 | | 53.3 | | 310.9 | | 680.3 | |
Interest and other income, net | | (14.6 | ) | 0.1 | | (50.0 | ) | (64.5 | ) |
Total expenses | | 5,788.9 | | 1,131.6 | | 352.0 | | 7,272.5 | |
Income (loss) before income taxes | | 190.1 | | (20.7 | ) | (340.4 | ) | (171.0 | ) |
Adjustments: | | | | | | | | | |
Purchase accounting (a): | | | | | | | | | |
Direct operating and selling, general and administrative | | 38.2 | | 35.3 | | 2.5 | | 76.0 | |
Depreciation of revenue earning equipment | | — | | 14.3 | | — | | 14.3 | |
Non-cash debt charges (b) | | 131.7 | | 9.0 | | 31.2 | | 171.9 | |
Restructuring charges (c) | | 58.7 | | 38.2 | | 9.9 | | 106.8 | |
Restructuring related charges (c) | | 42.3 | | 0.3 | | 3.9 | | 46.5 | |
Derivative gains (c) | | — | | — | | (2.4 | ) | (2.4 | ) |
Third party bankruptcy reserve (e) | | 4.3 | | — | | — | | 4.3 | |
Management transition costs (e) | | — | | — | | 1.0 | | 1.0 | |
Gain on debt buyback (f) | | — | | — | | (48.5 | ) | (48.5 | ) |
Adjusted pre-tax income (loss) | | 465.3 | | 76.4 | | (342.8 | ) | 198.9 | |
Assumed (provision) benefit for income taxes of 34% | | (158.2 | ) | (26.0 | ) | 116.6 | | (67.6 | ) |
Noncontrolling interest | | — | | — | | (14.7 | ) | (14.7 | ) |
Adjusted net income (loss) | | $ | 307.1 | | $ | 50.4 | | $ | (240.9 | ) | $ | 116.6 | |
| | | | | | | | | |
Adjusted diluted number of shares outstanding | | | | | | | | 407.7 | |
| | | | | | | | | |
Adjusted diluted earnings per share | | | | | | | | $ | 0.29 | |
(a) Represents the purchase accounting effects of the acquisition of all of Hertz's common stock on December 21, 2005 on our results of operations relating to increased depreciation and amortization of tangible and intangible assets and accretion of workers' compensation and public liability and property damage liabilities. Also represents the purchase accounting effects of subsequent acquisitions on our results of operations relating to increased amortization of intangible assets.
(b) Represents non-cash debt charges relating to the amortization of deferred debt financing costs and debt discounts. For the three months ended December 31, 2010 and 2009, also includes $12.0 million and $22.4 million, respectively, associated with the amortization of amounts pertaining to the de-designation of our interest rate swaps as effective hedging instruments. For the year ended December 31, 2010 and 2009, also includes $68.9 million and $74.6 million, respectively, associated with the amortization of amounts pertaining to the de-designation of our interest rate swaps as effective hedging instruments.
(c) Amounts are included within direct operating and selling, general and administrative expense in our statement of operations.
(d) Represents costs incurred in connection with the Dollar Thrifty Automotive Group, Inc. transaction which has now been terminated. These costs are included within selling, general and administrative expense in our statement of operations.
(e) Amounts are included within selling, general and administrative expense in our statement of operations.
(f) Amount is included within interest and other income, net in our statement of operations.
Table 6
HERTZ GLOBAL HOLDINGS, INC.
RECONCILIATION OF GAAP TO NON-GAAP EARNINGS MEASURES
(In millions)
Unaudited
EBITDA, CORPORATE EBITDA, UNLEVERED PRE-TAX CASH FLOW, LEVERED AFTER-TAX CASH FLOW BEFORE FLEET GROWTH AND AFTER FLEET GROWTH
| | Three Months Ended December 31, 2010 | |
| | | | | | Other | | | |
| | Car | | Equipment | | Reconciling | | | |
| | Rental | | Rental | | Items | | Total | |
| | | | | | | | | |
Income (loss) before income taxes | | $ | 87.6 | | $ | 16.9 | | $ | (112.3 | ) | $ | (7.8 | ) |
Depreciation, amortization and other purchase accounting | | 419.6 | | 84.2 | | 2.3 | | 506.1 | |
Interest, net of interest income | | 98.6 | | 9.9 | | 91.0 | | 199.5 | |
Noncontrolling interest | | — | | — | | (4.5 | ) | (4.5 | ) |
EBITDA | | 605.8 | | 111.0 | | (23.5 | ) | 693.3 | |
Adjustments: | | | | | | | | | |
Car rental fleet interest | | (93.5 | ) | — | | — | | (93.5 | ) |
Car rental fleet depreciation | | (383.9 | ) | — | | — | | (383.9 | ) |
Non-cash expenses and charges (a) | | 27.8 | | 0.1 | | 6.6 | | 34.5 | |
Extraordinary, unusual or non-recurring gains and losses (b) | | 8.9 | | 3.5 | | 2.9 | | 15.3 | |
Corporate EBITDA | | $ | 165.1 | | $ | 114.6 | | $ | (14.0 | ) | 265.7 | |
Equipment rental maintenance capital expenditures, net | | | | | | | | (63.6 | ) |
Non-fleet capital expenditures, net | | | | | | | | (43.9 | ) |
Changes in working capital | | | | | | | | 7.5 | |
Changes in other assets and liabilities | | | | | | | | (93.0 | ) |
Unlevered pre-tax cash flow (c) | | | | | | | | 72.7 | |
Corporate net cash interest | | | | | | | | (93.7 | ) |
Corporate cash taxes | | | | | | | | (9.3 | ) |
Levered after-tax cash flow before fleet growth (c) | | | | | | | | (30.3 | ) |
Equipment rental fleet growth capital expenditures | | | | | | | | (26.0 | ) |
Car rental net fleet equity requirement | | | | | | | | 467.0 | |
Levered after-tax cash flow after fleet growth (c) | | | | | | | | $ | 410.7 | |
| | Three Months Ended December 31, 2009 | |
| | | | | | Other | | | |
| | Car | | Equipment | | Reconciling | | | |
| | Rental | | Rental | | Items | | Total | |
| | | | | | | | | |
Income (loss) before income taxes | | $ | 25.7 | | $ | 2.8 | | $ | (95.9 | ) | $ | (67.4 | ) |
Depreciation, amortization and other purchase accounting | | 431.1 | | 87.2 | | 1.9 | | 520.2 | |
Interest, net of interest income | | 80.2 | | 11.2 | | 78.8 | | 170.2 | |
Noncontrolling interest | | — | | — | | (3.3 | ) | (3.3 | ) |
EBITDA | | 537.0 | | 101.2 | | (18.5 | ) | 619.7 | |
Adjustments: | | | | | | | | | |
Car rental fleet interest | | (90.0 | ) | — | | — | | (90.0 | ) |
Car rental fleet depreciation | | (393.6 | ) | — | | — | | (393.6 | ) |
Non-cash expenses and charges (a) | | 40.6 | | 0.5 | | 9.3 | | 50.4 | |
Extraordinary, unusual or non-recurring gains and losses (b) | | 22.9 | | 9.3 | | 2.3 | | 34.5 | |
Corporate EBITDA | | $ | 116.9 | | $ | 111.0 | | $ | (6.9 | ) | 221.0 | |
Equipment rental maintenance capital expenditures, net | | | | | | | | (65.7 | ) |
Non-fleet capital expenditures, net | | | | | | | | (46.8 | ) |
Changes in working capital | | | | | | | | 30.4 | |
Changes in other assets and liabilities | | | | | | | | (106.6 | ) |
Unlevered pre-tax cash flow (c) | | | | | | | | 32.3 | |
Corporate net cash interest | | | | | | | | (66.9 | ) |
Corporate cash taxes | | | | | | | | (10.6 | ) |
Levered after-tax cash flow before fleet growth (c) | | | | | | | | (45.2 | ) |
Equipment rental fleet growth capital expenditures | | | | | | | | 58.2 | |
Car rental net fleet equity requirement | | | | | | | | (7.7 | ) |
Levered after-tax cash flow after fleet growth (c) | | | | | | | | $ | 5.3 | |
| | Year Ended December 31, 2010 | |
| | | | | | Other | | | |
| | Car | | Equipment | | Reconciling | | | |
| | Rental | | Rental | | Items | | Total | |
| | | | | | | | | |
Income (loss) before income taxes | | $ | 442.8 | | $ | (14.6 | ) | $ | (441.8 | ) | $ | (13.6 | ) |
Depreciation, amortization and other purchase accounting | | 1,740.9 | | 341.6 | | 9.8 | | 2,092.3 | |
Interest, net of interest income | | 390.2 | | 39.3 | | 331.6 | | 761.1 | |
Noncontrolling interest | | — | | — | | (17.4 | ) | (17.4 | ) |
EBITDA | | 2,573.9 | | 366.3 | | (117.8 | ) | 2,822.4 | |
Adjustments: | | | | | | | | | |
Car rental fleet interest | | (384.4 | ) | — | | — | | (384.4 | ) |
Car rental fleet depreciation | | (1,594.6 | ) | — | | — | | (1,594.6 | ) |
Non-cash expenses and charges (a) | | 135.0 | | 0.1 | | 37.2 | | 172.3 | |
Extraordinary, unusual or non-recurring gains and losses (b) | | 30.0 | | 35.0 | | 20.6 | | 85.6 | |
Corporate EBITDA | | $ | 759.9 | | $ | 401.4 | | $ | (60.0 | ) | 1,101.3 | |
Equipment rental maintenance capital expenditures, net | | | | | | | | (255.2 | ) |
Non-fleet capital expenditures, net | | | | | | | | (134.4 | ) |
Changes in working capital | | | | | | | | 360.4 | |
Changes in other assets and liabilities | | | | | | | | (280.2 | ) |
Unlevered pre-tax cash flow (c) | | | | | | | | 791.9 | |
Corporate net cash interest | | | | | | | | (319.4 | ) |
Corporate cash taxes | | | | | | | | (50.7 | ) |
Levered after-tax cash flow before fleet growth (c) | | | | | | | | 421.8 | |
Equipment rental fleet growth capital expenditures | | | | | | | | 114.3 | |
Car rental net fleet equity requirement | | | | | | | | (267.0 | ) |
Levered after-tax cash flow after fleet growth (c) | | | | | | | | $ | 269.1 | |
| | Year Ended December 31, 2009 | |
| | | | | | Other | | | |
| | Car | | Equipment | | Reconciling | | | |
| | Rental | | Rental | | Items | | Total | |
| | | | | | | | | |
Income (loss) before income taxes | | $ | 190.1 | | $ | (20.7 | ) | $ | (340.4 | ) | $ | (171.0 | ) |
Depreciation, amortization and other purchase accounting | | 1,766.3 | | 388.0 | | 8.1 | | 2,162.4 | |
Interest, net of interest income | | 301.5 | | 53.4 | | 309.4 | | 664.3 | |
Noncontrolling interest | | — | | — | | (14.7 | ) | (14.7 | ) |
EBITDA | | 2,257.9 | | 420.7 | | (37.6 | ) | 2,641.0 | |
Adjustments: | | | | | | | | | |
Car rental fleet interest | | (319.0 | ) | — | | — | | (319.0 | ) |
Car rental fleet depreciation | | (1,614.2 | ) | — | | — | | (1,614.2 | ) |
Non-cash expenses and charges (a) | | 130.1 | | — | | 36.9 | | 167.0 | |
Extraordinary, unusual or non-recurring gains and losses (b) | | 105.3 | | 38.5 | | (38.7 | ) | 105.1 | |
Corporate EBITDA | | $ | 560.1 | | $ | 459.2 | | $ | (39.4 | ) | 979.9 | |
Equipment rental maintenance capital expenditures, net | | | | | | | | (294.4 | ) |
Non-fleet capital expenditures, net | | | | | | | | (91.9 | ) |
Changes in working capital | | | | | | | | (241.0 | ) |
Changes in other assets and liabilities | | | | | | | | 238.8 | |
Unlevered pre-tax cash flow (c) | | | | | | | | 591.4 | |
Corporate net cash interest | | | | | | | | (296.7 | ) |
Corporate cash taxes | | | | | | | | (31.3 | ) |
Levered after-tax cash flow before fleet growth (c) | | | | | | | | 263.4 | |
Equipment rental fleet growth capital expenditures | | | | | | | | 343.4 | |
Car rental net fleet equity requirement | | | | | | | | (423.4 | ) |
Levered after-tax cash flow after fleet growth (c) | | | | | | | | $ | 183.4 | |
(a) | As defined in the credit agreements for the senior credit facilities, Corporate EBITDA excludes the impact of certain non-cash expenses and charges. The adjustments reflect the following: |
NON-CASH EXPENSES AND CHARGES
| | Three Months Ended December 31, 2010 | |
| | | | | | Other | | | |
| | Car | | Equipment | | Reconciling | | | |
| | Rental | | Rental | | Items | | Total | |
| | | | | | | | | |
Non-cash amortization of debt costs included in car rental fleet interest | | $ | 25.3 | | $ | — | | $ | — | | $ | 25.3 | |
Non-cash stock-based employee compensation charges | | 2.7 | | 0.1 | | 5.7 | | 8.5 | |
Derivative (gains) losses | | (0.2 | ) | — | | 0.9 | | 0.7 | |
Total non-cash expenses and charges | | $ | 27.8 | | $ | 0.1 | | $ | 6.6 | | $ | 34.5 | |
NON-CASH EXPENSES AND CHARGES
| | Three Months Ended December 31, 2009 | |
| | | | | | Other | | | |
| | Car | | Equipment | | Reconciling | | | |
| | Rental | | Rental | | Items | | Total | |
| | | | | | | | | |
Non-cash amortization of debt costs included in car rental fleet interest | | $ | 39.3 | | $ | — | | $ | — | | $ | 39.3 | |
Non-cash stock-based employee compensation charges | | — | | — | | 8.7 | | 8.7 | |
Non-cash charges for workers’ compensation | | 1.3 | | 0.5 | | — | | 1.8 | |
Derivative losses | | — | | — | | 0.6 | | 0.6 | |
Total non-cash expenses and charges | | $ | 40.6 | | $ | 0.5 | | $ | 9.3 | | $ | 50.4 | |
NON-CASH EXPENSES AND CHARGES
| | Year Ended December 31, 2010 | |
| | | | | | Other | | | |
| | Car | | Equipment | | Reconciling | | | |
| | Rental | | Rental | | Items | | Total | |
| | | | | | | | | | | | | |
Non-cash amortization of debt costs included in car rental fleet interest | | $ | 132.5 | | $ | — | | $ | — | | $ | 132.5 | |
Non-cash stock-based employee compensation charges | | 2.7 | | 0.1 | | 33.8 | | 36.6 | |
Derivative losses | | (0.2 | ) | — | | 3.4 | | 3.2 | |
Total non-cash expenses and charges | | $ | 135.0 | | $ | 0.1 | | $ | 37.2 | | $ | 172.3 | |
NON-CASH EXPENSES AND CHARGES
| | Year Ended December 31, 2009 | |
| | | | | | Other | | | |
| | Car | | Equipment | | Reconciling | | | |
| | Rental | | Rental | | Items | | Total | |
| | | | | | | | | |
Non-cash amortization of debt costs included in car rental fleet interest | | $ | 130.1 | | $ | — | | $ | — | | $ | 130.1 | |
Non-cash stock-based employee compensation charges | | — | | — | | 34.3 | | 34.3 | |
Derivative losses | | — | | — | | 2.6 | | 2.6 | |
Total non-cash expenses and charges | | $ | 130.1 | | $ | — | | $ | 36.9 | | $ | 167.0 | |
(b) As defined in the credit agreements for the senior credit facilities, Corporate EBITDA excludes the impact of extraordinary, unusual or non-recurring gains or losses or charges or credits. The adjustments reflect the following:
EXTRAORDINARY, UNUSUAL OR NON-RECURRING ITEMS
| | Three Months Ended December 31, 2010 | |
| | | | | | Other | | | |
| | Car | | Equipment | | Reconciling | | | |
| | Rental | | Rental | | Items | | Total | |
| | | | | | | | | |
Restructuring charges | | $ | 4.6 | | $ | 3.3 | | $ | 1.2 | | $ | 9.1 | |
Restructuring related charges | | 4.3 | | 0.2 | | 0.8 | | 5.3 | |
Acquisition related costs | | — | | — | | 0.9 | | 0.9 | |
Total extraordinary, unusual or non-recurring items | | $ | 8.9 | | $ | 3.5 | | $ | 2.9 | | $ | 15.3 | |
EXTRAORDINARY, UNUSUAL OR NON-RECURRING ITEMS
| | Three Months Ended December 31, 2009 | |
| | | | | | Other | | | |
| | Car | | Equipment | | Reconciling | | | |
| | Rental | | Rental | | Items | | Total | |
| | | | | | | | | |
Restructuring charges | | $ | 8.4 | | $ | 9.3 | | $ | 1.9 | | $ | 19.6 | |
Restructuring related charges | | 14.5 | | — | | 0.4 | | 14.9 | |
Total extraordinary, unusual or non-recurring items | | $ | 22.9 | | $ | 9.3 | | $ | 2.3 | | $ | 34.5 | |
EXTRAORDINARY, UNUSUAL OR NON-RECURRING ITEMS
| | Year Ended December 31, 2010 | |
| | | | | | Other | | | |
| | Car | | Equipment | | Reconciling | | | |
| | Rental | | Rental | | Items | | Total | |
| | | | | | | | | |
Restructuring charges | | $ | 18.1 | | $ | 34.7 | | $ | 1.9 | | $ | 54.7 | |
Restructuring related charges | | 11.9 | | 0.3 | | 1.0 | | 13.2 | |
Acquisition related costs | | — | | — | | 17.7 | | 17.7 | |
Total extraordinary, unusual or non-recurring items | | $ | 30.0 | | $ | 35.0 | | $ | 20.6 | | $ | 85.6 | |
EXTRAORDINARY, UNUSUAL OR NON-RECURRING ITEMS
| | Year Ended December 31, 2009 | |
| | | | | | Other | | | |
| | Car | | Equipment | | Reconciling | | | |
| | Rental | | Rental | | Items | | Total | |
| | | | | | | | | |
Restructuring charges | | $ | 58.7 | | $ | 38.2 | | $ | 9.9 | | $ | 106.8 | |
Restructuring related charges | | 42.3 | | 0.3 | | 3.9 | | 46.5 | |
Third-party bankruptcy reserve | | 4.3 | | — | | — | | 4.3 | |
Gain on debt buyback | | — | | — | | (48.5 | ) | (48.5 | ) |
Derivative gains | | — | | — | | (5.0 | ) | (5.0 | ) |
Management transition costs | | — | | — | | 1.0 | | 1.0 | |
Total extraordinary, unusual or non-recurring items | | $ | 105.3 | | $ | 38.5 | | $ | (38.7 | ) | $ | 105.1 | |
(c) Amounts include the effect of fluctuations in foreign currency.
Table 7
HERTZ GLOBAL HOLDINGS, INC.
RECONCILIATION OF GAAP TO NON-GAAP EARNINGS MEASURES
(In millions, except as noted)
Unaudited
RECONCILIATION FROM OPERATING CASH FLOWS TO EBITDA:
| | Three Months Ended | | Year Ended | |
| | December 31, | | December 31, | |
| | 2010 | | 2009 | | 2010 | | 2009 | |
| | | | | | | | | |
Net cash provided by operating activities | | $ | 479.1 | | $ | 498.6 | | $ | 2,208.7 | | $ | 1,693.3 | |
Amortization of debt costs | | (25.8 | ) | (28.3 | ) | (113.8 | ) | (97.3 | ) |
Gain on extinguishment of debt | | — | | — | | — | | 48.5 | |
Provision for losses on doubtful accounts | | (4.5 | ) | (5.5 | ) | (19.7 | ) | (28.0 | ) |
Derivative gains (losses) | | 5.6 | | 5.4 | | (10.8 | ) | 1.6 | |
Gain (loss) on sale of property and equipment | | 3.1 | | (0.1 | ) | 5.7 | | 1.1 | |
Amortization of cash flow hedges | | (12.0 | ) | (22.4 | ) | (68.9 | ) | (74.6 | ) |
Stock-based compensation charges | | (8.5 | ) | (8.9 | ) | (36.6 | ) | (35.5 | ) |
Asset writedowns | | (0.9 | ) | (9.6 | ) | (20.4 | ) | (36.1 | ) |
Lease charges | | 21.1 | | 17.7 | | 78.2 | | 81.7 | |
Noncontrolling interest | | (4.5 | ) | (3.3 | ) | (17.4 | ) | (14.7 | ) |
Deferred income taxes | | (3.5 | ) | (11.3 | ) | 26.1 | | (111.2 | ) |
Provision (benefit) for taxes on income | | 16.9 | | (39.8 | ) | 17.0 | | (59.7 | ) |
Interest expense, net of interest income | | 199.5 | | 170.2 | | 761.1 | | 664.3 | |
Changes in assets and liabilities | | 27.7 | | 57.0 | | 13.2 | | 607.6 | |
EBITDA | | $ | 693.3 | | $ | 619.7 | | $ | 2,822.4 | | $ | 2,641.0 | |
NET CORPORATE DEBT, NET FLEET DEBT AND TOTAL NET DEBT
| | December 31, | | September 30, | | December 31, | |
| | 2010 | | 2010 | | 2009 | |
| | | | | | | |
Corporate Debt | | | | | | | |
Debt, less: | | $ | 11,306.4 | | $ | 12,046.9 | | $ | 10,364.4 | |
U.S Fleet Debt and Pre-Acquisition Notes | | 3,644.9 | | 4,588.7 | | 4,058.3 | |
International facilities | | 1,587.7 | | 1,843.9 | | 1,413.9 | |
Fleet Financing Facility | | 162.7 | | 162.6 | | 147.2 | |
Canadian Fleet Financing Facility | | 80.4 | | 117.0 | | 55.6 | |
Fleet Debt | | $ | 5,475.7 | | $ | 6,712.2 | | $ | 5,675.0 | |
Corporate Debt | | $ | 5,830.7 | | $ | 5,334.7 | | $ | 4,689.4 | |
| | | | | | | |
Corporate Restricted Cash | | | | | | | |
Restricted Cash, less: | | $ | 207.6 | | $ | 739.6 | | $ | 365.2 | |
Restricted Cash Associated with Fleet Debt | | (115.6 | ) | (663.4 | ) | (295.0 | ) |
Corporate Restricted Cash | | $ | 92.0 | | $ | 76.2 | | $ | 70.2 | |
| | | | | | | |
Net Corporate Debt | | | | | | | |
Corporate Debt, less: | | $ | 5,830.7 | | $ | 5,334.7 | | $ | 4,689.4 | |
Cash and Cash Equivalents | | (2,374.2 | ) | (1,483.3 | ) | (985.6 | ) |
Corporate Restricted Cash | | (92.0 | ) | (76.2 | ) | (70.2 | ) |
Net Corporate Debt | | $ | 3,364.5 | | $ | 3,775.2 | | $ | 3,633.6 | |
| | | | | | | |
Net Fleet Debt | | | | | | | |
Fleet Debt, less: | | $ | 5,475.7 | | $ | 6,712.2 | | $ | 5,675.0 | |
Restricted Cash Associated with Fleet Debt | | (115.6 | ) | (663.4 | ) | (295.0 | ) |
Net Fleet Debt | | $ | 5,360.1 | | $ | 6,048.8 | | $ | 5,380.0 | |
| | | | | | | |
Total Net Debt | | $ | 8,724.6 | | $ | 9,824.0 | | $ | 9,013.6 | |
NET CORPORATE DEBT, NET FLEET DEBT AND TOTAL NET DEBT
| | September 30, | | December 31, | |
| | 2009 | | 2008 | |
| | | | | |
Corporate Debt | | | | | |
Debt, less: | | $ | 10,348.4 | | $ | 10,972.3 | |
U.S Fleet Debt and Pre-Acquisition Notes | | 3,546.2 | | 4,254.5 | |
International facilities | | 1,843.0 | | 1,871.4 | |
Fleet Financing Facility | | 144.6 | | 149.3 | |
Canadian Fleet Financing Facility | | 126.8 | | 111.6 | |
Fleet Debt | | $ | 5,660.6 | | $ | 6,386.8 | |
Corporate Debt | | $ | 4,687.8 | | $ | 4,585.5 | |
| | | | | |
Corporate Restricted Cash | | | | | |
Restricted Cash, less: | | $ | 404.7 | | $ | 731.4 | |
Restricted Cash Associated with Fleet Debt | | (282.5 | ) | (557.2 | ) |
Corporate Restricted Cash | | $ | 122.2 | | $ | 174.2 | |
| | | | | |
Net Corporate Debt | | | | | |
Corporate Debt, less: | | $ | 4,687.8 | | $ | 4,585.5 | |
Cash and Cash Equivalents | | (926.7 | ) | (594.3 | ) |
Corporate Restricted Cash | | (122.2 | ) | (174.2 | ) |
Net Corporate Debt | | $ | 3,638.9 | | $ | 3,817.0 | |
| | | | | |
Net Fleet Debt | | | | | |
Fleet Debt, less: | | $ | 5,660.6 | | $ | 6,386.8 | |
Restricted Cash Associated with Fleet Debt | | (282.5 | ) | (557.2 | ) |
Net Fleet Debt | | $ | 5,378.1 | | $ | 5,829.6 | |
| | | | | |
Total Net Debt | | $ | 9,017.0 | | $ | 9,646.6 | |
CAR RENTAL RATE REVENUE PER TRANSACTION DAY (a)
| | Three Months Ended | | Year Ended | |
| | December 31, | | December 31, | |
| | 2010 | | 2009 | | 2010 | | 2009 | |
| | | | | | | | | |
Car rental segment revenues (b) | | $ | 1,548.0 | | $ | 1,463.7 | | $ | 6,486.2 | | $ | 5,979.0 | |
Non-rental rate revenue | | (258.1 | ) | (226.8 | ) | (1,043.5 | ) | (905.2 | ) |
Foreign currency adjustment | | 7.3 | | (7.9 | ) | 121.5 | | 99.9 | |
Rental rate revenue | | $ | 1,297.2 | | $ | 1,229.0 | | $ | 5,564.2 | | $ | 5,173.7 | |
Transactions days (in thousands) | | 30,408 | | 28,534 | | 127,159 | | 118,459 | |
Rental rate revenue per transaction day (in whole dollars) | | $ | 42.66 | | $ | 43.07 | | $ | 43.76 | | $ | 43.68 | |
EQUIPMENT RENTAL AND RENTAL RELATED REVENUE (a)
| | Three Months Ended | | Year Ended | |
| | December 31, | | December 31, | |
| | 2010 | | 2009 | | 2010 | | 2009 | |
| | | | | | | | | |
Equipment rental segment revenues | | $ | 286.1 | | $ | 274.0 | | $ | 1,070.1 | | $ | 1,110.9 | |
Equipment sales and other revenue | | (25.2 | ) | (27.1 | ) | (100.1 | ) | (109.8 | ) |
Foreign currency adjustment | | (0.2 | ) | 0.1 | | 6.1 | | 20.7 | |
Rental and rental related revenue | | $ | 260.7 | | $ | 247.0 | | $ | 976.1 | | $ | 1,021.8 | |
(a) Based on 12/31/09 foreign exchange rates.
(b) Includes U.S. off-airport revenues of $262.9 million and $231.0 million for the three months ended December 31, 2010 and 2009, respectively, and $1,079.5 million and $953.1 million for the year ended December 31, 2010 and 2009, respectively.
Exhibit 1
Non-GAAP Measures: Definitions and Use/Importance
Hertz Global Holdings, Inc. (“Hertz Holdings”) is our top-level holding company. The Hertz Corporation (“Hertz”) is our primary operating company. The term “GAAP” refers to accounting principles generally accepted in the United States of America.
Definitions of non-GAAP measures utilized in Hertz Holdings’ February 22, 2011 Press Release are set forth below. Also set forth below is a summary of the reasons why management of Hertz Holdings and Hertz believes that the presentation of the non-GAAP financial measures included in the Press Release provide useful information regarding Hertz Holdings’ and Hertz’s financial condition and results of operations and additional purposes, if any, for which management of Hertz Holdings and Hertz utilize the non-GAAP measures.
1. Earnings Before Interest, Taxes, Depreciation and Amortization (“EBITDA”) and Corporate EBITDA
EBITDA is defined as net income before net interest expense, income taxes and depreciation (which includes revenue earning equipment lease charges) and amortization. Corporate EBITDA, as presented herein, represents EBITDA as adjusted for car rental fleet interest, car rental fleet depreciation and certain other items, as described in more detail in the accompanying tables.
Management uses EBITDA and Corporate EBITDA as operating performance and liquidity metrics for internal monitoring and planning purposes, including the preparation of our annual operating budget and monthly operating reviews, as well as to facilitate analysis of investment decisions, profitability and performance trends. Further, EBITDA enables management and investors to isolate the effects on profitability of operating metrics such as revenue, operating expenses and selling, general and administrative expenses, which enables management and investors to evaluate our two business segments that are financed differently and have different depreciation characteristics and compare our performance against companies with different capital structures and depreciation policies. We also present Corporate EBITDA as a supplemental measure because such information is utilized in the calculation of financial covenants under Hertz’s senior credit facilities.
EBITDA and Corporate EBITDA are not recognized measurements under GAAP. When evaluating our operating performance or liquidity, investors should not consider EBITDA and Corporate EBITDA in isolation of, or as a substitute for, measures of our financial performance and liquidity as determined in accordance with GAAP, such as net income, operating income or net cash provided by operating activities.
2. Adjusted Pre-Tax Income
Adjusted pre-tax income is calculated as income before income taxes plus non-cash purchase accounting charges, non-cash debt charges relating to the amortization of debt financing costs and debt discounts and certain one-time charges and non-operational items. Adjusted pre-tax income is important to management because it allows management to assess operational performance of our business, exclusive of the items mentioned above. It also allows management to assess the performance of the entire business on the same basis as the segment measure of profitability. Management believes that it is important to investors for the same reasons it is important to management and because it allows them to assess the operational performance of the Company on the same basis that management uses internally.
3. Adjusted Net Income
Adjusted net income is calculated as adjusted pre-tax income less a provision for income taxes derived utilizing a normalized income tax rate (34% in 2010 and 2009) and noncontrolling interest. The normalized income tax rate is management’s estimate of our long-term tax rate. Adjusted net income is important to management and investors because it represents our operational performance exclusive of the effects of purchase accounting, non-cash debt charges, one-time charges and items that are not operational in nature or comparable to those of our competitors.
4. Adjusted Diluted Earnings Per Share
Adjusted diluted earnings per share is calculated as adjusted net income divided by, for 2010, 410.0 million which represents the approximate number of shares outstanding at December 31, 2009, and for 2009, 407.7 million which represents the actual diluted weighted average number of shares outstanding for the year ended December 31, 2008 plus 85 million shares offered in the 2009 common stock offerings. Adjusted diluted earnings per share is important to management and investors because it represents a measure of our operational performance exclusive of the effects of purchase accounting adjustments, non-cash debt charges, one-time charges and items that are not operational in nature or comparable to those of our competitors.
5. Transaction Days
Transaction days represent the total number of days that vehicles were on rent in a given period.
6. Car Rental Rate Revenue, Rental Rate Revenue Per Transaction Day and Rental Rate Revenue Per Transaction
Car rental rate revenue consists of all revenue, net of discounts, associated with the rental of cars including charges for optional insurance products, but excluding revenue derived from fueling and concession and other expense pass-throughs, NeverLost units in the U.S. and certain ancillary revenue. Rental rate revenue per transaction day is calculated as total rental rate revenue, divided by the total number of transaction days, with all periods adjusted to eliminate the effect of fluctuations in foreign currency. Rental rate revenue per transaction is calculated as total rental rate revenue, divided by the total number of transactions, with all periods adjusted to eliminate the effects of fluctuations in foreign currency. Our management believes eliminating the effect of fluctuations in foreign currency is appropriate so as not to affect the comparability of underlying trends. These statistics a re important to management and investors as they represent the best measurements of the changes in underlying pricing in the car rental business and encompass the elements in car rental pricing that management has the ability to control. The optional insurance products are packaged within certain negotiated corporate, government and membership programs and within certain retail rates being charged. Based upon these existing programs and rate packages, management believes that these optional insurance products should be consistently included in the daily pricing of car rental transactions. On the other hand, non-rental rate revenue items such as refueling and concession pass-through expense items are driven by factors beyond the control of management (i.e. the price of fuel and the concession fees charged by airports). Additionally, NeverLost units are an optional revenue product which management does not consider to be part of their daily pricing of car rental transactions.
7. Equipment Rental and Rental Related Revenue
Equipment rental and rental related revenue consists of all revenue, net of discounts, associated with the rental of equipment including charges for delivery, loss damage waivers and fueling, but excluding revenue arising from the sale of equipment, parts and supplies and certain other ancillary revenue. Rental and rental related revenue is adjusted in all periods to eliminate the effect of fluctuations in foreign currency. Our management believes eliminating the effect of fluctuations in foreign currency is appropriate so as not to affect the comparability of underlying trends. This statistic is important to our management and to investors as it is utilized in the measurement of rental revenue generated per dollar invested in fleet on an annualized basis and is comparable with the reporting of other industry participants.
8. Same Store Revenue Growth/Decline
Same store revenue growth or decline is calculated as the year over year change in revenue for locations that are open at the end of the period reported and have been operating under our direction for more than twelve months. The same store revenue amounts are adjusted in all periods to eliminate the effect of fluctuations in foreign currency. Our management believes eliminating the effect of fluctuations in foreign currency is appropriate so as not to affect the comparability of underlying trends.
9. Unlevered Pre-Tax Cash Flow
Unlevered pre-tax cash flow is calculated as Corporate EBITDA less equipment rental fleet depreciation including gain (loss) on sale, non-fleet capital expenditures, net of non-fleet disposals, plus changes in working capital (accounts receivable, inventories, prepaid expenses, accounts payable and accrued liabilities), and changes in other assets and liabilities (including public liability and property damage, U.S. pension liability, other assets and liabilities, equity and noncontrolling interest). Unlevered pre-tax cash flow is important to management and investors as it represents funds available to pay corporate interest and taxes and to grow our fleet or reduce debt.
10. Levered After-Tax Cash Flow Before Fleet Growth
Levered after-tax cash flow before fleet growth is calculated as Unlevered Pre-Tax Cash Flow less corporate net cash interest and corporate cash taxes. Levered after-tax cash flow before fleet growth is important to management and investors as it represents the funds available to grow our fleet or reduce our debt.
11. Corporate Net Cash Interest (used in the calculation of Levered After-Tax Cash Flow Before Fleet Growth)
Corporate net cash interest represents total interest expense, net of total interest income, less car rental fleet interest expense, net of car rental fleet interest income, and non-cash corporate interest charges. Non-cash corporate interest charges represent the amortization of corporate debt financing costs and corporate debt discounts. Corporate net cash interest helps management and investors measure the ongoing costs of financing the business exclusive of the costs associated with the fleet financing.
12. Corporate Cash Taxes (used in the calculation of Levered After-Tax Cash Flow Before Fleet Growth)
Corporate cash taxes represents cash paid by the Company during the period for income taxes.
13. Levered After-Tax Cash Flow After Fleet Growth
Levered after-tax cash flow after fleet growth is calculated as Levered After-Tax Cash Flow Before Fleet Growth less equipment rental fleet growth capital expenditures, less gross car rental fleet growth capital expenditures, change in car rental fleet receivables and less the change in car rental fleet financing. Levered after-tax cash flow after fleet growth is important to management and investors as it represents the funds available for the reduction of corporate debt.
14. Net Corporate Debt
Net corporate debt is calculated as total debt excluding fleet debt less cash and equivalents and corporate restricted cash. Corporate debt consists of senior notes issued prior to the acquisition of all of Hertz’s common stock on December 21, 2005; borrowings under our Senior Term Facility; borrowings under our Senior ABL Facility; our Senior Notes; our Senior Subordinated Notes; our 5.25% Convertible Senior Notes; and certain other indebtedness of our domestic and foreign subsidiaries. Net Corporate Debt is important to management, investors and ratings agencies as it helps measure our leverage. Net Corporate Debt also assists in the evaluation of our ability to service our non-fleet-related debt without reference to the expense associated with the fleet debt, which is fully collateralized by assets not available to lenders under the non-fleet debt facilities.
15. Corporate Restricted Cash (used in the calculation of Net Corporate Debt)
Total restricted cash includes cash and cash equivalents that are not readily available for our normal disbursements. Total restricted cash and equivalents are restricted for the purchase of revenue earning vehicles and other specified uses under our Fleet Debt facilities, our like-kind exchange programs and to satisfy certain of our self insurance regulatory reserve requirements. Corporate restricted cash is calculated as total restricted cash less restricted cash associated with fleet debt.
16. Net Fleet Debt
Net fleet debt is calculated as total fleet debt less restricted cash associated with fleet debt. As of December 31, 2010, fleet debt consists of U.S. Fleet Variable Funding Notes, U.S. Fleet Medium Term Notes, U.S. Fleet Financing Facility, European Revolving Credit Facility, European Fleet Notes, European Securitization, Canadian Securitization, Australian Securitization and Capitalized Leases relating to revenue earning equipment. This measure is important to management, investors and ratings agencies as it helps measure our leverage.
17. Restricted Cash Associated with Fleet Debt (used in the calculation of Net Fleet Debt and Corporate Restricted Cash)
Restricted cash associated with fleet debt is restricted for the purchase of revenue earning vehicles and other specified uses under our Fleet Debt facilities and our car rental like-kind exchange program.
18. Total Net Debt
Total net debt is calculated as net corporate debt plus net fleet debt. This measure is important to management, investors and ratings agencies as it helps measure our leverage.