Exhibit 99.1

| 1Q 2013 Earnings Call April 30, 2013 10:00 am ET Dial in: (800) 288-8967 U.S. (612) 332-0530 International Passcode: 291985 Replay available until May 14: (800) 475-6701 U.S. (320) 365-3844 International passcode: 291985 Slide 12 corrected from 4/29/13 |

| Safe Harbor Statement Certain statements made within this presentation contain forward-looking statements, within the meaning of the Private Securities Litigation Reform Act of 1995. Forward-looking statements are not guarantees of performance and by their nature are subject to inherent uncertainties. Actual results may differ materially. Any forward-looking information relayed in this presentation speaks only as of April 29, 2013, and the Company undertakes no obligation to update that information to reflect changed circumstances. Additional information concerning these statements is contained in the Company’s press release regarding its First Quarter results issued on April 29, 2013, and the Risk Factors and Forward-Looking Statements sections of the Company’s 2012 Form 10-K and Quarterly Reports on Form 10-Q. Copies of these filings are available from the SEC, the Hertz web site or the Company’s Investor Relations Department. |
| Non-GAAP Measures Definitions and reconciliations of these non-GAAP measures are provided at the end of the presentation. The following non-GAAP measures will be used in the presentation: EBITDA Corporate EBITDA Adjusted Pre-Tax Income Adjusted Net Income Adjusted Diluted Earnings Per Share (Adjusted EPS) Net Corporate Debt Net Fleet Debt Total Net Debt Adjusted Interest Expense Adjusted Direct Operating Expense Adjusted Selling, General and Administrative Adjusted Depreciation of Revenue Earning Equipment Free Cash Flow |

| Overview Mark Frissora, Chairman and CEO Financial Performance Elyse Douglas, Executive VP and CFO 2013 Outlook Mark Frissora, Chairman and CEO Questions & Answers Session Today’s Agenda |
| Q1:13 Consolidated WW Revenue +24.3% YoY HERC Off Airport Donlen Dollar Thrifty Leisure Full quarter of Dollar Thrifty revenue U.S. rental car off-airport revenue 14% higher North American equipment rental revenue up 20%, excluding FX Donlen leasing and fleet management revenue increased 16% Double-digit Revenue Growth Drivers |
| Q1:13 Cost Savings Update Consolidated DOE and SG&A expense -180 bps as % revenue Consolidated fleet depreciation expense -210bps as % revenue Efficiency & cost management programs support profit growth $60M of cost savings achieved in Q1:13 Lean/Six Sigma locations represent ~42% of total revenue 26 consecutive quarter of YoY labor efficiency FY:13 cost savings goal $300 million (offsets inflation) Cost Savings Q1:13 +37% vs 2006 Based on rental revenue per employee Q1:13 Q1:13 includes DTG results |
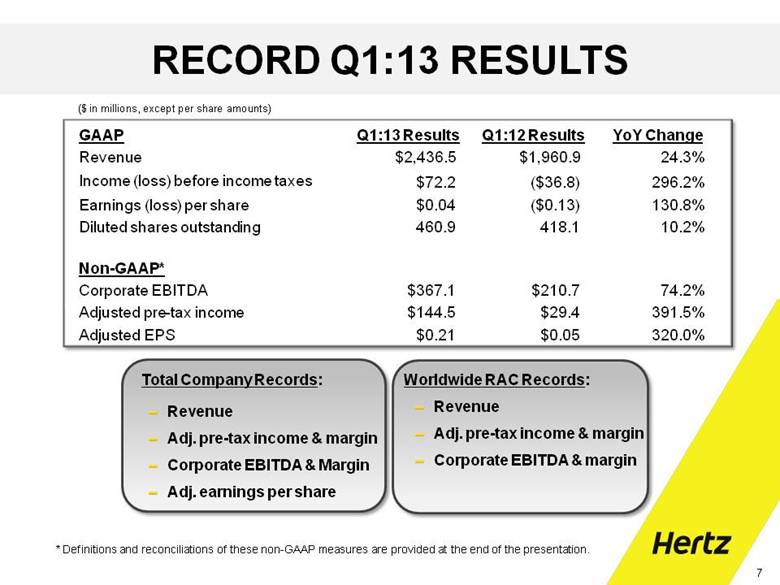
| C * Definitions and reconciliations of these non-GAAP measures are provided at the end of the presentation. GAAP Q1:13 Results Q1:12 Results YoY Change Revenue $2,436.5 $1,960.9 24.3% Income (loss) before income taxes $72.2 ($36.8) 296.2% Earnings (loss) per share $0.04 ($0.13) 130.8% Diluted shares outstanding 460.9 418.1 10.2% Non-GAAP* Corporate EBITDA $367.1 $210.7 74.2% Adjusted pre-tax income $144.5 $29.4 391.5% Adjusted EPS $0.21 $0.05 320.0% Total Company Records: Revenue Adj. pre-tax income & margin Corporate EBITDA & Margin Adj. earnings per share ($ in millions, except per share amounts) Worldwide RAC Records: Revenue Adj. pre-tax income & margin Corporate EBITDA & margin RECORD Q1:13 RESULTS |
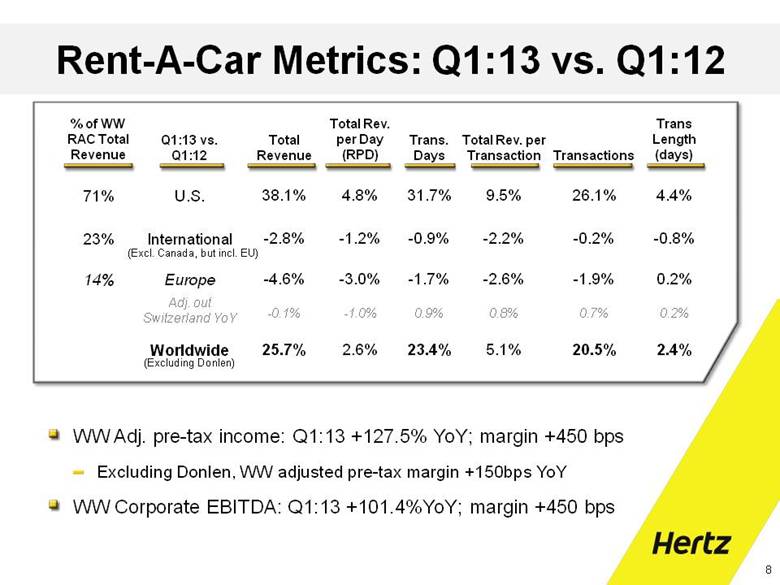
| % of WW RAC Total Revenue Q1:13 vs. Q1:12 Total Revenue Total Rev. per Day (RPD) Trans. Days Total Rev. per Transaction Transactions Trans Length (days) 71% U.S. 38.1% 4.8% 31.7% 9.5% 26.1% 4.4% 23% International -2.8% -1.2% -0.9% -2.2% -0.2% -0.8% 14% Europe -4.6% -3.0% -1.7% -2.6% -1.9% 0.2% Adj. out Switzerland YoY -0.1% -1.0% 0.9% 0.8% 0.7% 0.2% Worldwide 25.7% 2.6% 23.4% 5.1% 20.5% 2.4% (Excluding Donlen) (Excl. Canada, but incl. EU) Rent-A-Car Metrics: Q1:13 vs. Q1:12 WW Adj. pre-tax income: Q1:13 +127.5% YoY; margin +450 bps Excluding Donlen, WW adjusted pre-tax margin +150bps YoY WW Corporate EBITDA: Q1:13 +101.4%YoY; margin +450 bps |
| Rev. +$409.0 million Total Revenue ($ in millions) 77.8% 9.3% 12.9% % of total increase Airport Leisure** Off-Airport % Change in Total Revenue On-Airport 78.0% of U.S. RAC Revenue Off-Airport 22.0% of U.S. RAC Revenue RPD * $60.29 $47.60 $35.23 Trans Days -0.5% +397.0% +13.0% Rental length +1.8% -3.8% +4.6% U.S. RAC Growth Drivers Q1:13 vs. Q1:12 Leisure $318.1 Off Airport $38.2 Airport $52.7 * RPD calculated using Total Revenue ** Advantage & DTG Q1:13 U.S. RAC Total Revenue +38.1% YoY Note: DTG acquired Nov. 2012; Advantage RAC divested Dec. 2012 |
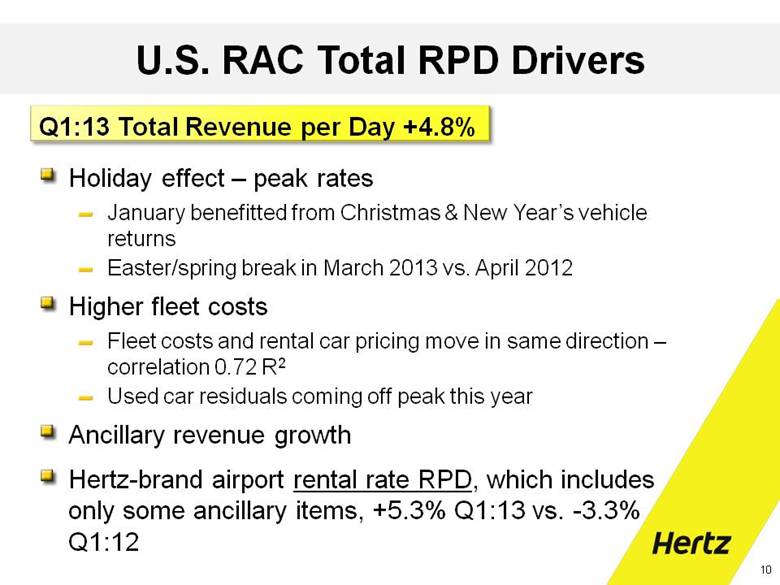
| U.S. RAC Total RPD Drivers Q1:13 Total Revenue per Day +4.8% Holiday effect – peak rates January benefitted from Christmas & New Year’s vehicle returns Easter/spring break in March 2013 vs. April 2012 Higher fleet costs Fleet costs and rental car pricing move in same direction – correlation 0.72 R2 Used car residuals coming off peak this year Ancillary revenue growth Hertz-brand airport rental rate RPD, which includes only some ancillary items, +5.3% Q1:13 vs. -3.3% Q1:12 |
| Fleet Efficiency Primarily Timing Issue Operating three separate fleets in Q1:13 In process of transferring Advantage fleet Added Dollar Thrifty fleet Hertz existing fleet Continue to work on fleet sharing synergies Higher level of retail car sales inventory also impacted utilization Units sold through retail lots were up 67% YoY |
| Q1:13 Depr./ Vehicle Improvement U.S. RAC Strategically increasing U.S. mix of risk vehicles to capitalize on more profitable resale channels % of Total Hertz Vehicle Sales Alternative Resale Channels Incremental Return vs. Auction HTZ Q1:13 Channel Mix Corrected for 2013E Resale Channel Mix from 4/29/13 |
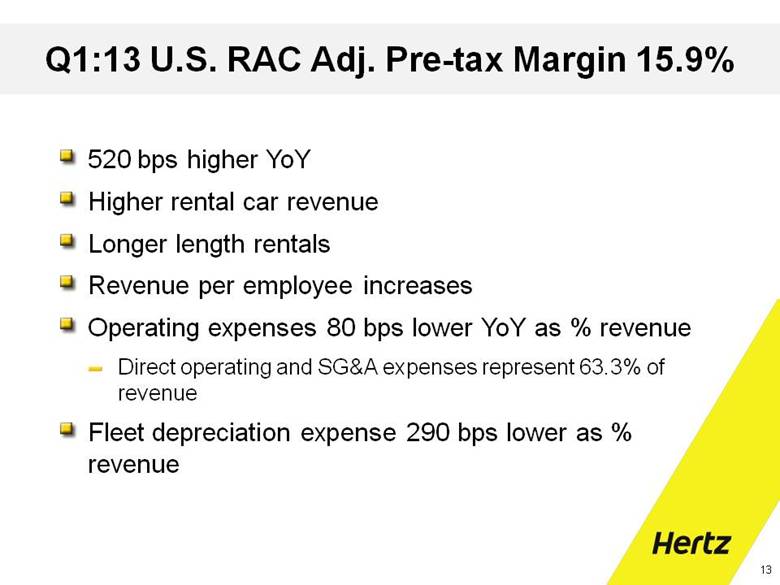
| Q1:13 U.S. RAC Adj. Pre-tax Margin 15.9% 520 bps higher YoY Higher rental car revenue Longer length rentals Revenue per employee increases Operating expenses 80 bps lower YoY as % revenue Direct operating and SG&A expenses represent 63.3% of revenue Fleet depreciation expense 290 bps lower as % revenue |
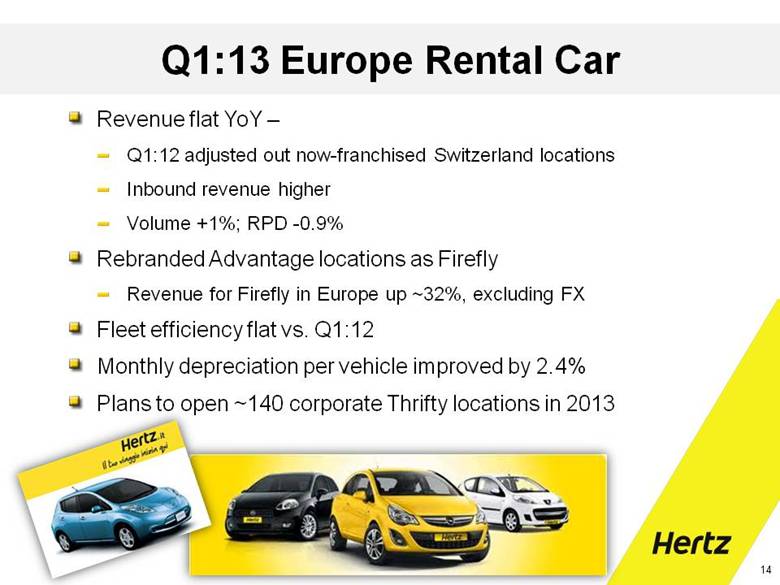
| Q1:13 Europe Rental Car Revenue flat YoY – Q1:12 adjusted out now-franchised Switzerland locations Inbound revenue higher Volume +1%; RPD -0.9% Rebranded Advantage locations as Firefly Revenue for Firefly in Europe up ~32%, excluding FX Fleet efficiency flat vs. Q1:12 Monthly depreciation per vehicle improved by 2.4% Plans to open ~140 corporate Thrifty locations in 2013 |

| Partnership with China’s Market Share Leader Provides broad coverage, brand exposure in emerging market China Auto Rental, domestic market leader in fast-growing $2.5B Chinese rental car market, 2.5x larger than any other domestic player 50,000-unit fleet is more than 4x the size of nearest competitor. Strong financial partners in Legend Holdings and Warburg Pincus Hertz stake ~20% fully diluted Equity method of accounting Commission earned on Hertz inbound referrals Complementary fit China Auto Rental -- 80% revenue domestic self drive, outbound China Hertz China -- 80% revenue inbound China, corporate, chauffeur drive Co-branded at ~300 full service locations across the country |
| Equipment Rental (HERC) Q1:13 N.A. time utilization +240bps with 12% more fleet N.A. dollar utilization +170bps N.A. Corporate EBITDA margin 32.3%; +420bps YoY Note: Pricing and volume data exclude Cinelease due to the nature of that business Pricing N.A. nat’l accounts 52% of revenue N.A. non-contract pricing +5.6% Volume Industrial (oil & gas), pump & power, entertainment svcs. and early stage construction recovery YoY % change Revenue Rental Revenue* Volume Pricing WWHERC 16.2% 17.6% 15.7% 3.6% N.A. 18.6% 20.0% 17.1% 3.9% U.S. 19.5% 19.5% 17.4% 4.1% N.A. Rev. Mix Q1:13 FY:07 Construction 37% 50% Industrial 28% 20% Fragmented 35% 30% * Excludes FX impact |

| HERC Key Metrics Using American Rental Association (ARA) calculations for: Pricing Fleet Age Time utilization Dollar utilization Updated historical metrics for proper YoY comparison Dollar utilization: lower for higher- cost equipment (earthmoving) impacted by level of refurbishments |

| Elyse Douglas CFO FINANCIAL RESULTS CASH FLOW REVIEW BALANCE SHEET REVIEW |
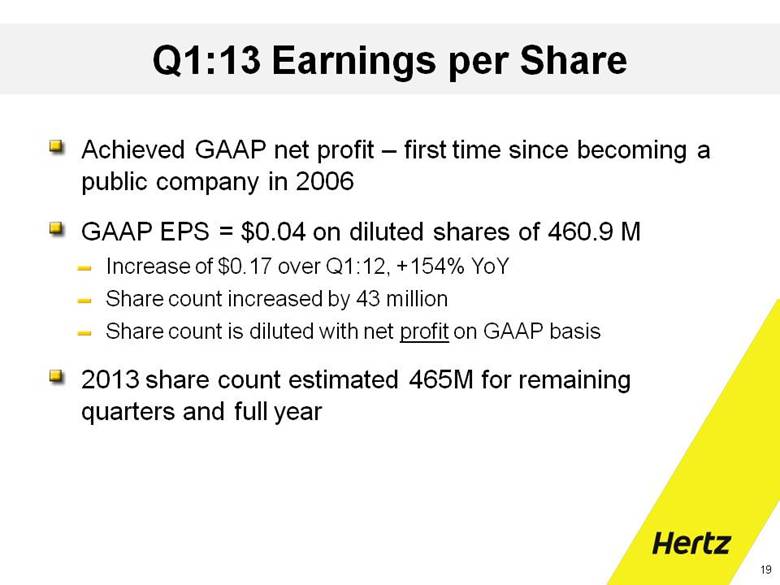
| Q1:13 Earnings per Share Achieved GAAP net profit – first time since becoming a public company in 2006 GAAP EPS = $0.04 on diluted shares of 460.9 M Increase of $0.17 over Q1:12, +154% YoY Share count increased by 43 million Share count is diluted with net profit on GAAP basis 2013 share count estimated 465M for remaining quarters and full year |
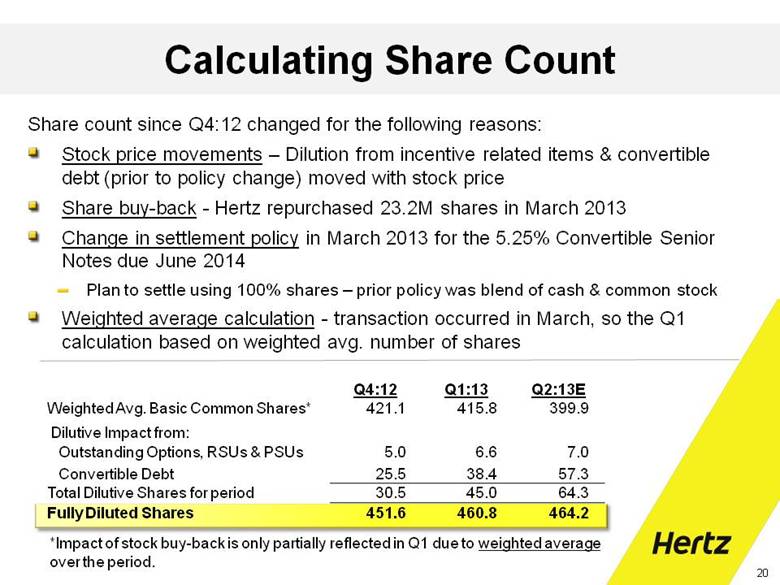
| Calculating Share Count Q4:12 Q1:13 Q2:13E Weighted Avg. Basic Common Shares* 421.1 415.8 399.9 Dilutive Impact from: Outstanding Options, RSUs & PSUs 5.0 6.6 7.0 Convertible Debt 25.5 38.4 57.3 Total Dilutive Shares for period 30.5 45.0 64.3 Fully Diluted Shares 451.6 460.8 464.2 Share count since Q4:12 changed for the following reasons: Stock price movements – Dilution from incentive related items & convertible debt (prior to policy change) moved with stock price Share buy-back - Hertz repurchased 23.2M shares in March 2013 Change in settlement policy in March 2013 for the 5.25% Convertible Senior Notes due June 2014 Plan to settle using 100% shares – prior policy was blend of cash & common stock Weighted average calculation - transaction occurred in March, so the Q1 calculation based on weighted avg. number of shares *Impact of stock buy-back is only partially reflected in Q1 due to weighted average over the period. |
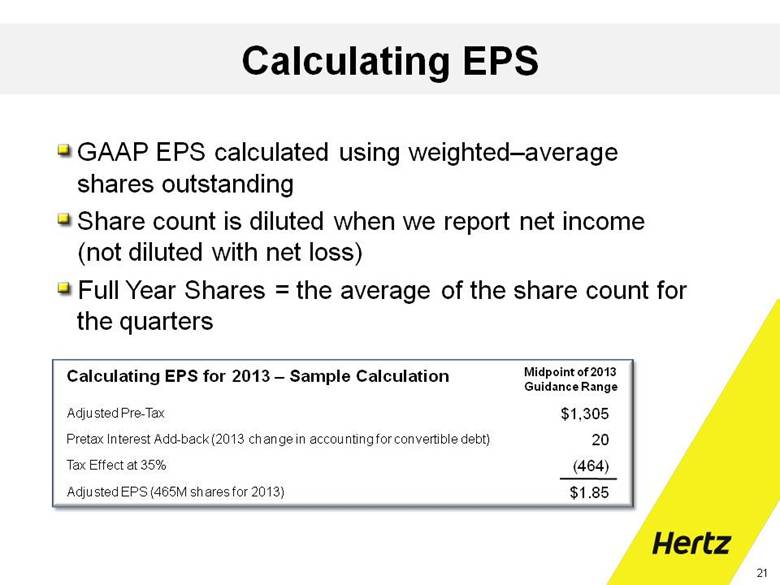
| Calculating EPS Calculating EPS for 2013 – Sample Calculation Midpoint of 2013 Guidance Range Adjusted Pre-Tax $1,305 Pretax Interest Add-back (2013 change in accounting for convertible debt) 20 Tax Effect at 35% (464) Adjusted EPS (465M shares for 2013) $1.85 GAAP EPS calculated using weighted–average shares outstanding Share count is diluted when we report net income (not diluted with net loss) Full Year Shares = the average of the share count for the quarters |
| Interest Expense Summary 2013E: Cash interest expense expected to increase ~$100-120M (Related to acquisition financing and fleet growth) 2013 2012 Q1 $176.8M $162.3M 2013 2012 Q1 $159.5M $137.1M Improved 100bps as % of Rev Incr. $22.4 Million as expected Reflects additional corporate and fleet debt from Dollar Thrifty acquisition GAAP Interest Expense Cash Interest Expense |
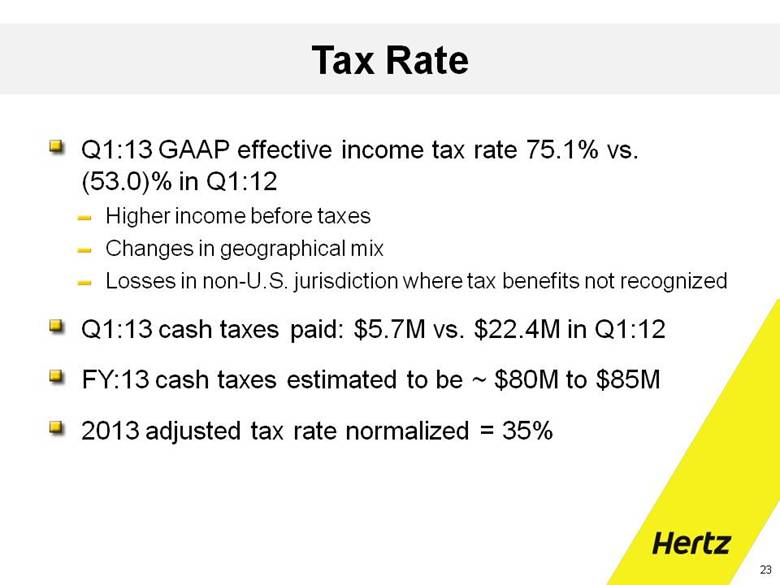
| Tax Rate Q1:13 GAAP effective income tax rate 75.1% vs. (53.0)% in Q1:12 Higher income before taxes Changes in geographical mix Losses in non-U.S. jurisdiction where tax benefits not recognized Q1:13 cash taxes paid: $5.7M vs. $22.4M in Q1:12 FY:13 cash taxes estimated to be ~ $80M to $85M 2013 adjusted tax rate normalized = 35% |
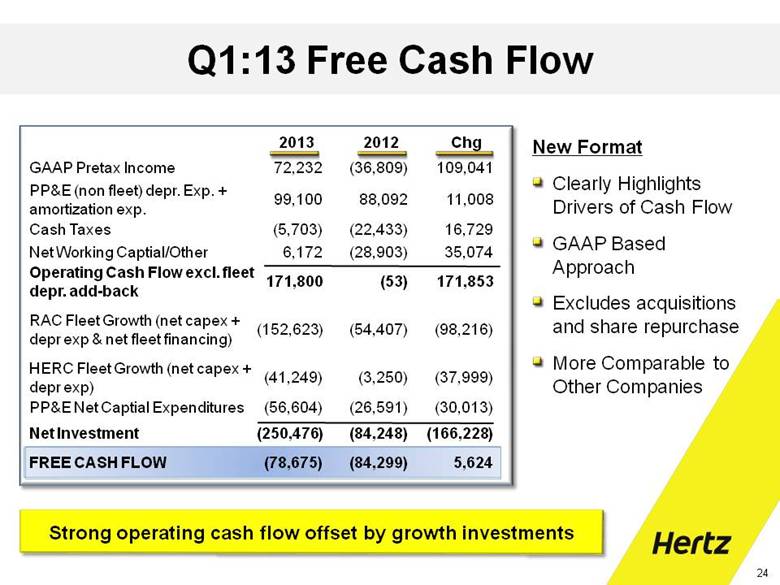
| Q1:13 Free Cash Flow New Format Clearly Highlights Drivers of Cash Flow GAAP Based Approach Excludes acquisitions and share repurchase More Comparable to Other Companies Strong operating cash flow offset by growth investments 2013 2012 Chg GAAP Pretax Income 72,232 (36,809) 109,041 PP&E (non fleet) depr. Exp. + amortization exp. 99,100 88,092 11,008 Cash Taxes (5,703) (22,433) 16,729 Net Working Captial/Other 6,172 (28,903) 35,074 Operating Cash Flow excl. fleet depr. add-back 171,800 (53) 171,853 RAC Fleet Growth (net capex + depr exp & net fleet financing) (152,623) (54,407) (98,216) HERC Fleet Growth (net capex + depr exp) (41,249) (3,250) (37,999) PP&E Net Captial Expenditures (56,604) (26,591) (30,013) Net Investment (250,476) (84,248) (166,228) FREE CASH FLOW (78,675) (84,299) 5,624 |
| ($ in millions) WW HERC Fleet – Cash Basis ** ($ in millions), excl. FX Q1:13 Q1:12 Fleet Expenditures $154.2 $124.0 Disposal Proceeds $39.0 $58.3 Net Capital Exp. $115.2 $65.7 ** Above amounts are on a cash flow basis, consistent with our GAAP statement of cash flows. Purchases* Disposals 1st Cost* Net Fleet Capital Expenditures* * Includes non-cash purchases and sales. Q1:13 average WW fleet age 42 months vs. 47 months in Q1:12 Q1:13 WWHERC Fleet Statistics |
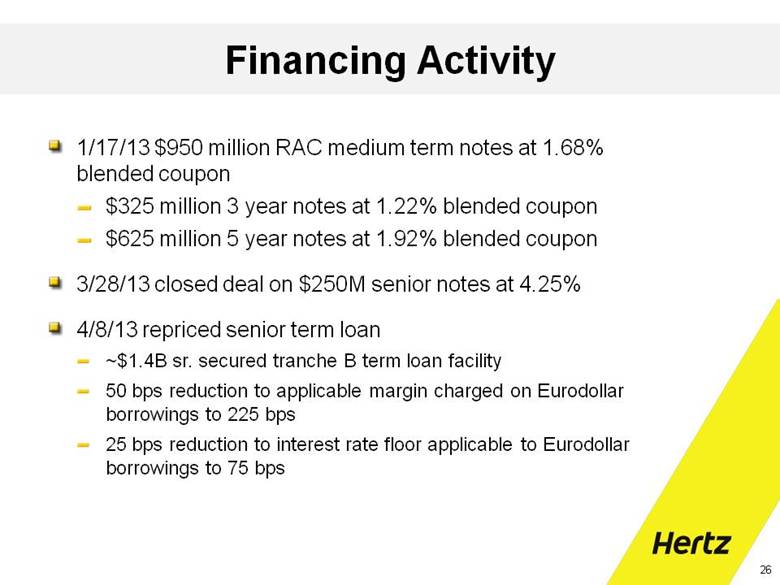
| Financing Activity 1/17/13 $950 million RAC medium term notes at 1.68% blended coupon $325 million 3 year notes at 1.22% blended coupon $625 million 5 year notes at 1.92% blended coupon 3/28/13 closed deal on $250M senior notes at 4.25% 4/8/13 repriced senior term loan ~$1.4B sr. secured tranche B term loan facility 50 bps reduction to applicable margin charged on Eurodollar borrowings to 225 bps 25 bps reduction to interest rate floor applicable to Eurodollar borrowings to 75 bps |

| Liquidity & Debt Corporate Liquidity @ 3/31/13 ($ in millions) ABL Availability: $751 Unrestricted Cash: 654 Corporate Liquidity: $1,405 Total net corporate debt $6.5 billion Total net fleet debt $8.7 billion Net corporate debt / corporate EBITDA ratio 3.6x With DTG full year EBITDA, pro forma ratio 3.3x With full run-rate synergies and DTG full year EBITDA, pro forma ratio would be 2.8x* *Assumes $300M of cost synergies |

| OUTLOOK |
| Q1:13 Performance Better Than Expected Dollar Thrifty integration synergies tracking ahead of plan 26 consecutive YoY quarterly increase in employee productivity Installed car-sharing technology in ~25,000 vehicles globally Current installed base gives Hertz the largest car sharing fleet in the world, by a significant margin Goal = 80,000 telematics packages installed by year end Opened both off-airport and equipment rental facilities to address the higher volumes Beginning of growth in Europe |
| Looking ahead... Fleet costs -- Q2:13 & Q3:13 more difficult YoY comps Recorded gains on depreciation adjustments last year FY:13 still expecting U.S. monthly depr. per vehicle to be down 4-5% U.S. -- April soft in volume and pricing for RAC & HERC One less rental day YoY due to Leap year comparison Easter shift into Q1:13 vs. Q2:12 Sequester – government and corporate accounts w/gov’t exposure Industry seasonally overfleeted (temporary), as we begin to fleet up for summer peak Believe conditions still positive for 2013 pricing Lower residual drive fleet costs higher Higher fleet costs drive pricing higher: 0.72 R2 correlation |
| Guidance % high end YoY Revenue $10.85 to $10.95 bil +21.4% Corporate EBITDA $2.21 to $2.27 bil +38.8% Adj. Pre-Tax Income $1.27 to $1.34 bil +48.6% Adj. Net Income $830 to $875 mil +47.1% Adjusted Diluted EPS Share count FY:13 = 465 mil $1.82 to $1.92 +44.9% RISKS: EU/China economies, U.S. sequester FY:13 Financial Guidance Reaffirmed Cost savings target of $300M to offset inflation (incl. depreciation savings) Higher tax rate of 35% Cash interest expense ~$100-120M higher YoY |
| FY:13 Assumptions WW RAC HERC Total + 1% Transaction Days / Volume $26 $4 $30 + 1% Total RPD / Pricing $67 $12 $79 + 1 PP Fleet utilization $26 $6 $32 + 1% Net Depreciation Expense $18 $3 $21 + 1% Direct OpEx / SG&A $52 $10 $62 + 1% Residual Values (U.S. RAC only) $23 - $23 ($ in millions) Adjusted Pre-tax Sensitivity to Incremental 1% Change Worldwide rental car pricing flat on 21-23% higher volume Equipment rental pricing +2-3% with volume +10-12% U.S. RAC monthly depreciation per unit est. down 4-5% EU RAC monthly depreciation per unit est. down 2% Note: The sensitivity reflects any incremental change from our stated guidance |

| Q & A |

| APPENDIX |
| Calculating Share Count *Impact of stock buy-back is only partially reflected in Q1 due to weighted average over the period. Q1 2013 Wght Avg for Qtr Q1 % wght Q2 2013 Wght Avg for Qtr Q2 % wght Basic Common Shares Opening Bal 1/1/13 420.9 421.6 421.6 399.9 399.9 March 8, 2013 Share buyback (23.2) (6.2) 26.7% Assumes no significant Share issuances during quarter 0.7 1.5 0.4 common share activity in Q2 (ESPP,RSU/option conversions, etc.) Closing Bal 3/31/13 421.6 399.9 399.9 Wght. Avg. Basic Shares O/S 421.3 415.8 399.9 Wght Avg for Qtr Q1 % wght Wght Avg for Qtr Q2 % wght Dilutive Shares O/S Options,PSUs,RSUs 5.0 6.6 7.0 Estimated Conv. Debt impact 1/1/13 - 3/8/13 25.5 31.6 23.1 73.3% Policy change from 3/8/13 to 3/31/13 57.3 15.3 26.7% 57.3 57.3 100.0% Wght. Avg. Dilutive Share Impact 30.5 45.0 64.3 Wght. Avg. Fully Dilutive Shares O/S 451.8 460.9 464.2 Q4 2012 |
Table 1
HERTZ GLOBAL HOLDINGS, INC.
CONDENSED CONSOLIDATED STATEMENTS OF OPERATIONS
(In millions, except per share amounts)
Unaudited
| | Three Months Ended | | As a Percentage | |
| | March 31, | | of Total Revenues | |
| | 2013 | | 2012 | | 2013 | | 2012 | |
Total revenues | | $ | 2,436.5 | | $ | 1,960.9 | | 100.0 | % | 100.0 | % |
| | | | | | | | | |
Expenses: | | | | | | | | | |
Direct operating | | 1,351.2 | | 1,114.1 | | 55.4 | % | 56.8 | % |
Depreciation of revenue earning equipment and lease charges | | 587.0 | | 515.1 | | 24.1 | % | 26.3 | % |
Selling, general and administrative | | 251.7 | | 207.8 | | 10.3 | % | 10.6 | % |
Interest expense | | 176.8 | | 162.3 | | 7.3 | % | 8.3 | % |
Interest income | | (1.8 | ) | (1.1 | ) | (0.1 | )% | (0.1 | )% |
Other income, net | | (0.6 | ) | (0.5 | ) | — | % | — | % |
Total expenses | | 2,364.3 | | 1,997.7 | | 97.0 | % | 101.9 | % |
Income (loss) before income taxes | | 72.2 | | (36.8 | ) | 3.0 | % | (1.9 | )% |
Provision for taxes on income | | (54.2 | ) | (19.5 | ) | (2.2 | )% | (1.0 | )% |
Net income (loss) attributable to Hertz Global Holdings, Inc. and Subsidiaries’ common stockholders | | $ | 18.0 | | $ | (56.3 | ) | 0.8 | % | (2.9 | )% |
| | | | | | | | | |
Weighted average number of shares outstanding: | | | | | | | | | |
Basic | | 415.8 | | 418.1 | | | | | |
Diluted | | 460.9 | | 418.1 | | | | | |
| | | | | | | | | |
Earnings (loss) per share attributable to Hertz Global Holdings, Inc. and Subsidiaries’ common stockholders: | | | | | | | | | |
Basic | | $ | 0.04 | | $ | (0.13 | ) | | | | |
Diluted | | $ | 0.04 | | $ | (0.13 | ) | | | | |
Table 2
HERTZ GLOBAL HOLDINGS, INC.
CONDENSED CONSOLIDATED STATEMENTS OF OPERATIONS
(In millions)
Unaudited
| | Three Months Ended March 31, 2013 | | Three Months Ended March 31, 2012 | |
| | As | | | | As | | As | | | | As | |
| | Reported | | Adjustments | | Adjusted | | Reported | | Adjustments | | Adjusted | |
Total revenues | | $ | 2,436.5 | | $ | — | | $ | 2,436.5 | | $ | 1,960.9 | | $ | — | | $ | 1,960.9 | |
| | | | | | | | | | | | | |
Expenses: | | | | | | | | | | | | | |
Direct operating | | 1,351.2 | | (35.4 | )(a) | 1,315.8 | | 1,114.1 | | (28.7 | )(a) | 1,085.4 | |
Depreciation of revenue earning equipment and lease charges | | 587.0 | | (3.6 | )(b) | 583.4 | | 515.1 | | (2.9 | )(b) | 512.2 | |
Selling, general and administrative | | 251.7 | | (16.0 | )(c) | 235.7 | | 207.8 | | (9.4 | )(c) | 198.4 | |
Interest expense | | 176.8 | | (17.3 | )(d) | 159.5 | | 162.3 | | (25.2 | )(d) | 137.1 | |
Interest income | | (1.8 | ) | — | | (1.8 | ) | (1.1 | ) | — | | (1.1 | ) |
Other income, net | | (0.6 | ) | — | | (0.6 | ) | (0.5 | ) | — | | (0.5 | ) |
Total expenses | | 2,364.3 | | (72.3 | ) | 2,292.0 | | 1,997.7 | | (66.2 | ) | 1,931.5 | |
Income (loss) before income taxes | | 72.2 | | 72.3 | | 144.5 | | (36.8 | ) | 66.2 | | 29.4 | |
Benefit (provision) for taxes on income | | (54.2 | ) | 3.6 | (e) | (50.6 | ) | (19.5 | ) | 9.5 | (e) | (10.0 | ) |
Net income (loss) attributable to Hertz Global Holdings, Inc. and Subsidiaries’ common stockholders | | $ | 18.0 | | $ | 75.9 | | $ | 93.9 | | $ | (56.3 | ) | $ | 75.7 | | $ | 19.4 | |
(a) Represents the increase in amortization of other intangible assets, depreciation of property and equipment and accretion of certain revalued liabilities relating to purchase accounting. For the three months ended March 31, 2013 and 2012, also includes restructuring and restructuring related charges of $2.5 million and $8.1 million, respectively.
(b) Represents the increase in depreciation of equipment rental revenue earning equipment based upon its revaluation relating to purchase accounting.
(c) Represents an increase in depreciation of property and equipment relating to purchase accounting. For the three months ended March 31, 2013 and 2012, also includes restructuring and restructuring related charges of $3.9 million and $1.9 million, respectively. For all periods presented, also includes other adjustments which are detailed in Table 5.
(d) Represents non-cash debt charges relating to the amortization of deferred debt financing costs and debt discounts.
(e) Represents a provision for income taxes derived utilizing a normalized income tax rate (35% for 2013 and 34% for 2012).
Table 3
HERTZ GLOBAL HOLDINGS, INC.
SEGMENT AND OTHER INFORMATION
(In millions, except per share amounts)
Unaudited
| | Three Months Ended | |
| | March 31, | |
| | 2013 | | 2012 | |
Revenues: | | | | | |
Car Rental | | $ | 2,084.8 | | $ | 1,658.2 | |
Equipment Rental | | 351.0 | | 302.1 | |
Other reconciling items | | 0.7 | | 0.6 | |
| | $ | 2,436.5 | | $ | 1,960.9 | |
| | | | | |
Depreciation of property and equipment: | | | | | |
Car Rental | | $ | 40.3 | | $ | 30.8 | |
Equipment Rental | | 8.5 | | 8.4 | |
Other reconciling items | | 2.5 | | 3.1 | |
| | $ | 51.3 | | $ | 42.3 | |
| | | | | |
Amortization of other intangible assets: | | | | | |
Car Rental | | $ | 19.5 | | $ | 9.3 | |
Equipment Rental | | 10.5 | | 9.5 | |
Other reconciling items | | 0.5 | | 0.4 | |
| | $ | 30.5 | | $ | 19.2 | |
| | | | | |
Income (loss) before income taxes: | | | | | |
Car Rental | | $ | 169.6 | | $ | 61.5 | |
Equipment Rental | | 32.1 | | 10.2 | |
Other reconciling items | | (129.5 | ) | (108.5 | ) |
| | $ | 72.2 | | $ | (36.8 | ) |
| | | | | |
Corporate EBITDA (a): | | | | | |
Car Rental | | $ | 250.2 | | $ | 124.2 | |
Equipment Rental | | 139.0 | | 108.3 | |
Other reconciling items | | (22.1 | ) | (21.8 | ) |
| | $ | 367.1 | | $ | 210.7 | |
| | | | | |
Adjusted pre-tax income (loss) (a): | | | | | |
Car Rental | | $ | 208.4 | | $ | 91.6 | |
Equipment Rental | | 45.8 | | 25.9 | |
Other reconciling items | | (109.7 | ) | (88.1 | ) |
| | $ | 144.5 | | $ | 29.4 | |
| | | | | |
Adjusted net income (loss) (a): | | | | | |
Car Rental | | $ | 135.4 | | $ | 60.4 | |
Equipment Rental | | 28.9 | | 17.1 | |
Other reconciling items | | (70.3 | ) | (58.1 | ) |
| | $ | 93.9 | | $ | 19.4 | |
| | | | | |
Adjusted diluted number of shares outstanding (a) | | 460.9 | | 418.1 | |
| | | | | |
Adjusted diluted earnings per share (a) | | $ | 0.21 | | $ | 0.05 | |
(a) Represents a non-GAAP measure, see the accompanying reconciliations and definitions.
Note: “Other Reconciling Items” includes general corporate expenses, certain interest expense (including net interest on corporate debt), as well as other business activities such as our third-party claim management services. See Tables 5 and 6.
Table 4
HERTZ GLOBAL HOLDINGS, INC.
SELECTED OPERATING AND FINANCIAL DATA
Unaudited
| | Three | | Percent | |
| | Months | | change | |
| | Ended, or as | | from | |
| | of Mar. 31, | | prior year | |
| | 2013 | | period | |
| | | | | |
Selected Car Rental Operating Data | | | | | |
| | | | | |
Worldwide number of transactions (in thousands) | | 7,694 | | 20.4 | % |
Domestic (Hertz, Dollar and Thrifty) | | 6,100 | | 26.1 | % |
International (Hertz, Dollar and Thrifty) | | 1,594 | | 2.8 | % |
| | | | | |
Worldwide transaction days (in thousands) | | 39,070 | | 23.4 | % |
Domestic (Hertz, Dollar and Thrifty) | | 30,064 | | 31.7 | % |
International (Hertz, Dollar and Thrifty) | | 9,006 | | 1.8 | % |
| | | | | |
Worldwide total rental revenue per transaction day (a) | | $ | 50.14 | | 2.6 | % |
Domestic (Hertz, Dollar and Thrifty) | | $ | 49.35 | | 4.8 | % |
International (Hertz, Dollar and Thrifty) (b) | | $ | 52.76 | | (1.2 | )% |
| | | | | |
Worldwide average number of cars during period | | 757,100 | | 27.2 | % |
Domestic (Hertz company-operated) | | 432,900 | | 33.9 | % |
Domestic (Leased) | | 24,800 | | N/A | |
International (Hertz company-operated) | | 137,500 | | 3.2 | % |
Donlen (under lease and maintenance) | | 165,600 | | N/A | |
| | | | | |
Worldwide revenue earning equipment, net (in millions) | | $ | 11,699.7 | | 25.1 | % |
| | | | | |
Selected Worldwide Equipment Rental Operating Data | | | | | |
| | | | | |
Rental and rental related revenue (in millions) (a) (b) | | $ | 322.1 | | 17.4 | % |
Same store revenue growth , including initiatives (a) (b) | | 12.9 | % | N/M | |
Average acquisition cost of revenue earning equipment operated during period (in millions) | | $ | 3,273.5 | | 12.8 | % |
Worldwide revenue earning equipment, net (in millions) | | $ | 2,269.5 | | 18.8 | % |
| | | | | |
Other Financial Data (in millions) | | | | | |
| | | | | |
Cash flows provided by operating activities | | $ | 743.6 | | 51.1 | % |
Free cash flow (a) | | (78.7 | ) | 6.8 | % |
EBITDA (a) | | 916.3 | | 30.4 | % |
Corporate EBITDA (a) | | 367.1 | | 74.2 | % |
Selected Balance Sheet Data (in millions)
| | March 31, | | December 31, | |
| | 2013 | | 2012 | |
Cash and cash equivalents | | $ | 653.8 | | $ | 533.3 | |
Total revenue earning equipment, net | | 13,969.2 | | 12,908.3 | |
Total assets | | 24,076.2 | | 23,286.0 | |
Total debt | | 16,317.0 | | 15,448.6 | |
Net corporate debt (a) | | 6,528.5 | | 5,934.4 | |
Net fleet debt (a) | | 8,709.5 | | 8,409.3 | |
Total net debt (a) | | 15,238.0 | | 14,343.7 | |
Total equity | | 2,037.2 | | 2,507.3 | |
| | | | | | | |
(a) Represents a non-GAAP measure, see the accompanying reconciliations and definitions.
(b) Based on 12/31/12 foreign exchange rates.
N/M Percentage change not meaningful.
Table 5
HERTZ GLOBAL HOLDINGS, INC.
RECONCILIATION OF GAAP TO NON-GAAP EARNINGS MEASURES
(In millions, except per share amounts)
Unaudited
ADJUSTED PRE-TAX INCOME (LOSS), ADJUSTED NET INCOME (LOSS) AND
ADJUSTED DILUTED EARNINGS PER SHARE
| | Three Months Ended March 31, 2013 | |
| | | | | | Other | | | |
| | Car | | Equipment | | Reconciling | | | |
| | Rental | | Rental | | Items | | Total | |
Total revenues: | | $ | 2,084.8 | | $ | 351.0 | | $ | 0.7 | | $ | 2,436.5 | |
Expenses: | | | | | | | | | |
Direct operating and selling, general and administrative | | 1,328.2 | | 232.0 | | 42.7 | | 1,602.9 | |
Depreciation of revenue earning equipment and lease | | 513.0 | | 74.0 | | — | | 587.0 | |
Interest expense | | 75.8 | | 13.4 | | 87.6 | | 176.8 | |
Interest income | | (1.7 | ) | (0.1 | ) | — | | (1.8 | ) |
Other income, net | | (0.1 | ) | (0.5 | ) | — | | (0.6 | ) |
Total expenses | | 1,915.2 | | 318.8 | | 130.3 | | 2,364.3 | |
Income (loss) before income taxes | | 169.6 | | 32.2 | | (129.6 | ) | 72.2 | |
Adjustments: | | | | | | | | | |
Purchase accounting (a): | | | | | | | | | |
Direct operating and selling, general and administrative | | 20.5 | | 10.5 | | 0.6 | | 31.6 | |
Depreciation of revenue earning equipment | | 2.1 | | — | | — | | 2.1 | |
Non-cash debt charges (b) | | 5.7 | | 1.2 | | 10.4 | | 17.3 | |
Restructuring charges (c) | | 3.2 | | 0.4 | | 0.1 | | 3.7 | |
Restructuring related charges (c) | | 2.6 | | 1.5 | | 0.1 | | 4.2 | |
Integration expenses | | 4.7 | | — | | 6.1 | | 10.8 | |
Acquisition related costs (d) | | — | | — | | 2.6 | | 2.6 | |
Adjusted pre-tax income (loss) | | 208.4 | | 45.8 | | (109.7 | ) | 144.5 | |
Assumed (provision) benefit for income taxes of 35% | | (72.9 | ) | (16.0 | ) | 38.4 | | (50.6 | ) |
Adjusted net income (loss) | | $ | 135.5 | | $ | 29.8 | | $ | (71.3 | ) | $ | 93.9 | |
Adjusted diluted number of shares outstanding | | | | | | | | 460.9 | |
| | | | | | | | | |
Adjusted diluted earnings per share | | | | | | | | $ | 0.21 | |
| | Three Months Ended March 31, 2012 | |
| | | | | | Other | | | |
| | Car | | Equipment | | Reconciling | | | |
| | Rental | | Rental | | Items | | Total | |
Total revenues: | | $ | 1,658.2 | | $ | 302.1 | | $ | 0.6 | | $ | 1,960.9 | |
Expenses: | | | | | | | | | |
Direct operating and selling, general and administrative | | 1,064.4 | | 217.3 | | 40.2 | | 1,321.9 | |
Depreciation of revenue earning equipment and lease | | 452.7 | | 62.4 | | — | | 515.1 | |
Interest expense | | 80.5 | | 12.8 | | 69.0 | | 162.3 | |
Interest income | | (0.9 | ) | (0.1 | ) | (0.1 | ) | (1.1 | ) |
Other income, net | | — | | (0.5 | ) | — | | (0.5 | ) |
Total expenses | | 1,596.7 | | 291.9 | | 109.1 | | 1,997.7 | |
Income (loss) before income taxes | | 61.5 | | 10.2 | | (108.5 | ) | (36.8 | ) |
Adjustments: | | | | | | | | | |
Purchase accounting (a): | | | | | | | | | |
Direct operating and selling, general and administrative | | 10.2 | | 10.0 | | 1.0 | | 21.2 | |
Depreciation of revenue earning equipment | | 2.9 | | — | | — | | 2.9 | |
Non-cash debt charges (b) | | 11.2 | | 1.5 | | 12.5 | | 25.2 | |
Restructuring charges (c) | | 3.5 | | 3.2 | | — | | 6.7 | |
Restructuring related charges (c) | | 2.3 | | 1.0 | | — | | 3.3 | |
Acquisition related costs (d) | | — | | — | | 6.9 | | 6.9 | |
Adjusted pre-tax income (loss) | | 91.6 | | 25.9 | | (88.1 | ) | 29.4 | |
Assumed (provision) benefit for income taxes of 34% | | (31.2 | ) | (8.8 | ) | 30.0 | | (10.0 | ) |
Adjusted net income (loss) | | $ | 60.4 | | $ | 17.1 | | $ | (58.1 | ) | $ | 19.4 | |
Adjusted diluted number of shares outstanding | | | | | | | | 418.1 | |
| | | | | | | | | |
Adjusted diluted earnings per share | | | | | | | | $ | 0.05 | |
(a) Represents the purchase accounting effects of the acquisition of all of Hertz’s common stock on December 21, 2005 on our results of operations relating to increased depreciation and amortization of tangible and intangible assets and accretion of workers’ compensation and public liability and property damage liabilities. Also represents the purchase accounting effects of certain subsequent acquisitions on our results of operations relating to increased depreciation and amortization of intangible assets.
(b) Represents non-cash debt charges relating to the amortization of deferred debt financing costs and debt discounts.
(c) Amounts are included within direct operating and selling, general and administrative expense in our statement of operations.
(d) Amounts are included within selling, general and administrative expense in our statement of operations.
Table 6
HERTZ GLOBAL HOLDINGS, INC.
RECONCILIATION OF GAAP TO NON-GAAP EARNINGS MEASURES
(In millions)
Unaudited
FREE CASH FLOW, EBITDA, AND CORPORATE EBITDA
| | Three Months Ended | |
| | March 31, | |
FREE CASH FLOW | | 2013 | | 2012 | |
| | | | | |
Income (loss) before income taxes | | $ | 72.2 | | $ | (36.8 | ) |
Depreciation of property and equipment | | 51.3 | | 44.0 | |
Amortization of intangibles and debt costs | | 47.8 | | 44.0 | |
Cash paid for income taxes | | (5.7 | ) | (22.4 | ) |
Changes in assets and liabilities, net of effects of acquisitions, and other | | 6.2 | | (28.9 | ) |
Net cash provided by (used in) operating activities excluding depreciation of revenue earning equipment | | 171.8 | | (0.1 | ) |
Car rental fleet growth (a) | | (152.6 | ) | (54.4 | ) |
Equipment rental fleet growth (a) | | (41.3 | ) | (3.3 | ) |
Property and equipment expenditures, net of disposals | | (56.6 | ) | (26.6 | ) |
Net investment activity | | (250.5 | ) | (84.3 | ) |
Free cash flow | | $ | (78.7 | ) | $ | (84.4 | ) |
(a) Car rental fleet growth is defined as car rental fleet capital expenditures, net of proceeds from disposals, plus car rental fleet depreciation and net car rental fleet financing. Equipment rental fleet growth is defined as equipment rental fleet expenditures, net of proceeds from disposals, plus depreciation. The calculation reflects the following:
| | Three Months Ended March 31, 2013 | | Three Months Ended March 31, 2012 | |
| | Car | | Equipment | | | | Car | | Equipment | | | |
FLEET GROWTH | | Rental | | Rental | | Total | | Rental | | Rental | | Total | |
Revenue earning equipment expenditures | | $ | (3,098.8 | ) | $ | (154.2 | ) | $ | (3,253.0 | ) | $ | (2,524.7 | ) | $ | (124.0 | ) | $ | (2,648.7 | ) |
Proceeds from disposal of revenue earning equipment | | 2,198.9 | | 38.9 | | $ | 2,237.9 | | 1,951.0 | | 58.3 | | $ | 2,009.3 | |
Net revenue earning equipment capital expenditures | | (899.9 | ) | (115.3 | ) | (1,015.1 | ) | (573.7 | ) | (65.7 | ) | (639.4 | ) |
Depreciation of revenue earning equipment | | 497.8 | | 74.0 | | 571.8 | | 429.7 | | 62.4 | | 492.1 | |
Net financing activity related to car rental fleet | | 249.5 | | — | | 249.5 | | 89.6 | | — | | 89.6 | |
Fleet growth | | $ | (152.6 | ) | $ | (41.3 | ) | $ | (193.9 | ) | $ | (54.4 | ) | $ | (3.3 | ) | $ | (57.7 | ) |
| | Three Months Ended March 31, 2013 | | Three Months Ended March 31, 2012 | |
| | | | | | Other | | | | | | | | Other | | | |
| | Car | | Equipment | | Reconciling | | | | Car | | Equipment | | Reconciling | | | |
EBITDA AND CORPORATE EBITDA | | Rental | | Rental | | Items | | Total | | Rental | | Rental | | Items | | Total | |
| | | | | | | | | | | | | | | | | |
Income (loss) before income taxes | | $ | 169.6 | | $ | 32.1 | | $ | (129.5 | ) | $ | 72.2 | | $ | 61.5 | | $ | 10.2 | | $ | (108.5 | ) | $ | (36.8 | ) |
Depreciation and amortization | | 573.1 | | 93.0 | | 3.0 | | 669.1 | | 493.8 | | 81.2 | | 3.5 | | 578.5 | |
Interest, net of interest income | | 74.0 | | 13.4 | | 87.6 | | 175.0 | | 79.6 | | 12.7 | | 68.9 | | 161.2 | |
EBITDA | | 816.7 | | 138.5 | | (38.9 | ) | 916.3 | | 634.9 | | 104.1 | | (36.1 | ) | 702.9 | |
Adjustments: | | | | | | | | | | | | | | | | | |
Car rental fleet interest | | 70.7 | | — | | — | | 70.7 | | (75.8 | ) | — | | — | | (75.8 | ) |
Car rental fleet depreciation | | (513.1 | ) | — | | — | | (513.1 | ) | (451.7 | ) | — | | — | | (451.7 | ) |
Non-cash expenses and charges (b) | | 5.4 | | — | | 7.9 | | 13.3 | | 11.0 | | — | | 7.4 | | 18.4 | |
Extraordinary, unusual or non-recurring gains and losses (c) | | 11.9 | | 0.5 | | 8.9 | | 21.3 | | 5.8 | | 4.2 | | 6.9 | | 16.9 | |
Corporate EBITDA | | $ | 250.2 | | $ | 139.0 | | $ | (22.1 | ) | $ | 367.1 | | $ | 124.2 | | $ | 108.3 | | $ | (21.8 | ) | $ | 210.7 | |
(b) As defined in the credit agreements for the senior credit facilities, Corporate EBITDA excludes the impact of certain non-cash expenses and charges. The adjustments reflect the following:
| | Three Months Ended March 31, 2013 | | Three Months Ended March 31, 2012 | |
| | | | | | Other | | | | | | | | Other | | | |
| | Car | | Equipment | | Reconciling | | | | Car | | Equipment | | Reconciling | | | |
NON-CASH EXPENSES AND CHARGES | | Rental | | Rental | | Items | | Total | | Rental | | Rental | | Items | | Total | |
| | | | | | | | | | | | | | | | | |
Non-cash amortization of debt costs included in car rental fleet interest | | $ | 5.4 | | $ | — | | $ | — | | $ | 5.4 | | $ | 11.0 | | $ | — | | $ | — | | $ | 11.0 | |
Non-cash stock-based employee compensation charges | | — | | — | | 7.9 | | 7.9 | | — | | — | | 7.4 | | 7.4 | |
Total non-cash expenses and charges | | $ | 5.4 | | $ | — | | $ | 7.9 | | $ | 13.3 | | $ | 11.0 | | $ | — | | $ | 7.4 | | $ | 18.4 | |
Table 6(pg.2)
(c) As defined in the credit agreements for the senior credit facilities, Corporate EBITDA excludes the impact of extraordinary, unusual or non-recurring gains or losses or charges or credits.
The adjustments reflect the following:
| | Three Months Ended March 31, 2013 | | Three Months Ended March 31, 2012 | |
| | | | | | Other | | | | | | | | Other | | | |
EXTRAORDINARY, UNUSUAL OR | | Car | | Equipment | | Reconciling | | | | Car | | Equipment | | Reconciling | | | |
NON-RECURRING ITEMS | | Rental | | Rental | | Items | | Total | | Rental | | Rental | | Items | | Total | |
| | | | | | | | | | | | | | | | | |
Restructuring charges | | $ | 3.1 | | $ | 0.5 | | $ | 0.1 | | $ | 3.7 | | $ | 3.5 | | $ | 3.2 | | $ | — | | $ | 6.7 | |
Restructuring related charges | | 4.1 | | — | | 0.1 | | 4.2 | | 2.3 | | 1.0 | | — | | 3.3 | |
Acquisition related costs | | — | | — | | 2.6 | | 2.6 | | — | | — | | 6.9 | | 6.9 | |
Integration expenses | | 4.7 | | — | | 6.1 | | 10.8 | | — | | — | | — | | — | |
Total extraordinary, unusual or non-recurring items | | $ | 11.9 | | $ | 0.5 | | $ | 8.9 | | $ | 21.3 | | $ | 5.8 | | $ | 4.2 | | $ | 6.9 | | $ | 16.9 | |
Table 7
HERTZ GLOBAL HOLDINGS, INC.
RECONCILIATION OF GAAP TO NON-GAAP EARNINGS MEASURES
(In millions, except as noted)
Unaudited
| | Three Months Ended | |
RECONCILIATION FROM OPERATING | | March 31, | |
CASH FLOWS TO EBITDA: | | 2013 | | 2012 | |
| | | | | |
Net cash provided by operating activities | | $ | 743.6 | | $ | 492.0 | |
Amortization of debt costs | | (17.3 | ) | (24.9 | ) |
Provision for losses on doubtful accounts | | (12.7 | ) | (6.9 | ) |
Derivative gains (losses) | | 1.5 | | 3.0 | |
Gain (loss) on sale of property and equipment | | 1.0 | | 0.2 | |
Loss on revaluation of foreign denominated debt | | — | | (2.5 | ) |
Stock-based compensation charges | | (8.0 | ) | (7.5 | ) |
Asset writedowns | | — | | (2.7 | ) |
Lease charges | | 15.3 | | 23.1 | |
Deferred income taxes | | (35.9 | ) | (2.4 | ) |
Provision (benefit) for taxes on income | | 54.2 | | 19.5 | |
Interest expense, net of interest income | | 175.0 | | 161.2 | |
Changes in assets and liabilities | | (0.4 | ) | 48.1 | |
EBITDA | | $ | 916.3 | | $ | 700.2 | |
NET CORPORATE DEBT, NET FLEET DEBT | | March 31, | | December 31, | | March 31, | | December 31, | | March 31, | |
AND TOTAL NET DEBT | | 2013 | | 2012 | | 2012 | | 2011 | | 2011 | |
| | | | | | | | | | | |
Total Corporate Debt | | $ | 7,237.0 | | $ | 6,545.3 | | $ | 4,645.2 | | $ | 4,704.8 | | $ | 5,202.2 | |
Total Fleet Debt | | 9,080.0 | | 8,903.3 | | 6,780.5 | | 6,612.3 | | 5,547.8 | |
Total Debt | | $ | 16,317.0 | | $ | 15,448.6 | | $ | 11,425.7 | | $ | 11,317.1 | | $ | 10,750.0 | |
| | | | | | | | | | | |
Corporate Restricted Cash | | | | | | | | | | | |
Restricted Cash, less: | | $ | 425.2 | | $ | 571.6 | | $ | 211.9 | | $ | 308.0 | | $ | 190.9 | |
Restricted Cash Associated with Fleet Debt | | (370.5 | ) | (494.0 | ) | (126.5 | ) | (213.6 | ) | (110.2 | ) |
Corporate Restricted Cash | | $ | 54.7 | | $ | 77.6 | �� | $ | 85.4 | | $ | 94.4 | | $ | 80.7 | |
| | | | | | | | | | | |
Net Corporate Debt | | | | | | | | | | | |
Corporate Debt, less: | | $ | 7,237.0 | | $ | 6,545.3 | | $ | 4,645.2 | | $ | 4,704.8 | | $ | 5,202.2 | |
Cash and Cash Equivalents | | (653.8 | ) | (533.3 | ) | (594.7 | ) | (931.8 | ) | (1,365.8 | ) |
Corporate Restricted Cash | | (54.7 | ) | (77.6 | ) | (85.4 | ) | (94.4 | ) | (80.7 | ) |
Net Corporate Debt | | $ | 6,528.5 | | $ | 5,934.4 | | $ | 3,965.1 | | $ | 3,678.6 | | $ | 3,755.7 | |
| | | | | | | | | | | |
Net Fleet Debt | | | | | | | | | | | |
Fleet Debt, less: | | $ | 9,080.0 | | $ | 8,903.3 | | $ | 6,780.5 | | $ | 6,612.3 | | $ | 5,547.8 | |
Restricted Cash Associated with Fleet Debt | | (370.5 | ) | (494.0 | ) | (126.5 | ) | (213.6 | ) | (110.2 | ) |
Net Fleet Debt | | $ | 8,709.5 | | $ | 8,409.3 | | $ | 6,654.0 | | $ | 6,398.7 | | $ | 5,437.6 | |
| | | | | | | | | | | |
Total Net Debt | | $ | 15,238.0 | | $ | 14,343.7 | | $ | 10,619.1 | | $ | 10,077.3 | | $ | 9,193.3 | |
| | Three Months Ended | |
CAR RENTAL REVENUE PER | | March 31, | |
TRANSACTION DAY (a) | | 2013 | | 2012 | |
| | | | | |
Car rental segment revenues (b) | | $ | 2,084.8 | | $ | 1,658.2 | |
Non-rental revenue | | (127.8 | ) | (110.4 | ) |
Foreign currency adjustment | | 1.9 | | (0.8 | ) |
Total rental revenue | | $ | 1,958.9 | | $ | 1,547.0 | |
Transactions days (in thousands) | | 39,070 | | 31,669 | |
Total rental revenue per transaction day (in whole dollars) | | $ | 50.14 | | $ | 48.85 | |
| | Three Months Ended | |
EQUIPMENT RENTAL AND RENTAL | | March 31, | |
RELATED REVENUE (a) | | 2013 | | 2012 | |
| | | | | |
Equipment rental segment revenues | | $ | 351.0 | | $ | 302.1 | |
Equipment sales and other revenue | | (29.8 | ) | (26.3 | ) |
Foreign currency adjustment | | 0.9 | | (1.5 | ) |
Rental and rental related revenue | | $ | 322.1 | | $ | 274.3 | |
(a) Based on 12/31/12 foreign exchange rates.
(b) Includes U.S. off-airport revenues of $320.4 million and $283.9 million for the three months ended March 31, 2013 and 2012, respectively.
Exhibit 1
Non-GAAP Measures: Definitions and Use/Importance
Hertz Global Holdings, Inc. (“Hertz Holdings”) is our top-level holding company. The Hertz Corporation (“Hertz”) is our primary operating company. The term “GAAP” refers to accounting principles generally accepted in the United States of America.
Definitions of non-GAAP measures utilized in Hertz Holdings’ April 29, 2013 Press Release are set forth below. Also set forth below is a summary of the reasons why management of Hertz Holdings and Hertz believes that the presentation of the non-GAAP financial measures included in the Press Release provide useful information regarding Hertz Holdings’ and Hertz’s financial condition and results of operations and additional purposes, if any, for which management of Hertz Holdings and Hertz utilize the non-GAAP measures.
1. Earnings Before Interest, Taxes, Depreciation and Amortization (“EBITDA”) and Corporate EBITDA
EBITDA is defined as net income before net interest expense, income taxes and depreciation (which includes revenue earning equipment lease charges) and amortization. Corporate EBITDA, as presented herein, represents EBITDA as adjusted for car rental fleet interest, car rental fleet depreciation and certain other items, as described in more detail in the accompanying tables.
Management uses EBITDA and Corporate EBITDA as operating performance and liquidity metrics for internal monitoring and planning purposes, including the preparation of our annual operating budget and monthly operating reviews, as well as to facilitate analysis of investment decisions, profitability and performance trends. Further, EBITDA enables management and investors to isolate the effects on profitability of operating metrics such as revenue, operating expenses and selling, general and administrative expenses, which enables management and investors to evaluate our two business segments that are financed differently and have different depreciation characteristics and compare our performance against companies with different capital structures and depreciation policies. We also present Corporate EBITDA as a supplemental measure because such information is utilized in the calculation of financial covenants under Hertz’s senior credit facilities.
EBITDA and Corporate EBITDA are not recognized measurements under GAAP. When evaluating our operating performance or liquidity, investors should not consider EBITDA and Corporate EBITDA in isolation of, or as a substitute for, measures of our financial performance and liquidity as determined in accordance with GAAP, such as net income, operating income or net cash provided by operating activities.
2. Adjusted Pre-Tax Income
Adjusted pre-tax income is calculated as income before income taxes plus non-cash purchase accounting charges, non-cash debt charges relating to the amortization of debt financing costs and debt discounts and certain one-time charges and non-operational items. Adjusted pre-tax income is important to management because it allows management to assess operational performance of our business, exclusive of the items mentioned above. It also allows management to assess the performance of the entire business on the same basis as the segment measure of profitability. Management believes that it is important to investors for the same
reasons it is important to management and because it allows them to assess the operational performance of the Company on the same basis that management uses internally.
3. Adjusted Net Income
Adjusted net income is calculated as adjusted pre-tax income less a provision for income taxes derived utilizing a normalized income tax rate (35% in 2013 and 34% in 2012) and noncontrolling interest. The normalized income tax rate is management’s estimate of our long-term tax rate. Adjusted net income is important to management and investors because it represents our operational performance exclusive of the effects of purchase accounting, non-cash debt charges, one-time charges and items that are not operational in nature or comparable to those of our competitors.
4. Adjusted Diluted Earnings Per Share
Adjusted diluted earnings per share is calculated as adjusted net income divided by, for the three months ended March 31, 2013, 460.9 million which represents the weighted average diluted shares outstanding for the period; for the three months ended March 31, 2012, 418.1 million which represents the weighted average diluted shares outstanding for the period; which represents the weighted average diluted shares outstanding for the period. Adjusted diluted earnings per share is important to management and investors because it represents a measure of our operational performance exclusive of the effects of purchase accounting adjustments, non-cash debt charges, one-time charges and items that are not operational in nature or comparable to those of our competitors.
5. Transaction Days
Transaction days represent the total number of days that vehicles were on rent in a given period.
6. Car Rental Revenue, Total Rental Revenue Per Transaction Day and Total Rental Revenue Per Transaction
Car rental revenue consists of all revenue, net of discounts, associated with the rental of cars including charges for optional insurance products, but excluding non-rental revenues derived from Donlen. Total revenue per transaction day is calculated as total rental revenue, divided by the total number of transaction days, with all periods adjusted to eliminate the effect of fluctuations in foreign currency. Our management believes eliminating the effect of fluctuations in foreign currency is appropriate so as not to affect the comparability of underlying trends. This statistic is important to our management and investors as it represents the best measurement of the changes in underlying pricing in the car rental business and encompasses the elements in car rental pricing that management has the ability to control.
7. Equipment Rental and Rental Related Revenue
Equipment rental and rental related revenue consists of all revenue, net of discounts, associated with the rental of equipment including charges for delivery, loss damage waivers and fueling, but excluding revenue arising from the sale of equipment, parts and supplies and certain other ancillary revenue. Rental and rental related revenue is adjusted in all periods to eliminate the effect of fluctuations in foreign currency. Our management believes eliminating the effect of fluctuations in foreign currency is appropriate so as not to affect the comparability of underlying trends. This statistic is important to our management and to investors as it is utilized in the measurement of rental revenue generated per dollar invested in fleet on an annualized basis and
is comparable with the reporting of other industry participants.
8. Same Store Revenue Growth/Decline
Same store revenue growth or decline is calculated as the year over year change in revenue for locations that are open at the end of the period reported and have been operating under our direction for more than twelve months. The same store revenue amounts are adjusted in all periods to eliminate the effect of fluctuations in foreign currency. Our management believes eliminating the effect of fluctuations in foreign currency is appropriate so as not to affect the comparability of underlying trends.
9. Free Cash Flow
Free cash flow is calculated as Net cash provided by operating activities less revenue earning equipment expenditures, net of disposal proceeds and car rental fleet financing, less non-fleet capital expenditures, net of non-fleet disposals. Free cash flow is important to management and investors as it represents the cash available for acquisitions and the reduction of corporate debt.
10. Net Corporate Debt
Net corporate debt is calculated as total debt excluding fleet debt less cash and equivalents and corporate restricted cash. Corporate debt consists of our Senior Term Facility; Senior ABL Facility; Senior Notes; Senior Subordinated Notes, Convertible Senior Notes; and certain other indebtedness of our domestic and foreign subsidiaries. Net Corporate Debt is important to management, investors and ratings agencies as it helps measure our leverage. Net Corporate Debt also assists in the evaluation of our ability to service our non-fleet-related debt without reference to the expense associated with the fleet debt, which is fully collateralized by assets not available to lenders under the non-fleet debt facilities.
11. Corporate Restricted Cash (used in the calculation of Net Corporate Debt)
Total restricted cash includes cash and cash equivalents that are not readily available for our normal disbursements. Total restricted cash and equivalents are restricted for the purchase of revenue earning vehicles and other specified uses under our Fleet Debt facilities, our like-kind exchange programs and to satisfy certain of our self insurance regulatory reserve requirements. Corporate restricted cash is calculated as total restricted cash less restricted cash associated with fleet debt.
12. Net Fleet Debt
Net fleet debt is calculated as total fleet debt less restricted cash associated with fleet debt. As of March 31, 2013, fleet debt consists of HVF U.S. Fleet Variable Funding Notes, HVF U.S. Fleet Medium Term Notes, RCFC U.S. Fleet Variable Funding Notes, RCFC U.S. Fleet Medium Term Notes, Donlen GN II Variable Funding Notes, U.S. Fleet Financing Facility, European Revolving Credit Facility, European Fleet Notes, European Securitization, Hertz-Sponsored Canadian Securitization, Dollar Thrifty-Sponsored Canadian Securitization, Australian Securitization, Brazilian Fleet Financing and Capitalized Leases relating to revenue earning equipment. This measure is important to management, investors and ratings agencies as it helps measure our leverage.
13. Restricted Cash Associated with Fleet Debt (used in the calculation of Net Fleet Debt and Corporate Restricted Cash)
Restricted cash associated with fleet debt is restricted for the purchase of revenue earning vehicles and other specified uses under our Fleet Debt facilities and our car rental like-kind exchange program.
14. Total Net Debt
Total net debt is calculated as net corporate debt plus net fleet debt. This measure is important to management, investors and ratings agencies as it helps measure our leverage.