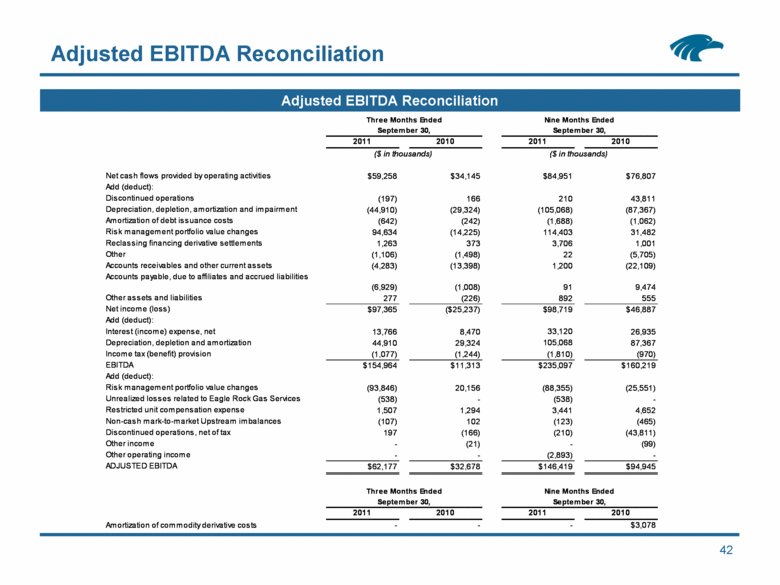
| Adjusted EBITDA Reconciliation Adjusted EBITDA Reconciliation 42 2011 2010 2011 2010 Net cash flows provided by operating activities $59,258 $34,145 $84,951 $76,807 Add (deduct): Discontinued operations (197) 166 210 43,811 Depreciation, depletion, amortization and impairment (44,910) (29,324) (105,068) (87,367) Amortization of debt issuance costs (642) (242) (1,688) (1,062) Risk management portfolio value changes 94,634 (14,225) 114,403 31,482 Reclassing financing derivative settlements 1,263 373 3,706 1,001 Other (1,106) (1,498) 22 (5,705) Accounts receivables and other current assets (4,283) (13,398) 1,200 (22,109) Accounts payable, due to affiliates and accrued liabilities (6,929) (1,008) 91 9,474 Other assets and liabilities 277 (226) 892 555 Net income (loss) $97,365 ($25,237) $98,719 $46,887 Add (deduct): Interest (income) expense, net 13,766 8,470 33,120 26,935 Depreciation, depletion and amortization 44,910 29,324 105,068 87,367 Income tax (benefit) provision (1,077) (1,244) (1,810) (970) EBITDA $154,964 $11,313 $235,097 $160,219 Add (deduct): Risk management portfolio value changes (93,846) 20,156 (88,355) (25,551) Unrealized losses related to Eagle Rock Gas Services (538) - (538) - Restricted unit compensation expense 1,507 1,294 3,441 4,652 Non-cash mark-to-market Upstream imbalances (107) 102 (123) (465) Discontinued operations, net of tax 197 (166) (210) (43,811) Other income - (21) - (99) Other operating income - - (2,893) - ADJUSTED EBITDA $62,177 $32,678 $146,419 $94,945 2011 2010 2011 2010 Amortization of commodity derivative costs - - - $3,078 September 30, September 30, ($ in thousands) ($ in thousands) Nine Months Ended Three Months Ended September 30, September 30, Three Months Ended Nine Months Ended |
