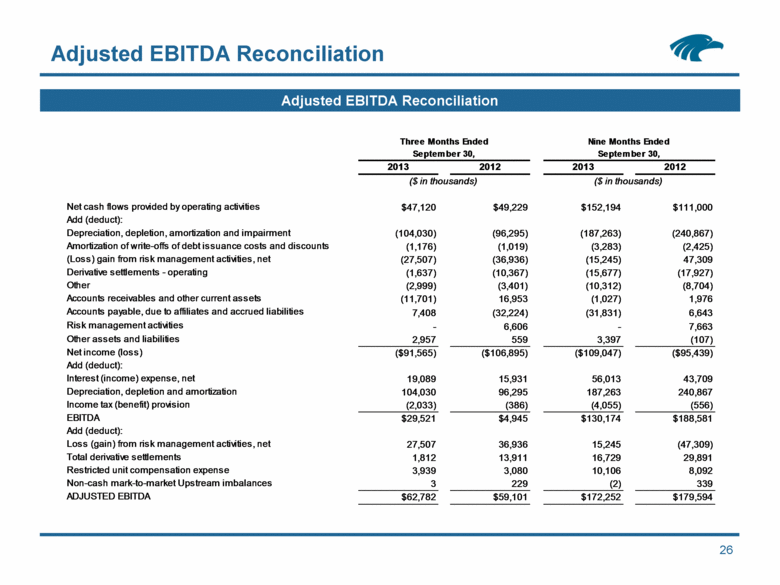
| Adjusted EBITDA Reconciliation Adjusted EBITDA Reconciliation 26 2013 2012 2013 2012 Net cash flows provided by operating activities $47,120 $49,229 $152,194 $111,000 Add (deduct): Depreciation, depletion, amortization and impairment (104,030) (96,295) (187,263) (240,867) Amortization of write-offs of debt issuance costs and discounts (1,176) (1,019) (3,283) (2,425) (Loss) gain from risk management activities, net (27,507) (36,936) (15,245) 47,309 Derivative settlements - operating (1,637) (10,367) (15,677) (17,927) Other (2,999) (3,401) (10,312) (8,704) Accounts receivables and other current assets (11,701) 16,953 (1,027) 1,976 Accounts payable, due to affiliates and accrued liabilities 7,408 (32,224) (31,831) 6,643 Risk management activities - 6,606 - 7,663 Other assets and liabilities 2,957 559 3,397 (107) Net income (loss) ($91,565) ($106,895) ($109,047) ($95,439) Add (deduct): Interest (income) expense, net 19,089 15,931 56,013 43,709 Depreciation, depletion and amortization 104,030 96,295 187,263 240,867 Income tax (benefit) provision (2,033) (386) (4,055) (556) EBITDA $29,521 $4,945 $130,174 $188,581 Add (deduct): Loss (gain) from risk management activities, net 27,507 36,936 15,245 (47,309) Total derivative settlements 1,812 13,911 16,729 29,891 Restricted unit compensation expense 3,939 3,080 10,106 8,092 Non-cash mark-to-market Upstream imbalances 3 229 (2) 339 ADJUSTED EBITDA $62,782 $59,101 $172,252 $179,594 ($ in thousands) ($ in thousands) Three Months Ended Nine Months Ended September 30, September 30, |
