Exhibit 99.2
AG Edwards’ Yield Conference May 15, 2007 Eagle Rock Energy Partners, L.P. NASDAQ: EROC
2 The statements made by representatives of Eagle Rock during the course of this presentation that are not historical facts are forward-looking statements. Although Eagle Rock believes that the assumptions underlying these statements are reasonable, readers are cautioned that such forward-looking statements are inherently uncertain and necessarily involve risks that may affect Eagle Rock’s business prospects and performance, causing actual results to differ from those discussed during this presentation. When considering forward-looking statements, you should keep in mind the risk factors and other cautionary statements included in the prospectus. Any forward-looking statements made are subject to all of the risks and uncertainties, many of which are beyond management’s control, including risks related to the gathering, processing, and marketing of natural gas and natural gas liquids, or NGLs. These risks include the risks described in Eagle Rock’s prospectus filed with the SEC. Should one or more of these risks or uncertainties occur, or should underlying assumptions prove incorrect, Eagle Rock’s actual results and plans could differ materially from those expressed in any forward-looking statements. The Partnership undertakes no obligation to publicly update any forward-looking statements, whether as a result of new information or future events. Forward Looking Statements
Statements 3 Senior Management Representatives Joseph A. Mills Chairman & Chief Executive Officer Richard W. FitzGerald Senior Vice President & Chief Financial Officer
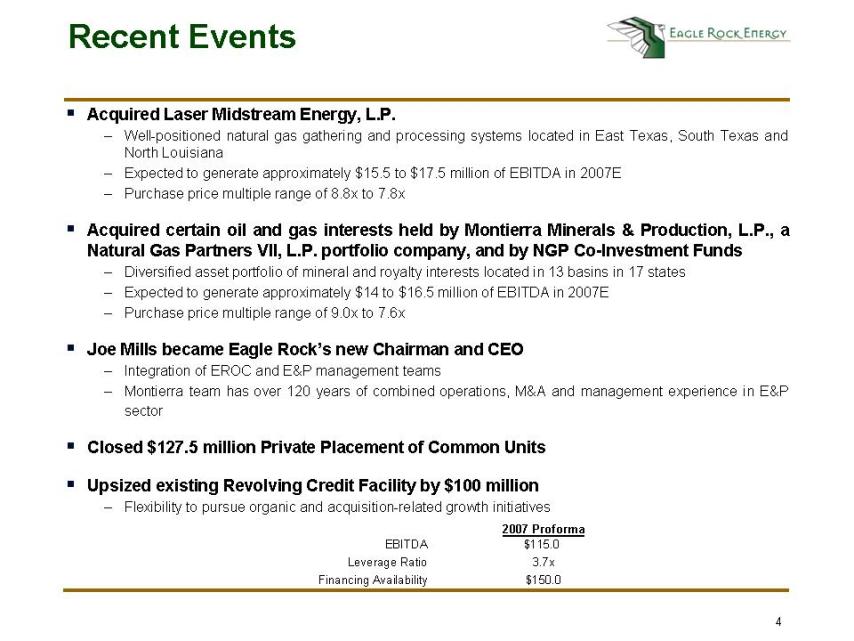
4 Recent Events ⑀⍽ Acquired Laser Midstream Energy, L.P. - Well-positioned natural gas gathering and processing systems located in East Texas, South Texas and North Louisiana - Expected to generate approximately $15.5 to $17.5 million of EBITDA in 2007E - Purchase price multiple range of 8.8x to 7.8x ⑀⍽ Acquired certain oil and gas interests held by Montierra Minerals & Production, L.P., a Natural Gas Partners VII, L.P. portfolio company, and by NGP Co-Investment Funds - Diversified asset portfolio of mineral and royalty interests located in 13 basins in 17 states - Expected to generate approximately $14 to $16.5 million of EBITDA in 2007E - Purchase price multiple range of 9.0x to 7.6x ⑀⍽ Joe Mills became Eagle Rock’s new Chairman and CEO - Integration of EROC and E&P management teams - Montierra team has over 120 years of combined operations, M&A and management experience in E&P sector ⑀⍽ Closed $127.5 million Private Placement of Common Units ⑀⍽ Upsized existing Revolving Credit Facility by $100 million - Flexibility to pursue organic and acquisition-related growth initiatives 2007 Proforma EBITDA $115.0 Leverage Ratio 3.7x Financing Availability $150.0
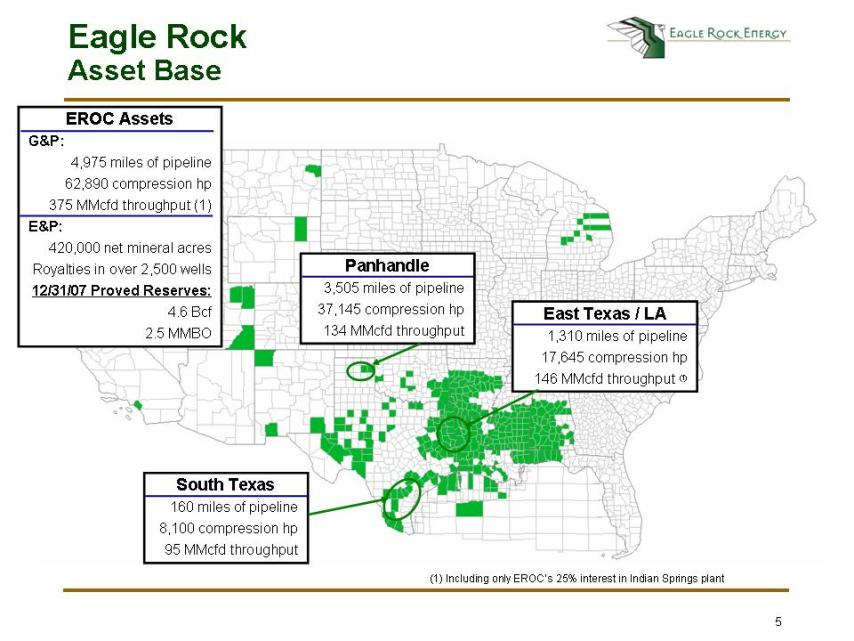
5 Eagle Rock Asset Base Panhandle 3,505 miles of pipeline 37,145 compression hp 134 MMcfd throughput East Texas / LA 1,310 miles of pipeline 17,645 compression hp 146 MMcfd throughput (1) South Texas 160 miles of pipeline 8,100 compression hp 95 MMcfd throughput EROC Assets G&P: 4,975 miles of pipeline 62,890 compression hp 375 MMcfd throughput (1) E&P: 420,000 net mineral acres Royalties in over 2,500 wells 12/31/07 Proved Reserves: 4.6 Bcf 2.5 MMBO (1) Including only EROC’s 25% interest in Indian Springs plant
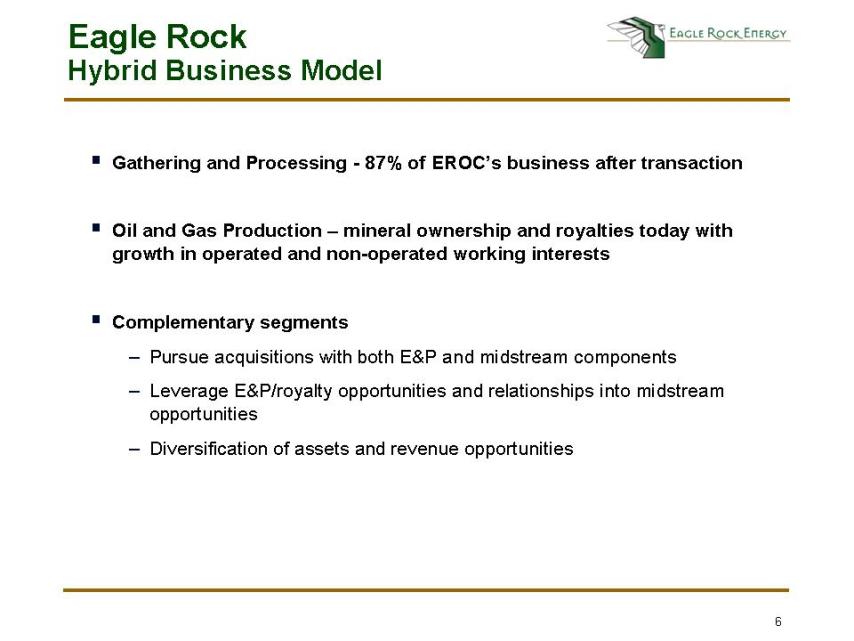
6 Eagle Rock Hybrid Business Model ⑀⍽ Gathering and Processing - 87% of EROC’s business after transaction ⑀⍽ Oil and Gas Production - mineral ownership and royalties today with growth in operated and non-operated working interests ⑀⍽ Complementary segments - Pursue acquisitions with both E&P and midstream components - Leverage E&P/royalty opportunities and relationships into midstream opportunities - Diversification of assets and revenue opportunities
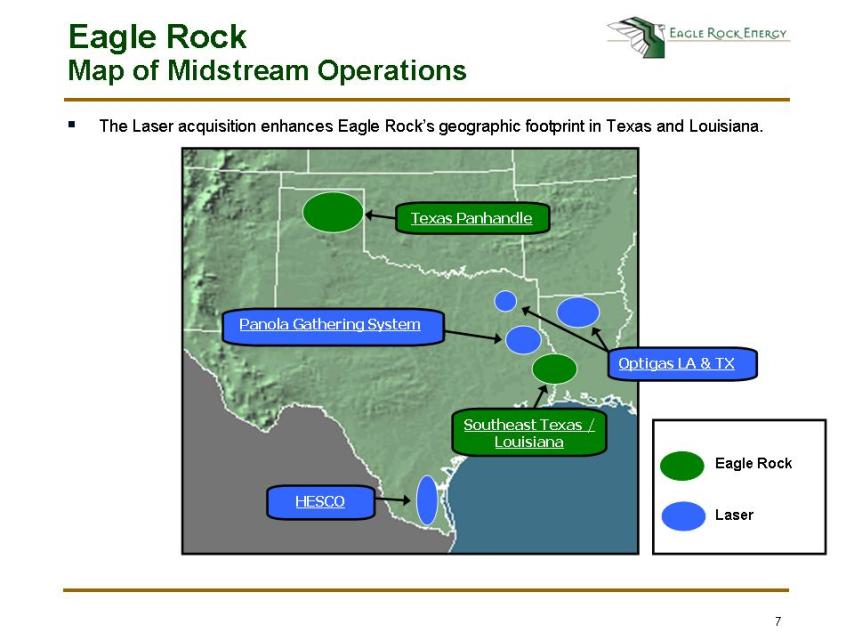
7 Eagle Rock Map of Midstream Operations Panola Gathering System HESCO Texas Panhandle Southeast Texas / Louisiana Eagle Rock Laser Optigas LA & TX ⑀⍽ The Laser acquisition enhances Eagle Rock’s geographic footprint in Texas and Louisiana.
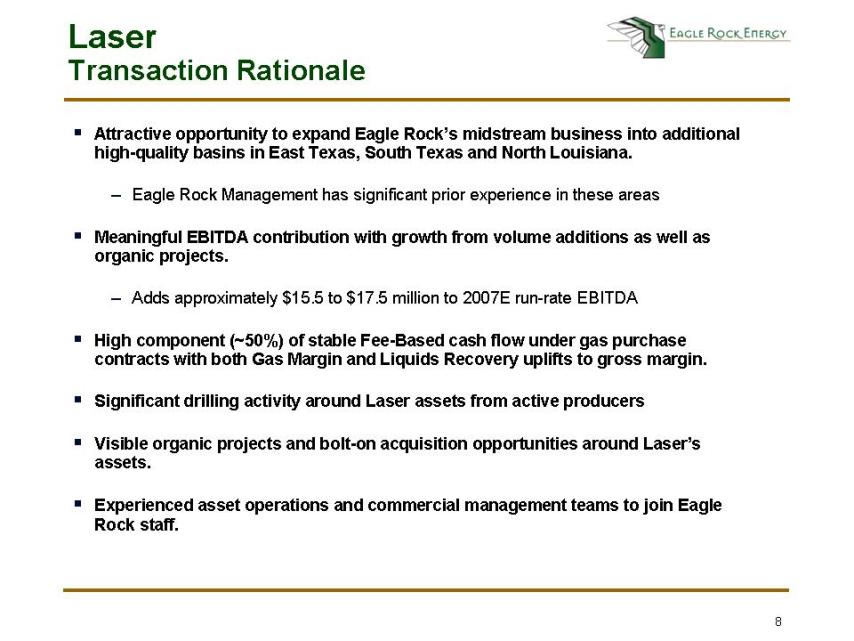
8 Laser Transaction Rationale ⑀⍽ Attractive opportunity to expand Eagle Rock’s midstream business into additional high-quality basins in East Texas, South Texas and North Louisiana. - Eagle Rock Management has significant prior experience in these areas ⑀⍽ Meaningful EBITDA contribution with growth from volume additions as well as organic projects. - Adds approximately $15.5 to $17.5 million to 2007E run-rate EBITDA ⑀⍽ High component (~50%) of stable Fee-Based cash flow under gas purchase contracts with both Gas Margin and Liquids Recovery uplifts to gross margin. ⑀⍽ Significant drilling activity around Laser assets from active producers ⑀⍽ Visible organic projects and bolt-on acquisition opportunities around Laser’s assets. ⑀⍽ Experienced asset operations and commercial management teams to join Eagle Rock staff.
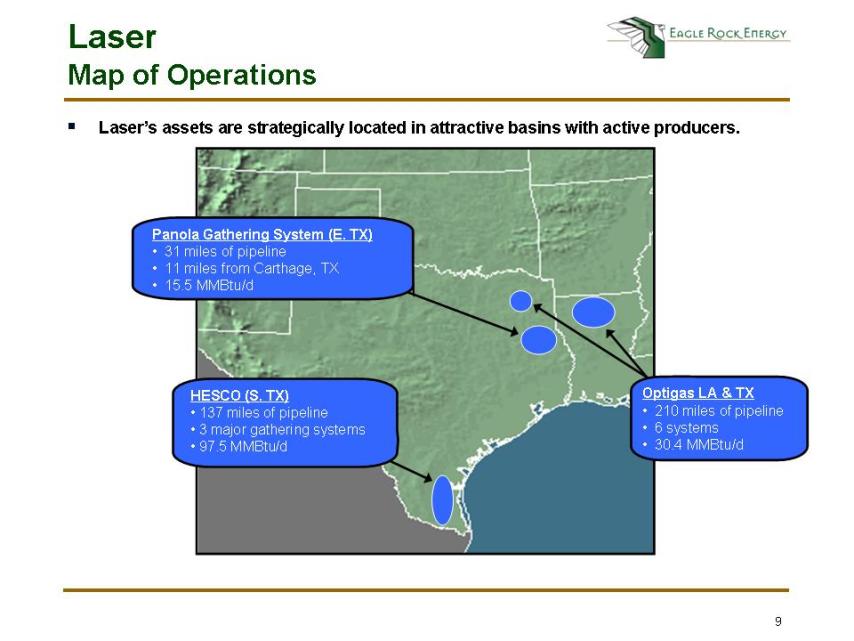
9 Laser Map of Operations Panola Gathering System (E. TX) • 31 miles of pipeline • 11 miles from Carthage, TX • 15.5 MMBtu/d Optigas LA & TX • 210 miles of pipeline • 6 systems • 30.4 MMBtu/d HESCO (S. TX) • 137 miles of pipeline • 3 major gathering systems • 97.5 MMBtu/d ⑀⍽ Laser’s assets are strategically located in attractive basins with active producers.
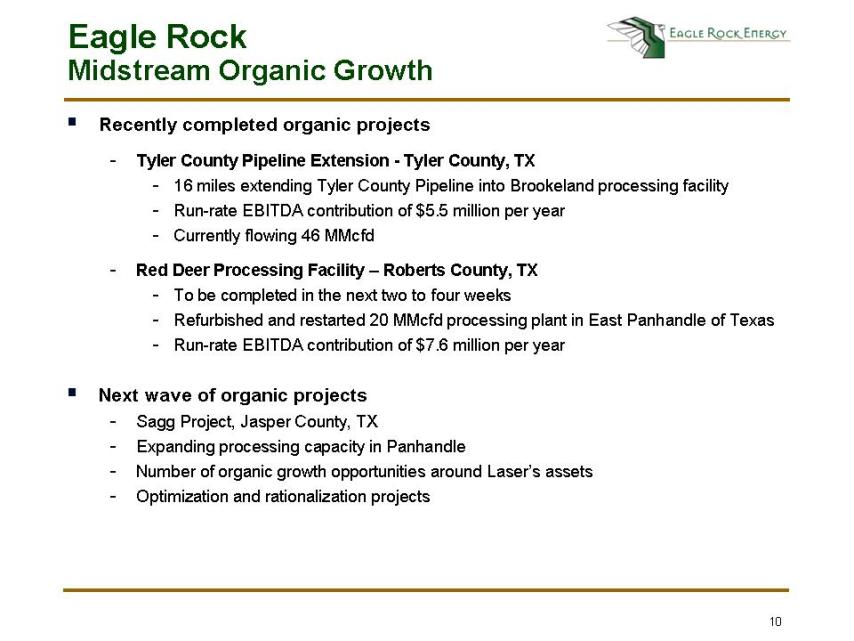
10 Eagle Rock Midstream Organic Growth ⑀⍽ Recently completed organic projects - Tyler County Pipeline Extension - Tyler County, TX - 16 miles extending Tyler County Pipeline into Brookeland processing facility - Run-rate EBITDA contribution of $5.5 million per year - Currently flowing 46 MMcfd - Red Deer Processing Facility - Roberts County, TX - To be completed in the next two to four weeks - Refurbished and restarted 20 MMcfd processing plant in East Panhandle of Texas - Run-rate EBITDA contribution of $7.6 million per year ⑀⍽ Next wave of organic projects - Sagg Project, Jasper County, TX - Expanding processing capacity in Panhandle - Number of organic growth opportunities around Laser’s assets - Optimization and rationalization projects

11 Eagle Rock Midstream Growth Opportunities ⑀⍽ Acquisition-led growth - Mid-sized midstream acquisition opportunities, similar to Laser - Significant number of bolt-on acquisitions opportunities around existing systems - G&P / E&P combined assets
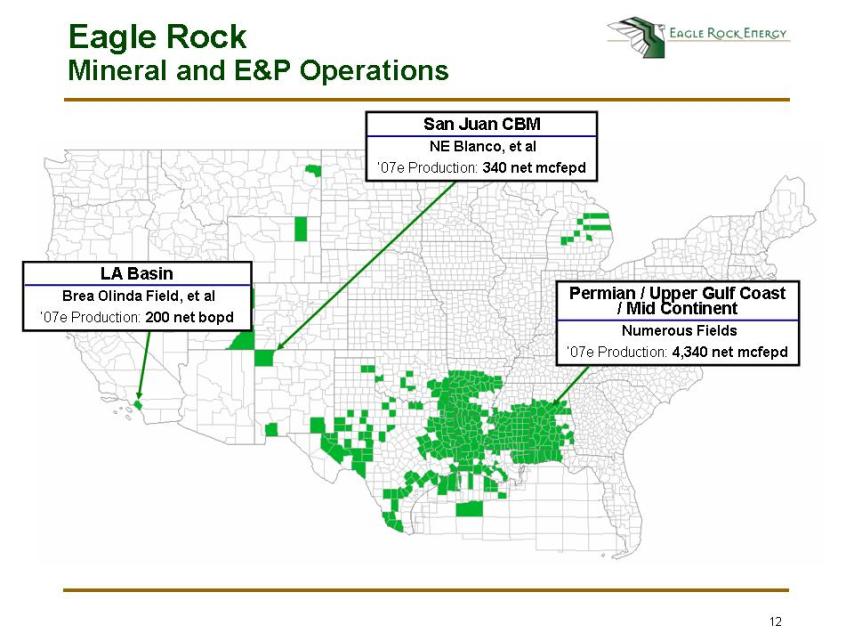
12 Eagle Rock Mineral and E&P Operations LA Basin Brea Olinda Field, et al ’07e Production: 200 net bopd Permian / Upper Gulf Coast / Mid Continent Numerous Fields ’07e Production: 4,340 net mcfepd San Juan CBM NE Blanco, et al ’07e Production: 340 net mcfepd
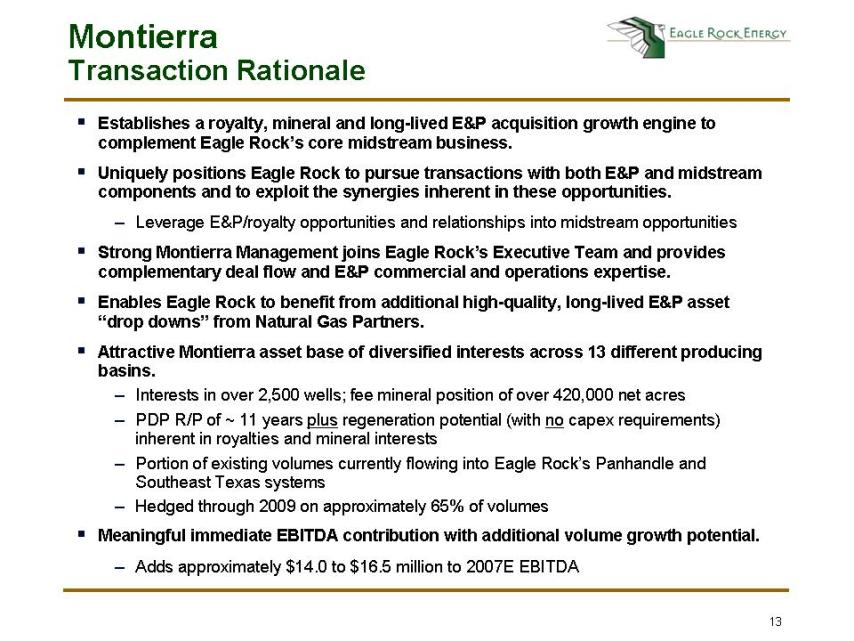
13 Montierra Transaction Rationale ⑀⍽ Establishes a royalty, mineral and long-lived E&P acquisition growth engine to complement Eagle Rock’s core midstream business. ⑀⍽ Uniquely positions Eagle Rock to pursue transactions with both E&P and midstream components and to exploit the synergies inherent in these opportunities. - Leverage E&P/royalty opportunities and relationships into midstream opportunities ⑀⍽ Strong Montierra Management joins Eagle Rock’s Executive Team and provides complementary deal flow and E&P commercial and operations expertise. ⑀⍽ Enables Eagle Rock to benefit from additional high-quality, long-lived E&P asset “drop downs” from Natural Gas Partners. ⑀⍽ Attractive Montierra asset base of diversified interests across 13 different producing basins. - Interests in over 2,500 wells; fee mineral position of over 420,000 net acres - PDP R/P of ~ 11 years plus regeneration potential (with no capex requirements) inherent in royalties and mineral interests - Portion of existing volumes currently flowing into Eagle Rock’s Panhandle and Southeast Texas systems - Hedged through 2009 on approximately 65% of volumes ⑀⍽ Meaningful immediate EBITDA contribution with additional volume growth potential. - Adds approximately $14.0 to $16.5 million to 2007E EBITDA
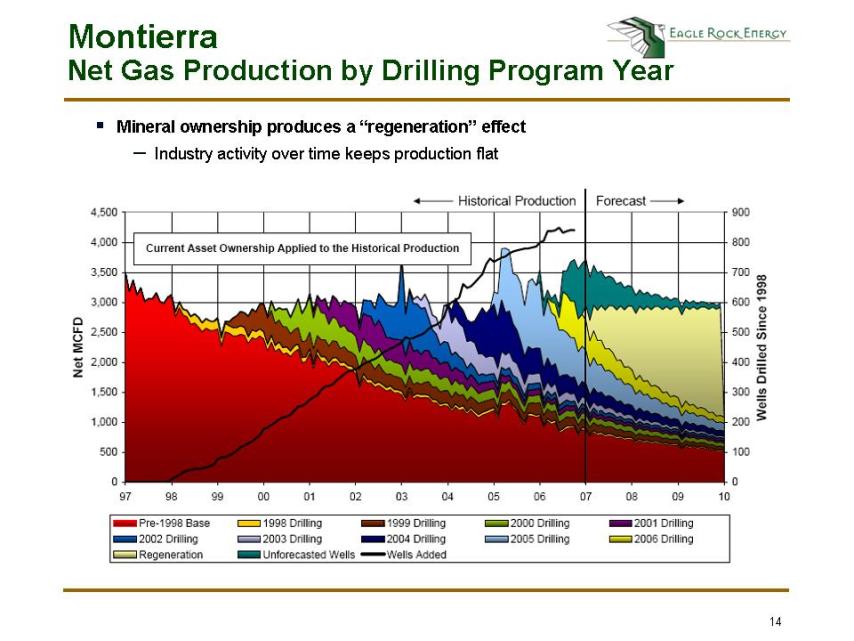
14 Montierra Net Gas Production by Drilling Program Year ⑀⍽ Mineral ownership produces a “regeneration” effect - Industry activity over time keeps production flat
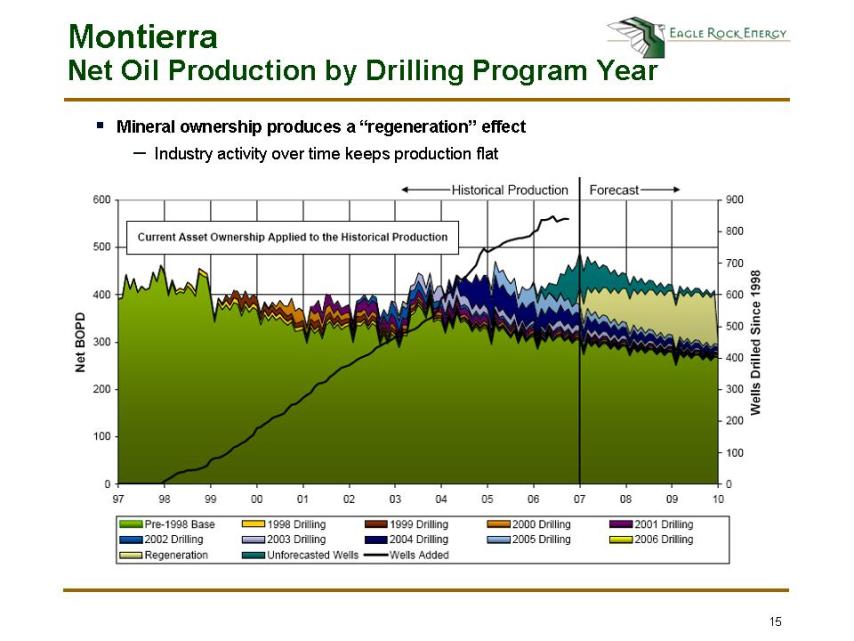
15 Montierra Net Oil Production by Drilling Program Year ⑀⍽ Mineral ownership produces a “regeneration” effect - Industry activity over time keeps production flat
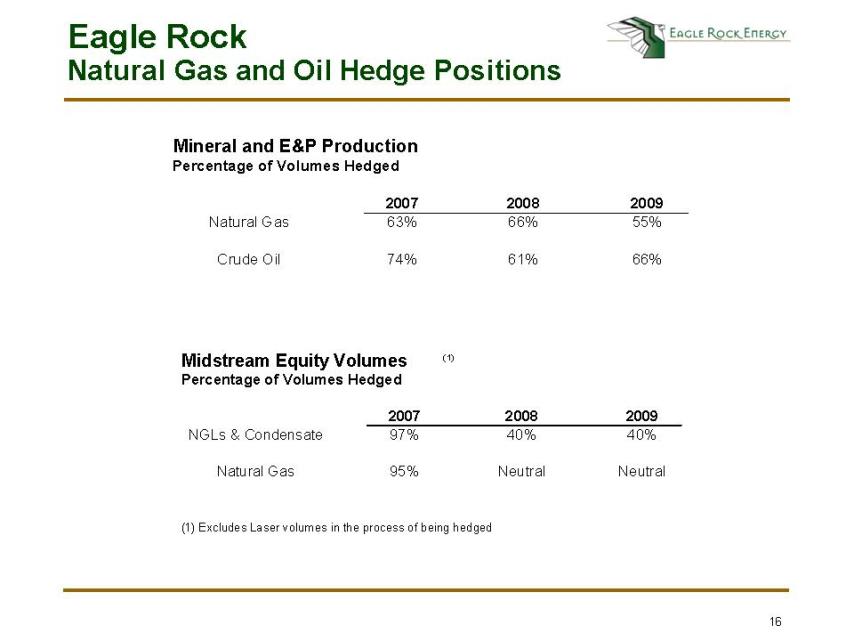
16 Eagle Rock Natural Gas and Oil Hedge Positions Mineral and E&P Production Percentage of Volumes Hedged 2007 2008 2009 Natural Gas 63% 66% 55% Crude Oil 74% 61% 66% Midstream Equity Volumes (1) Percentage of Volumes Hedged 2007 2008 2009 NGLs & Condensate 97% 40% 40% Natural Gas 95% Neutral Neutral (1) Excludes Laser volumes in the process of being hedged
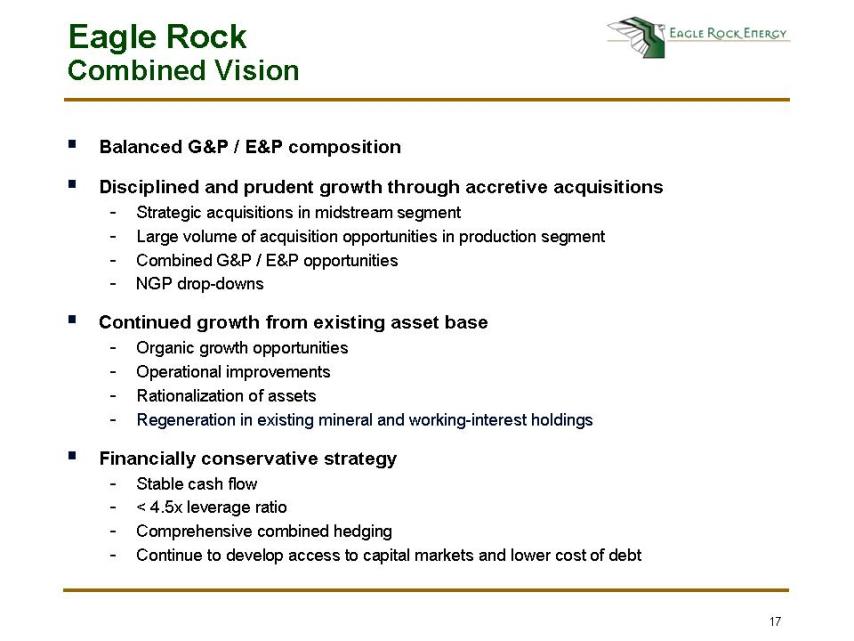
17 Eagle Rock Combined Vision ⑀⍽ Balanced G&P / E&P composition ⑀⍽ Disciplined and prudent growth through accretive acquisitions - Strategic acquisitions in midstream segment - Large volume of acquisition opportunities in production segment - Combined G&P / E&P opportunities - NGP drop-downs ⑀⍽ Continued growth from existing asset base - Organic growth opportunities - Operational improvements - Rationalization of assets - Regeneration in existing mineral and working-interest holdings ⑀⍽ Financially conservative strategy - Stable cash flow - < 4.5x leverage ratio - Comprehensive combined hedging - Continue to develop access to capital markets and lower cost of debt
18 Eagle Rock Proforma Financials 2007E Eagle Rock DCF Stand-Alone Proforma EBITDA $85.0 Less: Maint. Capex ($10.7) Less: Interest Expense ($31.8) Distributable Cash Flow $42.5 Montierra Acquisition Adjustments Acquired Montierra EBITDA (incl. increm. G&A) $14.0 Less: Maint. Capex -- Distributable Cash Flow $14.0 Laser Acquisition Adjustments Acquired Laser EBITDA (incl. increm. G&A) $16.0 Less: Maint. Capex ($0.8) Distributable Cash Flow $15.2 Eagle Rock DCF Pro Forma EBITDA $115.0 Less: Maint. Capex ($11.5) Less: Interest Expense ($31.8) Distributable Cash Flow $71.7
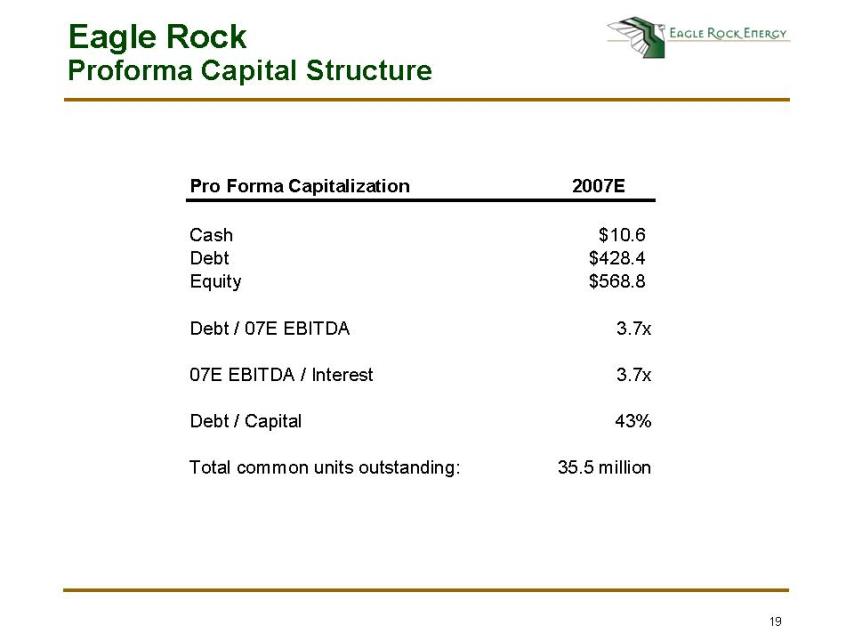
19 Eagle Rock Proforma Capital Structure Pro Forma Capitalization 2007E Cash $10.6 Debt $428.4 Equity $568.8 Debt / 07E EBITDA 3.7x 07E EBITDA / Interest 3.7x Debt / Capital 43% Total common units outstanding: 35.5 million
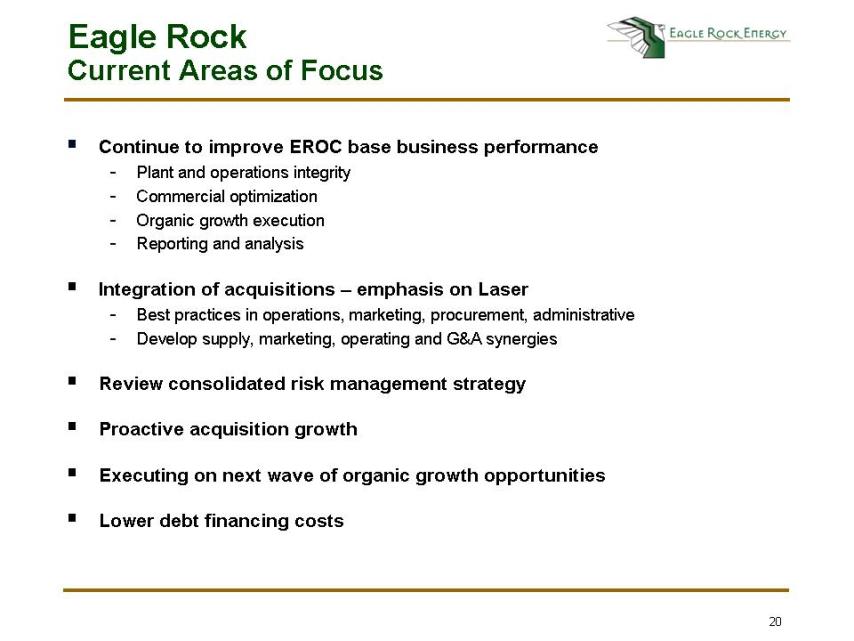
20 Eagle Rock Current Areas of Focus ⑀⍽ Continue to improve EROC base business performance - Plant and operations integrity - Commercial optimization - Organic growth execution - Reporting and analysis ⑀⍽ Integration of acquisitions - emphasis on Laser - Best practices in operations, marketing, procurement, administrative - Develop supply, marketing, operating and G&A synergies ⑀⍽ Review consolidated risk management strategy ⑀⍽ Proactive acquisition growth ⑀⍽ Executing on next wave of organic growth opportunities ⑀⍽ Lower debt financing costs
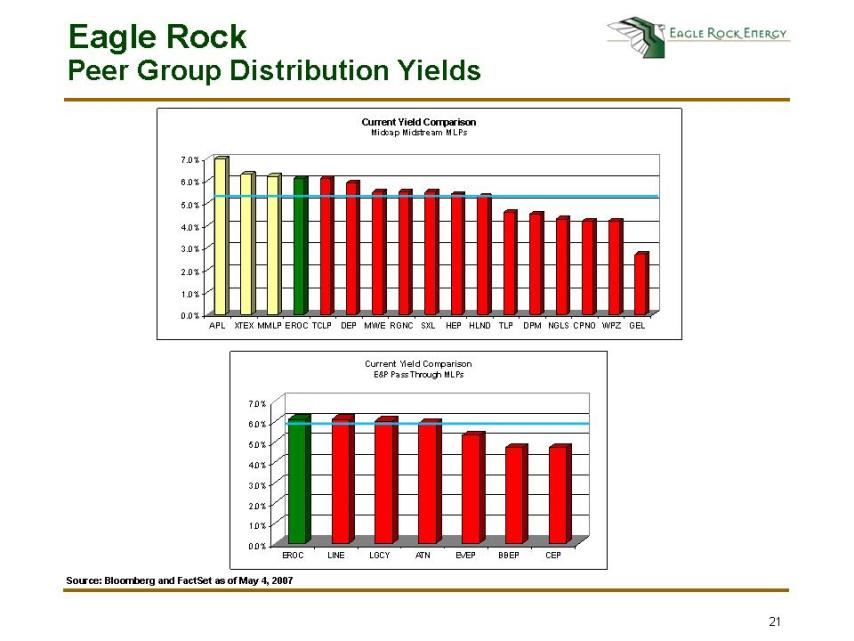
21 Eagle Rock Peer Group Distribution Yields 0.0% 1.0% 2.0% 3.0% 4.0% 5.0% 6.0% 7.0% APL XTEX MMLP EROC TCLP DEP MWE RGNC SXL HEP HLND TLP DPM NGLS CPNO WPZ GEL Current Yield Comparison Midcap Midstream MLPs 0.0% 1.0% 2.0% 3.0% 4.0% 5.0% 6.0% 7.0% EROC LINE LGCY ATN EVEP BBEP CEP Current Yield Comparison E&P Pass Through MLPs Source: Bloomberg and FactSet as of May 4, 2007
22 ⑀⍽ Refocused as hybrid business model along the natural gas and oil value chains ⑀⍽ Expanded set of acquisition growth opportunities - Large number of E&P acquisition opportunities - E&P and G&P combined asset sales - NGP drop-downs from extensive portfolio ⑀⍽ Significant and highly accretive organic growth opportunities around existing and Laser assets ⑀⍽ Strong balance sheet, credit statistics and financing availability ⑀⍽ High common unit coverage ⑀⍽ Experienced management teams in both G&P and E&P segments with substantial equity ownership and incentives Eagle Rock Investment Highlights