Eagle Rock Energy Partners, L.P.
NAPTP 2009 MLP Conference
September 2009
2
Management Representatives
Joseph A. Mills (Speaker)
Chairman & Chief Executive Officer
Jeffrey P. Wood
Senior Vice President & Chief Financial Officer
Adam K. Altsuler
Senior Financial Analyst
3
The material that follows, as well as statements made by representatives of Eagle Rock during the
course of this presentation, includes “forward-looking statements” within the meaning of Section
27A of the Securities Act of 1933, as amended, and Section 21E of the Securities Exchange Act of
1934, as amended. All statements, other than statements of historical facts, included in this
material, or made during the course of this presentation, that address activities, events or
developments that Eagle Rock expects, believes or anticipates will or may occur in the future are
forward-looking statements. These forward-looking statements are based on certain assumptions
made by Eagle Rock in reliance on its experience and perception of historical trends, current
conditions, expected future developments and other factors Eagle Rock believes are appropriate
under the circumstances. Such statements are inherently uncertain and are subject to a number of
risks, many of which are beyond Eagle Rock’s control. Should one or more of these risks or
uncertainties occur, or should underlying assumptions prove incorrect, Eagle Rock’s actual results
and plans could differ materially from those implied or expressed by any forward-looking
statements.
Eagle Rock undertakes no obligation to publicly update any forward-looking statements, whether as
a result of new information or future events. For a detailed list of Eagle Rock’s risk factors and
other cautionary statements, including without limitation risks related to the production, gathering,
processing, and marketing of natural gas and natural gas liquids, please consult Eagle Rock’s Form
10-K, filed with the Securities and Exchange Commission for the year ended December 31, 2008,
and Eagle Rock’s Forms 10-Q, filed with the SEC for subsequent quarters, as well as any other
public filings and press releases.
Forward Looking Statements
4
Enterprise Value: $1.1 billion (1)
2009E Adj. EBITDA (2): $160 - $180 million
Business Segments:
Midstream:
• We gather and process natural gas from top
tier producers in Texas and Louisiana
• Exposure to the Haynesville Shale, active in
Austin Chalk (East Texas) and Granite Wash
(Texas Panhandle)
Austin Chalk (East Texas) and Granite Wash
(Texas Panhandle)
Minerals:
• We receive royalty income with no
associated operating costs or capital
requirements
associated operating costs or capital
requirements
• New drilling activity drives underlying
production growth (“re-generation” effect)
• Significant exposure to the Haynesville Shale
Upstream:
• We operate in four low-cost, low-decline
producing regions in Texas and Alabama
• Attractive inventory of new drilling
opportunities
opportunities
Introduction to Eagle Rock Energy Partners, L.P.
(1) As of September 9, 2009. Subordinated units are valued at common unit price.
(2) See Appendix for definition of Adjusted EBITDA.
• Eagle Rock (NASDAQ: EROC) is an MLP with three complementary energy businesses well-
positioned to benefit from some of the most prolific producing basins in the U.S.
5
Challenges
Responses
Proactive plan positions Eagle Rock to weather current difficult
environment and capitalize on future opportunities
Recent Events: Focused on Liquidity
• Current period of depressed commodity prices (particularly gas) negatively impacting cash flows across all segments • Concerns over current and expected natural gas prices causing a slowdown in drilling activity •Significant leverage in capital constrained environment | • Monetized 2011 / 2012 hedges when crude sold- off in January 2009 - Re-hedged volumes at $75-$82/Bbl • Reset strike prices higher on certain existing 2009 hedges to stabilize cash flows during commodity trough • Initiated cost reduction measures and rationalized capital program • Reduced distribution to re-direct estimated $75- $100 million of annual cash flow to enhance liquidity - Paid down $33 million of debt in Q2 2009 - Estimate $25 to $30 million of debt repayment in Q3 2009 • Actively reviewing asset portfolio for potential credit-enhancing divestiture opportunities | |
• Eagle Rock has moved decisively to address the challenging environment
6
Historical Performance and Growth
Adjusted EBITDA ($ in Millions) (1)
Daily Gathering Volumes (MMcfe/d)
Upstream Volumes (3)
Minerals Volumes (4)
(1) See Appendix for a definition of Adjusted EBITDA and a reconciliation to GAAP net income (loss).
(2) Compound annual growth rate based on mid-point of 2009E Adjusted EBITDA guidance.
(3) Upstream Business was created by acquisition on July 31, 2007 and was added to by acquisition on April 30, 2008.
(4) Minerals Business was created by acquisition on April 30, 2007. Q2 ‘07 is pro forma for full quarter.
7
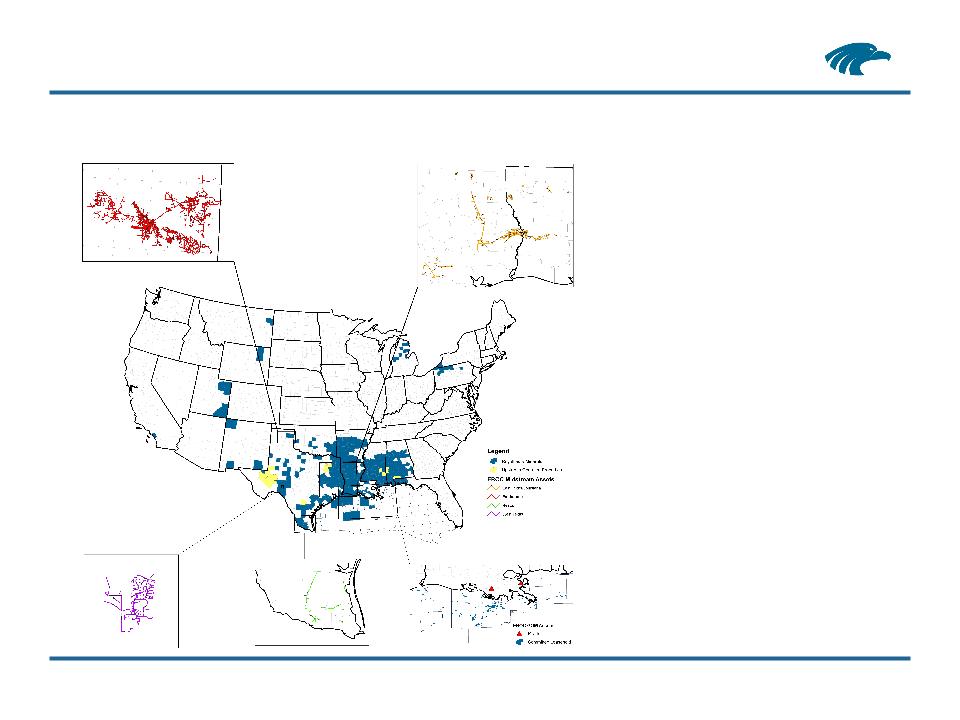
Overview of Midstream Business
Panhandle
• 3,743 miles of pipeline
• 7 processing plants
• 125,000 compression HP
• 152 MMcf/d 2008 average volume
East Texas / North Louisiana
• 1,145 miles of pipeline
• 7 processing plants
• 50,500 compression HP
• 198 MMcf/d 2008 average volume
Gulf of Mexico
• 40 miles of pipeline
• 2 processing plants
• 16,100 compression HP
• 154 MMcf/d 2008 average volume
EROC Plant
Haynesville Shale
Austin Chalk
Granite Wash
South Texas
• 279 miles of pipeline
• 3 processing stations
• 15,500 compression HP
• 89 MMcf/d 2008 average volume
8
System Update:
• Haynesville Shale: In active discussions
with a number of producers regarding
extending systems
with a number of producers regarding
extending systems
• Austin Chalk: Recently spent $3.5mm in
growth capital in Q2 ’09 to capitalize on
new drilling opportunities
growth capital in Q2 ’09 to capitalize on
new drilling opportunities
• Last four producer wells reported average
IP of approximately 12 MMcf/d
• Deep Bossier: Producers planning
wildcats this year for the play
East Texas /
North Louisiana Volumes
Haynesville Shale
Angelina River Trend
Austin Chalk
Midstream: East Texas Growth Engine
EROC Minerals
9
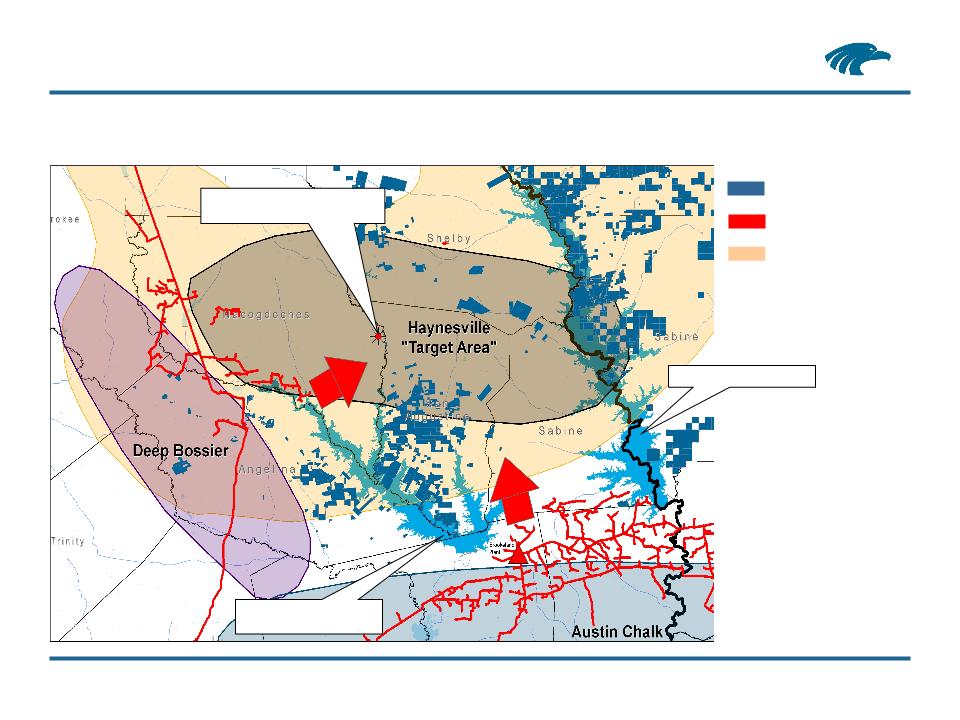
Midstream: East Texas Growth Engine (Cont’d)
EROC Minerals
EROC Midstream Assets
Haynesville Shale
EOG Resources -- Gammage #1
IP = 9.6 MMcf/d
IP = 9.6 MMcf/d
Toledo Bend Reservoir
Sam Rayburn Lake /
National Forest
National Forest
• Given natural barriers, Eagle Rock is uniquely-positioned to serve the Haynesville East Texas
“Target Area” from either the south or the west
10
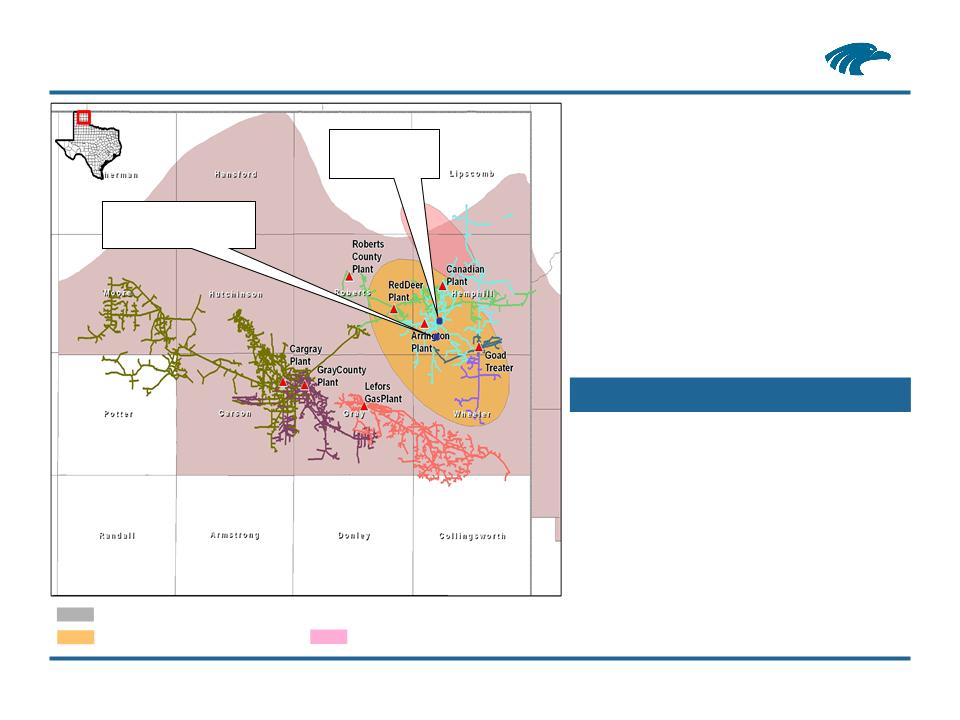
• Proven horizontal drilling potential in
Granite Wash/Greater Buffalo Wallow Area
• 21 horizontal wells drilled to date in the
play with average IP of 6.6 MMcfe/d
• Estimated drill and complete costs of $5.5
million per well
million per well
• Chesapeake horizontal drilling program
behind the Roberts County plant is
increasing volumes from 3 Mmcf/d to 21
Mmcf/d over next three months
behind the Roberts County plant is
increasing volumes from 3 Mmcf/d to 21
Mmcf/d over next three months
Drilling Economics (1)
Panhandle: Granite Wash Horizontal Drilling Potential
Granite Wash Horizontal Fairway
Lower Morrow Horizontal Fairway
Granite Wash Play
Forest Oil (FST)
FST 5-7H Zybach
FST 5-7H Zybach
IP: 17.0 MMcfe/d
Newfield Exploration/FST
Stiles/Britt Ranch
Max IP: 21.6 MMcfe/d
(1) Based on Forest Oil Corporation estimates.
Source: Industry press releases, research and company presentations.
Program | ||||
# of wells | EUR (Bcfe) | Dev. Cost ($mm) | F&D ($/Mcfe) | |
Horizontal: | ||||
Granite Wash | 3 | 19.6 | $16.6 | $0.85 |
Atoka | 3 | 20.3 | $29.7 | $1.46 |
Vertical: | ||||
40-acre spacing | 16 | 23.2 | $36.9 | $1.59 |
20-acre spacing | 32 | 46.5 | $73.8 | $1.59 |
11
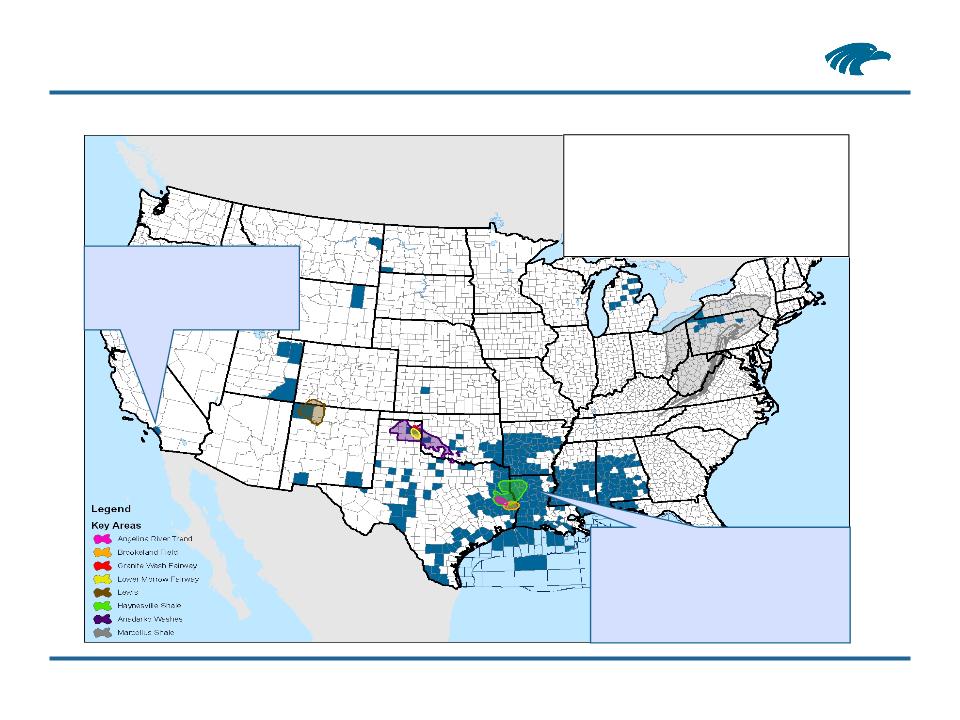
Overview of Minerals Business
Total Minerals Assets (as of 12/31/08):
• Proved Reserves: 3.6 MMboe
• % PDP: 100%
• # of Wells: > 2,800
• Oil / Gas %: 77% / 23%
• Net Acres: 430,000
• Avg. Daily Production: 1.1 MBoe/d
Permian / Upper Gulf Coast /
Mid Continent
Mid Continent
• Numerous fields
• Generated $14 million of leasing bonuses in
2008
2008
• Significant potential upside in Haynesville
Shale play
Shale play
LA Basin (Brea Olinda Field)
• Most significant individual
contributor to current royalty income
• 100% crude production with very
low decline rate
low decline rate
• Eagle Rock’s Minerals Business offers diversification, stability and upside
12
Minerals: Significant Exposure to Haynesville Shale
Existing Permits/Wells
• 36 producing wells
and 171 permitted
wells on or within one
mile of Eagle Rock’s
minerals on Louisiana-
side of Haynesville
Shale
and 171 permitted
wells on or within one
mile of Eagle Rock’s
minerals on Louisiana-
side of Haynesville
Shale
Current Production
• As of May 2009,
producing wells on
Louisiana-side of the
Haynesville Shale on
or within one mile of
Eagle Rock’s minerals
were producing a total
of approximately 114
MMcf/d
producing wells on
Louisiana-side of the
Haynesville Shale on
or within one mile of
Eagle Rock’s minerals
were producing a total
of approximately 114
MMcf/d
Source: Internal reports and Louisiana’s Department of Natural Resources website (http://sonris-www.dnr.state.la.us).
13
Regeneration + Haynesville Creates Significant Value
14
Overview of Upstream Business
Alabama Assets
• 26 Producing wells
• 73% Avg. W.I.
• 2,721 BOE/d
Permian Assets
• 252 Producing wells
• 96% Avg. W.I.
• 805 BOE/d
South TX Assets
• 11 Producing wells
• 100% Avg. W.I.
• 502 BOE/d
East TX Assets
• 33 Producing wells
• 83% Avg. W.I.
• 1,322 BOE/d
15
Total Upstream Assets (as of 12/31/08):
• Proved Reserves: 19.5 MMBoe (116.9 Bcfe)
• % PDP: 85%
• Producing Wells: 321 gross operated; 142 non-operated
• Net Production: 5.5 MBoe/d (32.8 MMcfe/d)
• R/P: 10 years
• 2008 F&D Cost: $8.82 / Boe ($1.47 / Mcfe)
• 2008 Opex: $11.16 / Boe ($1.86 / Mcfe)
• Eagle Rock’s reserves consist of long-life, diversified reserves with a high percentage of PDP
Attractive Proven Reserve Base
Reserves by Commodity
Reserves by Category
16
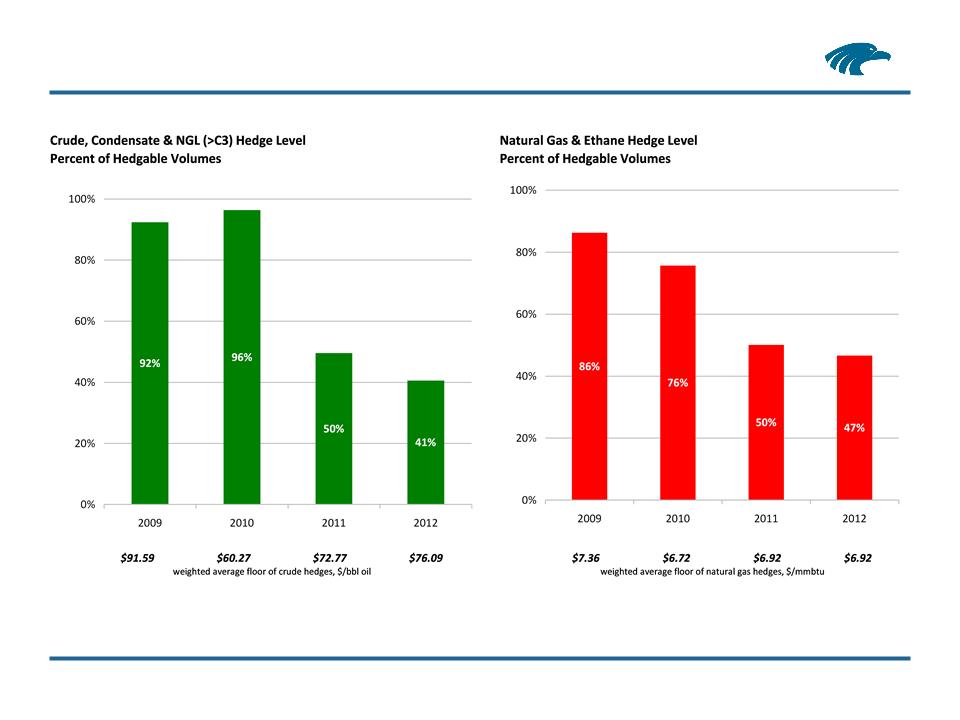
Hedging Update
(1) Prices shown reflect average price of crude hedges and exclude price impact of direct product hedges.
(2) Prices shown reflect average price of natural gas hedges and exclude price impact of direct ethane hedges.
(1)
(2)
17
Eagle Rock Credit Facility
Borrowing Base
Compliance Tests
• Supported by all Upstream properties
• Semi-annual re-determination (negotiated
process with banks) currently ongoing;
revised borrowing base expected in
October
process with banks) currently ongoing;
revised borrowing base expected in
October
• Leverage Ratio: < 5.0x 4.4x
• Interest Coverage Ratio: > 2.5x 5.4x
• Management anticipates continued covenant pressure
given current commodity price environment
Pricing: LIBOR + 187.5 bps
$669 million (1)
(1) As of June 30, 2009.
Note: Eagle Rock has repaid an additional $15 million of revolver borrowings since June 30, 2009.
18
• Despite distribution cut, Eagle Rock continues to generate significant cash flow; technical
pressure should reverse when meaningful distribution is reinstated
Significant Cash Flow Coverage
Expected Range of
$40-$45mm / Quarter
$40-$45mm / Quarter
Adjusted EBITDA
Distribution per Unit
(1) See Appendix for a definition of Adjusted EBITDA and a reconciliation to GAAP net income (loss).
(1)
19
Roadmap to Reinstating Distributions
Management intends to recommend increasing the distribution upon
achieving an appropriate leverage ratio and/or improving fundamentals
Reduce
Debt
Enhance
Adjusted EBITDA
• Use near-term cash flow to pay down credit
facility borrowings
facility borrowings
• Execute possible asset sales, if credit
enhancing
enhancing
• Access new equity
• Benefit from continued improvement in
commodity prices (all businesses)
– Rebound in natural gas price should
spur increased drilling activity in core
areas (Midstream)
spur increased drilling activity in core
areas (Midstream)
• Fund high-return organic growth projects or
attractive bolt-on acquisitions
• Further rationalize operating costs
Means to
Achieve
Goal
Appendix
21
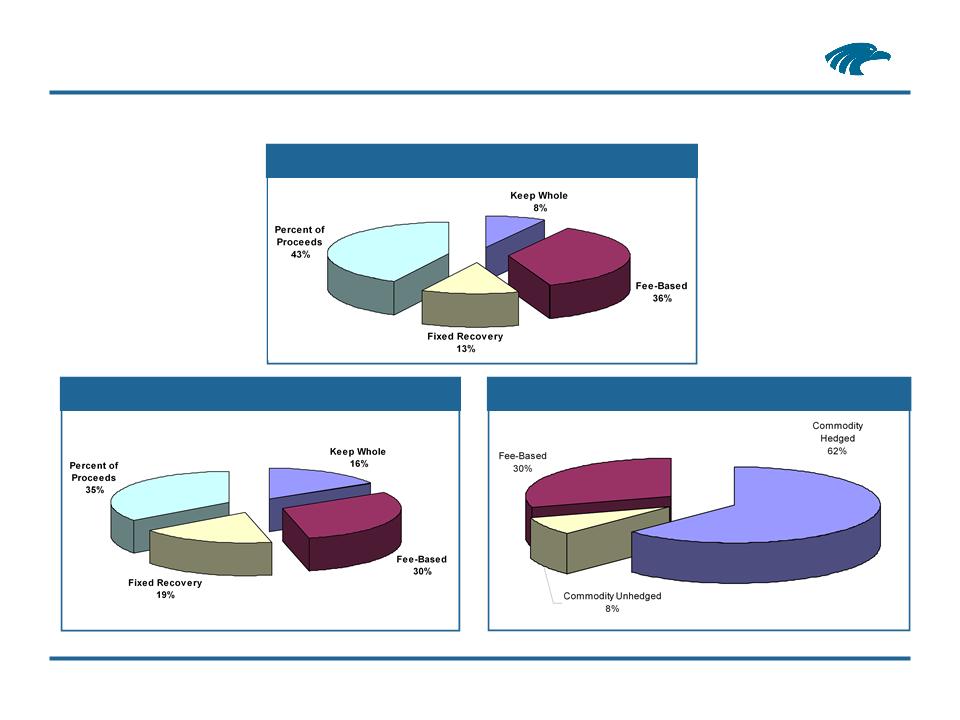
Contract Mix (July ‘09 Throughput Volumes)
Midstream Contract Mix
Contract Mix (Jan-Jul 2009 Margin)
Commodity Exposure (Jan-Jul 2009 Margin)
• Eagle Rock has a well-balanced mix of fee-based and commodity-based contracts
22
Haynesville Mineral Position Has Significant Potential Upside
• Haynesville core area of 3.4
million gross acres (versus
estimates of up to 6.4 million)
million gross acres (versus
estimates of up to 6.4 million)
• Average EURs range from 6 to
8 Bcfe / well
8 Bcfe / well
• Average IPs range from 10 to
15 MMcfe / d
15 MMcfe / d
• Current estimated rig count of
80 rises to 160 by mid-2010
and held constant thereafter
80 rises to 160 by mid-2010
and held constant thereafter
• Expect 4 to 6 wells per section
over 30 years
over 30 years
• Based on strip pricing as of
mid-May, 2009
mid-May, 2009
Assumptions
Forecast Net Minerals Production Potential from Haynesville
Note:
EUR = Estimated ultimate recovery
IP = Initial production
• Eagle Rock’s position in emerging Haynesville play could be worth $75 to $100 million, based on
internal estimates and assumptions listed below
• Management expects the impact from the Haynesville could more than double production from
the Minerals Business in the next 7 years
23
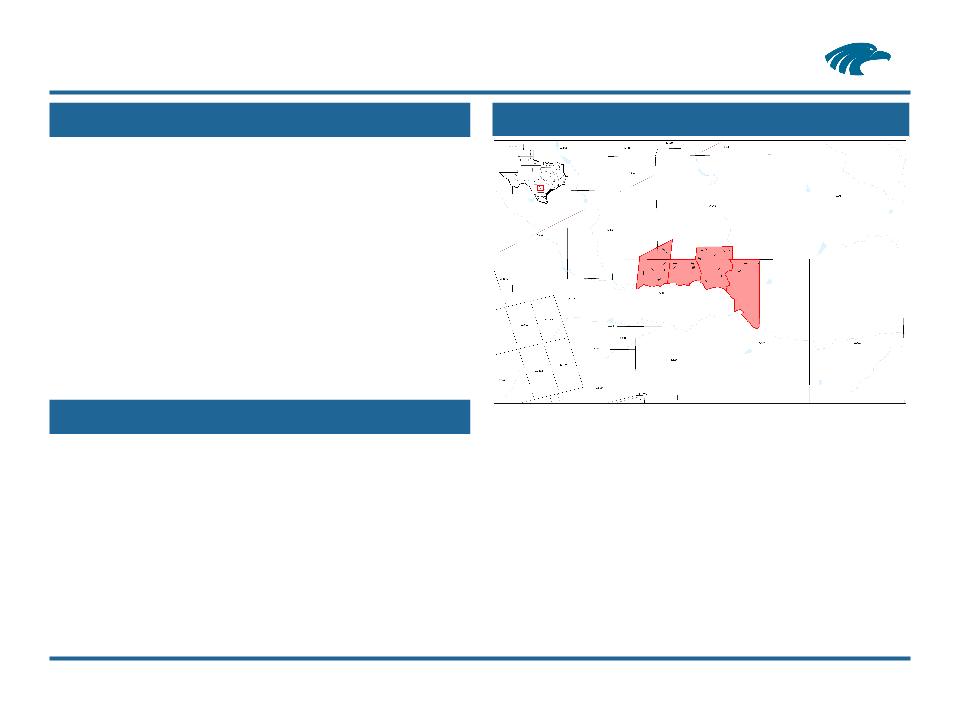
System Overview
Map of East Texas System
Producer Activity
Midstream: East Texas System
• Miles of Pipeline: 1,145
• Processing Plants: 7
• Compression HP: 50,500
• Contract Mix (1): Fixed Fee 48%
Commodity-based 52%
• 2008 Adj. EBITDA: $36.4 million
• Q2 2009 Adj. EBITDA: $6.8 million
• 2008 Capex: $17.4 million
• Producing Formations: Austin Chalk
James Lime Trend
James Lime Trend
Travis Peak
Haynesville Shale
Cotton Valley
Woodbine
(1) As of December 31, 2008.
• Acquired Millennium Midstream Partners in October 2008, adding 94 MMcf/d of fixed-fee business
• Major producers are Anadarko Petroleum, Encana Oil & Gas Inc., Ergon Exploration Inc., Goodrich Petroleum
Corporation
Corporation
• Austin Chalk play is major driver in near-term future volume growth in Brookeland system with five additional wells
scheduled for 2009
scheduled for 2009
• East Texas Main Line (ETML) System continues to see drilling activity into the James Lime and Travis Peak formations
• Haynesville potential in near proximity to Eagle Rock’s ETML, Panola and Belle Bower systems
24
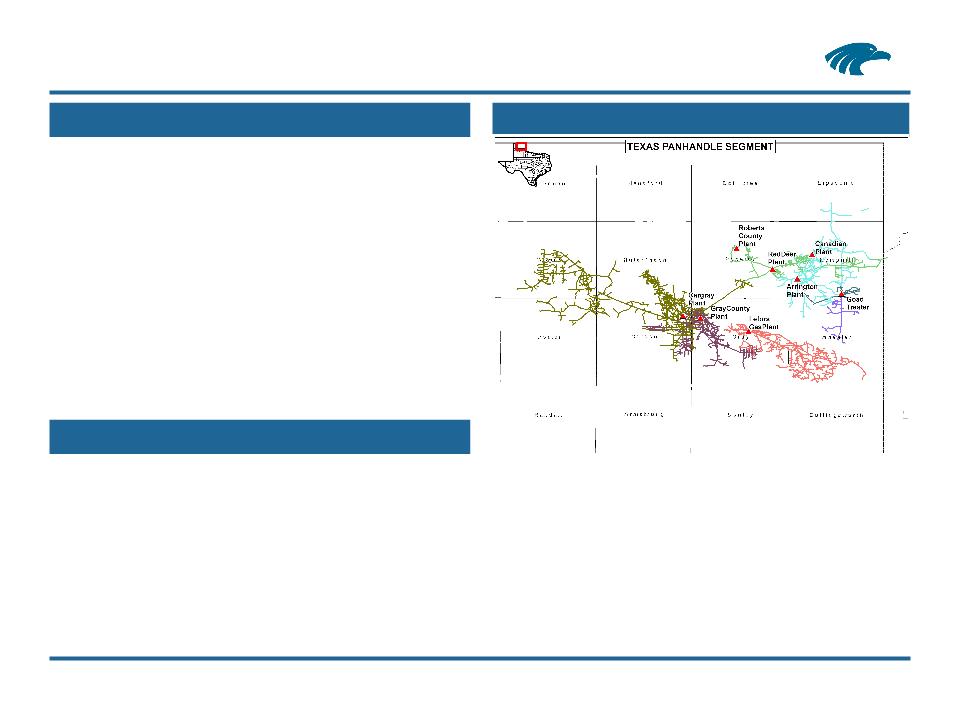
System Overview
Map of North Texas / Panhandle System
Producer Activity
Midstream: North Texas / Panhandle System
• Miles of Pipeline: 3,743
• Processing Plants: 7
• Compression HP: 125,000
• Contract Mix (1): Fixed Fee 15%
Commodity-based 85%
• 2008 Adj. EBITDA: $109.7 million
• Q2 2009 Adj. EBITDA: $11.5 million
• 2008 Capex: $30.7 million
• Producing Formations: Granite Wash
; Morrow
; Morrow
160; Brown Dolomite
160; Cleveland
• Major producers are BP, Cimarex, Cordillera, Chesapeake, Chevron and Excel Production
• Gathered volumes have remained relatively flat for last 3 years
– West Panhandle is a rich gas (average 8 GPM) on a shallow annual decline of ~9%
– East Panhandle is a leaner gas (average 3 GPM) with growing volumes
– Granite Wash is the primary driver of volume growth in the East Panhandle
ú Horizontal drilling being applied with encouraging results (average IPs of 6 to 10 MMcf/d)
– Activity has slowed due to lower commodity prices
(1) As of December 31, 2008.
25
System Overview
Map of South Texas System
Producer Activity
Midstream: South Texas System
• Major producers are Chesapeake and Sanchez Oil &
Gas in South Texas and FIML on the Wildhorse
system
Gas in South Texas and FIML on the Wildhorse
system
• Acquired Wildhorse system as part of Millennium
Midstream Partners in October 2008
• Wildhorse system is primarily low decline Canyon
Sands production
Sands production
• Activity has slowed due to lower commodity prices
• Miles of Pipeline: 279
• Processing JT Skids: 3
• Compression HP: 15,500
• Contract Mix (1): Fixed Fee 98%
Commodity-based 2%
• 2008 Adj. EBITDA: $10.6 million
• Q2 2009 Adj. EBITDA: $1.1 million
• 2008 Capex: $1.1 million
(1) As of December 31, 2008.
26
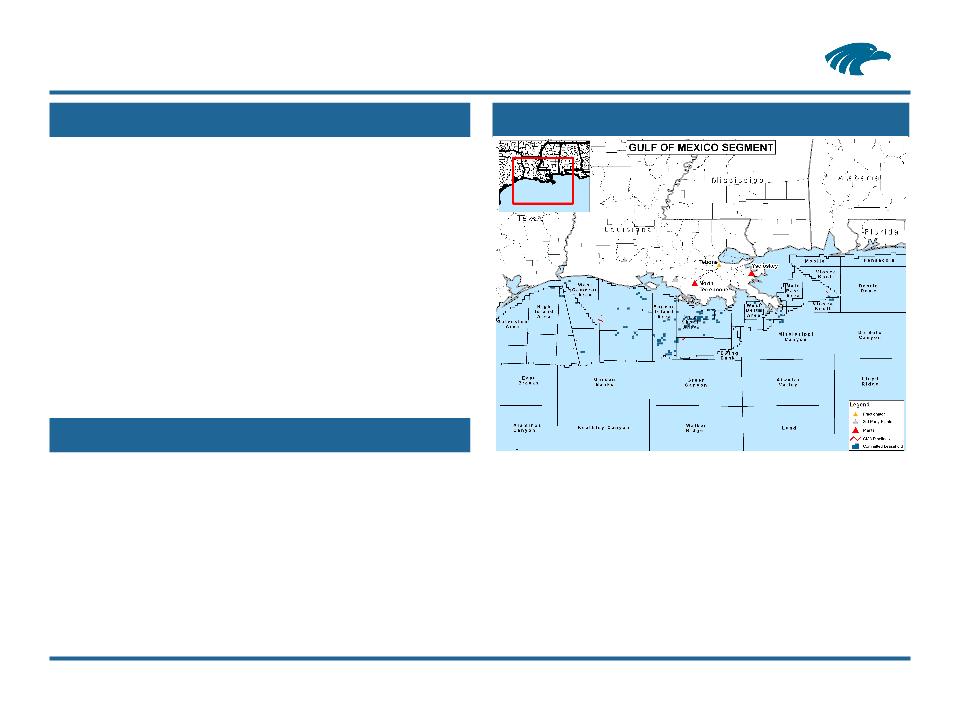
System Overview
Gulf of Mexico System
Producer Activity
Midstream: Gulf of Mexico System
• Miles of Pipeline: 40
• Processing Plants: 2 (non-operated)
• Compression HP: 16,100
• Contract Mix (1): Fixed Fee 9%
Commodity-based 91%
• 2008 Adj. EBITDA: ($0.3) million
• Q2 2009 Adj. EBITDA: $1.9 million
• 2008 Capex: Zero
• Acquired as part of Millennium Midstream Partners in October 2008
• Q4 2008 volumes curtailed due to damage from Hurricane Ike and Gustav
– Volumes continued to be curtailed at Yscloskey due to 3rd party offshore pipelines undergoing repair
– Currently at approximately 70% of pre-hurricane volumes of 200 MMcf/d
ú Major producers are Stone Energy and McMoran Exploration
ú Currently approximately 115 blocks committed to life-of-lease contracts
– Contracts are life-of-lease commitments of the leases on a percent of proceeds with fixed floors
(1) As of December 31, 2008.
27
Asset Overview
Permian Basin Properties
Q2 2009 Operating Statistics
Upstream: Permian Basin
• Acquisition Date: April 30, 2008
• Texas Counties: Ward, Crane, Pecos
• Operating Producing Wells: 252
• Net Acreage: 24,000
• Net Reserves: 6.5 MMboe (38.8 Bcfe)
• Average Operated W.I.: 96%
• Producing Formations: Yates, Queen, San
; Andres, Wichita
0; Albany, Holt,
Wolfcamp and Penn
; Andres, Wichita
0; Albany, Holt,
Wolfcamp and Penn
Net Production:
• Gas MMcf/d: 1.6
• Oil Bo/d: 383
• NGLs Bl/d: 216
• Total BOE/d: 858
Financial Summary
• Revenue ($ in millions): $2.8
• Operating Expense ($ in millions) (1): $0.8
• Unit Operating Expense ($/BOE): $10.76
(1) Excluding taxes.
28
Asset Overview
Alabama Properties
Q2 2009 Operating Statistics
Upstream: Alabama
• Acquisition Date: July 31, 2007
• Alabama Counties: Escambia, Choctaw
• Operating Producing Wells: 26
• Net Acreage: 13,000
• Net Reserves: 7.1 MMboe (42.7 Bcfe)
• Average Operated W.I.: 73%
• Producing Formations: Smackover
• Gas Stream Composition (+/-): 20% H2S
; 45% CO2
; 45% CO2
• Assets include two treating plants (100 MMcf/d
capacity) and one cryogenic processing plant (50
MMcf/d) to remove H2S and CO2 prior to sales
capacity) and one cryogenic processing plant (50
MMcf/d) to remove H2S and CO2 prior to sales
Net Production:
• Gas MMcf/d: 3.2
• Oil Bo/d: 1,550
• NGLs Bl/d: 452
• Sulfur LT/d: 273
• Total BOE/d: 2,535
Financial Summary
• Revenue ($ in millions): $7.8
• Operating Expense ($ in millions) (1): $3.0
• Unit Operating Expense ($/BOE): $13.05
Florida / Alabama State Border
(1) Excluding taxes.
29
Asset Overview
East Texas Properties
Q2 2009 Operating Statistics
Upstream: East Texas
• Acquisition Date: July 31, 2007
• Texas Counties: Wood, Rains, Van
; Zandt, Henderson
; Zandt, Henderson
• Operating Producing Wells: 33
• Net Acreage: 16,000
• Net Reserves: 4.8 MMboe (28.6 Bcfe)
• Average Operated W.I.: 83%
• Producing Formations: Smackover
• Gas Composition: 20-40% H2S
• Eagle Rock’s East Texas production is treated and
processed by Regency Field Services’ Eustace
facilities
processed by Regency Field Services’ Eustace
facilities
Net Production:
• Gas MMcf/d: 2.7
• Oil Bo/d: 293
• NGLs Bl/d: 684
• Sulfur LT/d: 160
• Total BOE/d: 1,429
Financial Summary
• Revenue ($ in millions): $2.7
• Operating Expense ($ in millions) (1): $0.7
• Unit Operating Expense ($/BOE): $5.76
(1) Excluding taxes.
30
Asset Overview
South Texas Properties
Q2 2009 Operating Statistics
Upstream: South Texas
• Acquisition Date: July 31, 2007
• Texas Counties: Atascosa
• Operating Producing Wells: 11
• Net Acreage: 1,400
• Net Reserves: �� 1.1 MMboe (6.7 Bcfe)
• Average Operated W.I.: 100%
• Producing Formations: Edwards
• Successful re-completion program conducted in 2008
with infill drilling locations identified for future
development
with infill drilling locations identified for future
development
Net Production:
• Gas MMcf/d: 2.4
• Oil Bo/d: 23
• Total BOE/d: 416
Financial Summary
• Revenue ($ in millions): $0.9
• Operating Expense ($ in millions) (1): $0.3
• Unit Operating Expense ($/BOE): $8.05
(1) Excluding taxes.
31
This presentation includes, and certain statements made during this presentation may include, the non-generally accepted accounting
principles, or non-GAAP, financial measures of Adjusted EBITDA. The accompanying non-GAAP financial measures schedule provides
reconciliations of Adjusted EBITDA to its most directly comparable financial measure calculated and presented in accordance with accounting
principles generally accepted in the United States, or GAAP, with respect to the references to Adjusted EBITDA that are of a historical nature.
Where references are forward-looking or prospective in nature, and not based in historical fact, this presentation does not provide a
reconciliation. Eagle Rock could not provide such reconciliation without undue hardship because the Adjusted EBITDA numbers included in
the presentation, and that may be included in certain statements made during the presentation, are estimations, approximations and/or
ranges. In addition, it would be difficult for Eagle Rock to present a detailed reconciliation on account of many unknown variables for the
reconciling items. For an example of the reconciliation, please consult the reconciliations included for the historical Adjusted EBITDA numbers
in this appendix. Non-GAAP financial measures should not be considered as alternatives to GAAP measures such as net income (loss),
operating income (loss), cash flows from operating activities or any other GAAP measure of liquidity or financial performance.
Eagle Rock defines Adjusted EBITDA as net income (loss) plus or (minus) income tax provision (benefit); interest-net, including realized
interest rate risk management instruments and other expense; depreciation, depletion and amortization expense, impairment expense; other
operating expense, non-recurring; other non-cash operating and general and administrative expenses, including non-cash compensation
related to our equity-based compensation program; unrealized (gains) losses on commodity and interest rate risk management related
instruments; (gains) losses on discontinued operations and other (income) expenses.
Eagle Rock uses Adjusted EBITDA as a measure of its core profitability to assess the financial performance of its assets. Adjusted EBITDA
also is used as a supplemental financial measure by external users of Eagle Rock’s financial statements such as investors, commercial banks
and research analysts. For example, Eagle Rock’s lenders under its revolving credit facility use a variant of Eagle Rock’s Adjusted EBITDA in a
compliance covenant designed to measure the viability of Eagle Rock and its ability to perform under the terms of its revolving credit facility;
Eagle Rock, therefore, uses Adjusted EBITDA to measure its compliance with its revolving credit facility. Eagle Rock believes that investors
benefit from having access to the same financial measures that its management uses in evaluating performance. Adjusted EBITDA is useful in
determining Eagle Rock’s ability to sustain or increase distributions. By excluding unrealized derivative gains (losses), a non-cash, mark-to-
market benefit (charge) which represents the change in fair market value of Eagle Rock’s executed derivative instruments and is independent
of its assets’ performance or cash flow generating ability, Eagle Rock believes Adjusted EBITDA reflects more accurately Eagle Rock’s ability
to generate cash sufficient to pay interest costs, support its level of indebtedness, make cash distributions to its unitholders and general
partner and finance its maintenance capital expenditures. Eagle Rock further believes that Adjusted EBITDA also describes more accurately
the underlying performance of its operating assets by isolating the performance of its operating assets from the impact of an unrealized, non-
cash measure designed to describe the fluctuating inherent value of a financial asset. Similarly, by excluding the impact of non-recurring
discontinued operations, Adjusted EBITDA provides users of the Partnership’s financial statements a more accurate picture of its current
assets’ cash generation ability, independently from that of assets which are no longer a part of its operations.
Use of Non-GAAP Financial Measures
32
Eagle Rock’s Adjusted EBITDA definition may not be comparable to Adjusted EBITDA or similarly titled measures of other entities, as other
entities may not calculate Adjusted EBITDA in the same manner as Eagle Rock. For example, Eagle Rock includes in Adjusted EBITDA the
actual settlement revenue created from its commodity hedges by virtue of transactions undertaken by it to reset commodity hedges to higher
prices or purchase puts or other similar floors despite the fact that Eagle Rock excludes from Adjusted EBITDA any charge for amortization of
the cost of such commodity hedge reset transactions or puts. Eagle Rock has reconciled historical Adjusted EBITDA numbers to the GAAP
financial measure of net income (loss) in the appendix to this presentation but has not reconciled prospective Adjusted EBITDA numbers.
Use of Non-GAAP Financial Measures (Continued)
33
Adjusted EBITDA Reconciliation