| Item 6. | Selected Financial Data. |
The following table shows selected historical financial data of our predecessor, ONEOK Texas Field Services L.P., and of Eagle Rock Pipeline, L.P. and Eagle Rock Energy Partners, L.P. ONEOK Texas Field Services, L.P. is treated as our and Eagle Rock Pipeline, L.P.’s predecessor and is referred to as “Eagle Rock Predecessor” throughout this report because of the substantial size of the operations of ONEOK Texas Field Services, L.P. as compared to Eagle Rock Pipeline, L.P. and the fact that all of Eagle Rock Pipeline, L.P.’s operations at the time of the acquisition of ONEOK Texas Field Services, L.P. related to an investment that was managed and operated by others. References in this report to “Eagle Rock Pipeline” refer to Eagle Rock Pipeline, L.P., which is the acquirer of Eagle Rock Predecessor and the entity contributed to us in connection with our initial public offering.
Our historical results of operations for the periods presented below may not be comparable either from period to period or going forward, for the following reasons:
| | • | On December 5, 2003, Eagle Rock Pipeline commenced operations by acquiring the Dry Trail plant from Williams Field Service Company for approximately $18.0 million, and in July 2004, Eagle Rock Pipeline sold the Dry Trail Plant to Celero Energy, L.P. for approximately $37.4 million, resulting in a pre-tax realized gain in the disposition of approximately $19.5 million in 2004. The Dry Trail operations are reflected as discontinued operations for Eagle Rock Pipeline for 2004. |
| | • | The purchase price paid in connection with the acquisition of Eagle Rock Predecessor on December 1, 2005 was “pushed down” to the financial statements of Eagle Rock Energy Partners, L.P. As a result of this “push-down” accounting, the book basis of our assets was increased to reflect the purchase price, which had the effect of increasing our depreciation expense. |
| | • | In connection with our acquisition of the Eagle Rock Predecessor, our interest expense subsequent to December 1, 2005 increased due to the increased debt incurred. |
| | • | After our acquisition of Eagle Rock Predecessor, we initiated a risk management program comprised of puts, costless collars and swaps for crude oil, natural gas and NGLs, as well as interest rate swaps that we account for using mark-to-market accounting. The amounts related to commodity hedges are included in unrealized/realized gain (loss) derivatives gains (losses) and the amounts related to interest rate swaps are included in interest expenses (income). |
| | • | The historical results of Eagle Rock Predecessor only include the financial results of ONEOK Texas Field Services L.P.. |
| | • | Our historical financial results for periods prior to December 31, 2005 do not include the full financial results from the operation of the Tyler County pipeline. |
| | • | On March 27, 2006, Eagle Rock Pipeline completed a private placement of 5,455,050 common units for $98.3 million. |
| | • | On March 31, 2006 and April 7, 2006, a wholly-owned subsidiary of Eagle Rock Energy Partners, L.P. acquired certain natural gas gathering and processing assets from Duke Energy Field Services, L.P. and Swift Energy Corporation, consisting of the Brookeland gathering system and processing plant, the Masters Creek gathering system and the Jasper NGL pipeline. We refer to this acquisition as the Brookeland Acquisition. As a result, our historical financial results for the periods prior to March 31, 2006 do not include the financial results from the operation of these assets. |
| | • | On June 2, 2006, we purchased all of the partnership interests in Midstream Gas Services, L.P., which we refer to as the MGS Acquisition, an NGP affiliate, for approximately $4.7 million in cash and 809,174 (recorded value of $20.3 million) common units in Eagle Rock Pipeline. As a result, financial results for the periods prior to June 2006 do not include the financial results from the operation of these assets. |
| | • | On April 30, 2007, we acquired certain fee minerals, royalties and working interest properties through purchases directly from Montierra Minerals & Production, L.P. and through purchases directly from NGP-VII Income Co-Investment Opportunities, L.P., which we refer to as the Montierra Acquisition, for 6,458,946 (recorded value of $133.8 million) of our common units and $5.4 million in cash. As a result, financial results for the periods prior to May 2007 do not include the financial results from these assets. |
| | • | On May 3, 2007, we acquired Laser Midstream Energy, L.P. and certain of its subsidiaries, which we refer to as the Laser Acquisition, for $113.4 million in cash and 1,407,895 (recorded value of $29.2 million) of our common units. As a result, financial results for the periods prior to May 2007 do not include the financial results from these assets. |
| | • | On May 3, 2007, we completed the private placement of 7,005,495 common units for $127.5 million. |
| | • | On June 18, 2007, we acquired certain fee minerals and royalties from MacLondon Energy, L.P., which we refer to as the MacLondon Acquisition, for $18.2 million, financed with 757,065 (recorded value of $18.1 million) of our common units and cash of $0.1 million. As a result, financial results for the periods prior to July 2007 do not include the financial results from these assets. |
| | • | On July 31, 2007, we completed the acquisition of Escambia Asset Co. LLC and Escambia Operating Co. LLC, which we refer to as the EAC Acquisition, for approximately $224.6 million in cash and 689,857 (recorded value of $17.2 million) of our common units, subject to post-closing adjustment. As a result, financial results for the periods prior to July 31, 2007 do not include the financial results from these assets. |
| | • | On July 31, 2007, we completed the acquisition of Redman Energy Holdings, L.P. and Redman Energy Holdings II, L.P. and certain assets owned by NGP Income Co-Investment Opportunities Fund II, L.P. (a Natural Gas Partners affiliate) which we refer to as the Redman Acquisition, for 4,428,334 (recorded value of $108.2 million) common units and $84.6 million. As a result, financial results for the periods prior to July 2007 do not include the financial results from these assets. |
| | • | On July 31, 2007, we completed the private placement of 9,230,770 common units for approximately $204.0 million. |
| | • | On April 30, 2008, we completed the acquisition of Stanolind Oil and Gas Corp., which we refer to as the Stanolind Acquisition, for an aggregate purchase price of $81.9 million in cash. As a result, financial results for the periods prior to May 2008 do not include the financial results from these assets. |
| | • | On October 1, 2008 we completed the acquisition of Millennium Midstream Partners, L.P., which we refer to as the Millennium Acquisition, for approximately $181.0 million in cash and 2,181,818 (recorded value of $24.2 million) of our common units. Additionally, 1,818,182 common units and $0.6 million in cash were placed into an escrow account. Prior to December 31, 2008, we recovered 40,880 common units and $0.3 million in cash from the escrow account. As a result, financial results for the periods prior to October 2008 do not include the financial results from these assets. |
The selected historical financial data as of and for the year ended December 31, 2004 and as of and for the eleven month period ended November 30, 2005 are derived from the audited financial statements of Eagle Rock Predecessor and as of and for the years ended December 31, 2004, and 2005 are derived from the audited financial statements of Eagle Rock Pipeline, L.P. The selected historical financial data as of and for the years ended December 31, 2006, 2007, and 2008 are derived from the audited financial statements of Eagle Rock Energy Partners, L.P.
The following table includes the non-GAAP financial measure of Adjusted EBITDA. We define Adjusted EBITDA as net income (loss) plus or (minus) income tax provision (benefit); interest-net, including realized interest rate risk management instruments and other expense; depreciation, depletion and amortization expense, impairment expense; other operating expense, non-recurring; other non-cash operating and general and administrative expenses, including non-cash compensation related to our equity-based compensation program; unrealized (gains) losses on commodity and interest rate risk management related instruments; and other (income) expense. Adjusted EBITDA is used as a supplemental financial measure by external users of Eagle Rock’s financial statements such as investors, commercial banks and research analysts. Adjusted EBITDA is useful in determining our ability to sustain or increase distributions. By excluding unrealized derivative gains (losses), a non-cash, mark-to-market benefit (charge) which represents the change in fair market value of our executed derivative instruments and is independent of our assets’ performance or cash flow generating ability, we believe Adjusted EBITDA reflects more accurately our ability to generate cash sufficient to pay interest costs, support our level of indebtedness, make cash distributions to our unitholders and general partner and finance our maintenance capital expenditures. We further believe that Adjusted EBITDA, by excluding unrealized derivative gains (losses), also describes more accurately the underlying performance of our operating assets by isolating the performance of our operating assets from the impact of an unrealized, non-cash measure designed to describe the fluctuating inherent value of a financial asset. Similarly, by excluding the impact of non-recurring discontinued operations, Adjusted EBITDA provides users of our financial statements a more accurate picture of our current assets’ cash generation ability, independently from that of assets which are no longer a part of our operations. Eagle Rock’s Adjusted EBITDA definition may not be comparable to Adjusted EBITDA or similarly titled measures of other entities, as other entities may not calculate Adjusted EBITDA in the same manner as Eagle Rock. For example, we include in Adjusted EBITDA the actual settlement revenue created from our commodity hedges by virtue of transactions undertaken by us to reset commodity hedges to higher prices or purchase puts or other similar floors despite the fact that we exclude from Adjusted EBITDA any charge for amortization of the cost of such commodity hedge reset transactions or puts. For a reconciliation of Adjusted EBITDA to its most directly comparable financial measures calculated and presented in accordance with GAAP (accounting principles generally accepted in the United States), please read “Summary—Non-GAAP Financial Measures.”
| | | | | | Eagle Rock Pipeline, L.P. | | | Eagle Rock Energy Partners, L.P. | |
| | | Year Ended December 31, 2004 | | | Period from January 1, 2005 to November 30, 2005 | | | Year Ended December 31, 2004 | | | Year Ended December 31, 2005(1) | | | Year Ended December 31, 2006 | | | Year Ended December 31, 2007 | | | Year Ended December 31, 2008 | |
| Statement of Operations Data: | | | | | | | | | | | | | | | | | | | | | |
Sales to external customers | | $ | 335,519 | | | $ | 396,953 | | | $ | 10,636 | | | $ | 66,382 | | | $ | 502,394 | | | $ | 775,857 | | | $ | 1,316,500 | |
| Unrealized derivative gains/(losses) | | | — | | | | — | | | | — | | | | 7,308 | | | | (26,306 | ) | | | (130,773 | ) | | | 207,824 | |
| Realized derivative gains/(losses) | | | — | | | | — | | | | — | | | | — | | | | 2,302 | | | | (3,061 | ) | | | (46,059 | ) |
| Total revenues | | | 335,519 | | | | 396,953 | | | | 10,636 | | | | 73,690 | | | | 478,390 | | | | 642,023 | | | | 1,478,265 | |
| Cost of natural gas and NGLs | | | 263,840 | | | | 316,979 | | | | 8,811 | | | | 55,272 | | | | 377,580 | | | | 553,248 | | | | 891,433 | |
Operating and maintenance expense | | | 25,219 | | | | 25,326 | | | | 34 | | | | 2,955 | | | | 32,905 | | | | 52,793 | | | | 73,620 | |
Non-income based taxes | | | 2,208 | | | | 2,192 | | | | — | | | | 149 | | | | 2,301 | | | | 8,340 | | | | 19,936 | |
| General and administrative expense | | | — | | | | — | | | | 2,406 | | | | 4,616 | | | | 10,860 | | | | 27,799 | | | | 45,701 | |
| Other operating | | | — | | | | — | | | | — | | | | — | | | | — | | | | 2,847 | | | | 10,699 | |
| Advisory termination fee | | | — | | | | — | | | | — | | | | — | | | | 6,000 | | | | — | | | | — | |
| Depreciation, depletion and amortization expense | | | 8,268 | | | | 8,157 | | | | 619 | | | | 4,088 | | | | 43,220 | | | | 80,559 | | | | 116,754 | |
| Impairment expense | | | — | | | | — | | | | — | | | | — | | | | — | | | | 5,749 | | | | 174,851 | |
| Operating income (loss) | | | 35,984 | | | | 44,299 | | | | (1,234 | ) | | | 6,610 | | | | 5,524 | | | | (89,312 | ) | | | 145,271 | |
| Interest (income) expense | | | (646 | ) | | | (859 | ) | | | — | | | | 4,031 | | | | 28,604 | | | | 49,764 | | | | 65,022 | |
Other (income) expense | | | (23 | ) | | | (17 | ) | | | (24 | ) | | | (171 | ) | | | (996 | ) | | | 7,530 | | | | (4,373 | ) |
| Income (loss) from continuing operations before income taxes | | | 36,653 | | | | 45,175 | | | | (1,210 | ) | | | 2,750 | | | | (22,084 | ) | | | (146,606 | ) | | | 84,622 | |
| Income tax provision | | | 12,731 | | | | 15,811 | | | | — | | | | — | | | | 1,230 | | | | 158 | | | | (1,134 | ) |
Income (loss) from continuing operations | | | 23,922 | | | | 29,364 | | | | (1,210 | ) | | | 2,750 | | | | (23,314 | ) | | | (146,764 | ) | | | 85,756 | |
| Discontinued operations | | | — | | | | — | | | | 22,192 | | | | — | | | | — | | | | 1,130 | | | | 1,764 | |
| Net income (loss) | | $ | 23,922 | | | $ | 29,364 | | | $ | 20,982 | | | $ | 2,750 | | | $ | (23,314 | ) | | $ | (145,634 | ) | | $ | 87,520 | |
| Loss (income) per common unit - diluted | | $ | — | | | $ | — | | | $ | — | | | $ | — | | | $ | (0.98 | ) | | $ | (2.13 | ) | | $ | 1.18 | |
| | | | | | | | | | | | | | | | | | | | | | | | | | | | | |
| | | | | | | | | | | | | | | | | | | | | | | | | | | | | |
| Balance Sheet Data (at period end): | | | | | | | | | | | | | | | | | | | | | | | | | | | | |
| Property plant and equipment, net | | $ | 243,939 | | | $ | 242,487 | | | $ | 19,564 | | | $ | 441,588 | | | $ | 554,063 | | | $ | 1,207,130 | | | $ | 1,357,609 | |
| Total assets | | | 304,631 | | | | 376,447 | | | | 28,017 | | | | 700,659 | | | | 779,901 | | | | 1,609,927 | | | | 1,773,061 | |
| Long-term debt | | | — | | | | — | | | | — | | | | 408,466 | | | | 405,731 | | | | 567,069 | | | | 799,383 | |
| Net equity | | | 204,344 | | | | 233,708 | | | | 27,655 | | | | 208,096 | | | | 291,987 | | | | 726,768 | | | | 727,715 | |
| | | | | | | | | | | | | | | | | | | | | | | | | | | | | |
| Cash Flow Data: | | | | | | | | | | | | | | | | | | | | | | | | | | | | |
| Net cash flows provided by (used in): | | | | | | | | | | | | | | | | | | | | | | | | | | | | |
| Operating activities | | $ | 41,813 | | | $ | 47,603 | | | $ | 3,652 | | | $ | (1,667 | ) | | $ | 54,992 | | | $ | 106,945 | | | $ | 181,151 | |
| Investing activities | | | (5,567 | ) | | | (6,708 | ) | | | 16,918 | | | | (543,501 | ) | | | (134,873 | ) | | | (475,790 | ) | | | (334,603 | ) |
| Financing activities | | | (36,246 | ) | | | (40,895 | ) | | | (13,955 | ) | | | 556,304 | | | | 71,088 | | | | 426,816 | | | | 102,816 | |
| Other Financial Data: | | | | | | | | | | | | | | | | | | | | | | | | | | | | |
| Cash distributions per Common Unit (declared) | | $ | — | | | $ | — | | | $ | — | | | $ | — | | | $ | 0.2679 | | | $ | 1.485 | | | $ | 1.63 | |
| Adjusted EBITDA(2) | | $ | 44,275 | | | $ | 52,473 | | | $ | (591 | ) | | $ | 3,561 | | | $ | 81,192 | | | $ | 132,216 | | | $ | 247,445 | |
| | | | | | | | | | | | | | | | | | | | | | | | | | | | | |
| | (1) | Includes historical financial and operating data for Eagle Rock Predecessor for the period from December 1, 2005 to December 31, 2005. Prior to the December 1, 2005 acquisition of the Eagle Rock Predecessor, the operations of Eagle Rock Pipeline, L.P. were minimal. |
| | (2) | See Part II Item 6. Selection Financial Data – Non-GAAP Financial Measures for reconciliation of “Adjusted EBITDA” to net cash flows from operating activities and net income (loss). |
Non-GAAP Financial Measures
We include in this filing the following non-GAAP financial measure: Adjusted EBITDA (as defined on page 80). We provide reconciliations of this non-GAAP financial measure to its most directly comparable financial measures as calculated and presented in accordance with GAAP.
Adjusted EBITDA should not be considered an alternative to net income, operating income, cash flows from operating activities or any other measure of financial performance presented in accordance with GAAP.
Adjusted EBITDA does not include interest expense, income taxes or depreciation and amortization expense. Because we have borrowed money to finance our operations, interest expense is a necessary element of our costs and our ability to generate net income. Because we use capital assets, depreciation and amortization are also necessary elements of our costs. Therefore, any measures that exclude these elements have material limitations. To compensate for these limitations, we believe that it is important to consider both net income determined under GAAP, as well as Adjusted EBITDA, to evaluate our liquidity. Our Adjusted EBITDA excludes some, but not all, items that affect net income and operating income and these measures may vary among companies. Therefore, our Adjusted EBITDA may not be comparable to similarly titled measures of other companies. For example, we include in Adjusted EBITDA the actual settlement revenue created from our commodity hedges by virtue of transactions undertaken by us to reset commodity hedges to higher prices or purchase puts or other similar floors despite the fact that we exclude from Adjusted EBITDA any charge for amortization of the cost of such commodity hedge reset transactions or puts.
| | | | | | | | | | | | | | | | | | | | | | |
| | | | | | Eagle Rock Pipeline, L.P. | | | Eagle Rock Energy Partners, L.P. | |
| | | Year Ended December 31, 2004 | | | Period from January 1, 2005 to November 30, 2005 | | | Year Ended December 31, 2004 | | | Year Ended December 31, 2005(1) | | | Year Ended December 31, 2006 | | | Year Ended December 31, 2007 | | | Year Ended December 31, 2008 | |
| Reconciliation of “Adjusted EBITDA” to net cash flows provided by (used in) operating activities and net income (loss): | | | | | | | | | | | | | | | | | | | | | |
| Net cash flows provided by (used in) operating activities | | $ | 41,813 | | | $ | 47,603 | | | $ | 3,652 | | | $ | (1,667 | ) | | $ | 54,992 | | | $ | 106,945 | | | $ | 181,151 | |
| Add (deduct): | | | | | | | | | | | | | | | | | | | | | | | | | | | | |
| Depreciation, depletion, amortization and impairment | | | (8,268 | ) | | | (8,157 | ) | | | (1,174 | ) | | | (4,088 | ) | | | (43,220 | ) | | | (86,308 | ) | | | (291,605 | ) |
Amortization of debt issue cost | | | — | | | | — | | | | — | | | | (76 | ) | | | (1,114 | ) | | | (1,777 | ) | | | (958 | ) |
| Risk management portfolio value changes | | | — | | | | — | | | | — | | | | 5,709 | | | | (23,531 | ) | | | (136,132 | ) | | | 199,339 | |
| Reclassing financing derivative settlements | | | — | | | | — | | | | — | | | | — | | | | 978 | | | | (1,667 | ) | | | (11,063 | ) |
Other | | | (7,325 | ) | | | (1,559 | ) | | | — | | | | (6 | ) | | | (7,566 | ) | | | (8,235 | ) | | | (4,433 | ) |
Gain on sale of Dry Trail plant | | | — | | | | — | | | | 19,465 | | | | — | | | | — | | | | — | | | | — | |
| Accounts receivable and other current assets | | | 30,905 | | | | 56,599 | | | | (901 | ) | | | 43,179 | | | | 1,432 | | | | 16,579 | | | | (41,814 | ) |
| Accounts payable, due to affiliates and accrued liabilities | | | (34,705 | ) | | | (64,320 | ) | | | (169 | ) | | | (40,197 | ) | | | (8,777 | ) | | | (34,374 | ) | | | 57,762 | |
Other assets and liabilities | | | 1,502 | | | | (802 | ) | | | 109 | | | | (104 | ) | | | 3,492 | | | | (665 | ) | | | (859 | ) |
Net income (loss) | | | 23,922 | | | | 29,364 | | | | 20,982 | | | | 2,750 | | | | (23,314 | ) | | | (145,634 | ) | | | 87,520 | |
| | | | | | | | | | | | | | | | | | | | | | | | | | | | | |
| Add: | | | | | | | | | | | | | | | | | | | | | | | | | | | | |
Interest (income) expense, net | | | (646 | ) | | | (859 | ) | | | — | | | | 2,432 | | | | 30,383 | | | | 44,587 | | | | 38,260 | |
| Depreciation, depletion, amortization and impairment | | | 8,268 | | | | 8,157 | | | | 619 | | | | 4,088 | | | | 43,220 | | | | 86,308 | | | | 291,605 | |
Income tax provision (benefit) | | | 12,731 | | | | 15,811 | | | | — | | | | — | | | | 1,230 | | | | 158 | | | | (1,134 | ) |
EBITDA | | | 44,275 | | | | 52,473 | | | | 21,601 | | | | 9,270 | | | | 51,519 | | | | (14,581 | ) | | | 416,251 | |
| | | | | | | | | | | | | | | | | | | | | | | | | | | | | |
| Add: | | | | | | | | | | | | | | | | | | | | | | | | | | | | |
| Income from discontinued operations | | | — | | | | — | | | | (22,192 | ) | | | — | | | | — | | | | (1,130 | ) | | | (1,764 | ) |
| Risk management portfolio value changes | | | — | | | | — | | | | — | | | | (5,709 | ) | | | 23,531 | | | | 144,176 | | | | (180,107 | ) |
| Restricted unit compensation expense | | | — | | | | — | | | | — | | | | — | | | | 142 | | | | 2,395 | | | | 7,694 | |
Other income | | | — | | | | — | | | | — | | | | — | | | | — | | | | (696 | ) | | | (5,328 | ) |
Other operating expense (2) | | | — | | | | — | | | | — | | | | — | | | | 6,000 | | | | 2,847 | | | | 10,699 | |
Non-recurring operating items | | | — | | | | — | | | | — | | | | — | | | | — | | | | (795 | ) | | | — | |
ADJUSTED EBITDA | | $ | 44,275 | | | $ | 52,473 | | | $ | (591 | ) | | $ | 3.561 | | | $ | 81,192 | | | $ | 132,216 | | | $ | 247,445 | |
| | | | | | | | | | | | | | | | | | | | | | | | | | | | | |
| | (1) | Includes historical financial and operating data for Eagle Rock Predecessor for the period from December 1, 2005 to December 31, 2005. |
| | (2) | Includes $6.0 million to terminate an advisory fee for the year ended December 31, 2006, a settlement of arbitration for $1.4 million, severance to a former executive for $0.3 million and $1.1 million for liquidated damage related to the late registration of our common units during the year ended December 31, 2007 and $10.7 million related to bad debt expense taken against our outstanding accounts receivable from SemGroup during the year ended December 31, 2008. |
The following table summarizes our quarterly financial data for 2008.
| | | | | | | | | | | | | |
| | | For the Quarters Ended | |
| | | December 31, 2008 | | | September 30, 2008(1) | | | June 30, 2008(1) | | | March 31, 2008(1) | |
| | | ($ in thousands, except earnings per unit) | |
Sales of natural gas, NGLs and condensate | | $ | 225,028 | | | $ | 341,700 | | | $ | 369,808 | | | $ | 297,383 | |
Gathering and treating services | | | 11,130 | | | | 12,513 | | | | 8,085 | | | | 7,143 | |
Minerals and royalty income | | | 8,388 | | | | 17,393 | | | | 10,255 | | | | 6,958 | |
Realized commodity derivative gains (losses) | | | 18,329 | | | | (24,105 | ) | | | (27,708 | ) | | | (12,575 | ) |
| Unrealized commodity derivative gains (losses) | | | 241,205 | | | | 255,956 | | | | (256,265 | ) | | | (33,072 | ) |
Other revenues | | | 106 | | | | 428 | | | | 122 | | | | 60 | |
Total operating revenues | | | 504,186 | | | | 603,885 | | | | 104,297 | | | | 265,897 | |
Cost of natural gas and NGLs | | | 165,033 | | | | 237,743 | | | | 272,156 | | | | 216,501 | |
Operating and maintenance expense | | | 23,809 | | | | 21,475 | | | | 17,731 | | | | 15,566 | |
General and administrative expense | | | 14,540 | | | | 15,258 | | | | 15,289 | | | | 15,589 | |
Other operating expense | | | 565 | | | | 3,920 | | | | 6,214 | | | | — | |
| Depreciation, depletion, amortization and impairment expense | | | 210,806 | | | | 28,597 | | | | 26,457 | | | | 25,745 | |
| Interest—net including realized risk management instrument | | | 9,499 | | | | 9,856 | | | | 9,418 | | | | 9,205 | |
| Unrealized risk management interest related instrument | | | 27,245 | | | | 501 | | | | (13,689 | ) | | | 13,660 | |
Income tax (benefit) provision | | | 363 | | | | (500 | ) | | | (891 | ) | | | (105 | ) |
Other expense (income) | | | (2,158 | ) | | | (441 | ) | | | (814 | ) | | | (1,633 | ) |
Discontinued operations | | | (313 | ) | | | (595 | ) | | | (553 | ) | | | (303 | ) |
Net income (loss) | | $ | 54,797 | | | $ | 288,071 | | | $ | (227,020 | ) | | $ | (28,328 | ) |
| | | | | | | | | | | | | | | | | |
| Earnings per unit—diluted | | | | | | | | | | | | | | | | |
Common units | | $ | 0.73 | | | $ | 3.94 | | | $ | (3.14 | ) | | $ | (0.39 | ) |
Subordinated units | | $ | 0.73 | | | $ | 3.94 | | | $ | (3.14 | ) | | $ | (0.39 | ) |
General partner | | $ | 0.73 | | | $ | 3.94 | | | $ | (3.14 | ) | | $ | (0.39 | ) |
| (1) | Prior quarterly periods’ financial data has been reclassified to conform to current period presentation. |
During our fiscal year ended December 31, 2008, we recorded the following unusual or infrequently occurring items,
| · | During our quarter ended December 31, 2008, we incurred impairment charges of $35.1 million in our Midstream Business, $107.0 million in our Upstream Segment and $1.7 million in our Minerals Segment. These impairment charges were necessary due to the substantial decline in commodity prices during the fourth quarter of 2008, as well as declining drilling activity. In addition, due to the impairment charge recorded in our Upstream Segment, we assessed our goodwill balance for impairment and recorded an impairment charge of $31.0 million. |
| · | We experienced significant fluctuations in our unrealized commodity derivative gains and losses from quarter to quarter as a result of the volatility that was experience by commodity prices during 2008. For example, we recorded a unrealized loss of $256.3 million during our quarter ended June 30, 2008, while in our quarters ended September 30, 2008 and December 31, 2008, we recorded unrealized gains of $256.0 million and $241.2 million, respectively. See Part II, Item 7. Management’s Discussion and Analysis of Financial Condition and Results of Operations – General Trends and Outlook – Natural Gas Supply and Demand and Petroleum Supply, Demand and Outlook for further discussion regarding the volatility of commodity prices. |
| · | As a result SemGroup, L.P. and certain of its subsidiaries filing petitions for bankruptcy we recorded bad debt charges during our quarters ended June 30, 2008, September 30, 2008 and December 31, 2008 of $6.2 million, $3.9 million and $0.6 million, respectively. These amounts are recorded as Other operating expense. See Part II, Item 7. Management’s Discussion and Analysis of Financial Condition and Results of Operations – Summary of Consolidated Operating Results – Corporate Segment for a further discussion. |
| · | During our quarter ended June 30, 2008, we acquired Stanolind Oil and Gas Corp. for which operations were included within our Upstream Segment beginning on May 1, 2008. |
| · | During our quarter ended December 31, 2008, we acquired Millennium Midstream Partners, L.P. for which operations related to these assets were included within our Midstream Business starting on October 2, 2008. |
| | | | | | | | | | | | | |
| | | For the Quarters Ended | |
| | | December 31, 2007(1) | | | September 30, 2007(1) | | | June 30, 2007(1) | | | March 31, 2007(1) | |
| | | ($ in thousands, except earnings per unit) | |
| Sales of natural gas, NGLs and condensate | | $ | 269,798 | | | $ | 207,127 | | | $ | 146,280 | | | $ | 110,121 | |
| Gathering and treating services | | | 8,148 | | | | 8,103 | | | | 6,883 | | | | 4,283 | |
| Minerals and royalty income | | | 5,803 | | | | 6,009 | | | | 3,192 | | | | — | |
| Realized commodity derivative gains (losses) | | | (7,385 | ) | | | (177 | ) | | | 1,502 | | | | 2,999 | |
| Unrealized commodity derivative gains (losses) | | | (100,240 | ) | | | 8,865 | | | | (28,757 | ) | | | (10,641 | ) |
| Other revenues | | | 130 | | | | (20 | ) | | | — | | | | — | |
| Total operating revenues | | | 176,254 | | | | 229,907 | | | | 129,100 | | | | 106,762 | |
| Cost of natural gas and NGLs | | | 192,996 | | | | 150,338 | | | | 119,278 | | | | 90,636 | |
| Operating and maintenance expense | | | 20,754 | | | | 19,629 | | | | 12,124 | | | | 8,626 | |
| General and administrative expense | | | 11,212 | | | | 7,196 | | | | 5,171 | | | | 4,220 | |
| Other operating expense | | | 916 | | | | 220 | | | | — | | | | 1,711 | |
| Depreciation, depletion, amortization and impairment expense | | | 35,424 | | | | 25,105 | | | | 14,149 | | | | 11,630 | |
| Interest—net including realized risk management instrument | | | 10,826 | | | | 10,075 | | | | 8,025 | | | | 7,435 | |
| Unrealized risk management interest related instrument | | | 9,848 | | | | 8,429 | | | | (6,485 | ) | | | 1,611 | |
| Income tax (benefit) provision | | | (607 | ) | | | 347 | | | | 254 | | | | 164 | |
| Other expense (income) | | | 6,866 | | | | (352 | ) | | | 619 | | | | 397 | |
| Discontinued operations | | | (431 | ) | | | (456 | ) | | | (254 | ) | | | — | |
| Net (loss) income | | $ | (111,554 | ) | | $ | 9,371 | | | $ | (23,783 | ) | | $ | (19,668 | ) |
| | | | | | | | | | | | | | | | | |
| Earnings per unit—diluted | | | | | | | | | | | | | | | | |
| Common units | | $ | (1.86 | ) | | $ | 0.16 | | | $ | (0.25 | ) | | $ | (0.22 | ) |
| Subordinated units | | $ | (2.00 | ) | | $ | 0.09 | | | $ | (0.76 | ) | | $ | (0.70 | ) |
| General partner | | $ | (2.00 | ) | | $ | 0.09 | | | $ | (0.76 | ) | | $ | (0.70 | ) |
| (1) | Prior quarterly periods’ financial data has been reclassified to conform to current period presentation. |
During our fiscal year ended December 31, 2007, we recorded the following unusual or infrequently occurring items,
| · | During our quarter ended December 31, 2007, we incurred impairment charges of $5.7 million in our Minerals Segment as a result of steeper decline rates in certain fields. |
| · | We experience significant fluctuations in our unrealized commodity derivative gains and losses from quarter to quarter as a result of the volatility that was experience by commodity prices during 2008. For example, we recorded an unrealized gain of $8.9 million during our quarter ended September 30, 2007, while in our quarters ended March 31, 2007, June 30, 2007 and December 31, 2007, we recorded unrealized losses of $10.6 million, $28.8 million and $100.2 million, respectively. See Part II, Item 7. Management’s Discussion and Analysis of Financial Condition and Results of Operations – General Trends and Outlook – Natural Gas Supply and Demand and Petroleum Supply, Demand and Outlook for further discussion regarding the volatility of commodity prices. |
| · | During our quarter ended March 31, 2007, we an expense of $1.4 million related to the settlement of arbitration. This amount was recorded as Other Operating Expense. |
| · | In our quarter ended June 30, 2007, we acquired certain fee minerals and royalties from Montierra Minerals and Production, L.P. and NGP-VII Income Co-Investment Opportunities, L.P., for which operations related to these assets were the start of our Mineral Segment beginning on May 1, 2007. |
| · | In our quarter ended June 30, 2007, we acquired all of the non-corporate interests of Laser Midstream Energy, LP and certain subsidiaries, for which operations were included as part of our Midstream Business beginning on May 3, 2007. |
| · | In our quarter ended September 30, 2007, we acquired completed our acquisitions of Escambia Asset Co. LLC, Escambia Operating Co. LLC, Redman Energy Holdings, L.P. and Redman Holdings II, L.P and certain assets owned by NGP Income Co-Investment Opportunities Fund II, L.P., for which operations related to these assets acquired were included as part of our Upstream Business beginning on August 1, 2007. |
Item 7. Management’s Discussion and Analysis of Financial Condition and Results of Operations.
The following discussion analyzes our financial condition and results of operations. The following discussion of our financial condition and results of operations should be read in conjunction with our historical consolidated financial statements and notes included elsewhere in this Annual Report.
OVERVIEW
We are a domestically focused growth-oriented publicly traded Delaware limited partnership engaged in the following three businesses:
| | • | Midstream Business—gathering, compressing, treating, processing and transporting of natural gas; fractionating and transporting of natural gas liquids (“NGLs”); and the marketing of natural gas, condensate and NGLs; |
| | • | Upstream Business—acquiring, developing and producing oil and natural gas property interests; and |
| | • | Minerals Business—acquiring and managing fee minerals and royalty interests, either through direct ownership or through investment in other partnerships. |
We report on our businesses in seven accounting segments.
We conduct, evaluate and report on our Midstream Business within four distinct segments—the Texas Panhandle Segment, the East Texas/Louisiana Segment, the South Texas Segment and the Gulf of Mexico Segment. Our Texas Panhandle Segment consists of gathering and processing assets in the Texas Panhandle. Our East Texas/Louisiana Segment consists of gathering and processing assets in East Texas/Northern Louisiana. Our South Texas Segment consists of gathering systems and related compression and processing facilities in South Texas, Central Texas, and West Texas. Our Gulf of Mexico Segment consists of gathering and processing assets in Southern Louisiana, the Gulf of Mexico and Galveston Bay. During the year ended December 31, 2008, our Midstream Business generated operating income from continuing operations of $56.5 million, compared to operating income of $55.9 million generated during the year ended December 31, 2007, an increase of 1.0%. The operating income generated during the year ended December 31, 2008 was offset by an impairment charge to certain assets of $35.1 million.
We conduct, evaluate and report on our Upstream Business as one segment. Our Upstream Segment includes operated wells in Escambia County, Alabama as well as two treating facilities, one natural gas processing plant and related gathering systems that are inextricably intertwined with ownership and operation of the wells. The Upstream Segment also includes operated and non-operated wells that are primarily located in West, East and South Texas in Ward, Crane, Pecos, Henderson, Rains, Van Zandt, Limestone, Freestone and Atascosa Counties. During the year ended December 31, 2008, our Upstream Business generated an operating loss of $47.5 million, compared to operating income of $19.6 million generated during the year ended December 31, 2007. The operating loss generated during the year ended December 31, 2008 was primarily due to impairment charges of $107.0 million and $31.0 million to write down the value of certain fields and goodwill, respectively. Of important note, during 2008, our Upstream Business had eight months of operations from the assets acquired in the Stanolind Acquisition and a full year of the other assets acquired in acquisition during 2007 and our Upstream Business generated revenue of $37.8 million from the sale of sulfur during the year ended December 31, 2008 compared to revenue of $2.6 million during the year ended December 31, 2007.
We conduct, evaluate, and report our Minerals Business as one segment. Our Minerals Segment consists of fee mineral, royalty and overriding royalty interests located in multiple producing trends in the United States. A significant portion of the mineral interests that we own are managed by a non-affiliated private partnership (the “Minerals Manager”) that controls the executive rights associated with the minerals. For a more detailed discussion of this relationship, see Part I, Item 1. Business – Minerals Business. During the year ended December 31, 2008, our Minerals Segment generated operating income of $31.8 million, compared to $0.5 million generated during the year ended December 31, 2007. Included within these numbers is $16.8 million of lease bonus revenue generated during the year ended December 31, 2008 compared to $1.3 million of lease bonus revenue generated during the year ended December 31, 2007. During the year ended December 31, 2008, as a result of the regeneration phenomenon we received an initial royalty payment for 304 new wells. During the year ended December 31, 2008, we recorded an impairment charge of $1.7 million compared to an impairment charge of $5.7 million recorded during the year ended December 31, 2007.
The final segment that we report on is our Corporate Segment, which is where we account for our commodity derivative/hedging activity and our general and administrative expenses. During the year ended December 31, 2008, our Corporate Segment generated operating income of $104.6 million compared to an operating loss of $165.2 million generated during the year ended December 31, 2007. Within these numbers were gains, realized and unrealized, on commodity derivatives of $161.8 million during the year ended December 31, 2008 compared to a loss, realized and unrealized, on commodity derivatives of $133.8 million during the year ended December 31, 2007. The gain generated by our commodity derivatives during the year ended December 31, 2008 was the result of the decline in commodity prices during the fourth quarter of 2008.
Impairment
In connection with preparation and audit of our Consolidated Financial Statements for the year ended December 31, 2008, which are included in Part II, Item 8. Financial Statements and Supplementary Data starting on page F-1 of this Annual Report, we determined that we needed to record an impairment charge for certain plants and pipelines within our Midstream Business and certain fields within our proved properties within our Upstream and Minerals Segments. These impairment charges were necessary due to the substantial decline in commodity prices during the fourth quarter of 2008, as well as declining drilling activity. As a result, we incurred impairment charges of $35.1 million in our Midstream Business, $107.0 million in our Upstream Segment and $1.7 million in our Minerals Segment. Due to the impairment charge recorded in our Upstream Segment, we assessed our goodwill balance for impairment and recorded an impairment charge of $31.0 million.
Pursuant to generally accepted accounting principles in the United States, our impairment analysis does not take into account the value of our commodity derivative instruments, which generally increase as the estimates of future prices decline. Further declines in commodity prices and other factors could result in additional impairment charges and changes to the fair value of our derivative instruments.
Acquisitions
Historically, we have grown through acquisitions. With the Stanolind Acquisition, described below, completed at the beginning of the second quarter of 2008, we expanded our Upstream Business. At the beginning of the fourth quarter we completed the Millennium Acquisition, described below, which expanded our Midstream Business.
Going forward, we will continue to assess acquisition opportunities, regardless of whether such opportunity is in the Midstream, Upstream, or Minerals Business, for their potential accretive value. Our ability to complete acquisitions will depend on our ability to finance the acquisitions, either through the issuance of additional securities, debt or equity, or the incurrence of additional debt under our credit facilities, on terms acceptable to us.
Below is a summary of our important acquisition transactions completed during 2008.
Stanolind Acquisition - On April 30, 2008, we completed the acquisition of all of the outstanding capital stock of Stanolind Oil and Gas Corp. (“Stanolind”), for an aggregate purchase price of $81.9 million, subject to working capital and other purchase price adjustments (the “Stanolind Acquisition”). We funded the transaction from existing cash from operations, as well as with borrowings under our existing secured revolving credit facility. Stanolind operated crude oil and natural gas producing properties in the Permian Basin of West Texas, primarily in Ward, Crane and Pecos Counties.
Millennium Acquisition - On October 1, 2008, we completed the acquisition of 100% of the outstanding units of Millennium Midstream Partners, L.P. (“MMP”) for an aggregate purchase price of $205.2 million, comprised of approximately $181.0 million in cash and 2,181,818 (recorded value of $24.2 million) common units (the “Millennium Acquisition”). Additionally, 1,818,182 common units and $0.6 million in cash were placed into an escrow account. The cash portion of the consideration was funded through borrowings of $176.4 million under our secured revolving credit facility made prior to September 30, 2008 and through cash on hand. MMP is in the natural gas gathering and processing business, with assets located in East, Central and West Texas and South Louisiana. With respect to the South Louisiana assets acquired in the Millennium Acquisition, both the Yscloskey and North Terrebonne facilities were flooded with three to four feet of water as a result of the storm surges caused by Hurricanes Ike and Gustav. We have reported, are preparing to file claims for, and expect to receive payment on our business interruption insurance coverage related to hurricanes Ike and Gustav’s damage to these two facilities. The timing of collection of such insurance claims is unknown at this time. The North Terrebonne Plant restarted service in November 2008 and the Yscloskey Plant restarted service in January 2009. The former owners of MMP provided us indemnity coverage for Hurricanes Ike and Gustav to the extent losses are not covered by insurance and established an escrow account of 1,818,182 common units and $0.6 million in cash available for us to recover against for this purpose. Prior to December 31, 2008, we recovered 40,880 units and $0.3 million in cash from this escrow account. Subsequent to December 31, 2008, we recovered 65,841 common units and the remaining $0.3 million in cash from the escrow account and we expect to recover additional amounts in the future.
Below is a summary of the important acquisition transactions we completed during the year ended December 31, 2007. A more complete description of these acquisitions is contained in Note 4 of our consolidated financial statements included in Part II, Item 8, Financial Statements and Supplementary Data starting on page F-1 of this Annual Report.
Montierra Acquisition - On April 30, 2007, we completed the acquisition of (by direct acquisition or acquisition of certain entities) certain fee minerals, royalties, working interest properties and certain investments in partnerships from Montierra Minerals & Production, L.P. and NGP-VII Income Co-Investment Opportunities, L.P. (the “Montierra Acquisition”).
Laser Acquisition - On May 3, 2007, we acquired all of the non-corporate interests of Laser Midstream Energy, LP and certain subsidiaries (the “Laser Acquisition”).
MacLondon Acquisition - On June 18, 2007, we completed the acquisition of certain fee mineral and royalties owned by MacLondon Energy, L.P.
Escambia Acquisition - On July 31, 2007, we completed the acquisition of Escambia Asset Co. LLC and Escambia Operating Co. LLC (the “Escambia Acquisition”).
Redman Acquisition - On July 31, 2007, we completed the acquisition of Redman Energy Holdings, L.P. and Redman Energy Holdings II, L.P. and certain assets owned by NGP Income Co-Investment Opportunities Fund II, L.P. (the “Redman Acquisition”).
Prior to the above 2007 acquisitions the Partnership was solely a midstream company. The Montierra Acquisition, (followed quickly by the MacLondon Acquisition) provided the Partnership’s entry into the Minerals Business and the EAC and Redman acquisitions provided the Partnership’s entry into the Upstream Business.
Other Matters
Hurricanes Ike and Gustav - Hurricane Ike, which made landfall in Texas on September 13, 2008, caused no direct damage to our offices or facilities except for certain assets acquired in the Millennium Acquisition, as described above; however, the storm did cause temporary operational disruption to our operations located in East Texas, North Louisiana and South Texas due to third-party downstream infrastructure issues. Operations were either temporarily interrupted or curtailed during and immediately after the storm due to power disruptions suffered by third parties causing natural gas and natural gas liquids supply and market issues. All of our operations returned to pre-hurricane levels within ten days after the storm. Our assets, except for certain assets acquired in the Millennium Acquisition, as described above, were not impacted by Hurricane Gustav.
Recent Transactions
On January 8, 2009, we executed a series of hedging transactions that involved the unwinding of a portion of existing “in-the-money” 2011 and 2012 WTI crude oil swaps and collars, and the unwinding of two “in-the-money” 2009 WTI crude oil collars. With these transactions, and an additional $13.9 million of cash, we purchased a 2009 WTI crude oil swap on 60,000 barrels per month beginning January 1, 2009 at $97 per barrel. Both the unwound hedges and new hedges relate to expected volumes in our Midstream and Minerals segments. These transactions were executed to enhance our expected 2009 cash flows and our ability to maintain our current distribution level of $1.64 per unit on an annual basis and our ability to remain in compliance with our credit facility financial covenants. The actual distributions we will declare will be subject to our operating performance, prevailing market conditions (including forward oil, natural gas and sulfur commodity prices), the impact of unforeseen events and the approval of our Board of Directors and the actual distributions will be pursuant to our distribution policy described in Part II, Item 5 Market for Registrant’s Common Equity, Related Unitholder Matters and Issuer Purchases of Equity Securities – Cash Distribution Policy.
In addition to the hedging transactions discussed above, we also entered into a 125,000 MMBtu per month Henry Hub natural gas swap at $6.65/MMBtu on January 19, 2009 for our 2009 fiscal year, a 170,000 MMBtu per month Henry Hub natural gas swap at $6.14/MMBtu on February 17, 2009 for our 2010 fiscal year, a 45,000 barrel per month WTI crude oil swap at $53.55 per barrel on February 17, 2009 for our 2010 fiscal year and a 40,000 barrel per month WTI crude oil swap at $51.40 per barrel on February 19, 2009 for our 2010 fiscal year.
On April 1, 2009, we sold our producer services business (which is accounted for in its South Texas Segment) by assigning and novating the contracts under this business to a third-party purchaser. We sold the producer services business to a third-party purchaser as it was a low-margin business that was not core to our operations. We received an initial payment of $0.1 million for the sale of the business. In addition we will receive a contingency payment of up to $0.1 million in October 2009. We will continue to receive a monthly payment equivalent to $0.01 per MMbtu on the volume of gas that flows pursuant to the assigned contracts through March 31, 2011. Producer services was a business in which we would negotiate new well connections on behalf of small producers to pipelines other than its own. During the year ended December 31, 2008, this business generated revenues of $265.1 million and cost of natural gas and natural gas liquids of $263.3 million, as compared to revenues of $134.8 million and cost of natural gas and natural gas liquids of $133.6 million during the year ended December 31, 2007. There were no operations during the year ended December 31, 2006. The accompanying consolidated financial statements have been retrospectively adjusted to present these operations as discontinued operations.
How We Evaluate Our Operations
Our management uses a variety of financial and operational measurements to analyze our performance. We view these measurements as important factors affecting our profitability and review these measurements on a monthly basis for consistency and trend analysis. These measures include volumes, margin, operating expenses and Adjusted EBITDA (defined on page 80) on a company-wide basis.
Volumes (by Business)
Midstream Volumes. In our Midstream Business, we must continually obtain new supplies of natural gas to maintain or increase throughput volumes on our gathering and processing systems. Our ability to maintain existing supplies of natural gas and obtain new supplies is impacted by (1) the level of workovers or recompletions of existing connected wells and successful drilling activity in areas currently dedicated to our pipelines, (2) our ability to compete for volumes from successful new wells in other areas and (3) our ability to obtain natural gas that has been released from other commitments. We routinely monitor producer activity in the areas served by our gathering and processing systems to pursue new supply opportunities.
Upstream Volumes. In the Upstream Segment, we continually monitor the production rates of the wells we operate. This information is a critical indicator of the performance of our wells, and we evaluate and respond to any significant adverse changes. We employ an experienced team of engineering and operations professionals to monitor these rates on a well-by-well basis and to design and implement remediation activities when necessary. We also design and implement workover and drilling operations to increase production in order to offset the natural decline of our currently producing wells.
Minerals Volumes. Our Minerals Segment assets are comprised of royalty, overriding royalty, non-producing mineral, and therefore, we do not operate any of these properties. In order to maintain or increase our cash flows from our Minerals Segment, we rely upon the efforts of the operators of our interests. We do not control whether or when additional drilling or recompletion activity will be conducted on the properties in which we have an interest; however, when these activities do occur, we do not bear any of their costs. Nevertheless, at any time, there is often a significant amount of drilling and recompletion activity occurring on the properties in which we own an interest yielding us a cost-free “regeneration effect” on mineral and royalty interests. We monitor the additional production volumes that we realize from regeneration, and we use this information to make adjustments to our reserves estimates on a regular basis. These adjustments to our reserves (as a result of the regeneration effect) are important measures of the performance of our Minerals Segment. During the year ended December 31, 2008, as a result of the regeneration phenomenon we received an initial royalty payment for 304 new wells.
Commodity Pricing
Our margins in our Midstream Business may be positively impacted to the extent the price of NGLs increase in relation to the price of natural gas and may be adversely impacted to the extent the price of NGLs decline in relation to the price of natural gas. We refer to the price of NGLs in relation to the price of natural gas as the fractionation spread. In both our Upstream and Minerals Segments, increases in crude oil, natural gas and NGL prices will generally have a favorable impact on our revenues, conversely, decreases in crude oil, natural gas and NGL prices will generally unfavorably impact our revenue.
Risk Management
We conduct risk management activities to mitigate the effect of commodity price and interest rate fluctuations on our cash flows. Our primary method of risk management in this respect is entering into derivative contracts. To execute and evaluate the performance of these activities, we have formed a Risk Management Committee which is comprised of several members of our senior management team and other key employees. In addition to establishing the procedures and controls associated with risk management activities, the Risk Management Committee meets regularly to review the hedge portfolio and make recommendations for additional hedges. The Risk Management Committee routinely estimates the potential effect of price and interest rate fluctuations on the expected future cash flows associated with our operations, and the Risk Management Committee evaluates whether the hedges sufficiently mitigate the effect of these fluctuations. The impact of our risk management activities are captured in our Corporate Segment.
Operating Expenses
Midstream Operating Expenses. Midstream operating expenses are a separate measure we use to evaluate the performance of our field operations. Direct labor, insurance, repair and maintenance, utilities and contract services comprise the most significant portion of our operating expenses. These expenses are largely independent of the volumes through our systems, but fluctuate depending on the activities performed during a specific period.
Upstream Operating Expenses. We monitor and evaluate our Upstream Segment operating costs routinely, both on a total cost and unit cost basis. Many of the operating costs we incur are not directly related to the quantity of hydrocarbons that we produce, so we strive to maximize our production rates in order to improve our unit operating costs. The most significant portion of our Upstream Segment operating costs is associated with the operation of the Big Escambia treating and processing facilities. These facilities are overseen by members of our midstream engineering and operations staff. The majority of the cost of operating these facilities is independent of their throughput. This includes items such as labor, chemicals, utilities, materials, and insurance.
Minerals Operating Expenses. We do not incur any operating costs associated with our Minerals Segment due to the non-cost-bearing nature of the mineral and royalty assets.
Adjusted EBITDA
See discussion of Adjusted EBITDA in Part II, Item 6. Selected Financial Data.
General Trends and Outlook
We expect our business to continue to be affected by the following key trends. Our expectations are based on assumptions made by us and information currently available to us. To the extent our underlying assumptions about or interpretations of available information prove to be incorrect, our actual results may vary materially from our expected results.
The most significant external events impacting our business are the worldwide credit crisis that was precipitated by the United States subprime mortgage market collapse, and the resulting global economic recession. The recession has led to a significant reduction in demand for the commodities that we produce, transport and/or process.
The government of the United States and the governments of many other developed and developing nations have already taken, and are contemplating additional, significant actions to stabilize their banking systems and to increase consumption to stimulate economic growth. Although these actions are of unprecedented size and scope, we do not believe that they will restore demand for our products in 2009 to the levels that we observed in early 2008.
Natural Gas Supply and Demand
Natural gas is a significant source of energy and raw materials in the United States. Over the last several years, supply of natural gas remained fairly steady, while demand gradually increased. In the early part of the current decade, supply and demand came into balance and natural gas prices began to rise.
However, over the last half of 2008, the global economic recession resulted in greatly reduced demand for natural gas. This reduction in demand has occurred at the same time that large amounts of additional natural gas supply are being developed in various shale gas plays in the United States. The development of some of these shale gas plays has been so successful that the decline in United States per well natural gas production has been reversed for the first time in many years. The confluence of reduced demand and increased domestic supply caused natural gas prices to fall dramatically in the United States. Natural gas is currently about $4.50/mmbtu at Henry Hub.
We do not expect that significant economic growth will occur in the United States and global economies during 2009, and we believe it will be at least several months before reduced levels of drilling activity will lead to lower production rates. Therefore, with demand low and unlikely to increase quickly, and with supply strong and unlikely to decline quickly, we believe that natural gas prices will be low (relative to the last couple of years) throughout 2009 and at least throughout the first portion of 2010.
Other factors which we do not believe will affect the price of natural gas in the near term, but potentially could, are liquified natural gas (LNG) imports and the development of alternative energy sources. With respect to LNG imports, we have noted that the amount of LNG delivered to United States terminals has declined significantly, to the point where it can not be considered a meaningful source of supply. Nevertheless, despite the low prices we anticipate in the United States natural gas market, LNG exporters may find that prices in other markets have suffered, as well. Atlantic Basin LNG suppliers may view the United States as their most attractive market, and the additional supply they could bring would put additional downward pressure on prices.
Alternative energy sources are generally more expensive than fossil fuels and are unlikely to displace fossil fuels at their current prices. It is possible, however, that the expected investment in alternative energy sources contemplated in the United States economic stimulus legislation could result in either lower costs for these technologies (through successful research) or could result in economic subsidies intended to make these fuels more competitive. We do not think these scenarios are likely in 2009, however.
Petroleum Supply, Demand and Outlook
Petroleum, primarily in the form of crude oil, condensate, and NGLs, plays a critical role in the United States and world economies. It is a primary source of energy, especially for transportation, and its components are used in an extensive number of manufacturing processes. Many of the characteristics of modern civilization, particularly in the industrialized countries, are a result of the abundance, utility, and relatively low cost of petroleum. The supply and demand of petroleum is a very complex matter; however, we have made the following observations about current trends.
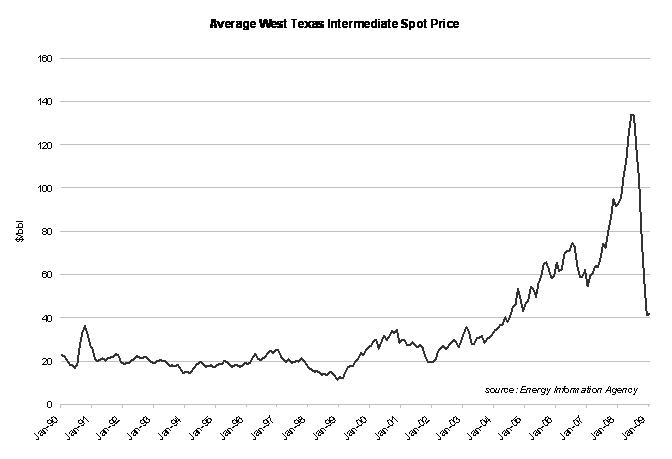
As was the case for many commodities in 2008, demand for crude oil reached all-time highs, and record high prices (both real and nominally) were observed. Much of the growth in demand for crude oil was fueled by the continued strong growth of several developing economies, particularly China, Russia, India, and certain countries in the Middle East. Nevertheless, the global economic recession has resulted in substantially lower demand for crude oil, and the price for the prompt month NYMEX futures contract has fallen from nearly $150/bbl in July 2008 to about $40/bbl in February 2009. As shown below, spot prices have experienced a similar rise and fall.
We expect crude oil demand to remain below last year’s levels until economic growth resumes. With respect to supply, however, we have observed that the members of the Organization of Petroleum Exporting Countries (“OPEC”) have made several recent reductions in their production quotas. We are uncertain how well OPEC’s members will adhere to their quotas, and how successful they will be in reducing crude oil supply to a level that will support higher prices. We believe that their efforts have had some measure of success, and that without their actions prices would be lower. Because OPEC’s members have had a mixed record of adhering to their production quotas, we are not optimistic that enough supply will be removed from the market to result in a significant price increase during 2009. We believe there is a reasonable probability that prices will decline below current prices before prices begin to strengthen.
Sulfur Supply, Demand and Outlook
Much of the natural gas that we produce in our Upstream Segment contains high, naturally-occurring concentrations of hydrogen sulfide. This is a corrosive, poisonous gas that must be removed from the natural gas before it can be processed for NGL extraction or sale. The process of removing the hydrogen sulfide yields a large amount of elemental sulfur, and we can sell this co-product or otherwise dispose of it. The process of removing hydrogen sulfide from natural gas, and similar processes for the removal of hydrogen sulfide from sour crude oils (prior to refining) are the primary sources of sulfur production in the United States and the world.
The primary use of sulfur is the production of sulfuric acid, and one of the major uses of sulfuric acid is the production of phosphoric acid. Phosphoric acid is a key raw material in the manufacture of phosphate fertilizers, so one of the major factors influencing the demand for sulfur is the demand for fertilizer. The region around Tampa, Florida contains a large amount of fertilizer manufacturing facilities, and Tampa also serves as an export port for sulfur. For many years, the supply of sulfur was greater than the available demand, such that Tampa prices fluctuated within a narrow band of $20 to $40 per long ton. Some North American sources of sulfur are large distances from Tampa, so those sellers might have received very little revenue for their sulfur, or actually had a net expense to move their sulfur co-product.
Beginning in the second half of 2007, demand for fertilizer increased significantly, and the Tampa prices also rose to record levels. By the fourth quarter of 2008, sulfur prices at Tampa were over $600 per long ton. The global economic recession has greatly reduced fertilizer demand, however, and consequently, demand for sulfur is also much lower than it was only a few months ago. By the end of 2008, Tampa sulfur prices had fallen to $0 (zero dollars) per long ton, resulting in a net expense for sellers to move their sulfur.
Our expectations are for sulfur demand to increase back to historical levels as fertilizer manufacturers deplete their excess inventories. Nevertheless, if the global economic recession worsens, sulfur prices could stay depressed throughout the year.
Outlook for Interest Rates and Inflation
The turmoil in worldwide capital markets makes it difficult to formulate a clear outlook of future interest and inflation rates. We have observed that many key benchmark interest rates are at very low levels, despite heavy borrowing by the U.S. Treasury. We believe this reflects a high degree of risk aversion by all types of investors due to the great uncertainty regarding the likely returns of virtually all other investment types. Despite this, we have observed that many interest rates of riskier securities (consumer and corporate debt, for instance) are very high by historical standards and these types of credit are difficult to obtain. We expect that both of these conditions will persist during 2009.
Nevertheless, we believe as order is restored in the financial system, and economic growth resumes, investors will seek opportunities to generate higher returns. This could lead to increased interest rates as the U.S. Treasury finds it harder to sell bonds at the current low rates. Also, a potential excess of dollars in the economy as a result of spending related to economic stimulus efforts may cause an increase in inflation. If this were to occur, the government may find that monetary policy actions are needed to reduce inflation, which would also lead to higher interest rates. It is difficult for us to predict if and when such a scenario might occur, and during the near term, we believe that the threat of inflation is very low. In fact, if the U.S. government’s efforts to restore the banking system and stimulate the economy are unsuccessful, deflation will be a possibility.
Impact of Credit and Capital Market Turmoil
As a direct consequence of the collapse of the sub-prime mortgage and housing markets that began in the summer of 2007 and their corollary impact on the banking and financial industry in general, bank lending and capital markets have experienced a significant contraction. This generalized and world-wide condition of reduced credit availability and downward pressure on the value of debt obligations and equity prices has persevered throughout 2008 and into 2009. Specifically among Master Limited Partnerships, which rely on credit and capital markets to finance their acquisition and organic growth projects, this diminished availability of external capital, made worse by a low commodity price environment has in the short term, effectively closed access to traditional external financing sources for all but the largest investment grade partnerships.
As governments around the world enact policies designed to restore the health of the banking industry and promote growth in their respective economies, we believe that credit and access to capital markets will gradually return. When such favorable conditions become prevalent again, we believe we will be able to obtain external financing in the credit and capital markets which will allow us to resume our growth strategy through acquisitions and organic growth projects. In the meantime, we have reduced our growth and maintenance capital expenditure budget for 2009 and are only pursuing highly accretive potential acquisitions which could be financed in the current financial market environment.
Impact of Regulation of Greenhouse Gas Emissions
The natural gas and oil industry is a source of emissions of certain greenhouse gases, namely carbon dioxide and methane Regulation of greenhouse gas emissions has not had an impact on our operations in the past and regulation of our greenhouse gas emissions as such has not occurred. However, there is a trend towards government-imposed limitations on greenhouse gas emissions at the state, regional, and federal level. Although there are still significant uncertainties regarding future federal regulation in the U.S., a reasonably broad-based consensus for federal legislation, involving either a cap-and-trade program or a carbon tax, is forming. Many significant uncertainties remain about the timing, nature, and effect of any such action. Consequently, at this time, we are unable to forecast how future regulation of greenhouse gas emissions would negatively impact our operations. We will continue to monitor regulatory developments and to assess our ability to reasonably predict the economic impact of these developments on our business.
Critical Accounting Policies
Conformity with accounting principles generally accepted in the United States requires management to make estimates and judgments that affect the amounts reported in the financial statements and notes. On an on-going basis, we make and evaluate estimates and judgments based on management’s best available knowledge of previous, current, and expected future events. Given that a substantial portion of our operations were acquired within the past 12 to 24 months, we base our estimates on historical experience and various other assumptions that we believe to be reasonable under the circumstances. Actual results may differ from these estimates, and estimates are subject to change due to modifications in the underlying conditions or assumptions. Currently, we do not foresee any reasonably likely changes to our current estimates and assumptions which would materially affect amounts reported in the financial statements and notes. We have selected the following critical accounting policies that currently affect our financial condition and results of operations for discussion.
Successful Efforts. We utilize the successful efforts method of accounting for our oil and natural gas properties. Leasehold costs are capitalized when incurred. Costs incurred to drill and complete development wells, including dry holes, are capitalized. Unproved properties are assessed periodically within specific geographic areas and, if necessary, impairments are charged to expense. Geological and geophysical expenses and delay rentals are charged to expense as incurred. Exploratory drilling costs are initially capitalized, but charged to expense if the well is determined to be unsuccessful. We carry the costs of an exploratory well as an asset if the well finds a sufficient quantity of reserves to justify its capitalization as a producing well as long as we are making sufficient progress towards assessing the reserves and the economic and operating viability of the project.
Depletion of producing oil and natural gas properties is recorded based on units of production. Unit rates are computed for unamortized drilling and development costs using proved developed reserves and for acquisition costs using all proved reserves. Statement of Financial Accounting Standards (“SFAS”) No. 19, Financial Accounting and Reporting for Oil and Gas Producing Companies requires that acquisition costs of proved properties be amortized on the basis of all proved reserves (developed and undeveloped) and that capitalized development costs (wells and related equipment and facilities) be amortized on the basis of proved developed reserves. In the case of our Minerals Segment, we only claim proved, producing reserves because, as a mineral interest owner, we lack sufficient engineering and geological data to estimate the proved undeveloped and non-producing reserve quantities and because we cannot control the occurrence or the timing of the activities that would cause such reserves to become productive. Since our units of production depletion and amortization rate is a function of our proved reserves, we experience a higher depletion and amortization rate than we would if we claimed undeveloped or non-producing reserves.
Upon sale or retirement of complete fields of depreciable or depleted property, the book value thereof, less proceeds or salvage value, is charged or credited to income.
In accordance with SFAS No. 144, Accounting for the Impairment or Disposal of Long-Lived Assets, we assess proved oil and natural gas properties in our Upstream Segment for possible impairment when events or circumstances indicate that the recorded carrying value of the properties may not be pre-tax recoverable. We recognize an impairment loss as a result of a triggering event and when the estimated undiscounted pre-tax future cash flows from a property are less than the carrying value. If impairment is indicated, the fair value is compared to the carrying value for determining the amount of the impairment loss to record. Estimated future cash flows are based on management’s expectations for the future and include estimates of oil and natural gas reserves and future commodity prices and operating costs. Downward revisions in estimates of reserve quantities or expectations of falling commodity prices or rising operating costs could result in a reduction in undiscounted future cash flows and could indicate property impairment. During the year ended December 31, 2008, we incurred impairment charges related to certain fields of $107.0 million and $1.7 million in our Upstream and Minerals Segments, respectively, due to the substantial decline in commodity prices during the fourth quarter of 2008. During the year ended December 31, 2007, we incurred an impairment charge in our Minerals Segment of $5.7 million as a result of steeper decline rates in certain fields.
Unproved properties that are individually insignificant are amortized. Unproved properties that are individually significant are assessed for impairment on a property-by-property basis. If considered impaired, costs are charged to expense when such impairment is deemed to have occurred.
Our estimates of proved reserves are based on the quantities of oil and natural gas that engineering and geological analyses demonstrate, with reasonable certainty, to be recoverable from established reservoirs in the future under current operating and economic conditions. Annually, and on other occasions, Cawley, Gillespie & Associates, Inc. prepares an estimate of the proved reserves on all our properties, based on information provided by us.
Reserves and their relation to estimated future net cash flows impact our depletion and impairment calculations. As a result, adjustments to depletion and impairment are made concurrently with changes to reserve estimates. We prepare our reserve estimates, and the projected cash flows derived from these reserve estimates, in accordance with SEC guidelines. The independent engineering firm described above adheres to the same guidelines when preparing their reserve reports. The accuracy of our reserve estimates is a function of many factors including the following: the quality and quantity of available data, the interpretation of that data, the accuracy of various mandated economic assumptions and the judgments of the individuals preparing the estimates. The data for a given reservoir may change substantially over time as a result of numerous factors, including additional development activity, evolving production history and continual reassessment of the viability of production under varying economic conditions. Changes in oil and natural gas prices, operating costs and expected performance from a given reservoir also will result in revisions to the amount of our estimated proved reserves.
Our proved reserve estimates are a function of many assumptions, all of which could deviate significantly from actual results. As such, reserve estimates may materially vary from the ultimate quantities of natural gas, natural gas liquids and oil eventually recovered.
Revenue and Cost of Goods Sold Recognition. In our Midstream Business, we record revenue and cost of goods sold on the gross basis for those transactions where we act as the principal and take title to natural gas, NGLs or condensates that is purchased for resale. When our customers pay us a fee for providing a service such as gathering, treating or transportation we record the fees separately in revenues.
Risk Management Activities. We have structured our hedging activities in order to minimize our commodity pricing and interest rate risks. These hedging activities rely upon forecasts of our expected operations and financial structure over the next few years. If our operations or financial structure are significantly different from these forecasts, we could be subject to adverse financial results as a result of these hedging activities. We mitigate this potential exposure by retaining an operational cushion between our forecasted transactions and the level of hedging activity executed. We have currently hedged approximately 88% of our forecasted 2009 hedgeable crude, condensate and natural gas liquids (heavier than propane) and 93% of our net natural gas and ethane production. We have currently hedged approximately 90% of our anticipated 2010 hedgeable crude, condensate and natural gas liquids (heavier than propane) and 90% of our net natural gas and ethane production.
From the inception of our hedging program, we used mark-to-market accounting for our commodity hedges and interest rate swaps. There were no derivatives for the periods before September 30, 2005. We record monthly realized gains and losses on hedge instruments based upon cash settlements information. The settlement amounts vary due to the volatility in the commodity market prices throughout each month. We also record unrealized gains and losses monthly based upon the future value on mark-to-market hedges through their expiration dates. The expiration dates vary but are currently no later than December 2012 for our interest rate hedges and for our commodity hedges. Option premiums and costs incurred to reset contract prices or purchase swaps are amortized during the contract period through the unrealized risk management instruments in total revenue. We monitor and review hedging positions regularly.
Depreciation and Depletion Expense and Cost Capitalization Policies. Our midstream assets consist primarily of natural gas gathering pipelines and processing plants. We capitalize all construction-related direct labor and material costs, as well as indirect construction costs. Indirect construction costs include general engineering and the costs of funds used in construction. The cost of funds used in construction represents capitalized interest. These costs are then expensed over the life of the constructed asset through the recording of depreciation expense.
As discussed in Note 2 to our consolidated financial statements included in Part II, Item 8. Financial Statements and Supplementary Data starting on page F-1 of this Annual Report, depreciation of our midstream assets is generally computed using the straight-line method over the estimated useful life of the assets. The costs of renewals and betterments which extend the useful life of property, plant and equipment are also capitalized. The costs of repairs, replacements and maintenance projects are expensed as incurred.
The computation of depreciation expense requires judgment regarding the estimated useful lives and salvage value of assets. As circumstances warrant, depreciation estimates are reviewed to determine if any changes are needed. Such changes could involve an increase or decrease in estimated useful lives or salvage values which would impact future depreciation expense.
Impairment of Long-Lived Assets. We assess our long-lived assets for impairment based on SFAS No. 144, Accounting for the Impairment or Disposal of Long-Lived Assets. A long-lived asset is tested for impairment whenever events or changes in circumstances indicate its carrying amount may exceed its fair value. Fair values are based on the sum of the undiscounted future cash flows expected to result from the use and eventual disposition of the assets.
Examples of long-lived asset impairment indicators include:
| | • | a significant decrease in the market price of a long-lived asset or asset group; |
| | • | a significant adverse change in the extent or manner in which a long-lived asset or asset group is being used or in its physical condition; |
| | • | a significant adverse change in legal factors or in the business climate could affect the value of a long-lived asset or asset group, including an adverse action or assessment by a regulator which would exclude allowable costs from the rate-making process; |
| | • | an accumulation of costs significantly in excess of the amount originally expected for the acquisition or construction of a long-lived asset or asset group; |
| | • | a current-period operating cash flow loss combined with a history of operating cash flow losses or a projection or forecast that demonstrates continuing losses associated with the use of a long-lived asset or asset group; and |
| | • | a current expectation that, more likely than not, a long-lived asset or asset group will be sold or otherwise disposed of significantly before the end of its previously estimated useful life. |
During the year ended December 31, 2008, we incurred impairment charges related to certain processing plants and contracts within our Midstream Business of $35.1 million due to the substantial decline in commodity prices during the fourth quarter of 2008.
Goodwill Impairment. We assess our goodwill for impairment annually or whenever events indicate impairment may have occurred based on SFAS No. 142, Goodwill and Other Intangible Assets.. We performed our annual assessment in May 2008 and no impairment was evident at that point in time. As a result of the impairment charge recorded in our Upstream Segment, we performed an assessment of our goodwill during the fourth quarter and recorded an impairment charge of $31.0 million, or our entire goodwill balance, during the fourth quarter of 2008.
Environmental Remediation. Current accounting guidelines require us to recognize a liability and expense associated with environmental remediation if (i) government agencies mandate such activities or one of our properties were added to the Comprehensive Environmental Response, Compensation and Liability Act (CERCLA) database, (ii) the existence of a liability is probable and (iii) the amount can be reasonably estimated. As of December 31, 2008, we have recorded an $8.6 million liability for remediation expenditures. If governmental regulations change, we could be required to incur additional remediation costs which may have a material impact on our profitability.
Asset Retirement Obligations. Eagle Rock has recorded liabilities of $19.9 million for future asset retirement obligations in its midstream and upstream operations. Related accretion expense has been recorded in operating expenses, as discussed in Note 5 to our consolidated financial statements included in Part II, Item 8. Financial Statements and Supplementary Data starting on page F-1 of this Annual Report.
Presentation of Financial Information
For a description of the presentation of our financial information in this report, please see Part II, Item 6. Selected Financial Data.
Year Ended December 31, 2008 Compared with Year Ended December 31, 2007
Summary of Consolidated Operating Results
Below is a table of a summary of our consolidated operating results for the years ended December 31, 2008 and December 31, 2007. Operating results for our individual operating segments are presented in tables in this Item 7.
| | | | | | | |
| | | Year Ended December 31, | |
| | | 2008 | | | 2007 | |
| | | ($ in thousands) | |
| Revenues: | | | | | | |
| Sales of natural gas, NGLs, oil, condensate and sulfur | | $ | 1,233,919 | | | $ | 733,326 | |
Gathering, compression, processing and treating fees | | | 38,871 | | | | 27,417 | |
| Minerals and royalty income | | | 42,994 | | | | 15,004 | |
| Realized commodity derivative gains (losses) | | | (46,059 | ) | | | (3,061 | ) |
| Unrealized commodity derivative gains (losses) | | | 207,824 | | | | (130,773 | ) |
| Other | | | 716 | | | | 110 | |
| Total revenues | | | 1,478,265 | | | | 642,023 | |
| Cost of natural gas and natural gas liquids | | | 891,433 | | | | 553,248 | |
| Costs and expenses: | | | | | | | | |
| Operating and maintenance | | | 73,620 | | | | 52,793 | |
| Taxes and other income | | | 19,936 | | | | 8,340 | |
General and administrative | | | 45,701 | | | | 27,799 | |
| Other operating expense | | | 10,699 | | | | 2,847 | |
| Depreciation, depletion and amortization | | | 116,754 | | | | 80,559 | |
Impairment expense | | | 143,857 | | | | 5,749 | |
| Goodwill impairment expense | | | 30,994 | | | | — | |
Total costs and expenses | | | 441,561 | | | | 178,087 | |
| Total operating income (loss) | | | 145,271 | | | | (89,312 | ) |
| Other income (expense): | | | | | | | | |
Interest income | | | 793 | | | | 1,160 | |
| Other income | | | 5,328 | | | | 696 | |
| Interest expense, net | | | (32,884 | ) | | | (38,936 | ) |
| Unrealized interest rate derivatives gains (losses) | | | (27,717 | ) | | | (13,403 | ) |
Realized interest rate derivative gains (losses) | | | ( 5,214 | ) | | | 1,415 | |
Other expense | | | (955 | ) | | | (8,226 | ) |
Total other income (expense) | | | (60,649 | ) | | | (57,294 | ) |
| Income (loss) from continuing operations before income taxes | | | 84,622 | | | | (146,606 | ) |
| Income tax (benefit) provision | | | (1,134 | ) | | | 158 | |
| Income (loss) from continuing operations | | | 85,756 | | | | (146,764 | ) |
| Discontinued operations | | | 1,764 | | | | 1,130 | |
Net income (loss) | | $ | 87,520 | | | $ | (145,634 | ) |
Adjusted EBITDA(a) | | $ | 247,445 | | | $ | 132,216 | |
| | | | | | | | | |
| (a) | See Part II, Item 6. Selected Financial Data – Non-GAAP Financial Measures for a definition and reconciliation to GAAP. |
Midstream Business (Four Segments)
Significant Acquisitions and Organic Growth Projects in 2008
The Millennium Acquisition, completed in October 2008 (hereinafter, the period of operation from October 2 through December 31, 2008, (the “Millennium Covered Period”), contributed a number of gathering and processing assets to the Midstream Business. The assets expanded the East Texas/Louisiana Segment and the South Texas Segment and created the Gulf of Mexico Segment. The assets acquired consisted of:
| | • | Approximately 679 miles of natural gas gathering pipelines ranging in size from four inches to 20 inches in diameter. |
| | • | Compression stations with approximately 12,500 aggregate horsepower. |
| | • | Two cryogenic processing plants (non-operated), in which we own a 14.26% and 7.74% interest, respectively, consisting of processing and related facilities for an aggregate capacity of 369 MMcf/d. |
| | • | A 30,000 Bbl/d NGL fractionation plant (non-operated), in which we own a 7.74% interest. |
We also completed a number of capacity expansion projects during 2008. In the Texas Panhandle Segment, we installed an additional 2600 horsepower of compression at two sites to provide additional capacity of approximately 7 MMcf/d and lower gathering pressures for the producers. In addition we completed the shut-down of the Stinnett Plant and the consolidation of the volumes from the Stinnett Plant into the Cargray Plant resulting in increased operating efficiencies. In the East Texas/Louisiana Segment, we completed the connection of our Panola system to a processing plant owned by a third party, increasing the recovered NGLs on the Panola system; we expanded the capacity of the ETML system by 120 MMcf/d; and we expanded the Brookeland and Tyler County systems by 12.7 miles to continue to keep pace with drilling activity in the Austin Chalk play. In the South Texas Segment, we completed the expansion of the Kelsey Compressor station, adding an additional 12 MMcf/d of outlet capacity to our Phase 1 20” pipeline system.
Texas Panhandle Segment
| | | | | | | |
| | | Twelve Months Ending December 31, | |
| | | 2008 | | | 2007 | |
| | | ($ in thousands, except for realized prices) | |
| Revenues: | | | | | | |
| Sales of natural gas, NGLs, oil and condensate | | $ | 592,997 | | | $ | 479,120 | |
| Gathering and treating services | | | 10,069 | | | | 8,910 | |
| Total revenues | | | 603,066 | | | | 488,030 | |
| Cost of natural gas and natural gas liquids | | | 459,064 | | | | 372,205 | |
| Operating costs and expenses: | | | | | | | | |
| Operations and maintenance | | | 34,269 | | | | 32,494 | |
| Depreciation and amortization | | | 43,688 | | | | 42,308 | |
| Total operating costs and expenses | | | 77,957 | | | | 74,802 | |
| Operating income | | $ | 66,045 | | | $ | 41,023 | |
| | | | | | | | | |
| Capital expenditures | | $ | 30,738 | | | $ | 34,865 | |
| | | | | | | | | |
| Oil and condensate (per Bbl) | | $ | 94.27 | | | $ | 63.51 | |
| Natural gas (per Mcf) | | $ | 7.44 | | | $ | 6.08 | |
| NGLs (per Bbl) | | $ | 58.34 | | | $ | 51.24 | |
| Production volumes: | | | | | | | | |
Gathering volumes (Mcf/d)(a) | | | 151,964 | | | | 151,260 | |
NGLs and condensate (net equity gallons) | | | 86,514,543 | | | | 88,973,133 | |
Natural gas short position (MMbtu/d)(a) | | | (5,607 | ) | | | (7,184 | ) |
| (a) | Gathering volumes (Mcf/d) and natural gas short position (MMbtu/d) are calculated by taking the total volume and then dividing by the number of days in the respective period. |
Revenue and Cost of Natural Gas and Natural Gas Liquids. For the year ended December 31, 2008, the revenues minus cost of natural gas and natural gas liquids for our Texas Panhandle Segment operations totaled $144.0 million compared to $115.8 million for the year ended December 31, 2007. There were three primary contributors to this increase: (i) higher NGL and condensate pricing, as compared to pricing in 2007, (ii) a lower natural gas short position as compared to 2007 and (iii) the downtime at our Arrington Plant which resulted in a negative impact in 2007 of approximately $2.7 million.
The slightly higher gathering volumes in 2008 as compared to 2007 were primarily due to a full year of Red Deer Plant operations in 2008 compared to only six months in 2007, colder than normal weather in that area and downtime to repair the Arrington plant during 2007, which reduced gathering volumes during the year ended December 31, 2007. These were partially offset by reduced drilling activity during 2008 that was not sufficient to replace the natural volume declines in the West Panhandle System and the East Panhandle System.
The drilling activity in the West Panhandle System is not sufficient to offset the natural declines experienced on the System. While our contract mix in the West Panhandle System provides us with a higher equity share of the production, the overall decline will continue, and we expect to recover smaller amounts of equity production in the future on the West Panhandle System. The East Panhandle System experienced increased drilling activity in the active Granite Wash play located in Roberts and Hemphill Counties, Texas through much of 2008; however, due to lower commodity values during the fourth quarter of 2008, we saw a significant reduction in drilling activity during the fourth quarter of the year ended December 31, 2008 by the producers in Roberts and Hemphill Counties. The liquids content of the natural gas is lower in the East Panhandle System, and our contract mix provides us with a smaller share of equity production as compared to the West Panhandle System. Due to this difference in contract mix and liquid content between our West and East Panhandle Systems, while we have grown aggregate volumes during 2008 as compared to 2007, our equity share of liquids production declined in 2008 as compared to 2007. Our current goal is to grow volumes aggressively in the East Panhandle System to offset the decline in volumes in the West Panhandle System (and resulting decline in our share of equity production). The start-up of the Red Deer Plant in June 2007 provided an additional 20 MMcf/d of processing capacity in our East Panhandle System that was immediately utilized by our customers. We expanded our Red Deer Plant facility during 2008 to handle additional volumes of 5 MMcf/d, bringing total capacity to 25 MMcf/d. We completed the shut-down of the Stinnett Plant and the consolidation of the volumes from the Stinnett Plant to the Cargray Plant. We initiated a project to relocate the Stinnett Plant to the Arrington Plant, with the goal of replacing the older refrigerated lean oil plant, resulting in additional processing capacity and improved product recovery efficiencies. This project has been postponed due to the reduction in drilling activity and the reduction in commodity prices. We intend to reevaluate the project in the near future and either resume the project, relocate the plant to the East Texas area or sell the plant.
Operating Expenses. Operating expenses, including taxes other than income, for the year ended December 31, 2008 were $34.3 million compared to $32.5 million for the year ended December 31, 2007. The major items impacting the $1.8 million increase in operating expenses for the year ended December 31, 2008 were a combination of the operations of the Red Deer plant for the full year in 2008 compared to only six months in 2007 and higher materials, supplies and labor costs. These increases in operating expenses were slightly offset by the fact that the year ended December 31, 2007 included additional maintenance costs for repairing the Arrington plant.
Depreciation and Amortization. Depreciation and amortization expenses for the year ended December 31, 2008 were $43.7 million compared to $42.3 million for the year ended December 31, 2007. The major items impacting the $1.4 million increase were the depreciation on the Red Deer Plant for a full year in 2008 compared to only six months in 2007 and beginning depreciation expense associated with the other capital expenditure projects.
Capital Expenditures. Capital expenditures for the year ended December 31, 2008 were $30.7 million as compared to $34.9 million for the year ended December 31, 2007. During 2008, of our capital spending in this segment, we spent $21.4 million on growth capital and $9.3 million on maintenance capital. We classify capital expenditures as either maintenance capital which represents routine well connects and capitalized maintenance activities or as growth capital which represents organic growth projects. Our decrease of $4.2 million in capital spending for 2008 was driven by less growth capital due to expenditures in 2007 on the new Red Deer Plant, which was offset by capital expenditures related to our Stinnett – Cargray plant consolidation projects during 2008.
East Texas/Louisiana Segment
| | | | | | | |
| | | Twelve Months Ending December 31, | |
| | | 2008(c) | | | 2007(b) | |
| | | ($ in thousands, except for realized prices) | |
| Revenues: | | | | | | |
Sales of natural gas, NGLs, oil and condensate | | $ | 298,720 | | | $ | 153,660 | |
| Gathering and treating services | | | 23,320 | | | | 13,547 | |
| Other | | | — | | | | (21 | ) |
Total revenues | | | 322,040 | | | | 167,186 | |
Cost of natural gas and natural gas liquids | | | 269,030 | | | | 133,350 | |
| Operating costs and expenses: | | | | | | | | |
Operations and maintenance | | | 16,569 | | | | 10,929 | |
Depreciation and amortization | | | 13,559 | | | | 10,781 | |
Impairment | | | 26,994 | | | | — | |
Total operating costs and expenses | | | 57,122 | | | | 21,710 | |
Operating income | | $ | (4,112 | ) | | $ | 12,126 | |
| | | | | | | | | |
Capital expenditures | | $ | 17,391 | | | $ | 25,560 | |
| | | | | | | | | |
| Realized prices: | | | | | | | | |
Oil and condensate (per Bbl) | | $ | 101.62 | | | $ | 73.33 | |
Natural gas (per Mcf) | | $ | 8.75 | | | $ | 6.54 | |
NGLs (per Bbl) | | $ | 54.66 | | | $ | 44.94 | |
| Production volumes: | | | | | | | | |
Gathering volumes (Mcf/d)(a) | | | 198,365 | | | | 134,007 | |
NGLs and condensate (net equity gallons) | | | 28,619,378 | | | | 18,320,082 | |
Natural gas short position (MMbtu/d)(a) | | | 1,427 | | | | 1,077 | |
| (a) | Gathering volumes (Mcf/d) and natural gas short position (MMbtu/d) are calculated by taking the total volume and then dividing by the number of days in the respective period. |
| (b) | Includes operations related to the Laser Acquisition starting on May 3, 2007. |
| (c) | Includes operations related to the Millennium Acquisition starting on October 2, 2008. |
Revenue and Cost of Natural Gas and Natural Gas Liquids. For the year ended December 31, 2008, revenues minus cost of natural gas and natural gas liquids for our East Texas/Louisiana Segment totaled $53.0 million compared to $33.8 million for the year ended December 31, 2007.
We were positively impacted from higher NGL and condensate pricing during 2008 as compared to 2007. We were also positively impacted by a 48% growth in daily gathering volumes during 2008, as compared to 2007. Increased volumes were due to both a full year of the Laser Acquisition during 2008 compared to approximately eight months 2007; three months of the Millennium Acquisition during 2008; and continued successful drilling in the Austin Chalk play in Tyler and Jasper Counties, Texas. Excluding the Laser Acquisition and the Millennium Acquisition, our gathering volumes increased by 26.6% during 2008 compared to 2007. We have also constructed a new seven mile lateral from our Brookeland gathering system into an active Austin Chalk drilling area where we have a large dedicated acreage position under a life-of-lease contract with an active significant producer. The production rates of wells drilled in the Austin Chalk play are characterized by high initial decline rates; therefore, operators must conduct active drilling programs if they are to maintain or grow their production in this play. Depending upon the continued success of the producer’s drilling activities on this acreage; this area may continue to provide added volume growth to our East Texas/Louisiana Segment in the future.
The Laser Acquisition positively impacted the East Texas/Louisiana Segment’s revenues minus cost of natural gas and natural gas liquids by $15.0 million during the year ended December 31, 2008, compared to $8.6 million during the same time period in the prior year. The increase is primarily the result of twelve months of operations during the year ended 2008 compared to approximately eight months during the same period in the prior year. The daily gathering volumes of the assets acquired in the Laser Acquisition during 2008, as compared to the time period of ownership of those assets in 2007, are down due to reduced drilling activity around the Belle Bower system.
The Millennium Acquisition positively impacted the East Texas/Louisiana Segment’s revenue minus cost of natural gas and natural gas liquids by $5.0 million.
Operating Expenses. Operating expenses for the year ended December 31, 2008 were $16.6 million compared to $10.9 million for the year ended December 31, 2007. The major items impacting the $5.6 million increase in operating expense for 2008 were (i) the additional months in 2008 that we have owned the assets acquired in 2007 as part of the Laser Acquisition (twelve months compared to approximately eight months); (ii) incremental expenses for additional compression costs due to increased gathered volumes on the Tyler County Pipeline and Brookeland system; (iii) preparation costs for hurricanes Ike and Gustav; (iv) expenses associated with operating the assets acquired as part of the Millennium Acquisition; and (v) higher materials, supply and labor expenses.
Depreciation and Amortization. Depreciation and amortization expenses for the year ended December 31, 2008 were $13.6 million compared to $10.8 million for the year ended December 31, 2007. The major items impacting the increase were (i) the additional months in 2008 that we owned the assets acquired as part of the Laser acquisition (twelve months compared to approximately eight months); (ii) placing the Tyler County Pipeline Extension into service and beginning the depreciation expense associated therewith; (iii) beginning the depreciation expense associated with other capital expenditure projects; and (iv) three months of depreciation and amortization of the assets acquired as part of the Millennium Acquisition.
Impairment. During the year ended December 31, 2008, we incurred impairment charges related to certain processing plants, gathering systems and contracts within our East Texas/Louisiana Segment of $27.0 million due to the substantial decline in commodity prices during the fourth quarter of 2008. No impairment charges were incurred during the year ended December 31, 2007.
Capital Expenditures. Capital expenditures for the year ended December 31, 2008 were $17.4 million compared to $25.6 million for the year ended December 31, 2007. During 2008, of our capital spending in this segment, we spent $14.5 million on growth capital and $2.9 million on maintenance capital. We classify capital expenditures as either maintenance capital, which represents routine well connects and capitalized maintenance activities, or as growth capital, which represents organic growth projects. Our decrease in capital spending for 2008 was due primarily to the high costs associated with the construction and start-up of the Tyler County Pipeline Extension in March 2007.
South Texas Segment
| | | | | | | |
| | | Twelve Months Ending December 31, | |
| | | 2008(c) | | | 2007(b) | |
| | | ($ in thousands, except for realized prices) | |
| Revenues: | | | | | | |
Sales of natural gas, NGLs, oil and condensate | | $ | 168,922 | | | $ | 49,859 | |
| Gathering and treating services | | | 4,779 | | | | 4,012 | |
| Other | | | 15 | | | | 1 | |
| Total revenues | | | 173,716 | | | | 53,872 | |
| Cost of natural gas and natural gas liquids | | | 161,963 | | | | 47,693 | |
| Operating costs and expenses: | | | | | | | | |
| Operations and maintenance | | | 2,924 | | | | 1,058 | |
| Depreciation and amortization | | | 4,428 | | | | 2,453 | |
Impairment | | | 8,105 | | | | — | |
| Total operating costs and expenses | | | 15,457 | | | | 3,511 | |
| Operating income (loss) from continuing operations | | | (3,704 | ) | | | 2,668 | |
| Discontinued operations | | | 1,782 | | | | 1,141 | |
| Operating income (loss) | | $ | (1,922 | ) | | $ | 3,809 | |
| | | | | | | | | |
| Capital expenditures | | $ | 1,145 | | | $ | 3,449 | |
| | | | | | | | | |
| Realized volumes: | | | | | | | | |
Oil and condensate (per Bbl) | | $ | 92.10 | | | $ | 78.89 | |
| Natural gas (per Mcf) | | $ | 8.99 | | | $ | 6.38 | |
| NGLs (per Bbl) | | $ | 52.66 | | | $ | 55.44 | |
| Production volumes: | | | | | | | | |
Gathering volumes (Mcf/d)(a) | | | 88,488 | | | | 63,435 | |
| NGLs and condensate (net equity gallons) | | | 2,413,483 | | | | 463,490 | |
Natural gas short position (MMbtu/d)(a) | | | 500 | | | | 250 | |
| (a) | Gathering volumes (Mcf/d) and natural gas short position (MMbtu/d) are calculated by taking the total volume and then dividing by the number of days in the respective period. |
| (b) | Includes operations related to the Laser Acquisition starting on May 3, 2007. |
| (c) | Includes operations related to the Millennium Acquisition starting on October 2, 2008. |
Revenue and Cost of Natural Gas and Natural Gas Liquids. During the year ended December 31, 2008 the South Texas Segment contributed revenues minus cost of natural gas and natural gas liquids of $11.8 million, as compared to $6.2 million for the year ended December 31, 2007. The increase during 2008, as compared to 2007 was due to a full year of operating the assets acquired as part of the Laser Acquisition as compared to approximately eight months in 2007 and also due to the additional assets acquired as part of the Millennium Acquisition. The assets acquired as part of the Millennium Acquisition positively impacted the South Texas Segment’s revenue minus cost of natural gas and natural gas liquids by $1.1 million. Also contributing to the increase in revenues minus cost of natural gas and natural gas liquids is the expansion during the fourth quarter of 2008 of the Kelsey Compressor Station on our Phase 1 20-inch Pipeline, which provides access to Exxon’s King Ranch processing facility, which added an additional 12 MMcf/d of capacity.
Operating Expenses. Operating expenses for the year ended December 31, 2008 were $2.9 million, as compared to $1.1 million for the year ended December 31, 2007. Operating expenses are higher due to (i) the additional months in 2008 that we have owned the assets acquired in 2007 as part of the Laser Acquisition (twelve months compared to approximately eight months); (ii) expenses associated with operating the assets acquired as part of the Millennium Acquisition; and (ii) higher material and labor expenses.
Depreciation and Amortization. Depreciation and amortization expenses for the year ended December 31, 2008 were $4.4 million, as compared to $2.5 million for the year ended December 31, 2007. Depreciation and amortization increased due to: (i) a full year of depreciation and amortization of the assets acquired in 2007 as part of the Laser Acquisition in 2008 as compared to approximately eight months in 2007; and (ii) depreciation and amortization associated with the assets acquired as part of the Millennium Acquisition.
Impairment. During the year ended December 31, 2008, we incurred impairment charges related to certain processing plants, gathering systems and contracts within our South Texas Segment of $8.1 million due to the substantial decline in commodity prices during the fourth quarter of 2008. No impairment charges were incurred during the year ended December 31, 2007.
Capital Expenditures. Capital expenditures for the year ended December 31, 2008 were $1.1 million as compared to $3.4 million for the year ended December 31, 2007. During the year ended December 31, 2008, we spent $0.8 million on growth capital and $0.3 million on maintenance capital. The decrease in capital expenditures in 2008 compared to 2007 was the result of the spending incurred in 2007 to add capacity and new supply to our Phase 1 20” pipeline.
Discontinued Operations. On April 1, 2009, we sold our producer services line of business, and thus have retrospectively classified the revenues minus the cost of natural gas and natural gas liquids as discontinued operations. During the year ended December 31, 2008, this business generated revenues of $265.1 million and cost of natural gas and natural gas liquids of $263.3 million, as compared to revenues of $134.8 million and cost of natural gas and natural gas liquids of $133.6 million during the year ended December 31, 2007.
Gulf of Mexico Segment
| | | | | | | |
| | | Three Months Ending December 31, | |
| | | 2008(b) | | | 2007 | |
| | | ($ in thousands, except for realized prices) | |
| Revenues: | | | | | | |
Sales of natural gas, NGLs, oil and condensate | | $ | 952 | | | $ | — | |
Gathering and treating services | | | 703 | | | | — | |
Other | | | — | | | | — | |
Total revenues | | | 1,655 | | | | — | |
Cost of natural gas and natural gas liquids | | | 1,376 | | | | — | |
| Operating costs and expenses: | | | | | | | | |
Operations and maintenance | | | 605 | | | | — | |
Depreciation and amortization | | | 1,521 | | | | — | |
Total operating costs and expenses | | | 2,126 | | | | — | |
Operating income (loss) | | $ | (1,847 | ) | | $ | — | |
| | | | | | | | | |
| Realized average prices: | | | | | | | | |
Natural gas (per Mcf) | | $ | 6.64 | | | $ | — | |
NGLs (per Bbl) | | $ | 20.58 | | | $ | — | |
| Production volumes: | | | | | | | | |
Gathering volumes (Mfc/d)(a) | | | 12,014 | | | | — | |
NGLs and condensate (net equity gallons) | | | 176,962 | | | | — | |
| (a) | Gathering volumes (Mcf/d) and natural gas short position (MMbtu/d) are calculated by taking the total volume and then dividing by the number of days in the respective period. |
| (b) | Includes operations related to the Millennium Acquisition starting on October 2, 2008. |
Revenues and Cost of Natural Gas and Natural Gas Liquids. The Gulf of Mexico Segment is a new segment and new area of operations for us in 2008. We entered into this segment as a result of the Millennium Acquisition, effective October 1, 2008. During 2008, the Gulf of Mexico Segment contributed $0.3 million in revenues minus cost of natural gas and natural gas liquids. Revenues minus the cost of natural gas and natural gas liquids were impacted in this segment as the result of damage inflicted on the Yscloskey and North Terrebonne plants by hurricanes Gustav and Ike. During the time period we owned these assets in 2008, the Yscloskey plant did not come back online and the North Terrebonne plant only came back online during mid November 2008.
Operating Expenses. Operating expenses for 2008 were $0.6 million for the Millennium Covered Period. We continued to incur operating expenses associated with the Yscloskey and North Terrebonne plants while the plants were undergoing repair for the hurricane damage. We anticipate that the costs for the repair of the two plants will either be covered by insurance proceeds or by the previous owners pursuant to the Millennium Acquisition purchase and sale agreement. In fact, we made our first claim against the sellers for such repair costs at the end of 2008 and received payment from the acquisition escrow on December 28, 2008 in the amount of $0.3 million. We have since made a claim for the balance of the $0.6 million in cash held in escrow (i.e. $0.3 million) and have begun canceling common units held in escrow to satisfy our claims. We may elect to cancel common units or wait to receive cash payment from the insurer for future amounts at our discretion.
Depreciation and Amortization. Depreciation and amortization expenses for 2008 were $1.5 million for the three months in 2008 that we owned the assets acquired in the Millennium Acquisition.
Capital Expenditures. We did not incur any capital expenditures related to the Gulf of Mexico Segment in 2008.
Upstream Segment
| | | | | | | |
| | | Twelve Months Ending December 31, | |
| | | 2008 (b) | | | 2007 (a) | |
| | | (Amounts in thousands, except volumes and realized prices) | |
| Revenues: | | | | | | |
Oil and condensate | | $ | 72,526 | | | $ | 24,874 | |
Sulfur | | | 37,759 | | | | 2,588 | |
Natural gas | | | 32,513 | | | | 11,210 | |
NGLs | | | 29,530 | | | | 12,015 | |
Income fees and other | | | — | | | | 948 | |
Other | | | 701 | | | | 130 | |
Total revenues | | | 173,029 | | | | 51,765 | |
| Operating Costs and expenses: | | | | | | | | |
Operations and maintenance | | | 37,481 | | | | 15,881 | |
Depletion, depreciation and amortization | | | 44,997 | | | | 16,235 | |
Impairment | | | 107,017 | | | | — | |
Goodwill impairment | | | 30,994 | | | | — | |
Total operating costs and expenses | | | 220,489 | | | | 32,116 | |
Operating income | | $ | (47,460 | ) | | $ | 19,649 | |
| | | | | | | | | |
Capital expenditures | | $ | 20,655 | | | $ | 2,242 | |
| | | | | | | | | |
| Realized average prices: | | | | | | | | |
Oil and condensate (per Bbl) | | $ | 87.21 | | | $ | 74.02 | |
Natural gas (per Mcf) | | $ | 7.89 | | | $ | 7.08 | |
NGLs (per Bbl) | | $ | 61.36 | | | $ | 56.66 | |
Sulfur (per Long ton) | | $ | 360.31 | | | $ | 58.55 | |
| Production volumes: | | | | | | | | |
Oil and condensate (Bbl) | | | 831,631 | | | | 336,028 | |
Natural gas (Mcf) | | | 4,122,997 | | | | 1,584,279 | |
NGLs (Bbl) | | | 481,259 | | | | 212,061 | |
Total (Mcfe) | | | 12,000,337 | | | | 4,872,813 | |
Sulfur (Long ton) | | | 104,795 | | | | 44,201 | |
| (a) | Includes operations from the Escambia and Redman acquisitions beginning on August 1, 2007. |
| (b) | Includes operations from the Stanolind Acquisition beginning on May 1, 2008. |
Acquisitions. On April 30, 2008, we acquired Stanolind Oil and Gas Corporation. All of the assets acquired in this transaction are located in the Permian Basin, primarily in Ward, Crane and Pecos counties, Texas. As of December 31, 2008, the transaction has added 252 operated producing wells, 21 non-operated producing wells and 44 injection wells to the Upstream Segment. During the eight month period ended December 31, 2008, these assets averaged approximately 1,906 Mcf/d, 372 Bop/d and 168 Bbls of NGL’s of production, net to our interest after deducting royalties. Also during the eight month period ended December 31, 2008, we drilled and completed five successful wells on the acquired leasehold acreage. One additional well was drilled during the period and is currently in its completion phase.
Revenue. For the year ended December 31, 2008, the Upstream Segment contributed $173.0 million of revenue as compared to $51.8 million for the year ended December 31, 2007. The increase in revenues in 2008 was due to higher realized prices for oil, natural gas, NGLs and sulfur, as well as eight months of operations related to the assets acquired in the Stanolind Acquisition, and a full year’s contribution from the assets acquired in the Escambia and Redman Acquisitions compared to only five months of operations in 2007. During the year ended December 31, 2008, production averaged 11.2 MMcf/d, 2.3 MBO/d, 1.3 MB/d of NGL’s and 286 LT/d of sulfur. The period included eight months of production from the assets acquired in the Stanolind acquisition properties which averaged 858 BOE/d. These increases in revenue in 2008 were offset by: (i) shut-in production at the Big Escambia Creek field associated with a 20 day planned turnaround of the BEC treating facility in April 2008; (ii) BEC experiencing 31 days and 18 days of partial curtailment associated with sulfur recovery limitations and facility damage caused by a lightning strike, respectively; and (iii) gas production from Flomaton and Fanny Church fields being restricted from sales for 25 days associated with a third party’s gas quality issue at the point of sale (Oil and sulfur sales from both Flomaton and Fanny Church fields continued during this period of curtailment).
During the year ended December 31, 2008, sulfur sales contributed $37.8 million of the total $173.0 million for the Upstream Segment. Historically, sulfur was viewed as a low value by-product in the production of oil and natural gas. Due to an increase in demand in the global fertilizer market during the first nine months of 2008, the price per long ton peaked at over $600 at the Tampa, Florida market (before effects of net-backs). During the last three months of 2008, demand in the global fertilizer market began to decline and the price per long ton at the Tampa, Florida market was $150 as of December 31, 2008. Further deterioration in the sulfur market and pricing has continued into the first quarter 2009. Sulfur pricing at the Tampa, Florida market in the first quarter 2009 is $0 per long ton. We anticipate sulfur disposal costs during the first quarter 2009 to be $50 to $60 per long ton, and we anticipate this pricing will continue in future quarters of 2009. During 2008, we attempted to identify and negotiate a long term contract to lock in some of the price upside, but we were unable to find a suitable counterparty.
Operating Expenses. Operating expenses, including severance and ad valorem taxes, totaled $37.5 million for the Upstream Segment during the year ended December 31, 2008, as compared to $15.9 million for the year ended December 31, 2007. The operating expenses in 2008 include eight months of expenses related to the assets acquired in the Stanolind Acquisition, as well as a full year of operating expense from the assets acquired in the Escambia and Redman Acquisitions compared to five months of expenses related to these assets in 2007. During the eight month period of the operation of the assets acquired in the Stanolind Acquisition, these assets accounted for $5.1 million of the total $37.5 million of operating expenses including severance and ad valorem taxes. Excluding severance and ad valorem taxes, the most significant portion of operating expenses were associated with operating the BEC and Flomaton treating and processing facilities, including operating expenses related to the planned turnaround at the BEC treating facility during April 2008. The remaining operating expenses are attributed to base lease operating expenses and well workovers. For 2008, our unit operating expense totaled $1.86 / Mcfe in the Upstream Business.
Depletion, Depreciation and Amortization. Depletion, depreciation and amortization expense for the year ended December 31, 2008 was $45.0 million, as compared to $16.2 million for the year ended December 31, 2007. This increase is due to us owning the assets acquired in the Escambia and Redman Acquisitions for twelve months in 2008 compared to only five months in 2007 and owning the assets acquired in the Stanolind Acquisition for eight months of 2008 compared to zero months in 2007.
Impairment. During the year ended December 31, 2008, we incurred an impairment charge of $107.0 million related to certain fields within our Upstream Segment as a result of the substantial decline in commodity prices during the fourth quarter of 2008. As a result of this impairment charge, we assessed our goodwill balance for impairment and recorded an impairment charge to goodwill of $31.0 million. We did not incur any impairment charges related to any of our fields or to goodwill during the year ended December 31, 2007.
Capital Expenditures. The Upstream Segment’s maintenance capital expenditures for the year ended December 31, 2008 totaled $14.2 million. The maintenance capital expenditures during 2008 were associated with the planned turnaround at the BEC treating facility, drilling, recompletions and workover activities. One successful Smackover test was drilled and completed in our Big Escambia Creek (BEC) field in 2008, while one additional BEC well is in the process of completion operations as of December 31, 2008. Maintenance capital was expended in fifteen non-operated wells drilled by a third party operator in various fields of East Texas and North Louisiana. Eagle Rock’s average working interest in this non operated drilling program is 3.8%. Recompletions and capital workovers were also conducted on eight operated wells across our South Texas, West Texas and Alabama regions during 2008. Five recompletions were executed in our Jourdanton field to complete additional Edwards formation intervals. Three of the five Edwards recompletions were successful. Three successful capital workovers were completed in our Alabama and West Texas operations resulting in significant reserve additions during 2008. The unit development cost for these recompletions and workover operations was $1.77/Mcfe. During 2009, we are not expecting to perform any turnarounds at the BEC treating facility.
Growth capital expenditures during 2008 totaled $6.5 million and were associated with five successful wells drilled and completed on leaseholds acquired from the Stanolind Acquisition in 2008. Four wells were drilled in the Ward-Estes field area on the Louis Richter and American National leases testing the San Andres, Holt and Penn formations. The fifth Permian Basin well was a successful completion in the Penn Sand on our American National lease in the Southern Unit field area.
For the total capital drilling program in 2008, we completed the drilling of 21 wells (5.8 net), of which 15 wells drilled were operated by others. As of December 31, 2008, two additional wells are in the process of completion operations. The total finding and development cost of the operated program was $1.47/Mcfe.
Minerals Segment
| | | | | | | |
| | | Twelve Months Ending December 31, | |
| | | 2008 | | | 2007(a) | |
| | | (Amounts in thousands, except volumes and realized prices) | |
| Revenues: | | | | | | |
Oil and condensate | | $ | 14,337 | | | $ | 7,529 | |
| Natural gas | | | 10,451 | | | | 5,493 | |
NGLs | | | 1,376 | | | | 693 | |
| Lease bonus, rentals and other | | | 16,830 | | | | 1,289 | |
| Total revenues | | | 42,994 | | | | 15,004 | |
| Operating Costs and expenses: | | | | | | | | |
Operating | �� | | 1,708 | | | | 771 | |
| Depreciation and depletion | | | 7,774 | | | | 8,028 | |
Impairment | | | 1,741 | | | | 5,749 | |
| Total operating costs and expenses | | | 11,223 | | | | 14,548 | |
| Operating Income | | $ | 31,771 | | | $ | 456 | |
| | | | | | | | | |
| Realized average prices: | | | | | | | | |
| Oil and condensate (per Bbl) | | $ | 91.83 | | | $ | 70.84 | |
| Natural gas (per Mcf) | | $ | 8.18 | | | $ | 6.30 | |
| NGLs (per Bbl) | | $ | 52.32 | | | $ | 46.63 | |
| Production volumes: | | | | | | | | |
| Oil and condensate (Bbl) | | | 156,118 | | | | 106,275 | |
| Natural gas (Mcf) | | | 1,277,046 | | | | 872,176 | |
| NGLs (Bbl) | | | 26,298 | | | | 14,862 | |
| Total (Mcfe) | | | 2,371,542 | | | | 1,599,001 | |
| (a) | Includes operations from the Montierra Acquisition beginning on May 1, 2007 and from the MacLondon Acquisition beginning on July 1, 2007. |
Revenue. For the year ended December 31, 2008 our revenue was $43.0 million compared to $15.0 million for the year ended December 31, 2007. The increase in revenue was due to (i) increases in commodity prices, (ii) increases in production rates during 2008, which was the result of drilling, recompletion and workover operations conducted by the various operators of the properties and (iii) owning these properties for the full year in 2008.
Additionally, we received approximately $16.8 million in bonus and delay rental payments during the year ended December 31, 2008. Substantially all of this was derived from our ownership in the minerals. The majority of this bonus revenue ($12.8 million) was derived from new leases executed during the third and fourth quarters in 2008 on our behalf by the Minerals Manager in the emerging Haynesville shale play. As a result of these leases, we now have the opportunity to receive future royalty revenues from wells drilled on approximately 75,000 gross acres in Desoto and Sabine Parishes, Louisiana and San Augustine and Sabine Counties, Texas. In addition, we made a capital contribution to Ivory Working Interest Partners who then used the funds (along with other funds contributed by the remaining partners) to purchase a working interest position in approximately 60,000 gross acres in the Haynesville shale play, in San Augustine and Sabine Counties, Texas. We also own a mineral interest in approximately 32,000 of these acres (included in the 75,000 acres mentioned above).
The amount of revenue we receive from bonus and rental payments varies significantly from month to month; therefore, we do not believe a meaningful set of conclusions can be drawn by observing changes in leasing activity over small time periods. Commodity prices may affect the amount of leasing that will occur on the minerals in future periods, and it is impossible to predict the timing or amount of future bonus payments. We do expect to receive some level of bonus payments in the future, however.
Operating Expenses. Operating expenses of $1.7 million for the year ended December 31, 2008 as compared to $0.8 million for the year ended December 31, 2007 are predominately production and ad valorem taxes. These taxes are levied by various state and local taxing entities. For the year ended December 31, 2008, operating expenses include a full year of production and ad valorem taxes for the assets acquired in the Montierra and MacLondon Acquisition, while 2007 includes only approximately eight months for the assets acquired in the Montierra Acquisition and six months for the assets acquired in the MacLondon Acquisition.
Impairment. During the year ended December 31, 2008, we incurred an impairment charge of $1.7 million related to certain fields within our Minerals Segment as a result of the substantial decline in commodity prices during the fourth quarter of 2008. During the year ended December 31, 2007, we recorded an impairment charge of $5.7 million as a result of steeper decline rates in certain fields.
Depletion. Our depletion during the year ended December 31, 2008 was $7.8 million as compared to $8.0 million for the year ended December 31, 2008.
Corporate Segment
| | | | | | | |
| | | Twelve Months Ending December 31, | |
| | | 2008 | | | 2007 | |
| | | ($ in thousands) | |
| Revenues: | | | | | | |
Realized commodity derivatives | | $ | (46,059 | ) | | $ | (3,061 | ) |
Unrealized commodity derivatives | | | 207,824 | | | | (130,773 | ) |
Total revenues | | | 161,765 | | | | (133,834 | ) |
General and administrative | | | 45,701 | | | | 27,799 | |
Depreciation and amortization | | | 787 | | | | 754 | |
Other expense | | | 10,699 | | | | 2,847 | |
Operating income | | | 104,578 | | | | (165,234 | ) |
| Other income (expense): | | | | | | | | |
Interest income | | | 793 | | | | 1,160 | |
Other income | | | 5,328 | | | | 696 | |
Interest expense, net | | | (32,884 | ) | | | (38,936 | ) |
Unrealized interest rate derivative gains (losses) | | | (27,717 | ) | | | (13,403 | ) |
Realized interest rate derivative gains (losses) | | | (5,214 | ) | | | 1,415 | |
Other income (expense) | | | (955 | ) | | | (8,226 | ) |
Total other income (expense) | | | (60,649 | ) | | | (57,294 | ) |
Gain (loss) from continuing operations before taxes | | | 43,929 | | | | (222,528 | ) |
Income tax provision | | | (1,134 | ) | | | 158 | |
Gain (loss) from continuing operations | | | 45,063 | | | | (222,686 | ) |
Discontinued operations | | | (18 | ) | | | (11 | ) |
Segment gain (loss) | | $ | 45,045 | | | $ | (222,697 | ) |
| | | | | | | | | |
Revenue. As a master limited partnership, we distribute available cash (as defined in our partnership agreement) every quarter to our unitholders. Our distribution policy, including a description of the right to make reserves against available cash, is discussed in greater detail in Part II, Item 5. Market for Registrant’s Common Equity, Related Unitholder Matters and Issuer Purchases of Equity Securities - Cash Distribution Policy.
The volatility inherent in commodity prices generates uncertainty in future levels of available cash. We enter into derivative transactions to reduce our exposure to commodity price risk and reduce the uncertainty of future cash flows.
Our Corporate Segment’s revenue, which solely includes our commodity derivatives activity, increased to a gain of $161.8 million for the year ended December 31, 2008, from a loss of $133.8 million for the year ended December 31, 2007. As a result of our commodity hedging activities, revenues include total realized losses of $46.1 million on risk management activity settled during the year ended December 31, 2008 and unrealized mark-to-market gains of $207.8 million for the year ended December 31, 2008, as compared to realized losses of $3.1 million and unrealized losses of $130.8 million for the year ended December 31, 2007. During the year ended December 31, 2008, our realized losses were partially offset by realized gains as a result of the hedge resets performed in the fourth quarter of 2008. In addition, we recorded amortization related to put premiums and costs associated with the resetting of derivative contract prices of $13.3 million during the year ended December 31, 2008 as compared to $8.2 million for the year ended December 31, 2007.
As the forward price curves for our hedged commodities shift in relation to the caps, floors, and swap strike prices, the fair value of such instruments changes. We capture this change as unrealized, non-cash, mark-to-market changes during the period of the change. The unrealized mark-to-market changes for the year ended December 31, 2008 and 2007 had no impact on cash activities for those periods and, as such, are excluded from our calculation of Adjusted EBITDA. The realized commodity derivatives results during the year ended December 31, 2008 reflect the difference between the strike prices and settlement prices for derivative volumes settled during the year. As such, the realized amounts impact our cash flows and are included in our calculation of Adjusted EBITDA.
Given the uncertainty surrounding future commodity prices, and the general inability to predict future commodity prices as they relate to the strike prices at which we have hedged our exposure, it is difficult to predict the magnitude and impact that marking our hedges to market will have on our income from operations in future periods. Conversely, negative commodity price movements affecting our revenues and costs are expected to be partially offset by our executed derivative instruments.
General and Administrative Expenses. General and administrative expenses were $45.7 million for the year ended December 31, 2008 as compared to $27.8 million for the year ended December 31, 2007. This growth in general and administrative expenses was mostly driven by an increase in the number of employees in our corporate office as a result of: our midstream acquisitions in both 2008 and 2007; our expansion into the minerals and upstream businesses related to the Montierra, Redman, EAC and Stanolind acquisitions in both 2008 and 2007; and recruiting efforts in accounting, engineering, land and operations. As a result of the acquisitions and recruiting efforts, corporate-office payroll expenses increased by $11.9 million for the year ended December 31, 2008 as compared to the same period in the prior year. In addition, other professional fees, including our public partnership expenses related to audit, tax, Sarbanes-Oxley compliance and other contract labor increased by $2.5 million for the year ended December 31, 2008. We also experienced increased miscellaneous general and administrative expenses of $1.0 million for the year ended December 31, 2008. At the present time, we do not allocate our general and administrative expenses to our operational segments. The Corporate Segment bears the entire amount.
For the years ended December 31, 2008 and 2007, non-cash compensation expense of approximately $6.0 million and $2.4 million, respectively, was recorded as general and administrative expense related to restricted units granted under the Partnership’s long-term incentive plan (“LTIP”).
General and administrative expenses also increased by $1.7 million in 2008 due to non-cash compensation expense allocated to us related to the issuance of Tier I incentive units by Eagle Rock Holdings, L.P. During 2008, Holdings granted 417,000 Tier I incentive interests in the aggregate to six Eagle Rock employees. One of these employees subsequently forfeited 200,000 of the interests upon his resignation from Eagle Rock in 2008. The Tier I incentive interests entitle the holder to immediately begin to share in the cash distributions of Holdings because the associated payout target was reached in 2006. Grants of Tier I incentive units by Holdings to employees working on our behalf are intended to provide additional motivation for those employees to create value at Holdings, in part through their actions to create value in the equity Holdings holds in us. Because the incentive interests represent an interest in the future profits of Holdings, and receive distributions only from the cash flow at Holdings, the value the incentive interests creates accrues to the benefit of our unitholders without any associated burden on, or dilution to, the returns on our common units. On the contrary, the incentive units are solely a burden on, and dilutive to, the returns of the equity owners of Holdings, including NGP as the substantial majority equity owner of Holdings. We have determined to record a portion of the value of the incentive units as compensation expense in our financial statements based on our estimate of the total value of the incentive unit grant and based on our estimate of the grantee’s portion of time dedicated to us.
Other Operating Expenses. In July 2008, SemGroup, L.P. and certain of its subsidiaries (“SemGroup”) filed petitions for reorganization under Chapter 11 of the U.S. Bankruptcy Code. We historically sold portions of our condensate production from our Texas Panhandle and East Texas midstream systems to SemGroup. During July 2008, we sold pre-bankruptcy, and continued to sell post-bankruptcy, condensate to SemGroup. As of August 1, 2008, we ceased all deliveries/sales of condensate to SemGroup. As a result of the bankruptcy we recorded a $10.7 million bad debt charge during the year ended December 31, 2008 which is included in “Other Operating Expense” in the consolidated statement of operations. Although we sought payment of our $10.7 million receivable for condensate sales as a critical supplier to SemGroup under its Supplier Protection Program (“SPP”), we were not successful in being recognized as a critical provider by SemGroup and thus were not admitted to the SPP.
For the year ended December 31, 2007, other operating expenses included a settlement of arbitration of $1.4 million, severance to a former executive of $0.3 million, and $1.1 million for liquidated damages related to the late registration of our common units.
Total Other Expense. Total other expense, which includes both realized and unrealized gains and losses from our interest rate swaps, increased to $61.5 million for the year ended December 31, 2008 as compared to $57.3 million for the year ended December 31, 2007. During 2008, we incurred realized losses from our interest rate swaps of $5.2 million as compared to realized gains of $1.4 million during the year ended December 31, 2007. We also incurred unrealized mark-to-market losses from our interest rate swaps of $28.6 million during the year ended December 31, 2008 as compared to unrealized mark-to-market losses of $13.4 for the same period in 2007. These unrealized mark-to-market losses did not have any impact on cash activities for the period, and are excluded by definition from our calculation of Adjusted EBITDA.
Interest expense, net, decreased to $32.9 million for the year ended December 31, 2008 as compared to $38.9 million during the same period in the prior year. The decrease in interest expense, net, is due to the decrease in interest rates from December 31, 2007 to December 31, 2008 as well as lower interest rate margin under the new senior revolving credit facility, partially offset by higher debt balances.
Other income includes our equity in earnings of the partnerships described in Part I, Item 1. Business – Minerals Business (Ivory Working Interests, L.P and Ivory Acquisition Partners, L.P.). During the year ended December 31, 2008, we recorded income of $8.2 million. This income was partially offset by a loss on the sale of investments of $2.1 million due to the reversion of our interest in the IAP partnership. During the year ended December 31, 2007, we recorded income of $0.7 million related to the equity in earnings of the partnerships. In addition, other income for the year ended December 31, 2008 includes a $1.3 million gain on the sale of assets related to properties we sold.
Income Tax (Benefit) Provision. Income tax benefit recorded during the year ended December 31, 2008 reflects the Texas Margin Tax as recorded during the current year and offset by the reduction of the deferred tax liability created by the book/tax differences as a result of the federal income taxes associated with the Redman and Stanolind Acquisitions. For further discussion of our income tax (benefit) provision, see Note 15 to our consolidated financial statements included in Part II, Item 8, Financial Statements and Supplementary Data staring on page F-1 of this Annual Report.
Adjusted EBITDA.
Adjusted EBITDA, as defined under Part II, Item 6. Selected Financial Data - Non-GAAP Financial Measures, increased by $115.2 million from $132.2 million for the year ended December 31, 2007 to $247.4 million for the year ended December 31, 2008.
As described above, revenues minus cost of natural gas and natural gas liquids for the Midstream Segment (including the Texas Panhandle, East Texas/Louisiana, South Texas and Gulf of Mexico Segments) grew by $53.3 million during the year ended December 31, 2008, as compared to the comparable period in 2007. The acquisitions which led to our entry into our Upstream and Minerals Segments contributed an additional $149.3 million to revenues during the year ended December 31, 2008, as compared to the comparable period in 2007. Our Corporate Segment’s realized commodity derivatives loss decreased by $43.0 million during the year ended December 31, 2008 as compared to the comparable period in 2007. This resulted in $160.1 million of total incremental revenues minus cost of natural gas and natural gas liquids during the year ended December 31, 2008, as compared to the comparable period in 2007. The incremental revenue amounts are adjusted to exclude the impact of unrealized commodity derivatives not included in the calculation of Adjusted EBITDA.
Operating expenses (including taxes other than income) for our Midstream Segment increased by $9.9 million for the year ended December 31, 2008, as compared to the same period in 2007, while the acquisitions which created the Upstream and Minerals Segments in 2007 and 2008 contributed additional Operating Expenses (including taxes other than income) of $22.5 million for the year ended December 31, 2008, as compared to the comparable period in 2007.
General and administrative expense, excluding the impact of non-cash compensation charges related to our long-term incentive program, Holding’s Tier I incentive units and other non-recurring items and captured within our Corporate Segment, increased during the year ended December 31, 2008 by $11.8 million, as compared to the respective period in 2007.
As a result, revenues (excluding the impact of unrealized commodity derivative activity) minus cost of natural gas and natural gas liquids for the year ended December 31, 2008, as compared to the same period in 2007 increased by $160.1 million, operating expenses increased by $32.4 million and general and administrative expenses increased by $11.8 million. The increases in revenues minus the cost of natural gas and natural gas liquids, offset by increases in operating costs and general and administrative expenses resulted in an increase to Adjusted EBITDA during the year ended December 31, 2008, as compared to the year ended December 31, 2007.
Year Ended December 31, 2007 Compared with Year Ended December 31, 2006
Summary of Consolidated Operating Results
Below is a table of a summary of our consolidated operating results for the years ended December 31, 2007 and December 31, 2006. Operating results for our individual operating segments are presented in tables in this Item 7.
| | | | | | | |
| | | Year Ended December 31, | |
| | | 2007 | | | 2006 | |
| | | ($ in thousands) | |
| Revenues: | | | | | | |
Sales of natural gas, NGLs, oil and condensate | | $ | 733,326 | | | $ | 486,911 | |
Gathering and treating services | | | 27,417 | | | | 14,862 | |
Minerals and royalty income | | | 15,004 | | | | — | |
Commodity derivatives | | | (133,834 | ) | | | (24,004 | ) |
Other | | | 110 | | | | 621 | |
Total revenues | | | 642,023 | | | | 478,390 | |
Cost of natural gas and natural gas liquids | | | 553,248 | | | | 377,580 | |
| Costs and expenses: | | | | | | | | |
Operating | | | 52,793 | | | | 32,905 | |
Taxes and other income | | | 8,340 | | | | 2,301 | |
General and administrative | | | 27,799 | | | | 10,860 | |
Other expense | | | 2,847 | | | | 6,000 | |
Depreciation, depletion and amortization | | | 80,559 | | | | 43,220 | |
Impairment | | | 5,749 | | | | — | |
Total costs and expenses | | | 178,087 | | | | 95,286 | |
Total operating income (loss) | | | (89,312 | ) | | | 5,524 | |
| Other income (expense): | | | | | | | | |
Interest income | | | 1,160 | | | | 996 | |
Other income | | | 696 | | | | — | |
Interest expense | | | (37,521 | ) | | | (29,759 | ) |
Unrealized interest rate derivatives | | | (13,403 | ) | | | 2,774 | |
Other income (expense) | | | (8,226 | ) | | | (1,619 | ) |
Total other income (expense) | | | (57,294 | ) | | | (27,608 | ) |
Loss from continuing operations before taxes | | | (146,606 | ) | | | (22,084 | ) |
Income tax provision | | | 158 | | | | 1,230 | |
Loss from continuing operations | | | (146,764 | ) | | | (23,314 | ) |
Discontinued operations | | | 1,130 | | | | — | |
Net income (loss) | | $ | (145,634 | ) | | $ | (23,314 | ) |
Adjusted EBITDA(a) | | $ | 132,216 | | | $ | 81,192 | |
| | | | | | | | | |
| (a) | See Part II, Item 6. Selected Financial Data – Non-GAAP Financial Measures for a definition and reconciliation to GAAP. |
For the year ended December 31, 2007, based on operating income of our non-Corporate segments, our Midstream Business comprised approximately 73.9% of our business (with the Texas Panhandle Segment accounting for 53.2% of our business, the South Texas Segment accounting for 4.9% of our business, and the East Texas/Louisiana Segment accounting for 15.7% of our business), our Upstream Business comprised approximately 25.5% of our business, and our Minerals Business comprised approximately 0.6% of our business.
Midstream Business (Three Segments)
Significant Acquisitions and Organic Growth Projects in 2007
The Laser Acquisition, completed in May 2007 (hereinafter, the period of operation from May 3 through December 31, 2007, the “Laser Covered Period”), contributed a number of gathering and processing assets to the Midstream Business. The assets were split between the East Texas/Louisiana Segment and established the new South Texas Segment. The assets acquired consisted of:
| | • | Approximately 137 miles of natural gas gathering pipelines ranging in size from two inches to 20 inches in diameter. |
| | • | Approximately 8100 aggregate horsepower. |
| | • | Three processing stations consisting of processing and related facilities for an aggregate capacity of 87 MMcf/d. |
| | • | Producer Services utilizing our pipelines and third-party pipelines for the purchase and sale of wellhead natural gas. |
We also completed two significant organic growth capital projects, one in the Texas Panhandle Segment (refurbishment and start-up of the Red Deer Plant) and the other in the East Texas/Louisiana Segment (completion of the Tyler County Pipeline Extension), both of which contributed to the results in 2007.
Texas Panhandle Segment
| | | | | | | |
| | | Twelve Months Ending December 31, | |
| | | 2007 | | | 2006 | |
| | | ($ in thousands) | |
| Revenues: | | | | | | |
Sales of natural gas, NGLs, oil and condensate | | $ | 479,120 | | | $ | 415,331 | |
Gathering and treating services | | | 8,910 | | | | 7,382 | |
Other | | | — | | | | 339 | |
Total revenues | | | 488,030 | | | | 423,052 | |
Cost of natural as and natural gas liquids | | | 372,205 | | | | 317,626 | |
| Operating costs and expenses: | | | | | | | | |
| Operations and maintenance | | | 30,635 | | | | 28,318 | |
Taxes other than income | | | 1,859 | | | | 1,758 | |
Depreciation and amortization | | | 42,308 | | | | 36,270 | |
Total operating costs and expenses | | | 74,802 | | | | 66,346 | |
Operating income | | $ | 41,023 | | | $ | 39,080 | |
| | | | | | | | | |
Revenues and Cost of natural gas and natural gas liquids. For the year ended December 31, 2007, the revenues minus cost of natural gas and natural gas liquids for our Texas Panhandle Segment operations totaled $115.8 million compared to $105.4 million for the year ended December 31, 2006. There were two primary contributors to this increase: (i) higher NGL and condensate pricing, as compared to pricing in 2007, and (ii) flat natural gas pricing, as compared to pricing in 2007.
Due to the large component of keep-whole contracts in our West Panhandle System, we are a net buyer of natural gas in the Texas Panhandle Segment. Given this short position in natural gas, we were positively impacted in 2007 from a flat natural gas price from 2006 to 2007, essentially maintaining our cost of gas at a constant rate, and rising NGL and condensate prices in the same period, which resulted in a higher fractionation spread in 2007 as compared to 2006.
During 2007, this Segment gathered an average of 151.3 MMcf/d of natural gas on its pipelines and processed an average of 122 MMcf/d of natural gas as compared to gathering an average of 146.4 MMcf/d of natural gas on its pipelines and processing an average of 112.7 MMcf/d of natural gas during 2006. During 2007, we recovered an average of 11,896 Bbls/d of NGLs of which our equity share was 3,678 Bbls/d compared to an average of 11,322 Bbls/d of NGLs recovered during 2006, of which our equity share was 3,828 Bbls/d during 2006. During 2007 we recovered an average of 2,200 Bbls/d of condensate from our gathering systems of which our equity share was 2,125 Bbls/d as compared to 2,619 Bbls/d of condensate from our gathering systems of which our equity share was 2,549 Bbls/d during 2006.
The positive pricing impact was partially offset by a reduction of our equity share of production. This is primarily due to a continued decline in volumes in our West Panhandle System and partially due to the colder than normal weather in that area during the first quarter. The drilling activity in the West Panhandle System is not sufficient to offset the natural declines experienced on the System. While our contract mix in the West Panhandle System provides us with a higher equity share of the production, the overall decline will continue and we expect to recover smaller equity production in the future on the West Panhandle System.
The East Panhandle System continues to experience strong growth in volumes and equity production due to the active Granite Wash drilling play located in Roberts and Hemphill Counties, Texas. The liquids content of the natural gas is lower in the East Texas Panhandle System and our contract mix provides us with a smaller share of equity production as compared to the West Panhandle System. Due to this difference in contract mix and liquid content between our West and East Panhandle Systems, while we have grown aggregate volumes during 2007 as compared to 2006, our equity share of liquids production has been reduced. Our goal is to grow volumes aggressively in the East Panhandle System to offset the decline in volumes and our share of equity production in the West Panhandle System. The start-up of the Red Deer Plant in June 2007 provided an additional 20 MMcf/d of processing capacity in our East Panhandle System that was immediately utilized by our customers.
Other significant events during 2007 included the Arrington Plant downtime during the second quarter resulting in a negative impact of approximately $2.7 million.
Operating Expenses. Operating expenses for 2007 were $30.6. million compared to $28.3 million in 2006. The major items impacting the $2.3 million increase in operating expense were (i) $1.0 million associated with the start-up and operations of the Red Deer Plant, (ii) $0.5 million for the unscheduled Arrington shutdown, (iii) $0.4 million for additional rental compression due to increased natural gas volumes on the East Panhandle System, (iv) $0.1 million study to review moving the Tonkawa Plant to a new location and (v) $0.1 million incremental costs for scheduled shutdowns as compared to 2006.
Depreciation and Amortization. Depreciation and amortization expenses for 2007 were $42.3 million compared to $36.3 million in 2006. The major items impacting the $6.0 million increase were (i) a full year for the MGS Acquisition and (ii) placing the Red Deer Plant into service and beginning the depreciation expense associated with the capital spend.
Capital Expenditures. Capital expenditures for 2007 were $34.9 million compared to $12.2 million in 2007. We classify capital expenditures as either maintenance capital which represents routine well connects and capitalized maintenance activities or as growth capital which represents organic growth projects. In 2007, growth capital represented 71% of our capital expenditures as compared to 52% in 2006. Our increase in growth capital of $18.2 million and routine well connects of $3.1 million in this area were driven by the continued heavy drilling activity in the Granite Wash play. Growth capital expenditures focused on adding additional capacity to our systems as reflected by the Red Deer Plant project and compressor station expansions. We anticipate continued growth capital expenditures as we have announced the replacement of our existing Arrington Plant with a cryogenic plant to provide more capacity for our customers in the Granite Wash play. In addition to growth capital, we continued to spend on maintenance capital to make up for the lack of maintenance performed by the previous owners of the assets. We spent an additional $1.7 million on overhauls of compression during 2007 compared to 2006 in order to improve runtimes and service to our customers.
East Texas/Louisiana Segment
| | | | | | | |
| | | Twelve Months Ending December 31 | |
| | | 2007 | | | 2006 | |
| | | ($ in thousands) | |
| Revenues: | | | | | | |
Sales of natural gas, NGLs, oil and condensate | | $ | 153,660 | | | $ | 71,580 | |
Gathering and treating services | | | 13,547 | | | | 7,480 | |
Other | | | (21 | ) | | | 282 | |
Total revenues | | | 167,186 | | | | 79,342 | |
Cost of natural gas and natural gas liquids | | | 133,350 | | | | 59,954 | |
| Operating costs and expenses: | | | | | | | | |
Operations and maintenance | | | 9,773 | | | | 4,587 | |
Taxes other than income | | | 1,156 | | | | 543 | |
Depreciation and amortization | | | 10,781 | | | | 5,915 | |
Total operating costs and expenses | | | 21,710 | | | | 11,045 | |
Operating income | | $ | 12,126 | | | $ | 8,343 | |
| | | | | | | | | |
Revenues and Cost of natural gas and natural gas liquids. For the year ended December 31, 2007, revenues minus cost of natural gas and natural gas liquids for our East Texas/Louisiana Segment totaled $33.8 million compared to $19.4 million for the year ended December 31, 2006. During 2007, this segment gathered an average of 134.0 MMcf/d of natural gas on its pipelines and processed an average of 108.4 MMcf/d of natural gas as compared to gathering an average of 72.2 MMcf/d of natural gas on its pipelines and processing an average of 70.7 MMcf/d of natural gas during 2006. During 2007, we produced an average of 5,380 Bbls/d of NGLs of which our equity share was 1,118 Bbls/d compared to 3,624 Bbls/d of NGLs of which our equity share was 841 Bbls/d during 2006. We recovered during 2007 an average of 112 Bbls/d of condensate from our gathering systems of which our equity share was 77 Bbls/d compared to an average of 84 Bbls/d of condensate from our gathering systems of which our equity share was 37 Bbls/d during 2006.
The Laser Acquisition positively impacted the East Texas/Louisiana Segment by $8.6 million during 2007. For the approximate eight months of the Laser Covered Period, the assets acquired in the Laser Acquisition added 52.5 MMcf/d average volume and 177 Bbls/d of NGL production. The Laser Acquisition contract mix is weighted to fee-based contracts. Fees we received from these contracts represented $5.0 million of the $8.6 million.
We were positively impacted from higher NGL and condensate pricing during 2007 as compared to 2006. Due to the large component of fixed recovery contracts, we are from time to time a net buyer of natural gas in the East Texas/Louisiana area. During those times where we were net short natural gas, we were positively impacted from a flat natural gas price from 2006 to 2007. The flat natural gas price and rising NGL and condensate prices resulted in a higher fractionation spread in 2007 as compared to 2006 which positively impacted the fixed recovery contract mix. During those times where we were a net seller of natural gas, the flat natural gas pricing environment had no negative financial impact to us.
We were positively impacted by a 78% gathering volume growth during 2007 compared to 2006. Volumes increased due to both the Laser Acquisition and continued drilling in the Austin Chalk play in Tyler and Jasper Counties, Texas. Excluding the Laser Acquisition, our gathering volumes increased by 32%. The Tyler County Pipeline Extension completed in March 2007, connected the Tyler County Pipeline to our Brookeland gathering system providing an additional 50 MMcf/d of outlet capacity for the Tyler County Pipeline. The Tyler County Pipeline has greatly benefited from the active drilling in the Austin Chalk play. The Austin Chalk’s production profile is characterized by steep initial declines in new wells requiring active drilling programs by producers to maintain or grow volumes. We have also constructed a new seven mile lateral from our Brookeland gathering system into an active Austin Chalk drilling area where we have a large dedicated acreage position under a life-of-lease contract with Anadarko Exploration and Production Company.
Operating Expenses. Operating expenses for 2007 were $9.8 million compared to $4.6 million in 2006. The major items impacting the $5.2 million increase in operating expense were (i) $3.9 million for the eight months that we have owned the assets in 2007 that were a part of the Laser Acquisition, (ii) $0.8 million for a full year of operations in 2007 compared to only 9 months of ownership in 2006 of the assets acquired in the Brookeland Acquisition, (iii) $0.4 million expenses for operating compression due to increased natural gas volumes on the Tyler County Pipeline, and (iv) $0.3 million our share for unscheduled downtime and repair work at the non operated Indian Springs Plant.
Depreciation and Amortization. Depreciation and amortization expenses for 2007 were $10.8 million compared to $5.9 million in 2006. The major items impacting the $4.9 million increase were (i) the inclusion of eight months of the Laser Acquisition, (ii) a full year for the Brookeland Acquisition and (iii) placing the Tyler County Pipeline Extension into service and beginning the depletion and amortization expense associated with the capital spend.
Capital Expenditures. Capital expenditures for 2007 were $25.6 million compared to $0.7 million in 2006. We classify capital expenditures as either maintenance capital which represents routine well connects and capitalized maintenance activities or as growth capital which represents organic growth projects. In 2006 and 2007 growth capital represents over 90% of the capital expenditures in the area. Growth capital expenditures focused on adding additional capacity to our systems to meet the active Austin Chalk play in the Jasper and Tyler Counties in Texas. Major projects completed in 2007 were the Tyler County Pipeline Extension and the Brookeland Gathering System expansion. In addition to capital expenditures incurred to support the Austin Chalk play, growth capital expenditures increased by an additional $2.0 due to the Laser Acquisition and supporting growth in those areas. Maintenance capital expenditures for 2007 increased by $1.3 million due to the Laser Acquisition.
South Texas Segment
| | | | | | | |
| | | Twelve Months Ending December 31 | |
| | | 2007 | | | 2006 | |
| | | ($ in thousands) | |
| Revenues: | | | | | | |
Sales of natural gas, NGLs, oil and condensate | | $ | 49,859 | | | $ | — | |
Gathering and treating services | | | 4,012 | | | | — | |
Other | | | 1 | | | | — | |
Total revenues | | | 53,872 | | | | — | |
Cost of natural gas and natural gas liquids | | | 47,693 | | | | — | |
| Operating costs and expenses: | | | | | | | | |
Operations and maintenance | | | 911 | | | | — | |
Taxes other than income | | | 147 | | | | — | |
Depreciation and amortization | | | 2,453 | | | | — | |
Total operating costs and expenses | | | 3,511 | | | | — | |
Operating income from continuing operations | | | 2,668 | | | | — | |
Discontinued operations | | | 1,141 | | | | — | |
Operating income | | $ | 3,809 | | | $ | — | |
| | | | | | | | | |
Revenues and Cost of natural gas and natural gas liquids. This segment was a new area of operations for us in 2007. We entered into this segment as a result of the Laser Acquisition, effective May, 2007. During the Laser Covered Period, the South Texas Segment contributed $6.2 million in revenues minus cost of natural gas and natural gas liquids
Two significant items that will continue to add value to this area are (i) a pipeline extension to connect Chesapeake Energy Corporation’s and other operator’s production to our Phase 1 20” Pipeline and (ii) the construction of the Kelsey Compressor Station on our Phase 1 20” Pipeline which will provide access to Exxon’s King Ranch processing facility, resulting in an incremental 24 MMcf/d of capacity. The construction of this station will enable us to continue to increase volumes on our Phase 1 20” Pipeline providing that drilling activity and our commercial success to contract for the natural gas continues in 2008.
Operating Expenses. Operating expenses for 2007 were $0.9 million in for the Laser Covered Period.
Depreciation and Amortization. Depreciation and amortization expenses for 2007 were $2.5 million for the eight months in 2007 that we have owned the assets part of the Laser Acquisition.
Capital Expenditures. Capital expenditures for 2007 were $3.4 million for the eight months in 2007 that we have owned the assets part of the Laser Acquisition in 2007. This spending was primarily growth capital focused on adding capacity and new supply to our Phase 1 20” pipeline.
Discontinued Operations. On April 1, 2009, we sold our producer services line of business, and thus have retrospectively classified the revenues minus the cost of natural gas and natural gas liquids as discontinued operations. During the year ended December 31, 2007, this business generated revenues of $134.8 million and cost of natural gas and natural gas liquids of $133.6 million.
Upstream Segment
| | | | | | | |
| | | Twelve Months Ending December 31 | |
| | | 2007 | | | 2006 | |
| | | ($ in thousands) | |
| Revenues: | | | | | | |
Oil and condensate | | $ | 24,874 | | | $ | — | |
Natural gas | | | 11,210 | | | | — | |
NGLs | | | 14,603 | | | | — | |
Income fee and other | | | 948 | | | | — | |
Other | | | 130 | | | | — | |
Total revenues | | | 51,765 | | | | — | |
| Operating Costs and expenses: | | | | | | | | |
Operations and maintenance | | | 11,474 | | | | — | |
Taxes other than income | | | 4,407 | | | | — | |
Depreciation, depletion and impairment | | | 16,235 | | | | — | |
Total operating costs and expenses | | | 32,116 | | | | — | |
Operating Income | | $ | 19,649 | | | $ | — | |
| | | | | | | | | |
Overview. On July 31, 2007, the Partnership became engaged in the Upstream Segment with the acquisition of Escambia Asset Co., LLC (EAC) and Redman Energy Holdings, L.P., Redman Energy Holdings II, L.P., and NGP Income Co-Investment Opportunities Fund II, L.P. (collectively Redman). The EAC and Redman operated properties consist of 108 wells (producing and non-producing) located in Alabama, Texas and Mississippi. From those transactions, the Partnership also acquired 106 non-operated wells (producing and non-producing) with minor working interests and overriding royalty interests in Texas and Louisiana. Our Upstream Segment assets produced 4.9 Bcfe, net to our interest after deducting royalties, during the five months of 2007 from July 31, 2007 to December 31, 2007 (the “Upstream Covered Period”).
EAC Assets. Substantially all of the assets acquired in this transaction are located in or near Escambia County, Alabama. We own and operate 30 producing wells in three primary fields: Big Escambia Creek, Flomaton and Fanny Church in the Smackover and Norphlett formations. During the Upstream Covered Period, these wells averaged approximately 21 MMcfe/d of production, net to our interest after deducting royalties. Production from these formations contains significant percentages of hydrogen sulfide and carbon dioxide and must be extracted prior to sales. In addition to the wells, the EAC assets included two treating plants (100 MMcf/d capacity, to facilitate the extraction of these contaminants, and one processing plant (40 MMcf/d capacity) to process and sell natural gas liquids. These facilities are included within our Upstream Segment predominately because these facilities exist to service the equity owners in the wells in the field and not to service third-party gas. The field assets also include gathering pipelines, saltwater disposal wells and other equipment to conduct efficient operations. The Partnership owns an 18.8% interest in the Jay field plant that processes natural gas liquids from the Flomaton and Fanny Church field.
Redman Assets. The East Texas assets acquired in this transaction are located in the Smackover trend extending from Rains County to Henderson County, Texas. On account of the Redman Acquisition, we own and operate 31 producing wells in nine fields which averaged approximately 7.6 MMcfe/d of production, net to our interest after deducting royalties, from the Smackover formation during the Upstream Covered Period. Production from these wells is mostly gathered and compressed by Regency Field Services and transported to Regency’s Eustace plant for separation, hydrogen sulfide treating and NGL processing. Production from the Smackover contains significant percentages of hydrogen sulfide requiring treating at the wellhead and extraction prior to sales.
The Redman transaction also included the acquisition of operated assets in South Texas and Mississippi as well certain non-operated wells in Texas and Louisiana. The South Texas assets include 10 producing wells in Jourdanton field in Atascosa County which averaged approximately 2.8 MMcfe/d of production, net to our interest after deducting royalties, from the Edwards formation during the Upstream Covered Period. These wells are gathered and compressed by Eagle Rock Operating Co., LLC and are transported to the Regency Field Services Tilden plant for treating prior to sales. In Mississippi, the Partnership operates 3 producing wells which averaged approximately 165 Mcf/d of production, net to our interest after deducting royalties, from the Smackover formation during the Upstream Covered Period. The production is treated for hydrogen sulfide and processed by Enbridge. In addition to the operated assets, the Partnership acquired minor non-operated working interests in 81 producing wells, as well as 13 producing wells with small overriding royalty interests. The primary operator of the Partnership’s non-operated interests is Stroud Petroleum Inc. Stroud operates 78% of these non-operated properties.
Revenues. For the year ended December 31, 2007, revenues for our Upstream Segment contributed $51.8 million of revenues. Production rates during the period were essentially flat to slightly increasing. Exiting 2007, the average December production rate of 34.9 MMcfe/d was slightly above the August average production rate of 33 MMcfe/d due to the completion of two wells (i.e., the Huddleston 1-3, associated with Redman assets, and the Manning 4-9 #1, in Big Escambia Creek field), certain wellbore cleanouts, and flush production following the unscheduled shutdown of the Big Escambia Creek plant’s sulfur treating facility in November, 2007. Revenues during the Upstream Covered Period were negatively impacted by approximately $ 3.6 million, according to management’s estimate, from the production downtime at Big Escambia Creek field required for maintenance and repair of the plant’s sulfur treating facilities. Following the Big Escambia Creek downtime, production rates were restored to levels equivalent to those at the beginning of the fourth quarter of 2007. Prices received for all products improved through the Upstream Covered Period and contributed significantly to revenues. In particular, oil and sulfur prices improved 24% and 46%, respectively, comparing August to December 2007.
Operating Expenses. Operating expenses during the period, including severance and ad valorem taxes, which totaled $15.9 million for the Upstream Segment. Excluding the severance and ad valorem taxes, the most significant portion of the operating expenses were associated with operating the Big Escambia Creek and Flomaton treating and processing facilities. The incremental net operating expense associated with the unscheduled Big Escambia Creek shutdown was offset by the reduction in severance taxes due to the reduced volume. These facilities are required to extract the H2S and CO2 to achieve pipeline sales quality specifications, as well as beneficially extracting natural gas liquids and sulfur for sale. The remaining operating expenses are attributed to base lease operating expenses and well workovers. The most significant workovers were conducted on three wells with coiled tubing units to cleanout scale plugging the production tubulars. All three wells were returned to normal producing rates following the cleanouts. The remaining workover expenses were associated with wireline operations to remove scale from wells or improve natural gas flow.
Depletion, Depreciation and Amortization. Depletion, depreciation and amortization expense for 2007 was $16.2 million for the five months in 2007 that we have owned the Upstream assets acquired from EAC and Redman.
Capital Expenditures. All Upstream Segment capital expenditures during the period, totaling $2.2 million, were categorized as maintenance capital. The majority of the capital (approximately 50%) was associated with completing three wells drilled by EAC and Redman prior to the transaction close date. In addition to the operated completions, an unsuccessful recompletion in Jourdanton field was conducted, as well as various facility upgrades in each of the newly acquired asset areas. The Partnership participated in small non-operated working interest projects consisting of ten drilling wells and two recompletions.
Minerals Segment
| | | | | | | |
| | | Twelve Months Ending December 31 | |
| | | 2007 | | | 2006 | |
| | | ($ in thousands) | |
| Revenues: | | | | | | |
Oil and condensate | | $ | 7,529 | | | $ | — | |
Natural gas | | | 5,493 | | | | — | |
NGLs | | | 693 | | | | — | |
Lease bonus, rentals and other | | | 1,289 | | | | — | |
| Total revenues | | | 15,004 | | | | — | |
| Operating Costs and expenses: | | | | | | | | |
Operations and maintenance | | | — | | | | — | |
Taxes other than income | | | 771 | | | | — | |
Depreciation, depletion and impairment | | | 13,777 | | | | — | |
Total operating costs and expenses | | | 14,548 | | | | — | |
Operating Income | | $ | 456 | | | $ | — | |
| | | | | | | | | |
Revenues. Our Minerals Segment consists of properties we acquired in the Montierra Acquisition on April 30, 2007 and in the MacLondon Acquisition on June 18, 2007. The figures and events discussed below relate only to the period after our acquisition of the properties (the “Minerals Covered Period”).
During the Minerals Covered Period, we produced an average of approximately 440 barrels of oil, 3.6 MMcf of natural gas, and 62 Bbls of natural gas liquids per day. The production rate during the period remained essentially flat due to drilling, recompletion and workover operations conducted by the various operators of the properties. We did not incur any expense for these activities.
A mineral owner typically experiences a delay of two to six months between the time a new well is completed and receipt of the initial royalty payment. Because of these delays we are generally not aware of new sources of production until many months after the drilling has occurred. For this reason, we did not include any extensions and discoveries in our Minerals Segment and cannot quantify the level of drilling activity that occurred on the interests since we purchased them.
Our realized average prices during the Minerals Covered Period in the Minerals Segment (excluding the effect of hedging) were $70.85/Bbl of oil, $6.30/Mcf of natural gas, and $46.62/Bbl of natural gas liquids. Prices for these commodities rose during the period.
The prices we receive for our production are influenced by a number of factors including their location, quality, and external market forces. At our largest oil producing field, Brea Olinda the crude oil production is sold under a long term contract that is tied to NYMEX WTI. Under the terms of the contract we receive approximately 83% of the NYMEX WTI price.
We received approximately $1.3 million in bonus and delay rental payments in 2007. Substantially all of this was derived from our ownership in the Pure Minerals. The amount of revenue we receive from bonus and rental payments varies significantly from month to month. Therefore, we do not believe a meaningful set of conclusions can be drawn by observing changes in leasing activity over small time periods. Nevertheless, due to high commodity prices, we expect leasing activity to remain robust and expect to see similar levels of bonus income in future periods.
Operating Expenses. Operating expenses for the Minerals Segment are predominately production expenses. We paid $0.8 million in production expenses, which was substantially all production and ad valorem taxes. These taxes are levied by various state and local taxing entities and were approximately 5.6% of our production revenue.
Depletion, depreciation, amortization and impairment. Under the Successful Efforts method of accounting, we calculate depletion, depreciation and amortization using the units of production method. In the case of our Minerals Segment, we only claim proved, producing reserves because, as a mineral interest owner, we lack sufficient engineering and geological data to estimate the proved undeveloped and non-producing reserve quantities, and because we cannot control the occurrence or the timing of the activities that would cause such reserves to become productive. Since our units of production depletion and amortization rate is a function of our proved reserves, we experience a higher depletion and amortization rate than we would if we claimed undeveloped or non-producing reserves. Our depletion, depreciation and amortization rate during 2007 was $4.89/Mcfe, and our depletion, depreciation and amortization expenses were $8.0 million in 2007. In addition in 2007, we recorded an impairment change of $5.7 million as result of steeper decline rates in certain fields.
One of the distinctive characteristics of our large, diversified mineral position is that operators are continually conducting exploration and development drilling, recompletion, and workover operations on our interests. We do not pay for these operations, but we do receive a share of the production they generate. This mode of operation has resulted in relatively constant production rates from our mineral interests in the last several years, and we expect that this will continue. We refer to this phenomenon as “regeneration.” The new sources of production that we expect to materialize due to regeneration will also be the source of future extensions and discoveries, and positive revisions to our reserve estimates, which may effect out future depletion and amortization rates.
Corporate Segment
| | | | | | | |
| | | Twelve Months Ending December 31 | |
| | | 2007 | | | 2006 | |
| | | ($ in thousands) | |
| Revenues: | | | | | | |
| Realized commodity derivatives | | $ | (3,061 | ) | | $ | 2,302 | |
Unrealized commodity derivatives | | | (130,773 | ) | | | (26,306 | ) |
Total revenues | | | (133,834 | ) | | | (24,004 | ) |
General and administrative | | | 27,799 | | | | 10,860 | |
Depreciation and amortization | | | 754 | | | | 1,035 | |
Other expense | | | 2,847 | | | | 6,000 | |
Operating income | | | (165,234 | ) | | | (41,899 | ) |
| Other income (expense): | | | | | | | | |
Interest income | | | 1,160 | | | | 996 | |
Other income | | | 696 | | | | — | |
Interest expense, net | | | (37,521 | ) | | | (29,759 | ) |
Unrealized interest rate derivatives | | | (13,403 | ) | | | 2,774 | |
Other income (expense) | | | (8,226 | ) | | | (1,619 | ) |
Total other income (expense) | | | (57,294 | ) | | | (27,608 | ) |
Loss from continuing operations before taxes | | | (222,528 | ) | | | (69,507 | ) |
Income tax provision | | | 158 | | | | 1,230 | |
Loss from continuing operations | | | (222,686 | ) | | | (70,737 | ) |
Discontinued operations | | | (11 | ) | | | — | |
Segment loss | | $ | (222,697 | ) | | $ | (70,737 | ) |
| | | | | | | | | |
Revenues. As a master limited partnership, we distribute Available Cash (as defined in our partnership agreement) every quarter to our unitholders. The volatility inherent in commodity prices generates uncertainty around achieving a steady flow of available cash. We counter this by entering into certain derivative transactions to reduce our exposure to commodity price risk and reduce uncertainty surrounding our cash flows.
Our Corporate Segment’s revenues, which solely include the Partnership’s commodity derivatives activity, for the year decreased to a loss of $133.8 million for the year ended December 31, 2007, from a loss of $24.0 million for the year ended December 31, 2006. As a result of our commodity hedging activities, revenues include a total realized loss of $3.1 million on risk management activity that was settled during the year ended December 31, 2007, and an unrealized mark-to-market loss of $130.8 million for the year ended December 31, 2007, as compared to a realized gain of $2.3 million on risk management activity that was settled for the year ended December 31, 2006 and an unrealized mark-to-market net loss of $26.3 million for the year ended December 31,2006.
As the forward price curves for our hedged commodities shift in relation to the caps, floors, swap and strike prices at which we have executed our derivative instruments, the fair market value of such instruments changes through time. The unrealized, non-cash mark-to-market net gain in 2006 as compared to our loss in 2007 reflects overall favorable forward curve price movements as they relate to our physical volumes sales during the twelve month period for commodities underlying the derivative instruments. The unrealized mark-to-market loss for 2007 of $130.8 million reflects $122.5 million in losses related to our crude oil, NGL and natural gas positions as the forward curve prices in these commodities increased during the year, as well as $8.2 million loss related to amortization of put premiums during the term of the underlying options. The unrealized mark-to-market net loss for 2006 is comprised of a $18.6 million gain related to our NGL position and crude oil as the forward curve prices in these commodities decreased during the year, $25.7 million loss related to our natural gas position as the forward curve price increased during the year, and the $19.2 million loss related to amortization of put premiums during the term of the underlying options. Neither the unrealized mark-to-market net loss of $26.3 million for 2006 nor the unrealized mark-to-market loss of $130.7 million for 2007 had an impact on cash activities for the 2006 period and 2007 period, as applicable, and as such are excluded from our calculation of Adjusted EBITDA.
Given the uncertainty surrounding future commodity prices, and the general inability to predict these as they relate to the caps, floors, swaps and strike prices at which we have hedged our exposure, it is difficult to predict the magnitude and impact that marking our hedges to market will have on our income from operations in future periods. Conversely, negative commodity price movements affecting our revenues and costs are expected to be partially offset by our executed derivative instruments.
General and Administrative Expenses. General and administrative expenses increased by $16.9 million from $10.9 million for the year ended December 31, 2006 to $27.8 million for the year ended December 31, 2007. This growth in general and administrative expenses was mostly driven by increased head-count in our corporate office as a result of our 2006 acquisitions, our expansion into the minerals and upstream businesses related to the Montierra, Redman and EAC acquisitions, and to recruiting efforts in accounting, back-office, engineering, land and operations-related corporate personnel associated with being a public partnership. Corporate-office payroll expenses increased by $4.8 million as a result. Also as a result of being a public partnership, our public partnership expenses related to audit, tax, Sarbanes-Oxley compliance and others increased by $4.3 million. Also, expenses related to outside professional services, including those related to the registration of common units related to our private placements of equity and funding of acquisitions with our common units, impacted our general and administrative expenses expense by $1.9 million. Insurance costs increased by $1.2 million as we insured our acquired assets. In addition, contract labor on an interim basis as we integrated acquisitions contributed to this increase in our general and administrative expenses by $0.6 million, while IT infrastructure increased by $0.9 million and we recorded other miscellaneous expense of $3.2 million. At the present time, we do not allocate our general and administrative expenses cost to our operational Segments. The Corporate Segment bears the entire amount.
Total other income (expense). Which includes both realized and unrealized gains/losses from our interest rate swaps, increased to $57.3 million for the year ended December 31, 2007 as compared to $27.6 million for the year ended December 31, 2006. This increase is a result of an increase in our debt outstanding from $405.7 million at the end of 2006, to $567.1 million at the end of 2007. This increase in funded debt results from our debt financing of several organic projects and acquisitions during the year, including the Tyler County Pipeline Expansion, Red Deer processing plant project and the acquisitions of Redman and EAC, partially financed by a $106 million draw from our credit facility. In addition, increased base interest rate and a higher interest rate margin also decreased our interest expense. We entered into a new Senior Revolving Credit Facility on December 13, 2007 (as discussed in greater detail in Item 7. “—Liquidity and Capital Resources” below and Item 7A. Quantitative and Qualitative Disclosures About Market Risk), which carries a lower interest rate margin than our previous credit facility. However, this only impacted our interest expense for a two-week period.
Total other income (expense), includes interest rate swap realized gain of $1.4 million. We also recorded an unrealized mark-to-market loss of $13.4 million related to our interest rate risk management position reflected in Interest Expense—net. The unrealized gain relates to our future periods interest swaps and from changes during the year in the underlying interest rate associated with the derivatives. The unrealized mark-to-market gain did not have any impact on cash activities for the 2006 period and 2007 period, as applicable, and is excluded by definition from our calculation of Adjusted EBITDA.
Adjusted EBITDA. Adjusted EBITDA, as defined in Part II, Item 6. Selected Financial Data – Non GAAP Financial Measures, increased by $51.0 million from $81.2 million for the year ended December 31, 2006 to $132.2 million for the year ended December 31, 2007. The components of adjusted EBITDA are revenues minus cost of natural gas and natural gas liquids, offset by operating expenses, taxes other than income and general and administrative expenses.
As described above, revenues minus cost of natural gas and natural gas liquids for the Midstream Segment (including the Texas Panhandle, East Texas / Louisiana, including the acquired Laser Assets, and the newly created South Texas Segment) grew by $31.0 million as compared to the year ended December 31, 2006. The acquisitions leading to our entry into our Upstream and Mineral Segments contributed $51.8 million and $15.0 million, respectively, to revenues while our Corporate Segment’s realized commodity derivatives loss increased by $5.4 million as compared to the year ended December 31, 2006. This resulted in $93.6 million of total incremental revenues minus cost of natural gas and natural gas liquids, adjusted to exclude the impact of un-realized commodity derivatives not included in the calculation of Adjusted EBITDA, with respect to 2006.
Operating expenses (including Taxes Other Than Income), increased by $9.3 million for our Midstream Segment with respect to 2006, while the acquisitions which created the Upstream and Minerals Segments contributed incremental operating Expenses (including Taxes Other Than Income) of $15.9 million and $0.8 million, respectively. This resulted in total incremental Operating Expenses of $26.0 million.
General and administrative expense, captured in the Corporate Segment, increased by $14.7 million adjusted to exclude non-cash compensation charges related to our LTIP program, while Other Expense decreased by $3.2 million, with respect to 2006.
As a result, revenues (excluding the impact of unrealized commodity derivative activity) minus cost of natural gas and natural gas liquids increased by $93.6 million, operating expenses increased by $26.0 million and general and administrative expenses increased by $14.7 million, resulting in an increase to Adjusted EBITDA of $52.2 million from 2006 to 2007.
Other Expense. Other expense reflects the arbitration award recorded during 2007 of approximately $1.4 million related to a dispute on the Panhandle operations for periods before the Partnership’s ownership. In addition, approximately $0.3 million relates to a separation expense accrual recorded during 2007.
In addition, other expense includes the non-cash write-off of $6.2 million in unamortized debt issuance costs related to our previous credit facility.
Related to registration rights granted to our March 2006 pre-IPO investors and investors in our May 2007 private equity placement, the Partnership incurred $1.0 million in liquidated damages as the effective registration of these investors’ common units was not achieved within the timeframe specified in such registration statements.
Income Tax Provision. Income taxes recorded during the year ended December 31, 2007 of approximately $0.2 million reflects the Texas Margin Tax recorded during the current year offset by the reduction of the deferred tax liability created by the book/tax differences as a result of the acquisition of Redman Energy Corporation.
Liquidity and Capital Resources
Historically, our sources of liquidity have included cash generated from operations, equity investments by our owners, borrowings under our existing credit facilities and the private placement of our common units among institutional investors. During 2008, however, our sources of cash were limited to cash generated from operations and borrowings under our existing credit facility.
We believe that the cash generated from these sources will continue to be sufficient to meet our minimum quarterly cash distributions and our requirements for short-term working capital and long-term capital expenditures for at least the next twelve months. The actual distributions we will declare will be subject to our operating performance, prevailing market conditions (including forward oil, natural gas and sulfur commodity prices), the impact of unforeseen events and the approval of our Board of Directors and will be done pursuant to our distribution policy described in Part II, Item 5. Market for Registrant’s Common Equity, Related Unitholder Matters and Issuer Purchases of Equity Securities
In the event that we acquire additional midstream assets or natural gas or oil properties that exceed our existing capital resources, we expect that we will finance those acquisitions with a combination of expanded or new debt facilities and, if necessary, new equity issuances. The continued credit crisis and related turmoil in the global financial system has caused restricted access to the capital markets, particularly for non-investment grade companies like us. If these conditions continue, we expect our level of acquisition activity to be lower going forward than that which we experienced in 2007 and 2008. The ratio of debt and equity issued, if any, will be determined by our management and our board of directors as deemed appropriate.
Cash Flows
From January 1, 2007 through December 31, 2008, there have been several key events that have had major impacts on our cash flows. They are:
| | • | the completion of the Tyler County Pipeline Extension into our Brookeland System on March 31, 2007 at a cost of approximately $24.2 million, which we financed with proceeds from a draw on our credit facility; |
| | • | the acquisition of certain fee minerals, royalties and non-operated working interest properties, directly and by entity acquisition, from Montierra Minerals & Production, L.P., and NGP-VII Income Co-Investment Opportunities, L.P. on April 30, 2007 for an aggregate purchase price of $139.2 million, including cash of $5.4 million; |
| | • | the acquisition of Laser Midstream Energy, LP, on May 3, 2007, including its subsidiaries Laser Quitman Gathering Company, LP, Laser Gathering Company, LP, Hesco Gathering Company, LLC, and Hesco Pipeline Company, LLC, for $142.6 million, including $113.4 million in cash; |
| | • | the acquisition of certain fee minerals, royalties and non-operated working interest properties from MacLondon Energy, L.P. on June 18, 2007 for $18.2 million, including cash of approximately $0.1 million; |
| | • | the private placement of 7,005,495 common units to several institutional purchasers in a private offering resulting in gross proceeds of $127.5 million, on May 3, 2007. The proceeds from this offering were used to fully fund the cash portion of the purchase price of the Laser Acquisition and other general company purposes; |
| | • | the refurbishment and installation of a 20 MMcf/d processing facility located in Roberts County, Texas called our Red Deer Processing Plant, at a cost of $16.2 million and put in service on June 21, 2007; |
| | • | the acquisition of Escambia Asset Co, LLC and Escambia Operating Co, LLC on July 31, 2007 for $241.8 million, including $224.6 million in cash; |
| | • | the acquisition of Redman Energy Holdings, L.P. and Redman Energy Holdings II, L.P. and certain assets owned by NGP Income Co-Investment Opportunities Fund II, L.P. on July 31, 2007 for $192.8 million, including $84.6 million in cash; |
| | • | the private placement of 9,230,770 common units among a group of institutional investors for total cash proceeds of approximately $204.0 million on July 31, 2007. The proceeds from the private offering were used to partially fund the cash portion of the purchase price of the Escambia and Redman Acquisitions; |
| | • | the acquisition of Stanolind Oil and Gas Corp. on April 30, 2008, for which we paid $81.9 million in cash drawn from our revolver and cash on hand; and |
| | • | the acquisition of Millennium Midstream Partners, L.P. on October 1, 2008 for $205.2 million, including $181.0 million in cash drawn from our revolver and cash on hand, excluding amounts placed into an escrow account. |
Cash Distributions. On February 7, 2007, we declared a cash distribution of $0.3625 per common unit for the fourth quarter of 2006, prorated to $0.2679 per common unit for the timing of the initial public offering on October 24, 2006. The distribution to the common units was paid on February 15, 2007. No distribution was made to the general partner or Holdings (on the general partner units or subordinated units) for the quarter.
On May 4, 2007, we declared a cash distribution of $0.3625 per common unit for the first quarter ending March 31, 2007. The distribution was paid May 15, 2007, for common unitholders of record as of May 7, 2007, not including common unitholders who acquired common units in either the Montierra Acquisition or the Laser Acquisition. No distribution was made to the general partner or Holdings (on the general partner units or subordinated units) for the quarter.
On August 6, 2007, we declared a cash distribution of $0.3625 per common unit for the second quarter ending June 30, 2007. The distribution was paid August 14, 2007 to common unitholders of record as of August 8, 2007, not including common unitholders who acquired common units in the MacLondon, EAC or Redman Acquisitions. No distribution was made to the general partner or Holdings (on the general partner units or subordinated units) for the quarter.
On November 8, 2007, we declared a cash distribution of $0.3675 per unit for the third quarter ended September 30, 2007. The distribution was paid November 14, 2007 to all unitholders of record as of November 8, 2007, including the general partner and Holdings (on the general partner units and subordinated units, respectively).
On February 6, 2008, we declared a cash distribution of $0.3925 per unit for the fourth quarter ended December 31, 2008. The distribution was paid February 15, 2008 to all unitholders of record as of February 11, 2008, including the general partner and Holdings (on the general partner units and subordinated units, respectively).
On April 30, 2008, we declared a cash distribution of $0.40 per unit for the first quarter ended March 31, 2008. The distribution was paid May 15, 2008 to all unitholders of record as of May 9, 2008, including the general partner and Holdings (on the general partner units and subordinated units, respectively).
On July 29, 2008, we declared a cash distribution of $0.41 per unit for the second quarter ended June 30, 2008. The distribution was paid on August 14, 2008, to all unitholders of record as of August 8, 2008, including the general partner and Holdings (on the general partner units and subordinated units, respectively).
On October 29, 2008, we declared a cash distribution of $0.41 per unit for the third quarter ended September 30, 2008. The distribution was paid on November 14, 2008, to all unitholders of record as of November 7, 2008, including the general partner and Holdings (on the general partner units and subordinated units, respectively), but not including common unitholders who acquired common units in the Millennium Acquisition.
On February 4, 2009, we declared a $0.41 per unit distribution on all outstanding units (including common units, general partner units, and subordinated units) for the fourth quarter of 2008, payable on February 13, 2009 to the unitholders of record on February 10, 2009. The distribution to the common units, general partner units and subordinated units was paid on February 13, 2009.
Working Capital. Working capital is the amount by which current assets exceed current liabilities and is a measure of our ability to pay our liabilities as they become due. As of December 31, 2008, working capital was $57.5 million as compared to $15.1 million as of December 31, 2007.
The net increase in working capital of $42.4 million from December 31, 2007 to December 31, 2008, resulted primarily from the following factors:
| | • | cash balances and marketable securities, net of due to affiliates, decreased overall by $38.1 million and was impacted primarily from the working capital balances acquired in the acquisitions during the year, from the results of operations, timing of capital expenditures payments, financing activities including our debt activities as well as members’ equity distributions; |
| | • | the Due to Affiliate liability of $4.3 million as of December 31, 2008 is owed to Eagle Rock Energy G&P, LLC; |
| | • | trade accounts receivable decreased by $19.7 million primarily due to an increase in our allowance for bad debt of $10 million related to SemCrude, and from a decline in commodity prices during the last three months of the year ended December 31, 2008; |
| | • | risk management net working capital balance increased by a net $29.9 million as a result of the changes in current portion of the mark-to-market unrealized positions and the purchase of option premiums; |
| | • | accounts payable decreased by $15.9 million from December 31, 2007 primarily as a result the decline in commodity prices during the last three months of the year ended December 31, 2008 compared to the same time period in the prior year and timing of payments, including capital expenditures activities; and |
| | • | accrued liabilities increased by $9.8 million primarily reflecting unbilled expenditures, timing of payments related to compensation and activities from the acquisitions during the year. |
Cash Flows Year Ended 2008 Compared to Year Ended 2007
Cash Flow from Operating Activities.The increase of $74.2 million during the current year is the result of increased income from the acquired assets, the growth capital expenditure projects and rising commodity prices during the first half of 2008. During 2007, we made five acquisitions throughout the year. We had the benefit of the cash flows generated by the assets acquired for the entire year during 2008, compared to only portions of the year during 2007. During 2008, we also made two acquisitions, one during our second quarter and the other during our fourth quarter. Our average realized prices for crude, natural gas and NGLs were higher in 2008 as compared to 2007. In addition, our revenue from sulfur sales in our Upstream Segment was $37.8 million in 2008 compared to only $2.6 million in 2007. This was a result of twelve months of production in 2008, compared to only five months of production in 2007 and of prices peaking at $600 per long ton during 2008. In 2008, our average realized price for sulfur was $360 per long ton, compared to $59 per long ton in 2007. See Part II, Item 7. Management’s Discussion and Analysis of Financial Condition and Results of Operations – Year Ended December 31, 2008 Compared with Year Ended December 31, 2007 for a further discussion of the impact of the volatility in commodity prices. Higher commodity prices also resulted in us realizing settlement losses during 2008, of which $11.1 million of payments was reclassified to cash from financing activities, compared to $1.7 million reclassed during 2007. In addition, our cash flows from operating activities for 2008 includes payments $19.2 million for put premiums and to reset certain derivative contracts, compared to payments of $9.1 million during 2007.
Cash Flows from Investing Activities.Cash flows used by investing activities for the year ended December 31, 2008, as compared to the year ended December 31, 2007, decreased by $141.2 million. During 2008, we paid $262.2 million, net of cash acquired, to acquire Stanolind and MMP, while during 2007; we paid $407.6 million, net of cash acquired, to complete our Montierra, Laser, MacLondon, Escambia and Redman Acquisitions. Our investing activities for the current year reflect a slightly higher capital expenditure level of $66.7 million versus $66.1 million for the year ended 2007. During 2008, our capital expenditures related to our Stinnett-Cargray plant consolidation project in our Panhandle Segment, drilling, recompletions and capital workover projects in our Upstream Segment and a scheduled turnaround at our BEC facility. During 2007, our capital expenditures related to the completion of our Red Deer plant in our Panhandle Segment, which was driven by heavy drilling activity in the Granite Wash play and the completion of our Tyler County Pipeline Extension and Brookeland Gathering System expansion in our East Texas/Louisiana Segment to meet the active Austin Chalk play.
Cash Flows from Financing Activities.Cash flows provided by financing activities for the year ended December 31, 2008 decreased by $324.0 million over the year ended December 31, 2007. During 2007, we completed two private placement equity offerings, which raised $331.1 million, net of offering costs. The proceeds from these two offering were used to fund our acquisition in 2007. We did not raise any proceeds from equity issuances during 2008. During 2008, we incurred net borrowings of $232.3 million, which was used to help fund our acquisitions of Stanolind and MMP. During 2007, we incurred net borrowings of $161.3 million, which was used to help fund our Escambia Acquisition and capital expenditures. Distributions to members increased to $117.6 million during 2008, as compared to $59.5 million in 2007, as a result of an increase in the number of outstanding units due to units issued to the sellers of our acquisitions and the private placement equity offerings, a full year of distributing to the subordinated and general partner units and increases in our quarterly distribution.
Cash Flows Year Ended 2007 Compared to Year Ended 2006
Cash Flows from Operating Activities.Increase of $52.0 million during 2007 compared to 2006 is the result of increased income from both the acquired assets and the growth capital expenditure projects. During 2006, we made two acquisitions throughout the year. We had the benefit of the cash flows generated by the assets acquired for the entire year during 2006, compared to only portions of the year during 2007. During 2007, we made five acquisitions, three during our second quarter and the other two during our third quarter. See Cash Flows from Investing Activities below for a discussion of our capital expenditure projects. During 2007, our cash flows from operating activities included payments of $9.1 million for costs related to certain derivative contracts, while in 2006, we did not incur any of these costs. During 2006, a payment of $6 million was paid to Natural Gas Partners to terminate a management advisory arrangement between Natural Gas Partners and Eagle Rock Energy Holdings, L.P., (“Holdings”) of which we are a wholly-owned subsidiary. This payment was recorded as a capital contribution.
Cash Flows from Investing Activities.Cash flows used by investing activities for the year ended December 31, 2007, as compared to the year ended December 31, 2006, increased by $340.9 million. During 2008, we paid $407.6 million, net of cash acquired to complete the Montierra, Laser, MacLondon, Escambia and Redman Acquisition, while in 2006 we paid $101.2 million, net of cash acquired, to complete our Brookeland and Masters Creek acquisitions and our acquisition of Midstream Gas Services, L.P. In addition, investing activities for 2007 reflect a higher capital expenditure level of $66.1 million versus $38.4 million for the year ended 2006. During 2007, our capital expenditures related to the completion of our Red Deer plant in our Panhandle Segment and the completion of our Tyler County Pipeline Extension and Brookeland Gathering System expansion in our East Texas/Louisiana Segment. In 2006, our capital expenditures related to our Tyler County Pipeline project. In addition, cost for acquiring intangibles, primarily pipeline rights-of-way decreased by $0.9 million.
Cash Flows from Financing Activities.Cash flows provided by financing activities for the year ended December 31, 2007, increased by $355.7 million, over the year ended December 31, 2006. During 2007, we completed two private placement equity offerings, which raised $331.1 million, net of offering costs. The proceeds from these two offering were used to fund our acquisition in 2007. In 2006, we raised $98.5 million through a private placement equity offering, in which the proceeds were used to fund our Brookeland and Masters Creek acquisitions. During 2006, we raised $244.3 million, net of offering costs, in our initial public offering (“IPO”), which was used to fund distributions of $245.1 million made to Holdings and other pre-IPO investors for capital expenditure and working capital reimbursements and distribution arrearages. During 2007, we incurred net borrowings of $161.3 million, which was used to help fund our Escambia Acquisition and capital expenditures. During 2006, we repaid $2.7 million of debt. Distributions, not including the IPO-related distributions, were a cash outflow of $59.4 million in 2007, as compared to $22.0 million in 2006. This increase was a result of an increase in the number of units outstanding due to units issued to the sellers of our acquisitions and the private placement equity offerings and increases in our quarterly distribution.
Capital Requirements
The energy business can be capital intensive, requiring significant investment for the acquisition or development of new facilities. We categorize our capital expenditures as either:
| | • | acquisition-related capital expenditures, which are made to acquire additional assets, properties or companies to increase the scope of our business; |
| | • | growth capital expenditures, which are made to expand and upgrade existing systems and facilities or to construct similar systems or facilities, or to grow our production in our Upstream Business; or |
| | • | maintenance capital expenditures, which are made to replace partially or fully depreciated assets, to meet regulatory requirements, to maintain the existing operating capacity of our assets and extend their useful lives, or to connect wells to maintain existing system volumes and related cash flows; in our Upstream Business, maintenance capital is defined as capital which is expended to maintain our production and cash flow levels in the near future. |
Our 2008 capital budget anticipated that we would spend approximately $54.3 million in total in 2008 on our existing assets. We actually spent approximately $70.7 million in total in 2008, including the Stinnett to Cargray consolidation, Stinnett plant relocation and numerous capacity expansion, well connection and maintenance projects within our Midstream Business and the turnaround at our BEC Plant and drilling, recompletion and workover activities within our Upstream Segment.
Our 2009 capital budget anticipates that we will spend approximately $40 million in total for the year on our existing assets. This budget includes capital expenditures for growth, maintenance and well connect projects in both our Midstream and Upstream Segments. We reduced our 2009 capital budget in late 2008 to reflect more conservative assumptions on capital availability during 2009 as a result of the continued global credit crisis. We intend to finance our maintenance capital expenditures (including well connect costs) with internally generated cash flow, and our growth capital expenditures with draws from our Revolving Credit Facility.
Since 2004, we have made substantial growth capital expenditures. We anticipate we will continue to make growth capital expenditures and acquisitions as opportunities arise and as long as we can secure equity or debt financing at levels and costs satisfactory to us. We continually review opportunities for both organic growth projects and acquisitions which will enhance our financial performance. Because we will distribute most of our available cash to our unitholders, our ability to develop and maintain sources of funds to meet our capital requirements is critical to our ability to meet our growth objectives. We will depend on borrowings under our Revolving Credit Facility and the issuance of debt and equity securities to finance any future growth capital expenditures or acquisitions. We do not believe the equity or debt markets are currently available to us at levels and costs satisfactory to us.
Hedging Strategy
We use a variety of hedging instruments to accomplish our risk management objectives. At times our hedging strategy may involve entering into hedges with strike prices above current futures prices or resetting existing hedges to higher price levels in order to meet our cash flow requirements, stay in compliance with our credit facility covenants and continue to execute on our distribution objectives. Hedge transactions such as these impact our liquidity in that we are required to pay the present value of the difference between the hedged price and the current futures price. These transactions also increase our exposure to the counterparties through which we execute the hedges.
Revolving Credit Facility
On December 13, 2007, we entered into a credit agreement with Wachovia Bank, National Association, as administrative agent and swing line lender, Bank of America, N.A., as syndication agent; HSH Nordbank AG, New York Branch; the Royal Bank of Scotland, plc; and BNP Paribas, as co-documentation agents, and the other lenders who are parties to the agreement with aggregate commitments of up to $800 million. During the year ended December 31, 2008, we exercised $180 million of our $200 million accordion feature under the credit facility, which increased the total commitment to $980 million. In connection with exercising the accordion feature of our credit facility, we incurred debt issuance costs of $0.8 million. We exercised the accordion feature to provide for adequate funding associated with our growth strategy. Pursuant to the credit facility we may, at our request and subject to the terms and conditions of the credit facility, increase our commitments by an additional $20 million to an aggregate of $1 billion. As a result of Lehman Brothers’ bankruptcy filing, the amount of available commitments was reduced by the unfunded portion of Lehman Brothers’ commitment in an amount of approximately, $9.1 million. As of December 31, 2008, unused capacity available to us under the new credit agreement, based on financial covenants, is approximately $171.5 million. The credit agreement is scheduled to mature on December 13, 2012.
Given the current state of the banking industry worldwide, we have endeavored to diversify our lender group as much as possible. As such, after the upsizing of our credit facility as described above, our credit facility now includes the participation of 20 financial institutions. As of today, all of our banks’ commitments, with the exception of Lehman Brothers’ commitment, remain in place and have funded in response to our borrowing notices. A Lehman Brothers subsidiary has an approximately 2.6% participation in the Partnership’s credit facility. We believe that based on the expected positive effects of the passing of the Emergency Economic Stabilization Act of 2008, and similar initiatives around the world, credit will continue to be available under our credit facility.
Off-Balance Sheet Obligations.
We have no off-balance sheet transactions or obligations.
Debt Covenants.
Our credit facility accommodates, through the use of a borrowing base for our Upstream Business and traditional cash-flow based covenants for our Midstream and Minerals Businesses, the allocation of indebtedness to either our Upstream Business (to be measured against the borrowing base) or to our Midstream and Minerals Businesses (to be measured against the cash-flow based covenant). At December 31, 2008, we were in compliance with our covenants under the credit facility. Our interest coverage ratio, as defined in the credit agreement (i.e., Consolidated EBITDA divided by Consolidated Interest Expense), was 6.6 as compared to a minimum interest coverage covenant of 2.5, and our leverage ratio, as defined in the credit agreement (i.e., Total Funded Indebtedness divided by Adjusted Consolidated EBITDA), was 3.7 as compared to a maximum leverage ratio of 5.0 times (5.25 times until March 31, 2009 due to the Millennium Acquisition). As of December 31, 2008, the borrowing base for our Upstream Business was determined at $206 million. As a result of the current commodity price environment and depressed economic activity, which will negatively impact our financial results going forward, we expect that our borrowing base will be re-determined in early April 2009 to a lower amount (resulting in a higher allocation of indebtedness to our Midstream and Minerals Businesses) and a rise in our leverage ratio in 2009. This may cause us to take steps to reduce our leverage or enhance our Adjusted Consolidated EBITDA, as defined in our credit facility, (e.g., through further hedge resets). As a result of our hedging transactions executed on January 8, 2009, which enhanced our expected 2009 EBITDA, as defined under our credit facility, as described above and in Note 19 to our Consolidated Financial Statements included in Part II, Item 8. Financial Statements and Supplementary Data starting on page F-1 of this Annual Report, however, we believe that, assuming that our producers volumes through our systems are in line with our expectations, we will remain in covenant compliance for the remainder of 2009.
Total Contractual Cash Obligations.
The following table summarizes our total contractual cash obligations as of December 31, 2008.
| | | | | | | | | | | | | | |
| | | Payments Due by Period |
| | | | Total | | | | 2009 | | | | 2010 | | | | 2011 | | | | 2012-2013 | | | | Thereafter | |
| ($ in millions) |
Long-term debt (including interest)(1) | | $ | 982.6 | | | $ | 46.1 | | | $ | 46.1 | | | $ | 46.1 | | | $ | 844.3 | | | $ | — | |
Operating leases | | | 12.1 | | | | 1.7 | | | | 0.8 | | | | 0.7 | | | | 1.2 | | | | 7.7 | |
Purchase obligations(2) | | | — | | | | — | | | | — | | | | — | | | | — | | | | — | |
Total contractual obligations | | $ | 994.7 | | | $ | 47.8 | | | $ | 46.9 | | | $ | 46.8 | | | $ | 845.5 | | | $ | 7.7 | |
| (1) | Assumes our fixed swapped average interest rate of 3.76% plus the applicable margin under our amended and restated credit agreement, which remains constant in all periods. |
| (2) | Excludes physical and financial purchases of natural gas, NGLs, and other energy commodities due to the nature of both the price and volume components of such purchases, which vary on a daily or monthly basis. Additionally, we do not have contractual commitments for fixed price and/or fixed quantities of any material amount. |
Recent Accounting Pronouncements
In September 2006, the FASB issued SFAS No. 157, Fair Value Measurements (“SFAS No. 157”). This statement defines fair value, establishes a framework for measuring fair value, and expands disclosure about fair value measurements. The statement was effective for financial statements issued for fiscal years beginning after November 15, 2007. We adopted SFAS No. 157 on January 1, 2008, and it did not have a material impact on our consolidated results of operations and financial position.
In February 2008, the FASB issued FASB Staff Position (“FSP”) No. FAS 157-2, Effective Date of FASB Statement No. 157 (“FSP FAS 157-2”), which delays the effective date of SFAS 157 for all nonfinancial assets and non financial liabilities, except those that are recognized or disclosed at fair value in the financial statements on at least an annual basis, until fiscal years beginning after November 15, 2008. We do not expect the adoption of FSP FAS 157-2 to have a material impact on our consolidated financial statements.
In February 2007, the FASB issued SFAS No. 159, The Fair Value Option for Financial Assets and Financial Liabilities (“SFAS No. 159”), which permits entities to choose to measure many financial instruments and certain other items at fair value. SFAS No. 159 was effective for us as of January 1, 2008 and had no impact as we elected not to measure additional financial assets and liabilities at fair value.
In December 2007, the FASB issued SFAS No. 141 (revised 2007), Business Combinations (“SFAS No. 141R”), which replaces SFAS No. 141. SFAS 141R requires that all assets, liabilities, contingent consideration, contingencies and in-process research and development costs of an acquired business be recorded at fair value at the acquisition date; that acquisition costs generally be expensed as incurred; that restructuring costs generally be expensed in periods subsequent to the acquisition date; and that changes in accounting for deferred tax asset valuation allowances and acquired income tax uncertainties after the measurement period impact income tax expense. SFAS No. 141R is effective for business combinations for which the acquisition date is on or after the beginning of the first annual reporting period beginning on or after December 15, 2008, with the exception for the accounting for valuation allowances on deferred tax assets and acquired tax contingencies associated with acquisitions. SFAS No. 141R amends SFAS No. 109, Accounting for Income Taxes, such that adjustments made to valuation allowances on deferred taxes and acquired tax contingencies associated with acquisitions that closed prior to the effective date of SFAS No. 141R would also apply the provisions of SFAS No. 141R. The impact of the adoption of SFAS No. 141R on our consolidated financial statements will depend on the nature and the extent of business combinations occurring after January 1, 2009.
In December 2007, the FASB issued SFAS No. 160, “Noncontrolling Interests in Consolidated Financial Statements—an amendment of ARB No. 51” (“SFAS No. 160”). SFAS No. 160 requires that accounting and reporting for minority interests will be re-characterized as noncontrolling interests and classified as a component of equity. SFAS 160 also establishes reporting requirements that provide sufficient disclosures that clearly identify and distinguish between the interests of the parent and the interests of the noncontrolling owners. This Statement is effective as of the beginning of an entity’s first fiscal year beginning after December 15, 2008. The adoption of SFAS No. 160 did not have a material impact on our consolidated financial statements.
In March 2008, the FASB issued Statement No. 161, Disclosures About Derivative Instruments and Hedging Activities (“SFAS No. 161”). SFAS No. 161 requires enhanced disclosures to help investors better understand the effect of an entity’s derivative instruments and related hedging activities on its financial position, financial performance, and cash flows. SFAS No. 161 is effective for financial statements issued for fiscal years and interim periods beginning after November 15, 2008, with early application encouraged. We do not expect the adoption of SFAS No. 161 to have a material impact on our consolidated financial statements.
In March 2008 the FASB approved EITF Issue No. 07-4, Application of the Two-Class Method under FASB Statement No. 128, Earnings per Share, to Master Limited Partnerships (EITF No. 07-4), which requires that master limited partnerships use the two-class method of allocating earnings to calculate earnings per unit. EITF Issue No. 07-4 is effective for fiscal years and interim periods beginning after December 15, 2008. EITF No. 07-4 was effective for us as of January 1, 2009 and the impact on our earnings per unit calculation has been retrospectively applied to the years ended December 31, 2008, 2007 and 2006.
In April 2008, the FASB issued FASB Staff Position (“FSP”) No. SFAS 142-3, Determination of the Useful Life of Intangible Assets (“FSP SFAS 142-3”). FSP SFAS 142-3 amends the factors that should be considered in developing renewal or extension assumptions used to determine the useful life of a recognized intangible asset under SFAS No. 142, Goodwill and Other Intangible Assets (“SFAS 142”). The intent of FSP SFAS 142-3 is to improve the consistency between the useful life of a recognized intangible asset under SFAS 142 and the period of expected cash flows used to measure the fair value of the asset under SFAS No. 141R (revised 2007), Business Combinations (“SFAS 141R”) and other applicable accounting literature. FSP SFAS 142-3 is effective for financial statements issued for fiscal years beginning after December 15, 2008 and must be applied prospectively to intangible assets acquired after the effective date. The impact of the adoption of FSP SFAS 142-3 on our consolidated financial statements will depend on the nature and the extent of business combinations occurring after January 1, 2009.
In May 2008, the FASB issued SFAS No. 162, Hierarchy of Generally Accepted Accounting Principles (“SFAS 162”). This statement is intended to improve financial reporting by identifying a consistent framework, or hierarchy, for selecting accounting principles to be used in preparing financial statements of nongovernmental entities that are presented in conformity with GAAP. This statement will be effective 60 days following the U.S. Securities and Exchange Commission’s approval of the Public Company Accounting Oversight Board amendment to AU Section 411, The Meaning of Present Fairly in Conformity with Generally Accepted Accounting Principles. We do not expect the adoption of SFAS 162 to have a material impact on our consolidated financial statements.
In June 2008, the FASB issued FSP No. EITF 03-6-1, Determining Whether Instruments Granted in Share-Based Payment Transactions Are Participating Securities (“FSP EITF 03-6-1”). FSP EITF 03-6-1 affects entities that accrue cash dividends on share-based payment awards during the awards’ service period when dividends do not need to be returned if the employees forfeit the awards. FSP EITF 03-6-1 is effective for fiscal years beginning after December 15, 2008 and earnings-per-unit calculations would need to be adjusted retroactively. FSP EITF 03-6-1 was effective for us as of January 1, 2009 and the impact on our earnings per unit calculation has been retrospectively applied to the years ended December 31, 2008, 2007 and 2006.
In December 2008, the SEC released Final Rule, Modernization of Oil and Gas Reporting to revise the existing Regulation S-K and Regulation S-X reporting requirements to align with current industry practices and technological advances. The new disclosure requirements include provisions that permit the use of new technologies to determine proved reserves if those technologies have been demonstrated empirically to lead to reliable conclusions about reserve volumes. In addition, the new disclosure requirements require a company to (a) disclose its internal control over reserves estimation and report the independence and qualification of its reserves preparer or auditor, (b) file reports when a third party is relied upon to prepare reserves estimates or conducts a reserve audit and (c) report oil and gas reserves using an average price based upon the prior 12-month period rather than period-end prices. The provisions of this final ruling will become effective for disclosures in our Annual Report on Form 10-K for the year ended December 31, 2009.
INDEX TO FINANCIAL STATEMENTS
| | |
| Eagle Rock Energy Partners, L.P. Consolidated Financial Statements: | |
| Report of Independent Registered Public Accounting Firm | F-2 |
Consolidated Balance Sheets as of December 31, 2008 and 2007 | F-3 |
| Consolidated Statements of Operations for the Years Ended December 31, 2008, 2007 and 2006 | F-4 |
| Consolidated Statements of Cash Flows for the Years Ended December 31, 2008, 2007 and 2006 | F-5 |
| Consolidated Statements of Members’ Equity for the Years Ended December 31, 2008, 2007 and 2006 | F-6 |
| Notes to Consolidated Financial Statements | F-7 |
| | |
REPORT OF INDEPENDENT REGISTERED PUBLIC ACCOUNTING FIRM
To the Board of Directors of Eagle Rock Energy G&P, LLC and Unitholders of Eagle Rock Energy Partners, L.P. Houston, Texas
We have audited the consolidated balance sheets of Eagle Rock Energy Partners, L.P. and subsidiaries (the "Partnership") as of December 31, 2008 and 2007, and the related consolidated statements of operations, members' equity, and cash flows for each of the three years in the period ended December 31, 2008. These financial statements are the responsibility of the Partnership’s management. Our responsibility is to express an opinion on the financial statements based on our audits.
We conducted our audits in accordance with the standards of the Public Company Accounting Oversight Board (United States). Those standards require that we plan and perform the audit to obtain reasonable assurance about whether the financial statements are free of material misstatement. An audit includes examining, on a test basis, evidence supporting the amounts and disclosures in the financial statements. An audit also includes assessing the accounting principles used and significant estimates made by management, as well as evaluating the overall financial statement presentation. We believe that our audits provide a reasonable basis for our opinion.
We have also audited, in accordance with the standards of the Public Company Accounting Oversight Board (United States), the Partnership’s internal control over financial reporting as of December 31, 2008, based on the criteria established in Internal Control—Integrated Framework issued by the Committee of Sponsoring Organizations of the Treadway Commission and our report dated March 12, 2009 (not presented herein) expressed an unqualified opinion on the Partnership’s internal control over financial reporting.
As discussed in Note 17, the accompanying consolidated financial statements have been retrospectively adjusted for the adoption of Emerging Issues Task Force (EITF) Issue No. 07-4, Application of the Two-Class Method Under FASB Statement No. 128, Earnings per share, to Master Limited Partnerships (EITF 07-4) and Financial Accounting Standards Board Staff Position EITF 03-6-1, Determining Whether Investments Granted in Share-Based Payment Transactions are Participating Securities (FSP EITF 03-6-1). As discussed in Note 19 to the consolidated financial statements, the accompanying consolidated financial statements have been retrospectively adjusted for discontinued operations.
/s/ DELOITTE & TOUCHE, LLP
Houston, Texas
March 12, 2009, except for the retrospective adoption of EITF 07-4 and FSP EITF 03-6-1 as described in Note 17 and the retrospective adjustment for discontinued operations discussed in Note 19, as to which the date is December 7, 2009
EAGLE ROCK ENERGY PARTNERS, L.P.
CONSOLIDATED BALANCE SHEETS
AS OF DECEMBER 31, 2008 AND 2007
($ in thousands)
| | | | | | | |
| | | December 31, 2008 | | | December 31, 2007 | |
| ASSETS | |
| CURRENT ASSETS: | | | | | | |
| Cash and cash equivalents | | $ | 17,916 | | | $ | 68,552 | |
Accounts receivable(1) | | | 115,932 | | | | 135,633 | |
| Risk management assets | | | 76,769 | | | | — | |
| Prepayments and other current assets | | | 2,607 | | | | 3,992 | |
| Total current assets | | | 213,224 | | | | 208,177 | |
| PROPERTY, PLANT AND EQUIPMENT —Net | | | 1,357,609 | | | | 1,207,130 | |
INTANGIBLE ASSETS —Net | | | 154,206 | | | | 153,948 | |
RISK MANAGEMENT ASSETS | | | 32,451 | | | | — | |
| GOODWILL | | | — | | | | 29,527 | |
| OTHER ASSETS | | | 15,571 | | | | 11,145 | |
TOTAL | | $ | 1,773,061 | | | $ | 1,609,927 | |
| | | | | | | | | |
| LIABILITIES AND MEMBERS’ EQUITY | | | | | | | | |
| CURRENT LIABILITIES: | | | | | | | | |
| Accounts payable | | $ | 116,578 | | | $ | 132,485 | |
| Due to affiliate | | | 4,473 | | | | 16,964 | |
Accrued liabilities | | | 19,565 | | | | 9,776 | |
| Income taxes payable | | | 1,559 | | | | 723 | |
Risk management liabilities | | | 13,763 | | | | 33,089 | |
Total current liabilities | | | 155,938 | | | | 193,037 | |
| LONG-TERM DEBT | | | 799,383 | | | | 567,069 | |
ASSET RETIREMENT OBLIGATIONS | | | 19,872 | | | | 11,337 | |
| DEFERRED TAX LIABILITY | | | 42,349 | | | | 17,516 | |
| RISK MANAGEMENT LIABILITIES | | | 26,182 | | | | 94,200 | |
| OTHER LONG TERM LIABILITIES | | | 1,622 | | | | — | |
| COMMITMENTS AND CONTINGENCIES (Note 12) | | | | | | | | |
| MEMBERS’ EQUITY: | | | | | | | | |
Common unitholders(2) | | | 625,590 | | | | 617,563 | |
| Subordinated unitholders(3) | | | 105,839 | | | | 112,360 | |
General partner(4) | | | (3,714 | ) | | | (3,155 | ) |
| Total members’ equity | | | 727,715 | | | | 726,768 | |
TOTAL | | $ | 1,773,061 | | | $ | 1,609,927 | |
| | | | | | | | | |
| (1) | Net of allowance for bad debt of $12,080 and $1,046 as of December 31, 2008 and 2007, respectively. |
| (2) | 53,043,767 and 50,699,647 units were issued and outstanding as of December 31, 2008 and 2007, respectively. |
| (3) | 20,691,495 units were issued and outstanding as of December 31, 2008 and 2007. |
| (4) | 844,551 units were issued and outstanding as of December 31, 2008 and 2007. |
See notes to consolidated financial statements.
EAGLE ROCK ENERGY PARTNERS, L.P.
CONSOLIDATED STATEMENTS OF OPERATIONS
FOR THE YEARS ENDED DECEMBER 31, 2008, 2007 AND 2006
($ in thousands, except per unit amounts)
| | | | | | | | | | |
| | | Years Ended December 31, | |
| | | 2008 | | | 2007 | | | 2006 | |
| REVENUE: | | | | | | | | | |
| Natural gas, natural gas liquids, oil, condensate and sulfur sales | | $ | 1,233,919 | | | $ | 733,326 | | | $ | 486,911 | |
Gathering, compression, processing and treating fees | | | 38,871 | | | | 27,417 | | | | 14,862 | |
Minerals and royalty income | | | 42,994 | | | | 15,004 | | | | — | |
Commodity risk management gains (losses) | | | 161,765 | | | | (133,834 | ) | | | (24,004 | ) |
Other revenue | | | 716 | | | | 110 | | | | 621 | |
Total revenue | | | 1,478,265 | | | | 642,023 | | | | 478,390 | |
| COSTS AND EXPENSES: | | | | | | | | | | | | |
Cost of natural gas and natural gas liquids | | | 891,433 | | | | 553,248 | | | | 377,580 | |
Operations and maintenance | | | 73,620 | | | | 52,793 | | | | 32,905 | |
Taxes other than income | | | 19,936 | | | | 8,340 | | | | 2,301 | |
Other operating | | | 10,699 | | | | 2,847 | | | | 6,000 | |
General and administrative | | | 45,701 | | | | 27,799 | | | | 10,860 | |
Impairment of property and plants | | | 143,857 | | | | 5,749 | | | | — | |
Goodwill impairment | | | 30,994 | | | | — | | | | — | |
Depreciation, depletion and amortization | | | 116,754 | | | | 80,559 | | | | 43,220 | |
Total costs and expenses | | | 1,332,994 | | | | 731,335 | | | | 472,866 | |
OPERATING (LOSS) INCOME | | | 145,271 | | | | (89,312 | ) | | | 5,524 | |
| OTHER INCOME (EXPENSE): | | | | | | | | | | | | |
Interest income | | | 793 | | | | 1,160 | | | | 996 | |
Other income | | | 5,328 | | | | 696 | | | | — | |
Interest expense, net | | | (32,884 | ) | | | (38,936 | ) | | | (30,281 | ) |
Interest rate risk management gains (losses) | | | (32,931 | ) | | | (11,988 | ) | | | 3,296 | |
Other expense | | | (955 | ) | | | (8,226 | ) | | | (1,619 | ) |
Total other (expense) income | | | (60,649 | ) | | | (57,294 | ) | | | (27,608 | ) |
| INCOME (LOSS) FROM CONTINUING OPERATIONS BEFORE INCOME TAXES | | | 84,622 | | | | (146,606 | ) | | | (22,084 | ) |
INCOME TAX PROVISION | | | (1,134 | ) | | | 158 | | | | 1,230 | |
INCOME (LOSS) FROM CONTINUING OPERATIONS | | | 85,756 | | | | (146,764 | ) | | | (23,314 | ) |
DISCONTINUED OPERATIONS | | | 1,764 | | | | 1,130 | | | | — | |
NET INCOME (LOSS) | | $ | 87,520 | | | $ | (145,634 | ) | | $ | (23,314 | ) |
| | | | | | | | | | | | | |
EAGLE ROCK ENERGY PARTNERS, L.P.
CONSOLIDATED STATEMENTS OF OPERATIONS (continued)
FOR THE YEARS ENDED DECEMBER 31, 2008, 2007 AND 2006
($ in thousands, except per unit amounts)
| | | Years Ended December 31, |
| | | 2008 | | | 2007 | | 2006 |
| NET INCOME (LOSS) PER COMMON UNIT—BASIC AND DILUTED: | | | | | | | |
| Basic: | | | | | | | |
| Net Income (Loss) from Continuing Operations | | | | | | | |
Common units | | $ | 1.16 | | | $ | (2.15 | ) | | $ | (0.98 | ) |
Subordinated units | | $ | 1.16 | | | $ | (3.15 | ) | | $ | (0.61 | ) |
General partner units | | $ | 1.16 | | | $ | (3.15 | ) | | $ | (1.00 | ) |
| Discontinued Operations | | | | | | | | | | | | | |
Common units | | $ | 0.02 | | | $ | 0.02 | | | $ | — | |
Subordinated units | | $ | 0.02 | | | $ | 0.02 | | | $ | — | |
General partner units | | $ | 0.02 | | | $ | 0.02 | | | $ | — | |
| Net Income (Loss) | | | | | | | | | | | | | |
Common units | | $ | 1.18 | | | $ | (2.13 | ) | | $ | (0.98 | ) |
Subordinated units | | $ | 1.18 | | | $ | (3.13 | ) | | $ | (0.61 | ) |
General partner units | | $ | 1.18 | | | $ | (3.13 | ) | | $ | (1.00 | ) |
| Basic: (units in thousands) | | | | | | | | | | | | | |
Common units | | | 51,534 | | | | 37,008 | | | | 12,123 | |
Subordinated units | | | 20,691 | | | | 20,691 | | | | 17,873 | |
General partner units | | | 845 | | | | 845 | | | | 557 | |
| | | | | | | | | | | | | | |
| Diluted: | | | | | | | | | | | | | |
| Net Income (Loss) from Continuing Operations | | | | | | | | | | | | | |
Common units | | $ | 1.16 | | | $ | (2.15 | ) | | $ | (0.98 | ) |
Subordinated units | | $ | 1.16 | | | $ | (3.15 | ) | | $ | (0.61 | ) |
General partner units | | $ | 1.16 | | | $ | (3.15 | ) | | $ | (1.00 | ) |
| Discontinued Operations | | | | | | | | | | | | | |
Common units | | $ | 0.02 | | | $ | 0.02 | | | $ | — | |
Subordinated units | | $ | 0.02 | | | $ | 0.02 | | | $ | — | |
General partner units | | $ | 0.02 | | | $ | 0.02 | | | $ | — | |
| Net Income (Loss) | | | | | | | | | | | | | |
Common units | | $ | 1.18 | | | $ | (2.13 | ) | | $ | (0.98 | ) |
Subordinated units | | $ | 1.18 | | | $ | (3.13 | ) | | $ | (0.61 | ) |
General partner units | | $ | 1.18 | | | $ | (3.13 | ) | | $ | (1.00 | ) |
| Diluted: (units in thousands) | | | | | | | | | | | | | |
Common units | | | 51,699 | | | | 37,008 | | | | 12,123 | |
Subordinated units | | | 20,691 | | | | 20,691 | | | | 17,873 | |
General partner units | | | 845 | | | | 845 | | | | 557 | |
See notes to consolidated financial statements.
EAGLE ROCK ENERGY PARTNERS, L.P.
CONSOLIDATED STATEMENTS OF CASH FLOWS
FOR THE YEARS ENDED DECEMBER 31, 2008, 2007 AND 2006
($ in thousands)
| | | | | | | | | | |
| | | Years Ended December 31, | |
| | | 2008 | | | 2007 | | | 2006 | |
| CASH FLOWS FROM OPERATING ACTIVITIES: | | | | | | | | | |
Net income (loss) | | $ | 87,520 | | | $ | (145,634 | ) | | $ | (23,314 | ) |
| Adjustments to reconcile net (loss) income to net cash provided by (used in) operating activities: | | | | | | | | | | | | |
Depreciation, depletion and amortization | | | 116,754 | | | | 80,559 | | | | 43,220 | |
Impairment | | | 174,851 | | | | 5,749 | | | | — | |
Amortization of debt issuance costs | | | 958 | | | | 1,777 | | | | 1,114 | |
Write-off of debt issuance costs | | | — | | | | 6,215 | | | | — | |
Equity in earnings of unconsolidated affiliates | | | (4,021 | ) | | | (714 | ) | | | — | |
| Distribution from unconsolidated affiliates—return on investment | | | 3,643 | | | | 408 | | | | — | |
Reclassing financing derivative settlements | | | 11,063 | | | | 1,667 | | | | (978 | ) |
Advisory termination fee | | | — | | | | — | | | | 6,000 | |
Equity-based compensation | | | 7,694 | | | | 2,395 | | | | 142 | |
Gain of sale of assets | | | (1,265 | ) | | | — | | | | — | |
Other | | | (1,618 | ) | | | (69 | ) | | | 1,424 | |
| Changes in assets and liabilities—net of acquisitions: | | | | | | | | | | | | |
Accounts receivable | | | 40,873 | | | | (17,565 | ) | | | (10 | ) |
Prepayments and other current assets | | | 941 | | | | 986 | | | | (1,422 | ) |
Risk management activities | | | (199,339 | ) | | | 136,132 | | | | 23,531 | |
Accounts payable | | | (44,013 | ) | | | 19,200 | | | | 3,105 | |
Due to affiliates | | | (12,491 | ) | | | 16,964 | | | | — | |
Accrued liabilities | | | (1,258 | ) | | | (1,790 | ) | | | 5,672 | |
Other assets | | | 23 | | | | (58 | ) | | | (3,492 | ) |
Other current liabilities | | | 836 | | | | 723 | | | | — | |
Net cash provided by operating activities | | | 181,151 | | | | 106,945 | | | | 54,992 | |
| CASH FLOWS FROM INVESTING ACTIVITIES: | | | | | | | | | | | | |
Additions to property, plant and equipment | | | (66,741 | ) | | | (66,116 | ) | | | (38,416 | ) |
Acquisitions, net of cash acquired | | | (262,245 | ) | | | (407,626 | ) | | | (101,182 | ) |
Escrow cash | | | — | | | | — | | | | 7,643 | |
Investment in partnerships | | | (3,936 | ) | | | — | | | | — | |
Proceeds from sale of asset | | | 1,294 | | | | — | | | | — | |
Purchase of intangible assets | | | (2,975 | ) | | | (2,048 | ) | | | (2,918 | ) |
Net cash used in investing activities | | | (334,603 | ) | | | (475,790 | ) | | | (134,873 | ) |
| CASH FLOWS FROM FINANCING ACTIVITIES: | | | | | | | | | | | | |
Proceeds from long-term debt | | | 432,128 | | | | 740,470 | | | | 10,366 | |
Repayment of long-term debt | | | (199,814 | ) | | | (579,131 | ) | | | (15,001 | ) |
Proceeds from revolver | | | — | | | | — | | | | 12,500 | |
Repayment of revolver | | | — | | | | — | | | | (10,600 | ) |
Payment of debt issuance costs | | | (789 | ) | | | (4,280 | ) | | | (2,939 | ) |
Proceeds from derivative contracts | | | (11,063 | ) | | | (1,667 | ) | | | 978 | |
Unit issuance costs for IPO and other equity issuances | | | — | | | | (381 | ) | | | (3,723 | ) |
Net cash flow from IPO, including overallotment | | | — | | | | — | | | | 248,067 | |
Distributions of IPO proceeds to pre-IPO members | | | — | | | | — | | | | (245,067 | ) |
Proceeds from equity issuances | | | — | | | | 331,500 | | | | — | |
Repurchase of common units | | | — | | | | (154 | ) | | | — | |
Contribution by members | | | — | | | | — | | | | 98,540 | |
Distributions to members and affiliates | | | (117,646 | ) | | | (59,541 | ) | | | (22,033 | ) |
Net cash provided by financing activities | | | 102,816 | | | | 426,816 | | | | 71,088 | |
| NET INCREASE (DECREASE) IN CASH AND CASH EQUIVALENTS | | | (50,636 | ) | | | 57,971 | | | | (8,791 | ) |
CASH AND CASH EQUIVALENTS—Beginning of period | | | 68,552 | | | | 10,581 | | | | 19,372 | |
CASH AND CASH EQUIVALENTS—End of period | | $ | 17,916 | | | $ | 68,552 | | | $ | 10,581 | |
| | | | | | | | | | | | | |
Interest paid—net of amounts capitalized | | $ | 29,822 | | | $ | 40,948 | | | $ | 30,657 | |
Investments in property, plant and equipment not paid | | $ | 2,242 | | | $ | 2,297 | | | $ | 2,981 | |
Issuance of common units for acquisitions | | $ | 24,236 | | | $ | 307,017 | | | $ | 20,280 | |
| | | | | | | | | | | | | |
See notes to consolidated financial statements.
EAGLE ROCK ENERGY PARTNERS, L.P.
CONSOLIDATED STATEMENTS OF MEMBERS’ EQUITY
FOR THE YEARS ENDED DECEMBER 31, 2008, 2007 AND 2006
| | | | | | | | | | | | | | | | | | | |
| | | General Partner | | | Number of Common Units | | | Common Units | | | Number of Subordinated Units | | | Subordinated Units | | | Total | |
| | | ($ in thousands, except unit amounts) | |
| BALANCE—January 1, 2006 | | $ | 83 | | | | 24,150,731 | | | $ | 208,013 | | | | — | | | $ | — | | | $ | 208,096 | |
Net loss | | | (448 | ) | | | — | | | | (15,229 | ) | | | — | | | | (7,637 | ) | | | (23,314 | ) |
Distributions | | | (287 | ) | | | — | | | | (4,159 | ) | | | — | | | | (12,587 | ) | | | (17,033 | ) |
| Conversion of common units to subordinated units | | | — | | | | (20,691,495 | ) | | | (193,481 | ) | | | 20,691,495 | | | | 193,481 | | | | — | |
Issuance of common units— March 2006 | | | — | | | | 3,922,930 | | | | 98,540 | | | | — | | | | — | | | | 98,540 | |
Issuance of common units— March 2006 | | | — | | | | 809,329 | | | | 20,280 | | | | — | | | | — | | | | 20,280 | |
IPO and overallotment | | | 4,883 | | | | 12,500,000 | | | | 37,144 | | | | — | | | | 206,039 | | | | 248,066 | |
| Distribution of IPO proceeds | | | (4,824 | ) | | | — | | | | (35,860 | ) | | | — | | | | (204,383 | ) | | | (245,067 | ) |
IPO offering costs | | | (74 | ) | | | — | | | | (1,593 | ) | | | — | | | | (2,056 | ) | | | (3,723 | ) |
Advisory fee termination | | | 120 | | | | — | | | | 2,567 | | | | — | | | | 3,313 | | | | 6,000 | |
Restricted units expense | | | 3 | | | | — | | | | 61 | | | | — | | | | 78 | | | | 142 | |
| BALANCE—December 31, 2006 | | | (544 | ) | | | 20,691,495 | | | | 116,283 | | | | 20,691,495 | | | | 176,248 | | | | 291,987 | |
| Equity issued to private investors | | | — | | | | 16,236,265 | | | | 331,500 | | | | — | | | | — | | | | 331,500 | |
| Equity issued in acquisitions | | | — | | | | 13,742,097 | | | | 307,017 | | | | — | | | | — | | | | 307,017 | |
Distribution to affiliates | | | — | | | | — | | | | (421 | ) | | | — | | | | — | | | | (421 | ) |
| Unit issuance costs for IPO | | | — | | | | — | | | | (381 | ) | | | — | | | | — | | | | (381 | ) |
Net loss | | | (2,329 | ) | | | — | | | | (86,334 | ) | | | — | | | | (56,971 | ) | | | (145,634 | ) |
Distributions | | | (310 | ) | | | — | | | | (51,627 | ) | | | — | | | | (7,604 | ) | | | (59,541 | ) |
| Vesting of restricted units | | | — | | | | 37,190 | | | | — | | | | — | | | | — | | | | — | |
| Repurchase of common units | | | — | | | | (7,400 | ) | | | (154 | ) | | | — | | | | — | | | | (154 | ) |
Restricted unit expense | | | 28 | | | | — | | | | 1,680 | | | | — | | | | 687 | | | | 2,395 | |
| BBALANCE—December 31, 2007 | | | (3,155 | ) | | | 50,699,647 | | | | 617,563 | | | | 20,691,495 | | | | 112,360 | | | | 726,768 | |
Net Income | | | 1,009 | | | | — | | | | 61,794 | | | | — | | | | 24,717 | | | | 87,520 | |
Distributions | | | (1,643 | ) | | | — | | | | (82,588 | ) | | | — | | | | (33,415 | ) | | | (117,646 | ) |
| Vesting of restricted units | | | — | | | | 162,302 | | | | — | | | | — | | | | — | | | | — | |
| Repurchase of common units | | | — | | | | — | | | | — | | | | — | | | | — | | | | — | |
| Equity-based compensation | | | 75 | | | | — | | | | 5,442 | | | | — | | | | 2,177 | | | | 7,694 | |
Distributions to affiliates | | | — | | | | — | | | | (857 | ) | | | — | | | | — | | | | (857 | ) |
| Equity issued in acquisitions | | | — | | | | 2,181,818 | | | | 24,236 | | | | — | | | | — | | | | 24,236 | |
| BBALANCE—December 31, 2008 | | $ | (3,714 | ) | | | 53,043,767 | | | $ | 625,590 | | | | 20,691,495 | | | $ | 105,839 | | | $ | 727,715 | |
See notes to consolidated financial statements.
EAGLE ROCK ENERGY PARTNERS, L.P.
NOTES TO CONSOLIDATED FINANCIAL STATEMENTS
FOR THE YEARS ENDED DECEMBER 31, 2008, 2007 AND 2006
NOTE 1. ORGANIZATION AND DESCRIPTION OF BUSINESS
Eagle Rock Pipeline, L.P., a Texas limited partnership, is an indirect wholly-owned subsidiary of Eagle Rock Holdings, L.P. (“Holdings”). Holdings is a portfolio company of Irving, Texas based private equity capital firm, Natural Gas Partners. Eagle Rock Pipeline, L.P. was formed on November 14, 2005 for the purpose of owning a limited partnership interest in Eagle Rock Midstream Resources, L.P.
In May 2006, Eagle Rock Energy Partners, L.P., a Delaware limited partnership and an indirect wholly-owned subsidiary of Holdings, was formed for the purpose of completing a public offering of common units. On October 24, 2006, it offered and sold 12,500,000 common units in its initial public offering, or IPO, at a price of $19.00 per unit. Net proceeds from the sale of the units, $222.1 million after underwriting costs, were used for reimbursement of capital expenditures for investors prior to the initial public offering, replenish working capital, and a distribution arrearage payment. In connection with the initial public offering, Eagle Rock Pipeline, L.P. was merged with and into a newly-formed subsidiary of Eagle Rock Energy Partners, L.P. (“Eagle Rock Energy” or the “Partnership”).
Basis of Presentation and Principles of Consolidation—The accompanying financial statements include assets, liabilities and the results of operations of Eagle Rock Energy from October 24, 2006, and the results of operations of Eagle Rock Pipeline, L.P. for the periods prior to October 24, 2006. The reorganization of these entities was accounted for as a reorganization of entities under common control. The general partner of Eagle Rock Energy and Eagle Rock Midstream Resources, L.P. is Eagle Rock Energy GP, L.P., a wholly-owned subsidiary of Holdings. Eagle Rock Pipeline, L.P., Eagle Rock Midstream Resources, L.P. and their subsidiaries and, effective October 24, 2006, Eagle Rock Energy Partners, L.P. are collectively referred to as “Eagle Rock Energy” or the “Partnership.”
Description of Business—We are a growth-oriented limited partnership engaged in the business of gathering, compressing, treating, processing, transporting and selling natural gas, fractionating and transporting natural gas liquids, or NGLs, which we call our “Midstream” business; the business of acquiring, developing and producing interests in oil and natural gas properties, which we call our “Upstream” business; and the business of acquiring and managing fee minerals and royalty interests, which we call our “Minerals” business. The Partnership’s natural gas pipelines gather natural gas from designated points near producing wells and transport these volumes to third-party pipelines, the Partnership’s gas processing plants, utilities and industrial consumers. Natural gas transported to the Partnership’s gas processing plants, either on the Partnership’s pipelines or third party pipelines, is treated to remove contaminants and conditioned or processed into marketable natural gas and natural gas liquids. The Partnership conducts its midstream operations within Louisiana and three geographic areas of Texas. The Partnership’s Texas Panhandle Segment assets consist of assets acquired from ONEOK, Inc. on December 1, 2005, and include gathering and processing assets (“Texas Panhandle Segment”). The Partnership’s East Texas/Louisiana assets include a non-operated 25% undivided interest in a processing plant as well as a non-operated 20% undivided interested in a connected gathering system the (“East Texas/Louisiana Segment”). On April 7, 2006, the Partnership’s East Texas/Louisiana Segment completed the acquisition of a 100% interest in the Brookeland and Masters Creek processing plants in East Texas from Duke Energy Field Services and Swift Energy Corporation. On June 2, 2006, the Partnership’s Texas Panhandle Segment completed the acquisition of 100% of Midstream Gas Services, L.P. On May 3, 2007, the Partnership completed the acquisition of Laser Midstream Energy, L.P. (“Laser”) and certain of its subsidiaries (“Laser Acquisition”) (see Note 4). The Laser assets include gathering systems and related compression and processing facilities in South Texas, East Texas, and North Louisiana, now a part of the Partnership’s East Texas/Louisiana Segment and which created the Partnership’s South Texas Segments. On October 1, 2008, the Partnership completed the acquisition of 100% of the outstanding units of Millennium Midstream Partners, L.P. (“MMP”) (see Note 4). The MMP assets include natural gas gathering and related compression and processing facilities in West Texas, Central Texas, East Texas, Southern Louisiana and the Gulf of Mexico that are now a part of the Partnership’s East Texas/Louisiana Segment, South Texas Segment and which created the Partnership’s Gulf of Mexico Segment.
With respect to our Minerals Business, we completed the acquisition of certain fee minerals, royalties, overriding royalties and non-operated working interest properties from Montierra Minerals & Production, L.P. (“Montierra”) and NGP-VII Income Co-Investment Opportunities, L.P. (“Co-Invest”) (collectively, the “Montierra Acquisition”) on April 30, 2007 (see Note 4). As a result of this acquisition, our mineral assets include royalty interests located in multiple producing trends across the United States. The assets include interests in mineral acres and interests in wells. On June 18, 2007, we also completed the acquisition of certain assets owned by MacLondon Energy, L.P. (see Note 4), which include additional interests in wells in which the Partnership already owns a royalty interest as a result of the Montierra Acquisition.
On July 31, 2007, the Partnership entered the upstream business when it completed the acquisition of Escambia Asset Co., LLC and Escambia Operating Co., LLC (“the Escambia Acquisition”) (see Note 4). The assets subject to this transaction include operated wells in Escambia County, Alabama. The transaction also included two treating facilities, one natural gas processing plant and related gathering systems. Also on July 31, 2007, Eagle Rock Energy completed the acquisition of Redman Energy Holdings, L.P. and Redman Energy Holdings II, L.P. and certain assets owned by NGP Income Co-Investment Opportunities Fund II, L.P. These transactions are collectively referred to as the “Redman Acquisition” (see Note 4). The assets conveyed in the Redman Acquisition included operated and non-operated wells mainly located in East and South Texas. On April 30, 2008, the Partnership completed the acquisition of all of the outstanding capital stock of Stanolind Oil and Gas Corp. (“Stanolind”) (see Note 4). The Stanolind assets include operated oil and natural gas producing properties in the Permian Basin, primarily in Ward, Crane and Pecos Counties, Texas.
Subsequent Events— The Partnership has evaluated all events subsequent to the balance sheet date of December 31, 2008 through the date of issuance, March 12, 2009.
NOTE 2. SUMMARY OF SIGNIFICANT ACCOUNTING POLICIES
The accompanying condensed consolidated financial statements have been prepared in accordance with accounting principles generally accepted in the United States of America. Eagle Rock Energy is the owner of a non-operating undivided interest in the Indian Springs gas processing plant and the Camp Ruby gas gathering system. Eagle Rock Energy owns these interests as tenants-in-common with the majority owner-operator of the facilities. Accordingly, Eagle Rock Energy includes its pro-rata share of assets, liabilities, revenues and expenses related to these assets in its financial statements. All intercompany accounts and transactions are eliminated in the consolidated financial statements.
The preparation of financial statements in conformity with accounting principles generally accepted in the United States of America requires management to make estimates and assumptions that affect the reported amounts of assets and liabilities and disclosure of contingent assets and liabilities at the date of the financial statements and the reported amounts of revenues and expenses during the reported period. Significant estimates are required for proved oil and natural gas reserves, which can affect the carrying value of oil and natural gas properties. We evaluate our estimates and assumptions on a regular basis. We base our estimates on historical experience and various other assumptions that are believed to be reasonable under the circumstances, the results of which form the basis for making judgments about the carrying values of assets and liabilities that are not readily apparent from other sources. Actual results could differ from those estimates and such differences could be material.
Oil and Natural Gas Accounting Policies
We utilize the successful efforts method of accounting for our oil and natural gas properties. Leasehold costs are capitalized when incurred. Costs incurred to drill and complete development wells, including dry holes, are capitalized. Unproved properties are assessed periodically within specific geographic areas and, if necessary, impairments are charged to expense. Geological and geophysical expenses and delay rentals are charged to expense as incurred. Exploratory drilling costs are initially capitalized, but charged to expense if the well is determined to be unsuccessful. We carry the costs of an exploratory well as an asset if the well finds a sufficient quantity of reserves to justify its capitalization as a producing well as long as we are making sufficient progress towards assessing the reserves and the economic and operating viability of the project.
Depletion of producing oil and natural gas properties is recorded based on units of production. Unit rates are computed for unamortized drilling and development costs using proved developed reserves and for acquisition costs using all proved reserves. Statement of Financial Accounting Standards (“SFAS”) No. 19, Financial Accounting and Reporting for Oil and Gas Producing Companies requires that acquisition costs of proved properties be amortized on the basis of all proved reserves, (developed and undeveloped) and that capitalized development costs (wells and related equipment and facilities) be amortized on the basis of proved developed reserves.
Upon sale or retirement of complete fields of depreciable or depleted property, the book value thereof, less proceeds or salvage value, is charged or credited to income.
Impairment of Oil and Natural Gas Properties
The Partnership reviews its proved properties at the field level when management determines that events or circumstances indicate that the recorded carrying value of the properties may not be recoverable. Such events include a projection of future oil and natural gas reserves that will be produced from a field, the timing of this future production, future costs to produce the oil and natural gas, and future inflation levels. If the carrying amount of an asset exceeds the sum of the undiscounted estimated future net cash flows, the Partnership recognizes impairment expense equal to the difference between the carrying value and the fair value of the asset, which is estimated to be the expected present value of discounted future net cash flows from proved reserves utilizing the Partnership’s weighted average cost of capital. During the year ended December 31, 2008, the Partnership recorded impairment charges of $107.0 million and $1.7 million in its Upstream and Minerals Segments, respectively, as a result of substantial declines in commodity prices in the fourth quarter. During the year ended December 31, 2007, the Partnership recorded an impairment charge in its Minerals segment of $5.7 million as a result of steeper decline rates in certain fields. The Partnership did not own any oil and gas properties during the year ended December 31, 2006 and, therefore, did not incur impairment charges during this period. We cannot predict the amount of additional impairment charges that may be recorded in the future.
Unproved leasehold costs are reviewed periodically and a loss is recognized to the extent, if any, that the cost of the property has been impaired. Unproved properties that are individually insignificant are amortized. Unproved properties that are individually significant are assessed for impairment on a property-by-property basis. If considered impaired, costs are charged to expense when such impairment is deemed to have occurred.
Property Retirement Obligations
The Partnership is required to make estimates of the future costs of the retirement obligations of its producing oil and natural gas properties. This requirement necessitates that we make estimates of property abandonment costs that, in some cases, will not be incurred until a substantial number of years in the future. Such cost estimates could be subject to significant revisions in subsequent years due to changes in regulatory requirements, technological advances and other factors that may be difficult to predict.
Other Significant Accounting Policies
Cash and Cash Equivalents—Cash and cash equivalents include certificates of deposit or other highly liquid investments with maturities of three months or less at the time of purchase.
Concentration and Credit Risk—Concentration and credit risk for the Partnership principally consists of cash and cash equivalents and accounts receivable.
The Partnership places its cash and cash equivalents with high-quality institutions and in money market funds. The Partnership derives its revenue from customers primarily in the natural gas industry. During 2006, the Partnership increased the parties to which it was selling liquids and natural gas from two to seven. The Partnership further increased the number of parties to which it sells liquids and natural gas as a result of the acquisitions completed during 2007 and 2008. Industry concentrations have the potential to impact the Partnership’s overall exposure to credit risk, either positively or negatively, in that the Partnership’s customers could be affected by similar changes in economic, industry or other conditions. However, the Partnership believes the credit risk posed by this industry concentration is offset by the creditworthiness of the Partnership’s customer base. The Partnership’s portfolio of accounts receivable is comprised primarily of mid-size to large domestic corporate entities. The following is the activity within our allowance for doubtful accounts during the years ended December 31, 2008 and 2007.
Year | | Description | | Balance at beginning of period | | | Charged to bad debt expense | | | Write-offs/adjustments charged to allowance | | | Balance at end of period | |
| | | | | | | | | | | | | | | |
| 2008 | | Allowance for doubtful accounts receivable | | $ | 1,046 | | | $ | 11,136 | | | $ | 102 | | | $ | 12,080 | |
| | | | | | | | | | | | | | | | | | | |
| 2007 | | Allowance for doubtful accounts receivable | | $ | — | | | $ | 1,046 | | | $ | — | | | $ | 1,046 | |
| | | | | | | | | | | | | | | | | | | |
Of the $11.1 million charged to bad debt expense during the year ended December 31, 2008, $10.7 relates to outstanding receivables from SemGroup, L.P. which filed for bankruptcy in July 2008. For further discussion, see Note 18.
Certain Other Concentrations—The Partnership relies on natural gas producers for its Midstream Business’s natural gas and natural gas liquid supply, with the top two producers (by segment) accounting for 37.0% of its natural gas supply in the Texas Panhandle Segment, 24.4% of its natural gas supply in the East Texas/Louisiana Segment, 48.8% of its natural gas supply in the South Texas Segment and in the Gulf of Mexico Segment, one customer accounted for 90% of its natural gas supply for the month of December 2008. While there are numerous natural gas and natural gas liquid producers and some of these producers are subject to long-term contracts, the Partnership may be unable to negotiate extensions or replacements of these contracts on favorable terms, if at all. If the Partnership were to lose all or even a portion of the natural gas volumes supplied by these producers and was unable to acquire comparable volumes, the Partnership’s results of operations and financial position could be materially adversely affected. These percentages are calculated based on MMBtus gathered during the month of December 2008.
Property, Plant, and Equipment—Property, plant, and equipment consists primarily of gas gathering systems, gas processing plants, NGL pipelines, conditioning and treating facilities and other related facilities, and oil and gas properties, which are carried at cost less accumulated depreciation, depletion and amortization. The Partnership charges repairs and maintenance against income when incurred and capitalizes renewals and betterments, which extend the useful life or expand the capacity of the assets. The Partnership calculates depreciation on the straight-line method over estimated useful lives of the Partnership’s newly developed or acquired assets. The weighted average useful lives are as follows:
| | |
| Pipelines and equipment | 20 years |
Gas processing and equipment | 20 years |
| Office furniture and equipment | 5 years |
The Partnership capitalizes interest costs on major projects during extended construction time periods. Such interest costs are allocated to property, plant and equipment and amortized over the estimated useful lives of the related assets. During the year ended December 31, 2008, 2007 and 2006, the Partnership capitalized interest costs of approximately $0.4 million, $1.4 million and $0.4 million, respectively.
Impairment of Long-Lived Assets—Management evaluates whether the carrying value of long-lived assets has been impaired when circumstances indicate the carrying value of those assets may not be recoverable. This evaluation is based on undiscounted cash flow projections. The carrying amount is not recoverable if it exceeds the undiscounted sum of cash flows expected to result from the use and eventual disposition of the assets. Management considers various factors when determining if these assets should be evaluated for impairment, including, but not limited to:
| | • | significant adverse change in legal factors or in the business climate; |
| | • | a current-period operating or cash flow loss combined with a history of operating or cash flow losses or a projection or forecast which demonstrates continuing losses associated with the use of a long-lived asset; |
| | • | an accumulation of costs significantly in excess of the amount originally expected for the acquisition or construction of a long-lived asset; |
| | • | significant adverse changes in the extent or manner in which an asset is used or in its physical condition; |
| | • | a significant change in the market value of an asset; or |
| | • | a current expectation that, more likely than not, an asset will be sold or otherwise disposed of before the end of its estimated useful life. |
If the carrying value is not recoverable on an undiscounted basis, the impairment loss is measured as the excess of the asset’s carrying value over its fair value. Management assesses the fair value of long-lived assets using commonly accepted techniques, and may use more than one method, including, but not limited to, recent third party comparable sales, internally developed discounted cash flow analysis and analysis from outside advisors. Significant changes in market conditions resulting from events such as the condition of an asset or a change in management’s intent to utilize the asset would generally require management to reassess the cash flows related to the long-lived assets. During the year ended December 31, 2008, the Partnership recorded an impairment charge related to certain processing plants, pipelines and contracts in its Midstream business of $35.1 million due to the substantial decline in commodity prices in the fourth quarter as well as declining drilling activity by its producer customers. Due to the percent-of-proceeds, fixed recovery and keep-whole contract arrangements the Partnership operates under with some of its producer customers, cash flows are dependent up the selling price of the natural gas and natural gas liquids processed by its plants. Under these arrangements, lower commodity prices result in lower margins. In addition, lower commodity prices influence the drilling activity of the Partnership’s producer customers. Lower drilling activity reduces the future volumes of natural gas projected to flow through our gathering systems, thus reducing both the equity volumes attributable to the Partnership and the fees generated under the fee-based arrangements the Partnership operates under as part of its Midstream Business.
Goodwill—Goodwill acquired in connection with business combinations represent the excess of consideration over the fair value of tangible net assets and identifiable intangible assets acquired. Certain assumptions and estimates are employed in determining the fair value of assets acquired and liabilities assumed, as well as in determining the allocation of goodwill to the appropriate reporting unit.
The Partnership acquired goodwill as part of its acquisition of Redman (See Note 4 and Note 15) on July 31, 2007. During the year ended December 31, 2008, goodwill increased by $1.4 million due to adjustments made to the Redman purchase price allocation. The Partnership performed its annual impairment test in May 2008 and determined that no impairment appeared evident. The Partnership’s goodwill impairment test involves a comparison of the fair value of each of its reporting units with their carrying value. The fair value is determined using discounted cash flows and other market-related valuation models. Certain estimates and judgments are required in the application of the fair value models. As a result of the impairment charge incurred within the Partnership’s Upstream Segment during the fourth quarter of 2008 which resulted from the substantial decline in commodity prices during the fourth quarter of 2008, the Partnership performed an assessment of its goodwill and recorded an impairment charge of $31.0 million, which reduced its goodwill amount to zero.
Other Assets— As of December 31, 2008, other assets primarily consist of costs associated with: debt issuance costs, net of amortization ($4.2 million); business deposits to various providers and state or regulatory agencies ($0.5 million); and investment in unconsolidated affiliates ($9.3 million). As of December 31, 2007, other assets primarily consist of costs associated with: debt issuance costs, net of amortization ($4.2 million); business deposits to various providers and state or regulatory agencies ($0.6 million); and investment in unconsolidated affiliates ($6.0 million).
Within the Partnership’s investments of unconsolidated non-affiliates, the Partnership owns 13.2%, 5.0% and 5.0% of the common units of Ivory Working Interests, L.P., Buckeye Pipeline, L.P. and Trinity River, LLC, respectively. The Partnership also owns a 50% joint venture in Valley Pipeline, LLC. These investments are accounted for under the equity method and as of December 31, 2008 are not considered material to the Partnership’s financial position or results of operations.
Transportation and Exchange Imbalances—In the course of transporting natural gas and natural gas liquids for others, the Partnership may receive for redelivery different quantities of natural gas or natural gas liquids than the quantities actually delivered. These transactions result in transportation and exchange imbalance receivables or payables which are recovered or repaid through the receipt or delivery of natural gas or natural gas liquids in future periods, if not subject to cash out provisions. Imbalance receivables are included in accounts receivable and imbalance payables are included in accounts payable on the consolidated balance sheets and marked-to-market using current market prices in effect for the reporting period of the outstanding imbalances. For the Midstream business, as of December 31, 2008, the Partnership had imbalance receivables totaling $0.3 million and imbalance payables totaling $2.8 million, respectively. For the Midstream Business, as of December 31, 2007, the Partnership had imbalance receivables totaling $0.2 million and imbalance payables totaling $2.7 million, respectively. Changes in market value and the settlement of any such imbalance at a price greater than or less than the recorded imbalance results in either an upward or downward adjustment, as appropriate, to the cost of natural gas sold.
Revenue Recognition—Eagle Rock Energy’s primary types of sales and service activities reported as operating revenue include:
| | • | sales of natural gas, NGLs, crude oil and condensate; |
| | • | natural gas gathering, processing and transportation, from which Eagle Rock Energy generates revenues primarily through the compression, gathering, treating, processing and transportation of natural gas; |
| | • | NGL transportation from which we generate revenues from transportation fees; and |
| | • | royalties, overriding royalties and lease bonuses. |
Revenues associated with sales of natural gas, NGLs, crude oil and condensate are recognized when title passes to the customer, which is when the risk of ownership passes to the customer and physical delivery occurs. Revenues associated with transportation and processing fees are recognized when the service is provided.
For gathering and processing services, Eagle Rock Energy either receives fees or commodities from natural gas producers depending on the type of contract. Under the percentage-of-proceeds contract type, Eagle Rock Energy is paid for its services by keeping a percentage of the NGLs produced and a percentage of the residue gas resulting from processing the natural gas. Commodities received are in turn sold and recognized as revenue in accordance with the criteria outlined above. Under the keep-whole contract type, Eagle Rock Energy purchases wellhead natural gas and sells processed natural gas and NGLs to third parties.
Transportation, compression and processing-related revenues are recognized in the period when the service is provided and include the Partnership’s fee-based service revenue for services such as transportation, compression and processing.
The Partnership’s Upstream Segment recognizes revenues based on actual volumes of natural gas sold to purchasers. The volumes of natural gas sold may differ from the volumes to which the Partnership is entitled based on its interests in the properties. Differences between volumes sold and volumes based on entitlements create natural gas imbalances. Material imbalances are reflected as adjustments to reported natural gas reserves and future cash flows. As of December 31, 2008, the Partnership had an imbalance receivable balance of $3.5 million and an imbalance payable balance of $0.2 million.
A significant portion of the Partnership’s sale and purchase arrangements are accounted for on a gross basis in the consolidated statements of operations as natural gas sales and costs of natural gas, respectively. These transactions are contractual arrangements which establish the terms of the purchase of natural gas at a specified location and the sale of natural gas at a different location at the same or at another specified date. These arrangements are detailed either jointly, in a single contract, or separately in individual contracts which are entered into concurrently or in contemplation of one another with a single or multiple counterparties. Both transactions require physical delivery of the natural gas and the risk and reward of ownership are evidenced by title transfer, assumption of environmental risk, transportation scheduling, credit risk and counterparty nonperformance risk. In accordance with the provision of Emerging Issues Task Force Issue No. 04-13, Accounting for Purchases and Sales of Inventory with the Same Counterparty (“EITF 04-13”), the Partnership reflects the amounts of revenues and purchases for these transactions as a net amount in its consolidated statements of operations beginning with April 2006. For the years ended December 31, 2008 and 2007, the Partnership did not enter into any purchase and sale agreements with the same counterparty.
Environmental Expenditures—Environmental expenditures are expensed or capitalized as appropriate, depending upon the future economic benefit. Expenditures which relate to an existing condition caused by past operations and do not generate current or future revenue are expensed. Liabilities for these expenditures are recorded on an undiscounted basis when environmental assessments and/or clean-ups are probable and the costs can be reasonably estimated.
Income Taxes—Provision for income taxes is primarily applicable to our state tax obligations under the Revised Texas Franchise Tax (the “Revised Texas Franchise Tax”) and certain federal and state tax obligations of Eagle Rock Energy Acquisition Co., Inc. and Eagle Rock Upstream Development Company, Inc., both of which are consolidated subsidiaries of ours. Deferred income tax assets and liabilities are recognized for temporary differences between the assets and liabilities of our tax paying entities for financial reporting and tax purposes.
In general, legal entities that conduct business in Texas are subject to the Revised Texas Franchise Tax. In May 2006, the State of Texas expanded its pre-existing franchise tax to include limited partnerships, limited liability companies, corporations and limited liability partnerships. As a result of the change in tax law, our tax status in the State of Texas changed from non-taxable to taxable effective with the 2007 tax year.
Since we are structured as a pass-through entity, we are not subject to federal income taxes. As a result, our partners are individually responsible for paying federal and certain income taxes on their share of our taxable income. Since we do not have access to information regarding each partner’s tax basis, we cannot readily determine the total difference in the basis of our net assets for financial and tax reporting purposes.
In accordance with Financial Accounting Standards Board Interpretation 48, Accounting for Uncertainty in Income Taxes (“FIN 48”), we must recognize the tax effects of any uncertain tax positions we may adopt, if the position taken by us is more likely than not sustainable. If a tax position meets such criteria, the tax effect to be recognized by us would be the largest amount of benefit with more than a 50% chance of being realized upon settlement. This guidance was effective January 1, 2007, and our adoption of this guidance had no material impact on our financial position, results of operations or cash flows. See Note 15 for additional information regarding our income taxes.
Derivatives—SFAS No. 133, Accounting for Derivative Instruments and Hedging Activities, as amended (“SFAS No. 133”), establishes accounting and reporting standards for derivative instruments, including certain derivative instruments embedded in other contracts, and for hedging activities. SFAS No. 133 requires an entity to recognize all derivatives as either assets or liabilities in the statement of financial position and measure those instruments at fair value. SFAS No. 133 provides that normal purchase and normal sale contracts, when appropriately designated, are not subject to the statement. Normal purchases and normal sales are contracts which provide for the purchase or sale of something, other than a financial instrument or derivative instrument, that will be delivered in quantities expected to be used or sold by the reporting entity over a reasonable period in the normal course of business. The Partnership’s forward natural gas and crude oil purchase and sales contracts are designated as normal purchases and sales. Substantially all forward contracts fall within a one-month to four-year term; however, the Partnership does have certain contracts which extend through the life of the dedicated production. The terms of these contracts generally preclude unplanned netting. The Partnership uses financial instruments such as puts, swaps and other derivatives to mitigate the risks to cash flows resulting from changes in commodity prices and interest rates. The Partnership recognizes these financial instruments on its consolidated balance sheet at the instrument’s fair value with changes in fair value reflected in the consolidated statement of operations, as the Partnership has not designated any of these derivative instruments as hedges. The cash flows from derivatives are reported as cash flows from operating activities unless the derivative contract is deemed to contain a financing element. Derivatives deemed to contain a financing element are reported as a financing activity in the statement of cash flows. See Note 11 for a description of the Partnership’s risk management activities.
Reclassifications—Prior periods have been reclassified to conform to current period presentation to reflect taxes other than income as a separate financial statement line item on the Statement of Operations.
NOTE 3. NEW ACCOUNTING PRONOUNCEMENTS
In September 2006, the FASB issued SFAS No. 157, Fair Value Measurements (“SFAS No. 157”). This statement defines fair value, establishes a framework for measuring fair value, and expands disclosure about fair value measurements. The statement is effective for financial statements issued for fiscal years beginning after November 15, 2007. SFAS No.157, as it relates to financial assets and financial liabilities, was effective for the Partnership on January 1, 2008 and had no material impact on our consolidated results of operations or financial position.
In February 2007, the FASB issued SFAS No. 159, The Fair Value Option for Financial Assets and Financial Liabilities (“SFAS No. 159”), which permits entities to choose to measure many financial instruments and certain other items at fair value. SFAS No. 159 was effective for us as of January 1, 2008 and had no impact, as we have elected not to fair value additional financial assets and liabilities.
In December 2007, the FASB issued SFAS No. 141 (revised 2007), Business Combinations (“SFAS No. 141R”), which replaces SFAS No. 141. SFAS 141R requires that all assets, liabilities, contingent consideration, contingencies and in-process research and development costs of an acquired business be recorded at fair value at the acquisition date; that acquisition costs generally be expensed as incurred; that restructuring costs generally be expensed in periods subsequent to the acquisition date; and that changes in accounting for deferred tax asset valuation allowances and acquired income tax uncertainties after the measurement period impact income tax expense. SFAS No. 141R is effective for business combinations for which the acquisition date is on or after the beginning of the first annual reporting period beginning on or after December 15, 2008, with the exception for the accounting for valuation allowances on deferred tax assets and acquired tax contingencies associated with acquisitions. SFAS No. 141R amends SFAS No. 109, Accounting for Income Taxes, such that adjustments made to valuation allowances on deferred taxes and acquired tax contingencies associated with acquisitions that closed prior to the effective date of SFAS No. 141R would also apply the provisions of SFAS No. 141R. The impact of the adoption of SFAS No. 141R on the Partnership’s consolidated financial statements will depend on the nature and the extent of business combinations occurring after January 1, 2009.
In December 2007, the FASB issued SFAS No. 160, Noncontrolling Interests in Consolidated Financial Statements—an amendment of ARB No. 51 (“SFAS No. 160”). SFAS No.160 requires that accounting and reporting for minority interests will be re-characterized as noncontrolling interests and classified as a component of equity. SFAS 160 also establishes reporting requirements that provide sufficient disclosures that clearly identify and distinguish between the interests of the parent and the interests of the noncontrolling owners. This Statement is effective as of the beginning of an entity’s first fiscal year beginning after December 15, 2008. The Partnership has not yet determined the impact, if any, that SFAS No. 160 will have on its financial statements. The adoption of SFAS No. 160 did not have a material impact on the Partnership’s consolidated financial statements.
In March 2008, the FASB issued Statement No. 161, Disclosures About Derivative Instruments and Hedging Activities (“SFAS No. 161”). SFAS No. 161 requires enhanced disclosures to help investors better understand the effect of an entity’s derivative instruments and related hedging activities on its financial position, financial performance, and cash flows. SFAS No. 161 is effective for financial statements issued for fiscal years and interim periods beginning after November 15, 2008, with early application encouraged. The Partnership does not expect the adoption of SFAS No. 161 to have a material impact on its consolidated financial statements.
In March 2008 the FASB approved EITF Issue No. 07-4, Application of the Two-Class Method under FASB Statement No. 128, Earnings per Share, to Master Limited Partnerships (“EITF Issue No. 07-4”), which requires that master limited partnerships use the two-class method of allocating earnings to calculate earnings per unit. EITF Issue No. 07-4 is effective for fiscal years and interim periods beginning after December 15, 2008. EITF Issue No. 07-4 was effective for the Partnership as of January 1, 2009 and the impact on its earnings per unit calculation has been retrospectively applied to the years ended December 31, 2008, 2007 and 2006. (See Note 17)
In April 2008, the FASB issued FASB Staff Position (“FSP”) No. SFAS 142-3, Determination of the Useful Life of Intangible Assets (“FSP SFAS 142-3”). FSP SFAS 142-3 amends the factors that should be considered in developing renewal or extension assumptions used to determine the useful life of a recognized intangible asset under SFAS No. 142, Goodwill and Other Intangible Assets (“SFAS 142”). The intent of FSP SFAS 142-3 is to improve the consistency between the useful life of a recognized intangible asset under SFAS 142 and the period of expected cash flows used to measure the fair value of the asset under SFAS No. 141R (revised 2007), Business Combinations (“SFAS 141R”) and other applicable accounting literature. FSP SFAS 142-3 is effective for financial statements issued for fiscal years beginning after December 15, 2008 and must be applied prospectively to intangible assets acquired after the effective date. The impact of the adoption of FSP SFAS 142-3 on the Partnership’s consolidated financial statements will depend on the nature and the extent of business combinations occurring after January 1, 2009.
In May 2008, the FASB issued SFAS No. 162, Hierarchy of Generally Accepted Accounting Principles (“SFAS 162”). This statement is intended to improve financial reporting by identifying a consistent framework, or hierarchy, for selecting accounting principles to be used in preparing financial statements of nongovernmental entities that are presented in conformity with GAAP. This statement will be effective 60 days following the U.S. Securities and Exchange Commission’s approval of the Public Company Accounting Oversight Board amendment to AU Section 411, The Meaning of Present Fairly in Conformity with Generally Accepted Accounting Principles. The Partnership does not expect the adoption of SFAS 162 to have a material impact on its consolidated financial statements.
In June 2008, the FASB issued FSP No. EITF 03-6-1, Determining Whether Instruments Granted in Share-Based Payment Transactions Are Participating Securities (“FSP EITF 03-6-1”). FSP EITF 03-6-1 affects entities that accrue cash dividends on share-based payment awards during the awards’ service period when dividends do not need to be returned if the employees forfeit the awards. FSP EITF 03-6-1 is effective for fiscal years beginning after December 15, 2008 and earnings-per-unit calculations would need to be adjusted retroactively. FSP EITF 03-6-1 was effective for the Partnership as of January 1, 2009 and the impact on its earnings per unit calculation has been retrospectively applied to the years ended December 31, 2008, 2007 and 2006. (See Note 17)
In December 2008, the SEC released Final Rule, Modernization of Oil and Gas Reporting to revise the existing Regulation S-K and Regulation S-X reporting requirements to align with current industry practices and technological advances. The new disclosure requirements include provisions that permit the use of new technologies to determine proved reserves if those technologies have been demonstrated empirically to lead to reliable conclusions about reserve volumes. In addition, the new disclosure requirements require a company to (a) disclose its internal control over reserves estimation and report the independence and qualification of its reserves preparer or auditor, (b) file reports when a third party is relied upon to prepare reserves estimates or conducts a reserve audit and (c) report oil and gas reserves using an average price based upon the prior 12-month period rather than period-end prices. The provisions of this final ruling will become effective for disclosures in the Partnership’s Annual Report on Form 10-K for the year ended December 31, 2009.
NOTE 4. ACQUISITIONS
2008 Acquistions
Stanolind Acquisition. On April 30, 2008, the Partnership completed the acquisition of all of the outstanding capital stock of Stanolind Oil and Gas Corp. (“Stanolind”), for an aggregate purchase price of $81.9 million, subject to working capital and other purchase price adjustments (the “Stanolind Acquisition”). One or more Natural Gas Partners’ (“NGP”) private equity funds, which directly or indirectly owned a majority of the equity interests in Stanolind, is an affiliate of the Partnership and is the majority owner of the sole owner of Eagle Rock Energy G&P, LLC (the “Company”), which is the general partner of Eagle Rock Energy GP, L.P., which is the general partner of the Partnership. The Partnership funded the transaction from borrowings under its existing credit facility as well as existing cash from operations. Stanolind owned and operated oil and natural gas producing properties in the Permian Basin, primarily in Ward, Crane and Pecos Counties, Texas.
The purchase price was allocated on a preliminary basis to acquired assets and liabilities assumed based on their respective fair value as determined by management. The Partnership recorded the Stanolind acquisition under the guidance of Staff Accounting Bulletin Topic 2D, Financial Statements of Oil and Gas Exchange Offers (“Topic 2D”). In accordance with Topic 2D, the Partnership has recorded the interest attributable to the ownership of NGP in Stanolind at their carryover basis. Those interests not attributable to NGP have been recorded at their fair value. As a result, the Partnership recorded $0.9 million of the net cash paid in excess of the carryover basis as a distribution to NGP for the Stanolind acquisition.
The preliminary purchase price allocation is set forth below.
| | | ($ in thousands) | |
| Oil and gas properties: | | | |
Proved properties | | $ | 110,747 | |
Unproved properties | | | 7,597 | |
Cash and cash equivalents | | | 537 | |
Accounts receivable | | | 4,561 | |
Other assets | | | 459 | |
Accounts payable and accrued liabilities | | | (4,948 | ) |
Risk management liabilities | | | (2,865 | ) |
Deferred income taxes | | | (27,468 | ) |
Asset retirement obligations | | | (4,770 | ) |
Other long-term liabilities | | | (2,825 | ) |
| Total purchase price allocation | | | 81,025 | |
Distribution to NGP | | | 857 | |
Total Consideration Paid | | $ | 81,882 | |
| | | | | |
The Partnership commenced recording results of operations with regard to Stanolind on May 1, 2008.
Due to the potential conflict of interest between the interests of the Company and the public unitholders of Eagle Rock Energy, as a result of one or more NGP private equity funds directly or indirectly owning a majority of the equity interests in Eagle Rock Energy and Stanolind, the Board of Directors authorized the Company’s Conflicts Committee to review, evaluate, and, if determined appropriate, approve the Stanolind Acquisition. The Conflicts Committee, consisting of independent Directors of the Company, determined that the Stanolind Acquisition was fair and reasonable to Eagle Rock Energy and its public unitholders and recommended to the Board of Directors of the Company that the transaction be approved and authorized. In considering the fairness of the Stanolind acquisition, the Conflicts Committee considered the valuation of the assets and liabilities involved in the transaction and the cash flow of Stanolind. Based on the recommendation of management and the Conflicts Committee, the Board of Directors approved the transaction.
Millennium Acquisition. On October 1, 2008, the Partnership completed the acquisition of 100% of the outstanding units of Millennium Midstream Partners, L.P. (“MMP”) for an aggregate purchase price of $205.2 million, comprised of approximately $181.0 million in cash and 2,181,818 (recorded value of $24.2 million) common units, subject to post closing purchase price adjustments (the “Millennium Acquisition”). The cash portion of the consideration was funded through borrowings of $176.4 million under the Partnership’s Revolving Credit Facility made prior to September 30, 2008 and cash on hand. MMP is in the natural gas gathering and processing business, with assets located in East, Central and West Texas and South Louisiana. With respect to the South Louisiana assets acquired in the Millennium Acquisition, the Yscloskey and North Terrebonne facilities were flooded with three to four feet of water as a result of the storm surges caused by Hurricanes Ike and/or Gustav. The Partnership has reported, is preparing to file claims for, and expects to receive payment on physical damage and its business interruption insurance coverage related to Hurricane Ike and Gustav’s damage to these two facilities. The timing of collection of such insurance claims is unknown at this time. The North Terrebonne facility came back on-line in November 2008 and the Yscloskey facility came back on-line in January 2009. The former owners of MMP provided the Partnership indemnity coverage for Hurricanes Ike and Gustav to the extent losses are not covered by insurance and established an escrow account of 1,818,182 common units and $0.6 million in cash available for the Partnership to recover against for this purpose. Prior to December 31, 2008, the Partnership recovered 40,880 units and $0.3 million in cash from this escrow account. As of March 6, 2009, the Partnership has recovered an additional 65,841 common units and the remaining $0.3 million in cash from the escrow account.
The purchase price was allocated, excluding amounts held in escrow, on a preliminary basis to assets acquired and liabilities assumed, based on their respective fair value as determined by management with the assistance of K.E. Andrews & Company, a third-party valuation specialist. The Millennium Acquisition was accounted for as a purchase in accordance with SFAS No. 141, Business Combinations (“SFAS No. 141). The preliminary purchase price allocation is set forth below.
| | | ($ in thousands) | |
Property, plant and equipment | | $ | 189,753 | |
Intangibles, right-of-way and contracts | | | 28,371 | |
Cash and cash equivalents | | | 38 | |
Accounts receivable | | | 19,130 | |
Other current assets | | | 1,188 | |
Derivatives | | | 89 | |
Other current liabilities | | | (24,650 | ) |
Other current liabilities | | | (3,103 | ) |
Asset retirement obligations | | | (2,490 | ) |
Minority interest | | | (1,346 | ) |
Other liabilities | | | (1,749 | ) |
| | | $ | 205,231 | |
| | | | | |
The Partnership commenced recording results of operations with regard to MMP on October 2, 2008.
2007 Acquisitions
Montierra Acquisition. On April 30, 2007, the Partnership acquired (through part entity purchase and part asset purchase in the Montierra Acquisition) certain fee mineral acres, royalty and overriding royalty interests in oil and natural gas producing wells from Montierra (a Natural Gas Partners VII, L.P. portfolio company) and Co-Invest (a Natural Gas Partners affiliate). Eagle Rock Energy paid consideration that totaled 6,458,946 (recorded value of $133.8 million) of our common units and $5.4 million of cash. As part of this transaction, a 39.34% economic interest in the incentive distribution rights was conveyed from Eagle Rock Holdings, L.P. to Montierra.
The Partnership recorded the Montierra Acquisition under the guidance of Staff Accounting Bulletin Topic 2D, Financial Statements of Oil and Gas Exchange Offers (“Topic 2D”). In accordance with Topic 2D, the Partnership has recorded the interest attributable to the ownership of Natural Gas Partners in Montierra at their carryover basis. Those interests not attributable to Natural Gas Partners have been recorded at their fair value.
The purchase price was allocated to assets acquired and liabilities assumed based on their respective fair value as determined by management. The purchase price allocation is set forth below.
| | |
| | | ($ in thousands) |
| Oil and gas properties | | |
Proved properties | | $ | 66,884 | |
Unproved properties | | | 65,855 | |
Cash and cash equivalents | | | 936 | |
Accounts receivable | | | 3,267 | |
Prepayments | | | 15 | |
Accounts payable and accrued liabilities | | | (1,671 | ) |
Risk management liabilities | | | (759 | ) |
Investment in unconsolidated affiliates | | | 4,694 | |
| | | $ | 139,221 | |
| | | | | |
The Partnership commenced recording results of operations with regard to Montierra on May 1, 2007.
One or more NGP private equity funds directly or indirectly owned a majority of the equity interests in Eagle Rock and Montierra. Because of the potential conflict of interest between the interests of the Company and the public unitholders of Eagle Rock, the Board of Directors authorized the Company’s Conflicts Committee to review, evaluate, and, if determined appropriate, approve the Montierra Acquisition. The Conflicts Committee, consisting of independent Directors of the Company, determined that the Montierra Acquisition was fair and reasonable to Eagle Rock and its public unitholders and recommended to the Board of Directors of the Company that the transaction be approved and authorized. In considering the fairness of the Montierra Acquisition, the Conflicts Committee considered the valuation of the properties involved in the transaction, the valuation of the units to be offered as consideration in the transaction, and the cash flow of Montierra. Based on the recommendation of the Conflicts Committee, the Board of Directors approved the transaction.
Laser Acquisition. On May 3, 2007, Eagle Rock Energy Partners, L.P. acquired certain entities from Laser Midstream Energy II, LP, a Delaware limited partnership, and Laser Midstream Company, LLC, a Texas limited liability company. The Partnership paid total consideration of $113.4 million in cash and 1,407,895 (recorded value of $29.2 million) of our common units. The assets subject to the transaction include gathering systems and related compression and processing facilities in south Texas, east Texas and north Louisiana.
The purchase price was allocated to assets acquired and liabilities assumed based on their respective fair value as determined by management with the assistance of K.E. Andrews & Company, a third-party valuation specialist. The Laser acquisition was accounted for as a purchase in accordance with SFAS No. 141, Business Combinations. The purchase price allocation is set forth below.
| | | |
| | | ($ in thousands) |
Property, plant and equipment | | $ | 98,883 | | |
Intangibles, right-of-way and contracts | | | 39,057 | | |
Cash and cash equivalents | | | 1,823 | | |
Accounts receivable | | | 44,136 | | |
Other current assets | | | 1,713 | | |
Accounts payable | | | (42,639 | ) | |
Other current liabilities | | | (376 | ) | |
| | | $ | 142,597 | | |
| | | | | | |
The Partnership commenced recording results of operations with regard to Laser on May 1, 2007.
MacLondon Acquisition. On June 18, 2007, the Partnership acquired from MacLondon Energy, L.P. (“MacLondon”) certain mineral royalty and overriding royalty interests in which the Partnership already owned an interest as a result of the Montierra Acquisition. MacLondon Energy, L.P.’s assets were acquired for total consideration of $18.2 million, consisting of 757,065 (recorded value of $18.1 million) common units and cash of approximately $0.1 million. The Partnership commenced recording results of operations with regard to MacLondon on July 1, 2007.
EAC Acquisition. On July 31, 2007, the Partnership completed the acquisition of Escambia Asset Co., LLC and Escambia Operating Co., LLC (the “EAC Acquisition”). Upon closing, the Partnership paid total consideration of $224.6 million in cash and 689,857 (recorded value of $17.2 million) in common units, subject to adjustment. The assets subject to the EAC Acquisition include operated productive wells in Escambia County, Alabama, two associated treating facilities, one associated natural gas processing plant and related gathering systems.
The purchase price was allocated to assets acquired and liabilities assumed, based on their respective fair value as determined by management with the assistance of K.E. Andrews & Company, a third-party valuation specialist. The EAC Acquisition was accounted for as a purchase in accordance with SFAS No. 141, Business Combinations. The purchase price allocation is set forth below.
| | | |
| | | ($ in thousands) |
| Oil and gas properties | | |
Proved Properties | | $ | 210,082 | | |
Plant and related assets | | | 25,246 | | |
Cash and cash equivalents | | | 4,679 | | |
Accounts receivable | | | 21,052 | | |
Derivative contracts-fair value | | | 107 | | |
Intangibles | | | 725 | | |
Accounts payable | | | (11,694 | ) | |
Accrued liabilities | | | (1,865 | ) | |
Asset retirement obligations | | | (6,507 | ) | |
| | | $ | 241,825 | | |
| | | | | | |
The Partnership commenced recording results of operations with regard to EAC on August 1, 2007.
Redman Acquisition. On July 31, 2007, Eagle Rock completed the acquisition of Redman Energy Holdings, L.P. and Redman Energy Holdings II, L.P. (Natural Gas Partners VII, L.P. and Natural Gas Partners VIII, L.P. portfolio companies, respectively) and certain assets owned by NGP Income Co-Investment Opportunities Fund II, L.P. (a Natural Gas Partners affiliate (the “Redman Acquisition”). Upon closing, the Partnership paid, as consideration, a total of 4,428,334 (recorded value of $108.2 million) common units and $84.6 million in cash.
The purchase price was allocated to assets acquired and liabilities assumed based on their respective fair value as determined by management. Goodwill acquired in the acquisition was the result of deferred tax liability relating to book/tax differences created as a result of the acquisition (See Note 15) and due to the increase in the price of the Partnership’s common units from the time the acquisition was negotiated to when the acquisition was recorded. The acquisition of Redman was accounted for as a purchase in accordance with Topic 2D. Those interests not attributable to Natural Gas Partners have been recorded at their fair value. In accordance with Topic 2D, the Partnership has recorded the interest attributable to the ownership of Natural Gas Partners in Redman at their carryover basis and as a result the Partnership recorded $0.4 million of the net cash paid in excess of the carryover basis as a distribution to Natural Gas Partners for the Redman Acquisition. Those interests not attributable to Natural Gas Partners have been recorded at their fair value.
The purchase price was allocated to assets acquired and liabilities assumed based on their respective fair value as determined by management. The purchase price allocation is set forth below.
| | | |
| | | ($ in thousands) |
| Oil and gas properties | | |
Proved Properties | | $ | 169,357 | | |
Cash and cash equivalents | | | 12,975 | | |
Accounts receivable, net | | | 5,932 | | |
Prepayments | | | 573 | | |
Risk management assets | | | 1,002 | | |
Other assets | | | 2,077 | | |
Goodwill | | | 29,527 | | |
Accounts payable | | | (8,427 | ) | |
Deferred tax payable | | | (16,826 | ) | |
Other long-term liabilities | | | (3,384 | ) | |
| | | $ | 192,806 | | |
| | | | | | |
The Partnership commenced recording results of operations with regard to Redman on August 1, 2007.
One or more NGP private equity funds directly or indirectly owned a majority of the equity interests in Eagle Rock and the Redman entities. Because of the potential conflict of interest between the interests of the Company and the public unitholders of Eagle Rock, the Board of Directors authorized the Company’s Conflicts Committee to review, evaluate, and, if determined appropriate, approve the Redman Acquisition. The Conflicts Committee, consisting of independent Directors of the Company, determined that the Redman Acquisition was fair and reasonable to Eagle Rock and its public unitholders and recommended to the Board of Directors of the Company that the transaction be approved and authorized. In considering the fairness of the Redman Acquisition, the Conflicts Committee considered the valuation of the properties involved in the transaction, the valuation of the units to be offered as consideration in the transaction, and the cash flow of Redman. Based on the recommendation of the Conflicts Committee, the Board of Directors approved the transaction.
2006 Acquisitions
Brookeland and Masters Creek Acquisitions. On March 31, 2006, the Partnership’s East Texas/Louisiana System completed the acquisition of an 80% interest in the Brookeland gathering and processing facility, a 76.3% interest in the Masters Creek gathering system and 100% of the Jasper NGL line for $75.7 million to solidify the Partnership’s East Texas/Louisiana Segment and to integrate with the segment’s existing operations. The Partnership commenced recording these results of operations on April 1, 2006. On April 7, 2006, the remaining interests were acquired for $20.2 million and the results of operations have been recorded effective as of April 1, 2006, as results of operations for the period April 1, 2006 to April 7, 2006, were not material. The purchase price was allocated to property, plant and equipment and intangibles in the amounts of $88.8 million and $7.9 million, respectively, based on their respective fair value as determined by management with the assistance of a third-party valuation specialist. In addition to long-term assets, the Partnership assumed certain accrued liabilities. The purchase price has been allocated as presented below.
| | | |
| | | ($ in thousands) |
Property, plant, and equipment | | $ | 88,858 | | |
Intangibles | | | 7,992 | | |
Other current liabilities | | | (750 | ) | |
Asset retirement obligations | | | (291 | ) | |
| | | $ | 95,809 | | |
| | | | | | |
Midstream Gas Services, L.P. Acquisition. On June 2, 2006, the Partnership purchased Midstream Gas Services, L.P. (“MGS”) from a Natural Gas Partners affiliate for $4.7 million in cash and 809,174 (recorded value of $20.3 million) in common units to integrate with the Texas Panhandle Systems’ existing operations. The Partnership would have issued up to 798,113 common units to the previous equity owner of MGS, as a contingent earn-out payment if MGS achieved certain financial objectives for the year ending December 31, 2007. These financial objectives were not achieved. The Partnership commenced recording the results of operations on June 2, 2006.
The following pro forma information for the years ended December 31, 2008 and 2007, assumes the Stanolind, Millennium, Laser, Montierra, EAC and Redman acquisitions had been acquired by Eagle Rock Energy on January 1, 2008 and 2007, respectively (unaudited):
| | | | |
| | | December 31, 2008 | | | December 31, 2007 |
| | | ($ in thousands, except per unit amounts) |
Revenues | | $ | 1,972,495 | | | $ | 1,148,240 | |
Costs and expenses | | | 1,820,644 | | | | 1,224,543 | |
Operating (loss) income | | | 151,851 | | | | (76,303 | ) |
Other expense, net | | | 69,125 | | | | 78,864 | |
Income tax provision | | | (2,202 | ) | | | (4,080 | ) |
Net income (loss) | | $ | 84,928 | | | $ | (151,087 | ) |
Net income (loss) per common unit | | $ | 1.16 | | | $ | (2.20 | ) |
| | | | | | | | | |
NOTE 5. PROPERTY PLANT AND EQUIPMENT AND ASSET RETIREMENT OBLIGATIONS
Fixed assets consisted of the following:
| | | | |
| | | December 31, 2008 | | | December 31, 2007 |
| | | ($ in thousands) |
Land | | $ | 1,211 | | | $ | 1,153 | |
Plant | | | 232,219 | | | | 156,092 | |
Gathering and pipeline | | | 653,016 | | | | 541,247 | |
Equipment and machinery | | | 18,672 | | | | 14,081 | |
Vehicles and transportation equipment | | | 3,958 | | | | 3,657 | |
Office equipment, furniture, and fixtures | | | 1,023 | | | | 1,023 | |
Computer equipment | | | 4,714 | | | | 4,636 | |
Corporate | | | 126 | | | | 126 | |
Linefill | | | 4,269 | | | | 4,157 | |
Proved properties | | | 515,452 | | | | 487,481 | |
Unproved properties | | | 73,622 | | | | 66,023 | |
Construction in progress | | | 39,498 | | | | 20,884 | |
| | | | 1,547,780 | | | | 1,300,560 | |
| Less: accumulated depreciation, depletion and amortization | | | (190,171 | ) | | | (93,430 | ) |
Net property plant and equipment | | $ | 1,357,609 | | | $ | 1,207,130 | |
| | �� | | | | | | | |
Depreciation expense for the years ended December 31, 2008, 2007 and 2006 was approximately $44.1 million, $41.1 million, and $27.4 million respectively. Depletion expense for the year ended December 31, 2008 and 2007 was approximately $52.8 million and $21.7 million, respectively. The Partnership did not own oil and natural gas properties in 2006 or 2005 and, therefore, did not incur depletion expense during these periods. During the year ended December 31, 2008, the Partnership recorded impairment charges related to its plants and gathering and pipeline assets and proved properties of $4.3 million, $19.5 million and $108.8 million, respectively. During the year ended December 31, 2007, the Partnership recorded impairment charges of $5.7 million related to its proved properties. During the year ended December 31, 2006, the Partnership did not record any impairment charges to its property plant and equipment.
Asset Retirement Obligations—The Partnership recognizes asset retirement assets for its oil and gas working interests in accordance with FASB Statement No. 143, Accounting for Asset Retirement Obligations (“SFAS 143”). SFAS 143 applies to obligations associated with the retirement of tangible long-lived assets that result from the acquisition, construction and development of the assets. SFAS 143 requires that we record the fair value of a liability for an asset retirement obligation in the period in which it is incurred and a corresponding increase in the carrying amount of the related long-lived asset. The Partnership recognizes asset retirement obligations for its midstream assets in accordance with FASB Interpretation No. 47, Accounting for Conditional Asset Retirement Obligations, an interpretation of FASB Statement No. 143 (“FIN 47”). FIN 47 clarified that the term “conditional asset retirement obligation”, as used in SFAS No. 143, Accounting for Asset Retirement Obligations, refers to a legal obligation to perform an asset retirement activity in which the timing and/or method of settlement are conditional upon a future event that may or may not be within our control. Although uncertainty about the timing and/or method of settlement may exist and may be conditional upon a future event, the obligation to perform the asset retirement activity is unconditional. Accordingly, we are required to recognize a liability for the fair value of a conditional asset retirement obligation if the fair value of the liability can be reasonably estimated.
A reconciliation of our liability for asset retirement obligations is as follows:
| | | | | | | | | | |
| | | 2008 | | | 2007 | | | 2006 | |
| | | ($ in thousands) | |
| Asset retirement obligations—January 1 | | $ | 11,337 | | | $ | 1,819 | | | $ | 679 | |
| Additional liability on newly constructed assets | | | 204 | | | | 325 | | | | 17 | |
Additional liability related to acquisitions | | | 7,260 | | | | 8,722 | | | | 297 | |
Revisions | | | — | | | | — | | | | 698 | |
Accretion expense | | | 1,071 | | | | 471 | | | | 128 | |
Asset retirement obligations—December 31 | | $ | 19,872 | | | $ | 11,337 | | | $ | 1,819 | |
| | | | | | | | | | | | | |
NOTE 6. INTANGIBLE ASSETS
Intangible assets consist of right-of-ways and easements and acquired customer contracts, which the Partnership amortizes over the term of the agreement or estimated useful life. Amortization expense was approximately $19.9 million $17.8 million and $15.8 million for the years ended December 31, 2008, 2007 and 2006, respectively. Estimated aggregate amortization expense for each of the five succeeding years is as follows: 2009—$22.9 million; 2010—$21.9 million; 2011—$11.2 million; 2012—$11.2 million; and 2013—$10.1 million. Intangible assets consisted of the following (as of December 31, 2008 and 2007):
| | | | | | | |
| | | December 31, 2008 | | | December 31, 2007 | |
| | | ($ in thousands) | |
Rights-of-way and easements—at cost | | $ | 89,203 | | | $ | 80,069 | |
Less: accumulated amortization | | | (11,437 | ) | | | (7,274 | ) |
Contracts | | | 119,743 | | | | 108,772 | |
Less: accumulated amortization | | | (43,303 | ) | | | (27,619 | ) |
Net intangible assets | | $ | 154,206 | | | $ | 153,948 | |
| | | | | | | | | |
The amortization period for our rights-of-way and easements is 20 years. The amortization period for contracts range from 5 to 20 years, and are approximately 8 years on average as of December 31, 2008. During the year ended December 31, 2008, the Partnership recorded impairment charges related to its Right-of-way and easements and contracts of $3.7 million and $7.6 million, respectively. During the years ended December 31, 2007 and 2006, the Partnership did not record any impairment charges related to its intangible assets.
NOTE 7. LONG-TERM DEBT
Long-term debt consisted of:
| | | | | | | |
| | | December 31, 2008 | | | December 31, 2007 | |
| | | ($ in thousands) | |
| Revolver | | $ | 799,383 | | | $ | 567,069 | |
| Total debt | | | 799,383 | | | | 567,069 | |
| Less: current portion | | | — | | | | — | |
| Total long-term debt | | $ | 799,383 | | | $ | 567,069 | |
| | | | | | | | | |
On December 13, 2007, the Partnership entered into a new senior secured revolving credit facility (the “Revolving Credit Facility”) with aggregate commitments of $800 million. During the year ended December 31, 2008, the Partnership exercised $180 million of its $200 million accordion feature of the Revolving Credit Facility, which increased the total commitment to $980 million. The Revolving Credit Facility was entered into with a syndicate of commercial and investment banks, led by Wachovia Capital Markets, LLC and Bank of America Securities LLC as joint lead arrangement agents and joint book runners. The Revolving Credit Facility provides for $980 million aggregate principal amount of revolving commitments and has a maturity date of December 13, 2012. The Revolving Credit Facility provides the Partnership with the ability to potentially increase the total amount of revolving commitments by an additional $20 million to a total of $1 billion. Subsequently, as a result of Lehman Brothers’ bankruptcy filing, the amount of available commitments was reduced by the unfunded portion of Lehman Brother’s commitment in an amount of approximately $9.1 million to a total of $970.9 million.
Upon entering into the Revolving Credit Facility, the Partnership drew approximately $567 million from the revolving commitments to repay its then outstanding indebtedness under its previously existing credit facility of approximately $561 million and pay accrued interest of approximately $6 million. In addition, during the year ended December 31, 2007, the Partnership recorded a $6.2 million charge to other expense to write off unamortized debt issuance costs related to its previous credit facility. In connection with the closing of the Revolving Credit Facility, the Partnership incurred debt issuance costs of $4.3 million. During the year ended December 31, 2008, the Partnership incurred an additional $0.8 million of debt issuance costs in connection with exercising the accordion feature of the Revolving Credit Facility. During the years ended December 31, 2008, 2007 and 2006, the Partnership recorded approximately $1.0 million, $1.8 million and $1.2 million of debt issuance amortization expense, respectively. As of December 31, 2008 the unamortized amount of debt issuance cost was $4.2 million.
The Revolving Credit Facility includes a sub-limit for the issuance of standby letters of credit for a total of $200 million. At December 31, 2008, the Partnership had $0.2 million of outstanding letters of credit.
In certain instances defined in the Revolving Credit Facility, the Partnership’s outstanding debt is subject to mandatory repayments and/or is subject to a commitment reduction for asset and property sales, reductions in borrowing base and for insurance/condemnation proceeds.
The Revolving Credit Facility contains various covenants which limit the Partnership’s ability to grant liens, make certain loans and investments; make certain capital expenditures outside the Partnership’s current lines of business or certain related lines of business; make distributions other than from available cash; merge or consolidate with or into a third party; or engage in certain asset dispositions, including a sale of all or substantially all of the Partnership’s assets. Additionally, the Revolving Credit Facility limits the Partnership’s ability to incur additional indebtedness with certain exceptions and purchase money indebtedness and indebtedness related to capital or synthetic leases not to exceed 2.5% of tangible net worth.
The Revolving Credit Facility also contains covenants, which, amount other things, require the Partnership, on a consolidated basis, to maintain specified ratios or conditions as follows:
| | • | Consolidated EBITDA (as defined) to Consolidated Interest Expense (as defined) of not less than 2.5 to 1.0; |
| | • | Total Funded Indebtedness (as defined) to Adjusted Consolidated EBITDA (as defined) of not more than 5.0 to 1.0 (5.25 to 1.0 for the three quarters following a material acquisition); and |
| | • | Borrowing Base Indebtedness (as defined) not to exceed the Borrowing Base (as defined) as re-determined from time to time. |
The Partnership’s credit facility accommodates, through the use of a borrowing base for our Upstream Business and traditional cash-flow based covenants for our Midstream and Minerals Businesses, the allocation of indebtedness to either our Upstream Business (to be measured against the borrowing base) or to our Midstream and Minerals Businesses (to be measured against the cash-flow based covenant). At December 31, 2008, we were in compliance with our covenants under the credit facility. Our interest coverage ratio, as defined in the credit agreement (i.e., Consolidated EBITDA divided by Consolidated Interest Expense), was 6.6 as compared to a minimum interest coverage covenant of 2.5, and our leverage ratio, as defined in the credit agreement (i.e., Total Funded Indebtedness divided by Adjusted Consolidated EBITDA), was 3.7 as compared to a maximum leverage ratio of 5.0 times (5.25 times until March 31, 2009 due to the Millennium Acquisition). As of December 31, 2008, the borrowing base for our Upstream Business was determined at $206 million. As a result of the current commodity price environment and depressed economic activity, which will negatively impact our financial results going forward we expect that our borrowing base will be re-determined in early April 2009 to a lower amount (resulting in a higher allocation of indebtedness to our Midstream and Minerals Businesses) and a rise in our leverage ratio in 2009. This may cause us to take steps to reduce our leverage or enhance our Adjusted Consolidated EBITDA, as defined in our credit facility.
Based upon the above mentioned ratios and conditions as calculated as of December 31, 2008, the Partnership has approximately $171.5 million of unused capacity under the Revolving Credit Facility at December 31, 2008 on which the Partnership pays a 0.3% commitment fee per year.
At the Partnership’s election, its outstanding indebtedness bears interest on the unpaid principal amount either at a base rate plus the applicable margin (currently 0.75% per annum based on the Partnership’s total leverage ratio and utilization of its borrowing base as part of its total indebtedness); or at the Adjusted Eurodollar Rate plus the applicable margin (currently 1.75% per annum based on the Partnership’s total leverage ratio and utilization of its borrowing base as part of its total indebtedness). At December 31, 2008, the weighted average interest rate on our outstanding debt balance was 5.76%.
Base rate interest loans are paid the last day of each March, June, September and December. Eurodollar Rate Loans are paid the last day of each interest period, representing one-, two-, three-, six-, nine- or twelve months, as selected by the Partnership. The Partnership pays a commitment fee equal to (1) the average of the daily differences between (a) the revolver commitments and (b) the sum of the aggregate principal amount of all outstanding loans times (2) 0.30% per annum, based on our current leverage ratio and borrowing base utilization. The Partnership also pays a letter of credit fee equal to (1) the applicable margin for revolving loans which are Eurodollar Rate loans times (2) the average aggregate daily maximum amount available to be drawn under all such Letters of Credit (regardless of where any conditions for drawing could then be met and determined as of the close of business on any date of determination). Additionally, the Partnership pays a fronting fee equal to 0.125% per annum, times the average aggregate daily maximum amount available to be drawn under all letters of credit.
The obligation under the Revolving Credit Facility are secured by first priority liens on substantially all for the Partnership’s assets, including a pledge of all of the capital stock of each of its subsidiaries.
Scheduled maturities of long-term debt as of December 31, 2008, were as follows:
| |
| | | Principal Amount |
| | | ($ in thousands) |
2009 | | $ | — |
2010 | | | — |
2011 | | | — |
2012 | | | 799,383 |
| | | $ | 799,383 |
| | | | |
The Partnership was in compliance with the financial covenants under the Revolving Credit Facility as of December 31, 2008. If an event of default existed under the Amended Revolving Credit Facility, the lenders would be able to accelerate the maturity of the Revolving Credit Facility and exercise other rights and remedies.
NOTE 8. MEMBERS’ EQUITY
At December 31, 2005, the Partnership had common units outstanding representing 98.01% of limited partnership interests and 1.99% of general partner interests, all of which were controlled by Holdings. On March 27, 2006, the Partnership sold 5,455,050 common units in a private placement for $98.3 million and converted the 98.01% limited partnership interest into 33,582,918 subordinated units. In June 2006, the Partnership issued 1,125,416 common units in connection with the MGS acquisition. At the initial public offering, the pre-IPO common units outstanding were converted into publicly traded common units using a factor of approximately 0.7191. Additionally, Holdings contributed $0.2 million in cash during 2006. For the initial public offering, the Partnership issued 12.5 million common units. The overallotment option was exercised by the underwriters in November 2006 with 1,463,785 common units being issued from common units acquired by the Partnership from Holdings and selected private investors. The exercise of the overallotment did not result in additional shares being issued by the Partnership.
Additionally, during the fourth quarter of 2006, Holdings paid $6.0 million to terminate the advisory fee arrangement with Natural Gas Partners. The expense was recorded on the Partnership’s financial results of operations with the offset to members’ equity.
On August 15, 2006, the Partnership declared and paid a distribution of $1.9 million to its common unit holders. As of September 30, 2006, the Partnership was in arrears on its subordinated units and general partner units in the amount of $10.7 million and $0.3 million, respectively for the second quarter of 2006. The arrearages were declared and paid at the time of the initial public offering. The IPO net cash received was $222.1 million, including $3.0 million for initial public offering transaction costs reimbursement to the Partnership. Distributions of $219.1 million were made in the fourth quarter for capital expenditure and working capital reimbursements and distribution arrearages. On November 14, 2006, the Partnership distributed $14.4 million from its third quarter 2006 results. This distribution was made to the unitholders on record as of September 30, 2006. In November, the Partnership received net cash of $26.0 million for the exercise of the overallotment by the underwriters. This amount was used to buy common units from Holdings and certain Pre-IPO investors.
The Partnership has declared a cash distribution for each quarter since its initial public offering. The table below summarizes these distributions.
| | | | | | | |
Quarter Ended | | Distribution per Unit | | Record Date | | Payment Date |
December 31, 2006+ | | $ | 0.2679 | (1) | Feb. 7, 2007 | | Feb. 15, 2007 |
March 31, 2007+ | | $ | 0.3625 | | May 7, 2007 | | May 15, 2007 |
June 30, 2007+ | | $ | 0.3625 | | Aug. 8, 2007 | | Aug. 14, 2007 |
| September 30, 2007 | | $ | 0.3675 | | Nov. 8, 2007 | | Nov. 14, 2007 |
| December 31, 2007 | | $ | 0.3925 | | Feb. 11, 2008 | | Feb. 14, 2008 |
| March 31, 2008 | | $ | 0.4000 | | May 9, 2008 | | May 15, 2008 |
| June 30, 2008 | | $ | 0.4100 | | Aug. 8, 2008 | | Aug. 14, 2008 |
| September 30, 2008 | | $ | 0.4100 | | Nov. 7, 2008 | | Nov. 14, 2008 |
| December 31, 2008 | | $ | 0.4100 | | Feb. 10, 2009 | | Feb. 13, 2009 |
| (1) | Represents a prorated distribution to the common unitholders from the IPO date of October 24, 2006 through December 31, 2006. |
| + | The distribution per unit represents distributions made only on common units. |
Subordinated units represent limited partner interests in the Partnership, and holders of subordinated units exercise the rights and privileges available to unitholders under the Partnership’s agreement of limited partnership. Subordinated units, during the subordination period, will generally receive quarterly cash distributions only when the common units have received a minimum quarterly distribution of $0.3625 per common unit. Subordinated units will convert into common units on a one-for-one basis when the subordination period ends. Pursuant to the Partnership’s agreement of limited partnership, the subordination period will extend to the earliest date following September 30, 2009 for which there does not exist any cumulative common unit arrearage and other conditions pursuant to the partnership agreement have been met.
On May 3, 2007, the Partnership completed the private placement of 7,005,495 common units among a group of institutional investors for gross proceeds of $127.5 million. The proceeds from the private offering were used to fully fund the cash portion of the purchase price of the Laser Acquisition. The offering closed contemporaneously with the Laser Acquisition.
On July 31, 2007, the Partnership entered into a common unit purchase agreement to sell in a private placement 9,230,770 common units to third-party investors for total cash proceeds of approximately $204.0 million. The private placement closed contemporaneously with the EAC and Redman Acquisitions on July 31, 2007.
At December 31, 2008, there were 53,043,767 common units (exclusive of restricted unvested common units and common units held in escrow related to the Millennium Acquisition), 20,691,495 subordinated units (all subordinated units are owned by Holdings) and 844,551 general partner units outstanding. In addition, there were 905,486 restricted unvested common units outstanding.
As of December 31, 2008, 2007 and 2006, Eagle Rock Energy GP, L.P. owned 1.09%, 1.16% and 2.0%, respectively, of the Partnership.
NOTE 9. RELATED PARTY TRANSACTIONS
On July 1, 2006, the Partnership entered into a month-to-month contract for the sale of natural gas with an affiliate of Natural Gas Partners, under which the Partnership sells a portion of its gas supply. In July 2008, the company to which the Partnership sells its natural gas was sold by the affiliate of NGP and thus ceased being a related party. The Partnership recorded revenues of $16.0 million, $35.3 million and $19.4 million for the years ended December 31, 2008, 2007 and 2006, respectively, from the agreement, of which there was a receivable of $5.5 million outstanding at December 31, 2007.
In addition, during the years ended December 31, 2008 and 2007, the Partnership incurred of $0.6 million and $1.5 million, respectively, in expenses with related parties, of which there was an outstanding accounts payable balance of $0.7 million and $0.5 million, respectively, as of December 31, 2008 and December 31, 2007. During the year ended December 31, 2008, we generated revenue from related parties of $0.2 million, of which no amounts are outstanding as of December 31, 2008.
Related to its investments in unconsolidated subsidiaries, during the year ended December 31, 2008 and 2007, the Partnership recorded income of $4.0 million and $0.7 million, respectively, of which there was no outstanding account receivable balance as of December 31, 2008 and 2007.
During the year ended December 31, 2008, the Partnership leased office space from Montierra and was also reimbursed by Montierra for services performed by its employees on behalf of Montierra. The Partnership made rental payment of $0.1 million and was reimbursed $0.2 million by Montierra. As of December 31, 2008, we have an outstanding receivable balance of $0.3 million due from Montierra and an outstanding payable balance of $0.7 million due to Montierra.
During the year ended December 31, 2008, the Partnership incurred approximately $2.1 million for services performed by Stanolind Field Services (“SFS”), which are assets controlled by NGP and certain individuals, including one employee of Eagle Rock Energy G&P, LLC. As of December 31, 2008, the Partnership had an outstanding payable balance due to SFS of $0.1 million.
The Partnership entered into an Omnibus Agreement with Eagle Rock Energy G&P, LLC, Holdings and the Partnership’s general partner on October 24, 2006, in connection with the initial public offering of the Partnership. The Omnibus Agreement requires the Partnership to reimburse Eagle Rock Energy G&P, LLC for the payment of certain expenses incurred on the Partnership’s behalf, including payroll, benefits, insurance and other operating expenses, and provides certain indemnification obligations.
The Partnership does not directly employ any persons to manage or operate our business. Those functions are provided by the general partner of our general partner. We reimburse the general partner of our general partner for all direct and indirect costs of these services under the Omnibus Agreement.
On April 30, 2007, the Partnership completed the acquisition of certain fee minerals, royalties, overriding royalties and non-operated working interest properties from Montierra and Co-Invest, a Natural Gas Partners portfolio company and affiliate, respectively. Montierra and Natural Gas Partners received as consideration a total of 6,458,946 Eagle Rock Energy common units and $6.0 million in cash, subject to adjustments. As part of this transaction, a 39.34% economic interest in the incentive distribution rights was conveyed from Eagle Rock Holdings, L.P. to Montierra. One or more NGP private equity funds directly or indirectly owns a majority of the equity interests in Eagle Rock Energy, Montierra and Co-Invest. Because of the potential conflict of interest between the interests of Eagle Rock Energy G&P, LLC (the “Company”) and the public unitholders of Eagle Rock Energy, the Board of Directors authorized the Company’s Conflicts Committee to review, evaluate, and, if determined appropriate, approve the Montierra Acquisition. The Conflicts Committee, consisting of independent Directors of the Company, determined that the Montierra Acquisition was fair and reasonable to Eagle Rock Energy and its public unitholders and recommended to the Board of Directors of the Company that the transaction be approved and authorized. In determining the purchase consideration for the Montierra Acquisition, the Board of Directors considered the valuation of the properties involved in the transaction, the valuation of the units to be offered as consideration in the transaction, and the cash flow of Montierra and Co-Invest, including cash receipts and royalty interests.
In connection with the closing of our initial public offering, on October 24, 2006, we entered into a registration rights agreement with Eagle Rock Holdings, L.P. in connection with its contribution to us of all of its limited and general partner interests in Eagle Rock Pipeline. In the registration rights agreement, we agreed, for the benefit of Eagle Rock Holdings, L.P., to register the common units it holds, the common units issuable upon conversion of the subordinated units that it holds and any common units or other equity securities issuable in exchange for the common units and subordinated units it holds. The registration rights agreement is still in effect and the Partnership is in compliance with all obligations of the agreement.
In connection with the closing of the Montierra Acquisition, we entered into a registration rights agreements with Montierra and Co-Invest. In the registration rights agreements, we agreed, for the benefit of Montierra and Co-Invest, to register the common units it holds, the common units issuable upon conversion of the subordinated units that it holds and any common units or other equity securities issuable in exchange for the common units and subordinated units it holds. The registration rights agreement is still in effect and the Partnership is in compliance with all obligations of the agreement.
On July 31, 2007, Eagle Rock Energy Partners, L.P. completed the acquisition of Redman Energy Holdings, L.P. and Redman Energy Holdings II, L.P. (Natural Gas Partners VII, L.P. and Natural Gas Partners VIII, L.P. portfolio companies, respectively) and certain assets owned by NGP Income Co-Investment Opportunities Fund II, L.P. (a Natural Gas Partners affiliate) (the “Redman Acquisition”). Redman sellers and NGP received as consideration a total of 4,428,334 newly-issued Eagle Rock common units and $83.8 million in cash, subject to adjustments. One or more NGP private equity funds directly or indirectly owns a majority of the equity interests in Eagle Rock and the Redman entities. Because of the potential conflict of interest between the interests of the Company and the public unitholders of Eagle Rock, the Board of Directors authorized the Company’s Conflicts Committee to review, evaluate, and, if determined appropriate, approve the Redman Acquisition. The Conflicts Committee, consisting of independent Directors of the Company, determined that the Redman Acquisition was fair and reasonable to Eagle Rock and its public unitholders and recommended to the Board of Directors of the Company that the transaction be approved and authorized. In determining the purchase consideration for the Redman Acquisition, the Conflicts Committee considered the valuation of the properties involved in the transaction, the valuation of the units to be offered as consideration in the transaction, and the cash flow of Redman. Based on the recommendation of the Conflicts Committee, the Board of Directors approved the transaction.
On April 30, 2008, the Partnership completed the acquisition of all of the outstanding capital stock of Stanolind, for an aggregate purchase price of $81.8 million. One or more NGP private equity funds, which directly or indirectly owned a majority of the equity interests in Eagle Rock and Stanolind. Because of the potential conflict of interest between the interests of the Company and the public unitholders of Eagle Rock, the Board of Directors authorized the Company’s Conflicts Committee to review, evaluate, and, if determined appropriate, approve the Stanolind Acquisition. The Conflicts Committee, consisting of independent Directors of the Company, determined that the Stanolind Acquisition was fair and reasonable to Eagle Rock and its public unitholders and recommended to the Board of Directors of the Company that the transaction be approved and authorized. In determining the purchase consideration for the Stanolind Acquisition, the Conflicts Committee considered the valuation of the properties involved in the transaction, the valuation of the units to be offered as consideration in the transaction, and the cash flow of Stanolind. Based on the recommendation of the Conflicts Committee, the Board of Directors approved the transaction.
Holdings had a management advisory arrangement with Natural Gas Partners requiring a quarterly fee payment. For years ended 2006, the Partnership expensed the $0.4 million for the management advisory arrangement. At the time of the initial public offering, Holdings terminated the agreement with a $6.0 million payment to Natural Gas Partners. The termination fee was recorded as an other operating expense of the Partnership during the fourth quarter of 2006, with the offset as a capital contribution.
In 2006, the Partnership paid a $215.2 million distribution to Holdings, for initial public offering related activities and earning distributions. A portion of this amount was distributed to Holdings from the Partnership’s distributions to its general partner. Holdings owns and controls the general partner of the Partnership while Holdings is controlled by Natural Gas Partners with minority ownership by certain management personnel and board members of the Partnership’s general partner.
As of December 31, 2008 and 2007, Eagle Rock Energy G&P, LLC had $4.5 million and $17.0 million, respectively, of outstanding checks paid on behalf of the Partnership. This amount was recorded as Due to Affiliate on the Partnership’s balance sheet in current liabilities. As the checks are drawn against Eagle Rock Energy G&P, LLC’s cash accounts, the Partnership reimburses Eagle Rock Energy G&P, LLC.
NOTE 10. FAIR VALUE OF FINANCIAL INSTRUMENTS
Effective January 1, 2008, the Partnership adopted SFAS No. 157, as discussed in Note 3, which, among other things, requires enhanced disclosures about assets and liabilities carried at fair value.
As defined in SFAS No. 157, fair value is the price that would be received to sell an asset or paid to transfer a liability in an orderly transaction between market participants at the measurement date (exit price). The Partnership utilizes market data or assumptions that market participants would use in pricing the asset or liability, including assumptions about risk inherent in the inputs to the valuation technique. SFAS No. 157 establishes a fair value hierarchy that prioritizes the inputs used to measure fair value. The hierarchy gives the highest priority to unadjusted quoted prices in active markets for identical assets or liabilities (Level 1 measurement) and the lowest priority to unobservable inputs (Level 3 measurements). The three levels of the fair value hierarchy defined by SFAS No. 157 are as follows:
Level 1 – Quoted prices are available in active markets for identical assets and liabilities as of the reporting date. Active markets are those in which transactions for the asset or liability occur in sufficient frequency and volume to provide information on an ongoing basis.
Level 2 – Pricing inputs are other than quoted prices in active markets included in Level 1, which are either directly or indirectly observable as of the reporting date. Level 2 includes those financial instruments that are valued using models or other valuation methodologies. These models are primarily industry-standard models that consider various assumptions, including quoted forward prices for commodities, time value, volatility factors and current market and contractual prices for the underlying instruments, as well as other relevant economic measures. Substantially all of these assumptions are observable in the market place throughout the full term of the instrument, can be derived from observable data or are supported by observable levels at which transactions are executed in the marketplace.
Level 3 – Pricing inputs include significant inputs that are generally less observable from objective sources. These inputs may be used with internally developed methodologies that result in management’s best estimate of fair value.
As of December 31, 2008, the Partnership has recorded its interest rate swaps and commodity derivative instruments (see Note 11), which includes crude oil, natural gas and natural gas liquids (“NGLs”), at fair value. The Partnership has classified the inputs to measure the fair value of its interest rate swap, crude oil derivatives and natural gas derivatives as Level 2. Because the NGL market is considered to be less liquid and thinly traded, the Partnership has classified the inputs related to its NGL derivatives as Level 3. The following table discloses the fair value of the Partnership’s derivative instruments as of December 31, 2008:
| | | Level 1 | | | Level 2 | | | Level 3 | | | Total | |
| | | ($ in thousands) | |
| Assets: | | | | | | | | | | | | |
Crude oil derivatives | | $ | — | | | $ | 87,329 | | | $ | — | | | $ | 87,329 | |
Natural gas derivatives | | | — | | | | 7,875 | | | | — | | | | 7,875 | |
NGL derivatives | | | — | | | | — | | | | 14,016 | | | | 14,016 | |
Total | | $ | — | | | $ | 95,204 | | | $ | 14,016 | | | $ | 109,220 | |
| | | | | | | | | | | | | | | | | |
| Liabilities: | | | | | | | | | | | | | | | | |
Interest rate swaps | | $ | — | | | $ | (39,945 | ) | | $ | — | | | $ | (39,945 | ) |
| | | | | | | | | | | | | | | | | |
As of December 31, 2008, risk management current assets and risk management long-term assets in the Consolidated Balance Sheet include investment premiums of $13.3 million and $1.7 million, respectively.
The following table sets forth a reconciliation of changes in the fair value of the Level 3 NGL derivatives during the year ended December 31, 2008 (in thousands):
| | | | |
| | | | |
Net liability balances as of January 1, 2008 | | $ | (52,793 | ) |
Settlements | | | 16,098 | |
Unrealized gains | | | 50,711 | |
Net asset balances as of December 31, 2008 | | $ | 14,016 | |
| | | | | |
The Partnership values its Level 3 NGL derivatives using forward curves, volatility curves, volatility skew parameters, interest rate curves and model parameters.
Realized and unrealized losses related to the interest rate derivatives are recorded as part of interest rate risk management gains and losses in the Consolidated Statements of Operations. Realized and unrealized gains and losses and premium amortization related to the Partnership’s commodity derivatives are recorded as a component of revenue in the Consolidated Statements of Operations.
The carrying amount of cash equivalents is believed to approximate their fair values because of the short maturities of these instruments. The fair value of accounts receivable and accounts payable are not materially different from their carrying amounts because of the short-term nature of these instruments. As of December 31, 2008, the debt associated with the Credit Agreement bore interest at floating rates. As such, carrying amounts of this debt instrument approximates fair value.
NOTE 11. RISK MANAGEMENT ACTIVITIES
To mitigate its interest rate risk, the Partnership entered into various interest rate swaps. These swaps convert the variable-rate term loan into a fixed-rate obligation. The purpose of entering into these swaps is to eliminate interest rate variability by converting LIBOR-based variable-rate payments to fixed-rate payments. Amounts received or paid under these swaps were recorded as reductions or increases in interest expense.
On December 4, 2008, we executed a series of interest rate hedge transactions by which we extended the term on our existing interest rate swaps with a then notional amount of $450 million. The expiration dates on these swaps were extended from December 31, 2010 (for swaps with a notional value of $150 million), and January 3, 2011 (for swaps with a notional value of $300 million) to December 31, 2012. In addition, we blended the existing swap rates with the then prevailing interest rate swap rate for the period January 2011 through December 2012 (“blend and extend” strategy). This resulted in our weighted average three month LIBOR swap rate on our existing swaps decreasing from approximately 4.84% to approximately 4.16%.
In addition, on December 5, 2008, we executed an incremental interest rate swap on a notional amount of $150 million with an expiration of December 31, 2012 at a three month LIBOR swap rate of 2.56%. This additional transaction further reduced our weighted average three month LIBOR swap rate to approximately 3.76%.
The table below summarizes the terms, amounts received or paid and the fair values of the various interest rate swaps:
| | | | | | | | | | | | |
Effective Date | Expiration Date | | Notional Amount | | | Fixed Rate | | | Fair Value December 31, 2008 |
| | ($ in thousands, except notional amount) |
| 09/30/2008 | 12/31/2012 | | $ | 150,000,000 | | | | 4.020 | % | | $ | (11,398 | ) |
09/30/2008 | 12/31/2012 | | | 150,000,000 | | | | 4.295 | | | | (12,900 | ) |
10/03/2008 | 12/31/2012 | | | 150,000,000 | | | | 4.170 | | | | (12,199 | ) |
12/31/2008 | 12/31/2012 | | | 150,000,000 | | | | 2.560 | | | | (3,448 | ) |
| | | | | | | | | | | | $ | (39,945 | ) |
| | | | | | | | | | | | | | | |
For the years ended December 31, 2008, 2007 and 2006, the Partnership recorded a fair value (loss) gain within interest expense of ($27.7) million, ($13.4) million and $2.8 million (unrealized), respectively, and a realized (loss) gain of ($5.2) million, $1.4 million and $0.5 million, respectively. As of December 31, 2008 and 2007, the fair value of these contracts totaled an approximate $39.9 million liability and an approximate $12.2 million liability, respectively.
The prices of natural gas, crude oil and NGLs are subject to fluctuations in response to changes in supply, market uncertainty and a variety of additional factors which are beyond the Partnership’s control. In order to manage the risks associated with natural gas, crude oil and NGLs, the Partnership engages in risk management activities that take the form of commodity derivative instruments. Currently these activities are overseen by the Partnership’s Risk Management Committee and are governed by the general partner, which today typically prohibits speculative transactions and limits the type, maturity and notional amounts of derivative transactions. We have implemented a Risk Management Policy which will allow management to execute crude oil, natural gas liquids and natural gas hedging instruments in order to reduce exposure to substantial adverse changes in the prices of these commodities. We continuously monitor and ensure compliance with this Risk Management Policy through senior level executives in our operations, finance and legal departments.
During 2005 and 2006, the Partnership entered into the following risk management activities in connection with risks in our midstream business (excluding transactions that settled in previous periods):
| | • | NGL puts, costless collar and swap transactions for the sale of Mont Belvieu natural gas liquids with a combined notional amount of 57,000 Bbls per month and 54,000 Bbls per month for 2009, and 2010, respectively; and |
| | • | Condensate puts and costless collar transactions for the sale of West Texas Intermediate crude oil with a combined notional amount of 40,000 Bbls per month and 40,000 Bbls per month for 2009, and 2010, respectively. |
The NGL derivatives are intended to hedge the risk of lower prices for NGLs with offsetting increases in the value of the NGL derivatives. The condensate derivatives are intended to hedge the risk of lower NGL and condensate prices with offsetting increases in the value of the derivatives based on the correlation between NGL prices and crude oil prices. The natural gas derivatives are intended to hedge the risk of increasing natural gas prices with the offsetting value of the natural gas derivatives.
The Partnership entered or assumed the following derivative transactions related to our upstream business in association with the Montierra, EAC and Redman acquisitions during the year ended December 31, 2007. Transactions shown with a floor price only are puts; all other are costless collars (excluding transactions that settled in previous periods).
| | | | | | | | | | | |
| | | | | | | | | |
Price
($/MMBTU or $/bbl) |
| Period | | Commodity | | Average Monthly Volumes | | Index | | | Avg. Floor | | Avg. Ceiling |
Jan-Dec 2009 | | Gas | | 20,000 MMBtu | | NYMEX | | | 6.25 | | 11.20 |
Jan-Mar 2009 | | Gas | | 92,700 MMBtu | | NYMEX | | | 7.50 | | 13.75 |
Jan-May 2009 | | Gas | | 40,000 MMBtu | | NYMEX | | | 7.00 | | |
Jan-May 2009 | | Oil | | 7,000 Bbl | | NYMEX WTI | | | 60.00 | | 80.75 |
Jan-Dec 2009 | | Oil | | 6,000 Bbl | | NYMEX WTI | | | 60.00 | | 77.00 |
In addition to the upstream derivative transaction described above, the Partnership also entered into or assumed the following derivative transactions associated with our midstream business in conjunction with the Escambia Acquisition (excluding transactions that settled in previous periods). All of these derivatives are swaps.
| | | | | | | | | | | |
| Period | | Commodity | | Average Monthly Volumes | | Index | | Price ($/gal) |
| Jan-Dec 2009 | | Propane | | 2,955 Bbl | | OPIS MTB TET | | | 1.0875 | |
Jan-Dec 2009 | | Propane | | 5,486 Bbl | | OPIS MTB non-TET | | | 1.0775 | |
Jan-Dec 2009 | | n-Butane | | 6,042 Bbl | | OPIS MTB non-TET | | | 1.2775 | |
| Jan-Dec 2009 | | i-Butane | | 3,040 Bbl | | OPIS MTB non-TET | | | 1.2950 | |
On September 13, 2007, Eagle Rock entered into the following crude oil swaps for 2009 and 2010 to help mitigate its upstream business’ commodity price exposure:
| | | | | | | | | |
| Period | | Commodity | | Average Monthly Volumes | | Index | | Swap Price ($/Bbl) |
| Jan-Dec 2009 | | Crude oil | | 25,000 Bbl | | NYMEX WTI | | 71.25 |
| Jan-Dec 2010 | | Crude oil | | 25,000 Bbl | | NYMEX WTI | | 70.00 |
On September 25, 2007, Eagle Rock entered into additional swap transactions on ethane and propane volumes for 2009 per the following table:
| | | | | | | | | | |
| Period | | Commodity | | Average Monthly Volumes | | Index | | Swap Price ($/gal) |
| Jan-Dec 2009 | | Ethane | | 25,000 Bbl | | OPIS MTB non-TET | | 0.6361 |
| Jan-Dec 2009 | | Propane | | 15,000 Bbl | | OPIS MTB TET | | 1.0925 |
On November 7 and 8, 2007, the Partnership entered into additional commodity hedge transactions (excluding transactions settled in previous periods), as described below:
| | | | | | | | | | |
| Period | | Commodity | | Average Monthly Volumes | | Index | | Swap Price ($/Bbl) |
Jan-Dec 2010 | | Crude oil | | 10,000Bbl | | NYMEX WTI | | 78.35 |
| Jan-Dec 2011 | | Crude oil | | 45,000Bbl | | NYMEX WTI | | 80.00 |
Jan-Dec 2012 | | Crude oil | | 40,000 Bbl | | NYMEX WTI | | 80.30 |
Jan-Dec 2009 | | Natural Gas | | 85,000 MMBtu | | NYMEX | | 8.35 |
| | | | | | | | | | | |
| Period | | Commodity | | Average Monthly Volumes | | Index | | Floor ($/Bbl) | | Cap $/Bbl |
Jan-Dec 2011 | | Crude oil | | 50,000 Bbl | | NYMEX WTI | | 75.00 | | 85.70 |
Jan-Dec 2012 | | Crude Oil | | 50,000 Bbl | | NYMEX WTI | | 75.30 | | 86.00 |
Jan-Dec 2009 | | Natural Gas | | 85,000 MMbtu | | NYMEX | | 7.85 | | 9.25 |
Jan-Dec 2010 | | Natural Gas | | 110,000 MMbtu | | NYMEX | | 7.70 | | 9.10 |
Jan-Dec 2011 | | Natural Gas | | 100,000 MMbtu | | NYMEX | | 7.50 | | 8.85 |
| Jan-Dec 2012 | | Natural Gas | | 90,000 MMbtu | | NYMEX | | 7.35 | | 8.65 |
In addition to entering into the derivative instruments described in the tables above, the Partnership also bought back at no cost to the Partnership an option on a swap (“swaption”) during the year ended December 31, 2007. Under that agreement, the other party had the right, but not the obligation, to enter into a swap with us for 26,000 Bbls of NYMEX WTI per month during the period from January to December 2009 at a strike price of $85.00.
During the year ended December 31, 2008, we assumed the following derivative transactions related to our Upstream and Midstream Businesses in association with the Stanolind and Millennium acquisitions during the year ended December 31, 2008. Transactions shown with a floor price only are puts; all other are costless collars (excluding transactions that settled in previous periods).
| | | | | | | | | | | |
| | | | Average Monthly Volumes | | | | Price ($/mmbtu or $/bbl) |
| Period | | Commodity | | Index | | Avg. Floor | | Avg. Ceiling |
Jan-Mar 2009 | | Gas | 20,000 MMBtu | | NYMEX | | 9.00 | | 9.85 |
Apr-Jun 2009 | | Gas | 20,000 MMBtu | | NYMEX | | 7.50 | | 7.95 |
Jul-Sep 2009 | | Gas | 20,000 MMBtu | | NYMEX | | 7.50 | | 8.60 |
Jan-May 2009 | | Gas | 40,000 MMBtu | | NYMEX | | 7.50 | | 8.90 |
Jan-Dec 2009 | | Oil | 10,000 Bbl | | NYMEX WTI | | 93.00 | | 105.20 |
Jan-Dec 2010 | | Oil | 9,000 Bbl | | NYMEX WTI | | 90.00 | | 99.80 |
The Partnership entered into the following transactions associated with its Midstream Business during the year ended December 31, 2008. For the crude oil puts that were acquired, the Partnership paid premiums totaling $3.3 million. The natural gas collars were costless transactions that were entered into in order to reduce the Partnership’s exposure to potential natural gas increases. For these collars, the Partnership sold floors and bought caps to offset previous derivative transactions and these collars were necessary because of a change in the Partnership’s expected net natural gas position (excluding transactions that settled in previous periods).
| | | | | | | | | | | | |
| | | | Average Monthly Volumes | | | | Price ($/mmbtu or $/bbl) |
| Period | | Commodity | | Index | | Avg. Floor | | Avg. Ceiling |
| Jan-Mar 2009 | | Gas | 92,700 MMBtu | | NYMEX | | 8.80 | | 13.75 |
Jan-Dec 2009 | | Oil | 7,000 Bbl | | NYMEX WTI | | 90.00 | | |
Jan-Dec 2009 | | Oil | 5,000 Bbl | | NYMEX WTI | | 100.00 | | |
| Jan-Dec 2009 | | Oil | 6,000 Bbl | | NYMEX WTI | | 90.00 | | |
Jan-Dec 2009 | | Oil | 5,000 Bbl | | NYMEX WTI | | 100.00 | | |
On October 31, 2008, the Partnership entered into following transaction:
| | | | | | | | | |
| Period | | Commodity | | Average Monthly Volumes | | Index | | Swap Price ($/Bbl) |
| Jan-Dec 2009 | | Crude oil | | 50,000 Bbl | | NYMEX WTI | | 100.00 |
The above swap was part of a transaction in which the Partnership reset two existing crude oil swaps. The first swap was reset from $73.90 to $100 on 80,000 barrels per month for the months of November and December 2008 (this swap is excluded from the table because it has already settled). The cost of this reset swap was $4.1 million. The second swap was reset from $80.25 to $100 per barrel on 50,000 barrels per month for calendar year 2009. The cost to reset this swap was $11.7 million.
On November 25, 2008, the Partnership entered into the following swap transactions on natural gas volumes for 2009 per the following table:
| | | | | | | | | | |
| Period | | Commodity | | Average Monthly Volumes | | Index | | Swap Price ($/Bbl) |
| Jan-Dec 2009 | | Gas | | 70,000 MMbtu | | NYMEX WTI | | 6.685 |
Jun-Dec 2009 | | Crude oil | | 70,000 MMbtu | | NYMEX WTI | | 6.885 |
The counterparties used for all of these transactions have investment grade ratings.
The Partnership has not designated these derivative instruments as hedges and as a result is marking these derivative contracts to market with changes in fair values recorded as an adjustment to the mark-to-market gains /(losses) on risk management transactions within revenue. For the year ended December 31, 2008, the Partnership recorded a gain on risk management instruments of $161.8 million, representing a fair value (unrealized) gain of $221.2 million, amortization of derivative costs of $13.3 million and net (realized) settlement losses to the Partnership of $46.1 million. As of December 31, 2008, the fair value of these contracts, including derivative costs, totaled $109.2 million. For the year ended December 31, 2007, the Partnership recorded a loss on risk management instruments of $133.8 million, representing a fair value (unrealized) loss of $130.7 million, amortization of derivative costs of $8.2 million and net (realized) settlement losses to the Partnership of $3.1 million. As of December 31, 2007, the fair value of these contracts, including derivative costs, totaled $(127.3 million). For the year ended December 31, 2006, the Partnership recorded a loss on risk management instruments of $24.0 million, representing a fair value (unrealized) loss of $7.1 million, amortization of put premiums of $19.2 million and net (realized) settlements gain to the Partnership of $2.3 million.
On January 8, 2009, the Partnership executed a series of hedging transactions that involved unwinding certain existing derivative contracts and entering into new derivative contracts. See Note 19 for further discussion of these transactions.
NOTE 12. COMMITMENTS AND CONTINGENT LIABILITIES
Litigation—The Partnership is subject to several lawsuits which arise from time to time in the ordinary course of business, such as the interpretation and application of contractual terms related to the calculation of payment for liquids and natural gas proceeds. The Partnership has accruals of approximately $0.1 million and $1.8 million as of December 31, 2008 and 2007, respectively, related to these matters. The Partnership has been indemnified up to a certain dollar amount for two of these lawsuits. For the indemnified lawsuits, the Partnership has not established any accruals as the likelihood of these suits being successful against them is considered remote. If there ultimately is a finding against the Partnership in the indemnified cases, the Partnership would expect to make a claim against the indemnification up to limits of the indemnification. These matters are not expected to have a material adverse effect on our financial position, results of operations or cash flows.
Insurance—The Partnership covers its operations and assets with insurance which management believes is consistent with that in force for other companies engaged in similar commercial operations with similar type properties. This insurance includes: (1) commercial general liability insurance covering liabilities to third parties for bodily injury, property damage and pollution arising out of Eagle Rock Energy operations; (2) workers’ compensation liability coverage for employees to required statutory limits; (3) automobile liability insurance covering liability to third parties for bodily injury and property damage arising out of the operation of all owned, hired and non-owned vehicles by our employees on company business; (4) property insurance covering the replacement cost of all owned real and personal property, including coverage for losses due to boiler and machinery breakdown, earthquake, flood and consequent business interruption/extra expense; (5) control of well/operator’s extra expense insurance for operated and non operated wells in the Upstream Segment; and (6) corporate liability insurance including coverage for Directors and Officers and Employment Practices liabilities. In addition, the Partnership maintains excess liability insurance providing limits in excess of the established primary limits for commercial general liability and automobile liability insurance.
All coverages are subject to industry accepted policy terms, conditions, limits and deductibles comparable to that obtained by other energy companies with similar operations. The cost of insurance for the energy industry continued to fluctuate over the past year, reflecting the changing conditions in the insurance markets.
Regulatory Compliance—In the ordinary course of business, the Partnership is subject to various laws and regulations. In the opinion of management, the Partnership is in material compliance with existing laws and regulations.
Environmental—The operation of pipelines, plants and other facilities for gathering, transporting, processing, treating, or storing natural gas, NGLs and other products is subject to stringent and complex laws and regulations pertaining to health, safety and the environment. As an owner or operator of these facilities, the Partnership must comply with United States laws and regulations at the federal, state and local levels that relate to air and water quality, hazardous and solid waste management and disposal and other environmental matters. The cost of planning, designing, constructing and operating pipelines, plants, and other facilities must incorporate compliance with environmental laws and regulations and safety standards. Failure to comply with these laws and regulations may trigger a variety of administrative, civil and potentially criminal enforcement measures, including citizen suits, which can include the assessment of monetary penalties, the imposition of remedial requirements and the issuance of injunctions or restrictions on operation. Management believes that, based on currently known information, compliance with these laws and regulations will not have a material adverse effect on the Partnership’s combined results of operations, financial position or cash flows. At December 31, 2008 and 2007, the Partnership had accrued approximately $8.6 million and $2.4 million, respectively, for environmental matters.
In June 2008, the Texas Commission on Environmental Quality (“TCEQ”) issued a Notice of Enforcement (“NOE”) to one of the Partnership’s subsidiaries, TCEQ ID No.: CF-0068-J (the “First NOE”) and another NOE to another of its subsidiaries (TCEQ ID No.: CF-0070-W) (the “Second NOE”). Both the First NOE and the Second NOE were the result of findings made by the TCEQ’s Amarillo Region Office as a result of routine inspections of the Partnership’s Cargray facilities in the Texas Panhandle. These NOEs were consolidated into one docket during negotiations between the Partnership and the TCEQ. On October 28, 2008, the Partnership executed an Agreed Order resolving with the TCEQ the two NOE matters by, among other things, payment of an administrative penalty and Supplemental Environmental Project payment which, in the aggregate, were less than $10,000. The Partnership considers these matters concluded.
On September 29, 2008, the TCEQ issued another NOE to one of the Partnership’s subsidiaries concerning the environmental compliance of its Red Deer Gas Plant; TCEQ ID No.: RH-0004-B (the “Third NOE”). The allegations in the Third NOE are also the result of findings made by the TCEQ’s Amarillo Region Office as a result of a routine inspection. In response, the Partnership’s subsidiary took certain steps to come into compliance, and provided substantial documentation, some of which is corrective in nature, to the TCEQ. We also contested certain allegations. On December 5, 2008, TCEQ issued a proposed Agreed Order to the Partnership, offering settlement by, among other things, payment of an administrative penalty. On February 13, 2009, the Partnership executed this Agreed Order, paying an administrative penalty and Supplemental Environmental Project payment which, in the aggregate, were $46,072. The Partnership considers this matter concluded.
The Partnership has voluntarily undertaken a self-audit of its compliance with air quality standards, including permitting in the Texas Panhandle Segment as well as a majority of our other Midstream Business locations and some of its Upstream Business locations. This auditing has been and is being undertaken pursuant to the Texas Environmental, Health and Safety Audit Privilege Act, as amended. The Partnership has begun making the disclosures to the TCEQ as a result of the completion of the first of these self audits, and it is addressing in due course the deficiencies that it disclosed therein. The Partnership does not foresee at this time any impediment to its successful conclusion of these audits and the resulting corrective effort.
Since 2008, the Partnership has received additional NOEs and a notice of violation from the TCEQ related to air compliance matters in the Texas Panhandle Segment. One of the NOEs has been resolved for $2,575. The Partnership expects to receive additional NOEs or NOVs from the TCEQ from time to time throughout 2009. Though the TCEQ has the discretion to adjust penalties and settlements upwards based on a compliance history containing multiple, successive NOEs, the Partnership does not expect that the resolution of any existing NOE or any future similar NOE will vary significantly from the administrative penalties and agreed settlements experienced by it to date.
Retained Revenue Interest—Certain assets of the Partnership’s Upstream Segment are subject to retained revenue interests. These interests were established under purchase and sale agreements that were executed by the Partnership’s predecessors in title. The terms of these agreements entitle the owners of the retained revenue interests to a portion of the revenues received from the sale of the hydrocarbons above specified base oil and natural gas prices. These retained revenue interests do not represent a real property interest in the hydrocarbons. The Partnership’s reported revenues are reduced to account for the retained revenue interests on a monthly basis.
The retained revenue interests affect the Partnership’s interest at the Big Escambia Creek, Flomaton and Fanny Church fields in Escambia County, Alabama. With respect to the Partnership’s Flomaton and Fanny Church fields, the Partnership is currently making payments in satisfaction of the retained revenue interests, and it expects these payments to continue through the end of 2009 and possibly 2010. With respect to the Partnership’s Big Escambia Creek field, these payments are expected to begin in 2010 and continue through the end of 2019.
Other Commitments—The Partnership utilizes assets under operating leases for its corporate office, certain rights-of way and facilities locations, vehicles and in several areas of its operation. Rental expense, including leases with no continuing commitment, amounted to approximately $5.8 million, $3.6 million and, $0.3 million for the years ended December 31, 2008, 2007 and 2006, respectively. Rental expense for leases with escalation clauses is recognized on a straight-line basis over the initial lease term. At December 31, 2008, commitments under long-term non-cancelable operating leases for the next five years are as follows: 2009—$1.7 million; 2010—$0.8 million; 2011—$0.7 million; 2012—$0.6 million; and 2013—$0.6 million.
NOTE 13. SEGMENTS
Based on our approach to managing our assets, we believe our operations consist of four geographic segments in its Midstream Business, one mineral/royalty segment, one Upstream Segment and one functional (corporate) segment:
| | (i) | Midstream—Texas Panhandle Segment: |
gathering, processing, transportation and marketing of natural gas in the Texas Panhandle;
| | (ii) | Midstream—South Texas Segment: |
gathering, processing, transportation and marketing of natural gas in South Texas;
| | (iii) | Midstream—East Texas/Louisiana Segment: |
gathering, processing and marketing of natural gas and related NGL transportation in East Texas and Louisiana;
| | (iv) | Midstream—Gulf of Mexico Segment: |
Gathering and processing of natural gas; and fractionation, transportation and marketing of NGLs in South Louisiana, Gulf of Mexico and inland waters of Texas;
crude oil and natural gas production from operated and non-operated wells;
fee minerals, royalties and non-operated working interest ownership, lease bonus and rental income and equity in earnings of unconsolidated non-affiliate; and
risk management and other corporate activities.
The Partnership’s chief operating decision-maker currently reviews its operations using these segments. The Partnership evaluates segment performance based on segment operating income or loss. Summarized financial information concerning the Partnership’s reportable segments is shown in the following table:
| Year Ended December 31, 2008 | | Texas Panhandle Segment | | | South Texas Segment | | | East Texas/ Louisiana Segment | | | Gulf of Mexico Segment | | | Total Midstream Segments | |
| | | ($ in millions) | |
| Sales to external customers | | $ | 603.1 | | | $ | 173.7 | | | $ | 322.0 | | | $ | 1.7 | | | $ | 1,100.5 | |
Cost of natural gas and natural gas liquids | | | 459.1 | | | | 162.0 | | | | 269.0 | | | | 1.4 | | | | 891.5 | |
Operating costs and other expenses | | | 34.3 | | | | 2.9 | | | | 16.5 | | | | 0.6 | | | | 54.3 | |
| Depreciation, depletion, amortization and impairment | | | 43.7 | | | | 12.5 | | | | 40.6 | | | | 1.5 | | | | 98.3 | |
| Operating income (loss) | | $ | 66.0 | | | $ | (3.7 | ) | | $ | (4.1 | ) | | $ | (1.8 | ) | | $ | 56.4 | |
| | | | | | | | | | | | | | | | | | | | | |
| Capital Expenditures | | $ | 30.7 | | | $ | 1.1 | | | $ | 17.4 | | | $ | — | | | $ | 49.2 | |
| Segment Assets | | $ | 543.5 | | | $ | 97.3 | | | $ | 368.6 | | | $ | 80.1 | | | $ | 1,089.5 | |
| | | | | | | | | | | | | | | | |
| Year Ended December 31, 2008 | | Total Midstream Segments | | | Upstream Segment | | | Minerals Segment | | | Corporate Segment | | | Total Segments | |
| | | ($ in millions) | |
Sales to external customers | | $ | 1,100.5 | | | $ | 173.0 | | | $ | 43.0 | | | $ | 161.8 | (a) | | $ | 1,478.2 | |
Cost of natural gas and natural gas liquids | | | 891.5 | | | | — | | | | — | | | | — | | | | 891.4 | |
Operating costs and other expenses | | | 54.3 | | | | 37.5 | | | | 1.7 | | | | 56.4 | | | | 149.9 | |
| Depreciation, depletion, amortization and impairment | | | 98.3 | | | | 183.0 | | | | 9.5 | | | | 0.8 | | | | 291.6 | |
Operating income (loss) | | $ | 56.4 | | | $ | (47.5 | ) | | $ | 31.8 | | | $ | 104.6 | | | $ | 145.3 | |
| | | | | | | | | | | | | | | | | | | | | |
Capital Expenditures | | $ | 49.2 | | | $ | 20.7 | | | $ | — | | | $ | 0.8 | | | $ | 70.7 | |
Segment Assets | | $ | 1,089.5 | | | $ | 398.0 | | | $ | 143.9 | | | $ | 141.7 | | | $ | 1,773.1 | |
| | | | | | | | | | | | | | |
| Year Ended December 31, 2007 | | Texas Panhandle Segment | | | South Texas / Segment | | | East Texas / Louisiana Segment | | | Total Midstream Segments |
| | | ($ in millions) |
Sales to external customers | | $ | 488.0 | | | $ | 53.9 | | | $ | 167.2 | | | $ | 709.1 | |
Cost of natural gas and natural gas liquids | | | 372.2 | | | | 47.7 | | | | 133.4 | | | | 553.3 | |
Operating costs and other expenses | | | 32.5 | | | | 1.1 | | | | 10.9 | | | | 44.5 | |
| Depreciation and amortization | | | 42.3 | | | | 2.5 | | | | 10.8 | | | | 55.5 | |
| Operating income (loss) | | $ | 41.0 | | | $ | 2.6 | | | $ | 12.1 | | | $ | 55.8 | |
| | | | | | | | | | | | | | | | | | |
Capital expenditures | | $ | 34.9 | | | $ | 3.4 | | | $ | 25.6 | | | $ | 63.9 | |
Segment assets | | $ | 586.9 | | | $ | 99.3 | | | $ | 254.4 | | | $ | 940.6 | |
| Year Ended December 31, 2007 | | Total Midstream Segments | | | Upstream Segment | | | Minerals Segment | | | Corporate Segment | | | Total Segments | |
| | | ($ in millions) | |
Sales to external customers | | $ | 709.1 | | | $ | 51.8 | | | $ | 15.0 | | | $ | (133.8 | )(a) | | $ | 642.0 | |
Cost of natural gas and natural gas liquids | | | 553.3 | | | | — | | | | — | | | | — | | | | 553.3 | |
Operating costs and other expenses | | | 44.5 | | | | 15.9 | | | | 0.8 | | | | 30.5 | | | | 91.8 | |
| Depreciation, depletion, amortization and impairment | | | 55.5 | | | | 16.2 | | | | 13.8 | | | | 0.8 | | | | 86.3 | |
Operating income (loss) | | $ | 55.8 | | | $ | 19.6 | | | $ | 0.5 | | | $ | (165.2 | ) | | $ | (89.3 | ) |
| | | | | | | | | | | | | | | | | | | | | |
Capital Expenditures | | $ | 63.9 | | | $ | 2.2 | | | $ | — | | | $ | — | | | $ | 66.1 | |
Segment Assets | | $ | 940.6 | | | $ | 503.8 | | | $ | 155.2 | | | $ | 10.3 | | | $ | 1,609.9 | |
| Year Ended December 31, 2006 | | Texas Panhandle Segment | | | East Texas / Louisiana Segment | | | Corporate Segment | | | Total Midstream Segments | |
| | | ($ in millions) | |
| Sales to external customers | | $ | 423.1 | | | $ | 79.3 | | | $ | (24.0 | )(a) | | $ | 478.4 | |
| Cost of natural gas and natural gas liquids | | | 317.6 | | | | 60.0 | | | | — | | | | 377.6 | |
| Operating costs and other expenses | | | 30.1 | | | | 5.1 | | | | 16.9 | | | | 52.1 | |
| Depreciation and amortization | | | 36.3 | | | | 5.9 | | | | 1.0 | | | | 43.2 | |
| Operating income (loss) | | $ | 39.1 | | | $ | 8.3 | | | $ | (41.9 | ) | | $ | 5.5 | |
| | | | | | | | | | | | | | | | | |
| Capital expenditures | | $ | 12.2 | | | $ | 20.7 | | | $ | 5.5 | | | $ | 38.4 | |
| Segment assets | | $ | 573.6 | | | $ | 148.9 | | | $ | 57.4 | | | $ | 779.9 | |
| (a) | Represents results of our derivatives activity. |
NOTE 14. EMPLOYEE BENEFIT PLAN
The Partnership offers a defined contribution benefit plan to its employees. The plan, which was amended in December 2007 to eliminate, in part, a requirement that an employee have been with the Partnership longer than six months, provides for a dollar for dollar matching contribution by the Partnership of up to 3% of an employee’s contribution and 50% of additional contributions up to an additional 2%. Additionally, the Partnership may, at its sole discretion and election, contribute up to 6% of a participating employee’s base salary annually, subject to vesting requirements. Expenses under the plan for the years ended December 31, 2008, 2007 and 2006 were approximately $1.4 million, $0.8 million and $0.3 million, respectively.
NOTE 15. INCOME TAXES
The Partnership’s provision for income taxes relates to (i) state taxes for the Partnership and (ii) federal taxes for Eagle Rock Energy Acquisition Co., Inc, (acquiring entity of certain entities acquired in the Redman acquisition in 2007) and Eagle Rock Energy Acquisition Co. II, Inc. (acquiring entity of certain entities acquired in the Stanolind Acquisition in 2008) and their wholly owned corporations, Eagle Rock Upstream Development Company, Inc., (successor entity of certain entities acquired in the Redman acquisition) and Eagle Rock Upstream Development Company II, Inc. (successor entity of certain entities acquired in the Stanolind acquisition), which are subject to federal income taxes (the “C Corporations”) The comparative data presented below for 2006 does not include the income taxes of the above referenced corporations since they were acquired in 2007 and 2008. In addition, with the amendment of the Texas Franchise Tax in 2006, we have become a taxable entity in the state of Texas. Our federal and state income tax provision is summarized below:
| | | | | | | | | | |
| | | For the Year Ended | |
| | | 2008 | | | 2007 | | | 2006 | |
| | | ($ in thousands) | |
| Current: | | | | | | | | | |
Federal | | $ | 140 | | | $ | (26 | ) | | $ | — | |
State | | | 831 | | | | 713 | | | | — | |
Total current provision | | | 971 | | | | 687 | | | | — | |
| Deferred: | | | | | | | | | | | | |
Federal | | | (6,766 | ) | | | (493 | ) | | | — | |
State | | | 2,217 | | | | (62 | ) | | | 1,230 | |
Total deferred | | | (4,549 | ) | | | (555 | ) | | | 1,230 | |
Total provision for income taxes | | | (3,577 | ) | | | 132 | | | | 1,230 | |
Add Back: valuation allowance for Federal loss | | | 2,444 | | | | 26 | | | | — | |
Total Provision for income taxes less valuation allowance | | $ | (1,134 | ) | | $ | 158 | | | $ | 1,230 | |
| | | | | | | | | | | | | |
The effective rate for the twelve months ended December 31, 2008, 2007 and 2006 are shown in the table below. For 2007 and 2006 the federal and state based income taxes were applied against book losses which resulted in a 100% effective tax rate for 2007 and 2006. The changes in the 2008 effective rate are attributable to the state and federal taxes being applied against book income for 2008. A reconciliation of the provision for income taxes with amounts determined by applying the statutory U.S. federal income tax rate to income before income taxes is as follows:
| | | | | | | | | | |
| | | For the Year Ended December 31, | |
| | | | | | 2007 | | | 2006 | |
| | | ($ in thousands) | |
Pre-tax net book income (loss) | | $ | 86,404 | | | $ | (145,465 | ) | | $ | (22,084 | ) |
| | | | | | | | | | | | | |
Texas Margin Tax current and deferred | | | 3,048 | | | | 651 | | | | 1,230 | |
| Federal income taxes computed by applying the federal statutory rate to NBI of corporate entities | | | (4,182 | ) | | | (519 | ) | | | — | |
NOL used | | | (2,444 | ) | | | — | | | | — | |
Valuation allowance | | | 2,444 | | | | 26 | | | | — | |
Provision for income taxes | | $ | (1,134 | ) | | $ | 158 | | | $ | 1,230 | |
Effective income tax rate | | | (1.3 | )% | | | 100.0 | % | | | 100.0 | % |
| | | | | | | | | | | | | |
Significant components of deferred tax liabilities and deferred tax assets as of December 31, 2008 and 2007 are as follows:
| | | | |
| | | At December 31, |
| | | 2008 | | | 2007 |
| | | ($ in thousands) |
| Deferred Tax Assets: | | | | | |
| Net operating loss carryovers | | $ | 3,616 | | | $ | 1,998 | |
| Current year adjustment to net operating loss carryforwards | | | (2,444 | ) | | | 26 | |
| Statutory depletion carryover | | | 1,842 | | | | — | |
| AMT credit carryforward | | | 140 | | | | — | |
| Unrealized hedging transactions | | | — | | | | 1,278 | |
| Total deferred tax | | | 3,154 | | | | 3,302 | |
| Less: Valuation allowance | | | (3,154 | ) | | | (2,578 | ) |
| Net Deferred Tax Assets | | | — | | | | 724 | |
| | | | | | | | | |
| Deferred Tax Liabilities: | | | | | | | | |
| Property, plant equipment & amortizable assets | | | (2,621 | ) | | | (1,906 | ) |
| Unrealized hedging transactions | | | (765 | ) | | | — | |
| Book/tax differences from partnership investment | | | (38,963 | ) | | | (16,334 | ) |
| Total Deferred Tax Liabilities | | | (42,349 | ) | | | (18,240 | ) |
| Total Net Deferred Tax Liabilities | | $ | (42,349 | ) | | $ | (17,516 | ) |
| Current portion of total net deferred tax liabilities | | $ | — | | | $ | — | |
| Long-term portion of total net deferred tax liabilities | | $ | (42,349 | ) | | $ | (17,516 | ) |
| | | | | | | | | |
We had net operating loss carryforwards and depletion deduction carryforwards of $1.2 million and $2.0 million at December 31, 2008 and 2007, respectively. These losses expire in various years between 2008 and 2028 and are subject to limitations on their utilization. We record a valuation allowance to reduce our deferred tax assets to the amount of future tax benefit that is more likely than not to be realized. The valuation allowance was $3.1 million and $2.6 million at December 31, 2008 and 2007, respectively. Of the $3.1 million valuation allowance at December 31, 2008, none is for timing differences from hedging transactions which impact the Texas Margins Tax and $3.0 million is from net operating loss carryovers from the C Corporations and $0.1 is from AMT credit carryforwards from the C corporations. For 2007, $0.6 million was for timing differences from hedging transactions which impact the Texas Margins Tax and $2.0 million is from net operating loss carryovers from the Redman Acquisition and current year losses from our wholly owned corporations Eagle Rock Energy Acquisition Co, Inc. and Eagle Rock Upstream Development Company, Inc. We expect to pay minimal federal taxes for the foreseeable future and this valuation allowance serves to eliminate the recognized tax benefit associated with carryovers of our corporate entities to an amount that will, more likely than not, be realized.
The largest single component of our deferred tax liabilities is related to federal income taxes of the C Corporations described above. Book/tax differences were created by the Redman and Stanolind Acquisitions. These book/tax temporary differences result in a net deferred tax liability of $39.0 million at December 31, 2008, which will be reduced as allocation of depletion in proportion to the assets contributed brings the book and tax basis closer together over time. This deferred tax liability was recognized in conjunction with the purchase accounting adjustments for long term assets.
On May 18, 2006, the State of Texas enacted House Bill 3 which revised the pre-existing state franchise tax. In general, legal entities that conduct business in Texas are subject to the Revised Texas Franchise Tax, including previously non-taxable entities such as limited partnerships and limited liability partnerships. The tax is assessed on Texas sourced taxable margin which is defined as the lesser of (i) 70% of total revenue or (ii) total revenue less (a) cost of goods sold or (b) compensation and benefits.
Although the bill states that the Revised Texas Franchise Tax is not an income tax, it has the characteristics of an income tax since it is determined by applying a tax rate to a base that considers both revenues and expenses. Due to the enactment of the Revised Texas Franchise Tax, we recorded a net deferred tax liability of $3.4 million, $1.9 million and $1.2 million during the years ended December 31, 2008, 2007 and 2006, respectively. The offsetting net charges of $0.9 million, $0.7 million and $1.2 million are shown on our Statement of Consolidated Operations for the years ended December 31, 2008, 2007 and 2006, respectively, as a component of provision for income taxes.
In accordance with FASB Interpretation No. 48, Accounting for Uncertainty in Income Taxes, the Partnership must recognize the tax effects of any uncertain tax positions it may adopt, if the position taken by the Partnership is more likely than not sustainable. If a tax position meets such criteria, the tax effect to be recognized is by the Partnership would be the largest amount of benefit with more than 50% chance of being realized upon settlement. This guidance was effective January 1, 2007, and the Partnership’s adoption of this guidance had and continues to have no material impact on its financial position, results of operations or cash flows.
NOTE 16. EQUITY-BASED COMPENSATION
Eagle Rock Energy G&P, LLC the general partner of the general partner for the Partnership, approved a long-term incentive plan (LTIP), as amended, for its employees, directors and consultants who provide services to the Partnership covering an aggregate of 2,000,000 common units to be granted either as options, restricted units or phantom units. On October 25, 2006, 124,450 restricted common units were issued to employees and directors of the General Partner who provide services to the Partnership. These restricted units were valued at the market price of the initial public offering less a discount for the delay in their cash distributions during the unvested period. The weighted average fair value of the units granted during the year ended December 31, 2006 was $18.75. With the completion of the Montierra and Laser Acquisitions, during May and June 2007, 343,271 restricted common units were issued to employees and independent directors of the General Partner who provide services to the Partnership. Subsequently (but prior to December 31, 2007) 95,700 restricted common units were issued to certain employees and a new independent director (in connection with their acceptance of employment and directorship, respectively). During the year ended December 31, 2008, the Partnership granted an additional 741,150 restricted common units. The restricted units granted in 2008 and 2007 were valued at the market price as of the date issued. The weighted average fair value of the units granted during the year ended December 31, 2008 and 2007 were $14.89 and $23.10, respectively. The awards generally vest on the basis of one third of the award each year. During the restriction period, distributions associated with the granted awards will be distributed to the awardees. No options or phantom units have been issued to date.
A summary of the restricted common units activity for the year ended December 31, 2008, is provided below:
| | | |
| | | Number of Restricted Units | | | Weighted Average Fair Value |
Outstanding at December 31, 2007 | | | 467,062 | | | $ | 23.01 |
Granted | | | 741,150 | | | $ | 14.86 |
Vested | | | (162,302 | ) | | $ | 22.69 |
Forfeitures | | | (140,424 | ) | | $ | 19.09 |
Outstanding at December 31, 2008 | | | 905,486 | | | $ | 17.00 |
| | | | | | | | |
The total grant date fair value of restricted units that vested during the years ended December 31, 2008 and 2007 were $3.7 million and $0.8 million, respectively. No restricted units vested in 2006.
For the years ended December 31, 2008, 2007 and 2006, non-cash compensation expense of approximately $6.0 million, $2.4 million and $0.1 million, respectively, was recorded related to the granted restricted units. The terms of the October 2006 award agreements were amended during the third quarter of 2007 to permit direct distributions to the holders of restricted unvested common units under such award agreements during the unvested period, including the August 14, 2007 distribution. Prior to the amendment, distributions were made on the restricted unvested common units under these award agreements held by the Partnership, to be finally distributed to the holder or forfeited in keeping with (and on the same timing as) the fate of the underlying unit’s vesting or forfeiture, and, per the amendment, the two prior distributions (i.e., the fourth quarter 2006 prorated distribution and the first quarter 2007 minimum quarterly distribution) will continue to be held by the Partnership with the final disposition of said distributions to be determined in the original manner prescribed for distributions. Restricted common units granted during 2007 already were entitled to receive direct distributions during their unvested periods. This modification resulted in a repricing of the unvested units from their original value of $18.75 to the unit price of $22.60 at the time of the amendment. This change affected approximately 109,750 unvested units (135 employees) and resulted in a $0.1 million increase in compensation during the year ended December 31, 2007. On November 5, 2007, the Partnership modified the vesting dates of the options granted on October 25, 2006 and for other individuals granted units between May 15, 2007 and November 5, 2007. This modification moved the individuals vesting dates to either May 15, 2008, 2009 and 2010 or to November 15, 2008, 2009 and 2010. As the price of the Partnership’s units was lower on the date of modification than the unit price on the date of grant, or date of the previous modification, there was no incremental cost associated with this modification and thus there was no impact to compensation.
As of December 31, 2008, unrecognized compensation costs related to the outstanding restricted units under our LTIP totaled approximately $13.3 million. The remaining expense is to be recognized over a weighted average of 2 years.
Due to vesting of certain restricted units during 2007, 7,400 units were repurchased by the Partnership for $0.2 million as reimbursement for the related employee tax liability paid by the Partnership. These units were put back into the plan and are available for future grants under the LTIP plan.
In addition to equity awards involving units of the Partnership, Eagle Rock Holdings, L.P., which is controlled by NGP, in the past has from time to time granted equity in Holdings to certain employees working on behalf of the Partnership, some of which are named executive officers. During 2008, Holdings granted 417,000 “Tier I” incentive interests in the aggregate to six Eagle Rock employees. One of these employees subsequently forfeited 200,000 of the interests upon his resignation from Eagle Rock in 2008. The Tier I incentive interests entitle the holder to share in the cash distributions of Holdings upon achieving a certain payout target, which was reached in 2006. Holdings also granted 33,415 “Tier III” incentive units during 2008 (20,000 of which were subsequently forfeited in 2008). These units have not achieved their payout target and as such have no impact to compensation.
The Partnership has no discretion in granting any awards at the Holdings level. The Tier I incentive interests are intended to provide additional motivation for the grantees to create value at Holdings, in part through their actions to increase the value of the Partnership. Because the incentive interests represent an interest in the future profits of Holdings, and receive distributions only from the cash flow at Holdings, the incentive interests create no burden on, or dilution to, the returns on the Partnership’s common units. On the contrary, the incentive units are solely a burden on, and dilutive to, the returns of the equity owners of Holdings, including NGP as the substantial majority owner of Holdings. Despite this, under the guidance of U.S. Securities and Exchange Commission Staff Accounting Bulletin Topic 1.B: “Allocation Of Expenses And Related Disclosure In Financial Statements Of Subsidiaries, Divisions Or Lesser Business Components Of Another Entity,” the Partnership recorded a portion of the value of the incentive units as compensation expense in the Partnership’s financial statements. This allocation is based on management’s estimation of the total value of the incentive unit grant and of the grantee’s portion of time dedicated to the Partnership. Eagle Rock recorded a non-cash compensation expense of $1,665,831 based on management’s estimates related to the Tier I incentive unit grants made by Holdings in 2008.
NOTE 17. EARNINGS PER UNIT
Basic earnings per unit is computed by dividing the net income, or loss, by the weighted average number of units outstanding during a period. To determine net income, or loss, allocated to each class of ownership (common, subordinated and general partner), we first allocated net income, or loss, by the amount of distributions made for the quarter by each class, if any. The remaining net income, or loss, after the deduction for the related quarterly distribution was allocated to each class in proportion to the class’ weighted average number of units outstanding for a period, as compared to the weighted average number of units for all classes for the period.
We issued restricted, unvested common units at the time of the initial public offering, October 24, 2006 and subsequent award dates. These units will be considered in the diluted common unit weighted average number in periods of net income. In periods of net losses, the units are excluded from the diluted earnings per unit calculation due to their antidilutive effect.
On January 1, 2009, the Partnership adopted the provisions of EITF 07-4, which provides that for master limited partnerships (“MLPs”), current period earnings be reduced by the amount of available cash that will be distributed with respect to that period for purposes of calculating earnings per unit. Any residual amount representing undistributed earnings is assumed to be allocated to the various ownership interests in accordance with the contractual provisions of the partnership agreement. In addition, incentive distribution rights (“IDRs”), which represent a limited partnership ownership interest, are considered to be participating securities because they have the right to participate in earnings with common equity holders.
Under the Partnership’s partnership agreement, for any quarterly period, IDRs participate in net income only to the extent of the amount of cash distributions actually declared, thereby excluding the IDRs from participating in undistributed earnings or losses. Accordingly, undistributed net income is assumed to be allocated to the other ownership interests on a pro-rata basis. During the years ended December 31, 2008, 2007 and 2006, the Partnership did not declare a quarterly distribution for the IDRs.
On January 1, 2009, the Partnership also adopted the provisions of FSP EITF 03-6-1, which provides that share-based payment awards that contain non-forfeitable rights to dividends or dividend equivalents meets the definition of a participating security and shall be included in the computation of earnings-per-unit pursuant to the two-class method, as provided by SFAS No. 128, Earnings Per Share. The restricted common units granted under the LTIP, as discussed in Note 16, contain non-forfeitable rights to the distributions declared by the Partnership.
The accompanying consolidated financial statements have been retrospectively adjusted for the adoption of EITF 07-4 and FSP EITF 03-06-1. After applying the provisions of EITF 07-4 and FSP EITF 03-6-1, net income per common, subordinated and general partner unit for the year ended December 31, 2008 changed from $1.20 to $1.08. For the year ended December 31, 2007, net loss per common unit changed from $2.11 to $2.13, while net loss per subordinated and general partner unit changed from $3.15 to $3.13. For the year ended December 31, 2006, net loss per common changed from $1.26 to $0.98, net loss per subordinated unit changed from $0.43 to $0.61 and net loss per general partner unit changed from $0.80 to $1.00. Earnings per unit has not been separately disclosed for the restricted common units, as they restricted common units are not considered a separate class of equity.
The following table presents our calculation of basic and diluted units outstanding for the periods indicated:
| | | | | | | | | | |
| | | For the Year Ended December 31, | |
| | | 2008 | | | 2007 | | | 2006 | |
| | | ($ in thousands, except per unit amounts) | |
| | | | | | | | | | |
| Basic weighted average unit outstanding during period: | | | | | | | | | |
| Common units | | | 51,534 | | | | 37,008 | | | | 12,123 | |
| Subordinated units | | | 20,691 | | | | 20,691 | | | | 17,873 | |
| General partner units | | | 845 | | | | 845 | | | | 557 | |
| | | | | | | | | | | | | |
| Diluted weighted average unit outstanding during period: | | | | | | | | | | | | |
Common units | | | 51,699 | | | | 37,008 | | | | 12,123 | |
Subordinated units | | | 20,691 | | | | 20,691 | | | | 17,873 | |
General partner units | | | 845 | | | | 845 | | | | 557 | |
The following table presents the Partnership’s basic and diluted loss per unit for the year ended December 31, 2008:
| | | Total | | | Common Units | | | Restricted Common Units | | | Subordinated Units | | | General Partner Units | |
| | | ($ in thousands, except for per unit amounts) | |
Income from continuing operations | | $ | 85,756 | | | | | | | | | | | | | | | | | |
Distributions declared | | | 120,257 | | | $ | 84,001 | | | $ | 1,152 | | | $ | 33,727 | | | $ | 1,377 | |
| Assumed loss from continuing operations after distribution to be allocated | | | (34,501 | ) | | | (24,332 | ) | | | — | | | | (9,770 | ) | | | (399 | ) |
| Assumed allocation of income from continuing operations | | | 85,756 | | | | 59,669 | | | | 1,152 | | | | 23,957 | | | | 978 | |
Discontinued operations | | | 1,764 | | | | 1,244 | | | | — | | | | 500 | | | | 20 | |
Assumed net income to be allocated | | $ | 87,520 | | | $ | 60,913 | | | $ | 1,152 | | | $ | 24,457 | | | $ | 998 | |
| | | | | | | | | | | | | | | | | | | | | |
| Basic and diluted income from continuing operations per unit | | | | | | $ | 1.16 | | | | | | | $ | 1.16 | | | $ | 1.16 | |
| Basic discontinued operations per unit | | | | | | $ | 0.02 | | | | | | | $ | 0.02 | | | $ | 0.02 | |
Basic income per unit | | | | | | $ | 1.18 | | | | | | | $ | 1.18 | | | $ | 1.18 | |
The following table presents the Partnership’s basic and diluted loss per unit for the year ended December 31, 2007:
| | | Total | | | Common Units | | | Restricted Common Units | | | Subordinated Units | | | General Partner Units | |
| | | ($ in thousands, except for per unit amounts) | |
Loss from continuing operations | | $ | (146,764 | ) | | | | | | | | | | | | | | | | |
Distributions declared | | | 81,893 | | | $ | 65,131 | | | $ | 395 | | | $ | 15,726 | | | $ | 641 | |
| Assumed loss from continuing operations after distribution to be allocated | | | (228,657 | ) | | | (144,543 | ) | | | — | | | | (80,815 | ) | | | (3,299 | ) |
| Assumed allocation of loss from continuing operations | | | (146,764 | ) | | | (79,412 | ) | | | 395 | | | | (65,089 | ) | | | (2,658 | ) |
Discontinued operations | | | 1,130 | | | | 714 | | | | — | | | | 399 | | | | 17 | |
Assumed net loss to be allocated | | $ | (145,634 | ) | | $ | (78,698 | ) | | $ | 395 | | | $ | (64,690 | ) | | $ | (2,641 | ) |
| | | | | | | | | | | | | | | | | | | | | |
| Basic and diluted loss from continuing operations per unit | | | | | | $ | (2.15 | ) | | | | | | $ | (3.15 | ) | | $ | (3.15 | ) |
| Basic and diluted discontinued operations per unit | | | | | | $ | 0.02 | | | | | | | $ | 0.02 | | | $ | 0.02 | |
Basic and diluted loss per unit | | | | | | $ | (2.13 | ) | | | | | | $ | (3.13 | ) | | $ | (3.13 | ) |
The following table presents the Partnership’s basic and diluted loss per unit for the year ended December 31, 2006:
| | | Total | | | Common Units | | | Restricted Common Units | | | Subordinated Units | | | General Partner Units | |
| | | ($ in thousands, except for per unit amounts) | |
Net loss | | $ | (23,314 | ) | | | | | | | | | | | | | | | | |
Distributions declared | | | 39,530 | | | $ | 16,480 | | | $ | — | | | $ | 22,501 | | | $ | 549 | |
| Assumed net loss after distribution to be allocated | | | (62,844 | ) | | | (28,316 | ) | | | — | | | | (33,422 | ) | | | (1,106 | ) |
Assumed net loss to be allocated | | $ | (23,314 | ) | | $ | (11,836 | ) | | $ | — | | | $ | (10,921 | ) | | $ | (557 | ) |
| | | | | | | | | | | | | | | | | | | | | |
Basic and diluted loss per unit | | | | | | $ | (0.98 | ) | | | | | | $ | (0.61 | ) | | $ | (1.00 | ) |
NOTE 18. OTHER OPERATING EXPENSE
In July 2008, SemGroup, L.P. and certain of its subsidiaries (“SemGroup”) filed petitions for reorganization under Chapter 11 of the U.S. Bankruptcy Code. The Partnership, through certain subsidiaries, has historically sold portions of its condensate production from its Texas Panhandle and East Texas midstream systems to SemGroup. As a result of the bankruptcy filing, the Partnership recorded a $10.7 million bad debt charge during the year ended December 31, 2008. The bad debt charges are included in “Other Operating Expense” in the consolidated statement of operations. The Partnership stopped all sales to SemGroup as of August 1, 2008, and as a result, the Partnership does not anticipate recording any additional bad debt charges in future periods. Other operating expenses for the year ended December 31, 2007 consisted of the settlement of a lawsuit for $1.4 million, liquidated damages related to the late registration of our common units for $1.1 million and a severance payment to a former executive of $0.3 million. For the year ended December 31, 2006, other operating expenses consisted of a payment of $6.0 million for the termination of advisory services agreement with an affiliate.
NOTE 19. SUBSEQUENT EVENTS
On January 8, 2009, the Partnership executed a series of hedging transactions that involved the unwinding of a portion of existing “in-the-money” 2011 and 2012 WTI crude oil swaps and collars, and the unwinding of two “in-the-money” 2009 WTI crude oil collars. With these transactions, and an additional $13.9 million of cash, the Partnership purchased a 2009 WTI crude oil swap on 60,000 barrels per month beginning January 1, 2009 at $97 per barrel. Both the unwound hedges and new hedges relate to expected volumes in the Partnership’s Midstream and Minerals Segments.
In addition to the hedging transactions discussed above, the Partnership also entered into a 125,000 MMBtu per month Henry Hub natural gas swap at $6.65/MMBtu on January 19, 2009 for its 2009 fiscal year, a 170,000 MMBtu per month Henry Hub natural gas swap at $6.14/MMBtu on February 17, 2009 for its 2010 fiscal year, a 45,000 barrel per month WTI crude oil swap at $53.55 per barrel on February 17, 2009 for its 2010 fiscal year and a 40,000 barrel per month WTI crude oil swap at $51.40 per barrel on February 19, 2009 for our 2010 fiscal year.
On April 1, 2009, the Partnership sold its producer services business (which is accounted for in its South Texas Segment) by assigning and novating the contracts under this business to a third-party purchaser. The Partnership sold the producer services business to a third-party purchaser as it was a low-margin business that was not core to the Partnership’s operations. The Partnership received an initial payment of $0.1 million for the sale of the business. In addition the Partnership will receive a contingency payment of up to $0.1 million in October 2009. It will also continue to receive a monthly payment equivalent to $0.01 per MMbtu on the volume of gas that flows pursuant to the assigned contracts for the next two years. Producer services was a business in which the Partnership would negotiate new well connections on behalf of small producers to pipelines other than its own. During the year ended December 31, 2008, this business generated revenues of $265.1 million and cost of natural gas and natural gas liquids of $263.3 million, as compared to revenues of $134.8 million and cost of natural gas and natural gas liquids of $133.6 million during the year ended December 31, 2007. There were no operations during the year ended December 31, 2006. The accompanying consolidated financial statements have been retrospectively adjusted to present these operations as discontinued operations.
NOTE 20. SUBSIDIARY GUARANTORS
The obligations under the Partnership’s revolving credit facility are secured by first priority liens on substantially all of the Partnership’s assets, including a pledge of all of the capital stock of each of its subsidiaries. All guarantees are full and unconditional and joint and several guarantees. In accordance with practices accepted by the SEC, the Partnership has prepared Unaudited Condensed Consolidating Financial Statements as supplemental information. The following Unaudited Condensed Consolidating Balance Sheets at December 31, 2008 and 2007, and Unaudited Condensed Consolidating Statements of Operations and Unaudited Condensed Consolidating Statements of Cash Flows for the years ended December 31, 2008, 2007 and 2006, present financial information for Eagle Rock Energy Partners, L.P. as the Parent on a stand-alone basis (carrying any investments in subsidiaries under the equity method), financial information for the subsidiary guarantors, which are all fully owned by the Parent, on a stand-alone basis, and the consolidation and elimination entries necessary to arrive at the information for the Partnership on a consolidated basis. The subsidiary guarantors are not restricted from making distributions to the Partnership.
Unaudited Condensed Consolidating Balance Sheet |
December 31, 2008 |
| (in thousands) | | Parent Issuer | | Subsidiary Guarantors | | Consolidating Entries | | | Total | |
| | | | |
| ASSETS: | | | | | | | | | | |
Accounts receivable – related parties | | $ | — | | $ | 16,880 | | $ | (16,880 | ) | | $ | — | |
Other current assets | | | 37,452 | | | 175,772 | | | — | | | | 213,224 | |
Total property, plant and equipment, net | | | 128 | | | 1,357,481 | | | — | | | | 1,357,609 | |
Investment in subsidiaries | | | 1,520,016 | | | — | | | (1,520,016 | ) | | | — | |
Total other long-term assets | | | 7,506 | | | 194,722 | | | — | | | | 202,228 | |
Total assets | | $ | 1,565,102 | | $ | 1,744,855 | | $ | (1,536,896 | ) | | $ | 1,773,061 | |
| LIABILITIES AND EQUITY: | | | | | | | | | | | | | | |
Accounts payable – related parties | | $ | 16,880 | | $ | — | | $ | (16,880 | ) | | $ | — | |
Other current liabilities | | | 10,596 | | | 145,342 | | | — | | | | 155,938 | |
Other long-term liabilities | | | 10,528 | | | 79,497 | | | — | | | | 90,025 | |
Long-term debt | | | 799,383 | | | — | | | — | | | | 799,383 | |
Equity | | | 727,715 | | | 1,520,016 | | | (1,520,016 | ) | | | 727,715 | |
Total liabilities and equity | | $ | 1,565,102 | | $ | 1,744,855 | | $ | (1,536,896 | ) | | $ | 1,773,061 | |
Unaudited Condensed Consolidating Balance Sheet |
December 31, 2007 |
| (in thousands) | | Parent Issuer | | Subsidiary Guarantors | | Consolidating Entries | | | Total | |
| | | | |
| ASSETS: | | | | | | | | | | |
Accounts receivable – related parties | | $ | 1,616 | | $ | — | | $ | (1,616 | ) | | $ | — | |
Other current assets | | | 72,286 | | | 135,891 | | | — | | | | 208,177 | |
Total property, plant and equipment, net | | | — | | | 1,207,130 | | | — | | | | 1,207,130 | |
Investment in subsidiaries | | | 1,217,445 | | | — | | | (1,217,445 | ) | | | — | |
Total other long-term assets | | | 4,234 | | | 190,386 | | | — | | | | 194,620 | |
Total assets | | $ | 1,295,581 | | $ | 1,533,407 | | $ | (1,219,061 | ) | | $ | 1,609,927 | |
| LIABILITIES AND EQUITY: | | | | | | | | | | | | | | |
Accounts payable – related parties | | $ | — | | $ | 1,616 | | $ | (1,616 | ) | | $ | — | |
Other current liabilities | | | 2,216 | | | 190,821 | | | — | | | | 193,037 | |
Other long-term liabilities | | | (472 | ) | | 123,525 | | | — | | | | 123,053 | |
Long-term debt | | | 567,069 | | | — | | | — | | | | 567,069 | |
Equity | | | 726,768 | | | 1,217,445 | | | (1,217,445 | ) | | | 726,768 | |
Total liabilities and equity | | $ | 1,295,581 | | $ | 1,533,407 | | $ | (1,219,061 | ) | | $ | 1,609,927 | |
Unaudited Condensed Consolidating Statement of Operations |
For the year ended December 31, 2008 |
| (in thousands) | | Parent Issuer | | Subsidiary Guarantors | | | Consolidating Entries | | | Total | |
| | | | |
Total revenues | | $ | 8,809 | | $ | 1,469,456 | | | $ | — | | | $ | 1,478,265 | |
Cost of natural gas and natural gas liquids | | | — | | | 891,433 | | | | — | | | | 891,433 | |
Operations and maintenance | | | — | | | 73,620 | | | | — | | | | 73,620 | |
Taxes other than income | | | — | | | 19,936 | | | | — | | | | 19,936 | |
General and administrative | | | 15 | | | 45,686 | | | | — | | | | 45,701 | |
Other operating expense | | | — | | | 10,699 | | | | — | | | | 10,699 | |
Depreciation, depletion, amortization and impairment | | | — | | | 291,605 | | | | — | | | | 291,605 | |
Income from operations | | | 8,794 | | | 136,477 | | | | — | | | | 145,271 | |
Interest expense, net | | | (32,884 | ) | | — | | | | — | | | | (32,884 | ) |
Other non-operating income | | | 5,617 | | | 6,350 | | | | (5,846 | ) | | | 6,121 | |
Other non-operating expense | | | (6,623 | ) | | (33,109 | ) | | | 5,846 | | | | (33,886 | ) |
Income (loss) before income taxes | | | (25,096 | ) | | 109,718 | | | | — | | | | 84,622 | |
Income tax provision | | | 1,087 | | | (2,221 | ) | | | — | | | | (1,134 | ) |
Equity in earnings of subsidiaries | | | 113,703 | | | — | | | | (113,703 | ) | | | — | |
Income (loss) from continuing operations | | | 87,520 | | | 111,939 | | | | (113,703 | ) | | | 85,756 | |
Discontinued operations | | | — | | | 1,764 | | | | — | | | | 1,764 | |
Net income (loss) | | $ | 87,520 | | $ | 113,703 | | | $ | (113,703 | ) | | $ | 87,520 | |
Unaudited Condensed Consolidating Statement of Operations |
For the year ended December 31, 2007 |
| (in thousands) | | Parent Issuer | | Subsidiary Guarantors | | | Consolidating Entries | | | Total | |
| | | | |
Total revenues | | $ | — | | $ | 642,023 | | | $ | — | | | $ | 642,023 | |
Cost of natural gas and natural gas liquids | | | — | | | 553,248 | | | | — | | | | 553,248 | |
Operations and maintenance | | | — | | | 52,793 | | | | — | | | | 52,793 | |
Taxes other than income | | | — | | | 8,340 | | | | — | | | | 8,340 | |
General and administrative | | | 53 | | | 27,746 | | | | — | | | | 27,799 | |
Other operating expense | | | — | | | 2,847 | | | | — | | | | 2,847 | |
Depreciation, depletion, amortization and impairment | | | — | | | 86,308 | | | | — | | | | 86,308 | |
Income from operations | | | (53 | ) | | (89,259 | ) | | | — | | | | (89,312 | ) |
Interest expense, net | | | (2,148 | ) | | (36,788 | ) | | | — | | | | (38,936 | ) |
Other non-operating income | | | 1,423 | | | 1,708 | | | | (1,275 | ) | | | 1,856 | |
Other non-operating expense | | | (46 | ) | | (21,443 | ) | | | 1,275 | | | | (20,214 | ) |
Income (loss) before income taxes | | | (824 | ) | | (145,782 | ) | | | — | | | | (146,606 | ) |
Income tax provision | | | (498 | ) | | 656 | | | | — | | | | 158 | |
Equity in earnings of subsidiaries | | | (145,308 | ) | | — | | | | 145,308 | | | | — | |
Income (loss) from continuing operations | | | (145,634 | ) | | (146,438 | ) | | | 145,308 | | | | (146,764 | ) |
Discontinued operations | | | — | | | 1,130 | | | | — | | | | 1,130 | |
Net income (loss) | | $ | (145,634 | ) | $ | (145,308 | ) | | $ | 145,308 | | | $ | (145,634 | ) |
Unaudited Condensed Consolidating Statement of Operations |
For the year ended December 31, 2006 |
| (in thousands) | | Parent Issuer | | Subsidiary Guarantors | | | Consolidating Entries | | | Total | |
| | | | |
Total revenues | | $ | — | | $ | 478,390 | | | $ | — | | | $ | 478,390 | |
Cost of natural gas and natural gas liquids | | | — | | | 377,580 | | | | — | | | | 377,580 | |
Operations and maintenance | | | — | | | 32,905 | | | | — | | | | 32,905 | |
Taxes other than income | | | — | | | 2,301 | | | | — | | | | 2,301 | |
General and administrative | | | 1 | | | 10,859 | | | | — | | | | 10,860 | |
Other operating expense | | | — | | | 6,000 | | | | — | | | | 6,000 | |
Depreciation, depletion, amortization and impairment | | | — | | | 43,220 | | | | — | | | | 43,220 | |
Income from operations | | | (1 | ) | | 5,525 | | | | — | | | | 5,524 | |
Interest expense, net | | | — | | | (30,281 | ) | | | — | | | | (30,281 | ) |
Other non-operating income | | | 70 | | | 4,222 | | | | — | | | | 4,292 | |
Other non-operating expense | | | — | | | (1,619 | ) | | | — | | | | (1,619 | ) |
Income (loss) before income taxes | | | 69 | | | (22,153 | ) | | | — | | | | (22,084 | ) |
Income tax provision (benefit) | | | — | | | 1,230 | | | | — | | | | 1,230 | |
Equity in earnings of subsidiaries | | | (23,383 | ) | | — | | | | 23,383 | | | | — | |
Net income (loss) | | $ | (23,314 | ) | $ | (23,383 | ) | | $ | 23,383 | | | $ | (23,314 | ) |
Unaudited Condensed Consolidating Statement of Cash Flows |
For the year ended December 31, 2008 |
| (in thousands) | | Parent Issuer | | Subsidiary Guarantors | | | Consolidating Entries | | | Total | |
| | | | |
Net cash flows provided by operating activities | | $ | 106,073 | | $ | 75,078 | | | $ | — | | | $ | 181,151 | |
| CASH FLOWS FROM INVESTING ACTIVITIES: | | | | | | | | | | | | | | | |
Additions to property, plant and equipment | | | (128 | ) | | (66,613 | ) | | | — | | | | (66,741 | ) |
Purchase of intangible assets | | | — | | | (2,975 | ) | | | — | | | | (2,975 | ) |
Investment in partnerships | | | — | | | (3,936 | ) | | | — | | | | (3,936 | ) |
Acquisitions, net of cash acquired | | | (857 | ) | | (261,388 | ) | | | — | | | | (262,245 | ) |
Proceeds from sale of asset | | | — | | | 1,294 | | | | — | | | | 1,294 | |
| Contributions to subsidiaries | | | (261,981 | ) | | — | | | | 261,981 | | | | — | |
| Net cash flows provided by (used in) investing activities | | | (292,966 | ) | | (333,618 | ) | | | 261,981 | | | | (334,603 | ) |
| CASH FLOWS FROM FINANCING ACTIVITIES: | | | | | | | | | | | | | | | |
Proceeds from long-term debt | | | 432,128 | | | — | | | | — | | | | 432,128 | |
Repayment of long-term debt | | | (199,814 | ) | | — | | | | — | | | | (199,814 | ) |
Proceeds from derivative contracts | | | — | | | (11,063 | ) | | | — | | | | (11,063 | ) |
Payment of debt issuance costs | | | (789 | ) | | — | | | | — | | | | (789 | ) |
Contributions from parent | | | — | | | 261,981 | | | | (261,981 | ) | | | — | |
Distributions to members and affiliates | | | (117,646 | ) | | — | | | | — | | | | (117,646 | ) |
| Net cash flows provided by (used in) financing activities | | | 113,879 | | | 250,918 | | | | (261,981 | ) | | | 102,816 | |
| Net (decrease) increase in cash and cash equivalents | | | (43,014 | ) | | (7,622 | ) | | | — | | | | (50,636 | ) |
Cash and cash equivalents at beginning of year | | | 72,286 | | | (3,734 | ) | | | — | | | | 68,552 | |
Cash and cash equivalents at end of year | | $ | 29,272 | | $ | (11,356 | ) | | $ | — | | | $ | 17,916 | |
Unaudited Condensed Consolidating Statement of Cash Flows |
For the year ended December 31, 2007 |
| (in thousands) | | Parent Issuer | | Subsidiary Guarantors | | | Consolidating Entries | | | Total | |
| | | | |
Net cash flows provided by operating activities | | $ | 203,468 | | $ | (96,523 | ) | | $ | — | | | $ | 106,945 | |
| CASH FLOWS FROM INVESTING ACTIVITIES: | | | | | | | | | | | | | | | |
Additions to property, plant and equipment | | | — | | | (66,116 | ) | | | — | | | | (66,116 | ) |
Purchase of intangible assets | | | — | | | (2,048 | ) | | | — | | | | (2,048 | ) |
Acquisitions, net of cash acquired | | | (421 | ) | | (407,205 | ) | | | — | | | | (407,626 | ) |
Contributions to subsidiaries | | | (427,618 | ) | | — | | | | 427,618 | | | | — | |
| Net cash flows provided by (used in) investing activities | | | (428,039 | ) | | (475,369 | ) | | | 427,618 | | | | (475,790 | ) |
| CASH FLOWS FROM FINANCING ACTIVITIES: | | | | | | | | | | | | | | | |
Proceeds from long-term debt | | | 567,069 | | | 173,401 | | | | — | | | | 740,470 | |
Repayment of long-term debt | | | (567,069 | ) | | (12,062 | ) | | | — | | | | (579,131 | ) |
Proceeds from derivative contracts | | | — | | | (1,667 | ) | | | — | | | | (1,667 | ) |
Payment of debt issuance costs | | | (4,280 | ) | | — | | | | — | | | | (4,280 | ) |
Proceeds from equity issuances | | | 331,500 | | | — | | | | — | | | | 331,500 | |
Payment of offering costs | | | (381 | ) | | — | | | | — | | | | (381 | ) |
Repurchase of common units | | | (154 | ) | | — | | | | — | | | | (154 | ) |
Contributions from parent | | | — | | | 427,618 | | | | (427,618 | ) | | | — | |
Distributions to members and affiliates | | | (59,541 | ) | | — | | | | — | | | | (59,541 | ) |
Net cash flows provided by financing activities | | | 267,144 | | | 587,290 | | | | (427,618 | ) | | | 426,816 | |
| Net increase (decrease) in cash and cash equivalents | | | 42,573 | | | 15,398 | | | | — | | | | 57,791 | |
Cash and cash equivalents at beginning of year | | | 29,713 | | | (19,132 | ) | | | — | | | | 10,581 | |
Cash and cash equivalents at end of year | | $ | 72,286 | | $ | (3,734 | ) | | $ | — | | | $ | 68,552 | |
Unaudited Condensed Consolidating Statement of Cash Flows |
For the year ended December 31, 2006 |
| (in thousands) | | Parent Issuer | | Subsidiary Guarantors | | | Consolidating Entries | | | Total | |
| | | | |
Net cash flows provided by operating activities | | $ | 44,780 | | $ | 10,214 | | | $ | — | | | $ | 54,994 | |
| CASH FLOWS FROM INVESTING ACTIVITIES: | | | | | | | | | | | | | | | |
Additions to property, plant and equipment | | | — | | | (38,416 | ) | | | — | | | | (38,416 | ) |
Purchase of intangible assets | | | — | | | (2,918 | ) | | | — | | | | (2,918 | ) |
Acquisitions, net of cash acquired | | | — | | | (101,182 | ) | | | — | | | | (101,182 | ) |
Other | | | — | | | 7,643 | | | | — | | | | 7,643 | |
| Net cash flows provided by (used in) investing activities | | | — | | | (134,873 | ) | | | — | | | | (134,873 | ) |
| CASH FLOWS FROM FINANCING ACTIVITIES: | | | | | | | | | | | | | | | |
Proceeds from long-term debt | | | — | | | 10,366 | | | | — | | | | 10,366 | |
Repayment of long-term debt | | | — | | | (15,001 | ) | | | — | | | | (15,001 | ) |
Proceeds from revolver | | | — | | | 12,500 | | | | — | | | | 12,500 | |
Repayment of revolver | | | — | | | (10,600 | ) | | | — | | | | (10,600 | ) |
Proceeds from derivative contracts | | | — | | | 978 | | | | — | | | | 978 | |
Proceeds from equity issuances | | | 248,067 | | | — | | | | — | | | | 248,067 | |
Payment of debt issuance costs | | | — | | | (2,939 | ) | | | — | | | | (2,939 | ) |
Payment of offering costs | | | (3,723 | ) | | — | | | | — | | | | (3,723 | ) |
Contributions by members | | | — | | | 98,540 | | | | — | | | | 98,540 | |
Distributions to members and affiliates | | | (259,411 | ) | | (7,689 | ) | | | — | | | | (267,100 | ) |
Net cash flows provided by financing activities | | | (15,067 | ) | | 86,155 | | | | — | | | | 71,088 | |
| Net increase (decrease) in cash and cash equivalents | | | 29,713 | | | (38,504 | ) | | | — | | | | (8,791 | ) |
Cash and cash equivalents at beginning of year | | | — | | | 19,372 | | | | — | | | | 19,372 | |
Cash and cash equivalents at end of year | | $ | 29,713 | | $ | (19,132 | ) | | $ | — | | | $ | 10,581 | |
NOTE 21. SUPPLEMENTAL OIL AND GAS INFORMATION (UNAUDITED)
Oil and Natural Gas Reserves
Users of this information should be aware that the process of estimating quantities of proved and proved developed oil and natural gas reserves is very complex, requiring significant subjective decisions in the evaluation of all available geological, engineering and economic data for each reservoir. The data for a given reservoir may also change substantially over time as a result of numerous factors including, but not limited to, additional development activity, evolving production history and continual reassessment of the viability of production under varying economic conditions. As a result, revisions to existing reserve estimates may occur from time to time. Although every reasonable effort is made to ensure the reported reserve estimates represent the most accurate assessments possible, the subjective decisions and variances in available data for various reservoirs make these estimates generally less precise than other estimates included in the financial statement disclosures.
Proved reserves represent estimated quantities of natural gas, crude oil and condensate that geological and engineering data demonstrate, with reasonable certainty, to be recoverable in future years from known reservoirs under economic and operating conditions in effect when the estimates were made. Proved developed reserves are proved reserves expected to be recovered through wells and equipment in place and under operating methods used when the estimates were made.
Estimates of proved developed reserves as of December 31, 2008, were based on estimates made by our independent engineers, Cawley, Gillespie & Associates, Inc (“Cawley Gillespie”). In 2008, Cawley Gillespie was engaged by and provided their reports to our senior management team. In order to enhance our controls regarding reserve reporting, we have recently modified the charter of the Audit Committee to include the right to engage the independent engineers, in consideration of management’s recommendations. For 2009, management has recommended, and the Audit Committee has approved our continued engagement with Cawley Gillespie.
In January 2009, the SEC issued new rules for reserves reporting. These rules are not currently effective, and the SEC has specifically prohibited early adoption of them. We will adopt them in our 2009 annual report, however. The new rules include several significant changes, such as the use of average (rather than year-end), the optional inclusion of probable and possible reserves, and the option to include price sensitivities.
We make representations to the independent engineers that we have provided all relevant operating data and documents, and in turn, we review the reserve reports provided by the independent engineers to ensure completeness and accuracy. Our Chief Executive Officer makes the final decision on booked proved reserves by incorporating the proved reserves from the independent engineers’ reports.
Our relevant management controls over proved reserve attribution, estimation and evaluation include:
| | • | Controls over and processes for the collection and processing of all pertinent operating data and documents needed by our independent reservoir engineers to estimate our proved reserves; and |
| | • | Engagement of well qualified and independent reservoir engineers for review of our operating data and documents and preparation of reserve reports annually in accordance with all SEC reserve estimation guidelines. |
There are numerous uncertainties inherent in estimating quantities of proved reserves and in projecting the future rates of production and timing of development expenditures. Reserve data represent estimates only and should not be construed as being exact. Moreover, the standardized measure should not be construed as the current market value of the proved oil and natural gas reserves or the costs that would be incurred to obtain equivalent reserves. A market value determination would include many additional factors including (a) anticipated future changes in natural gas and crude oil prices, production and development costs, (b) an allowance for return on investment, (c) the value of additional reserves, not considered proved at present, which may be recovered as a result of further exploration and development activities, and (d) other business risk.
The following table illustrates the Company’s estimated net proved reserves, including changes, and proved developed reserves for the periods indicated, as estimated by Cawley, Gillespie and Associates. Natural gas liquids are included in oil reserves. Oil and natural gas liquids are based on the December 31, 2008 West Texas Intermediate posted price of $44.60 per barrel and are adjusted by lease for quality, transportation fees, and regional price differentials. Gas prices are based on a December 31, 2008 Henry Hub spot market price of $5.63 per MMBtu and are adjusted by lease for energy content, transportation fees, and regional price differentials. All prices are held constant in accordance with SEC guidelines. All of the Company’s reserves are located in the United States.
| | | | | | | | | | |
| | | Proved Reserves | |
| | | Oil (MBbls) | | | Gas (MMcf) | | | Natural Gas Liquids (MBbls) | |
Proved reserves, January 1, 2007 | | | — | | | | — | | | | — | |
Extensions and discoveries | | | — | | | | — | | | | — | |
Purchase of minerals in place | | | 9,816 | | | | 48,336 | | | | 5,727 | |
Production | | | (442 | ) | | | (2,456 | ) | | | (227 | ) |
Sale of minerals in place | | | — | | | | — | | | | — | |
Revision of previous estimates | | | 707 | | | | (1,237 | ) | | | 242 | |
Proved reserves, December 31, 2007 | | | 10,081 | | | | 44,643 | | | | 5,743 | |
| | | | |
| | | Proved Developed Reserves | |
| | | Oil (MBbls) | | | Gas (MMcf) | | | Natural Gas Liquids (MBbls) | |
December 31, 2007 | | | 9,634 | | | | 38,868 | | | | 5,437 | |
| | | | | | | | | | | | | |
| | | | | | | | | | |
| | | Proved Reserves | |
| | | Oil (MBbls) | | | Gas (MMcf) | | | Natural Gas Liquids (MBbls) | |
Proved reserves, January 1, 2008 | | | 10,081 | | | | 44,643 | | | | 5,743 | |
Extensions and discoveries | | | 189 | | | | 3,566 | | | | 45 | |
Purchase of minerals in place | | | 3,513 | | | | 8,157 | | | | 1,432 | |
Production | | | (988 | ) | | | (5,400 | ) | | | (508 | ) |
Sale of minerals in place | | | — | | | | — | | | | — | |
Revision of previous estimates | | | (2,789 | ) | | | (6,378 | ) | | | (1,073 | ) |
Proved reserves, December 31, 2008 | | | 10,006 | | | | 44,588 | | | | 5,639 | |
| | | | |
| | | Proved Developed Reserves | |
| | | Oil (MBbls) | | | Gas (MMcf) | | | Natural Gas Liquids (MBbls) | |
December 31, 2008 | | | 10,568 | | | | 40,908 | | | | 5,391 | |
| | | | | | | | | | | | | |
In 2008, we experienced significant negative revisions to our proved reserves. These revisions can be attributed to technical factors and economic factors. Revisions due to economic factors are primarily due to the dramatic decline in commodity prices that occurred between December 31, 2007 and December 31, 2008. We estimate that approximately 3,782 mboe of the 2008 negative reserve revisions can be attributed to price changes.
Capitalized Costs Relating to Oil and Natural Gas Producing Activities
The following table illustrates the total amount of capitalized costs relating to oil and natural gas producing activities and the total amount of related accumulated depreciation, depletion and amortization (in thousands) at December 31, 2008 and 2007.
| | | | | | | |
| | | December 31, 2008 | | | December 31, 2007 | |
Evaluated properties | | $ | 593,520 | | | $ | 461,884 | |
Unevaluated properties—excluded from depletion | | | 73,622 | | | | 66,023 | |
Gross oil and gas properties | | | 667,142 | | | | 527,907 | |
Accumulated depreciation, depletion, amortization | | | (52,771 | ) | | | (23,865 | ) |
Impairment | | | (108,758 | ) | | | — | |
Net oil and gas properties | | $ | 505,613 | | | $ | 504,042 | |
| | | | | | | | | |
Costs Incurred in Oil and Natural Gas Property Acquisition, Exploration and Development Activities
Costs incurred in property acquisition, exploration and development activities were as follows (in thousands) for the years ended December 31, 2008 and 2007:
| | | | | | | |
| | | For the Year Ended December 31, | |
| | | 2008 | | | 2007 | |
Property acquisition costs, proved | | $ | 110,747 | | | $ | 464,204 | |
Property acquisition costs, unproved | | | 7,597 | | | | 66,023 | |
Exploration and extension well costs | | | 1,610 | | | | — | |
Development costs | | | 12,294 | | | | 3,429 | |
Total costs | | $ | 132,248 | | | $ | 533,656 | |
| | | | | | | | | |
Our exploration and extension well costs are primarily related to low risk drilling around our existing fields.
Standardized Measure of Discounted Future Net Cash Flows Relating to Proved Oil and Natural Gas Reserves
The following information has been developed utilizing SFAS 69, Disclosures about Oil and Gas Producing Activities, (SFAS 69) procedures and is based on oil and natural gas reserves estimated by the Company’s independent reserves engineer. It can be used for some comparisons, but should not be the only method used to evaluate the Company or its performance. Further, the information in the following table may not represent realistic assessments of future cash flows, nor should the Standardized Measure of Discounted Future Net Cash Flow be viewed as representative of the current value of the Company.
The Company believes that the following factors should be taken into account when reviewing the following information:
| | • | future costs and selling prices will probably differ from those required to be used in these calculations; |
| | • | due to future market conditions and governmental regulations, actual rates of production in future years may vary significantly from the rate of production assumed in the calculations; and |
| | • | a 10% discount rate may not be reasonable as a measure of the relative risk inherent in realizing future net oil and natural gas revenues. |
Under the Standardized Measure, future cash inflows were estimated by applying year-end oil and natural gas prices to the estimated future production of year-end proved reserves. Estimates of future income taxes are computed using current statutory income tax rates including consideration for estimated future statutory depletion and tax credits. The resulting net cash flows are reduced to present value amounts by applying a 10% discount factor. Use of a 10% discount rate and year-end prices are required by SFAS 69.
In our Standardized Measure calculations we have excluded the future revenues that would be associated with the sales of sulfur since it is not a hydrocarbon and SFAS 69 does not allow for the inclusion of non-hydrocarbon revenues. Also, we have included the expected impact of the retained revenue interests as a revenue reduction.
The Standardized Measure is as follows (in thousands) as of December 31, 2008 and 2007:
| | | | | | | |
| | | December 31, 2008 | | | December 31, 2007 | |
Future cash inflows | | $ | 788,154 | | | $ | 1,565,539 | |
Future production costs | | | (322,931 | ) | | | (500,240 | ) |
Future development costs | | | (60,189 | ) | | | (10,045 | ) |
Future net cash flows before income taxes | | | 405,034 | | | | 1,055,254 | |
Future income tax benefit | | | 1,895 | | | | — | |
Future net cash flows before 10% discount | | | 406,929 | | | | 1,055,254 | |
10% annual discount for estimated timing of cash flows | | | (197,185 | ) | | | (498,294 | ) |
Standardized measure of discounted future net cash flows | | $ | 209,744 | | | $ | 556,960 | |
| | | | | | | | | |
Changes in Standardized Measure of Discounted Future Net Cash Flows Relating to Proved Oil and Natural Gas Reserves
The following is a summary of the changes in the Standardized Measure of discounted future net cash flows for the Company’s proved oil and natural gas reserves for the years ended December 31, 2008 and 2007 (in thousands).
| | | | | | | |
| | | For the Year Ended December 31, | |
| | | 2008 | | | 2007 | |
Beginning of year | | $ | 556,960 | | | $ | — | |
Sale of oil and gas produced, net of production costs | | | (127,125 | ) | | | (48,294 | ) |
Net changes in prices and production costs | | | (293,537 | ) | | | 99,252 | |
Extensions, discoveries and improved recovery, less related costs | | | 8,842 | | | | — | |
Previously estimated development costs incurred during the period | | | (12,294 | ) | | | 888 | |
Net changes in future development costs | | | 11,766 | | | | — | |
Revisions of previous quantity estimates | | | (49,546 | ) | | | 26,110 | |
Purchases of property | | | 45,239 | | | | 459,041 | |
Sales of property | | | — | | | | — | |
Accretion of discount | | | 50,531 | | | | 21,274 | |
Net changes in income taxes | | | 1,033 | | | | — | |
Other | | | 17,875 | | | | (1,311 | ) |
End of year | | $ | 209,744 | | | $ | 556,960 | |
| | | | | | | | | |
Results of Operations
The following are the results of operations for the Partnership’s oil and natural gas producing activities for the year ended December 31, 2008 and 2007 (in thousands):
| | | | | | | |
| | | For the Year Ended December 31, | |
| | | 2008 | | | 2007 | |
| Revenues | | $ | 166,948 | | | $ | 64,934 | |
| Costs and expenses: | | | | | | | | |
| Production costs | | | 39,823 | | | | 16,640 | |
| General and administrative | | | 4,282 | | | | 1,593 | |
| Depreciation, depletion and amortization | | | 52,771 | | | | 24,262 | |
| Impairment | | | 108,758 | | | | 5,749 | |
| Total costs and expenses | | | 205,634 | | | | 48,244 | |
| Results of operations | | $ | (38,686 | ) | | $ | 16,690 | |
| | | | | | | | | |
