SECURITIES AND EXCHANGE COMMISSION
Washington, D.C. 20549
Form 10-K
| x | ANNUAL REPORT PURSUANT TO SECTION 13 OR 15(d) OF THE SECURITIES EXCHANGE ACT OF 1934 |
For the fiscal year ended December 31, 2009
OR
| ¨ | TRANSITION REPORT PURSUANT TO SECTION 13 OR 15(d) OF THE SECURITIES EXCHANGE ACT OF 1934 |
For the transition period from ________ to ________
Commission File No. 001-33016
EAGLE ROCK ENERGY PARTNERS, L.P.
(Exact Name of Registrant as Specified in Its Charter)
| | |
| Delaware | 68-0629883 |
(State or other jurisdiction of incorporation or organization) | (I.R.S. Employer Identification Number) |
1415 Louisiana Street, Suite 2700
Houston, Texas 77002
(Address of principal executive offices, including zip code)
(281) 408-1200
(Registrant’s telephone number, including area code)
Securities registered pursuant to Section 12(b) of the Act:
| | |
Title of Each Class | Name of Each Exchange on Which Registered |
| Common Units of Limited Partner Interests | NASDAQ Global Select Market |
Securities registered pursuant to Section 12(g) of the Act:
None
Indicate by check mark if the registrant is a well-known seasoned issuer, as defined in Rule 405 of the Securities Act. Yes ¨ No x
Indicate by check mark if the registrant is not required to file reports pursuant to Section 13 or Section 15(d) of the Exchange Act. Yes ¨ No x
Indicate by check mark whether the registrant (1) has filed all reports required to be filed by Section 13 or 13(d) of the Securities Exchange Act of 1934 during the preceding 12 months (or for such shorter period that the registrants was required to file such reports), and (2) has been subject to such filing requirements for the past 90 days. Yes x No ¨
Indicate by check mark whether the registrant has submitted electronically and posted on its corporate website, if any, every Interactive Data File required to be submitted and posted pursuant to Rule 405 of Regulation S-T (§232.405 of this chapter) during the preceding 12 months (or for such shorter period that the registrant was required to submit and post such files). Yes ¨ No ¨
Indicate by check mark if disclosure of delinquent filers pursuant to Item 405 of Regulation S-K (§229.405) is not contained herein, and will not be contained, to the best of registrant’s knowledge, in definitive proxy or information statements incorporated by reference in Part III of this Form 10-K or any amendment to this Form 10-K. x
Indicate by check mark whether the registrant is a large accelerated filer, an accelerated filer, a non-accelerated filer, or a smaller reporting company. See the definitions of “large accelerated filer,” “accelerated filer” and “smaller reporting company” in Rule 12b-2 of the Exchange Act. (Check one):
| | |
Large accelerated filer ¨ | Accelerated Filer x |
Non-accelerated Filer ¨ | Smaller reporting company ¨ |
(Do not check if a smaller reporting company)
Indicate by check mark whether the registrant is a shell company (as defined in Rule 12b-2 of the Exchange Act). Yes ¨ No x
As of June 30, 2009, the aggregate market value of the registrant’s common units held by non-affiliates of the registrant was $130,901,290, based on the closing sale price as reported on NASDAQ Global Select Market.
The issuer had 55,980,185 common units and 21,536,046 subordinated and general partner units outstanding as of March 1, 2010.
DOCUMENTS INCORPORATED BY REFERENCE:
None
| | | |
| | | Page |
| PART I |
| Item 1. | Business | 1 |
| Item 1A. | Risk Factors | 38 |
| Item 1B. | Unresolved Staff Comments | 53 |
| Item 2. | Properties | 53 |
| Item 3. | Legal Proceedings | 53 |
| Item 4. | Reserved | 53 |
| PART II |
| Item 5. | Market for Registrant’s Common Equity, Related Unitholder Matters and Issuer Purchases of Equity Securities | 54 |
| Item 6. | Selected Financial Data | 56 |
| Item 7. | Management’s Discussion and Analysis of Financial Condition and Results of Operations | 62 |
| Item 7A. | Quantitative and Qualitative Disclosures About Market Risk | 92 |
| Item 8. | Financial Statements and Supplementary Data | 96 |
| Item 9. | Changes in and Disagreements With Accountants on Accounting and Financial Disclosure | 96 |
| Item 9A. | Controls and Procedures | |
| Item 9B. | Other Information | 98 |
| PART III |
| Item 10. | Directors, Executive Officers and Corporate Governance | 98 |
| Item 11. | Executive Compensation | 103 |
| Item 12. | Security Ownership of Certain Beneficial Owners and Management and Related Unitholder Matters | 113 |
| Item 13. | Certain Relationships and Related Transactions, and Director Independence | 113 |
| Item 14. | Principal Accountant Fees and Services | 118 |
| PART IV |
| Item 15. | Exhibits and Financial Statement Schedules | 119 |
FORWARD-LOOKING STATEMENTS
This report may include forward-looking statements. All statements, other than statements of historical facts, included in this report that address activities, events or developments that we expect, believe or anticipate will or may occur in the future are forward-looking statements. These statements are based on certain assumptions made by us based on our experience and perception of historical trends, current conditions, expected future developments and other factors we believe are appropriate under the circumstances. Such statements are subject to a number of assumptions, risks and uncertainties, many of which are beyond our control, which may cause our actual results to differ materially from those implied or expressed by the forward-looking statements. For a complete description of these risks, please see our risk factors set forth under Item 1A of this annual report. These factors include but are not limited to:
| · | Risks Related to the Recapitalization and Related Transactions; |
| · | Drilling and geological / exploration risks; |
| · | Assumptions regarding oil and natural gas reserve levels and costs to exploit and timing of development; |
| · | Ability to obtain credit and access capital markets; |
| · | Ability to remain in compliance with the covenants set forth in our revolving credit facility; |
| · | Conditions in the securities and/or capital markets; |
| · | Future processing volumes and throughput; |
| · | Loss of significant customers; |
| · | Availability and cost of processing and transportation of natural gas liquids (“NGLs”); |
| · | Competition in the oil and natural gas industry; |
| · | Relevant legislative or regulatory changes, including retroactive royalty or production tax regimes, changes in environmental regulation, environmental risks and liability under federal, state and foreign environmental laws and regulations; |
| · | Ability to make favorable acquisitions and integrate operations from such acquisitions; |
| · | Shortages of personnel and equipment; |
| · | Increases in interest rates; |
| · | Creditworthiness of our counterparties; |
| · | Weather, including the occurrence of any adverse weather conditions and/or natural disasters affecting our business; |
| · | Any other factors that impact or could impact the exploration of oil or natural gas resources, including but not limited to the geology of a resource, the total amount and costs to develop recoverable reserves, legal title, regulatory, natural gas administration, marketing and operations factors relating to the extraction of oil and natural gas; and |
| · | Tax risk associated with pass-through investment, including potential reduction in tax shield or creation of phantom income in the event distributions are not enough to support the tax burden. |
GLOSSARY OF OIL AND GAS TERMS
The following is a description of the meanings of some of the oil and gas industry terms that may be used in this report. The definitions of proved reserves, proved developed reserves, and proved undeveloped reserves have been abbreviated from the applicable definitions contained in Rule 4-10(a) (2-4) of Regulation S-X.
Bbl: One stock tank barrel, or 42 U.S. gallons liquid volume, of crude oil or other liquid hydrocarbons.
Bbl/d: One stock tank barrel, or 42 U.S. gallons liquid volume, of crude oil or other liquid hydrocarbons per day.
Bbtu: One billion British thermal units.
Bcf: One billion cubic feet of natural gas.
Bcf/d: One billion cubic feet of natural gas per day.
Bcfe: One billion cubic feet of natural gas equivalent, using a ratio of six Mcf of natural gas to one Bbl of crude oil and NGLs.
Boe: One barrel of oil equivalent, determined using a ratio of six Mcf of natural gas to one Bbl of crude oil.
Boe/d: One barrel of oil equivalent, determined using a ratio of six Mcf of natural gas to one Bbl of crude oil and NGLs per day.
btu: British thermal unit.
development well: A well drilled within the proved area of a natural gas or oil reservoir to the depth of a stratigraphic horizon known to be productive.
dry gas: Natural gas that does not require plant processing prior to delivery to the interstate or intrastate pipeline systems.
dry hole: A well found to be incapable of producing hydrocarbons in sufficient quantities such that proceeds from the sale of such production would exceed production expenses, taxes and future capital.
equity liquids or gallons: Natural gas liquid and condensate production that equates to an entity’s contractual share of the production.
exploitation: A drilling, recompletion, workover or other project which may target proven or unproven reserves (such as probable or possible reserves), but which generally has a lower risk than with exploration projects.
exploratory well: A well drilled to find and produce oil or natural gas reserves in an unproved area, to find new reservoir in a field previously found to be productive or oil or natural gas in another reservoir or to extend a known reservoir.
fee-based arrangements: Under these arrangements, the oil and gas producer pays to the gatherer a fixed cash fee per unit volume for performing the gathering and processing service. This fee is directly related to the volume of natural gas that flows through the gatherer’s pipeline systems and is not directly dependent on commodity prices.
fee mineral or fee mineral interest: A perpetual ownership of all or a portion of the oil, natural gas and other naturally-occurring substances that lie beneath the surface of the earth in a specific area.
field: An area consisting of a single reservoir or multiple reservoirs, all grouped on or related to the same individual geological structural feature and/or stratigraphic condition.
finding and development cost (F&D): Total capital costs, including leasing and exploration expenses, spent to place reserves into production; often expressed as a unit cost, such as $/Mcfe or $/Boe, which are derived by dividing the costs by the reserves.
fixed recovery arrangements: Under these arrangements, raw natural gas is gathered from producers at the wellhead, transported through our gathering system, and processed and sold as processed natural gas and/or NGLs at prices based on published index prices. The price paid to the producers is based on an agreed to theoretical product recovery factor to be applied against the wellhead production and then a percentage of the theoretical proceeds based on an index or actual sales prices multiplied to the theoretical production. To the extent that the actual recoveries differ from the theoretical product recovery factor, this will affect the margin.
frac spread: The difference between the value of the NGLs produced and the cost of the processed gas used to replace the thermal equivalent value of those NGLs in a keep-whole arrangement.
gpm: Gallons of natural gas liquids per million cubic feet of gas.
gross acres or gross wells: The total acres or wells, as the case may be, in which a working interest is owned.
Hp: Horsepower.
keep-whole arrangements: Under these arrangements, raw natural gas is processed to extract NGLs and pay to the producer the full thermal equivalent volume of raw natural gas received from the producer in the form of either processed natural gas or its cash equivalent. The processors are generally entitled to retain the processed NGLs and to sell them for their account. Accordingly, the margin is a function of the frac spread.
LT/d: Long tons per day.
MBbls: One thousand barrels of crude oil or other liquid hydrocarbons.
MBO/d: One thousand barrels of crude oil or other liquid hydrocarbons per day.
MBoe: One thousand barrels of oil equivalent, determined using a ratio of six Mcf of natural gas to one Bbl of crude oil.
MBoe/d: One thousand barrels of oil equivalent per day.
Mcf: One thousand cubic feet of natural gas.
Mcf/d: One thousand cubic feet of natural gas per day.
Mcfe: One thousand cubic feet of natural gas equivalent, determined using a ratio of six Mcf of natural gas to one Bbl of crude oil and NGLs.
MMBbls: One million barrels of crude oil or other liquid hydrocarbons.
MMBoe: One million barrels of oil equivalent.
MMBtu: One million British thermal units.
MMcf: One million cubic feet of natural gas.
MMcf/d: One million cubic feet of natural gas per day.
natural gas liquids or NGLs: The combination of ethane, propane, isobutene, normal butane and natural gasoline that may be removed from natural gas as a liquid under certain levels of pressure and temperature. Most NGLs are gases at room temperature and pressure.
net acres or net wells: The sum of the fractional working interests owned in gross acres or wells, as the case may be.
NYMEX: New York Mercantile Exchange.
oil: Crude oil and condensate.
overriding royalty or overriding royalty interest: A non-cost bearing interest in the production from a well that is carved out of the working interest. It expires when the underlying oil and/or natural gas lease expires.
percent-of-proceeds arrangements: Under these arrangements, generally raw natural gas is gathered from natural gas producers at the wellhead, moved through the gathering system, processed and sold as processed natural gas and/or NGLs at prices based on published index prices. The price paid to producers is based on an agreed percentage of one of the following: (1) the actual sale proceeds; and (2) the proceeds based on an index price.
probable locations: Locations that are near proved undeveloped locations, but do not meet the definition of a proved location.
productive well: A well that is found to be capable of producing hydrocarbons in sufficient quantities such that proceeds from the sale of such production exceeds production expenses and taxes.
proved developed reserves: Proved reserves that can be expected to be recovered from existing wells with existing equipment and operating methods.
proved locations: Locations that geological and engineering data demonstrate with reasonable certainty to recover reserves in future years from known reservoirs under existing economic and operating conditions.
proved reserves: The estimated quantities of crude oil, natural gas and natural gas liquids which geological and engineering data demonstrate with reasonable certainty to be recoverable in future years from known reservoirs under existing economic and operating conditions, i.e., prices and costs as of the date the estimate is made. Prices include consideration of changes in existing prices provided only by contractual arrangements, but not on escalations based on future conditions.
proved undeveloped reserves or PUDs. Proved reserves that are expected to be recovered from new wells on undrilled acreage or from existing wells where a relatively major expenditure is required for recompletion.
recompletion: The completion for production of an existing wellbore in another formation from that which the well has been previously completed.
reserve life index: The number of years required to produce the proved reserves at the current annual production rate.
reservoir: A porous and permeable underground formation containing a natural accumulation of producible oil and/or natural gas that is confined by impermeable rock or water barriers and is individual and separate from other reserves.
royalty or royalty interest: A non-cost bearing interest in the production from a well that is created from a mineral interest when the minerals are leased to an operator. The royalty interest generally is retained by the mineral interest owner as part of the compensation for leasing the minerals.
standardized measure: The present value of estimated future net revenue to be generated from the production of proved reserves, determined in accordance with the rules and regulations of the SEC (using prices and costs in effect as of the date of estimation), less future development, production and income tax expenses, and discounted at 10% per annum to reflect the timing of future net revenue. Standardized measure does not give effect to derivative transactions.
Tcf: One trillion cubic feet of natural gas.
undeveloped acreage: Lease acreage on which wells have not been drilled or completed to a point that would permit the production of commercial quantities of natural gas or oil regardless of whether or not such acreage contains proved reserves.
unit development cost (UDC): The capital expenditures required to develop proved reserves per unit of reserves added or transferred from undeveloped acreage non-producing acreage to proved developed producing reserves, expressed in $/Mcfe or $/Boe.
West Texas Intermediate or WTI: Light, sweet crude oil with high API gravity and low sulfur content used as the benchmark for U.S. crude oil refining and trading. NYMEX futures contracts for light, sweet crude oil specify the delivery of WTI at Cushing, Oklahoma.
wet gas: Natural gas that requires plant processing in order to meet the interstate and intrastate gas quality specifications.
working interest: The operating interest that gives the owner the right to drill, produce and conduct operating activities on the property/lease and to receive a share of production.
workover: Operations on a producing well to restore or increase production.
In this report, unless the context requires otherwise, references to “Eagle Rock Energy Partners, L.P.,” “Eagle Rock,” the “Partnership,” “we,” “our,” “us,” or like terms, refer to Eagle Rock Energy Partners, L.P. and its subsidiaries. References to our “general partner” refer to Eagle Rock Energy GP, L.P., our general partner, and Eagle Rock Energy G&P, LLC, the general partner of our general partner. References to “Natural Gas Partners” or “NGP” refer to Natural Gas Partners VII, L.P. and Natural Gas Partners VIII, L.P. in the context of any description of our investors, and in other contexts refer to NGP Energy Capital Management, which manages a series of energy investment funds, including Natural Gas Partners VII, L.P. and Natural Gas Partners VIII, L.P. References to the “NGP Investors” refer to Natural Gas Partners and some of our directors and current and former members of our management team. References to “Holdings” or “Eagle Rock Holdings” refer to Eagle Rock Holdings, L.P., the largest holder of our securities (common units and subordinated units) and sole owner of the general partner of our general partner, which is owned by the NGP Investors. References to our “Board of Directors” refer to the board of directors of the general partner of our general partner.
PART I
Overview
We are based in the United States and are a domestically-focused, growth-oriented limited partnership engaged in the business of (i) gathering, compressing, treating, processing and transporting natural gas; fractionating and transporting natural gas liquids (“NGLs”); and marketing natural gas, condensate and NGLs, which collectively we call our “Midstream Business;” (ii) acquiring, developing and producing interests in oil and natural gas properties, which we call our “Upstream Business;” and (iii) acquiring and managing fee mineral, overriding royalty and royalty interests, either through direct ownership or through investment in other partnerships, which we call our “Minerals Business.” We have entered into an agreement to sell our Minerals Business, subject to unitholder approval of certain transactions described under “Recapitalization and Related Transactions” below. If the transactions are approved, we expect to complete the sale in the second quarter of 2010.
Our objective is to grow our business in a manner that increases our potential to distribute cash to our unitholders. To do so, we focus on achieving operational excellence in our businesses and executing accretive low-risk acquisitions and organic growth opportunities. We also may allocate a portion of our cash flows to fund growth-related capital expenditures that would otherwise be paid as distributions. In the first quarter of 2009, because of low commodity prices and decreases in volumes through our systems, we significantly reduced our distribution to preserve cash to pay down debt. Upon completion of the Recapitalization and Related Transactions, if approved by our unitholders, we believe our simplified capital structure and reduced debt levels will improve our potential to distribute cash to our unitholders.
We are uniquely positioned as a publicly-traded partnership, or master limited partnership (“MLP”), that is engaged in both the midstream and upstream sectors of the oil and natural gas value chain. We have an experienced management team with expertise in gathering and processing natural gas, operating oil and natural gas properties and assets, managing mineral interests, and evaluating and executing acquisition opportunities. Generally, our MLP structure gives us a lower cost of capital than a corporation through the avoidance of double taxation of our earnings. Our diversification across our three businesses was adopted to broaden the spectrum of potential acquisition opportunities, give us an advantage in acquiring asset packages that involve both midstream and upstream assets, provide us with a natural hedge on a portion of our natural gas volumes in our Upstream Business (to the extent of the volumes of natural gas purchased by us under our natural gas purchase agreements in our Midstream Business that is not offset by our long position in our Midstream Business), and exploit vertical integration synergies and market intelligence in selected regions of our operations.
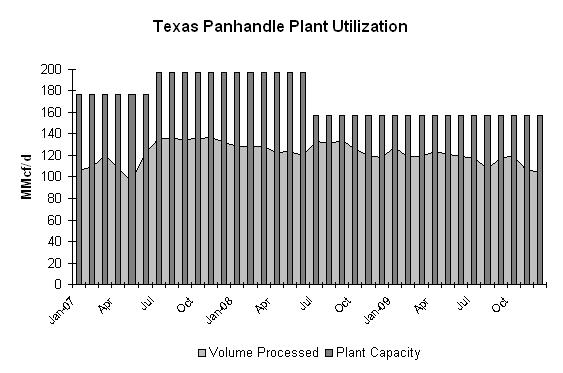
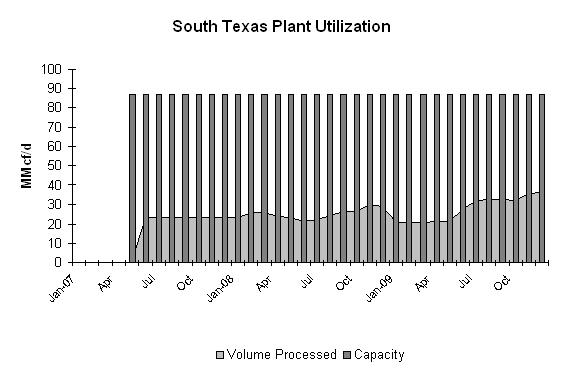
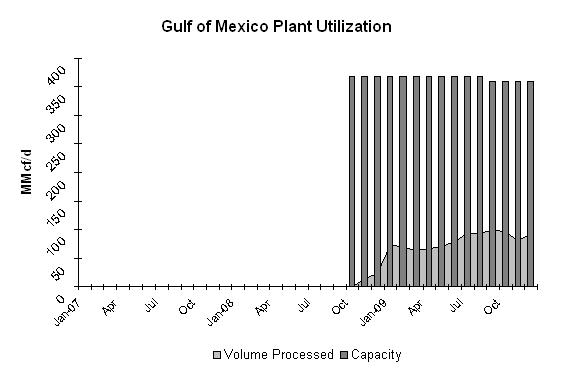
Our Midstream Business is strategically located in five significant natural gas producing regions: (i) the Texas Panhandle; (ii) East Texas/Louisiana; (iii) South Texas; (iv) West Texas; and (v) the Gulf of Mexico. These five regions are productive, mature, natural gas producing basins that have historically experienced significant drilling activity. Eagle Rock’s natural gas gathering systems within these regions are comprised of approximately 5,200 miles of natural gas gathering pipelines with approximately 2,700 well connections, 19 natural gas processing plants with approximately 757 MMcf/d of plant processing capacity and 203,580 horsepower of compression. Our Midstream Business averaged 587 MMcf/d of gathered volumes and 348 MMcf/d of processed volumes during 2009.
Our Upstream Business has long-lived, high working interest properties located in four significant natural gas producing regions: (i) Southern Alabama (where we also operate the associated gathering and processing assets); (ii) East Texas; (iii) South Texas; and (iv) West Texas. As of December 31, 2009, these working interest properties included 260 operated productive wells and 149 non-operated wells with net production to us of approximately 5,300 Boe/d and proved reserves of approximately 33.8 Bcf of natural gas, 7.5 MMBbls of crude oil, and 6.1 MMBbls of natural gas liquids, of which 88% are proved developed.
Our Minerals Business, which is subject to a current sales agreement, is a diversified set of fee mineral, overriding royalty interests and royalty interests comprised of interests in multiple trends over 5.6 million gross mineral acres (430,000 net mineral acres) and interests in over 2,800 productive wells across 17 states in the United States. As of December 31, 2009, these interests had proved reserves of approximately 4.8 Bcf of natural gas and 2.9 MMBbls of crude oil (100% proved developed producing). These interests produced an average of approximately 1,048 Boe/d (net to our interest) during 2009.
We report on our businesses in seven accounting segments. See Note 13 of our consolidated financial statements included in Part II, Item 8. Financial Statements and Supplementary Data starting on page F-1 of this Annual Report.
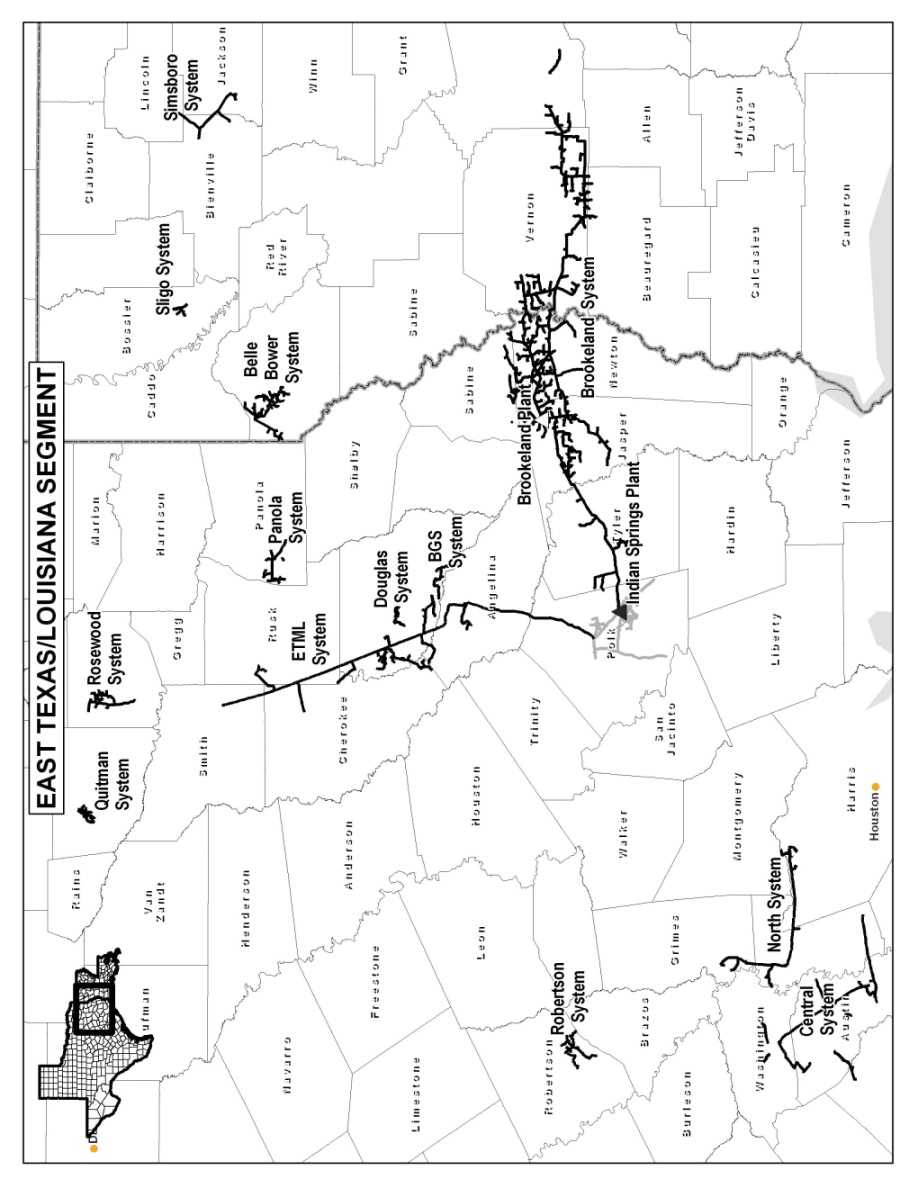
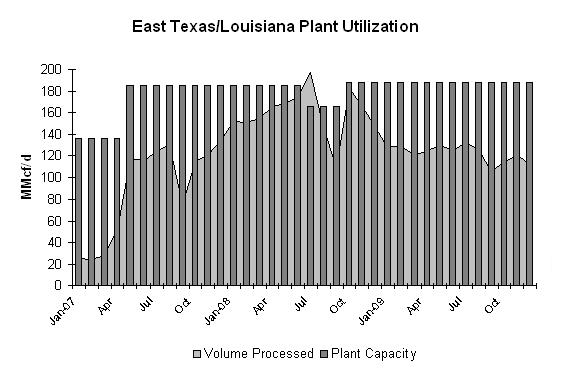
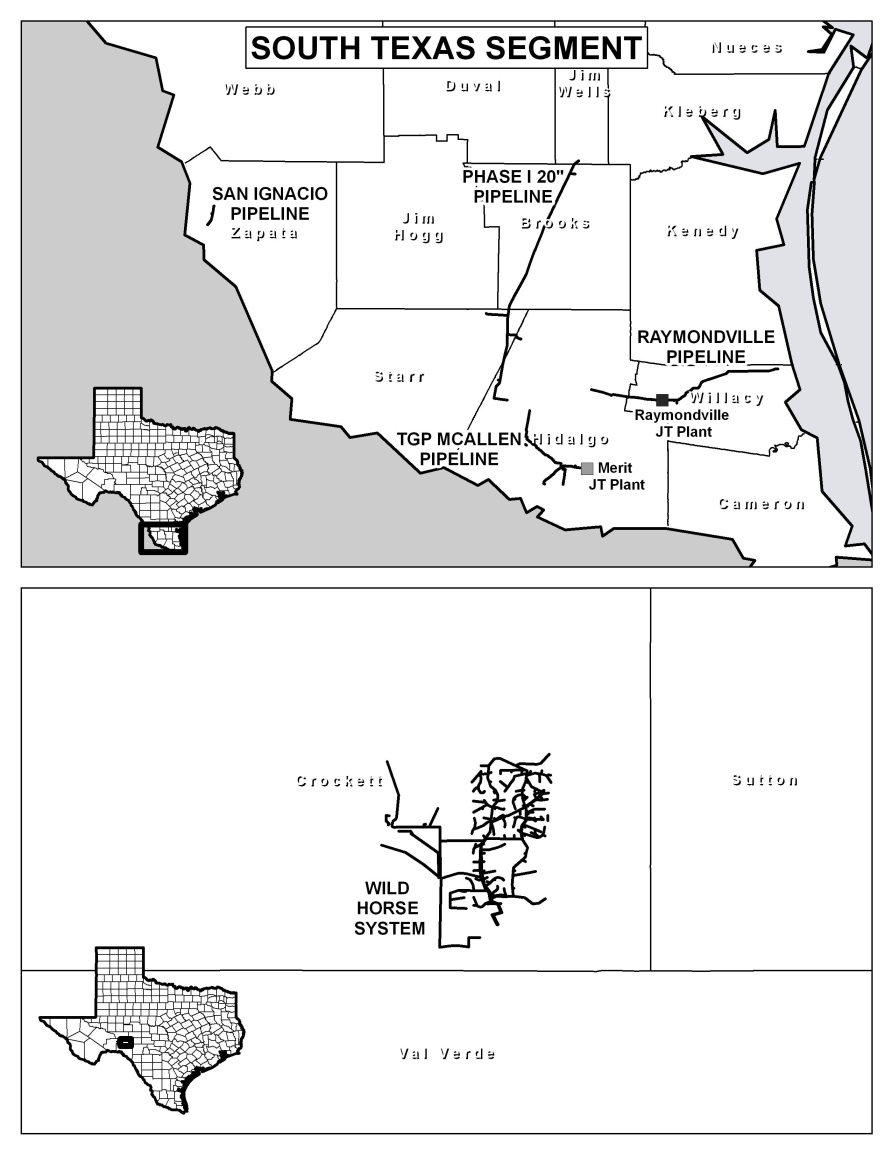
We conduct, evaluate and report on our Midstream Business within four distinct segments—the Texas Panhandle Segment, the East Texas/Louisiana Segment (prior to the filing of our 2007 Annual Report, known as our Southeast Texas and North Louisiana Segment), the South Texas Segment, and the Gulf of Mexico Segment. These Midstream segments include our gathering, processing and related compression assets grouped geographically by major operating area. Our South Texas Segment includes our Wild Horse system in West Texas, and our Gulf of Mexico Segment includes interests in gathering systems and related compression and processing facilities in Southern Louisiana, the Gulf of Mexico and Galveston Bay.
We conduct, evaluate and report our Upstream Business as one segment. Our Upstream Segment includes operated wells in Escambia County, Alabama as well as two treating facilities, one natural gas processing plant and related gathering systems that are inextricably intertwined with ownership and operation of the wells. The Upstream Segment also includes operated and non-operated wells that are primarily located in Rains, Van Zandt, Limestone, Freestone, Henderson, Ward, Crane, Pecos and Atascosa Counties, Texas.
We conduct, evaluate, and report our Minerals Business as one segment. A significant portion of the mineral interests that we own is managed by a non-affiliated private partnership, Black Stone Minerals Company, L.P. (“Black Stone”), that controls the executive rights associated with the minerals. As discussed under “Recapitalization and Related Transactions” below, we have entered into an agreement to sell our Minerals Business to Black Stone, subject to unitholder approval of certain other transactions.
Our final reporting segment is our Corporate Segment, in which we account for our commodity hedging activity and our general corporate costs.
Ownership Structure
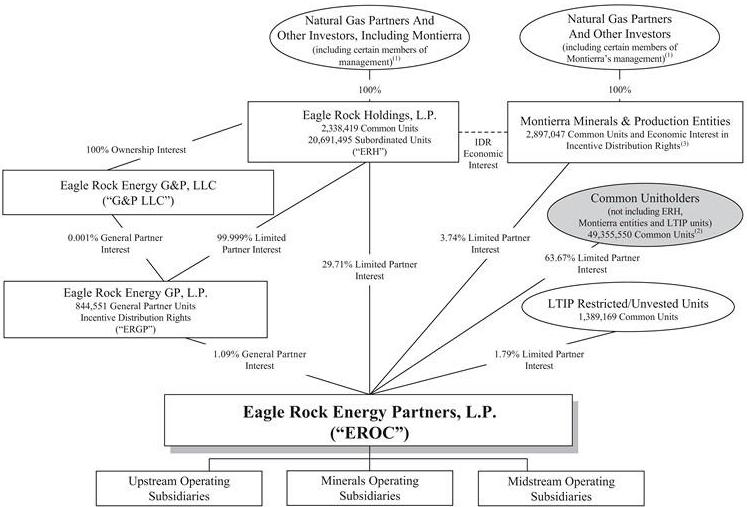
The diagram below depicts our ownership structure as of March 31, 2010. The ownership percentages shown below are calculated on a fully-diluted basis:
| (1) | For a discussion of management’s ownership, see Part III, Item 12 -Security Ownership of Certain Beneficial Owners and Management. |
| (2) | Includes a total of 7,074,580 common units beneficially owned by Natural Gas Partners and its affiliates, but excludes all common units beneficially owned by ERH, Montierra and the general partner of Montierra. |
| (3) | Includes 2,869,556 common units directly owned by Montierra and 28,491 common units directly owned by the general partner of Montierra. Additionally, Montierra owns a 39.34% economic interest in our incentive distribution rights, through an agreement with ERH. |
Recapitalization and Related Transactions
On December 21, 2009, we announced that we, through certain of our affiliates, had entered into definitive agreements with affiliates of NGP and Black Stone to improve our liquidity and simplify our capital structure. The definitive agreements include: (i) a Securities Purchase and Global Transaction Agreement, entered into between Eagle Rock and NGP, including Eagle Rock’s general partner entities controlled by NGP, and (ii) a Purchase and Sale Agreement (the “Minerals Business Sale Agreement”), entered into between Eagle Rock and Black Stone for the sale of our Minerals Business. The Securities Purchase and Global Transaction Agreement was amended on January 12, 2010 to allow for greater flexibility in the payment of the contemplated transaction fee to Holdings, which is controlled by NGP (we refer to the amended Securities Purchase and Global Transaction Agreement throughout this document as the “Global Transaction Agreement”).
The Global Transaction Agreement and Minerals Business Sale Agreement include the following key provisions, which we refer to collectively as the “Recapitalization and Related Transactions.”
| | • | An option in favor of us, exercisable until December 31, 2012, by the issuance of 1,000,000 newly-issued common units, to capture the value of the controlling interest in us through (i) acquiring our general partner, and such general partner’s general partner, and thereby acquiring the 844,551 general partner units outstanding, and (ii) reconstituting our board of directors to allow our common unitholders not affiliated with NGP to elect the majority of our directors (the "GP Acquisiton Option"); |
| | • | The sale of our Minerals Business to Black Stone for total consideration of $174.5 million in cash, subject to customary adjustments; |
| | • | The simplification of our capital structure through the contribution, and resulting cancellation, of our existing incentive distribution rights currently held by our general partner (which is ultimately controlled and 100% beneficially owned by Holdings) and our approximately existing 20.7 million subordinated units currently held by Holdings; |
| | • | A rights offering in which Holdings and NGP will fully participate with respect to approximately 9.5 million common and general partner units owned or controlled by Holdings and NGP as well as with respect to common units it receives as payment of the transaction fee, if any; and |
| | • | For a period of up to five months following unitholder approval of the amended Global Transaction Agreement, NGP’s commitment to back-stop (primarily through Holdings) up to $41.6 million, at a price of $3.10 per unit, of an Eagle Rock equity offering to be undertaken at the sole option of the Partnership’s Conflicts Committee. |
In exchange for NGP’s and Holdings’ contributions and commitments under the Global Transaction Agreement, Eagle Rock will pay Holdings a transaction fee of $29 million in newly-issued common units valued at the greater of (i) 90% of the volume-adjusted trailing 10-day average of the trading price of Eagle Rock’s common units calculated on the 20th day prior to the date of the special meeting to obtain unitholder approval of the Global Transaction Agreement and related proposals; and (ii) $3.10 per common unit. As an alternative, the Conflicts Committee of Eagle Rock’s Board of Directors may, at its sole discretion, cause the Partnership to pay the transaction fee in cash by election made no later than 20 days prior to the date of the special meeting.
Completion of the Recapitalization and Related Transactions is expected to occur in the first half of 2010, subject to customary closing conditions including approval of the Global Transaction Agreement and the transactions contemplated therein, including certain partnership agreement amendments, by a majority of the common units held by non-affiliates of NGP. The transactions contemplated by the Global Transaction Agreement are conditioned upon the consummation of the transactions contemplated in the Minerals Business Sale Agreement, which is conditioned on unitholder approval of the Global Transaction Agreement and related amendments to the Eagle Rock partnership agreement.
We filed a copy of the Minerals Business Sale Agreement, and the Global Transaction Agreement and related ancillary agreements, on Form 8-K with the SEC on December 21, 2009 and January 12, 2010, respectively.
On March 8, 2010, we amended our Revolving Credit Facility to modify the definition of “Change in Control” so the exercise of the GP Acquisition Option would no longer trigger a “Change in Control” event and potential default. In light of the amendment, our Conflicts Committee currently intends to cause us to exercise the GP Acquisition Option as soon as practicable after the required unitholder approvals of the Recapitalization and Related Transactions prior to July 31, 2010, the deadline in the credit facility amendment. See Part II, Item 7. Management’s Discussion and Analysis of Financial Condition and Results of Operations – Overview – Recapitalization and Related Transactions for a discussion of the amendment to our Revolving Credit Facility.
Revised Distribution Policy
If the Recapitalization and Related Transactions are consummated, and subject to market conditions at that time, the Eagle Rock management team intends to recommend to our Board of Directors an increase to the distribution per unit. Currently, we anticipate recommending a quarterly distribution at an annualized rate in the range of $0.40 to $0.60 per unit commencing no later than the distribution with respect to the fourth quarter of 2010. We expect this distribution level will allow us to retain a meaningful percentage of our available cash to fund potential organic growth projects and to further reduce our total leverage ratio (defined in our revolving credit facility as the ratio of our debt to our Adjusted EBITDA) to our targeted range of less than 3.50. Our estimated range for the distribution is subject to change should commodity prices, factors affecting the general business climate or our specific operations differ from our current expectations. All actual distributions paid will be determined and declared at the discretion of our Board of Directors.
If the Recapitalization and Related Transactions are not consummated, and absent other unforeseen events, the Eagle Rock management team does not anticipate recommending to our Board of Directors an increase to the distribution per unit until we have reached our targeted range for our total leverage ratio, either through growth of our Adjusted EBITDA or repayment of debt.
We plan to institute a new distribution policy after we have reached our targeted range for our total leverage ratio. This policy will include a “baseline distribution” that we believe would be sustainable in low commodity price environments. The initial baseline distribution would be established by our Board of Directors and would be adjusted when appropriate to reflect the long-term impact of subsequent significant acquisitions and organic growth projects. Furthermore, under the policy, if we generate distributable cash flow (which we define as Adjusted EBITDA less interest expense, cash taxes and maintenance capital expenditures) in excess of that required to make the baseline distribution, we would distribute 50% of the excess distributable cash flow above the amount required to cover the actual distribution by at least 120% (i.e., a coverage ratio of at least 1.20). We anticipate, at this point, the initial baseline distribution will be below the Minimum Quarterly Distribution (“MQD”) of $0.3625 per unit specified in our current partnership agreement. Should the Recapitalization and Related Transactions not be consummated and the subordinated units remain outstanding, payment of an initial baseline distribution below the MQD will result in arrearages on our common units continuing to build.
In making the determination to establish the baseline distribution and future distribution coverage ratios, our Board of Directors will take into account our projected capital requirements, its view of future commodity prices, economic conditions present and forecasted in the United States and other economies around the world, and other variables that it believes could impact the near and long term sustainability of the baseline distribution. In order to reduce the volatility in our distributions, our Board of Directors may decide to make the baseline distribution, even in quarters in which we do not generate sufficient distributable cash flow to fund such distributions, by using borrowings from our revolving credit facility. Under our new distribution policy, we plan to continue with our strategy of utilizing derivatives to mitigate the impact of changes in commodity prices on our financial results.
Our Board of Directors will evaluate our distribution policy from time to time as conditions warrant in the future.
Relationship to Natural Gas Partners
We are affiliated with Natural Gas Partners, a leading private equity capital source for the energy industry. Natural Gas Partners owns a significant equity position in Eagle Rock Holdings, L.P., which owns 2,338,419 common units, 20,691,495 subordinated units and all of the equity interests in our general partner (directly and through ownership of all equity interests of our general partner’s general partner), which holds the incentive distribution rights in us. Should the Recapitalization and Related Transactions be consummated, Holdings will contribute to us all of the subordinated units and cause our general partner to contribute to us all of our incentive distribution rights. We anticipate Holdings will continue to be a substantial owner of our common units if the Recapitalization and Related Transactions are completed.
Historically, we have benefited from increased exposure to acquisition opportunities through our affiliation with Natural Gas Partners, including the consummation of several transactions with portfolio companies of Natural Gas Partners (the Midstream Gas Services, Montierra, Redman and Stanolind Acquisitions, as more fully described under “History” below). We expect that our relationship with Natural Gas Partners will continue to provide us with several significant benefits, including increased exposure to acquisition opportunities and access to a significant group of transactional and financial professionals with a successful track record of investing in energy assets. However, if we exercise the option to acquire our general partner interests, Natural Gas Partners will no longer control us through its control of our general partner, which may change our relationship with Natural Gas Partners. Founded in 1988, Natural Gas Partners represents a $7.2 billion family of investment funds organized to make direct equity investments in private energy enterprises.
Business Strategies
Our primary business objective is to increase our cash distribution per unit potential over time. We intend to accomplish this objective by continuing to execute the following business strategies:
| · | Maintaining a disciplined financial policy. We will pursue a disciplined financial policy by maintaining a prudent capital structure, managing our exposure to interest rate and commodity price risk, and conservatively managing our cash reserves, especially in light of the state of the financial, credit and equity markets as they now exist and may exist in the future. We target a total leverage ratio, as defined in our revolving credit facility, of 3.50 or less, and upon achieving that level, we plan to institute a new cash distribution policy that will allow us to retain a portion of our distributable cash flow for reinvestment. Maintaining a balanced capital structure may allow us to use our available capital to selectively pursue accretive investments or acquisition opportunities. |
| · | Expanding our operations through organic growth projects. In our Midstream Business, we intend to leverage our existing infrastructure and customer relationships by expanding our existing asset base to meet new or increased demand for midstream services. We also look for opportunities to invest in attractive “Greenfield” projects in areas outside our existing asset base. In our Upstream Business, we intend to continue to identify and execute infill drilling and recompletion opportunities as the primary source of organic growth. We employ sound petroleum engineering practices to identify and quantify these opportunities, and we pursue the opportunities in a manner that reduces risk and cost. We measure the success of these projects by unit development cost and internal rate of return. We currently target an 18% internal rate of return or higher for our Midstream Business’s projects and commercial contracts and a 25% internal rate of return or higher for our Upstream Business’s infill drilling, recompletion and workover activities. |
| · | Continuing to reduce our exposure to commodity price risk. We intend to continue to operate our business in a manner that reduces our exposure to commodity price risk in the near term and on an opportunistic basis over the long term. We manage our portfolio of equity volumes from our three lines of business as a single portfolio. As a result, the volumes of natural gas that we purchase in conjunction with our midstream keep-whole arrangements are more than offset by our long natural gas position associated with midstream percent-of-proceeds arrangements and natural gas production from our upstream and mineral assets. We use a variety of hedging instruments to accomplish our risk management objectives. Based on the production estimates in our current forecast, we have hedged approximately 88% of our expected hedgeable crude, condensate and natural gas liquids (heavier than propane) and 96% of our expected hedgeable natural gas and ethane production through 2010. Similarly, based on the production estimates in our current forecast, we have hedged approximately 63% of our 2011 expected hedgeable crude, condensate and natural gas liquids (heavier than propane) volumes and 73% of our natural gas and ethane production. We actively monitor our hedge portfolio for opportunities to enter into additional hedges to support our cash flow objectives. Our hedging strategy also may include resetting existing hedges to higher price levels in order to meet our cash flow requirements, stay in compliance with our credit facility covenants and continue to execute on our distribution objectives. |
| · | Maximizing the profitability of our existing assets. In our Midstream Business, we intend to maximize the profitability of our existing assets by marketing to, and contracting with, new customers to add new volumes of natural gas to our gathering and processing assets under economically favorable terms to us. We also strive to provide superior customer service while undertaking additional initiatives to enhance utilization, minimize excess processing capacity, and improve operating margins and efficiencies across our midstream assets. In our Upstream Business, we utilize best practices and technologies to improve the recoveries of oil and natural gas from our existing wellbores, as well as focus on reducing our overall and per unit operating expenses. We manage our assets to maximize the amount of hydrocarbons and valuable by-products we can profitably extract. We pursue these opportunities at a measured pace to attempt to maintain constant or slightly growing production rates and cash flows. The performance measures we use to assess the success of our asset performance and production enhancement activities are increased throughput volumes, improved run times on our equipment, internal rate of return and unit operating cost. |
| · | Pursuing acquisitions. We will continue to employ a disciplined acquisition strategy that capitalizes on the operational experience of our management team as well as bringing new expertise to the Partnership. Due to our unique structure and expertise in managing midstream, upstream and mineral assets, we can pursue acquisitions that involve all three types of assets and thereby provide a seller the ability to complete a sale in a single transaction. Strategically, we will focus our acquisition efforts on midstream and upstream assets which we believe are best-suited to accomplish our objective of growing our distributable cash flow. If we are successful in selling our Minerals Business, we do not foresee making acquisitions of mineral-only asset or packages. We will remain opportunistic on our acquisition activity. |
In our Midstream Business, we seek to acquire assets that: (i) serve producing areas with high levels of drilling activity; (ii) have a stable contract mix profile characterized by relatively low commodity price exposure and relatively long contract terms; (iii) are complementary to our existing asset base and which provide operating cost savings, diversified market outlets and a diversified customer base; and (iv) allow us to serve as operator, which gives us greater flexibility with respect to future capital investments and allows us to better manage the associated risks.
In our Upstream Business, we seek to acquire assets that: (i) have low decline rates; (ii) have a relatively high level of developed producing reserves; (iii) have meaningful low-risk development opportunities; (iv) contain a balanced mix of oil and natural gas current production and future reserves; (v) serve attractively priced markets; (vi) produce from numerous wellbores so as to minimize the impact of a single negative well event; and (vii) allow us to serve as operator, which gives us greater flexibility with respect to future capital investments and allows us to better manage the associated risks.
The primary measures we use to assess the success of our acquisition program are sustained accretion and internal rate of return. We currently target a 12% internal rate of return or higher for our acquisitions.
Competitive Strengths
We believe that we are well positioned to execute our business strategies successfully because of the following competitive strengths:
| · | We have a uniquely diversified business model. The combination of our Midstream, Upstream and Minerals Businesses along the oil and gas value chain provides us with significant benefits. While the Midstream Business provides us with relatively stable, and potentially growing, throughput volumes and cash flows, the performance of gathering and processing assets is tied, among other things, to our gas-producing customers’ drilling plans, well performance and financial situation. Each of these factors is beyond our control. In contrast, in our Upstream Business we are able to manage our infill drilling plans, recompletion and workover activities to varying degrees with a company-wide view of maximizing and/or stabilizing our overall cash flow. |
An additional benefit to our diversified business model is our ability to bid for acquisition opportunities which include assets or properties in two or more of our segments and potentially in two or more of our businesses. This provides us with a competitive advantage against other potential single-focus bidders, as we are able and willing to assign value and identify potential operational improvements of all the assets included in the package.
If we are successful in selling our Minerals Business, we do not foresee a negative impact to our diversified business model as the benefits of our model is primarily realized through the juxtaposition of our Midstream and Upstream Businesses.
| · | We have an experienced, knowledgeable management team with a proven record of performance. Our management team has a proven record of enhancing value through the investment in, and the acquisition, exploitation and integration of, natural gas midstream, upstream and mineral assets. Our senior management team has an average of approximately 20 years of industry-related experience and a substantial economic interest in us through direct ownership of our common units and, in certain cases, indirect ownership through Holdings. Our senior management team’s extensive experience and contacts within the energy industry provide a strong foundation for managing and enhancing our operations, accessing strategic acquisition opportunities and constructing new assets. We have a staff of engineers, commercial, operational and support staff who are experts at drilling and operating oil and gas wells and managing gathering and processing assets. |
| · | We have a highly flexible, low cost and long term credit facility in place. We currently have a $971 million senior secured revolving credit facility that expires in December 2012, carries an attractive borrowing rate and offers us financial flexibility. The credit facility accommodates, through the use of a borrowing base for our Upstream Business and traditional cash-flow based covenants for our Midstream and Minerals Businesses, the allocation of indebtedness to either our Upstream Business (to be measured against the borrowing base) or to our Midstream and Minerals Businesses (to be measured against the cash-flow based covenant). We have a well-diversified lender group consisting of 19 domestic and international financial institutions with the highest concentration in any one financial institution being 13.9% of aggregate commitments. We have the ability to upsize total commitments by an additional $19.5 million, in addition to the $180 million upsizing we executed during 2008. As a result of Lehman Brothers’ bankruptcy filing, the amount of available commitments was reduced by the unfunded portion of Lehman Brothers’ commitment in an amount of approximately $9.1 million. As of December 31, 2009, we had approximately $60.5 million of available capacity under our credit facility expiring in 2012. Our current credit availability and our ability to draw from our credit facility may be limited by our financial results during 2010 and beyond if the energy industry endures a prolonged lower commodity price environment. We believe that the Recapitalization and Related Transactions will improve our liquidity and increase our access to capital markets to raise additional funds for future acquisitions and organic growth projects. |
| · | We are affiliated with NGP. We expect our relationship with NGP to continue to provide us with several significant benefits, including increased exposure to acquisition opportunities and access to a significant group of transactional and financial professionals with a proven track record of investing in midstream and upstream assets. If we are successful in consummating the transactions described in Recapitalization and Related Transactions above, and we exercise the option to purchase our general partner from NGP affiliates, our relationship with NGP could change dramatically. |
History
Our Partnership, formed in May 2006, is the legal successor to Eagle Rock Pipeline, L.P. (“Eagle Rock Pipeline”) which continues to exist in our organization as a subsidiary as a result of our initial public offering in October 2006.
The following is a detailed chronology of our history of significant transactions, including acquisitions, divestures, organic growth projects and equity financings.
Dry Trail Plant
| | • | On December 5, 2003, Eagle Rock Pipeline commenced operations with the acquisition of the Dry Trail plant carbon dioxide recovery plant from Williams Field Services in the amount of approximately $18.0 million which was financed through equity of $6.0 million and debt of $12.0 million; |
| | • | On July 1, 2004, Eagle Rock Pipeline sold the Dry Trail plant to Celero Energy, L.P. for approximately $37.4 million, of which $12.0 million was used to repay the debt incurred to purchase the Dry Trial plant, and resulted in a pre-tax realized gain in the disposition of approximately $19.5 million in 2004; |
Entrance into East Texas Segment with Indian Springs Processing Plant and Camp Ruby Gathering System Acquisition (Indian Springs Acquisition)
| | • | On July 1, 2004, Eagle Rock Pipeline acquired a 25% interest in the Indian Springs processing plant and a 20% interest in the Camp Ruby gathering system, for an aggregate purchase price of approximately $20.0 million, financed with proceeds received from the sale of the Dry Trail plant; |
Entrance into Texas Panhandle Segment (ONEOK Acquisition)
| | • | On December 1, 2005, Eagle Rock Pipeline acquired ONEOK Texas Field Services, L.P (“Eagle Rock Predecessor”) for approximately $531.1 million, which was financed through an additional equity contribution of $133 million and incurrence of debt of $400 million; |
Tyler County Pipeline
| | • | On February 28, 2006, Eagle Rock Pipeline completed the first phase of construction of the 23-mile, 10 inch Tyler County Pipeline in Tyler County, Texas and Polk County, Texas, costing approximately $8 million, financed from operating cash flow, connecting the Indian Springs Plant and a significant producer in Tyler County; |
Creation of East Texas/Louisiana Segment with Acquisition of Brookeland gathering system and processing plant, Masters Creek gathering system, and Jasper NGL Pipeline from Duke and Swift (Brookeland Acquisition)
| | • | On March 27, 2006, Eagle Rock Pipeline completed a private placement of 5,455,050 common units for $98.3 million among a group of private investors; |
| | • | On March 31, 2006 and April 7, 2006, a wholly-owned subsidiary of Eagle Rock Pipeline acquired certain natural gas gathering and processing assets from Duke Energy Field Services, L.P. and Swift Energy Corporation, consisting of the Brookeland gathering system and processing plant, the Masters Creek gathering system and the Jasper NGL pipeline. This acquisition was financed with approximately $96 million out of the proceeds received from the private equity placement closed on March 27, 2006; |
Expansion of Texas Panhandle Segment assets with addition of Roberts County Plant
(Midstream Gas Services Acquisition)
| | • | On June 2, 2006, Eagle Rock Pipeline acquired all of the partnership interests in Midstream Gas Services, L.P., an NGP affiliate, which owned a plant and a small gathering system in Roberts County, Texas, for approximately $25.0 million, consisting of $4.7 million of cash flow from operations and $20.3 million in Eagle Rock Pipeline partnership units; |
Creation of Quinduno Pipeline Connecting East and West Panhandle Systems in Texas Panhandle Segment
| | • | On August 1, 2006, Eagle Rock Pipeline completed the construction of the 10-mile, 10-inch Quinduno pipeline, costing approximately $3.1 million, financed from operating cash flow, connecting our East and West Panhandle Systems in the Texas Panhandle Segment; |
Initial Public Offering
| | • | On October 24, 2006, we completed our initial public offering with the issuance of 12,500,000 common units to the public, representing a 29.6% limited partner interest. In connection with that offering, Eagle Rock Holdings, L.P. contributed certain assets and ownership of operating subsidiaries to us and received 3,459,236 common units and 20,691,495 subordinated units; |
| | • | On November 21, 2006, 1,463,785 common units held by Eagle Rock Holdings, L.P. and certain private investors were redeemed as part of the exercise of the underwriters’ overallotment option granted in conjunction with our IPO; |
Tyler County Pipeline Extension
| | • | On March 31, 2007, we completed the construction of the 13-mile, 10-inch Tyler County Pipeline Extension in Tyler County and Jasper County, Texas, costing approximately $24.2 million, financed with proceeds from a draw on our credit facility, extending the Tyler County Pipeline to our Brookeland Gathering System; |
Creation of Minerals Segment (Montierra Acquisition)
| | • | On April 30, 2007, we acquired all outstanding equity of entities owning certain fee minerals, royalties and working interest properties, from Montierra Minerals & Production, L.P., an NGP affiliate, and we acquired certain fee minerals, royalties and working interest properties directly from NGP-VII Income Co-Investment Opportunities, L.P., another NGP affiliate, for an aggregate purchase price of $139.2 million, consisting of 6,458,946 (recorded value of $133.8 million) of our common units and $5.4 million in cash; |
East Texas/Louisiana Segment Expansion and Entrance to South Texas Segment (Laser Acquisition)
| | • | On May 3, 2007, we acquired Laser Midstream Energy, LP, including certain of its subsidiaries, for a total purchase price of $142.6 million, consisting of $113.4 million in cash and 1,407,895 (recorded value of $29.2 million) of our common units; |
| | • | On May 3, 2007, we completed the private placement of 7,005,495 common units to several institutional purchasers in a private offering resulting in gross proceeds of $127.5 million. The proceeds from this offering were used to fully fund the cash portion of the purchase price of the Laser Acquisition and the Montierra Acquisition and were used for other general company purposes; |
Acquisition of Complementary Assets to Minerals Segment (MacLondon Acquisition)
| | • | On June 18, 2007, the Partnership completed the acquisition of certain royalty and mineral assets owned by MacLondon Energy, L.P. for a purchase price of $18.2 million, consisting of 757,065 (recorded value of $18.1 million) of our common units, and cash of $0.1 million; |
Construction of Red Deer Processing Plant in East Panhandle System in Texas Panhandle Segment
| | • | On June 21, 2007, the Red Deer processing plant, with a 20 MMcf/d processing capacity, was put into service in Roberts County, Texas in the East Panhandle System in the Texas Panhandle Segment, at a cost of $16.2 million financed with proceeds from a draw on our credit facility; |
Entrance into Upstream Segment with Acquisition of oil and gas producing properties in East and South Texas and in Alabama (including certain related natural gas gathering and processing assets) (Escambia and Redman Acquisitions)
| | • | On July 31, 2007, we acquired Escambia Asset Co. LLC and Escambia Operating Co. LLC (collectively “Escambia”) for an aggregate purchase price of approximately $241.8 million, comprised of approximately $224.6 million in cash and 689,857 (recorded value of $17.2 million) in Eagle Rock common units; |
| | • | On July 31, 2007, we acquired Redman Energy Holdings, L.P. and Redman Energy Holdings II, L.P., each an NGP affiliate, and certain assets owned by NGP Income Co-Investment Opportunities Fund II, L.P., and NGP affiliate, (collectively, “Redman”) for a combined value of $192.8 million, comprised of 4,426,591 (recorded value of $108.2 million) common units and $84.6 million in cash; |
| | • | On July 31, 2007, we completed the private placement of 9,230,770 common units to third-party investors for total cash proceeds of approximately $204 million. The proceeds were used to finance a portion of the cash used in the Escambia and Redman acquisitions, with the other portion being financed from a draw on our credit facility; |
Upstream Segment expansion with Acquisition of oil and gas producing properties in West Texas (Stanolind Acquisition)
| | • | On April 30, 2008, we acquired Stanolind Oil and Gas Corp. (“Stanolind”), an affiliate of NGP, for an aggregate purchase price of approximately $81.9 million of cash; |
| | • | In 2008, subsequent to the Stanolind Acquisition, we drilled and completed five wells in the Permian Basis at a cost of $6.5 million financed through cash from operations; |
| | Stinnett-Cargray Consolidation Project |
| | • | In July 2008, we complete the shutdown of our Stinnett Plant and began to move the natural gas to our Cargray Plant for processing. This project cost us $6.1 million financed through cash from operations; |
| | East Texas/ Louisiana Segment and South Texas Segment expansion and entrance into Gulf of Mexico Segment (Millennium Acquisition) |
| | • | On October 1, 2008, we acquired Millennium Midstream Partners, L.P. (“MMP”) for an aggregate purchase price of approximately $210.6 million, comprised of approximately $183.4 million in cash and 3,031,676 (recorded value of $27.2 million) common units. The purchase price includes the release of 849,858 units from the escrow account to the sellers as well as other post-closing adjustments made subsequent to October 1, 2008. As of December 31, 2009, the escrow account held 391,304 common units which are available for claims by the Partnership and will not be available for release to the former owners of MMP until April 1, 2010. As of March 9, 2010, we had recovered an additional 3,759 common units from the escrow account. |
For a further discussion of our acquisitions, see Note 4 to our consolidated financial statements included in Part II, Item 8. Financial Statements and Supplementary Data starting on page F-1 of this Annual Report.
The following are charts and tables that depict the foregoing history of acquisitions/dispositions and organic growth projects by date, transaction type, cost, financing sources and business:
Table of Acquisitions/Dispositions
| | | | | | | | | | |
Closing Date | | Acquisition/Dispositions | | Cost ($ in Millions) | | | Financing Sources ($ in Millions) | | Business |
| | Cash | | | Debt | | | Equity to Sellers | | | Cash from private equity/ PIPEs(4) | |
| | 12-05-03 | | Dry Trail Acquisition(1) | | $ | 18.0 | | | | — | | | $ | 12.0 | | | | — | | | $ | 6.0 | | Midstream |
| | 7-01-04 | | Dry Trail Disposition | | $ | (37.4 | ) | | | — | | | | — | | | | — | | | | — | | NA |
| | 7-01-04 | | Indian Springs Acquisition(2) | | $ | 20.0 | | | $ | 20.0 | | | | — | | | | — | | | | — | | Midstream |
| | 12-01-05 | | ONEOK Acquisition(1) | | $ | 531.1 | | | | — | | | $ | 400.0 | | | | — | | | $ | 133.0 | | Midstream |
| 3-31-06 & 4-07-06 | | Brookeland Acquisition | | $ | 95.8 | | | | — | | | | — | | | | — | | | $ | 98.3 | | Midstream |
| | 6-02-06 | | Midstream Gas Services Acquisition | | $ | 25.0 | | | $ | 4.7 | | | | — | | | $ | 20.3 | | | | — | | Midstream |
| | 4-30-07 | | Montierra Acquisition | | $ | 139.2 | | | | — | | | | — | | | $ | 133.8 | | | $ | 5.4 | | Minerals |
| | 5-03-07 | | Laser Acquisition | | $ | 142.6 | | | | — | | | | — | | | $ | 29.2 | | | $ | 113.4 | | Midstream |
| | 6-18-07 | | MacLondon Acquisition | | $ | 18.2 | | | $ | 0.1 | | | | — | | | $ | 18.1 | | | | — | | Minerals |
| | 7-31-07 | | Escambia Acquisition | | $ | 241.8 | | | | — | | | $ | 113.0 | | | $ | 17.2 | | | $ | 111.6 | | Upstream |
| | 7-31-07 | | Redman Acquisition | | $ | 192.8 | | | | — | | | | — | | | $ | 108.2 | | | $ | 84.6 | | Upstream |
| | 4-30-08 | | Stanolind Acquisition | | $ | 81.9 | | | $ | 5.9 | | | $ | 76.0 | | | | — | | | | — | | Upstream |
| | 10-01-08 | | Millennium Acquisition(3) | | $ | 210.6 | | | $ | 7.0 | | | $ | 176.4 | | | $ | 27.2 | | | | — | | Midstream |
(1) | Private equity funding provided by Natural Gas Partners. |
(2) | Cash provided by the disposition of Dry Trail. |
(3) | Cost excludes 391,304 units held in an escrow account as of December 31, 2009. |
(4) | Private Investment in Public Equity (“PIPE”) by institutional investors. |
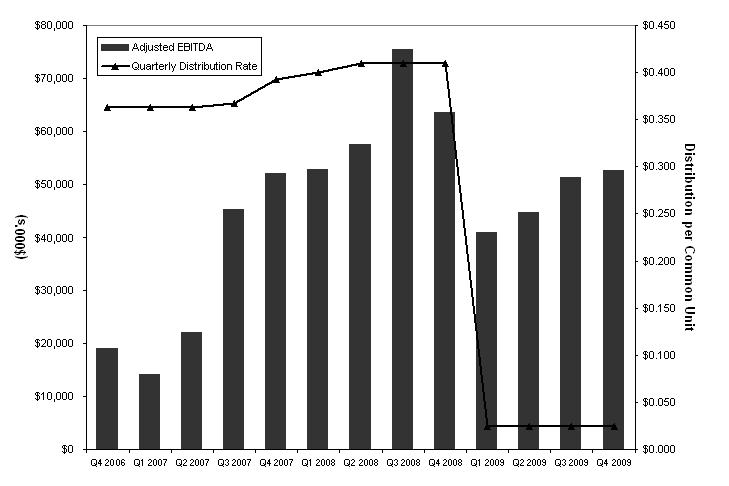
The following graph depicts our historical trends in Adjusted EBITDA and quarterly distribution rate per common unit, from our initial public offering on October 24, 2006 to December 31, 2009:
Note: Q4 2006 represents a prorated distribution to the common unitholders from the IPO date of October 24, 2006 through December 31, 2006. In addition, hedge resets contributed $4.2 million and $46.8 million to Adjusted EBITDA for the fourth quarter 2008 and the year ended December 31, 2009, respectively.
For a definition of Adjusted EBITDA and reconciliation to GAAP, see Part II, Item 6. Selected Financial Data-Non-GAAP Financial Measures.
From the time of our initial public offering through the third quarter of 2008, we increased our Adjusted EBITDA and the distribution per unit paid to our unitholders. Our financial results during this period benefited from our acquisition activity, as described above, and from the positive impact of increasing commodity prices, including the resulting increased producer drilling activity in our core Midstream Business areas. Beginning in the third quarter of 2008, however, commodity prices began to fall significantly, caused in part by the worldwide credit crisis and ensuing reduction in demand for crude oil, natural gas, natural gas liquids, and sulfur. This downward trend in commodity prices continued throughout the first quarter of 2009, and resulted in a substantial slowdown in the drilling activity of virtually all the major producer customers of our Midstream Business. Against this backdrop of declining midstream volumes and cash flows, our Board of Directors elected to substantially reduce our distribution beginning with the distribution with respect to the first quarter of 2009. This decision was made in order to enhance our liquidity and financial flexibility, and to avoid breaching the covenants in our revolving credit facility. Our Adjusted EBITDA benefited substantially in 2009 from our hedge portfolio, including from “hedge resets,” in which we pay our hedge counterparties to increase the strike price of existing swaps. Such hedge resets contributed approximately $46.8 million to our Adjusted EBITDA.
An investment in our common units involves risks associated with our business, regulatory and legal matters, our limited partnership structure and the tax characteristics of our common units. Please read carefully the risks described under Part I, Item 1A. Risk Factors.
Our Three Lines of Business and Our Seven Reporting Segments
Midstream Business
Midstream Industry Overview
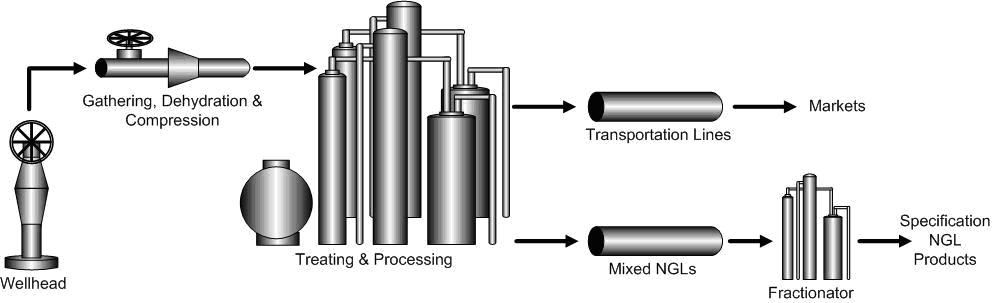
General. Raw natural gas produced from the wellhead is gathered and delivered to a processing plant or markets located near the production field, where it is treated, dehydrated, and/or processed. Processing natural gas involves the separation and treating of raw natural gas resulting in a pipeline quality natural gas, primarily methane, and mixed NGLs for sale. Natural gas treating entails the removal of impurities, such as water, sulfur compounds, carbon dioxide and nitrogen. Interstate and intrastate pipelines deliver the processed natural gas to markets. Mixed NGLs are typically transported via NGL pipelines or by truck to a fractionator which separates the NGLs into its components such as ethane, propane, normal butane, isobutane and natural gasoline. The component NGLs are then sold to end users.
The following diagram shows the process of gathering, processing, marketing and transporting natural gas and NGLs. Our Midstream Business is in all of the depicted segments other than the wellhead (which is captured in our Upstream Business Segment).
Gathering. A gathering system typically consists of a network of small diameter pipelines and a compression system which together collect natural gas from producing wells and delivers it to larger pipelines for further transportation. We own and operate large gathering systems in four geographic regions of the United States.
Compression. Gathering systems are operated at design pressures that seek to maximize the total through-put volumes from all connected wells. Since wells produce at progressively lower field pressures as they age, the raw natural gas must be compressed to deliver the remaining production against higher pressure that exists in the connected gathering system or transport pipelines. Natural gas compression is a mechanical process in which a volume of natural gas at a lower pressure is boosted, or compressed, to a desired higher pressure, allowing natural gas that no longer naturally flows into a higher pressure downstream pipeline to be brought to market. Field compression is used to lower the wellhead pressure while maintaining the exit pressure of a gathering system to deliver natural gas into higher pressure downstream pipelines. We own and operate compression on a number of our systems
Treating and processing. Raw natural gas produced at the wellhead is often unsuitable for pipeline transportation or commercial use and must be processed and/or treated to remove the heavier hydrocarbon components and/or contaminants. The principal components of pipeline-quality natural gas are methane and ethane, but most raw natural gas also contains varying amounts of heavier hydrocarbon components (such as propane, normal butane, isobutane, and natural gasoline) and impurities, such as water, sulfur compounds, carbon dioxide, or nitrogen. We own and operate natural gas processing and/or treating plants in five geographic regions.
Fractionation. NGL fractionation facilities separate mixed NGL streams into discrete NGL products: ethane, propane, normal butane, isobutane and natural gasoline. Ethane is primarily used in the petrochemical industry as feedstock for ethylene, one of the basic building blocks for a wide range of plastics and other chemical products. Propane is used both as a petrochemical feedstock and as a heating fuel, an engine fuel and an industrial fuel. Normal butane is used as a petrochemical, and as a blend stock for motor gasoline. Isobutane is typically fractionated from mixed butane (a stream of normal butane and isobutane in solution), principally for use in enhancing the octane content of motor gasoline. Natural gasoline, a mixture of pentanes and heavier hydrocarbons, is used primarily as motor gasoline blend stock or petrochemical feedstock. We operate a fractionation facility to produce propane at one of our facilities in the Texas Panhandle Segment. In our Gulf of Mexico Segment we own a 5.16% interest in the Tebone Fractionator, a fractionation facility operated by Enterprise Products Partners L.P. in southern Louisiana, acquired as a part of our recently closed Millennium Acquisition.
Marketing. Natural gas marketing involves the sale of the pipeline-quality natural gas either produced by processing plants or purchased from gathering systems or other pipelines. NGL marketing involves the sale of the unfractionated or y-grade products or fractionated products recovered at the processing plants. We perform a limited marketing function for our account and for the accounts of our customers based upon the location of our assets.
Transportation. Natural gas transportation consists of moving pipeline-quality natural gas from gathering systems, processing plants and other pipelines and delivering it to wholesalers, utilities and other pipelines. Other than our North and Central systems we acquired in the Millennium Acquisition, we do not own any natural gas transportation assets.
Natural gas is gathered and processed in the industry pursuant to a variety of arrangements generally categorized (by the nature of the commodity price risk) as fee-based, percent-of-proceeds, fixed recovery and keep-whole, described in greater detail as follows:
| · | Fee-Based Arrangements. Under these arrangements, we generally are paid a fixed cash fee per unit volume for performing the gathering and processing service. This fee is directly related to the volume of natural gas that flows through our systems and is not directly dependent on commodity prices. A sustained decline, however, in commodity prices could result in a decline in volumes and, thus, a decrease in fee revenues. These arrangements provide stable cash flows, but minimal, if any, upside in higher commodity price environments. |
| · | Percent-of-Proceeds Arrangements. Under these arrangements, generally raw natural gas is gathered from producers at the wellhead, moved through the gathering system, and processed and sold at prices based on published index prices. We pay a portion of the sale price to the producers. These arrangements provide upside in high commodity price environments, but result in lower margins in low commodity price environments. The price paid to producers is based on an agreed percentage of the products produced multiplied by one of the following: (1) the actual sale price; or (2) the index price. Contracts in which the gatherer/processor shares only in specified percentages of the proceeds from the sale of NGLs and in which the producer receives 100% of the proceeds from natural gas sales, are referred to as “percent-of-liquids” arrangements. Contracts in which the gatherer/processor share only in specified percentages of the proceeds from the sale of the natural gas and in which the producer receives 100% of the proceeds from the NGL sales are referred to as a “percent-of-index” arrangements. Under percent-of-proceeds arrangements, the margin correlates directly with the prices of natural gas and NGLs; under percent-of-liquids arrangements, the margin correlates directly with the prices of NGLs; and under percent-of-index arrangements, the margin correlates directly with the prices of natural gas (although there is often a fee-based component to all of these forms of contracts in addition to the commodity sensitive component). |
| · | Fixed Recovery Arrangements. Under these arrangements, raw natural gas is gathered from producers at the wellhead, moved through our gathering system and processed and sold as processed natural gas and/or NGLs at prices based on published index prices. The price paid to the producers is based on an agreed to theoretical product recovery factor to be applied against the wellhead production and then a percentage of the theoretical proceeds based on an index or actual sales prices multiplied to the theoretical production. To the extent that the actual recoveries differ from the theoretical product recovery factor, this will affect the margin. These arrangements provide upside in high commodity price environments, but result in lower margins in low commodity price environments. |
| · | Keep-Whole Arrangements. Under these arrangements, raw natural gas is processed to extract NGLs, and the processor pays to the producer the full thermal equivalent volume of raw natural gas received from the producer in the form of either processed natural gas or its cash equivalent. The processors are generally entitled to retain the processed NGLs and to sell them for their account. Accordingly, the margin is a function of the difference between the value of the NGLs produced and the cost of the processed gas used to replace the thermal equivalent value of those NGLs (i.e. the frac spread). The profitability of these arrangements is subject not only to the commodity price risk of natural gas and NGLs, but also to the price of natural gas relative to NGL prices. These arrangements can provide improved profit margins in favorable commodity price environments, but also can be subject to losses if the cost of natural gas exceeds the value of its thermal equivalent of NGLs. Many keep-whole arrangements include provisions that reduce commodity price exposure, including (1) conditioning floors that require the keep-whole arrangements to convert to a fee-based arrangement if the NGLs have a lower value than their thermal equivalent in natural gas, (2) discounts to the applicable natural gas index price under which we may reimburse the producer an amount in cash for the thermal equivalent volume of raw natural gas acquired from the producer, or (3) fixed cash fees for ancillary services, such as gathering, treating and compressing. |
Midstream Business Overview
We own strategically-positioned natural gas gathering and processing assets in five significant natural gas producing regions: the Texas Panhandle, East Texas/Louisiana, West Texas, South Texas and the Gulf of Mexico. Our gathering and processing assets are located in basins that have experienced consistent growth in natural gas land leases, drilling and production. These core basins are known as the Anadarko basin, East Texas basin, Permian and South Texas basin and the Outer Continental Shelf. While the reduction in oil, natural gas and natural gas liquids prices from their historic highs during 2008 to their current levels has resulted in a significant reduction in current drilling activity behind a number of our gathering systems particularly in the East Texas/Louisiana segment and South Texas segment, we continue to believe our strategically-positioned assets will benefit us when the drilling activity resumes in these areas. During 2009 we remained focused on contracting new gas to our systems and continuing our cost reduction efforts. We did execute on a number of smaller organic growth projects during the 2009 calendar year which included laying additional gathering lines in East Texas and adding compressors where drilling activity was occurring in the Texas Panhandle. Given the significant dislocations in the equity and capital markets throughout 2009 and the rise and fall of oil prices and the deterioration of natural gas prices, we did not execute on any acquisitions.
Within our geographic areas of operation, we want to be competitive and low cost natural gas gatherer and processor. To achieve this end, we have structured the operations and commercial activities of our gathering and processing assets to work closely together to provide better service to our customers. From an operations perspective, our key strategy is to provide our customers safe and reliable service at reasonable costs and to improve our competitiveness through more efficient operations to assist in securing new customers. From a commercial perspective, our focus is to assist our customers in maximizing the value of their production by adding additional options and capacity for the movement and marketing of their natural gas and natural gas liquids. The growth prospects in our core areas are driven primarily by strong commodity prices and improvements in technology to produce natural gas from tight sand and shale formations. We are well positioned in the Texas Panhandle Granite Wash play and in East Texas for the Haynesville, James Lime and Petit plays in Angelina and Nacogdoches counties and the Austin Chalk play in Tyler, Polk, Newton and Jasper counties. These will continue to require expansions to our systems in order to meet the producers’ needs and are a part of our continuing strategy to be the gatherer and processor of choice. We gather and process natural gas pursuant to a variety of arrangements generally categorized (by the nature of the commodity price risk) as fee-based, percent-of-proceeds, fixed recovery or keep-whole, as described more fully under “Midstream Industry Overview” above. As of December 31, 2009, the percentage of natural gas throughput volumes under various contractual arrangements were 12% fixed recovery, 37% fee-based, 43% percent-of-proceeds and 8% keep-whole. The following is a summary of the contracts that are significant to our operations.
ONEOK Hydrocarbon
We are a party to a natural gas liquids exchange agreement with ONEOK Hydrocarbon, L.P., dated December 1, 2005. We deliver all of our natural gas liquids extracted at six of our natural gas processing plants in the Texas Panhandle to ONEOK for transportation and fractionation services. We take title to all of these volumes, and they are physically delivered to Conway, Kansas where mid-continent type natural gas liquids pricing is available, with an option to exchange certain volumes at Mont Belvieu, Texas where gulf coast type natural gas liquids pricing is available. The primary contract term expires on June 30, 2010, but an extension to June 30, 2015 may be mutually agreed to by the parties.
Chesapeake Energy Marketing
We are a party to a natural gas purchase agreement with Chesapeake Energy Marketing Inc., dated July 1, 1997, whereby we purchase raw natural gas from a number of wells on acreage dedicated to us located in Moore and Carson Counties, Texas for the life of the lease. The natural gas from these wells is delivered into our Stinnett and Cargray gathering and processing systems. We pay Chesapeake an index posted gas price, less a fixed charge and fixed commodity fee and a fixed fuel percentage. Under this contract, there is an annual option to renegotiate the fuel and fees components. The original agreement was between MC Panhandle, Inc. and MidCon Gas Services Corp. and, as a result of ownership changes; the contract is now between Chesapeake and us. The volumes delivered pursuant to this contract accounts for 3.0% of all the volumes gathered by us as of December 31, 2009. This is our single largest keep-whole arrangement by volume.
Cimarex Energy
We are a party to a natural gas purchase agreement with Prize Operating Company (Cimarex Energy Co.), dated March 28, 1994, whereby we gather and process raw natural gas from a number of wells on acreage dedicated to us located in Roberts and Hemphill Counties, Texas, delivered to our Canadian processing plant for the life of the lease. We receive a percentage of the natural gas liquid value and a percentage of the natural gas residue value for gathering and processing services. The original agreement was between Warren Petroleum Company and Wallace Oil & Gas, Inc. and, as a result of ownership changes, the contract is now between Prize (Cimarex) and us. The volume delivered pursuant to this contract accounts for 3.7% of all the volumes gathered by us as of December 31, 2009. This producer has added the most volume, year over year, of any producer-customer in our Texas Panhandle Segment.
Anadarko Petroleum
We are a party to a natural gas purchase agreement with Anadarko E&P Company LP dated September 9, 1993, whereby we gather and process raw natural gas from a number of wells on acreage dedicated to us located in Jasper and Sabine Counties, Texas, delivered to our Brookeland processing plant for the life of the lease. We receive a fee for gathering and processing services based upon a percentage of the natural gas liquid value and a percentage of the natural gas residue value. The volume delivered pursuant to this contract accounts for 4.5% of all the volumes gathered by us as of December 31, 2009. The producer has the largest area of mutual interest dedication to us in the East Texas/Louisiana Segment.
Midstream Business Strategies
| · | Maximizing the profitability of our existing assets. We strive to maximize the profitability of our existing midstream assets through organic growth opportunities, adding new volumes of natural gas, maintaining a low cost operational structure and undertaking additional initiatives to enhance utilization and improve operating efficiencies. We differentiate ourselves by taking the following steps: |
| · | Customer service—We seek to market our midstream services and provide superior customer service to producers in our areas of operation to connect new wells to our gathering and processing systems, increase gathering volumes from existing wells and more fully utilize excess capacity on our systems. |
| · | Asset optimization— We seek to improve the operations of our existing assets by relocating idle processing plants to areas experiencing increased processing demand, reconfiguring compression facilities and improving processing plant efficiencies and run times. |
| · | Low cost operations— We focus on controlling costs through competitive sourcing of materials and services, improving the productivity of the workforce and reducing the uses of natural gas on our systems. |
| · | Executing on accretive organic growth prospects. We intend to leverage our existing infrastructure and customer relationships by expanding our existing asset base to meet new or increased demand for midstream services. This could be an expansion of our existing asset base or organic growth prospects in new areas. We seek projects with the following characteristics: |
| · | Projects that provide more than a single production horizon. |
| · | Projects that expand our gathering pipelines into new areas of drilling activity. |
| · | Expansion or relocation of existing plants for additional capacity to process or treat producer’s gas |
| · | Acquiring midstream assets. We continue to seek opportunities to grow our midstream assets and the distributions to our unitholders through the acquisition of midstream properties. We seek assets that are either complementary to our existing assets, located in active drilling basins or complementary to our Upstream or Mineral oil and gas production assets. The primary measures we use to assess the success of our acquisition program are accretion and internal rate of return. We employ an experienced and qualified staff of engineering, commercial, operations, financial and legal experts who can effectively evaluate, negotiate and close these transactions. We focus our acquisition efforts on assets that we believe are best-suited to accomplish our objective of delivering stable and growing distributions; specifically, we seek properties with the following characteristics: |
| · | Serve producing areas with low decline rates—In order to provide a platform for stable and growing distributions, we seek assets that have historically low production decline rates. |
| · | Serve producing areas with relatively high levels of drilling activity—We seek a balance of future development potential and current production rate. The current production rate is important to ensure that the acquisition will be immediately accretive (i.e. provide adequate cash flow so that distributions can be increased immediately), but the active drilling is necessary to ensure that production declines can be offset by additional well connects or recompletions. |
| · | Attractive contract mix– We generally seek midstream asset acquisitions that have a stable contract mix profile as it relates to relatively lower commodity price exposure as well as longer contract terms. In particular, we seek to increase our overall fee-based business and look for longer term or life-of-lease contracts in potential acquisitions. |
| · | Complementary to existing assets—We seek assets that are complementary to our existing asset base that provide operating cost savings, diversified market outlets and diversified customer base. |
| · | Operator—We prefer to operate the properties we own. This allows us greater flexibility with respect to future capital investments and allows us to better manage the risks associated with them. |
Midstream Business Competitive Strengths
| · | We have an experienced, knowledgeable management team with a proven record of performance in evaluating, negotiating and closing midstream asset acquisitions. |
| · | We have a staff of engineers, commercial, operational and support staff that are experts in the Midstream business. |
| · | We have highly competitive asset footprints in a number of our midstream operating areas. |
As of December 31, 2009, our Midstream Business consists of the following:
| | | | | | | | | | |
| Asset | | Length (miles) | | | Compression (Horsepower) | | | Processing Plant Through-put Volume Capacity (MMcf/d) | |
| Texas Panhandle Segment | | | 3,743 | | | | 131,000 | | | | 157 | |
East Panhandle System | | | 1,100 | | | | 53,000 | | | | 96 | |
Canadian cryogenic plant and gathering system | | | 359 | | | | | | | | 25 | |
| Arrington refrigerated lean oil plant and gathering system | | | 537 | | | | | | | | 40 | |
Red Deer cryogenic plant (1)(2) | | | n/a | | | | | | | | 24 | |
| Roberts County refrigeration plant and gathering system (1)(3) | | | 14 | | | | | | | | 7 | |
System 97 gathering system (4) | | | 77 | | | | | | | | n/a | |
Buffalo Wallow gathering system (4) | | | 113 | | | | | | | | n/a | |
West Panhandle System | | | 2,643 | | | | 78,000 | | | | 61 | |
| Cargray cryogenic plant and gathering system (1) | | | 905 | | | | | | | | 30 | |
Gray cryogenic plant and gathering system (1) | | | 615 | | | | | | | | 20 | |
Lefors cryogenic plant and gathering system | | | 663 | | | | | | | | 11 | |
Stinnett gathering system | | | 451 | | | | | | | | n/a | |
Turkey Creek gathering system | | | 9 | | | | | | | | n/a | |
| East Texas/Louisiana Segment | | | 1,195 | | | | 43,700 | | | | 188 | |
| Brookeland cryogenic plant and gathering system | | | 386 | | | | | | | | 100 | |
| Indian Springs cryogenic plant (25% non-operated) and Camp Ruby gathering system (20% non-operated) (5) | | | n/a | | | | | | | | 36 | |
Tyler County gathering system | | | 75 | | | | | | | | n/a | |
Panola gathering system (1) | | | 33 | | | | | | | | n/a | |
Quitman gathering system | | | 51 | | | | | | | | n/a | |
Rosewood JT plant and gathering system (1) | | | 36 | | | | | | | | 10 | |
Vixen gathering system (4) | | | 7 | | | | | | | | n/a | |
Belle Bower JT plant and gathering system (1) | | | 68 | | | | | | | | 20 | |
Simsboro gathering system (4) | | | 30 | | | | | | | | n/a | |
Sligo gathering system (4) | | | 10 | | | | | | | | n/a | |
ETML gathering system and JT Plant (4) | | | 221 | | | | | | | | 15 | |
Douglas East gathering system (4) | | | 14 | | | | | | | | n/a | |
BGS gathering system (4) | | | 28 | | | | | | | | n/a | |
Robertson County gathering system (4) | | | 34 | | | | | | | | n/a | |
North JT plant and gathering system | | | 85 | | | | | | | | 5 | |
Central JT plant and gathering system | | | 102 | | | | | | | | 2 | |
New Ulm gathering system | | | 15 | | | | | | | | n/a | |
| South Texas Segment | | | 266 | | | | 14,700 | | | | 87 | |
Phase 1 gathering system | | | 70 | | | | | | | | n/a | |
Raymondville gathering system (1) | | | 48 | | | | | | | | n/a | |
Raymondville JT plant | | | n/a | | | | | | | | 40 | |
San Ignacio gathering system (4) | | | 6 | | | | | | | | n/a | |
TGP McAllen JT plant and gathering system | | | 13 | | | | | | | | 40 | |
Merit JT plant | | | n/a | | | | | | | | 7 | |
Wildhorse gathering system | | | 113 | | | | | | | | n/a | |
Sweeny gathering system (50% non-operated) | | | 16 | | | | | | | | n/a | |
| Gulf of Mexico Segment | | | 40 | | | | 14,180 | | | | 325 | |
Yscloskey refrigerated lean oil plant (13.78% non-operated) (6) | | | n/a | | | | | | | | 255 | |
| North Terrebonne refrigerated lean oil plant (5.16% non-operated) (6) | | | n/a | | | | | | | | 70 | |
Tebone Fractionator (5.16% non-operated) (7) | | | n/a | | | | | | | | n/a | |
Galveston Bay gathering (100% non-operated) | | | 12 | | | | | | | | n/a | |
CMA Pipeline segments (non-operated) | | | 28 | | | | | | | | n/a | |
TOTAL Midstream Businesses | | | 5,244 | | | | 203,580 | | | | 757 | |
(1) | The plant is owned by us, but we lease the plant site. |
(2) | The plant processes gas from the Canadian gathering system. |
(3) | The Roberts County Plant has 21 MMcf/d of capacity but currently only has installed compression to process 20 MMcf/d. |
(4) | The gathering systems gather natural gas that is dry gas that does not require processing to meet pipeline hydrocarbon dew point quality specifications prior to delivery to the pipeline grid. |
(5) | Our net plant capacity is based on the recent plant expansion to 145 MMcf/d total capacity. |
(6) | Our ownership capacity is subject to change each year based upon the percentage that our equity gas and/or natural gas liquids volumes represent in comparison to the total equity gas and/or natural gas liquids volumes processed and/or produced at the plant for the year. The capacity shown is net to our ownership share. |
(7) | 30,000 Bbl/d capacity and our ownership share is tied to our ownership percentage in the North Terrebonne Plant. |
Below is a graph showing processing plant utilization. The graph shows the plant processing capacity by month and includes the Millennium Acquisition and the shutdown and consolidation of the Stinnett Plant into the Cargray Plant. The volumes shown include only the gas volumes that were gathered and required plant processing in order to meet the interstate or intrastate gas quality specifications (we refer to such natural gas as wet gas) and excludes the gas volumes that were gathered that did not require plant processing prior to delivery to the interstate or intrastate pipeline systems (we refer to such natural gas as dry gas).
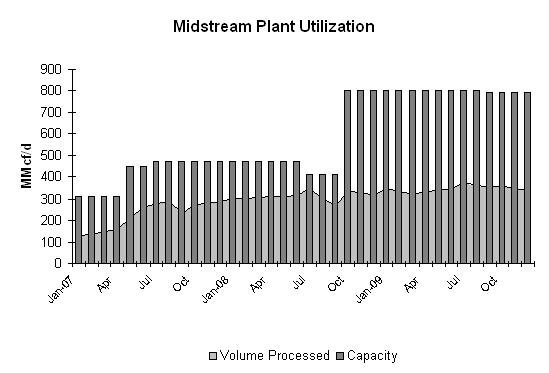
Note. The reduction in plant capacity in July 2008 was due to the shutdown of the Panola JT Plant. The significant increase in processing capacity in October was due to the addition of our share of the North Terrebonne Plant and the Yscloskey Plant acquired through the Millennium Acquisition. Both plants were impacted by hurricanes Ike and Gustav. The North Terrebonne Plant returned to operations in November 2008. The Yscloskey Plant did not restart until January 2009. The reduction in plant capacity in September 2009 was due to the adjustment of plant ownership at the Yscloskey Plant.
Texas Panhandle Segment
Our Texas Panhandle Segment covers ten counties in Texas and one county in Oklahoma and consists of our East Panhandle System and our West Panhandle System. The facilities are primarily located in Wheeler, Hemphill, Roberts, Moore, Potter, Hutchinson, Carson, Gray and Collingsworth Counties. Through these systems, we offer producers a complete set of midstream wellhead-to-market services, including gathering, compressing, treating, processing and selling of natural gas and fractionating and selling of NGLs. The Texas Panhandle Segment averaged gathered volumes for the fourth quarter of 2009 of approximately 131.6 MMcf/d. As of December 2009, Chesapeake Energy and Prize represented 22% and 15%, respectively, of the total volumes of our Texas Panhandle Segment. The following is a map of our Texas Panhandle Segment.
Below is a graph showing processing plant utilization for the Texas Panhandle Segment. The volumes include only the wet gas volumes that were gathered and processed prior to delivery to the interstate or intrastate pipeline systems.
Note: The Stinnett Plant was consolidated into the Cargray Plant in July 2008 resulting in a reduction of 40 MMcf/d of processing capacity for the Texas Panhandle Segment.
Our Texas Panhandle Systems are located in the Texas Railroad Commission (the “TRRC”) District 10, which has experienced significant growth activity since 2002. According to the EIA, total proved natural gas reserves have grown from 6.3 Tcf at year-end 2007 to 6.9 Tcf at year-end 2008 in District 10. This area has experienced significant drilling activity during the last three years; however, with the current price environment we have seen a reduction in drilling activity in the near term.
System Description. The Texas Panhandle Segment consists of:
| | • | approximately 3,743 miles of natural gas gathering pipelines, ranging from two inches to 24 inches in diameter, with approximately 131,000 horsepower of associated pipeline compression; |
| | • | seven active natural gas processing plants with an aggregate capacity of 157 MMcf/d; |
| | • | a propane fractionation facility with capacity of 1.0 MBbls/d; |
| | • | a condensate collection facility; and |
| | • | average gathered volumes of both wet and dry gas of approximately 139 MMcf/d for 2009. |
East Panhandle System
The East Panhandle System gathers and processes natural gas produced in the Morrow and Granite Wash reservoirs of the Anadarko basin in Wheeler, Hemphill and Roberts Counties, an area in the eastern portion of the Texas Panhandle. This area has experienced substantial drilling and reserve growth since 2002; however, with the current price environment, this area has seen a reduction in drilling activity particularly in the Granite Wash play. We anticipate producers will increase their drilling activity once either an increase in natural gas prices occurs or the cost to drill the wells declines to a point to support the producer’s drilling economics. Producers are increasing their use of horizontal drilling in the Granite Wash play due to the belief that the economics of the Granite Wash play will be significantly enhanced due to the fewer number of wells and lower capital required to develop the same amount of acreage versus conventional vertical drilling results. During 2009 42% of the drilling permits were for horizontal wells. This is an increase of 16% from 2008. We anticipate that this trend will continue, resulting in higher initial production rates but steeper decline curves during the first year.
The processing plants in our East Panhandle System, given the current drilling activity, have sufficient processing capacity to accommodate our customers’ current needs until drilling levels increase. In order to provide additional processing capacity to our East Panhandle System, we initiated a project to refurbish the Stinnett cryogenic processing plant, located in the West Panhandle System, and relocate it to the East Panhandle System to replace the existing Arrington lean oil processing plant, resulting in additional processing capacity and improved processing economics. This project was temporarily postponed in early 2009. On February 15, 2010, we announced our plans to complete the project. The refurbished Stinnett plant, now renamed the Phoenix plant, will replace the existing Arrington plant, resulting in improved efficiencies for existing volumes and increased capacity to serve the need for future processing capacity as the horizontal drilling activity in the Granite Wash play resumes in the East Panhandle area.
System Description. The East Panhandle System consists of the following:
| | • | approximately 1,100 miles of natural gas gathering pipelines, ranging from 4 inches to 12 inches in diameter with approximately 54,500 horsepower of associated pipeline and plant compression; |
| | • | four active natural gas processing plants with an aggregate capacity of 96 MMcf/d; and |
| | • | average gathered volumes of both wet and dry gas of approximately 98 MMcf/d for 2009. |
Canadian System: The system consists of 359 miles of natural gas gathering pipelines and two cryogenic natural gas processing plants referred to as the Red Deer Plant and the Canadian Plant. The Red Deer Plant was refurbished and placed back in service in June 2007; capable of processing 25 MMCF/d of natural gas. The Canadian system gathers raw natural gas from producers and delivers the gas to the Canadian Plant, the Red Deer Plant, the Cargray System or the Arrington System.
Arrington System: The system consists of 537 miles of natural gas gathering pipelines and a refrigerated lean oil natural gas processing plant (Arrington Plant).
System 97 Gathering System: The System 97 Gathering System consists of 77 miles of natural gas gathering pipelines. The system gathers raw natural gas from producers and delivers the gas to the interstate pipeline system. This natural gas is dry gas that does not require processing prior to delivery to the pipeline grid.
Buffalo Wallow Gathering System: The Buffalo Wallow Gathering System consists of 113 miles of natural gas gathering pipelines. The system gathers raw natural gas from producers and delivers the gas to the interstate pipeline system. This natural gas is dry gas that does not require processing prior to delivery to the pipeline grid; however, a portion of the natural gas does contain hydrogen sulfide that is removed prior to delivering the gas to the interstate pipeline system.
Natural Gas Supply. As of December 31, 2009, approximately 533 wells and central delivery points were connected to our East Panhandle System. There are approximately 136 producers with the primary producers connected to the East Panhandle System being Bravo Natural Gas, LLC, Prize Operating Company, BP Americas and Chevron Texaco Exploration & Production. The Anadarko basin, from where this natural gas is produced, extends from the western portion of the Texas Panhandle through most of central Oklahoma. The East Panhandle System averaged gathered volumes of approximately 93 MMcf/d during the fourth quarter of 2009.
Natural gas from new wells located in the area served by the East Panhandle System generally have an initial annual production decline rate of approximately 75%, but after the first year of production the decline rates decreases to between 35% and 30%. These decline rates continue to decrease over time, eventually stabilizing at 10% to 15% after several years of production. Approximately 75% of the natural gas that is gathered on our East Panhandle System is processed to recover the NGL content, which generally ranges from 4.0 to 5.0 gpm. Approximately 25% of the natural gas gathered in the East Panhandle System is not processed but is treated for removal of carbon dioxide and hydrogen sulfide to make the natural gas marketable. This natural gas can be isolated and sent to the treating facilities while the remaining system is used to gather the natural gas into the processing plants.
On the East Panhandle System, natural gas is contracted for at the wellhead primarily under percent-of proceeds and fee-based arrangements that range from one to five years in term. As of December 31, 2009, approximately 55%, 20%, 12% and 13% of our total throughput in the East Panhandle System was under percent-of-proceeds, fee-based, fixed recovery and keep-whole arrangements, respectively.
Competition. With the growth in production in the Granite Wash play, a number of midstream companies have built plants in the area; however, our primary competitor in this area is Enbridge, Inc. The key drivers in this high growth area, in order to continue to connect producer wells, are the ability to provide low pressure gathering services, to provide outlet capacity for the natural gas as it is brought into producing status and to provide high value efficient plant processing. We have extensive gathering systems that are situated in the Granite Wash play. We expanded these systems during 2007 by approximately 24 MMcf/d of processing capacity by refurbishing and restarting the Red Deer cryogenic plant. In 2008, we had approved a project to refurbish the Stinnett Plant and move it to the Arrington Plant site to replace the existing Arrington Plant. Due to depressed commodity prices and pending a review of drilling activity by our producer-customers, this project was put on hold for 2008 and 2009. However, given the overall improvement in commodity prices and our view of producer-customers’ drilling activity, we have determined to proceed with the relocation of the Stinnett Plant to the Arrington Plant location and to further consolidate the Canadian Plant. In 2009 we added additional compression at our Roberts County plant to expand gathering capacity from 14 MMcf/d to 21 MMcf/d to accommodate additional Granite Wash production. We continue to review additional projects to remain competitive in connecting new natural gas.
West Panhandle System
The West Panhandle System gathers and processes natural gas produced from the Anadarko basin in Moore, Potter, Hutchinson, Carson, Roberts, Gray, Wheeler and Collingsworth Counties located in the western part of the Texas Panhandle.
System Description. The West Panhandle System consists of:
| | • | approximately 2,643 miles of natural gas gathering pipelines, ranging from two inches to 24 inches in diameter, with approximately 78,500 horsepower of associated pipeline and plant compression; |
| | • | three active natural gas processing plants with an aggregate capacity of 61 MMcf/d; |
| | • | a propane fractionation facility with capacity of 1.0 MBbls/d; |
| | • | a condensate collection facility; and |
| | • | average gathered volumes of wet gas of approximately 40 MMcf/d for 2009. |
Cargray System: Consists of 905 miles of natural gas gathering pipelines and a cryogenic natural gas processing plant (Cargray Plant). The system includes a propane fractionation facility for producing specification propane for sales into local markets. The system is a vacuum pressure gathering system gathering natural gas from very low volume wells.
Gray System: Consists of 615 miles of natural gas gathering pipelines and a cryogenic natural gas processing plant (Gray Plant). The gathering system is a vacuum pressure gathering system gathering natural gas from very low volume wells.
Lefors System: Consists of 663 miles of natural gas gathering pipelines and a cryogenic natural gas processing plant (Lefors Plant). The gathering system is a vacuum pressure gathering system gathering natural gas from very low volume wells.
Stinnett Gathering System: Consists of 451 miles of natural gas gathering pipelines. The gathering system is a vacuum pressure gathering system gathering natural gas from very low volume wells. In July 2008, the cryogenic plant (Stinnett Plant) that was a part of the Stinnett System was shutdown and we began redirecting the Stinnett System gas to the Cargray System. The Stinnett plant has been refurbished. In 2008, we refurbished the cryogenic plant (the Stinnett Plant) that was part of the Stinnett System and had approved moving the Stinnett Plant to the Arrington Plant site. As discussed above, this project was put on hold during 2008 and 2009. However, given the overall improvement in commodity prices and our view of producer-customers’ drilling activity, we have determined to proceed with the relocation of the Stinnett Plant, now renamed the Phoenix plant, to the Arrington Plant location and to further consolidate the Canadian Plant.
Turkey Creek Gathering System: Consists of nine miles of natural gas gathering pipelines. The system gathers raw natural gas from producers and delivers the gas to the Cargray Plant. The gathering system is a vacuum pressure gathering system gathering natural gas from very low volume wells.
Super Drip Condensate Collection Facility: The Super Drip condensate collection facility receives condensate collected from various gathering systems where it is then separated from the collected water and treated.
Natural Gas Supply. As of December 31, 2009, approximately 1,400 wells and central delivery points were connected to our West Panhandle System. There are approximately 118 producers with the primary producers connected to the West Panhandle System being Chesapeake Energy Marketing, Inc., Excel Production Company, and W.O. Operating Company. The West Panhandle System, from where this natural gas is produced, extends through the western and southern part of the Texas Panhandle. The West Panhandle System averaged throughput of approximately 39 MMcf/d during the fourth quarter of 2009.
Natural gas production from wells located within the area served by the West Panhandle System generally are low volume wells being gathered at very low pressure. Natural gas from wells located in the area generally have an annual rate of decline of 6% to 9%. This natural gas is processed to recover the NGL content which generally ranges from 8.0 to 18.0 gpm. These low volume, high gpm wells are susceptible to interruptions during freezing conditions such as can be experienced during the winter in the Texas Panhandle. Much of the natural gas in the West Panhandle System is high in nitrogen content due to the formation from which it is produced and in oxygen content due to the numerous wellhead compressors being operated by the producers and the formation from which it is produced. The interstate pipelines to which the plants are connected have continued to waive their gas quality specifications requiring lower nitrogen and oxygen content in the natural gas delivered to their pipelines. Our current processing plants in the West Panhandle System are not capable of recovering and rejecting the nitrogen or removing the oxygen in the producer’s natural gas to meet the current interstate pipeline specifications. In the event that the interstate pipelines discontinue the waivers, we will be required to modify our plants at a substantial cost to meet the pipeline specifications. We produce over 2,000 barrels per day of condensate in the West Panhandle systems. We are currently expanding our condensate stabilization capacity for the West Panhandle System by using out-of-service equipment at our Cargray Plant to add an additional 1,000 barrels per day of capacity. This will allow us to make a lower vapor pressure condensate product to provide a higher value product for sale. We continue to review additional condensate stabilization projects that may provide an opportunity to handle third party condensate for a fee. We continue to review additional plant consolidation projects in order to rationalize plant processing capacity and operating costs in an area where the gas decline continues in the range of 7% to 9% per year.
On the West Panhandle System, natural gas is purchased at the wellhead primarily under keep-whole arrangements that are life-of-lease, fixed recovery and percent-of proceeds arrangements that range from one to five years in term. As of December 31, 2009, approximately 54%, 34%, and 12% of our total throughput in the West Panhandle System was under keep-whole, fixed recovery and percent-of-proceeds arrangements, respectively. Our keep-whole arrangements have a significant gathering fee component.
Competition. Our primary competition in this area is Duke Energy Field Services, L.P. The key drivers in this low growth area are to continue to improve operating efficiencies, provide low pressure gathering services and to maintain equipment reliability for improved on line operations. In 2008, we refurbished the cryogenic plant (the Stinnett Plant) that was part of the Stinnett System and had approved moving the Stinnett Plant to the Arrington Plant site. As discussed above, this project was put on hold during 2008 and 2009. However, given the overall improvement in commodity prices and our view of producer-customers’ drilling activity, we have determined to proceed with the relocation of the Stinnett Plant to the Arrington Plant location and to further consolidate the Canadian Plant.
Texas Panhandle Markets.Our residue gas is marketed primarily to large trading companies who buy the gas at the tailgate of our plants. Our NGLs are marketed primarily to ONEOK Hydrocarbons. The residue gas and NGL liquids are sold under month to month agreements. In addition, condensate produced on the system is exchanged by Petro Source Partners, LP to Cushing, Oklahoma where we sell it to various parties. The condensate is sold under contract terms of one year or less.
East Texas/Louisiana Segment
Our East Texas/Louisiana operations are located primarily in Angelina, Nacogdoches, Rusk, Cherokee, Smith, Harris, Waller, Montgomery, Austin, Colorado, Robertson, Grimes, Washington, Polk, Tyler, Jasper, Newton, Upshur, Gregg, Wood and Panola Counties, Texas and Vernon, DeSoto, Lincoln, Jackson, Bienville, Caldwell and Bossier Parishes, Louisiana. Through our East Texas/Louisiana Segment, we offer producers natural gas gathering, treating, processing and transportation and NGL transportation. Our East Texas/Louisiana systems are located in the Texas Railroad Commission (the “TRRC”) District 3, 5 and 6, which has experienced significant growth activity since 2002. According to the EIA, total proved natural gas reserves have grown from 31.4 Tcf at year-end 2007 to 35.2 Tcf at year-end 2008. The following is a map of our East Texas/Louisiana Segment:
Below is a graph showing processing plant utilization for the East Texas/Louisiana Segment. The volumes include only the wet gas volumes that were gathered and processed prior to delivery to the interstate or intrastate pipeline systems.
Note: The drop in capacity in July 2008 was due to the shutdown of the Panola JT Plant. The increase in processing capacity in October 2008 was due to the Millennium Acquisition. The September 2008 drop in volume processed was due to the impact of Hurricanes Ike and Gustav that resulted in the shut-in of production as a safety precaution and the resulting damage to third party NGL infrastructure downstream from our plants. Volumes exceeding capacity in July and October of 2008 was the result of prior period adjustments.
Systems Description. The facilities that comprise our East Texas/Louisiana operations, including those acquired through the Millennium Acquisition completed in October, 2008, consist of:
| | • | approximately 1,195 miles of natural gas gathering pipelines, ranging from two inches to 12 inches in diameter, with approximately 43,700 horsepower of associated pipeline compression; |
| | • | a 100 MMcf/d cryogenic processing plant; |
| | • | a 145 MMcf/d cryogenic processing plant, in which we own a 25% undivided interest; |
| | • | five JT/refrigeration processing plants with an aggregate capacity of 52 MMcf/d; |
| | • | a 19-mile NGL pipeline; and |
| | • | average gathered volumes of both wet and dry gas of approximately 249 MMcf/d for 2009. |
Brookeland System: Consists of 386 miles of natural gas gathering pipelines and a cryogenic natural gas processing plant (Brookeland Plant).
Camp Ruby Gathering System: The system gathers raw natural gas from producers and delivers the gas to the Indian Springs Plant. We have a 20% non-operated ownership position in the gathering system
Indian Springs Plant: The Indian Springs plant is a cryogenic natural gas processing plant that processes raw natural gas gathered on the Camp Ruby and Tyler County gathering systems. We have a 25% non-operated ownership position in the plant. The plant is operated by Enterprise Products Partners, LP.
Tyler County Gathering System: Tyler County Gathering System consists of 75 miles of natural gas gathering pipelines ranging in size from two inches to 10 inches in diameter. The system gathers raw natural gas from producers and delivers the gas to the Brookeland Plant and to the Indian Springs Plant. We completed construction on this system in 2007.
Panola Gathering System: This system consists of 33 miles of natural gas gathering pipelines. In July 2008, the Panola JT plant that was a part of the system was shutdown and a connection to Markwest Energy Partners, LP was made to deliver the natural gas for processing prior to delivery to the interstate pipeline grid.
Rosewood System: This system consists of 36 miles of natural gas gathering pipelines and a refrigeration natural gas processing plant that processes the raw natural gas to meet the minimum interstate pipeline gas quality specifications. The system gathers raw natural gas from producers and delivers the gas to the Rosewood refrigeration plant.
Belle Bower System: This system consists of 68 miles of natural gas gathering pipelines and a JT natural gas processing plant (Belle Bower JT Plant) that processes the raw natural gas to meet the minimum interstate pipeline gas quality specifications.
Vixen Gathering System: The Vixen Gathering System consists of seven miles of natural gas gathering pipelines. The system gathers raw natural gas from producers. The raw natural gas is dry gas and does not require processing prior to delivery to the pipeline grid.
Sligo Gathering System: The Sligo Gathering System consists of ten miles of natural gas gathering pipelines. The system gathers raw natural gas from producers. The raw natural gas is dry gas and does not require processing prior to delivery to the pipeline grid.
Simsboro Gathering System: The Simsboro Gathering System consists of 30 miles of natural gas gathering pipelines. The system gathers raw natural gas from producers. The raw natural gas is dry gas and does not require processing prior to delivery to the pipeline grid.
Quitman Gathering System: The Quitman Gathering System consists of 51 miles of natural gas gathering pipelines. The system gathers raw natural gas from producers. The raw natural gas is dry gas and does not require processing prior to delivery to the pipeline grid.
ETML Gathering System: The ETML Gathering System consists of 221 miles of natural gas gathering pipelines and a 15 MMcf/d J-T plant that processes a small portion of wet gas prior to delivery to the ETML Gathering System. The system gathers raw natural gas from producers. The raw natural gas is dry gas and does not require processing prior to delivery to the pipeline grid.
Douglas East Gathering System: The Douglas East Gathering System consists of 14 miles of natural gas gathering pipelines. The system gathers raw natural gas from producers. The raw natural gas is dry gas and does not require processing prior to delivery to the pipeline grid.
BGS Gathering System: The BGS Gathering System consists of 26 miles of natural gas gathering pipelines. The system gathers raw natural gas from producers. The raw natural gas is dry gas and does not require processing prior to delivery to the pipeline grid.
Robertson County Gathering System: The Robertson County Gathering System consists of 34 miles of natural gas gathering pipelines. The system gathers raw natural gas from producers. The raw natural gas is delivered to third parties for further treating and processing.
North Gathering System: The North Gathering System consists of 85 miles of natural gas gathering pipelines and a 5 MMcf/d JT plant that processes a small portion of wet gas prior to delivery to the North Gathering System. The system gathers raw natural gas from producers. The raw natural gas is dry gas and does not require processing prior to delivery to the pipeline grid. Sections of the system are subject to FERC jurisdiction under Section 311 of the NGPA. There are a number of city gate deliveries from this system.
Central Gathering System: The Central Gathering System consists of 102 miles of natural gas gathering pipelines and a 2 MMcf/d refrigeration plant that processes a small portion of wet gas prior to delivery to the Central Gathering System. The system gathers raw natural gas from producers. The raw natural gas is dry gas and does not require processing prior to delivery to the pipeline grid. Sections of the system are subject to FERC jurisdiction under Section 311 of the NGPA. There are a number of city gate deliveries from this system.
New Ulm Gathering System: The New Ulm Gathering System consists of 15 miles of natural gas gathering pipelines. The system gathers raw natural gas from producers. The raw natural gas is delivered to a third party for processing.
Natural Gas Supply. As of December 31, 2009, approximately 586 wells and central delivery points were connected to our systems in the East Texas and Louisiana regions. Due to the decline in natural gas prices during 2009, drilling activity in our East Texas and Louisiana operations declined. Our Tyler County and Brookeland Systems are situated in the Austin Chalk drilling play in Polk, Tyler and Jasper Counties, Texas. Our ETML system is situated in an active drilling area called the Angelina River Trend complex that has active development in the James Lime and Travis Peak formations of Angelina and Nacogdoches Counties, Texas. While drilling in these areas has continued, the pace at which the drilling has occurred has not been sufficient to maintain our gathered volume rates at the same levels as 2008. These assets are located in areas that have multiple production horizons such that we anticipate that when natural gas prices recover that drilling will increase. Recently there has been active Haynesville Shale drilling activity in the East Texas area. We have an active project to expand our ETML system to provide gathering and treating services to producers particularly in Nacogdoches County. There is active Haynesville Shale drilling resulting in production flowing to our Belle Bower System, located in Desoto Parish, Louisiana, of which at the end of 2009 we were gathering approximately 9.6 MMcf/d. The East Texas/Louisiana segment averaged gathered volumes of approximately 220.6 MMcf/d during the fourth quarter of 2009. As of December 31, 2009, Anadarko Petroleum, Encana Oil & Gas Inc., Ergon Exploration Inc. and XTO Energy Inc., represented 12%, 11%, 11% and 6%, respectively, of the total volumes of our East Texas/Louisiana Segment.
The natural gas supplied to us under our East Texas/Louisiana Systems is generally dedicated to us under individually negotiated long-term and life-of-lease contracts. Contracts associated with this production are generally percent-of-proceeds, which includes percent-of-liquids and percent-of-index, fixed recovery, well head purchases or fee-based arrangements. As of December 31, 2009, the percentage of natural gas under the contract structures were 19% fixed recovery, 41% fee-based, 34% percent of proceeds and 6% purchased at the wellhead.
Markets. Residue gas remaining after processing or gathering is primarily taken-in-kind by the producer customers into the markets available at the tailgates of the plants or pipeline interconnects. Some of the available markets are Houston Pipeline Company, Natural Gas Pipeline Company, Tennessee Gas Pipeline, Crosstex Energy L.P. and Southern Natural Pipeline. Our NGLs are sold to various companies with Duke Energy Field Services, L.P. representing the largest purchaser.
Competition. Our primary competition in this area includes Anadarko Petroleum, Crosstex Energy, L.P., Duke Energy Field Services L.P., Energy Transfer Partners, LP and Enterprise Products Partners, L.P. The key drivers are high run-time rates of the assets, connections to premium markets and low pressure gathering services. During 2009 we continued to expand the Brookeland Gathering System and Tyler County gathering system to gather the expanding Austin Chalk Drilling activity by 12.7 miles of 4 inch to 10 inch pipeline at a cost of $5.4 million.
South Texas Segment
As a result of the Millennium Acquisition on October 1, 2008, we expanded the footprint of our South Texas segment. The South Texas Segment systems primarily gather natural gas and recovers NGLs and condensate from natural gas produced in the Frio, Vicksburg, Miocene, Canyon Sands and Wilcox formations in Hidalgo, Willacy, Brooks, Zapata, Starr, Cameron, Crockett and Colorado Counties in South Texas and in the Permian Basin. The South Texas Segment also provides producer services by purchasing natural gas at the wellhead for sale into third-party pipeline systems. Our South Texas systems are located in the Texas Railroad Commission (the “TRRC”) District 4 and 8, which has experienced significant growth activity since 2002; however, due to the decline in natural gas prices drilling activity has been significantly reduced in the South Texas segment. According to the EIA, total proved natural gas reserves have declined from 14.5 TCF at year-end 2007 to 14.4 TCF at year-end 2008. The following is a map of our South Texas Segment.
Below is a graph showing processing plant utilization for the South Texas Segment. The volumes include only the wet gas volumes that were gathered and processed prior to delivery to the interstate or intrastate pipeline systems.
System Description. The South Texas Segment consists of:
| | • | approximately 266 miles of natural gas pipeline ranging in size from two inches to 20 inches in diameter; |
| | • | compressor stations with approximately 14,700 aggregate horsepower; |
| | • | three processing stations consisting of 11 active skids and related facilities for an aggregate capacity of 87 MMcf/d; and, |
| | • | average gathered volumes of both wet and dry gas of approximately 83 MMcf/d for 2009. |
Phase 1 Gathering System: The Phase 1 Gathering System consists of 70 miles of natural gas gathering pipelines. The system gathers raw natural gas from producers and delivers the gas to multiple market outlets.
Raymondville System: The Raymondville System consists of 48 miles of natural gas gathering pipelines and a JT natural gas processing plant (Raymondville JT Plant). A JT plant typically recovers less NGL production than a cryogenic plant. The system gathers both raw and treated natural gas from producers and delivers the gas to multiple market outlets.
San Ignacio Gathering System: The San Ignacio Gathering System consists of six miles of natural gas gathering pipelines. The system gathers raw natural gas from producers and delivers the gas to Tennessee Gas Pipeline. The raw natural gas is dry gas and does not require processing prior to delivery to the pipeline grid.
TGP McAllen Gathering System: The TGP McAllen Gathering System consists of 13 miles of natural gas gathering pipelines. The system gathers raw natural gas from producers and delivers the gas to Tennessee Gas Pipeline. The raw natural gas is of such quality that it does not require processing prior to delivery to the pipeline grid.
Merit JT Plant: The Merit JT plant is a JT natural gas processing plant that processes raw natural gas to meet the minimum interstate pipeline gas quality specifications. A JT plant typically recovers less NGL production than a cryogenic plant. The gas from the plant is delivered to the Tennessee Gas Pipeline.
Wildhorse Gathering System: The Wildhorse Gathering System consists of 113 miles of natural gas gathering pipelines located in Crockett County, Texas, in the prolific Permian Basin. The system gathers raw natural gas from producers and delivers the gas to a third party plant for processing.
Sweeny Gathering System: The Sweeny Gathering System consists of 16 miles of natural gas gathering pipelines. The system gathers raw natural gas from producers and delivers the gas to a third party plant for processing. We own a 50% non-operated ownership in the system. We account for this system as an equity method investment.
Producer Services: On April 1, 2009, we sold our producer services business by assigning and novating the contracts under this business to a third-party purchaser. We sold the producer services business to a third-party purchaser as it was a low-margin business that was not core to our operations. We received an initial payment of $0.1 million for the sale of the business. In addition, we received a contingency payment of $0.1 million in October 2009. We have received since April 1, 2009 and will continue to receive a monthly payment equivalent to $0.01 per MMbtu on the volume of gas that flows pursuant to the assigned contracts until March 31, 2011. We have classified the operations from this business as discontinued operations.
Natural Gas Supply. As of December 31, 2009, the South Texas Segment provides gathering and/or marketing services to approximately 33 producers. The South Texas Segment operates approximately 94 meter stations for receipt or delivery of producer gas. The primary producers on the South Texas Segment systems are Wagner Energy Corporation (“Wagner Energy”), Chesapeake Energy Corporation (“Chesapeake Energy”), and FIML Natural Resources LLC (“FIML Natural gas production from wells located in the area served by the South Texas Segment’s systems generally have steep rates of decline during the first few years of production, therefore throughput must be maintained by the addition of new wells. The South Texas Segment averaged gathered volumes of approximately 76 MMcf/d during the fourth quarter of 2009. As of December 31, 2009, Wagner Energy, Chesapeake Energy and FIML represented 35.4%, 33.4% and 9.7%, respectively, of the total volumes of our South Texas Segment.
On the South Texas Segment’s systems, natural gas is gathered, compressed, dehydrated, and/or processed under fee-based arrangements. The gas is processed primarily for hydrocarbon dewpoint control to satisfy the gas quality requirements of the receiving interstate pipelines such as Tennessee Gas Pipeline Company.
Markets. The majority of natural gas deliveries from the South Texas systems go to Tennessee Gas Pipeline Company or Enterprise Texas Pipeline. The natural gas is sold primarily at the delivery points into the interstate or intrastate pipeline systems to various customers. Our South Texas Segment’s producer services three largest markets were Cypress Pipeline Company, Houston Pipeline Company, and Total Gas & Power North America Company.
Competition. Our primary competition in our South Texas Segment is DCP Midstream, LLC and Enterprise Products Partners, L.P. The key drivers in this area are low pressure gathering and multiple market outlets for the natural gas. Much of the natural gas drilled within the vicinity of our gathering systems is of sufficient wellhead pressure to deliver directly to the interstate pipelines in the 1000 psig range; however, the wells quickly decline in pressure. We operate our systems at lower pressures which offers the producers an alternative to installing their own compression. Many of the interstate pipelines in our area are constrained from time to time. Offering multiple market outlets is important to our customers to insure that they can produce their natural gas.
Gulf of Mexico Segment
As a result of the Millennium Acquisition, which closed October 1, 2008, we expanded the footprint of our Midstream Business into the Gulf of Mexico. Our Gulf of Mexico Segment’s operations are non-operated ownership interests in a number of pipelines and onshore plants which are all located in southern Louisiana. The Gulf of Mexico Segment’s systems primarily process natural gas from the Transco, Gulf South and Tennessee interstate pipelines and recover NGLs and condensate from natural gas produced in the Outer Continental Shelf of the Gulf of Mexico. The Gulf of Mexico Segment’s operations also provide producer services by arranging for the processing of producers’ natural gas into third-party processing plants, which we describe as our Mezzanine Processing Services in the Gulf of Mexico Segment. Our Gulf of Mexico Segment’s systems have experienced decreased activity since 2002. According to the EIA, total proved natural gas reserves have decreased from 11.1 TCF at year-end 2007 to 10.5 TCF at year-end 2008. The following is a map of our Gulf of Mexico Segment.
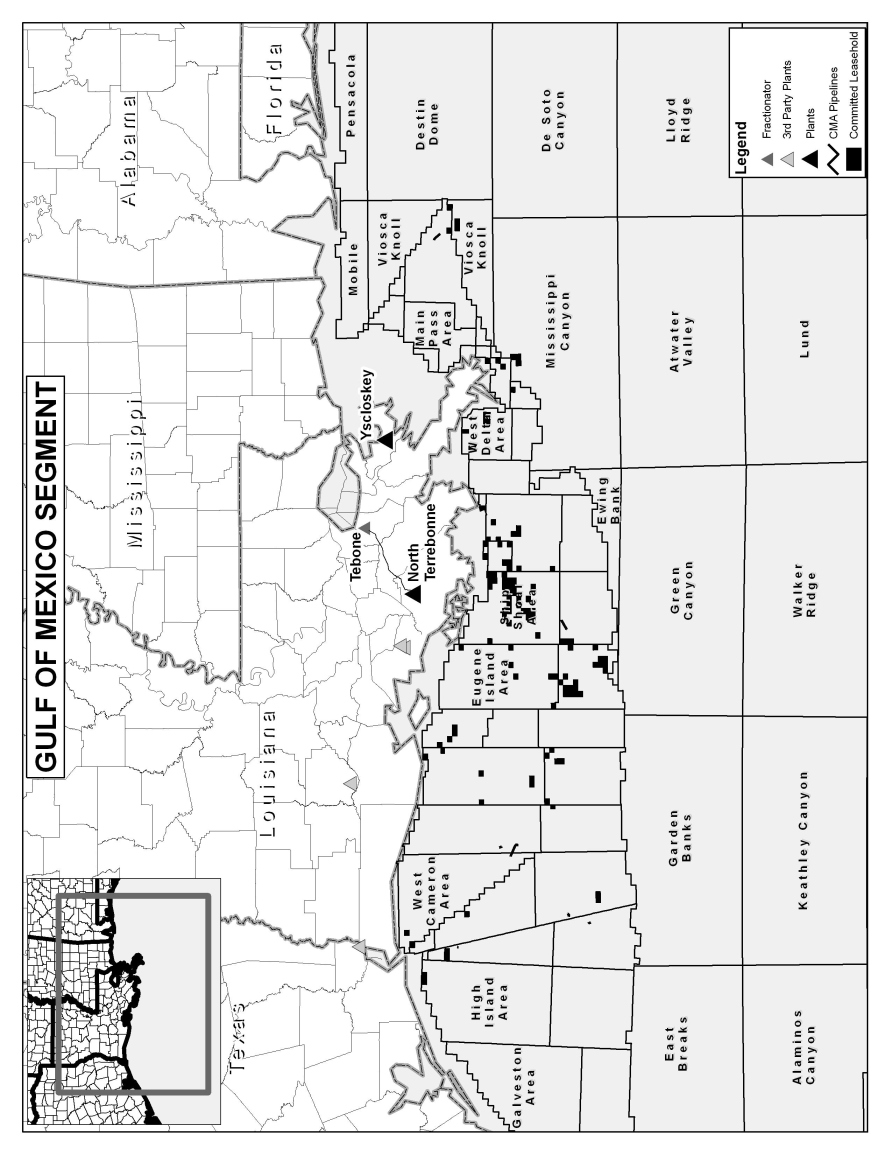 Below
Below
Below is a graph showing processing plant utilization for the Gulf of Mexico Segment. The capacity and volumes processed reflect our net interests in the plants. The volumes include only the wet gas volumes that were gathered and processed prior to delivery to the interstate or intrastate pipeline systems.
Note. The Gulf of Mexico Segment processing utilization was impacted by Hurricanes Ike and Gustav. The North Terrebonne Plant returned to limited operations in November 2008 and the Yscloskey plant did not restart until January 2009. The drop in capacity in September 2009 was due to the annual adjustment of plant ownership at the Yscloskey Plant.
Systems Description. The facilities that comprise our Gulf of Mexico Segment, acquired through the Millennium Acquisition which closed October 1, 2008, consist of:
| | • | approximately 40 miles of natural gas gathering pipelines located in the Gulf of Mexico or Galveston Bay, ranging from four inches to 20 inches in diameter. The pipelines are operated by others. |
| | • | a 1.85 Bcf/d cryogenic processing plant in which we own a 13.78% interest; |
| | • | a 1.35 Bcf/d cryogenic processing plant, in which we own a 5.16% interest; |
| | • | a 30 MBbl/d NGL fractionator in which we own a 5.16% interest; and |
| | • | average processed volumes of both wet and dry gas of approximately 117 MMcf/d for 2009. |
CMA Pipelines: The CMA Pipelines consist of various interests in 28 miles of offshore natural gas and condensate gathering pipeline segments in the Gulf of Mexico acquired from Trunkline Pipeline Company. The pipeline segments gather raw natural gas and condensate generally from a single offshore platform and deliver the gas to various pipeline interconnects with Trunkline Pipeline Company. The CMA Pipelines are operated by Trunkline Pipeline Company and Enterprise Products Partners, LP.
Yscloskey Plant: The Yscloskey Plant is a refrigerated lean oil natural gas processing plant located in Saint Bernard Parish, Louisiana that processes raw natural gas transported on the Tennessee Pipeline. We have a 13.78% non-operated ownership interest in the plant. Targa Resources Inc. operates the plant.
North Terrebonne Plant: The North Terrebonne plant is a refrigerated lean oil natural gas processing plant located in Terrebonne Parish, Louisiana that processes raw natural gas transported on the Transco Pipeline and the Gulf South Pipeline. As of December 31, 2009 we had a 5.16% non-operated ownership interest in the plant. Subsequent to December 31, 2009, our non-operated ownership interest adjusted to 1.67%. The ownership adjusts annually based upon volume of an owner’s share of dedicated gas volumes and liquids recovered at the plant compared to other owners of the plant. The reduced production of our dedicated gas early in the year due to Hurricanes Ike and Gustav negatively impacted our ownership position in the facility. Enterprise Products Partners, LP operates the plant.
Tebone Fractionator: The Tebone Fractionator is a NGL fractionation plant located in Terrebonne Parish, LA that separates an NGL stream into its specification products of ethane, propane, isobutane, normal butane and natural gasoline which are then sold to various markets. The Tebone Fractionator substantially fractionates the y-grade NGL stream produced from the North Terrebonne Plant. As of December 31, 2009, we had a 5.16% non-operated ownership interest in the fractionator. Subsequent to December 31, 2009, our non-operated ownership interest adjusted to 1.67%. The ownership adjusts annually based upon the ownership interest in the North Terrebonne Plant. Enterprise Products Partners, LP operates the Tebone Fractionator.
Galveston Bay Gathering System: The Galveston Bay gathering system consists of 12 miles of natural gas, water and condensate gathering pipeline segments located in Galveston Bay, Texas. These pipeline segments gather water and condensate mixture from a single platform located in state waters and deliver the natural gas to a downstream pipeline for further transportation to an onshore separation facility owned by others. In December 2009 the original investment criteria for a reduction of our ownership were met thereby reducing our ownership in the assets from 100% to 50%. This system is operated by Layton Energy, the producer on the system.
Mezzanine Processing Services: Our Mezzanine Processing Services arranges for the processing of producers’ natural gas into third-party processing plants. This is accomplished by us entering into contracts with various processing plants in south Louisiana in which we have no ownership position and then contracting with various producers to have their gas processed in these plants. Producers enter into these arrangements with us as we provide the management of the processing of their natural gas for them. Typically, these are smaller producers without staffing to handle the management of the processing themselves. The fee we receive for these services is typically a percentage of the NGLs recovered from their natural gas. We have no keep-whole exposure under our contracts with the producers.
Natural Gas Supply. The supply of natural gas is highly dependent upon the success of drilling activity that occurs offshore to feed the offshore pipelines in which we have no ownership or control. These offshore pipelines deliver natural gas to plants that we have an ownership interest in or a contract with the owner to process natural gas. As of December 31, 2009, the Gulf of Mexico Segment provides processing services to approximately 16 producers. Our processing contracts with the producers are specific to their ownership interests in certain blocks located in the Gulf of Mexico or state waters. These producers have also entered into rights agreements with us whereby they have dedicated their processing interest to us under a life-of-lease term. We, in turn, enter into processing agreements with the producers whereby we receive a portion of the NGLs as a fee for the services we provide. We have no keep-whole exposure under our direct processing agreements with the producers. In addition to the natural gas which we have under direct contract, we also receive an economic benefit from stranger’s gas as an owner in the Yscloskey and North Terrebonne Plants. Stranger’s gas is the natural gas that the plant operator contracts for on behalf of the collective plant owners for the benefit of plant owners in proportion to their ownership interest. This may be contracted for directly with various producers or with the pipeline delivering gas to the plant. The primary producers served by our Yscloskey and North Terrebonne systems, in which we have an ownership share, are Stone Energy Corporation, McMoRan Exploration Company and ExxonMobil Corporation. The gas we currently process comes primarily from what is referred to as the Gulf of Mexico Shelf which is an area extending out from the coast of Louisiana approximately 100 miles.
The Yscloskey and North Terrebonne Plants suffered significant damage from hurricanes Gustav and Ike, respectively. The damage resulted in significant downtime for both facilities. North Terrebonne Plant restarted operations in November 2008 and the Yscloskey Plant restarted operations in January 2009. The cost to repair the facilities and the cost of business interruption are being covered by either insurance proceeds or by the sellers under the Millennium Acquisition purchase and sale agreement. In addition to damage to the facilities, the third-party pipelines delivering gas to the plants and the producer platforms suffered damage that has resulted in reduced volumes for processing. Due to the hurricanes, we have permanently lost 26 MMcf/d of contracted volumes due to the producers’ election not to repair pipelines or platforms to restore production. The hurricanes also had impacts to our Mezzanine Processing Services due to the shut-in of production in the Gulf of Mexico and the impact on third-party plants. Our Mezzanine Processing Services have returned to near pre-hurricane levels.
Tennessee Gas Pipeline acquired the Bluewater lateral from Columbia Gulf Pipeline and redirected the gas toward the Yscloskey Plant. This increased the natural gas we have under contract for processing at the Yscloskey Plant while reducing the volume of gas in our Mezzanine Processing Business. This is due to shifting gas under contract in the Mezzanine Processing Services to the Yscloskey Plant. The result will be increased margin for us due to reduced costs for processing the gas.
Our three largest producers in the Mezzanine Processing Services business are Stone Energy Corporation, Hall-Houston Exploration and Apex Oil & Gas, Inc.
Natural gas production from wells located in the area served by the Gulf of Mexico Segment generally have steep rates of decline during the first few years of production, therefore throughput must be maintained by the addition of new wells. The Gulf of Mexico Segment averaged processed volumes of approximately 119 MMcf/d during the fourth quarter of 2009. As of December 31, 2009, Stone Energy Corporation represented 62% of the total volumes of our Gulf of Mexico Segment. On the Gulf of Mexico Segment’s gathering systems, natural gas and condensate is gathered under fee-based arrangements. We do not purchase any natural gas or condensate from producers for purposes of reselling in the Gulf of Mexico Segment’s systems.
Markets. The majority of natural gas liquids produced from the Gulf of Mexico Segment’s systems are transported by pipelines for fractionation at the Norco, Toca and Tebone fractionators. Once fractionated, the specification products are sold to Enterprise Products Partners L.P. under a year-to-year contract.
Competition Our competition in the Gulf of Mexico at the Yscloskey Plant and the North Terrebonne Plant is primarily from other owners in those plants as well as the plant operators who are attempting to contract with the producers on behalf of all the plant owners. The owners most active in contracting directly for new supplies of natural gas are Enterprise Products Partners, L.P., as the operator of the North Terrebonne Plant, Targa Resources, Inc., as the operator of the Yscloskey Plant, and DCP Midstream, L.P. In our Mezzanine Processing Services, the primary competition comes from the plant operators at the various third party plants in which we have contracts and from Texon L.P. who provides a similar service as to ours.
Upstream Business
Upstream Business Overview
Our Upstream Business has long-lived, high working interest properties located primarily in Southern Alabama (where we also operate the associated gathering and processing assets), East Texas, South Texas and West Texas regions. As of December 31, 2009, these working interest properties included 260 operated productive wells and 147 non-operated wells with net production of approximately 5,300 Boe/d and proved reserves of approximately 33.8 Bcf of natural gas, 7.5 MMBbls of crude oil, and 6.1 MMBbls of natural gas liquids, of which 88% are proved developed. The reserve life index is approximately 10 years.
We entered the Upstream Business in August 2007 through the Redman and EAC acquisitions that included operated properties in East Texas, South Texas, Mississippi and Alabama, as well as non-operated properties in East Texas and Louisiana. In April 2008 we closed on the Stanolind Acquisition, which provided our entry to the prolific Permian Basin of West Texas. Each of these acquisitions is consistent with our focus to acquire assets with a relatively high percentage of proved developed producing reserves, characterized by low production decline rates, and located in areas providing low risk infill drilling and recompletion opportunities. We pursue operated assets with generally high working interests to better control the development of our reserves and maximize the efficiency of our cost structure. The average working interest of our producing operated properties is 92%. Our properties are diversified in multiple fields and producing basins. Our largest fields, comprising 75% of net production, are the Big Escambia Creek field in Escambia County, Alabama, the Jourdanton field in Atascosa County, Texas, the Ward Estes field in Ward County, Texas, the Ginger/Ginger S.E. fields in Rains County, Texas and the Flomaton and Fanny Church fields in Escambia County, Alabama. The remaining 25% of our fields are located in East Texas, West Texas and Mississippi.
The production in our East Texas and Alabama fields is predominantly from the Smackover formation which contains significant percentages of hydrogen sulfide and carbon dioxide which must be extracted prior to sales. The Alabama assets include two operated treating plants to facilitate the extraction of these contaminants and elemental sulfur, and one operated processing plant to process and sell natural gas liquids. The Alabama field assets also include gathering pipelines, saltwater disposal wells and other equipment to conduct efficient operations. The production from our East Texas assets is treated and processed by Regency Field Services at its Eustace Plant. Regency provides gathering, compression, and treating to extract hydrogen sulfide and carbon dioxide prior to residue gas sales. In addition, the gas stream is processed to extract natural gas liquids for sales, and elemental sulfur is recovered for sales at Regency’s Eustace Plant. The Jourdanton field in Atascosa County, Texas produces from the Edwards formation and contains a significantly lower percentage of hydrogen sulfide (2%) and is treated at Regency Field Services’ Tilden Plant.
The Permian assets acquired in the Stanolind acquisition are characterized by long life oil and gas reserves produced from multiple pay horizons with low decline rates. Production from these assets averaged 812 Boe/d in 2009. Since January 2009, we have drilled and completed two wells on these Permian assets with a success rate of 100%. The growth prospects in our core areas are driven primarily by infill drilling, low risk recompletions and workovers of existing formations or shut-in wells located on our properties.
Upstream Business Strategies
| | • | Enhancing the production and profitability of our existing assets—We endeavor to manage our assets in a manner to maximize the amount of hydrocarbons we can profitably extract. We accomplish this by employing sound petroleum engineering practices to identify opportunities to improve production rates and recoveries and to reduce our operating costs. Examples of these types of opportunities are the installation of additional surface compression, recompletions, well workovers and stimulations, and the installation of artificial lift and other production equipment modifications. We pursue these opportunities at a measured pace to attempt to maintain constant or slightly growing production rates and cash flows. The performance measures we use to assess the success of our production enhancement activities are accretion, internal rate of return, and unit development and operating cost. |
| | • | Pursuing organic growth opportunities—In our Upstream Business, drilling our proved undeveloped and probable locations are the sources of organic growth. We employ sound petroleum engineering and geological practices to identify and quantify these opportunities, and we pursue them in a manner that seeks to reduce risk and cost. We have identified numerous proved undeveloped and probable locations on our existing assets and we prudently drill these locations to add reserves and production to maintain our growth production. We measure the success of these projects by their accretion, internal rate of return, and unit development cost. |
| | • | Acquiring oil and natural gas assets—Our goal is to grow our assets and the distributions to our unitholders, in part, through the acquisition of oil and gas properties. We employ an experienced and qualified staff of engineers, geoscientists, and financial and legal experts who can effectively evaluate, negotiate and close these transactions. We focus our acquisition efforts on properties that we believe are best-suited to accomplish our objective of delivering stable and growing distributions; specifically, we seek properties with the following characteristics: |
| | • | Low decline rates—In order to provide a platform for stable and growing distributions, we seek assets that have historically low production decline rates. |
| | • | Relatively high level of developed reserves—We seek a balance of future development potential and current production rate. The current production rate is important to ensure that the acquisition will be immediately accretive (i.e., provide adequate cash flow so that distributions can be increased immediately), but the undeveloped potential is necessary to ensure that production declines can be offset by additional drilling and recompletions. |
| | • | Relatively low-risk development—We seek properties that have multiple horizons in the substrata that are capable of producing oil and gas hydrocarbons. Our goal is to obtain properties where we can drill an oil or gas well and encounter multiple productive horizons and therefore reduce the risk of drilling an uneconomic well. We avoid investment opportunities that require significant exploration activities. Although we cannot guarantee future distributions, we have attempted to structure our Partnership to deliver stable distributions to our investors; we do not believe that this objective is compatible with a high level of exploration activity. |
| | • | Oil/natural gas balance—We diversify our hydrocarbon mix in order to avoid exposure to excessive price swings in one commodity. Although we use commodity hedges to protect the cash flows of our existing production, a significant drop in the price of a commodity could result in a significant reduction in the profitability of drilling activities that are focused on that commodity. |
| | • | Attractively priced markets—We seek to make acquisitions in our Upstream Business predominantly in producing basins where the supply and demand of hydrocarbons in the consuming markets associated with such basin(s) generate a local commodity pricing environment where the basis differential to the major commodity price index is attractive. |
| | • | Wellbore diversification—We attempt to avoid situations in which a single well negative event could result in a significant impact to our cash flows. |
| | • | Operator—We prefer to operate the properties we own. This allows us greater flexibility with respect to future capital investments and allows us to better manage the associated risks. |
The primary measures we use to assess the success of our acquisition program are sustained accretion and internal rate of return.
Upstream Business Competitive Strengths
| | • | We have an experienced knowledgeable management team with a proven record of performance in evaluating, negotiating and closing upstream oil and gas transactions. |
| | • | We have a staff of engineers and support staff that are highly proficient at drilling and operating oil and gas wells in the areas in which we operate production. |
| | • | We derive market intelligence from our Midstream and Minerals Businesses that improve our ability to acquire Upstream assets that meet our investment criteria. If we are successful in selling our Minerals Business, we will continue to derive market intelligence from our Midstream Business that improves our ability to acquire Upstream assets. |
Upstream Significant Properties
Our Upstream business consists of operated and non-operated working interests located in Alabama, Texas, Louisiana and Mississippi. The following table summarizes our holdings as of December 31, 2009.
| | | | | | | | | | | | | |
| Field | Location | | Average net daily sales in 2009 | | Gross productive wells in December 2009 | |
| | Oil, Bbl/d | | Natural gas, Mcf/d | | Natural gas liquids, Bbl/d | | Operated | | Non- Operated | |
| Big Escambia Creek | Escambia County, Alabama | | | 1,116 | | | 2,879 | | | 515 | | | 18 | | | 1 | |
| Jourdanton | Atascosa County, Texas | | | 24 | | | 2,526 | | | — | | | 11 | | | 1 | |
| Ward Estes | Ward County, Texas | | | 231 | | | 882 | | | 138 | | | 93 | | | — | |
| Ginger/Ginger SE | Rains County, Texas | | | 120 | | | — | | | 242 | | | 7 | | | 1 | |
| Fanny Church | Escambia County, Alabama | | | 203 | | | 367 | | | 40 | | | 5 | | | — | |
| Flomaton | Escambia County, Alabama | | | 130 | | | 206 | | | — | | | 6 | | | 1 | |
| Southern Unit | Crane County, Texas | | | 25 | | | 264 | | | 14 | | | 21 | | | — | |
| Edgewood/Edgewood NE | Van Zandt County, Texas | | | 75 | | | 162 | | | 105 | | | 4 | | | — | |
| Fruitvale/Fruitvale E | Van Zandt County, Texas | | | 39 | | | 307 | | | 71 | | | 6 | | | — | |
| Eustace | Henderson County, Texas | | | 8 | | | 26 | | | 86 | | | 6 | | | — | |
| All others | Various | | | 252 | | | 2,407 | | | 172 | | | 83 | | | 143 | |
| Total | | | 2,223 | | | 10,026 | | | 1,383 | | | 260 | | | 147 | |
Big Escambia Creek. The Big Escambia Creek field, located in Escambia County, Alabama, encompasses approximately 11,520 gross and 7,128 net Eagle Rock operated acres. The field was discovered in 1971 and produces from the Smackover formation at depths ranging from approximately 15,000 to 16,000 feet. Eagle Rock operates eighteen productive wells with an average ownership of 62% working interest and 51% net revenue interest. The reservoir is a sour, gas condensate reservoir in which produced gas and fluids contain a high percentage of hydrogen sulfide and carbon dioxide. These impurities are extracted at the Eagle Rock operated Big Escambia Creek Treating Facility, and the effluent gas is further processed in the Big Escambia Gas Processing Facility for the removal of natural gas liquids. The operation of the wells and the two facilities is closely connected, and Eagle Rock is the largest owner and operator of the combined assets. In addition to selling condensate, natural gas, and natural gas liquids, we also market elemental sulfur. The sulfur market was depressed during 2009, with prices ranging from $0 to $30 per long ton before price netbacks. The current market for sulfur has strengthened primarily due to an increased demand for sulfur-based fertilizers. This demand has resulted in the first quarter 2010 sulfur price being $90 per long ton before price netbacks. However, given the volatility of the sulfur market in the past 24 months, if we are unable to either sell or dispose of the sulfur we produce we may be forced to curtail our oil and gas production.
Jourdanton. The Jourdanton field, located in Atascosa County, Texas, was originally discovered in 1945 by Humble Oil Company. Eagle Rock’s production from the field is primarily from the Edwards carbonates (7,300 to 7,400 feet); however production has been established in multiple reservoirs above the Edwards interval, predominately the Georgetown, Austin Chalk, and Buda formations. The Jourdanton field originally produced from the “oil leg” at the bottom of the Edwards interval with subsequent production from the higher porosity gas sections at the top of the Edwards. In recent years, production has been established from some of the lower permeability and porosity sections in the middle Edwards interval. Eagle Rock operates eleven productive wells with 100% working interest and 87.5% net revenue interest. Net leasehold ownership in the field is 1,422 acres. Gas content is relatively dry and contains approximately 7% carbon dioxide and 2% hydrogen sulfide. Production flows from the wellhead full well stream to a central production facility where the liquids are separated and the gas is compressed to pipeline pressures. The gas is delivered via pipeline to Regency Field Services’ Tilden Gas Plant where it is sold to Louis Dreyfus. The oil is transported from our central production facility by truck and sold to Flint Hills Resources, LP.
Ward-Estes. The Ward-Estes Area is located on the western edge of the prolific Central Basin Platform within the Permian Basin. The Central Basin Platform extends from central Lea County in New Mexico to central Pecos County in Texas and encompasses hundreds of individual fields with multiple productive intervals from the Yates-Seven Rivers-Queen through the Ellenburger formations. Eagle Rock operates multiple fields consisting of stacked multi-pay horizons that produce from depths of 2300 feet (Yates) to 9100 feet (Pennsylvanian). The Yates-Queen production is primarily oil production associated with secondary waterflood operations with discovery dates dating back to the late 1920s. The San Andres, Holt, Glorieta, Tubb / Clearfork intervals produce oil with associated casinghead gas. The Wichita Albany, Wolfcamp and Pennsylvanian intervals typically are gas wells that produce some associated oil. Our ownership in these wells average 99.8% net working interest and 79.4% net revenue interest. Gas production from the leases are gathered and processed by Southern Union Gas and Targa Gas under various percent-of-proceeds (POP) contracts. Crude oil is sold to Navajo and Plains Petroleum. Water production from the Yates – Queen secondary recovery operations is treated and re-injected into water injection wells to provide reservoir pressure maintenance.
Ginger/Ginger Southeast. The Ginger/Ginger Southeast fields are located in eastern Rains County, Texas encompassing approximately 2,346 gross and 1,835 net Eagle Rock operated acres. The fields are positioned on the flanks of a northeast-southwest trending salt-cored anticline that culminates in a graben at its crest. The fields were discovered in 1951 and 1982 respectively and produce from the Smackover formation at depths of approximately 12,000 feet. We operate seven productive wells in these fields which produce gas that contains approximately 32% hydrogen sulfide and 3.5% carbon dioxide. Eagle Rock’s ownership in the wells average 77% working interest and 62% net revenue interest. The full well stream production is gathered by Regency Field Services and delivered to Regency’s Ginger Station where it is compressed before flowing to Regency’s Myrtle Springs compressor station for condensate separation and sales. Flow continues to Regency’s Eustace Plant where it is treated for impurities, and natural gas liquids and sulfur is extracted for a combination of fees and percent-of-proceeds. The residue gas is sold to Regency. Natural gas liquids are sold to Regency through a marketing arrangement with Targa Midstream Services LP (“Targa”) and condensate is sold to CIMA Energy. The extracted sulfur is sold to International Chemical Company (“Inter-Chem”).
Fanny Church. The Fanny Church field is located 2 miles east of Big Escambia Creek and produces from the Smackover formation at depths from approximately 15,000 to 16,000 feet. Eagle Rock’s ownership includes approximately 1,923 gross and 1,506 net operated acres that include five productive operated wells with an average ownership of 87% working interest and 68% net revenue interest. Similar to those in the Big Escambia Creek Field, the produced fluids contain a high concentration of hydrogen sulfide and carbon dioxide. The production is treated for the removal of these impurities at the Flomaton Treating Facility, and the treated natural gas is sent to the Big Escambia Processing Facility for the extraction of natural gas liquids.
Flomaton. The Flomaton field is adjacent to and partially underlies the Big Escambia Creek field. The field encompasses approximately 3,200 gross and 3,143 net Eagle Rock operated acres and produces from the Norphlet formation at depths from approximately 15,000 to 16,000 feet. Eagle Rock operates six wells with an approximate average 98% working interest and 86% net revenue interest. Production from the Flomaton Field contains significant quantities of hydrogen sulfide and carbon dioxide. The produced fluids from Flomaton are treated in the same manner as those from the Fanny Church Field.
Southern Unit. The Southern Unit field is located in the middle of the Central Basin Platform of the Permian Basin, specifically in Crane County, Texas. Production is primarily associated with the Ordovician-aged Waddell Sand formation that is faulted and sub crops against the younger Permian-aged carbonates. The Southern Unit is located in the Running “W” Waddell field discovered in the mid-1930s and produces predominantly oil at depths from approximately 5,750 to 5,900 feet. Eagle Rock operates approximately 6,100 net acres in this area. In addition to the Waddell Sand in the Southern Unit, production is also associated with the shallower McKee Sand gas bearing interval which sub crops similar to the Waddell Sand west of the Southern Unit. Our ownership average in these wells average 85.4% net working interest and 66.7% net revenue interest. Gas production from the Southern Unit field is gathered and processed by Targa under a percent-of-proceeds contract. The oil is purchased by Plains Marketing, L.P. Produced water on the Southern Unit is re-injected into the Waddell Sand to provide reservoir pressure maintenance.
Northeast Edgewood. The Northeast Edgewood field is located in Van Zandt County, Texas along the Smackover Trend of East Texas. The reservoir is a northeast-southwest oriented anticline that produces from the Upper Smackover formation at approximately 12,700 feet. Eagle Rock’s leasehold includes 4,531 gross acres and 3,691 net acres and we operate four productive wells which produce gas that contains approximately 30% hydrogen sulfide. Eagle Rock’s ownership in the wells averages 81% working interest and 69% net revenue interest. The full well stream production is gathered by Regency Field Services and compressed at Regency’s Edgewood compressor station. The gas proceeds to Regency’s Myrtle Springs compressor station for additional compression and separation of condensate before arriving at Regency’s Eustace Plant. At the Eustace Plant the gas stream is separated, treated for impurities and natural gas liquids and sulfur is extracted for a combination of fees and percent of proceeds. The residue gas is sold to Regency. Natural gas liquids are sold to Regency through a marketing arrangement with Targa, and the condensate is sold to CIMA Energy. The extracted sulfur is sold to Inter-Chem. During the fourth quarter 2009, the J.H. Parker #1 was recompleted from the Smackover formation to the Cotton Valley formation. The well tested gas from the Cotton Valley and was shut-in pending the installation of production equipment and flowlines. The well will flow to Regency’s Eustace plant for fluids separation and gas processing.
Fruitvale / E. Fruitvale. The Fruitvale and East Fruitvale fields are located in Van Zandt County, Texas and encompass approximately 4,037 gross and 3,925 net Eagle Rock operated acres. The fields were discovered in 1976 and produce from the Smackover at 12,500 feet. The reservoir is on a northeast-southwest oriented anticline that produces from the Upper Smackover formation at approximately 12,700 feet. Eagle Rock operates six productive wells which produce gas that contains approximately 6.5% hydrogen sulfide, 7.5% carbon dioxide and 17% nitrogen. Eagle Rock’s ownership in the wells averages 97% working interest and 81% net revenue interest. The full well stream production is gathered by Regency Field Services and flows to Regency’s Myrtle Springs compressor station for condensate separation and sales. The gas proceeds to Regency’s Eustace Plant for separation, treating for impurities, and extraction of natural gas liquids and sulfur for a combination of fees and percentage of proceeds. Residue gas is sold to Regency. Natural gas liquids are sold to Regency through a marketing arrangement with Targa, and condensate is sold to CIMA Energy. The extracted sulfur is sold to Inter-Chem.
Eustace. The Eustace field is located in northwestern Henderson County, Texas and includes approximately 2,800 gross and net acres operated by Eagle Rock. The wells produce from the Smackover formation at approximately 12,700 feet. The field was originally discovered in 1973 and began producing in 1981 after Shell Oil Company purchased the field and constructed the Eustace sour gas treating and gas processing plant (that is currently owned and operated by Regency Field Services). The reservoir is an elongated anticlinal feature located along the East Texas Smackover Trend. Eagle Rock operates six productive wells in this field that produce gas containing approximately 37% hydrogen sulfide and 5% carbon dioxide. Eagle Rock’s ownership in the wells is 100% working interest and 87% net revenue interest. The full well stream production flows through Eagle Rock’s flow lines to Regency’s Eustace Plant for separation of condensate, removal of impurities, and extraction of natural gas liquids and sulfur for a combination of fees and percentage of proceeds. The residue gas is sold to Regency. Natural gas liquids are sold to Regency through a marketing arrangement with Targa, and condensate is sold to CIMA Energy.
Upstream Proved Reserves
The following table presents the Partnership’s estimated net proved natural gas and oil reserves in the Upstream Business on December 31, 2009. These values are based on independent reserve reports prepared by Cawley, Gillespie & Associates, Inc.
| | | As of December 31, 2009 | |
| Reserve Data: Upstream Segment | | | |
| Estimated net proved reserves: | | | |
Natural gas (Bcf) | | | 33.8 | |
Oil (MMBbls) | | | 7.5 | |
Natural Gas Liquids (MMBbls) | | | 6.1 | |
Total (Bcfe) | | | 115.5 | |
Proved developed (Bcfe) | | | 101.5 | |
Proved developed reserves as % of total proved reserves | | | 88 | % |
(source: CGA Proved Reserves Estimates)
Productive Wells
On December 31, 2009 we had under operation 186 gross (177 net) productive oil wells and 74 gross (59 net) productive natural gas wells. On December 31, 2009, we owned non-operated working interests in an additional 23 gross (1.4 net) productive oil wells and 124 gross (3.7 net) productive natural gas wells.
Developed and Undeveloped Acreage
The following table describes the leasehold acreage we owned as of December 31, 2009.
| | | | | | | | | | | | | | | | | | | |
| | | Developed Acreage(1) | | | Undeveloped Acreage(2) | | | Total Acreage | |
| | | Gross(3) | | | Net(4) | | | Gross(3) | | | Net(4) | | | Gross | | | Net | |
Operated | | | 65,177 | | | | 53,509 | | | | 1,276 | | | | 1,222 | | | | 66,453 | | | | 54,730 | |
Non-operated | | | 27,850 | | | | 1,847 | | | | — | | | | — | | | | 27,850 | | | | 1,847 | |
Total | | | 93,027 | | | | 55,356 | | | | 1,276 | | | | 1,222 | | | | 94,303 | | | | 56,577 | |
| (1) | Developed acres are acres pooled or assigned to productive wells. |
| (2) | Undeveloped acres are acres on which wells have not been drilled or completed to a point that would permit the production of commercial quantities of natural gas or oil, regardless of whether such acreage contains proved reserves. |
| (3) | A gross acre is an acre in which a working interest is owned. The number of gross acres is the total number of acres in which a working interest is owned. |
| (4) | A net acre is deemed to exist when the sum of the fractional ownership working interests in gross acres equals one. The number of net acres is the sum of the fractional working interests owned in gross acres. |
Drilling and Recompletion Activity
In 2009, we drilled and completed three successful operated wells in the Upstream segment. We consider a drilled and completed well successful if the cash flows (including capital investment) are forecasted to have a positive net present value from the booked reserves developed from the project. Two wells were drilled and successfully completed in our Ward Estes field in the Permian basin. These wells were drilled, completed and produced to sales from the Penn and Wolfcamp formations during the 4th quarter 2009. A third operated well was drilled during 2008, but completed and produced to sales in 2009 from the Smackover formation. The total development cost of these three wells was $1.52/Mcfe. In 2009, of the three wells we drilled, one was a proved undeveloped location. This well cost approximately $1.1 million and its production performance has been consistent with our expectations. The Partnership did not have any active drilling programs in process as of December 31, 2009.
Recompletions and capital workovers were conducted on ten operated wells across our West Texas and Alabama regions during 2009. Nine capital workovers or recompletions were executed in our Permian operations in multiple formations ranging from the shallow Queen formation to the deeper Penn formation. Seven of the nine Permian capital workovers were successful. One successful well sidetrack operation was conducted in our Alabama Big Escambia Creek field targeting the Smackover formation. The unit development cost for these ten operations was $0.61/Mcfe.
In 2008, we completed the drilling of 21 wells (5.8 net), of which 15 wells drilled were operated by others. All six wells operated by us were successful. Five operated, successful Permian Basin wells were drilled and completed on leasehold acquired from the Stanolind Acquisition in 2008. Four of these wells were drilled in the Ward-Estes field area on the Louis Richter and American National leases testing the San Andres, Holt and Penn formations. The fifth Permian Basin well was a successful completion in the Penn Sand on our American National lease in the Southern Unit field area. In addition to the Permian program, a successful Smackover test we drilled and completed a successful Smackover test in our Big Escambia Creek field. The fifteen non-operated wells drilled in 2008 were drilled by Stroud Petroleum in various fields of East Texas and North Louisiana. Our average working interest in the Stroud Petroleum program is 3.8%. Two of the non-operated wells were plugged and abandoned, the rest were successful.
Recompletions and capital workovers were conducted on eight operated wells across our South Texas, West Texas and Alabama regions during 2008. Five recompletions were executed in our Jourdanton field to complete additional Edwards formation intervals. Three of the five Edwards recompletions were successful. Three successful capital workovers were completed in our Alabama and West Texas operations resulting in significant reserve additions during 2008. The unit development cost for these operations was $1.77/Mcfe.
In 2007, we completed the drilling of 2 wells (1.02 net), both of which were classified as development wells and for when drilling had begun prior to our acquisitions of these companies. Both wells were productive.
Minerals Business
Minerals Business Overview
The Minerals Business is comprised almost entirely of mineral, royalty and overriding royalty interests. These interests represent ownership in over 430,000 net mineral acres and royalties and overriding royalties in over 2,800 producing wells in 17 states in the United States and the Gulf of Mexico. Our ownership in our minerals or royalties is a direct ownership of the mineral estate and ownership of partnership interests in other limited partnerships that were created to own and manage mineral and royalty interests. Our minerals and royalty holdings are very well diversified and span multiple geological basins and geographical areas. We have limited concentration of operators or wellbores in a single play type or exploration activity. Successful management of minerals entails actively leasing and promoting the mineral estate to active oil and gas producers to entice them to lease and develop the oil and gas potential. The majority of our mineral interests are managed by Black Stone, which has the sole authority to negotiate and execute mineral leases on those properties. We do not operate the substantial majority of the production on our minerals properties, but we do have small mineral interests underlying our Big Escambia Creek, Flomaton and Fanny Church Upstream assets.
Our fee mineral, royalty and overriding royalty interests are significantly different than working interests. Ownership of mineral and royalty interests do not bear any of the costs of drilling or production (other than certain production taxes) which are borne by the operator or producer but the mineral owner usually does not control any of the relevant decisions associated with the operation of existing wells or the drilling of future ones. Despite this lack of control, we believe the following characteristics make mineral and royalty interests a suitable asset for a master limited partnership.
| | • | They do not bear drilling or production costs—Mineral interests are leased to working interest owners who bear all of the cost and financial risk associated with operating the existing wells and drilling future ones. The mineral interest owner receives a negotiated portion of the revenues from the sale of the products of the wells. |
| | • | Mineral ownership may be perpetual—Mineral interests are a real property interest and they are usually owned in perpetuity. Overriding royalty interests are derived from the leasehold estate (the oil and gas lease rights), and are only valid so long as the underlying oil and gas lease is valid. Many leases last for decades, however. |
| | • | They have the potential for “regeneration”—This refers to the fact that although the current wells usually have declining production rates, the operator of the lease will often conduct activities to create new sources of production (by drilling new wells, working on old ones, or employing various forms of advanced technology to enhance production). In a well-diversified portfolio of mineral and royalty interests, it is not uncommon to observe stable or inclining production over the course of many years as a result of the regeneration effect. |
The income we receive from these assets consists of lease bonus payments, delay rentals, and royalty payments from the sale of production. We do not bear any of the costs associated with drilling or operating the wells, other than ad valorem and production taxes.
As part of the Recapitalization and Related Transactions, we have entered into a definitive agreement to sell our Minerals Business to Black Stone Minerals Company, L.P. along with its affiliates, (“Black Stone”) for $174.5 million, subject to purchase price and other customary adjustments. Even though the Minerals Business represents a highly profitable and growing business to us, and one which greatly complements our Midstream and Upstream Businesses, it was determined to be the most attractive divestiture candidate from a credit-enhancing perspective as we analyzed different assets to be potentially divested to enhance our liquidity position. This results from the fact that transaction multiples of Adjusted EBITDA in a potential Minerals Business sale, and the transaction multiple of Adjusted EBITDA ultimately achieved in the proposed transaction with Black Stone, significantly exceed our leverage covenant under our Senior Secured Credit Facility of 5.0 times. The sale to Black Stone is conditioned on, among other things, unitholder approval of the Global Transaction Agreement and certain amendments to our partnership agreement.
Minerals Business Strategies
We expect that, subject to unitholder approval and the satisfaction of other customary closing conditions, our Minerals Business will be divested in 2010 in conjunction with the Recapitalization and Related Transactions. As a result, we are no longer pursuing minerals growth opportunities. In the event that the transactions are not approved, we would evaluate our future strategies regarding our Minerals Business, yet would probably not seek to acquire additional minerals properties while we are focused on reducing our leverage. Furthermore, we do not have any intention to re-enter the minerals business if we divest our existing minerals assets. Until the sale of our Minerals Business is closed, we will continue to manage our minerals assets prudently in order to maximize their revenues and value.
Minerals Business Competitive Strengths
| | • | We have an experienced knowledgeable management team with a proven record of performance in evaluating, negotiating and closing minerals transactions where they have equal experience, knowledge and proven record of performance. |
| | • | We have a staff of engineers and support staff who are experts at evaluating minerals interests across a large majority of the geological basins and trends in the United States. No members of our management team have been solely dedicated to our Minerals Business, so our management team will not be impacted by the contemplated sale of our Minerals Business. If we are successful in selling our Minerals Business, members of our management team who spent time on our Minerals Business will allocate more of their time to our Upstream Business. |
Minerals Proved Reserves
The following table presents the Partnership’s estimated net proved natural gas and oil reserves in the Minerals Business on December 31, 2009. These volumes are based on independent reserve reports prepared by Cawley, Gillespie & Associates, Inc.
| Reserve Data: Minerals Segment | | | |
| Estimated net proved reserves: | | | |
Natural gas (Bcf) | | | 4.8 | |
Oil (MMBbls) | | | 2.9 | |
Total (Bcfe) | | | 22.4 | |
Proved developed (Bcfe) | | | 22.4 | |
Proved developed reserves as % of total proved reserves | | | 100 | % |
(source: CGA Proved Reserves Estimates)
Brea Olinda Royalty
Our most significant royalty interest is a 12.5% non-participating royalty interest in the oil production from three units of the Brea Olinda Field (Stearns, West Brea, and East Naranjal) and a 3.75% non-participating royalty interest in a fourth unit (Columbia). The field is located in Orange County, California and all of the units are operated by Linn Western Energy.
Production from the field is medium gravity crude oil and has a very low decline rate due to ongoing secondary recovery, infill drilling and workover operations. Our net production is approximately 213 Bbl/d, which represents about half of the crude oil and condensate production in the Minerals Business.
The surface lands are currently undergoing residential development which has the potential for limited, temporary impact on the field’s operations and production rate.
Fruitland Coal Bed Methane (CBM) Overriding Royalty, New Mexico
Another significant asset in the Minerals Business is overriding royalty interests in certain wells in two units in the Fruitland CBM Field: the Northeast Blanco and San Juan 30 6 Units. Our net production of natural gas is approximately 305 Mcf/d, which represents approximately 9% of the gas production in the Minerals Business.
Ivory Acquisitions Partners, L.P. and Ivory Working Interests, L.P.
We hold the majority of our mineral interests (all but approximately 10,000 net mineral acres) as a co-investor in an acquisition agreement signed in 2004 with respect to a set of mineral interests sold by the Pure Resources Company. These interests were previously owned by International Paper, and are often referred to as the “Pure Minerals” or the “IP Minerals.” The transaction was led by Black Stone Minerals Corporation (“Black Stone”), a private company, who serves as the manager of the mineral interests. We acquired these interests through the Montierra Acquisition in 2007. As discussed in Recapitalization and Related Transactions above, we have entered into an agreement to sell our entire Minerals Business including the Pure Minerals, to Black Stone, subject to unitholder approval of the Global Transaction Agreement and certain amendments to our partnership agreement.
Black Stone is the general partner of Ivory Acquisition Partners, L.P. (“IAP”), and also serves as the manager of the mineral interests. In these roles, the Minerals Manager has a number of rights and obligations; for instance, the Minerals Manager holds the executive rights of the mineral interests. Having the executive rights provides Black Stone the sole authority to negotiate and execute mineral leases on behalf of the mineral owners. Black Stone also collects all bonus and royalty payments from the operators and disburses them to the mineral owners monthly. Black Stone has a large staff of land, engineering, geological and accounting professionals who conduct extensive activities to lease the minerals on competitive terms and to encourage their exploration and development.
As part of the transaction, our predecessor in title received direct title to approximately 13.2% of 92% of the mineral interests (the “direct title minerals”); the remaining 8% of the mineral interests was placed into IAP, a private partnership of which we owned approximately 13.2% of the limited partner units. We account for the direct title minerals using the consolidation method while our interest in IAP is accounted for under the equity method. IAP was structured so that Black Stone would earn 100% of the limited partner units when certain payout hurdles were met. These hurdles were achieved in 2008, and we no longer have an interest in IAP.
Also in our Minerals Business is a 13.2% limited partnership interest in Ivory Working Interests, L.P. (“IWI”). This entity owns non-operating working interests in some of the wells in which we own a mineral interest, and its general partner is Black Stone. We do not own direct title to the working interests of IWI, so it is accounted for under the equity method. While our investment is held within our Minerals Business, we evaluate our operating segments down to operating income (loss), thus we account for our equity in earnings from this investment as part of our Corporate Segment.
IWI was formed at the same time as IAP, and its purpose was to hold title to current and future working interests related to the Pure minerals. These working interests derive from certain leases on the minerals that Black Stone executed which, under certain conditions, gave the mineral owners the right to participate collectively as a working interest owner (in addition to their participation as royalty owners). Under the various agreements that exist between the co-investors, IAP, IWI and Black Stone, IWI has the right to use the revenues generated in IAP or from the direct title minerals as a source of funding for its drilling and production costs, in the event and only to the extent that IWI’s internal cash flow is insufficient to cover these costs. In 2009, approximately $2.6 million was retained by Black Stone for investment in IWI.
One of the most important assets in the Minerals Business is a significant mineral interest in the Haynesville Shale play of northwestern Louisiana and east Texas. These interests were part of the Pure Minerals and are managed by Black Stone. Based on data provided by Black Stone, we estimate that we own approximately 9,000 net mineral acres (net to the Partnership) in Desoto and Sabine parishes, Louisiana and Sabine and St. Augustine counties, Texas. As of this filing, we estimate that 112 wells have been permitted and 54 wells have been drilled on our Louisiana Haynesville acreage (we can not accurately estimates these figures on the Texas acreage due to differences in state reporting requirements).
Substantially all of our Haynesville acreage is leased, and in most cases Black Stone negotiated the right to participate as a non-operating working interest owner in future wells. As in previous instances, these working interests will be owned by IWI. We have not received a budget for 2010 from IWI, so we do not know what level of capital expenditure they anticipate in 2010 in connection with Hayneville drilling; however, based on the number of wells permitted on our Haynesville acreage and the high level of drilling activity in the play, we believe it could be in excess of $30 million. This level of investment would substantially exceed the cash flow of the existing wells in IWI, and therefore would require Black Stone to use revenues from the direct title minerals to fund IWI’s share of the drilling costs.
Oil and Natural Gas Reserves (Upstream and Minerals Businesses)
On December 1, 2008, the SEC announced that it had approved revisions designed to modernize the oil and gas company reserve reporting requirements. The new rules, referred to as the SEC Reserves Reporting Modernization, replaced the rules that had been in effect since 1975. The new rules differ from the 1975 rules in many respects. We adopted the rules effective December 31, 2009.
Under the new reserve reporting rules, proved oil and gas reserves are defined in part as “those quantities of oil and gas, which, by analysis of geoscience and engineering data, can be estimated with reasonable certainty to be economically producible—from a given date forward, from known reservoirs, and under existing economic conditions, operating methods, and government regulations—prior to the time at which contracts providing the right to operate expire, unless evidence indicates that renewal is reasonably certain, regardless of whether deterministic or probabilistic methods are used for the estimation.”
Estimates of proved reserves as of December 31, 2009, were based on estimates made by our independent engineers, Cawley, Gillespie & Associates, Inc (“Cawley Gillespie”). In 2009, Cawley Gillespie was engaged by and provided its reports to our senior management team. In order to enhance our controls regarding reserve reporting, the Audit Committee charter was recently amended to grant the engagement of our independent reserve engineer. However, management continues to have direct oversight of the independent reserve engineer. For 2010, management has recommended, and the Audit Committee has approved our continued engagement with Cawley Gillespie.
We make representations to the independent engineers that we have provided all relevant operating data and documents, and in turn, we review the reserve reports provided by the independent engineers to ensure completeness and accuracy. Our review entails a comparison of the forecast and other parameters in the reserve report to our internal estimates and our historical results. If discrepancies are identified, we discuss these issues with Cawley Gillespie and provide them with additional information. This process may or may not result in changes to their estimates, but the final report will represent their estimates, based on the data we provided and the engineering judgment. Our Chief Executive Officer makes the final decision on booked proved reserves by incorporating the proved reserves from the independent engineers’ reports.
Qualifications of Reserve Estimators
Our reserves reporting process involves two major steps; the population of a reserves database by our Technical Evaluations staff, and the preparation of an independent reserve report which uses the database as its starting point. The independent reserves report is prepared by Cawley, Gillespie & Associates (“CGA”) which is a Texas Registered Engineering Firm (F-693). The engineer on our account is Mrs. Kellie Jordan who works under the supervision of Mr. Robert D. Ravnaas, Executive Vice President. Mr. Ravnaas is a State of Texas Licensed Professional Engineer (License #61304). Cawley Gillespie’s report is attached as Exhibit 99.1 to this Annual Report on Form 10-K.
In the preparation of its report, CGA relies on engineering and other data provided by our staff and overseen by our Senior Vice President - Technical Evaluations. He is a licensed Petroleum Engineer in Texas with over 25 years experience in upstream engineering, operations, economics, finance, acquisitions and risk management. He holds a bachelors of science degree in chemical engineering from the University of Texas and a masters of science degree in finance from the University of Houston. He is a member of the Society of Petroleum Engineers and the Society of Petroleum Evaluation Engineers.
Internal Controls Over Reserve Estimation
One of our primary controls with respect to reserve reporting is the independent reserve report; however, we also have various internal controls to ensure that the data we supply to CGA is accurate. These controls are tested by our internal auditors and our independent accounting auditors, and they have concluded that these controls are effective. Among other things, our internal controls include the following items:
| · | A process to identify all of the newly-drilled producing wells in our Minerals business and add them to our database. |
| · | A process to retrieve production data from our IHS Software Application to use as the basis of our decline curve forecasts. |
| · | A process to estimate various economic parameters, such as operating costs; price differentials; gas shrinkages; condensate, NGL and sulfur yields. This process relies on historical data provided by our accounting department and our operations engineers. |
| · | A process to check the working and net revenue interests in our reserves database to ensure they are consistent with our Land records. |
| · | A process to identify and document the engineering and geological support for our developed non-producing and undeveloped reserves. |
| · | Processes to estimate future capital expenditures and abandonment costs that are based on our prior experiences and engineering judgment. |
We use the data gathered and estimated in the processes above to populate our reserves database. Our Technical Evaluations staff prepares a reserves estimate for each well in which we own an interest (including non-producing and undeveloped locations). This database is then provided to CGA, along with any additional supporting information they request, and forms the primary basis for their reserve estimates.
After CGA has made their preliminary reserves estimate, the Senior Vice President – Technical Evaluations reviews their results and compares them to our historic production rates, operating costs, price differentials, severance tax rates and ad valorem tax rates. If they are not consistent with our historical results, the database is scrutinized to identify and correct possible sources of error. The Senior Vice President – Technical Evaluations and his staff also review the production forecasts prepared by CGA for possible errors, omissions or significant differences in engineering judgment. In those instances, the issue is discussed with CGA and additional supporting data is provided, if needed. Capital costs and investment timing are also reviewed to ensure that they are consistent with our five year development plan and our approved budget.
After CGA has completed their report, our Technical Evaluations group prepares the reserves reconciliation. During this process, we occasionally identify small discrepancies that we believe should be corrected and these discrepancies are discussed and resolved with CGA.
General Reserve Estimation Methods
Because the majority of our proved reserves are classified as proved producing reserves, we use production performance methods (decline curve analysis) extensively in the preparation of our proved reserves estimates. Our estimates of proved undeveloped and proved developed non-producing reserves are based on volumetric methods and analogy to offset producers. Where applicable, we occasionally use material balance methods to estimate reserve quantities, but our current reserve report does not contain any estimates that rely on this method. We have not used reservoir simulation or proprietary methods to prepare our reserves estimates.
The revised SEC rules permit the optional disclosure of probable and possible reserves. The Partnership has elected to not disclose these quantities at this time.
Proved Reserves
The following table presents the Partnership’s estimated net proved natural gas and oil reserves in the Upstream and Minerals Businesses on December 31, 2009. These values are based on independent reserve reports prepared by Cawley, Gillespie & Associates, Inc.
| | | | |
| | | As of December 31, 2009 | |
| Reserve Data: Upstream and Minerals Businesses | | | |
| Estimated net proved reserves: | | | |
Natural gas (Bcf) | | | 38.6 | |
Oil (MMBbls) | | | 10.4 | |
Natural Gas Liquids (MMBbls) | | | 6.1 | |
Total (Bcfe) | | | 137.9 | |
Proved developed (Bcfe) | | | 123.9 | |
Proved developed reserves as % of total proved reserves | | | 90 | % |
| | | | | |
| Estimated net undeveloped reserves: | | | | |
Natural gas (Bcf) | | | 7.5 | |
Oil (MMBbls) | | | 0.4 | |
Natural Gas Liquids (MMBbls) | | | 0.7 | |
Total (Bcfe) | | | 14.0 | |
Proved undeveloped (Bcfe) | | | 14.0 | |
Proved Undeveloped Reserves
The Partnership has a relatively modest level of proved undeveloped reserves. As a master limited partnership, we grow primarily through acquisitions of producing properties and subsequently conduct development activities on those properties to maintain our production rates. The acquisition candidates that meet our investment criteria often have a high ratio of developed to undeveloped reserves, and we rarely conduct exploration activities.
We approach the development of our undeveloped reserves in a measured pace, in order to hold our production rate fairly constant or slightly inclining. The development plan in our proved reserves report contemplates the drilling of all of our undeveloped locations within five years.
Our undeveloped drilling locations are primarily located in the North Ward Estes Field, Ward County, Texas. The primary targets of these wells are the Penn, Wolfcamp, and Wichita Albany formations. We also have a small number of undeveloped locations in the Jourdanton Field, Atascosa County, Texas in the Edwards formation. There is additional detail regarding these fields and our recent development activity in the Upstream Business Section.
The revised SEC reserves reporting rules permit the additional disclosure of proved reserves at prices other than the prior twelve month average prices. Since the prior twelve month average prices were relatively low, particularly for natural gas, we have elected to include a summary of proved reserves at a set of optional forecast prices. These reserves are based on the same production forecasts and operating costs as the proved reserves presented above, but we have based our future prices on the forward prices of the crude oil and natural gas futures contracts traded on NYMEX as of December 31, 2009. We have averaged the prices for each calendar year until 2015 and held the prices flat thereafter. The following table shows prices used in the calculation:
| | | Crude Oil Prices | | | Natural Gas Prices | |
| | | | | | | |
2010 | | $ | 81.46 | | | $ | 5.78 | |
2011 | | $ | 85.81 | | | $ | 6.34 | |
2012 | | $ | 87.83 | | | $ | 6.53 | |
2013 | | $ | 89.31 | | | $ | 6.67 | |
2014 | | $ | 91.09 | | | $ | 6.84 | |
2015 and thereafter | | $ | 93.07 | | | $ | 7.05 | |
| | | Proved Reserves | |
| | | Oil (MBbls) | | | Gas (MMcf) | | | Natural Gas Liquids (MBbls) | |
| Proved Reserves as of December 31, 2009 using optional forecast prices | | | 11,062 | | | | 43,986 | | | | 6,431 | |
The increase in proved reserves between the SEC price case and the optional price case was due to lower economic limits on virtually all wells, and the inclusion of a few undeveloped locations that are commercial at the optional price deck.
Production and Price
For detail and discussion of our net production and realized prices by product for the years ended December 31, 2009, 2008 and 2007, see our discussion of the results of operations for our Upstream and Minerals Businesses within Part II, Item 7. Management’s Discussion and Analysis of Financial Condition and Results of Operations – Year Ended December 31, 2009 Compared with Year Ended December 31, 2008 and Year Ended December 31, 2008 Compared with Year Ended December 31, 2009. Production costs, excluding ad valorem and severance taxes for our Upstream Business for the years ended December 31, 2009, 2008 and 2007 were $1.60/Mcfe, $1.86/Mcfe and $2.36/Mcfe, respectively. We do not incur any production costs, other than ad valorem and severance taxes, within our Minerals Business.
Regulation of Our Operations
Safety and Maintenance Regulation
Midstream Business
Our Midstream Business, other than our pipelines, is subject to federal safety standards developed under the Occupational Health and Safety Act of 1970, as amended (“OSHA”). The OSHA standards focus on protection of employee health and safety and the maintenance and safe operation of our facilities. The facilities covered by these safety regulations in our Midstream Business are our natural gas plants, compressor stations, and natural gas treatment facilities. Safety matters associated with our pipelines are regulated by the U.S. Department of Transportation (“DOT”), Office of Pipeline Safety (“OPS”). We incur costs related to all of these regulations for monitoring and maintaining our facilities in safe operating conditions. We also have costs associated with training our workforce in safety, record keeping, reporting, and inspecting our operations. Consequences of non-compliance with these regulations are potential fines from the federal or state government agencies and disruption of operations due to injuries or equipment failure.
OSHA process safety management (“PSM”) standards apply to our natural gas plants, compressor stations, and natural gas treatment facilities. The PSM standards address ways in which our Midstream Business maintains process safety information, evaluates the hazards associated with these operations, develops procedures for ensuring their safe operation, maintains the integrity of our operations, and manages contractors on-site. PSM standards apply because each of these sites processes and stores (under pressure) flammable liquids or gas in excess of 10,000 pounds. In addition, those of our facilities that handle hydrogen sulfide in quantities exceeding 1,500 pounds are subject to further PSM requirements. The PSM standard also requires us to conduct compliance audits every three years. We are on schedule to timely complete these audits.
More general OSHA standards also apply to these operations. These include regulations governing safety sensitive issues, such as means of egress, fire protection, materials handling and storage, confined space entry, servicing and maintaining machines and equipment, and electrical, that have more application to our Midstream Business than our Upstream Business due to the nature of our Midstream Business facilities.
Our pipeline operations within our Midstream Business, specifically the gathering and transportation of natural gas and hazardous liquids, are subject to DOT regulatory requirements as promulgated by the OPS, specifically 49 CFR 192 (natural gas) and 49 CFR 195 (hazardous liquids). The extent to which our gathering pipelines are regulated primarily depends on their location. There is a sliding scale of regulation ranging from basic safety precautions to more rigorous inspection and reporting depending upon the population density and other factors within proximity of the specific pipeline. Where applicable, these DOT regulations direct our activities with respect to design and construction of pipelines, corrosion control, testing requirements, operations, maintenance, emergency response, and qualification of pipeline personnel.
The safety of our pipelines is also regulated by the states in which we operate. These regulations in general, focus on reporting, recordkeeping, and notification obligations.
Upstream and Minerals Business
Our Upstream and Minerals Business implicates safety matters with respect to the exploration and production of hydrocarbons and carries consequences of non-compliance consistent with those discussed above under the safety matters for the Midstream Business. This segment of our business is also subject to OSHA standards. The actual production of oil and gas is subject to OSHA PSM requirements but through agency internal policy, PSM standards are not currently enforced. OSHA has specifically exempted oil and gas well drilling and servicing from standards covering the control of hazardous energy and the PSM standard as they relate to highly hazardous chemicals. If agency policy changes, additional compliance, reporting, and training costs could be incurred in our Upstream and Minerals Business.
Our Upstream and Minerals Business is also subject to safety rules and regulations promulgated by state agencies, such as the Alabama State Oil and Gas Board, Louisiana Department of Conservation, Mississippi Oil and Gas Board, New Mexico Oil Conservation Division, and Texas Railroad Commission. While these agencies have established some regulations designed to protect worker and community health and safety, their primary focus is on environmentally sound well drilling, servicing, and production operations.
FERC and Similar State Regulations
Under the Natural Gas Act of 1938, or NGA, as amended by the Energy Policy Act of 2005, or EPA 2005, the Federal Energy Regulatory Commission (“FERC”) has jurisdiction over the transportation of natural gas in interstate commerce and the sale of natural gas for resale in interstate commerce, and entities engaged in such activities. FERC also possesses regulatory oversight over natural gas markets, including the purchase, sale and transportation activities of non-interstate pipelines and other natural gas market participants. FERC possesses substantial enforcement authority for violations of the NGA, including the ability to assess civil penalties, order disgorgement of profits and recommend criminal penalties. FERC also regulates intrastate pipelines that engage in interstate transportation activities under Section 311 of the Natural Gas Policy Act, or NGPA.
Our natural gas gathering operations are generally exempt from FERC regulation under the NGA; however, FERC has regulatory influence over certain aspects of our business through its jurisdiction over natural gas markets and intrastate pipelines that engage in interstate transportation services.
FERC exercises authority over the rates, terms and conditions of service of intrastate pipelines to the extent that such pipelines transport gas in interstate commerce under Section 311 of the NGPA. Rates for Section 311 transportation service must be fair and equitable, and amounts collected in excess of fair and equitable rates are subject to refund with interest. The rates for Section 311 service are generally subject to review every three years by the FERC or by an appropriate state agency. Our Eagle Rock DeSoto Pipeline, L.P., (“DeSoto Pipeline”) an intrastate pipeline acquired in October 2008 as part of the Millennium Acquisition, transports gas in interstate commerce on its Central and North Texas Systems and is therefore subject to FERC regulation under Section 311 of the NGPA. Any failure on our part to comply with the rates approved by the FERC for Section 311 service, to comply with the terms and conditions of service established in our FERC-approved Statement of Operating Conditions, or to comply with applicable FERC regulations, the NGPA, or certain state laws and regulations could result in an alteration of the jurisdictional status of the DeSoto Pipeline or the imposition of civil and/or criminal penalties.
EPA 2005 amended the NGA to grant FERC new authority to facilitate price transparency in markets for the sale or transportation of physical natural gas in interstate commerce, and to prohibit market manipulation. In January 2006, FERC issued rules implementing the anti-manipulation provision of EPA 2005. These rules make it unlawful for any entity, directly or indirectly, in connection with the purchase or sale of natural gas subject to the jurisdiction of FERC or the purchase or sale of transportation services subject to the jurisdiction of FERC: (1) to use or employ any device, scheme or artifice to defraud; (2) to make any untrue statement of material fact or omit to make any such statement necessary to make the statements made not misleading; or (3) to engage in any act or practice that operates as a fraud or deceit upon any person. The anti-manipulation rules apply to activities of natural gas pipelines and storage companies that provide interstate transportation services, and to otherwise non-jurisdictional entities to the extent the activities are conducted “in connection with” gas sales, purchases, or transportation subject to FERC jurisdiction, but do not apply to activities that relate only to non-jurisdictional sales or gathering. Should we fail to comply with all applicable FERC-administered statutes, rule, regulations and orders, we could be subject to substantial penalties and fines.
In 2008, FERC took additional steps to enhance its market oversight and monitoring of the natural gas industry. Order No. 704, as clarified on rehearing in 2008, requires buyers and sellers of natural gas above a de minimis level, including entities not otherwise subject to FERC jurisdiction, to submit an annual report to FERC describing their wholesale physical natural gas transactions. Order No. 720, issued in late November 2008, requires “major non-interstate” pipelines (defined as pipelines, including certain gathering pipelines not otherwise subject to FERC jurisdiction, with annual deliveries of more than 50 million MMBtu) to post on the internet the daily volumes scheduled for each receipt and delivery point on their systems with a design capacity of 15,000 MMBtu per day or greater. Order No. 720 also increases the posting obligations of interstate pipelines. Numerous parties requested modification or reconsideration of this rule. The FERC issued an order on rehearing, Order No. 720-A, on January 21, 2010. The order on rehearing affirms the FERC’s determination that it has jurisdiction over major non-interstate pipelines for the purpose of requiring public disclosure of information to enhance market transparency. Order No. 720-A generally affirms the posting requirement for major non-interstate pipelines, and grants clarification as to certain aspects of Order No. 720. Major non-interstate pipelines subject to the rule have 150 days to comply with the rule’s Internet posting requirements. None of our existing assets, as of the date of the order, meet the criteria established in Order No. 720-A for daily posting of scheduled volumes. However, we will continue to monitor our assets with respect to this order. In November 2008, FERC also issued a Notice of Inquiry to the industry soliciting comments regarding whether “Hinshaw” pipelines and intrastate pipelines that transport natural gas in interstate commerce pursuant to Section 311 of the NGPA should be required to post on the internet certain details of their transactions with individual shippers in a manner comparable to the reporting requirements applicable to interstate pipelines. Once the FERC evaluates the comments filed in response to the Notice of Inquiry, it may choose to engage in the formal rulemaking process to propose additional reporting requirements on such pipelines.
In 2008 FERC also took action to ease restrictions on the capacity release market, in which shippers on interstate pipelines can transfer to one another their rights to pipeline and/or storage capacity. Among other things, Order No. 712, as modified on rehearing, removed the price ceiling on short-term capacity releases of one year or less, and facilitated Asset Management Agreements, or AMAs, by exempting releases under qualified AMAs from: the competitive bidding requirements for released capacity; FERC’s prohibition against tying releases to extraneous conditions; and the prohibition on capacity brokering.
Midstream Business
Regulation of pipeline gathering and transportation services, natural gas sales and transportation of NGLs may affect certain aspects of our business and the market for our products and services.
Gathering Pipeline Regulation. Section 1(b) of the NGA exempts natural gas gathering facilities from the jurisdiction of FERC, but does not define or provide any guidance as to what constitutes “gathering.” FERC has developed tests for determining which facilities constitute gathering facilities exempt from FERC jurisdiction under the NGA. From time to time, FERC may reconsider the elements of such tests. In recent years, FERC has permitted jurisdictional pipelines to “spin-down” exempt facilities out of a jurisdictional entity into affiliated entities not subject to FERC jurisdiction, although FERC continues to examine the factual circumstances under which a spin-down is appropriate. We cannot predict when and under what circumstances FERC may elect to re-examine activities that could fall within the scope of our business with respect to gathering.
We believe that, currently, the natural gas pipelines in our gathering systems meet the traditional tests FERC has used to establish a pipeline’s status as a gatherer not subject to FERC jurisdiction. However, the distinction between FERC-regulated transmission services and federally unregulated gathering services is the subject of substantial, on-going litigation, so the classification and regulation of our gathering facilities are subject to change based on future determinations by FERC and the courts. State regulation of gathering facilities generally includes various safety, environmental and, in some circumstances, nondiscriminatory take requirements, and in some instances complaint-based rate regulation.
The jurisdictional status of DeSoto Pipeline’s East Texas System has been reviewed by the FERC. DeSoto Pipeline filed a petition for a declaratory order in October 2008, in connection with the Millennium Acquisition, requesting the FERC to determine that the East Texas System is engaged in natural gas gathering services under Section 1(b) of the NGA, and is not engaged in jurisdictional transportation services, pursuant to FERC’s traditional tests used to establish a pipeline’s jurisdictional status. DeSoto Pipeline filed the petition based on changed system circumstances, including expanded producer interconnections and the fact that the East Texas System had ceased taking gas from an intrastate pipeline. On February 6, 2009, FERC granted DeSoto Pipeline’s request for a declaratory order and determined that DeSoto Pipeline’s East Texas facilities perform a gathering function. As a result, the East Texas System operations are deemed to be exempt from FERC jurisdiction under Section 1(b) of the NGA.
Louisiana’s Pipeline Operations Section of the Department of Natural Resources’ Office of Conservation is generally responsible for regulating gathering facilities in Louisiana, and has authority to review and authorize the construction, acquisition, abandonment and interconnection of physical pipeline facilities. Historically, apart from pipeline safety, it has not acted to exercise this jurisdiction respecting gathering facilities.
The majority of our gathering systems in Texas have been deemed non-utilities by the TRRC. Under Texas law, non-utilities are not subject to rate regulation by the TRRC. Should the status of these non-utility facilities change, they would become subject to rate regulation by the TRRC, which could adversely affect the rates that our facilities are allowed to charge their customers. Texas also administers federal pipeline safety standards under the Pipeline Safety Act of 1968. The “rural gathering exemption” under the Natural Gas Pipeline Safety Act of 1968 presently exempts most of our gathering facilities from jurisdiction under that statute, including those portions located outside of cities, towns or any area designated as residential or commercial, such as a subdivision or shopping center. The “rural gathering exemption,” however, may be restricted in the future. With respect to recent pipeline accidents in other parts of the country, Congress and the Department of Transportation, or DOT, have passed or are considering heightened pipeline safety requirements. We operate our facilities in full compliance with local, state and federal regulations, including the DOT regulations found at 49 C.F.R. Parts 192 and 195.
The DOT also regulates the design, installation, testing, construction, operation, replacement, and management of our pipeline facilities. In addition, we must permit access to and copying of records, and must make certain reports and provide information, as required by the Secretary of Transportation. The states in which we have pipelines have comparable regulations.
We are subject to regulation by the DOT under the Accountable Pipeline and Safety Partnership Act of 1996, sometimes referred to as the Hazardous Liquid Pipeline Safety Act (“HLPSA”), and comparable state statutes relating to the design, installation, testing, construction, operation, replacement and management of our pipeline facilities. The HLPSA covers petroleum and petroleum products. The HLPSA requires any entity that owns or operates pipeline facilities to (i) comply with such regulations, (ii) permit access to and copying of records, (iii) file certain reports and (iv) provide information as required by the Secretary of Transportation. We believe that we are in material compliance with these HLPSA regulations.
We are subject to the DOT regulation requiring qualification of pipeline personnel. The regulation requires pipeline operators to develop and maintain a written qualification program for individuals performing covered tasks on pipeline facilities. The intent of this regulation is to ensure a qualified work force and to reduce the probability and consequence of incidents caused by human error. The regulation establishes qualification requirements for individuals performing covered tasks. We believe that we are in material compliance with these DOT regulations.
We are also subject to the DOT Integrity Management regulations, which specify how companies should assess, evaluate, validate and maintain the integrity of pipeline segments that, in the event of a release, could impact High Consequence Areas (“HCAs”). HCAs are defined to include populated areas, unusually sensitive environmental areas and commercially navigable waterways. The regulation requires the development and implementation of an Integrity Management Program (“IMP”) that utilizes internal pipeline inspection, pressure testing, or other equally effective means to assess the integrity of HCA pipeline segments. The regulation also requires periodic review of HCA pipeline segments to ensure adequate preventative and mitigative measures exist and that companies take prompt action to address integrity issues raised by the assessment and analysis. In compliance with these DOT regulations, we identified our HCA pipeline segments and have developed an IMP. We believe that the established IMP meets the requirements of these DOT regulations.
We are also subject to the EPA’s Risk Management Plan (“RMP”) regulations at certain facilities. These regulations are intended to work with the OSHA Process Safety Management regulations to minimize the offsite consequences of catastrophic releases. The regulations required us to develop and implement a risk management program that includes a five-year accident history, an offsite consequence analysis process, a prevention program and an emergency response program. We believe we are operating in material compliance with our risk management program.
Eleven miles of our Turkey Creek gathering system are regulated as a utility by the TRRC. To date, there has been no adverse affect to our system due to this regulation. In addition, our Hesco Pipeline Company, LLC, which we purchased in 2007, and our recently purchased DeSoto Pipeline are regulated by the TRRC. Our purchasing and gathering operations are subject to ratable take and common purchaser statutes. The ratable take statutes generally require gatherers to take, without undue discrimination, natural gas production that may be tendered to the gatherer for handling. Similarly, common purchaser statutes generally require gatherers to purchase without undue discrimination as to source of supply or producer. These statutes are designed to prohibit discrimination in favor of one producer over another producer or one source of supply over another source of supply. These statutes have the effect of restricting our right as an owner of gathering facilities to decide with whom we contract to purchase or gather natural gas. Texas and Louisiana have adopted a complaint-based regulation of natural gas gathering activities, which allows natural gas producers and shippers to file complaints with state regulators in an effort to resolve grievances relating to natural gas gathering access and rate discrimination. The TRRC has authority to enforce its statutory duty to prevent discrimination in natural gas gathering and transportation, to enforce the requirement that parties participate in an informal complaint process, and to punish purchasers, transporters, and gatherers for taking discriminatory actions against shippers and sellers through the imposition of administrative, civil and criminal penalties.
Natural gas gathering may receive greater regulatory scrutiny at both the state and federal levels now that FERC has taken a more light-handed approach to regulation of the gathering activities of interstate pipeline transmission companies and a number of such companies have transferred gathering facilities to unregulated affiliates. Many of the producing states have adopted some form of complaint-based regulation that generally allows natural gas producers and shippers to file complaints with state regulators in an effort to resolve grievances relating to natural gas gathering access and rate discrimination. Our gathering operations could be adversely affected should they be subject in the future to the application of state or federal regulation of rates and services. Our gathering operations also may be or become subject to safety and operational regulations relating to the design, installation, testing, construction, operation, replacement and management of gathering facilities. Additional rules and legislation pertaining to these matters are considered or adopted from time to time. We cannot predict what effect, if any, such changes might have on our operations, but the industry could be required to incur additional capital expenditures and increased costs depending on future legislative and regulatory changes.
Intrastate Pipeline Regulation. Our DeSoto Pipeline, acquired in October 2008 as part of the Millennium Acquisition, transports natural gas both in intrastate commerce and in interstate commerce on its North and Central Texas Systems. The TRRC has authority over the rates, terms and conditions of service for DeSoto Pipeline’s intrastate transportation activities. FERC exercises authority over the rates, terms and conditions of service for DeSoto Pipeline’s interstate transportation activities. Pursuant to Section 311 of the NGPA, rates for such transportation must be “fair and equitable,” and amounts collected in excess of “fair and equitable” rates are subject to refund with interest. In October 2008, DeSoto filed a request for FERC approval to continue to use DeSoto Pipeline’s currently-effective rate for NGPA Section 311 service, which is based on a city-gate transportation rate approved by the TRRC as being fair and equitable and not in excess of a cost-based rate. In March 2009, FERC approved a settlement authorizing DeSoto Pipeline to continue to charge the currently-effective rate for NGPA Section 311 service, subject to a requirement that on or before May 1, 2010, DeSoto Pipeline must either file a new application for rate approval with FERC or file an election to use its then-effective rates for intrastate city-gate transportation service on file with the TRRC. If the latter, then DeSoto Pipeline is required to make a filing with the TRRC for a cost-based rate determination. DeSoto Pipeline is currently evaluating its options under the terms of the settlement. Any failure on our part to comply with the rates approved by the FERC for Section 311 service, to comply with the terms and conditions of service established in our FERC-approved Statement of Operating Conditions, or to comply with applicable FERC regulations, the NGPA, or certain state laws and regulations could result in an alteration of the jurisdictional status of DeSoto Pipeline or the imposition of civil and/or criminal penalties.
Sales of Natural Gas. The price at which we buy and sell natural gas currently is not subject to federal regulation and, for the most part, is not subject to state regulation. Our sales of natural gas are affected by the availability, terms and cost of pipeline transportation. As noted above, the price and terms of access to pipeline transportation are subject to extensive federal and state regulation. The FERC is continually proposing and implementing new rules and regulations affecting those segments of the natural gas industry, most notably interstate natural gas transmission companies that remain subject to the FERC’s jurisdiction. These initiatives also may affect the intrastate transportation of natural gas under certain circumstances. The stated purpose of many of these regulatory changes is to promote competition among the various sectors of the natural gas industry, and these initiatives generally reflect more light-handed regulation, although FERC has recently promulgated regulations to implement the increased market oversight ability conferred by Congress in EPA 2005. FERC has imposed an annual reporting requirement on all industry participants, including otherwise non-jurisdictional entities, engaged in wholesale physical natural gas sales and purchases in excess of a de minimis level. Further, our physical purchases and sales of natural gas, our gathering and/or transportation of natural gas, and any related hedging activities that we undertake are subject to anti-market manipulation regulation by FERC and/or the Commodity Future Trading Commission. These agencies hold substantial enforcement authority, including the ability to assess civil penalties, to order disgorgement of profits, and to recommend criminal penalties for violations of anti-market manipulation laws and related regulations. Violation of the anti-market manipulation laws and regulations could also subject us to related third-party damage claims. We do not believe that we will be affected by these anti-market manipulation requirements materially differently than other natural gas marketers with whom we compete.
Intrastate NGL Pipeline Regulation. We do not own any NGL pipelines subject to FERC’s regulation. We do own and operate an intrastate common carrier NGL pipeline subject to the regulation of the TRRC. The TRRC requires that intrastate NGL pipelines file tariff publications that contain all the rules and regulations governing the rates and charges for service performed. The applicable Texas statutes require that NGL pipeline rates provide no more than a fair return on the aggregate value of the pipeline property used to render services. State commissions have generally not been aggressive in regulating common carrier pipelines and have generally not investigated the rates or practices of NGL pipelines in the absence of shipper complaints. Complaints to state agencies have been infrequent and are usually resolved informally. Although we cannot assure you that our intrastate rates would ultimately be upheld if challenged, we believe that, given this history, the tariffs now in effect are not likely to be challenged or, if challenged, are not likely to be ordered to be reduced. On the other hand, climate change and greenhouse gas regulation, depending on the specific provisions of the regulations may increase demand for natural gas as a lower greenhouse gas emitting fossil fuel.
Upstream Business and Minerals Business
The natural gas and oil industry is extensively regulated by numerous federal, state and local authorities. Legislation affecting the natural gas and oil industry is under constant review for amendment or expansion, frequently increasing the regulatory burden. Also, numerous departments and agencies, both federal and state, are authorized by statute to issue rules and regulations binding on the natural gas and oil industry and its individual members, some of which carry substantial penalties for failure to comply. Although the regulatory burden on the natural gas and oil industry increases our cost of doing business and, consequently, affects our profitability, these burdens generally do not affect us any differently or to any greater or lesser extent than they affect other companies in the industry with similar types, quantities and locations of production.
Legislation continues to be introduced in Congress and development of regulations continues in the Department of Homeland Security and other agencies concerning the security of industrial facilities, including natural gas and oil facilities. Our operations may be subject to such laws and regulations. Presently, it is not possible to accurately estimate the costs we could incur to comply with any such facility security laws or regulations, but such expenditures could be substantial.
Drilling and Production. The activities conducted by us and by the operators on our properties are subject to various types of regulation at the federal, state and local levels. These types of regulation include requiring permits for the drilling of wells, posting of drilling bonds and filing reports concerning operations. Most states, and some counties and municipalities, in which we operate also regulate one or more of the following:
| | • | the method of drilling and casing wells; |
| | • | the surface use and restoration of properties upon which wells are drilled; |
| | • | the disposal of fluids and solids used in connection with our operations; |
| | • | air emissions associated with our operations; |
| | • | the plugging and abandoning of wells; and |
| | • | notice to surface owners and other third parties. |
State laws regulate the size and shape of drilling and spacing units or proration units governing the pooling of natural gas and oil properties. Some states allow forced pooling or integration of tracts to facilitate exploitation while other states rely on voluntary pooling of lands and leases. In some instances, forced pooling or unitization may be implemented by third parties and may reduce our interest in the unitized properties. In addition, state conservation laws establish maximum rates of production from natural gas and oil wells, generally prohibit the venting or flaring of natural gas and impose requirements regarding the ratability of production. These laws and regulations may limit the amount of natural gas and oil we can produce from our wells or limit the number of wells or the locations at which we can drill. Moreover, each state generally imposes a production or severance tax with respect to the production and sale of oil, natural gas and natural gas liquids within its jurisdiction. Additionally, some municipalities also impose property taxes on oil and natural gas interests, production equipment, and our production revenues.
Federal Regulation. The availability, terms and cost of transportation significantly affect sales of natural gas. The interstate transportation and sale for resale of natural gas are subject to federal regulation, including regulation of the rates, terms and conditions of service for interstate transportation, storage and various other matters, primarily by the FERC. Our sale of gas in interstate markets is subject to FERC authority and rules prohibiting market manipulation. Further, FERC has imposed new reporting requirements on entities engaged in wholesale physical natural gas transactions as part of FERC’s initiatives to facilitate price transparency. Federal and state regulations govern the price and terms for access to natural gas pipeline transportation. The FERC’s regulations for interstate natural gas transmission in some circumstances may also affect the intrastate transportation of natural gas.
Although natural gas prices are currently unregulated, Congress historically has been active in the area of natural gas regulation. We cannot predict whether new legislation to regulate natural gas prices or market participants might be proposed, what proposals, if any, might actually be enacted by Congress or the various state legislatures, and what effect, if any, the proposals might have on the operations of the underlying properties. Sales of condensate and natural gas liquids are not currently regulated and are made at market prices.
State Regulation. The various states regulate the drilling for, and the production, gathering and sale of, natural gas, including imposing severance taxes and requirements for obtaining drilling permits. States also regulate the method of developing new fields, the spacing and operation of wells and the prevention of waste of natural gas resources. States may regulate rates of production and may establish maximum daily production allowables from natural gas wells based on market demand or resource conservation, or both. States do not regulate wellhead prices or engage in other similar direct economic regulation, but there can be no assurance that they will not do so in the future. The effect of these regulations may be to limit the amounts of natural gas that may be produced from our wells, and to limit the number of wells or locations we can drill.
The petroleum industry is also subject to compliance with various other federal, state and local regulations and laws. Some of those laws relate to occupational safety, resource conservation and equal employment opportunity. We do not believe that compliance with these laws will have a material adverse effect upon the unitholders.
Environmental Matters
Midstream Business
We operate pipelines, plants, and other facilities for gathering, compressing, treating, processing, fractionating, or transporting natural gas, NGLs, and other products that are subject to stringent and complex federal, state, and local laws and regulations governing the discharge of materials into the environment or otherwise relating to environmental protection. These laws and regulations can adversely affect our capital expenditures, earnings and competitive position in many ways, such as requiring the acquisition of permits to conduct regulated activities; restricting the manner in which we can release materials into the environment; requiring remedial activities or capital expenditures to mitigate pollution from former or current operations, including accidental releases and spills; and imposing substantial liabilities on us for pollution resulting from our operations. The costs of planning, designing, constructing, operating and decommissioning pipelines, plants and other facilities must incorporate compliance with environmental laws and regulations and safety standards. Failure to comply with these laws and regulations may result in the assessment of administrative, civil and criminal penalties, the imposition of remedial obligations, and the issuance of injunctions limiting or prohibiting our activities.
The Comprehensive Environmental Response, Compensation and Liability Act, as amended, also known as “CERCLA” or “Superfund,” and comparable state laws impose liability without regard to fault or the legality of the original conduct, on certain classes of persons who are considered to be responsible for the release of a hazardous substance into the environment. Under CERCLA, these “responsible persons” may be subject to joint and several, strict liability for the costs of cleaning up the hazardous substances that have been released into the environment, for damages to natural resources, and for the costs of certain health studies, and it is not uncommon for neighboring landowners and other third parties to file claims for personal injury and property damage allegedly caused by the release of hazardous substances into the environment. We generate materials in the course of our operations that may be regulated as hazardous substances, and therefore subject to CERCLA. However, we have not to date received notification that we are or may be potentially responsible for cleanup costs under CERCLA.
We also may incur liability under the Resource Conservation and Recovery Act, as amended, also known as “RCRA,” which imposes requirements related to the handling and disposal of solid and hazardous wastes, as well as similar state laws. Although RCRA contains an exclusion from the definition of solid and hazardous wastes for certain materials generated in the exploration, development, or production of crude oil and natural gas, in the course of our operations we may generate petroleum product wastes and ordinary industrial wastes such as paint wastes, waste solvents, and waste compressor oils that may be regulated as solid and hazardous wastes under RCRA. We currently own or lease, and have in the past owned or leased, properties that for many years have been used for midstream natural gas and NGL activities. Although we used operating and disposal practices that were standard in the industry at the time, petroleum hydrocarbons or wastes may have been disposed of or released on or under the properties owned or leased by us or on or under other locations where such wastes have been taken for disposal. In addition, some of these properties have been operated by third parties whose treatment and disposal or release of petroleum hydrocarbons and wastes was not under our control. These properties and the materials disposed or released on them may be subject to CERCLA, RCRA and analogous state laws. Under such laws, we could be required to remove or decontaminate previously disposed wastes or contaminated environmental media, or to perform activities to prevent future contamination.
The Federal Clean Air Act, as amended, and comparable state laws restrict the emission of air pollutants from many sources, including processing plants and compressor stations. These laws and any implementing regulations may require us to obtain pre-approval for the construction or modification of facilities, obtain and comply with the terms of operating permits that may include stringent limitations on air emissions, capacity utilization, and hours of facility operations, or utilize specific equipment or technologies to control emissions. Please refer to our discussion under the heading Legal Proceedings for further information on this subject.
The Federal Water Pollution Control Act of 1972, as amended, also known as the “Clean Water Act,” and analogous state laws impose restrictions and controls on the discharge of pollutants into federal and state waters. These laws also regulate the discharge of stormwater in process areas. Pursuant to these laws and regulations, we are required to obtain and maintain approvals or permits for the discharge of wastewater and stormwater and develop and implement spill prevention, control and countermeasure plans, also referred to as “SPCC plans,” in connection with on-site storage of greater than threshold quantities of oil.
The primary federal law for oil spill liability is the Oil Pollution Act of 1990 (“OPA”), which addresses three principal areas of oil pollution—prevention, containment and cleanup, and liability. OPA applies to vessels, offshore platforms and onshore facilities, including terminals, pipelines and transfer facilities, and subjects owners of such facilities to strict liability for containment and removal costs, natural resource damages and certain other consequences of an oil spill, where such spill is into waters of the U.S. Any unpermitted release of petroleum or other pollutants from our operations could also result in fines or penalties. Some states maintain groundwater protection programs that require permits for discharges or operations that may impact groundwater conditions. These programs may also require remedial activities or capital expenditures to mitigate groundwater contamination along our pipeline systems as a result of past or current operations. Contamination of groundwater resulting from spills or releases of oil or gas is an inherent risk within our industry. We believe, but cannot assure, that our exposure to loss from groundwater contamination will not have a material adverse effect on our financial position.
Federal regulations limiting greenhouse gas ("GHG") emissions or imposing reporting obligations with respect to such emissions have been proposed or finalized. On October 30, 2009, EPA published a final rule requiring the reporting of GHG emissions from specified large sources in the United States beginning in 2011 for emissions occurring in 2010. We have ten facilities that are being evaluated as potential large sources. In addition, on December 15, 2009, EPA published a Final Rule finding that current and projected concentrations of six key GHGs in the atmosphere threaten public health and welfare of current and future generations. EPA also found that the combined emissions of these GHGs from new motor vehicles and new motor vehicle engines contribute to the GHG pollution that threatens public health and welfare. This Final Rule, also known as EPA's Endangerment Finding, does not impose any requirements on industry or other entities directly; however, after the rule's January 14, 2010 effective date, EPA will be able to finalize motor vehicle GHG standards, the effect of which could reduce demand for motor fuels refined from crude oil. Finally, according to EPA, the final motor vehicle GHG standards will trigger construction and operating permit requirements for stationary sources. As a result, EPA has proposed to tailor these programs such that only stationary sources, including refineries that emit over 25,000 tons of GHGs per year will be subject to air permitting requirements. Any limitation on emissions of GHGs from our equipment or operations could require us to incur costs to reduce such emissions. In addition, on September 22, 2009, EPA issued a “Mandatory Reporting of Greenhouse Gases” final rule (“Reporting Rule”). The Reporting Rule establishes a new comprehensive scheme requiring operators of stationary sources emitting more than established annual thresholds of carbon dioxide-equivalent GHGs to inventory and report their GHG emissions annually on a facility-by-facility basis. Further, proposed legislation has been introduced in Congress that would establish an economy-wide cap on emissions of GHGs in the United States and would require most sources of GHG emissions to obtain GHG emission “allowances” corresponding to their annual emissions of GHGs. Although it is not possible at this time to predict how legislation enacted to address climate change may impact our business, any future federal laws or implementing regulations that may be adopted to address greenhouse gas emissions, as well as future climate change litigation against us or our customers for GHG emissions, could result in increased compliance costs or additional operating restrictions. Moreover, new legislation or rules establishing mandates or incentives to conserve energy or use alternative energy sources could have an adverse effect on demand for the oil and natural gas we produce and distribute.
In addition to claims arising under state and federal statutes, where a release or spill of hazardous substances, oil and gas, or oil and gas wastes have occurred, private parties or landowners may bring lawsuits under state law. The plaintiffs in such lawsuits may seek property damages, personal injury damages, remediation costs or injunctions to require remediation or restoration of contaminated environmental media, including soil, sediment, groundwater or surface water. Some of our, oil and gas operations are located near populated areas and routine emissions or accidental releases could affect the surrounding properties and population.
Upstream Business and Minerals Business
Our Upstream Business involves acquiring, developing and producing oil and natural gas working interests. Our Minerals Business involves acquiring and managing fee minerals and royalty interests.
Our and our lease operators’ operations are subject to stringent federal, state and local laws and regulations governing the discharge of materials into the environment or otherwise relating to environmental protection. These operations are subject to the same environmental laws and regulations as other companies in the natural gas and oil industry. These laws and regulations may:
| | • | require the acquisition of various permits before drilling commences; |
| | • | require the installation of expensive pollution control equipment; |
| | • | restrict the types, quantities and concentration of various substances that can be released into the environment in connection with drilling and production activities; |
| | • | limit or prohibit drilling activities on lands lying within wilderness, wetlands and other protected areas; |
| | • | require remedial measures to prevent pollution from former operations, such as pit closure and plugging of abandoned wells; |
| | • | impose substantial liabilities for pollution resulting from our operations; |
| | • | with respect to operations affecting federal lands or leases, require preparation of a Resource Management Plan, an Environmental Assessment, and/or an Environmental Impact Statement; and |
| | • | restrict the rate of natural gas and oil production below the rate that would otherwise be possible. |
On our working interest properties, and particularly our operated properties, we are responsible for conducting operations in a manner that complies with applicable environmental laws and regulations. These laws and regulations may adversely affect our capital expenditures, earnings and competitive position.
Consistent with normal industry practices, substantially all of our oil and gas leases require that, upon termination of economic production, the working interest owners’ plug and abandon non-producing wellbores, remove tanks, production equipment and flow lines and restore the wellsite. The Partnership has recorded liabilities for these asset retirement obligations in accordance with authoritative guidance which applies to obligations associated with the retirement of tangible long-lived assets that result from the acquisition, construction and development of the assets. The guidance requires that we record the fair value of a liability for an asset retirement obligation in the period in which it is incurred and a corresponding increase in the carrying amount of the related long-lived asset.
A portion of our Upstream Business and Minerals Business is derived from non-cost bearing minerals, royalties, and overriding royalty interests. Because we are not the owner or operator of the facilities associated with these interests we believe that we would not be liable or responsible for non-compliance with environmental laws or any environmental damage caused by the operator or other parties as a result of drilling or production activities.
We believe but cannot assure that compliance with existing environmental laws and regulations will not have a material adverse effect on our capital expenditures, earnings and competitive position.
Title to Properties and Rights-of-Way
Midstream Business
Our midstream real property falls into two categories: (1) parcels that we own in fee simple and (2) parcels in which our interest derives from leases, easements, rights-of-way, permits or licenses from landowners or governmental authorities permitting the use of such land for our operations. Portions of the land on which our plants and other major facilities are located are owned by us in fee title, and we believe that we have satisfactory title to these lands. The remainder of the land on which our plant sites and major facilities are located are held by us pursuant to ground leases between us, as lessee, and the fee owner of the lands, as lessors. We, or our predecessors, have leased these lands for many years without any material challenge known to us relating to the title to the land upon which the assets are located, and we believe that we have satisfactory leasehold estates to such lands. We have no knowledge of any challenge to the underlying fee title of any material lease, easement, right-of-way, permit or license held by us or to our title to any material lease, easement, right-of-way, permit or lease, and we believe that we have satisfactory title to all of our material leases, easements, rights-of-way, permits and licenses.
Upstream Business and Minerals Business
As is customary in the natural gas and oil industry, we initially conduct only a cursory review of the title to our properties on which we do not have proved reserves. Prior to completing an acquisition of producing natural gas properties, we perform title reviews on the most significant leases and, depending on the materiality of properties or irregularities we may observe in the title chain, we may obtain a title opinion or review previously obtained title opinions. As a result, we have obtained or reviewed title opinions on a significant portion of our natural gas properties and believe that we have satisfactory title to our producing properties in accordance with standards generally accepted in the natural gas and oil industry. Our natural gas properties are subject to customary royalty and other interests, liens for current taxes and other burdens which we believe do not materially interfere with the use of or affect our carrying value of the properties.
Employees
To carry out our operations, as of December 31, 2009, Eagle Rock Energy G&P, LLC or its affiliates employed approximately 353 people who provide direct support for our operations. None of these employees are covered by collective bargaining agreements. Eagle Rock Energy G&P, LLC considers its employee relations to be good.
Available Information
Eagle Rock provides access free of charge to all of its SEC filings, as soon as reasonably practicable after filing or furnishing it, on its internet site located at www.eaglerockenergy.com. The Partnership will also make available to any unitholder, without charge, copies of its Annual Report on Form 10-K as filed with the SEC. For copies of this, or any other filing, please contact: Eagle Rock Energy Partners, L.P., General Counsel or Chief Financial Officer, 1415 Louisiana Street, Suite 2700, Houston, TX 77002, or call 281-408-1200. Unless explicitly stated otherwise herein, the information on our website is not incorporated by reference into this Annual Report on Form 10-K.
In addition, the public may read and copy any materials Eagle Rock files with the SEC at the SEC’s Public Reference Room at 100 F Street, NE, Washington, DC 20549. The public may obtain information on the operation of the Public Reference Room by calling the SEC at 1-800-SEC-0330. The SEC maintains an internet site (www.sec.gov) that contains reports, proxy and information statements and other information regarding issuers that file electronically with the SEC.
Limited partner interests are inherently different from capital stock of a corporation, although many of the business risks to which we are subject are similar to those that would be faced by a corporation engaged in similar businesses.
If any of the following risks were actually to occur, our business, financial condition or results of operations could be materially adversely affected. In that case, we might not be able to pay a distribution on our common units, the trading price of our common units could decline and you could lose all or part of your investment.
Certain risks apply to both our midstream business and our upstream business. To the extent any risk applies to one or the other, we have indicated the specific risk in the appropriate risk factor.
Risks Related to the Recapitalization and Related Transactions
The failure to complete the Recapitalization and Related Transactions could adversely affect the price of our common units and otherwise have an adverse effect on us.
There can be no assurance that the conditions to the completion of any portion of the Recapitalization and Related Transactions, many of which are out of our control, will be satisfied. Among other things, we cannot be certain that (i) holders of a majority of our common units (other than our general partner and its affiliates) will vote in favor of the Global Transaction Agreement and associated partnership agreement amendments or (ii) no injunction will be granted in the pending unitholder lawsuit challenging the Recapitalization and Related Transactions. See Part I, item 3, “Legal Proceedings.”
If the Recapitalization and Related Transactions are not completed, we may only be able to find alternative means of reducing our debt and improving our liquidity position on less favorable terms. This could enhance the risk that we may violate the leverage covenant ratio contained in our revolving credit facility and restrict our ability to grow and diversify our business and pay distributions to our unitholders.
Further, a failed transaction may result in negative publicity and/or a negative impression of us in the investment community and may affect our relationship with employees, vendors, creditors and other business partners. Accordingly, if the Recapitalization and Related Transactions are not completed, the price of our common units may be adversely affected.
We are subject to litigation related to the Recapitalization and Related Transactions.
We are subject to litigation related to the Recapitalization and Related Transactions. See Part I, Item 3, “Legal Proceedings.” It is possible that additional claims beyond those that have already been filed will be brought by the current plaintiffs or by others in an effort to enjoin the Recapitalization and Related Transactions or seek monetary relief from us. We cannot predict the outcome of this lawsuit, or others, nor can we predict the amount of time and expense that will be required to resolve the lawsuit. An unfavorable resolution of any such litigation surrounding the Recapitalization and Related Transactions could delay or prevent the consummation of the Recapitalization and Related Transactions. In addition, the cost to us of defending the litigation, even if resolved in our favor, could be substantial. We are seeking coverage for defendants under other Director and Officers insurance policies, to the extent costs are in any excess of any applicable retention. Such litigation could also divert the attention of our management and our resources from day-to-day operations.
The Global Transaction Agreement and the Minerals Business Sale Agreement restrict our ability to pursue opportunities and strategic transactions with other parties. Additionally, while we direct internal resources towards the completion of the Recapitalization and Related Transactions, our ability to pursue other attractive business opportunities may be limited.
While the Global Transaction Agreement and the Minerals Business Sale Agreement are in effect, we are prohibited from initiating, soliciting or knowingly encouraging the submission of any competing strategic proposal, including competing proposals for the sale of our Minerals Business, or from participating in any discussions or negotiations regarding any competing strategic proposal, subject to certain exceptions. As a result of the provisions contained in these agreements, our opportunities to enter into more favorable transactions may be limited.
In addition to the economic costs associated with pursuing the Recapitalization and Related Transactions, our general partner’s management will continue to devote substantial time and other resources to the Recapitalization and Related Transactions, which could limit our ability to pursue other attractive business opportunities, including potential joint ventures, stand-alone projects and other transactions. This limitation could adversely affect our growth prospects and the long-term strategic position of our business.
The costs of the Recapitalization and Related Transactions could adversely affect our operations and cash flows available for distribution to our unitholders.
We estimate the total costs of the Recapitalization and Related Transactions will be significant and will primarily consist of investment banking and legal advisors’ fees, accounting fees, financial printing and other related costs, including the reasonable fees and expenses of Natural Gas Partners associated with the Recapitalization and Related Transactions, which we are contractually obligated to reimburse pursuant to the terms of the Global Transaction Agreement. Additionally, if the Global Transaction Agreement is terminated under certain circumstances, including upon a change in, or withdrawal of, the recommendation of the Recapitalization and Related Transactions by our board of directors or our conflicts committee, we will also be required to pay a termination fee of $7 million to Holdings.
These costs could adversely affect our operations and cash flows available for distributions to our unitholders.
If we undertake the rights offering contemplated in the Global Transaction Agreement, to the extent unitholders choose not to fully participate in the rights offering, their ownership position in our common units may be diluted. In addition, unitholders may not be able to transfer the rights on terms that they find acceptable.
Unitholders who do not fully participate in the rights offering should expect that they will, at the completion of the offering, own a smaller proportional interest in us than would otherwise be the case had they fully exercised their rights. In addition, the common units issuable upon the exercise of the warrants to be earned pursuant to this rights offering will further dilute the ownership interest of unitholders not participating in the rights offering or holders of warrants issued pursuant to the rights offering who have not exercised them.
While we anticipate that the rights will be transferable and listed on the NASDAQ Global Select Market, there will not be an established trading market for the rights and there can be no assurance that a market will develop for the rights. Even if a market for the rights does develop, the price of the rights may fluctuate and liquidity may be limited. If a market for the rights does not develop, then holders of the rights may be unable to resell the rights or may only be able to sell them at an unfavorable price.
The tax consequences relating to the warrants issued in connection with the Recapitalization and Related Transactions are unclear, and the IRS may adopt positions that differ from the positions we intend to take.
The tax consequences relating to the issuance and exercise of the warrants issued in connection with the Recapitalization and Related Transactions are unclear. However, we intend for our methods of maintaining capital accounts and allocating income, gain, loss and deduction with respect to the warrants to comply with proposed Treasury regulations issued on January 22, 2003, relating to the tax treatment of noncompensatory options issued by partnerships (the “Noncompensatory Option Regulations”). Under these rules, it is not anticipated that we or our existing common unitholders will recognize income or gain as a result of the issuance or exercise of the warrants. However, it is important to note that the Noncompensatory Option Regulations are proposed Treasury regulations that are subject to change and are not legally binding until they are finalized. There can be no assurance that the proposed Treasury Regulations will ever be finalized, or that they will not be finalized in a substantially different form. Consequently, if the warrants are issued, no assurance can be provided that the issuance and exercise of the warrants will be tax free or that our methods to be adopted for allocating income and loss among our unitholders to take into account the outstanding warrants will be given effect for federal income tax purposes. If our allocations are not respected, a unitholder could be allocated more taxable income (or less taxable loss).
Unitholders will have increased taxable income from us as a result of the Recapitalization and Related Transactions.
We estimate, based on various factual assumptions, that the Recapitalization and Related Transactions will result in an increase in the amount of net income (or decrease in the amount of net loss) allocable to our existing unitholders for the period from January 1, 2010 through December 31, 2012 (the “Projection Period”). Specifically, we estimate that our existing common unitholders will be allocated, on a cumulative basis, between $0.30 and $0.70 more net ordinary income (or less net ordinary loss) per common unit during the Projection Period as a result of the Recapitalization and Related Transactions, excluding any gain from the sale of our Minerals Business and any impact of an equity offering, if one were to occur. Although there are numerous variables, many of which are beyond our control, we anticipate that even with the incremental effects of the Recapitalization and Related Transactions, most, if not all, existing common unitholders will be allocated a net passive loss for the Projection Period. In addition, with respect to the sale of our Minerals Business, each of our current unitholders will be allocated a share of our gain on the sale of our Minerals Business for the year in which the sale occurs, anticipated to be between $0.40 and $1.70 of capital gain per common unit and between $0.20 and $0.70 per common unit of ordinary income attributable to recapture items, depending on the times and prices at which the unitholder purchased its common units. Because a unitholder’s share of our trade or business losses and deductions are subject to passive loss limitations, unitholders may not offset their share of this ordinary income from recapture or their share of this capital gain with their share of our passive losses.
Also as a result of the Recapitalization and Related Transactions, a portion of our liabilities currently allocable to our existing common unitholders will be shifted to the holders of new common units issued as part of the Recapitalization and Related Transactions and each of our existing common unitholders will be deemed to have received a cash distribution equal to the amount by which his allocable share of our liabilities is reduced, which is referred to as a “reducing debt shift.” Distributions made by us to a common unitholder generally will not be taxable to the common unitholder for federal income tax purposes, except to the extent the amount of any such cash distribution exceeds the unitholder’s tax basis in its common units immediately before the distribution. Distributions from us that are in excess of a unitholder’s tax basis generally will be considered to be gain from the sale or exchange of the common units. Thus, if a reducing debt shift and the resulting deemed cash distribution exceeds such unitholder’s basis in our common units, such unitholder would recognize gain in an amount equal to such excess. However, such unitholder generally will not recognize taxable gain if such unitholder’s tax basis in our common units is positive without including any basis associated with such unitholder’s share of our liabilities. Although, because of the prices at which the holders of our common units purchased their respective common units, we do not anticipate that our existing common unitholders will recognize taxable gain as a result of any potential reducing debt shifts caused by the Recapitalization and Related Transactions, we have not received an opinion with respect to the reducing debt shifts and no assurances can be given.
The foregoing is not intended to constitute a solicitation of any vote or proxy, which will be solicited only by an appropriate proxy statement or appropriate soliciting materials. The above is merely a recitation of risk associated with the Recapitalization and Related Transactions.
Risks Related to Our Revolving Credit Facility
We have significant indebtedness under our revolving credit facility. We may have difficulty complying with the leverage ratio covenant set forth in our revolving credit facility during 2010.
As of December 31, 2009, total borrowings under our revolving credit facility were approximately $754.4 million, and our leverage ratio (amount of outstanding debt over Adjusted EBITDA, as defined in the credit agreement) was approximately 4.6 versus a maximum allowable ratio level of 5.0. Our ability to comply with the leverage ratio covenant during 2010 is uncertain and may depend on our ability to reduce debt or increase our Adjusted EBITDA. Our strategies to remain in compliance may include (i) the liquidity enhancements contemplated in the Recapitalization and Related Transactions, (ii) asset sales, and/or (iii) enhancements to our hedging portfolio (including through hedge reset transactions). Other factors beyond our control that may contribute to our ability to comply with the leverage ratio covenant include, but are not limited to, commodity prices and drilling activity by our producer customers. If we breach the leverage ratio covenant, an event of default would occur under our revolving credit facility. An event of default could cause an acceleration of our repayment of the outstanding amounts under our revolving credit facility or, if waived, incurrence of a waiver fee and/or an increase in the applicable interest-rate margins in our revolving credit facility.
Our current debt levels have limited, and may continue to limit, our flexibility in obtaining additional financing and in pursuing other business opportunities. In addition, we may incur substantial debt in the future to enable us to maintain or increase our reserve and production levels and to otherwise pursue our business plan. This debt may restrict our ability to make distributions.
In December 2007, we entered into an $800 million senior secured credit facility. During the year ended December 31, 2008, we exercised $180 million of our $200 million accordion feature under the credit facility, which increased total commitments from lenders under our credit facility to $980 million. Our level of outstanding debt has had, and could continue to have important consequences to us, including the following:
| | • | our ability to obtain additional financing, if necessary, for working capital, capital expenditures, acquisitions or other purposes may be impaired or such financing may not be available on favorable terms; |
| | • | we will need a portion of our cash flow to make interest payments on our debt, reducing the funds that would otherwise be available for operations, future business opportunities and distributions to unitholders; |
| | • | our debt level will make us more vulnerable to competitive pressures or a downturn in our business or the economy generally; and |
| | • | our debt level may limit our flexibility in responding to changing business and economic conditions. |
Our ability to service our debt will depend upon, among other things, our future financial and operating performance, which will be affected by prevailing economic conditions and financial, business, regulatory and other factors, some of which are beyond our control. In addition, our ability to service debt under our credit facility will depend on market interest rates, since we anticipate that the interest rates applicable to our borrowings will fluctuate with movements in interest rate markets. If our operating results are not sufficient to service our current or future indebtedness or comply with our financial covenants under our existing credit facility, we will be forced to take actions such as eliminating, reducing or further reducing distributions, reducing or delaying our business activities and expenses, acquisitions, investments or capital expenditures, selling assets, restructuring or refinancing our debt, or seeking additional equity capital. We may not be able to affect any of these actions on satisfactory terms, or at all.
Our Upstream Business requires a significant amount of capital expenditures to maintain and grow production levels. If commodity prices were to decline for an extended period of time, if the costs of our acquisition and drilling and development operations were to increase substantially, or if other events were to occur which reduced our revenues or increased our costs, we may be required to borrow significant amounts in the future to enable us to finance the expenditures necessary to replace the reserves we produce. The cost of the borrowings and our obligations to repay the borrowings will reduce amounts otherwise available for distributions to our unitholders.
Low commodity price levels have resulted in, and may result in further decreases of our borrowing base under our credit facility, impacting our covenant compliance.
Our credit facility accommodates, through the use of a borrowing base for our Upstream Business and traditional cash-flow based covenants for our Midstream and Minerals Businesses, the allocation of indebtedness to either our Upstream Business (to be measured against the borrowing base) or to our Midstream and Minerals Businesses (to be measured against the cash-flow based covenant). As of December 31, 2009, our borrowing base for our Upstream Business had been reduced to $135 million, resulting in a higher allocation of indebtedness to our Midstream and Minerals Business and a rise in our leverage ratio which reported our availability under our credit facility and put us at risk for potential breach of covenants (including total leverage ratio test) under our credit facility. A decrease in our borrowing base would result in a higher allocation of indebtedness to our Midstream and Minerals Businesses and a rise in our leverage ratio which may impact our availability under our credit facility and, potentially, put us at risk of breach covenants.
Restrictions in our credit facility limit our ability to make distributions in certain circumstances and limit our ability to enter into certain types of acquisitions and other business opportunities.
Our credit facility contains covenants limiting our ability to make distributions, incur indebtedness, grant liens, make acquisitions, investments or dispositions and engage in transactions with affiliates. Furthermore, our credit facility contains covenants requiring us to maintain certain financial ratios and tests. Any subsequent replacement, restatement or amendment of our credit facility or any new indebtedness could impose similar or greater restrictions.
Risks Related to Our Business
Because of the natural decline in production from existing wells, our success depends on our ability to obtain new sources of production and supplies of oil, natural gas and NGLs, which are dependent on certain factors, many of which are beyond our control. Our success is also dependent on developing current reserves. Any decrease in production or supplies of oil, natural gas or NGLs could adversely affect our business and operating results.
The volume of gas that we gather, process and/or produce is dependent on the level of production from hydrocarbon-producing wells. The production rate of these wells naturally will decline over time, and as a result, our cash flows associated with them will also decline over time. In order to maintain or increase the throughput levels of our assets we must continually obtain new supplies of natural gas to offset these declines.
In our Midstream Business, the primary factors affecting our ability to obtain new supplies of natural gas and NGLs and attract new customers to our assets include: (1) the level of successful drilling activity by producers near our systems and (2) our ability to compete for volumes from successful new wells. The level of drilling activity is dependent on economic and business factors that are beyond our control. The primary factor that impacts producers’ drilling decisions is natural gas prices. A sustained decline in natural gas prices could result in a decrease in exploration and development activities in the fields served by our gathering systems and our natural gas treating and processing plants, which would lead to reduced utilization of these assets. Other factors that impact production decisions include producers’ capital budgets, the ability of producers to obtain capital and necessary drilling and other governmental permits and regulatory changes. Because of these factors, even if new natural gas reserves are discovered in areas served by our assets, we and other producers may choose not to develop those reserves.
In our Upstream Business, we also have risks inherent with declining reserves. Our producing reservoirs experience production rate declines that vary depending upon reservoir characteristics and other factors. The overall production decline rate of our upstream business may change when additional wells are drilled, make acquisitions and under other circumstances. Our future cash flows and income, and our ability to maintain and to increase distributions to unitholders are partly dependent on our success in efficiently developing and exploiting our current reserves and economically finding or acquiring additional recoverable reserves. We may not be able to develop, find or acquire additional reserves to replace our current and future production at acceptable costs, which would adversely affect our business, financial condition and results of operations. Factors that may hinder our ability to acquire additional reserves or develop current reserves include competition, access to capital, prevailing oil and natural gas prices, the costs incurred by us to develop and exploit current and future oil and natural gas reserves, and the number and attractiveness of properties for sale.
Natural gas, NGLs, crude oil and other commodity prices are volatile, and an adverse movement in these prices could adversely affect our cash flow and our ability to make distributions.
We are subject to risks due to frequent and often substantial fluctuations in commodity prices. Changes in NGL prices are generally well-correlated to changes in crude oil prices. In the past, the prices of natural gas and crude oil have been extremely volatile, and we expect this volatility to continue. A drop in prices can significantly affect our financial results and impede our growth, including our ability to maintain or increase our borrowing capacity, to repay current or future indebtedness and to obtain additional capital on attractive terms, all of which can affect our ability to pay distributions.
Changes in crude oil and natural gas prices have a significant impact on the value of our reserves and on our cash flows. In 2009, the settlement price of the prompt month NYMEX natural gas contract ranged from $2.51 per MMBtu to $6.07 per MMBtu, and the settlement price of prompt month NYMEX crude oil contract ranged from $33.98 per barrel to $81.37 per barrel.
The prices for oil, natural gas and NGLs depend upon the supply and demand for these products, which in turn depend on a large number of complex, interrelated factors that are beyond our control. These factors include:
| | • | the overall level of economic activity in the United States and the world; |
| | • | the impact of weather or other force majeure events; |
| | • | political and economic conditions and events in, as well as actions taken by, foreign oil and natural gas producing nations; |
| | • | significant crude oil or natural gas discoveries; |
| | • | the availability of local, intrastate and interstate transportation systems including natural gas pipelines and other transportation facilities to our production; |
| | • | the availability and marketing of competitive fuels; |
| | • | delays or cancellations of crude oil and natural gas drilling and production activities; |
| | • | the impact of energy conservation efforts, including technological advances affecting energy consumption; and |
| | • | the extent of governmental regulation and taxation. |
Lower oil or natural gas prices may not only decrease our revenues and net proceeds, but also reduce the amount of oil or natural gas that we, and other producers using our midstream assets, can economically produce. As a result, the operators may, especially during periods of low commodity prices, decide to shut in or curtail production, or to plug and abandon marginal wells. In our upstream business, this may result in substantial downward adjustments to our estimated proved reserves.
We are required to perform impairment tests on our assets whenever our estimates of the useful life or future cash flows of an asset indicates that the carrying amount may not be recoverable or whenever management’s plans change with respect to those assets. Reductions in commodity prices are one of the events that can cause us to conduct impairment tests on our assets. For this reason and others, we evaluated our assets for potential impairment on several occasions in 2009, and these evaluations resulted in a total impairment charge of $22.1 million. We may incur additional impairment charges in the future; these may have a material adverse effect on our results of operations and our ability to borrow funds under our credit facility, and may adversely affect our ability to make cash distributions to our unitholders.
The loss of any of our significant customers could result in a decline in our volumes, revenues and cash available for distribution.
In our Midstream Business we rely on certain natural gas producer customers for a significant portion of our natural gas and NGL supply. The number and relative significance of gas suppliers can change based upon a number of reasons, including the relative success of the producers’ drilling programs, additions or cancellations of gathering and processing agreements, and the acquisition of new systems. We may be unable to negotiate new long-term contracts, or extensions or replacements of existing contracts, on favorable terms, if at all. The loss of even a portion of the natural gas volumes supplied by our significant customers, as a result of competition or otherwise, could have an adverse effect on our business, results of operations and financial condition, unless we were able to acquire comparable volumes from other sources.
In our Upstream and Minerals Businesses, if a significant customer reduces the volume of its purchases from us, we could experience a temporary interruption in sales of, or lower prices for, our production. As a result our revenues and cash available for distribution could decline which may adversely affect our ability to make cash distributions to our unitholders.
Our hedging activities may have a material adverse effect on our earnings, profitability, cash flows and financial condition.
Because we are exposed to risks associated with fluctuating commodity prices, we utilize various financial instruments (swaps, collars, and puts) to mitigate these risks. Nevertheless, it is possible that these hedging activities may not be effective in reducing our exposure to commodity price risk. For instance, we may not produce or process sufficient volumes to cover our hedges, we may fail to hedge a sufficient portion of our future production or the instruments we use may not adequately correlate with changes in the prices we receive. Our current hedging position is presented in Part II, Item 7A. Qualitative and Quantitative Disclosure About Market Risk.
To the extent we hedge our commodity price and interest rate risk, we may forego the benefits we would otherwise experience when commodity prices or interest rates improve. Furthermore, because we have entered into derivative transactions related to only a portion of the commodity volumes and outstanding debt to which we have price and interest rate exposure, we will continue to have direct commodity price and interest rate risk on the unhedged portion. Our actual future supply and production may be significantly higher or lower than we estimated at the time we entered into the commodity derivative transactions for that period. If the actual amount is higher than we estimated, we will have more commodity price risk than we intended. If the actual amount is lower than the amount that is subject to our derivative financial instruments, we might be forced to satisfy all or a portion of our derivative transactions without the benefit of the underlying physical commodity, resulting in a reduction of our liquidity.
As a result of these factors, our hedging activities may not be as effective as we intend in reducing the volatility of our cash flows, and in certain circumstances may actually increase the volatility of our cash flows. In addition, hedging activities may result in substantial losses. Such losses could occur under various circumstances, such as when a counterparty fails to perform its obligations under the applicable hedging arrangement, the hedging arrangement is imperfect or ineffective, or our hedging policies and procedures are not properly followed or otherwise do not work as planned. The steps we take to monitor our hedging activities may not detect and prevent violations of our risk management policies and procedures, particularly if deception or other intentional misconduct is involved.
As a result of our hedging activities and our practice of marking to market the value of our hedging instruments, we will also experience significant variations in our unrealized derivative gains/ (losses) from period to period. These variations from period to period will follow variations in the underlying commodity prices and interest rates. As this item is of a non-cash nature, it will not impact our cash flows or our ability to make our distributions. However, it will impact our earnings and other profitability measures. To illustrate, during the twelve months ended December 31, 2009, we experienced negative movements in our underlying commodities’ prices which led to an unrealized derivative loss of $141.2 million. This $141.2 million loss had a direct impact on our net income (loss) line resulting in a net loss of $171.3 million. For additional information regarding our hedging activities, please read Part II, Item 7A. Quantitative and Qualitative Disclosures About Market Risk.
Our estimated oil and natural gas reserve quantities and future production rates are based on many assumptions that may prove to be inaccurate. Any material inaccuracies in these reserve estimates or the underlying assumptions will materially affect the quantities and present value of our reserves.
Numerous uncertainties are inherent in estimating quantities of oil and natural gas reserves. The process of estimating oil and natural gas reserves is complex, requiring significant decisions and assumptions in the evaluation of available geological, engineering and economic data for each reservoir, and these reports rely upon various assumptions, including future oil and natural gas prices, production levels and operating and development costs. As a result, estimated quantities of proved reserves and projections of future production rates and the timing of development expenditures may prove to be inaccurate. Over time, we may make material changes to reserve estimates taking into account the results of actual drilling and production. Any significant change in our assumptions or actual performance of our wells could greatly affect our estimates of reserves, the classifications of the reserves and our estimates of the future net cash flows associated with the reserves. In addition, since many of our wells are mature and have low production rates, changes in future production costs assumptions could have a significant effect on our proved reserve estimates.
The standardized measure of discounted future net cash flows of our estimated net proved reserves is not necessarily the same as the current market value of our estimated net proved reserves. We base the discounted future net cash flows from our estimated net proved reserves on average prices observed in the previous twelve months and on cost estimates we believe reflect the costs at the end of the period. Actual prices received for production and actual costs of such production will be different than these assumptions, perhaps materially.
The timing of both our production and our incurrence of expenses in connection with the development and production of our properties will affect the timing of actual future net cash flows from proved reserves, and thus their actual present value. In addition, the discount factor we use when calculating discounted future net cash flows may not be the most appropriate discount factor based on interest rates in effect from time to time and risks associated with us or the natural gas and oil industry in general. Any material inaccuracy in our reserve estimates or underlying assumptions will materially affect the quantities and present value of our reserves which could adversely affect our business, results of operations, financial condition and our ability to make cash distributions to our unitholders.
In our Minerals Business, due to the nature of ownership of royalties, overriding royalties and fee minerals, we will not usually be able to control the timing of drilling by the operators who have taken an oil and gas lease on our lands. This leads to uncertainty in the timing of future reserve additions and production increases resulting from new drilling across our assets. Any material inaccuracy in our reserve estimates or underlying assumptions will materially affect the quantities and present value of our reserves which could adversely affect our business, results of operations, financial condition and our ability to make cash distributions to our unitholders.
Our operations will require substantial capital expenditures, which will reduce our cash available for distribution. We may be unable to obtain needed capital or financing on satisfactory terms, which could lead to a decline in our cash flows.
The oil and natural gas industry is capital intensive. We expect to continue to make substantial capital expenditures in our business for the maintenance, construction and acquisition of midstream assets and oil and natural gas reserves. We intend to finance our future capital expenditures with cash flows from operations, borrowings under our credit facility and the issuance of debt and equity securities, when market conditions allow. The incurrence of debt will require that a portion of our cash flows from operations be used for the payment of interest and principal on our debt, thereby reducing our ability to use cash flows to fund working capital, capital expenditures and acquisitions. Our cash flows from operations and access to capital are subject to a number of variables, including:
| | • | volume throughput through our pipelines and processing facilities; |
| | • | the estimated quantities of our oil and natural gas reserves; |
| | • | the amount of oil and natural gas produced from existing wells; |
| | • | the prices at which we sell our production or that of our midstream customers; |
| | • | the strike prices of our hedges; |
| | • | our operating and general and administrative expenses; and |
| | • | our ability to acquire, locate and produce new reserves. |
If our revenues or the borrowing base under our credit facility decrease as a result of lower commodity prices, operating difficulties, declines in reserves or for any other reason, we may have limited ability to obtain the capital necessary to sustain our operations at current levels, or to pursue our growth strategy. Our credit facility may restrict our ability to obtain new financing. If additional capital is needed, we may not be able to obtain debt or equity financing on terms favorable to us, or at all. If cash generated by operations or available under our credit facility is not sufficient to meet our capital requirements, the failure to obtain additional financing could result in a curtailment of our operations relating to development of our capital projects, which in turn could lead to a possible decline in our gathering and processing available capacity or in our natural gas and crude oil reserves and production, which could adversely effect our business, results of operation, financial conditions and ability to make distributions to our unitholders. In addition, we may lose opportunities to acquire oil and natural gas properties and businesses.
To fund our capital expenditures, we will be required to use cash generated from our operations, additional borrowings or the issuance of additional partnership interests, or some combination thereof.
In 2010, our capital program is expected to be approximately $40 million, excluding acquisitions. Use of cash generated from operations to fund future capital expenditures will reduce cash available for distribution to our unitholders. Our ability to obtain bank financing or to access the capital markets for future equity or debt offerings to fund future capital expenditures may be limited by our financial condition at the time of any such financing or offering and the covenants in our debt agreements, as well as by oil and natural gas prices, the value and performance of our equity securities, and adverse market conditions resulting from, among other things, general economic conditions and contingencies and uncertainties that are beyond our control. Our failure to obtain the funds for necessary future capital expenditures could have a material adverse effect on our business, results of operations, financial condition and ability to pay distributions. Even when we are successful in obtaining the necessary funds, the terms of such financings could limit our ability to pay distributions to our unitholders. In addition, incurring additional debt may significantly increase our interest expense and financial leverage, and issuing additional partnership interests may result in significant unitholder dilution which could have a material adverse effect on our ability to pay distributions at the then-current distribution rate.
We typically do not obtain independent evaluations of other producers’ natural gas reserves dedicated to our gathering and processing systems; therefore, volumes of natural gas on our systems in the future could be less than we anticipate.
We typically do not obtain independent evaluations of other producers’ natural gas reserves connected to our systems due to the unwillingness of producers to provide engineering and geological data related to their wells and to the cost of such evaluations. Accordingly, we do not have independent estimates of the reserves of the wells that are dedicated to our systems or of the anticipated productive life of those wells. If the total reserves, production or estimated life of the wells connected to our gathering systems is less than we anticipate and we are unable to secure additional sources of natural gas, then the volumes of natural gas on our systems in the future could be less than we anticipate. A decline in the volumes of natural gas on our systems could have a material adverse effect on our business, results of operations, financial condition and our ability to make cash distributions.
Failure of the natural gas, NGLs, condensate or other products produced at our plants or shipped on our pipelines to meet the specifications of interconnecting pipelines or markets could result in curtailments by the pipelines or markets.
The markets and pipelines to which we deliver natural gas, NGLs, condensate or other products typically establish specifications for the products that they are willing to accept. These specifications include requirements such as hydrocarbon dewpoint, compositions, temperature, and foreign content (such as water, sulfur, carbon dioxide, and hydrogen sulfide), and these specifications can vary by product, pipeline or markets. If the total mix of a product that we deliver to a pipeline or market fails to meet the applicable product quality specifications, the pipeline or market may refuse to accept all or a part of the products scheduled for delivery to it or may invoice us for the costs to handle the out-of-specification products. In those circumstances, we may be required to find alternative markets for that product or to shut-in the producers of the non-conforming natural gas that is causing the products to be out of specification, potentially reducing our through-put volumes or revenues.
We may encounter obstacles to marketing our oil, natural gas, NGLs and sulfur, which could adversely impact our revenues.
Access to markets is, in many respects, beyond our control. Access to markets for our production will depend in part upon the availability, proximity and capacity of natural gas gathering systems, pipelines, fractionators, storage and transportation facilities owned by third parties. The amount of oil, natural gas and NGLs that can be produced and sold is subject to limitation in certain circumstances, such as pipeline interruptions due to scheduled and unscheduled maintenance, excessive pressure, physical damage to the gathering or transportation system, or lack of contracted capacity on such systems. The curtailments arising from these and other circumstances may last from a few days to several months, and in many cases, we are only provided with limited, if any, notice as to when these circumstances will arise and their duration. Our access to transportation options can also be affected by U.S. federal and state regulation of oil and natural gas production and transportation, general economic conditions, and changes in supply and demand. If market factors dramatically change, the impact on our revenues could be substantial and could adversely affect our ability to produce and market oil and natural gas, the value of our units and our ability to pay distributions on our units. Sulfur is a by-product associated with substantially all of the natural gas production in our upstream operations in Alabama and East Texas and we have a limited ability to store it at our facilities. If we were unable to either sell or dispose of the sulfur we produce in these areas, we may be forced to curtail our oil and gas production.
We may not successfully balance our purchases and sales of natural gas, which would increase our exposure to commodity price risks.
We purchase from producers and other customers a substantial amount of the natural gas that flows through our natural gas gathering, processing and transportation systems for resale to third parties, including natural gas pipelines, marketers and a reduced number of end-users. We may not be successful in balancing our purchases and sales. A producer or supplier could fail to deliver contracted volumes or deliver in excess of contracted volumes, or a purchaser could purchase less than contracted volumes. Any of these actions could cause our purchases and sales to be unbalanced. If our purchases and sales are unbalanced, we will face increased exposure to commodity price risks and could have increased volatility in our operating income and cash flows.
Our Upstream Business depends on gathering, transportation and processing facilities. Any limitation in the availability of, or our access to, those facilities would interfere with our ability to market the oil, natural gas and NGLs we produce, and could reduce our cash available for distribution and adversely impact expected increases in oil, natural gas and NGL production from our drilling program.
The marketability of our oil, gas and NGL production depends in part on the accessibility, availability, proximity and capacity of gathering, processing and pipeline systems. The amount of oil, natural gas and NGLs that can be produced and sold is subject to limitation in certain circumstances, such as pipeline interruptions due to scheduled and unscheduled maintenance, excessive pressure, physical damage to the gathering, processing or transportation system, weather, or lack of contracted capacity on such systems. The curtailments arising from these and similar circumstances may last from a few days to several months. In many cases, we are provided only with limited, if any, notice as to when these circumstances will arise and their duration. In addition, some of our wells may be drilled in locations that are not serviced by gathering, processing and transportation facilities, or the gathering and transportation pipelines in the area may not have sufficient capacity to transport additional production. As a result, we may not be able to sell the oil, gas and NGL production from these wells until the necessary gathering, processing and transportation facilities are constructed. Any significant curtailment in gathering system or pipeline capacity, or significant delay in the construction of necessary gathering, processing and transportation facilities, would interfere with our ability to market the oil, gas and NGLs we produce, and could reduce our cash available for distribution and adversely impact expected increases in oil and gas production from our drilling program. Our access to transportation options can also be affected by U.S. federal and state regulations of oil and natural gas production and transportation and other general economic conditions beyond our control.
If third-party pipelines and other facilities interconnected to our midstream systems become unavailable to transport or produce natural gas and NGLs, our revenues and cash available for distribution could be adversely affected.
We depend upon third-party pipelines, natural gas gathering systems and other facilities that provide delivery options to and from our pipelines and facilities for the benefit of our midstream customers. Since we do not own or operate any of these pipelines or other facilities, their continuing operation is not within our control. If any of these third-party pipelines and other facilities become unavailable or limited in their ability to transport or produce natural gas and NGLs, our revenues and cash available for distribution could be adversely affected.
Our industry is highly competitive, and increased competitive pressure could adversely affect our business and operating results.
We compete with similar enterprises in our respective areas of operation. Some of our competitors are large oil and natural gas companies that have greater financial resources and access to supplies of natural gas and NGLs than we do.
In our Midstream Business, some of our competitors may expand or construct gathering, processing and transportation systems that would create additional competition for the services we provide to our customers. In addition, our customers who are significant producers of natural gas may develop their own gathering, processing and transportation systems in lieu of using ours. Likewise, our customers who produce NGLs may develop their own processing facilities in lieu of using ours. Our ability to renew or replace existing contracts with our customers at rates sufficient to maintain current revenues and cash flows could be adversely affected by the activities of our competitors and our customers. All of these competitive pressures could have a material adverse effect on our business, results of operations, financial condition and ability to make cash distributions.
In our Upstream Business, our ability to acquire additional properties and to discover reserves in the future will be dependent upon our ability to evaluate and select suitable properties and to consummate transactions in a highly competitive environment. Many of our larger competitors not only drill for and produce oil and natural gas, but also conduct refining operations and market petroleum and other products on a regional, national or worldwide basis. These companies may be able to pay more for natural gas properties and evaluate, bid for and purchase a greater number of properties than our financial or human resources permit. In addition, these companies may have a greater ability to continue drilling activities during periods of low oil and natural gas prices, to contract for drilling equipment, to secure trained personnel and to absorb the burden of present and future federal, state, local and other laws and regulations. The oil and natural gas industry has periodically experienced shortages of drilling rigs, equipment, pipe and personnel, which has delayed development drilling and other exploitation activities and has caused significant price increases.
In both the Midstream and Upstream Businesses, competition has been strong in hiring experienced personnel, particularly in the engineering, accounting and financial reporting, tax and land departments. In addition, competition is strong for attractive midstream assets, natural gas producing properties, oil and natural gas companies and undeveloped leases and drilling rights. We may be often outbid by competitors in our attempts to acquire assets, properties or companies. Our inability to compete effectively with larger companies could have a material adverse impact on our business activities, financial condition and results of operations.
We are exposed to the credit risk of our customers and other counterparties, and a general increase in the nonperformance by counterparties could have an adverse impact on our cash flows, results of operations and financial condition. Also, we withhold our revenue in our payments to our midstream customers so we don’t have credit risk with our E&P customers.
We are subject to risks of loss resulting from nonperformance by our customers and other counterparties, such as our lenders and other hedge counterparties. Many of our customers finance their activities through cash flow from operations, the incurrence of debt or the issuance of equity. Any deterioration in the financial health of our customers and counterparties or any factors causing reduced access to capital for them may result in the reduction in their ability to pay or otherwise perform on their obligations to us. Furthermore, some of our customers may be highly leveraged and subject to their own operating and regulatory risks, which increases the risk that they may default on their obligations to us. Any increase in the nonperformance by our counterparties, either as a result of recent changes in financial and economic conditions or otherwise, could have an adverse impact on our operating results and could adversely affect our liquidity.
Our construction of new assets may not result in revenue increases and is subject to regulatory, environmental, political, legal and economic risks, which could adversely affect our results of operations and financial condition.
One of the ways we intend to grow our business is through the construction of new midstream assets. The construction of additions or modifications to our existing systems and the construction of new midstream assets involve numerous regulatory, environmental, political and legal uncertainties beyond our control and may require the expenditure of significant amounts of capital. If we undertake these projects, they may not be completed on schedule or at the budgeted cost, or at all.
Our revenues may not increase immediately upon the expenditure of funds on a particular project. For instance, if we expand a pipeline, the construction expenditures may occur over an extended period of time, yet we will not receive any material increases in revenues until the project is completed. Also, we may construct facilities to capture anticipated future growth in production in a region in which such growth does not materialize. To the extent we rely on estimates of future production in our decision to construct additions to our systems, such estimates may prove to be inaccurate. As a result, new facilities may not be able to attract enough throughput to achieve our expected investment return, which could adversely affect our results of operations and financial condition.
The construction of additions to our existing gathering and transportation assets may require us to obtain new rights-of-way prior to constructing new pipelines. We may be unable to obtain such rights-of-way to connect new natural gas supplies to our existing gathering lines or capitalize on other attractive expansion opportunities. Additionally, it may become more expensive for us to obtain new rights-of-way or to renew existing rights-of-way. If the cost of renewing or obtaining new rights-of-way increases, our cash flows could be adversely affected.
If we do not make acquisitions on economically acceptable terms, our future growth will be limited.
Our ability to grow our business depends, in part, on our ability to make acquisitions that result in an increase in the cash generated from operations per unit. If we are unable to make these accretive acquisitions either because we are: (1) unable to identify attractive acquisition candidates or negotiate acceptable purchase contracts with them, (2) unable to obtain financing for these acquisitions on economically acceptable terms, or (3) outbid by competitors, then our future growth and ability to increase distributions will be limited. Furthermore, even if we do make acquisitions that we believe will be accretive, these acquisitions may nevertheless result in a decrease in the cash generated from operations per unit because of unforeseen circumstances.
All acquisitions involve potential risks, including, among other things:
| | • | mistaken assumptions about future prices, volumes, revenues and costs of oil and natural gas, including synergies and estimates of the oil and natural gas reserves attributable to a property we acquire; |
| | • | an inability to integrate successfully the businesses we acquire; |
| | • | inadequate expertise for new geographic areas, operations or products and services; |
| | • | inefficiencies and complexities that can arise because of unfamiliarity with new assets and the businesses associated with them, including their markets; |
| | • | the assumption of unknown liabilities for which we are not indemnified or for which our indemnity is inadequate; |
| | • | limitations on rights to indemnity from the seller; |
| | • | mistaken assumptions about the overall costs of equity or debt; |
| | • | decrease in our liquidity as a result of our using a significant portion of our available cash or borrowing capacity to finance the acquisition; |
| | • | a significant increase in our interest expense or financial leverage if we incur additional debt to finance the acquisition; |
| | • | the diversion of management’s and employees’ attention from other business concerns; |
| | • | customer or key employee losses at the acquired businesses; and |
| | • | establishment of internal controls and procedures that we are required to maintain under the Sarbanes-Oxley Act of 2002. |
If we consummate any future acquisitions, our capitalization and results of operations may change significantly, and the limited partners will not have the opportunity to evaluate the economic, financial and other relevant information that we will consider in determining the application of financing, human and other resources.
Our ability to derive benefits from our acquisitions will depend on our ability to integrate operations to achieve the benefits of the acquisitions.
Achieving the anticipated benefits from acquisitions depends in part upon whether we are able to integrate the assets or businesses of these acquisitions, in an efficient and effective manner. We may not be able to accomplish the integration process smoothly or successfully. The difficulties combining businesses or assets potentially will include, among other things:
| | • | geographically separated organizations and possible differences in corporate cultures and management philosophies; |
| | • | significant demands on management resources, which may distract management’s attention from day-to-day business; |
| | • | differences in the disclosure systems, accounting systems, and accounting controls and procedures of the two companies, which may interfere with our ability to make timely and accurate public disclosure; and |
| | • | the demands of managing new lines of business acquired. |
Any inability to realize the potential benefits of the acquisition, as well as any delays in integration, could have an adverse effect upon the revenues, level of expenses and operating results of the company, after the acquisitions, which may affect the value of our common units after the acquisition.
We may not be able to fully execute our business strategy if we encounter illiquid capital markets.
One component of our business strategy contemplates pursuing opportunities to acquire assets where we believe growth opportunities are attractive and our business strategies could be applied. We regularly consider and enter into discussions regarding strategic transactions that we believe will present opportunities to pursue our growth strategy.
We will require substantial new capital to finance strategic acquisitions. Any limitations on our access to capital will impair our ability to execute this component of our growth strategy. If the cost of such capital becomes too expensive, our ability to develop or acquire accretive assets will be limited. We may not be able to raise the necessary funds on satisfactory terms, if at all. The primary factors that influence our cost of capital include our units’ market performance, conditions in the debt and equity markets and offering or borrowing costs such as interest rates or underwriting discounts.
We do not own all of the land on which our pipelines and facilities are located, which could disrupt our operations.
We do not own all of the land on which our pipelines and facilities have been constructed, and we are therefore subject to the possibility of more onerous terms and/or increased costs to retain necessary land use if we do not have valid rights of way or if such rights of way lapse or terminate. We obtain the rights to construct and operate our pipelines on land owned by third parties and governmental agencies for a specific period of time. Our loss of these rights, through our inability to renew right-of-way contracts or otherwise, could have a material adverse effect on our business, results of operations and financial condition and our ability to make cash distributions.
Our business involves many hazards and operational risks, some of which may not be fully covered by insurance. If a significant accident or event occurs that is not fully insured or interrupts normal operations, our operations and financial results could be adversely affected.
Our operations are subject to many hazards inherent in the drilling, producing, gathering, compressing, treating, processing and transporting of oil, natural gas and NGLs, including:
| | • | damage to production equipment, pipelines and plants, related equipment and surrounding properties caused by hurricanes, tornadoes, floods, fires and other natural disasters and acts of terrorism; |
| | • | inadvertent damage from construction, farm and utility equipment; |
| | • | leaks of natural gas, poisonous hydrogen sulfide gas, NGLs and other hydrocarbons or losses of natural gas or NGLs as a result of the malfunction of pipeline, equipment or facilities; |
| | • | fires and explosions; and |
| | • | other hazards that could also result in personal injury and loss of life, pollution and suspension of operations, such as the uncontrollable flow of oil or natural gas or well fluids. |
These risks could result in substantial losses due to personal injury and/or loss of life, severe damage to and destruction of property and equipment and pollution or other environmental damage and attorney’s fees and other expenses incurred in the prosecution or defense of litigation and may result in curtailment or suspension of our related operations. A natural disaster or other hazard affecting the areas in which we operate could have a material adverse effect on our operations and ability to pay distributions to our unitholders.
As is customary in the industry, we maintain insurance against some but not all of these risks. Additionally, we may elect not to obtain insurance if we believe that the cost of available insurance is excessive relative to the perceived risks presented. Losses could therefore occur for uninsurable or uninsured risks or in amounts in excess of existing insurance coverage. We are not fully insured against all risks inherent to our business. For example, we are not fully insured against all environmental accidents which may include toxic tort claims. If a significant accident or event occurs that is not fully insured, it could adversely affect our operations and financial condition. In addition, we may not be able to maintain or obtain insurance of the type and amount we desire at reasonable rates. As a result of market conditions, premiums and deductibles for certain of our insurance policies have increased substantially, and could escalate further. In some instances, certain insurance could become unavailable or available only for reduced amounts of coverage. Additionally, we may be unable to recover from prior owners of our assets, pursuant to our indemnification rights, for potential environmental liabilities. The occurrence of an event that is not fully covered by insurance could have a material adverse impact on our business activities, financial condition, results of operations and ability to pay distributions to our unitholders.
Increases in interest rates, which have recently experienced record lows, could adversely impact our unit price and our ability to issue additional equity, to incur debt to make acquisitions or for other purposes or to make cash distributions at our intended levels.
Credit markets recently have experienced record lows in interest rates. As the overall economy recovers from the current recessionary environment, it is likely that monetary policy will gradually tighten, resulting in higher interest rates to counter possible inflation. Interest rates on future credit facilities and debt offerings could be higher than current levels, causing our financing costs to increase accordingly. As with other yield-oriented securities, our unit price is impacted by the level of our cash distributions and implied distribution yield. The distribution yield is often used by investors to compare and rank related yield-oriented securities for investment decision-making purposes. Therefore, changes in interest rates, either positive or negative, may affect the yield requirements of investors who invest in our units, and a rising interest rate environment could have an adverse impact on our unit price and our ability to issue additional equity, to incur debt to make acquisitions or for other purposes or to make cash distributions at our intended levels.
Shortages of drilling rigs, equipment and crews could delay our operations and reduce our cash available for distribution.
Under normal market conditions, higher oil and natural gas prices generally increase the demand for drilling rigs, equipment and crews and can lead to shortages of, and increasing costs for, drilling equipment, services and personnel. Shortages of, or increasing costs for, experienced drilling crews and oil field equipment and services could restrict our and other operators’ ability to drill the wells and conduct the operations currently planned. Any delay in the drilling of new wells or significant increase in drilling costs could reduce our revenues and cash available for distribution.
Our and other operators’ drilling operations may be curtailed, delayed or cancelled as a result of a variety of factors.
Drilling for oil and gas involves numerous risks, including the risk that we will not encounter commercially productive oil or gas reservoirs. Our and other operators’ drilling operations may be curtailed, delayed or cancelled as a result of a variety of factors, including:
| | • | unexpected drilling conditions; |
| | • | drilling, production or transportation facility or equipment failure or accidents; |
| | • | shortages or delays in the availability of drilling rigs and other services and equipment; |
| | • | adverse weather conditions; |
| | • | compliance with environmental and governmental requirements; |
| | • | unusual or unexpected geological formations; |
| | • | fires, blowouts, craterings and explosions; and |
| | • | uncontrollable flows of oil or natural gas or well fluids. |
Any curtailment to the gathering systems used by operators could also require such operators to find alternative means to transport the oil and natural gas production from the underlying properties, which alternative means could require such operators to incur additional costs. We do not provide midstream services to all of our upstream activities.
Any such curtailment, delay or cancellation may limit our ability to make cash distributions to our unitholders.
Low commodity prices may result in additional write-downs of our asset carrying values.
In our Upstream Business, low oil and natural gas prices may result in substantial downward adjustments to our estimated proved reserves. Furthermore, if our estimates of development costs increase, production data factors change or drilling results deteriorate, accounting rules may require us to write down, as a non-cash charge to earnings, the carrying value of our oil and natural gas properties. Low oil and natural gas prices also may result in reduced drilling activity and declines in future cash flows within our Midstream Business.
We are required to perform impairment tests on our assets periodically and whenever events or changes in circumstances warrant a review of our assets. To the extent such tests indicate a reduction of the estimated future cash flows of our assets, the carrying value may not be recoverable and therefore may require a write-down. In 2009, we incurred total impairment charges of $22.1 million primarily as a result of lower drilling activity due to lower natural gas prices. In 2008, we incurred total impairment charges of $174.9 million primarily as a result of lower expected commodity prices. We may incur additional impairment charges in the future, which could have a material adverse effect on our results of operations and financial position in the period incurred.
Due to our limited industry and geographic diversification in our midstream operations and in our upstream operated properties, adverse developments in our operations or operating areas would reduce our ability to make distributions to our unitholders.
While our fee mineral and royalty upstream properties are well diversified geographically, all of our midstream assets are located in the Texas Panhandle, East, West and South Texas and Louisiana and all of our upstream operated properties are located in West, East and South Texas and Alabama. Due to our limited diversification in industry type and location, an adverse development in one of these businesses or operating areas would have a significantly greater impact on our financial condition and results of operations than if we maintained more diverse assets and operating areas.
Terrorist attacks, and the threat of terrorist attacks, have resulted in increased costs to our business. Continued hostilities in the Middle East or other sustained military campaigns may adversely impact our results of operations.
The long-term impact of terrorist attacks, such as the attacks that occurred on September 11, 2001, and the threat of future terrorist attacks on our industry in general, and on us in particular, is not known at this time. Increased security measures taken by us as a precaution against possible terrorist attacks have resulted in increased costs to our business. Uncertainty surrounding continued hostilities in the Middle East or other sustained military campaigns may affect our operations in unpredictable ways, including disruptions of crude oil supplies and markets for refined products, and the possibility that infrastructure facilities could be direct targets of, or indirect casualties of, an act of terror.
Changes in the insurance markets attributable to terrorist attacks may make certain types of insurance more difficult for us to obtain. Moreover, the insurance that may be available to us may be significantly more expensive than our existing insurance coverage. Instability in the financial markets as a result of terrorism or war could also affect our ability to raise capital.
Risks Inherent in an Investment in Us
We may not have sufficient cash from operations following the establishment of cash reserves and payment of fees and expenses, including cost reimbursements to our general partner, to enable us to make cash distributions at any particular level or at all.
We may not have sufficient available cash from operating surplus each quarter to enable us to make cash distributions at any particular level or at all. The amount of cash we can distribute on our units principally depends upon the amount of cash we generate from our operations, which will fluctuate from quarter to quarter based on, among other things:
| | • | the fees we charge and the margins we realize for our services; |
| | • | the prices and level of production of and demand for, oil, natural gas, NGLs and condensate that we and others produce; |
| | • | the volume of natural gas we gather, treat, compress, process, transport and sell, the volume of NGLs we transport and sell, and the volume of oil and natural gas we and others produce; |
| | • | our operators’ and other producers’ drilling activities and success of such programs; |
| | • | the level of competition from other upstream and midstream energy companies; |
| | • | the level of our operating and maintenance and general and administrative costs; |
| | • | the relationship between oil, natural gas and NGL prices; and |
| | • | prevailing economic conditions. |
In addition, the actual amount of cash we will have available for distribution will depend on other factors, some of which are beyond our control, including:
| | • | the level of capital expenditures we make; |
| | • | the cost of acquisitions; |
| | • | our debt service requirements and other liabilities; |
| | • | fluctuations in our working capital needs; |
| | • | our ability to borrow funds and access capital markets; |
| | • | our need to reduce outstanding indebtedness; |
| | • | restrictions contained in our debt agreements; and |
| | • | the amount of cash reserves established by our general partner. |
During the year ended December 31, 2009, we reduced our quarterly distributions on our common units to a rate below the minimum quarterly distribution as defined in our partnership agreement. As described in the partnership agreement, during the subordination period, our common units carry arrearage rights. Although the common unitholders have arrearage rights, the unitholders are not entitled to receive these arrearages, which may never be paid. We can give no assurances that the minimum quarterly distribution and any arrearages will ever be paid on the common units. However, we must first pay all arrearages in addition to current minimum quarterly distributions before distributions can be made to holders of our subordinated units and our incentive distribution rights, and we generally must first pay all arrearages before conversion of our subordinated units can occur. Additionally, if the Recapitalization and Related Transactions are completed, our subordinated units will be eliminated. As there will no longer be any units subordinate in right of payment of distributions to the common units, the subordination period will be terminated and, as a result, the concept of arrearages will be eliminated.
The amount of cash we have available for distribution to holders of our common units and subordinated units depends primarily on our cash flow and not solely on profitability.
The amount of cash we have available for distribution depends primarily upon our cash flow and not solely on profitability, which will be affected by non-cash items. As a result, we may make cash distributions during periods when we record losses for financial accounting purposes and may not make cash distributions during periods when we record net earnings for financial accounting purposes.
Assuming our ownership structure as of December 31, 2009, the amount of available cash we need to pay the minimum quarterly distribution for four quarters on our outstanding common units and restricted units under our Long Term Incentive Plan is approximately $81.2 million. In addition, $1.2 million is a full four-quarter distribution on our general partner units, and a full distribution on our subordinated units is $30.0 million, totaling $112.4 million with the full distribution on outstanding common units and restricted units.
We may not have sufficient available cash from operating surplus each quarter to enable us to make cash distributions at the initial distribution rate under our current cash distribution policy. Additionally, if the Recapitalization and Related Transactions are completed, we may not have sufficient available cash from operating surplus each quarter to enable us to make cash distributions at the distribution rates contemplated in our anticipated cash distribution policy described in Part II, Item 5. Market for Registrant’s Common Equity, Related Unitholder Matters and Issuer Purchases of Equity Securities – Cash Distribution Policy.
Eagle Rock Holdings, L.P., owns and controls our general partner, which has sole responsibility for conducting our business and managing our operations. Our general partner has conflicts of interest, which may permit it to favor its own interests.
Eagle Rock Holdings, L.P. owns and controls our general partner. Holdings is owned and controlled by the NGP Investors. Although our general partner has a fiduciary duty to manage us in a manner beneficial to us and our unitholders, the directors and officers of our general partner have a fiduciary duty to manage our general partner in a manner beneficial to its owners, the NGP Investors. Conflicts of interest may arise between the NGP Investors and their affiliates, including our general partner, on the one hand, and us and our unitholders, on the other hand. In resolving these conflicts of interest, our general partner may favor its own interests and the interests of its affiliates over the interests of our unitholders. These conflicts include, among others, the following situations:
| | • | neither our partnership agreement nor any other agreement requires the NGP Investors to pursue a business strategy that favors us; |
| | • | our general partner is allowed to take into account the interests of parties other than us in resolving conflicts of interest; |
| | • | the NGP Investors and its affiliates are not limited in their ability to compete with us; |
| | • | our general partner has limited its liability and reduced its fiduciary duties, and has also restricted the remedies available to our unitholders for actions that, without the limitations, might constitute breaches of fiduciary duty; |
| | • | our general partner determines the amount and timing of asset purchases and sales, borrowings, issuance of additional partnership securities and establishment of cash reserves, each of which can affect the amount of cash that is distributed to unitholders; |
| | • | our general partner determines the amount and timing of any capital expenditures and whether a capital expenditure is a maintenance capital expenditure, which reduces operating surplus, or an expansion capital expenditure, which does not reduce operating surplus. This determination can affect the amount of cash that is distributed to our unitholders and the ability of the subordinated units to convert to common units; |
| | • | our general partner determines which costs incurred by it and its affiliates are reimbursable by us; |
| | • | our partnership agreement does not restrict our general partner from causing us to pay it or its affiliates for any services rendered to us or entering into additional contractual arrangements with any of these entities on our behalf; |
| | • | our general partner intends to limit its liability regarding our contractual and other obligations and, in some circumstances, is entitled to be indemnified by us; |
| | • | our general partner may exercise its limited right to call and purchase common units if it and its affiliates own more than 80% of the common units; |
| | • | our general partner controls the enforcement of obligations owed to us by our general partner and its affiliates; and |
| | • | our general partner decides whether to retain separate counsel, accountants or others to perform services for us. |
Affiliates of our general partner are not limited in their ability to compete with us, which could cause conflicts of interest and limit our ability to acquire additional assets, drilling opportunities or businesses which in turn could adversely affect our results of operations and cash available for distribution to our unitholders.
Affiliates of our general partner are not prohibited from owning assets or engaging in businesses that compete directly or indirectly with us. In addition, affiliates of our general partner may acquire, construct or dispose of additional midstream, upstream or other assets in the future, without any obligation to offer us the opportunity to purchase or construct any of those assets.
Our ability to manage and grow our business effectively may be adversely affected if our General Partner loses key management or operational personnel.
We depend on the continuing efforts of our executive officers. The departure of any of our executive officers could have a significant negative effect on our business, operating results, financial condition, and on our ability to compete effectively in the marketplace. Additionally, the General Partner’s employees operate our business. Our General Partner's ability to hire, train, and retain qualified personnel will continue to be important and will become more challenging as we grow and if energy industry market conditions are positive. When general industry conditions are good, the competition for experienced operational and field technicians increases as other energy and manufacturing companies’ needs for the same personnel increases. Our ability to grow and perhaps even to continue our current level of service to our current customers will be adversely impacted if our General Partner is unable to successfully hire, train and retain these important personnel.
Cost reimbursements to our general partner and its affiliates for services provided, which will be determined by our general partner, will be substantial and will reduce our cash available for distribution.
Prior to making distribution on our common units, we will reimburse our general partner and its affiliates for all expenses they incur on our behalf. These expenses will include all costs incurred by our general partner and its affiliates in managing and operating us, including costs for rendering corporate staff and support services to us, and there is no limit on the amount of expenses for which our general partner and its affiliates may be reimbursed. Our partnership agreement provides that our general partner will determine the expenses that are allocable to us in good faith. If we are unable or unwilling to reimburse or indemnify our general partner, our general partner may take actions to cause us to make payments of these obligations and liabilities. Any such payments could reduce the amount of cash otherwise available for distribution to our unitholders.
Our general partner intends to limit its liability regarding our obligations.
Our general partner intends to limit its liability under contractual arrangements so that other parties have recourse only to our assets, and not against our general partner or its assets. Our general partner therefore may cause us to incur indebtedness or other obligations that are nonrecourse to it. The partnership agreement provides that any action taken by our general partner to limit its liability is not a breach of our general partner’s fiduciary duties, even if we could have obtained more favorable terms without the limitation on liability.
Our partnership agreement requires that we distribute all of our available cash, which could limit our ability to grow and make acquisitions.
We expect that we will distribute all of our available cash to our unitholders. As a result, we expect that we will rely primarily upon external financing sources, including commercial bank borrowings and the issuance of debt and equity securities, to fund our acquisitions and expansion capital expenditures. As a result, to the extent we are unable to finance growth externally, our cash distribution policy will significantly impair our ability to grow.
In addition, because we distribute all of our available cash, our growth may not be as fast as businesses that reinvest their available cash to expand ongoing operations. To the extent we issue additional units in connection with any acquisitions or expansion capital expenditures, the payment of distributions on those additional units may increase the risk that we will be unable to maintain or increase our per unit distribution level. There are no limitations in our partnership agreement or our credit facility on our ability to issue additional units, including units ranking senior to the common units. The incurrence of additional commercial borrowings or other debt to finance our growth strategy would result in increased interest expense, which in turn may impact the available cash that we have to distribute to our unitholders.
Our partnership agreement limits our general partner’s fiduciary duties to holders of our common units and subordinated units.
Although our general partner has a fiduciary duty to manage us in a manner beneficial to us and our unitholders, the directors and officers of our general partner have a fiduciary duty to manage our general partner in a manner beneficial to its owners. Our partnership agreement contains provisions that reduce the standards to which our general partner would otherwise be held by state fiduciary duty laws. For example, our partnership agreement permits our general partner to make a number of decisions in its individual capacity, as opposed to in its capacity as our general partner or otherwise free of fiduciary duties to us and our unitholders, including determining how to allocate corporate opportunities among us and our affiliates. This entitles our general partner to consider only the interests and factors that it desires, and it has no duty or obligation to give any consideration to any interest of, or factors affecting, us, our affiliates or any limited partner. Examples include:
| | • | its voting rights with respect to the units it owns; |
| | • | its registration rights; and |
| | • | its determination whether or not to consent to any merger or consolidation of the partnership or amendment to the partnership agreement. |
Our partnership agreement restricts the remedies available to holders of our common units and subordinated units for actions taken by our general partner that might otherwise constitute breaches of fiduciary duty.
Our partnership agreement contains provisions that modify and limit our general partner’s fiduciary duties to our unitholders. Our partnership agreement also contains provisions that restrict the remedies available to unitholders for actions taken by our general partner that might otherwise constitute breaches of fiduciary duty. For example, our partnership agreement:
| | • | provides that whenever our general partner makes a determination or takes, or declines to take, any other action in its capacity as our general partner, our general partner is required to make such determination, or take or decline to take such other action in good faith, and our general partner will not be subject to any other or different standard imposed by our partnership agreement, Delaware law or any other law, rule or regulation or at equity; |
| | • | provides that our general partner will not have any liability to us or our unitholders for decisions made in its capacity as a general partner so long as it acted in good faith, and our partnership agreement specifies that the satisfaction of this standard requires that our general partner must believe that the decision is in the best interests of our partnership; |
| | • | provides that our general partner and its officers and directors will not be liable for monetary damages to us, our limited partners or assignees for any acts or omissions unless there has been a final and non-appealable judgment entered by a court of competent jurisdiction determining that the general partner or those other persons acted in bad faith or engaged in fraud or willful misconduct or, in the case of a criminal matter, acted with knowledge that the conduct was criminal; and |
| | • | provides that our general partner will not be in breach of its obligations under the partnership agreement or its fiduciary duties to us or our unitholders if the resolution of a conflict is: |
| | • | approved by the conflicts committee of our general partner, although our general partner is not obligated to seek such approval; |
| | • | approved by the vote of a majority of the outstanding common units, excluding any common units owned by our general partner or any of its affiliates; |
| | • | on terms no less favorable to us than those generally being provided to or available from unrelated third parties; or |
| | • | fair and reasonable to us, taking into account the totality of the relationships among the parties involved, including other transactions that may be particularly favorable or advantageous to us. |
In connection with a situation involving a conflict of interest, any determination by our general partner involving the resolution of the conflict of interest must be made in good faith, provided that, if our general partner does not seek approval from the conflicts committee and its board of directors determines that the resolution or course of action taken with respect to the conflict of interest satisfies either of the standards set forth in the third and fourth bullet points above, then it will be presumed that, in making its decision, the board of directors acted in good faith, and in any proceeding brought by or on behalf of any limited partner or the partnership, the person bringing or prosecuting such proceeding will have the burden of overcoming such presumption.
Holders of our common units have limited voting rights and are not entitled to elect our general partner or its directors.
Unlike the holders of common stock in a corporation, unitholders have only limited voting rights on matters affecting our business and, therefore, limited ability to influence management’s decisions regarding our business. Unitholders will not elect our general partner or its board of directors, and will have no right to elect our general partner or its board of directors on an annual or other continuing basis. The board of directors of Eagle Rock Energy G&P, LLC, the general partner of our general partner, is chosen by the members of Eagle Rock Energy G&P, LLC. Furthermore, if the unitholders were dissatisfied with the performance of our general partner, they will have little ability to remove our general partner. As a result of these limitations, the price at which the common units will trade could be diminished because of the absence or reduction of a takeover premium in the trading price.
Our partnership agreement restricts the voting rights of unitholders owning 20% or more of our common units.
Unitholders’ voting rights are further restricted by the partnership agreement provision providing that any units held by a person that owns 20% or more of any class of units then outstanding, other than our general partner, its affiliates, their transferees and persons who acquired such units with the prior approval of the board of directors of our general partner, cannot vote on any matter. Our partnership agreement also contains provisions limiting the ability of unitholders to call meetings or to acquire information about our operations, as well as other provisions limiting the unitholders’ ability to influence the manner or direction of management.
Control of our general partner may be transferred to a third party without unitholder consent.
Our general partner may generally transfer its general partner interest to a third party in a merger or in a sale of all or substantially all of its assets without the consent of the unitholders. Furthermore, our partnership agreement does not restrict the ability of the owners of our general partner or Eagle Rock Energy G&P, LLC, from transferring all or a portion of their respective ownership interest in our general partner or Eagle Rock Energy G&P, LLC to a third party. The new owners of our general partner or Eagle Rock Energy G&P, LLC would then be in a position to replace the board of directors and officers of Eagle Rock Energy G&P, LLC with its own choices and thereby influence the decisions taken by the board of directors and officers.
We may issue additional units without limited partner approval, which would dilute ownership interests.
Our partnership agreement does not limit the number of additional limited partner interests that we may issue at any time without the approval of our unitholders. In addition, we may issue a significant number of additional limited partner interests in connection with the Recapitalization and Related Transactions. The issuance by us of additional common units or other equity securities of equal or senior rank will have the following effects:
| | • | our unitholders’ proportionate ownership interest in us will decrease; |
| | • | the amount of cash available for distribution on each unit may decrease; |
| | • | because a lower percentage of total outstanding units will be subordinated units, the risk that a shortfall in the payment of the minimum quarterly distribution will be borne by our common unitholders will increase; |
| | • | the ratio of taxable income to distributions may increase; |
| | • | the relative voting strength of each previously outstanding unit may be diminished; and |
| | • | the market price of the common units may decline. |
Affiliates of our general partner, certain private investors and employees, may sell common units in the public markets, which sales could have an adverse impact on the trading price of the common units.
Management of Eagle Rock Energy G&P, LLC, the general partner of our general partner and the NGP Investors and their affiliates (both through their interests in Eagle Rock Holdings and Montierra) and certain employees of Eagle Rock Energy G&P, LLC hold, as of December 31, 2009, an aggregate of 14,830,731 common units, including 1,371,019 common units which are still subject to a vesting requirement and 20,691,495 subordinated units. All of the subordinated units will convert into common units at the end of the subordination period but may convert earlier. The NGP Investors and their affiliates may receive a significant amount of additional common units in connection with the Recapitalization and Related Transactions. Certain of the NGP Investors, as “control persons,” are not able to resell their securities without a valid registration statement. Some of the common units held by certain of the NGP Investors are currently covered by an effective resale registration statement. The resale of any of these common units in the public markets could have an adverse impact on the price of the common units or on any trading market that may develop. We also have entered into a registration rights agreement with Holdings and Montierra, which requires us to file with the SEC a registration statement registering for resale to the public Holdings’ and Montierra’s units.
Our general partner has a limited call right that may require limited partners to sell their units at an undesirable time or price.
If at any time our general partner and its affiliates own more than 80% of the common units, our general partner will have the right, but not the obligation, which it may assign to any of its affiliates or to us, to acquire all, but not less than all, of the common units held by unaffiliated persons at a price not less than their then-current market price. As a result, the limited partners may be required to sell their common units at an undesirable time or price and may not receive any return on their investment. Limited partners may also incur a tax liability upon a sale of units. As of December 31, 2009, our general partner and its affiliates owned approximately 26.5% of our outstanding common units. At the end of the subordination period, assuming no additional issuances of common units, our general partner and its affiliates will own approximately 46.3% of our outstanding common units. In addition, if the transactions contemplated in the Global Transaction Agreement are completed, our general partner and its affiliates will increase the percentage of our common units that they own in us, potentially by a significant amount.
Liability of a limited partner may not be limited if a court finds that unitholder action constitutes control of our business.
A general partner of a partnership generally has unlimited liability for the obligations of the partnership, except for those contractual obligations of the partnership that are expressly made without recourse to the general partner. Our partnership is organized under Delaware law and we conduct business in a number of other states. The limitations on the liability of holders of limited partner interests for the obligations of a limited partnership have not been clearly established in some of the other states in which we do business. Limited partners could be liable for any and all of our obligations as a general partner if:
| | • | a court or government agency determined that we were conducting business in a state but had not complied with that particular state’s partnership statute; or |
| | • | the right to act with other unitholders to remove or replace the general partner, to approve some amendments to our partnership agreement or to take other actions under our partnership agreement constitute “control” of our business. |
Unitholders may have liability to repay distributions that were wrongfully distributed to them.
Under certain circumstances, unitholders may have to repay amounts wrongfully returned or distributed to them. Under Section 17-607 of the Delaware Revised Uniform Limited Partnership Act, we may not make a distribution if the distribution would cause our liabilities to exceed the fair value of our assets. Delaware law provides that for a period of three years from the date of the impermissible distribution, limited partners who received the distribution and who knew at the time of the distribution that it violated Delaware law will be liable to the limited partnership for the distribution amount. Substituted limited partners are liable for the obligations of the assignor to make contributions to the partnership that are known to the substituted limited partner at the time it became a limited partner and for unknown obligations if the liabilities could be determined from the partnership agreement. Liabilities to partners on account of their partnership interest and liabilities that are non-recourse to the partnership are not counted for purposes of determining whether a distribution is permitted.
If we fail to maintain an effective system of internal controls, we may not be able to accurately report our financial results or prevent fraud. As a result, current and potential unitholders could lose confidence in our financial reporting, which would harm our business and the trading price of our units.
Effective internal controls are necessary for us to provide reliable financial reports, prevent fraud and operate successfully as a public company. If we cannot provide reliable financial reports or prevent fraud, our reputation and operating results would be harmed. We cannot be certain that our efforts to maintain our internal controls will be successful, that we will be able to maintain adequate controls over our financial processes and reporting in the future or that we will be able to continue to comply with our obligations under Section 404 of the Sarbanes-Oxley Act of 2002. Any failure to maintain effective internal controls, or difficulties encountered in implementing or improving our internal controls, could harm our operating results or cause us to fail to meet our reporting obligations. Ineffective internal controls could also cause investors to lose confidence in our reported financial information, which would likely have a negative effect on the trading price of our units.
We have the right to borrow to make distributions. Repayment of these borrowings will decrease cash available for future distributions, and covenants in our credit facility may restrict our ability to make distributions.
Our partnership agreement allows us to borrow to make distributions. We may borrow under our credit facility to make distributions. The primary purpose of these borrowings would be to mitigate the effects of short term fluctuation in our cash flow that would otherwise cause volatility in our quarter to quarter distributions.
The terms of our credit facility may restrict our ability to pay distributions if we do not satisfy the financial and other covenants in the facility.
With respect to the Pure Minerals (a significant asset in our Minerals business), we may be required to invest all or part of the revenues in Ivory Working Interest, L.P.
We are a limited partner in Ivory Working Interests, L.P. (IWI) which owns non-operating working interests in some of the wells in which we own a mineral interest. IWI was formed at the same time as we acquired our direct mineral interest in the Pure Minerals and its general partner is Black Stone, the same entity that holds the executive rights on the Pure Minerals.
The working interests in IWI derive from certain leases on the Pure Minerals that Black Stone executed which, under certain conditions, gave the us and the other owners of the Pure Minerals (through IWI) the right to participate collectively as a working interest owner in future wells (in addition to their participation as royalty owners). Under the various agreements that exist between us, IWI and Black Stone, IWI has the right to use the cash generated by the direct title minerals as a source of funding for its drilling and production costs, in the event and only to the extent that IWI’s internal cash flow is insufficient to cover these costs.
Each year, Black Stone prepares a budget for IWI which is subject to the approval of the IWI limited partners. We do not own sufficient interest in IWI to unilaterally control whether the budget is approved, and once it is approved we are obligated to pay our share of the budgeted capital projects. Black Stone has the right to retain cash generated in IWI and from the direct title minerals to the extent necessary to fund these projects. As a result, we may recognize revenue in our Minerals Business from production on the Pure Minerals, but not receive any cash since it is required to fund our share of investments in IWI.
Risks Related to Governmental Regulation
Potential legislation related to “over-the-counter” derivatives could adversely impact our ability to execute our hedging strategy.
In response to the role that “over-the-counter” derivatives are perceived to have played in the global financial crisis that began in 2008, various committees of the United States Congress are currently drafting legislation to increase the regulation of the markets for these instruments. These efforts may result, among other things, in legislation that would require us to clear our commodity derivatives through clearinghouses, and to post cash collateral when market prices rise above the strike prices of our derivatives. If this or similar legislation is promulgated, the cost of executing our hedging strategy could increase significantly, potentially to a level that would lead us to hedge a much lower level of our forecasted production than we otherwise would desire. Increases in hedging costs and the need to post cash collateral would have an adverse effect on our business as a result of reduced cash flow and reduced liquidity. Additionally, in the event that we hedge lower quantities in response to higher hedging costs and increased margin requirements, our exposure to changes in commodity prices would increase and this could result in lower cash flows to the Partnership. Ultimately, increased regulation of “over-the-counter” derivatives has the potential to reduce our cash flows and our ability to make distributions, reduce debt, and fund maintenance and growth activities.
A change in the jurisdictional characterization of some of our assets by federal, state or local regulatory agencies or a change in policy by those agencies may result in increased regulation of our assets, which may cause our revenues to decline and operating expenses to increase.
Our natural gas gathering and intrastate transportation operations are generally exempt from Federal Energy Regulatory Commission (FERC) regulation under the Natural Gas Act of 1938 (NGA); however, FERC has regulatory influence over certain aspects of our business because it has jurisdiction over natural gas markets and intrastate pipelines engaged in interstate transportation services (such as Eagle Rock DeSoto Pipeline, L.P.). FERC’s policies and practices across the range of its oil and natural gas regulatory activities, such as its policies on open access transportation, ratemaking, price transparency, market manipulation, capacity release and market center promotion, indirectly affect intrastate markets. In recent years, FERC has pursued policies to increase competition in interstate oil and natural gas transmission. However, FERC may not continue this approach as it considers matters such as pipeline rates and rules and policies that may affect rights of access to oil and natural gas transportation capacity. In addition, the distinction between FERC-regulated transmission services and federally unregulated gathering services has been the subject of regular litigation, so the classification and regulation of some of our gathering facilities and intrastate transportation pipelines may change in the future.
Other state and local regulations also affect our business. Common purchaser statutes generally require gatherers to purchase without undue discrimination as to source of supply or producer. These statutes restrict our right as an owner of gathering facilities to decide with whom we contract to purchase or gather oil or natural gas. Federal law leaves any economic regulation of natural gas gathering to the states. The states in which we operate have adopted complaint-based regulation of oil and natural gas gathering activities, which allows oil and natural gas producers and shippers to file complaints with state regulators in an effort to resolve grievances relating to oil and natural gas gathering access and rate discrimination. Other state regulations may not directly regulate our business, but may nonetheless affect the availability of natural gas for purchase, processing and sale; for example, state regulation of production rates and maximum daily production allowable from gas wells. Although our proprietary gathering lines are currently subject to limited state regulation, there is a risk that state laws will be changed, and this may give producers a stronger basis to challenge the proprietary status of a line, or the rates, terms and conditions of a gathering line providing gathering service. Please see Part I, Item 1. Business—Regulation of Operations.
We are subject to compliance with stringent environmental laws and regulations that may expose us to significant costs and liabilities.
Our operations are subject to stringent and complex federal, state and local environmental laws and regulations. These laws and regulations may impose numerous obligations on our operations including the acquisition of permits to conduct regulated activities, the incurrence of capital expenditures to limit or prevent releases of materials from our pipelines and facilities, and the imposition of substantial liabilities for pollution resulting from our operations. Failure or delay in obtaining regulatory approvals or drilling permits by us or our operators could have a material adverse effect on our ability to develop our properties, and receipt of drilling permits with onerous conditions could increase our compliance costs. In addition, regulations regarding conservation practices and the spacing, and density of wellbores may limit the quantity of oil and natural gas that may be produced and sold.
Numerous governmental authorities, such as the U.S. Environmental Protection Agency (EPA) and analogous state agencies, have the power to enforce compliance with these laws and regulations, oftentimes requiring difficult and costly actions. Failure to comply may result in the assessment of administrative, civil and criminal penalties, the imposition of remedial obligations, assessment of monetary penalties and the issuance of injunctions limiting or preventing some or all of our operations.
These costs and liabilities could arise under a wide range of federal, state and local environmental laws and regulations, including, for example:
| | • | the federal Clean Air Act and comparable state laws and regulations that impose obligations related to air emissions; |
| | • | the federal Clean Water Act and comparable state laws and regulations that impose obligations related to discharges of pollutants into regulated bodies of water; |
| | • | the federal Resource Conservation and Recovery Act, or RCRA, and comparable state laws that impose requirements for the handling and disposal of waste from our facilities; and |
| | • | the Comprehensive Environmental Response, Compensation and Liability Act of 1980 (CERCLA), also known as “Superfund,” and comparable state laws that regulate the cleanup of hazardous substances that may have been released at properties currently or previously owned or operated by us or at locations to which we have sent waste for disposal. |
Certain environmental statutes, including the RCRA, CERCLA, the federal Oil Pollution Act and analogous state laws and regulations, impose strict, joint and several liability for costs required to clean up and restore sites where hazardous substances have been disposed of or otherwise released. Moreover, it is not uncommon for neighboring landowners and other third parties to file claims for personal injury and property damage allegedly caused by the release of hazardous substances or other waste products into the environment.
There is risk of incurring significant environmental costs and liabilities in connection with our operations due to our handling of petroleum hydrocarbons and wastes; operation of our wells, gathering systems and other facilities; air emissions and water discharges related to our operations and historical industry operations and waste disposal practices. Joint and several, strict liability may be incurred under these environmental laws and regulations in connection with discharges or releases of petroleum hydrocarbons and wastes on, under or from our properties and facilities. Most of our midstream assets have been used for midstream activities for a number of years, oftentimes by third parties. Private parties, including the owners of properties through which our gathering systems pass and facilities where our petroleum hydrocarbons or wastes are taken for reclamation or disposal, may also have the right to pursue legal actions to enforce compliance as well as to seek damages for non-compliance with environmental laws and regulations or for personal injury or property damage. In addition, changes in environmental laws and regulations occur frequently, and any such changes that result in more stringent and costly waste handling, storage, transport, disposal, or remediation requirements could have a material adverse effect on our operations or financial position. We may not be able to recover some or any of these costs from insurance. See Part I, Item 1. Business—Regulation of Our Operations.
Climate change legislation, regulatory initiatives and litigation may adversely affect our operations, our cost structure, or the demand for oil and natural gas.
Federal regulations limiting greenhouse gas ("GHG") emissions or imposing reporting obligations with respect to such emissions have been proposed or finalized. On October 30, 2009, EPA published a final rule requiring the reporting of GHG emissions from specified large sources in the United States beginning in 2011 for emissions occurring in 2010. We have ten facilities that are being evaluated as potential large sources. In addition, on December 15, 2009, EPA published a Final Rule finding that current and projected concentrations of six key GHGs in the atmosphere threaten public health and welfare of current and future generations. EPA also found that the combined emissions of these GHGs from new motor vehicles and new motor vehicle engines contribute to the GHG pollution that threatens public health and welfare. This Final Rule, also known as EPA's Endangerment Finding, does not impose any requirements on industry or other entities directly; however, after the rule's January 14, 2010 effective date, EPA will be able to finalize motor vehicle GHG standards, the effect of which could reduce demand for motor fuels refined from crude oil. Finally, according to EPA, the final motor vehicle GHG standards will trigger construction and operating permit requirements for stationary sources. As a result, EPA has proposed to tailor these programs such that only stationary sources, including refineries that emit over 25,000 tons of GHGs per year will be subject to air permitting requirements. Any limitation on emissions of GHGs from our equipment or operations could require us to incur costs to reduce such emissions. In addition, on September 22, 2009, EPA issued a “Mandatory Reporting of Greenhouse Gases” final rule (“Reporting Rule”). The Reporting Rule establishes a new comprehensive scheme requiring operators of stationary sources emitting more than established annual thresholds of carbon dioxide-equivalent GHGs to inventory and report their GHG emissions annually on a facility-by-facility basis. Further, proposed legislation has been introduced in Congress that would establish an economy-wide cap on emissions of GHGs in the United States and would require most sources of GHG emissions to obtain GHG emission “allowances” corresponding to their annual emissions of GHGs.
Although it is not possible at this time to predict how any of these matters will ultimately be resolved, future federal laws or regulations to address GHG emissions, and litigation against us or our customers for GHG emissions could result in increased compliance costs or additional operating restrictions. Future laws or regulations could also result in higher prices for our products which could have an adverse effect on their demand and for the services we provide.
We may incur significant costs and liabilities as a result of pipeline integrity management program testing and any related pipeline repair, or preventative or remedial measures.
The DOT has adopted regulations requiring pipeline operators to develop integrity management programs for transportation pipelines and certain gathering lines located where a leak or rupture could do the most harm in "high consequence areas." The regulations require operators to:
| | • | perform ongoing assessments of pipeline integrity; |
| | • | identify and characterize applicable threats to pipeline segments |
| | that could impact a high consequence area; |
| | • | improve data collection, integration and analysis; |
| | • | repair and remediate the pipeline as necessary; and |
| | • | implement preventive and mitigating actions. |
We currently estimate that we will incur costs of $885,000 between 2009 and 2010 to implement pipeline integrity management program testing along certain segments of our pipeline, as required by existing DOT regulations. This estimate does not include the costs, if any, for repair, remediation, preventative or mitigating actions that may be determined to be necessary as a result of the testing program, which could be substantial.
Tax Risks to Common Unitholders
The sale or exchange of 50% or more of our capital and profits interests during any twelve-month period would result in the technical termination of our partnership for federal income tax purposes.
We will be considered to have terminated our partnership for federal income tax purposes if there is a sale or exchange of 50% or more of the total interests in our capital and profits within a twelve-month period. During the year ended December 31, 2009, we experienced a high volume of trading in our common units. We cannot at this time determine whether there has been a sale or exchange of 50% or more of the total interests in our capital and profits as such determination requires analyzing historic brokerage trading data as it becomes available to us. A technical termination would not affect our consolidated financial statements nor does it affect our classification as a partnership or otherwise affect the nature or extent of our “qualifying income” for U.S. federal income tax purposes. A technical termination would, among other things, result in the closing of our taxable year for all unitholders (which, most likely, results in unitholders who were unitholders before and after such technical termination receiving an additional K-1 on account of the termination) and would result in a deferral of depreciation deductions allowable in computing our taxable income. A deferral of depreciation deductions would result in increased taxable income or reduced taxable loss to certain unitholders, although the exact increase or reduction for each unitholder cannot be estimated at this time.
The tax efficiency of our partnership structure depends on our status as a partnership for federal income tax purposes, as well as our not being subject to a material amount of entity-level taxation by individual states. If the Internal Revenue Service were to treat us as a corporation or if we become subject to a material amount of entity-level taxation for state tax purposes, it would reduce the amount of cash available for distribution.
The anticipated after-tax economic benefit of an investment in the common units depends largely on our being treated as a partnership for federal income tax purposes. We have not requested, and do not plan to request, a ruling from the Internal Revenue Service, which we refer to as the IRS, on this or any other tax matter affecting us.
If we were treated as a corporation for federal income tax purposes, we would pay federal income tax on our taxable income at the corporate tax rate, which is currently a maximum of 35% and would likely pay state income tax at varying rates. Distributions would generally be taxed again as corporate distributions, and no income, gains, losses or deductions would flow through to the limited partners. Because a tax would be imposed upon us as a corporation, our cash available for distribution would be substantially reduced. Therefore, treatment of us as a corporation would result in a material reduction in the anticipated cash flow and after-tax return to the unitholders, likely causing a substantial reduction in the value of our common units.
Current law may change so as to cause us to be treated as a corporation for federal income tax purposes or otherwise subject us to entity-level taxation. Any such changes could negatively impact the value of an investment in our common units. In addition, because of widespread state budget deficits and other reasons, several states are evaluating ways to subject partnerships to entity-level taxation through the imposition of state income, franchise and other forms of taxation. We are, for example, subject to a new entity level tax on the portion of our income that is generated in Texas during our tax year ending December 31, 2009. Imposition of such a tax on us by any state, will reduce the cash available for distribution. The partnership agreement provides that if a law is enacted or existing law is modified or interpreted in a manner that subjects us to taxation as a corporation or otherwise subjects us to entity-level taxation for federal, state or local income tax purposes, the minimum quarterly distribution amount and the target distribution amounts will be adjusted to reflect the impact of that law on us.
If the IRS contests the federal income tax positions we take, the market for our common units may be adversely impacted and the cost of any IRS contest will reduce our cash available for distribution.
We have not requested a ruling from the IRS with respect to our treatment as a partnership for federal income tax purposes or any other matter affecting us. The IRS may adopt positions that differ from the conclusions of our counsel expressed in this report or from the positions we take. It may be necessary to resort to administrative or court proceedings to sustain some or all of our counsel’s conclusions or the positions we take. A court may not agree with some or all of our counsel’s conclusions or positions we take. Any contest with the IRS may materially and adversely impact the market for our common units and the price at which they trade. In addition, our costs of any contest with the IRS will be borne indirectly by our unitholders and our general partner because the costs will reduce our cash available for distribution.
We may adopt certain valuation methodologies that could result in a shift of income, gain, loss and deduction between the general partner and the unitholders. The IRS may successfully challenge this treatment, which could adversely affect the value of the Common Units.
When we issue additional units or engage in certain other transactions, we will determine the fair market value of our assets and allocate any unrealized gain or loss attributable to our assets to the capital accounts of our unitholders and our general partner. Our methodology may be viewed as understating the value of our assets. In that case, there may be a shift of income, gain, loss and deduction between certain unitholders and the general partner, which may be unfavorable to such unitholders. Moreover, under our valuation methods, subsequent purchasers of Common Units may have a greater portion of their Internal Revenue Code Section 743(b) adjustment allocated to our tangible assets and a lesser portion allocated to our intangible assets. The IRS may challenge our valuation methods, or our allocation of the Section 743(b) adjustment attributable to our tangible and intangible assets, and allocations of income, gain, loss and deduction between the general partner and certain of our unitholders.
A successful IRS challenge to these methods or allocations could adversely affect the amount of taxable income or loss being allocated to our unitholders. It also could affect the amount of gain from our unitholders' sale of Common Units and could have a negative impact on the value of the Common Units or result in audit adjustments to our unitholders' tax returns without the benefit of additional deductions.
We prorate our items of income, gain, loss and deduction between transferors and transferees of our units each month based upon the ownership of our units on the first day of each month, instead of on the basis of the date a particular unit is transferred. The IRS may challenge this treatment, which could change the allocation of items of income, gain, loss and deduction among our unitholders.
We prorate our items of income, gain, loss and deduction between transferors and transferees of our units each month based upon the ownership of our units on the first day of each month, instead of on the basis of the date a particular unit is transferred. The use of this proration method may not be permitted under existing Treasury Regulations, and, accordingly, our counsel is unable to opine as to the validity of this method. If the IRS were to challenge this method or new Treasury Regulations were issued, we may be required to change the allocation of items of income, gain, loss and deduction among our unitholders.
A unitholder whose units are loaned to a “short seller” to cover a short sale of units may be considered as having disposed of those units. If so, he would no longer be treated for tax purposes as a partner with respect to those units during the period of the loan and may recognize gain or loss from the disposition.
Because a unitholder whose units are loaned to a “short seller” to cover a short sale of units may be considered as having disposed of the loaned units, he may no longer be treated for tax purposes as a partner with respect to those units during the period of the loan to the short seller and the unitholder may recognize gain or loss from such disposition. Moreover, during the period of the loan to the short seller, any of our income, gain, loss or deduction with respect to those units may not be reportable by the unitholder and any cash distributions received by the unitholder as to those units could be fully taxable as ordinary income. Unitholders desiring to assure their status as partners and avoid the risk of gain recognition from a loan to a short seller are urged to modify any applicable brokerage account agreements to prohibit their brokers from borrowing their units.
Limited partners may be required to pay taxes on their share of our income even if they do not receive any cash distributions from us.
Because our unitholders will be treated as partners to whom we will allocate taxable income which could be different in amount than the cash we distribute, limited partners will be required to pay any federal income taxes and, in some cases, state and local income taxes on their share of our taxable income even if no cash distributions were received from us. Although not anticipated, our taxable income for a taxable year may include income without a corresponding receipt of cash by us, such as accrual of future income, original issue discount or cancellation of indebtedness income. Limited partners may not receive cash distributions from us equal to their share of our taxable income or even equal to the actual tax liability that results from that income.
Tax gain or loss on disposition of our common units could be more or less than expected.
If a limited partner sells common units, the limited partner will recognize a gain or loss equal to the difference between the amount realized and the tax basis in those common units. Prior distributions to a limited partner in excess of the total net taxable income allocated for a common unit, which decreased the limited partner’s tax basis in that common unit, will, in effect, become taxable income to the limited partner if the common unit is sold at a price greater than their tax basis in that common unit, even if the price received is less than the original cost. A substantial portion of the amount realized, whether or not representing gain, may be ordinary income. In addition, if a limited partner sells units, the limited partner may incur a tax liability in excess of the amount of cash received from the sale.
Tax-exempt entities and foreign persons face unique tax issues from owning common units that may result in adverse tax consequences to them.
Investment in common units by tax-exempt entities, such as individual retirement accounts (known as IRAs), other retirement plans and non-U.S. persons raises issues unique to them. For example, virtually all of our income allocated to organizations that are exempt from federal income tax, including IRAs and other retirement plans, will be unrelated business taxable income and will be taxable to them. Distributions to non-U.S. persons will be reduced by withholding taxes at the highest applicable effective tax rate, and non-U.S. persons will be required to file United States federal tax returns and pay tax on their share of our taxable income. If a limited partner is a tax-exempt entity or a foreign person, the limited partner should consult a tax advisor before investing in our common units.
We will treat each purchaser of our common units as having the same tax benefits without regard to the actual common units purchased. The IRS may challenge this treatment, which could adversely affect the value of the common units.
Because we cannot match transferors and transferees of common units and because of other reasons, we will adopt depreciation and amortization positions that may not conform to all aspects of existing Treasury Regulations. A successful IRS challenge to those positions could adversely affect the amount of tax benefits available to the limited partners. It also could affect the timing of these tax benefits or the amount of gain from sales of common units and could have a negative impact on the value of our common units or result in audit adjustments to tax returns of our limited partners.
Limited partners will likely be subject to state and local taxes and return filing requirements in states where they do not live as a result of investing in our common units.
In addition to federal income taxes, a limited partner will likely be subject to other taxes, including state and local taxes, unincorporated business taxes and estate, inheritance or intangible taxes that are imposed by the various jurisdictions in which we do business or own property, even if the limited partner does not live in any of those jurisdictions. A limited partner will likely be required to file state and local income tax returns and pay state and local income taxes in some or all of these various jurisdictions. Further, a limited partner may be subject to penalties for failure to comply with those requirements. We own assets and conduct business in several states. Many of these states currently impose a personal income tax. As we make acquisitions or expand our business, we may own assets or conduct business in additional states that impose a personal income tax. It is a limited partner’s responsibility to file all United States federal, state and local tax returns. Our counsel has not rendered an opinion on the foreign, state or local tax consequences of an investment in our common units.
| Item 1B. | Unresolved Staff Comments. |
Not Applicable.
For a complete description of our significant properties, see Item 1. Business, which descriptions are incorporated into this item by this reference. Substantially all of our pipelines are constructed on rights-of-way granted by the apparent record owners of the property. Lands over which pipeline rights-of-way have been obtained may be subject to prior liens that may have been subordinated to the right-of-way grants. We have obtained, where deemed necessary, license or permit agreements from public authorities and railroad companies to cross over or under, or to lay facilities in or along, waterways, county or parish roads, municipal streets, railroad properties and state highways, as applicable. In some cases, property on which our pipeline was built was purchased in fee.
We believe that we have satisfactory title to our assets. Title to property may be subject to encumbrances and liens on substantially all of our assets as collateral support of our credit facility. We believe that none of these encumbrances will materially detract from the value of our properties or from our interest in these properties or will they materially interfere with their use in the operation of our business.
While we own our facilities, plants and gathering systems, in many cases we do not always own the land upon which the facilities, plants and gathering systems reside. In cases where the land is leased (and not owned), we are ordinarily in long-term leases. From time to time, these long-term leases expire, and we are forced to negotiate new terms at market rates or exit the premises. For more information, see our table of assets within Part I, Item 1 Business – Our Three Lines of Business and Our Seven Reporting Segments – Midstream Business.
| Item 3. | Legal Proceedings. |
Our operations are subject to a variety of risks and disputes normally incidental to our business. As a result, we are and may, at any given time, be a defendant in various legal proceedings and litigation arising in the ordinary course of business. However, we are not currently a party to any material litigation. We maintain insurance policies with insurers in amounts and with coverage and deductibles that we, with the advice of our insurance advisors and brokers, believe are reasonable and prudent. We cannot, however, assure you that this insurance will be adequate to protect us from all material expenses related to potential future claims for personal and property damage or that these levels of insurance will be available in the future at economical prices.
We have voluntarily undertaken a self-audit of our compliance with air quality standards, including permitting in the Texas Panhandle Segment as well as a majority of our other Midstream Business locations and some of our Upstream Business locations in Texas. This audit has been performed pursuant to the Texas Environmental, Health and Safety Audit Privilege Act, as amended. We have completed the disclosures to the Texas Commission on Environmental Quality (“TCEQ”), and we are addressing in due course the deficiencies that we disclosed therein. We do not foresee at this time any impediment to the timely corrective efforts identified as a result of these audits.
Since January 1, 2009, we have received additional Notices of Enforcement (“NOEs”) and Notices of Violation (“NOVs”) from the TCEQ related to air compliance matters. We expect to receive additional NOEs or NOVs from the TCEQ from time to time throughout 2010. Though the TCEQ has the discretion to adjust penalties and settlements upwards based on a compliance history containing multiple, successive NOEs, we do not expect that the resolution of any existing NOE or any future similar NOE will vary significantly from the administrative penalties and agreed settlements experienced by us to date.
On February 9, 2010 a lawsuit, alleging certain claims related to the Recapitalization and Related Transactions (see Part I, Item 1, “Recapitalization and Related Transactions”), was filed on behalf of one of our public unitholders in the Court of Chancery of the State of Delaware naming the Partnership, our general partner, certain affiliates of our general partner, including the general partner of our general partner, and each member of our Board of Directors as defendants. The complaint alleges a breach by defendants of their fiduciary duties to the Partnership and seeks to enjoin the Recapitalization and Related Transactions. We believe the allegations claimed in the lawsuit are without merit.
PART II
| Item 5. | Market for Registrant’s Common Equity, Related Unitholder Matters and Issuer Purchases of Equity Securities. |
Our common units are listed on the NASDAQ Global Select Market under the symbol “EROC.” The following table sets forth, for the periods indicated, the high and low sales prices of our common units as reported by the NASDAQ Global Select Market, as well as the amount of cash distributions declared per quarter.
| | | | | | | | | | | |
| Quarter Ended | | High | | Low | | Distribution per Unit | | Record Date | | Payment Date |
| March 31, 2008 | | $ | 18.71 | | $ | 12.90 | | $ | 0.4000 | | May 9, 2008 | | May 15, 2008 |
June 30, 2008 | | $ | 17.96 | | $ | 14.26 | | $ | 0.4100 | | Aug. 8, 2008 | | Aug. 14, 2008 |
September 30, 2008 | | $ | 16.56 | | $ | 10.00 | | $ | 0.4100 | | Nov. 7, 2008 | | Nov. 14, 2008 |
| December 31, 2008 | | $ | 10.90 | | $ | 4.00 | | $ | 0.4100 | | Feb. 10, 2009 | | Feb. 13, 2009 |
| | | | | | | | | | | | | | |
| March 31, 2009 | | $ | 7.99 | | $ | 3.90 | | $ | 0.0250 | | May 11, 2009 | | May 15, 2009 |
| June 30, 2009 | | $ | 6.57 | | $ | 2.94 | | $ | 0.0250 | | Aug. 10, 2009 | | Aug. 14, 2009 |
| September 30, 2009 | | $ | 5.14 | | $ | 2.65 | | $ | 0.0250 | | Nov. 9, 2009 | | Nov. 13, 2009 |
| December 31, 2009 | | $ | 5.91 | | $ | 4.00 | | $ | 0.0250 | | Feb. 8, 2010 | | Feb. 12, 2010 |
We have also issued 20,691,495 subordinated units, for which there is no established market. There is one holder of record of our subordinated units as of the date of this Form 10-K.
The last reported sale price of our common units on the NASDAQ Global Select Market on February 19, 2010 was $5.70. As of that date, there were 175 holders of record and approximately 13,224 beneficial owners of our common units.
Cash Distribution Policy
We intend to distribute to our unitholders, on a quarterly basis, all of our available cash in the manner described below and as further described in our partnership agreement. Available cash generally means, for any quarter ending prior to liquidation, all cash on hand at the end of that quarter less the amount of cash reserves that are necessary or appropriate in the reasonable discretion of the general partner to:
| | • | provide for the proper conduct of our business; |
| | • | comply with applicable law or any partnership debt instrument or other agreement; or |
| | • | provide funds for distributions to unitholders and the general partner in respect of any one or more of the next four quarters. |
During 2009, we reduced our distributions and used the cash to pay down debt.
In addition to distributions on its 1.09% general partner interest, our general partner is entitled to receive incentive distributions if the amount we distribute with respect to any quarter exceeds levels specified in our partnership agreement. Under the quarterly incentive distribution provisions, our general partner is entitled, without duplication and in addition to its 1.09% general partner interest, to 13% of amounts we distribute in excess of $0.4169 per unit, 23% of the amounts we distribute in excess of $0.4531 per unit and 48% of amounts we distribute in excess of $0.5438 per unit.
Under the terms of the agreements governing our debt, we are prohibited from declaring or paying any distribution to unitholders if a default or event of default (as defined in such agreements) exists. See Item 7. Management’s Discussion and Analysis of Financial Condition and Results of Operations—Liquidity and Capital Resources—Capital Requirements—Revolving Credit Facility.
If the Recapitalization and Related Transactions are consummated, and subject to market conditions at that time, the Eagle Rock management team intends to recommend to our Board of Directors an increase to the distribution per unit. Currently, we anticipate recommending a quarterly distribution at an annualized rate in the range of $0.40 to $0.60 per unit commencing no later than the distribution with respect to the fourth quarter of 2010. We expect this distribution level will allow us to retain a meaningful percentage of our available cash to fund potential organic growth projects and to further reduce our total leverage ratio (defined in our revolving credit facility as the ratio of our debt to our Adjusted EBITDA) to our targeted range of less than 3.50. Our estimated range for the distribution is subject to change should commodity prices, factors affecting the general business climate or our specific operations differ from our current expectations. All actual distributions paid will be determined and declared at the discretion of our Board of Directors.
If the Recapitalization and Related Transactions are not consummated, and absent other unforeseen events, the Eagle Rock management team does not anticipate recommending to our Board of Directors an increase to the distribution per unit until we have reached our targeted range for total leverage ratio through growth of our Adjusted EBITDA or repayment of debt.
We plan to institute a new distribution policy after we have reached our targeted range for our total leverage ratio. This policy will include a “baseline distribution” that we believe would be sustainable in low commodity price environments. The initial baseline distribution would be established by our Board of Directors and would be adjusted to reflect the long-term impact of subsequent significant acquisitions and organic growth projects. Furthermore, under the policy, if we generate distributable cash flow in excess of that required to make the baseline distribution, we would distribute 50% of the excess distributable cash flow above the amount required to cover the actual distribution by at least 120% (i.e., a coverage ratio of at least 1.20). We anticipate, at this point, the initial baseline distribution will be below the Minimum Quarterly Distribution (“MQD”) of $0.3625 per unit specified in our current partnership agreement. Should the Recapitalization and Related Transactions not be consummated and the subordinated units remain outstanding, payment of an initial baseline distribution below the MQD will result in arrearages on common units continuing to build.
In making the determination to establish the baseline distribution and future distribution coverage ratios, our Board of Directors will take into account our projected capital requirements, its view of future commodity prices, economic conditions present and forecasted in the United States and other economies around the world, and other variables that it believes could impact the near and long term sustainability of the baseline distribution. In order to reduce the volatility in our distributions, our Board of Directors may decide to make the baseline distribution, even in quarters in which we do not generate sufficient Distributable Cash Flow to fund such distributions, by using borrowings from our revolving credit facility. Under our new distribution policy, we plan to continue with our strategy of utilizing derivatives to mitigate the impact of changes in commodity prices on our financial results.
Our Board of Directors will evaluate our distribution policy from time to time as conditions warrant in the future.
Sales of Unregistered Securities
We did not sell our equity securities in unregistered transactions during the period covered by this report.
Repurchases of Common Units
The following table sets forth certain information with respect to repurchases of common units during the three months ended December 31, 2009:
| | | | | | | | | | | | | |
| Period | | Total Number of Units Purchased | | | Average Price Paid Per Unit | | | Total Number of Units Purchased as Part of Publicly Announced Plans or Programs | | | Maximum Number (or Approximate Dollar Value) of Units that May Yet Be Purchased Under the Plan or Programs | |
| | | | |
October 1, 2009 to October 31, 2009 | | | — | | | | — | | | | — | | | | — | |
| November 1, 2009 to November 30, 2009 | | | 7,648 | | | $ | 4.70 | | | | — | | | | — | |
December 1, 2009 to December 31, 2009 | | | — | | | | — | | | | — | | | | — | |
Total | | | 7,648 | | | $ | 4.70 | | | | — | | | | — | |
All of the units were surrendered by employees to pay tax withholding in connection with the vesting of restricted common units. As a result, we are deeming the surrenders to be “repurchases.” These repurchases were not part of a publicly announced program to repurchase our common units, nor do we have a publicly announced program to repurchase our common units.
Item 6. Selected Financial Data.
The following table shows selected historical financial data of our predecessor, ONEOK Texas Field Services L.P., and of Eagle Rock Pipeline, L.P. and Eagle Rock Energy Partners, L.P. ONEOK Texas Field Services, L.P. is treated as our and Eagle Rock Pipeline, L.P.’s predecessor and is referred to as “Eagle Rock Predecessor” because of the substantial size of the operations of ONEOK Texas Field Services, L.P. as compared to Eagle Rock Pipeline, L.P. and the fact that all of Eagle Rock Pipeline, L.P.’s operations at the time of the acquisition of ONEOK Texas Field Services, L.P. related to an investment that was managed and operated by others. References to “Eagle Rock Pipeline” refer to Eagle Rock Pipeline, L.P., which is the acquirer of Eagle Rock Predecessor and the entity contributed to us in connection with our initial public offering in October 2006.
Our historical results of operations for the periods presented below may not be comparable either from period to period or going forward, for the following reasons:
| | • | The purchase price paid in connection with the acquisition of Eagle Rock Predecessor on December 1, 2005 was “pushed down” to the financial statements of Eagle Rock Energy Partners, L.P. As a result of this “push-down” accounting, the book basis of our assets was increased to reflect the purchase price, which had the effect of increasing our depreciation expense. |
| | • | In connection with our acquisition of the Eagle Rock Predecessor, our interest expense subsequent to December 1, 2005 increased due to the increased debt incurred. |
| | • | After our acquisition of Eagle Rock Predecessor, we initiated a risk management program comprised of puts, costless collars and swaps for crude oil, natural gas and NGLs, as well as interest rate swaps that we account for using mark-to-market accounting. The amounts related to commodity hedges are included in unrealized/realized gain (loss) derivatives gains (losses) and the amounts related to interest rate swaps are included in interest expenses (income). |
| | • | The historical results of Eagle Rock Predecessor only include the financial results of ONEOK Texas Field Services L.P. |
| | • | Our historical financial results for periods prior to December 31, 2005 do not include the full financial results from the operation of the Tyler County pipeline. |
| | • | On March 27, 2006, Eagle Rock Pipeline completed a private placement of 5,455,050 common units for $98.3 million. |
| | • | On March 31, 2006 and April 7, 2006, a wholly-owned subsidiary of Eagle Rock Energy Partners, L.P. acquired certain natural gas gathering and processing assets from Duke Energy Field Services, L.P. and Swift Energy Corporation, consisting of the Brookeland gathering system and processing plant, the Masters Creek gathering system and the Jasper NGL pipeline. We refer to this acquisition as the Brookeland Acquisition. As a result, our historical financial results for the periods prior to March 31, 2006 do not include the financial results from the operation of these assets. |
| | • | On June 2, 2006, we purchased all of the partnership interests in Midstream Gas Services, L.P., which we refer to as the MGS Acquisition, an NGP affiliate, for approximately $4.7 million in cash and 809,174 (recorded value of $20.3 million) common units in Eagle Rock Pipeline. As a result, financial results for the periods prior to June 2006 do not include the financial results from the operation of these assets. |
| | • | On April 30, 2007, we acquired certain fee minerals, royalties and working interest properties through purchases directly from Montierra Minerals & Production, L.P. and through purchases directly from NGP-VII Income Co-Investment Opportunities, L.P., which we refer to as the Montierra Acquisition, for 6,458,946 (recorded value of $133.8 million) of our common units and $5.4 million in cash. As a result, financial results for the periods prior to May 2007 do not include the financial results from these assets. |
| | • | On May 3, 2007, we acquired Laser Midstream Energy, L.P. and certain of its subsidiaries, which we refer to as the Laser Acquisition, for $113.4 million in cash and 1,407,895 (recorded value of $29.2 million) of our common units. As a result, financial results for the periods prior to May 2007 do not include the financial results from these assets. |
| | • | On May 3, 2007, we completed the private placement of 7,005,495 common units for $127.5 million. |
| | • | On June 18, 2007, we acquired certain fee minerals and royalties from MacLondon Energy, L.P., which we refer to as the MacLondon Acquisition, for $18.2 million, financed with 757,065 (recorded value of $18.1 million) of our common units and cash of $0.1 million. As a result, financial results for the periods prior to July 2007 do not include the financial results from these assets. |
| | • | On July 31, 2007, we completed the acquisition of Escambia Asset Co. LLC and Escambia Operating Co. LLC, which we refer to as the EAC Acquisition, for approximately $224.6 million in cash and 689,857 (recorded value of $17.2 million) of our common units, subject to post-closing adjustment. As a result, financial results for the periods prior to July 31, 2007 do not include the financial results from these assets. |
| | • | On July 31, 2007, we completed the acquisition of Redman Energy Holdings, L.P. and Redman Energy Holdings II, L.P. and certain assets owned by NGP Income Co-Investment Opportunities Fund II, L.P. (a Natural Gas Partners affiliate) which we refer to as the Redman Acquisition, for 4,428,334 (recorded value of $108.2 million) common units and $84.6 million. As a result, financial results for the periods prior to July 2007 do not include the financial results from these assets. |
| | • | On July 31, 2007, we completed the private placement of 9,230,770 common units for approximately $204.0 million. |
| | • | On April 30, 2008, we completed the acquisition of Stanolind Oil and Gas Corp., which we refer to as the Stanolind Acquisition, for an aggregate purchase price of $81.9 million in cash. As a result, financial results for the periods prior to May 2008 do not include the financial results from these assets. |
| | • | On October 1, 2008 we completed the acquisition of Millennium Midstream Partners, L.P. (“MMP”), which we refer to as the Millennium Acquisition, for approximately $183.4 million in cash and 3,031,676 (recorded value of $27.2 million) of our common units. The purchase price includes the release of 849,858 units from the escrow account to the sellers as well as other post-closing adjustments made subsequent to October 1, 2008. As a result, financial results for the periods prior to October 2008 do not include the financial results from these assets. |
The selected historical financial data as of and for the eleven month period ended November 30, 2005 are derived from the audited financial statements of Eagle Rock Predecessor and as of and for the year ended December 31, 2005 are derived from the audited financial statements of Eagle Rock Pipeline, L.P. The selected historical financial data as of and for the years ended December 31, 2006, 2007, 2008 and 2009 are derived from the audited financial statements of Eagle Rock Energy Partners, L.P.
The following table includes the non-GAAP financial measure of Adjusted EBITDA. We define Adjusted EBITDA as net income (loss) plus or (minus) income tax provision (benefit); interest-net, including realized interest rate risk management instruments and other expense; depreciation, depletion and amortization expense; impairment expense; other operating expense, non-recurring; other non-cash operating and general and administrative expenses, including non-cash compensation related to our equity-based compensation program; unrealized (gains) losses on commodity and interest rate risk management related instruments; gains (losses) on discontinued operations and other (income) expense. We use Adjusted EBITDA as a measure of our core profitability to assess the financial performance of our assets. Adjusted EBITDA is also used as a supplemental financial measure by external users of Eagle Rock’s financial statements such as investors, commercial banks and research analysts. For example, Eagle Rock’s lenders under its revolving credit facility use a variant of Eagle Rock’s Adjusted EBITDA in a compliance covenant designed to measure the viability of Eagle Rock and its ability to perform under the terms of its revolving credit facility; Eagle Rock, therefore, uses Adjusted EBITDA to measure its compliance with its revolving credit facility. We believe that investors benefit from having access to the same financial measures that our management team uses in evaluating performance. Adjusted EBITDA is useful in determining our ability to sustain or increase distributions. By excluding unrealized derivative gains (losses), a non-cash, mark-to-market benefit (charge) which represents the change in fair market value of our executed derivative instruments and is independent of our assets’ performance or cash flow generating ability, we believe Adjusted EBITDA reflects more accurately our ability to generate cash sufficient to pay interest costs, support our level of indebtedness, make cash distributions to our unitholders and general partner and finance our maintenance capital expenditures. We further believe that Adjusted EBITDA also describes more accurately the underlying performance of our operating assets by isolating the performance of our operating assets from the impact of an unrealized, non-cash measure designed to describe the fluctuating inherent value of a financial asset. Similarly, by excluding the impact of non-recurring discontinued operations, Adjusted EBITDA provides users of our financial statements a more accurate picture of our current assets’ cash generation ability, independently from that of assets which are no longer a part of our operations. Eagle Rock’s Adjusted EBITDA definition may not be comparable to Adjusted EBITDA or similarly titled measures of other entities, as other entities may not calculate Adjusted EBITDA in the same manner as Eagle Rock. For example, we include in Adjusted EBITDA the actual settlement revenue created from our commodity hedges by virtue of transactions undertaken by us to reset commodity hedges to higher prices or purchase puts or other similar floors despite the fact that we exclude from Adjusted EBITDA any charge for amortization of the cost of such commodity hedge reset transactions or puts. For a reconciliation of Adjusted EBITDA to its most directly comparable financial measures calculated and presented in accordance with GAAP (accounting principles generally accepted in the United States), please read “Summary—Non-GAAP Financial Measures.”
| | | Eagle Rock Predecessor | | | Eagle Rock Pipeline, L.P. | | | Eagle Rock Energy Partners, L.P. | |
| | | Period from January 1, 2005 to November 30, 2005 | | | Year Ended December 31, 2005(1) | | | Year Ended December 31, 2006 | | | Year Ended December 31, 2007 | | | Year Ended December 31, 2008 | | | Year Ended December 31, 2009 | |
| Statement of Operations Data: | | | | | | | | | | | | | | | | | | | | | | | | |
Sales to external customers | | $ | 396,953 | | | $ | 66,382 | | | $ | 502,394 | | | $ | 775,857 | | | $ | 1,316,500 | | | $ | 716,754 | |
Unrealized derivative gains/(losses) | | | — | | | | 7,308 | | | | (26,306 | ) | | | (130,773 | ) | | | 207,824 | | | | (189,590 | ) |
Realized derivative gains/(losses) | | | — | | | | — | | | | 2,302 | | | | (3,061 | ) | | | (46,059 | ) | | | 83,300 | |
Total revenues | | | 396,953 | | | | 73,690 | | | | 478,390 | | | | 642,023 | | | | 1,478,265 | | | | 610,464 | |
Cost of natural gas and NGLs | | | 316,979 | | | | 55,272 | | | | 377,580 | | | | 553,248 | | | | 891,433 | | | | 488,230 | |
Operating and maintenance expense | | | 25,326 | | | | 2,955 | | | | 32,905 | | | | 52,793 | | | | 73,620 | | | | 73,196 | |
Non-income based taxes | | | 2,192 | | | | 149 | | | | 2,301 | | | | 8,340 | | | | 19,936 | | | | 12,047 | |
General and administrative expense | | | — | | | | 4,616 | | | | 10,860 | | | | 27,799 | | | | 45,701 | | | | 46,188 | |
Other operating | | | — | | | | — | | | | — | | | | 2,847 | | | | 10,699 | | | | (3,552 | ) |
Advisory termination fee | | | — | | | | — | | | | 6,000 | | | | — | | | | — | | | | — | |
| Depreciation, depletion and amortization expense | | | 8,157 | | | | 4,088 | | | | 43,220 | | | | 80,559 | | | | 116,754 | | | | 116,262 | |
| Impairment expense | | | — | | | | — | | | | — | | | | 5,749 | | | | 174,851 | | | | 22,062 | |
Operating income (loss) | | | 44,299 | | | | 6,610 | | | | 5,524 | | | | (89,312 | ) | | | 145,271 | | | | (143,969 | ) |
Interest (income) expense | | | (859 | ) | | | 4,031 | | | | 28,604 | | | | 49,764 | | | | 65,022 | | | | 27,750 | |
Other (income) expense | | | (17 | ) | | | (171 | ) | | | (996 | ) | | | 7,530 | | | | (4,373 | ) | | | (1,258 | ) |
| Income (loss) from continuing operations before income taxes | | | 45,175 | | | | 2,750 | | | | (22,084 | ) | | | (146,606 | ) | | | 84,622 | | | | (170,461 | ) |
Income tax provision | | | 15,811 | | | | — | | | | 1,230 | | | | 158 | | | | (1,134 | ) | | | 1,087 | |
Income (loss) from continuing operations | | | 29,364 | | | | 2,750 | | | | (23,314 | ) | | | (146,764 | ) | | | 85,756 | | | | (171,548 | ) |
Discontinued operations | | | — | | | | — | | | | — | | | | 1,130 | | | | 1,764 | | | | 290 | |
Net income (loss) | | $ | 29,364 | | | $ | 2,750 | | | $ | (23,314 | ) | | $ | (145,634 | ) | | $ | 87,520 | | | $ | (171,258 | ) |
| Loss (income) from continuing operations per common unit - diluted | | $ | — | | | $ | — | | | $ | (0.98 | ) | | $ | (2.15 | ) | | $ | 1.16 | | | $ | (2.26 | ) |
| | | | | | | | | | | | | | | | | | | | | | | | | |
| Balance Sheet Data (at period end): | | | | | | | | | | | | | | | | | | | | | | | | |
Property plant and equipment, net | | $ | 242,487 | | | $ | 441,588 | | | $ | 554,063 | | | $ | 1,207,130 | | | $ | 1,357,609 | | | $ | 1,275,881 | |
Total assets | | | 376,447 | | | | 700,659 | | | | 779,901 | | | | 1,609,927 | | | | 1,773,061 | | | | 1,534,328 | |
Long-term debt | | | — | | | | 408,466 | | | | 405,731 | | | | 567,069 | | | | 799,383 | | | | 754,383 | |
Net equity | | | 233,708 | | | | 208,096 | | | | 291,987 | | | | 726,768 | | | | 727,715 | | | | 530,398 | |
| | | | | | | | | | | | | | | | | | | | | | | | | |
| Cash Flow Data: | | | | | | | | | | | | | | | | | | | | | | | | |
| Net cash flows provided by (used in): | | | | | | | | | | | | | | | | | | | | | | | | |
Operating activities | | $ | 47,603 | | | $ | (1,667 | ) | | $ | 54,992 | | | $ | 106,945 | | | $ | 181,151 | | | $ | 96,941 | |
Investing activities | | | (6,708 | ) | | | (543,501 | ) | | | (134,873 | ) | | | (475,790 | ) | | | (334,603 | ) | | | (38,865 | ) |
Financing activities | | | (40,895 | ) | | | 556,304 | | | | 71,088 | | | | 426,816 | | | | 102,816 | | | | (73,260 | ) |
| Other Financial Data: | | | | | | | | | | | | | | | | | | | | | | | | |
Cash distributions per Common Unit (declared) | | $ | — | | | $ | — | | | $ | 0.2679 | | | $ | 1.485 | | | $ | 1.63 | | | $ | 0.10 | |
Adjusted EBITDA(2) | | $ | 52,473 | | | $ | 3,561 | | | $ | 81,192 | | | $ | 132,216 | | | $ | 248,286 | | | $ | 188,583 | |
| | (1) | Includes historical financial and operating data for Eagle Rock Predecessor for the period from December 1, 2005 to December 31, 2005. Prior to the December 1, 2005 acquisition of the Eagle Rock Predecessor, the operations of Eagle Rock Pipeline, L.P. were minimal. |
| | (2) | See Part II Item 6. Selection Financial Data – Non-GAAP Financial Measures for reconciliation of “Adjusted EBITDA” to net cash flows from operating activities and net income (loss). |
Non-GAAP Financial Measures
We include in this filing the following non-GAAP financial measure: Adjusted EBITDA (as defined on page 80). We provide reconciliations of this non-GAAP financial measure to its most directly comparable financial measures as calculated and presented in accordance with GAAP.
Adjusted EBITDA should not be considered an alternative to net income, operating income, cash flows from operating activities or any other measure of financial performance presented in accordance with GAAP.
Adjusted EBITDA does not include interest expense, income taxes or depreciation and amortization expense. Because we have borrowed money to finance our operations, interest expense is a necessary element of our costs and our ability to generate net income. Because we use capital assets, depreciation and amortization are also necessary elements of our costs. Therefore, any measures that exclude these elements have material limitations. To compensate for these limitations, we believe that it is important to consider both net income determined under GAAP, as well as Adjusted EBITDA, to evaluate our performance. Our Adjusted EBITDA excludes some, but not all, items that affect net income and operating income and these measures may vary among companies. Therefore, our Adjusted EBITDA may not be comparable to similarly titled measures of other companies. For example, we include in Adjusted EBITDA the actual settlement revenue created from our commodity hedges by virtue of transactions undertaken by us to reset commodity hedges to higher prices or purchase puts or other similar floors despite the fact that we exclude from Adjusted EBITDA any charge for amortization of the cost of such commodity hedge reset transactions or puts.
| | | Eagle Rock Predecessor | | | Eagle Rock Pipeline, L.P. | | | Eagle Rock Energy Partners, L.P. | |
| | | Period from January 1, 2005 to November 30, 2005 | | | Year Ended December 31, 2005(1) | | | Year Ended December 31, 2006 | | | Year Ended December 31, 2007 | | | Year Ended December 31, 2008 | | | Year Ended December 31, 2009 | |
| Reconciliation of “Adjusted EBITDA” to net cash flows provided by (used in) operating activities and net income (loss): | | | | | | | | | | | | | | | | | | | | | | | | |
| Net cash flows provided by (used in) operating activities | | $ | 47,603 | | | $ | (1,667 | ) | | $ | 54,992 | | | $ | 106,945 | | | $ | 181,151 | | | $ | 96,941 | �� |
| Add (deduct): | | | | | | | | | | | | | | | | | | | | | | | | |
| Depreciation, depletion, amortization and impairment | | | (8,157 | ) | | | (4,088 | ) | | | (43,220 | ) | | | (86,308 | ) | | | (291,605 | ) | | | (138,324 | ) |
Amortization of debt issue cost | | | — | | | | (76 | ) | | | (1,114 | ) | | | (1,777 | ) | | | (958 | ) | | | (1,068 | ) |
| Risk management portfolio value changes | | | — | | | | 5,709 | | | | (23,531 | ) | | | (136,132 | ) | | | 199,339 | | | | (147,751 | ) |
| Reclassing financing derivative settlements | | | — | | | | — | | | | 978 | | | | (1,667 | ) | | | (11,063 | ) | | | 8,939 | |
Other | | | (1,559 | ) | | | (6 | ) | | | (7,566 | ) | | | (8,235 | ) | | | (4,433 | ) | | | (1,762 | ) |
| Accounts receivable and other current assets | | | 56,599 | | | | 43,179 | | | | 1,432 | | | | 16,579 | | | | (41,814 | ) | | | (23,821 | ) |
| Accounts payable, due to affiliates and accrued liabilities | | | (64,320 | ) | | | (40,197 | ) | | | (8,777 | ) | | | (34,374 | ) | | | 57,762 | | | | 36,668 | |
Other assets and liabilities | | | (802 | ) | | | (104 | ) | | | 3,492 | | | | (665 | ) | | | (859 | ) | | | (1,080 | ) |
Net income (loss) | | | 29,364 | | | | 2,750 | | | | (23,314 | ) | | | (145,634 | ) | | | 87,520 | | | | (171,258 | ) |
| | | | | | | | | | | | | | | | | | | | | | | | | |
| Add: | | | | | | | | | | | | | | | | | | | | | | | | |
Interest (income) expense net | | | (859 | ) | | | 2,432 | | | | 30,383 | | | | 44,587 | | | | 38,260 | | | | 41,349 | |
| Depreciation, depletion, amortization and impairment | | | 8,157 | | | | 4,088 | | | | 43,220 | | | | 86,308 | | | | 291,605 | | | | 138,324 | |
Income tax provision (benefit) | | | 15,811 | | | | — | | | | 1,230 | | | | 158 | | | | (1,134 | ) | | | 1,087 | |
EBITDA | | | 52,473 | | | | 9,270 | | | | 51,519 | | | | (14,581 | ) | | | 416,251 | | | | 9,502 | |
| | | | | | | | | | | | | | | | | | | | | | | | | |
| Add: | | | | | | | | | | | | | | | | | | | | | | | | |
| Income from discontinued operations | | | — | | | | — | | | | — | | | | (1,130 | ) | | | (1,764 | ) | | | (290 | ) |
| Risk management portfolio value changes | | | — | | | | (5,709 | ) | | | 23,531 | | | | 144,176 | | | | (180,107 | ) | | | 177,061 | |
| Restricted unit compensation expense | | | — | | | | — | | | | 142 | | | | 2,395 | | | | 7,694 | | | | 6,685 | |
Other income | | | — | | | | — | | | | — | | | | (696 | ) | | | (5,328 | ) | | | (2,328 | ) |
Other operating expense (2) | | | — | | | | — | | | | 6,000 | | | | 2,847 | | | | 10,699 | | | | (3,552 | ) |
| Non-cash mark-to-market of Upstream imbalances | | | — | | | | — | | | | — | | | | — | | | | 841 | | | | 1,505 | |
Non-recurring operating items | | | — | | | | — | | | | — | | | | (795 | ) | | | — | | | | — | |
ADJUSTED EBITDA(3) | | $ | 52,473 | | | $ | 3,561 | | | $ | 81,192 | | | $ | 132,216 | | | $ | 248,286 | | | $ | 188,583 | |
| (1) | Includes historical financial and operating data for Eagle Rock Predecessor for the period from December 1, 2005 to December 31, 2005. |
| | Includes $6.0 million to terminate an advisory fee for the year ended December 31, 2006, a settlement of arbitration for $1.4 million, severance to a former executive for $0.3 million and $1.1 million for liquidated damage related to the late registration of our common units during the year ended December 31, 2007; $10.7 million related to bad debt expense taken against our outstanding accounts receivable from SemGroup during the year ended December 31, 2008 and $3.6 million due to the recovery of $2.2 million of assets previously written off and the release of $1.4 million of liabilities assumed as part of our purchase price allocation for our acquisitions of Escambia Asset Co. LLC and Redman Energy Holdings, L.P. during the year ended December 31, 2009. |
| | Adjusted EBITDA excludes amortization of commodity hedge costs (including costs of hedge reset transactions) for the years ended December 31, 2009, 2008, 2007 and 2006 of $48.4 million, $13.3 million, $8.2 million and $19.2 million, respectively. We did not amortization any commodity hedge costs during the year ended December 31, 2005. Including these amortization costs, our Adjusted EBITDA for the years ended December 31, 2009, 2008, 2007 and 2006, would have been $140.2 million, $235.0 million, $124.0 million and $61.0 million, respectively. |
The following table summarizes our quarterly financial data for 2009:
| | | For the Quarters Ended | |
| | | March 31, 2009 | | | June 30, 2009 | | | September 30, 2009 | | | December 31, 2009 | |
| | | ($ in thousands, except earnings per unit) | |
Sales of natural gas, NGLs and condensate | | $ | 158,490 | | | $ | 153,320 | | | $ | 156,779 | | | $ | 185,123 | |
Gathering and treating services | | | 11,667 | | | | 11,562 | | | | 11,814 | | | | 10,433 | |
Minerals and royalty income | | | 3,239 | | | | 3,499 | | | | 4,050 | | | | 4,920 | |
Realized commodity derivative gains | | | 30,778 | | | | 22,483 | | | | 17,170 | | | | 12,869 | |
Unrealized commodity derivative losses | | | (4,522 | ) | | | (97,044 | ) | | | (26,002 | ) | | | (62,022 | ) |
Other revenues | | | 42 | | | | 1,678 | | | | 50 | | | | 88 | |
Total operating revenues | | | 199,694 | | | | 95,498 | | | | 163,861 | | | | 151,411 | |
Cost of natural gas and NGLs | | | 133,217 | | | | 115,640 | | | | 109,945 | | | | 129,428 | |
Operating and maintenance expense | | | 21,619 | | | | 21,927 | | | | 19,868 | | | | 21,829 | |
General and administrative expense | | | 12,538 | | | | 11,895 | | | | 10,449 | | | | 11,306 | |
Other operating expense | | | — | | | | (3,552 | ) | | | — | | | | — | |
| Depreciation, depletion, amortization and impairment expense | | | 30,305 | | | | 27,588 | | | | 28,860 | | | | 51,571 | |
| Interest—net including realized risk management instrument | | | 10,989 | | | | 10,434 | | | | 9,345 | | | | 9,511 | |
| Unrealized interest rate derivative losses (gains) | | | (3,099 | ) | | | (11,954 | ) | | | 5,308 | | | | (2,784 | ) |
Income tax (benefit) provision | | | (2,730 | ) | | | (1,477 | ) | | | 5,841 | | | | (547 | ) |
Other expense (income) | | | (293 | ) | | | (283 | ) | | | (458 | ) | | | (224 | ) |
Discontinued operations | | | (307 | ) | | | 67 | | | | (26 | ) | | | (24 | ) |
Net loss | | $ | (2,545 | ) | | $ | (74,787 | ) | | $ | (25,271 | ) | | $ | (68,655 | ) |
| Earnings per unit—diluted | | | | | | | | | | | | | | | | |
Common units | | $ | (0.03 | ) | | $ | (0.99 | ) | | $ | (0.33 | ) | | $ | (0.90 | ) |
Subordinated units | | $ | (0.06 | ) | | $ | (1.02 | ) | | $ | (0.35 | ) | | $ | (0.93 | ) |
General partner | | $ | (0.03 | ) | | $ | (0.99 | ) | | $ | (0.33 | ) | | $ | (0.90 | ) |
During our fiscal year ended December 31, 2009, we recorded the following unusual or infrequently occurring items,
| · | During our quarter ended December 31, 2009, we incurred impairment charges of $13.7 million in our Midstream Business and $7.9 million in our Upstream Segment. During our quarter ended March 31, 2009 we recorded an impairment charge of $0.2 million in our Upstream Segment and in our quarter ended September 30, 2009, we recorded an impairment charge of $0.3 million in our Minerals Segment as a result of the continued decline in natural gas prices. See Part II, Item 7. Management’s Discussion and Analysis of Financial Condition and Results of Operations – Overview – Impairment for further discussion of our impairment charges during the year ended December 31, 2009. |
| · | We experienced significant fluctuations in our unrealized commodity derivative gains and losses from quarter to quarter as a result of the volatility that was experience by commodity prices during 2009. For example, we recorded unrealized losses of $62.0 million, $26.0 million and $97.0 million during our quarters ended December 31, 2009, September 30, 2009 and June 30, 2009, respectively, while in our quarter ended March 31, 2009, we only recorded an unrealized loss of $4.5 million. See Part II, Item 7. Management’s Discussion and Analysis of Financial Condition and Results of Operations – Overview – General Trends and Outlook – Natural Gas Supply and Demand and Petroleum Supply, Demand and Outlook for further discussion regarding the volatility of commodity prices. |
| · | During our quarter ended June 30, 2009, we recorded other operating income of $3.6 million due to the recovery of $2.2 million of assets previously written off and the release of $1.4 million of liabilities assumed as part of our purchase price allocation for our acquisitions of Escambia Asset Co. LLC and Redman Energy Holdings, L.P. |
The following table summarizes our quarterly financial data for 2008:
| | | For the Quarters Ended | |
| | | March 31, 2008 | | | June 30, 2008 | | | September 30, 2008 | | | December 31, 2008 | |
| | | ($ in thousands, except earnings per unit) | |
| Sales of natural gas, NGLs, condensate and sulfur | | $ | 297,383 | | | $ | 369,808 | | | $ | 341,700 | | | $ | 225,028 | |
Gathering and treating services | | | 7,143 | | | | 8,085 | | | | 12,513 | | | | 11,130 | |
Minerals and royalty income | | | 6,958 | | | | 10,255 | | | | 17,393 | | | | 8,388 | |
Realized commodity derivative gains (losses) | | | (12,575 | ) | | | (27,708 | ) | | | (24,105 | ) | | | 18,329 | |
| Unrealized commodity derivative gains (losses) | | | (33,072 | ) | | | (256,265 | ) | | | 255,956 | | | | 241,205 | |
Other revenues | | | 60 | | | | 122 | | | | 428 | | | | 106 | |
Total operating revenues | | | 265,897 | | | | 104,297 | | | | 603,885 | | | | 504,186 | |
Cost of natural gas and NGLs | | | 216,501 | | | | 272,156 | | | | 237,743 | | | | 165,033 | |
Operating and maintenance expense | | | 19,913 | | | | 22,994 | | | | 26,840 | | | | 23,809 | |
General and administrative expense | | | 11,242 | | | | 10,026 | | | | 9,893 | | | | 14,540 | |
Other operating expense | | | — | | | | 6,214 | | | | 3,920 | | | | 565 | |
| Depreciation, depletion, amortization and impairment expense | | | 25,745 | | | | 26,457 | | | | 28,597 | | | | 210,806 | |
| Interest—net including realized risk management instrument | | | 9,205 | | | | 9,417 | | | | 9,856 | | | | 9,499 | |
| Unrealized interest rate derivative (gains) losses | | | 13,660 | | | | (13,689 | ) | | | 501 | | | | 27,245 | |
Income tax (benefit) provision | | | (105 | ) | | | (891 | ) | | | (500 | ) | | | 363 | |
Other expense (income) | | | (1,633 | ) | | | (814 | ) | | | (441 | ) | | | (2,158 | ) |
Discontinued operations | | | (303 | ) | | | (553 | ) | | | (595 | ) | | | (313 | ) |
Net income (loss) | | $ | (28,328 | ) | | $ | (227,020 | ) | | $ | 288,071 | | | $ | 54,797 | |
| Earnings per unit—diluted | | | | | | | | | | | | | | | | |
Common units | | $ | (0.39 | ) | | $ | (3.14 | ) | | $ | 3.94 | | | $ | 0.73 | |
Subordinated units | | $ | (0.39 | ) | | $ | (3.14 | ) | | $ | 3.94 | | | $ | 0.73 | |
General partner | | $ | (0.39 | ) | | $ | (3.14 | ) | | $ | 3.94 | | | $ | 0.73 | |
During our fiscal year ended December 31, 2008, we recorded the following unusual or infrequently occurring items,
| · | During our quarter ended December 31, 2008, we incurred impairment charges of $35.1 million in our Midstream Business, $107.0 million in our Upstream Segment and $1.7 million in our Minerals Segment. These impairment charges were necessary due to the substantial decline in commodity prices during the fourth quarter of 2008, as well as declining drilling activity. In addition, due to the impairment charge recorded in our Upstream Segment, we assessed our goodwill balance for impairment and recorded an impairment charge of $31.0 million. |
| · | We experienced significant fluctuations in our unrealized commodity derivative gains and losses from quarter to quarter as a result of the volatility that was experience by commodity prices during 2008. For example, we recorded a unrealized loss of $256.3 million during our quarter ended June 30, 2008, while in our quarters ended September 30, 2008 and December 31, 2008, we recorded unrealized gains of $256.0 million and $241.2 million, respectively. See Part II, Item 7. Management’s Discussion and Analysis of Financial Condition and Results of Operations – General Trends and Outlook – Natural Gas Supply and Demand and Petroleum Supply, Demand and Outlook for further discussion regarding the volatility of commodity prices. |
| · | As a result SemGroup, L.P. and certain of its subsidiaries filing petitions for bankruptcy we recorded bad debt charges during our quarters ended June 30, 2008, September 30, 2008 and December 31, 2008 of $6.2 million, $3.9 million and $0.6 million, respectively. These amounts are recorded as Other operating expense. See Part II, Item 7. Management’s Discussion and Analysis of Financial Condition and Results of Operations – Summary of Consolidated Operating Results – Corporate Segment for a further discussion. |
| · | During our quarter ended June 30, 2008, we acquired Stanolind Oil and Gas Corp. for which operations were included within our Upstream Segment beginning on May 1, 2008. |
| · | During our quarter ended December 31, 2008, we acquired Millennium Midstream Partners, L.P. for which operations related to these assets were included within our Midstream Business starting on October 2, 2008. |
Item 7. Management’s Discussion and Analysis of Financial Condition and Results of Operations.
The following discussion analyzes our financial condition and results of operations and should be read in conjunction with our historical consolidated financial statements and notes included elsewhere in this Annual Report.
OVERVIEW
We are a domestically focused growth-oriented publicly traded Delaware limited partnership engaged in the following three businesses:
| | • | Midstream Business—gathering, compressing, treating, processing and transporting of natural gas; fractionating and transporting of natural gas liquids (“NGLs”); and the marketing of natural gas, condensate and NGLs; |
| | • | Upstream Business—acquiring, developing and producing oil and natural gas property interests; and |
| | • | Minerals Business—acquiring and managing fee minerals and royalty interests, either through direct ownership or through investment in other partnerships. |
We report on our businesses in seven accounting segments.
We conduct, evaluate and report on our Midstream Business within four distinct segments—the Texas Panhandle Segment, the East Texas/Louisiana Segment, the South Texas Segment and the Gulf of Mexico Segment. Our Texas Panhandle Segment consists of gathering and processing assets in the Texas Panhandle. Our East Texas/Louisiana Segment consists of gathering and processing assets in East Texas/Northern Louisiana. Our South Texas Segment consists of gathering systems and related compression and processing facilities in South Texas, Central Texas, and West Texas. Our Gulf of Mexico Segment consists of gathering and processing assets in Southern Louisiana, the Gulf of Mexico and Galveston Bay. During the year ended December 31, 2009, our Midstream Business generated operating income from continuing operations of $4.9 million, compared to operating income from continuing operations of $56.4 million generated during the year ended December 31, 2008, a decrease of 91%. In addition, during the year ended December 31, 2009, our Midstream Business incurred impairment charges of $13.7 million, compared to $35.1 million during the year ended December 31, 2008.
We conduct, evaluate and report on our Upstream Business as one segment. Our Upstream Segment includes operated wells in Escambia County, Alabama as well as two treating facilities, one natural gas processing plant and related gathering systems that are inextricably intertwined with ownership and operation of the wells. The Upstream Segment also includes operated and non-operated wells that are primarily located in West, East and South Texas in Ward, Crane, Pecos, Henderson, Rains, Van Zandt, Limestone, Freestone and Atascosa Counties. During the year ended December 31, 2009, our Upstream Business generated operating an operating loss of $3.5 million compared to an operating loss of $47.5 million generated during the year ended December 31, 2008. Of important note, during 2008, our Upstream Business had eight months of operations from the assets acquired in the Stanolind Acquisition and a full year of the other assets acquired in acquisition during 2007 and our Upstream Business generated a loss of $2.2 million from the sale of sulfur during the year ended December 31, 2009 compared to revenue of $37.8 million during the year ended December 31, 2008. In addition, during the year ended December 31, 2009, our Upstream Business incurred impairment charges related to its proved properties of $8.1 million, compared to $107.0 million related to it proved properties and $31.0 million related to its goodwill during the year ended December 31, 2008.
We conduct, evaluate, and report our Minerals Business as one segment. Our Minerals Segment consists of fee mineral, royalty and overriding royalty interests located in multiple producing trends in the United States. A significant portion of the mineral interests that we own are managed by a non-affiliated private partnership (the “Minerals Manager”) that controls the executive rights associated with the minerals. For a more detailed discussion of this relationship, see Part I, Item 1. Business – Minerals Business. During the year ended December 31, 2009, our Minerals Segment generated operating income of $8.1 million compared to $31.8 million generated during the year ended December 31, 2008. Included within these numbers is $2.3 million of lease bonus revenue generated during the year ended December 31, 2009 compared to $16.8 million of lease bonus revenue generated during the year ended December 31, 2008. During the year ended December 31, 2008, as a result of the regeneration phenomenon we received an initial royalty payment for 304 new wells. During the year ended December 31, 2009, we recorded an impairment charge of $0.3 million compared to an impairment charge of $1.7 million recorded during the year ended December 31, 2008.
On December 21, 2009, we have entered into a definitive agreement to sell our Minerals Business subject to the approval of a majority of our non-affiliated common unitholders of the agreements described under “Recapitalization and Related Transactions” below. As the sale of the Minerals Business is conditioned upon the approval by a majority of our non-affiliated common unitholders, we have not classified the assets of our Minerals Business as assets-held-for-sale or the operations as discontinued. If the transactions are approved by a majority of the non-affiliated common unitholders, at that point we will then classify the assets of the Minerals Business as assets-held-for-sale and the operations as discontinued.
The final segment that we report on is our Corporate Segment, which is where we account for our commodity derivative/hedging activity and our general and administrative expenses. During the year ended December 31, 2009, our Corporate Segment generated operating loss of $153.6 million compared to operating income of $104.6 million generated during the year ended December 31, 2008. Within these numbers were losses, realized and unrealized, on commodity derivatives of $106.3 million during the year ended December 31, 2009 compared to a gain, realized and unrealized, on commodity derivatives of $161.8 million during the year ended December 31, 2008. The gain generated by our commodity derivatives during the year ended December 31, 2008 was the result of the decline in commodity prices during the fourth quarter of 2008.
Impairment
In connection with preparation and audit of our Consolidated Financial Statements for the years ended December 31, 2009 and 2008, which are included in Part II, Item 8. Financial Statements and Supplementary Data starting on page F-1 of this Annual Report, we determined that we needed to record an impairment charge for certain plants and pipelines within our Midstream Business and certain fields within our proved properties within our Upstream and Minerals Segments. As a result, we incurred impairment charges during the year ended December 31, 2009 of (i) $13.7 million in our Midstream segment due to reduced throughput volumes as our producer customers curtailed their drilling activity in response to lower natural gas prices, (ii) $8.1 million in our Upstream Segment, of which, $7.9 million was a result of a decline in natural gas prices, production declines and lower natural gas liquids yields at our Flomaton field and $0.2 million in other fields due to lower natural gas prices, and (iii) $0.3 million in our Minerals segment as a result of a decline in natural gas prices and a slight reduction in oil reserves based on updated production performance. During the year ended December 31, 2008, we recorded impairment charges related (i) to certain processing plants, pipelines and contracts in its Midstream business of $35.1 million due to the substantial decline in commodity prices in the fourth quarter as well as declining drilling activity by its producer customers, (ii) $107.0 million in our Upstream and (iii) $1.7 million in our Minerals Segments as a result of substantial declines in commodity prices in the fourth quarter 2008. Due to the impairment charge recorded in our Upstream Segment, we assessed our goodwill balance for impairment and recorded an impairment charge of $31.0 million for the year ended December 31, 2008.
Pursuant to generally accepted accounting principles in the United States, our impairment analysis does not take into account the value of our commodity derivative instruments, which generally increase as the estimates of future prices decline. Further declines in commodity prices and other factors could result in additional impairment charges and changes to the fair value of our derivative instruments.
Acquisitions
Historically, we have grown through acquisitions. We did not make any acquisitions during the year ended December 31, 2009. Refer to Part I, Item 1. Business – Table of Acquisitions and Dispositions for a complete history of acquisitions.
Going forward, we will continue to assess acquisition opportunities, regardless of whether such opportunity is in the Midstream or Upstream Business, for their potential accretive value. Our ability to complete acquisitions will depend on our ability to finance the acquisitions, either through the issuance of additional securities, debt or equity, or the incurrence of additional debt under our credit facilities, on terms acceptable to us.
Below is a summary of our important acquisition transactions completed during the year ended December 31, 2008. A more complete description of these acquisitions is contained in Note 4 of our consolidated financial statements included in Part II, Item 8. Financial Statements and Supplementary Data starting on page F-1 of this Annual Report.
Stanolind Acquisition - On April 30, 2008, we completed the acquisition of all of Stanolind Oil and Gas Corp. (the “Stanolind Acquisition”). With this acquisition, we acquired crude oil and natural gas producing properties in the Permian Basin of West Texas, primarily in Ward, Crane and Pecos Counties.
Millennium Acquisition - On October 1, 2008, we completed the acquisition of Millennium Midstream Partners, L.P. (the "Millennium Acquisition”). With this acquisition, we acquired a natural gas gathering and processing business, with assets located in East, Central and West Texas and South Louisiana.
Other Matters
Hurricanes Ike and Gustav - Hurricane Ike, which made landfall in Texas on September 13, 2008, caused no direct damage to our offices or facilities except for certain assets acquired in the Millennium Acquisition; however, the storm did cause temporary operational disruption to our operations located in East Texas, North Louisiana and South Texas due to third-party downstream infrastructure issues. Operations were either temporarily interrupted or curtailed during and immediately after the storm due to power disruptions suffered by third parties causing natural gas and natural gas liquids supply and market issues. All of our operations returned to pre-hurricane levels within ten days after the storm. Our assets, except for certain assets acquired in the Millennium Acquisition, were not impacted by Hurricane Gustav. We received a partial payment for business interruption caused by Hurricane Ike and Gustav of approximately $1.6 million, which was recognized as other income during the year ended December 31, 2009.
Discontinued Operations
On April 1, 2009, we sold our producer services business (which is accounted for in its South Texas Segment) by assigning and novating the contracts under this business to a third-party purchaser. We sold the producer services business to a third-party purchaser as it was a low-margin business that was not core to our operations. We received an initial payment of $0.1 million for the sale of the business. In addition we received a contingency payment of $0.1 million in October 2009. We will continue to receive a monthly payment equivalent to $0.01 per MMbtu on the volume of gas that flows pursuant to the assigned contracts through March 31, 2011. Producer services was a business in which we would negotiate new well connections on behalf of small producers to pipelines other than their own. During the year ended December 31, 2009, this business generated revenues of $19.2 million and cost of natural gas and natural gas liquids of $18.9 million, as compared to revenues of $265.1 million and cost of natural gas and natural gas liquids of $263.3 million during the year ended December 31, 2008 and revenues of $134.8 million and cost of natural gas and natural gas liquids of $133.6 million during the year ended December 31, 2007. The accompanying consolidated financial statements for the years ended December 31, 2009, 2008 and 2007 have been retrospectively adjusted to present revenues minus cost of natural gas and natural gas liquids of $0.3 million, $1.8 million and $1.2 million, respectively, as discontinued operations.
Recapitalization and Related Transactions
On December 21, 2009, we announced that we, through certain of our affiliates, had entered into definitive agreements with affiliates of NGP and Black Stone Minerals Company, L.P. along with affiliates (“Black Stone”) to improve our liquidity and simplify our capital structure. The definitive agreements include: (i) a Securities Purchase and Global Transaction Agreement, entered into between Eagle Rock and NGP, including Eagle Rock’s general partner entities controlled by NGP, and (ii) a Purchase and Sale Agreement (the “Minerals Business Sale Agreement”), entered into between Eagle Rock and Black Stone for the sale of Eagle Rock’s Minerals Business. The Securities Purchase and Global Transaction Agreement was amended on January 12, 2010 to allow for greater flexibility in the payment of the contemplated transaction fee to Holdings, which is controlled by NGP.
The Global Transaction Agreement and Minerals Business Sale Agreement include the following key provisions, which we refer to collectively as the “Recapitalization and Related Transactions.”
| | • | An option in favor of us, exercisable until December 31, 2012 by the issuance of 1,000,000 newly-issued common units, to capture the value of the controlling interest in us through (i) acquiring our general partner, and such general partner’s general partner, and thereby acquiring the 844,551 general partner units outstanding, and (ii) reconstituting our board of directors to allow our common unitholders not affiliated with NGP to elect the majority of our directors (the "GP Acquisition Option"); |
| | • | The sale of our Minerals Business to Black Stone for total consideration of $174.5 million in cash, subject to customary adjustments; |
| | • | The simplification of our capital structure through the contribution, and resulting cancellation, of our existing incentive distribution rights and our existing subordinated units (approximately 20.7 million) currently held by Holdings; |
| | • | A rights offering in which Holdings and NGP will fully participate with respect to 9.5 million common and general partner units owned or controlled by NGP as well as with respect to common units it receives as payment of the transaction fee, if any; and |
| | • | For a period of up to five months following unitholder approval of the amended Global Transaction Agreement, NGP’s commitment to back-stop (primarily through Holdings) up to $41.6 million, at a price of $3.10 per unit, an Eagle Rock equity offering to be undertaken at the sole option of the Partnership’s Conflicts Committee. |
In exchange for NGP’s and Holdings’ contributions and commitments under the Global Transaction Agreement, Eagle Rock will pay Holdings a transaction fee of $29 million in newly-issued common units valued at the greater of (i) 90% of the volume-adjusted trailing 10-day average of the trading price of Eagle Rock’s common units calculated on the 20th day prior to the date of the special meeting to obtain unitholder approval of the Global Transaction Agreement and related proposals; and (ii) $3.10 per common unit. As an alternative, the Conflicts Committee of Eagle Rock’s Board of Directors may, at its sole discretion, cause the Partnership to pay the transaction fee in cash.
Completion of the Recapitalization and Related Transactions is expected to occur in the first half of 2010, subject to customary closing conditions including approval of the Global Transaction Agreement and the transactions contemplated therein, including certain partnership agreement amendments, by a majority of the common units held by non-affiliates of NGP. The transactions contemplated by Global Transaction Agreement is conditioned upon the consummation of the transactions contemplated in the Minerals Business Sale Agreement, which are conditioned on unitholder approval of the Recapitalization and Related Transactions.
We filed a copy of the Minerals Business Sale Agreement, and the Global Transaction Agreement and related ancillary agreements, on Form 8-K with the SEC on December 21, 2009 and January 12, 2010, respectively.
On March 8, 2010, we entered into the Second Amendment to our senior secured revolving credit facility (“Revolving Credit Facility”), dated as of December 13, 2007, with Wachovia Bank, N.A., Bank of America, N.A., HSH NordBank AG, New York Branch, The Royal Bank of Scotland, PLC, BNP Paribas and the other lenders party thereto. We refer to this amendment as the “Credit Facility Amendment.”
Prior to execution of the Credit Facility Amendment, we had concluded that it would require a waiver from our lender group in order to exercise the GP acquisition option without triggering a “Change in Control” event and potential event of default under our credit agreement. The Credit Facility Amendment, however, modifies the definition of “Change in Control" in such a way that our exercise of the GP acquisition option would not trigger a “Change in Control” event and potential default provided we receive unitholder approval of the Recapitalization and Related Transactions prior to July 31, 2010. In light of the amendment, our Conflicts Committee currently intends to cause us to exercise the GP Acquisition Option as soon as practicable after the required unitholder approvals of the Recapitalization and Related Transactions. The Credit Facility Amendment will take effect upon our providing written notice to our lender group that the required unitholder approvals have been obtained prior to July 31, 2010.
In addition to modifying the definition of “Change in Control,” the Credit Facility Amendment also:
| · | Reduces the maximum permitted Senior Secured Leverage Ratio (as such term is defined in the Credit Agreement) from 4.25 to 1.0 under the current credit agreement to 3.75 to 1.0 (and from 4.75 to 1.0 to 4.25 to 1.0 for specified periods following certain permitted acquisitions); |
| · | Obligates us to use $100 million of the proceeds from the Minerals Business Sale to make a mandatory prepayment towards our outstanding borrowings under the revolving credit facility; and |
| · | Reduces, upon such mandatory prepayment, our borrowing capacity under the revolving credit facility by the $100 million amount of such mandatory prepayment; however, our availability under our revolving credit facility is not currently impacted because it is calculated based on our outstanding debt and compliance with financial covenants. |
How We Evaluate Our Operations
Our management uses a variety of financial and operational measurements to analyze our performance. We view these measurements as important factors affecting our profitability and review these measurements on a monthly basis for consistency and trend analysis. These measures include volumes, margin, operating expenses and Adjusted EBITDA (defined on page 78) on a company-wide basis.
Volumes (by Business)
Midstream Volumes. In our Midstream Business, we must continually obtain new supplies of natural gas to maintain or increase throughput volumes on our gathering and processing systems. Our ability to maintain existing supplies of natural gas and obtain new supplies is impacted by (1) the level of workovers or recompletions of existing connected wells and successful drilling activity in areas currently dedicated to our pipelines, (2) our ability to compete for volumes from successful new wells in other areas and (3) our ability to obtain natural gas that has been released from other commitments. We routinely monitor producer activity in the areas served by our gathering and processing systems to pursue new supply opportunities.
We rely on producer drilling activity to maintain and grow our midstream volumes. Generally, producer drilling activity is correlated to the current and expected price of natural gas. As such, throughput volume in our existing midstream assets will typically increase in times of rising gas prices and will typically decrease in times of falling gas prices.
Upstream Volumes. In the Upstream Segment, we continually monitor the production rates of the wells we operate. This information is a critical indicator of the performance of our wells, and we evaluate and respond to any significant adverse changes. We employ an experienced team of engineering and operations professionals to monitor these rates on a well-by-well basis and to design and implement remediation activities when necessary. We also design and implement workover and drilling operations to increase production in order to offset the natural decline of our currently producing wells.
Minerals Volumes. Our Minerals Segment assets are comprised of fee mineral, overriding royalty interests and royalty interests. We do not operate any of these properties. In order to maintain or increase our cash flows from our Minerals Segment, we rely upon the efforts of the operators of our interests. We do not control whether or when additional drilling or recompletion activity will be conducted on the properties in which we have an interest; however, when these activities do occur, we do not bear any of their costs. At any time, there is often a significant amount of drilling and recompletion activity occurring on the properties in which we own an interest, yielding us a cost-free “regeneration effect” on mineral and royalty interests. We monitor the additional production volumes that we realize from regeneration as an important measure of the performance of our Minerals Segment. During the year ended December 31, 2009, as a result of the regeneration phenomenon we received an initial royalty payment for 208 new wells.
Margin
Commodity Pricing. The margins in our Midstream Business generally are positively correlated to NGL and condensate prices, and may be adversely impacted to the extent the price of NGLs decline in relation to the price of natural gas. We refer to the price of NGLs in relation to the price of natural gas as the fractionation spread. In both our Upstream and Minerals Segments, increases in crude oil, natural gas and NGL prices will generally have a favorable impact on our revenues, conversely, decreases in crude oil, natural gas and NGL prices will generally unfavorably impact our revenue.
Risk Management. We conduct risk management activities to mitigate the effect of commodity price and interest rate fluctuations on our cash flows. Our primary method of risk management in this respect is entering into derivative contracts. The impact of our risk management activities are captured in our Corporate Segment. For a further discussion of our risk management activities, see Part II, Item 7A. Quantitative and Qualitative Disclosures About Market Risk.
Operating Expenses
Midstream Operating Expenses. We monitor midstream operating expenses as a measure of the operating efficiency of our field operations. Direct labor, insurance, repair and maintenance, utilities and contract services comprise the most significant portion of our operating expenses. These expenses are largely independent of the volumes through our systems, but fluctuate depending on the activities performed during a specific period and changes in commodity values.
Upstream Operating Expenses. We monitor and evaluate our Upstream Segment operating costs routinely, both on a total cost and unit cost basis. Many of the operating costs we incur are not directly related to the quantity of hydrocarbons that we produce, so we strive to maximize our production rates in order to improve our unit operating costs. The most significant portion of our Upstream Segment operating costs is associated with the operation of the Big Escambia treating and processing facilities. These facilities are overseen by members of our midstream engineering and operations staff. The majority of the cost of operating these facilities is independent of their throughput. This includes items such as labor, chemicals, utilities, materials, and insurance.
Minerals Operating Expenses. We do not incur any operating costs associated with our Minerals Segment.
Adjusted EBITDA
See discussion of Adjusted EBITDA in Part II, Item 6. Selected Financial Data.
General Trends and Outlook
We expect our business to continue to be affected by the following key trends. Our expectations are based on assumptions made by us and information currently available to us; however, our actual results may vary materially from our expectations.
One of the most significant external events impacting our business is the continuing global economic weakness, and the resulting monetary and fiscal policy responses of the governments and central bankers of the developed and major developing countries. As a result of global economic weakness in 2009, there was a significant reduction in demand for the commodities that we produce, transport and/or process, and this led to significantly lower prices for them during much of the year. During the second half of the year, following the stabilization of the banking system and the introduction of high levels of economic stimulus into the world’s major economies, demand for these commodities increased and their prices improved substantially.
In the United States and major western European economies, unemployment and underemployment are at high levels. Despite the recent resumption of economic growth in these economies, many economists expect that employment will improve very slowly, which we believe will continue to place downward pressure on demand for the commodities we produce, gather and process. Also contributing to downward pressure on demand is that most of the beneficial impact of the fiscal stimulus that these economies implemented in 2009 has been realized, and it is unlikely that these countries will be able to significantly stimulate their economies further due to their large budget deficits and high levels of debt.
In contrast, the Chinese economy appears to have quickly recovered from the recession. Economic growth in China slowed to approximately 5% in 2009, and is projected to recover to its pre-recession level of 9-10% in 2010. This is significant because most of the future growth in demand for petroleum and other commodities is expected to come from China and other major developing economies such as India, Brazil and Russia.
Other than factors relating to demand, there are two other factors that could contribute to rising commodity prices in 2010, particularly with respect to oil. The first is the possible weakening of the United States dollar. We expect that until there is some indication of inflation in the United States, central bankers will attempt to keep interest rates at historical lows in order to facilitate lending and minimize the cost of funding the United States’ large budget deficit. Other major economies have begun to increase their central bank lending rates, however, and these relatively higher rates could lead to a weakening of the dollar. During the previous two years there has been a strong negative correlation between oil prices and the dollar, and if this relationship continues, the price of crude would be expected to move higher if the dollar weakens.
Also, the loose monetary policies implemented by the developed nations in response to the recession may result in excess liquidity that could cause valuation bubbles in some types of assets, including commodities. This liquidity could also impact the types of assets we seek to acquire and could ultimately result in acquisition prices that we would consider unattractive.
Natural Gas Supply and Demand
Natural gas prices are more dependent than crude oil prices on regional supply and demand due to the relative difficulty in transporting natural gas from producing to consuming regions of the world. In the United States, where we produce natural gas, the outlook for demand remains depressed due to the slow recovery from the recession. Over the longer term, we believe that the environmental advantages that natural gas has over coal will result in the construction of additional natural gas-fired electricity generation capacity, both for new capacity and to replace aging coal-fired facilities.
As a result of diminished demand, natural gas in storage reached a record level in 2009 and it is possible that natural gas in storage at the end of the winter heating season will be well above the five-year average. This may place significant downward pressure on prices in early 2010.
In late 2008 and early 2009, prices for natural gas declined significantly and producers responded by drastically reducing their drilling activities. Forecasters expect that this would, over the course of several months, lead to a decrease in natural gas supply and an increase in prices. It is difficult to know how much the reduction in drilling activity has influenced natural gas supply, however, because much of the natural gas-directed drilling in the United States has shifted from traditional reservoirs to unconventional reservoirs, particularly the Barnett, Haynesville and Marcellus shales. The wells in these plays typically have high initial flow rates and very high production decline rates. Because the Haynesville and Marcellus shale plays encompass large areas and are still in the early stage of development, it is uncertain whether production from these plays will be sufficient to create excess natural gas supply that could place additional downward pressure on prices. It is also interesting to note that the natural gas produced from the Haynesville shale contains essentially no natural gas liquids. Therefore, as producers shift their activity from traditional reservoirs, which often contain high levels of natural gas liquids, to shale plays, natural gas prices may fall while natural gas liquids prices simultaneously rise.
In addition to North American drilling activity, imported liquefied natural gas (LNG) has the potential to increase the supply of natural gas in the United States. LNG imports are currently 1.2 Bcf/d. Some forecasters have predicted this will increase to a much as 4.0 Bcf/d in the next few years. However, some of the large LNG projects that are under construction to provide this supply are reported to have been delayed due to the global economic weakness.
Petroleum Supply, Demand and Outlook
The majority of the world’s crude oil production and reserves is controlled by foreign governments and state-owned oil companies. Many of these countries rely on crude oil exports to fund the majority of their governmental expenditures, and in some of these the export of crude oil represents the bulk of their economic output. Certain exporting countries have seen declines in their production rates due to low levels of capital re-investment in their oil industry. We believe that, while some oil exporting countries will be able to increase their production to meet future increases in demand, that others will have a difficult time maintaining their production levels and that this may result in an undersupplied market for crude oil within a few years.
As discussed above, there are several factors influencing the demand for crude oil, all of which are related to the pace with which various economies recover. Ultimately, the continued growth of the developing economies will result in much greater demand for crude oil but it is uncertain how quickly demand will exceed supply. We believe that crude oil prices may soften in the next several months but expect higher prices over the next one to two years.
Natural gas liquids prices tend to have a high correlation to crude oil prices, especially for propane and heavier NGL’s. In late 2009, while crude oil prices were increasing, natural gas liquids prices strengthened even more, so currently the ratios of the prices of the various natural gas liquids to the price of West Texas Intermediate crude oil are at very high levels. We expect these price ratios to remain high at least through the first half of 2009.
Sulfur Supply, Demand and Outlook
Much of the natural gas that we produce in our Upstream Segment contains high, naturally-occurring concentrations of hydrogen sulfide. This is a corrosive, poisonous gas that must be removed from the natural gas stream before it can be processed for NGL extraction or sale. The process of removing the hydrogen sulfide yields a large amount of elemental sulfur, and we can sell this co-product or otherwise dispose of it. The process of removing hydrogen sulfide from natural gas, and similar processes for the removal of hydrogen sulfide from sour crude oils (prior to refining), is the primary source of sulfur production in the United States and the world.
The primary use of sulfur is the production of sulfuric acid, and one of the major uses of sulfuric acid is the production of phosphoric acid. Phosphoric acid is a key raw material in the manufacture of phosphate fertilizers. Therefore, one of the major factors influencing the demand for sulfur is the demand for fertilizer. The region around Tampa, Florida contains a large amount of fertilizer manufacturing facilities, and Tampa also serves as an export port for sulfur. For many years, the supply of sulfur was greater than the available demand, such that Tampa prices fluctuated within a narrow band of $20 to $40 per long ton. Some North American sources of sulfur are large distances from Tampa, so those sellers might have received very little net revenue for their sulfur after transportation costs or might have actually incurred a net expense to move their sulfur co-product.
Beginning in the second half of 2007, global demand for fertilizer increased significantly, and as a result, Tampa prices also rose to record levels. By the fourth quarter of 2008, sulfur prices at Tampa were over $600 per long ton. The global economic weakness has greatly reduced fertilizer demand, however, and consequently, demand for sulfur is also much lower than it was only a few months ago. By the end of 2008, Tampa sulfur prices had fallen to $0 (zero dollars) per long ton, resulting in a net expense for sellers to move their sulfur. Sulfur prices remained low throughout 2009 and ended the year at a Tampa sulfur price of $30 per long ton. Currently, in the first quarter 2009, the Tampa, Florida sulfur market has improved to $90 per long ton.
Our expectations are for sulfur demand to increase to normal levels as fertilizer manufacturers deplete their excess inventories and the developing economies emerge from the economic weakness. In the same way that almost all of the growth in petroleum demand is expected to occur in developing economies, we expect most of the growth in agricultural, and hence fertilizer, demand to occur there as well. These economies, particularly China, appear to be recovering strongly and so we expect strengthening sulfur prices in 2010.
Outlook for Interest Rates and Inflation
In response to the global recession, the governments and central banks of the world’s large economies adopted fiscal and monetary policies that introduced unprecedented amounts of liquidity into their financial systems. Because these economies have excess productive capacity due to the reduction in demand caused by the recession, this liquidity has not led to inflationary pressures. Eventually, however, as the economies recover and demand increases, policymakers will need to remove this liquidity from their economies to avoid significant levels of inflation. This will be a delicate task and will require a high degree of coordination between central banks.
It is impossible to predict when these policy changes will occur or how successful they will be. In the near term, however, we expect that unemployment and underemployment will remain persistently high, and this will act as a brake on inflation. As inflationary pressures arise, however, we expect that one of the responses will be higher interest rates, and this will increase our interest expenses.
Impact of Credit and Capital Market Turmoil
The global financial crisis resulted in very low levels of credit availability in 2008 and early 2009. Since then, as signs of economic recovery have emerged and governments have enacted policies to stabilize banks and increase liquidity, equity and corporate debt markets began to expand. With respect to master limited partnerships, which rely on external capital to finance acquisitions and organic growth projects, the availability of capital has steadily increased as investor appetite has returned to the sector.
So long as governments around the world continue to enact policies designed to restore the health of the banking industry and promote growth in their respective economies, we believe that credit and access to capital markets will continue to grow. Upon the successful completion of our Recapitalization and Related Transactions, and if favorable conditions in the capital markets continue, we believe we will be able to obtain additional external financing which will allow us to resume our growth strategy through acquisitions and organic growth projects. In the meantime, we have reduced our growth and maintenance capital expenditure budget for 2010 and are only pursuing highly accretive acquisitions which could be financed in the current financial market environment.
Impact of Regulation of Greenhouse Gas Emissions
The operations of and use of the products produced by the natural gas and oil industry are sources of emissions of certain greenhouse gases (GHG’s), namely carbon dioxide and methane. Regulation of GHG emissions has not had an impact on our operations in the past, and the regulation of our GHG emissions as such has not occurred. However, there is a trend towards government-imposed limitation of GHG emissions at the state, regional, and federal level.
The United States Environmental Protection Agency (EPA), by virtue of a recent Supreme Court decision, was deemed to have authority to regulate carbon dioxide and other GHG emissions under the Clean Air Act, and they are drafting and preparing to implement regulations. It is possible that legislation will be proposed to amend the Clean Air Act to exclude GHG’s, but we believe the probability of the enactment of such legislation is uncertain.
In addition, in 2009 there was a significant effort in the United States Congress to enact legislation to establish a cap-and-trade system as a means to regulate GHG emissions. A cap-and-trade bill was approved by the House of Representatives, but it appears uncertain that similar legislation will pass in the Senate. Therefore, it appears that the probability of enactment of a cap-and-trade bill in 2010 may be relatively low at this time, but is fairly unpredictable. Because of the uncertainty of the nature of any potential future federal GHG regulations at this time, we are unable to forecast how future regulation of GHG emissions would negatively impact our operations. We will continue to monitor regulatory developments and to assess our ability to reasonably predict the economic impact of these developments on our business.
The commercial risk associated with the exploration and production of fossil fuels lies in the uncertainty of government-imposed climate change legislation, including cap and trade schemes, and regulations that may affect our customers, which could affect the demand for crude oil and natural gas. Such an impact on demand could have an adverse impact on the demand for our services, and could have an impact on our financial condition, results of operations and cash flows.
On the other hand, natural gas produces less greenhouse gas emissions when burned than other fossil fuels, such as refined petroleum products or coal. As a result, climate change legislation could create an increased demand for natural gas.
To what extent climate change may result in an increase in extreme weather conditions such as more intense hurricanes, thunderstorms, tornados and snow or ice storms, as well as rising sea levels is uncertain. Extreme weather conditions could increase our costs and damage resulting from extreme weather, for which we may not be fully insured. However, to what extent climate change may lead to increased storm or weather hazards or affect our operations, is difficult to determine at this time.
Critical Accounting Policies
Conformity with accounting principles generally accepted in the United States requires management to make estimates and judgments that affect the amounts reported in the financial statements and notes. On an on-going basis, we make and evaluate estimates and judgments based on management’s best available knowledge of previous, current, and expected future events. Given that a substantial portion of our operations were acquired within the past 24 months, we base our estimates on historical experience and various other assumptions that we believe to be reasonable under the circumstances. Actual results may differ from these estimates, and estimates are subject to change due to modifications in the underlying conditions or assumptions. Currently, we do not foresee any reasonably likely changes to our current estimates and assumptions which would materially affect amounts reported in the financial statements and notes. We have selected the following critical accounting policies that currently affect our financial condition and results of operations for discussion.
Successful Efforts. We utilize the successful efforts method of accounting for our oil and natural gas properties. Leasehold costs are capitalized when incurred. Costs incurred to drill and complete development wells, including dry holes, are capitalized. Unproved properties are assessed periodically within specific geographic areas and, if necessary, impairments are charged to expense. Geological and geophysical expenses and delay rentals are charged to expense as incurred. Exploratory drilling costs are initially capitalized, but charged to expense if the well is determined to be unsuccessful. We carry the costs of an exploratory well as an asset if the well finds a sufficient quantity of reserves to justify its capitalization as a producing well as long as we are making sufficient progress towards assessing the reserves and the economic and operating viability of the project.
Depletion of producing oil and natural gas properties is recorded based on units of production. Unit rates are computed for unamortized drilling and development costs using proved developed reserves and for acquisition costs using all proved reserves. U.S. GAAP authoritative guidance requires that acquisition costs of proved properties be amortized on the basis of all proved reserves (developed and undeveloped) and that capitalized development costs (wells and related equipment and facilities) be amortized on the basis of proved developed reserves. In the case of our Minerals Segment, we only claim proved, producing reserves because, as a mineral interest owner, we lack sufficient engineering and geological data to estimate the proved undeveloped and non-producing reserve quantities and because we cannot control the occurrence or the timing of the activities that would cause such reserves to become productive. Since our units of production depletion and amortization rate are a function of our proved reserves, we experience a higher depletion and amortization rate than we would if we claimed undeveloped or non-producing reserves.
Upon sale or retirement of complete fields of depreciable or depleted property, the book value thereof, less proceeds or salvage value, is charged or credited to income.
We assess proved oil and natural gas properties in our Upstream Segment for possible impairment when events or circumstances indicate that the recorded carrying value of the properties may not be pre-tax recoverable. We recognize an impairment loss as a result of a triggering event and when the estimated undiscounted pre-tax future cash flows from a property are less than the carrying value. If impairment is indicated, the fair value is compared to the carrying value for determining the amount of the impairment loss to record. Estimated future cash flows are based on management’s expectations for the future and include estimates of oil and natural gas reserves and future commodity prices and operating costs. Downward revisions in estimates of reserve quantities or expectations of falling commodity prices or rising operating costs could result in a reduction in undiscounted future cash flows and could indicate property impairment. During the year ended December 31, 2009, we incurred impairment charges of $8.1 million in our Upstream segment as a result of a decline in natural gas prices and an impairment of $0.3 million in our Minerals segment as a result of a decline in natural gas prices and a slight reduction in oil reserves based on updated production performance. During the year ended December 31, 2008, we incurred impairment charges related to certain fields of $107.0 million and $1.7 million in our Upstream and Minerals Segments, respectively, due to the substantial decline in commodity prices during the fourth quarter of 2008.
Unproved properties that are individually insignificant are amortized. Unproved properties that are individually significant are assessed for impairment on a property-by-property basis. If considered impaired, costs are charged to expense when such impairment is deemed to have occurred.
Our estimates of proved reserves are based on the quantities of oil and natural gas that engineering and geological analyses demonstrate, with reasonable certainty, to be recoverable from established reservoirs in the future under current operating and economic conditions. Annually, and on other occasions, Cawley, Gillespie & Associates, Inc. prepares an estimate of the proved reserves on all our properties, based on information provided by us.
Reserves and their relation to estimated future net cash flows impact our depletion and impairment calculations. As a result, adjustments to depletion and impairment are made concurrently with changes to reserve estimates. We prepare our reserve estimates, and the projected cash flows derived from these reserve estimates, in accordance with SEC guidelines. The independent engineering firm described above adheres to the same guidelines when preparing their reserve reports. The accuracy of our reserve estimates is a function of many factors including the following: the quality and quantity of available data, the interpretation of that data, the accuracy of various mandated economic assumptions and the judgments of the individuals preparing the estimates. The data for a given reservoir may change substantially over time as a result of numerous factors, including additional development activity, evolving production history and continual reassessment of the viability of production under varying economic conditions. Changes in oil and natural gas prices, operating costs and expected performance from a given reservoir also will result in revisions to the amount of our estimated proved reserves.
Our proved reserve estimates are a function of many assumptions, all of which could deviate significantly from actual results. As such, reserve estimates may materially vary from the ultimate quantities of natural gas, natural gas liquids and oil eventually recovered.
Revenue and Cost of Goods Sold Recognition. In our Midstream Business, we record revenue and cost of goods sold on the gross basis for those transactions where we act as the principal and take title to natural gas, NGLs or condensates that is purchased for resale. When our customers pay us a fee for providing a service such as gathering, treating or transportation we record the fees separately in revenues.
Risk Management Activities. We have structured our hedging activities in order to minimize our commodity pricing and interest rate risks and to help maintain compliance with certain financial covenants in our revolving credit facility. These hedging activities rely upon forecasts of our expected operations and financial structure over the next few years. If our operations or financial structure are significantly different from these forecasts, we could be subject to adverse financial results as a result of these hedging activities. We mitigate this potential exposure by retaining an operational cushion between our forecasted transactions and the level of hedging activity executed. Based on the production estimates in our current forecast, we have hedged approximately 88% of our expected hedgeable crude, condensate and natural gas liquids (heavier than propane) and 96% of our expected hedgeable natural gas and ethane production through 2010. Similarly, based on the production estimates in our current forecast, we have hedged approximately 63% of our 2011 expected hedgeable crude, condensate and natural gas liquids (heavier than propane) volumes and 73% of our natural gas and ethane production.
From the inception of our hedging program, we used mark-to-market accounting for our commodity hedges and interest rate swaps. There were no derivatives for the periods before September 30, 2005. We record monthly realized gains and losses on hedge instruments based upon cash settlements information. The settlement amounts vary due to the volatility in the commodity market prices throughout each month. We also record unrealized gains and losses monthly based upon the future value on mark-to-market hedges through their expiration dates. The expiration dates vary but are currently no later than December 2012 for our interest rate hedges and for our commodity hedges. Option premiums and costs incurred to reset contract prices or purchase swaps are amortized during the contract period through the unrealized risk management instruments in total revenue. We monitor and review hedging positions regularly.
Depreciation and Depletion Expense and Cost Capitalization Policies. Our midstream assets consist primarily of natural gas gathering pipelines and processing plants. We capitalize all construction-related direct labor and material costs, as well as indirect construction costs. Indirect construction costs include general engineering and the costs of funds used in construction. The cost of funds used in construction represents capitalized interest. These costs are then expensed over the life of the constructed asset through the recording of depreciation expense.
As discussed in Note 2 to our consolidated financial statements included in Part II, Item 8. Financial Statements and Supplementary Data starting on page F-1 of this Annual Report, depreciation of our midstream assets is generally computed using the straight-line method over the estimated useful life of the assets. The costs of renewals and betterments which extend the useful life of property, plant and equipment are also capitalized. The costs of repairs, replacements and maintenance projects are expensed as incurred.
The computation of depreciation expense requires judgment regarding the estimated useful lives and salvage value of assets. As circumstances warrant, depreciation estimates are reviewed to determine if any changes are needed. Such changes could involve an increase or decrease in estimated useful lives or salvage values which would impact future depreciation expense.
Impairment of Long-Lived Assets. We assess our long-lived assets for impairment based on authoritative guidance. A long-lived asset is tested for impairment whenever events or changes in circumstances indicate its carrying amount may exceed its fair value. Fair values are based on the sum of the undiscounted future cash flows expected to result from the use and eventual disposition of the assets.
Examples of long-lived asset impairment indicators include:
| | • | a significant decrease in the market price of a long-lived asset or asset group; |
| | • | a significant adverse change in the extent or manner in which a long-lived asset or asset group is being used or in its physical condition; |
| | • | a significant adverse change in legal factors or in the business climate could affect the value of a long-lived asset or asset group, including an adverse action or assessment by a regulator which would exclude allowable costs from the rate-making process; |
| | • | an accumulation of costs significantly in excess of the amount originally expected for the acquisition or construction of a long-lived asset or asset group; |
| | • | a current-period operating cash flow loss combined with a history of operating cash flow losses or a projection or forecast that demonstrates continuing losses associated with the use of a long-lived asset or asset group; and |
| | • | a current expectation that, more likely than not, a long-lived asset or asset group will be sold or otherwise disposed of significantly before the end of its previously estimated useful life. |
During the year ended December 31, 2009, we incurred impairment charges of $13.7 million in our Midstream segment as a result of reduced throughput volumes as our producer customers curtailed their drilling activity in response to lower natural gas prices. During the year ended December 31, 2008, the Partnership recorded an impairment charge related to certain processing plants, pipelines and contracts in its Midstream business of $35.1 million due to the substantial decline in commodity prices in the fourth quarter as well as declining drilling activity by its producer customers.
Goodwill Impairment. We assess our goodwill for impairment annually or whenever events indicate impairment may have occurred based on authoritative guidance. We performed our annual assessment in May 2008 and no impairment was evident at that point in time. As a result of the impairment charge recorded in our Upstream Segment, we performed an assessment of our goodwill during the fourth quarter and recorded an impairment charge of $31.0 million, or our entire goodwill balance, during the fourth quarter of 2008.
Environmental Remediation. Current accounting guidelines require us to recognize a liability and expense associated with environmental remediation if (i) government agencies mandate such activities or one of our properties were added to the Comprehensive Environmental Response, Compensation and Liability Act (CERCLA) database, (ii) the existence of a liability is probable and (iii) the amount can be reasonably estimated. As of December 31, 2009, we have recorded a $4.4 million liability for remediation expenditures. If governmental regulations change, we could be required to incur additional remediation costs which may have a material impact on our profitability. Accrued environmental costs represent our best estimate as to the total costs of remediation and the time period over which these costs will be incurred.
Asset Retirement Obligations. Eagle Rock has recorded liabilities of $19.8 million for future asset retirement obligations in its midstream and upstream operations. Related accretion expense has been recorded in operating expenses, as discussed in Note 5 to our consolidated financial statements included in Part II, Item 8. Financial Statements and Supplementary Data starting on page F-1 of this Annual Report. The recognition of an asset retirement obligation requires that management make numerous estimates, assumptions and judgments regarding such factors as costs of remediation, timing of settlements, the credit-adjusted risk-free rate to be used and inflation rates. In periods subsequent to initial measurement of the asset retirement obligation, we must recognize period-to-period changes in the liability resulting from changes in the timing of settlement to changes in the estimate of the costs of remediation. Any such changes that result in upward or downward revisions in the estimated obligation will result in an adjustment to the related capitalized asset and corresponding liability on a prospective basis and an adjustment in our DD&A expense in future periods.
Presentation of Financial Information
For a description of the presentation of our financial information in this report, please see Part II, Item 6. Selected Financial Data.
Year Ended December 31, 2009 Compared with Year Ended December 31, 2008
Summary of Consolidated Operating Results
Below is a table of a summary of our consolidated operating results for the years ended December 31, 2009 and December 31, 2008. Operating results for our individual operating segments are presented in tables in this Item 7.
| | | | | | | |
| | | Year Ended December 31, | |
| | | 2009 | | | 2008 | |
| | | ($ in thousands) | |
| Revenues: | | | | | | |
| Sales of natural gas, NGLs, oil, condensate and sulfur | | $ | 653,712 | | | $ | 1,233,919 | |
Gathering, compression, processing and treating fees | | | 45,476 | | | | 38,871 | |
| Minerals and royalty income | | | 15,708 | | | | 42,994 | |
| Realized commodity derivative gains (losses) | | | 83,300 | | | | (46,059 | ) |
| Unrealized commodity derivative (losses) gains | | | (189,590 | ) | | | 207,824 | |
| Other | | | 1,858 | | | | 716 | |
| Total revenues | | | 610,464 | | | | 1,478,265 | |
| Cost of natural gas and natural gas liquids | | | 488,230 | | | | 891,433 | |
| | | | | | | | | |
| Costs and expenses: | | | | | | | | |
| Operating and maintenance (b) | | | 73,196 | | | | 73,620 | |
| Taxes and other income | | | 12,047 | | | | 19,936 | |
General and administrative | | | 46,188 | | | | 45,701 | |
| Other operating (income) expense | | | (3,552 | ) | | | 10,699 | |
| Depreciation, depletion and amortization | | | 116,262 | | | | 116,754 | |
Impairment expense | | | 22,062 | | | | 143,857 | |
| Goodwill impairment expense | | | — | | | | 30,994 | |
Total costs and expenses | | | 266,203 | | | | 441,561 | |
| Total operating (loss) income | | | (143,969 | ) | | | 145,271 | |
| Other income (expense): | | | | | | | | |
Interest income | | | 188 | | | | 793 | |
| Other income | | | 2,328 | | | | 5,328 | |
| Interest expense | | | (21,591 | ) | | | (32,884 | ) |
| Unrealized interest rate derivatives gains (losses) | | | 12,529 | | | | (27,717 | ) |
Realized interest rate derivative losses | | | (18,876 | ) | | | ( 5,214 | ) |
Other expense | | | (1,070 | ) | | | (955 | ) |
Total other income (expense) | | | (26,492 | ) | | | (60,649 | ) |
| (Loss) income from continuing operations before income taxes | | | (170,461 | ) | | | 84,622 | |
| Income tax (benefit) provision | | | 1,087 | | | | (1,134 | ) |
| (Loss) income from continuing operations | | | (171,548 | ) | | | 85,756 | |
| Discontinued operations | | | 290 | | | | 1,764 | |
Net (loss) income | | $ | (171,258 | ) | | $ | 87,520 | |
Adjusted EBITDA(a) | | $ | 188,583 | | | $ | 248,286 | |
| (a) | See Part II, Item 6. Selected Financial Data – Non-GAAP Financial Measures for a definition and reconciliation to GAAP. |
| (b) | Includes costs to dispose of sulfur in our Upstream segment of $2.2 million for the year ended December 31, 2009. |
Midstream Business (Four Segments)
Texas Panhandle Segment
| | | | | | | |
| | | Twelve Months Ending December 31, | |
| | | 2009 | | | 2008 | |
| | | ($ in thousands, except for realized prices) | |
| Revenues: | | | | | | |
| Sales of natural gas, NGLs, oil and condensate | | $ | 282,916 | | | $ | 592,997 | |
| Gathering and treating services | | | 11,036 | | | | 10,069 | |
| Total revenues | | | 293,952 | | | | 603,066 | |
| Cost of natural gas and natural gas liquids | | | 206,985 | | | | 459,064 | |
| Operating costs and expenses: | | | | | | | | |
| Operations and maintenance | | | 31,873 | | | | 34,269 | |
| Depreciation and amortization | | | 46,085 | | | | 43,688 | |
| Total operating costs and expenses | | | 77,958 | | | | 77,957 | |
| Operating income | | $ | 9,009 | | | $ | 66,045 | |
| | | | | | | | | |
| Capital expenditures | | $ | 7,293 | | | $ | 30,738 | |
| | | | | | | | | |
| Realized prices: | | | | | | | | |
| Oil and condensate (per Bbl) | | $ | 60.14 | | | $ | 94.27 | |
| Natural gas (per Mcf) | | $ | 3.23 | | | $ | 7.44 | |
| NGLs (per Bbl) | | $ | 33.45 | | | $ | 58.34 | |
| Production volumes: | | | | | | | | |
Gathering volumes (Mcf/d)(a) | | | 138,450 | | | | 151,964 | |
NGLs (net equity gallons) | | | 46,376,433 | | | | 51,351,966 | |
Condensate (net equity gallons) | | | 35,292,388 | | | | 35,162,578 | |
Natural gas short position (MMbtu/d)(a) | | | (6,010 | ) | | | (5,607 | ) |
| (a) | Gathering volumes (Mcf/d) and natural gas short position (MMbtu/d) are calculated by taking the total volume and then dividing by the number of days in the respective period. |
Revenue and Cost of Natural Gas and Natural Gas Liquids. For the year ended December 31, 2009, the revenues minus cost of natural gas and natural gas liquids for our Texas Panhandle Segment operations totaled $87.0 million compared to $144.0 million for the year ended December 31, 2008. There were two primary contributors to this decrease: (i) lower NGL and condensate pricing, as compared to pricing in 2008, and (ii) lower NGL equity production as compared to production in 2008. The lower NGL equity production was primarily due to approximately 9% lower gathered volumes in 2009 as compared to 2008 and due to operating certain plants in ethane rejection mode for much of the first two months of 2009. Ethane rejection operations occur when we elect to not recover the ethane component in the natural gas stream in our plants and instead choose to leave the ethane component in the residue gas stream sold at the tailgates of our plants. Ethane rejection operations result in a lower volume of equity NGLs with a correspondingly smaller natural gas short position. We operate in this manner when the value of ethane is worth more in the gas stream than as a separate product.
The lower gathering volumes during the twelve months ended December 31, 2009 compared to the same period in the prior year were due to natural declines in the underlying existing wells in addition to reduced drilling activity during 2009. The dramatic fall in commodity prices experienced in the latter part of 2008 and continuing throughout into 2009 has resulted in many of our producer customers significantly reducing drilling activity in the Texas Panhandle, presumably not to be resumed until commodity prices rise to levels which justify drilling. While oil prices have recovered from the lows seen in the three months ended March 31, 2009, natural gas prices have improved during the fourth quarter of 2009; however, not to levels that have caused our producers to increase drilling activity back to the 2008 levels.
Our Texas Panhandle Segment primarily covers ten counties in Texas and consists of our East Panhandle System and our West Panhandle System. The drilling activity in the West Panhandle System is not sufficient to offset the natural declines experienced on this system. While our contract mix in the West Panhandle System provides us with a higher equity share of the production, the overall decline will continue and we expect to recover smaller equity production in the future on the West Panhandle System.
The East Panhandle System experienced growth in volumes and equity production due to the active Granite Wash drilling play located in Roberts, Hemphill and Wheeler Counties, Texas through much of 2008; however, due to lower commodity values during the fourth quarter of 2008 continuing through the twelve months of 2009, we experienced a significant decline in drilling activity in this area.
Recent drilling by the largest operators in the Granite Wash play, utilizing horizontal drilling technologies, has resulted in initial natural gas production rates of 6 MMcf/d. These operators believe the economics of the Granite Wash play will be significantly enhanced due to the fewer number of wells and lower capital required to develop the same amount of acreage versus conventional vertical drilling results. We have extensive gathering and processing facilities in Roberts and Hemphill Counties, Texas and long term acreage dedications from several of the larger producers. We believe the Partnership will benefit in the future due to the application of this technology in the Granite Wash play with increased natural gas and condensate production in the East Panhandle System.
The liquids content of the natural gas is lower in the East Texas Panhandle System and our contract mix provides us with a smaller share of equity production as compared to the West Panhandle System. At the current lower drilling activity in the East Panhandle System we would be unable to offset the continued decline on the West Panhandle System of NGL and condensate equity gallons. Our current goal is to aggressively contract for new volumes in the East Panhandle System to offset the decline in volumes and our share of equity production in the West Panhandle System.
Operating Expenses. Operating expenses, including taxes other than income, for the year ended December 31, 2009 were $31.9 million compared to $34.3 million for the year ended December 31, 2008. The major items impacting the $2.4 million decrease in operating expenses for the year ended December 31, 2009 were was primarily due to overall cost reduction initiatives implemented by the Partnership across the segment.
Depreciation and Amortization. Depreciation and amortization expenses for the year ended December 31, 2009 were $46.1 million compared to $43.7 million for the year ended December 31, 2008. The major item impacting the $2.4 million decrease was depreciation expense associated with the capital expenditures placed into service during the period.
Capital Expenditures. Capital expenditures for the year ended December 31, 2009 were $7.3 million as compared to $30.7 million for the year ended December 31, 2008. We classify capital expenditures as either maintenance capital (which represents routine well connects and capitalized maintenance activities) or as growth capital (which represents organic growth projects). In the year ended December 31, 2009, growth capital represented 39% of our capital expenditures as compared to 70%, respectively, in the year ended December 31, 2008. The decrease in capital expenditures of $23.4 million was driven by reduced maintenance capital associated with fewer new well connects due to the lower drilling activity and by less growth capital due to expenditures related to our Stinnett – Cargray plant consolidation project having occurred in the year ended December 31, 2008.
East Texas/Louisiana Segment
| | | Twelve Months Ending December 31, | |
| | | 2009 | | | 2008(b) | |
| | | ($ in thousands, except for realized prices) | |
| Revenues: | | | | | | |
Sales of natural gas, NGLs, oil and condensate | | $ | 181,550 | | | $ | 298,720 | |
Gathering and treating services | | | 27,968 | | | | 23,320 | |
Total revenues | | | 209,518 | | | | 322,040 | |
Cost of natural gas and natural gas liquids | | | 162,957 | | | | 269,030 | |
| Operating costs and expenses: | | | | | | | | |
Operations and maintenance | | | 17,985 | | | | 16,569 | |
Depreciation and amortization | | | 17,188 | | | | 13,559 | |
Impairment | | | 5,941 | | | | 26,994 | |
Total operating costs and expenses | | | 41,114 | | | | 57,122 | |
Operating income (loss) | | $ | 5,447 | | | $ | (4,112 | ) |
| | | | | | | | | |
Capital expenditures | | $ | 18,188 | | | $ | 17,391 | |
| | | | | | | | | |
| Realized prices: | | | | | | | | |
Oil and condensate (per Bbl) | | $ | 63.34 | | | $ | 101.62 | |
Natural gas (per Mcf) | | $ | 3.83 | | | $ | 8.75 | |
NGLs (per Bbl) | | $ | 35.87 | | | $ | 54.66 | |
| Production volumes: | | | | | | | | |
Gathering volumes (Mcf/d)(a) | | | 248,597 | | | | 198,365 | |
NGLs (net equity gallons) | | | 19,924,820 | | | | 27,038,450 | |
Condensate (net equity gallons) | | | 2,381,123 | | | | 1,580,928 | |
Natural gas short position (MMbtu/d)(a) | | | 2,851 | | | | 1,427 | |
| (a) | Gathering volumes (Mcf/d) and natural gas short position (MMbtu/d) are calculated by taking the total volume and then dividing by the number of days in the respective period. |
| (b) | Includes operations related to the Millennium Acquisition starting on October 1, 2008. |
Revenue and Cost of Natural Gas and Natural Gas Liquids. For the year ended December 31, 2009, revenues minus cost of natural gas and natural gas liquids for our East Texas/Louisiana Segment totaled $46.6 million compared to $53.0 million for the year ended December 31, 2008.
The Millennium Acquisition positively impacted the East Texas/Louisiana Segment’s revenue minus cost of natural gas and natural gas liquids by $15.3 million during the year ended December 31, 2009. Our lower NGL equity gallons for 2009 were primarily due to operating the facilities in ethane rejection mode during much of the first two months of 2009. Ethane rejection mode is when we elect to not recover the ethane component in the natural gas stream in our plants and instead choose to leave the ethane component in the residue gas stream sold at the tailgates of our plants. We operate in this manner when the value of ethane is worth more in the gas stream than as a separate product.
We were negatively impacted by lower NGL and condensate pricing during 2009 as compared to 2008. We were positively impacted by 38% growth in gathering volume during 2009 compared to 2008 due to the Millennium Acquisition. Other East Texas/Louisiana Segment gathering systems realized a reduction in volumes. Excluding the Millennium Acquisition, our gathering volumes decreased by 11%. The offsetting reduction in higher margin gas volumes is being replaced with lower margin, fixed fee volumes from the Millennium Acquisition. The gas volumes from the Millennium Acquisition are comprised primarily of dry gas that does not require processing to remove NGLs prior to delivery to the interstate pipelines in order to meet the pipelines’ gas quality tariff requirements. The lower margin gas, though contributing to a significant increase in overall gathered volumes, has not offset the lower revenues and margins due to the lower NGL, condensate and natural gas prices during 2009 as compared to the same time period in 2008. During the last three months of 2008 and continuing into 2009, we saw a significant reduction in our customer’s drilling activity due to lower commodity values.
During the month of September 2009, two producers curtailed their gas production due to low natural gas prices by a total of approximately 17,500 Mcf/d for the month delivered to the Brookeland Plant and Tyler County gathering system. As of December 31, 2009, no production remains curtailed due to natural gas prices.
Operating Expenses. Operating expenses for the year ended December 31, 2009 were $18.0 million compared to $16.6 million for the year ended December 31, 2008. The major item impacting the $1.4 million increase in operating expense for 2009 was due to expenses associated with operating the assets acquired as part of the Millennium Acquisition. The year ended December 31, 2009 includes twelve months of activity for the assets acquired as part of the Millennium Acquisition compared to three months in the year ended December 31, 2008. Excluding operating expenses related to the assets acquired as part of the Millennium Acquisition, operating expenses were relatively flat for 2009 as compared to the same period in 2008.
Depreciation and Amortization. Depreciation and amortization expenses for the year ended December 31, 2009 were $17.2 million compared to $13.6 million for the year ended December 31, 2008. The major items impacting the $3.6 million increase were (i) twelve months of depreciation and amortization of the assets acquired as part of Millennium Acquisition and (ii) depreciation expense associated with the capital expenditures placed into service. These increases were offset by an adjustment of $0.9 million recorded during the three months ended June 30, 2009 to correct an overstatement of depreciation expense in a prior period.
Impairment. During the year ended December 31, 2009, we incurred impairment charges of $5.9 million in our Midstream segment as a result of reduced throughput volumes as our producer customers curtailed their drilling activity in response to lower natural gas prices. During the year ended December 31, 2008, the Partnership recorded an impairment charge related to certain processing plants, pipelines and contracts in its Midstream business of $27.0 million due to the substantial decline in commodity prices in the fourth quarter as well as declining drilling activity by its producer customers.
Capital Expenditures. Capital expenditures for the year ended December 31, 2009 were $18.2 million compared to $17.4 million for the year ended December 31, 2008. During 2009, of our capital spending in this segment, we spent $10.8 million on growth capital and $7.4 million on maintenance capital. We classify capital expenditures as either maintenance capital, which represents routine well connects and capitalized maintenance activities, or as growth capital, which represents organic growth projects. Our increase in capital spending for 2009 is due primarily to the construction of gathering lines to producers in the Brookeland and Tyler County gathering systems.
South Texas Segment
| | | Twelve Months Ending December 31, | |
| | | 2009 | | | 2008(b) | |
| | | ($ in thousands, except for realized prices) | |
| Revenues: | | | | | | |
Sales of natural gas, NGLs, oil and condensate | | $ | 94,691 | | | $ | 168,922 | |
Gathering and treating services | | | 5,608 | | | | 4,779 | |
Other | | | 3 | | | | 15 | |
Total revenues | | | 100,302 | | | | 173,716 | |
Cost of natural gas and natural gas liquids | | | 91,916 | | | | 161,963 | |
| Operating costs and expenses: | | | | | | | | |
Operations and maintenance | | | 3,661 | | | | 2,924 | |
Depreciation and amortization | | | 5,324 | | | | 4,428 | |
Impairment | | | 7,733 | | | | 8,105 | |
Total operating costs and expenses | | | 16,718 | | | | 15,457 | |
Operating income (loss) from continuing operations | | | (8,332 | ) | | | (3,704 | ) |
Discontinued operations | | | 290 | | | | 1,782 | |
Operating income (loss) | | $ | (8,042 | ) | | $ | (1,922 | ) |
| | | | | | | | | |
Capital expenditures | | $ | 69 | | | $ | 1,145 | |
| | | | | | | | | |
| Realized prices: | | | | | | | | |
Oil and condensate (per Bbl) | | $ | 50.83 | | | $ | 92.10 | |
Natural gas (per Mcf) | | $ | 3.76 | | | $ | 8.99 | |
NGLs (per Bbl) | | $ | 32.26 | | | $ | 52.66 | |
| Production volumes: | | | | | | | | |
Gathering volumes (Mcf/d)(a) | | | 83,307 | | | | 88,488 | |
NGLs (net equity gallons) | | | 1,248,783 | | | | 591,683 | |
Condensate (net equity gallons) | | | 1,443,060 | | | | 1,821,800 | |
Natural gas short position (MMbtu/d)(a) | | | 902 | | | | 500 | |
| (a) | Gathering volumes (Mcf/d) and natural gas short position (MMbtu/d) are calculated by taking the total volume and then dividing by the number of days in the respective period. |
| (b) | Includes operations related to the Millennium Acquisition starting on October 1, 2008. |
Revenue and Cost of Natural Gas and Natural Gas Liquids. During the year ended December 31, 2009 the South Texas Segment contributed revenues minus cost of natural gas and natural gas liquids of $8.4 million, as compared to $11.8 million for the year ended December 31, 2008. We were negatively impacted by lower NGL, natural gas and condensate pricing during 2009 as compared to the same period in 2008. This decline was partially offset by the impact of the assets acquired as part of the Millennium Acquisition which contributed revenue minus cost of natural gas and natural gas liquids of $3.7 million during 2009.
Operating Expenses. Operating expenses for the year ended December 31, 2009 were $3.7 million, as compared to $2.9 million for the year ended December 31, 2008. The major item impacting the $0.7 million increase in operating expense was the additional expenses associated with operating the assets acquired as part of the Millennium Acquisition.
Depreciation and Amortization. Depreciation and amortization expenses for the year ended December 31, 2009 were $5.3 million, as compared to $4.4 million for the year ended December 31, 2008. Depreciation and amortization increased due to depreciation and amortization associated with the assets acquired as part of the Millennium Acquisition.
Impairment. During the year ended December 31, 2009, we incurred impairment charges of $7.7 million in our Midstream segment as a result of reduced throughput volumes as our producer customers curtailed their drilling activity in response to lower natural gas prices. During the year ended December 31, 2008, the Partnership recorded an impairment charge related to certain processing plants, pipelines and contracts in its Midstream business of $8.1 million due to the substantial decline in commodity prices in the fourth quarter as well as declining drilling activity by its producer customers.
Capital Expenditures. Capital expenditures for the year ended December 31, 2009 were $0.1 million as compared to $1.1 million for the year ended December 31, 2008. During the year ended December 31, 2009, we spent $0.1 million on maintenance capital. The decrease in capital expenditures in 2009 compared to 2008 was the result of a reduction in drilling activity during 2009.
Discontinued Operations. On April 1, 2009, we sold our producer services line of business, and thus have retrospectively classified the revenues minus the cost of natural gas and natural gas liquids as discontinued operations. During the year ended December 31, 2009, this business generated revenues of $19.2 million and cost of natural gas and natural gas liquids of $18.9 million, as compared to revenues of $265.1 million and cost of natural gas and natural gas liquids of $263.3 million during the year ended December 31, 2008.
Gulf of Mexico Segment
| | | Twelve Months Ending December 31, | |
| | | 2009 | | | 2008(b) | |
| | | ($ in thousands, except for realized prices) | |
| Revenues: | | | | | | |
Sales of natural gas, NGLs, oil and condensate | | $ | 31,161 | | | $ | 952 | |
Gathering and treating services | | | 864 | | | | 703 | |
Other | | | 1,616 | | | | | |
Total revenues | | | 33,641 | | | | 1,655 | |
Cost of natural gas and natural gas liquids | | | 26,372 | | | | 1,376 | |
| Operating costs and expenses: | | | | | | | | |
Operations and maintenance | | | 1,907 | | | | 605 | |
Depreciation and amortization | | | 6,576 | | | | 1,521 | |
Total operating costs and expenses | | | 8,483 | | | | 2,126 | |
Operating loss | | $ | (1,214 | ) | | $ | (1,847 | ) |
| | | | | | | | | |
| | | | | | | | | |
| Capital Expenditures | | $ | 358 | | | | — | |
| | | | | | | | | |
| Realized average prices: | | | | | | | | |
Oil and condensate (per Bbl) | | $ | 59.11 | | | $ | — | |
Natural gas (per Mcf) | | $ | 4.64 | | | $ | 6.64 | |
NGLs (per Bbl) | | $ | 35.52 | | | $ | 20.58 | |
| Production volumes: | | | | | | | | |
Gathering volumes (Mfc/d)(a) | | | 116,492 | | | | 12,014 | |
NGLs and condensate (net equity gallons) | | | 5,768,018 | | | | 176,962 | |
| (a) | Gathering volumes (Mcf/d) and natural gas short position (MMbtu/d) are calculated by taking the total volume and then dividing by the number of days in the respective period. |
| (b) | Includes operations related to the Millennium Acquisition starting on October 1, 2008. |
Revenues and Cost of Natural Gas and Natural Gas Liquids. The Gulf of Mexico Segment was a new segment and new area of operations for us in 2008. We entered into this segment as a result of the Millennium Acquisition, effective October 1, 2008. During the year ended December 31, 2009, the Gulf of Mexico Segment contributed $7.3 million in revenues minus cost of natural gas and natural gas liquids compared to $0.3 million in the year ended December 31, 2008. As a result of damage inflicted by Hurricanes Gustav and Ike in August 2008 and September 2008, respectively, the Yscloskey plant did not come back online until mid-January 2009 and the North Terrebonne plant did not come back online until mid-November 2008. We received a partial payment of approximately $1.6 million for business interruption caused by Hurricanes Gustav and Ike which we recognized as other revenue during the three months ended June 30, 2009.
Operating Expenses. Operating expenses for the year ended December 31, 2009 were $1.9 million compared to $0.6 million in the year ended December 31, 2008. We continued to incur operating expenses associated with the Yscloskey and North Terrebonne plants while the plants were undergoing repair for the hurricane damage. We also incurred costs for the repair of the two plants. Such costs were recovered from the escrow account established pursuant to the Millennium Acquisition purchase and sale agreement. As a result and pursuant to the agreement, any insurance proceeds received for repair costs will be deposited into the escrow account. During 2009, we received payment from the Millennium Acquisition escrow of the remaining $0.3 million in cash and continued canceling common units held in escrow to satisfy additional claims.
Depreciation and Amortization. Depreciation and amortization expenses for in the year ended December 31, 2009 were $6.6 million compared to $1.5 million for the three months in 2008 that we owned the assets acquired in the Millennium Acquisition.
Capital Expenditures. Capital expenditures for 2009 for the Gulf of Mexico Segment were $0.4 million. We did not incur any capital expenditures related to the Gulf of Mexico Segment in 2008.
Upstream Segment
| | | Twelve Months Ending December 31, |
| | | 2009 | | | 2008 (a) | | |
| | | (Amounts in thousands, except volumes and realized prices) |
| Revenues: | | | | | | | |
Oil and condensate | | $ | 35,316 | | | $ | 72,526 | |
Sulfur | | | — | | | | 37,759 | |
Natural gas (b) | | | 12,021 | | | | 32,513 | |
NGLs | | | 16,057 | | | | 29,530 | |
Other | | | 239 | | | | 701 | |
Total revenues | | | 63,633 | | | | 173,029 | |
| Operating Costs and expenses: | | | | | | | | | |
Operations and maintenance(d) | | | 28,536 | | | | 37,481 | |
Other operating expense | | | (3,552 | ) | | | — | |
Depletion, depreciation and amortization | | | 34,009 | | | | 44,997 | |
Impairment | | | 8,114 | | | | 107,017 | |
Goodwill impairment | | | — | | | | 30,994 | |
Total operating costs and expenses | | | 67,107 | | | | 220,489 | |
Operating income | | $ | (3,474 | ) | | $ | (47,460 | ) |
| | | | | | | | | | |
Capital expenditures | | $ | 8,437 | | | $ | 20,655 | |
| | | | | | | | | | |
| Realized average prices (e): | | | | | | | | | |
Oil and condensate (per Bbl) | | $ | 45.30 | | | $ | 87.04 | |
Natural gas (per Mcf) (c) | | $ | 3.69 | | | $ | 8.09 | |
NGLs (per Bbl) | | $ | 31.90 | | | $ | 61.39 | |
Sulfur (per Long ton) | | $ | — | | | $ | 359,96 | |
| Production volumes (e): | | | | | | | | | |
Oil and condensate (Bbl) | | | 811,075 | | | | 823,316 | |
Natural gas (Mcf) | | | 3,659,431 | | | | 4,117,247 | |
NGLs (Bbl) | | | 504,669 | | | | 480,450 | |
Total (Mcfe) | | | 11,553,895 | | | | 11,939,843 | |
Sulfur (Long ton) | | | 119,812 | | | | 104,613 | |
| (a) | Includes operations from the Stanolind Acquisition effective May 1, 2008. |
| (b) | Revenues include a change in the value of product imbalances of $1,505 and $841 for the years ended December 31, 2009 and 2008, respectively. |
| (c) | Calculation does not include impact of product imbalances. |
| (d) | Includes costs to dispose of sulfur in our Upstream segment of $2.2 million for the year ended December 31, 2009. |
| (e) | Volumes and realized prices for the year ended December 31, 2008 have been adjusted from prior reported amounts for a reallocation which was recorded in December 2009. |
Revenue. For the year ended December 31, 2009, the Upstream Segment contributed $63.6 million of revenue as compared to $173.0 million for the year ended December 31, 2008. The decrease in revenue was due to substantially lower realized prices for oil, natural gas, NGLs and sulfur and the non-cash mark-to-market of product imbalances, partially offset by an additional four months of operations related to the assets acquired in the Stanolind Acquisition. During 2009, production averaged 10.3 MMcf/d of natural gas, 2.2 MBO/d of oil and condensate, 1.4 MB/d of NGL’s and 328 LT/d of sulfur. The period included twelve months of production from the assets acquired in the Stanolind Acquisition which averaged 812 Boe/d. During 2009, the Big Escambia Creek (BEC) plant experienced reduced oil, residue gas and NGL sales due to unanticipated repairs and overhauls to the plant’s residue gas compressors. Sales of oil, residue gas and NGLs from BEC, Flomaton and Fanny Church fields were curtailed for 60 days, during 2009 associated with the compressors’ downtime. The reduced production during these periods negatively impacted Upstream revenues by approximately $2.6 million.
During 2009, the cost to dispose sulfur exceeded the sales price by $2.2 million compared to revenue of $37.8 million during 2008. Historically, sulfur was viewed as a low value by-product in the production of oil and natural gas. Due to an increase in demand in the global fertilizer market during the first nine months of 2008, the price per long ton (before effects of net-backs) peaked at over $600 at the Tampa, Florida market in September 2008. Deterioration in the sulfur market during 2009 has caused the price at the Tampa, Florida market to decline to a range of $0 to $30 per long ton. Currently in the first quarter 2010, the Tampa, Florida sulfur market has improved to $90 per long ton.
Operating Expenses. Operating expenses, including severance and ad valorem taxes, totaled $28.5 million for the Upstream Segment during the year ended December 31, 2009, as compared to $37.5 million for the year ended December 31, 2008. The operating expenses include twelve months of expenses related to the assets acquired in the Stanolind Acquisition during 2009 compared to only eight months for the same period in 2008. The decrease in operating expense can be attributed to lower well workover expense incurred during 2009 as compared to the same period in the prior year and additional expenses being incurred during 2008 due to the turnaround at the BEC treating facility in April 2008. The decrease during 2009 is also due to a reversal of $1.6 million in environmental reserves determined to no longer be necessary as well as a credit of $0.7 million for overbilling related to a non-operated asset.
Depletion, Depreciation and Amortization. Depletion, depreciation and amortization expense for the year ended December 31, 2009 was $34.0 million, as compared to $45.0 million for the year ended December 31, 2008. The decrease for 2009 compared to the comparable period in 2008 is due to the decrease in our depletable base as a result of the impairment charges we incurred during the last three months of fiscal year 2008. This decrease was partially offset by the depletion expense related to the assets added through the Stanolind Acquisition for 2009 compared to only eight months during the same period in 2008 and the curtailed production during 2008 due to the turnaround at the BEC treating facility in April 2008.
Other Operating Income. Other operating income for the year ended December 31, 2009, includes income of $3.6 million due to the recovery of $2.2 million of assets previously written off and the release of $1.4 million of liabilities assumed as part of our purchase price allocation for our acquisitions of Escambia Asset Co. LLC and Redman Energy Holdings, L.P. During the period, we received additional information about collectability of these assets and determined that we no longer had any obligation under these liabilities.
Impairment. During the year ended December 31, 2009, we incurred impairment charges of $8.1 million in our Upstream Segment, of which, $7.9 million was a result of a decline in natural gas prices, production declines and lower natural gas liquids yields at our Flomaton field and $0.2 million in other fields due to lower natural gas prices. During the year ended December 31, 2008, we incurred impairment charges related to certain fields of $107.0 million due to the substantial decline in commodity prices during the fourth quarter of 2008. As a result of the impairment charge in the year ended December 31, 2008, we assessed our goodwill balance for impairment and recorded an impairment charge to goodwill of $31.0 million.
Capital Expenditures. The Upstream Segment’s maintenance capital expenditures for the year ended December 31, 2009 totaled $8.4 million compared $20.7 million for the year ended December 31, 2008. We did not incur any growth capital expenditures during 2009 or 2008. The maintenance capital expenditures during 2009 were associated with compressor overhauls at the BEC and Flomaton treating facilities and well completions, recompletions, workovers, equipping and leasing activities. The higher maintenance capital expenditures in 2009 were related primarily to a planned turnaround at our Big Escambia Creek (“BEC”) facility.
Minerals Segment
| | | Twelve Months Ending December 31, | |
| | | 2009 | | | 2008 | |
| | | (Amounts in thousands, except volumes and realized prices) | |
| Revenues: | | | | | | |
Oil and condensate | | $ | 9,004 | | | $ | 14,337 | |
| Natural gas | | | 3,854 | | | | 10,451 | |
NGLs | | | 582 | | | | 1,376 | |
| Lease bonus, rentals and other | | | 2,268 | | | | 16,830 | |
| Total revenues | | | 15,708 | | | | 42,994 | |
| Operating Costs and expenses: | | | | | | | | |
Operating | | | 1,281 | | | | 1,708 | |
| Depreciation and depletion | | | 6,007 | | | | 7,774 | |
Impairment | | | 274 | | | | 1,741 | |
| Total operating costs and expenses | | | 7,562 | | | | 11,223 | |
| Operating income | | $ | 8,146 | | | $ | 31,771 | |
| | | | | | | | | |
| Realized average prices: | | | | | | | | |
| Oil and condensate (per Bbl) | | $ | 56.97 | | | $ | 91.83 | |
| Natural gas (per Mcf) | | $ | 3.15 | | | $ | 8.18 | |
| NGLs (per Bbl) | | $ | 28.53 | | | $ | 52.32 | |
| Production volumes: | | | | | | | | |
| Oil and condensate (Bbl) | | | 158,041 | | | | 156,118 | |
| Natural gas (Mcf) | | | 1,225,339 | | | | 1,277,046 | |
| NGLs (Bbl) | | | 20,403 | | | | 26,298 | |
| Total (Mcfe) | | | 2,296,003 | | | | 2,371,542 | |
Revenue. For the year ended December 31, 2009 our revenue was $15.7 million compared to $43.0 million for the year ended December 31, 2008. The decrease in revenue was due to decreases in commodity prices and lower production volumes as well as much lower bonus income due to the reduced leasing activity in 2009 as compared to 2008. In addition, during 2009, our natural gas production volumes and related revenues were negatively impacted by approximately 37,000 Mcf due to a correction by an operator of the Fruitland Coal field, in which we hold mineral interests.
One of the distinctive characteristics of our large, diversified mineral position is that operators are continually conducting exploration and development drilling, recompletion, and workover operations on our interests; in our minerals segment, we refer to this phenomenon as “regeneration.” We do not pay for these operations, but we do receive a share of the production they generate. This mode of operation has resulted in relatively constant production rates from our mineral interests in the past, and while we expect that regeneration will continue, we are uncertain if it will continue at rates sufficient to maintain or grow the segment’s production rate so long as commodity prices remain at their current levels. We have observed rapid and significant reductions in the active drilling rig count in virtually every producing basin of the United States, except for the Haynesville (North Louisiana and East Texas) and Marcellus (Appalachian region) shale plays. The new sources of production that we expect will materialize due to regeneration will also be the source of future extensions and discoveries and positive revisions to our reserve estimates, which may effect out future depletion rates. During 2009, as a result of regeneration we received an initial royalty payment for 208 new wells.
Additionally, we received approximately $2.3 million in bonus and delay rental payments during 2009 compared to and $16.8 million in 2008. The amount of revenue we receive from bonus and rental payments varies significantly from month to month; therefore, we do not believe a meaningful set of conclusions can be drawn by observing changes in leasing activity over small time periods. Commodity prices may affect the amount of leasing that will occur on the minerals in future periods, and it is impossible to predict the timing or amount of future bonus payments. However, we do expect to receive some level of bonus payments in the future.
Operating Expenses. Operating expenses of $1.3 million for the year ended December 31, 2009 as compared to $1.7 million for the year ended December 31, 2008 are predominately production and ad valorem taxes. These taxes are levied by various state and local taxing entities.
Impairment. During the year ended December 31, 2009, we incurred an impairment charge of $0.3 million related to certain fields within our Minerals Segment as a result of the substantial decline in commodity prices. During the year ended December 31, 2008, we incurred an impairment charge of $1.7 million related to certain fields within our Minerals Segment as a result of the substantial decline in commodity prices during the fourth quarter of 2008.
Depletion. Our depletion during the year ended December 31, 2009 was $6.0 million as compared to $7.8 million for the year ended December 31, 2008. The decrease in depletion expense for 2009, as compared to the same period in the prior year, is due to lower production.
Other Matters. On December 21, 2008, we entered into a definitive agreement to sell our Minerals Business to Black Stone for $174.5 million subject to the approval of the Global Transaction Agreement as described in Part II, Item 7. Managements Discussion and Analysis of Financial Condition and Results of Operations – Overview – Recapitalization and Related Transactions. As the sale of the Minerals Business is conditioned upon the approval of the Global Transaction Agreement and certain partnership agreement amendments by a majority of our non-NGP affiliated common unitholders, we have not classified the assets of our Minerals Business as assets-held-for-sale or the operations as discontinued. If the transactions are approved by a majority of the non-affiliated common unitholders, it is at this point that we will then classify the assets of the Minerals Business as assets-held-for-sale and the operations as discontinued.
Corporate Segment
| | | Twelve Months Ending December 31, | |
| | | 2009 | | | 2008 | |
| | | ($ in thousands) | |
| Revenues: | | | | | | |
Realized commodity derivatives gains (losses) | | $ | 83,300 | | | $ | (46,059 | ) |
Unrealized commodity derivatives (losses) gains | | | (189,590 | ) | | | 207,824 | |
Total revenues | | | (106,290 | ) | | | 161,765 | |
General and administrative | | | 46,188 | | | | 45,701 | |
Depreciation and amortization | | | 1,073 | | | | 787 | |
Other expense | | | — | | | | 10,699 | |
Operating (loss) income | | | (153,551 | ) | | | 104,578 | |
| Other income (expense): | | | | | | | | |
Interest income | | | 188 | | | | 793 | |
Other income | | | 2,328 | | | | 5,328 | |
Interest expense | | | (21,591 | ) | | | (32,884 | ) |
Unrealized interest rate derivative gains (losses) | | | 12,529 | | | | (27,717 | ) |
Realized interest rate derivative losses | | | (18,876 | ) | | | (5,214 | ) |
Other expense | | | (1,070 | ) | | | (955 | ) |
Total other income (expense) | | | (26,492 | ) | | | (60,649 | ) |
Gain (loss) from continuing operations before taxes | | | (180,043 | ) | | | 43,929 | |
Income tax provision (benefit) | | | 1,087 | | | | (1,134 | ) |
Gain (loss) from continuing operations | | | (181,130 | ) | | | 45,063 | |
Discontinued operations | | | — | | | | (18 | ) |
Segment gain (loss) | | $ | (181,130 | ) | | $ | 45,045 | |
Revenue. As a master limited partnership, we distribute available cash (as defined in our partnership agreement) every quarter to our unitholders subject to reserves established by our Board of Directors. Our distribution policy, including a description of the right to make reserves against available cash, is discussed in greater detail in Part II, Item 5. Market for Registrant’s Common Equity, Related Unitholder Matters and Issuer Purchases of Equity Securities - Cash Distribution Policy.
The volatility inherent in commodity prices generates uncertainty in future levels of available cash. We enter into derivative transactions to reduce our exposure to commodity price risk and reduce the uncertainty of future cash flows.
Our Corporate Segment’s revenue, which solely includes our commodity derivatives activity, decreased to a loss of $106.3 million for the year ended December 31, 2009, from a gain of $161.8 million for the year ended December 31, 2008. As a result of our commodity hedging activities, revenues include total realized gains of $83.3 million on risk management activity settled during the year ended December 31, 2009 and unrealized mark-to-market losses of $189.6 million for the year ended December 31, 2009, as compared to realized losses of $46.1 million and unrealized mark-to-market gains of $207.8 million for the year ended December 31, 2008. Included in unrealized commodity derivative (losses) gains is amortization related to put premiums and costs associated with the resetting of derivative contract prices of $48.4 million during the year ended December 31, 2009 as compared to $13.3 million for the year ended December 31, 2008.
As the forward price curves for our hedged commodities shift in relation to the caps, floors, and swap strike prices, the fair value of such instruments changes. We capture this change as unrealized, non-cash, mark-to-market changes during the period of the change. The unrealized mark-to-market changes for the year ended December 31, 2009 and 2008 had no impact on cash activities for those periods and, as such, are excluded from our calculation of Adjusted EBITDA. The realized commodity derivatives results during the year ended December 31, 2009 reflect the difference between the strike prices and settlement prices for derivative volumes settled during the year. As such, the realized amounts impact our cash flows and are included in our calculation of Adjusted EBITDA.
Given the uncertainty surrounding future commodity prices, and the general inability to predict future commodity prices as they relate to the strike prices at which we have hedged our exposure, it is difficult to predict the magnitude and impact that marking our hedges to market will have on our income from operations in future periods. Conversely, negative commodity price movements affecting our revenues and costs are expected to be partially offset by our executed derivative instruments.
General and Administrative Expenses. General and administrative expenses increased by $0.5 million to $46.2 million for 2009 as compared to $45.7 million for 2008. This growth in general and administrative expenses was primarily driven by increased headcount in our corporate office as a result of our 2008 acquisitions but was also impacted by our recruiting efforts in accounting, back-office, engineering, land and operations-related corporate personnel associated with being a public partnership. Corporate-office payroll expenses increased by $2.8 million in 2009 as a result of the increased headcount. Included within the increased corporate-office payroll expenses was an decrease of $1.0 million related to equity-based compensation, of which 2009 includes $0.4 million related to the allocation of expense from Eagle Rock Holdings, L.P. due to its issuance of Tier I units to one of our executives, as compared to $1.6 million in 2008. Also included in 2009 was a one time charge of $0.1 million for severance payments due to a reduction in workforce. As a result of the increase in our expenses for corporate-office headcount, contract labor and other outside professional services decreased by $2.6 million in 2009 as compared to the same period in 2008. In addition, 2009 included legal and other professional advisory fees of $0.9 million incurred related to strategic discussions regarding our capital structure and proposals received regarding the sale of the Minerals Business.
At the present time, we do not allocate our general and administrative expenses cost to our operational segments. The Corporate Segment bears the entire amount.
Other Operating Expenses. In July 2008, SemGroup, L.P. and certain of its subsidiaries (“SemGroup”) filed petitions for reorganization under Chapter 11 of the U.S. Bankruptcy Code. We historically sold portions of our condensate production from our Texas Panhandle and East Texas midstream systems to SemGroup. During July 2008, we sold pre-bankruptcy, and continued to sell post-bankruptcy, condensate to SemGroup. As of August 1, 2008, we ceased all deliveries/sales of condensate to SemGroup. As a result of the bankruptcy we recorded a $10.7 million bad debt charge during the year ended December 31, 2008 which is included in “Other Operating Expense” in the consolidated statement of operations. Although we sought payment of our $10.7 million receivable for condensate sales as a critical supplier to SemGroup under its Supplier Protection Program (“SPP”), we were not successful in being recognized as a critical provider by SemGroup and thus were not admitted to the SPP.
Total Other Expense. Total other expense, which includes both realized and unrealized gains and losses from our interest rate swaps, decreased to $26.5 million for the year ended December 31, 2009 as compared to $60.6 million for the year ended December 31, 2008. During 2009, we incurred realized losses from our interest rate swaps of $18.9 million as compared to realized losses of $5.2 million during the year ended December 31, 2008. We also incurred unrealized mark-to-market gains from our interest rate swaps of $12.5 million during the year ended December 31, 2009 as compared to unrealized mark-to-market losses of $27.7 million for the same period in 2008. These unrealized mark-to-market losses did not have any impact on cash activities for the period, and are excluded by definition from our calculation of Adjusted EBITDA.
Interest expense decreased to $21.6 million for the year ended December 31, 2009 as compared to $32.9 million during the same period in the prior year. Interest expense is shown before the impact of our interest rate derivatives, which convert a portion of our outstanding debt from variable-rate interest obligations to fixed-rate interest obligations. All of our outstanding debt consists of borrowings under our revolving credit facility, which bears interest primarily based on a LIBOR rate plus the applicable margin. The decrease in interest expense is due to lower LIBOR rates during 2009, as compared to the same period in 2008, partially offset by higher debt balances in the 2009 period as a result of our acquisitions made in 2008.
Other income includes our equity in earnings of the partnerships described in Part I, Item 1. Business – Minerals Business (Ivory Working Interests, L.P and Ivory Acquisition Partners, L.P.). During the year ended December 31, 2009, we recorded income of $1.4 million. During the year ended December 31, 2008, we recorded income of $8.2 million. This income was partially offset by a loss on the sale of investments of $2.1 million due to the reversion of our interest in the IAP partnership. In addition, other income for the years ended December 31, 2009 and 2008 includes gains of $0.5 million and $1.3 million, respectively, on the sale of assets related to properties we sold.
Income Tax (Benefit) Provision. Income tax provision for the 2009 and 2008 relates to (i) state taxes due by us and (ii) federal taxes due by Eagle Rock Energy Acquisition Co., Inc. (acquiring entity of certain entities acquired in the acquisition of Redman Energy Corporation “Redman Acquisition” in 2007) and Eagle Rock Energy Acquisition Co. II, Inc. (acquiring entity of certain entities acquired in the Stanolind Acquisition) and their wholly-owned corporations, Eagle Rock Upstream Development Company, Inc. (successor entity to certain entities acquired in the Redman acquisition) and Eagle Rock Upstream Development Company II, Inc. (successor entity to certain entities acquired in the Stanolind acquisition), which are subject to federal income taxes (the “C Corporations”). During 2009, our tax provision increased by $2.2 million as compared to the same periods in the prior year. These increases were the result of 2009 income projected for the C Corporations resulting from utilization of our remaining net operating loss carryforwards, adjustments to true-up of the results of 2008 tax return and our 2008 tax provision, as well as changes in estimates used in our tax provision calculation in prior periods. For further discussion of our income tax (benefit) provision, see Note 15 to our consolidated financial statements included in Part II, Item 8. Financial Statements and Supplementary Data staring on page F-1 of this Annual Report.
Adjusted EBITDA.
Adjusted EBITDA, as defined under Part II, Item 6. Selected Financial Data - Non-GAAP Financial Measures, decreased by $59.7 million from $248.3 million for the year ended December 31, 2008 to $188.6 million for the year ended December 31, 2009.
As described above, revenues minus cost of natural gas and natural gas liquids for the Midstream Business (including the Texas Panhandle, East Texas/Louisiana, South Texas and Gulf of Mexico Segments) decreased by $59.9 million during the year ended December 31, 2009, as compared to the comparable period in 2008. The Upstream and Minerals Segments contributed an additional $136.1 million to revenues during the year ended December 31, 2009, as compared to the comparable period in 2008. Our Corporate Segment’s realized commodity derivatives gain increased by $129.4 million during the year ended December 31, 2009 as compared to the comparable period in 2008. This resulted in $66.6 million of total incremental revenues minus cost of natural gas and natural gas liquids during the year ended December 31, 2009 as compared to the comparable period in 2008. The incremental revenue amounts are adjusted to exclude the impact of unrealized commodity derivatives not included in the calculation of Adjusted EBITDA.
Operating expenses (including taxes other than income) for our Midstream Business increased by $1.1 million for the year ended December 31, 2009, as compared to the same period in 2008, while Operating Expenses (including taxes other than income) for the Upstream and Minerals Segments decreased $9.5 million for the year ended December 31, 2009, as compared to the comparable period in 2008.
General and administrative expense, excluding the impact of non-cash compensation charges related to our long-term incentive program, Holding’s Tier I incentive units and other non-recurring items and captured within our Corporate Segment, increased during the year ended December 31, 2009 by $1.5 million, as compared to the respective period in 2008.
As a result, revenues (excluding the impact of unrealized commodity derivative activity) minus cost of natural gas and natural gas liquids for the year ended December 31, 2009, as compared to the same period in 2008 decreased by $66.6 million, operating expenses decreased by $8.4 million and general and administrative expenses increased by $1.5 million. The decreases in revenues minus the cost of natural gas and natural gas liquids, the decreases in operating costs offset by the increase in general and administrative expenses resulted in a decrease to Adjusted EBITDA during the year ended December 31, 2009, as compared to the year ended December 31, 2008.
Year Ended December 31, 2008 Compared with Year Ended December 31, 2007
Summary of Consolidated Operating Results
Below is a table of a summary of our consolidated operating results for the years ended December 31, 2008 and December 31, 2007. Operating results for our individual operating segments are presented in tables in this Item 7.
| | | Year Ended December 31, | |
| | | 2008 | | | 2007 | |
| | | ($ in thousands) | |
| Revenues: | | | | | | |
| Sales of natural gas, NGLs, oil, condensate and sulfur | | $ | 1,233,919 | | | $ | 733,326 | |
Gathering, compression, processing and treating fees | | | 38,871 | | | | 27,417 | |
| Minerals and royalty income | | | 42,994 | | | | 15,004 | |
| Realized commodity derivative gains (losses) | | | (46,059 | ) | | | (3,061 | ) |
| Unrealized commodity derivative gains (losses) | | | 207,824 | | | | (130,773 | ) |
| Other | | | 716 | | | | 110 | |
| Total revenues | | | 1,478,265 | | | | 642,023 | |
| Cost of natural gas and natural gas liquids | | | 891,433 | | | | 553,248 | |
| Costs and expenses: | | | | | | | | |
| Operating and maintenance | | | 73,620 | | | | 52,793 | |
| Taxes and other income | | | 19,936 | | | | 8,340 | |
General and administrative | | | 45,701 | | | | 27,799 | |
| Other operating expense | | | 10,699 | | | | 2,847 | |
| Depreciation, depletion and amortization | | | 116,754 | | | | 80,559 | |
Impairment expense | | | 143,857 | | | | 5,749 | |
| Goodwill impairment expense | | | 30,994 | | | | — | |
Total costs and expenses | | | 441,561 | | | | 178,087 | |
| Total operating income (loss) | | | 145,271 | | | | (89,312 | ) |
| Other income (expense): | | | | | | | | |
Interest income | | | 793 | | | | 1,160 | |
| Other income | | | 5,328 | | | | 696 | |
| Interest expense | | | (32,884 | ) | | | (38,936 | ) |
| Unrealized interest rate derivatives losses | | | (27,717 | ) | | | (13,403 | ) |
Realized interest rate derivative (losses) gains | | | ( 5,214 | ) | | | 1,415 | |
Other expense | | | (955 | ) | | | (8,226 | ) |
Total other income (expense) | | | (60,649 | ) | | | (57,294 | ) |
| Income (loss) from continuing operations before income taxes | | | 84,622 | | | | (146,606 | ) |
| Income tax (benefit) provision | | | (1,134 | ) | | | 158 | |
| Income (loss) from continuing operations | | | 85,756 | | | | (146,764 | ) |
| Discontinued operations | | | 1,764 | | | | 1,130 | |
Net income (loss) | | $ | 87,520 | | | $ | (145,634 | ) |
Adjusted EBITDA(a) | | $ | 248,286 | | | $ | 132,216 | |
| (a) | See Part II, Item 6. Selected Financial Data – Non-GAAP Financial Measures for a definition and reconciliation to GAAP. |
Midstream Business (Four Segments)
Significant Acquisitions and Organic Growth Projects in 2008
The Millennium Acquisition, completed in October 2008 (hereinafter, the period of operation from October 1 through December 31, 2008, (the “Millennium Covered Period”) contributed a number of gathering and processing assets to the Midstream Business. The assets expanded the East Texas/Louisiana Segment and the South Texas Segment and created the Gulf of Mexico Segment. The assets acquired consisted of:
| | • | Approximately 679 miles of natural gas gathering pipelines ranging in size from four inches to 20 inches in diameter. |
| | • | Compression stations with approximately 12,500 aggregate horsepower. |
| | • | Two cryogenic processing plants (non-operated), in which we own a 14.26% and 7.74% interest, respectively, consisting of processing and related facilities for an aggregate capacity of 369 MMcf/d. |
| | • | A 30,000 Bbl/d NGL fractionation plant (non-operated), in which we own a 7.74% interest. |
We also completed a number of capacity expansion projects during 2008. In the Texas Panhandle Segment, we installed an additional 2600 horsepower of compression at two sites to provide additional capacity of approximately 7 MMcf/d and lower gathering pressures for the producers. In addition we completed the shut-down of the Stinnett Plant and the consolidation of the volumes from the Stinnett Plant into the Cargray Plant resulting in increased operating efficiencies. In the East Texas/Louisiana Segment, we completed the connection of our Panola system to a processing plant owned by a third party, increasing the recovered NGLs on the Panola system; we expanded the capacity of the ETML system by 120 MMcf/d; and we expanded the Brookeland and Tyler County systems by 12.7 miles to continue to keep pace with drilling activity in the Austin Chalk play. In the South Texas Segment, we completed the expansion of the Kelsey Compressor station, adding an additional 12 MMcf/d of outlet capacity to our Phase 1 20” pipeline system.
Texas Panhandle Segment
| | | Twelve Months Ending December 31, | |
| | | 2008 | | | 2007 | |
| | | ($ in thousands, except for realized prices) | |
| Revenues: | | | | | | |
| Sales of natural gas, NGLs, oil and condensate | | $ | 592,997 | | | $ | 479,120 | |
| Gathering and treating services | | | 10,069 | | | | 8,910 | |
| Total revenues | | | 603,066 | | | | 488,030 | |
| Cost of natural gas and natural gas liquids | | | 459,064 | | | | 372,205 | |
| Operating costs and expenses: | | | | | | | | |
| Operations and maintenance | | | 34,269 | | | | 32,494 | |
| Depreciation and amortization | | | 43,688 | | | | 42,308 | |
| Total operating costs and expenses | | | 77,957 | | | | 74,802 | |
| Operating income | | $ | 66,045 | | | $ | 41,023 | |
| | | | | | | | | |
| Capital expenditures | | $ | 30,738 | | | $ | 34,865 | |
| | | | | | | | | |
| Realized prices: | | | | | | | | |
| Oil and condensate (per Bbl) | | $ | 94.27 | | | $ | 63.51 | |
| Natural gas (per Mcf) | | $ | 7.44 | | | $ | 6.08 | |
| NGLs (per Bbl) | | $ | 58.34 | | | $ | 51.24 | |
| Production volumes: | | | | | | | | |
Gathering volumes (Mcf/d)(a) | | | 151,964 | | | | 151,260 | |
NGLs and condensate (net equity gallons) | | | 86,514,543 | | | | 88,973,133 | |
Natural gas short position (MMbtu/d)(a) | | | (5,607 | ) | | | (7,184 | ) |
| (a) | Gathering volumes (Mcf/d) and natural gas short position (MMbtu/d) are calculated by taking the total volume and then dividing by the number of days in the respective period. |
Revenue and Cost of Natural Gas and Natural Gas Liquids. For the year ended December 31, 2008, the revenues minus cost of natural gas and natural gas liquids for our Texas Panhandle Segment operations totaled $144.0 million compared to $115.8 million for the year ended December 31, 2007. There were three primary contributors to this increase: (i) higher NGL and condensate pricing, as compared to pricing in 2007, (ii) a lower natural gas short position as compared to 2007 and (iii) the downtime at our Arrington Plant which resulted in a negative impact in 2007 of approximately $2.7 million.
The slightly higher gathering volumes in 2008 as compared to 2007 were primarily due to a full year of Red Deer Plant operations in 2008 compared to only six months in 2007, colder than normal weather in that area and downtime to repair the Arrington plant during 2007, which reduced gathering volumes during the year ended December 31, 2007. These were partially offset by reduced drilling activity during 2008 that was not sufficient to replace the natural volume declines in the West Panhandle System and the East Panhandle System.
The drilling activity in the West Panhandle System is not sufficient to offset the natural declines experienced on the System. While our contract mix in the West Panhandle System provides us with a higher equity share of the production, the overall decline will continue, and we expect to recover smaller amounts of equity production in the future on the West Panhandle System. The East Panhandle System experienced increased drilling activity in the active Granite Wash play located in Roberts and Hemphill Counties, Texas through much of 2008; however, due to lower commodity values during the fourth quarter of 2008, we saw a significant reduction in drilling activity during the fourth quarter of the year ended December 31, 2008 by the producers in Roberts and Hemphill Counties. The liquids content of the natural gas is lower in the East Panhandle System, and our contract mix provides us with a smaller share of equity production as compared to the West Panhandle System. Due to this difference in contract mix and liquid content between our West and East Panhandle Systems, while we have grown aggregate volumes during 2008 as compared to 2007, our equity share of liquids production declined in 2008 as compared to 2007. The start-up of the Red Deer Plant in June 2007 provided an additional 20 MMcf/d of processing capacity in our East Panhandle System that was immediately utilized by our customers. We expanded our Red Deer Plant facility during 2008 to handle additional volumes of 5 MMcf/d, bringing total capacity to 25 MMcf/d. We completed the shut-down of the Stinnett Plant and the consolidation of the volumes from the Stinnett Plant to the Cargray Plant. We initiated a project to relocate the Stinnett Plant to the Arrington Plant, with the goal of replacing the older refrigerated lean oil plant, resulting in additional processing capacity and improved product recovery efficiencies. This project was postponed due to the reduction in drilling activity and the reduction in commodity prices. On February 15, 2010, we announced our plans to complete the project. The refurbished Stinnett plant, now renamed the Phoenix plant, will replace the existing Arrington plant, resulting in improved efficiencies for existing volumes and increased capacity to serve the need for future processing capacity as the horizontal drilling activity in the Granite Wash play resumes in the East Panhandle area.
Operating Expenses. Operating expenses, including taxes other than income, for the year ended December 31, 2008 were $34.3 million compared to $32.5 million for the year ended December 31, 2007. The major items impacting the $1.8 million increase in operating expenses for the year ended December 31, 2008 were a combination of the operations of the Red Deer plant for the full year in 2008 compared to only six months in 2007 and higher materials, supplies and labor costs. These increases in operating expenses were slightly offset by the fact that the year ended December 31, 2007 included additional maintenance costs for repairing the Arrington plant.
Depreciation and Amortization. Depreciation and amortization expenses for the year ended December 31, 2008 were $43.7 million compared to $42.3 million for the year ended December 31, 2007. The major items impacting the $1.4 million increase were the depreciation on the Red Deer Plant for a full year in 2008 compared to only six months in 2007 and beginning depreciation expense associated with the other capital expenditure projects.
Capital Expenditures. Capital expenditures for the year ended December 31, 2008 were $30.7 million as compared to $34.9 million for the year ended December 31, 2007. During 2008, of our capital spending in this segment, we spent $21.4 million on growth capital and $9.3 million on maintenance capital. We classify capital expenditures as either maintenance capital which represents routine well connects and capitalized maintenance activities or as growth capital which represents organic growth projects. Our decrease of $4.2 million in capital spending for 2008 was driven by less growth capital due to expenditures in 2007 on the new Red Deer Plant, which was offset by capital expenditures related to our Stinnett – Cargray plant consolidation projects during 2008.
East Texas/Louisiana Segment
| | | Twelve Months Ending December 31, | |
| | | 2008(c) | | | 2007(b) | |
| | | ($ in thousands, except for realized prices) | |
| Revenues: | | | | | | |
Sales of natural gas, NGLs, oil and condensate | | $ | 298,720 | | | $ | 153,660 | |
| Gathering and treating services | | | 23,320 | | | | 13,547 | |
| Other | | | — | | | | (21 | ) |
Total revenues | | | 322,040 | | | | 167,186 | |
Cost of natural gas and natural gas liquids | | | 269,030 | | | | 133,350 | |
| Operating costs and expenses: | | | | | | | | |
Operations and maintenance | | | 16,569 | | | | 10,929 | |
Depreciation and amortization | | | 13,559 | | | | 10,781 | |
Impairment | | | 26,994 | | | | — | |
Total operating costs and expenses | | | 57,122 | | | | 21,710 | |
Operating (loss) income | | $ | (4,112 | ) | | $ | 12,126 | |
| | | | | | | | | |
Capital expenditures | | $ | 17,391 | | | $ | 25,560 | |
| | | | | | | | | |
| Realized prices: | | | | | | | | |
Oil and condensate (per Bbl) | | $ | 101.62 | | | $ | 73.33 | |
Natural gas (per Mcf) | | $ | 8.75 | | | $ | 6.54 | |
NGLs (per Bbl) | | $ | 54.66 | | | $ | 44.94 | |
| Production volumes: | | | | | | | | |
Gathering volumes (Mcf/d)(a) | | | 198,365 | | | | 134,007 | |
NGLs and condensate (net equity gallons) | | | 28,619,378 | | | | 18,320,082 | |
Natural gas short position (MMbtu/d)(a) | | | 1,427 | | | | 1,077 | |
| (a) | Gathering volumes (Mcf/d) and natural gas short position (MMbtu/d) are calculated by taking the total volume and then dividing by the number of days in the respective period. |
| (b) | Includes operations related to the Laser Acquisition starting on May 3, 2007. |
| (c) | Includes operations related to the Millennium Acquisition starting on October 1, 2008. |
Revenue and Cost of Natural Gas and Natural Gas Liquids. For the year ended December 31, 2008, revenues minus cost of natural gas and natural gas liquids for our East Texas/Louisiana Segment totaled $53.0 million compared to $33.8 million for the year ended December 31, 2007.
We were positively impacted from higher NGL and condensate pricing during 2008 as compared to 2007. We were also positively impacted by a 48% growth in daily gathering volumes during 2008, as compared to 2007. Increased volumes were due to both a full year of the Laser Acquisition during 2008 compared to approximately eight months 2007; three months of the Millennium Acquisition during 2008; and continued successful drilling in the Austin Chalk play in Tyler and Jasper Counties, Texas. Excluding the Laser Acquisition and the Millennium Acquisition, our gathering volumes increased by 26.6% during 2008 compared to 2007. We have also constructed a new seven mile lateral from our Brookeland gathering system into an active Austin Chalk drilling area where we have a large dedicated acreage position under a life-of-lease contract with an active significant producer. The production rates of wells drilled in the Austin Chalk play are characterized by high initial decline rates; therefore, operators must conduct active drilling programs if they are to maintain or grow their production in this play. Depending upon the continued success of the producer’s drilling activities on this acreage; this area may continue to provide added volume growth to our East Texas/Louisiana Segment in the future.
The Laser Acquisition positively impacted the East Texas/Louisiana Segment’s revenues minus cost of natural gas and natural gas liquids by $15.0 million during the year ended December 31, 2008, compared to $8.6 million during the same time period in the prior year. The increase is primarily the result of twelve months of operations during the year ended 2008 compared to approximately eight months during the same period in the prior year. The daily gathering volumes of the assets acquired in the Laser Acquisition during 2008, as compared to the time period of ownership of those assets in 2007, are down due to reduced drilling activity around the Belle Bower system.
The Millennium Acquisition positively impacted the East Texas/Louisiana Segment’s revenue minus cost of natural gas and natural gas liquids by $5.0 million.
Operating Expenses. Operating expenses for the year ended December 31, 2008 were $16.6 million compared to $10.9 million for the year ended December 31, 2007. The major items impacting the $5.6 million increase in operating expense for 2008 were (i) the additional months in 2008 that we have owned the assets acquired in 2007 as part of the Laser Acquisition (twelve months compared to approximately eight months); (ii) incremental expenses for additional compression costs due to increased gathered volumes on the Tyler County Pipeline and Brookeland system; (iii) preparation costs for hurricanes Ike and Gustav; (iv) expenses associated with operating the assets acquired as part of the Millennium Acquisition; and (v) higher materials, supply and labor expenses.
Depreciation and Amortization. Depreciation and amortization expenses for the year ended December 31, 2008 were $13.6 million compared to $10.8 million for the year ended December 31, 2007. The major items impacting the increase were (i) the additional months in 2008 that we owned the assets acquired as part of the Laser acquisition (twelve months compared to approximately eight months); (ii) placing the Tyler County Pipeline Extension into service and beginning the depreciation expense associated therewith; (iii) beginning the depreciation expense associated with other capital expenditure projects; and (iv) three months of depreciation and amortization of the assets acquired as part of the Millennium Acquisition.
Impairment. During the year ended December 31, 2008, we incurred impairment charges related to certain processing plants, gathering systems and contracts within our East Texas/Louisiana Segment of $27.0 million due to the substantial decline in commodity prices during the fourth quarter of 2008. No impairment charges were incurred during the year ended December 31, 2007.
Capital Expenditures. Capital expenditures for the year ended December 31, 2008 were $17.4 million compared to $25.6 million for the year ended December 31, 2007. During 2008, of our capital spending in this segment, we spent $14.5 million on growth capital and $2.9 million on maintenance capital. We classify capital expenditures as either maintenance capital, which represents routine well connects and capitalized maintenance activities, or as growth capital, which represents organic growth projects. Our decrease in capital spending for 2008 was due primarily to the high costs associated with the construction and start-up of the Tyler County Pipeline Extension in March 2007.
South Texas Segment
| | | Twelve Months Ending December 31, | |
| | | 2008(c) | | | 2007(b) | |
| | | ($ in thousands, except for realized prices) | |
| Revenues: | | | | | | |
Sales of natural gas, NGLs, oil and condensate | | $ | 168,922 | | | $ | 49,859 | |
| Gathering and treating services | | | 4,779 | | | | 4,012 | |
| Other | | | 15 | | | | 1 | |
| Total revenues | | | 173,716 | | | | 53,872 | |
| Cost of natural gas and natural gas liquids | | | 161,963 | | | | 47,693 | |
| Operating costs and expenses: | | | | | | | | |
| Operations and maintenance | | | 2,924 | | | | 1,058 | |
| Depreciation and amortization | | | 4,428 | | | | 2,453 | |
Impairment | | | 8,105 | | | | — | |
| Total operating costs and expenses | | | 15,457 | | | | 3,511 | |
| Operating income (loss) from continuing operations | | | (3,704 | ) | | | 2,668 | |
| Discontinued operations | | | 1,782 | | | | 1,141 | |
| Operating income (loss) | | $ | (1,922 | ) | | $ | 3,809 | |
| �� | | | | | | | | |
| Capital expenditures | | $ | 1,145 | | | $ | 3,449 | |
| | | | | | | | | |
| Realized volumes: | | | | | | | | |
Oil and condensate (per Bbl) | | $ | 92.10 | | | $ | 78.89 | |
| Natural gas (per Mcf) | | $ | 8.99 | | | $ | 6.38 | |
| NGLs (per Bbl) | | $ | 52.66 | | | $ | 55.44 | |
| Production volumes: | | | | | | | | |
Gathering volumes (Mcf/d)(a) | | | 88,488 | | | | 63,435 | |
| NGLs and condensate (net equity gallons) | | | 2,413,483 | | | | 463,490 | |
Natural gas short position (MMbtu/d)(a) | | | 500 | | | | 250 | |
| (a) | Gathering volumes (Mcf/d) and natural gas short position (MMbtu/d) are calculated by taking the total volume and then dividing by the number of days in the respective period. |
| (b) | Includes operations related to the Laser Acquisition starting on May 3, 2007. |
| (c) | Includes operations related to the Millennium Acquisition starting on October 1, 2008. |
Revenue and Cost of Natural Gas and Natural Gas Liquids. During the year ended December 31, 2008 the South Texas Segment contributed revenues minus cost of natural gas and natural gas liquids of $11.8 million, as compared to $6.2 million for the year ended December 31, 2007. The increase during 2008, as compared to 2007 was due to a full year of operating the assets acquired as part of the Laser Acquisition as compared to approximately eight months in 2007 and also due to the additional assets acquired as part of the Millennium Acquisition. The assets acquired as part of the Millennium Acquisition positively impacted the South Texas Segment’s revenue minus cost of natural gas and natural gas liquids by $1.1 million. Also contributing to the increase in revenues minus cost of natural gas and natural gas liquids is the expansion during the fourth quarter of 2008 of the Kelsey Compressor Station on our Phase 1 20-inch Pipeline, which provides access to Exxon’s King Ranch processing facility, which added an additional 12 MMcf/d of capacity.
Operating Expenses. Operating expenses for the year ended December 31, 2008 were $2.9 million, as compared to $1.1 million for the year ended December 31, 2007. Operating expenses are higher due to (i) the additional months in 2008 that we have owned the assets acquired in 2007 as part of the Laser Acquisition (twelve months compared to approximately eight months); (ii) expenses associated with operating the assets acquired as part of the Millennium Acquisition; and (ii) higher material and labor expenses.
Depreciation and Amortization. Depreciation and amortization expenses for the year ended December 31, 2008 were $4.4 million, as compared to $2.5 million for the year ended December 31, 2007. Depreciation and amortization increased due to: (i) a full year of depreciation and amortization of the assets acquired in 2007 as part of the Laser Acquisition in 2008 as compared to approximately eight months in 2007; and (ii) depreciation and amortization associated with the assets acquired as part of the Millennium Acquisition.
Impairment. During the year ended December 31, 2008, we incurred impairment charges related to certain processing plants, gathering systems and contracts within our South Texas Segment of $8.1 million due to the substantial decline in commodity prices during the fourth quarter of 2008. No impairment charges were incurred during the year ended December 31, 2007.
Capital Expenditures. Capital expenditures for the year ended December 31, 2008 were $1.1 million as compared to $3.4 million for the year ended December 31, 2007. During the year ended December 31, 2008, we spent $0.8 million on growth capital and $0.3 million on maintenance capital. The decrease in capital expenditures in 2008 compared to 2007 was the result of the spending incurred in 2007 to add capacity and new supply to our Phase 1 20” pipeline.
Discontinued Operations. On April 1, 2009, we sold our producer services line of business, and thus have retrospectively classified the revenues minus the cost of natural gas and natural gas liquids as discontinued operations. During the year ended December 31, 2008, this business generated revenues of $265.1 million and cost of natural gas and natural gas liquids of $263.3 million, as compared to revenues of $134.8 million and cost of natural gas and natural gas liquids of $133.6 million during the year ended December 31, 2007.
Gulf of Mexico Segment
| | | Three Months Ending December 31, | |
| | | 2008(b) | | | 2007 | |
| | | ($ in thousands, except for realized prices) | |
| Revenues: | | | | | | |
Sales of natural gas, NGLs, oil and condensate | | $ | 952 | | | $ | — | |
Gathering and treating services | | | 703 | | | | — | |
Other | | | | | | | — | |
Total revenues | | | 1,655 | | | | — | |
Cost of natural gas and natural gas liquids | | | 1,376 | | | | — | |
| Operating costs and expenses: | | | | | | | | |
Operations and maintenance | | | 605 | | | | — | |
Depreciation and amortization | | | 1,521 | | | | — | |
Total operating costs and expenses | | | 2,126 | | | | — | |
Operating loss | | $ | (1,847 | ) | | $ | — | |
| | | | | | | | | |
| Realized average prices: | | | | | | | | |
Natural gas (per Mcf) | | $ | 6.64 | | | $ | — | |
NGLs (per Bbl) | | $ | 20.58 | | | $ | — | |
| Production volumes: | | | | | | | | |
Gathering volumes (Mfc/d)(a) | | | 12,014 | | | | — | |
NGLs and condensate (net equity gallons) | | | 176,962 | | | | — | |
| (a) | Gathering volumes (Mcf/d) and natural gas short position (MMbtu/d) are calculated by taking the total volume and then dividing by the number of days in the respective period. |
| (b) | Includes operations related to the Millennium Acquisition starting on October 1, 2008. |
Revenues and Cost of Natural Gas and Natural Gas Liquids. The Gulf of Mexico Segment is a new segment and new area of operations for us in 2008. We entered into this segment as a result of the Millennium Acquisition, effective October 1, 2008. During 2008, the Gulf of Mexico Segment contributed $0.3 million in revenues minus cost of natural gas and natural gas liquids. Revenues minus the cost of natural gas and natural gas liquids were impacted in this segment as the result of damage inflicted on the Yscloskey and North Terrebonne plants by hurricanes Gustav and Ike. During the time period we owned these assets in 2008, the Yscloskey plant did not come back online and the North Terrebonne plant only came back online during mid November 2008.
Operating Expenses. Operating expenses for 2008 were $0.6 million for the Millennium Covered Period. We continued to incur operating expenses associated with the Yscloskey and North Terrebonne plants while the plants were undergoing repair for the hurricane damage. We anticipate that the costs for the repair of the two plants will either be covered by insurance proceeds or by the previous owners pursuant to the Millennium Acquisition purchase and sale agreement. In fact, we made our first claim against the sellers for such repair costs at the end of 2008 and received payment from the acquisition escrow on December 28, 2008 in the amount of $0.3 million. We have since made a claim for the balance of the $0.6 million in cash held in escrow (i.e. $0.3 million) and have begun canceling common units held in escrow to satisfy our claims. We may elect to cancel common units or wait to receive cash payment from the insurer for future amounts at our discretion.
Depreciation and Amortization. Depreciation and amortization expenses for 2008 were $1.5 million for the three months in 2008 that we owned the assets acquired in the Millennium Acquisition.
Capital Expenditures. We did not incur any capital expenditures related to the Gulf of Mexico Segment in 2008.
| | | Twelve Months Ending December 31, | |
| | | 2008 (b) | | | 2007 (a) | |
| | | (Amounts in thousands, except volumes and realized prices) | |
| Revenues: | | | | | | |
Oil and condensate | | $ | 72,526 | | | $ | 24,874 | |
Sulfur | | | 37,759 | | | | 2,588 | |
Natural gas | | | 32,513 | | | | 11,210 | |
NGLs | | | 29,530 | | | | 12,015 | |
Income fees and other | | | — | | | | 948 | |
Other | | | 701 | | | | 130 | |
Total revenues | | | 173,029 | | | | 51,765 | |
| Operating Costs and expenses: | | | | | | | | |
Operations and maintenance | | | 37,481 | | | | 15,881 | |
Depletion, depreciation and amortization | | | 44,997 | | | | 16,235 | |
Impairment | | | 107,017 | | | | — | |
Goodwill impairment | | | 30,994 | | | | — | |
Total operating costs and expenses | | | 220,489 | | | | 32,116 | |
Operating (loss) income | | $ | (47,460 | ) | | $ | 19,649 | |
| | | | | | | | | |
Capital expenditures | | $ | 20,655 | | | $ | 2,242 | |
| | | | | | | | | |
| Realized average prices (c): | | | | | | | | |
Oil and condensate (per Bbl) | | $ | 87.04 | | | $ | 73.99 | |
Natural gas (per Mcf) | | $ | 8.09 | | | $ | 7.08 | |
NGLs (per Bbl) | | $ | 61.39 | | | $ | 56.66 | |
Sulfur (per Long ton) | | $ | 359.96 | | | $ | 58.50 | |
| Production volumes (c): | | | | | | | | |
Oil and condensate (Bbl) | | | 823,316 | | | | 328,028 | |
Natural gas (Mcf) | | | 4,117,247 | | | | 1,589,721 | |
NGLs (Bbl) | | | 480,450 | | | | 211,895 | |
Total (Mcfe) | | | 11,939,843 | | | | 4,832,679 | |
Sulfur (Long ton) | | | 104,613 | | | | 44,070 | |
| (a) | Includes operations from the Escambia and Redman acquisitions beginning on August 1, 2007. |
| (b) | Includes operations from the Stanolind Acquisition beginning on May 1, 2008. |
| (c) | Volumes and realized prices for the years ended December 31, 2008 and 2007 have been adjusted from prior reported amounts for a reallocation which was recorded in December 2009. |
Acquisitions. On April 30, 2008, we acquired Stanolind Oil and Gas Corporation. All of the assets acquired in this transaction are located in the Permian Basin, primarily in Ward, Crane and Pecos counties, Texas. As of December 31, 2008, the transaction has added 252 operated producing wells, 21 non-operated producing wells and 44 injection wells to the Upstream Segment. During the eight month period ended December 31, 2008, these assets averaged approximately 1,906 Mcf/d, 372 Bop/d and 168 Bbls of NGL’s of production, net to our interest after deducting royalties. Also during the eight month period ended December 31, 2008, we drilled and completed five successful wells on the acquired leasehold acreage. One additional well was drilled during the period and is currently in its completion phase.
Revenue. For the year ended December 31, 2008, the Upstream Segment contributed $173.0 million of revenue as compared to $51.8 million for the year ended December 31, 2007. The increase in revenues in 2008 was due to higher realized prices for oil, natural gas, NGLs and sulfur, as well as eight months of operations related to the assets acquired in the Stanolind Acquisition, and a full year’s contribution from the assets acquired in the Escambia and Redman Acquisitions compared to only five months of operations in 2007. During the year ended December 31, 2008, production averaged 11.2 MMcf/d, 2.3 MBO/d, 1.3 MB/d of NGL’s and 286 LT/d of sulfur. The period included eight months of production from the assets acquired in the Stanolind acquisition properties which averaged 858 BOE/d. These increases in revenue in 2008 were offset by: (i) shut-in production at the Big Escambia Creek field associated with a 20 day planned turnaround of the BEC treating facility in April 2008; (ii) BEC experiencing 31 days and 18 days of partial curtailment associated with sulfur recovery limitations and facility damage caused by a lightning strike, respectively; and (iii) gas production from Flomaton and Fanny Church fields being restricted from sales for 25 days associated with a third party’s gas quality issue at the point of sale (oil and sulfur sales from both Flomaton and Fanny Church fields continued during this period of curtailment).
During the year ended December 31, 2008, sulfur sales contributed $37.8 million of the total $173.0 million for the Upstream Segment. Historically, sulfur was viewed as a low value by-product in the production of oil and natural gas. Due to an increase in demand in the global fertilizer market during the first nine months of 2008, the price per long ton peaked at over $600 at the Tampa, Florida market (before effects of net-backs). During the last three months of 2008, demand in the global fertilizer market began to decline and the price per long ton at the Tampa, Florida market was $150 as of December 31, 2008.
Operating Expenses. Operating expenses, including severance and ad valorem taxes, totaled $37.5 million for the Upstream Segment during the year ended December 31, 2008, as compared to $15.9 million for the year ended December 31, 2007. The operating expenses in 2008 include eight months of expenses related to the assets acquired in the Stanolind Acquisition, as well as a full year of operating expense from the assets acquired in the Escambia and Redman Acquisitions compared to five months of expenses related to these assets in 2007. During the eight month period of the operation of the assets acquired in the Stanolind Acquisition, these assets accounted for $5.1 million of the total $37.5 million of operating expenses including severance and ad valorem taxes. Excluding severance and ad valorem taxes, the most significant portion of operating expenses were associated with operating the BEC and Flomaton treating and processing facilities, including operating expenses related to the planned turnaround at the BEC treating facility during April 2008. The remaining operating expenses are attributed to base lease operating expenses and well workovers. For 2008, our unit operating expense totaled $1.86 / Mcfe in the Upstream Business.
Depletion, Depreciation and Amortization. Depletion, depreciation and amortization expense for the year ended December 31, 2008 was $45.0 million, as compared to $16.2 million for the year ended December 31, 2007. This increase is due to us owning the assets acquired in the Escambia and Redman Acquisitions for twelve months in 2008 compared to only five months in 2007 and owning the assets acquired in the Stanolind Acquisition for eight months of 2008 compared to zero months in 2007.
Impairment. During the year ended December 31, 2008, we incurred an impairment charge of $107.0 million related to certain fields within our Upstream Segment as a result of the substantial decline in commodity prices during the fourth quarter of 2008. As a result of this impairment charge, we assessed our goodwill balance for impairment and recorded an impairment charge to goodwill of $31.0 million. We did not incur any impairment charges related to any of our fields or to goodwill during the year ended December 31, 2007.
Capital Expenditures. The Upstream Segment’s maintenance capital expenditures for the year ended December 31, 2008 totaled $14.2 million. The maintenance capital expenditures during 2008 were associated with the planned turnaround at the BEC treating facility, drilling, recompletions and workover activities. One successful Smackover test was drilled and completed in our Big Escambia Creek (BEC) field in 2008, while one additional BEC well is in the process of completion operations as of December 31, 2008. Maintenance capital was expended in fifteen non-operated wells drilled by a third party operator in various fields of East Texas and North Louisiana. Eagle Rock’s average working interest in this non operated drilling program is 3.8%. Recompletions and capital workovers were also conducted on eight operated wells across our South Texas, West Texas and Alabama regions during 2008. Five recompletions were executed in our Jourdanton field to complete additional Edwards formation intervals. Three of the five Edwards recompletions were successful. Three successful capital workovers were completed in our Alabama and West Texas operations resulting in significant reserve additions during 2008. The unit development cost for these recompletions and workover operations was $1.77/Mcfe. During 2009, we are not expecting to perform any turnarounds at the BEC treating facility.
Growth capital expenditures during 2008 totaled $6.5 million and were associated with five successful wells drilled and completed on leaseholds acquired from the Stanolind Acquisition in 2008. Four wells were drilled in the Ward-Estes field area on the Louis Richter and American National leases testing the San Andres, Holt and Penn formations. The fifth Permian Basin well was a successful completion in the Penn Sand on our American National lease in the Southern Unit field area.
For the total capital drilling program in 2008, we completed the drilling of 21 wells (5.8 net), of which 15 wells drilled were operated by others. As of December 31, 2008, two additional wells are in the process of completion operations. The total finding and development cost of the operated program was $1.47/Mcfe.
Minerals Segment
| | | Twelve Months Ending December 31, | |
| | | 2008 | | | 2007(a) | |
| | | (Amounts in thousands, except volumes and realized prices) | |
| Revenues: | | | | | | |
Oil and condensate | | $ | 14,337 | | | $ | 7,529 | |
| Natural gas | | | 10,451 | | | | 5,493 | |
NGLs | | | 1,376 | | | | 693 | |
| Lease bonus, rentals and other | | | 16,830 | | | | 1,289 | |
| Total revenues | | | 42,994 | | | | 15,004 | |
| Operating Costs and expenses: | | | | | | | | |
Operating | | | 1,708 | | | | 771 | |
| Depreciation and depletion | | | 7,774 | | | | 8,028 | |
Impairment | | | 1,741 | | | | 5,749 | |
| Total operating costs and expenses | | | 11,223 | | | | 14,548 | |
| Operating income | | $ | 31,771 | | | $ | 456 | |
| | | | | | | | | |
| Realized average prices: | | | | | | | | |
| Oil and condensate (per Bbl) | | $ | 91.83 | | | $ | 70.84 | |
| Natural gas (per Mcf) | | $ | 8.18 | | | $ | 6.30 | |
| NGLs (per Bbl) | | $ | 52.32 | | | $ | 46.63 | |
| Production volumes: | | | | | | | | |
| Oil and condensate (Bbl) | | | 156,118 | | | | 106,275 | |
| Natural gas (Mcf) | | | 1,277,046 | | | | 872,176 | |
| NGLs (Bbl) | | | 26,298 | | | | 14,862 | |
| Total (Mcfe) | | | 2,371,542 | | | | 1,599,001 | |
| (a) | Includes operations from the Montierra Acquisition beginning on May 1, 2007 and from the MacLondon Acquisition beginning on July 1, 2007. |
Revenue. For the year ended December 31, 2008 our revenue was $43.0 million compared to $15.0 million for the year ended December 31, 2007. The increase in revenue was due to (i) increases in commodity prices, (ii) increases in production rates during 2008, which was the result of drilling, recompletion and workover operations conducted by the various operators of the properties and (iii) owning these properties for the full year in 2008.
Additionally, we received approximately $16.8 million in bonus and delay rental payments during the year ended December 31, 2008. Substantially all of this was derived from our ownership in the minerals. The majority of this bonus revenue ($12.8 million) was derived from new leases executed during the third and fourth quarters in 2008 on our behalf by Black Stone in the emerging Haynesville shale play. As a result of these leases, we now have the opportunity to receive future royalty revenues from wells drilled on approximately 75,000 gross acres in Desoto and Sabine Parishes, Louisiana and San Augustine and Sabine Counties, Texas. In addition, we made a capital contribution to Ivory Working Interest Partners who then used the funds (along with other funds contributed by the remaining partners) to purchase a working interest position in approximately 60,000 gross acres in the Haynesville shale play, in San Augustine and Sabine Counties, Texas. We also own a mineral interest in approximately 32,000 of these acres (included in the 75,000 acres mentioned above).
The amount of revenue we receive from bonus and rental payments varies significantly from month to month; therefore, we do not believe a meaningful set of conclusions can be drawn by observing changes in leasing activity over small time periods. Commodity prices may affect the amount of leasing that will occur on the minerals in future periods, and it is impossible to predict the timing or amount of future bonus payments. We do expect to receive some level of bonus payments in the future, however.
Operating Expenses. Operating expenses of $1.7 million for the year ended December 31, 2008 as compared to $0.8 million for the year ended December 31, 2007 are predominately production and ad valorem taxes. These taxes are levied by various state and local taxing entities. For the year ended December 31, 2008, operating expenses include a full year of production and ad valorem taxes for the assets acquired in the Montierra and MacLondon Acquisition, while 2007 includes only approximately eight months for the assets acquired in the Montierra Acquisition and six months for the assets acquired in the MacLondon Acquisition.
Impairment. During the year ended December 31, 2008, we incurred an impairment charge of $1.7 million related to certain fields within our Minerals Segment as a result of the substantial decline in commodity prices during the fourth quarter of 2008. During the year ended December 31, 2007, we recorded an impairment charge of $5.7 million as a result of steeper decline rates in certain fields.
Depletion. Our depletion during the year ended December 31, 2008 was $7.8 million as compared to $8.0 million for the year ended December 31, 2008.
Corporate Segment
| | | Twelve Months Ending December 31, | |
| | | 2008 | | | 2007 | |
| | | ($ in thousands) | |
| Revenues: | | | | | | |
Realized commodity derivatives losses | | $ | (46,059 | ) | | $ | (3,061 | ) |
Unrealized commodity derivatives gains (losses) | | | 207,824 | | | | (130,773 | ) |
Total revenues | | | 161,765 | | | | (133,834 | ) |
General and administrative | | | 45,701 | | | | 27,799 | |
Depreciation and amortization | | | 787 | | | | 754 | |
Other expense | | | 10,699 | | | | 2,847 | |
Operating income (loss) | | | 104,578 | | | | (165,234 | ) |
| Other income (expense): | | | | | | | | |
Interest income | | | 793 | | | | 1,160 | |
Other income | | | 5,328 | | | | 696 | |
Interest expense | | | (32,884 | ) | | | (38,936 | ) |
Unrealized interest rate derivative losses | | | (27,717 | ) | | | (13,403 | ) |
Realized interest rate derivative gains (losses) | | | (5,214 | ) | | | 1,415 | |
Other expense | | | (955 | ) | | | (8,226 | ) |
Total other income (expense) | | | (60,649 | ) | | | (57,294 | ) |
Gain (loss) from continuing operations before taxes | | | 43,929 | | | | (222,528 | ) |
Income tax (benefit) provision | | | (1,134 | ) | | | 158 | |
Gain (loss) from continuing operations | | | 45,063 | | | | (222,686 | ) |
Discontinued operations | | | (18 | ) | | | (11 | ) |
Segment gain (loss) | | $ | 45,045 | | | $ | (222,697 | ) |
Revenue. Our Corporate Segment’s revenue, which solely includes our commodity derivatives activity, increased to a gain of $161.8 million for the year ended December 31, 2008, from a loss of $133.8 million for the year ended December 31, 2007. As a result of our commodity hedging activities, revenues include total realized losses of $46.1 million on risk management activity settled during the year ended December 31, 2008 and unrealized mark-to-market gains of $207.8 million for the year ended December 31, 2008, as compared to realized losses of $3.1 million and unrealized losses of $130.8 million for the year ended December 31, 2007. During the year ended December 31, 2008, our realized losses were partially offset by realized gains as a result of the hedge resets performed in the fourth quarter of 2008. In addition, we recorded amortization related to put premiums and costs associated with the resetting of derivative contract prices of $13.3 million during the year ended December 31, 2008 as compared to $8.2 million for the year ended December 31, 2007.
As the forward price curves for our hedged commodities shift in relation to the caps, floors, and swap strike prices, the fair value of such instruments changes. We capture this change as unrealized, non-cash, mark-to-market changes during the period of the change. The unrealized mark-to-market changes for the year ended December 31, 2008 and 2007 had no impact on cash activities for those periods and, as such, are excluded from our calculation of Adjusted EBITDA. The realized commodity derivatives results during the year ended December 31, 2008 reflect the difference between the strike prices and settlement prices for derivative volumes settled during the year. As such, the realized amounts impact our cash flows and are included in our calculation of Adjusted EBITDA.
General and Administrative Expenses. General and administrative expenses were $45.7 million for the year ended December 31, 2008 as compared to $27.8 million for the year ended December 31, 2007. This growth in general and administrative expenses was mostly driven by an increase in the number of employees in our corporate office as a result of: our midstream acquisitions in both 2008 and 2007; our expansion into the Minerals and Upstream Businesses related to the Montierra, Redman, EAC and Stanolind acquisitions in both 2008 and 2007; and recruiting efforts in accounting, engineering, land and operations. As a result of the acquisitions and recruiting efforts, corporate-office payroll expenses increased by $11.9 million for the year ended December 31, 2008 as compared to the same period in the prior year. In addition, other professional fees, including our public partnership expenses related to audit, tax, Sarbanes-Oxley compliance and other contract labor increased by $2.5 million for the year ended December 31, 2008. We also experienced increased miscellaneous general and administrative expenses of $1.0 million for the year ended December 31, 2008. At the present time, we do not allocate our general and administrative expenses to our operational segments. The Corporate Segment bears the entire amount.
For the years ended December 31, 2008 and 2007, non-cash compensation expense of approximately $6.0 million and $2.4 million, respectively, was recorded as general and administrative expense related to restricted units granted under the Partnership’s long-term incentive plan (“LTIP”).
General and administrative expenses also increased by $1.7 million in 2008 due to non-cash compensation expense allocated to us related to the issuance of Tier I incentive units by Eagle Rock Holdings, L.P. During 2008, Holdings granted 417,000 Tier I incentive interests in the aggregate to six Eagle Rock employees. One of these employees subsequently forfeited 200,000 of the interests upon his resignation from Eagle Rock in 2008. The Tier I incentive interests entitle the holder to immediately begin to share in the cash distributions of Holdings because the associated payout target was reached in 2006. Grants of Tier I incentive units by Holdings to employees working on our behalf are intended to provide additional motivation for those employees to create value at Holdings, in part through their actions to create value in the equity Holdings holds in us. Because the incentive interests represent an interest in the future profits of Holdings, and receive distributions only from the cash flow at Holdings, the value the incentive interests creates accrues to the benefit of our unitholders without any associated burden on, or dilution to, the returns on our common units. On the contrary, the incentive units are solely a burden on, and dilutive to, the returns of the equity owners of Holdings, including NGP as the substantial majority equity owner of Holdings. We have determined to record a portion of the value of the incentive units as compensation expense in our financial statements based on our estimate of the total value of the incentive unit grant and based on our estimate of the grantee’s portion of time dedicated to us.
Other Operating Expenses. In July 2008, SemGroup, L.P. and certain of its subsidiaries (“SemGroup”) filed petitions for reorganization under Chapter 11 of the U.S. Bankruptcy Code. We historically sold portions of our condensate production from our Texas Panhandle and East Texas midstream systems to SemGroup. During July 2008, we sold pre-bankruptcy, and continued to sell post-bankruptcy, condensate to SemGroup. As of August 1, 2008, we ceased all deliveries/sales of condensate to SemGroup. As a result of the bankruptcy we recorded a $10.7 million bad debt charge during the year ended December 31, 2008 which is included in “Other Operating Expense” in the consolidated statement of operations. Although we sought payment of our $10.7 million receivable for condensate sales as a critical supplier to SemGroup under its Supplier Protection Program (“SPP”), we were not successful in being recognized as a critical provider by SemGroup and thus were not admitted to the SPP.
For the year ended December 31, 2007, other operating expenses included a settlement of arbitration of $1.4 million, severance to a former executive of $0.3 million, and $1.1 million for liquidated damages related to the late registration of our common units.
Total Other Expense. Total other expense, which includes both realized and unrealized gains and losses from our interest rate swaps, increased to $61.5 million for the year ended December 31, 2008 as compared to $57.3 million for the year ended December 31, 2007. During 2008, we incurred realized losses from our interest rate swaps of $5.2 million as compared to realized gains of $1.4 million during the year ended December 31, 2007. We also incurred unrealized mark-to-market losses from our interest rate swaps of $28.6 million during the year ended December 31, 2008 as compared to unrealized mark-to-market losses of $13.4 for the same period in 2007. These unrealized mark-to-market losses did not have any impact on cash activities for the period, and are excluded by definition from our calculation of Adjusted EBITDA.
Interest expense, decreased to $32.9 million for the year ended December 31, 2008 as compared to $38.9 million during the same period in the prior year. The decrease in interest expense is due to the decrease in interest rates from December 31, 2007 to December 31, 2008 as well as lower interest rate margin under the new senior revolving credit facility, partially offset by higher debt balances.
Other income includes our equity in earnings of the partnerships described in Part I, Item 1. Business – Minerals Business (Ivory Working Interests, L.P and Ivory Acquisition Partners, L.P.). During the year ended December 31, 2008, we recorded income of $8.2 million. This income was partially offset by a loss on the sale of investments of $2.1 million due to the reversion of our interest in the IAP partnership. During the year ended December 31, 2007, we recorded income of $0.7 million related to the equity in earnings of the partnerships. In addition, other income for the year ended December 31, 2008 includes a $1.3 million gain on the sale of assets related to properties we sold.
Income Tax (Benefit) Provision. Income tax benefit recorded during the year ended December 31, 2008 reflects the Texas Margin Tax as recorded during the current year and offset by the reduction of the deferred tax liability created by the book/tax differences as a result of the federal income taxes associated with the Redman and Stanolind Acquisitions. For further discussion of our income tax (benefit) provision, see Note 15 to our consolidated financial statements included in Part II, Item 8. Financial Statements and Supplementary Data staring on page F-1 of this Annual Report.
Adjusted EBITDA
Adjusted EBITDA, as defined under Part II, Item 6. Selected Financial Data - Non-GAAP Financial Measures, increased by $116.1 million from $132.2 million for the year ended December 31, 2007 to $248.3 million for the year ended December 31, 2008.
As described above, revenues minus cost of natural gas and natural gas liquids for the Midstream Business (including the Texas Panhandle, East Texas/Louisiana, South Texas and Gulf of Mexico Segments) grew by $53.3 million during the year ended December 31, 2008, as compared to the comparable period in 2007. The acquisitions which led to our entry into our Upstream and Minerals Segments contributed an additional $150.1 million to revenues during the year ended December 31, 2008, as compared to the comparable period in 2007. Our Corporate Segment’s realized commodity derivatives loss decreased by $43.0 million during the year ended December 31, 2008 as compared to the comparable period in 2007. This resulted in $160.9 million of total incremental revenues minus cost of natural gas and natural gas liquids during the year ended December 31, 2008, as compared to the comparable period in 2007. The incremental revenue amounts are adjusted to exclude the impact of unrealized commodity derivatives not included in the calculation of Adjusted EBITDA.
Operating expenses (including taxes other than income) for our Midstream Business increased by $9.9 million for the year ended December 31, 2008, as compared to the same period in 2007, while the acquisitions which created the Upstream and Minerals Segments in 2007 and 2008 contributed additional Operating Expenses (including taxes other than income) of $22.5 million for the year ended December 31, 2008, as compared to the comparable period in 2007.
General and administrative expense, excluding the impact of non-cash compensation charges related to our long-term incentive program, Holding’s Tier I incentive units and other non-recurring items and captured within our Corporate Segment, increased during the year ended December 31, 2008 by $11.8 million, as compared to the respective period in 2007.
As a result, revenues (excluding the impact of unrealized commodity derivative activity) minus cost of natural gas and natural gas liquids for the year ended December 31, 2008, as compared to the same period in 2007 increased by $160.9 million, operating expenses increased by $32.4 million and general and administrative expenses increased by $11.8 million. The increases in revenues minus the cost of natural gas and natural gas liquids, offset by increases in operating costs and general and administrative expenses resulted in an increase to Adjusted EBITDA during the year ended December 31, 2008, as compared to the year ended December 31, 2007.
LIQUIDITY AND CAPITAL RESOURCES
Historically, our sources of liquidity have included cash generated from operations, equity investments by our existing owners, equity investments by other institutional investors and borrowings under our existing revolving credit facility. We believe that the cash generated from these sources will continue to be sufficient to meet our expected liquidity needs, which include our requirements for short-term working capital, long-term capital expenditures and our expected quarterly cash distributions; provided, however, that we are currently trying to reduce our leverage position and do not intend to borrow any significant amounts under our revolving credit facility in the near term.
Our distribution policy is to distribute to our unitholders, on a quarterly basis, all of our available cash in the manner described below and as further described in our partnership agreement. Available cash generally means, for any quarter ending prior to liquidation, all cash on hand at the end of that quarter less the amount of cash reserves that the general partner determines to establish to:
| | • | provide for the proper conduct of our business, including for future capital expenditures and credit needs; |
| | • | comply with applicable law or any partnership debt instrument or other agreement; or |
| | • | provide funds for distributions to unitholders and the general partner in respect of any one or more of the next four quarters. |
The actual distributions we will declare will be subject to our operating performance, prevailing market conditions (including forward oil, natural gas and sulfur prices), the impact of unforeseen events and the approval of our Board of Directors and will be done pursuant to our distribution policy.
In response to, in part, a lack of liquidity due to our high leverage levels and restricted access to the capital markets during 2009, our Board of Directors determined to reduce the quarterly distribution with respect to each quarter of 2009 to $0.025 per common and general partner unit, as compared to $0.41 per common, subordinated and general partner unit paid with respect to the fourth quarter of 2008. This decision was made to establish cash reserves (as against available cash) for the proper conduct of our business and to enhance our ability to remain in compliance with financial covenants under our revolving credit facility in future periods. The cash not distributed has been used to reduce our outstanding debt under our revolving credit facility, to continue to execute our hedge strategy to maintain future cash flows and/or to fund growth capital expenditures. For a discussion of the proposed cash distribution policy to be presented to our Board of Directors upon reaching our targeted total leverage ratio, see Part II, Item 5. Market for Registrant’s Common Equity, Related Unitholder Matters and Issuer Purchases of Equity Securities – Cash Distribution Policy.
Under the terms of the agreements governing our revolving credit facility, we are prohibited from declaring or paying any distribution to unitholders if a default or event of default (as defined in such agreements) exists. Our goal is to reduce our ratio of outstanding debt to Adjusted EBITDA, or “leverage ratio,” with respect to our Midstream and Minerals Businesses, which as of December 31, 2009 was 4.6 to approximately 3.0 to 3.5. We believe this leverage ratio range to be appropriate in light of these more turbulent economic conditions and more in-line with historical industry standards. Our leverage ratio was negatively impacted during the year ended December 31, 2009 by the effect of lower commodity prices on our Adjusted EBITDA. In response, we have taken steps to reduce our outstanding indebtedness under our revolving credit facility and to improve our Adjusted EBITDA position through prudent management of our hedging portfolio, including by hedge reset transactions. During the period from March 31, 2009 to December 31, 2009, we reduced our outstanding debt under the revolving credit facility by $83.0 million from $837.4 million to $754.4 million. Based primarily on our current expectations of continued depressed natural gas prices, decreased drilling activity and a smaller contribution to our Adjusted EBITDA from our hedge portfolio and not taking into consideration the Recapitalization and Related Transactions (described below), we do not expect to be able to maintain the same level of debt reduction achieved during 2009 for 2010. The actual amount and timing of further debt repayment will depend on a number of factors, including but not limited to, changes in commodity prices, our producer customers’ drilling plans, availability of external capital, and the potential consummation of asset acquisitions or divestitures, as well as future determinations of the borrowing base under our revolving credit facility and the effect of the Recapitalization and Related Transactions. We also plan to reduce our leverage ratio by investing in attractive organic growth opportunities in our Midstream Business which will increase our Adjusted EBITDA. Based on our strategy, we believe that we will remain in compliance with our financial covenants through 2010.
On December 21, 2009, we announced that we, through certain of our affiliates, had entered into definitive agreements with affiliates, of NGP and Black Stone to improve our liquidity and simplify our capital structure, which includes the sale of our Minerals Business to Black Stone for $174.5 million in cash. The Global Transaction Agreement was subsequently amended on January 12, 2010 to allow for greater flexibility in the payment of the contemplated transaction fee to Holdings, which is controlled by NGP. For further discussion of the definitive agreements, see Part II, Item 7. Management’s Discussion and Analysis of Financial Condition and Results of Operations – Overview – Recapitalization and Related Transactions. For a detailed description of our revolving credit facility, see Note 7 to our consolidated financial statements included in Part II, Item 8. Financial Statements and Supplementary Data and below under “Revolving Credit Facility and Debt Covenants.”
In the event that we acquire additional midstream assets or natural gas or oil properties at purchase prices that exceed our existing capital resources, we expect that we will finance those acquisitions with a combination of expanded or new debt facilities, cash reserves established by our general partner and new equity issuances. In light of our current leverage ratio and cost of capital, we expect our level of acquisition activity to be lower going forward than that which we experienced in 2008 and 2007.
Cash Flows
From January 1, 2008 through December 31, 2009, the key events that have had major impacts on our cash flows are:
| | • | the acquisition of Stanolind Oil and Gas Corp. on April 30, 2008, for which we paid $81.9 million in cash drawn from our revolver and cash on hand; and |
| | • | the acquisition of Millennium Midstream Partners, L.P. on October 1, 2008 for $210.6 million, including $183.4 million in cash drawn from our revolving credit facility and cash on hand, excluding amounts placed into an escrow account. |
Cash Distributions. On February 6, 2008, we declared a cash distribution of $0.3925 per unit for the fourth quarter ended December 31, 2008. The distribution was paid February 15, 2008 to all unitholders of record as of February 11, 2008, including the general partner and Holdings (on the general partner units and subordinated units, respectively).
On April 30, 2008, we declared a cash distribution of $0.40 per unit for the first quarter ended March 31, 2008. The distribution was paid May 15, 2008 to all unitholders of record as of May 9, 2008, including the general partner and Holdings (on the general partner units and subordinated units, respectively).
On July 29, 2008, we declared a cash distribution of $0.41 per unit for the second quarter ended June 30, 2008. The distribution was paid on August 14, 2008, to all unitholders of record as of August 8, 2008, including the general partner and Holdings (on the general partner units and subordinated units, respectively).
On October 29, 2008, we declared a cash distribution of $0.41 per unit for the third quarter ended September 30, 2008. The distribution was paid on November 14, 2008, to all unitholders of record as of November 7, 2008, including the general partner and Holdings (on the general partner units and subordinated units, respectively), but not including common unitholders who acquired common units in the Millennium Acquisition.
On February 4, 2009, we declared a $0.41 per unit distribution on all outstanding units (including common units, general partner units, and subordinated units) for the fourth quarter of 2008, payable on February 13, 2009 to the unitholders of record on February 10, 2009. The distribution to the common units, general partner units and subordinated units was paid on February 13, 2009.
On April 29, 2009, we declared our first quarter 2009 cash distribution to its common unitholders of record as of May 11, 2009. The distribution amount was $0.025 per common unit, or approximately $1.4 million. In addition, pursuant to the terms of the Partnership’s partnership agreement, the Partnership’s general partner received a distribution of $0.025 per general partner unit. The distribution was paid on May 15, 2009.
On July 29, 2009, we declared our second quarter 2009 cash distribution of $0.025 per unit to its general partner (as to its general partner units) and its common unitholders of record as of August 10, 2009. The distribution amount was approximately $1.4 million. The distribution was paid on August 14, 2009.
On October 28, 2009, we declared our third quarter 2009 cash distribution of $0.025 per unit to its general partner (as to its general partner units) and its common unitholders of record as of November 9, 2009. The distribution amount was approximately $1.4 million. The distribution was paid on November 13, 2009.
On February 2, 2010, we declared our fourth quarter 2009 cash distribution of $0.025 per unit to its general partner (as to its general partner units) and its common unitholders of record as of February 8, 2010. The distribution was paid on February 12, 2010.
Working Capital. Working capital is the amount by which current assets exceed current liabilities and is a measure of our ability to pay our liabilities as they become due. As of December 31, 2009, working capital was a negative $57.0 million as compared to positive $57.3 million as of December 31, 2008.
The net decrease in working capital of $114.3 million from December 31, 2008 to December 31, 2009, resulted primarily from the following factors:
| | • | cash balances and marketable securities, net of due to affiliates, decreased overall by $23.6 million and was impacted primarily by the distributions paid on February 15, 2009 with respect to the fourth quarter of 2008 financial results, the results of operations, timing of capital expenditures payments, and financing activities including our debt activities (the due to affiliate liability of $12.9 million as of December 31, 2009 is owed to Eagle Rock Energy G&P, LLC); |
| | • | trade accounts receivable decreased by $24.8 million primarily from the impact of lower commodity prices on our consolidated revenue; |
| | • | risk management net working capital balance decreased by a net $112.2 million as a result of the changes in current portion of the mark-to-market unrealized positions, increased other derivative costs, which includes the unwinding of long-term positions to purchase current positions (see Hedging Strategy), and amortization of the put premiums and other derivative costs; |
| | • | accounts payable decreased by $38.5 million from December 31, 2008 primarily as a result of activities and timing of payments, including capital expenditures activities and lower commodity prices; and |
| | • | accrued liabilities decreased by $8.5 million primarily reflecting payment of employee benefit accruals, lower interest payments and the timing of payment of unbilled expenditures related primarily to capital expenditures. |
Cash Flows Year Ended 2009 Compared to Year Ended 2008
Cash Flow from Operating Activities. Cash flows from operating activities decreased $84.2million during 2009 as compared to 2008 as a result of lower commodity prices across our three businesses and reduced NGL equity volumes in the Midstream Business. These lower commodity prices resulted in lower cash flows from the sale of our equity crude oil, natural gas and natural gas liquids volumes. In addition, during 2009, we incurred expenses of $2.2 million as the cost to dispose sulfur exceeded the sales price, compared to 2008 in which we recorded revenue related to the sale of sulfur of $37.8 million. The lower commodity prices also had a direct result in the decrease in our working capital. Specifically contributing to the decrease in cash flows from operating activities was the $37.0 million decrease in accounts payable, as discussed above. Lower commodity prices also resulted in us realizing settlement gains during the year ended December 31, 2009, of which $8.9 million of cash received was reclassified to cash from financing activities, compared to $11.1 million of payments being reclassified during 2008. In addition, our cash flows from operating activities for 2009 includes payments of $19.6 million to reset certain derivative contracts and $5.6 million to unwind certain derivative contracts, as discussed within “Hedging Strategy” below.
Cash Flows from Investing Activities. Cash flows used for investing activities for 2009, as compared to 2008, decreased by $295.7 million due to acquisitions completed in 2008. During 2008, we paid $262.2 million, net of cash acquired, for our acquisitions. During the 2009, we did not make any acquisitions. The investing activities for the current period reflect additions to property, plant and equipment expenditures of $36.1 million versus $66.7 million for the prior year period. This decrease is attributable to lower well-connect activity in our Midstream Business resulting from the reduced drilling activity of our producer customers, as well as lower capital spending associated with the maintenance of our Big Escambia Creek (“BEC”) facility, for which we performed a scheduled turnaround during 2008.
Cash Flows from Financing Activities. Cash flows used for financing activities during 2009, were $73.3 million versus cash flows provided by financing activities of $102.8 during 2008. Key differences between periods include net payments to our revolving credit facility of $45.0 million during 2009, as compared to net proceeds of $232.3 million from our revolving credit facility during 2008. The net proceeds received during 2008, were used for our acquisitions of Stanolind and MMP. Distributions to members decreased to $35.7 million during 2009, as compared to $117.6 million during 2008 as a result of reducing our quarterly distribution to $0.025 from $0.41, as discussed above
Cash Flows Year Ended 2008 Compared to Year Ended 2007
Cash Flow from Operating Activities. The increase of $74.2 million during the current year is the result of increased income from the acquired assets, the growth capital expenditure projects and rising commodity prices during the first half of 2008. During 2007, we made five acquisitions throughout the year. We had the benefit of the cash flows generated by the assets acquired for the entire year during 2008, compared to only portions of the year during 2007. During 2008, we also made two acquisitions, one during our second quarter and the other during our fourth quarter. Our average realized prices for crude, natural gas and NGLs were higher in 2008 as compared to 2007. In addition, our revenue from sulfur sales in our Upstream Segment was $37.8 million in 2008 compared to only $2.6 million in 2007. This was a result of twelve months of production in 2008, compared to only five months of production in 2007 and of prices peaking at $600 per long ton during 2008. In 2008, our average realized price for sulfur was $360 per long ton, compared to $59 per long ton in 2007. See Part II, Item 7. Management’s Discussion and Analysis of Financial Condition and Results of Operations – Year Ended December 31, 2008 Compared with Year Ended December 31, 2007 for a further discussion of the impact of the volatility in commodity prices. Higher commodity prices also resulted in us realizing settlement losses during 2008, of which $11.1 million of payments was reclassified to cash from financing activities, compared to $1.7 million reclassed during 2007. In addition, our cash flows from operating activities for 2008 includes payments $19.2 million for put premiums and to reset certain derivative contracts, compared to payments of $9.1 million during 2007.
Cash Flows from Investing Activities. Cash flows used by investing activities for the year ended December 31, 2008, as compared to the year ended December 31, 2007, decreased by $141.2 million. During 2008, we paid $262.2 million, net of cash acquired, to acquire Stanolind and MMP, while during 2007; we paid $407.6 million, net of cash acquired, to complete our Montierra, Laser, MacLondon, Escambia and Redman Acquisitions. Our investing activities for the current year reflect a slightly higher capital expenditure level of $66.7 million versus $66.1 million for the year ended 2007. During 2008, our capital expenditures related to our Stinnett-Cargray plant consolidation project in our Panhandle Segment, drilling, recompletions and capital workover projects in our Upstream Segment and a scheduled turnaround at our BEC facility. During 2007, our capital expenditures related to the completion of our Red Deer plant in our Panhandle Segment, which was driven by heavy drilling activity in the Granite Wash play and the completion of our Tyler County Pipeline Extension and Brookeland Gathering System expansion in our East Texas/Louisiana Segment to meet the active Austin Chalk play.
Cash Flows from Financing Activities. Cash flows provided by financing activities for the year ended December 31, 2008 decreased by $324.0 million over the year ended December 31, 2007. During 2007, we completed two private placement equity offerings, which raised $331.1 million, net of offering costs. The proceeds from these two offering were used to fund our acquisition in 2007. We did not raise any proceeds from equity issuances during 2008. During 2008, we incurred net borrowings of $232.3 million, which was used to help fund our acquisitions of Stanolind and MMP. During 2007, we incurred net borrowings of $161.3 million, which was used to help fund our Escambia Acquisition and capital expenditures. Distributions to members increased to $117.6 million during 2008, as compared to $59.5 million in 2007, as a result of an increase in the number of outstanding units due to units issued to the sellers of our acquisitions and the private placement equity offerings, a full year of distributing to the subordinated and general partner units and increases in our quarterly distribution.
Capital Requirements
We anticipate that we will have sufficient liquidity and access to capital to continue to maintain and commercially exploit our Midstream Business (all four segments), Upstream Segment, and Mineral Segment assets consistent with our current operations. Additionally, as an operator of midstream and upstream assets, our capital requirements have increased to maintain those assets, hold production and throughput constant and to replace reserves. We anticipate that we will meet these requirements through cash generated from operations. We believe, however, that substantial growth would require access to external capital sources. At this time, we cannot provide assurances that we will be able to obtain the necessary capital under terms acceptable to us.
The energy business can be capital intensive, requiring significant investment for the acquisition or development of new facilities. We categorize our capital expenditures as either:
| | | growth capital expenditures, which are made to acquire additional assets to increase our business, to expand and upgrade existing systems and facilities or to construct or acquire similar systems or facilities in our Midstream Business (and our Upstream Business with respect to the Big Escambia Plant and other Alabama plants and facilities), or grow our production in our Upstream Business; or |
| | | maintenance capital expenditures, which are made to replace partially or fully depreciated assets, to meet regulatory requirements, to maintain the existing operating capacity of our assets and extend their useful lives, or to connect wells to maintain existing system volumes and related cash flows in our Midstream Business (and in our Upstream Business with respect to the Big Escambia Plant and other Alabama plants and facilities; in our Upstream Business, maintenance capital also includes capital which is expended to maintain our production in the near future. |
Our 2009 capital budget anticipated that we would spend approximately $40 million in total in 2009 on maintenance and growth capital. We actually spent approximately $36.4 million in total in 2009.
Our 2010 capital budget anticipates that we will spend approximately $40 million in total for the year. This budget includes capital expenditures for growth, maintenance and well connect projects in both our Midstream and Upstream Segments. We intend to finance our capital expenditures with internally generated cash flow and draws from our Revolving Credit Facility.
Since our inception in 2002, we have made substantial growth capital expenditures. We anticipate that when economic conditions allow us, we will continue to make growth capital expenditures and acquisitions; however, we anticipate that our expenditures and acquisitions in 2010 will not return to the levels maintained by us prior to 2009. We continually review opportunities for both organic growth projects and acquisitions which will enhance our financial performance. De-levering our business by reducing our debt and enhancing our liquidity and access to new capital such that we once again have the ability to develop and maintain sources of funds to meet our capital requirements are critical to our ability to meet our growth objectives over the long-term.
We historically have financed our maintenance capital expenditures (including well-connect costs) with internally generated cash flow and our growth capital expenditures ultimately with draws from our revolving credit facility (although such expenditures were often funded out of internally generated cash flow as an interim step). We anticipate funding our growth capital expenditures, for the foreseeable future, out of cash flow generated from operations, and, to the extent necessary, with draws from our revolving credit facility.
Hedging Strategy
We use a variety of hedging instruments to accomplish our risk management objectives. At times our hedging strategy may involve entering into hedges with strike prices above current futures prices or resetting existing hedges to higher price levels in order to meet our cash flow requirements, stay in compliance with our revolving credit facility covenants and continue to execute on our distribution objectives. In addition, we may also terminate or unwind hedges or portions of hedges when the expected future volumes do not support the level of hedges. Hedge transactions such as these impact our liquidity in that we are required to pay the present value of the difference between the hedged price and the current futures price. These transactions also increase our exposure to the counterparties through which we execute the hedges. As part of this strategy, we executed the following hedging transactions during the year ended December 31, 2009;
| · | On January 8, 2009, we executed a series of hedging transactions that involved the unwinding of a portion of existing “in-the-money” 2011 and 2012 WTI crude oil swaps and collars, and the unwinding of two “in-the-money” 2009 WTI crude oil collars. With these transactions, and an additional $13.9 million of cash, we purchased a 2009 WTI crude oil swap on 60,000 barrels per month beginning January 1, 2009 at $97 per barrel. |
| · | On October 8, 2009, we unwound a portion of an “in-the-money” 2009 WTI crude oil swap and reset the remaining portion. For the first part of the transaction, we bought 3,000 barrels per month for the months of November and December of 2009, for which we received $0.1 million for the counterparty. For the second part of the transaction, we reset from $97.00 to $135.00 the remaining 57,000 barrels a month for the months of November and December of 2009, for which we paid the counterparty $4.3 million. |
| · | On November 2, 2009, the Partnership reset a 2010 WTI crude oil swap, from $53.55 to $95.00, the swap price for 45,000 barrels a month for the months of January, February and March 2010, for which the Partnership paid the counterparty $5.7 million. |
| · | On December 17, 2009, we entered into a series of hedging transactions to unwind existing contracts. We unwound three “out-of-the-money” 2010 WTI crude oil collars; (i) 5,000 barrels a month with a floor of $50.00 and a cap of $68.00, (ii) 15,000 barrels a months with a floor of $50.00 and a cap of $67.50 and (iii) 15,000 barrels a months with a cap of $50.00 and a cap of $68.30. In addition, we unwound 7,000 barrels a month of a 10,000 barrels a month “in the money” swap with a price of $78.35. For these transactions we paid $5.6 million. We were using these WTI crude oil derivatives to hedge against changes in NGL prices. To continue hedging these NGL volumes, we then entered into the following derivative transactions for the 2010 calendar year on December 17, 2009: a 1,478,400 gallon per month OPIS propane swap at $1.091 per gallon, a 348,600 gallon per month OPIS iso-butane swap at $1.404 per gallon, a 705,600 gallon per month OPIS normal butane swap at $1.374 per gallon and a 184,800 gallon per month OPIS natural gasoline swap at $1.646 per gallon. |
For a further discussion of our hedging strategy, see Note 11 to our consolidated financial statements included in Part II, Item 8. Financial Statements and Supplementary Data starting on page F-1 of this Annual Report. For a detail of our open derivative positions as of December 31, 2009, see Part II, Item 7A. Qualitative and Quantitative Disclosure About Market Risk.
Revolving Credit Facility
On December 13, 2007, we entered into a credit agreement with Wachovia Bank, National Association, as administrative agent and swing line lender, Bank of America, N.A., as syndication agent; HSH Nordbank AG, New York Branch; the Royal Bank of Scotland, plc; and BNP Paribas, as co-documentation agents, and the other lenders who are parties to the agreement with aggregate commitments of up to $800 million. During the year ended December 31, 2008, we exercised $180 million of our $200 million accordion feature under the revolving credit facility, which increased the total commitment to $980 million. Pursuant to the revolving credit facility, we may, at our request and subject to the terms and conditions of the revolving credit facility, increase our commitments by an additional $20 million to an aggregate of $1 billion. Subsequently, as a result of Lehman Brothers’ bankruptcy filing, the amount of available commitments was reduced by the unfunded portion of Lehman Brother’s commitment in an amount of approximately $9.1 million to a total of $970.9 million and the potential increase in commitments by approximately $0.5 million to a total of approximately $19.5 million. As of December 31, 2009, unused capacity available to us under the new credit agreement, based on outstanding debt and compliance with financial covenants as of that date, was approximately $60.5 million. The credit agreement is scheduled to mature on December 13, 2012.
Given the current state of the banking industry worldwide, we are pleased with the degree of diversification within our lender group. Our revolving credit facility includes the participation of 19 financial institutions. As of today, all of our banks’ commitments, with the exception of Lehman Brothers’ commitment, remain in place and have funded in response to our borrowing notices. A Lehman Brothers subsidiary has an approximately 2.6% participation in our revolving credit facility.
We announced in October 2009 that our existing borrowing base of $135 million under our revolving credit facility was reaffirmed by our commercial lenders as a result of our regularly scheduled semi-annual borrowing base redetermination. The reaffirmation is effective as of October 1, 2009, with no additional fees or increases in interest rate spread incurred.
Debt Covenants
Our revolving credit facility accommodates, through the use of a borrowing base for our Upstream Business and traditional cash-flow based covenants for our Midstream and Minerals Businesses, the allocation of indebtedness to either our Upstream Business (to be measured against the borrowing base) or to our Midstream and Minerals Businesses (to be measured against the cash-flow based covenant). At December 31, 2009, we were in compliance with our covenants under the revolving credit facility. Our interest coverage ratio, as defined in the credit agreement (i.e., Consolidated EBITDA divided by Consolidated Interest Expense), was 4.7 as compared to a minimum interest coverage covenant of 2.5, and our leverage ratio, as defined in the credit agreement (i.e., Total Funded Indebtedness divided by Adjusted Consolidated EBITDA), was 4.6 as compared to a maximum leverage ratio of 5.0. Primarily as a result of lower expected future commodity prices, our borrowing base was re-determined in April 2009 to $135 million (which resulted in a higher allocation of indebtedness to our Midstream and Minerals Businesses). The reduction in borrowing base was a contributing factor to the decrease in our quarterly distribution (as discussed above). It also contributed to our taking steps to reduce our leverage. The $135 million borrowing base was reaffirmed effective October 1, 2009. Our covenant compliance throughout 2009 was benefited substantially from the contributions of our hedging portfolio. Absent any changes to the current hedge positions in place for 2010, we anticipate a lower contribution from our hedges in 2010, which, among other factors, could result in us exceeding the allowable covenant levels in the revolving credit facility. Our strategies to remain in compliance include (i) the liquidity enhancements contemplated in the Recapitalization and Related Transactions, (ii) asset sales, and/or (iii) enhancements to our hedging portfolio (including through hedge reset transactions). Based on our strategy, we believe that we will remain in compliance with our financial covenants through 2010.
Off-Balance Sheet Obligations.
We have no off-balance sheet transactions or obligations.
Total Contractual Cash Obligations.
The following table summarizes our total contractual cash obligations as of December 31, 2009.
| | | Payments Due by Period |
| | | |
| Contractual Obligations | | Total | | | | 2010 | | | | 2011 | | | | 2012 | | | | 2013-2014 | | | | Thereafter | |
| | | ($ in millions) | |
Long-term debt (including interest)(1) | | $ | 863.8 | | | $ | 36.0 | | | $ | 37.1 | | | $ | 790.7 | | | $ | — | | | $ | — | |
Operating leases | | | 15.7 | | | | 3.5 | | | | 3.1 | | | | 2.7 | | | | 1.6 | | | | 4.8 | |
Purchase obligations(2) | | | — | | | | — | | | | — | | | | — | | | | — | | | | — | |
Total contractual obligations | | $ | 879.5 | | | $ | 39.5 | | | $ | 40.2 | | | $ | 793.4 | | | $ | 1.6 | | | $ | 4.8 | |
| (1) | Assumes our fixed swapped average interest rate of 3.56% for 2010 and 3.76% for the remaining periods plus the applicable margin under our amended and restated credit agreement, which remains constant in all periods. |
| (2) | Excludes physical and financial purchases of natural gas, NGLs, and other energy commodities due to the nature of both the price and volume components of such purchases, which vary on a daily or monthly basis. Additionally, we do not have contractual commitments for fixed price and/or fixed quantities of any material amount. |
Recent Accounting Pronouncements
The Financial Accounting Standards Board (the “FASB”) has codified a single source of U.S. Generally Accepted Accounting Principles (U.S. GAAP), the Accounting Standards Codification. Unless needed to clarify a point to readers, the Partnership will refrain from citing specific section references when discussing application of accounting principles or addressing new or pending accounting rule changes.
In December 2007, the FASB issued authoritative guidance to require that all assets, liabilities, contingent consideration, contingencies and in-process research and development costs of an acquired business be recorded at fair value at the acquisition date; that acquisition costs generally be expensed as incurred; that restructuring costs generally be expensed in periods subsequent to the acquisition date; and that changes in accounting for deferred tax asset valuation allowances and acquired income tax uncertainties after the measurement period impact income tax expense. The guidance is effective for business combinations for which the acquisition date is on or after the beginning of the first annual reporting period beginning on or after December 15, 2008, with the exception for the accounting for valuation allowances on deferred tax assets and acquired tax contingencies associated with acquisitions. The guidance amends previous guidance such that adjustments made to valuation allowances on deferred taxes and acquired tax contingencies associated with acquisitions that closed prior to the effective date of the amended guidance would also apply the provisions of such guidance. The guidance was effective for us as of January 1, 2009 but the impact of the adoption on our consolidated financial statements will depend on the nature and the extent of business combinations occurring after January 1, 2009.
In December 2007, the FASB issued authoritative guidance which requires that accounting and reporting for minority interests will be recharacterized as noncontrolling interests and classified as a component of equity. The guidance also establishes reporting requirements that provide sufficient disclosures that clearly identify and distinguish between the interests of the parent and the interests of the noncontrolling owners. This Statement is effective as of the beginning of an entity’s first fiscal year beginning after December 15, 2008. The guidance was effective for us as of January 1, 2009 and did not have a material impact on its consolidated results of operations or financial position as we have no noncontrolling interests.
In February 2008, the FASB issued authoritative guidance that permitted the delayed application of fair value measurement for all nonfinancial assets and nonfinancial liabilities, except those that are recognized or disclosed at fair value in the financial statements on at least an annual basis, until fiscal years beginning after November 15, 2008. Non-financial assets and liabilities that we measure at fair value on a non-recurring basis consists primarily of property, plant and equipment, and intangible assets, which are subject to fair value adjustments in certain circumstances (for example, when there is evidence of impairment). (See Note 10).
In March 2008, the FASB issued authoritative guidance requiring enhanced disclosures to help investors better understand the effect of an entity’s derivative instruments and related hedging activities on its financial position, financial performance, and cash flows. The guidance was effective for us as of January 1, 2009. (See Note 11).
In March 2008 the FASB approved authoritative guidance which requires that master limited partnerships use the two-class method of allocating earnings to calculate earnings per unit. This guidance is effective for fiscal years and interim periods beginning after December 15, 2008. The guidance was effective for us as of January 1, 2009 and the impact on its earnings per unit calculation has been retrospectively applied to 2008 and 2007. (see Note 16).
In April 2008, the FASB issued authoritative guidance which amends the factors that should be considered in developing renewal or extension assumptions used to determine the useful life of a recognized intangible asset. The intent of guidance is to improve the consistency between the useful life of a recognized intangible asset and the period of expected cash flows used to measure the fair value of the asset. This guidance must be applied prospectively to intangible assets acquired after the effective date. The guidance was effective for us as of January 1, 2009 but the impact of the adoption on our consolidated financial statements will depend on the nature and the extent of business combinations occurring after January 1, 2009.
In June 2008, the FASB issued authoritative guidance which affects entities that accrue cash dividends on share-based payment awards during the awards’ service period when dividends do not need to be returned if the employees forfeit the awards. This guidance is effective for fiscal years beginning after December 15, 2008 and earnings-per-unit calculations would need to be adjusted retroactively. The guidance was effective for us as of January 1, 2009 and the impact on its earnings per unit calculation has been retrospectively applied to September 30, 2008. (See Note 16).
In December 2008, the SEC issued authoritative guidance related to the modernization of oil and gas reporting, which amends the oil and gas disclosures for oil and gas producers and codifies the revised disclosure requirements. The goal is to provide investors with a more meaningful and comprehensive understanding of oil and gas reserves. Energy companies affected by this guidance are now required to price proved oil and gas reserves using the unweighted arithmetic average of the price on the first day of each month within the 12-month period prior to the end of the reporting period, unless prices are defined by contractual arrangements, excluding escalations based on future conditions. This guidance is effective beginning for financial statements for fiscal years ending on or after December 31, 2009. The impact on our operating results, financial position and cash flows has been recorded in the financial statements; additional disclosures were added to the accompanying notes to the consolidated financial statements for our supplemental oil and gas disclosure.
In January 2010, the FASB issued updated authoritative guidance which aligns the current oil and natural gas reserve estimation and disclosure requirements of the Extractive Industries - Oil and Gas guidance, as discussed above. This guidance expands the disclosures required for equity method investments, revises the definition of oil- and natural gas-producing activities to include nontraditional resources in reserves unless not intended to be upgraded into synthetic oil or natural gas, amends the definition of proved oil and natural gas reserves to require 12-month average pricing in estimating reserves, amends and adds definitions in the Master Glossary that is used in estimating proved oil and natural gas quantities and provides guidance on geographic areas with respect to disclosure of information about significant reserves. This guidance must be applied prospectively as a change in accounting principle that is inseparable from a change in accounting estimate and is effective for entities with annual reporting periods ending on or after December 31, 2009. We adopted this guidance effective December 31, 2009. (See Note 21).
In April 2009, the FASB issued authoritative guidance amending the other-than-temporary impairment guidance for debt securities to make the guidance more operational and to improve the presentation and disclosure of other-than-temporary impairments in the financial statements. The most significant change is a revision to the amount of other-than-temporary loss of a debt security recorded in earnings under certain circumstances. This guidance was effective for us as of June 30, 2009 and did not have a material impact on its consolidated financial statements.
In April 2009, the FASB issued authoritative guidance which provides additional guidance for estimating fair value when the volume and level of activity for the asset or liability have significantly decreased. The guidance also includes guidance on identifying circumstances that indicate a transaction is not orderly and emphasizes that even if there has been a significant decrease in the volume and level of activity for the asset or liability and regardless of the valuation technique(s) used, the objective of a fair value measurement remains the same. Fair value is the price that would be received to sell an asset or paid to transfer a liability in an orderly transaction (that is, not a forced liquidation or distressed sale) between market participants at the measurement date under current market conditions. This guidance was effective for us as of June 30, 2009 and did not have a material impact on its consolidated financial statements.
In April 2009, the FASB issued authoritative guidance to require disclosures about fair value of financial instruments for interim reporting periods of publicly traded companies as well as in annual financial statements. The guidance also requires those disclosures in summarized financial information at interim reporting periods. The guidance was effective for us as of June 30, 2009. (See Note 10).
In April 2009, the FASB issued authoritative guidance which amended and clarified previous guidance with respect to contingencies. The guidance provides that an acquirer shall recognize at fair value, at the acquisition date, an asset acquired or a liability assumed in a business combination that arises from a contingency if the acquisition-date fair value of that asset or liability can be determined during the measurement period. If the acquisition-date fair value of an asset acquired or a liability assumed in a business combination that arises from a contingency cannot be determined using the measurement period, the previous guidance shall apply.” This guidance was effective for us as of January 1, 2009 but the impact of the adoption on our consolidated financial statements will depend on the nature and the extent of business combinations occurring after January 1, 2009.
In May 2009, the FASB issued authoritative guidance which provides guidance on our assessment of subsequent events. Historically, we have relied on U.S. auditing literature for guidance on assessing and disclosing subsequent events. The guidance clarifies that we must evaluate, as of each reporting period, events or transactions that occur after the balance sheet date “through the date that the financial statements are issued or are available to be issued.” We must perform its assessment for both interim and annual financial reporting periods prospectively. The guidance was effective for us as of June 30, 2009 but the impact of the adoption will depend on the nature and the extent of transactions that occur subsequent to our interim and annual reporting periods. New guidance was issued on February 25, 2010 which requires SEC registrants to evaluate subsequent events through the date that the financial statements are issued.
In June 2009, the FASB issued authoritative guidance which reflects the FASB’s response to issues entities have encountered when applying previous guidance. In addition, this guidance addresses concerns expressed by the SEC, members of the United States Congress, and financial statement users about the accounting and disclosures required in the wake of the subprime mortgage crisis and the deterioration in the global credit markets. In addition, because this guidance eliminates the exemption from consolidation for qualified special-purpose entities (“QSPEs”) a transferor will need to evaluate all existing QSPEs to determine whether they must be consolidated. The guidance is effective for financial asset transfers occurring after the beginning of an entity’s first fiscal year that begins after November 15, 2009. Early adoption of is prohibited. We are currently evaluating the potential impact, if any, of the adoption of this guidance on its financial statements.
In June 2009, the FASB issued authoritative guidance, which amends the consolidation guidance applicable to variable interest entities (VIEs). The amendments will significantly affect the overall consolidation analysis. While the FASB’s discussions leading up to the issuance of this guidance focused extensively on structured finance entities, the amendments to the consolidation guidance affect all entities and enterprises, as well as qualifying special-purpose entities (QSPEs) that were excluded from previous guidance. Accordingly, an enterprise will need to carefully reconsider its previous conclusions, including (1) whether an entity is a VIE, (2) whether the enterprise is the VIE’s primary beneficiary, and (3) what type of financial statement disclosures are required. This guidance is effective as of the beginning of the first fiscal year that begins after November 15, 2009, and early adoption is prohibited. We are currently evaluating the potential impact, if any, of the adoption on its financial statements.
In June 2009, the FASB established the FASB Accounting Standards Codification (“ASC”) as the single source of authoritative U.S. generally accepted accounting principles (“U.S. GAAP”) recognized by the FASB to be applied by nongovernmental entities. Rules and interpretive releases of the United States Securities and Exchange Commission (“SEC”) under authority of federal securities laws are also sources of authoritative U.S. GAAP for SEC registrants. The Codification did not have a material impact on the Partnership’s consolidated financial statements upon adoption. Accordingly, our notes to consolidated financial statements will explain accounting concepts rather than cite the topics of specific U.S. GAAP.
In September 2009, the FASB issued a consensus which revises the standards for recognizing revenue on arrangements with multiple deliverables. Before evaluating how to recognize revenue for transactions with multiple revenue generating activities, an entity should identify all the deliverables in the arrangement and, if there are multiple deliverables, evaluate each deliverable to determine the unit of accounting and whether it should be treated separately or in combination. The consensus removes certain thresholds for separation, provides criteria for allocation of revenue amongst deliverables and expands disclosure requirements. The standards will be effective June 1, 2010, for fiscal year 2011, unless we elect to early adopt the standards. We have not yet evaluated the impact these standards will have on its financial position or results of operations. We have not determined if it will early adopt the standards.
In September 2009, the FASB issued an amendment to authoritative guidance to address the need for additional implementation guidance on accounting for uncertainty in income taxes and to specifically address the following questions, (1) is income tax paid by the entity attributable to the entity or its owners, (2) what constitutes a tax position for a pass-through entity or a tax-exempt not-for-profit entity and (3) how should accounting for uncertainty in income taxes be applied when a group of related entities comprise both taxable and nontaxable entities. This amendment is effective for interim and annual periods ended after September 15, 2009. The adoption of this guidance had no material impact on our financial statements.
| Item 7A. | Quantitative and Qualitative Disclosures About Market Risk. |
Risk and Accounting Policies
We are exposed to market risks associated with adverse changes in commodity prices, interest rates and counterparty credit. We may use financial instruments such as put and call options, swaps and other derivatives to mitigate the effects of the identified risks. Adverse effects on our cash flow from changes in crude oil, natural gas, NGL product prices or interest rates could adversely impact our ability to make distributions to our unitholders, meet debt service obligations, fund required capital expenditures, and other similar requirements. Our management has established a comprehensive review of our market risks and has developed risk management policies and procedures to monitor and manage these market risks. Our general partner is responsible for the overall approval of market risk management policies, delegation of transaction authority levels, and for the establishment of a Risk Management Committee. The Risk Management Committee is composed of officers (including, on an ex officio basis, our chief executive officer) who receive regular briefings on positions and exposures, credit exposures and overall risk management in the context of market activities. The Risk Management Committee is responsible for the overall management of commodity price risk, interest rate risk and credit risk, including monitoring exposure limits.
See Part II, Item 7. Management’s Discussion and Analysis of Financial Condition and Results of Operations —Critical Accounting Policies and Estimates — Risk Management Activities and Note 11 to our consolidated financial statements included in Part II, Item 8. Financial Statements and Supplementary Data starting on page F-1 for further discussion of the accounting for our derivative contracts.
Commodity Price Risk
We are exposed to the impact of market fluctuations in the prices of crude oil, natural gas, NGLs and other commodities as a result of our gathering, processing, producing and marketing activities, which produce a naturally long position in these commodities. Our profitability and cash flow are affected by changes in prices of these commodities. These prices are impacted by changes in the supply and demand for these commodities, as well as market uncertainty and other factors beyond our control. Historically, changes in the prices of NGLs have generally correlated with changes in the price of crude oil. For a discussion of the volatility of crude oil, natural gas and NGL prices, please read “Risk Factors.”
We manage this commodity price exposure through an integrated strategy that includes management of our contract portfolio, matching sales prices of commodities with purchases, optimization of our portfolio by monitoring basis and other price differentials in our areas of operations, and the use of derivative contracts. Crude oil, natural gas and NGL prices can also indirectly affect our profitability by influencing the level of drilling activity and related opportunities for our service.
The Risk Management Committee (“RMC”) is the entity responsible for creating and implementing a sound approach to managing our commodity price risk with respect to our budgetary exposure and stated risk tolerance. As such, the RMC’s responsibilities and authorities are to:
| | • | Identify sources of financial risk; |
| | • | Establish risk management policies (or ensure they are developed by appropriate departments within the partnership); |
| | • | Develop, oversee, review, assess and implement the risk management processes and infrastructure; |
| | • | Establish controls for risk management activities, including hedging transactions and financial reporting; |
| | • | Measure and analyze our overall commodity price risk exposure, at least quarterly; |
| | • | Recommend and approve hedging transactions to reduce our commodity price risk; and |
| | • | Report quarterly to the Board of Directors on the performance of the hedge program. These reports should disclose, but may not necessarily be limited to, the following: open hedge position volumes; percentage of volumes and debt outstanding hedged; mark-to-market valuations of open positions; cash-flow-at-risk reports; and settlement reports. |
The Risk Management Committee is charged with the following:
| | • | Establishing an organizational structure for risk management controls; |
| | • | Developing and enforcing policies related to setting and following acceptable risk parameters and risk limits; |
| | • | Establishing clearly-defined segregation of duties and delegations of authority; |
| | • | Identifying permitted transaction and product types; |
| | • | Establishing and enforcing counterparty credit limitations; and |
| | • | Developing and executing policies for risk reporting. |
The Audit Committee of our Board of Directors monitors the implementation of our policy, and we have engaged an independent firm to provide additional oversight.
We frequently use financial derivatives (“hedges”) to reduce our exposure to commodity price risk. We have implemented a Risk Management Policy which allows management to execute crude oil, natural gas liquids and natural gas hedging instruments, which may include swaps, collars, options and other derivatives, in order to reduce exposure to substantial adverse changes in the prices of these commodities. These hedges are only intended to mitigate the risk associated with our natural physical position. We monitor and ensure compliance with this Risk Management Policy through senior level executives in our operations, finance and legal departments. Our Risk Management Policy includes the following provisions:
1. Anti-speculation
Speculative buying and selling of commodity or interest rate products is prohibited. “Speculation” includes, but is not limited to, buying or selling commodity or financial instruments that are not necessary for meeting forecasted production, consumption, or outstanding debt service.
2. Maximum Transaction Term
The maximum term of any hedging transaction should be five (5) years, unless specifically approved by our Board of Directors.
3. Maximum Transaction Volumes
Hedged commodity volumes are not to exceed 80% of the expected production or consumption in any settlement period, and hedged interest rates shall not exceed 80% of total outstanding indebtedness. Neither of these limitations shall be exceeded without the prior approval of the Board of Directors, which (with respect to commodity volumes) we did obtain for 2009 and 2010.
In any quarter, newly-hedged volumes (i.e., added during that quarter) shall not exceed 20% of the expected production, consumption, or indebtedness for any settlement period without the prior approval of the Board of Directors.
4. Portfolio Performance and Value Reporting
Our staff shall prepare performance reports containing an analysis of physical and financial positions of all energy price and interest rate hedge contracts for review by the Risk Management Committee and presentation to the Board of Directors. The frequency and content of performance reports shall be determined by the Risk Management Committee, but in no case will be done less frequently than quarterly.
Payment obligations in connection with our hedging transactions are secured by a first priority lien in the collateral securing our senior secured indebtedness that ranks equal in right of payment with liens granted in favor of our senior secured lenders. As long as this first priority lien is in effect, we will have no obligation to post cash, letters of credit, or other additional collateral to secure these hedges at any time even if our counterparty’s exposure to our credit increases over the term of the hedge as a result of higher commodity prices or because there has been a change in our creditworthiness.
See Note 11 to our consolidated financial statements included in Part II, Item 8 Financial Statements and Supplementary Data starting on page F-1 of this Annual Report for additional discussion of our commodity hedging activities.
We have not designated our contracts as accounting hedges based on authoritative guidance. As a result, we mark our derivatives to market with the resulting change in fair value included in our statement of operations.
We continually monitor our hedging and contract portfolio and expect to continue to adjust our hedge position as conditions warrant.
The following table, as of December 31, 2009, sets forth certain information regarding our commodity derivatives that will mature during the year ended December 31, 2010:
| | | | | | | | | | | | | | | | | |
| Underlying | | Period | | Notional Volumes (units) | | Type | | Floor Strike Price ($/unit) | | | Cap Strike Price ($/unit) | | | Fair Value |
| | | ($ in thousands except volumes and $/unit) |
| Natural Gas: | | | | | | | | | | | | | | |
NYMEX Henry Hub | | Jan-Dec 2010 | | 1,320,000 mmbtu | | Costless Collar | | $ | 7.70 | | | $ | 9.10 | | | $ | 2,456 | |
NYMEX Henry Hub | | Jan-Dec 2010 | | 1,500,000 mmbtu | | Swap | | | 6.65 | | | | | | | | 1,160 | |
NYMEX Henry Hub | | Jan-Dec 2010 | | 2,040,000 mmbtu | | Swap | | | 6.57 | | | | | | | | 646 | |
| Crude Oil: | | | | | | | | | | | | | | | | | | |
NYMEX WTI | | Jan-Dec 2010 | | 60,000 bbls | | Costless Collar | | | 50.00 | | | | 67.50 | | | | (1,015 | ) |
NYMEX WTI | | Jan-Dec 2010 | | 108,000 bbls | | Costless Collar | | | 90.00 | | | | 99.80 | | | | 1,037 | |
NYMEX WTI | | Jan-Dec 2010 | | 60,000 bbls | | Put | | | 100.00 | | | | | | | | 2,047 | |
NYMEX WTI | | Jan-Dec 2010 | | 72,000 bbls | | Put | | | 90.00 | | | | | | | | 1,774 | |
NYMEX WTI | | Jan-Mar 2010 | | 135,000 bbls | | Swap | | | 95.00 | | | | | | | | 4,216 | |
NYMEX WTI | | Jan-Dec 2010 | | 36,000 bbls | | Swap | | | 78.35 | | | | | | | | (138 | ) |
NYMEX WTI | | Jan-Dec 2010 | | 300,000 bbls | | Swap | | | 70.00 | | | | | | | | (3,588 | ) |
NYMEX WTI | | Jan-Dec 2010 | | 480,000 bbls | | Swap | | | 51.40 | | | | | | | | (14,444 | ) |
NYMEX WTI | | Apr-Dec 2010 | | 405,000 bbls | | Swap | | | 53.55 | | | | | | | | (11,550 | ) |
| Natural Gas Liquids: | | | | | | | | | | | | | | | | | | | |
| OPIS Ethane Mt Belv non TET | | Jan-Dec 2010 | | 4,536,000 gallons | | Costless Collar | | | 0.43 | | | | 0.53 | | | | (753 | ) |
| OPIS Ethane Mt Belv non TET | | Jan-Dec 2010 | | 4,536,000 gallons | | Swap | | | 0.58 | | | | | | | | (901 | ) |
| OPIS IsoButane Mt Belv non TET | | Jan-Dec 2010 | | 2,520,000 gallons | | Costless Collar | | | 0.82 | | | | 1.02 | | | | (1,398 | ) |
| OPIS IsoButane Mt Belv non TET | | Jan-Dec 2010 | | 4,183,200 gallons | | Swap | | | 1.4045 | | | | | | | | (701 | ) |
| OPIS NButane Mt Belv non TET | | Jan-Dec 2010 | | 5,544,000 gallons | | Costless Collar | | | 0.82 | | | | 1.02 | | | | (2,773 | ) |
| OPIS NButane Mt Belv non TET | | Jan-Dec 2010 | | 8,467,200 gallons | | Swap | | | 1.3745 | | | | | | | | (1,191 | ) |
| OPIS Propane Mt Belv non TET | | Jan-Dec 2010 | | 5,040,000 gallons | | Costless Collar | | | 0.705 | | | | 0.81 | | | | (2,102 | ) |
| OPIS Propane Mt Belv non TET | | Jan-Dec 2010 | | 5,040,000 gallons | | Swap | | | 0.755 | | | | | | | | (2,333 | ) |
| OPIS Propane Mt Belv non TET | | Jan-Dec 2010 | | 17,740,800 gallons | | Swap | | | 1.0915 | | | | | | | | (2,393 | ) |
| OPIS Natural Gasoline Mt Belv non TET | | Jan-Dec 2010 | | 2,217,600 gallons | | Swap | | | 1.6562 | | | | | | | | (239 | ) |
Total | | | | | | | | | | | | | | | | $ | (32,183 | ) |
The following table, as of December 31, 2009, sets forth certain information regarding our commodity derivatives that will mature during the year ended December 31, 2011:
| | | | | | | | | | | | | | | | | |
| Underlying | | Period | | Notional Volumes (units) | | Type | | Floor Strike Price ($/unit) | | | Cap Strike Price ($/unit) | | | Fair Value |
| | | ($ in thousands except volumes and $/unit) |
| Natural Gas: | | | | | | | | | | | | | | |
| NYMEX Henry Hub | | Jan-Dec 2011 | | 1,200,000 mmbtu | | Costless Collar | | $ | 7.50 | | | $ | 8.85 | | | $ | 1,676 | |
| NYMEX Henry Hub | | Jan-Dec 2011 | | 720,000 mmbtu | | Swap | | | 7.085 | | | | | | | | 523 | |
| NYMEX Henry Hub | | Jan-Dec 2011 | | 2,280,000 mmbtu | | Swap | | | 6.14 | | | | | | | | 493 | |
| Crude Oil: | | | | | | | | | | | | | | | | | | | |
| NYMEX WTI | | Jan-Dec 2011 | | 139,152 bbls | | Costless Collar | | | 75.00 | | | | 85.70 | | | | (622 | ) |
| NYMEX WTI | | Jan-Dec 2011 | | 360,000 bbls | | Costless Collar | | | 80.00 | | | | 92.40 | | | | (20 | ) |
| NYMEX WTI | | Jan-Dec 2011 | | 125,256 bbls | | Swap | | | 80.00 | | | | | | | | (702 | ) |
| NYMEX WTI | | Jan-Dec 2011 | | 120,000 bbls | | Swap | | | 65.10 | | | | | | | | (2,318 | ) |
| NYMEX WTI | | Jan-Dec 2011 | | 240,000 bbls | | Swap | | | 75.00 | | | | | | | | (2,449 | ) |
| NYMEX WTI | | Jan-Dec 2011 | | 240,000 bbls | | Swap | | | 80.05 | | | | | | | | (1,333 | ) |
| NYMEX WTI | | Jan-Dec 2011 | | 360,000 bbls | | Swap | | | 65.60 | | | | | | | | (6,788 | ) |
| Total | | | | | | | | | | | | | | | | $ | (11,540 | ) |
The following table, as of December 31, 2009, sets forth certain information regarding our commodity derivatives that will mature during the year ended December 31, 2012:
| | | | | | | | | | | | | | | | | |
| Underlying | | Period | | Notional Volumes (units) | | Type | | Floor Strike Price ($/unit) | | | Cap Strike Price ($/unit) | | | Fair Value |
| | | ($ in thousands except volumes and $/unit) |
| Natural Gas: | | | | | | | | | | | | | | |
NYMEX Henry Hub | | Jan-Dec 2012 | | 1,080,000 mmbtu | | Costless Collar | | $ | 7.35 | | | $ | 8.65 | | | $ | 1,154 | |
NYMEX Henry Hub | | Jan-Dec 2012 | | 3,120,000 mmbtu | | Swap | | | 6.77 | | | | | | | | 652 | |
| Crude Oil: | | | | | | | | | | | | | | | | | | | |
NYMEX WTI | | Jan-Dec 2012 | | 135,576 bbls | | Costless Collar | | | 75.30 | | | | 86.30 | | | | (804 | ) |
NYMEX WTI | | Jan-Dec 2012 | | 360,000 bbls | | Costless Collar | | | 80.00 | | | | 98.50 | | | | 15 | |
NYMEX WTI | | Jan-Dec 2012 | | 108,468 bbls | | Swap | | | 80.30 | | | | | | | | (715 | ) |
NYMEX WTI | | Jan-Dec 2012 | | 240,000 bbls | | Swap | | | 68.30 | | | | | | | | (4,049 | ) |
NYMEX WTI | | Jan-Dec 2012 | | 240,000 bbls | | Swap | | | 76.50 | | | | | | | | (2,363 | ) |
NYMEX WTI | | Jan-Dec 2012 | | 240,000 bbls | | Swap | | | 82.02 | | | | | | | | (1,227 | ) |
Total | | | | | | | | | | | | | | | | $ | (7,337 | ) |
On February 16, 2010, we entered into a 12,000 barrels per month WTI costless collar with a floor strike price at $75.00 per barrel and a cap strike price of $89.85 per barrel for our 2011 calendar year. On February 17, 2010, we entered into a 16,000 barrels per month NYMEX WTI costless collar with a floor strike price at $75.00 per barrel and a cap strike price of $94.75 per barrel for our 2012 calendar year.
Effectiveness of Commodity Risk Management Activities
The goal of our commodity risk management activities is to reduce the impact of changing commodity prices on our ability to make future distributions to our unitholders. One way we evaluate the effectiveness of these activities is to analyze the theoretical change in our internal estimates of future Adjusted EBITDA given an assumed change in future commodity prices. Using this method, we estimate that a $10 per barrel change in NYMEX crude oil prices and a $1 per MMbtu change in NYMEX natural gas prices would result in changes to 2010 Adjusted EBITDA of $3.4 million and $0.3 million, respectively.
Users of this information should be aware that these estimates rely on a large number of assumptions that may ultimately prove to be false. These assumptions include, but are not limited to, future production rates, future volumes delivered to our plants and systems, future costs and other economic conditions, and future relationships between crude oil prices and natural gas liquids prices.
Interest Rate Risk
We are exposed to variable interest rate risk as a result of borrowings under our existing credit agreement. To mitigate its interest rate risk, the Partnership has entered into various interest rate swaps. These swaps convert the variable-rate term loan into a fixed-rate obligation. The purpose of entering into these swaps is to eliminate interest rate variability by converting LIBOR-based variable-rate payments to fixed-rate payments. Amounts received or paid under these swaps were recorded as reductions or increases in interest expense.
On March 30, 2009, the Partnership amended all of its existing interest rate swaps to change the interest rate the Partnership received from three month LIBOR to one month LIBOR through January 9, 2011. During this time period, the fixed rate to be paid by the Partnership was reduced, on average, by 20 basis points. After January 9, 2011, the interest rate to be received by the Partnership will change back to three month LIBOR and the fixed rate the Partnership pays will revert back to the original rate through the end of swap maturities in 2012.
Based upon the transactions discussed in the paragraph above, we estimate that for 2010, a 10% increase or decrease in the current LIBOR rates would impact our interest expense by less than $0.1 million.
See Note 11 of our consolidated financial statements included in Part II, Item 8. Financial Statements and Supplementary Data starting on page F-1 of this Annual Report for additional discussion of our interest rate hedging activities.
The table below summarizes the terms, amounts received or paid and the fair values of the various interest swaps:
Roll Forward Effective Date | Expiration Date | | Notional Amount | | | Fixed Rate(1) | | | Fair Market Value December 31, 2008 | |
| | ($ in thousands except notional amount) | |
12/31/2008 | 12/31/2012 | | $ | 150,000,000 | | | | 2.36% / 2.56% | | | $ | (1,869 | ) |
09/30/2008 | 12/31/2012 | | | 150,000,000 | | | | 4.105% / 4.295% | | | | (9,079 | ) |
10/03/2008 | 12/31/2012 | | | 300,000,000 | | | | 3.895% / 4.095% | | | | (16,468 | ) |
| | | | | | | | | | | | $ | (27,416 | ) |
| (1) | First amount is the interest rate we pay through January 9, 2011 and the second amount is the interest rate we pay from January 10, 2011 through December 31, 2012. |
The table below summarizes the changes in commodity and interest rate risk management assets for the applicable periods:
| | | Year Ended 12/31/2009 | | | Year Ended 12/31/2008 | |
| | | ($ in thousands) | |
| Net risk management assets at beginning of period | | $ | 69,275 | | | $ | (127,289 | ) |
| Investment premium payments (amortization), net | | | (27,901 | ) | | | 5,880 | |
Acquired contracts in acquisitions | | | — | | | | (2,710 | ) |
Cash paid (received) to terminate contracts, net | | | 8,850 | | | | — | |
Cash received (paid) from settled contracts | | | 64,425 | | | | (51,271 | ) |
Settlements of positions | | | (64,425 | ) | | | 51,271 | |
Unrealized mark-to-market valuations of positions | | | (128,700 | ) | | | 193,394 | |
Balance of risk management assets at end of period | | $ | (78,476 | ) | | $ | 69,275 | |
Credit Risk
Our principal natural gas sales customers are large gas marketing companies that, in turn, typically sell to large end users such as local distribution companies and electrical utilities. With respect to the sale of our NGLs and condensates, our principle customers are large natural gas liquids purchasers, fractionators and marketers, and large condensate aggregators that then typically sell to large multi-national petrochemical and refining companies. We also sell a small amount of propane to medium sized, local distributors.
For the year ended December 31, 2009, ONEOK Energy Services and Upstream Energy Services, our two largest customers, represented 27% and 16% of our total sales revenue (including realized and unrealized gains on commodity derivatives). All of our natural gas sales are under 30 day term deals, with credit based upon 60 days of deliveries and almost all other product sales contracts are under 30 day term arrangements.
This concentration of credit risk may affect our overall credit risk in that these customers may be similarly affected by changes in the natural gas, natural gas liquids, petrochemical and other segments of the energy industry, the economy in general, the regulatory environment and other factors.
In evaluating credit risk exposure we analyze the financial condition of each counterparty before entering into an agreement. Our corporate credit policy lists the resource materials and information required to assess the financial condition of each prospective customer. The credit threshold for each customer is also based upon a time horizon for exposure, which is typically 60 days or less. We establish these credit limits and monitor and adjust them on an ongoing basis. We also require counterparties to provide letters of credit or other collateral financial agreements for exposure in excess of the established threshold. All of our sales agreements contain adequate assurance provisions to permit us to mitigate or eliminate future credit risk, at our sole discretion, by suspending deliveries until obligations and payments are satisfied or by canceling the agreement.
In July 2008, SemGroup, L.P. and certain of its subsidiaries (“SemGroup”) filed petitions for reorganization under Chapter 11 of the U.S. Bankruptcy Code. We historically sold portions of our condensate production from our Texas Panhandle and East Texas midstream systems to SemGroup. The abrupt bankruptcy of SemGroup caught us, the energy business and the financial community by surprise. We are not aware of any other measures that we could have taken to identify this risk at an earlier time. During the year ended December 31, 2008, we recorded a bad debt provision of $10.7 million related to our outstanding receivables from SemGroup. We discontinued all sales to SemGroup as of August 1, 2008, and as a result, we do not anticipate recording any additional bad debt charges in future periods.
Our derivative counterparties include BNP Paribas, Wells Fargo Bank, N.A. / Wachovia Bank N.A, Comerica Bank, Barclays Bank PLC, The Royal Bank of Scotland plc, Bank of America N.A., J Aron & Company (an affiliate of Goldman Sachs), BBVA Compass Bank and Credit Suisse Energy LLC (an affiliate of Credit Suisse Group AG).
| Item 8. | Financial Statements and Supplementary Data. |
Our consolidated financial statements, together with the independent registered public accounting firm’s report of Deloitte & Touche LLP (“Deloitte & Touche”), begin on page F-1 of this Annual Report.
| Item 9. | Changes in and Disagreements With Accountants on Accounting and Financial Disclosure. |
None.
| Item 9A. | Controls and Procedures. |
Disclosure Controls and Procedures
The Partnership maintains disclosure controls and procedures that are designed to ensure that information required to be disclosed in the Partnership’s reports under the Securities Exchange Act of 1934, as amended (the “Exchange Act”) is recorded, processed, summarized and reported within the time periods specified in the SEC’s rules and forms, and that such information is accumulated and communicated to management, including our Chief Executive Officer and Chief Financial Officer, and our Audit Committee of the Board of Directors, as appropriate, to allow timely decisions regarding required disclosure. In designing and evaluating the disclosure controls and procedures, management recognizes that any controls and procedures, no matter how well designed and operated, can provide only reasonable assurance of achieving the desired control objectives, and management is required to apply its judgment in evaluating the cost-benefit relationship of possible controls and procedures. In addition, a control system, no matter how well conceived and operated, can provide only reasonable, not absolute, assurance that the objectives of the internal control system are met. Because of the inherent limitations of any internal control system, no evaluation of controls can provide absolute assurance that all control issues, if any, within a company have been detected.
Our management, with the participation of our Chief Executive Officer and Chief Financial Officer, evaluated the effectiveness of our disclosure controls and procedures as of December 31, 2009. Based on the evaluation of our disclosure controls and procedures (as defined in the Rules 13a-15(e) and 15d-15(e) under the Securities Exchange Act of 1934, as amended (the “Exchange Act”)) required by Exchange Act Rules 13a-15(b) or 15d-15(b), our principal executive officer and principal financial officer have concluded that as of the end of the period covered by this report, our disclosure controls and procedures were effective at the reasonable assurance level to ensure that information we are required to disclose in reports that we file or submit under the Exchange Act is recorded, processed, summarized and reported within the time periods specified in Securities and Exchange Commission rules and forms, and include controls and procedures designed to ensure that information required to be disclosed by us in such reports is accumulated and communicated to our management, including the principal executive officer and principal financial officer, as appropriate to allow timely decisions regarding required disclosure.
Management’s Annual Report On Internal Control Over Financial Reporting
Management is responsible for establishing and maintaining adequate internal control over financial reporting. Management has conducted (i) an evaluation of the design of our internal control over financial reporting, and (ii) a testing of the effectiveness of our internal control over financial reporting, as it pertains to the calendar year 2009. The evaluation and testing was conducted by our internal auditor, under the supervision and with the participation of our management, including our Chief Executive Officer and our Chief Financial Officer. Our evaluation and testing followed the “Internal Control—Integrated Framework” issued by the Committee of Sponsoring Organizations of the Treadway Commission (“COSO”). Our evaluation and testing was conducted as of the year ended December 31, 2009, which is the period covered by this Annual Report on Form 10-K. Based on our assessment, we believe our internal controls over financial reporting are effective to provide reasonable assurance regarding the reliability of financial reporting and the preparation of financial statements for external purposes in accordance with generally accepted accounting principles based on the criteria of the COSO Framework.
There have been no changes in our internal control over financial reporting that occurred during the last quarter that have materially affected or are reasonably likely to materially affect our internal control over financial reporting.
The Partnership’s independent registered public accounting firm has issued an attestation report based on their assessment of the Partnership’s internal control over financial reporting, which appears below.
REPORT OF INDEPENDENT REGISTERED PUBLIC ACCOUNTING FIRM
To the Board of Directors of Eagle Rock Energy G&P, LLC and Unitholders of Eagle Rock Energy Partners, L.P. Houston, Texas
We have audited the internal control over financial reporting of Eagle Rock Energy Partners, L.P. and subsidiaries (the “Partnership”) as of December 31, 2009, based on criteria established in Internal Control—Integrated Framework issued by the Committee of Sponsoring Organizations of the Treadway Commission. The Partnership’s management is responsible for maintaining effective internal control over financial reporting and for its assessment of the effectiveness of internal control over financial reporting, included in the accompanying Management’s Annual Report on Internal Control Over Financial Reporting. Our responsibility is to express an opinion on the Partnership’s internal control over financial reporting based on our audit.
We conducted our audit in accordance with the standards of the Public Company Accounting Oversight Board (United States). Those standards require that we plan and perform the audit to obtain reasonable assurance about whether effective internal control over financial reporting was maintained in all material respects. Our audit included obtaining an understanding of internal control over financial reporting, assessing the risk that a material weakness exists, testing and evaluating the design and operating effectiveness of internal control based on the assessed risk, and performing such other procedures as we considered necessary in the circumstances. We believe that our audit provides a reasonable basis for our opinion.
A company’s internal control over financial reporting is a process designed by, or under the supervision of, the company’s principal executive and principal financial officers, or persons performing similar functions, and effected by the company’s board of directors, management, and other personnel to provide reasonable assurance regarding the reliability of financial reporting and the preparation of financial statements for external purposes in accordance with generally accepted accounting principles. A company’s internal control over financial reporting includes those policies and procedures that (1) pertain to the maintenance of records that, in reasonable detail, accurately and fairly reflect the transactions and dispositions of the assets of the company; (2) provide reasonable assurance that transactions are recorded as necessary to permit preparation of financial statements in accordance with generally accepted accounting principles, and that receipts and expenditures of the company are being made only in accordance with authorizations of management and directors of the company; and (3) provide reasonable assurance regarding prevention or timely detection of unauthorized acquisition, use, or disposition of the company’s assets that could have a material effect on the financial statements.
Because of the inherent limitations of internal control over financial reporting, including the possibility of collusion or improper management override of controls, material misstatements due to error or fraud may not be prevented or detected on a timely basis. Also, projections of any evaluation of the effectiveness of the internal control over financial reporting to future periods are subject to the risk that the controls may become inadequate because of changes in conditions, or that the degree of compliance with the policies or procedures may deteriorate.
In our opinion, the Partnership maintained in all material respects effective internal control over financial reporting as of December 31, 2009, based on the criteria established in Internal Control—Integrated Framework issued by the Committee of Sponsoring Organizations of the Treadway Commission.
We have also audited, in accordance with the standards of the Public Company Accounting Oversight Board (United States), the consolidated financial statements as of and for the year ended December 31, 2009, of the Partnership and our report dated March 9, 2010 expressed an unqualified opinion on those financial statements and included an explanatory paragraph regarding the Partnership’s change in its method of accounting for oil and gas reserves.
/s/ DELOITTE & TOUCHE LLP
Houston, Texas
March 9, 2010
Item 9B. Other Information.
None.
PART III
| Item 10. | Directors, Executive Officers and Corporate Governance. |
Management and Board of Directors of Eagle Rock Energy Partners, L.P.
Under our partnership agreement, our general partner has full power and authority to do all things, other than those items that require unitholder approval or with respect to which our general partner has sought conflicts committee approval, on such terms as it determines to be necessary or appropriate to conduct our business. Our general partner typically must act in “good faith” when making decisions on behalf of the Partnership, and our partnership agreement further provides that in order for a determination by our general partner to be made in “good faith,” our general partner must believe that the determination is in the best interests of the Partnership; provided, however, our partnership agreement also allows our general partner to make certain decisions which are in the best interest of its owners. See “Risk Factors” and our partnership agreement for a more detailed description.
Our general partner owes a fiduciary duty to our unitholders; however, this duty has been modified by our partnership agreement. See “Risk Factors” for a description of the provisions that modify our general partner’s fiduciary duties. Our general partner will be liable, as general partner, for all of our debts (to the extent not paid from our assets), except for indebtedness or other obligations that are made expressly nonrecourse to our general partner. Our general partner therefore may cause us to incur indebtedness or other obligations that are nonrecourse to our general partner.
Because our general partner is a limited partnership, its general partner, Eagle Rock Energy G&P, LLC, makes all determinations on behalf of our general partner, including determinations related to the conduct of our business and operations. As a result, the executive officers of Eagle Rock Energy G&P, LLC, under the direction of the board of directors of Eagle Rock Energy G&P, LLC, make all decisions on behalf of our general partner with respect to the conduct of our business and operations. Neither our general partner, nor the general partner of our general partner, is elected by our unitholders, and neither entity will be subject to re-election on a regular basis in the future. Unitholders are not entitled to elect the directors of Eagle Rock Energy G&P, LLC, the general partner of our general partner, nor are unitholders otherwise entitled to directly or indirectly participate in our management or operation. Our general partner may be removed by the unitholders, subject to the satisfaction of various conditions which will be difficult to meet.
However, the Global Transaction Agreement grants an option in favor of us, exercisable until December 31, 2012 to acquire all of the issued and outstanding limited liability company interests of Eagle Rock Energy G&P, LLC and limited partner interests of our general partner in exchange for the issuance of 1,000,000 newly-issued common units of the Partnership. In addition, if this option is exercised, our common unitholders that are not affiliated with NGP would be entitled to elect the majority of our board of directors. See Part I, Item 1. Business – Recapitalization and Related Transactions.
The directors of Eagle Rock Energy G&P, LLC, the general partner of our general partner, oversee our operations. Eagle Rock Energy G&P, LLC has seven directors, three of whom are independent as defined under the independence standards established by the NASDAQ Global Select Market. The NASDAQ Global Select Market does not require a listed limited partnership like us to have a majority of independent directors on the Board of Directors of our general partner, or to establish a compensation committee or a nominating and governance committee. Nevertheless, we have established a compensation committee, and two of its three members are independent. All of our board members served during the entire calendar year of 2009. Our board of directors met seven times during 2009 with each board member attending all of our board meetings.
We have an audit committee of three directors, Philip B. Smith, William K. White and William A. Smith, all of whom meet the independence and experience standards established by the NASDAQ Global Select Market and the Securities Exchange Act of 1934, as amended. Mr. White served as chairman of our audit committee during 2009 and currently serves as our audit committee chairman for 2010. We have determined that Mr. White meets the standards of and has been designated as our “financial expert” on the audit committee in compliance with the SEC standards and the NASDAQ Global Select Market standards. The audit committee assists the board of directors in its oversight of the integrity of our financial statements and our compliance with legal and regulatory requirements and corporate policies and controls. The audit committee has the sole authority to retain and terminate our independent registered public accounting firm, approve all auditing services and related fees and the terms thereof, and pre-approve any non-audit services to be rendered by our independent registered public accounting firm. The audit committee is also responsible for confirming the independence and objectivity of our independent registered public accounting firm. Our independent registered public accounting firm is given unrestricted access to the audit committee. Additionally, the audit committee has the sole authority to retain and terminate our independent reservoir engineering firm.
Our audit committee met nine times during 2009 with all three members of the audit committee attending at least 89% of the meetings. Our audit committee regularly meets with our independent registered public accounting firm, Deloitte & Touche LLP, outside the presence of our management most often at the conclusion of regularly scheduled audit committee meetings.
We also have a compensation committee, comprised of William A. Smith, Philip B. Smith and John Weinzierl. Mr. W. Smith has served as chairman of our compensation committee since February 2008 and currently serves as our compensation committee chairman for 2010. In February 2010, Mr. Weinzierl joined the compensation committee, replacing William J. Quinn. Among other things, the compensation committee oversees the compensation plans and determination of the overall compensation for officers and employees. The compensation committee met six times during 2009 with all three members of the compensation committee attending at least 83% of the meetings.
Additionally, we have a standing conflicts committee, which currently consists of the three members of our board of directors who meet the independence described above for members of the audit committee, Messrs. P. Smith, W. White, and W. Smith. Mr. P. Smith served as chairman of our conflicts committee during 2009, and currently serves as our conflicts committee chairman for 2010. The conflicts committee reviews specific matters that the Board of Directors believes may involve conflicts of interest, including acquisitions or other transactions with an affiliate. The conflicts committee will determine if the resolution of the conflict of interest is fair and reasonable. The members of the conflicts committee may not be officers or employees of our general partner or directors, officers, or employees of its affiliates. Any matters approved by the conflicts committee will be conclusively deemed to be fair and reasonable to us, approved by all of our partners, and not a breach by our general partner of any duties it may owe us or our unitholders.
Our conflicts committee met formally 40 times during 2009, primarily to review, evaluate and develop the terms and conditions of a potential strategic transaction with Natural Gas Partners referred to in this report as the Recapitalization and Related Transactions, with all members attending at least 93% of the meetings.
Director Experience Related to Serving on our Board of Directors
Our Board of Directors considered many factors in concluding that each member of the Board of Directors is qualified and should serve as a director. Our Board of Directors reviewed the experience, qualifications, attributes and skills of each of our directors as discussed below. Please also see the biographies of our directors provided in this Item 10 under “Directors and Executive Officers.”
Mr. Joseph A. Mills – our Board of Directors believes that Mr. Mills brings operational, managerial and strategic expertise to the Board of Directors and the Partnership. Mr. Mills’ experience as Chief Executive Officer of Montierra Minerals & Production (which we acquired in 2007), that focuses on the stable cash-flow business of minerals, royalties and non-operated working interests, specifically benefits the Board of Directors and the Partnership as we strive to achieve one of our primary objectives of stable distribution of cash to our common unitholders. In addition, his executive and operational expertise, transactional background and business development experience with El Paso Corporation and Sonat Exploration Company is a valuable resource in leading our midstream and upstream operations, growth strategy and the management of our employees. Collectively, these experiences provide invaluable guidance in the operational aspects of the Partnership and the management and leadership of the Board of Directors, senior management and the Partnership. Please also see “Board Leadership Structure” below.
Mr. Kenneth A. Hersh - our Board of Directors believes that Mr. Hersh brings extensive knowledge to the Board of Directors and the Partnership through his experiences in the energy industry as an investor, involvement in complex energy-related transactions and his position as chief executive officer of NGP and co-manager of NGP’s investment portfolio. Mr. Hersh also brings a wealth of industry specific transactional skills, entrepreneurial ideas and a personal network of public and private capital sources that has brought, and our Board of Directors believes will continue to bring, us opportunities that we may not otherwise have.
Mr. William J. Quinn – our Board of Directors believes that Mr. Quinn brings skills to the Board of Directors and Partnership with his understanding and experiences in the energy industry and specifically with respect to his abilities in analysis of transactions and investment opportunities. Mr. Quinn has served in various capacities in the energy industry including presently as co-manager of NGP’s investment portfolio. In this role, Mr. Quinn is active in NGP’s investment process and oversees the ongoing development of proprietary transaction and analysis tools. The analytical skills Mr. Quinn has developed through his career provides our Board of Directors and the Partnership a valuable resource as we evaluate transactions, investment opportunities and other strategies.
Mr. Philip B. Smith – our Board of Directors believes that Mr. Smith brings a valuable engineering and analytical perspective to the Board of Directors and the Partnership through his engineering background and business knowledge. He has served as a director and chief executive officer of several energy companies and brings those experiences and insight to the Board of Directors as it oversees the conduct of the Partnership. Our Board of Directors believes Mr. Smith’s entrepreneurial abilities, combined with his practical experiences as an executive officer and director, have engendered resourceful ideas in furthering the strategies of the Partnership.
Mr. William A. Smith – our Board of Directors believes that Mr. Smith brings legal and business expertise to the Board of Directors and the Partnership through his experiences as general counsel and executive of Sonat, Inc. and his executive positions at El Paso Corporation and other energy companies. Through his work in the energy industry, Mr. Smith has also become an expert in the liquefied natural gas (“LNG”) markets which the Board of Directors utilizes as it considers the impact LNG could have on natural gas and the Partnership. Mr. W. Smith also has significant experience serving as a board member of other domestic as well as international energy companies. Our Board of Directors believes Mr. Smith’s industry experience as an executive, board member and attorney provides an important skill set and perspective to the Board of Directors.
Mr. John A. Weinzierl – our Board of Directors believes Mr. Weinzierl’s degree and experience in petroleum engineering, as well as his MBA and business expertise, brings valuable industry and analytical knowledge to the Board of Directors and the Partnership. Mr. Weinzierl honed these skills in part with his work in transaction underwriting and risk assessment. As managing director of NGP, he focuses on transaction analysis for NGP’s oil and gas producing companies - knowledge that is utilized at the Board of Directors level in reviewing investment opportunities. The Board of Directors also employs Mr. Weinzierl’s expertise in exploration and production activities as it evaluates opportunities in the Partnership’s Upstream business.
Mr. William K. White – our Board of Directors believes that Mr. White brings substantial experience to the Board of Directors and the Partnership through his extensive work in public and private equity and debt placements, administrative and operational restructuring, debt renegotiations and mergers and asset acquisitions. Mr. White has served in many capacities with several energy companies including positions as: (i) chief financial officer of two publicly traded energy companies, (ii) a member of the board of directors of both private and public companies, (iii) chairman of audit committees and (iv) a member of compensation committees. Our Board of Directors believes that Mr. White’s commercial banking background, expertise in finance-related activities, thorough understanding of audit and accounting-related matters and experience with numerous energy companies in both the private and public sectors provides significant insight, value and perspective to the Board of Directors, our Audit Committee (as chairman and designated “financial expert”) and the Partnership.
Each director’s experience, qualifications, attributes and skills as discussed above contribute to the Board of Directors’ overall effectiveness. Our Board of Directors further believes that the specific experience of each director complements the other directors, provides for a well-rounded Board of Directors and committees and enables our Board of Directors and committees to fulfill their obligations to the Partnership and public unitholders.
Risk Oversight by the Board of Directors
Our Board of Directors plays an important role in the risk oversight function of the Partnership through its Audit, Compensation and Conflicts Committees (collectively, the “Committees”) as well as various management committees that report directly to the Chief Executive Officer who, in turn, reports such information to the Board of Directors. The Audit Committee is primarily responsible for the oversight of: (i) the integrity of our financial statements and internal controls, (ii) our compliance with legal and regulatory requirements, (iii) our independent auditor’s qualifications, independence and performance of our internal audit function, and (iv) matters related to our hedging activities, litigation/disputes and environmental issues. The Compensation Committee is primarily responsible for matters related to compensation of our directors and officers as well as oversight of administration of the Partnership’s 401k plan. The Conflicts Committee is primarily responsible for resolving any potential conflicts of interest between us and certain of our affiliates that our Board of Directors tasks the Conflicts Committee to resolve. The Board of Directors and its committees implement and manage the risk oversight function through regular meetings with senior management where updates, reports and information concerning the different risks that are affecting or may affect the Partnership are provided.
In addition, the Enterprise Risk Committee, which is comprised of our Chief Executive Officer and members of senior management, provides enterprise-wide monitoring of risk for each department of the Partnership. The Enterprise Risk Committee receives reports and information from several other management committees that are comprised primarily of members of senior and mid-level management. The management committees have a number of responsibilities including risk oversight of the different functional areas of the Partnership. Certain of the executive officers who are members of the Enterprise Risk Committee, including the Chief Executive Officer, Chief Financial Officer and General Counsel, in turn, report material information to the Board of Directors and the Board committees. At this time, the primary management committees responsible for risk oversight are:
| (i) | Risk Management – standing committee that monitors and mitigates our hedging, our counterparties’ credit risk and our other finance-related activities |
| (ii) | Regulatory – ad-hoc committee that monitors proposed or pending rules and regulations that may impact us and our business |
| (iii) | Environmental, Health and Safety – standing committee that monitors and mitigates risks associated with our employees/contractors, our property and the environment |
| (iv) | Disclosure – standing committee that monitors and controls disclosures made in our public securities filings |
| (v) | Information Technology and Data Management – standing committee that oversees information technology infrastructure procurement, implementation and integration and implementation and administration of data management policies and procedures, respectively |
| (vi) | Human Resources – standing committee that monitors employee benefit plans, policies and practices and mitigates risks associated therewith, including through oversight of our 401k investment committee |
To facilitate the flow of information between the Partnership and our Board of Directors and its committees, our Board of Directors has unfettered access to the members of our management committees and our employees. We believe the interaction between our Board of Directors, our Board committees, our Chief Executive Officer/Chairman and management committees provides for continuous and open lines of communication regarding, and oversight of, the various areas of risk that may affect us. The combination of the open lines of communication among our Board of Directors, Board committees and management committees and the fact that our Chief Executive Officer also serves as Chairman of the Board of Directors allows the Board of Directors to understand and address our material risks in a manner that effectively fulfills the Board of Directors’ risk oversight function.
Board Leadership Structure
Joseph A. Mills serves as Chairman of the Board of Directors and Chief Executive Officer of G&P. We believe this structure is appropriate for us because it facilitates effective communication between management and our Board of Directors through a timelier and open flow of information, opinions and strategies. Furthermore, we believe this leadership structure contributes to the effectiveness of the Board of Directors’ risk oversight function, as discussed above, because Mr. Mills is an integral part of the Board of Directors as well as the management committees and serves an important role in interfacing with the Board committees. Combining the Chairman and Chief Executive Officer positions provides us with consistency of strategy and direction for the Partnership internally (at management and Board levels) and with the investing public. This also helps remove ambiguities in the decision-making process as we operate our business because there is direct communication and clarity in message between the Board of Directors and management. In addition, Mr. Mills has extensive experience regarding our industries and business lines as well as specific, in-depth knowledge of our history, structure and organization. We believe Mr. Mills’ management and leadership styles contribute to the appropriateness of our Board of Directors leadership structure as he emphasizes and values open discussion and consensus-building among management and our Board of Directors. We believe our unitholders benefit from Mr. Mills’ knowledge, experience and management and leadership styles in his capacity as Chairman and Chief Executive Officer.
Committee Charters and Code of Ethics
Each of our Board Committees has a written charter that can be found on our website, www.eaglerockenergy.com, under the “Investor Relations—Corporate Governance” tab. Additionally, we have a “Code of Ethics for Chief Executive Officer and Senior Financial Officers” and a “Code of Business Conduct and Ethics” for our employees, both of which also can be found on our website under the “Investor Relations—Corporate Governance” tab. Each committee charter was reviewed by the applicable committee during the first quarter of 2010, affirmed by the Committee and was not changed as a result of the review. Unless explicitly stated otherwise herein, the information on our website is not incorporated by reference into this Annual Report on Form 10-K.
Non-Management Executive Sessions and Unitholder Communications
Non-management Directors periodically meet in executive session in connection with regular meetings of the Board of Directors or at regular meetings of our Board Committees.
Interested parties can communicate directly with non-management Directors by mail in care of the General Counsel and Secretary, Eagle Rock Energy G&P, LLC, 1415 Louisiana Street, Suite 2700, Houston, Texas 77002. Such communications should specify clearly inside the body of the communication itself (and not simply the outside of the envelope) the intended recipient or recipients.
Report of the Audit Committee
The Audit Committee of Eagle Rock Energy G&P, LLC oversees the Partnership’s financial reporting process on behalf of the board of directors. Management has the primary responsibility for the financial statements and the reporting process, including the systems of internal control over financial reporting and disclosure.
In fulfilling its oversight responsibilities, the Audit Committee reviewed and discussed with management the audited financial statements contained in this Annual Report on Form 10-K.
Eagle Rock’s independent registered public accounting firm, Deloitte & Touche LLP, is responsible for expressing an opinion on the conformity of the audited financial statements with accounting principles generally accepted in the United States of America and opinions on management’s assessment and on the effectiveness of Eagle Rock’s internal control over financial reporting. The Audit Committee reviewed with Deloitte & Touche LLP its judgment as to the quality, not just the acceptability, of Eagle Rock’s accounting principles and such other matters as are required to be discussed with the audit committee under generally accepted auditing standards.
The Audit Committee discussed with Deloitte & Touche LLP the matters required to be discussed by SAS 61 (Codification of Statement on Auditing Standards, AU § 380), as modified or supplemented. The Audit Committee has received the written disclosures and the letter from Deloitte & Touche LLP required by applicable requirements of the Public Company Accounting Oversight Board regarding the independent accountant’s communications with the Audit Committee concerning independence, and has discussed with Deloitte & Touche LLP its independence from management and Eagle Rock.
Based on the reviews and discussions referred to above, the Audit Committee recommended to the Board of Directors that the audited financial statements be included in the Annual Report on Form 10-K for the year ended December 31, 2009 for filing with the SEC.
| | William K. White, Chairman |
Directors and Executive Officers
The following table sets forth certain information with respect to the current members of our board of directors and our executive officers (for purposes of Item 401(b) of Regulation S-K under the Securities Exchange Act of 1934).
| | | |
Name | Age | Position with Eagle Rock Energy G&P, LLC |
| Joseph A. Mills | 50 | Chairman and Chief Executive Officer, Director |
| Jeffrey P. Wood | 39 | Senior Vice President, Chief Financial Officer and Treasurer |
Alfredo Garcia | 44 | Senior Vice President, Corporate Development |
| Charles C. Boettcher | 36 | Senior Vice President, General Counsel, Chief Compliance Officer and Secretary |
| Steven G. Hendrickson | 48 | Senior Vice President, Technical Evaluations |
| William E. Puckett | 54 | Senior Vice President, Midstream Business |
Joseph E. Schimelpfening | 48 | Senior Vice President, Upstream and Minerals Business |
| Kenneth A. Hersh | 47 | Director |
| William J. Quinn | 39 | Director |
| Philip B. Smith | 58 | Director |
| William A. Smith | 65 | Director |
| John A. Weinzierl | 41 | Director |
| William K. White | 67 | Director |
Because of its control of the general partner of, and ownership of a majority interest in, Eagle Rock Holdings L.P., Natural Gas Partners controls the election of all of the members of the Board of Directors of Eagle Rock Energy G&P, LLC. Our Directors hold office until the earlier of their death, resignation, retirement, disqualification or removal by Eagle Rock Holdings L.P., as the sole member of Eagle Rock Energy G&P, LLC. The executive officers serve at the discretion of the Board of Directors. There are no family relationships among any of our directors or executive officers. The directors of Eagle Rock Energy G&P, LLC will devote a commercially reasonable amount of time to our business and operations, given the nature and scope of their duties as directors, but may devote a substantial amount of time to commercial activities unrelated to our business and operations. The executive officers of Eagle Rock Energy G&P, LLC will devote a majority of their time, and will strive to devote substantially all of their time, to our business and operations. With that understanding, the executive officers of Eagle Rock Energy G&P, LLC may devote a portion of their time to the business and operations of Holdings, Eagle Rock Energy GP, L.P., Eagle Rock Energy G&P, LLC, Montierra Minerals & Production, LP or other affiliates of Eagle Rock Energy G&P, LLC. Although the amount of time spent by the executive officers of Eagle Rock Energy G&P, LLC on matters other than our business and operations should be insignificant in comparison to the time spent on our business and operations, it may from time–to–time rise to a level that is not insignificant.
Joseph A. Mills was elected Chairman of the Board of Directors and Chief Executive Officer of Eagle Rock Energy G&P, LLC in May 2007. Additionally, Mr. Mills has served since April 19, 2006, and will continue to serve for the foreseeable future, as Chief Executive Officer and as a manager of Montierra Management LLC, which is the general partner of Montierra Minerals & Production, LP. From January 2006 to April 2006, Mr. Mills took some personal time off to spend time with his family. From September 2003 to January 2006, Mr. Mills was the Senior Vice President of Operations for Black Stone Minerals Company, LP, a privately held company. From March 2001 to August 2003, Mr. Mills was a Senior Vice President of El Paso Production Company, a wholly-owned subsidiary of El Paso Corporation.
Jeffrey P. Wood was elected Senior Vice President and Chief Financial Officer of Eagle Rock Energy G&P, LLC in January 2009. On March 11, 2009, Mr. Wood was appointed Treasurer of Eagle Rock Energy G&P, LLC. From August 2006 to December 2008, Mr. Wood was a senior vice president and portfolio manager in the private equity division of Lehman Brothers Holdings, Inc. From July 2001 through August 2006, Mr. Wood worked for Lehman Brothers in its natural resources investment banking practice. Mr. Wood’s primary focus area during his tenure at Lehman Brothers was the energy industry and specifically the master limited partnership sector.
Alfredo Garcia was elected Senior Vice President, Corporate Development of Eagle Rock Energy G&P, LLC in August 2006, and has served in that capacity ever since. In addition to his service in this role, Mr. Garcia has served as Interim Chief Financial Officer of Eagle Rock Energy G&P, LLC most recently from August 15, 2008 until January 5, 2009 and previously from December 29, 2007 until May 15, 2008, and Mr. Garcia served as Acting Chief Financial Officer of Eagle Rock Energy G&P, LLC from July 16, 2007 until November 9, 2007. Prior to August 2006, Mr. Garcia served as Senior Vice President and Chief Financial Officer of Eagle Rock Energy G&P, LLC from March 2006 until August 2006, Chief Financial Officer of Eagle Rock Pipeline, L.P. from December 2005 until August 2006 and Chief Financial Officer of Eagle Rock Energy, Inc. from February 2004 through December 2005. From March 1999 until February 2004, Mr. Garcia was founder and director of Investment Analysis & Management, LLC, a financial advisory and consulting firm. During this period, he also acted as Chief Financial Officer of TrueCentric, LLC, a software start-up company. Prior to this, Mr. Garcia was a Latin American Associate for HM Capital Partners, a private equity firm formerly known as Hicks Muse Tate & Furst.
Charles C. Boettcher was elected Senior Vice President, General Counsel and Secretary of Eagle Rock Energy G&P, LLC in August 2007. Additionally, Mr. Boettcher serves as the Chief Compliance Officer. Prior to joining Eagle Rock, Mr. Boettcher was a partner in the law firm of Thompson & Knight, LLP, primary outside counsel to Eagle Rock. During his eight years at Thompson & Knight, Mr. Boettcher practiced law in the Corporate and Securities department and focused his practice on mergers and acquisitions in the oil and gas industry and securities compliance and disclosure for public companies.
Steven G. Hendrickson was elected Senior Vice President of Technical Evaluations of Eagle Rock Energy G&P, LLC in May 2007. From May 2006 to May 2007, Mr. Hendrickson was Vice President of Engineering for Montierra Minerals & Production, L.P. From April 2005 to May 2006, he was in private engineering practice. From March 1999 to April 2005, Mr. Hendrickson was Director of Reservoir Engineering and other various management positions with El Paso Corporation. Mr. Hendrickson is a licensed Petroleum Engineer in the State of Texas.
William E. Puckett was elected Senior Vice President, Midstream Business of Eagle Rock Energy G&P, LLC in October 2008. From March 2006 to October 2008, Mr. Puckett has served as Senior Vice President, Midstream Commercial Operations of Eagle Rock Energy G&P, LLC. Mr. Puckett has served as Vice President, Midstream Commercial Operations of Eagle Rock Pipeline, L.P. from December 2005 to March 2006. From September 1999 until November 2005, Mr. Puckett was Vice President, Technical Services for Dynegy, Inc., a natural gas gathering and processing company. During the month of November 2005, Mr. Puckett served as Vice President of Technical Services for Targa Resources. Mr. Puckett has also served in a variety of positions in marketing, processing and operations.
Joseph E. Schimelpfening was elected Senior Vice President, Upstream and Minerals Business of Eagle Rock Energy G&P, LLC in October 2008. From May 2007 to October 2008, Mr. Schimelpfening served as Senior Vice President of E&P Operations and Development. From May 2006 to May 2007, Mr. Schimelpfening was Vice President of Operations and Development for Montierra Minerals & Production, L.P. Prior to May 2006, Mr. Schimelpfening was Division Operations Manager for El Paso Corporation. Mr. Schimelpfening is a licensed engineer in Texas.
Kenneth A. Hersh was elected Director of Eagle Rock Energy G&P, LLC in March 2006. Mr. Hersh served as a director of Eagle Rock Pipeline, L.P. from December 2005 to March 2006 and Eagle Rock Energy, Inc. from December 2003 through December 2005. Mr. Hersh is the Chief Executive Officer of NGP Energy Capital Management and is a managing partner of the Natural Gas Partners private equity funds and has served in those or similar capacities since 1989. He currently serves as a director of NGP Capital Resources Company, a business development company that focuses on the energy industry and Resolute Energy Corporation, a publicly traded independent oil and gas company. Mr. Hersh served as a director of Energy Transfer Partners, L.L.C., the indirect general partner of Energy Transfer Partners, L.P., a natural gas gathering and processing and transportation and storage and retail propane company, from February 2004 through December 2009 and served as a director of LE GP, LLC, the general partner of Energy Transfer Equity, L.P., from October 2002 through December 2009.
William J. Quinn was elected Director of Eagle Rock Energy G&P, LLC in March 2006. Mr. Quinn served as Chairman of the Board of Eagle Rock Energy G&P, LLC from January 2007 to May 2007. Mr. Quinn served as a member of the Compensation Committee from March 2006 to February 2010, and served as chairman of the Compensation Committee from March 2006 to February 2008. Mr. Quinn served as a director of Eagle Rock Pipeline, L.P. from December 2005 to March 2006 and Eagle Rock Energy, Inc. from December 2003 through December 2005. Mr. Quinn is the Executive Vice President of NGP Energy Capital Management and is a managing partner of the Natural Gas Partners private equity funds and has served in those or similar capacities since 1998. He currently serves on the investment committee of NGP Capital Resources Company, a business development company that focuses on the energy industry and as a director of Resolute Energy Corporation, a publicly traded independent oil and gas company.
Philip B. Smith was elected Director of Eagle Rock Energy G&P, LLC in October 2006 and serves as Chairman of the Conflicts Committee and as a member of the Audit Committee and the Compensation Committee of the board of directors of Eagle Rock Energy G&P, LLC. Since April 2002, Mr. Smith has been administering estates and managing private investments. From January 1999 until March 2002, Mr. Smith was Chief Executive Officer and Chairman of the Board of Directors of Prize Energy Corp. in Grapevine, Texas. From 1996 until 1999, Mr. Smith served as a director of HS Resources, Inc. and of Pioneer Natural Resources Company and its predecessor, MESA, Inc.
William A. Smith was elected Director of Eagle Rock Energy G&P, LLC in September 2007 and has served as Chairman of the Compensation Committee since February 2008 and as a member of the Audit Committee and Conflicts Committee of the board of directors of Eagle Rock Energy G&P, LLC since September 2007. Mr. Smith is managing director and partner in Galway Group, L.P., a position he has held since August 2002. From October 1999 to June 2002, Mr. Smith was executive vice president of El Paso Corporation. Prior to the merger of Sonat Inc. with El Paso Corporation in 1999, Mr. Smith was executive vice president and general counsel of Sonat, Inc. Mr. Smith previously served as a member of the Board of Directors of Maritrans, Inc. until 2006 and currently serves as a member of the Board of Directors and audit committee of the Board of Directors of El Paso Pipeline GP Company, LLC, the general partner of El Paso Pipeline Partners, L.P.
John A. Weinzierl was elected Director of Eagle Rock Energy G&P, LLC in March 2006, and Mr. Weinzierl was elected to serve on the Compensation Committee in February 2010. Mr. Weinzierl served as a director of Eagle Rock Pipeline, L.P. from December 2005 to March 2006 and Eagle Rock Energy, Inc. from December 2003 through December 2005. Mr. Weinzierl is a managing director of the Natural Gas Partners private equity funds and has served in that capacity since 2005. Upon joining Natural Gas Partners in 1999, Mr. Weinzierl served as a senior associate until 2000 and as a principal until he became a managing director in December 2004. He presently serves as a director for several of Natural Gas Partners’ private portfolio companies.
William K. White was elected Director of Eagle Rock Energy G&P, LLC in October 2006 and serves as Chairman of the Audit Committee and as a member of the Conflicts Committee of the board of directors of Eagle Rock Energy G&P, LLC. Mr. White also serves as the Audit Committee financial expert. Mr. White is President of Amado Energy Management, LLC, a private, wholly-owned LLC, a position he has held since December 2002. From May 2005 to September 2007, he served as an independent director and member of the audit and compensation committees of the board of directors of Teton Energy Corporation. From July 2008 through December 2008, Mr. White served as independent director, audit committee Chairman and member of the compensation committee of CRC-Evans International, Inc., an affiliate of a portfolio company of Natural Gas Partners. From September 1996 to November 2002, Mr. White was Vice President, Finance and Administration and Chief Financial Officer for Pure Resources, Inc. (a predecessor of which, Titan Exploration, Inc., was a Natural Gas Partners portfolio company until 1999).
Indemnification of Directors and Executive Officers
Each director is fully indemnified by us for his actions associated with being a director to the fullest extent permitted under Delaware law. In addition, on December 30, 2009, the board of directors approved the final form of Supplemental Indemnification Agreement covering each of the seven directors (and the six Senior Vice Presidents) of the Partnership. The agreement provides for indemnification coverage if a person serving the Partnership or G&P, at the request of G&P (the “Indemnitee”), becomes involved in litigation proceedings. The Indemnitee may request advancement of expenses upon delivery of an undertaking to G&P that the Indemnitee will reimburse G&P for the expenses if it is determined that the Indemnitee is not entitled to the expenses. The Indemnitee also may request that independent counsel determine whether the Indemnitee is entitled to indemnification. If not requested, the disinterested Board of Directors members will make the determination of entitlement, or the Board of Directors will appoint independent counsel. The Indemnitee is entitled to indemnification to the fullest extent of the applicable Delaware law unless the Indemnitee’s conduct was knowingly fraudulent, not in good faith or constituted willful misconduct, or, in the case of a criminal matter, was knowingly unlawful or was otherwise covered by insurance payments. Although the indemnification obligations of the Partnership under the Supplemental Indemnification Agreements are intended to be supplemental to the indemnification provided under our partnership agreement as discussed above, the general indemnification standard is substantively no different than that provided under our partnership agreement.
Section 16(A) Beneficial Ownership Reporting Compliance
Section 16(a) of the Exchange Act requires our directors and officers, and persons who beneficially own more than 10% of Eagle Rock’s common units, to file with the SEC initial reports of ownership and reports of changes in ownership of the common units. Directors, officers and more than 10% unitholders are required by SEC regulations to furnish us with copies of all Section 16(a) forms they file.
To our knowledge, based solely on review of the copies of such reports furnished to us and written representations that no other reports were required, we are not aware of any director, executive officer, or 10% unitholder who has not timely filed reports required by Section 16(a) of the Exchange Act during or following the end of the year ended December 31, 2009.
| Item 11. | Executive Compensation. |
The following discussion of executive compensation contains references to our employee benefit plans and an Omnibus Agreement. These descriptions are qualified in their entirety by reference to the full text of the plans and Omnibus Agreement, which have been filed by us as exhibits or are incorporated by reference as exhibits to this report on Form 10-K with the U.S. Securities and Exchange Commission.
Overview of Executive Officer Compensation
As a publicly-traded limited partnership, we do not have directors, officers or employees. Instead, our operations are managed by our general partner, Eagle Rock Energy GP, L.P., which in turn is managed by its general partner, Eagle Rock Energy G&P, LLC, which we refer to in this Item 11 as “G&P.” When we refer to “our employees,” “our officers,” or similar statements, we are referring to individuals who are employed by G&P and serve us or who hold officer positions for G&P and serve us. Employee costs, such as salaries, bonuses, benefits, reimbursements and other cash payments, are funded by payments received by G&P through an Omnibus Agreement, which G&P entered into with us, along with other of our affiliates, in connection with our initial public offering on October 24, 2006. We recognize and record these expenses in our financial statements on an accrual basis and in the same period as G&P or its affiliates incur them on our behalf.
Prior to our initial public offering, as a private company, compensation arrangements were determined on an individual basis and resulted primarily from negotiations between our management group and our private equity investors. These private equity investors are funds of Natural Gas Partners, which we refer to in this Item 11 as “NGP.”
Upon becoming a publicly-traded limited partnership, we altered our internal organization to follow the guidelines and processes of the appropriate governance standards for a publicly-traded limited partnership, including standards that apply to executive compensation decisions. As of the date of filing this Form 10-K, G&P has seven members of the Board of Directors, three of whom are independent board members as determined in accordance with the NASDAQ Global Select Market standards for independence. Three members of the Board of Directors, William A. Smith, John A. Weinzierl, and Philip B. Smith, serve as our Compensation Committee, which we refer to in this Item 11 as the “Compensation Committee” or the “Committee.” Mr. W. Smith serves as Chairman of the Committee, and Messrs. W. Smith and P. Smith meet the standards for independence under the NASDAQ Global Select Market. Mr. Weinzierl is a managing director of the NGP private equity funds.
Prior to 2008 and except with respect to executive officers hired in 2007 and 2009, compensation for our executive officers was set by the amounts previously put in place through negotiations by our management and our private investors, usually as set by the general partner of Eagle Rock Holdings, L.P., which we refer to in this Item 11 as “Holdings” and the “Holdings Board.”
In early 2008, the Compensation Committee redesigned our executive compensation program to better attract, motivate, and retain key executives and to reward executives for creating and improving the value of our company. In this regard, the Compensation Committee engaged Towers Perrin (now known as Towers Watson), a nationally recognized compensation consulting firm with experience in assisting master limited partnerships that own and operate upstream or midstream oil and gas assets. The Compensation Committee and our Chief Executive Officer worked with Towers Perrin to refine our executive compensation design, including compensation of our Chief Executive Officer, and to ensure that compensation to our executive management is commensurate with executive management compensation among industry peers and that our overall compensation fosters a performance-oriented environment by aligning a meaningful portion of each executive’s cash and equity compensation to the achievement of performance targets which are important to us and our unitholders. In this regard, our Chief Executive Officer worked closely with both the Compensation Committee and Towers Perrin, including attending routine Compensation Committee meetings and meeting with representatives of Towers Perrin.
On January 5, 2009, the Compensation Committee set the base salary and bonus target for, and made initial Long Term Incentive Plan restricted common unit grants and Holdings incentive interests grants to, Jeffrey P. Wood in connection with his employment as Senior Vice President and Chief Financial Officer of G&P.
On December 30, 2009, the Compensation Committee recommended, and the Board of Directors approved, a grant of restricted units pursuant to our Long-Term Incentive Plan to the following named executive officers as set forth below. Mr. Wood also received a grant of 50,000 restricted common units on January 5, 2009.
| | | Restricted Common Units | |
| Joseph A. Mills | | | 200,000 | |
| Jeffrey P. Wood | | | 100,000 | |
| Charles C. Boettcher | | | 100,000 | |
| Steven G. Hendrickson | | | 100,000 | |
| Joseph E. Schimelpfening | | | 100,000 | |
Discussion and Analysis of Executive Compensation
Goals of the Compensation Program
The Committee has focused on establishing an executive compensation program which is intended to attract, motivate, and retain key executives and to reward executives for creating and improving the value of our company. The goal of the program is to foster a performance-oriented environment by aligning a meaningful portion of each executive’s cash and equity compensation to the achievement of performance targets that are important to us and our public unitholders. In 2009, the Committee analyzed all facets of our named executive officers’, as well as all other officers’, total compensation based on these goals, and the Committee engaged its compensation consultant, Towers Perrin (now known as Towers Watson), to produce a study, utilizing compensation survey data and published compensation data for a peer group of publicly traded peer companies, intended to assist the Committee and management in determining compensation for our named executive officers. Because we have a combination of both midstream assets and upstream assets, which is not a typical combination for publicly-traded limited partnerships, part of the Committee’s evaluation process was to identify and develop an appropriate peer group for this benchmarking process. In this regard, the Committee relied heavily on the expertise and guidance of Towers Perrin. Ultimately, the Committee decided on a peer group consisting of the following companies, which the Committee, in consultation with management and Towers Perrin, feels incorporates an appropriate combination of business strategy (i.e., a mix of upstream and midstream businesses), financial size (as measured by financial metrics such as revenues, assets and market cap), and geographic spread for the purposes of reviewing top executive pay:
| Atlas Pipeline Partners, L.P. | DCP Midstream Partners, LP | MarkWest Energy Partners, L.P. |
| BreitBurn Energy Partners L.P. | Encore Acquisition Company | Petrohawk Energy Corporation |
| Brigham Exploration Company | EV Energy Partners, L.P. | Petroquest Energy, Inc. |
| Buckeye Partners, L.P. | Goodrich Petroleum Corporation | Quicksilver Resources Inc. |
| Cabot Oil & Gas Corporation | Hiland Partners, LP | Regency Energy Partners LP |
| Comstock Resources, Inc. | Legacy Reserves LP | Swift Energy Company |
| Copano Energy, L.L.C. | Linn Energy, LLC | Whiting Petroleum Corporation |
| Crosstex Energy, L.P. | Magellan Midstream Partners, L.P. | |
Except for the position of CEO, compensation data from this analysis are not necessarily comparable to our named executive officers in terms of individual position responsibility, but rather in terms of pay rank. We array peer group compensation data based on pay rank (e.g., highest paid executive, second highest paid executive, etc.) because the same executive positions are not consistently reported from one company to another, and it is difficult to determine specific position responsibilities of peer group officers for comparison to our own officers’ position responsibilities from titles alone.
In addition to publicly-disclosed peer group pay data being presented by Towers Perrin, the Committee also reviewed compensation data provided by Towers Perrin for individuals holding positions similar to the named executive officers obtained from compensation survey sources. Survey data presented were collected from a combination of industry-specific and general industry sources. Energy industry data were collected from Mercer’s 2008 Energy Industry Compensation Survey, which includes data for 217 organizations across a variety of energy industry segments (including upstream and midstream oil and gas). General industry data were also presented to the Committee from Towers Perrin’s 2008 General Industry Executive Compensation Survey, which includes data for over 800 companies across a variety of industries. Survey data provided from both sources are reflective of pay data for companies with revenues of between $500 million and $1 billion, and may be considered “size adjusted.” Although the Committee reviewed survey data in addition to public peer group data in order to have some additional broader-market perspective on the Partnership’s compensation programs, and to help identify emerging trends in compensation in the broader marketplace, in making decisions on individual pay levels, the Committee relied most heavily on the public peer group data in reviewing executive pay.
Upon completion of its review, the Committee targeted for our overall executive compensation program, excluding any equity or incentive interests at Holdings and/or Montierra, to be approximately at the 50th percentile among this peer group, but actually ended-up between the 25th and 50th percentile among the peer group.
Our executive compensation program currently has the following three principal elements: base salary, cash bonuses and equity. This mix of compensation balances compensation with the Partnership’s short term and long term goals. We will continue to evaluate the benefit of this mix as well as the benefit of the mix of components of our equity element.
Base Salary
2009
In early 2008, following a presentation of a study prepared by Towers Perrin, the Compensation Committee elected to maintain 2008 base salary rates at the levels set forth below. These salaries also remained in effect during 2009 for our named executive officers.
| Mr. Mills | | $ | 400,000 | |
| Mr. Wood | | $ | 250,000 | |
| Mr. Garcia | | $ | 210,000 | |
| Mr. Boettcher | | $ | 243,750 | |
| Mr. Hendrickson | | $ | 220,000 | |
| Mr. Schimelpfening | | $ | 220,000 | |
Mr. Mills’ base salary was established at a level that the Compensation Committee determined to be commensurate with Mr. Mills’ experience and knowledge in the energy industry and which would properly motivate Mr. Mills. In doing so, the Committee considered Mr. Mills prior performance and also sought to target the 25th - 50th percentile for Mr. Mills’ overall compensation as among the peer group outlined in the Towers Perrin study. The base salaries of Messrs. Wood, Garcia, Boettcher, Hendrickson, and Schimelpfening were similarly established, by iterating to target the 50th percentile for our named executive officers in the publicly-traded peer group from the Towers Perrin study.
2010 Going Forward
For 2010 and subsequent years, the Committee will analyze the appropriateness of base salaries through two primary means: first, through surveys of public information and other benchmarking techniques of our executive compensation with respect to our peer group, which the Committee will continue to identify and develop, as part of the named executive officer’s overall compensation; and, second, through a review process of base salaries on an annual basis to determine if the performance of both Eagle Rock (as an overall enterprise) and the executive officers (as a group and individually) support the continued or adjusted base salaries. For 2010, the Committee has set specific performance factors and goals for Eagle Rock with respect to its cash bonus decisions specifically, but the Committee will also use those targets as a guideline in making base salary decisions. The Committee will continue to evaluate the appropriate levels of performance factors and goals as a tool to measure and reward performance. See the discussion of the Eagle Rock Performance Goals below under “—Cash Bonus—2010 Going Forward.”
Cash Bonus
2009
For 2009, the Committee has authorized the payment of cash bonuses to the named executive officers, including our Chief Executive Officer, and other employees based on a review of Eagle Rock’s overall performance during 2009 and the individual performance of the executive officer or other employee, resulting in cash bonuses to the named executive officers, to be paid on March 15, 2010, as follows:
Joseph A. Mills | | $ | 361,000 | |
Jeffrey P. Wood | | $ | 142,500 | |
Alfredo Garcia | | $ | 84,788 | |
Charles C. Boettcher | | $ | 138,938 | |
| Steven G. Hendrickson | | $ | 104,500 | |
Joseph E. Schimelpfening | | $ | 114,950 | |
For 2009, the target cash bonus for our named executive officers, as a percentage of their respective base salaries, was 100% for Mr. Mills and 50% for our other named executive officers.
The Committee made its decisions based on the following predetermined enterprise performance goals and factors as guidelines for the Committee. These goals and factors were communicated to the executive officers and other employees during the year.
| Financial Goals: | |
·Adjusted EBITDA | $188.5 million (1) |
·Maintenance Capital Expenditures | Not to exceed $20,000,000 (excluding increases for any new acquisitions or major organic growth projects) |
·Growth Capital Expenditures | Not to exceed $20,000,000 (excluding increases for any new acquisitions) |
·Target IRR (for Capital Projects) | To be at (or greater than): |
| | 18% IRR for Midstream Business; and |
| | 25% IRR for Upstream Business |
·Operating Expenses | Not to exceed |
| | $55,000,000 in aggregate ($0.20/Mcfe) for Midstream Business |
| | $25,000,000 in aggregate ($2.09/Mcfe) for Upstream Business |
·Finding & Development Costs (Upstream) | Not to exceed $10.50 / BOE |
| Environmental and Safety Goals: | |
·Recordable Incident Rate | Not to exceed 2.0 |
·Spills | No major NRC Recordable Spills |
·Regulatory Compliance Program: | - Complete Environmental Air Permitting Audits |
| | - Complete Permitting for Disclosed Air Permitting Deficiencies |
| | - File Regulatory Forms on time and Training for key Operations personnel on TCEQ rules |
| | - Continue to implement proactive Environmental, Health and Safety Program |
| | - Implement Drug and Alcohol Program Required Training Matrix and Internal Audit Plan |
| Governance Goals: | |
·Sarbanes Oxley Compliance | No material weaknesses in Sarbanes Oxley Section 404 Attestation Audit of Internal Controls Over Financial Reporting |
(1) Adjusted EBITDA enterprise performance goal for 2008 was $190.0 million.
When making its bonus assessment for 2009, the Committee first determined that in 2009 the Partnership achieved at least 95% of each of the financial, maintenance capital expenditures, governance and operating expenses (for the Midstream Business) targets as well as the majority of the environmental and safety targets. The Partnership achieved at least 81% of the targets for growth capital expenditures and operating expenses (for the Upstream Business). The Committee determined that bonuses should be funded to the employees taking into consideration the successful achievement of a high percentage of the targets (including, most notably, the 98.4% achievement of Adjusted EBITDA target which does not include gains realized from the October 2009 hedge reset transactions) as well as (i) the continued decrease in the recordable incident rate, (ii) the completion of the environmental air permitting audits and (iii) the measurable reduction in enforcement violations received.
For the 2009 bonus payments, the achievement of the employee’s individual goals was a key factor in determining an employee’s bonus, the formula of which takes into account the following factors: annual base salary, bonus target percentage, funding percentage (as determined by the Board of Directors and dependent on achievement of the Partnership’s enterprise goals, individual performance factor (discretionary value from 0-125%) and any applicable proration factor if an employee was not employed for the full fiscal year). The Chief Executive Officer and other named executive officers’ bonus percentages were established by the Committee at the beginning of 2009, with input from the Chief Executive Officer regarding targets for named executive officers (other than the Chief Executive Officer), and the Committee based its determinations of the individual performance component on the individual performance measured against the individual performance goals and targets established by the Committee for (and communicated during 2009 to) each named executive officer.
2010 Going Forward
For 2010 and subsequent years, the Committee intends to continue providing annual incentive compensation (cash bonuses) to allow Eagle Rock to:
| | • | Reward achievement of financial or operational goals (earnings, safety, cost control, personnel development, and strategic initiatives) so that total compensation more accurately reflects actual company and individual performance; and |
| | • | Convert a portion of fixed employee costs into variable costs. |
In furtherance of these stated intentions, the Committee recommended to the Board of Directors to adopt, and the Board Directors adopted, the 2010 Short Term Incentive Bonus Plan on December 30, 2009.
The performance factors and goals of the Partnership were developed through an iterative effort of the Committee with input from the Chief Executive Officer and other senior management members. As a result, the 2010 Short Term Incentive Bonus Plan contains specific financial, safety and operational targets (the “Enterprise Goals”) as follows:
| Financial Goals: | |
· Adjusted EBITDA | $[*****] |
· Maintenance Capital Expenditures | Not to exceed $25,500,000 (excluding acquisitions or major organic growth projects) |
· Growth Capital Expenditures | Target: $14,500,000 (excluding acquisitions) Upstream development Unit costs not to exceed $1.01 / MCFE Target IRR hurdles for all capital projects will be at (or greater than): 18% IRR for Midstream Projects; and 25% IRR for Upstream Projects |
· Operating Expenses | Upstream: Not to exceed $22,100,000 (excludes TOTI) Unit OPEX not to exceed $[*****] / MCFE |
| | Midstream: Not to exceed $55,000,000 (excludes TOTI) |
| | Unit OPEX not to exceed $[*****] / MCFE of throughput |
| Environmental and Safety Goals: | |
· Recordable Incident Rate | Not to exceed 1.50 |
· Preventable Vehicle Incidents | Not to exceed 5 |
· Implementation of a contractor safety management program designed to drive contractor safety performance at Eagle Rock’s work sites | |
· Environmental and Regulatory Compliance: | Implementation of the OpsInfo EMIS System |
| | Implementation of an internal audit program of EH&S policies, procedures, and training across both operating segments |
· NRC Recordable Spills | No major spills |
| Governance Goals: | |
· Sarbanes Oxley Compliance | No material weaknesses in Sarbanes Oxley Section 404 Attestation Audit of Internal Controls |
[*****] Indicates redacted terms for which confidential treatment has been granted by the Securities and Exchange Commission.
Management believes that the Adjusted EBITDA target for which confidential treatment has been requested is achievable at a 90% level assuming the economic environment is consistent with our current forecast and we perform at or above historical standards.
In addition to the Enterprise Goals set forth above, pursuant to the 2010 Short Term Incentive Bonus Plan, each employee must document a set of measurable individual goals in support of the achievement of the Enterprise Goals. The achievement of his or her Individual Goals will be a key factor in determining an employee’s actual bonus payout, the formula of which takes into account the following factors:
| | • | Funding Percentage, determined by the Board of Directors and dependent on achievement of the Enterprise Goals above |
| | • | Individual Performance Factor, discretionary value from 0 to 125% depending on individual performance relative to the employee’s Performance Appraisal Rating |
The Committee maintains ultimate discretion in assigning the Individual Performance Factor for the Chief Executive Officer, and upon recommendation from the Chief Executive Officer, maintains discretion in assigning the Individual Performance Factor for the leadership team. For 2010, the target cash bonus for our named executive officers, as a percentage of their respective base salaries, is 100% for Mr. Mills and 50% for our other named executive officers. The Board of Directors maintains ultimate discretion in determining whether our Enterprise Goals have been met such that funding is appropriate, and if so what level of funding (Funding Percentage) is appropriate.
Long-Term Incentives
We offer long-term incentive awards to eligible employees, including our named executive officers, through the 2006 Long-Term Incentive Plan of Eagle Rock Energy Partners, L.P., as amended in 2008 to increase the aggregate available common units for grant and further amended in 2009 for compliance with Section 409A of the Internal Revenue Code of 1986, as amended, which we refer to in this Item 11 as the “LTIP.” The LTIP is described in further detail below. LTIP awards are intended to further align the interests of our employees with the interests of our public unitholders through shared ownership of Eagle Rock.
Additionally, although we do not control the ability to cause equity incentive grants by Holdings, the Holdings Board, controlled by NGP, in the past has from time-to-time granted equity in Holdings to certain of our employees, including our named executive officers, when such equity is available -- primarily because of forfeitures upon the departure of members of our management. The Committee does factor in the percentage of ownership of Holdings when determining appropriate awards under our LTIP. During 2009, the Holdings Board consisted of three representatives of NGP, and Messrs. Mills and Garcia. Other than as described below with respect to Mr. Wood, the Holdings Board did not issue any other equity incentive grants during 2009.
2009
In 2009, the Compensation Committee authorized awards of restricted common units under the LTIP to the following named executive officers in the amounts set forth below, providing for vesting in three substantially equivalent increments (i.e., 33%, 33%, and 34%) on each of November 15, 2010, November 15, 2011, and November 15, 2012, with the exception of 50,000 of the restricted units awarded to Mr. Wood on January 5, 2009 providing for vesting in three substantially equivalent increments (i.e., 33%, 33%, and 34%) on each of November 15, 2009, November 15, 2010, and November 15, 2011. In determining awards, the Compensation Committee considers prior discretionary grants made by the Holdings Board to our named executive officers.
| | | Restricted Common Units | |
| Joseph A. Mills | | | 200,000 | |
| Jeffrey P. Wood | | | 150,000 | |
| Charles C. Boettcher | | | 100,000 | |
| Steven G. Hendrickson | | | 100,000 | |
| Joseph E. Schimelpfening | | | 100,000 | |
The awards to Messrs. Mills, Wood, Boettcher, Hendrickson and Schimelpfening were greater in number of restricted common units per person than awards made to other members of senior management. These awards were made with the intent of equalizing the cash and non-cash compensation incentives among senior management, rewarding outstanding performance and as a retention tool. As among the group receiving awards, senior management received the vast majority of the awards by number of restricted common units.
As mentioned above, although it has no discretion in granting any awards at the Holdings level, the Compensation Committee does review prior discretionary grants made by the Holdings Board to our named executive officers. Certain of our named executive officers have previously received incentive equity ownership in Holdings. As of December 31, 2009, Mr. Garcia and certain other executive officers held direct, non-incentive equity ownership in Holdings based on prior capital contributions which were made at the time of initial employment, and all of the named executive officers had been granted incentive interests in Holdings in the form of various “tier” units. The incentive units were intended by the Holdings’ Board to create incentives for the management of the private company to reach certain pre-determined payout goals. The payout goals were set by NGP in negotiations with the limited partners of Holdings. The incentive interests to our named executive officers, which consist of several “tiers” of incentive interests, represent an interest in the future profits of Holdings and are intended to be treated as “profits interests” for federal income tax purposes. The incentive interests are subject both to time-vesting requirements and to meeting payout hurdles defined as cumulative cash payout amounts distributed to NGP within a certain time period. We have been informed by the Holdings Board that the first of these incentive tiers has met its payout goal and therefore the Tier I incentive interests are participating ratably with respect to 17.5% of the distributions from Holdings. Tier I incentive interests issued prior to January of 2006 are no longer subject to forfeiture; however, Tier I incentive interests issued on or after January 1, 2006 continue to be subject to forfeiture. The payout goals established by the Holdings Board for the Tier II and Tier III incentive interests are as follows: (i) Tier II - payout goal is met when NGP has received cumulative cash distributions equal to 2.5 times its cumulative capital contributions at which point the Tier II incentive interests will participate ratably with respect to 5% of the distributions from Holdings and (ii) Tier III - payout goal is met when NGP has received cumulative cash distributions equal to 3.5 times its cumulative capital contributions at which point the Tier III incentive interests will participate ratably with respect to 5% of the distributions from Holdings. At this time, the Holdings Board believes it is unlikely that the Tier II and Tier III payout goals will be achieved.
Messrs. Mills, Wood, Boettcher, Hendrickson and Schimelpfening have not invested in Holdings and do not hold non-incentive equity ownership. During 2009, the Holdings Board determined to make a grant to Mr. Wood of incentive interests which, if and when the payout goals for these units at the Holdings’ level are achieved, would entitle Mr. Wood to approximately the percentage of overall distributions from Holdings as follows: Tier I – 0.58% and Tier III – 0.19%
Because the payout goal for the Tier I incentive interests had already been achieved prior to this grant, the recipient became eligible immediately to participate pro rata in any future distributions, as and when paid, as to its Tier I incentive interests. In contrast, the payout goal for the Tier III incentive interests remains to be achieved and thus these interests do not entitle Mr. Wood to any share of current distributions, as and when declared. The interests are subject to vesting and forfeiture.
In the Summary Compensation Table, in accordance with FAS 123R and SEC Staff Accounting Bulletin Topic 1.B, we show these 2009 and 2008 grants as “Other Compensation.”
2010 Going Forward
Restricted Common Units under the LTIP. The Committee intends to use grants of restricted common units from the LTIP as a primary equity incentive for executive officers. Under the LTIP, as amended in 2008, the Committee had the right to grant awards of up to 2,000,000 common units in the form of option awards or other types of incentive grants. Notwithstanding the fact that the Committee has this discretion to issue awards of varying types, the Committee thus far has determined that it is in the best interest of the Partnership to make only grants of restricted common units because of the important sense of ownership created by these grants, which the Committee believes will align the interests of our executive officers and other recipients more closely with the interests of our public unitholders. From our initial public offering to December 31, 2009, the Committee has granted to employees, officers, and directors of G&P a total of 2,221,771 common units as restricted units, and 316,357 of such restricted common units have been forfeited and 24,892 of such restricted common units were surrendered in connection with their vestings on October 26, 2007, May 15, 2009, and November 15, 2009. Because the forfeited and canceled units are available for reissuance under the LTIP, there remained 119,978 common units available for issuance under the LTIP as of December 31, 2009. The Committee is considering recommending to the Board the adoption of a new long-term incentive plan during 2010.
The historical grants to our named executive officers under the LTIP have been made under restricted common unit award agreements, which generally call for the restricted common units to vest in three approximately equal increments over an approximately three-year vesting period (i.e., 33%, 33% and 34%). The form of award agreement applicable to the grants made on December 30, 2009 specifically excludes the exercise of the GP acquisition option under the Global Transaction Agreement as a “Change in Control” which would otherwise cause an acceleration of vesting. As a result of negotiations by our officers who became officers upon completion of the Montierra Acquisition, the form of award agreement, applicable to awards after May 2007, provides that quarterly distributions from Eagle Rock, which are declared and paid on restricted common units under the LTIP, are paid directly to the holder of such restricted common units. Prior to May 2007, the previous form of the award agreement provided that our quarterly distributions, that were declared and paid on restricted common units under the LTIP, were to be held by Eagle Rock for the benefit of the holder of the restricted common units until the restricted common units vested or for the benefit of Eagle Rock if the restricted common units were forfeited prior to vesting. All awards made prior to May 2007 were altered to provide for future distributions to be treated in similar fashion, while past distributions continue to be handled in accordance with the original terms of the original award agreements (i.e., continue to be held until the vesting or forfeiture of the underlying common units to which they relate). In general with respect to all award forms, the restricted common units are forfeited upon termination of the holder’s employment with G&P, and vesting of the restricted common units is accelerated upon a change in control, except as noted above, or upon death of the holder.
Incentive Interests in Holdings. As mentioned above, although the Committee does not control the ability to issue any equity ownership in Holdings, which is controlled by NGP, and does not know the exact terms or performance used by the Holdings Board in making its equity grant decisions at the Holdings level for our officers, the Committee from time-to-time may request from NGP, and from Holdings, information regarding equity interests at the Holdings level that have been granted to our officers by the Holdings Board. The Committee will use this information in determining appropriate levels of grants from the LTIP as well as in making overall compensation decisions to ensure that each officer’s equity ownership in the Eagle Rock enterprise (including Holdings, for this purpose) as well as his or her overall compensation is in line with what the Committee deems appropriate in its discretion with respect to each officer’s level of seniority within the Eagle Rock organization. Holdings currently owns 2,338,419 common units and 20,691,495 subordinated units as well as indirectly benefiting from the general partner units and the incentive distribution rights owned by our general partner (although certain economic value in these incentive distribution rights has been assigned to Montierra—for a description of the Montierra Acquisition, see Part III, Item 12. Certain Relationships and Related Transactions, and Director Independence). Should the Recapitalization and Related Transactions be consummated, Holdings will contribute to us all of the subordinated units and cause our general partner to contribute to us all of our incentive distribution rights. We anticipate Holdings will continue to be a substantial owner of our common units if the Recapitalization and Related Transactions are completed.
At this time, there remains to be allocated at Holdings certain Tier I incentive interests that would entitle the holder(s) to 0.14 % of overall distributions from Holdings. Because the incentive interests at Holdings represent an interest in the future profits of Holdings and receive distributions and allocations only from Holdings’ cash and net income, these incentive interests are not an additional burden on, or dilutive to, the returns on our common units (beyond such dilution or burden that already exists by virtue of the incentive distribution rights and general partner units held by our general partner and the common units and subordinated units held by Holdings). On the contrary, such incentive interests are solely a burden on, and dilutive to, the returns of the equity owners of Holdings, including NGP as the substantial majority owner of Holdings.
Equity Interests in Montierra. Similar to Holdings, although the Committee does not control the ability to issue any equity ownership in Montierra, which is controlled by NGP, and does not know the exact terms or performance targets used by Montierra in making its equity grant decisions at the Montierra level for our officers, the Committee from time-to-time may request from NGP, and from Montierra, information regarding equity interests at the Montierra level owned by our officers. The Committee will use this information in determining appropriate levels of grants from the LTIP, as well as making overall compensation decisions for these officers, to ensure that each officer’s equity ownership in the Eagle Rock enterprise, as well as his or her overall compensation, is in line with what the Committee deems appropriate. Montierra, which is controlled by NGP but which is partially owned by our Chief Executive Officer, Mr. Mills, our Senior Vice Presidents, Messrs. Hendrickson and Schimelpfening, and one of our other officers, currently owns 2,897,047 common units as well as the economic interest of certain incentive distribution rights owned by our general partner (for a description of the Montierra Acquisition, see Part III, Item 12. Certain Relationships and Related Transactions, and Director Independence). For a description of their ownership of Montierra, see footnote 4 to the chart appearing in Part III, Item 12. Security Ownership of Certain Beneficial Owners and Management and Related Unitholder Matters.
As with Holdings’ incentive interests, we strongly believe that having a substantial component of Mr. Mills’ and other named executive officers’ and officers’ equity incentives funded through their ownership in Montierra is a competitive advantage for us and our common unitholders by potentially lowering our overall costs related to their compensation, which, in turn, should increase returns to our common unitholders.
Impact of Financial Reporting and Tax Accounting Rules
Effective January 1, 2006, the Partnership adopted authoritative guidance which requires that compensation cost relating to share-based payment transactions be recognized in the financial statements. That cost is measured based on the fair value of the equity or liability instruments issued.
Despite the fact that the grants of incentive interests at Holdings are solely a burden on, and dilutive to, the returns of the equity owners of Holdings, including NGP as the substantial majority owner of Holdings, according to the authoritative guidance, the Partnership recorded a portion of the value of the incentive units as compensation expense in the Partnership’s 2008 and 2009 financial statements. Unlike grants of restricted common units under our LTIP, which fair value is relatively easy to determine (based on the freely-tradable nature of a common unit once the restrictions lapse), the grants of incentive interests at Holdings are susceptible to a host of difficult determinations including (i) estimating fair value of an illiquid, minority interest of a holding company; (ii) estimating when the fair value accretes to the grantee; and (iii) allocating the portion of such fair value that is “for the benefit of” the Partnership based on grantee’s portion of time dedicated to the Partnership as opposed to other business of Holdings. The Partnership recorded a non-cash compensation expense of $1,665,831 and $371,551 based on management’s estimates related to the Tier I incentive interest grants made by Holdings in 2008 and 2009, respectively.
IRC Section 162(m). Section 162(m) of the Internal Revenue Code, as amended (the “Code”), limits the deductibility of certain compensation expenses in excess of $1,000,000 to any one individual in any fiscal year. Compensation that is “performance based” is excluded from this limitation. For compensation to be “performance based,” it must meet certain criteria including certain predetermined objective standards approved by the Committee. We believe that maintaining the discretion to evaluate the performance of our executive officers is an important part of our responsibilities and benefits our unitholders. The Committee, in coordination with management, periodically assesses the potential application of Section 162(m) on incentive compensation awards and other compensation decisions.
Change in Named Executive Officers
Mr. Garcia was re-appointed Interim Chief Financial Officer on August 15, 2008 and relinquished that position on January 5, 2009 in connection with the appointment of Mr. Wood.
Compensation Committee Report:
Our compensation committee has reviewed and discussed with management the Compensation Discussion and Analysis contained in this Annual Report on Form 10-K. Based on the compensation committee’s review of, and discussions with management with respect to, the Compensation Discussion and Analysis, the compensation committee has recommended to our board of directors that the Compensation Discussion and Analysis be included in this annual report on Form 10-K.
| | William A. Smith, Chairman |
Compensation Tables
Summary Compensation Table
The Summary Compensation Table below sets forth information regarding 2009, 2008 (where applicable), and 2007 (where applicable) compensation for our Chief Executive Officer, persons who served as our Chief Financial Officer, and our other named executive officers:
| Name and Principal Position | | Year | | Salary ($) | | Bonus ($)(4) | | Unit Awards ($)(5) | | Option Awards ($)(6) | | Non-Equity Incentive Plan Compensation ($) | | Change in Pension Value and Nonqualified Deferred Compensation Earnings ($) | | All Other Compensation ($)(7)(8)(9)(10) | | Total ($) | |
| | | | | | | | | | | | | | | | | | | | |
| Joseph A. Mills | | 2009 | | $ | 400,000 | | $ | 361,000 | | $ | 1,174,000 | | | — | | | — | | | — | | $ | 81,740 | | $ | 2,016,740 | |
| Chief Executive Officer, Chairman of the Board, Director | | 2008 | | $ | 359,615 | | $ | 385,000 | | $ | 1,437,350 | | | — | | | — | | | — | | $ | 554,552 | | $ | 2,736,517 | |
| | | 2007 | | $ | 166,668 | | $ | 266,667 | | $ | 1,984,750 | | | — | | | — | | | — | | $ | 77,467 | | $ | 2,495,552 | |
| | | | | | | | | | | | | | | | | | | | | | | | | | | | |
| Jeffrey P. Wood | | 2009 | | $ | 248,057 | | $ | 142 500 | | $ | 907,000 | | | — | | | — | | | — | | $ | 403,516 | | $ | 1,701,073 | |
Senior Vice President and Chief Financial Officer (1) | | | | | | | | | | | | | | | | | | | | | | | | | | | |
| | | | | | | | | | | | | | | | | | | | | | | | | | | | |
Alfredo Garcia | | 2009 | | $ | 210,000 | | $ | 84,788 | | NA | | | — | | | — | | | — | | $ | 16,758 | | $ | 311,546 | |
| Senior Vice President, | | 2008 | | $ | 205,191 | | $ | 101,063 | | $ | 253,650 | | | — | | | — | | | — | | $ | 30,425 | | $ | 590,329 | |
| Corporate Development and Former Interim Chief Financial Officers (2) | | 2007 | | $ | 191,664 | | $ | 100,000 | | | — | | | — | | | — | | | — | | $ | 18,250 | | $ | 309,914 | |
| | | | | | | | | | | | | | | | | | | | | | | | | | | | |
Charles C. Boettcher | | 2009 | | $ | 243,750 | | $ | 138 938 | | $ | 587,000 | | | — | | | — | | | — | | $ | 40,543 | | $ | 1,010,231 | |
| Senior Vice President, General Counsel, Chief Compliance Officer and Secretary | | 2008 | | $ | 236,468 | | $ | 117,305 | | $ | 422,750 | | | — | | | — | | | — | | $ | 551,010 | | $ | 1,327,533 | |
| | | 2007 | | $ | 85,243 | | $ | 75,000 | | $ | 1,119,000 | | | — | | | — | | | — | | $ | 88,599 | | $ | 1,367,842 | |
| | | | | | | | | | | | | | | | | | | | | | | | | | | | |
Steven G. Hendrickson | | 2009 | | $ | 220,000 | | $ | 104 500 | | $ | 587,000 | | | — | | | — | | | — | | $ | 29,292 | | $ | 940,792 | |
| Senior Vice President,Technical Evaluation | | 2008 | | $ | 212,692 | | $ | 105,875 | | $ | 422,750 | | | — | | | — | | | — | | $ | 290,053 | | $ | 1,031,370 | |
| | | 2007 | | $ | 133,331 | | $ | 100,000 | | $ | 575,134 | | | — | | | — | | | — | | $ | 21,052 | | $ | 829,517 | |
| | | | | | | | | | | | | | | | | | | | | | | | | | | | |
Joseph E. Schimelpfening | | 2009 | | $ | 220,000 | | $ | 114,950 | | $ | 587,000 | | | — | | | — | | | — | | $ | 25,945 | | $ | 947,895 | |
Senior Vice President, Upstream and Minerals Business (3) | | 2008 | | $ | 212,692 | | $ | 105,875 | | $ | 422,750 | | | — | | | — | | | — | | $ | 287,113 | | $ | 1,028,430 | |
| | | 2007 | | $ | 133,331 | | $ | 100,000 | | $ | 575,134 | | | — | | | — | | | — | | $ | 19,052 | | $ | 827,517 | |
| (1) | Mr. Wood was appointed on January 5, 2009 to the office of Senior Vice President and Chief Financial Officer of Eagle Rock Energy G&P, LLC. |
| (2) | Mr. Garcia served as Interim Chief Financial Officer from August 15, 2008 until he relinquished that position on January 5, 2009 in connection with the appointment of Mr. Wood. |
| (3) | Mr. Schimelpfening’s title changed in 2008. |
| (4) | Bonuses accrued for executives with regard to 2009 performance will be paid on March 15, 2010. |
| (5) | With respect to 2009, the amounts represent: the dollar amount of 200,000 restricted common units awarded to Mr. Mills on December 30, 2009, the dollar amount of 100,000 restricted common units awarded to each of Messrs. Wood, Boettcher, Hendrickson and Schimelpfening on December 30, 2009. Such units vest 33% on November 15, 2010, 33% on November 15, 2011, and 34% on November 15, 2012. In determining the dollar amount, such units are valued at $5.87, which was the price of such units on the date of grant, December 30, 2009. In addition, with respect to 2009 for Mr. Wood, the amount represents the dollar amount of 50,000 restricted common units awarded to Mr. Wood on January 5, 2009. Such units are valued at $6.40, which was the price of such units on the date of grant, January 5, 2009. Such units vest 33% on November 15, 2009, 33% on November 15, 2010 and 34% on November 15, 2011. With respect to 2008, the amounts represent: the dollar amount of 85,000 restricted common units awarded to Mr. Mills on May 15, 2008; the dollar amount of 15,000 restricted common units awarded to Mr. Garcia on May 15, 2008; and the dollar amount of 25,000 restricted common units awarded to Messrs. Boettcher, Hendrickson and Schimelpfening on May 15, 2008. Such units vest 33% on May 15, 2009, 33% on May 15, 2010, and 34% on May 15, 2011. In determining the dollar amount, such units are valued at $16.91, which is the price of such units on the date of grant, May 15, 2008. With respect to 2007, the amounts represent: the dollar amount of 85,000 restricted common units awarded to Mr. Mills on May 15, 2007; the dollar amount of 50,000 restricted common units awarded to Mr. Boettcher on August 15, 2007; the dollar amount of 24,631 restricted common units awarded to Mr. Hendrickson on May 15, 2007; and the dollar amount of 24,631 restricted common units awarded to Mr. Schimelpfening on May 15, 2007. Such units vest 33% on May 15, 2008, 33% on May 15, 2009, and 34% on May 15, 2010. In determining the dollar amount, such units are valued at $23.35, which is the price of such units on the date of grant, May 15, 2007, except for Mr. Boettcher, whose units were granted on August 15, 2007 and which are valued at $22.38 per unit. |
| (6) | No options were awarded by the Partnership. |
| (7) | With respect to 2009, the amounts include contributions that we made to each named executive officer under our 401(k) plan in the following amounts: Mr. Mills, $15,499; Mr. Wood, $7,515; Mr. Garcia, $9,530; Mr. Boettcher, $13,208; Mr. Hendrickson, $9,782; and Mr. Schimelpfening, $6,435. With respect to 2008, the amounts include contributions that we made to each named executive officer under our 401(k) plan in the following amounts: Mr. Mills, $32,993; Mr. Garcia, $18,125; Mr. Boettcher, $22,807; Mr. Hendrickson, $18,679; and Mr. Schimelpfening, $15,739. With respect to 2007, represents the amount of contributions that we made to each named executive officer under our 401(k) plan in the following amounts: Mr. Mills, $15,417; Mr. Garcia, $18,250; Mr. Boettcher, $0; Mr. Hendrickson, $12,000; and Mr. Schimelpfening, $10,000. |
| (8) | The amounts include distributions that we made to each named executive officer on account of outstanding restricted common units under the LTIP that had not yet vested (i.e., for which the restrictions had not yet lapsed). With respect to 2009, the distribution payments were in the following amounts: Mr. Mills, $66,041; Mr. Wood, $24,250; Mr. Garcia, $7,028; Mr. Boettcher, $27,135; Mr. Hendrickson, $19,310; and Mr. Schimelpfening, $19,310. With respect to 2008, the distribution payments were in the following amounts: Mr. Mills, $183,761; Mr. Garcia, $12,300; Mr. Boettcher, $87,595; Mr. Hendrickson, $53,552; and Mr. Schimelpfening, $53,552. With respect to 2007, the distribution payments were in the following amounts: Mr. Mills, $62,050; Mr. Garcia, $0; Mr. Boettcher, $18,375; Mr. Hendrickson, $9,052; and Mr. Schimelpfening, $9,052. |
| (9) | Certain of the named executive officers received grants of incentive interests in Eagle Rock Holdings, L.P. from the Holdings Board. Pursuant to SEC Staff Accounting Bulletin Topic 1.B., the Tier I incentive interests are valued and included in “other compensation” but the Tier II and III incentive interests are not included. For 2009, the value of the Tier I incentive interests for Mr. Wood was $371,551, no other named executive officers received grants of incentive interests. For 2008, the value of the Tier I incentive interests for the named executive officers is as follows: Mr. Mills, $337,799; Mr. Garcia, $0; Mr. Boettcher, $440,608; Mr. Hendrickson, $217,822; and Mr. Schimelpfening, $217,822. For a discussion of the incentive interests granted, see “—Discussion and Analysis of Executive Compensation—Long-Term Incentives—2008.” |
| (10) | With respect to 2009, the amounts include paymentsfor parking and other transpotation that we made to each named executive officer of $200. No amounts wer paid in 2008 and 2007. |
The named executive officers listed above were previously granted incentive interests in, and are limited partners of, Eagle Rock Holdings, L.P., which owns common units and subordinated units in us as well as general partner units and incentive distribution rights through its ownership of our general partner. In addition, Mr. Garcia previously purchased limited partnership interests in Holdings. As a result of these prior grants and purchases, (i) during 2009, the named executive officers received cash distributions based on their limited partnership interests in Holdings in the following amounts: Mr. Mills, $24,729; Mr. Wood, $56,524, Mr. Garcia, $325,641; Mr. Boettcher, $15,897; Mr. Hendrickson, $11,923; and Mr. Schimelpfening, $11,923, (ii) during 2008, the named executive officers received cash distributions based on their limited partnership interests in Holdings in the following amounts: Mr. Mills, $21,794; Mr. Garcia, $1,236,281; Mr. Boettcher, $29,807; Mr. Hendrickson, $10,507; and Mr. Schimelpfening, $10,507, and (iii) during 2007, Mr. Garcia received $460,139 in cash distributions based on his limited partnership interests in Eagle Rock Holdings, L.P. and no other named executive officer received any distributions. We do not consider these amounts to be compensation from the Partnership to these individuals; however, we consider a majority of the value of the incentive interests (on the date granted in 2008) to be compensation from the Partnership. These amounts are distributions based on their respective ownership in Holdings, which holds the equity in us as described above. These distributions are funded by Holdings and are not funded by us, other than indirectly by virtue of our direct and indirect distributions to Holdings on account of its direct and indirect equity ownership in us.
Grants of Plan-Based Awards
The table below sets forth information regarding grants of plan-based awards made to our named executive officers during 2009.
| | | | | Estimated Future Payouts Under Non-Equity Incentive Plan Awards | | | Estimated Future Payouts Under Equity Incentive Plan Awards | | | All Other Unit Awards(1): Number of Restricted Units (#) | | | All Other Option Awards: Number of Securities Underlying Options (#) | | | Exercise or Base Price of Option Awards ($/Unit) | | | Grant Date Fair Value of Unit and Option Awards(2) | |
| Name | | Grant Date | | Threshold ($) | | | Target ($) | | | Maximum ($) | | | Threshold (#) | | | Target (#) | | | Maximum (#) | |
Joseph A. Mills | | 12/30/09 | | | — | | | | — | | | | — | | | | — | | | | — | | | | — | | | | 200,000 | | | | — | | | | — | | | $ | 1,174,000 | |
Jeffrey P. Wood | | 1/5/09 | | | — | | | | — | | | | — | | | | — | | | | — | | | | — | | | | 50,000 | | | | — | | | | — | | | $ | 320,000 | |
| | | 12/30/09 | | | — | | | | — | | | | — | | | | — | | | | — | | | | — | | | | 100,000 | | | | — | | | | — | | | $ | 587,000 | |
Alfredo Garcia | | NA | | | — | | | | — | | | | — | | | | — | | | | — | | | | — | | | | — | | | | — | | | | — | | | | — | |
Charles C. Boettcher | | 12/30/09 | | | — | | | | — | | | | — | | | | — | | | | — | | | | — | | | | 100,000 | | | | — | | | | — | | | $ | 587,000 | |
Steven G. Hendrickson | | 12/30/09 | | | — | | | | — | | | | — | | | | — | | | | — | | | | — | | | | 100,000 | | | | — | | | | — | | | $ | 587,000 | |
| Joseph E. Schimelpfening | | 12/30/09 | | | — | | | | — | | | | — | | | | — | | | | — | | | | — | | | | 100,000 | | | | — | | | | — | | | $ | 587,000 | |
| (1) | For all, represents the amount of restricted units awarded on December 30, 2009. Such units vest 33% on November 15, 2010, another 33% on November 15, 2011, and the final 34% on November 15, 2012. As for Mr. Wood, the grant of 50,000 restricted units on January 5, 2009 vests 33% on November 15, 2009, another 33% on November 15, 2010, and a final 34% on November 15, 2011. |
| (2) | Calculated based upon unit price on December 30, 2009 of $5.87 times the number of restricted units. As for Mr. Wood’s January 5, 2009 grant, this grant is calculated based upon unit price on January 5, 2009 of $6.40 times the number of restricted units. |
Outstanding Equity Awards at Fiscal Year-End
The following table summarizes the number of securities underlying outstanding plan awards for each named executive officer as of December 31, 2009.
| Name | Option Awards | | | Unit Awards | |
| | | | | | | | | | | | | | | | | | | | | | | | | | | | | | | | | | | | | | |
| | Number of Securities Underlying Unexercised Options (#) Exercisable | | | Number of Securities Underlying Unexercised Options (#) | | | Equity Incentive Plan Awards: Number of Securities Underlying Unexercised Unearned Options | | | Option Exercise Price | | | Option Expiration | | | Number of Units That Have Not Vested | | | Market Value of Units That Have Not Vested(1) | | | Equity Incentive Plan Awards: Number of Unearned, Units or Other Rights That Have Not Vested | | | Equity Incentive Plan Awards: Market or Payout Value of Unearned Shares, Units or Other Rights That Have Not Vested | |
Joseph A. Mills | | — | | | | — | | | | — | | | | — | | | | — | | | | 285,850 | (2) | | $ | 1,655,072 | | | | — | | | | — | |
Jeffrey P. Wood | | — | | | | — | | | | — | | | | — | | | | — | | | | 133,500 | (3) | | $ | 772,965 | | | | — | | | | — | |
Alfredo Garcia | | — | | | | — | | | | — | | | | — | | | | — | | | | 10,050 | (4) | | $ | 58,190 | | | | — | | | | — | |
Charles C. Boettcher | | — | | | | — | | | | — | | | | — | | | | — | | | | 133,750 | (5) | | $ | 774,413 | | | | — | | | | — | |
| Steven G. Hendrickson | | — | | | | — | | | | — | | | | — | | | | — | | | | 125,125 | (6) | | $ | 724,474 | | | | — | | | | — | |
| Joseph E. Schimelpfening | | — | | | | — | | | | — | | | | — | | | | — | | | | 125,125 | (7) | | $ | 724,424 | | | | — | | | | — | |
| (1) | Calculated based upon common unit price at end of the fiscal year of $5.79 times the number of unvested restricted unit awards. |
| (2) | 56,950 units vest on May 15, 2010; 66,000 units vest on November 15, 2010; 28,900 units vest on May 15, 2011; 66,000 units vest on November 15, 2011 and 68,000 units vest on November 15, 2012. |
| (3) | 49,500 units vest on November 15, 2010; 50,000 units vest on November 15, 2011 and 34,000 units vest on November 15, 2012. |
| (4) | 4,950 units vest on May 15, 2010 and 5,100 units vest on May 15, 2011. |
| (5) | 25,250 units vest on May 15, 2010; 33,000 units vest on November 15, 2010; 8,500 units vest on May 15, 2011; 33,000 units vest on November 15, 2011 and 34,000 units vest on November 15, 2012. |
| (6) | 16,625 units vest on May 15, 2010; 33,000 units vest on November 15, 2010; 8,500 units vest on May 15, 2011; 33,000 units vest on November 15, 2011 and 34,000 units vest on November 15, 2012. |
| (7) | 16,625 units vest on May 15, 2010; 33,000 units vest on November 15, 2010; 8,500 units vest on May 15, 2011; 33,000 units vest on November 15, 2011 and 34,000 units vest on November 15, 2012. |
Option Exercises and Units Vested
The following table summarizes the number of units that vested for the named executive officers during the year ended December 31, 2009.
| | | | | | | | | | | | | |
| | | Option Awards | | | Unit Awards | |
| Name | | Number of units acquired on exercise (#) | | | Value Realized on Exercise ($) | | | Number of Units Acquired on Vesting (#) | | | Value Realized on Vesting(1) ($) | |
Joseph A. Mills | | | — | | | | — | | | | 56,100 | | | $ | 176,154 | |
Jeffrey P. Wood | | | — | | | | — | | | | 16,500 | | | $ | 78,705 | |
| Alfredo Garcia | | | — | | | | — | | | | 4,950 | | | $ | 15,543 | |
| Charles C. Boettcher | | | — | | | | — | | | | 24,750 | | | $ | 77,715 | |
Steven G. Hendrickson | | | — | | | | — | | | | 16,378 | | | $ | 51,427 | |
| Joseph E. Schimelpfening | | | — | | | | — | | | | 16,378 | | | $ | 51,427 | |
| (1) | Calculated based upon a closing unit price of $3.14 on May 15, 2009, the date of vesting, and $4.77 on November 13, 2009, the date of vesting for Mr. Wood. |
Employment Agreements and Severance and Change of Control Arrangements
The award agreements under the LTIP provide for accelerated vesting upon a change of control of G&P or Eagle Rock (i) ownership of more than 50% of the voting securities by a person or entity other than an NGP Affiliate, (ii) a sale or liquidation of substantially all of the assets to any other non-affiliated party, or (iii) G&P or an affiliate of NGP ceases to be the general partner) or termination of employment by reason of death or disability of the employee.
The following table illustrates the potential value of the acceleration of the vesting requirements of prior equity grants under our LTIP to our named executive officers in certain circumstances described in the table. We do not have any obligation to make cash payments upon termination of employment or a change in control transaction for any of the named executive officers. The amounts in the table represent the value of the restricted common units that would vest as a result of the termination of the named executive officer’s employment or a change in control if such transaction had occurred at December 31, 2009. For purposes of valuing the restricted common unit grants, the amounts below are based on a per common unit price of $5.79, which was the closing price of our common units as reported on the NASDAQ Global Select Market December 31, 2009.
| Name | | Retirement, Termination for cause, or Voluntary Termination | | | Termination Without Cause or for Good Reason (1) | | | Change of Control (2)(3) | | | Change of Control(4) | | | Death or Disability(5) | |
Joseph A. Mills | | $ | — | | | $ | 1,158,000 | | | $ | 1,655,072 | | | $ | 497,072 | | | $ | 1,655,072 | |
| Jeffrey P. Wood | | $ | — | | | $ | 579,000 | | | $ | 772,965 | | | $ | 193,965 | | | $ | 772,965 | |
Alfredo Garcia | | $ | — | | | $ | — | | | $ | 58,190 | | | $ | 58,190 | | | $ | 58,190 | |
Charles C. Boettcher | | $ | — | | | $ | 579,000 | | | $ | 774,413 | | | $ | 195,413 | | | $ | 774,413 | |
Steven G. Hendrickson | | $ | — | | | $ | 579,000 | | | $ | 724,474 | | | $ | 145,474 | | | $ | 724,474 | |
Joseph E. Schimelpfening | | $ | — | | | $ | 579,000 | | | $ | 724,474 | | | $ | 145,474 | | | $ | 724,474 | |
| (1) | The award agreements with respect to the restricted units granted on December 30, 2009 provide the Compensation Committee the option, in its sole and absolute discretion, to vest all or a portion of the restricted units in the event of a termination without cause or for good reason. The potential value set forth in the table assumes that all restricted units would be vested. |
| (2) | The definition of change of control is defined above in this subsection and does not take into account if a change of control occurs due to the exercise of the GP acquisition option. See Footnote 4 below. |
| (3) | The potential value set forth in the table is based on the following number of unvested units: Mr. Mills – 285,580; Mr. Wood – 133,500; Mr. Garcia – 10,050; Mr. Boettcher – 133,750; Mr. Hendrickson – 125,125; and Mr. Schimelpfening – 125,125. |
| (4) | If a change of control occurs due to the exercise of the GP acquisition option, the potential value of the acceleration of the unvested common units would not include the December 30, 2009 grants as the award agreements associated with those grants expressly excludes from the definition of change of control the exercise of the GP acquisition option. In such event, the potential value set forth in the table is based on the following number of unvested units: Mr. Mills – 85,850; Mr. Wood – 33,500; Mr. Garcia – 10,050 (Mr. Garcia did not receive a grant on December 30, 2009); Mr. Boettcher – 33,750; Mr. Hendrickson – 25,125; and Mr. Schimelpfening – 25,125. |
| (5) | Includes the acceleration of vesting of all unvested common units held by each named executive officer. |
In addition to the restricted common units granted under the LTIP, any equity grants under the Holdings limited partnership agreement and the Montierra limited partnership agreement are subject to vesting requirements that may be accelerated in certain change of control transactions similar to the definition of change of control described above and certain termination scenarios similar to those described above. However, these equity grants either are (i) subject to reaching further payout goals that have not been met, as described above in “—Discussion and Analysis of Executive Compensation—Long Term Incentives” and ”Long-Term Incentive”, or (ii) have reached the applicable payout goal (in the case of Tier I incentive interests of Holdings) and the expense allocation has already been included in our 2009 financial statements pursuant to the authoritative guidance adopted as discussed above. Based on the lack of value of those equity units that have not achieved their payout goals using the hypothetical transaction date of December 31, 2009, we have not included any disclosure in the table above regarding these equity units.
2009 Director Compensation
The table below sets forth certain information concerning the compensation earned in 2009 by our non-employee directors who served in 2009. Information on our employee director who served in 2009, Joseph A. Mills, is set forth above for named executive officers.
Director Compensation
| | | | | | | | | | | | | | | | | | | | | | |
| Name | | Fees Earned or Paid in Cash(1) ($) | | | Unit Awards ($) | | | Option Awards ($) | | | Non-Equity Incentive Plan Compensation ($) | | | Change in Pension Value and Nonqualified Deferred Compensation Earnings | | | All Other Compensation(3) ($) | | | Total ($) | |
Kenneth A. Hersh | | | — | | | | — | | | | — | | | | — | | | | — | | | | — | | | | — | |
William J. Quinn | | | — | | | | — | | | | — | | | | — | | | | — | | | | — | | | | — | |
John A. Weinzierl | | | — | | | | — | | | | — | | | | — | | | | — | | | | — | | | | — | |
Philip B. Smith | | $ | 87,516 | | | $ | 20,545 | (2) | | | — | | | | — | | | | — | | | $ | 3,990 | | | $ | 112,051 | |
William A. Smith | | $ | 90,016 | | | $ | 20,545 | (2) | | | — | | | | — | | | | — | | | $ | 3,265 | | | $ | 113,826 | |
William K. White | | $ | 70,012 | | | $ | 20,545 | (2) | | | — | | | | — | | | | — | | | $ | 4,761 | | | $ | 95,318 | |
| (1) | Reflects fees paid or earned by our non-employee directors in 2009. Please see Additional Payment to Conflicts Committee Members below. |
| (2) | Represents the dollar amount of 3,500 restricted common units awarded on December 30, 2009. Such units vest 33% on November 15, 2010, another 33% on November 15, 2011, and a final 34% on November 15, 2012. In determining the dollar amount, such units are valued at $5.87 which was the grant date fair value. |
| (3) | Represents the amount of distributions that we made to each director on account of outstanding restricted common units under the LTIP that had not yet vested (i.e., for which the restrictions had not yet lapsed). |
Officers or employees of G&P or its affiliates who also serve as directors will not receive additional compensation for their service as a director of G&P. Our general partner intends for directors who are not officers or employees of G&P or its affiliates to receive compensation for serving on the board of directors and committees thereof. In 2008, the Board of Directors, by unanimous vote of all directors other than the independent directors who abstained from the vote, authorized revisions to the compensation of the independent directors pursuant to a recommendation received from management in connection with a study prepared by Towers Watson. As a result, the independent directors receive (a) $50,000 per year as an annual retainer fee; (b) $5,000 per year for each committee of the board of directors on which such director serves and an additional $10,000 per year for the Audit Committee chairman, $5,000 per year for the Compensation Committee chairman, and $2,500 per engagement (of the Conflicts Committee) for the Conflicts Committee chairman; (c) 5,000 restricted common units upon becoming a director, vesting in roughly one-third increments over a three-year period; (d) 3,500 restricted common units annually after becoming a director, vesting in roughly one-third increments over a three-year period; (e) reimbursement for out-of-pocket expenses associated with attending meetings of the board of directors or committees; (f) reimbursement for educational costs relevant to the director’s duties; and (g) director and officer liability insurance coverage. Each director is fully indemnified by us for his actions associated with being a director to the fullest extent permitted under Delaware law, including through supplemental indemnification agreements entered into by each director on December 30, 2009. See Part III, Item 10, Directors, Executive Officers and Corporate Governance - Indemnification of Directors and Executive Officers.
Additional Payment to Conflicts Committee Members
On November 13, 2009, our Board of Directors approved the payment to each member of the Conflicts Committee, in addition to the fees set forth above, a fee of $5,000 per month for each full or partial month of service commencing on or after August 1, 2009 during which the Conflicts Committee was authorized to evaluate or make any recommendation regarding any strategic alternative of the Partnership. The maximum amount of additional compensation to be paid is $45,000. As of the date of this Annual Report, each director has been paid $45,000.
Compensation Committee Interlocks and Insider Participation
William A. Smith, William J. Quinn and Philip B. Smith served on the Compensation Committee of the Board of Directors of G&P which is the general partner of our general partner for all of 2009. Mr. Smith served as the Chairman of the Committee during 2009. In addition to his service as a member of the Board of Directors and the Compensation Committee, Mr. Quinn also served as a managing partner of the NGP private equity funds during 2009. For additional disclosure on relationships of NGP to Eagle Rock, see Item 13, “Certain Relationships and Related Transactions, and Director Independence.” In addition, during 2009, none of our executive officers served as a director or as a member of the compensation committee of another company which employs any of our directors or members of our Compensation Committee.
Risks Related to our Compensation Policies and Practices
Certain of the executive officers of G&P are also executive officers and limited partners of Holdings, our general partner, through equity incentive grants made to these executive officers by the Holdings Board. Holdings, in turn, owns all of our subordinated units and incentive distribution rights (although certain economic value in these incentive distribution rights has been assigned to Montierra – for a description of the Montierra Acquisition, see Part III, Item 12) as well as the general partner units of the Partnership As officers of Holdings, the executive officers of G&P have certain duties and obligations to the equity holders (which includes the executive officers themselves) of Holdings as provided in the applicable organizational agreements, which may conflict with the duties and obligations that the executive officers of G&P have to the Partnership. In resolving these conflicts of interest, Holdings may take into account its own interests as well as the interests of its equity holders over the interests of the Partnership and its common unitholders. However, we believe that the contribution and subsequent cancellation of all our subordinated units and incentive distribution rights (and elimination of the concept of arrearages) will eliminate or significantly reduce the risks to the Partnership as a result of this conflict of interest since all equity interests in the Partnership will be common units.
| Item 12. | Security Ownership of Certain Beneficial Owners and Management and Related Unitholder Matters. |
The following table sets forth the beneficial ownership of our units as of March 1, 2010 held by:
• each person or group of persons who beneficially own 5% or more of the then outstanding common units;
• each member of the board of directors of Eagle Rock Energy G&P, LLC;
• each named executive officer of Eagle Rock Energy G&P, LLC; and
• all current directors and executive officers of Eagle Rock Energy G&P, LLC as a group.
Name of Beneficial Owner (1) (2) | | Common Units Beneficially Owned | | Percentage of Common Units Beneficially Owned | | Subordinated Units Beneficially Owned | | Percentage of Subordinated Units Beneficially Owned | | Percentage of Total Common and Subordinated Units Beneficially Owned |
Eagle Rock Holdings, L.P.(3) | | 2,338,419 | | 4.2% | | 20,691,495(8) | | 100.0% | | 30.0% |
NGP 2004 Co-Investment Income, L.P.(7) | | 3,500,136 | | 6.3% | | ---- | | ---% | | 4.6% |
Montierra Minerals & Production, L.P.(4) | | 2,868,556 | | 5.1% | | ---- | | ---% | | 3.7% |
Joseph A. Mills(3)(6) | | 362,480 | | *% | | ---- | | ---% | | *% |
Jeffrey P. Wood(6) | | 145,635 | | *% | | ---- | | ---% | | *% |
Alfredo Garcia(3)(6) | | 13,690 | | *% | | ---- | | ---% | | *% |
Charles C. Boettcher(3)(6) | | 170,615 | | *% | | ---- | | ---% | | *% |
Steven G. Hendrickson(3)(6) | | 143,118 | | *% | | ---- | | ---% | | *% |
Joseph E. Schimelpfening(3)(6) | | 149,631 | | *% | | ---- | | ---% | | *% |
William E. Puckett(3)(8) | | 83,857 | | *% | | ---- | | ---% | | *% |
Kenneth A. Hersh(5) | | 12,310,046 | | 22.0% | | 20,691,495(8) | | 100.0% | | 43.0% |
| William J. Quinn | | 10,000 | | *% | | ---- | | ---% | | *% |
Phillip B. Smith (6) | | 17,000 | | *% | | ---- | | ---% | | *% |
William A. Smith (6) | | 12,000 | | *% | | ---- | | ---% | | *% |
| John A. Weinzierl | | 8,800 | | *% | | ---- | | ---% | | *% |
William K. White (6) | | 22,200 | | *% | | ---- | | ---% | | *% |
| All directors and executive officers as a group (13 persons) | | 13,449,072 | | 24.0% | | 20,691,495(8) | | 100.0% | | 44.5% |
____________
* Less than 1%
| (1) | Unless otherwise indicated, the address for all beneficial owners in this table, except Barclays PLC and Steven B. Klinsky is 1415 Louisiana Street, Suite 2700, Houston, TX 77002. |
| (2) | All units are subject to the beneficial owner’s sole voting and dispositive power unless otherwise indicated in the footnotes below. |
| (3) | Natural Gas Partners VII, L.P., Natural Gas Partners VIII, L.P., Joseph A. Mills, Jeffrey P. Wood, Alfredo Garcia, Charles C. Boettcher, Steven G. Hendrickson, Joseph E. Schimelpfening and William E. Puckett based on equity ownership and profits interests in Eagle Rock Holdings, L.P. (“Holdings”), and Eagle Rock GP, L.L.C., its general partner which is owned 39.14% and 60.35% by Natural Gas Partners VII, L.P. and Natural Gas Partners VIII, L.P. and which owns a 1.0% general partner interest in Holdings, have the right to receive distributions (based on equity units and Tier I incentive interests which achieved payout target) in the following percentages, respectively: 32.2%, 49.7%, 0.3%, 0.6%, 3.3%, 0.2%, 0.1%, 0.1% and 0.8%. Our common units and subordinated units held by Holdings are not being reported in this table as beneficially owned by each of the limited partners and profits interests’ holders, except for Natural Gas Partners VII, L.P. and Natural Gas Partners VIII, L.P. (See footnote (7) below) |
| (4) | NGP VII, Joseph A. Mills, Steven G. Hendrickson and Joseph E. Schimelpfening, based on equity ownership and profits interests in Montierra Minerals & Production, L.P. (“Montierra”) and Montierra Management LLC, have the right to receive distributions (based on equity units only, as no tier of incentive interests has achieved payout target) in the following percentages, respectively: 97.1%, 2.4%, 0.1% and 0.2%. NGP VII appoints three managers on the board of Montierra Management LLC (“Montierra Management”), which serves as the general partner of Montierra. NGP VII also owns a 97.6% interest in Montierra Management, and thus may be deemed to beneficially own all of the reported securities of Montierra Management and Montierra. |
| (5) | G.F.W. Energy VII, L.P., GFW VII, L.L.C., G.F.W. Energy VIII, L.P. and GFW VIII, L.L.C. may be deemed to beneficially own the units held by Eagle Rock Holdings, L.P. (“Holdings”) that are attributable to Natural Gas Partners VII, L.P. (“NGP VII”) and Natural Gas Partners VIII, L.P. (“NGP VIII”) by virtue of GFW VII, L.L.C. being the sole general partner of G.F.W. Energy VII, L.P. and GFW VIII, L.L.C. being the sole general partner of G.F.W. Energy VIII, L.P. Kenneth A. Hersh, who is an Authorized Member of each of GFW VII, L.L.C. and GFW VIII, L.L.C., may also be deemed to share the power to vote, or to direct the vote, and to dispose, or to direct the disposition of, those units. NGP VII and NGP VIII collectively own a 98.1% LP interest in Holdings and NGP VII owns a 96.2% LP interest in Montierra, NGP VII and NGP VIII control the general partner of Holdings. NGP VII controls the general partner of Montierra. NGP VII owns 100% of NGP Income Management L.L.C. which serves as the general partner of both NGP-VII Income Co-Investment Opportunities, L.P. (“NGP-VII Income Co-Investment”) and NGP 2004 Co-Investment Income, L.P. (“NGP 2004”). NGP VII may be deemed to beneficially own all of the units of NGP 2004. Kenneth A. Hersh may be deemed to share dispositive power over the units held by NGP VII, thus, he may also be deemed to be the beneficial owner of these units. In addition to the amounts deemed beneficially owned, NPG VII also has direct beneficial ownership of 1,701,497 units, and NGP VIII also has direct beneficial ownership of 1,763,206 units. Mr. Hersh disclaims beneficial ownership of our units except to the extent of his pecuniary interest therein. |
| (6) | The information provided in this footnote is as of the date of filing and the referenced vesting is subject to the terms and conditions of our long term incentive plan and the particular award agreement(s) covering the grant(s) of such restricted units. |
Joseph A. Mills beneficially owns 362,480 units, 285,850 of which are unvested. Of the 285,850 unvested units, 122,950 units will vest within one year, 94,900 additional units will vest within two years and the remaining 68,000 units will vest within three years.
Jeffrey P. Wood beneficially owns 145,635 units, 133,500 of which are unvested. Of the 133,500 unvested units, 49,500 units will vest within one year, 50,000 additional units will vest within two years and the remaining 34,000 units will vest within three years.
Alfredo Garcia beneficially owns 13,690 units, 10,050 of which are unvested. Of the 10,050 unvested units, 4,950 units will vest within one year and the remaining 5,100 units will vest within two years.
Charles C. Boettcher beneficially owns 170,615 units, 133,750 of which are unvested. Of the 133,750 unvested units, 58,250 units will vest within one year, 41,500 additional units will vest within two years and the remaining 34,000 units will vest within three years.
Steven G. Hendrickson beneficially owns 143,118 units, 125,125 of which are unvested. Of the 125,125 unvested units, 49,625 units will vest within one year, 41,500 additional units will vest within two years and the remaining 34,000 units will vest within three years.
William E. Puckett beneficially owns 83,857 units, 63,500 of which are unvested. Of the 63,500 unvested units, 26,500 units will vest within one year, 23,400 additional units will vest within two years and the remaining 13,600 units will vest within three years.
Joseph E. Schimelpfening beneficially owns 149,631 units, 125,125 of which are unvested. Of the 125,125 unvested units, 49,625 units will vest within one year, 41,500 additional units will vest within two years and the remaining 34,000 units will vest within three years.
Philip B. Smith beneficially owns 17,000 units, 7,545 of which are unvested. Of the 7,545 unvested units, 4,010 will vest within one year, 2,345 will vest within two years and the remaining 1,190 units will vest within three years.
William A. Smith beneficially owns 12,000 units, 7,545 of which are unvested. Of the 7,545 unvested units, 4,010 will vest within one year, 2,345 will vest within two years and the remaining 1,190 units will vest within three years.
William K. White beneficially owns 22,200 units, 8,395 of which are unvested. Of the 8,395 unvested units, 4,860 will vest within one year, 2,345 will vest within two years and the remaining 1,190 units will vest within three years.
| (7) | See footnote (5) above for a description of NGP VII’s ownership and control of this beneficial owner. |
| (8) | Kenneth A. Hersh may be deemed to share dispositive power over the subordinated units, thus, he may also be deemed to be the beneficial owner of these units. Mr. Hersh disclaims beneficial ownership of these units except to the extent of his pecuniary interest therein. |
Equity Compensation Plan Information
The following table sets forth certain information with respect to our equity compensation plans as of December 31, 2009.
| | | | | | | | | | |
| | | Number of securities to be issued upon exercise of outstanding options, warrants and rights: (a) | | | Weighted-average exercise price of outstanding options, warrants and rights (b) | | | Number of securities remaining available for future issuance under equity compensation plans (excluding securities reflected in column (a)) (c) | |
| Equity compensation plans approved by security holders | | | N/A | | | | N/A | | | | N/A | |
| Equity compensation plans not approved by security holders | | | | | | | | | | | | |
| —2006 Long-Term Incentive Plan(1) | | | N/A | (1) | | | N/A | (1) | | | 119,978 | (1) |
| Total | | | N/A | | | | N/A | | | | 119,978 | |
| (1) | The long-term incentive plan, which did not require approval by our public limited partners and was adopted by our general partner in connection with our initial public offering in 2006 and amended by our general partner in 2008 and 2009, authorizes issuance of an aggregate of 2,000,000 common units in various forms of grants. For more information about our long-term incentive plan, or LTIP, refer to Part III, Item 11. Executive Compensation—Discussion and Analysis of Compensation—Long-Term Incentives. To date, all award grants under the long-term incentive plan have been in the form of restricted unit grants, which generally vest over a three-year period. As of March 1, 2010, we had outstanding 1,389,169 restricted common units granted under our LTIP. |
| Item 13. | Certain Relationships and Related Transactions, and Director Independence. |
Since January 1, 2006, we have been involved in several transactions involving Holdings or affiliates of Natural Gas Partners (“NGP”). Holdings, which is the sole member of Eagle Rock Energy G&P, LLC, which is the general partner of our general partner, is currently owned by NGP and certain members of our management team. Since April 30, 2007, the Partnership has been involved in several transactions with Montierra Minerals & Production, L.P. (“Montierra”), an affiliate of NGP. Joseph A. Mills, our Chief Executive Officer, is the chief executive officer and a manager of Montierra Management LLC, which is the general partner of Montierra. See Item 12, Security Ownership of Certain Beneficial Owners and Management and Related Unitholder Matters, for additional information regarding the Partnership’s relationship with NGP and the ownership of Holdings and Montierra.
The following members of the board of directors of Eagle Rock Energy G&P, LLC (G&P) hold positions at NGP set forth next to each person’s name: William J. Quinn, Executive Vice President of NGP Energy Capital Management and a managing partner of the NGP private equity funds, Kenneth A. Hersh, Chief Executive Officer of NGP Energy Capital Management and is a managing partner of the NGP private equity funds, and John A. Weinzierl, a managing director of the NGP private equity funds. The Partnership does not directly employ any persons to manage or operate our business. Those functions are provided by G&P. We reimburse G&P for all direct and indirect costs of these services.
On January 5, 2009, Jeffrey P. Wood was appointed to the position of senior vice president and chief financial officer of G&P, general partner of Eagle Rock Energy GP, L.P., which is our general partner. While serving as a principal with the private equity division of Lehman Brothers, Mr. Wood oversaw the investment of an aggregate of $94 million by certain Lehman Brothers’ private equity funds in our common units through private placements during 2007. The proceeds from these private placement transactions were used to fund the cash portion of the purchase prices of certain acquisitions by us closed in May and July of 2007. While Mr. Wood oversaw the investment process, Mr. Wood did not control the investment decisions for the Lehman Brothers private equity funds and does not have, and specifically disclaims, any beneficial ownership or pecuniary interest in the common units acquired by the Lehman Brothers private equity funds.
On July 1, 2006, we entered into a month-to-month contract for the sale of natural gas with an affiliate of NGP, Odyssey Energy Services, LLC, under which we sell a portion of our gas supply. In July 2008, the company to which we sell our natural gas was sold by the affiliate of NGP and thus ceased being a related party. The Partnership recorded revenues of $16.0 million, $35.3 million and $19.4 million for the years ended December 31, 2008, 2007 and 2006, respectively, from the agreement, of which there was a receivable of $5.5 million outstanding at December 31, 2007.
In the fourth quarter of 2006 and in connection with consummating our initial public offering, the Partnership entered into an Omnibus Agreement with G&P, Holdings and our general partner, Eagle Rock Energy GP, L.P., which requires us to reimburse G&P for the payment of certain expenses incurred by G&P or its employees, officers, or representatives on our behalf, including payroll, benefits, insurance and other operating expenses, and provides certain indemnification obligations.
In connection with the closing of our initial public offering, on October 24, 2006, we entered into a registration rights agreement with Eagle Rock Holdings, L.P. in connection with its contribution to us of all of its limited and general partner interests in Eagle Rock Pipeline. In the registration rights agreement, we agreed, for the benefit of Eagle Rock Holdings, L.P., to register the common units it holds, the common units issuable upon conversion of the subordinated units it holds, and any common units or other equity securities issuable in exchange for the common units and subordinated units it holds.
In connection with the closing of the acquisition of certain assets from Montierra and NGP-VII Income Co-Investment Opportunities, L.P. (“Co-Invest”), on April 30, 2007, we entered into registration rights agreements with Montierra and Co-Invest. In the registration rights agreements, we agreed, for the benefit of Montierra and Co-Invest, to register the common units they hold, the common units issuable upon conversion of the subordinated units that they hold and any common units or other equity securities issuable in exchange for the common units and subordinated units they hold. We have registered for resale the common units related to this transaction.
On April 30, 2008, we completed the acquisition of all of the outstanding capital stock of Stanolind Oil and Gas Corp., (“Stanolind”) for an aggregate purchase cash price of $81.9 million (the “Stanolind Acquisition”), from one or more NGP private equity funds, which directly or indirectly owned a majority of the equity interests in Stanolind. Because of the potential conflict of interest between the interests of the Partnership and the public unitholders of Eagle Rock, the Board of Directors authorized the Partnership’s Conflicts Committee to review, evaluate, and, if determined appropriate, approve the Stanolind Acquisition. The Conflicts Committee, consisting of independent Directors of the Partnership, determined that the Stanolind Acquisition was fair and reasonable to Eagle Rock and its public unitholders and recommended to the Board of Directors of the Partnership that the transaction be approved and authorized. In determining the purchase consideration for the Stanolind Acquisition, the Board of Directors considered the valuation of the properties involved in the transaction, the valuation of the units to be offered as consideration in the transaction, and the cash flow of Stanolind. The members of the Conflicts Committee –Messrs. Philip Smith, William Smith and William White – have been determined to be independent under the rules of the SEC and NASDAQ applicable to audit committees.
The conflicts resolution process described immediately above is the process we generally use to approve related-party transactions.
During the year ended December 31, 2009, we purchased and sold natural gas from certain companies affiliated with one or more NGP private equity funds, which include Crow Creek Energy II, LLC, Momentum Energy Holdings, L.P. and Blue Stone Natural Resources Holdings, LLC. During the year ended December 31, 2009, we purchased natural gas from one or more of these affiliated companies, totaling approximately $8.8 million, and sold natural gas to one or more of these affiliated companies, totaling approximately $16.0 million. During the year ended December 31, 2009, we rented office space from Montierra and we were also reimbursed by Montierra for work performed by our employees on their behalf. We paid Montierra $0.1 million in rental payments and were reimbursed $0.2 million by Montierra.
During the year ended December 31, 2009, we incurred approximately $2.2 million for services performed by Stanolind Field Services (“SFS”), which is controlled by NGP.
On December 21, 2009, we announced that we, through certain of our affiliates, had entered into definitive agreements with affiliates of NGP and Black Stone to improve our liquidity and simplify our capital structure. The definitive agreements include: (i) a Securities Purchase and Global Transaction Agreement, entered into between Eagle Rock and NGP, including Eagle Rock’s general partner entities controlled by NGP, and (ii) a Purchase and Sale Agreement, entered into between Eagle Rock and Black Stone for the sale of Eagle Rock’s Minerals Business. The Securities Purchase and Global Transaction Agreement was amended on January 12, 2010 to allow for greater flexibility in the payment of the contemplated transaction fee to Holdings, which is controlled by NGP. See Part I, Item 1, “Recapitalization and Related Transactions”.
Additional information is provided in Note 9, Related Party Transactions, of our consolidated financial statements included in Part II, Item 8. Financial Statements and Supplementary Data starting on page F-1 of this Annual Report.
| Item 14. | Principal Accountant Fees and Services. |
The following sets forth fees billed by Deloitte & Touche LLP for the audit of our annual financial statements and other services rendered for the fiscal years ended December 31, 2009 and 2008:
| | | | | | | |
| | | | | | | |
| | | December 31, 2009 | | | December 31, 2008 | |
Audit fees(1) | | $ | 1,989,468 | | | $ | 2,209,550 | |
Audit related fees(2) | | | — | | | | — | |
Tax fees(3) | | | 1,084,876 | | | | 798,254 | |
All other fees(4) | | | 11,651 | | | | 567,540 | |
Total | | $ | 3,085,995 | | | $ | 3,575,344 | |
| | | | | | | | | |
| (1) | Includes fees for audits of annual financial statements of our companies, reviews of the related quarterly financial statements, and services that are normally provided by the independent accountants in connection with statutory and regulatory filings or engagements, including reviews of interim financial statements, audits of businesses acquired and other customary documents filed with the Securities and Exchange Commission. |
| (2) | Includes fees related to consultations concerning financial accounting and reporting standards and services related to the implementation of our internal controls over financial reporting. |
| (3) | Includes fees related to professional services for tax compliance, tax advice, and tax planning. |
| (4) | Includes fees for due diligence work performed on our Stanolind and Millennium Acquisitions in 2008. |
Pursuant to the charter of the Audit Committee, the Audit Committee is responsible for the oversight of our accounting, reporting and financial practices. The Audit Committee has the responsibility to select, appoint, engage, oversee, retain, evaluate and terminate our external auditors; pre-approve all audit and non-audit services to be provided, consistent with all applicable laws, to us by our external auditors; and to establish the fees and other compensation to be paid to our external auditors. The Audit Committee also oversees and directs our internal auditing program and reviews our internal controls.
The Audit Committee has started a process for the pre-approval of audit and permitted non-audit services provided by our principal independent accountants. The policy requires that all services provided by Deloitte & Touche LLP, including audit services, audit-related services, tax services and other services, must be pre-approved by the Committee.
The Audit Committee reviews the external auditors’ proposed scope and approach as well as the performance of the external auditors. It also has direct responsibility for and sole authority to resolve any disagreements between our management and our external auditors regarding financial reporting, regularly reviews with the external auditors any problems or difficulties the auditors encountered in the course of their audit work, and, at least annually, uses its reasonable efforts to obtain and review a report from the external auditors addressing the following (among other items):
| | • | the auditors’ internal quality-control procedures; |
| | • | any material issues raised by the most recent internal quality-control review, or peer review, of the external auditors; |
| | • | the independence of the external auditors; |
| | • | the aggregate fees billed by our external auditors for each of the previous two fiscal years; and |
| | • | the rotation of the lead partner. |
PART IV
| Item 15. | Exhibits and Financial Statement Schedules. |
(a)(1) Financial Statements:
The following financial statements and the Report of Independent Registered Public Accounting Firm are filed as a part of this report on the pages indicated:
| | |
| Report of Independent Registered Public Accounting Firm | F-2 |
| Consolidated Balance Sheets | F-3 |
| Consolidated Statements of Operations | F-4 |
Consolidated Statements of Cash Flows | F-6 |
| Consolidated Statements of Members’ Equity | F-7 |
| Notes to Consolidated Financial Statements | F-8 |
| | |
(a)(2) Financial Statement Schedules:
All other schedules have been omitted since the required information is not significant or is included in the Consolidated Financial Statements or Notes thereto or is not applicable.
(a)(3) Exhibits:
The following documents are included as exhibits to this report:
| | |
Exhibit Number | Description |
| | |
| 2.1 | Partnership Interests Purchase and Contribution Agreement By and Among Laser Midstream Energy II, LP, Laser Gas Company I, LLC, Laser Midstream Company, LLC, Laser Midstream Energy, LP, and Eagle Rock Energy Partners, L.P., dated as of March 30, 2007 (incorporated by reference to Exhibit 2.1 of the registrant’s registration statement on Form S-1 (File No. 333-144938)) |
| | |
| 2.2 | Partnership Interests Contribution Agreement By and Among Montierra Minerals & Production, L.P., NGP Minerals, L.L.C. (Montierra Management LLC) and Eagle Rock Energy Partners, L.P., dated as of March 31, 2007 (incorporated by reference to Exhibit 2.2 of the registrant’s registration statement on Form S-1 (File No. 333-144938)) |
| | |
| 2.3 | Asset Contribution Agreement By and Among NGP 2004 Co-Investment Income, L.P., NGP Co-Investment Income Capital Corp., NGP-VII Income Co-Investment Opportunity, L.P., and Eagle Rock Energy Partners, L.P., dated as of March 31, 2007 (incorporated by reference to Exhibit 2.3 of the registrant’s registration statement on Form S-1 (File No. 333-144938)) |
| | |
| 2.4 | Contribution and Sale Agreement By and Among Eagle Rock Energy Partners, L.P., Redman Energy Holdings, L.P. and Certain Other Parties Named Therein, dated July 11, 2007 (incorporated by reference to Exhibit 2.4 of the registrant’s registration statement on Form S-1 (File No. 333-144938)) |
| | |
| 2.5 | Contribution and Sale Agreement By and Among Eagle Rock Energy Partners, L.P., Redman Energy Holdings II, L.P. and Certain Other Parties Named Therein, dated July 11, 2007 (incorporated by reference to Exhibit 2.5 of the registrant’s registration statement on Form S-1 (File No. 333-144938)) |
| | |
| 2.6 | Asset Contribution Agreement By and Among NGP Co-Investment Opportunities Fund II, L.P. and Eagle Rock Energy Partners, L.P., dated July 11, 2007 (incorporated by reference to Exhibit 2.6 of the registrant’s registration statement on Form S-1 (File No. 333-144938)) |
| | |
| 2.7 | Stock Purchase Agreement dated April 2, 2008 among Eagle Rock Energy Partners, L.P., Stanolind Holdings, L.P. and Stanolind Oil and Gas Corp. (incorporated by reference to Exhibit 2.8 of the registrant’s current report on Form 8-K filed with the Commission on April 4, 2008 (File No. 001-33016)) |
| | |
| 2.8 | Partnership Interests Purchase Agreement dated September 11, 2008, as amended, among Eagle Rock Energy Partners, L.P. and Millennium Midstream Partners, L.P. (incorporated by reference to Exhibit 2.1 of the registrant’s quarterly period for the period ended September 20, 2008 filed with the Commission on November 10, 2008 (File No. 001-33016)) |
| | |
| 2.9 | Amendment No. 2 to the Partnership Interests Purchase Agreement dated February 9, 2009 among Eagle Rock Energy Partners, L.P. and Millennium Midstream Partners, L.P. (incorporated by reference to Exhibit 2.9 of the registrant’s annual report on Form 10-K filed with the Commission on March 13, 2009) |
| | |
| 2.10 | Amendment No. 3 to the Partnership Interests Purchase Agreement dated February 27, 2009 among Eagle Rock Energy Partners, L.P. and Millennium Midstream Partners, L.P. (incorporated by reference to Exhibit 2.10 of the registrant’s annual report on Form 10-K filed with the Commission on March 13, 2009) |
| | |
2.11 | Purchase and Sale Agreement dated December 21, 2009 among Eagle Rock Pipeline GP,LLC, EROC Production, LLC and BSAP II GP, L.L.C. (incorporated by reference to Exhibit 2.1 of the registrant’s current report on Form 8-K filed with the Commission on December 21, 2009) |
| 3.1 | Certificate of Limited Partnership of Eagle Rock Energy Partners, L.P. (incorporated by reference to Exhibit 3.1 of the registrant’s registration statement on Form S-1 (File No. 333-134750)) |
| | |
| 3.2 | First Amended and Restated Agreement of Limited Partnership of Eagle Rock Energy Partners, L.P. (incorporated by reference to Exhibit 3.1 of the registrant’s current report on Form 8-K filed with the Commission on October 31, 2006) |
| | |
| 3.3 | Certificate of Limited Partnership of Eagle Rock Energy GP, L.P. (incorporated by reference to Exhibit 3.3 of the registrant’s registration statement on Form S-1 (File No. 333-134750)) |
| | |
| 3.4 | Limited Partnership Agreement of Eagle Rock Energy GP, L.P. (incorporated by reference to Exhibit 3.4 of the registrant’s registration statement on Form S-1 (File No. 333-134750)) |
| | |
| 3.5 | Certificate of Formation of Eagle Rock Energy G&P, LLC (incorporated by reference to Exhibit 3.5 of the registrant’s registration statement on Form S-1 (File No. 333-134750)) |
| | |
| 3.6 | Second Amended and Restated Limited Liability Company Agreement of Eagle Rock Energy G&P, LLC (incorporated by reference to Exhibit 3.2 of the registrant’s current report on Form 8-K filed with the Commission on October 31, 2006) |
| | |
| 4.1 | Registration Rights Agreement dated March 27, 2006, among Eagle Rock Pipeline, L.P. and the Purchasers listed thereto (incorporated by reference to Exhibit 4.1 of the registrant’s registration statement on Form S-1 (File No. 333-134750)) |
| | |
| 4.3 | Registration Rights Agreement between Eagle Rock Energy Partners, L.P. and Eagle Rock Holdings, L.P. (incorporated by reference to Exhibit 4.1 of the registrant’s current report on Form 8-K filed with the Commission on October 31, 2006) |
| | |
| 4.4 | Form of Common Unit Certificate (included as Exhibit A to the Amended and Restated Partnership Agreement of Eagle Rock Energy Partners, L.P., which is included as Appendix A to the Prospectus) (incorporated by reference to Exhibit 3.2 of the registrant’s registration statement on Form S-1 (File No. 333-134750)) |
| | |
| 4.5 | Registration Rights Agreement dated May 2, 2007, among Eagle Rock Energy Partners, L.P. and the purchasers listed thereto (incorporated by reference to Exhibit 4.5 of the registrant’s registration statement on Form S-1 (File No. 333-144938)) |
| | |
| 4.6 | Registration Rights Agreement dated July 31, 2007, among Eagle Rock Energy Partners, L.P. and the purchasers listed thereto (incorporated by reference to Exhibit 4.6 of the registrant’s registration statement on Form S-1 (File No. 333-144938)) |
| | |
| 4.7 | Registration Rights Agreement dated April 30, 2007, between Eagle Rock Energy Partners, L.P. and NGP-VII Income Co-Investment Opportunities, L.P. (incorporated by reference to Exhibit 4.7 of the registrant’s registration statement on Form S-1 (File No. 333-144938)) |
| | |
| 4.8 | Registration Rights Agreement dated April 30, 2007, between Eagle Rock Energy Partners, L.P. and Montierra Minerals & Production, L.P. (incorporated by reference to Exhibit 4.8 of the registrant’s registration statement on Form S-1 (File No. 333-144938)) |
| | |
| 10.1 | Amended and Restated Credit and Guaranty Agreement (incorporated by reference to Exhibit 3.1 of the registrant’s registration statement on Form S-1 (File No. 333-134750)) |
| | |
| 10.2 | Omnibus Agreement (incorporated by reference to Exhibit 10.1 of the registrant’s current report on Form 8-K filed with the Commission on October 31, 2006) |
| | |
| 10.3** | Eagle Rock Energy Partners, L.P. Long-Term Incentive Plan (incorporated by reference to Exhibit 10.3 of the registrant’s registration statement on Form S-1 (File No. 333-134750)) |
| | |
| | |
Exhibit Number | Description |
| 10.4 | Sale, Contribution and Exchange Agreement by and among the general and limited partners of Midstream Gas Services, L.P., Eagle Rock Energy Services, L.P. and Eagle Rock Pipeline, L.P. (incorporated by reference to Exhibit 10.4 of the registrant’s registration statement on Form S-1 (File No. 333-134750)) |
| | |
| 10.5† | Natural Gas Liquids Exchange Agreement by and between ONEOK Hydrocarbon, L.P. and ONEOK Texas Field Services, L.P. (incorporated by reference to Exhibit 10.5 of the registrant’s registration statement on Form S-1 (File No. 333-134750)) |
| | |
| 10.6 | Gas Sales and Purchase Agreement between MC Panhandle, Inc. (Chesapeake Energy Marketing Inc.) and MidCon Gas Services Corp. (Eagle Rock Field Services, L.P.) (incorporated by reference to Exhibit 10.6 of the registrant’s registration statement on Form S-1 (File No. 333-134750)) |
| | |
| 10.7 | Brookeland Gas Facilities Gas Gathering and Processing Agreement between Union Pacific Resources Company (Anadarko E&P Company LP) and Sonat Exploration Company (Eagle Rock Field Services, L.P.) (incorporated by reference to Exhibit 10.7 of the registrant’s registration statement on Form S-1 (File No. 333-134750)) |
| | |
| 10.8† | Minimum Volume Agreement between ONEOK Texas Field Services L.P. and Peak Operating of Texas, LLC (incorporated by reference to Exhibit 10.8 of the registrant’s registration statement on Form S-1 (File No. 333-134750)) |
| | |
| 10.9† | Gas Purchase Agreement between ONEOK Texas Field Services L.P. and Peak Operating of Texas, LLC (incorporated by reference to Exhibit 10.9 of the registrant’s registration statement on Form S-1 (File No. 333-134750)) |
| | |
| 10.10 | Gas Purchase Contract between Warren Petroleum Company (Eagle Rock Field Services, L.P.) and Wallace Oil & Gas, Inc. (Cimarex Energy Co.) (incorporated by reference to Exhibit 10.10 of the registrant’s registration statement on Form S-1 (File No. 333-134750)) |
| | |
| 10.11 | Contribution, Conveyance and Assumption Agreement (incorporated by reference to Exhibit 10.3 of the registrant’s current report on Form 8-K filed with the Commission on October 31, 2006) |
| | |
| 10.13 | Base Contract for Sale and Purchase of Natural Gas between Eagle Rock Field Services, L.P. and Odyssey Energy Services, LLC (incorporated by reference to Exhibit 10.13 of the registrant’s registration statement on Form S-1 (File No. 333-134750)) |
| | |
| 10.14 | Common Unit Purchase Agreement By and Among Eagle Rock Energy Partners, L.P. and The Purchasers Named Therein, dated March 30, 2007 (incorporated by reference to Exhibit 10.14 of the registrant’s registration statement on Form S-1 (File No. 333-144938)) |
| | |
| 10.15 | Common Unit Purchase Agreement By and Among Eagle Rock Energy Partners, L.P. and The Purchasers Named Therein, dated July 11, 2007 (incorporated by reference to Exhibit 10.15 of the registrant’s registration statement on Form S-1 (File No. 333-144938)) |
| | |
| 10.17** | Form of Award Agreement pursuant to the Eagle Rock Energy Partners, L.P. Long-Term Incentive Plan (incorporated by reference to Exhibit 10.14 of the Form 8-K filed with the Commission on May 22, 2007) |
| | |
| 10.18 | Credit Agreement dated December 13, 2007 among Eagle Rock Energy Partners, L.P. and Wachovia Bank, National Association, as administrative agent and swingline lender, Bank of America, N.A., as syndication agent, HSH Nordbank AG, New York Branch, the Royal Bank of Scotland, plc, and BNP Paribas, as co-documentation agents, and the other lenders who are parties thereto (incorporated by reference to Exhibit 10.17 of the Form 8-K filed with the Commission on December 13, 2007) |
Exhibit Number | Description |
| | |
| 10.19**† | Eagle Rock Energy G&P, LLC 2009 Short Term Incentive Bonus Plan effective February 4, 2009 (incorporated by reference to Exhibit 10.1 of the registrant’s current report on Form 8-K filed with the Commission on February 9, 2009) |
| | |
| 10.20 | Eagle Rock Energy Partners Long-Term Incentive Plan (Amended and Restated Effective February 4, 2009) (incorporated by reference to Exhibit 10.20 of the Registrant’s Annual Report on Form 10-K filed with the Commission on March 13, 2009) |
| | |
| 10.21** | Form of Supplemental Indemnification Agreement among Eagle Rock Energy G&P, LLC, Eagle Rock Energy GP, L.P., Eagle Rock Energy Partners, L.P. and officers and directors of Eagle Rock Energy G&P, LLC (incorporated by reference to Exhibit 10.1 of the registrant’s current report on Form 8-K filed with the Commission on December 30, 2009) |
| | |
| 10.22** | Form of Eagle Rock Energy Partners Long-Term Incentive Plan Restricted Unit Agreement for Officers (incorporated by reference to Exhibit 10.2 of the registrant’s current report on Form 8-K filed with the Commission on December 30, 2009) |
| | |
| 10.23**† | Eagle Rock Energy G&P, LLC 2010 Short Term Incentive Bonus Plan approved and adopted on December 30, 2009 (incorporated by reference to Exhibit 10.3 of the registrant’s current report on Form 8-K filed with the Commission on December 30, 2009) |
| 10.24** | Form of Eagle Rock Energy Partners Long-Term Incentive Plan Restricted Unit Agreement for Non-Employee Directors (incorporated by reference to Exhibit 10.4 of the registrant’s current report on Form 8-K filed with the Commission on December 30, 2009) |
| | |
| 10.25 | Amended and Restated Securities Purchase and Global Transaction Agreement dated January 12, 2010 among Natural Gas Partners VII, L.P., Natural Gas Partners VIII, L.P., Montierra Minerals & Production, L.P., Montierra Management LLC, Eagle Rock Holdings, L.P., Eagle Rock Energy G&P, LLC, Eagle Rock Energy GP, L.P. and Eagle Rock Energy Partners, L.P. (incorporated by reference to Exhibit 10.1 of the registrant’s current report on Form 8-K filed with the Commission on January 12, 2010) |
| | |
| 10.26 | Credit Facility Amendment, dated as of March 8, 2010, by and among Eagle Rock Energy Partners, L.P., as borrower, Wachovia Back, N/A., Bank of America, N.A., HSH Nordbank AG, New York Branch, The Royal Bank of Scotland, PLC, BNP Paribas and the other lenders party threeto, and the Guarantors thereto (incorporated by reference to Exhibit 10.1 of the Registrant's Current Report on Form 8-K file with the Commisision on March 9, 2010) |
| | |
| 14.1 | Code of Ethics for Chief Executive Officer and Senior Financial Officers posted on the Company’s website at www.eaglerockenergy.com. |
| | |
| 21.1* | List of Subsidiaries of Eagle Rock Energy Partners, L.P. |
| | |
| 23.1* | Consent of Deloitte & Touche LLP |
| | |
| 23.2* | Consent of Cawley, Gillespie & Associates, Inc. |
| | |
| 23.3* | Consent of K.E. Andrews & Company |
| | |
| 31.1* | Certification of Periodic Financial Reports by Joseph A. Mills in satisfaction of Section 302 of the Sarbanes-Oxley Act of 2002 |
| | |
| 31.2* | Certification of Periodic Financial Reports by Jeffrey P. Wood in satisfaction of Section 302 of the Sarbanes-Oxley Act of 2002 |
| | |
| 32.1* | Certification of Periodic Financial Reports by Joseph A. Mills in satisfaction of Section 906 of the Sarbanes-Oxley Act of 2002 |
| | |
| 32.2* | Certification of Periodic Financial Reports by Jeffrey P. Wood in satisfaction of Section 906 of the Sarbanes-Oxley Act of 2002 |
| | |
| 99.1* | Report of Cawley, Gillespie & Associates, Inc. |
| ** | Management contract or compensatory plan or arrangement required to be filed as an exhibit hereto. |
| † | Portions of this exhibit have been omitted pursuant to a request for confidential treatment. |
SIGNATURES
Pursuant to the requirements of Section 13 or 15(d) of the Securities Exchange Act of 1934, the registrant has duly caused this report to be signed on its behalf by the undersigned, thereunto duly authorized, on March 9, 2010.
| | | |
| | EAGLE ROCK ENERGY PARTNERS, L.P. |
| | | |
| | By: | Eagle Rock Energy GP, L.P., its general partner |
| | | |
| | By: | Eagle Rock Energy G&P, LLC, its general partner |
| | | |
| | By: | /s/ JOSEPH A. MILLS |
| | Name: | Joseph A. Mills |
| | Title: | Chief Executive Officer |
Pursuant to the requirements of the Securities Exchange Act of 1934, this report has been signed below by the following persons on behalf of the registrant and in the capacity and on the dates indicated:
| | | |
Signature | Title | Date |
| | | |
Joseph A. Mills | Chief Executive Officer (Principal Executive Officer) | March 9, 2010 |
| | | |
Jeffrey P. Wood | Senior Vice President and Chief Financial Officer (Principal Financial and Accounting Officer) | March 9, 2010 |
| | | |
/s/ KENNETH A. HERSH Kenneth A. Hersh | Director | March 9, 2010 |
| | | |
William J. Quinn | Director | March 9, 2010 |
| | | |
Philip B. Smith | Director | March 9, 2010 |
| | | |
William A. Smith | Director | March 9, 2010 |
| | | |
John A. Weinzierl | Director | March 9, 2010 |
| | | |
William K. White | Director | March 9, 2010 |
INDEX TO FINANCIAL STATEMENTS
| | |
| Eagle Rock Energy Partners, L.P. Consolidated Financial Statements: | |
| Report of Independent Registered Public Accounting Firm | F-2 |
Consolidated Balance Sheets as of December 31, 2009 and 2008 | F-3 |
| Consolidated Statements of Operations for the Years Ended December 31, 2009, 2008 and 2007 | F-4 |
| Consolidated Statements of Cash Flows for the Years Ended December 31, 2009, 2008 and 2007 | F-6 |
Consolidated Statements of Members’ Equity for the Years Ended December 31, 2009, 2008 and 2007 | F-7 |
| Notes to Consolidated Financial Statements | F-8 |
| | |
REPORT OF INDEPENDENT REGISTERED PUBLIC ACCOUNTING FIRM
To the Board of Directors of Eagle Rock Energy G&P, LLC and Unitholders of Eagle Rock Energy Partners, L.P.
Houston, Texas
We have audited the consolidated balance sheets of Eagle Rock Energy Partners, L.P. and subsidiaries (the “Partnership”) as of December 31, 2009 and 2008, and the related consolidated statements of operations, members’ equity, and cash flows for each of the three years in the period ended December 31, 2009. These financial statements are the responsibility of the Partnership’s management. Our responsibility is to express an opinion on the financial statements based on our audits.
We conducted our audits in accordance with standards of the Public Company Accounting Oversight Board (United States). Those standards require that we plan and perform the audit to obtain reasonable assurance about whether the financial statements are free of material misstatement. An audit includes examining, on a test basis, evidence supporting the amounts and disclosures in the financial statements. An audit also includes assessing the accounting principles used and significant estimates made by management, as well as evaluating the overall financial statement presentation. We believe that our audits provide a reasonable basis for our opinion.
In our opinion, such consolidated financial statements present fairly, in all material respects, the financial position of the Partnership as of December 31, 2009 and 2008, and the results of its operations and its cash flows for each of the three years in the period ended December 31, 2009, in conformity with accounting principles generally accepted in the United States of America.
As discussed in Note 3 to the consolidated financial statements, on December 31, 2009, the Partnership changed its method of accounting for oil and gas reserves.
We have also audited, in accordance with the standards of the Public Company Accounting Oversight Board (United States), the Partnership’s internal control over financial reporting as of December 31, 2009, based on the criteria established in Internal Control—Integrated Framework issued by the Committee of Sponsoring Organizations of the Treadway Commission and our report dated March 9, 2010 expressed an unqualified opinion on the Partnership’s internal control over financial reporting.
/s/ DELOITTE & TOUCHE LLP
Houston, Texas
March 9, 2010
EAGLE ROCK ENERGY PARTNERS, L.P.
CONSOLIDATED BALANCE SHEETS
AS OF DECEMBER 31, 2009 AND 2008
($ in thousands)
| | | December 31, 2009 | | | December 31, 2008 | |
| ASSETS | | | | | | |
| CURRENT ASSETS: | | | | | | |
Cash and cash equivalents | | $ | 2,732 | | | $ | 17,916 | |
Accounts receivable(1) | | | 91,164 | | | | 115,932 | |
Risk management assets | | | 2,479 | | | | 76,769 | |
Prepayments and other current assets | | | 2,790 | | | | 2,607 | |
Total current assets | | | 99,165 | | | | 213,224 | |
PROPERTY, PLANT AND EQUIPMENT — Net | | | 1,275,881 | | | | 1,357,609 | |
INTANGIBLE ASSETS — Net | | | 132,343 | | | | 154,206 | |
DEFERRED TAX ASSET | | | 1,562 | | | | — | |
RISK MANAGEMENT ASSETS | | | 3,410 | | | | 32,451 | |
OTHER ASSETS | | | 21,967 | | | | 15,571 | |
| | | | | | | | | |
TOTAL | | $ | 1,534,328 | | | $ | 1,773,061 | |
| | | | | | | | | |
| LIABILITIES AND MEMBERS’ EQUITY | | | | | | | | |
| CURRENT LIABILITIES: | | | | | | | | |
Accounts payable | | $ | 78,096 | | | $ | 116,578 | |
Due to affiliate | | | 12,910 | | | | 4,473 | |
Accrued liabilities | | | 11,110 | | | | 19,565 | |
Taxes payable | | | 2,416 | | | | 1,559 | |
Risk management liabilities | | | 51,650 | | | | 13,763 | |
Total current liabilities | | | 156,182 | | | | 155,938 | |
LONG-TERM DEBT | | | 754,383 | | | | 799,383 | |
ASSET RETIREMENT OBLIGATIONS | | | 19,829 | | | | 19,872 | |
DEFERRED TAX LIABILITY | | | 40,246 | | | | 42,349 | |
RISK MANAGEMENT LIABILITIES | | | 32,715 | | | | 26,182 | |
OTHER LONG TERM LIABILITIES | | | 575 | | | | 1,622 | |
| COMMITMENTS AND CONTINGENCIES (Note 12) | | | | | | | | |
| MEMBERS’ EQUITY: | | | | | | | | |
Common Unitholders(2) | | | 484,282 | | | | 625,590 | |
Subordinated Unitholders(3) | | | 52,058 | | | | 105,839 | |
General Partner(4) | | | (5,942 | ) | | | (3,714 | ) |
Total members’ equity | | | 530,398 | | | | 727,715 | |
TOTAL | | $ | 1,534,328 | | | $ | 1,773,061 | |
| (1) | Net of allowance for bad debt of $4,818 and $12,080 as of December 31, 2009 and 2008, respectively. |
| (2) | 54,203,471 and 53,043,767 units were issued and outstanding as of December 31, 2009 and 2008, respectively. These amounts do not include unvested restricted common units granted under the Partnership’s long-term incentive plan of 1,371,019 and 905,486 as of December 31, 2009 and 2008, respectively. |
| (3) | 20,691,495 units were issued and outstanding as of December 31, 2009 and 2008. |
| (4) | 844,551 units were issued and outstanding as of December 31, 2009 and 2008. |
See notes to consolidated financial statements.
EAGLE ROCK ENERGY PARTNERS, L.P.
CONSOLIDATED STATEMENTS OF OPERATIONS
FOR THE YEARS ENDED DECEMBER 31, 2009, 2008 AND 2007
($ in thousands)
| | | Years Ended December 31, | |
| | | 2009 | | | 2008 | | | 2007 | |
| REVENUE: | | | | | | | | | |
| Natural gas, natural gas liquids, oil, condensate and sulfur sales | | $ | 653,712 | | | $ | 1,233,919 | | | $ | 733,326 | |
Gathering, compression, processing and treating fees | | | 45,476 | | | | 38,871 | | | | 27,417 | |
Minerals and royalty income | | | 15,708 | | | | 42,994 | | | | 15,004 | |
Commodity risk management gains (losses) | | | (106,290 | ) | | | 161,765 | | | | (133,834 | ) |
Other revenue | | | 1,858 | | | | 716 | | | | 110 | |
Total revenue | | | 610,464 | | | | 1,478,265 | | | | 642,023 | |
| COSTS AND EXPENSES: | | | | | | | | | | | | |
Cost of natural gas and natural gas liquids | | | 488,230 | | | | 891,433 | | | | 553,248 | |
Operations and maintenance | | | 73,196 | | | | 73,620 | | | | 52,793 | |
Taxes other than income | | | 12,047 | | | | 19,936 | | | | 8,340 | |
Other operating (income) expense | | | (3,552 | ) | | | 10,699 | | | | 2,847 | |
General and administrative | | | 46,188 | | | | 45,701 | | | | 27,799 | |
Impairment of property and plants | | | 22,062 | | | | 143,857 | | | | 5,749 | |
Goodwill impairment | | | — | | | | 30,994 | | | | — | |
Depreciation, depletion and amortization | | | 116,262 | | | | 116,754 | | | | 80,559 | |
Total costs and expenses | | | 754,433 | | | | 1,332,994 | | | | 731,335 | |
OPERATING (LOSS) INCOME | | | (143,969 | ) | | | 145,271 | | | | (89,312 | ) |
| OTHER INCOME (EXPENSE): | | | | | | | | | | | | |
Interest income | | | 188 | | | | 793 | | | | 1,160 | |
Other income | | | 2,328 | | | | 5,328 | | | | 696 | |
Interest expense | | | (21,591 | ) | | | (32,884 | ) | | | (38,936 | ) |
Interest rate risk management losses | | | (6,347 | ) | | | (32,931 | ) | | | (11,988 | ) |
Other expense | | | (1,070 | ) | | | (955 | ) | | | (8,226 | ) |
Total other (expense) income | | | (26,492 | ) | | | (60,649 | ) | | | (57,294 | ) |
| (LOSS) INCOME FROM CONTINUING OPERATIONS BEFORE INCOME TAXES | | | (170,461 | ) | | | 84,622 | | | | (146,606 | ) |
INCOME TAX PROVISION (BENEFIT) | | | 1,087 | | | | (1,134 | ) | | | 158 | |
(LOSS) INCOME FROM CONTINUING OPERATIONS | | | (171,548 | ) | | | 85,756 | | | | (146,764 | ) |
DISCONTINUED OPERATIONS | | | 290 | | | | 1,764 | | | | 1,130 | |
NET (LOSS) INCOME | | $ | (171,258 | ) | | $ | 87,520 | | | $ | (145,634 | ) |
See notes to consolidated financial statements.
EAGLE ROCK ENERGY PARTNERS, L.P.
CONSOLIDATED STATEMENTS OF OPERATIONS (continued)
FOR THE YEARS ENDED DECEMBER 31, 2009, 2008 AND 2007
(in thousands, except per unit amounts)
| | | Years Ended December 31, | |
| | | 2009 | | | 2008 | | | 2007 | |
| NET (LOSS) INCOME PER COMMON UNIT—BASIC AND DILUTED: | | | | | | | | | |
| Basic: | | | | | | | | | | | | |
| (Loss) Income from Continuing Operations | | | | | | | | | | | | |
Common units | | $ | (2.26 | ) | | $ | 1.16 | | | $ | (2.15 | ) |
Subordinated units | | $ | (2.36 | ) | | $ | 1.16 | | | $ | (3.15 | ) |
General partner units | | $ | (2.26 | ) | | $ | 1.16 | | | $ | (3.15 | ) |
| Discontinued Operations | | | | | | | | | | | | |
Common units | | $ | — | | | $ | 0.02 | | | $ | 0.02 | |
Subordinated units | | $ | — | | | $ | 0.02 | | | $ | 0.02 | |
General partner units | | $ | — | | | $ | 0.02 | | | $ | 0.02 | |
| Net (Loss) Income | | | | | | | | | | | | |
Common units | | $ | (2.26 | ) | | $ | 1.18 | | | $ | (2.13 | ) |
Subordinated units | | $ | (2.36 | ) | | $ | 1.18 | | | $ | (3.13 | ) |
General partner units | | $ | (2.26 | ) | | $ | 1.18 | | | $ | (3.13 | ) |
Weighted Average Units Outstanding (in thousands) | | | | | | | | | | | | |
Common units | | | 53,496 | | | | 51,534 | | | | 37,008 | |
Subordinated units | | | 20,691 | | | | 20,691 | | | | 20,691 | |
General partner units | | | 845 | | | | 845 | | | | 845 | |
| | | | | | | | | | | | | |
| Diluted: | | | | | | | | | | | | |
| (Loss) Income from Continuing Operations | | | | | | | | | | | | |
Common units | | $ | (2.26 | ) | | $ | 1.16 | | | $ | (2.15 | ) |
Subordinated units | | $ | (2.36 | ) | | $ | 1.16 | | | $ | (3.15 | ) |
General partner units | | $ | (2.26 | ) | | $ | 1.16 | | | $ | (3.15 | ) |
| Discontinued Operations | | | | | | | | | | | | |
Common units | | $ | — | | | $ | 0.02 | | | $ | 0.02 | |
Subordinated units | | $ | — | | | $ | 0.02 | | | $ | 0.02 | |
General partner units | | $ | — | | | $ | 0.02 | | | $ | 0.02 | |
| Net (Loss) Income | | | | | | | | | | | | |
Common units | | $ | (2.26 | ) | | $ | 1.18 | | | $ | (2.13 | ) |
Subordinated units | | $ | (2.36 | ) | | $ | 1.18 | | | $ | (3.13 | ) |
General partner units | | $ | (2.26 | ) | | $ | 1.18 | | | $ | (3.13 | ) |
Weighted Average Units Outstanding (in thousands) | | | | | | | | | | | | |
Common units | | | 53,496 | | | | 51,699 | | | | 37,008 | |
Subordinated units | | | 20,691 | | | | 20,691 | | | | 20,691 | |
General partner units | | | 845 | | | | 845 | | | | 845 | |
See notes to consolidated financial statements.
EAGLE ROCK ENERGY PARTNERS, L.P.
CONSOLIDATED STATEMENTS OF CASH FLOWS
FOR THE YEARS ENDED DECEMBER 31, 2009, 2008 AND 2007
($ in thousands)
| | | Years Ended December 31, | |
| | | 2009 | | | 2008 | | | 2007 | |
| CASH FLOWS FROM OPERATING ACTIVITIES: | | | | | | | | | |
Net (loss) income | | $ | (171,258 | ) | | $ | 87,520 | | | $ | (145,634 | ) |
| Adjustments to reconcile net (loss) income to net cash provided by (used in) operating activities: | | | | | | | | | | | | |
Depreciation, depletion and amortization | | | 116,262 | | | | 116,754 | | | | 80,559 | |
Impairment | | | 22,062 | | | | 174,851 | | | | 5,749 | |
Amortization of debt issuance costs | | | 1,068 | | | | 958 | | | | 1,777 | |
Write-off of debt issuance costs | | | — | | | | — | | | | 6,215 | |
Equity in earnings of unconsolidated affiliates | | | (1,547 | ) | | | (4,021 | ) | | | (714 | ) |
| Distribution from unconsolidated affiliates—return on investment | | | 442 | | | | 3,643 | | | | 408 | |
Reclassing financing derivative settlements | | | (8,939 | ) | | | 11,063 | | | | 1667 | |
Other operating income | | | (3,552 | ) | | | — | | | | — | |
Equity-based compensation | | | 6,685 | | | | 7,694 | | | | 2,395 | |
Gain of sale of assets | | | (476 | ) | | | (1,265 | ) | | | — | |
Other | | | 210 | | | | (1,618 | ) | | | (69 | ) |
| Changes in assets and liabilities—net of acquisitions: | | | | | | | | | | | | |
Accounts receivable | | | 23,993 | | | | 40,873 | | | | (17,565 | ) |
Prepayments and other current assets | | | (172 | ) | | | 941 | | | | 986 | |
Risk management activities | | | 147,751 | | | | (199,339 | ) | | | 136,132 | |
Accounts payable | | | (38,694 | ) | | | (44,013 | ) | | | 19,200 | |
Due to affiliates | | | 8,437 | | | | (12,491 | ) | | | 16,964 | |
Accrued liabilities | | | (6,411 | ) | | | (1,258 | ) | | | (1,790 | ) |
Other assets | | | 1,487 | | | | 23 | | | | (58 | ) |
Other current liabilities | | | (407 | ) | | | 836 | | | | 723 | |
Net cash provided by operating activities | | | 96,941 | | | | 181,151 | | | | 106,945 | |
| CASH FLOWS FROM INVESTING ACTIVITIES: | | | | | | | | | | | | |
Additions to property, plant and equipment | | | (36,134 | ) | | | (66,741 | ) | | | (66,116 | ) |
Acquisitions, net of cash acquired | | | — | | | | (262,245 | ) | | | (407,626 | ) |
Investment in partnerships | | | (1,581 | ) | | | (3,936 | ) | | | — | |
Proceeds from sale of asset | | | 476 | | | | 1,294 | | | | — | |
Purchase of intangible assets | | | (1,626 | ) | | | (2,975 | ) | | | (2,048 | ) |
Net cash used in investing activities | | | (38,865 | ) | | | (334,603 | ) | | | (475,790 | ) |
| CASH FLOWS FROM FINANCING ACTIVITIES: | | | | | | | | | | | | |
Proceeds from long-term debt | | | 131,000 | | | | 432,128 | | | | 740,470 | |
Repayment of long-term debt | | | (176,000 | ) | | | (199,814 | ) | | | (579,131 | ) |
Payment of debt issuance costs | | | — | | | | (789 | ) | | | (4,280 | ) |
Proceeds from derivative contracts | | | 8,939 | | | | (11,063 | ) | | | (1,667 | ) |
Payment of equity offering costs | | | — | | | | — | | | | (381 | ) |
Proceeds from equity issuances | | | — | | | | — | | | | 331,500 | |
Deferred tranasaction fees | | | (1,480 | ) | | | — | | | | — | |
Repurchase of common units | | | (64 | ) | | | — | | | | (154 | ) |
Distributions to members and affiliates | | | (35,655 | ) | | | (117,646 | ) | | | (59,541 | ) |
Net cash (used in) provided by financing activities | | | (73,260 | ) | | | 102,816 | | | | 426,816 | |
| NET (DECREASE) INCREASE IN CASH AND CASH EQUIVALENTS | | | (15,184 | ) | | | (50,636 | ) | | | 57,971 | |
CASH AND CASH EQUIVALENTS—Beginning of period | | | 17,916 | | | | 68,552 | | | | 10,581 | |
CASH AND CASH EQUIVALENTS—End of period | | $ | 2,732 | | | $ | 17,916 | | | $ | 68,552 | |
| | | | | | | | | | | | | |
Interest paid—net of amounts capitalized | | $ | 26,311 | | | $ | 29,822 | | | $ | 40,948 | |
Units issued in acquisition from escrow | | $ | 3,000 | | | $ | — | | | $ | — | |
Cash paid for taxes | | $ | 1,517 | | | $ | 705 | | | $ | — | |
Issuance of common units for acquisitions | | $ | — | | | $ | 24,236 | | | $ | 307,017 | |
Investments in property, plant and equipment, not paid | | $ | 3,761 | | | $ | 5,534 | | | $ | 2,297 | |
| Deferred tranasaction fees, not paid | | $ | 1,155 | | | $ | — | | | $ | — | |
See notes to consolidated financial statements.
EAGLE ROCK ENERGY PARTNERS, L.P.
CONSOLIDATED STATEMENTS OF MEMBERS’ EQUITY
FOR THE YEARS ENDED DECEMBER 31, 2009, 2008 AND 2007
($ in thousands)
| | | General Partner | | | Number of Common Units | | | Common Units | | | Number of Subordinated Units | | | Subordinated Units | | | Total | |
| BALANCE — January 1, 2007 | | $ | (544 | ) | | | 20,691,495 | | | $ | 116,283 | | | | 20,691,495 | | | $ | 176,248 | | | $ | 291,987 | |
| Equity issued to private investors | | | — | | | | 16,236,265 | | | | 331,500 | | | | — | | | | — | | | | 331,500 | |
| Equity issued in acquisitions | | | — | | | | 13,742,097 | | | | 307,017 | | | | — | | | | — | | | | 307,017 | |
Distribution to affiliates | | | — | | | | — | | | | (421 | ) | | | — | | | | — | | | | (421 | ) |
| Unit issuance costs for IPO | | | — | | | | — | | | | (381 | ) | | | — | | | | — | | | | (381 | ) |
Net loss | | | (2,329 | ) | | | — | | | | (86,334 | ) | | | — | | | | (56,971 | ) | | | (145,634 | ) |
Distributions | | | (310 | ) | | | — | | | | (51,627 | ) | | | — | | | | (7,604 | ) | | | (59,541 | ) |
Vesting of restricted units | | | — | | | | 37,190 | | | | — | | | | — | | | | — | | | | — | |
| Repurchase of common units | | | | | | | (7,400 | ) | | | (154 | ) | | | — | | | | — | | | | (154 | ) |
| Equity-based compensation | | | 28 | | | | — | | | | 1,680 | | | | — | | | | 687 | | | | 2,395 | |
| BALANCE — December 31, 2007 | | | (3,155 | ) | | | 50,699,647 | | | | 617,563 | | | | 20,691,495 | | | | 112,360 | | | | 726,768 | |
Net Income | | | 1,009 | | | | — | | | | 61,794 | | | | — | | | | 24,717 | | | | 87,520 | |
Distributions | | | (1,643 | ) | | | — | | | | (82,588 | ) | | | — | | | | (33,415 | ) | | | (117,646 | ) |
Vesting of restricted units | | | — | | | | 162,302 | | | | — | | | | — | | | | — | | | | — | |
| Equity-based compensation | | | 75 | | | | — | | | | 5,442 | | | | — | | | | 2,177 | | | | 7,694 | |
Distribution to affiliates | | | — | | | | — | | | | (857 | ) | | | — | | | | — | | | | (857 | ) |
| Equity issued in acquisitions | | | — | | | | 2,181,818 | | | | 24,236 | | | | — | | | | — | | | | 24,236 | |
| BALANCE — December 31, 2008 | | | (3,714 | ) | | | 53,043,767 | | | | 625,590 | | | | 20,691,495 | | | | 105,839 | | | | 727,715 | |
Net loss | | | (1,921 | ) | | | — | | | | (122,270 | ) | | | — | | | | (47,067 | ) | | | (171,258 | ) |
Distributions | | | (379 | ) | | | — | | | | (26,738 | ) | | | — | | | | (8,538 | ) | | | (35,655 | ) |
Vesting of restricted units | | | — | | | | 334,403 | | | | — | | | | — | | | | — | | | | — | |
| Repurchase of common units | | | — | | | | (17,492 | ) | | | (64 | ) | | | — | | | | — | | | | (64 | ) |
| Equity-based compensation | | | 72 | | | | — | | | | 4,789 | | | | — | | | | 1,824 | | | | 6,685 | |
| Units returned from escrow | | | — | | | | (7,065 | ) | | | (25 | ) | | | — | | | | — | | | | (25 | ) |
Units issued from escrow | | | — | | | | 849,858 | | | | 3,000 | | | | — | | | | — | | | | 3,000 | |
| BALANCE — December 31, 2009 | | $ | (5, 942 | ) | | | 54,203,471 | | | $ | 484,282 | | | | 20,691,495 | | | $ | 52,058 | | | $ | 530,398 | |
See notes to consolidated financial statements.
EAGLE ROCK ENERGY PARTNERS, L.P.
NOTES TO CONSOLIDATED FINANCIAL STATEMENTS
FOR THE YEARS ENDED DECEMBER 31, 2009, 2008 AND 2007
NOTE 1. ORGANIZATION AND DESCRIPTION OF BUSINESS
Basis of Presentation and Principles of Consolidation—The accompanying financial statements include assets, liabilities and the results of operations of Eagle Rock Energy Partners, L.P. (“Eagle Rock Energy” or the “Partnership”). The general partner of Eagle Rock Energy is Eagle Rock Energy GP, L.P. The general partner of Eagle Rock Energy GP, L.P. is Eagle Rock Energy G&P, LLC. a wholly-owned subsidiary of Eagle Rock Holdings, L.P. (“Holdings”).
Description of Business—Eagle Rock Energy is a growth-oriented limited partnership engaged in the business of gathering, compressing, treating, processing, transporting and selling natural gas, fractionating and transporting natural gas liquids, or NGLs (the “Midstream Business”); the business of acquiring, developing and producing interests in oil and natural gas properties (the “Upstream Business”); and the business of acquiring and managing fee minerals and royalty interests (the “Minerals Business”). The Partnership’s natural gas pipelines gather natural gas from designated points near producing wells and transport these volumes to third-party pipelines, the Partnership’s gas processing plants, utilities and industrial consumers. Natural gas transported to the Partnership’s gas processing plants, either on the Partnership’s pipelines or third party pipelines, is treated to remove contaminants and conditioned or processed into marketable natural gas and natural gas liquids. The Partnership conducts its midstream operations within Louisiana and three geographic areas of Texas and reports its Midstream Business results through four segments: the Texas Panhandle Segment, the South Texas Segment, the East Texas/Louisiana Segment and the Gulf of Mexico Segment. On May 3, 2007, the Partnership completed the acquisition of Laser Midstream Energy, L.P. (“Laser”) and certain of its subsidiaries (“Laser Acquisition”) (see Note 4). The Laser assets include gathering systems and related compression and processing facilities in South Texas, East Texas, and North Louisiana, now a part of the Partnership’s East Texas/Louisiana Segment and which created the Partnership’s South Texas Segment. On October 1, 2008, the Partnership completed the acquisition of 100% of the outstanding units of Millennium Midstream Partners, L.P. (“MMP”) (see Note 4). The MMP assets include natural gas gathering and related compression and processing facilities in West Texas, Central Texas, East Texas, Southern Louisiana and the Gulf of Mexico that are now a part of the Partnership’s East Texas/Louisiana Segment, South Texas Segment and which created the Partnership’s Gulf of Mexico Segment.
The Partnership’s Minerals Business was formed upon completing the acquisition of certain fee minerals, royalties, overriding royalties and non-operated working interest properties from Montierra Minerals & Production, L.P. (“Montierra”) and NGP-VII Income Co-Investment Opportunities, L.P. (“Co-Invest”) (collectively, the “Montierra Acquisition”) on April 30, 2007 (see Note 4). As a result of this acquisition, the Partnership’s mineral assets include royalty interests located in multiple producing trends across the United States. The assets include interests in mineral acres and interests in wells. On June 18, 2007, the Partnership also completed the acquisition of certain assets owned by MacLondon Energy, L.P. (see Note 4), which include additional interests in wells in which the Partnership already owns a royalty interest as a result of the Montierra Acquisition.
On July 31, 2007, the Partnership entered the Upstream Business when it completed the acquisition of Escambia Asset Co., LLC and Escambia Operating Co., LLC (“the Escambia Acquisition”) (see Note 4). This transaction included operated wells in Escambia County, Alabama, as well as two treating facilities, one natural gas processing plant and related gathering systems. Also on July 31, 2007, Eagle Rock Energy completed the acquisition of Redman Energy Holdings, L.P. and Redman Energy Holdings II, L.P. and certain assets owned by NGP Income Co-Investment Opportunities Fund II, L.P. These transactions are collectively referred to as the “Redman Acquisition” (see Note 4). The assets conveyed in the Redman Acquisition included operated and non-operated wells mainly located in East and South Texas. On April 30, 2008, the Partnership completed the acquisition of all of the outstanding capital stock of Stanolind Oil and Gas Corp. (“Stanolind”) (see Note 4). The Stanolind assets include operated oil and natural gas producing properties in the Permian Basin, primarily in Ward, Crane and Pecos Counties, Texas.
On April 1, 2009, the Partnership sold its producer services business (which is accounted for in its South Texas Segment) by assigning and novating the contracts under this business to a third-party purchaser. The Partnership sold the producer services business to a third-party purchaser as it was a low-margin business that was not core to our operations. The Partnershsip received an initial payment of $0.1 million for the sale of the business. In addition it received a contingency payment of $0.1 million in October 2009. The Partnership will continue to receive a monthly payment equivalent to $0.01 per MMbtu on the volume of gas that flows pursuant to the assigned contracts through March 31, 2011. Producer services was a business in which the Partnership would negotiate new well connections on behalf of small producers to pipelines other than their own. During the year ended December 31, 2009, this business generated revenues of $19.2 million and cost of natural gas and natural gas liquids of $18.9 million, as compared to revenues of $265.1 million and cost of natural gas and natural gas liquids of $263.3 million during the year ended December 31, 2008 and revenues of $134.8 million and cost of natural gas and natural gas liquids of $133.6 million during the year ended December 31, 2007. The accompanying consolidated financial statements for the years ended December 31, 2009, 2008 and 2007 have been retrospectively adjusted to present revenues minus cost of natural gas and natural gas liquids of $0.3 million, $1.8 million and $1.2 million, respectively, as discontinued operations.
Subsequent Events— The Partnership has evaluated all events subsequent to the balance sheet date of December 31, 2009 through the date of issuance.
NOTE 2. SUMMARY OF SIGNIFICANT ACCOUNTING POLICIES
The accompanying consolidated financial statements have been prepared in accordance with accounting principles generally accepted in the United States of America. Eagle Rock Energy is the owner of a non-operating undivided interest in the Indian Springs gas processing plant and the Camp Ruby gas gathering system. Eagle Rock Energy owns these interests as tenants-in-common with the majority owner-operator of the facilities. Accordingly, Eagle Rock Energy includes its pro-rata share of assets, liabilities, revenues and expenses related to these assets in its financial statements. All intercompany accounts and transactions are eliminated in the consolidated financial statements.
The preparation of financial statements in conformity with accounting principles generally accepted in the United States of America requires management to make estimates and assumptions that affect the reported amounts of assets and liabilities and disclosure of contingent assets and liabilities at the date of the financial statements and the reported amounts of revenues and expenses during the reported period. Significant estimates are required for proved oil and natural gas reserves, which can affect the carrying value of oil and natural gas properties. The Partnership evaluates its estimates and assumptions on a regular basis. The Partnership bases its estimates on historical experience and various other assumptions that are believed to be reasonable under the circumstances, the results of which form the basis for making judgments about the carrying values of assets and liabilities that are not readily apparent from other sources. Actual results could differ from those estimates and such differences could be material.
Oil and Natural Gas Accounting Policies
The Partnership utilizes the successful efforts method of accounting for our oil and natural gas properties. Leasehold costs are capitalized when incurred. Costs incurred to drill and complete development wells, including dry holes, are capitalized. Unproved properties are assessed periodically within specific geographic areas and, if necessary, impairments are charged to expense. Geological and geophysical expenses and delay rentals are charged to expense as incurred. Exploratory drilling costs are initially capitalized, but charged to expense if the well is determined to be unsuccessful. The Partnership carries the costs of an exploratory well as an asset if the well finds a sufficient quantity of reserves to justify its capitalization as a producing well as long as the Partnership is making sufficient progress towards assessing the reserves and the economic and operating viability of the project.
Depletion of producing oil and natural gas properties is recorded based on units of production. Unit rates are computed for unamortized drilling and development costs using proved developed reserves and for acquisition costs using all proved reserves. Authoritative guidance requires that acquisition costs of proved properties be amortized on the basis of all proved reserves, (developed and undeveloped) and that capitalized development costs (wells and related equipment and facilities) be amortized on the basis of proved developed reserves.
Upon sale or retirement of complete fields of depreciable or depleted property, the book value thereof, less proceeds or salvage value, is charged or credited to income.
Impairment of Oil and Natural Gas Properties
The Partnership reviews its proved properties at the field level when management determines that events or circumstances indicate that the recorded carrying value of the properties may not be recoverable. Such events include a projection of future oil and natural gas reserves that will be produced from a field, the timing of this future production, future costs to produce the oil and natural gas, and future inflation levels. If the carrying amount of an asset exceeds the sum of the undiscounted estimated future net cash flows, the Partnership recognizes impairment expense equal to the difference between the carrying value and the fair value of the asset, which is estimated to be the expected present value of discounted future net cash flows from proved reserves utilizing the Partnership’s weighted average cost of capital. During the year ended December 31, 2009, the Partnership incurred impairment charges of $8.1 million in our Upstream Segment, of which, $7.9 million was a result of a decline in natural gas prices, production declines and lower natural gas liquids yields at its Flomaton field and $0.2 million in other fields due to lower natural gas prices and an impairment of $0.3 million in our Minerals segment as a result of a decline in natural gas prices and a reduction in oil reserves based on updated production performance. During the year ended December 31, 2008, the Partnership recorded impairment charges of $107.0 million and $1.7 million in its Upstream and Minerals Businesses, respectively, as a result of substantial declines in commodity prices in the fourth quarter. During the year ended December 31, 2007, the Partnership recorded an impairment charge in its Minerals segment of $5.7 million as a result of steeper decline rates in certain fields. The Partnership cannot predict the amount of additional impairment charges that may be recorded in the future.
Unproved leasehold costs are reviewed periodically and a loss is recognized to the extent, if any, that the cost of the property has been impaired. Unproved properties that are individually insignificant are amortized. Unproved properties that are individually significant are assessed for impairment on a property-by-property basis. If considered impaired, costs are charged to expense when such impairment is deemed to have occurred.
Property Retirement Obligations
The Partnership is required to make estimates of the future costs of the retirement obligations of its producing oil and natural gas properties. This requirement necessitates that we make estimates of property abandonment costs that, in some cases, will not be incurred until a substantial number of years in the future. Such cost estimates could be subject to significant revisions in subsequent years due to changes in regulatory requirements, technological advances and other factors that may be difficult to predict.
Other Significant Accounting Policies
Cash and Cash Equivalents—Cash and cash equivalents include certificates of deposit and other highly liquid investments with maturities of three months or less at the time of purchase.
Concentration and Credit Risk—Concentration and credit risk for the Partnership principally consists of cash and cash equivalents and accounts receivable.
The Partnership places its cash and cash equivalents with high-quality institutions and in money market funds. The Partnership derives its revenue from customers primarily in the natural gas industry. During 2006, the Partnership increased the parties to which it was selling liquids and natural gas from two to seven. The Partnership further increased the number of parties to which it sells liquids and natural gas as a result of the acquisitions completed during 2007 and 2008. Industry concentrations have the potential to impact the Partnership’s overall exposure to credit risk, either positively or negatively, in that the Partnership’s customers could be affected by similar changes in economic, industry or other conditions. However, the Partnership believes the risk posed by this industry concentration is offset by the creditworthiness of the Partnership’s customer base. The Partnership’s portfolio of accounts receivable is comprised primarily of mid-size to large domestic corporate entities. The following is the activity within our allowance for doubtful accounts during the years ended December 31, 2009, 2008 and 2007.
| | | 2009 | | | 2008 | | | 2007 | |
| ($ in thousands) | | | | | | | | | |
Balance at beginning of period | | $ | 12,080 | | | $ | 1,046 | | | $ | — | |
Charged to bad debt expense | | | 535 | | | | 11,136 | | | | 1,046 | |
Write-offs/adjustments charged to allowance | | | (7,797 | ) | | | (102 | ) | | | — | |
Operating income from continuing operations | | $ | 4,818 | | | $ | 12,080 | | | $ | 1,046 | |
Of the $11.1 million charged to bad debt expense during the year ended December 31, 2008, $10.7 relates to outstanding receivables from SemGroup, L.P. which filed for bankruptcy in July 2008. During the year ended December 31, 2009, the Partnership wrote off $7.3 million related to SemGroup, L.P. This amount relates to the non 503(b)(9) claims and the portion of the receivables sold in August 2009 (see Note 18 for further discussion).
Certain Other Concentrations—The Partnership relies on natural gas producers for its Midstream Business’s natural gas and natural gas liquid supply, with the top two producers (by segment) accounting for 37% of its natural gas supply in the Texas Panhandle Segment, 23% of its natural gas supply in the East Texas/Louisiana Segment, 69% of its natural gas supply in the South Texas Segment and in the Gulf of Mexico Segment, one customer accounted for 90% of its natural gas supply for the year ended December 31, 2009. While there are numerous natural gas and natural gas liquid producers and some of these producers are subject to long-term contracts, the Partnership may be unable to negotiate extensions or replacements of these contracts on favorable terms, if at all. If the Partnership were to lose all or even a portion of the natural gas volumes supplied by these producers and was unable to acquire comparable volumes, the Partnership’s results of operations and financial position could be materially adversely affected. These percentages are calculated based on MMBtus gathered during the year ended December 31, 2009. For the year ended December 31, 2009, ONEOK Energy Services and Upstream Energy Services, the Partnership’s two largest customers, represented 27% and 16% of our total sales revenue (including realized and unrealized gains on commodity derivatives).
Property, Plant, and Equipment—Property, plant, and equipment consists primarily of gas gathering systems, gas processing plants, NGL pipelines, conditioning and treating facilities and other related facilities, and oil and gas properties, which are carried at cost less accumulated depreciation, depletion and amortization. The Partnership charges repairs and maintenance against income when incurred and capitalizes renewals and betterments, which extend the useful life or expand the capacity of the assets. The Partnership calculates depreciation on the straight-line method over estimated useful lives of the Partnership’s newly developed or acquired assets. The weighted average useful lives are as follows:
| Pipelines and equipment | 20 years |
Gas processing and equipment | 20 years |
| Office furniture and equipment | 5 years |
The Partnership capitalizes interest costs on major projects during extended construction time periods. Such interest costs are allocated to property, plant and equipment and amortized over the estimated useful lives of the related assets. During the year ended December 31, 2009, 2008 and 2007, the Partnership capitalized interest costs of approximately $0.1 million, $0.4 million, and $1.4 million, respectively.
Impairment of Long-Lived Assets—Management evaluates whether the carrying value of non-oil and natural gas long-lived assets has been impaired when circumstances indicate the carrying value of those assets may not be recoverable. This evaluation is based on undiscounted cash flow projections. The carrying amount is not recoverable if it exceeds the undiscounted sum of cash flows expected to result from the use and eventual disposition of the assets. Management considers various factors when determining if these assets should be evaluated for impairment, including, but not limited to:
| | • | significant adverse change in legal factors or in the business climate; |
| | • | a current-period operating or cash flow loss combined with a history of operating or cash flow losses or a projection or forecast which demonstrates continuing losses associated with the use of a long-lived asset; |
| | • | an accumulation of costs significantly in excess of the amount originally expected for the acquisition or construction of a long-lived asset; |
| | • | significant adverse changes in the extent or manner in which an asset is used or in its physical condition; |
| | • | a significant change in the market value of an asset; or |
| | • | a current expectation that, more likely than not, an asset will be sold or otherwise disposed of before the end of its estimated useful life. |
If the carrying value is not recoverable on an undiscounted basis, the impairment loss is measured as the excess of the asset’s carrying value over its fair value. Management assesses the fair value of long-lived assets using commonly accepted techniques, and may use more than one method, including, but not limited to, recent third party comparable sales, internally developed discounted cash flow analysis and analysis from outside advisors. Significant changes in market conditions resulting from events such as the condition of an asset or a change in management’s intent to utilize the asset would generally require management to reassess the cash flows related to the long-lived assets. During the year ended December 31, 2009, the Partnership recorded impairment charges related to certain processing plants, pipelines and contracts in its Midstream business of $13.7 million due to reduced throughput volumes. During the year ended December 31, 2008, the Partnership recorded an impairment charge related to certain processing plants, pipelines and contracts in its Midstream business of $35.1 million due to the substantial decline in commodity prices in the fourth quarter as well as declining drilling activity by its producer customers. Due to the percent-of-proceeds, fixed recovery and keep-whole contract arrangements the Partnership operates under with some of its producer customers, cash flows are dependent up the selling price of the natural gas and natural gas liquids processed by its plants. Under these arrangements, lower commodity prices result in lower margins. In addition, lower commodity prices influence the drilling activity of the Partnership’s producer customers. Lower drilling activity reduces the future volumes of natural gas projected to flow through our gathering systems, thus reducing both the equity volumes attributable to the Partnership and the fees generated under the fee-based arrangements the Partnership operates under as part of its Midstream Business.
Goodwill—Goodwill acquired in connection with business combinations represent the excess of consideration over the fair value of tangible net assets and identifiable intangible assets acquired. Certain assumptions and estimates are employed in determining the fair value of assets acquired and liabilities assumed, as well as in determining the allocation of goodwill to the appropriate reporting unit.
The Partnership acquired goodwill as part of its acquisition of Redman (See Note 4 and Note 15) on July 31, 2007. During the year ended December 31, 2008, goodwill increased by $1.4 million due to adjustments made to the Redman purchase price allocation. The Partnership performed its annual impairment test in May 2008 and determined that no impairment appeared evident. The Partnership’s goodwill impairment test involves a comparison of the fair value of each of its reporting units with their carrying value. The fair value is determined using discounted cash flows and other market-related valuation models. Certain estimates and judgments are required in the application of the fair value models. As a result of the impairment charge incurred within the Partnership’s Upstream Segment during the fourth quarter of 2008 which resulted from the substantial decline in commodity prices during the fourth quarter of 2008, the Partnership performed an assessment of its goodwill and recorded an impairment charge of $31.0 million, which reduced its goodwill amount to zero. No such impairment was recorded in the years ended December 31, 2009 or 2007. At December 31, 2009, 2008 and 2007, the Partnership had gross goodwill of $31.0 million, $31.0 million and $29.5 million and accumulated impairment losses of $31.0 million, $31.0 million and zero, respectively.
Other Assets— As of December 31, 2009, other assets primarily consist of costs associated with: debt issuance costs, net of amortization ($3.2 million); business deposits to various providers and state or regulatory agencies ($1.1 million); and investment in unconsolidated affiliates ($13.3 million). As of December 31, 2008, other assets primarily consist of costs associated with: debt issuance costs, net of amortization ($4.2 million); business deposits to various providers and state or regulatory agencies ($0.5 million); and investment in unconsolidated affiliates ($9.3 million).
Within the Partnership’s investments of unconsolidated affiliates, the Partnership owns 13.2%, 5.0% and 5.0% of the common units of Ivory Working Interests, L.P., Buckeye Pipeline, L.P. and Trinity River, LLC, respectively. The Partnership also owns a 50% joint venture in Valley Pipeline, LLC. and Sweeny Gathering, L.P. These investments are accounted for under the equity method and as of December 31, 2009 are not considered material to the Partnership’s financial position or results of operations.
Transportation and Exchange Imbalances—In the course of transporting natural gas and natural gas liquids for others, the Partnership may receive for redelivery different quantities of natural gas or natural gas liquids than the quantities actually delivered. These transactions result in transportation and exchange imbalance receivables or payables which are recovered or repaid through the receipt or delivery of natural gas or natural gas liquids in future periods, if not subject to cash out provisions. Imbalance receivables are included in accounts receivable and imbalance payables are included in accounts payable on the consolidated balance sheets and marked-to-market using current market prices in effect for the reporting period of the outstanding imbalances. For the Midstream Business, as of December 31, 2009, the Partnership had imbalance receivables totaling $0.3 million and imbalance payables totaling $2.9 million, respectively. For the Midstream business, as of December 31, 2008, the Partnership had imbalance receivables totaling $0.3 million and imbalance payables totaling $2.8 million, respectively. Changes in market value and the settlement of any such imbalance at a price greater than or less than the recorded imbalance results in either an upward or downward adjustment, as appropriate, to the cost of natural gas sold.
Revenue Recognition—Eagle Rock Energy’s primary types of sales and service activities reported as operating revenue include:
| | • | sales of natural gas, NGLs, crude oil and condensate; |
| | • | natural gas gathering, processing and transportation, from which Eagle Rock Energy generates revenues primarily through the compression, gathering, treating, processing and transportation of natural gas; |
| | • | NGL transportation from which we generate revenues from transportation fees; and |
| | • | royalties, overriding royalties and lease bonuses. |
Revenues associated with sales of natural gas, NGLs, crude oil and condensate are recognized when title passes to the customer, which is when the risk of ownership passes to the customer and physical delivery occurs. Revenues associated with transportation and processing fees are recognized when the service is provided.
For gathering and processing services, Eagle Rock Energy either receives fees or commodities from natural gas producers depending on the type of contract. Under the percentage-of-proceeds contract type, Eagle Rock Energy is paid for its services by keeping a percentage of the NGLs produced and a percentage of the residue gas resulting from processing the natural gas. Commodities received are in turn sold and recognized as revenue in accordance with the criteria outlined above. Under the keep-whole contract type, Eagle Rock Energy purchases wellhead natural gas to return to the producer and sells processed natural gas and NGLs to third parties.
Transportation, compression and processing-related revenues are recognized in the period when the service is provided and include the Partnership’s fee-based service revenue for services such as transportation, compression and processing.
The Partnership’s Upstream Segment recognizes revenues based on actual volumes of natural gas sold to purchasers. The volumes of natural gas sold may differ from the volumes to which the Partnership is entitled based on its interests in the properties. Differences between volumes sold and volumes based on entitlements create natural gas imbalances. Material imbalances are reflected as adjustments to reported natural gas reserves and future cash flows. As of December 31, 2009, the Partnership’s Upstream Segment had an imbalance receivable balance of $1.9 million and an imbalance payable balance of $0.5 million. As of December 31, 2008, the Partnership’s Upstream Segment had an imbalance receivable balance of $3.5 million and an imbalance payable balance of $0.2 million.
A significant portion of the Partnership’s sale and purchase arrangements are accounted for on a gross basis in the consolidated statements of operations as natural gas sales and costs of natural gas, respectively. These transactions are contractual arrangements which establish the terms of the purchase of natural gas at a specified location and the sale of natural gas at a different location at the same or at another specified date. These arrangements are detailed either jointly, in a single contract, or separately in individual contracts which are entered into concurrently or in contemplation of one another with a single or multiple counterparties. Both transactions require physical delivery of the natural gas and the risk and reward of ownership are evidenced by title transfer, assumption of environmental risk, transportation scheduling, credit risk and counterparty nonperformance risk. Under authoritative guidance, purchase and sale agreements with the same counterparty are required to be recorded on a net basis. For the years ended December 31, 2009, 2008 and 2007, the Partnership did not enter into any purchase and sale agreements with the same counterparty.
Environmental Expenditures—Environmental expenditures are expensed or capitalized as appropriate, depending upon the future economic benefit. Expenditures which relate to an existing condition caused by past operatios and do not generate current or future revenue are expensed. Liabilities for these expenditures are recorded on an undiscounted basis when environmental assessments and/or clean-ups are probable and the costs can be reasonably estimated.
Income Taxes—Provision for income taxes is primarily applicable to our state tax obligations under the Revised Texas Franchise Tax (the “Revised Texas Franchise Tax”) and certain federal and state tax obligations of Eagle Rock Energy Acquisition Co., Inc. and Eagle Rock Upstream Development Company, Inc., both of which are consolidated subsidiaries of ours. Deferred income tax assets and liabilities are recognized for temporary differences between the assets and liabilities of our tax paying entities for financial reporting and tax purposes.
In general, legal entities that conduct business in Texas are subject to the Revised Texas Franchise Tax. In May 2006, the State of Texas expanded its pre-existing franchise tax to include limited partnerships, limited liability companies, corporations and limited liability partnerships. As a result of the change in tax law, the Partnership’s tax status in the State of Texas changed from non-taxable to taxable effective with the 2007 tax year.
Since the Partnership is structured as a pass-through entity, it is not subject to federal income taxes. As a result, its partners are individually responsible for paying federal and certain income taxes on their share of the Partnership’s taxable income. Since the Partnership does not have access to information regarding each partner’s tax basis, it cannot readily determine the total difference in the basis of our net assets for financial and tax reporting purposes.
In accordance with authoritative guidance, the Partnership must recognize the tax effects of any uncertain tax positions we may adopt, if the position taken by us is more likely than not sustainable. If a tax position meets such criteria, the tax effect to be recognized by us would be the largest amount of benefit with more than a 50% chance of being realized upon settlement. This guidance was effective January 1, 2007, and our adoption of this guidance had no material impact on our financial position, results of operations or cash flows. See Note 15 for additional information regarding our income taxes.
Derivatives—Authoritative guidance establishes accounting and reporting standards for derivative instruments, including certain derivative instruments embedded in other contracts, and for hedging activities. It requires an entity to recognize all derivatives as either assets or liabilities in the statement of financial position and measure those instruments at fair value. The guidance provides that normal purchase and normal sale contracts, when appropriately designated, are not subject to the statement. Normal purchases and normal sales are contracts which provide for the purchase or sale of something, other than a financial instrument or derivative instrument that will be delivered in quantities expected to be used or sold by the reporting entity over a reasonable period in the normal course of business. The Partnership’s forward natural gas and crude oil purchase and sales contracts are designated as normal purchases and sales. Substantially all forward contracts fall within a one-month to four-year term; however, the Partnership does have certain contracts which extend through the life of the dedicated production. The terms of these contracts generally preclude unplanned netting. The Partnership uses financial instruments such as puts, swaps and other derivatives to mitigate the risks to cash flows resulting from changes in commodity prices and interest rates. The Partnership recognizes these financial instruments on its consolidated balance sheet at the instrument’s fair value with changes in fair value reflected in the consolidated statement of operations, as the Partnership has not designated any of these derivative instruments as hedges. The cash flows from derivatives are reported as cash flows from operating activities unless the derivative contract is deemed to contain a financing element. Derivatives deemed to contain a financing element are reported as a financing activity in the statement of cash flows. See Note 11 for a description of the Partnership’s risk management activities.
NOTE 3. NEW ACCOUNTING PRONOUNCEMENTS
The Financial Accounting Standards Board (the “FASB”) has codified a single source of U.S. Generally Accepted Accounting Principles (U.S. GAAP), the Accounting Standards Codification. Unless needed to clarify a point to readers, the Partnership will refrain from citing specific section references when discussing application of accounting principles or addressing new or pending accounting rule changes.
In December 2007, the FASB issued authoritative guidance to require that all assets, liabilities, contingent consideration, contingencies and in-process research and development costs of an acquired business be recorded at fair value at the acquisition date; that acquisition costs generally be expensed as incurred; that restructuring costs generally be expensed in periods subsequent to the acquisition date; and that changes in accounting for deferred tax asset valuation allowances and acquired income tax uncertainties after the measurement period impact income tax expense. The guidance is effective for business combinations for which the acquisition date is on or after the beginning of the first annual reporting period beginning on or after December 15, 2008, with the exception for the accounting for valuation allowances on deferred tax assets and acquired tax contingencies associated with acquisitions. The guidance amends previous guidance such that adjustments made to valuation allowances on deferred taxes and acquired tax contingencies associated with acquisitions that closed prior to the effective date of the amended guidance would also apply the provisions of such guidance. The guidance was effective for us as of January 1, 2009 but the impact of the adoption on the Partnership’s consolidated financial statements will depend on the nature and the extent of business combinations occurring after January 1, 2009.
In December 2007, the FASB issued authoritative guidance which requires that accounting and reporting for minority interests will be recharacterized as noncontrolling interests and classified as a component of equity. The guidance also establishes reporting requirements that provide sufficient disclosures that clearly identify and distinguish between the interests of the parent and the interests of the noncontrolling owners. This Statement is effective as of the beginning of an entity’s first fiscal year beginning after December 15, 2008. The guidance was effective for us as of January 1, 2009 and did not have a material impact on its consolidated results of operations or financial position as the Partnership has no noncontrolling interests.
In February 2008, the FASB issued authoritative guidance that permitted the delayed application of fair value measurement for all nonfinancial assets and nonfinancial liabilities, except those that are recognized or disclosed at fair value in the financial statements on at least an annual basis, until fiscal years beginning after November 15, 2008. Non-financial assets and liabilities that the Partnership measures at fair value on a non-recurring basis consists primarily of property, plant and equipment, and intangible assets, which are subject to fair value adjustments in certain circumstances (for example, when there is evidence of impairment) (See Note 10).
In March 2008, the FASB issued authoritative guidance requiring enhanced disclosures to help investors better understand the effect of an entity’s derivative instruments and related hedging activities on its financial position, financial performance, and cash flows. The guidance was effective for us as of January 1, 2009 (See Note 11).
In March 2008 the FASB approved authoritative guidance which requires that master limited partnerships use the two-class method of allocating earnings to calculate earnings per unit. This guidance is effective for fiscal years and interim periods beginning after December 15, 2008. The guidance was effective for us as of January 1, 2009 and the impact on its earnings per unit calculation has been retrospectively applied to 2008 and 2007 (see Note 16).
In April 2008, the FASB issued authoritative guidance which amends the factors that should be considered in developing renewal or extension assumptions used to determine the useful life of a recognized intangible asset. The intent of guidance is to improve the consistency between the useful life of a recognized intangible asset and the period of expected cash flows used to measure the fair value of the asset. This guidance must be applied prospectively to intangible assets acquired after the effective date. The guidance was effective for the Partnership as of January 1, 2009 but the impact of the adoption on the Partnership’s consolidated financial statements will depend on the nature and the extent of business combinations occurring after January 1, 2009.
In June 2008, the FASB issued authoritative guidance which affects entities that accrue cash dividends on share-based payment awards during the awards’ service period when dividends do not need to be returned if the employees forfeit the awards. This guidance is effective for fiscal years beginning after December 15, 2008 and earnings-per-unit calculations would need to be adjusted retroactively. The guidance was effective for us as of January 1, 2009 and the impact on its earnings per unit calculation has been retrospectively applied to 2008 and 2007 (See Note 16).
In December 2008, the SEC issued authoritative guidance related to the modernization of oil and gas reporting, which amends the oil and gas disclosures for oil and gas producers and codifies the revised disclosure requirements. The goal is to provide investors with a more meaningful and comprehensive understanding of oil and gas reserves. Energy companies affected by this guidance are now required to price proved oil and gas reserves using the unweighted arithmetic average of the price on the first day of each month within the 12-month period prior to the end of the reporting period, unless prices are defined by contractual arrangements, excluding escalations based on future conditions. This guidance is effective beginning for financial statements for fiscal years ending on or after December 31, 2009. The impact on the Partnership’s operating results, financial position and cash flows has been recorded in the financial statements; additional disclosures were added to the accompanying notes to the consolidated financial statements for its supplemental oil and gas disclosure.
In January 2010, the FASB issued updated authoritative guidance which aligns the current oil and natural gas reserve estimation and disclosure requirements of the Extractive Industries - Oil and Gas authoritative guidance with the changes required by the SEC final rule, as discussed above. The guidance expands the disclosures required for equity method investments, revises the definition of oil- and natural gas-producing activities to include nontraditional resources in reserves unless not intended to be upgraded into synthetic oil or natural gas, amends the definition of proved oil and natural gas reserves to require 12-month average pricing in estimating reserves, amends and adds definitions in the Master Glossary that is used in estimating proved oil and natural gas quantities and provides guidance on geographic areas with respect to disclosure of information about significant reserves. The guidance must be applied prospectively as a change in accounting principle that is inseparable from a change in accounting estimate and is effective for entities with annual reporting periods ending on or after December 31, 2009. The Partnership adopted this guidance effective December 31, 2009. (See Note 21).
In April 2009, the FASB issued authoritative guidance amending the other-than-temporary impairment guidance for debt securities to make the guidance more operational and to improve the presentation and disclosure of other-than-temporary impairments in the financial statements. The most significant change is a revision to the amount of other-than-temporary loss of a debt security recorded in earnings under certain circumstances. This guidance was effective for us as of June 30, 2009 and did not have a material impact on its consolidated financial statements.
In April 2009, the FASB issued authoritative guidance which provides additional guidance for estimating fair value when the volume and level of activity for the asset or liability have significantly decreased. The guidance also includes guidance on identifying circumstances that indicate a transaction is not orderly and emphasizes that even if there has been a significant decrease in the volume and level of activity for the asset or liability and regardless of the valuation technique(s) used, the objective of a fair value measurement remains the same. Fair value is the price that would be received to sell an asset or paid to transfer a liability in an orderly transaction (that is, not a forced liquidation or distressed sale) between market participants at the measurement date under current market conditions. This guidance was effective for us as of June 30, 2009 and did not have a material impact on its consolidated financial statements.
In April 2009, the FASB issued authoritative guidance to require disclosures about fair value of financial instruments for interim reporting periods of publicly traded companies as well as in annual financial statements. The guidance also requires those disclosures in summarized financial information at interim reporting periods. The guidance was effective for us as of June 30, 2009. (See Note 10).
In April 2009, the FASB issued authoritative guidance which amended and clarified previous guidance with respect to contingencies. The guidance provides that an acquirer shall recognize at fair value, at the acquisition date, an asset acquired or a liability assumed in a business combination that arises from a contingency if the acquisition-date fair value of that asset or liability can be determined during the measurement period. If the acquisition-date fair value of an asset acquired or a liability assumed in a business combination that arises from a contingency cannot be determined using the measurement period, the previous guidance shall apply.” This guidance was effective for us as of January 1, 2009 but the impact of the adoption on the Partnership’s consolidated financial statements will depend on the nature and the extent of business combinations occurring after January 1, 2009.
In May 2009, the FASB issued authoritative guidance which provides guidance on the Partnership’s assessment of subsequent events. Historically, the Partnership has relied on U.S. auditing literature for guidance on assessing and disclosing subsequent events. The guidance clarifies that the Partnership must evaluate, as of each reporting period, events or transactions that occur after the balance sheet date “through the date that the financial statements are issued or are available to be issued.” The Partnership must perform its assessment for both interim and annual financial reporting periods prospectively. The guidance was effective for us as of June 30, 2009 but the impact of the adoption will depend on the nature and the extent of transactions that occur subsequent to the Partnership’s interim and annual reporting periods. New guidance was issued on February 25, 2010 which requires SEC registrants to evaluate subsequent events through the date that the financial statements are issued. (See Note 1).
In June 2009, the FASB issued authoritative guidance which reflects the FASB’s response to issues entities have encountered when applying previous guidance. In addition, this guidance addresses concerns expressed by the SEC, members of the United States Congress, and financial statement users about the accounting and disclosures required in the wake of the subprime mortgage crisis and the deterioration in the global credit markets. In addition, because this guidance eliminates the exemption from consolidation for qualified special-purpose entities (“QSPEs”) a transferor will need to evaluate all existing QSPEs to determine whether they must be consolidated. The guidance is effective for financial asset transfers occurring after the beginning of an entity’s first fiscal year that begins after November 15, 2009. Early adoption of is prohibited. The Partnership is currently evaluating the potential impact, if any, of the adoption of this guidance on its financial statements.
In June 2009, the FASB issued authoritative guidance, which amends the consolidation guidance applicable to variable interest entities (VIEs). The amendments will significantly affect the overall consolidation analysis. While the FASB’s discussions leading up to the issuance of this guidance focused extensively on structured finance entities, the amendments to the consolidation guidance affect all entities and enterprises, as well as qualifying special-purpose entities (QSPEs) that were excluded from previous guidance. Accordingly, an enterprise will need to carefully reconsider its previous conclusions, including (1) whether an entity is a VIE, (2) whether the enterprise is the VIE’s primary beneficiary, and (3) what type of financial statement disclosures are required. This guidance is effective as of the beginning of the first fiscal year that begins after November 15, 2009, and early adoption is prohibited. The Partnership is currently evaluating the potential impact, if any, of the adoption on its financial statements.
In June 2009, the FASB established the FASB Accounting Standards Codification (“ASC”) as the single source of authoritative U.S. generally accepted accounting principles (“U.S. GAAP”) recognized by the FASB to be applied by nongovernmental entities. Rules and interpretive releases of the United States Securities and Exchange Commission (“SEC”) under authority of federal securities laws are also sources of authoritative U.S. GAAP for SEC registrants. The Codification did not have a material impact on the Partnership’s consolidated financial statements upon adoption. Accordingly, the Partnership’s notes to consolidated financial statements will explain accounting concepts rather than cite the topics of specific U.S. GAAP.
In September 2009, the FASB issued a consensus which revises the standards for recognizing revenue on arrangements with multiple deliverables. Before evaluating how to recognize revenue for transactions with multiple revenue generating activities, an entity should identify all the deliverables in the arrangement and, if there are multiple deliverables, evaluate each deliverable to determine the unit of accounting and whether it should be treated separately or in combination. The consensus removes certain thresholds for separation, provides criteria for allocation of revenue amongst deliverables and expands disclosure requirements. The standards will be effective June 1, 2010, for fiscal year 2011, unless the Partnership elects to early adopt the standards. The Partnership has not yet evaluated the impact these standards will have on its financial position or results of operations. The Partnership has not determined if it will early adopt the standards.
In September 2009, the FASB issued an amendment to authoritative guidance to address the need for additional implementation guidance on accounting for uncertainty in income taxes and to specifically address the following questions, (1) is income tax paid by the entity attributable to the entity or its owners, (2) what constitutes a tax position for a pass-through entity or a tax-exempt not-for-profit entity and (3) how should accounting for uncertainty in income taxes be applied when a group of related entities comprise both taxable and nontaxable entities. This amendment is effective for interim and annual periods ended after September 15, 2009. The adoption of this guidance had no material impact on the Partnership’s financial statements.
NOTE 4. ACQUISITIONS
2008 Acquistions
Stanolind Acquisition. On April 30, 2008, the Partnership completed the acquisition of all of the outstanding capital stock of Stanolind Oil and Gas Corp. (“Stanolind”), for an aggregate purchase price of $81.9 million, subject to working capital and other purchase price adjustments (the “Stanolind Acquisition”). One or more Natural Gas Partners’ (“NGP”) private equity funds, which directly or indirectly owned a majority of the equity interests in Stanolind, is an affiliate of the Partnership and is the majority owner of the sole owner of Eagle Rock Energy G&P, LLC (the “Company”), which is the general partner of Eagle Rock Energy GP, L.P., which is the general partner of the Partnership. The Partnership funded the transaction from borrowings under its existing credit facility as well as existing cash from operations. Stanolind owned and operated oil and natural gas producing properties in the Permian Basin, primarily in Ward, Crane and Pecos Counties, Texas.
The purchase price was allocated on a preliminary basis to acquired assets and liabilities assumed based on their respective fair value as determined by management. The Partnership recorded the Stanolind acquisition under the authoritative guidance regarding Financial Statements of Oil and Gas Exchange Offers. In accordance with this guidance, the Partnership has recorded the interest attributable to the ownership of NGP in Stanolind at their carryover basis. Those interests not attributable to NGP have been recorded at their fair value. As a result, the Partnership recorded $0.9 million of the net cash paid in excess of the carryover basis as a distribution to NGP for the Stanolind acquisition.
The purchase price allocation is set forth below:
| | | ($ in thousands) | |
| Oil and gas properties: | | | |
Proved properties | | $ | 107,905 | |
Unproved properties | | | 7,082 | |
Cash and cash equivalents | | | 537 | |
Accounts receivable | | | 3,355 | |
Other assets | | | 406 | |
Accounts payable and accrued liabilities | | | (5,011 | ) |
Risk management liabilities | | | (2,865 | ) |
Deferred income taxes | | | (24,857 | ) |
Asset retirement obligations | | | (4,709 | ) |
Other long-term liabilities | | | (818 | ) |
Total purchase price allocation | | | 81,025 | |
Distribution to NGP | | | 857 | |
Total consideration paid | | $ | 81,882 | |
The Partnership commenced recording results of operations with regard to Stanolind on May 1, 2008.
Due to the potential conflict of interest between the interests of the Company and the public unitholders of Eagle Rock Energy, as a result of one or more NGP private equity funds directly or indirectly owning a majority of the equity interests in Eagle Rock Energy and Stanolind, the Board of Directors authorized the Company’s Conflicts Committee to review, evaluate, and, if determined appropriate, approve the Stanolind Acquisition. The Conflicts Committee, consisting of independent Directors of the Company, determined that the Stanolind Acquisition was fair and reasonable to Eagle Rock Energy and its public unitholders and recommended to the Board of Directors of the Company that the transaction be approved and authorized. In considering the fairness of the Stanolind acquisition, the Conflicts Committee considered the valuation of the assets and liabilities involved in the transaction and the cash flow of Stanolind. Based on the recommendation of management and the Conflicts Committee, the Board of Directors approved the transaction.
Millennium Acquisition. On October 1, 2008, the Partnership completed the acquisition of 100% of the outstanding units of Millennium Midstream Partners, L.P. (“MMP”) for an aggregate purchase price of $210.6 million, comprised of approximately $183.4 million in cash and 3,031,676 (recorded value of $27.2 million) common units, subject to post closing purchase price adjustments (the “Millennium Acquisition”). The cash portion of the consideration was funded through borrowings of $176.4 million under the Partnership’s Revolving Credit Facility and cash on hand. MMP is in the natural gas gathering and processing business, with assets located in East, Central and West Texas and South Louisiana. With respect to the South Louisiana assets acquired in the acquisition, the Yscloskey and North Terrebonne facilities were flooded with three to four feet of water as a result of the storm surges caused by Hurricanes Ike and/or Gustav. The North Terrebonne facility came back on-line in November 2008 and the Yscloskey facility came back on-line in January 2009. The Partnership received a partial payment for business interruption caused by Hurricanes Gustav and Ike of approximately $1.6 million, which was recognized as other revenue during the three months ended June 30, 2009. The former owners of MMP provided the Partnership indemnity coverage for Hurricanes Gustav and Ike to the extent losses are not covered by insurance and established an escrow account of 1,818,182 common units and $0.6 million in cash available for the Partnership to recover against for this purpose. As of December 31, 2009, the Partnership has recovered 577,020 units and the $0.6 million in cash from this escrow account. In addition, during the year ended December 31, 2009, the Partnership received $0.1 million representing the distribution for the fourth quarter of 2008 that was paid into escrow on 342,609 of those units, per an arrangement with the sellers that the fourth quarter 2008 distribution on certain units cancelled as part of the purchase price adjustment should be returned to the Partnership upon cancellation. During the year ended December 31, 2009, 849,858 (recorded value of $3.0 million) common units were released out of escrow to the former owners of MMP on account of satisfaction of agreed-upon conditions for an early-release and are included as part of the purchase price. As of December 31, 2009, the escrow account held 391,304 common units which are available for claims by the Partnership and will not be available for release to the former owners of MMP until April 1, 2010. As of March 9, 2010, the Partnership has recovered an additional 3,759 common units.
The purchase price was allocated, excluding amounts held in escrow to assets acquired and liabilities assumed, based on their respective fair value as determined by management with the assistance of K.E. Andrews & Company, a third-party valuation specialist. The Millennium Acquisition was accounted for as a purchase in accordance with authoritative guidance regarding business combinations. The purchase price allocation is set forth below:
| | | ($ in thousands) | |
| | | | |
Property, plant and equipment | | $ | 191,723 | |
Intangibles, right-of-way and contracts | | | 29,072 | |
Cash and cash equivalents | | | 38 | |
Accounts receivable | | | 19,130 | |
Other current assets | | | 2,534 | |
Derivatives | | | 89 | |
Other current liabilities | | | (27,753 | ) |
Asset retirement obligations | | | (2,490 | ) |
Other liabilities | | | (1,764 | ) |
| | | $ | 210,579 | |
The Partnership commenced recording results of operations with regard to MMP on October 1, 2008.
2007 Acquisitions
Montierra Acquisition. On April 30, 2007, the Partnership acquired (through part entity purchase and part asset purchase in the Montierra Acquisition) certain fee mineral acres, royalty and overriding royalty interests in oil and natural gas producing wells from Montierra (a Natural Gas Partners VII, L.P. portfolio company) and Co-Invest (a Natural Gas Partners affiliate). Eagle Rock Energy paid consideration that totaled 6,458,946 (recorded value of $133.8 million) of our common units and $5.4 million of cash. As part of this transaction, a 39.34% economic interest in the incentive distribution rights was conveyed from Eagle Rock Holdings, L.P. to Montierra.
The Partnership recorded the Montierra Acquisition under the guidance related to Financial Statements of Oil and Gas Exchange Offers. In accordance with this guidance, the Partnership has recorded the interest attributable to the ownership of Natural Gas Partners in Montierra at their carryover basis. Those interests not attributable to Natural Gas Partners have been recorded at their fair value.
The purchase price was allocated to assets acquired and liabilities assumed based on their respective fair value as determined by management. The purchase price allocation is set forth below:
| | | ($ in thousands) | |
| Oil and gas properties: | | | |
Proved properties | | $ | 66,884 | |
Unproved properties | | | 65,855 | |
Cash and cash equivalents | | | 936 | |
Accounts receivable | | | 3,267 | |
Prepayments | | | 15 | |
Accounts payable and accrued liabilities | | | (1,671 | ) |
Risk management liabilities | | | (759 | ) |
Investment in unconsolidated affiliates | | | 4,694 | |
| | | $ | 139,221 | |
The Partnership commenced recording results of operations with regard to Montierra on May 1, 2007.
One or more NGP private equity funds directly or indirectly owned a majority of the equity interests in Eagle Rock and Montierra. Because of the potential conflict of interest between the interests of the Company and the public unitholders of Eagle Rock, the Board of Directors authorized the Company’s Conflicts Committee to review, evaluate, and, if determined appropriate, approve the Montierra Acquisition. The Conflicts Committee, consisting of independent Directors of the Company, determined that the Montierra Acquisition was fair and reasonable to Eagle Rock and its public unitholders and recommended to the Board of Directors of the Company that the transaction be approved and authorized. In considering the fairness of the Montierra Acquisition, the Conflicts Committee considered the valuation of the properties involved in the transaction, the valuation of the units to be offered as consideration in the transaction, and the cash flow of Montierra. Based on the recommendation of the Conflicts Committee, the Board of Directors approved the transaction.
Laser Acquisition. On May 3, 2007, Eagle Rock Energy Partners, L.P. acquired certain entities from Laser Midstream Energy II, LP, a Delaware limited partnership, and Laser Midstream Company, LLC, a Texas limited liability company. The Partnership paid total consideration of $113.4 million in cash and 1,407,895 (recorded value of $29.2 million) of our common units. The assets subject to the transaction include gathering systems and related compression and processing facilities in south Texas, east Texas and north Louisiana.
The purchase price was allocated to assets acquired and liabilities assumed based on their respective fair value as determined by management with the assistance of K.E. Andrews & Company, a third-party valuation specialist. The Laser acquisition was accounted for as a purchase in accordance with authoritative guidance. The purchase price allocation is set forth below.
| | | ($ in thousands) | |
Property, plant and equipment | | | 98,883 | |
Intangibles, right-of-way and contracts | | | 39,057 | |
Cash and cash equivalents | | | 1,823 | |
Accounts receivable | | | 44,136 | |
Other current assets | | | 1,713 | |
Accounts payable | | | (42,639 | ) |
Other current liabilities | | | (376 | ) |
| | | $ | 142,597 | |
The Partnership commenced recording results of operations with regard to Laser on May 1, 2007.
MacLondon Acquisition. On June 18, 2007, the Partnership acquired from MacLondon Energy, L.P. (“MacLondon”) certain mineral royalty and overriding royalty interests in which the Partnership already owned an interest as a result of the Montierra Acquisition. MacLondon Energy, L.P.’s assets were acquired for total consideration of $18.2 million, consisting of 757,065 (recorded value of $18.1 million) common units and cash of approximately $0.1 million. The Partnership commenced recording results of operations with regard to MacLondon on July 1, 2007.
EAC Acquisition. On July 31, 2007, the Partnership completed the acquisition of Escambia Asset Co., LLC and Escambia Operating Co., LLC (the “EAC Acquisition”). Upon closing, the Partnership paid total consideration of $224.6 million in cash and 689,857 (recorded value of $17.2 million) in common units, subject to adjustment. The assets subject to the EAC Acquisition include operated productive wells in Escambia County, Alabama, two associated treating facilities, one associated natural gas processing plant and related gathering systems.
The purchase price was allocated to assets acquired and liabilities assumed, based on their respective fair value as determined by management with the assistance of K.E. Andrews & Company, a third-party valuation specialist. The EAC Acquisition was accounted for as a purchase in accordance with authoritative guidance regarding business combinations. The purchase price allocation is set forth below:
| | | ($ in thousands) | |
| Oil and gas properties: | | | |
Proved properties | | $ | 210,082 | |
Plant and related assets | | | 25,246 | |
Cash and cash equivalents | | | 4,679 | |
Accounts receivable | | | 21,052 | |
Derivative contracts – fair value | | | 107 | |
Intangibles | | | 725 | |
Accounts payable | | | (11,694 | ) |
Accrued liabilities | | | (1,865 | ) |
Asset retirement obligations | | | (6,507 | ) |
| | | $ | 241,825 | |
The Partnership commenced recording results of operations with regard to EAC on August 1, 2007.
Redman Acquisition. On July 31, 2007, Eagle Rock completed the acquisition of Redman Energy Holdings, L.P. and Redman Energy Holdings II, L.P. (Natural Gas Partners VII, L.P. and Natural Gas Partners VIII, L.P. portfolio companies, respectively) and certain assets owned by NGP Income Co-Investment Opportunities Fund II, L.P. (a Natural Gas Partners affiliate (the “Redman Acquisition”). Upon closing, the Partnership paid, as consideration, a total of 4,428,334 (recorded value of $108.2 million) common units and $84.6 million in cash.
The purchase price was allocated to assets acquired and liabilities assumed based on their respective fair value as determined by management. Goodwill acquired in the acquisition was the result of deferred tax liability relating to book/tax differences created as a result of the acquisition (See Note 15) and due to the increase in the price of the Partnership’s common units from the time the acquisition was negotiated to when the acquisition was recorded. The acquisition of Redman was accounted for as a purchase in accordance with guidance related to Financial Statement of Oil and Gas Exchange Offers. Those interests not attributable to Natural Gas Partners have been recorded at their fair value. The Partnership has recorded the interest attributable to the ownership of Natural Gas Partners in Redman at their carryover basis and as a result the Partnership recorded $0.4 million of the net cash paid in excess of the carryover basis as a distribution to Natural Gas Partners for the Redman Acquisition. Those interests not attributable to Natural Gas Partners have been recorded at their fair value.
The purchase price was allocated to assets acquired and liabilities assumed based on their respective fair value as determined by management. The purchase price allocation is set forth below.
| | | ($ in thousands) |
| Oil and gas properties | | |
Proved Properties | | $ | 169,357 | |
Cash and cash equivalents | | | 12,975 | |
Accounts receivable, net | | | 5,932 | |
Prepayments | | | 573 | |
Risk management assets | | | 1,002 | |
Other assets | | | 2,077 | |
Goodwill | | | 29,527 | |
Accounts payable | | | (8,427 | ) |
Deferred tax payable | | | (16,826 | ) |
Other long-term liabilities | | | (3,384 | ) |
| | | $ | 192,806 | |
The Partnership commenced recording results of operations with regard to Redman on August 1, 2007.
One or more NGP private equity funds directly or indirectly owned a majority of the equity interests in Eagle Rock and the Redman entities. Because of the potential conflict of interest between the interests of the Company and the public unitholders of Eagle Rock, the Board of Directors authorized the Company’s Conflicts Committee to review, evaluate, and, if determined appropriate, approve the Redman Acquisition. The Conflicts Committee, consisting of independent Directors of the Company, determined that the Redman Acquisition was fair and reasonable to Eagle Rock and its public unitholders and recommended to the Board of Directors of the Company that the transaction be approved and authorized. In considering the fairness of the Redman Acquisition, the Conflicts Committee considered the valuation of the properties involved in the transaction, the valuation of the units to be offered as consideration in the transaction, and the cash flow of Redman. Based on the recommendation of the Conflicts Committee, the Board of Directors approved the transaction.
The following pro forma information for the years ended December 31, 2008 and 2007, assumes the Stanolind, Millennium, Laser, Montierra, EAC and Redman acquisitions had been acquired by Eagle Rock Energy on January 1, 2008 and 2007, respectively (unaudited):
| | | December 31, 2008 | | | December 31, 2007 |
| | | ($ in thousands, except per unit amounts) |
Revenues | | $ | 1,972,495 | | | $ | 1,148,240 | |
Costs and expenses | | | 1,820,644 | | | | 1,224,543 | |
Operating (loss) income | | | 151,851 | | | | (76,303 | ) |
Other expense, net | | | 69,125 | | | | 78,864 | |
Income tax provision | | | (2,202 | ) | | | (4,080 | ) |
Net income (loss) | | $ | 84,928 | | | $ | (151,087 | ) |
Net income (loss) per common unit | | $ | 1.15 | | | $ | (2.22 | ) |
NOTE 5. PROPERTY PLANT AND EQUIPMENT AND ASSET RETIREMENT OBLIGATIONS
Fixed assets consisted of the following:
| | | December 31, 2009 | | | December 31, 2008 | | |
| | | ($ in thousands) | |
Land | | $ | 1,559 | | | $ | 1,211 | | |
Plant | | | 242,223 | | | | 232,219 | | |
Gathering and pipeline | | | 675,474 | | | | 653,016 | | |
Equipment and machinery | | | 22,527 | | | | 18,672 | | |
Vehicles and transportation equipment | | | 4,232 | | | | 3,958 | | |
Office equipment, furniture, and fixtures | | | 1,248 | | | | 1,023 | | |
Computer equipment | | | 6,912 | | | | 4,714 | | |
Corporate | | | 126 | | | | 126 | | |
Linefill | | | 4,269 | | | | 4,269 | | |
Proved properties | | | 512,545 | | | | 515,452 | | |
Unproved properties | | | 72,174 | | | | 73,622 | | |
Construction in progress | | | 15,513 | | | | 39,498 | | |
| | | | 1,558,802 | | | | 1,547,780 | | |
| Less: accumulated depreciation, depletion and amortization | | | (282,921 | ) | | | (190,171 | ) | |
Net property plant and equipment | | $ | 1,275,881 | | | $ | 1,357,609 | | |
Depreciation expense for the years ended December 31, 2009, 2008 and 2007 was approximately $53.1 million, $44.1 million and $41.1 million, respectively. Depletion expense for the year ended December 31, 2009, 2008 and 2007 was approximately $39.8 million, $52.8 million and $21.7 million, respectively. During the year ended December 31, 2009, the Partnership recorded impairment charges related to its pipeline assets and proved properties of $12.6 million and $8.4 million, respectively. During the year ended December 31, 2008, the Partnership recorded impairment charges related to its plants and gathering and pipeline assets and proved properties of $4.3 million, $19.5 million and $108.8 million, respectively. During the year ended December 31, 2007, the Partnership recorded impairment charges of $5.7 million related to its proved properties.
Asset Retirement Obligations—The Partnership recognizes asset retirement obligations for its oil and gas working interests associated with the retirement of tangible long-lived assets that result from the acquisition, construction and development of the assets. The Partnership records the fair value of a liability for an asset retirement obligation in the period in which it is incurred and a corresponding increase in the carrying amount of the related long-lived asset. The Partnership recognizes asset retirement obligations for its midstream assets in accordance with the term “conditional asset retirement obligation,” which refers to a legal obligation to perform an asset retirement activity in which the timing and/or method of settlement are conditional upon a future event that may or may not be within the Partnership’s control. Although uncertainty about the timing and/or method of settlement may exist and may be conditional upon a future event, the obligation to perform the asset retirement activity is unconditional. Accordingly, the Partnership is required to recognize a liability for the fair value of a conditional asset retirement obligation upon initial recognition if the fair value of the liability can be reasonably estimated. As of December 31, 2009, the Partnership currently has $1.0 million restricted in an escrow account for purposes of settling associated asset retirement obligations in the State of Alabama.
A reconciliation of our liability for asset retirement obligations is as follows:
| | | 2009 | | | 2008 | | | 2007 | |
| | | ($ in thousands) | |
| Asset retirement obligations—January 1 | | $ | 19,872 | | | $ | 11,337 | | | $ | 1,819 | |
Additional liability | | | — | | | | 204 | | | | 325 | |
| Liabilities settled | | | (1,324 | ) | | | — | | | | — | |
Additional liability related to acquisitions | | | — | | | | 7,260 | | | | 8,722 | |
Accretion expense | | | 1,281 | | | | 1,071 | | | | 471 | |
Asset retirement obligations—December 31 | | $ | 19,829 | | | $ | 19,872 | | | $ | 11,337 | |
NOTE 6. INTANGIBLE ASSETS
Intangible assets consist of right-of-ways and easements and acquired customer contracts, which the Partnership amortizes over the term of the agreement or estimated useful life. Amortization expense was approximately $23.4 million, $19.9 million and $17.8 million for the years ended December 31, 2009, 2008 and 2007, respectively. Estimated aggregate amortization expense for each of the five succeeding years is as follows: 2010—$22.4 million; 2011—$11.7 million; 2012—$11.7 million; 2013—$11.7 million; and 2014 —$7.1 million. Intangible assets consisted of the following (as of December 31, 2009 and 2008):
| | | December 31, 2009 | | | December 31, 2008 | |
| | | ($ in thousands) | |
Rights-of-way and easements—at cost | | $ | 86,243 | | | $ | 85,537 | |
Less: accumulated amortization | | | (15,600 | ) | | | (11,437 | ) |
Contracts | | | 123,959 | | | | 123,409 | |
Less: accumulated amortization | | | (62,259 | ) | | | (43,303 | ) |
Net intangible assets | | $ | 132,343 | | | $ | 154,206 | |
The amortization period for our rights-of-way and easements is 20 years. The amortization period for contracts range from 5 to 20 years, and are approximately 8 years on average as of December 31, 2009. During the year ended December 31, 2009, the Partnership recorded impairment charges related to its Rights-of-way and easements of $1.1 million. During the year ended December 31, 2008, the Partnership recorded impairment charges related to its Right-of-way and easements and contracts of $3.7 million and $7.6 million, respectively. During the year ended December 31, 2007, the Partnership did not record any impairment charges related to its intangible assets.
NOTE 7. LONG-TERM DEBT
Long-term debt consisted of:
| | | December 31, 2009 | | | December 31, 2008 | |
| | | ($ in thousands) | |
| Revolving credit facility | | $ | 754,383 | | | $ | 799,383 | |
| Total debt | | | 754,383 | | | | 799,383 | |
| Less: current portion | | | — | | | | — | |
| Total long-term debt | | $ | 754,383 | | | $ | 799,383 | |
On December 13, 2007, the Partnership entered into a senior secured revolving credit facility (the “Revolving Credit Facility”) with aggregate commitments of $800 million. During the year ended December 31, 2008, the Partnership exercised $180 million of its $200 million accordion feature of the Revolving Credit Facility, which increased the total commitment to $980 million. The Revolving Credit Facility was entered into with a syndicate of commercial and investment banks, led by Wachovia Capital Markets, LLC and Bank of America Securities LLC as joint lead arrangement agents and joint book runners. The Revolving Credit Facility provides for $980 million aggregate principal amount of revolving commitments and has a maturity date of December 13, 2012. The Revolving Credit Facility provides the Partnership with the ability to potentially increase the total amount of revolving commitments by an additional $20 million to a total of $1 billion. Subsequently, as a result of Lehman Brothers’ bankruptcy filing, the amount of available commitments was reduced by the unfunded portion of Lehman Brother’s commitment in an amount of approximately $9.1 million to a total of $970.9 million and the potential increase in commitments by approximately $0.5 million to a total of approximately $19.5 million.
During the year ended December 31, 2007, the Partnership recorded a $6.2 million charge to other expense to write off unamortized debt issuance costs related to its previous credit facility. In connection with the closing of the Revolving Credit Facility, the Partnership incurred debt issuance costs of $4.3 million. During the year ended December 31, 2008, the Partnership incurred an additional $0.8 million of debt issuance costs in connection with exercising the accordion feature of the Revolving Credit Facility. During the years ended December 31, 2009, 2008 and 2007, the Partnership recorded approximately $1.1 million, $1.0 million and $1.8 million of debt issuance amortization expense, respectively. As of December 31, 2009 the unamortized amount of debt issuance cost was $3.2 million.
The Revolving Credit Facility includes a sub-limit for the issuance of standby letters of credit for a total of $200 million. At December 31, 2009, the Partnership had $0.2 million of outstanding letters of credit.
In certain instances defined in the Revolving Credit Facility, the Partnership’s outstanding debt is subject to mandatory repayments and/or is subject to a commitment reduction for asset and property sales, reductions in borrowing base and for insurance/condemnation proceeds.
The Revolving Credit Facility contains various covenants which limit the Partnership’s ability to grant liens, make certain loans and investments; make certain capital expenditures outside the Partnership’s current lines of business or certain related lines of business; make distributions other than from available cash; merge or consolidate with or into a third party; or engage in certain asset dispositions, including a sale of all or substantially all of the Partnership’s assets. Additionally, the Revolving Credit Facility limits the Partnership’s ability to incur additional indebtedness with certain exceptions and purchase money indebtedness and indebtedness related to capital or synthetic leases not to exceed 2.5% of tangible net worth.
The Revolving Credit Facility also contains covenants, which, amount other things, require the Partnership, on a consolidated basis, to maintain specified ratios or conditions as follows:
| | • | Consolidated EBITDA (as defined) to Consolidated Interest Expense (as defined) of not less than 2.5 to 1.0; |
| | • | Total Funded Indebtedness (as defined) to Adjusted Consolidated EBITDA (as defined) of not more than 5.0 to 1.0 (5.25 to 1.0 for the three quarters following a material acquisition); and |
| | • | Borrowing Base Indebtedness (as defined) not to exceed the Borrowing Base (as defined) as re-determined from time to time. |
The Partnership’s credit facility accommodates, through the use of a borrowing base for our Upstream Business and traditional cash-flow based covenants for our Midstream and Minerals Businesses, the allocation of indebtedness to either our Upstream Business (to be measured against the borrowing base) or to our Midstream and Minerals Businesses (to be measured against the cash-flow based covenant.
Scheduled maturities of long-term debt as of December 31, 2009, were as follows:
| | | Principal Amount | |
| | | ($ in thousands) | |
| 2009 | | $ | — | |
| 2010 | | | — | |
| 2011 | | | — | |
| 2012 | | | 754,383 | |
| | | $ | 754,383 | |
In April 2009, due to a regularly scheduled redetermination of the Upstream Segment’s borrowing base associated with its proved reserves, the Partnership’s borrowing base was lowered to $135 million, from $206 million, as a result of declining commodity prices, including sulfur prices. The Partnership announced in October 2009 that its existing borrowing base of $135 million under its revolving credit facility was reaffirmed by its commercial lenders in the Partnership’s regularly scheduled semi-annual borrowing base redetermination. The reaffirmation is effective as of October 1, 2009, with no additional fees or increases in interest rate spread incurred.
As of December 31, 2009, the Partnership was in compliance with the financial covenants under its revolving credit facility and has not been subject to mandatory repayments and/or a commitment reduction for asset and property sales, reductions in borrowing base and for insurance/condemnation proceeds. The Partnership’s compliance with the financial covenants under its revolving credit facility in 2009 has benefited substantially from the Adjusted EBITDA contributions of its commodity hedging portfolio. As currently structured, the Partnership’s commodity hedges will contribute less to its expected 2010 Adjusted EBITDA due to the lower strike prices on its swaps and floors on both its crude oil and natural gas hedges. The Partnership’s ability to comply with the financial covenants throughout 2010 is uncertain and will depend upon the Partnership’s ability to reduce debt, enhance its commodity hedge portfolio or otherwise increase its liquidity, or increase its Adjusted EBITDA due to a rebound in commodity prices and a related increase in drilling activity by the producers supplying its Midstream facilities’ volumes. The Partnership’s strategy to remain in compliance includes (i) the liquidity enhancements as discussed in Note 9 under Recapitalization and Related Transactions, (ii) asset sales, and/or (iii) enhancements to our hedging portfolio (including through hedge reset transactions). Based on its strategy, the Partnership believes that it will remain in compliance with its financial covenants through 2010.
Based upon the above mentioned ratios and conditions as calculated as of December 31, 2009, the Partnership has approximately $60.5 million of unused capacity under the Revolving Credit Facility at December 31, 2009 on which the Partnership pays a 0.3% commitment fee per year.
At the Partnership’s election, its outstanding indebtedness bears interest on the unpaid principal amount either at a base rate plus the applicable margin (currently 0.75% per annum based on the Partnership’s total leverage ratio and utilization of its borrowing base as part of its total indebtedness); or at the Adjusted Eurodollar Rate plus the applicable margin (currently 1.875% per annum based on the Partnership’s total leverage ratio and utilization of its borrowing base as part of its total indebtedness). At December 31, 2009, the weighted average interest rate on our outstanding debt balance was 4.77%.
Base rate interest loans are paid the last day of each March, June, September and December. Eurodollar Rate Loans are paid the last day of each interest period, representing one-, two-, three-, six-, nine- or twelve months, as selected by the Partnership. The Partnership pays a commitment fee equal to (1) the average of the daily differences between (a) the revolver commitments and (b) the sum of the aggregate principal amount of all outstanding loans times (2) 0.30% per annum, based on our current leverage ratio and borrowing base utilization. The Partnership also pays a letter of credit fee equal to (1) the applicable margin for revolving loans which are Eurodollar Rate loans times (2) the average aggregate daily maximum amount available to be drawn under all such Letters of Credit (regardless of where any conditions for drawing could then be met and determined as of the close of business on any date of determination). Additionally, the Partnership pays a fronting fee equal to 0.125% per annum, times the average aggregate daily maximum amount available to be drawn under all letters of credit.
The obligation under the Revolving Credit Facility are secured by first priority liens on substantially all for the Partnership’s assets, including a pledge of all of the capital stock of each of its subsidiaries.
NOTE 8. MEMBERS’ EQUITY
At December 31, 2009, there were 54,203,471 common units (exclusive of restricted unvested common units and common units held in escrow related to the Millennium Acquisition), 20,691,495 subordinated units (all subordinated units are owned by Holdings) and 844,551 general partner units outstanding. In addition, there were 1,371,019 restricted unvested common units outstanding.
As of December 31, 2009 and 2008, Eagle Rock Energy GP, L.P. owned 1.09% of the Partnership.
Subordinated units represent limited partner interests in the Partnership, and holders of subordinated units exercise the rights and privileges available to unitholders under the limited partnership agreement. Subordinated units, during the subordination period, will generally receive quarterly cash distributions only when the common units have received a minimum quarterly distribution of $0.3625 per unit and any outstanding arrearages on the common units have been paid. Subordinated units will convert into common units on a one-for-one basis when the subordination period ends. The subordination period will end on the first day of any quarter beginning after September 30, 2009 in respect of which, among other things, the Partnership has earned and paid at least $1.45 (the minimum quarterly distribution on an annualized basis) on each outstanding limited partner unit and general partner unit for each of the three consecutive, non-overlapping four quarter periods immediately preceding such date and any outstanding arrearages on the common units have been paid. Alternatively, the subordination period will end on the first business day after the Partnership earned and paid at least $0.5438 per quarter (150% of the minimum quarter distribution, or $2.175 on an annualized basis) on each outstanding limited partner unit and general partner unit for any four consecutive quarters ending on or after September 30, 2007 and there are no outstanding arrearages on the common units. In addition, the subordination period will end upon the removal of the Partnership’s general partner other than for cause if the units held by the Partnership’s general partner and its affiliates are not voted in favor of such removal, at which point all outstanding common unit arrearages would be extinguished. For each of the three months ended March 31, 2009, June 30, 2009, September 30, 2009 and December 31, 2009, the Partnership did not pay the full minimum quarterly distribution amount. The fourth quarter 2009 Common Unit Arrearage is $0.3375 per common unit. The Cumulative Common Unit Arrearage increased to $1.35 per common unit with the payment of the fourth quarter 2009 distribution on February 12, 2010. Both Common Unit Arrearage and Cumulative Common Unit Arrearage are terms defined in Eagle Rock Energy’s partnership agreement.
During the three months ended June 30, 2009, the Partnership recovered and cancelled 7,065 common units that were being held in an escrow account related to its acquisition of MacLondon Energy, L.P.
During the three months ended September 30, 2009, the Partnership released 849,858 common units that were previously held in an escrow account related to its acquisition of Millennium Midstream Partners, L.P. (“MMP”) to the former owners of MMP.
On May 3, 2007, the Partnership completed the private placement of 7,005,495 common units among a group of institutional investors for gross proceeds of $127.5 million. The proceeds from the private offering were used to fully fund the cash portion of the purchase price of the Laser Acquisition. The offering closed contemporaneously with the Laser Acquisition.
On July 31, 2007, the Partnership entered into a common unit purchase agreement to sell in a private placement 9,230,770 common units to third-party investors for total cash proceeds of approximately $204.0 million. The private placement closed contemporaneously with the EAC and Redman Acquisitions on July 31, 2007.
The Partnership has declared a cash distribution for each quarter since its initial public offering. The table below summarizes these distributions.
| Quarter Ended | | Distribution per Unit | | Record Date | | Payment Date |
March 31, 2007+ | | $ | 0.3625 | | May 7, 2007 | | May 15, 2007 |
June 30, 2007+ | | $ | 0.3625 | | Aug. 8, 2007 | | Aug. 14, 2007 |
| September 30, 2007 | | $ | 0.3675 | | Nov. 8, 2007 | | Nov. 14, 2007 |
| December 31, 2007 | | $ | 0.3925 | | Feb. 11, 2008 | | Feb. 14, 2008 |
| March 31, 2008 | | $ | 0.4000 | | May 9, 2008 | | May 15, 2008 |
| June 30, 2008 | | $ | 0.4100 | | Aug. 8, 2008 | | Aug. 14, 2008 |
| September 30, 2008 | | $ | 0.4100 | | Nov. 7, 2008 | | Nov. 14, 2008 |
| December 31, 2008 | | $ | 0.4100 | | Feb. 10, 2009 | | Feb. 13, 2009 |
| March 31, 2009* | | $ | 0.0250 | | May 11, 2009 | | May 15, 2009 |
| June 30, 2009* | | $ | 0.0250 | | Aug. 10, 2009 | | Aug. 14, 2009 |
| September 30, 2009* | | $ | 0.0250 | | Nov. 9, 2009 | | Nov. 13, 2009 |
| December 31, 2009* | | $ | 0.0250 | | Feb. 8, 2010 | | Feb. 12, 2010 |
| + | The distribution per unit represents distributions made only on common units. |
| * | The distribution per unit represents distributions made only on common units and general partner units. |
NOTE 9. RELATED PARTY TRANSACTIONS
On July 1, 2006, the Partnership entered into a month-to-month contract for the sale of natural gas with an affiliate of Natural Gas Partners, under which the Partnership sells a portion of its gas supply. In July 2008, the company to which the Partnership sells its natural gas was sold by the affiliate of NGP and thus ceased being a related party. The Partnership recorded revenues of $16.0 million and $35.3 million for the years ended December 31, 2008 and 2007, respectively, from the agreement, of which there was a receivable of $5.5 million outstanding at December 31, 2007.
In addition, during the years ended December 31, 2009, 2008 and 2007, the Partnership incurred of $8.8 million, $0.6 million and $1.5 million, respectively, in expenses with related parties, of which there was an outstanding accounts payable balance of $0.7 million and $0.7 million and $0.5 million, respectively, as of December 31, 2009, 2008 and 2007. During the years ended December 31, 2009 and 2008, we generated revenue from related parties of less than $0.1 million and $0.2 million, of which no amounts are outstanding as of December 31, 2009 and 2008.
Related to its investments in unconsolidated subsidiaries, during the years ended December 31, 2009, 2008 and 2007, the Partnership recorded income of $1.6 million, $4.0 million and $0.7 million, respectively, of which there was no outstanding account receivable balance as of December 31, 2009 and 2008.
During the years ended December 31, 2009 and 2008, the Partnership leased office space from Montierra and was also reimbursed by Montierra for services performed by its employees on behalf of Montierra. During the year ended December 31, 2009, the Partnership made rental payments of $0.1 million and was reimbursed $0.1 million by Montierra. During the year ended December 31, 2008, the Partnership made rental payments of $0.1 million and was reimbursed $0.2 million by Montierra. As of December 31, 2009 and 2008, we had an outstanding receivable balance of less than $0.1 million and $0.3 million, respectively, due from Montierra and an outstanding payable balance of zero and $0.7 million due to Montierra as of December 31, 2009 and 2008, respectively.
During the years ended December 31, 2009 and 2008, the Partnership incurred approximately $2.2 million and $2.1 million, respectively, for services performed by Stanolind Field Services (“SFS”), which is an entity controlled by NGP. As of December 31, 2009 and 2008, the Partnership had an outstanding payable balance due to SFS of less than $0.1million and $0.1 million, respectively.
The Partnership has entered into an Omnibus Agreement with Eagle Rock Energy G&P, LLC, Holdings and the Partnership’s general partner. The Omnibus Agreement requires the Partnership to reimburse Eagle Rock Energy G&P, LLC for the payment of certain expenses incurred on the Partnership’s behalf, including payroll, benefits, insurance and other operating expenses, and provides certain indemnification obligations.
The Partnership does not directly employ any persons to manage or operate our business. Those functions are provided by the general partner of our general partner. We reimburse the general partner of our general partner for all direct and indirect costs of these services under the Omnibus Agreement.
On April 30, 2007, the Partnership completed the acquisition of certain fee minerals, royalties, overriding royalties and non-operated working interest properties from Montierra and Co-Invest, a Natural Gas Partners portfolio company and affiliate, respectively. Montierra and Natural Gas Partners received as consideration a total of 6,458,946 Eagle Rock Energy common units and $6.0 million in cash. As part of this transaction, a 39.34% economic interest in the incentive distribution rights was conveyed from Eagle Rock Holdings, L.P. to Montierra. One or more NGP private equity funds directly or indirectly owns a majority of the equity interests in Eagle Rock Energy, Montierra and Co-Invest. Because of the potential conflict of interest between the interests of Eagle Rock Energy G&P, LLC (the “Company”) and the public unitholders of Eagle Rock Energy, the Board of Directors authorized the Company’s Conflicts Committee to review, evaluate, and, if determined appropriate, approve the Montierra Acquisition. The Conflicts Committee, consisting of independent Directors of the Company, determined that the Montierra Acquisition was fair and reasonable to Eagle Rock Energy and its public unitholders and recommended to the Board of Directors of the Company that the transaction be approved and authorized. In determining the purchase consideration for the Montierra Acquisition, the Board of Directors considered the valuation of the properties involved in the transaction, the valuation of the units to be offered as consideration in the transaction, and the cash flow of Montierra and Co-Invest, including cash receipts and royalty interests.
In connection with the closing of the Partnership’s initial public offering, on October 24, 2006, it entered into a registration rights agreement with Eagle Rock Holdings, L.P. in connection with its contribution to the Partnership of all of Eagle Rock Holdings, L.P.’s limited and general partner interests in Eagle Rock’s predecessor. In the registration rights agreement, the Partnership agreed, for the benefit of Eagle Rock Holdings, L.P., to register the common units it holds, the common units issuable upon conversion of the subordinated units that it holds and any common units or other equity securities issuable in exchange for the common units and subordinated units it holds. The registration rights agreement is still in effect and the Partnership is in compliance with all obligations of the agreement.
In connection with the closing of the Montierra Acquisition, the Partnership entered into a registration rights agreements with Montierra and Co-Invest. In the registration rights agreements, the Partnership agreed, for the benefit of Montierra and Co-Invest, to register the common units it holds, the common units issuable upon conversion of the subordinated units that it holds and any common units or other equity securities issuable in exchange for the common units and subordinated units it holds. The registration rights agreement is still in effect and the Partnership is in compliance with all obligations of the agreement.
On July 31, 2007, Eagle Rock Energy Partners, L.P. completed the acquisition of Redman Energy Holdings, L.P. and Redman Energy Holdings II, L.P. (Natural Gas Partners VII, L.P. and Natural Gas Partners VIII, L.P. portfolio companies, respectively) and certain assets owned by NGP Income Co-Investment Opportunities Fund II, L.P. (a Natural Gas Partners affiliate) (the “Redman Acquisition”). Redman sellers and NGP received as consideration a total of 4,428,334 newly-issued Eagle Rock common units and $83.8 million in cash, subject to adjustments. One or more NGP private equity funds directly or indirectly owns a majority of the equity interests in Eagle Rock and the Redman entities. Because of the potential conflict of interest between the interests of the Company and the public unitholders of Eagle Rock, the Board of Directors authorized the Company’s Conflicts Committee to review, evaluate, and, if determined appropriate, approve the Redman Acquisition. The Conflicts Committee, consisting of independent Directors of the Company, determined that the Redman Acquisition was fair and reasonable to Eagle Rock and its public unitholders and recommended to the Board of Directors of the Company that the transaction be approved and authorized. In determining the purchase consideration for the Redman Acquisition, the Conflicts Committee considered the valuation of the properties involved in the transaction, the valuation of the units to be offered as consideration in the transaction, and the cash flow of Redman. Based on the recommendation of the Conflicts Committee, the Board of Directors approved the transaction.
On April 30, 2008, the Partnership completed the acquisition of all of the outstanding capital stock of Stanolind, for an aggregate purchase price of $81.8 million. Because of the potential conflict of interest between the interests of the Company and the public unitholders of Eagle Rock, the Board of Directors authorized the Company’s Conflicts Committee to review, evaluate, and, if determined appropriate, approve the Stanolind Acquisition. The Conflicts Committee, consisting of independent Directors of the Company, determined that the Stanolind Acquisition was fair and reasonable to Eagle Rock and its public unitholders and recommended to the Board of Directors of the Company that the transaction be approved and authorized. In determining the purchase consideration for the Stanolind Acquisition, the Conflicts Committee considered the valuation of the properties involved in the transaction, the valuation of the units to be offered as consideration in the transaction, and the cash flow of Stanolind. Based on the recommendation of the Conflicts Committee, the Board of Directors approved the transaction.
As of December 31, 2009 and 2008, Eagle Rock Energy G&P, LLC had $12.9 million and $4.5 million, respectively, of outstanding checks paid on behalf of the Partnership. This amount was recorded as Due to Affiliate on the Partnership’s balance sheet in current liabilities. As the checks are drawn against Eagle Rock Energy G&P, LLC’s cash accounts, the Partnership reimburses Eagle Rock Energy G&P, LLC.
Recapitalization and Related Transactions
On December 21, 2009, the Partnership announced that it, through certain of its affiliates, had entered into definitive agreements with affiliates of NGP and Black Stone Minerals Company, L.P. (“Black Stone”) to improve its liquidity and simplify its capital structure. The definitive agreements include: (i) a Securities Purchase and Global Transaction Agreement, entered into between Eagle Rock Energy and NGP, including Eagle Rock Energy’s general partner entities controlled by NGP, and (ii) a Purchase and Sale Agreement (the “Minerals Business Sale Agreement”), entered into between Eagle Rock Energy and Black Stone for the sale of Eagle Rock Energy’s Minerals Business. The Securities Purchase and Global Transaction Agreement was amended on January 12, 2010 to allow for greater flexibility in the payment of the contemplated transaction fee to Holdings, which is controlled by NGP (the Partnership refers to the amended Securities Purchase and Global Transaction Agreement as the “Global Transaction Agreement”).
The Global Transaction Agreement and Minerals Business Sale Agreement include the following key provisions, which the Partnership refers to collectively as the “Recapitalization and Related Transactions.”
| | • | An option in favor of the Partnership, exercisable until December 31, 2012 by the issuance of 1,000,000 newly-issued common units, to capture the value of its controlling interest through (i) acquiring the Partnership’s general partner, and such general partner’s general partner, and thereby acquiring the 844,551 general partner units outstanding, and (ii) reconstituting its board of directors to allow its common unitholders to elect the majority of its directors (the "GP Acquisiton Option"); |
| | • | The sale of the Partnership’s Minerals Business to Black Stone for total consideration of $174.5 million in cash, subject to customary adjustments; |
| | • | The simplification of the Partnership’s capital structure through the contribution, and resulting cancellation, of the existing incentive distribution rights and the existing 20.7 million subordinated units currently held by Holdings; |
| | • | A rights offering in which Holdings and NGP will fully participate with respect to 9.5 million common and general partner units owned or controlled by NGP as well as with respect to common units it receives as payment of the transaction fee, if any; and |
| | • | For a period of up to five months following unitholder approval of the amended Global Transaction Agreement, NGP’s commitment to back-stop (primarily through Holdings) up to $41.6 million, at a price of $3.10 per unit, an Eagle Rock Energy equity offering to be undertaken at the sole option of the Partnership’s Conflicts Committee. |
In exchange for NGP’s and Holdings’ contributions and commitments under the Global Transaction Agreement, Eagle Rock will pay Holdings a transaction fee of $29 million in newly-issued common units valued at the greater of (i) 90% of the volume-adjusted trailing 10-day average of the trading price of Eagle Rock’s common units calculated on the 20th day prior to the date of the special meeting to obtain unitholder approval of the Global Transaction Agreement and related proposals; and (ii) $3.10 per common unit. As an alternative, the Conflicts Committee of Eagle Rock’s Board of Directors may, at its sole discretion, cause the Partnership to pay the transaction fee in cash.
Completion of the Recapitalization and Related Transactions is expected to occur in the first half of 2010, subject to customary closing conditions including approval of the Global Transaction Agreement and the transactions contemplated therein, including certain partnership agreement amendments, by a majority of the common units held by non-affiliates of NGP. The Global Transaction Agreement is conditioned upon the consummation of the transactions contemplated in the Minerals Business Sale Agreement, which is conditioned on unitholder approval of the Global Transaction Agreement and certain partnership agreement amendments.
See Note 12 related to lawsuit alleging certain claims related to the Recapitalization and Related Transactions.
See Note 19 for a discussion of an amendment to our Revolving Credit Facility related to the Recapitalization and Related Transactions.
NOTE 10. FAIR VALUE OF FINANCIAL INSTRUMENTS
Effective January 1, 2008, the Partnership adopted authoritative guidance which, among other things, requires enhanced disclosures about assets and liabilities carried at fair value.
Fair value is the price that would be received to sell an asset or paid to transfer a liability in an orderly transaction between market participants at the measurement date (exit price). The Partnership utilizes market data or assumptions that market participants would use in pricing the asset or liability, including assumptions about risk inherent in the inputs to the valuation technique. The authoritative guidance establishes a fair value hierarchy that prioritizes the inputs used to measure fair value. The hierarchy gives the highest priority to unadjusted quoted prices in active markets for identical assets or liabilities (Level 1 measurements) and the lowest priority to unobservable inputs (Level 3 measurements).
The three levels of the fair value hierarchy are as follows:
Level 1 – Quoted prices are available in active markets for identical assets and liabilities as of the reporting date. Active markets are those in which transactions for the asset or liability occur in sufficient frequency and volume to provide information on an ongoing basis.
Level 2 – Pricing inputs are other than quoted prices in active markets included in Level 1, which are either directly or indirectly observable as of the reporting date. Level 2 includes those financial instruments that are valued using models or other valuation methodologies. These models are primarily industry-standard models that consider various assumptions, including quoted forward prices for commodities, time value, volatility factors and current market and contractual prices for the underlying instruments, as well as other relevant economic measures. Substantially all of these assumptions are observable in the market place throughout the full term of the instrument, can be derived from observable data or are supported by observable levels at which transactions are executed in the marketplace.
Level 3 – Pricing inputs include significant inputs that are generally less observable from objective sources. These inputs may be used with internally developed methodologies that result in management’s best estimate of fair value.
As of December 31, 2009, the Partnership has recorded its interest rate swaps and commodity derivative instruments (see Note 11), which includes crude oil, natural gas and natural gas liquids (“NGLs”), at fair value. The Partnership has classified the inputs to measure the fair value of its interest rate swap, crude oil derivatives and natural gas derivatives as Level 2. Because the NGL market is considered to be less liquid and thinly traded, the Partnership has classified the inputs related to its NGL derivatives as Level 3. The following table discloses the fair value of the Partnership’s derivative instruments as of December 31, 2009 and 2008:
| | | As of December 31, 2009 | |
| | | Level 1 | | | Level 2 | | | Level 3 | | | Total | |
| | | ($ in thousands) | |
| Assets: | | | | | | | | | | | | |
Crude oil derivatives | | $ | — | | | $ | 3 | | | $ | — | | | $ | 3 | |
Natural gas derivatives | | | — | | | | 5,286 | | | | — | | | | 5,286 | |
Interest rate swaps | | | — | | | | 600 | | | | — | | | | 600 | |
Total | | $ | — | | | $ | 5,889 | | | $ | — | | | $ | 5,889 | |
| | | | | | | | | | | | | | | | | |
| | | | | | | | | | | | | | | | | |
| Liabilities: | | | | | | | | | | | | | | | | |
Crude oil derivatives | | $ | — | | | $ | (45,039 | ) | | $ | — | | | $ | (45,039 | ) |
Natural gas derivatives | | | — | | | | 3,475 | | | | — | | | | 3,475 | |
NGL derivatives | | | — | | | | — | | | | (14,784 | ) | | | (14,784 | ) |
Interest rate swaps | | | — | | | | (28,017 | ) | | | — | | | | (28,017 | ) |
Total | | $ | — | | | $ | (69,581 | ) | | $ | (14,784 | ) | | $ | (84,365 | ) |
| | | As of December 31, 2008 | |
| | | Level 1 | | | Level 2 | | | Level 3 | | | Total | |
| | | ($ in thousands) | |
| Assets: | | | | | | | | | | | | |
Crude oil derivatives | | $ | — | | | $ | 87,329 | | | $ | — | | | $ | 87,329 | |
Natural gas derivatives | | | — | | | | 7,875 | | | | — | | | | 7,875 | |
NGL derivatives | | | — | | | | — | | | | 14,016 | | | | 14,016 | |
Total | | $ | — | | | $ | 95,204 | | | $ | 14,016 | | | $ | 109,220 | |
| | | | | | | | | | | | | | | | | |
| | | | | | | | | | | | | | | | | |
| Liabilities: | | | | | | | | | | | | | | | | |
Interest rate swaps | | $ | — | | | $ | (39,945 | ) | | $ | — | | | $ | (39,945 | ) |
As of December 31, 2009, risk management current assets in the Consolidated Balance Sheet include investment premiums of $4.0 million.
The following table sets forth a reconciliation of changes in the fair value of the Level 3 NGL derivatives during the years ended December 31, 2009 and 2008 (in thousands):
| | | Year Ended December 31, | |
| | | 2009 | | | 2008 | |
| | | | | | | |
Net asset (liability) balance as of January 1 | | $ | 14,016 | | | $ | (52,793 | ) |
Settlements | | | 66 | | | | 16,098 | |
Total gains or losses (realized and unrealized) | | | (28,866 | ) | | | 50,711 | |
Net (liability) asset balance as of December 31 | | $ | (14,784 | ) | | $ | 14,016 | |
The Partnership values its Level 3 NGL derivatives using forward curves, volatility curves, volatility skew parameters, interest rate curves and model parameters.
The Partnership recognized a loss of $15.2 million in the year ended December 31, 2009 that are attributable to the change in unrealized gains or losses related to those assets and liabilities still held at December 31, 2009 which are included in the unrealized commodity risk management gains (losses). The Partnership recognized a gain of $50.0 million in the year ended December 31, 2008 that are attributable to the change in unrealized gains or losses related to those assets and liabilities still held at December 31, 2008 which are included in the unrealized commodity risk management gains (losses).
Realized and unrealized losses related to the interest rate derivatives are recorded as part of interest rate risk management gains and losses in the Consolidated Statements of Operations. Realized and unrealized gains and losses and premium amortization related to the Partnership’s commodity derivatives are recorded as a component of revenue in the Consolidated Statements of Operations.
The following table discloses the fair value of the Partnership’s assets measured at fair value on a nonrecurring basis for the year ended December 31, 2009 (in thousands):
| | | December 31, 2009 | | | Level 1 | | | Level 2 | | | Level 3 | | | Total Losses | |
Impaired proved properties | | $ | 12,836 | | | $ | — | | | $ | — | | | $ | 12,836 | | | $ | 8,388 | |
Pipeline assets | | $ | 7,032 | | | $ | — | | | $ | — | | | $ | 7,032 | | | $ | 12,603 | |
Rights-of-way | | $ | 720 | | | $ | — | | | $ | — | | | $ | 720 | | | $ | 1,071 | |
In connection with the preparation of these financial statements for the year ended December 31, 2009, the Partnership wrote down proved properties with a carrying value of $21.2 million to their fair value of $12.8 million, resulting in an impairment charge of $8.4 million being included in earnings for the year. This impairment charge related specifically to a $8.1 million charge in the Upstream Segment and an additional $0.3 million charge in the Minerals Segment. The Partnership also wrote down pipeline assets with a carrying value of $19.6 million to their fair value of $7.0 million, resulting in an impairment charge of $12.6 million and rights-of way with a carrying value of $1.8 million to their fair value of $0.7 million, resulting in an impairment charge of $1.1 million being included in earnings for year. These impairment charges related specifically to the Midstream Segment. The Partnership calculated the fair value of the impaired proved properties using its proved reserves, estimated forward prices and an estimated weighted average cost of capital. The Partnership calculated the fair value of the pipeline assets and rights-of-way using estimated forward prices, expected drilling activity and an estimated weighted average cost of capital.
The carrying amount of cash equivalents is believed to approximate their fair values because of the short maturities of these instruments.
The Partnership believes that the fair value of its Revolving Credit Facility does not approximate its carrying value as of December 31, 2009 because the applicable floating rate margin on the Revolving Credit Facility was a below-market rate. The fair value of the Revolving Credit Facility has been estimated based on similar transactions that occurred during the twelve months ended December 31, 2009 and the first two months of 2010. The Partnership estimates the fair value of the borrowings under its Revolving Credit Facility as of December 31, 2009 was $713.2 million versus a carrying value of $754.4 million.
NOTE 11. RISK MANAGEMENT ACTIVITIES
To mitigate its interest rate risk, the Partnership entered into various interest rate swaps. These swaps convert the variable-rate term loan into a fixed-rate obligation. The purpose of entering into these swaps is to eliminate interest rate variability by converting LIBOR-based variable-rate payments to fixed-rate payments. Amounts received or paid under these swaps were recorded as reductions or increases in interest expense.
On March 30, 2009, the Partnership amended all of its existing interest rate swaps to change the interest rate the Partnership received from three month LIBOR to one month LIBOR through January 9, 2011. During this time period, the fixed rate to be paid by the Partnership was reduced, on average, by 20 basis points. After January 9, 2011, the interest rate to be received by the Partnership will change back to three month LIBOR and the fixed rate the Partnership pays will revert back to the original rate through the end of swap maturities in 2012.
The table below summarizes the terms, amounts received or paid and the fair values of the various interest rate swaps:
| Effective Date | | Expiration Date | | Notional Amount | | | Fixed Rate (a) | |
| 12/31/2008 | | 12/31/2012 | | $ | 150,000,000 | | | | 2.360% / 2.560% | |
| 09/30/2008 | | 12/31/2012 | | | 150,000,000 | | | | 4.105% / 4.295% | |
| 10/03/2008 | | 12/31/2012 | | | 300,000,000 | | | | 3.895% / 4.095% | |
| (a) | First amount is the rate the Partnership pays through January 9, 2011 and the second amount is the interest rate the Partnership pays from January 10, 2011 through December 31, 2012. |
Our interest rate derivative counterparties include Wells Fargo Bank N.A. / Wachovia Bank N.A and The Royal Bank of Scotland plc.
Commodity Derivative Instruments
The prices of crude oil, natural gas and NGLs are subject to fluctuations in response to changes in supply, demand, market uncertainty and a variety of additional factors which are beyond the Partnership’s control. These risks can cause significant changes in the Partnership’s cash flows and affect its ability to achieve its distribution objective and comply with the covenants of its revolving credit facility. In order to manage the risks associated with the future prices of crude oil, natural gas and NGLs, the Partnership engages in non-speculative risk management activities that take the form of commodity derivative instruments. The Partnership has determined that it is necessary to hedge a substantial portion of its expected production in order to meaningfully reduce its future cash flow volatility. The Partnership generally limits its hedging levels to 80% of expected future production. While hedging at this level of production does not eliminate all of the volatility in the Partnership’s cash flows, it allows the Partnership to mitigate the risk of situations where a modest loss of production would put it in an over-hedged position. The Partnership may hedge for periods of time above the 80% of expected future production levels where it deems it prudent to reduce extreme future price volatility. However, hedging to that level requires approval of the Board of Directors, which the Partnership has obtained for its 2009 and 2010 hedging activity. At times, the Partnership’s strategy may involve entering into hedges with strike prices above current future prices or resetting existing hedges to higher price levels in order to meet its cash flow objectives or to stay in compliance with its revolving credit facility. In addition, the Partnership may also terminate or unwind hedges or portions of hedges when the expected future volumes do not support the level of hedges. Expected future production for its Upstream and Minerals Businesses is derived from the proved reserves, adjusted for price-dependent expenses and revenue deductions. For the Midstream Business, expected future production is based on the expected production from wells currently flowing to the Partnership’s processing plants, plus additional volumes the Partnership expects to receive from future drilling activity by its producer customer base. The Partnership’s expectations for its Midstream Business volumes associated with future drilling are based on information it receives from its producer customer base and historical observations. The Partnership applies the appropriate contract terms to these projections to determine its expected future equity share of the commodities.
The Partnership uses put options, costless collars and fixed-price swaps to achieve its hedging objectives, and often hedges its expected future volumes of one commodity with derivatives of the same commodity. In some cases, however, the Partnership believes it is better to hedge future changes in the price of one commodity with a derivative of another commodity, which it refers to as “cross-commodity” hedging. The Partnership will often hedge the changes in future NGL prices (propane and heavier) using crude oil hedges because NGL prices have been highly correlated to crude oil prices and hedging NGLs directly is usually less attractive due to the relative illiquidity in the NGL forward market. The Partnership will also use natural gas hedges to hedge a portion of its expected future ethane production because forward prices for ethane are often heavily discounted from its current prices. Also, natural gas prices provide support for ethane prices because in many processing plants ethane can be recombined with the residue gas stream and sold as natural gas. When the Partnership uses cross-commodity hedging, it will convert the expected volumes of the underlying commodity to equivalent volumes of the hedged commodity. In the case of NGLs hedged with crude oil derivatives, these conversions are based on the linear regression of the prices of the two commodities observed during the previous 36 months and management’s judgment regarding future price relationships of the commodities. In the case where ethane is hedged with natural gas derivatives, the conversion is based on the thermal content of ethane.
The Partnership has a risk management policy which allows management to execute crude oil, natural gas and NGL hedging instruments in order to reduce exposure to substantial adverse changes in the prices of these commodities. The Partnership continually monitors and ensures compliance with this risk management policy through senior level executives in our operations, finance and legal departments.
The Partnership has not designated any of its commodity derivative instruments as hedges and therefore is marking these derivative contracts to fair value. Changes in fair values of the commodity derivative instruments are recorded as an adjustment to the mark-to-market gains (losses) on risk management transactions within revenue.
Our commodity derivative counterparties include BNP Paribas, Wachovia Bank N.A, Comerica Bank, Barclays Bank PLC, Bank of Nova Scotia, The Royal Bank of Scotland plc, Bank of America N.A., J Aron and Company (an affiliate of Goldman Sachs), BBVA Compass Bank and Credit Suisse Energy LLC (an affiliate of Credit Suisse Group AG).
On January 8, 2009, the Partnership executed a series of hedging transactions that involved the unwinding of a portion of existing “in-the-money” 2011 and 2012 WTI crude oil swaps and collars, and the unwinding of two “in-the-money” 2009 WTI crude oil collars. With these transactions, and an additional $13.9 million of cash, the Partnership purchased a 2009 WTI crude oil swap on 60,000 barrels per month beginning January 1, 2009 at an “in-the-money” level of $97 per barrel. Both the unwound hedges and new hedges relate to expected volumes in the Partnership’s Midstream and Minerals Segments.
On November 2, 2009, the Partnership reset a 2010 WTI crude oil swap, from $53.55 to $95.00, the swap price for 45,000 barrels a month for the months of January, February and March 2010, for which the Partnership paid the counterparty $5.7 million.
On December 17, 2009, the Partnership entered into a series of hedging transactions to unwind existing contracts. The Partnership unwound three “out-of-the-money” 2010 WTI crude oil collars; (i) 5,000 barrels a month with a floor of $50.00 and a cap of $68.00, (ii) 15,000 barrels a month with a floor of $50.00 and a cap of $67.50 and (iii) 15,000 barrels a month with a cap of $50.00 and a cap of $68.30. In addition, it unwound 7,000 barrels a month of a 10,000 barrels a month “in the money” swap with a price of $78.35. For these transactions the Partnership paid $5.6 million. The Partnership was using these WTI crude oil derivatives to hedge against changes in NGL prices. To continue hedging these NGL volumes, the Partnership then entered into the following derivative transactions for the 2010 calendar year on December 17, 2009: a 1,478,400 gallon per month OPIS propane swap at $1.091 per gallon, a 348,600 gallon per month OPIS iso-butane swap at $1.404 per gallon, a 705,600 gallon per month OPIS normal butane swap at $1.374 per gallon and a 184,800 gallon per month OPIS natural gasoline swap at $1.646 per gallon.
In addition, during the year ended December 31, 2009, the Partnership also entered into the following derivative transactions for the 2010 calendar year: a 125,000 MMBtu per month Henry Hub natural gas swap at $6.65 per MMBtu on January 19, 2009, a 170,000 MMBtu per month Henry Hub natural gas swap at $6.14 per MMBtu on February 17, 2009, a 45,000 barrel per month WTI crude oil swap at $53.55 per barrel on February 17, 2009 and a 40,000 barrel per month WTI crude oil swap at $51.40 per barrel on February 19, 2009.
The following table, as of December 31, 2009, sets forth certain information regarding our commodity derivatives that will mature during the year ended December 31, 2010:
| | | | | | | | | | | | | |
| Underlying | | Period | | Notional Volumes (units) | | Type | | Floor Strike Price ($/unit) | | | Cap Strike Price ($/unit) | |
| | | | | | | | | | | | | |
| Natural Gas: | | | | | | | | | | | | |
| NYMEX Henry Hub | | Jan-Dec 2010 | | 1,320,000 mmbtu | | Costless Collar | | $ | 7.70 | | | $ | 9.10 | |
| NYMEX Henry Hub | | Jan-Dec 2010 | | 1,500,000 mmbtu | | Swap | | | 6.65 | | | | | |
| NYMEX Henry Hub | | Jan-Dec 2010 | | 2,040,000 mmbtu | | Swap | | | 6.14 | | | | | |
| Crude Oil: | | | | | | | | | | | | | | |
| NYMEX WTI | | Jan-Dec 2010 | | 60,000 bbls | | Costless Collar | | | 50.00 | | | | 67.50 | |
| NYMEX WTI | | Jan-Dec 2010 | | 108,000 bbls | | Costless Collar | | | 90.00 | | | | 99.80 | |
| NYMEX WTI | | Jan-Dec 2010 | | 60,000 bbls | | Put | | | 100.00 | | | | | |
| NYMEX WTI | | Jan-Dec 2010 | | 72,000 bbls | | Put | | | 90.00 | | | | | |
| NYMEX WTI | | Jan-Mar 2010 | | 135,000 bbls | | Swap | | | 95.00 | | | | | |
| NYMEX WTI | | Jan-Dec 2010 | | 36,000 bbls | | Swap | | | 78.35 | | | | | |
| NYMEX WTI | | Jan-Dec 2010 | | 300,000 bbls | | Swap | | | 70.00 | | | | | |
| NYMEX WTI | | Jan-Dec 2010 | | 480,000 bbls | | Swap | | | 51.40 | | | | | |
| NYMEX WTI | | Apr-Dec 2010 | | 405,000 bbls | | Swap | | | 53.55 | | | | | |
| Natural Gas Liquids: | | | | | | | | | | | | | | |
| OPIS Ethane Mt Belv non TET | | Jan-Dec 2010 | | 4,536,000 gallons | | Costless Collar | | | 0.43 | | | | 0.53 | |
| OPIS Ethane Mt Belv non TET | | Jan-Dec 2010 | | 4,536,000 gallons | | Swap | | | 0.58 | | | | | |
| OPIS IsoButane Mt Belv non TET | | Jan-Dec 2010 | | 2,520,000 gallons | | Costless Collar | | | 0.82 | | | | 1.02 | |
| OPIS IsoButane Mt Belv non TET | | Jan-Dec 2010 | | 4,183,200 gallons | | Swap | | | 1.4045 | | | | | |
| OPIS NButane Mt Belv non TET | | Jan-Dec 2010 | | 5,544,000 gallons | | Costless Collar | | | 0.82 | | | | 1.02 | |
| OPIS NButane Mt Belv non TET | | Jan-Dec 2010 | | 8,467,200 gallons | | Swap | | | 1.3745 | | | | | |
| OPIS Propane Mt Belv non TET | | Jan-Dec 2010 | | 5,040,000 gallons | | Costless Collar | | | 0.705 | | | | 0.81 | |
| OPIS Propane Mt Belv non TET | | Jan-Dec 2010 | | 5,040,000 gallons | | Swap | | | 0.755 | | | | | |
| OPIS Propane Mt Belv non TET | | Jan-Dec 2010 | | 17,740,800 gallons | | Swap | | | 1.0915 | | | | | |
| OPIS Natural Gasoline Mt Belv non TET | | Jan-Dec 2010 | | 2,217,600 gallons | | Swap | | | 1.6562 | | | | | |
During the year ended December 31, 2009, the Partnership entered into the following derivative transactions for its 2011 calendar year: a 30,000 barrel per month NYMEX WTI swap at $65.60 per barrel on March 31, 2009, a 10,000 barrel per month NYMEX WTI swap at $65.10 per barrel on April 1, 2009, a 20,000 barrel per month NYMEX WTI swap at $75.00 per barrel on June 1, 2009, a 20,000 barrel per month NYMEX WTI swap at $80.05 per barrel on June 9, 2009, a 60,000 MMBtu per month Henry Hub swap at $7.085 per MMBtu on June 9, 2009, a 190,000 MMBtu per month Henry Hub swap at $6.57 per MMBtu on July 30, 2009 and into a 30,000 barrel per month WTI crude oil costless collar with a floor of $80.00 and a cap of $92.40 October 22, 2009.
The following table, as of December 31, 2009, sets forth certain information regarding our commodity derivatives that will mature during the year ended December 31, 2011:
| Underlying | | Period | | Notional Volumes (units) | | Type | | Floor Strike Price ($/unit) | | | Cap Strike Price ($/unit) | |
| | | | | | | | | | | | | |
| Natural Gas: | | | | | | | | | | | | |
| NYMEX Henry Hub | | Jan-Dec 2011 | | 1,200,000 mmbtu | | Costless Collar | | $ | 7.50 | | | $ | 8.85 | |
| NYMEX Henry Hub | | Jan-Dec 2011 | | 720,000 mmbtu | | Swap | | | 7.085 | | | | | |
| NYMEX Henry Hub | | Jan-Dec 2011 | | 2,280,000 mmbtu | | Swap | | | 6.14 | | | | | |
| Crude Oil: | | | | | | | | | | | | | | |
NYMEX WTI(1) | | Jan-Dec 2011 | | 139,152 bbls | | Costless Collar | | | 75.00 | | | | 85.70 | |
| NYMEX WTI | | Jan-Dec 2011 | | 360,000 bbls | | Costless Collar | | | 80.00 | | | | 92.40 | |
NYMEX WTI(2) | | Jan-Dec 2011 | | 125,256 bbls | | Swap | | | 80.00 | | | | | |
| NYMEX WTI | | Jan-Dec 2011 | | 120,000 bbls | | Swap | | | 65.10 | | | | | |
| NYMEX WTI | | Jan-Dec 2011 | | 240,000 bbls | | Swap | | | 75.00 | | | | | |
| NYMEX WTI | | Jan-Dec 2011 | | 240,000 bbls | | Swap | | | 80.05 | | | | | |
| NYMEX WTI | | Jan-Dec 2011 | | 360,000 bbls | | Swap | | | 65.60 | | | | | |
| (1) | 460,848 barrels of this costless collar were “unwound” as part of the January 8, 2009 hedge transactions. |
| (2) | 414,744 barrels of this swap were “unwound” as part of the January 8, 2009 hedge transactions. |
During the year ended December 31, 2009, the Partnership entered into the following derivative transactions for its 2012 calendar year: a 20,000 barrel per month NYMEX WTI swap at $68.30 per barrel on April 1, 2009, a 20,000 barrel per month NYMEX WTI swap at $76.50 per barrel on June 1, 2009, a 20,000 barrel per month NYMEX WTI swap at $82.02 per barrel on June 9, 2009 and a 260,000 MMBtu per month Henry Hub swap at $6.77 per MMBtu on July 30, 2009 and a 30,000 barrel per month WTI crude oil costless collar with a floor of $80.00 and a cap of $98.50 on October 22, 2009.
The following table, as of December 31, 2009, sets forth certain information regarding our commodity derivatives that will mature during the year ended December 31, 2012:
| | | | | | | | | | | | | |
| Underlying | | Period | | Notional Volumes (units) | | Type | | Floor Strike Price ($/unit) | | | Cap Strike Price ($/unit) | |
| | | | | | | | | | | | | |
| Natural Gas: | | | | | | | | | | | | |
| NYMEX Henry Hub | | Jan-Dec 2012 | | 1,080,000 mmbtu | | Costless Collar | | $ | 7.35 | | | $ | 8.65 | |
NYMEX Henry Hub | | Jan-Dec 2012 | | 3,120,000 mmbtu | | Swap | | | 6.77 | | | | | |
| Crude Oil: | | | | | | | | | | | | | | |
NYMEX WTI(1) | | Jan-Dec 2012 | | 135,576 bbls | | Costless Collar | | | 75.30 | | | | 86.30 | |
NYMEX WTI | | Jan-Dec 2012 | | 360,000 bbls | | Costless Collar | | | 80.00 | | | | 98.50 | |
NYMEX WTI(2) | | Jan-Dec 2012 | | 108,468 bbls | | Swap | | | 80.30 | | | | | |
NYMEX WTI | | Jan-Dec 2012 | | 240,000 bbls | | Swap | | | 68.30 | | | | | |
NYMEX WTI | | Jan-Dec 2012 | | 240,000 bbls | | Swap | | | 76.50 | | | | | |
NYMEX WTI | | Jan-Dec 2012 | | 240,000 bbls | | Swap | | | 82.02 | | | | | |
| (1) | 464,424 barrels of this costless collar were “unwound” as part of the January 8, 2009 hedge transactions. |
| (2) | 371,532 barrels of this swap were “unwound” as part of the January 8, 2009 hedge transactions. |
On February 16, 2010, the Partnership entered into a 12,000 barrels per month WTI costless collar with a floor strike price at $75.00 per barrel and a cap strike price of $89.85 per barrel for its 2011 calendar year. On February 17, 2010, the Partnership entered into a 16,000 barrels per month NYMEX WTI costless collar with a floor strike price at $75.00 per barrel and a cap strike price of $94.75 per barrel for its 2012 calendar year.
Fair Value of Interest Rate and Commodity Derivatives
Fair values of interest rate and commodity derivative instruments not designated as hedging instruments in the consolidated balance sheet as of December 31, 2009 and 2008:
| | Derivative Assets | | Derivative Liabilities | |
| | 2009 | | 2008 | | 2009 | | 2008 | |
| | Balance Sheet Location | | Fair Value | | Balance Sheet Location | | Fair Value | | Balance Sheet Location | | Fair Value | | Balance Sheet Location | | Fair Value | |
| | ($ in thousands) | |
Interest rate derivatives – assets | Long-term assets | | $ | 600 | | | | $ | — | | | | $ | — | | | | $ | — | |
Interest rate derivatives – liabilities | | | | — | | | | | — | | Current liabilities | | | (16,988 | ) | Current liabilities | | | (13,763 | ) |
Interest rate derivatives – liabilities | | | | — | | | | | — | | Long-term liabilities | | | (11,029 | ) | Long-term liabilities | | | (26,182 | ) |
Commodity derivatives – assets | Current assets | | | 3,494 | | Current assets | | | 77,603 | | Current liabilities | | | 9,842 | | | | | — | |
Commodity derivatives – assets | Long-term assets | | | 2,830 | | Long-term assets | | | 34,088 | | Long-term liabilities | | | 1,684 | | | | | — | |
Commodity derivatives – liabilities | Current assets | | | (1,015 | ) | Current assets | | | (834 | ) | Current liabilities | | | (44,504 | ) | | | | — | |
Commodity derivatives – liabilities | Long-term assets | | | (20 | ) | Long-term assets | | | (1,637 | ) | Long-term liabilities | | | (23,370 | ) | | | | — | |
Total derivatives | | | $ | 5,889 | | | | $ | 109,220 | | | | $ | (84,365 | ) | | | $ | (39,945 | ) |
The following table sets forth the location of gains and losses for derivatives not designated as hedging instruments within the Partnership’s Consolidated Statement of Operations ($ in thousands):
| | | | Amount of Gain (Loss) recognized in Income on Derivatives | |
| | | | 2009 | | | 2008 | | | 2007 | |
| | | | | | | | | | | |
| Interest rate derivatives | Interest rate risk management losses | | $ | (6,347 | ) | | $ | (32,931 | ) | | $ | (11,988 | ) |
| Commodity derivatives | Commodity risk management (losses) gains | | | (106,290 | ) | | | 161,765 | | | | (133,834 | ) |
| Total | | | $ | (112,637 | ) | | $ | 128,834 | | | $ | (145,822 | ) |
The Partnership’s hedge counterparties are participants in its credit agreement, and the collateral for the outstanding borrowings under its credit agreement is used as collateral for the Partnership’s hedges. The Partnership does not have rights to collateral from its counterparties, nor does it have rights of offset against borrowings under its credit agreement.
NOTE 12. COMMITMENTS AND CONTINGENT LIABILITIES
Litigation—The Partnership is subject to several lawsuits which arise from time to time in the ordinary course of business, such as the interpretation and application of contractual terms related to the calculation of payment for liquids and natural gas proceeds. The Partnership has accruals of approximately $0.1 million as of December 31, 2009 and 2008 related to these matters. The Partnership has been indemnified up to a certain dollar amount for two of these lawsuits. For the indemnified lawsuits, the Partnership has not established any accruals as the likelihood of these suits being successful against them is considered remote. If there ultimately is a finding against the Partnership in the indemnified cases, the Partnership would expect to make a claim against the indemnification up to limits of the indemnification. These matters are not expected to have a material adverse effect on our financial position, results of operations or cash flows.
On February 9, 2010 a lawsuit, alleging certain claims related to the Recapitalization and Related Transactions (see Note 9), was filed on behalf of one of the Partnership’s public unitholders in the Court of Chancery of the State of Delaware naming the Partnership, its general partner, certain affiliates of its general partner, including the general partner of its general partner, and each member of the Partnership's Board of Directors as defendants. The complaint alleges a breach by defendants of their fiduciary duties to the Partnership and the public unitholders and seeks to enjoin the Recapitalization and Related Transactions. The Partnership believes the allegations claimed in the lawsuit are without merit.
Insurance—The Partnership covers its operations and assets with insurance which management believes is consistent with that in force for other companies engaged in similar commercial operations with similar type properties. This insurance includes: (1) commercial general liability insurance covering liabilities to third parties for bodily injury, property damage and pollution arising out of Eagle Rock Energy operations; (2) workers’ compensation liability coverage for employees to required statutory limits; (3) automobile liability insurance covering liability to third parties for bodily injury and property damage arising out of the operation of all owned, hired and non-owned vehicles by our employees on company business; (4) property insurance covering the replacement cost of all owned real and personal property, including coverage for losses due to boiler and machinery breakdown, earthquake, flood and consequent business interruption/extra expense; (5) control of well/operator’s extra expense insurance for operated and non operated wells in the Upstream Segment; and (6) corporate liability insurance including coverage for Directors and Officers and Employment Practices liabilities. In addition, the Partnership maintains excess liability insurance providing limits in excess of the established primary limits for commercial general liability and automobile liability insurance.
All coverages are subject to industry accepted policy terms, conditions, limits and deductibles comparable to that obtained by other energy companies with similar operations. The cost of insurance for the energy industry continued to fluctuate over the past year, reflecting the changing conditions in the insurance markets.
Regulatory Compliance—In the ordinary course of business, the Partnership is subject to various laws and regulations. In the opinion of management, the Partnership is in material compliance with existing laws and regulations.
Environmental—The operation of pipelines, plants and other facilities for gathering, transporting, processing, treating, or storing natural gas, NGLs and other products is subject to stringent and complex laws and regulations pertaining to health, safety and the environment. As an owner or operator of these facilities, the Partnership must comply with United States laws and regulations at the federal, state and local levels that relate to air and water quality, hazardous and solid waste management and disposal and other environmental matters. The cost of planning, designing, constructing and operating pipelines, plants, and other facilities must incorporate compliance with environmental laws and regulations and safety standards. Failure to comply with these laws and regulations may trigger a variety of administrative, civil and potentially criminal enforcement measures, including citizen suits, which can include the assessment of monetary penalties, the imposition of remedial requirements and the issuance of injunctions or restrictions on operation. Management believes that, based on currently known information, compliance with these laws and regulations will not have a material adverse effect on the Partnership’s combined results of operations, financial position or cash flows. At December 31, 2009 and 2008, the Partnership had accrued approximately $4.4 million and $8.6 million, respectively, for environmental matters.
The Partnership has voluntarily undertaken a self-audit of its compliance with air quality standards, including permitting in the Texas Panhandle Segment as well as a majority of its other Midstream Business locations and some of its Upstream Business locations in Texas. This audit has been performed pursuant to the Texas Environmental, Health and Safety Audit Privilege Act, as amended. The Partnership has completed the disclosures to the Texas Commission on Environmental Quality (“TCEQ”), and the Partnership is addressing in due course the deficiencies that it disclosed therein. The Partnership does not foresee at this time any impediment to the timely corrective efforts identified as a result of these audits.
Since January 1, 2009, the Partnership received additional Notices of Enforcement (“NOEs”) and Notices of Violation (“NOVs”) from the TCEQ related to air compliance matters. The Partnership expects to receive additional NOEs or NOVs from the TCEQ from time to time throughout 2010. Though the TCEQ has the discretion to adjust penalties and settlements upwards based on a compliance history containing multiple, successive NOEs, the Partnership does not expect that the resolution of any existing NOE or any future similar NOE will vary significantly from the administrative penalties and agreed settlements experienced by it to date.
Retained Revenue Interest—Certain assets of the Partnership’s Upstream Segment are subject to retained revenue interests. These interests were established under purchase and sale agreements that were executed by the Partnership’s predecessors in title. The terms of these agreements entitle the owners of the retained revenue interests to a portion of the revenues received from the sale of the hydrocarbons above specified base oil and natural gas prices. These retained revenue interests do not represent a real property interest in the hydrocarbons. The Partnership’s reported revenues are reduced to account for the retained revenue interests on a monthly basis.
The retained revenue interests affect the Partnership’s interest at the Big Escambia Creek, Flomaton and Fanny Church fields in Escambia County, Alabama. With respect to the Partnership’s Flomaton and Fanny Church fields, the Partnership is currently making payments in satisfaction of the retained revenue interests, and it expects these payments to continue through possibly 2010. With respect to the Partnership’s Big Escambia Creek field, these payments are expected to begin in 2010 and continue through the end of 2019.
Other Commitments—The Partnership utilizes assets under operating leases for its corporate office, certain rights-of way and facilities locations, vehicles and in several areas of its operation. Rental expense, including leases with no continuing commitment, amounted to approximately $8.9 million, $5.8 million, and $3.6 million for the years ended December 31, 2009, 2008 and 2007, respectively. Rental expense for leases with escalation clauses is recognized on a straight-line basis over the initial lease term. At December 31, 2009, commitments under long-term non-cancelable operating leases for the next five years are as follows: 2010—$3.5 million; 2011—$3.1 million; 2012—$2.7 million; 2013—$0.9 million and 2014—$0.7 million.
NOTE 13. SEGMENTS
Based on the Partnership’s approach to managing its assets, the Partnership believes its operations consist of four geographic segments in its Midstream Business, one upstream segment that is its Upstream Business, one minerals segment that is its Minerals Business and one functional (corporate) segment:
| | (i) | Midstream—Texas Panhandle Segment: |
gathering, compressing, processing and treating natural gas and marketing of natural gas, NGLs and condensate in the Texas Panhandle;
| | (ii) | Midstream—South Texas Segment: |
gathering, compressing, processing and treating natural gas and marketing of natural gas, NGLs and condensate in South Texas and West Texas;
| | (iii) | Midstream—East Texas/Louisiana Segment: |
gathering, compressing, processing, treating and transporting natural gas and marketing of natural gas, NGLs and condensate and related NGL transportation in East Texas and Louisiana;
| | (iv) | Midstream—Gulf of Mexico Segment: |
gathering and processing of natural gas and fractionating, transporting and marketing of NGLs in South Louisiana, Gulf of Mexico and inland waters of Texas;
crude oil, natural gas and sulfur production from operated and non-operated wells;
fee minerals and royalties, lease bonus and rental income either through direct ownership or through investment in other partnerships; and
risk management and other corporate activities such as general and administrative expenses.
The Partnership’s chief operating decision-maker (“CODM”) currently reviews its operations using these segments. The CODM evaluates segment performance based on segment operating income or loss from continuing operations. Summarized financial information concerning the Partnership’s reportable segments is shown in the following table:
Midstream Business Year Ended December 31, 2009 | | Texas Panhandle Segment | | | South Texas Segment | | | East Texas / Louisiana Segment | | | Gulf of Mexico | | | Total Midstream Business | |
| ($ in thousands) | | | | | | | | | | | | | | | |
Sales to external customers | | $ | 293,952 | | | $ | 100,302 | | | $ | 209,518 | | | $ | 33,641 | | | $ | 637,413 | |
Cost of natural gas and natural gas liquids | | | 206,985 | | | | 91,916 | | | | 162,957 | | | | 26,372 | | | | 488,230 | |
Operating costs and other expenses | | | 31,873 | | | | 3,661 | | | | 17,985 | | | | 1,907 | | | | 55,426 | |
Depreciation, depletion, amortization and impairment | | | 46,085 | | | | 13,057 | | | | 23,129 | | | | 6,576 | | | | 88,847 | |
| Operating income (loss) from continuing operations | | $ | 9,009 | | | $ | (8,332 | ) | | $ | 5,447 | | | $ | (1,214 | ) | | $ | 4,910 | |
| | | | | | | | | | | | | | | | | | | | | |
Capital Expenditures | | $ | 7,293 | | | $ | 69 | | | $ | 18,188 | | | $ | 358 | | | $ | 25,908 | |
Segment Assets | | $ | 539,899 | | | $ | 60,414 | | | $ | 318,750 | | | $ | 87,780 | | | $ | 1,006,843 | |
Total Segments Year Ended December 31, 2009 | | Total Midstream Business | | | Upstream Segment | | | Minerals Segment | | | Corporate Segment | | Total Segments | |
| ($ in thousands) | | | | | | | | | | | | | | | |
Sales to external customers | | $ | 637,413 | | | $ | 63,633 | | | $ | 15,708 | | | $ | (106,290 | )(a) | $ | 610,464 | |
Cost of natural gas and natural gas liquids | | | 488,230 | | | | — | | | | — | | | | — | | | 488,230 | |
Operating costs and other (income) expenses | | | 55,426 | | | | 24,984 | (b) | | | 1,281 | | | | 46,188 | | | 127,879 | |
Depreciation, depletion, amortization and impairment | | | 88,847 | | | | 42,123 | | | | 6,281 | | | | 1,073 | | | 138,324 | |
| Operating income (loss) from continuing operations operations | | $ | 4,910 | | | $ | (3,474 | ) | | $ | 8,146 | | | $ | (153,551 | ) | $ | (143,969 | ) |
| | | | | | | | | | | | | | | | | | | | |
Capital Expenditures | | $ | 25,908 | | | $ | 8,437 | | | $ | — | | | $ | 2,022 | | $ | 36,367 | |
Segment Assets | | $ | 1,006,843 | | | $ | 363,667 | | | $ | 135,103 | | | $ | 28,715 | | $ | 1,534,328 | |
Midstream Business Year Ended December 31, 2008 | | Texas Panhandle Segment | | | South Texas Segment | | | East Texas / Louisiana Segment | | | Gulf of Mexico | | | Total Midstream Business | |
| ($ in thousands) | | | | | | | | | | | | | | | |
Sales to external customers | | $ | 603,066 | | | $ | 173,716 | | | $ | 322,040 | | | $ | 1,655 | | | $ | 1,100,477 | |
Cost of natural gas and natural gas liquids | | | 459,064 | | | | 161,963 | | | | 269,030 | | | | 1,376 | | | | 891,433 | |
Operating costs and other expenses | | | 34,269 | | | | 2,924 | | | | 16,569 | | | | 605 | | | | 54,367 | |
Depreciation, depletion, amortization and impairment | | | 43,688 | | | | 12,533 | | | | 40,553 | | | | 1,521 | | | | 98,295 | |
| Operating income (loss) from continuing operations | | $ | 66,045 | | | $ | (3,704 | ) | | $ | (4,112 | ) | | $ | (1,847 | ) | | $ | 56,382 | |
| | | | | | | | | | | | | | | | | | | | | |
Capital Expenditures | | $ | 30,738 | | | $ | 1,145 | | | $ | 17,391 | | | $ | — | | | $ | 49,274 | |
Segment Assets | | $ | 563,556 | | | $ | 73,580 | | | $ | 347,458 | | | $ | 80,106 | | | $ | 1,064,700 | |
Total Segments Year Ended December 31, 2008 | | Total Midstream Business | | | Upstream Segment | | | Minerals Segment | | | Corporate Segment | | Total Segments |
| ($ in thousands) | | | | | | | | | | | | | | |
Sales to external customers | | $ | 1,100,477 | | | $ | 173,029 | | | $ | 42,994 | | | $ | 161,765 | (a) | $ | 1,478,265 |
Cost of natural gas and natural gas liquids | | | 891,433 | | | | — | | | | — | | | | — | | | 891,433 |
Operating costs and other expenses | | | 54,367 | | | | 37,481 | | | | 1,708 | | | | 56,400 | | | 149,956 |
Depreciation, depletion, amortization and impairment | | | 98,295 | | | | 183,008 | | | | 9,515 | | | | 787 | | | 291,605 |
| Operating income (loss) from continuing operations operations | | $ | 56,382 | | | $ | (47,460 | ) | | $ | 31,771 | | | $ | 104,578 | | $ | 145,271 |
| | | | | | | | | | | | | | | | | | | |
Capital Expenditures | | $ | 49,274 | | | $ | 20,655 | | | $ | — | | | $ | 751 | | $ | 70,680 |
Segment Assets | | $ | 1,064,700 | | | $ | 397,785 | | | $ | 143,867 | | | $ | 166,709 | | $ | 1,773,061 |
| (a) | Represents results of our derivatives activity. |
| (b) | Includes costs to dispose of sulfur in the Upstream segment of $2.2 million for the year ended December 31, 2009. |
Midstream Business Year Ended December 31, 2007 | | Texas Panhandle Segment | | | South Texas Segment | | | East Texas / Louisiana Segment | | | Gulf of Mexico | | | Total Midstream Business | |
| ($ in thousands) | | | | | | | | | | | | | | | |
Sales to external customers | | $ | 488,030 | | | $ | 53,872 | | | $ | 167,186 | | | $ | — | | | $ | 709,088 | |
Cost of natural gas and natural gas liquids | | | 372,205 | | | | 47,693 | | | | 133,350 | | | | — | | | | 553,248 | |
Operating costs and other expenses | | | 32,494 | | | | 1,058 | | | | 10,929 | | | | — | | | | 44,481 | |
Depreciation, depletion, amortization and impairment | | | 42,308 | | | | 2,453 | | | | 10,781 | | | | — | | | | 55,542 | |
| Operating income (loss) from continuing operations | | $ | 410,23 | | | $ | 2,668 | | | $ | 12,126 | | | $ | — | | | $ | 55,817 | |
| | | | | | | | | | | | | | | | | | | | | |
Capital Expenditures | | $ | 34,865 | | | $ | 3,449 | | | $ | 25,560 | | | $ | — | | | $ | 63,874 | |
Segment Assets | | $ | 602,555 | | | $ | 238,008 | | | $ | 99,269 | | | $ | — | | | $ | 939,831 | |
Total Segments Year Ended December 31, 2007 | | Total Midstream Business | | | Upstream Segment | | | Minerals Segment | | | Corporate Segment | | Total Segments | |
| ($ in thousands) | | | | | | | | | | | | | | | |
Sales to external customers | | $ | 709,088 | | | $ | 51,765 | | | $ | 15,004 | | | $ | (133,834 | )(a) | $ | 642,023 | |
Cost of natural gas and natural gas liquids | | | 553,248 | | | | — | | | | — | | | | — | | | 553,248 | |
Operating costs and other expenses | | | 44,481 | | | | 15,881 | | | | 771 | | | | 30,646 | | | 91,779 | |
Depreciation, depletion, amortization and impairment | | | 55,542 | | | | 16,235 | | | | 13,777 | | | | 754 | | | 86,308 | |
| Operating income (loss) from continuing operations operations | | $ | 55,817 | | | $ | 19,649 | | | $ | 456 | | | $ | (165,234 | ) | $ | (89,312 | ) |
| | | | | | | | | | | | | | | | | | | | |
Capital Expenditures | | $ | 63,874 | | | $ | 2,242 | | | $ | — | | | $ | — | | $ | 66,116 | |
Segment Assets | | $ | 939,831 | | | $ | 468,004 | | | $ | 150,643 | | | $ | 51,449 | | $ | 1,609,927 | |
| (a) | Represents results of our derivatives activity. |
NOTE 14. EMPLOYEE BENEFIT PLAN
The Partnership offers a defined contribution benefit plan to its employees. The plan, which was amended in December 2007 to eliminate, in part, a requirement that an employee have been with the Partnership longer than six months, provides for a dollar for dollar matching contribution by the Partnership of up to 3% of an employee’s contribution and 50% of additional contributions up to an additional 2%. Additionally, the Partnership may, at its sole discretion and election, contribute up to 6% of a participating employee’s base salary annually, subject to vesting requirements. Expenses under the plan for the years ended December 31, 2009, 2008 and 2007 were approximately $0.7 million, $1.4 million and $0.8 million, respectively.
NOTE 15. INCOME TAXES
The Partnership’s provision for income taxes relates to (i) state taxes for the Partnership and (ii) federal taxes for Eagle Rock Energy Acquisition Co., Inc, (acquiring entity of certain entities acquired in the Redman acquisition in 2007) and Eagle Rock Energy Acquisition Co. II, Inc. (acquiring entity of certain entities acquired in the Stanolind Acquisition in 2008) and their wholly owned corporations, Eagle Rock Upstream Development Company, Inc., (successor entity of certain entities acquired in the Redman acquisition) and Eagle Rock Upstream Development Company II, Inc. (successor entity of certain entities acquired in the Stanolind acquisition), which are subject to federal income taxes (the “C Corporations”). In addition, with the amendment of the Texas Franchise Tax in 2006, we have become a taxable entity in the state of Texas. The Partnership’s federal and state income tax provision is summarized below:
| ($ in thousands) | | For the Year Ended December 31. | |
| | | 2009 | | 2008 | | 2007 | |
| Current: | | | | | | | |
Federal | | $ | 680 | | $ | 140 | | $ | (26 | ) |
State | | | 1,464 | | | 831 | | | 713 | |
Total current provision | | | 2,144 | | | 971 | | | 687 | |
| Deferred: | | | | | | | | | | |
Federal | | | 1,862 | | | (6,766 | ) | | (493 | ) |
State | | | 235 | | | 2,217 | | | (62 | ) |
Total deferred | | | 2,097 | | | (4,549 | ) | | (555 | ) |
Total provision for income taxes | | | 4,241 | | | (3,578 | ) | | 132 | |
Add Back: Valuation allowance for Federal tax attributes | | | (3,154 | ) | | 2,444 | | | 26 | |
Total provision for income taxes less valuation allowance | | $ | 1,087 | | $ | (1,134 | ) | $ | 158 | |
The effective rate for the years ended December 31, 2009, 2008 and 2007 are shown in the table below. For 2009 and 2007, the federal and state based income taxes were applied against book losses which resulted in a 100% effective tax rate. The changes in the 2008 effective rate are attributable to the state and federal taxes being applied against book income for 2008. A reconciliation of the provision for income taxes with amounts determined by applying the statutory U.S. federal income tax rate to income before income taxes is as follows:
| ($ in thousands) | | For the Year Ended December 31. | |
| | | 2009 | | | 2008 | | | 2007 | |
| | | | | | | | | | |
Pre-tax net book income (loss) | | $ | (170,461 | ) | | $ | 84,622 | | | $ | (146,606 | ) |
Texas Margin Tax current and deferred | | | 1,699 | | | | 3,048 | | | | 651 | |
| Federal income taxes computed by applying the federal statutory rate to NBI of corporate entities | | | (963 | ) | | | (4,182 | ) | | | (519 | ) |
Tax attributes used | | | (2,803 | ) | | | (2,444 | ) | | | — | |
Valuation allowance | | | 3,154 | | | | 2,444 | | | | 26 | |
Provision for income taxes | | $ | 1,087 | | | $ | (1,134 | ) | | $ | 158 | |
Effective income tax rate | | | 100.0 | % | | | (1.3 | )% | | | 100.0 | % |
Significant components of deferred tax liabilities and deferred tax assets as of December 31, 2009 and 2008 are as follows:
| | | December 31, 2009 | | | December 31, 2008 | |
| Deferred Tax Assets: | | | | | | |
Net operating loss carryovers | | $ | 1,303 | | | | 3,616 | |
Current year adjustment to net operating loss carryforwards | | | (1,303 | ) | | | (2,444 | ) |
Statutory depletion carryover | | | 3,062 | | | | 1,842 | |
Current year adjustment to Statutory depletion carryover | | | (1,500 | ) | | | — | |
AMT credit carryforward | | | — | | | | 140 | |
Total deferred tax | | | 1,562 | | | | 3,154 | |
Less: valuation allowance | | | — | | | | (3,154 | ) |
Net Deferred Tax Assets | | | 1,562 | | | | — | |
| | | | | | | | | |
| Deferred Tax Liabilities: | | | | | | | | |
Property, plant, equipment & amortizable assets | | | (3,012 | ) | | | (2,621 | ) |
Unrealized hedging transactions | | | (609 | ) | | | (765 | ) |
Book/tax differences from partnership investment | | | (36,625 | ) | | | (38,963 | ) |
Total Deferred Tax Liabilities | | | (40,246 | ) | | | (42,349 | ) |
Total Net Deferred Tax Liabilities | | | (38,684 | ) | | | (42,349 | ) |
Current potion of total net deferred tax liabilities | | | — | | | | — | |
Long-term portion of total net deferred tax liabilities | | $ | (38,684 | ) | | $ | (42,349 | ) |
The Partnership had net operating loss carryovers and depletion deduction carryforwards of $1.6 million and $3.2 million at December 31, 2009 and 2008, respectively. For the year ending December 31, 2009, all tax attribute carryforwards are related to statutory depletion deduction. The Partnership records a valuation allowance to reduce its deferred tax assets to the amount of future tax benefit that is more likely than not to be realized. The valuation allowance was zero and $3.2 million at December 31, 2009 and 2008, respectively. For year ended December 31, 2008, $3.1 million is from net operating loss and depletion carryovers and $0.1 million is from AMT credit carryforwards from the C Corporations.
The largest single component of Partnership’s deferred tax liabilities is related to federal income taxes of the C Corporations described above. Book/tax differences were created by the Redman and Stanolind Acquisitions. These book/tax temporary differences result in a net deferred tax liability of $35.1 million at December 31, 2009, which will be reduced as allocation of built-in gain in proportion to the assets contributed brings the book and tax basis closer together over time. This deferred tax liability was recognized in conjunction with the purchase accounting adjustments for long term assets. The additional $3.6 million in deferred tax liabilities are related to book/tax differences in property, plant, and equipment and unrealized hedging transactions.
On May 18, 2006, the State of Texas enacted House Bill 3 which revised the pre-existing state franchise tax. In general, legal entities that conduct business in Texas are subject to the Revised Texas Franchise Tax, including previously non-taxable entities such as limited partnerships and limited liability partnerships. The tax is assessed on Texas sourced taxable margin which is defined as the lesser of (i) 70% of total revenue or (ii) total revenue less (a) cost of goods sold or (b) compensation and benefits.
Although the bill states that the Revised Texas Franchise Tax is not an income tax, it has the characteristics of an income tax since it is determined by applying a tax rate to a base that considers both revenues and expenses. Due to the enactment of the Revised Texas Franchise Tax, the Partnership recorded a net deferred tax liability of $3.6 million, $3.4 million and $1.9 million as of December 31, 2009, 2008 and 2007, respectively. The offsetting net charges of $0.2 million, $1.5 million and $0.7 million are shown in the Statement of Consolidated Operations for the years ended December 31, 2009, 2008 and 2007, respectively, as a component of provision for income taxes.
The Partnership adopted authoritative guidance related to accounting for uncertainty in income taxes on January 1, 2007. The Partnership has taken a position which is deemed to be “more likely than not” to be upheld upon review, if any, with respect to the deductibility of certain costs for the purpose of its franchise tax liability on a state franchise return. We have recorded a provision of the portion of this tax liability equal to the probability of recognition. We have not accrued interest and penalties as the amounts are estimated to be de minimis. The amount stated below relates to the tax return filed for 2008 which is still open under current statute. A reconciliation of the beginning and ending amount of the unrecognized tax benefits (liabilities) is as follows ($ thousands):
| Balance as of December 31, 2008 | | $ | — | |
| Increases related to prior year tax positions | | | (267 | ) |
| Increases related to current year tax positions | | | — | |
| Balance as of December 31, 2009 | | $ | (267 | ) |
NOTE 16. EQUITY-BASED COMPENSATION
Eagle Rock Energy G&P, LLC the general partner of the general partner for the Partnership, approved a long-term incentive plan (LTIP), as amended, for its employees, directors and consultants who provide services to the Partnership covering an aggregate of 2,000,000 common units to be granted either as options, restricted units or phantom units. To date, only restricted units have been granted. The restricted units granted are valued at the market price as of the date issued. The weighted average fair value of the units granted during the years ended December 31, 2009, 2008 and 2007 were $5.58, $14.89 and $23.10, respectively. The awards generally vest on the basis of one third of the award each year. During the restriction period, distributions associated with the granted awards will be distributed to the awardees. No options or phantom units have been issued to date.
A summary of the restricted common units’ activity for the year ended December 31, 2009, is provided below:
| | | Number of Restricted Units | | | Weighted Average Fair Value |
Outstanding at December 31, 2008 | | | 905,486 | | | $ | 17.00 | | |
Granted | | | 916,900 | | | $ | 5.58 | | |
Vested | | | (334,403 | ) | | $ | 17.58 | | |
Forfeitures | | | (116,964 | ) | | $ | 15.50 | | |
Outstanding at December 31, 2009 | | | 1,371,019 | | | $ | 9.35 | | |
The total grant date fair value of restricted units that vested during the years ended December 31, 2009, 2008 and 2007 were $5.9 million, and $3.7 million and $0.8 million, respectively.
For the years ended December 31, 2009, 2008, and 2007, non-cash compensation expense of approximately $6.3 million, $6.0 million, and $2.4 million, respectively, was recorded related to the granted restricted units. During the third quarter of 2007, the terms of the October 2006 award agreements were amended to permit direct distributions to the holders of restricted unvested common units under such award agreements during the unvested period, including the August 14, 2007 distribution. Prior to the amendment, distributions were made on the restricted unvested common units under these award agreements when the awards vested. Per the amendment, the two prior distributions (i.e., the fourth quarter 2006 prorated distribution and the first quarter 2007 minimum quarterly distribution) were held by the Partnership and paid when the awards vested. Restricted common units granted subsequent to the October 2006 grant are entitled to receive direct distributions during their unvested periods. This modification resulted in a repricing of the unvested units from their original value of $18.75 to the unit price of $22.60 at the time of the amendment. This modification resulted in a $0.1 million increase in compensation during the year ended December 31, 2007. On November 5, 2007, the Partnership modified the vesting dates of the options granted on October 25, 2006 and for other individuals granted units between May 15, 2007 and November 5, 2007. This modification moved the individuals vesting dates to either May 15, 2008, 2009 and 2010 or to November 15, 2008, 2009 and 2010. As the price of the Partnership’s units was lower on the date of modification than the unit price on the date of grant, or date of the previous modification, there was no incremental cost associated with this modification and thus there was no impact to compensation.
As of December 31, 2009, unrecognized compensation costs related to the outstanding restricted units under our LTIP totaled approximately $9.5 million. The remaining expense is to be recognized over a weighted average of 1.92 years.
Due to the vesting of certain restricted units during the years ended December 31, 2009 and 2007, 17,492 and 7,400, respectively, were repurchased by the Partnership for $0.1 million and $0.2 million, respectively, as consideration for the related employee tax liability paid by the Partnership. No units were repurchased in during the year ended December 31, 2008. Pursuant to the terms of the LTIP, these repurchased units are available for future grants under the LTIP.
In addition to equity awards involving units of the Partnership, Eagle Rock Holdings, L.P., which is controlled by NGP, in the past has from time to time granted equity in Holdings to certain employees working on behalf of the Partnership, some of which are named executive officers. During the years ended December 31, 2009 and 2008, Holdings granted 160,000 and 417,000 “Tier I” incentive interests, respectively, to certain Eagle Rock Energy employees. One of these employees subsequently forfeited 200,000 of the interests upon his resignation from Eagle Rock in 2008. The Tier I incentive interests entitle the holder to share in the cash distributions of Holdings upon achieving a certain payout target, which was reached in 2006. During the years ended December 31, 2009 and 2008, Holdings also granted 51,416 and 33,415 “Tier III” incentive units, respectively, of which 20,000 were subsequently forfeited in 2008. These units have not achieved their payout target and as such have no impact to compensation.
The Partnership has no discretion in granting any awards at the Holdings level. The Tier I incentive interests are intended to provide additional motivation for the grantees to create value at Holdings, in part through their actions to increase the value of the Partnership. Because the incentive interests represent an interest in the future profits of Holdings, and receive distributions only from the cash flow at Holdings, the incentive interests create no burden on, or dilution to, the returns on the Partnership’s common units. On the contrary, the incentive units are solely a burden on, and dilutive to, the returns of the equity owners of Holdings, including NGP as the substantial majority owner of Holdings. Despite this, according to authoritative guidance, the Partnership recorded a portion of the value of the incentive units as compensation expense in the Partnership’s financial statements. This allocation is based on management’s estimation of the total value of the incentive unit grant and of the grantee’s portion of time dedicated to the Partnership. During the years ended December 31, 2009 and 2008, Eagle Rock recorded non-cash compensation expense of $0.4 million and $1.7 million, respectively based on management’s estimates related to the Tier I incentive unit grants made by Holdings in 2008.
NOTE 17. EARNINGS PER UNIT
Basic earnings per unit is computed by dividing the net income, or loss, by the weighted average number of units outstanding during a period. To determine net income, or loss, allocated to each class of ownership (common, subordinated and general partner), we first allocated net income, or loss, by the amount of distributions made for the quarter by each class, if any. The remaining net income, or loss, after the deduction for the related quarterly distribution was allocated to each class in proportion to the class’ weighted average number of units outstanding for a period, as compared to the weighted average number of units for all classes for the period.
We have issued restricted unvested common units. These units will be considered in the diluted common unit weighted average number in periods of net income. In periods of net losses, the units are excluded from the diluted earnings per unit calculation due to their antidilutive effect.
On January 1, 2009, the Partnership adopted guidance which provides that for master limited partnerships, current period earnings be reduced by the amount of available cash that will be distributed with respect to that period for purposes of calculating earnings per unit. Any residual amount representing undistributed earnings is assumed to be allocated to the various ownership interests in accordance with the contractual provisions of the partnership agreement. In addition, incentive distribution rights (“IDRs”), which represent a limited partnership ownership interest, are considered to be participating securities because they have the right to participate in earnings with common equity holders.
Under the Partnership’s partnership agreement, for any quarterly period, IDRs participate in net income only to the extent of the amount of cash distributions actually declared, thereby excluding the IDRs from participating in undistributed earnings or losses. Accordingly, undistributed net income is assumed to be allocated to the other ownership interests on a pro-rata basis. During the years ended December 31, 2009, 2008 and 2007, the Partnership did not declare a quarterly distribution for the IDRs.
On January 1, 2009, the Partnership also adopted the guidance which provides that share-based payment awards that contain non-forfeitable rights to dividends or dividend equivalents meets the definition of a participating security and shall be included in the computation of earnings-per-unit pursuant to the two-class method. The restricted common units granted under the LTIP, as discussed in Note 15, contain non-forfeitable rights to the distributions declared by the Partnership.
For the year ended December 31, 2008, the Partnership determined that is was more dilutive to apply the two-class method versus the treasury stock. Thus, non-vested units that vest solely on the basis of a service condition are included in the computation of the diluted weighted average common units outstanding, but denominator in the computation of diluted earnings per unit only includes the basic weighted average common units outstanding.
After applying the above guidance, net income per common, subordinated and general partner unit for the year ended December 31, 2008 changed from $1.20 to $1.18. For the year ended December 31, 2007, net loss per common unit changed from $2.11 to $2.13, while net loss per subordinated and general partner unit changed from $3.14 to $3.13. Earnings per unit has not been separately disclosed for the restricted common units, as the restricted common units are not considered a separate class of equity.
The following table presents our calculation of basic and diluted units outstanding for the periods indicated:
| | | For the Year Ended December 31, | |
| | | 2009 | | | 2008 | | | 2007 | |
| | | (Unit amounts in thousands) | |
| Basic weighted average unit outstanding during period: | | | | | | | | | |
Common units | | | 53,496 | | | | 51,534 | | | | 37,008 | |
Subordinated units | | | 20,691 | | | | 20,691 | | | | 20,691 | |
General partner units | | | 845 | | | | 845 | | | | 845 | |
| | | | | | | | | | | | | |
| Diluted weighted average unit outstanding during period: | | | | | | | | | | | | |
Common units | | | 53,496 | | | | 51,699 | | | | 37,008 | |
Subordinated units | | | 20,691 | | | | 20,691 | | | | 20,691 | |
General partner units | | | 845 | | | | 845 | | | | 845 | |
The following table presents the Partnership’s basic and diluted loss per unit for the year ended December 31, 2009:
| | | Total | | | Common Units | | | Restricted Common Units | | | Subordinated Units | | | General Partner Units | |
| | | ($ in thousands, except for per unit amounts) | |
Loss from continuing operations | | $ | (171,548 | ) | | | | | | | | | | | | | | | | |
Distributions declared | | | 5,498 | | | $ | 5,350 | | | $ | 64 | | | $ | — | | | $ | 84 | |
| Assumed loss from continuing operations after distribution to be allocated | | | (177,046 | ) | | | (126,230 | ) | | | — | | | | (48,823 | ) | | | (1,993 | ) |
| Assumed allocation of loss from continuing operations | | | (171,548 | ) | | | (120,880 | ) | | | 64 | | | | (48,823 | ) | | | (1,909 | ) |
Discontinued operations | | | 290 | | | | 207 | | | | — | | | | 80 | | | | 3 | |
Assumed net loss to be allocated | | $ | (171,258 | ) | | $ | (120,673 | ) | | $ | 64 | | | $ | (48,743 | ) | | $ | (1,906 | ) |
| | | | | | | | | | | | | | | | | | | | | |
| Basic and diluted income from continuing operations per unit | | | | | | $ | (2.26 | ) | | | | | | $ | (2.36 | ) | | $ | (2.26 | ) |
| Basic discontinued operations per unit | | | | | | $ | — | | | | | | | $ | — | | | $ | — | |
Basic income per unit | | | | | | $ | (2.26 | ) | | | | | | $ | (2.36 | ) | | $ | (2.26 | ) |
The following table presents the Partnership’s basic and diluted loss per unit for the year ended December 31, 2008:
| | | Total | | | Common Units | | | Restricted Common Units | | | Subordinated Units | | | General Partner Units | |
| | | ($ in thousands, except for per unit amounts) | |
Income from continuing operations | | $ | 85,756 | | | | | | | | | | | | | | | | | |
Distributions declared | | | 120,257 | | | $ | 84,001 | | | $ | 1,152 | | | $ | 33,727 | | | $ | 1,377 | |
| Assumed loss from continuing operations after distribution to be allocated | | | (34,501 | ) | | | (24,332 | ) | | | — | | | | (9,770 | ) | | | (399 | ) |
| Assumed allocation of income from continuing operations | | | 85,756 | | | | 59,669 | | | | 1,152 | | | | 23,957 | | | | 978 | |
Discontinued operations | | | 1,764 | | | | 1,244 | | | | — | | | | 500 | | | | 20 | |
Assumed net income to be allocated | | $ | 87,520 | | | $ | 60,913 | | | $ | 1,152 | | | $ | 24,457 | | | $ | 998 | |
| | | | | | | | | | | | | | | | | | | | | |
| Basic and diluted income from continuing operations per unit | | | | | | $ | 1.16 | | | | | | | $ | 1.16 | | | $ | 1.16 | |
| Basic discontinued operations per unit | | | | | | $ | 0.02 | | | | | | | $ | 0.02 | | | $ | 0.02 | |
Basic income per unit | | | | | | $ | 1.18 | | | | | | | $ | 1.18 | | | $ | 1.18 | |
The following table presents the Partnership’s basic and diluted loss per unit for the year ended December 31, 2007:
| | | Total | | | Common Units | | | Restricted Common Units | | | Subordinated Units | | | General Partner Units | |
| | | ($ in thousands, except for per unit amounts) | |
Loss from continuing operations | | $ | (146,764 | ) | | | | | | | | | | | | | | | | |
Distributions declared | | | 81,893 | | | $ | 65,131 | | | $ | 395 | | | $ | 15,726 | | | $ | 641 | |
| Assumed loss from continuing operations after distribution to be allocated | | | (228,657 | ) | | | (144,543 | ) | | | — | | | | (80,815 | ) | | | (3,299 | ) |
| Assumed allocation of loss from continuing operations | | | (146,764 | ) | | | (79,412 | ) | | | 395 | | | | (65,089 | ) | | | (2,658 | ) |
Discontinued operations | | | 1,130 | | | | 714 | | | | — | | | | 399 | | | | 17 | |
Assumed net loss to be allocated | | $ | (145,634 | ) | | $ | (78,698 | ) | | $ | 395 | | | $ | (64,690 | ) | | $ | (2,641 | ) |
| | | | | | | | | | | | | | | | | | | | | |
| Basic and diluted loss from continuing operations per unit | | | | | | $ | (2.15 | ) | | | | | | $ | (3.15 | ) | | $ | (3.15 | ) |
| Basic and diluted discontinued operations per unit | | | | | | $ | 0.02 | | | | | | | $ | 0.02 | | | $ | 0.02 | |
Basic and diluted loss per unit | | | | | | $ | (2.13 | ) | | | | | | $ | (3.13 | ) | | $ | (3.13 | ) |
NOTE 18. OTHER OPERATING EXPENSE
Other operating (income) expense for the year ended December 31, 2009, includes income of $3.6 million due to the recovery of $2.2 million of assets previously written off and the release of $1.4 million of liabilities assumed as part of the Partnership’s purchase price allocation for its acquisitions of Escambia Asset Co., LLC and Redman Energy Holdings, L.P. During the period, the Partnership received additional information about collectability of these assets and determined that it no longer had any obligation under these liabilities.
In July 2008, SemGroup, L.P. and certain of its subsidiaries (“SemGroup”) filed petitions for reorganization under Chapter 11 of the U.S. Bankruptcy Code. The Partnership historically sold portions of its condensate production from its Texas Panhandle and East Texas midstream systems to SemGroup. As a result of the bankruptcy, the Partnership took a $10.7 million bad debt charge during the year ended December 31, 2008, which is included in “Other Operating Expense” in the consolidated statement of operations. In August 2009, the Partnership sold $3.9 million of its outstanding receivables from SemGroup, which represented its 20-day administrative claims under 503(b)(9) of the United States Bankruptcy Code, for which it received a payment of $3.0 million. Due to certain repurchase obligations under the assignment agreement, the Partnership recorded the payment as a current liability within accounts payable as of December 31, 2009 and anticipates maintaining the balance as a liability until it is clear that the repurchase obligations can no longer be triggered.
Other operating expense expenses for the year ended December 31, 2007 consisted of the settlement of a lawsuit for $1.4 million, liquidated damages related to the late registration of our common units for $1.1 million and a severance payment to a former executive of $0.3 million.
NOTE 19. SUBSEQUENT EVENTS
In February 2010, the Partnership announced its intention to deploy a currently idle high-efficiency cryogenic plant to the Texas Panhandle in order to increase efficiency and accommodate volume growth from the Granite Wash Play. Deployment of the cryogenic plant (the “Phoenix Plant”), in replacement of an aging facility, is phase two of the Partnership’s Texas Panhandle consolidation and processing capacity expansion project originally announced in February 2008.
On March 8, 2010, the Partnership entered into the Second Amendment to its Revolving Credit Facility, dated as of December 13, 2007, with Wachovia Bank, N.A., Bank of America, N.A., HSH NordBank AG, New York Branch, The Royal Bank of Scotland, PLC, BNP Paribas and the other lenders party thereto (the “Credit Facility Amendment”).
Prior to execution of the Credit Facility Amendment, the Partnership had concluded that it would require a waiver from its lender group in order to exercise the GP acquisition option without triggering a “Change in Control” event and potential event of default under its Revolving Credit Facility. The Credit Facility Amendment, however, modifies the definition of “Change in Control" in such a way that the exercise of the GP acquisition option would not trigger a “Change in Control” event and potential default provided the Partnership receives unitholder approval of the Recapitalization and Related Transactions prior to July 31, 2010. In light of the amendment, the Conflicts Committee of Eagle Rock’s Board of Directors currently intends to cause the Partnership to exercise the GP Acquisition Option as soon as practicable after the required unitholder approvals of the Recapitalization and Related Transactions. The Credit Facility Amendment will take effect upon the Partnership providing written notice to its lender group that the required unitholder approvals have been obtained prior to July 31, 2010.
In addition to modifying the definition of “Change in Control,” the Credit Facility Amendment also:
| · | Reduces the maximum permitted Senior Secured Leverage Ratio (as such term is defined in the Revolving Credit Facility) from 4.25 to 1.0 under the current Revolving Credit Facility to 3.75 to 1.0 (and from 4.75 to 1.0 to 4.25 to 1.0 for specified periods following certain permitted acquisitions); |
| · | Obligates the Partnership to use $100 million of the proceeds from the Minerals Business Sale to make a mandatory prepayment towards its outstanding borrowings under the Revolving Credit Facility; and |
| · | Reduces, upon such mandatory prepayment, the Partnership’s borrowing capacity under the Revolving Credit Facility by the $100 million amount of such mandatory prepayment; however, The Partnership’s availability under its Revolving Credit Facility is not currently impacted because it is calculated based on its outstanding debt and compliance with financial covenants |
NOTE 20. SUBSIDIARY GUARANTORS
In the future, the Partnership may issue registered debt securities guaranteed by its subsidiaries. The Partnership expects that all guarantors would be wholly-owned or available to be pledged and that such guarantees would be joint and several and full and unconditional. In accordance with practices accepted by the SEC, the Partnership has prepared Condensed Consolidating Financial Statements as supplemental information. The following Condensed Consolidating Balance Sheets at December 31, 2009 and 2008, and Condensed Consolidating Statements of Operations and Condensed Consolidating Statements of Cash Flows for the years ended December 31, 2009, 2008 and 2007, present financial information for Eagle Rock Energy Partners, L.P. as the Parent on a stand-alone basis (carrying any investments in subsidiaries under the equity method), financial information for the subsidiary guarantors, which are all fully owned by the Parent, on a stand-alone basis, and the consolidation and elimination entries necessary to arrive at the information for the Partnership on a consolidated basis. The subsidiary guarantors are not restricted from making distributions to the Partnership.
| Condensed Consolidating Balance Sheet |
December 31, 2009 |
| (in thousands) | | Parent Issuer | | | Subsidiary Guarantors | | | Non-guarantor investments | | | Consolidating Entries | | | Total | |
| | | | | | | | | | | | | | | | |
| ASSETS: | | | | | | | | | | | | | | | | | | | | |
Accounts receivable – related parties | | $ | 87,433 | | | $ | — | | | $ | — | | | $ | (87,433 | ) | | $ | — | |
Other current assets | | | 5,171 | | | | 93,994 | | | | — | | | | — | | | | 99,165 | |
Total property, plant and equipment, net | | | 212 | | | | 1,275,669 | | | | — | | | | — | | | | 1,275,881 | |
Investment in subsidiaries | | | 1,244,384 | | | | — | | | | 1,205 | | | | (1,245,589 | ) | | | — | |
Total other long-term assets | | | 5,620 | | | | 153,662 | | | | — | | | | — | | | | 159,282 | |
Total assets | | $ | 1,342,820 | | | $ | 1,523,325 | | | $ | 1,205 | | | $ | (1,333,022 | ) | | $ | 1,534,328 | |
| LIABILITIES AND EQUITY: | | | | | | | | | | | | | | | | | | | | |
Accounts payable – related parties | | $ | — | | | $ | 87,433 | | | $ | — | | | $ | (87,433 | ) | | $ | — | |
Other current liabilities | | | 42,099 | | | | 114,083 | | | | — | | | | — | | | | 156,182 | |
Other long-term liabilities | | | 15,940 | | | | 77,425 | | | | — | | | | — | | | | 93,365 | |
Long-term debt | | | 754,383 | | | | — | | | | — | | | | — | | | | 754,383 | |
Equity | | | 530,398 | | | | 1,244,384 | | | | 1,205 | | | | (1,245,589 | ) | | | 530,398 | |
Total liabilities and equity | | $ | 1,342,820 | | | $ | 1,523,325 | | | $ | 1,205 | | | $ | (1,333,022 | ) | | $ | 1,534,328 | |
| Condensed Consolidating Balance Sheet |
December 31, 2008 |
| (in thousands) | | Parent Issuer | | Subsidiary Guarantors | | Consolidating Entries | | | Total | |
| | | | |
| ASSETS: | | | | | | | | | | |
Accounts receivable – related parties | | $ | — | | $ | 16,880 | | $ | (16,880 | ) | | $ | — | |
Other current assets | | | 37,452 | | | 175,772 | | | — | | | | 213,224 | |
Total property, plant and equipment, net | | | 128 | | | 1,357,481 | | | — | | | | 1,357,609 | |
Investment in subsidiaries | | | 1,520,016 | | | — | | | (1,520,016 | ) | | | — | |
Total other long-term assets | | | 7,506 | | | 194,722 | | | — | | | | 202,228 | |
Total assets | | $ | 1,565,102 | | $ | 1,744,855 | | $ | (1,536,896 | ) | | $ | 1,773,061 | |
| LIABILITIES AND EQUITY: | | | | | | | | | | | | | | |
Accounts payable – related parties | | $ | 16,880 | | $ | — | | $ | (16,880 | ) | | $ | — | |
Other current liabilities | | | 10,596 | | | 145,342 | | | — | | | | 155,938 | |
Other long-term liabilities | | | 10,528 | | | 79,497 | | | — | | | | 90,025 | |
Long-term debt | | | 799,383 | | | — | | | — | | | | 799,383 | |
Equity | | | 727,715 | | | 1,520,016 | | | (1,520,016 | ) | | | 727,715 | |
Total liabilities and equity | | $ | 1,565,102 | | $ | 1,744,855 | | $ | (1,536,896 | ) | | $ | 1,773,061 | |
| Condensed Consolidating Statement of Operations |
For the year ended December 31, 2009 |
| (in thousands) | | Parent Issuer | | | Subsidiary Guarantors | | | Non-guarantor investments | | | Consolidating Entries | | | Total | |
| | | | | | | | | | | | | | | | |
Total revenues | | $ | (37,432 | ) | | $ | 647,896 | | | $ | — | | | $ | — | | | $ | 610,464 | |
Cost of natural gas and natural gas liquids | | | — | | | | 488,230 | | | | — | | | | — | | | | 488,230 | |
Operations and maintenance | | | — | | | | 73,196 | | | | — | | | | — | | | | 73,196 | |
Taxes other than income | | | — | | | | 12,047 | | | | — | | | | — | | | | 12,047 | |
General and administrative | | | 2,803 | | | | 43,385 | | | | — | | | | — | | | | 46,188 | |
Other operating expense | | | — | | | | (3,552 | ) | | | — | | | | — | | | | (3,552 | ) |
Depreciation, depletion, amortization and impairment | | | — | | | | 138,324 | | | | — | | | | — | | | | 138,324 | |
Loss from operations | | | (40,235 | ) | | | (103,734 | ) | | | — | | | | — | | | | (143,969 | ) |
Interest expense | | | (21,568 | ) | | | (23 | ) | | | — | | | | — | | | | (21,591 | ) |
Other non-operating income | | | 6,886 | | | | 4,183 | | | | 153 | | | | (8,706 | ) | | | 2,516 | |
Other non-operating expense | | | (5,572 | ) | | | (10,551 | ) | | | — | | | | 8,706 | | | | (7,417 | ) |
Loss before income taxes | | | (60,489 | ) | | | (110,125 | ) | | | 153 | | | | — | | | | (170,461 | ) |
Income tax provision (benefit) | | | 1,547 | | | | (460 | ) | | | — | | | | — | | | | 1,087 | |
Equity in earnings of subsidiaries | | | (109,222 | ) | | | — | | | | — | | | | 109,222 | | | | — | |
Loss from continuing operations | | | (171,258 | ) | | | (109,665 | ) | | | 153 | | | | 109,222 | | | | (171,548 | ) |
Discontinued operations | | | — | | | | 290 | | | | — | | | | — | | | | 290 | |
Net loss | | $ | (171,258 | ) | | $ | (109,375 | ) | | $ | 153 | | | $ | 109,222 | | | $ | (171,258 | ) |
| Condensed Consolidating Statement of Operations |
For the year ended December 31, 2008 |
| (in thousands) | | Parent Issuer | | Subsidiary Guarantors | | | Consolidating Entries | | | Total | |
| | | | |
Total revenues | | $ | 8,809 | | $ | 1,469,456 | | | $ | — | | | $ | 1,478,265 | |
Cost of natural gas and natural gas liquids | | | — | | | 891,433 | | | | — | | | | 891,433 | |
Operations and maintenance | | | — | | | 73,620 | | | | — | | | | 73,620 | |
Taxes other than income | | | — | | | 19,936 | | | | — | | | | 19,936 | |
General and administrative | | | 15 | | | 45,686 | | | | — | | | | 45,701 | |
Other operating expense | | | — | | | 10,699 | | | | — | | | | 10,699 | |
Depreciation, depletion, amortization and impairment | | | — | | | 291,605 | | | | — | | | | 291,605 | |
Income from operations | | | 8,794 | | | 136,477 | | | | — | | | | 145,271 | |
Interest expense | | | (32,884 | ) | | — | | | | — | | | | (32,884 | ) |
Other non-operating income | | | 5,617 | | | 6,350 | | | | (5,846 | ) | | | 6,121 | |
Other non-operating expense | | | (6,623 | ) | | (33,109 | ) | | | 5,846 | | | | (33,886 | ) |
Income (loss) before income taxes | | | (25,096 | ) | | 109,718 | | | | — | | | | 84,622 | |
Income tax provision (benefit) | | | 1,087 | | | (2,221 | ) | | | — | | | | (1,134 | ) |
Equity in earnings of subsidiaries | | | 113,703 | | | — | | | | (113,703 | ) | | | — | |
Income from continuing operations | | | 87,520 | | | 111,939 | | | | (113,703 | ) | | | 85,756 | |
Discontinued operations | | | — | | | 1,764 | | | | — | | | | 1,764 | |
Net income | | $ | 87,520 | | $ | 113,703 | | | $ | (113,703 | ) | | $ | 87,520 | |
| Condensed Consolidating Statement of Operations |
For the year ended December 31, 2007 |
| (in thousands) | Parent Issuer | | | Subsidiary Guarantors | | | Consolidating Entries | | | Total | |
| | | |
Total revenues | $ | — | | | $ | 642,023 | | | $ | — | | | $ | 642,023 | |
Cost of natural gas and natural gas liquids | | — | | | | 553,248 | | | | — | | | | 553,248 | |
Operations and maintenance | | — | | | | 52,793 | | | | — | | | | 52,793 | |
Taxes other than income | | — | | | | 8,340 | | | | — | | | | 8,340 | |
General and administrative | | 53 | | | | 27,746 | | | | — | | | | 27,799 | |
Other operating expense | | — | | | | 2,847 | | | | — | | | | 2,847 | |
Depreciation, depletion, amortization and impairment | | — | | | | 86,308 | | | | — | | | | 86,308 | |
Loss from operations | | (53 | ) | | | (89,259 | ) | | | — | | | | (89,312 | ) |
Interest expense | | (2,148 | ) | | | (36,788 | ) | | | — | | | | (38,936 | ) |
Other non-operating income | | 1,423 | | | | 1,708 | | | | (1,275 | ) | | | 1,856 | |
Other non-operating expense | | (46 | ) | | | (21,443 | ) | | | 1,275 | | | | (20,214 | ) |
Loss before income taxes | | (824 | ) | | | (145,782 | ) | | | — | | | | (146,606 | ) |
Income tax provision (benefit) | | (498 | ) | | | 656 | | | | — | | | | 158 | |
Equity in earnings of subsidiaries | | (145,308 | ) | | | — | | | | 145,308 | | | | — | |
Loss from continuing operations | | (145,634 | ) | | | (146,438 | ) | | | 145,308 | | | | (146,764 | ) |
Discontinued operations | | — | | | | 1,130 | | | | — | | | | 1,130 | |
Net loss | $ | (145,634 | ) | | $ | (145,308 | ) | | $ | 145,308 | | | $ | (145,634 | ) |
| Condensed Consolidating Statement of Cash Flows |
For the year ended December 31, 2009 |
| (in thousands) | | Parent Issuer | | | Subsidiary Guarantors | | | Non-guarantor investments | | | Consolidating | | | Total | |
| | | | | | | | | | | | | | | | |
Net cash flows provided by operating activities | | $ | 57,933 | | | $ | 39,019 | | | $ | (11 | ) | | $ | — | | | $ | 96,941 | |
| CASH FLOWS FROM INVESTING ACTIVITIES: | | | | | | | | | | | | | | | | | | | | |
Additions to property, plant and equipment | | | (84 | ) | | | (36,050 | ) | | | — | | | | — | | | | (36,134 | ) |
Purchase of intangible assets | | | — | | | | (1,626 | ) | | | — | | | | — | | | | (1,626 | ) |
Investment in partnerships | | | — | | | | (1,581 | ) | | | — | | | | — | | | | (1,581 | ) |
Proceeds from sale of asset | | | — | | | | 476 | | | | — | | | | — | | | | 476 | |
Net cash flows used in investing activities | | | (84 | ) | | | (39,296 | ) | | | — | | | | — | | | | (38,865 | ) |
| CASH FLOWS FROM FINANCING ACTIVITIES: | | | | | | | | | | | | | | | | | | | | |
Proceeds from long-term debt | | | 131,000 | | | | — | | | | — | | | | — | | | | 131,000 | |
Repayment of long-term debt | | | (176,000 | ) | | | — | | | | — | | | | — | | | | (176,000 | ) |
Proceeds from derivative contracts | | | — | | | | 8,939 | | | | — | | | | — | | | | 8,939 | |
Deferred transaction fees | | | (1,480 | ) | | | — | | | | — | | | | — | | | | (1,480 | ) |
Repurchase of common units | | | (64 | ) | | | — | | | | — | | | | — | | | | (64 | ) |
| Distributions to members and affiliates | | | (35,655 | ) | | | — | | | | — | | | | — | | | | (35,655 | ) |
| Net cash flows provided by (used in) financing activities | | | (82,199 | ) | | | 8,939 | | | | — | | | | — | | | | (73,260 | ) |
| Net (decrease) increase in cash and cash equivalents | | | (24,350 | ) | | | 9,177 | | | | (11 | ) | | | — | | | | (15,184 | ) |
Cash and cash equivalents at beginning of year | | | 29,272 | | | | (11,356 | ) | | | — | | | | — | | | | 17,916 | |
Cash and cash equivalents at end of year | | $ | 4,922 | | | $ | (2,179 | ) | | $ | (11 | ) | | $ | — | | | $ | 2,732 | |
| Condensed Consolidating Statement of Cash Flows |
For the year ended December 31, 2008 |
| (in thousands) | | Parent Issuer | | Subsidiary Guarantors | | | Consolidating Entries | | | Total | |
| | | | |
Net cash flows provided by operating activities | | $ | 106,073 | | $ | 75,078 | | | $ | — | | | $ | 181,151 | |
| CASH FLOWS FROM INVESTING ACTIVITIES: | | | | | | | | | | | | | | | |
Additions to property, plant and equipment | | | (128 | ) | | (66,613 | ) | | | — | | | | (66,741 | ) |
Purchase of intangible assets | | | — | | | (2,975 | ) | | | — | | | | (2,975 | ) |
Investment in partnerships | | | — | | | (3,936 | ) | | | — | | | | (3,936 | ) |
Acquisitions, net of cash acquired | | | (857 | ) | | (261,388 | ) | | | — | | | | (262,245 | ) |
Proceeds from sale of asset | | | — | | | 1,294 | | | | — | | | | 1,294 | |
| Contributions to subsidiaries | | | (261,981 | ) | | — | | | | 261,981 | | | | — | |
Net cash flows used in investing activities | | | (262,966 | ) | | (333,618 | ) | | | 261,981 | | | | (334,603 | ) |
| CASH FLOWS FROM FINANCING ACTIVITIES: | | | | | | | | | | | | | | | |
Proceeds from long-term debt | | | 432,128 | | | — | | | | — | | | | 432,128 | |
Repayment of long-term debt | | | (199,814 | ) | | — | | | | — | | | | (199,814 | ) |
Proceeds from derivative contracts | | | — | | | (11,063 | ) | | | — | | | | (11,063 | ) |
Payment of debt issuance costs | | | (789 | ) | | — | | | | — | | | | (789 | ) |
Contributions from parent | | | — | | | 261,981 | | | | (261,981 | ) | | | — | |
Distributions to members and affiliates | | | (117,646 | ) | | — | | | | — | | | | (117,646 | ) |
Net cash flows provided by financing activities | | | 113,879 | | | 250,918 | | | | (261,981 | ) | | | 102,816 | |
Net decrease in cash and cash equivalents | | | (43,014 | ) | | (7,622 | ) | | | — | | | | (50,636 | ) |
Cash and cash equivalents at beginning of year | | | 72,286 | | | (3,734 | ) | | | — | | | | 68,552 | |
Cash and cash equivalents at end of year | | $ | 29,272 | | $ | (11,356 | ) | | $ | — | | | $ | 17,916 | |
| Condensed Consolidating Statement of Cash Flows |
For the year ended December 31, 2007 |
| (in thousands) | | Parent Issuer | | Subsidiary Guarantors | | | Consolidating Entries | | | Total | |
| | | | |
| Net cash flows provided by (used in)operating activities | | $ | 203,468 | | $ | (96,523 | ) | | $ | — | | | $ | 106,945 | |
| CASH FLOWS FROM INVESTING ACTIVITIES: | | | | | | | | | | | | | | | |
Additions to property, plant and equipment | | | — | | | (66,116 | ) | | | — | | | | (66,116 | ) |
Purchase of intangible assets | | | — | | | (2,048 | ) | | | — | | | | (2,048 | ) |
Acquisitions, net of cash acquired | | | (421 | ) | | (407,205 | ) | | | — | | | | (407,626 | ) |
Contributions to subsidiaries | | | (427,618 | ) | | — | | | | 427,618 | | | | — | |
Net cash flows used in investing activities | | | (428,039 | ) | | (475,369 | ) | | | 427,618 | | | | (475,790 | ) |
| CASH FLOWS FROM FINANCING ACTIVITIES: | | | | | | | | | | | | | | | |
Proceeds from long-term debt | | | 567,069 | | | 173,401 | | | | — | | | | 740,470 | |
Repayment of long-term debt | | | (567,069 | ) | | (12,062 | ) | | | — | | | | (579,131 | ) |
Proceeds from derivative contracts | | | — | | | (1,667 | ) | | | — | | | | (1,667 | ) |
Payment of debt issuance costs | | | (4,280 | ) | | — | | | | — | | | | (4,280 | ) |
Proceeds from equity issuances | | | 331,500 | | | — | | | | — | | | | 331,500 | |
Payment of offering costs | | | (381 | ) | | — | | | | — | | | | (381 | ) |
Repurchase of common units | | | (154 | ) | | — | | | | — | | | | (154 | ) |
Contributions from parent | | | — | | | 427,618 | | | | (427,618 | ) | | | — | |
Distributions to members and affiliates | | | (59,541 | ) | | — | | | | — | | | | (59,541 | ) |
Net cash flows provided by financing activities | | | 267,144 | | | 587,290 | | | | (427,618 | ) | | | 426,816 | |
Net increase in cash and cash equivalents | | | 42,573 | | | 15,398 | | | | — | | | | 57,971 | |
Cash and cash equivalents at beginning of year | | | 29,713 | | | (19,132 | ) | | | — | | | | 10,581 | |
Cash and cash equivalents at end of year | | $ | 72,286 | | $ | (3,734 | ) | | $ | — | | | $ | 68,552 | |
NOTE 21. SUPPLEMENTAL OIL AND GAS INFORMATION (UNAUDITED)
Oil and Natural Gas Reserves
Users of this information should be aware that the process of estimating quantities of proved oil and natural gas reserves is very complex, and requires significant subjective decisions in the evaluation of the available geological, engineering and economic data for each reservoir. The data for a given reservoir may also change substantially over time as a result of numerous factors including, but not limited to, additional development activity, evolving production history and changing operating and market conditions. As a result, revisions to existing reserve estimates may occur from time to time. Although reasonable effort is made to ensure the reported reserve estimates represent the most accurate assessments possible, the subjective decisions and variances in available data for various reservoirs make these estimates generally less precise than other estimates included in the financial statement disclosures.
There are numerous uncertainties inherent in estimating quantities of proved reserves and in projecting the future rates of production and timing of development expenditures. Reserve data represent estimates only and should not be construed as being exact. Moreover, the Standardized Measure of Oil and Gas (“SMOG”) should not be construed as the current market value of the proved oil and natural gas reserves or the costs that would be incurred to obtain equivalent reserves. A market value determination would include many additional factors including (a) anticipated future changes in natural gas and crude oil prices, production and development costs, (b) an allowance for return on investment, (c) the value of additional reserves, not considered proved at present, which may be recovered as a result of further exploration and development activities, and (d) other business risks.
Proved Reserves Summary
The following table illustrates the Partnership’s estimated net proved reserves attributable to its Upstream and Minerals Businesses, including changes, and proved developed reserves for the periods indicated, as estimated by Cawley, Gillespie and Associates. Oil and natural gas liquids prices for 2009 are based on a prior twelve month average West Texas Intermediate spot price of $61.08 per barrel and are adjusted for quality, transportation fees, and regional price differentials. Natural gas prices for 2009 are based on a prior 12 month average Henry Hub spot market price of $3.83 per MMBtu and are adjusted for energy content, transportation fees, and regional price differentials. All prices are held constant in accordance with SEC guidelines. All of the Partnership’s reserves are located in the United States.
| | | Proved Reserves |
| | | | | | | | | Natural Gas Liquids (MBbls) | |
Proved reserves, January 1, 2007 | | | — | | | | — | | | | — | |
Extensions and discoveries | | | — | | | | — | | | | — | |
Purchase of minerals in place | | | 9,816 | | | | 48,336 | | | | 5,727 | |
Production | | | (442 | ) | | | (2,456 | ) | | | (226 | ) |
Sale of minerals in place | | | — | | | | — | | | | — | |
Revision of previous estimates | | | 707 | | | | (1,237 | ) | | | 242 | |
Proved reserves, December 31, 2007 | | | 10,081 | | | | 44,643 | | | | 5,743 | |
| | | |
| | | Oil (MBbls) | | | Gas (MMcf) | | | Natural Gas Liquids (MBbls) |
Proved developed reserves, December 31, 2007 | | | 9,634 | | | | 38,868 | | | | 5,437 | |
Proved undeveloped reserves, December 31, 2007 | | | 447 | | | | 6,222 | | | | — | |
| | | Proved Reserves | |
| | | Oil (MBbls) | | | Gas (MMcf) | | | Natural Gas Liquids (MBbls) | |
Proved reserves, January 1, 2008 | | | 10,081 | | | | 44,643 | | | | 5,743 | |
Extensions and discoveries | | | 189 | | | | 3,566 | | | | 45 | |
Purchase of minerals in place | | | 3,513 | | | | 8,157 | | | | 1,432 | |
Production | | | (988 | ) | | | (5,400 | ) | | | (508 | ) |
Sale of minerals in place | | | — | | | | — | | | | — | |
Revision of previous estimates | | | (2,789 | ) | | | (6,378 | ) | | | (1,073 | ) |
Proved reserves, December 31, 2008 | | | 10,006 | | | | 44,588 | | | | 5,639 | |
| | | | | | | | | | | | | |
| | | Oil (MBbls) | | | Gas (MMcf) | | | Natural Gas Liquids (MBbls) | |
Proved developed reserves, December 31, 2008 | | | 9,200 | | | | 36,157 | | | | 4,883 | |
Proved undeveloped reserves, December 31, 2008 | | | 806 | | | | 8,431 | | | | 756 | |
| | | | |
| | | Proved Reserves | |
| | | Oil (MBbls) | | | Gas (MMcf) | | | Natural Gas Liquids (MBbls) | |
Proved reserves, January 1, 2009 | | | 10,006 | | | | 44,588 | | | | 5,639 | |
Extensions and discoveries | | | 298 | | | | 2,324 | | | | 241 | |
Purchase of minerals in place | | | 18 | | | | — | | | | — | |
Production | | | (984 | ) | | | (4,914 | ) | | | (513 | ) |
Sale of minerals in place | | | — | | | | — | | | | — | |
Revision of previous estimates | | | 1,114 | | | | (3,358 | ) | | | 738 | |
Proved reserves, December 31, 2009 | | | 10,452 | | | | 38,640 | | | | 6,105 | |
| | | | | | | | | | | | | |
| | | Oil (MBbls) | | | Gas (MMcf) | | | Natural Gas Liquids (MBbls) | |
Proved developed reserves, December 31, 2009 | | | 10,058 | | | | 31,082 | | | | 5,410 | |
Proved undeveloped reserves, December 31, 2009 | | | 394 | | | | 7,558 | | | | 695 | |
In 2009, we experienced significant revisions to our proved reserves. We revised our oil and natural gas liquids reserves upwards due to changes in production forecasts and engineering factors such as condensate and natural gas liquids yields. We also revised our natural gas reserves downward due to technical factors (such as increased shrinkage related to fuel usage and plant processing) and economic factors. Revisions due to economic factors are due to the relatively low prior twelve month average natural gas price that was used to determine our reserves and higher operating cost estimates in our Permian Basin operations. We also experienced negative oil and natural gas revisions in our Permian Basin operations, particularly in our lease in the Ward Estes and surrounding fields. These revisions were primarily due to poorer than expected performance in recent San Andres drilling and recompletions, changes to decline curves to reflect recent production performance, and the upward adjustment of operating costs which rendered several leases non-commercial. We are working to improve our cost structure on these leases and are optimistic that some of these negative reserves may be reversed in the future.
Proved Reserves Summary – Equity Method Entities
We own a 13.2% limited partner interest in Ivory Working Interests, L.P. (IWI), and we account for the results of this interest using the equity method. We acquired this interest in 2007 as part of the Montierra Acquisition. IWI is a private partnership engaged primarily in oil and gas operations and is managed by its General Partner under the control of Black Stone Minerals Corporation (the “Minerals Manager”). IWI is not required to make public disclosures of its proved reserves and the agreements that govern our rights as limited partners in IWI do not require Black Stone to provide us with detailed reserves data of the type that would be sufficient to make all of the disclosures that the SEC now requires with respect to the proved reserves of equity method entities. As a result, we lack the data needed to prepare the Supplemental Oil and Gas Disclosure for our equity interests.
Capitalized Costs Relating to Oil and Natural Gas Producing Activities
The following table illustrates the total amount of capitalized costs relating to oil and natural gas producing activities and the total amount of related accumulated depreciation, depletion and amortization (in thousands) at December 31, 2009, 2008 and 2007:
| | | As of December 31, 2009 | | | As of December 31, 2008 | | | As of December 31, 2007 | |
| ($ in thousands) | | | | | | | | | |
Evaluated properties | | $ | 512,545 | | | $ | 515,452 | | | $ | 487,481 | |
Unevaluated properties—excluded from depletion | | | 72,174 | | | | 73,622 | | | | 66,023 | |
Gross oil and gas properties | | | 584,719 | | | | 589,074 | | | | 553,504 | |
Accumulated depreciation, depletion, amortization | | | (116,652 | ) | | | (76,636 | ) | | | (23,865 | ) |
Net oil and gas properties | | $ | 468,067 | | | $ | 512,438 | | | $ | 529,639 | |
Costs Incurred in Oil and Natural Gas Property Acquisition, Exploration and Development Activities
Costs incurred in property acquisition, exploration and development activities were as follows (in thousands) for the years ended December 31, 2009, 2008 and 2007:
| | | As of December 31, 2009 | | | As of December 31, 2008 | | | As of December 31, 2007 | |
| ($ in thousands) | | | | | | | | | |
Property acquisition costs, proved | | $ | 512 | | | $ | 110,747 | | | $ | 464,204 | |
Property acquisition costs, unproved | | | 20 | | | | 7,597 | | | | 66,023 | |
Exploration and extension well costs | | | 1 | | | | 1,610 | | | | — | |
Development costs | | | 8,137 | | | | 12,294 | | | | 3,429 | |
Total costs | | $ | 8,670 | | | $ | 132,248 | | | $ | 533,656 | |
Our exploration and extension well costs are primarily related to low risk drilling around our existing fields.
Standardized Measure of Discounted Future Net Cash Flows Relating to Proved Oil and Natural Gas Reserves
The following information has been developed utilizing authoritative guidance procedures and is based on oil and natural gas reserves estimated by the Partnership’s independent reserves engineer. It can be used for some comparisons, but should not be the only method used to evaluate the Partnership or its performance. Further, the information in the following table may not represent realistic assessments of future cash flows, nor should the Standardized Measure of Discounted Future Net Cash Flow be viewed as representative of the current value of the Partnership.
The Partnership believes that the following factors should be taken into account when reviewing the following information:
| | • | future costs and selling prices will probably differ from those required to be used in these calculations; |
| | • | due to future market conditions and governmental regulations, actual rates of production in future years may vary significantly from the rate of production assumed in the calculations; and |
| | • | a 10% discount rate may not be reasonable as a measure of the relative risk inherent in realizing future net oil and natural gas revenues. |
Under the Standardized Measure, future cash inflows were estimated by applying year-end oil and natural gas prices to the estimated future production of year-end proved reserves. Estimates of future income taxes are computed using current statutory income tax rates including consideration for estimated future statutory depletion and tax credits. The resulting net cash flows are reduced to present value amounts by applying a 10% discount factor.
In our 2009 Standardized Measure calculations we have included the future revenues that would be associated with the sales of sulfur; however the cash flows only partially offset the costs of transporting and marketing the sulfur. As such, it is a net negative cash flow in our Standardized Measure. Also, we have included the expected impact of the retained revenue interests as a revenue reduction.
The recent changes to the disclosure rules relating to proved reserves require the inclusion of our share of the reserves associated with entities that we report under the equity method. As discussed above, we acquired these interests prior to December 31, 2009 and we do not have the right and have been unable to gather the data needed to include these reserves in our Standardized Measure calculations. Consequently, the tables below reflect only the reserves for our consolidate entities.
The Standardized Measure is as follows (in thousands) as of December 31, 2009, 2008 and 2007:
| | | As of December 31, 2009 | | | As of December 31, 2008 | | | As of December 31, 2007 | |
| ($ in thousands) | | | | | | | | | |
Future cash inflows | | $ | 827,586 | | | $ | 788,154 | | | $ | 1,565,539 | |
Future production costs | | | (321,139 | ) | | | (322,931 | ) | | | (500,240 | ) |
Future development costs | | | (72,577 | ) | | | (60,189 | ) | | | (10,045 | ) |
Future net cash flows before income taxes | | | 433,870 | | | | 405,034 | | | | 1,055,254 | |
Future income tax benefit | | | 384 | | | | 1,895 | | | | — | |
Future net cash flows before 10% discount | | | 434,254 | | | | 406,929 | | | | 1,055,254 | |
10% annual discount for estimated timing of cash flows | | | (219,601 | ) | | | (197,185 | ) | | | (498,294 | ) |
Standardized measure of discounted future net cash flows | | $ | 214,653 | | | $ | 209,744 | | | $ | 556,960 | |
Changes in Standardized Measure of Discounted Future Net Cash Flows Relating to Proved Oil and Natural Gas Reserves
The following is a summary of the changes in the Standardized Measure of discounted future net cash flows for the Partnership’s proved oil and natural gas reserves for the years ended December 31, 2009, 2008 and 2007 (in thousands).
| | | As of December 31, 2009 | | | As of December 31, 2008 | | | As of December 31, 2007 | |
| ($ in thousands) | | | | | | | | | |
Beginning of year | | $ | 209,744 | | | $ | 556,960 | | | $ | — | |
Sale of oil and gas produced, net of production costs | | | (52,791 | ) | | | (127,125 | ) | | | (48,294 | ) |
Net changes in prices and production costs | | | 16,044 | | | | (293,537 | ) | | | 99,252 | |
Extensions, discoveries and improved recovery, less related costs | | | 10,148 | | | | 8,842 | | | | — | |
Previously estimated development costs incurred during the period | | | (8,137 | ) | | | (12,294 | ) | | | 888 | |
Net changes in future development costs | | | 8,733 | | | | 11,766 | | | | — | |
Revisions of previous quantity estimates | | | 16,115 | | | | (49,546 | ) | | | 26,110 | |
Purchases of property | | | 347 | | | | 45,239 | | | | 459,041 | |
Sales of property | | | — | | | | — | | | | — | |
Accretion of discount | | | 19,006 | | | | 50,531 | | | | 21,274 | |
Net changes in income taxes | | | (927 | ) | | | 1,033 | | | | — | |
| Other | | | (3,629 | ) | | | 17,875 | | | | (1,311 | ) |
End of year | | $ | 214,653 | | | $ | 209,744 | | | $ | 556,960 | |
Results of Operations
The following are the results of operations for the Partnership’s oil and natural gas producing activities for the years ended December 31, 2009, 2008 and 2007 (in thousands):
| Year Ended December 31, | | 2009 | | | 2008 | | | 2007 | |
| ($ in thousands) | | | | | | | | | |
Revenues | | $ | 80,379 | | | $ | 166,948 | | | $ | 64,934 | |
| Costs and expenses: | | | | | | | | | | | | |
Production costs | | | 27,588 | | | | 39,823 | | | | 16,640 | |
General and administrative | | | 5,151 | | | | 4,282 | | | | 1,593 | |
Depreciation, depletion, and amortization | | | 40,016 | | | | 52,771 | | | | 24,262 | |
Impairment | | | 8,388 | | | | 108,758 | | | | 5,749 | |
Total costs and expenses | | | 81,414 | | | | 205,634 | | | $ | 48,244 | |
Results of operations | | $ | (764 | ) | | $ | (38,686 | ) | | $ | 16,690 | |
* * * *
Index to Exhibits
Exhibit Number | Description |
| | |
| 2.1 | Partnership Interests Purchase and Contribution Agreement By and Among Laser Midstream Energy II, LP, Laser Gas Company I, LLC, Laser Midstream Company, LLC, Laser Midstream Energy, LP, and Eagle Rock Energy Partners, L.P., dated as of March 30, 2007 (incorporated by reference to Exhibit 2.1 of the registrant’s registration statement on Form S-1 (File No. 333-144938)) |
| | |
| 2.2 | Partnership Interests Contribution Agreement By and Among Montierra Minerals & Production, L.P., NGP Minerals, L.L.C. (Montierra Management LLC) and Eagle Rock Energy Partners, L.P., dated as of March 31, 2007 (incorporated by reference to Exhibit 2.2 of the registrant’s registration statement on Form S-1 (File No. 333-144938)) |
| | |
| 2.3 | Asset Contribution Agreement By and Among NGP 2004 Co-Investment Income, L.P., NGP Co-Investment Income Capital Corp., NGP-VII Income Co-Investment Opportunity, L.P., and Eagle Rock Energy Partners, L.P., dated as of March 31, 2007 (incorporated by reference to Exhibit 2.3 of the registrant’s registration statement on Form S-1 (File No. 333-144938)) |
| | |
| 2.4 | Contribution and Sale Agreement By and Among Eagle Rock Energy Partners, L.P., Redman Energy Holdings, L.P. and Certain Other Parties Named Therein, dated July 11, 2007 (incorporated by reference to Exhibit 2.4 of the registrant’s registration statement on Form S-1 (File No. 333-144938)) |
| | |
| 2.5 | Contribution and Sale Agreement By and Among Eagle Rock Energy Partners, L.P., Redman Energy Holdings II, L.P. and Certain Other Parties Named Therein, dated July 11, 2007 (incorporated by reference to Exhibit 2.5 of the registrant’s registration statement on Form S-1 (File No. 333-144938)) |
| | |
| 2.6 | Asset Contribution Agreement By and Among NGP Co-Investment Opportunities Fund II, L.P. and Eagle Rock Energy Partners, L.P., dated July 11, 2007 (incorporated by reference to Exhibit 2.6 of the registrant’s registration statement on Form S-1 (File No. 333-144938)) |
| | |
| 2.7 | Stock Purchase Agreement dated April 2, 2008 among Eagle Rock Energy Partners, L.P., Stanolind Holdings, L.P. and Stanolind Oil and Gas Corp. (incorporated by reference to Exhibit 2.8 of the registrant’s current report on Form 8-K filed with the Commission on April 4, 2008 (File No. 001-33016)) |
| | |
| 2.8 | Partnership Interests Purchase Agreement dated September 11, 2008, as amended, among Eagle Rock Energy Partners, L.P. and Millennium Midstream Partners, L.P. (incorporated by reference to Exhibit 2.1 of the registrant’s quarterly period for the period ended September 20, 2008 filed with the Commission on November 10, 2008 (File No. 001-33016)) |
| | |
| 2.9 | Amendment No. 2 to the Partnership Interests Purchase Agreement dated February 9, 2009 among Eagle Rock Energy Partners, L.P. and Millennium Midstream Partners, L.P. (incorporated by reference to Exhibit 2.9 of the registrant’s annual report on Form 10-K filed with the Commission on March 13, 2009) |
| | |
| 2.10 | Amendment No. 3 to the Partnership Interests Purchase Agreement dated February 27, 2009 among Eagle Rock Energy Partners, L.P. and Millennium Midstream Partners, L.P. (incorporated by reference to Exhibit 2.10 of the registrant’s annual report on Form 10-K filed with the Commission on March 13, 2009) |
| | |
2.11 | Purchase and Sale Agreement dated December 21, 2009 among Eagle Rock Pipeline GP,LLC, EROC Production, LLC and BSAP II GP, L.L.C. (incorporated by reference to Exhibit 2.1 of the registrant’s current report on Form 8-K filed with the Commission on December 21, 2009) |
| 3.1 | Certificate of Limited Partnership of Eagle Rock Energy Partners, L.P. (incorporated by reference to Exhibit 3.1 of the registrant’s registration statement on Form S-1 (File No. 333-134750)) |
| | |
| 3.2 | First Amended and Restated Agreement of Limited Partnership of Eagle Rock Energy Partners, L.P. (incorporated by reference to Exhibit 3.1 of the registrant’s current report on Form 8-K filed with the Commission on October 31, 2006) |
| | |
| 3.3 | Certificate of Limited Partnership of Eagle Rock Energy GP, L.P. (incorporated by reference to Exhibit 3.3 of the registrant’s registration statement on Form S-1 (File No. 333-134750)) |
| | |
| 3.4 | Limited Partnership Agreement of Eagle Rock Energy GP, L.P. (incorporated by reference to Exhibit 3.4 of the registrant’s registration statement on Form S-1 (File No. 333-134750)) |
| | |
| 3.5 | Certificate of Formation of Eagle Rock Energy G&P, LLC (incorporated by reference to Exhibit 3.5 of the registrant’s registration statement on Form S-1 (File No. 333-134750)) |
| | |
| 3.6 | Second Amended and Restated Limited Liability Company Agreement of Eagle Rock Energy G&P, LLC (incorporated by reference to Exhibit 3.2 of the registrant’s current report on Form 8-K filed with the Commission on October 31, 2006) |
| | |
| 4.1 | Registration Rights Agreement dated March 27, 2006, among Eagle Rock Pipeline, L.P. and the Purchasers listed thereto (incorporated by reference to Exhibit 4.1 of the registrant’s registration statement on Form S-1 (File No. 333-134750)) |
| | |
| 4.3 | Registration Rights Agreement between Eagle Rock Energy Partners, L.P. and Eagle Rock Holdings, L.P. (incorporated by reference to Exhibit 4.1 of the registrant’s current report on Form 8-K filed with the Commission on October 31, 2006) |
| | |
| 4.4 | Form of Common Unit Certificate (included as Exhibit A to the Amended and Restated Partnership Agreement of Eagle Rock Energy Partners, L.P., which is included as Appendix A to the Prospectus) (incorporated by reference to Exhibit 3.2 of the registrant’s registration statement on Form S-1 (File No. 333-134750)) |
| | |
| 4.5 | Registration Rights Agreement dated May 2, 2007, among Eagle Rock Energy Partners, L.P. and the purchasers listed thereto (incorporated by reference to Exhibit 4.5 of the registrant’s registration statement on Form S-1 (File No. 333-144938)) |
| | |
| 4.6 | Registration Rights Agreement dated July 31, 2007, among Eagle Rock Energy Partners, L.P. and the purchasers listed thereto (incorporated by reference to Exhibit 4.6 of the registrant’s registration statement on Form S-1 (File No. 333-144938)) |
| | |
| 4.7 | Registration Rights Agreement dated April 30, 2007, between Eagle Rock Energy Partners, L.P. and NGP-VII Income Co-Investment Opportunities, L.P. (incorporated by reference to Exhibit 4.7 of the registrant’s registration statement on Form S-1 (File No. 333-144938)) |
| | |
| 4.8 | Registration Rights Agreement dated April 30, 2007, between Eagle Rock Energy Partners, L.P. and Montierra Minerals & Production, L.P. (incorporated by reference to Exhibit 4.8 of the registrant’s registration statement on Form S-1 (File No. 333-144938)) |
| | |
| 10.1 | Amended and Restated Credit and Guaranty Agreement (incorporated by reference to Exhibit 3.1 of the registrant’s registration statement on Form S-1 (File No. 333-134750)) |
| | |
| 10.2 | Omnibus Agreement (incorporated by reference to Exhibit 10.1 of the registrant’s current report on Form 8-K filed with the Commission on October 31, 2006) |
| | |
| 10.3** | Eagle Rock Energy Partners, L.P. Long-Term Incentive Plan (incorporated by reference to Exhibit 10.3 of the registrant’s registration statement on Form S-1 (File No. 333-134750)) |
Exhibit Number | Description |
| 10.4 | Sale, Contribution and Exchange Agreement by and among the general and limited partners of Midstream Gas Services, L.P., Eagle Rock Energy Services, L.P. and Eagle Rock Pipeline, L.P. (incorporated by reference to Exhibit 10.4 of the registrant’s registration statement on Form S-1 (File No. 333-134750)) |
| | |
| 10.5† | Natural Gas Liquids Exchange Agreement by and between ONEOK Hydrocarbon, L.P. and ONEOK Texas Field Services, L.P. (incorporated by reference to Exhibit 10.5 of the registrant’s registration statement on Form S-1 (File No. 333-134750)) |
| | |
| 10.6 | Gas Sales and Purchase Agreement between MC Panhandle, Inc. (Chesapeake Energy Marketing Inc.) and MidCon Gas Services Corp. (Eagle Rock Field Services, L.P.) (incorporated by reference to Exhibit 10.6 of the registrant’s registration statement on Form S-1 (File No. 333-134750)) |
| | |
| 10.7 | Brookeland Gas Facilities Gas Gathering and Processing Agreement between Union Pacific Resources Company (Anadarko E&P Company LP) and Sonat Exploration Company (Eagle Rock Field Services, L.P.) (incorporated by reference to Exhibit 10.7 of the registrant’s registration statement on Form S-1 (File No. 333-134750)) |
| | |
| 10.8† | Minimum Volume Agreement between ONEOK Texas Field Services L.P. and Peak Operating of Texas, LLC (incorporated by reference to Exhibit 10.8 of the registrant’s registration statement on Form S-1 (File No. 333-134750)) |
| | |
| 10.9† | Gas Purchase Agreement between ONEOK Texas Field Services L.P. and Peak Operating of Texas, LLC (incorporated by reference to Exhibit 10.9 of the registrant’s registration statement on Form S-1 (File No. 333-134750)) |
| | |
| 10.10 | Gas Purchase Contract between Warren Petroleum Company (Eagle Rock Field Services, L.P.) and Wallace Oil & Gas, Inc. (Cimarex Energy Co.) (incorporated by reference to Exhibit 10.10 of the registrant’s registration statement on Form S-1 (File No. 333-134750)) |
| | |
| 10.11 | Contribution, Conveyance and Assumption Agreement (incorporated by reference to Exhibit 10.3 of the registrant’s current report on Form 8-K filed with the Commission on October 31, 2006) |
| | |
| 10.13 | Base Contract for Sale and Purchase of Natural Gas between Eagle Rock Field Services, L.P. and Odyssey Energy Services, LLC (incorporated by reference to Exhibit 10.13 of the registrant’s registration statement on Form S-1 (File No. 333-134750)) |
| | |
| 10.14 | Common Unit Purchase Agreement By and Among Eagle Rock Energy Partners, L.P. and The Purchasers Named Therein, dated March 30, 2007 (incorporated by reference to Exhibit 10.14 of the registrant’s registration statement on Form S-1 (File No. 333-144938)) |
| | |
| 10.15 | Common Unit Purchase Agreement By and Among Eagle Rock Energy Partners, L.P. and The Purchasers Named Therein, dated July 11, 2007 (incorporated by reference to Exhibit 10.15 of the registrant’s registration statement on Form S-1 (File No. 333-144938)) |
| | |
| 10.17** | Form of Award Agreement pursuant to the Eagle Rock Energy Partners, L.P. Long-Term Incentive Plan (incorporated by reference to Exhibit 10.14 of the Form 8-K filed with the Commission on May 22, 2007) |
| | |
| 10.18 | Credit Agreement dated December 13, 2007 among Eagle Rock Energy Partners, L.P. and Wachovia Bank, National Association, as administrative agent and swingline lender, Bank of America, N.A., as syndication agent, HSH Nordbank AG, New York Branch, the Royal Bank of Scotland, plc, and BNP Paribas, as co-documentation agents, and the other lenders who are parties thereto (incorporated by reference to Exhibit 10.17 of the Form 8-K filed with the Commission on December 13, 2007) |
Exhibit Number | Description |
| | |
| 10.19**† | Eagle Rock Energy G&P, LLC 2009 Short Term Incentive Bonus Plan effective February 4, 2009 (incorporated by reference to Exhibit 10.1 of the registrant’s current report on Form 8-K filed with the Commission on February 9, 2009) |
| | |
| 10.20 | Eagle Rock Energy Partners Long-Term Incentive Plan (Amended and Restated Effective February 4, 2009) (incorporated by reference to Exhibit 10.20 of the Registrant’s Annual Report on Form 10-K filed with the Commission on March 13, 2009) |
| | |
| 10.21** | Form of Supplemental Indemnification Agreement among Eagle Rock Energy G&P, LLC, Eagle Rock Energy GP, L.P., Eagle Rock Energy Partners, L.P. and officers and directors of Eagle Rock Energy G&P, LLC (incorporated by reference to Exhibit 10.1 of the registrant’s current report on Form 8-K filed with the Commission on December 30, 2009) |
| | |
| 10.22** | Form of Eagle Rock Energy Partners Long-Term Incentive Plan Restricted Unit Agreement for Officers (incorporated by reference to Exhibit 10.2 of the registrant’s current report on Form 8-K filed with the Commission on December 30, 2009) |
| | |
| 10.23**† | Eagle Rock Energy G&P, LLC 2010 Short Term Incentive Bonus Plan approved and adopted on December 30, 2009 (incorporated by reference to Exhibit 10.3 of the registrant’s current report on Form 8-K filed with the Commission on December 30, 2009) |
| 10.24** | Form of Eagle Rock Energy Partners Long-Term Incentive Plan Restricted Unit Agreement for Non-Employee Directors (incorporated by reference to Exhibit 10.4 of the registrant’s current report on Form 8-K filed with the Commission on December 30, 2009) |
| | |
| 10.25 | Amended and Restated Securities Purchase and Global Transaction Agreement dated January 12, 2010 among Natural Gas Partners VII, L.P., Natural Gas Partners VIII, L.P., Montierra Minerals & Production, L.P., Montierra Management LLC, Eagle Rock Holdings, L.P., Eagle Rock Energy G&P, LLC, Eagle Rock Energy GP, L.P. and Eagle Rock Energy Partners, L.P. (incorporated by reference to Exhibit 10.1 of the registrant’s current report on Form 8-K filed with the Commission on January 12, 2010) |
| | |
| 10.26 | Credit Facility Amendment, dated as of March 8, 2010, by and among Eagle Rock Energy Partners, L.P., as borrower, Wachovia Back, N/A., Bank of America, N.A., HSH Nordbank AG, New York Branch, The Royal Bank of Scotland, PLC, BNP Paribas and the other lenders party threeto, and the Guarantors thereto (incorporated by reference to Exhibit 10.1 of the Registrant's Current Report on Form 8-K file with the Commisision on March 9, 2010) |
| | |
| 14.1 | Code of Ethics for Chief Executive Officer and Senior Financial Officers posted on the Company’s website at www.eaglerockenergy.com. |
| | |
| 21.1* | List of Subsidiaries of Eagle Rock Energy Partners, L.P. |
| | |
| 23.1* | Consent of Deloitte & Touche LLP |
| | |
| 23.2* | Consent of Cawley, Gillespie & Associates, Inc. |
| | |
| 23.3* | Consent of K.E. Andrews & Company |
| | |
| 31.1* | Certification of Periodic Financial Reports by Joseph A. Mills in satisfaction of Section 302 of the Sarbanes-Oxley Act of 2002 |
| | |
| 31.2* | Certification of Periodic Financial Reports by Jeffrey P. Wood in satisfaction of Section 302 of the Sarbanes-Oxley Act of 2002 |
| | |
| 32.1* | Certification of Periodic Financial Reports by Joseph A. Mills in satisfaction of Section 906 of the Sarbanes-Oxley Act of 2002 |
| | |
| 32.2* | Certification of Periodic Financial Reports by Jeffrey P. Wood in satisfaction of Section 906 of the Sarbanes-Oxley Act of 2002 |
| | |
| 99.1* | Report of Cawley, Gillespie & Associates, Inc. |
| ** | Management contract or compensatory plan or arrangement required to be filed as an exhibit hereto. |
| † | Portions of this exhibit have been omitted pursuant to a request for confidential treatment. |