UNITED STATES
SECURITIES AND EXCHANGE COMMISSION
Washington, D.C. 20549
Form 10-K
|
| |
| x | ANNUAL REPORT PURSUANT TO SECTION 13 OR 15(d) OF THE SECURITIES EXCHANGE ACT OF 1934 |
For the fiscal year ended December 31, 2011
OR
|
| |
| o | TRANSITION REPORT PURSUANT TO SECTION 13 OR 15(d) OF THE SECURITIES EXCHANGE ACT OF 1934 |
For the transition period from ________ to ________
Commission File No. 001-33016
EAGLE ROCK ENERGY PARTNERS, L.P.
(Exact Name of Registrant as Specified in Its Charter)
|
| | |
| Delaware | | 68-0629883 |
(State or other jurisdiction of incorporation or organization) | | (I.R.S. Employer Identification Number) |
1415 Louisiana Street, Suite 2700
Houston, Texas 77002
(Address of principal executive offices, including zip code)
(281) 408-1200
(Registrant's telephone number, including area code)
Securities registered pursuant to Section 12(b) of the Act:
|
| | |
Title of Each Class | | Name of Each Exchange on Which Registered |
| Common Units of Limited Partner Interests | | NASDAQ Global Select Market |
| Warrants to Purchase Common Units of Limited Partner Interests | | NASDAQ Global Select Market |
Securities registered pursuant to Section 12(g) of the Act:
None
Indicate by check mark if the registrant is a well-known seasoned issuer, as defined in Rule 405 of the Securities Act. Yes x No o
Indicate by check mark if the registrant is not required to file reports pursuant to Section 13 or Section 15(d) of the Exchange Act. Yes o No x
Indicate by check mark whether the registrant (1) has filed all reports required to be filed by Section 13 or 13(d) of the Securities Exchange Act of 1934 during the preceding 12 months (or for such shorter period that the registrants was required to file such reports), and (2) has been subject to such filing requirements for the past 90 days. Yes x No o
Indicate by check mark whether the registrant has submitted electronically and posted on its corporate website, if any, every Interactive Data File required to be submitted and posted pursuant to Rule 405 of Regulation S-T (§232.405 of this chapter) during the preceding 12 months (or for such shorter period that the registrant was required to submit and post such files). Yes x No o
Indicate by check mark if disclosure of delinquent filers pursuant to Item 405 of Regulation S-K (§229.405) is not contained herein, and will not be contained, to the best of registrant's knowledge, in definitive proxy or information statements incorporated by reference in Part III of this Form 10-K or any amendment to this Form 10-K. o
Indicate by check mark whether the registrant is a large accelerated filer, an accelerated filer, a non-accelerated filer, or a smaller reporting company. See the definitions of “large accelerated filer,” “accelerated filer” and “smaller reporting company” in Rule 12b-2 of the Exchange Act. (Check one):
|
| |
Large accelerated Filer x | Accelerated Filer o |
Non-accelerated Filer o | Smaller reporting company o |
(Do not check if a smaller reporting company)
Indicate by check mark whether the registrant is a shell company (as defined in Rule 12b-2 of the Exchange Act). Yes o No x
As of June 30, 2011, the aggregate market value of the registrant's common units held by non-affiliates of the registrant was $796,742,707 based on the closing sale price as reported on NASDAQ Global Select Market.
The issuer had 130,193,859 common units outstanding as of February 20, 2012.
DOCUMENTS INCORPORATED BY REFERENCE:
Portions of the registrant's definitive proxy statement for its 2012 Annual Meeting of Stockholders, which will be filed with the Securities and Exchange Commission within 120 days of December 31, 2011, are incorporated by reference into Part III of this report for the year ended December 31, 2011.
TABLE OF CONTENTS
|
| | |
| | | Page |
| PART I |
| Item 1. | Business | |
| Item 1A. | Risk Factors | |
| Item 1B. | Unresolved Staff Comments | |
| Item 2. | Properties | |
| Item 3. | Legal Proceedings | |
| Item 4. | Mine Safety Disclosures | |
| PART II |
| Item 5. | Market for Registrant’s Common Equity, Related Unitholder Matters and Issuer Purchases of Equity Securities | |
| Item 6. | Selected Financial Data | |
| Item 7. | Management’s Discussion and Analysis of Financial Condition and Results of Operations | |
| Item 7A. | Quantitative and Qualitative Disclosures About Market Risk | |
| Item 8. | Financial Statements and Supplementary Data | |
| Item 9. | Changes in and Disagreements With Accountants on Accounting and Financial Disclosure | |
| Item 9A. | Controls and Procedures | |
| Item 9B. | Other Information | |
| PART III |
| Item 10. | Directors, Executive Officers and Corporate Governance | |
| Item 11. | Executive Compensation | |
| Item 12. | Security Ownership of Certain Beneficial Owners and Management and Related Unitholder Matters | |
| Item 13. | Certain Relationships and Related Transactions, and Director Independence | |
| Item 14. | Principal Accounting Fees and Services | |
| PART IV |
| Item 15. | Exhibits and Financial Statement Schedules | |
CAUTIONARY NOTE REGARDING FORWARD-LOOKING STATEMENTS
This report may include “forward-looking statements” as defined by the SEC. All statements, other than statements of historical facts, included in this report that address activities, events or developments that we expect, believe or anticipate will or may occur in the future are forward-looking statements. These statements are based on certain assumptions made by us based on our experience and perception of historical trends, current conditions, expected future developments and other factors we believe are appropriate under the circumstances. Such statements are subject to a number of assumptions, risks and uncertainties, many of which are beyond our control, which may cause our actual results to differ materially from those implied or expressed by the forward-looking statements. We do not assume any obligation to update such forward-looking statements following the date of this report. For a complete description of known material risks, please read our risk factors set forth under Item 1A of this Annual Report on Form 10-K. These factors include but are not limited to:
| |
| • | Drilling and geological / exploration risks; |
| |
| • | Assumptions regarding oil and natural gas reserve levels and costs to exploit and timing of development; |
| |
| • | Volatility or declines in commodity prices; |
| |
| • | Our significant existing indebtedness, including indebtedness we assumed in connection with our acquisition of CC Energy II, L.L.C. (the "Crow Creek Acquisition"),which we closed in May 2011; |
| |
| • | Ability to obtain credit and access capital markets; |
| |
| • | Ability to remain in compliance with the covenants set forth in our credit facility; |
| |
| • | Conditions in the securities and/or capital markets; |
| |
| • | Future processing volumes and throughput; |
| |
| • | Loss of significant customers; |
| |
| • | Availability and cost of processing and transportation of NGLs; |
| |
| • | Competition in the oil and natural gas industry; |
| |
| • | Relevant legislative or regulatory changes, including retroactive royalty or production tax regimes, changes in environmental, health and safety regulation, hydraulic fracturing regulation, environmental risks and liability under federal, state and foreign environmental laws and regulations; |
| |
| • | Ability to make favorable acquisitions and integrate operations from such acquisitions, including our Crow Creek Acquisition; |
| |
| • | Shortages of personnel and equipment; |
| |
| • | Potential losses associated with trading in derivative contracts; |
| |
| • | Increases in interest rates; |
| |
| • | Creditworthiness of our counterparties; |
| |
| • | Weather, including the occurrence of any adverse weather conditions and/or natural disasters affecting our business; |
| |
| • | Any other factors that impact or could impact the exploration of oil or natural gas resources, including but not limited to the geology of a resource, the total amount and costs to develop recoverable reserves, legal title, regulatory, natural gas administration, marketing and operations factors relating to the extraction of oil and natural gas; and |
| |
| • | Tax risk associated with pass-through investment, including potential reduction in tax shield or creation of phantom income in the event distributions are not enough to support the tax burden. |
GLOSSARY OF OIL AND GAS TERMS
The following is a description of the meanings of some of the oil and gas industry terms that may be used in this report. The definitions of proved reserves, proved developed reserves, and proved undeveloped reserves have been abbreviated from the applicable definitions contained in Rule 4-10(a) (2-4) of Regulation S-X.
Bbl: One stock tank barrel, or 42 U.S. gallons liquid volume, of crude oil or other liquid hydrocarbons.
Bbl/d: One stock tank barrel, or 42 U.S. gallons liquid volume, of crude oil or other liquid hydrocarbons per day.
Bbtu: One billion British thermal units.
Bcf: One billion cubic feet of natural gas.
Bcf/d: One billion cubic feet of natural gas per day.
Bcfe: One billion cubic feet of natural gas equivalent, using a ratio of six Mcf of natural gas to one Bbl of crude oil and NGLs.
Boe: One barrel of oil equivalent, determined using a ratio of six Mcf of natural gas to one Bbl of crude oil.
Boe/d: One barrel of oil equivalent, determined using a ratio of six Mcf of natural gas to one Bbl of crude oil and NGLs per day.
btu: British thermal unit.
development well: A well drilled within the proved area of a natural gas or oil reservoir to the depth of a stratigraphic horizon known to be productive.
dry gas: Natural gas that does not require plant processing prior to delivery to the interstate or intrastate pipeline systems.
dry hole: A well found to be incapable of producing hydrocarbons in sufficient quantities such that proceeds from the sale of such production would exceed production expenses, taxes and future capital.
equity liquids or gallons: Natural gas liquid and condensate production that equates to an entity's contractual share of the production.
exploitation: A drilling, recompletion, workover or other project which may target proven or unproven reserves (such as probable or possible reserves), but which generally has a lower risk than with exploration projects.
exploratory well: A well drilled to find and produce oil or natural gas reserves in an unproved area, to find new reservoir in a field previously found to be productive or oil or natural gas in another reservoir or to extend a known reservoir.
fee mineral or fee mineral interest: A perpetual ownership of all or a portion of the oil, natural gas and other naturally-occurring substances that lie beneath the surface of the earth in a specific area.
field: An area consisting of a single reservoir or multiple reservoirs, all grouped on or related to the same individual geological structural feature and/or stratigraphic condition.
finding and development cost (F&D): Total capital costs, including leasing and exploration expenses, spent to place reserves into production; often expressed as a unit cost, such as $/Mcfe or $/Boe, which are derived by dividing the costs by the reserves.
frac spread: The difference between the value of the NGLs produced and the cost of the processed gas used to replace the thermal equivalent value of those NGLs in a keep-whole arrangement.
gpm: Gallons of natural gas liquids per million cubic feet of gas.
gross acres or gross wells: The total acres or wells, as the case may be, in which a working interest is owned.
Hp: Horsepower.
LT/d: Long tons per day.
MBbls: One thousand barrels of crude oil or other liquid hydrocarbons.
MBO/d: One thousand barrels of crude oil or other liquid hydrocarbons per day.
MBoe: One thousand barrels of oil equivalent, determined using a ratio of six Mcf of natural gas to one Bbl of crude oil.
MBoe/d: One thousand barrels of oil equivalent per day.
Mcf: One thousand cubic feet of natural gas.
Mcf/d: One thousand cubic feet of natural gas per day.
Mcfe: One thousand cubic feet of natural gas equivalent, determined using a ratio of six Mcf of natural gas to one Bbl of crude oil and NGLs.
MMBbls: One million barrels of crude oil or other liquid hydrocarbons.
MMBoe: One million barrels of oil equivalent.
MMBtu: One million British thermal units.
MMcf: One million cubic feet of natural gas.
MMcf/d: One million cubic feet of natural gas per day.
natural gas liquids or NGLs: The combination of ethane, propane, isobutane, normal butane and natural gasoline that may be removed from natural gas as a liquid under certain levels of pressure and temperature. Most NGLs are gases at room temperature and pressure.
net acres or net wells: The sum of the fractional working interests owned in gross acres or wells, as the case may be.
NYMEX: New York Mercantile Exchange.
oil: Crude oil and condensate.
overriding royalty or overriding royalty interest: A non-cost bearing interest in the production from a well that is carved out of the working interest. It expires when the underlying oil and/or natural gas lease expires.
probable locations: Locations that are near proved undeveloped locations, but do not meet the definition of a proved location.
productive well: A well that is found to be capable of producing hydrocarbons in sufficient quantities such that proceeds from the sale of such production exceeds production expenses and taxes.
proved developed reserves: Proved reserves that can be expected to be recovered from existing wells with existing equipment and operating methods.
proved locations: Locations that geological and engineering data demonstrate with reasonable certainty to recover reserves in future years from known reservoirs under existing economic and operating conditions.
proved reserves: The estimated quantities of crude oil, natural gas and natural gas liquids which geological and engineering data demonstrate with reasonable certainty to be recoverable in future years from known reservoirs under existing economic and operating conditions, i.e., prices and costs as of the date the estimate is made. Prices include consideration of changes in existing prices provided only by contractual arrangements, but not on escalations based on future conditions.
proved undeveloped reserves or PUDs: Proved reserves that are expected to be recovered from new wells on undrilled acreage or from existing wells where a relatively major expenditure is required for recompletion.
recompletion: The completion for production of an existing wellbore in another formation from that in which the well has been previously completed.
reserve life index: The number of years required to produce the proved reserves at the current annual production rate.
reservoir: A porous and permeable underground formation containing a natural accumulation of producible oil and/or natural gas that is confined by impermeable rock or water barriers and is individual and separate from other reserves.
royalty or royalty interest: A non-cost bearing interest in the production from a well that is created from a mineral interest when the minerals are leased to an operator. The royalty interest generally is retained by the mineral interest owner as part of the compensation for leasing the minerals.
standardized measure: The present value of estimated future net revenue to be generated from the production of proved reserves, determined in accordance with the rules and regulations of the SEC (using prices and costs in effect as of the date of estimation), less future
development, production and income tax expenses, and discounted at 10% per annum to reflect the timing of future net revenue. Standardized measure does not give effect to derivative transactions.
Tcf: One trillion cubic feet of natural gas.
undeveloped acreage: Lease acreage on which wells have not been drilled or completed to a point that would permit the production of commercial quantities of natural gas or oil regardless of whether or not such acreage contains proved reserves.
unit development cost (UDC): The capital expenditures required to develop proved reserves per unit of reserves added or transferred from undeveloped acreage non-producing acreage to proved developed producing reserves, expressed in $/Mcfe or $/Boe.
West Texas Intermediate or WTI: Light, sweet crude oil with high API gravity and low sulfur content used as the benchmark for U.S. crude oil refining and trading. NYMEX futures contracts for light, sweet crude oil specify the delivery of WTI at Cushing, Oklahoma.
wet gas: Natural gas that requires plant processing in order to meet the interstate and intrastate gas quality specifications.
working interest: The operating interest that gives the owner the right to drill, produce and conduct operating activities on the property/lease and to receive a share of production.
workover: Operations on a producing well to restore or increase production.
In this Annual Report on Form 10-K, as the context requires , references to “Eagle Rock Energy Partners, L.P.,” “Eagle Rock,” the “Partnership,” “we,” “our,” “us,” or like terms, refer to Eagle Rock Energy Partners, L.P. and/or one or more of its subsidiaries. References to our “general partner” refer to Eagle Rock Energy GP, L.P., and the general partner of Eagle Rock Energy GP, L.P., Eagle Rock Energy G&P, LLC, both wholly-owned subsidiaries of the Partnership. References to “Natural Gas Partners” or “NGP” refer to Natural Gas Partners VII, L.P. and Natural Gas Partners VIII, L.P. in the context of any description of our investors, and in other contexts refer to NGP Energy Capital Management, which manages a series of energy investment funds, including Natural Gas Partners VII, L.P. and Natural Gas Partners VIII, L.P. References to the “NGP Investors” refer to Natural Gas Partners and some of our directors and current and former members of our management team. References to our “Board of Directors” or "Board" refer to the board of directors of Eagle Rock Energy G&P, LLC.
PART I
Overview
We are based in the United States and are a domestically-focused, growth-oriented limited partnership engaged in the business of (i) gathering, compressing, treating, processing and transporting natural gas; fractionating and transporting natural gas liquids (“NGLs”); crude oil logistics and marketing; and natural gas marketing and trading, which collectively we call our “Midstream Business”; and (ii) developing and producing interests in oil and natural gas properties, which we call our “Upstream Business.”
Our objective is to grow our business in a manner that enhances our ability to increase cash distributions to our unitholders. To do so, we focus on achieving operational excellence in our businesses and executing accretive low-risk acquisitions and organic growth opportunities, and we allocate a portion of our cash flows to fund growth-related capital expenditures.
We are uniquely positioned as a publicly-traded partnership, or master limited partnership (“MLP”), that is engaged in both the midstream and upstream sectors of the oil and natural gas value chain. Our diversification broadens our spectrum of potential organic growth and acquisition opportunities, gives us a potential advantage in acquiring asset packages that involve both midstream and upstream assets, and enables us to exploit vertical integration synergies in selected regions of our operations.
Our Midstream Business is located in four significant natural gas producing regions: (i) the Texas Panhandle; (ii) East Texas/Louisiana; (iii) South Texas; and (iv) the Gulf of Mexico. These four regions are productive, mature, natural gas producing basins that have historically experienced significant drilling activity. Our natural gas gathering systems within these regions are comprised of approximately 5,583 miles of natural gas gathering pipelines with approximately 2,800 well connections, 17 natural gas processing plants with approximately 704 MMcf/d of plant processing capacity and 215,719 horsepower of compression. Our Midstream Business averaged 475 MMcf/d of gathered volumes and 388 MMcf/d of processed volumes during 2011.
Our Upstream Business has long-lived, high working interest properties located in four significant oil and gas producing regions: (i) Southern Alabama (which includes the associated gathering, processing and treating assets); (ii) Mid-Continent (which includes areas in Oklahoma, Arkansas, Texas Panhandle and North Texas); (iii) Permian (which includes areas in West Texas); and (iv) East/South Texas. As of December 31, 2011, these working interest properties included 591 gross operated productive wells and 1,197 gross non-operated wells with net production to us of approximately 87.7 MMcfe/d and proved reserves of approximately 234.0 Bcf of natural gas, 11.5 MMBbls of crude oil, and 11.3 MMBbls of natural gas liquids, of which 76% are proved developed.
We report on our businesses in five accounting segments, as outlined in Note 14 of our consolidated financial statements included in Part II, Item 8. Financial Statements and Supplementary Data starting on page F-1 of this Annual Report on Form 10-K. During the fourth quarter of 2011, our chief operating decision-maker decided that due to the relative size of the East Texas/Louisiana, South Texas and Gulf of Mexico segments, these three reporting segments would be collapsed into a single reporting segment and that a new Marketing and Trading reporting segment would be created. The Midstream Business's financial results are now reported in the following segments: (i) Texas Panhandle, which no longer includes the results of our Marketing and Trading operations, (ii) East Texas and Other Midstream, which consolidates our former East Texas/Louisiana, South Texas and Gulf of Mexico segments, and (iii) Marketing and Trading, which is a new reporting segment. Operating results for the reportable segments have been recast for the years ending December 31, 2010 and 2009 to reflect these changes. Our Upstream Segment and functional (Corporate) Segment remained unchanged from what has been
previously reported.
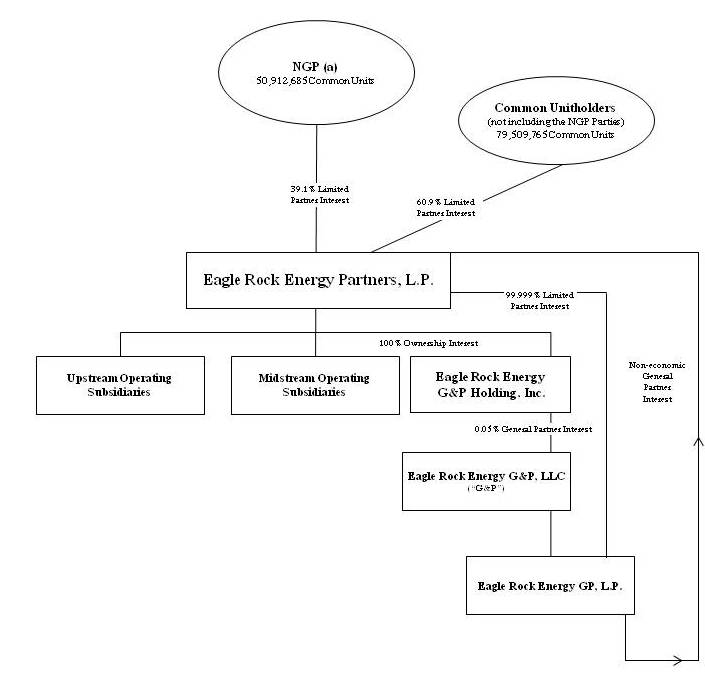
Ownership Structure
The diagram below depicts our ownership structure as of February 20, 2012. The ownership percentages shown below are calculated on a fully-diluted basis:
________________________
| |
| (a) | "NGP" refers collectively to Natural Gas Partners VII, L.P., a Delaware limited partnership; Natural Gas Partners VIII, L.P., a Delaware limited partnership; and such other entities as set forth on that certain Schedule 13D/A filed with the Securities and Exchange Commission, including, without limitation, Montierra Minerals & Production, L.P., a Texas limited partnership and Montierra Management LLC, a Texas limited liability company. In addition, NGP holds 488,635 warrants exercisable on a 1:1 ratio for common units, out of the 5,707,705 warrants outstanding. For a discussion of certain members of management's ownership in the Montierra entities, see Part III, Item 12 -Security Ownership of Certain Beneficial Owners and Management and Related Unitholder Matters, incorporating by reference our to-be-filed proxy statement for our 2012 Annual Meeting of Unitholders. |
Our Business Strategy
Our primary business objective is to manage our diversified midstream and upstream properties to generate cash flow and provide stable and growing distributions over time. To meet this objective, we intend to execute the following business strategies:
| |
| • | Expanding our operations through organic growth projects. In our Midstream Business, we intend to leverage our existing infrastructure and customer relationships by expanding our asset base to meet new or increased demand for midstream services. We also look for opportunities to invest in attractive projects in areas outside our existing asset base. In our Upstream Business, we intend to exploit our substantial inventory of attractive, lower-risk drilling opportunities as the primary source of organic growth. We measure the success of organic growth projects based on internal rate of return targets. |
| |
| • | Maximizing the profitability of our existing assets. In our Midstream Business, we intend to maximize the profitability of our existing assets by adding new volumes of natural gas to our gathering and processing assets under economically favorable terms. We strive to provide superior customer service, enhance utilization, and improve operating margins and efficiencies. In our Upstream Business, we strive to improve the recoveries of oil and natural gas from our existing wellbores, as well as focus on reducing our per unit operating expenses to maximize the amount of hydrocarbons and valuable by-products we can profitably extract. |
| |
| • | Maintaining a disciplined financial policy. We intend to continue to pursue a disciplined financial policy by maintaining a prudent capital structure and managing our exposure to interest rate and commodity price risk. We target a total leverage ratio (outstanding debt to Adjusted EBITDA) of 3.5:1.0 or less on a sustained basis. Since our initial public offering in October 2006, we have financed 60% of our approximately $1.6 billion in acquisitions with the issuance of our common units. We plan to continue with our historical pattern of financing our growth with a balanced combination of equity and debt. Maintaining a balanced capital structure allows us to use our available capital to selectively pursue attractive investments or acquisition opportunities. |
| |
| • | Continuing to reduce our exposure to commodity price risk. We intend to continue to operate our business in a manner that reduces our exposure to commodity price risk in the near term and on an opportunistic basis over the long term. We use a variety of hedging instruments to accomplish our risk management objectives and enhance the stability of our cash flows. Our commodity derivatives are primarily in the form of swaps and collars that are designed to provide a fixed price (swaps) or defined range of prices (collars) that we will receive. We generally hedge a substantial portion of our expected midstream and upstream equity volumes for forward periods of up to four years. We actively monitor our hedge portfolio for opportunities to enter into additional hedges to support our cash flow objectives. |
| |
| • | Pursuing acquisitions. We pursue acquisitions which we believe will result in long-term accretion to our distributable cash flow per common unit. We believe that our capital structure, which no longer includes incentive distribution rights, positions us to compete more effectively for future acquisitions. In our Midstream Business, we generally seek to acquire assets that serve producing areas with high levels of drilling activity. In our Upstream Business, we generally seek to acquire operated assets that contain a mix of oil and natural gas reserves, have shallow decline rates, and offer an appropriate balance of current production with meaningful, lower-risk development opportunities. We will pursue acquisition opportunities that we believe will provide the highest risk-adjusted returns available to us and are complementary to our existing asset base across the midstream and upstream sectors. |
Competitive Strengths
We believe that we are well positioned to execute our business strategies successfully because of the following competitive strengths:
| |
| • | Geographically and operationally diverse asset base focused on mature, prolific oil and natural gas basins. Our portfolio of assets is diversified both from a geographic and operational perspective. Our midstream assets are strategically located in active, mature regions including the Granite Wash play in the Texas Panhandle and the Austin Chalk and Haynesville Shale plays in East Texas and Louisiana. Our Midstream Business provides us with relatively stable, and potentially growing, throughput volumes and cash flows based, among other things, on our existing and potential customers' drilling plans and the expected performance of their wells. Our upstream assets are diversified among numerous established, lower-cost producing basins in Alabama, Texas, Oklahoma and Arkansas with a balanced mix of crude oil, NGL and natural gas production. |
| |
| • | Significant inventory of lower-risk organic growth opportunities. In our Midstream Business, we have identified approximately $89 million of opportunities to build additional infrastructure in our core areas of the Texas Panhandle and East Texas/Louisiana. In our Upstream Business, we have a significant inventory of lower-risk drilling opportunities and other development projects in our core areas of operation. As of December 31, 2011, we had approximately 600 gross drilling locations, 160 of which are proved drilling locations; we expect this inventory will allow us to maintain and grow production and proved reserves for several years. In our Upstream Business we have a high degree of operational control that allows us to manage our drilling plans to increase or stabilize our cash flow. We currently intend to drill or complete 65 gross (28.8 net) wells during 2012, for which we have budgeted approximately $135 million of drilling and completion capital expenditures. |
| |
| • | Strong financial profile. We have strong liquidity and sufficient financial flexibility to fund our anticipated capital needs and future growth opportunities. As of December 31, 2011 we had approximately $193.5 million of unused capacity under our credit facility, based on our outstanding debt and expected total commitments (before taking into account covenant‑based capacity limitations). We also expect our liquidity to benefit from the exercise of our outstanding warrants to purchase common units which will either be exercised on the quarterly exercise dates or will expire on May 15, 2012. If all of the approximately 5.7 million of the warrants outstanding as of December 31, 2011 are exercised, proceeds to us will total approximately $34.2 million. Our financial profile also is strengthened by our extensive commodity hedge portfolio, which serves to reduce our cash flow volatility in response to changes in oil, natural gas liquids and natural gas prices. |
| |
| • | Experienced, knowledgeable management team with a proven record of performance. Our management team has a proven record of enhancing value through investing in, acquiring and integrating midstream and upstream assets. Our senior management team has an average of approximately 20 years of industry‑related experience and a substantial economic interest in us through direct and indirect ownership of our common units. |
| |
| • | Affiliation with Natural Gas Partners. Founded in 1988, Natural Gas Partners represents a $7.2 billion family of investment funds organized to make direct equity investments in private energy enterprises. Natural Gas Partners owns a significant equity position in us. Natural Gas Partners historically has provided us with increased exposure to acquisition opportunities. For example, CC Energy II, L.L.C. ("Crow Creek Energy"), which we acquired on May 3, 2011, was a portfolio company of one of the Natural Gas Partners funds. We expect that our relationship with Natural Gas Partners may continue to provide us with several significant benefits, including on-going exposure to acquisition opportunities and access to a significant group of transactional and financial professionals with a successful track record of investing in energy assets. We have agreements with Natural Gas Partners that restrict its control of our board of directors and its voting rights with respect to our common units. |
History
Our Partnership, formed in May 2006, is the legal successor to Eagle Rock Pipeline, L.P. as a result of our initial public offering in October 2006. We have historically grown through acquisitions and organic growth projects.
The following is a table that depicts our acquisitions/dispositions by date, transaction type, cost, financing sources and business over the past five years:
Table of Acquisitions/Dispositions in the Past Five Years
|
| | | | | | | | | | | | | | | | | | | | | | | | |
Closing Date | | Transactions | | Amount ($ in Millions) | | Financing Sources ($ in Millions) | | Business |
| | | | Cash | | Debt | | Equity to Sellers | | Cash from private equity/ PIPEs(a) | |
| Acquisitions: | | | | | | | | | | | | |
| 4/30/2007 | | Montierra Acquisition | | $ | 139.2 |
| | $ | — |
| | $ | — |
| | $ | 133.8 |
| | $ | 5.4 |
| | Minerals |
| 5/3/2007 | | Laser Acquisition | | $ | 142.6 |
| | $ | — |
| | $ | — |
| | $ | 29.2 |
| | $ | 113.4 |
| | Midstream |
| 6/18/2007 | | MacLondon Acquisition | | $ | 18.2 |
| | $ | 0.1 |
| | $ | — |
| | $ | 18.1 |
| | $ | — |
| | Minerals |
| 7/31/2007 | | Escambia Acquisition | | $ | 241.8 |
| | $ | — |
| | $ | 113.0 |
| | $ | 17.2 |
| | $ | 111.6 |
| | Upstream |
| 7/31/2007 | | Redman Acquisition | | $ | 192.8 |
| | $ | — |
| | $ | — |
| | $ | 108.2 |
| | $ | 84.6 |
| | Upstream |
| 4/30/2008 | | Stanolind Acquisition | | $ | 81.9 |
| | $ | 5.9 |
| | $ | 76.0 |
| | $ | — |
| | $ | — |
| | Upstream |
| 10/1/2008 | | Millennium Acquisition | | $ | 212.9 |
| | $ | 7.2 |
| | $ | 176.4 |
| | $ | 29.3 |
| | $ | — |
| | Midstream |
| 9/30/2010 | | Indigo Acquisition | | $ | 4.1 |
| | $ | 4.1 |
| | $ | — |
| | $ | — |
| | $ | — |
| | Upstream |
| 10/19/2010 | | Centerpoint Acquisition | | $ | 27.0 |
| | $ | 27.0 |
| | $ | — |
| | $ | — |
| | $ | — |
| | Midstream |
| 5/3/2011 | | Crow Creek Acquisition | | $ | 563.7 |
| | $ | 15.0 |
| | $ | 212.6 |
| | $ | 336.1 |
| | $ | — |
| | Upstream |
| Dispositions: | | | | | | | | | | | | |
| 5/24/2010 | | Minerals Business Disposition (b) | | $ | 174.5 |
| | $ | 174.5 |
| | $ | — |
| | $ | — |
| | $ | — |
| | Minerals |
| 5/20/2011 | | Wildhorse System Disposition | | $ | 5.7 |
| | $ | 5.7 |
| | $ | — |
| | $ | — |
| | $ | — |
| | Midstream |
_______________________________
| |
| (a) | Private Investment in Public Equity (“PIPE”) by institutional investors. |
| |
| (b) | Amount includes approximately $2.9 million of cash received from the Minerals Business after the effective date of the sale. |
The following is a table that depicts our organic growth projects by date, project, cost, and reportable segment over the past five years:
Table of Significant Organic Growth Projects in the Past Five Years
|
| | | | | | | | |
| Completion Date | | Project | | Cost ($ in Millions) | | Segment |
| Midstream: | | | | | | |
| Q1 2007 | | Tyler County Pipeline Extension | | $ | 24.4 |
| | East Texas and Other Midstream |
| Q2 2007 | | Red Deer Processing Plant Construction | | 17.3 |
| | Panhandle |
| Q3 2008 | | Stinnett-Cargray Consolidation Project | | 6.1 |
| | Panhandle |
| Q1 2009 | | Cargray Residue Compressor Station | | 5.6 |
| | Panhandle |
| Q4 2010 | | Phoenix-Arrington Ranch Plant Construction | | 31.5 |
| | Panhandle |
| Q4 2011 | | Phoenix-Arrington Ranch Plant Expansion | | 19.6 |
| | Panhandle |
| Upstream: | | | | |
| 2008 | | Drilling projects | | 6.5 |
| | Upstream |
| 2009 | | Drilling projects | | — |
| | Upstream |
| 2010 | | Drilling projects | | 9.3 |
| | Upstream |
| 2011 | | Drilling projects | | 67.7 |
| | Upstream |
The following graph depicts our historical trends in Adjusted EBITDA and quarterly distribution rate per common unit from our initial public offering on October 24, 2006 to December 31, 2011:
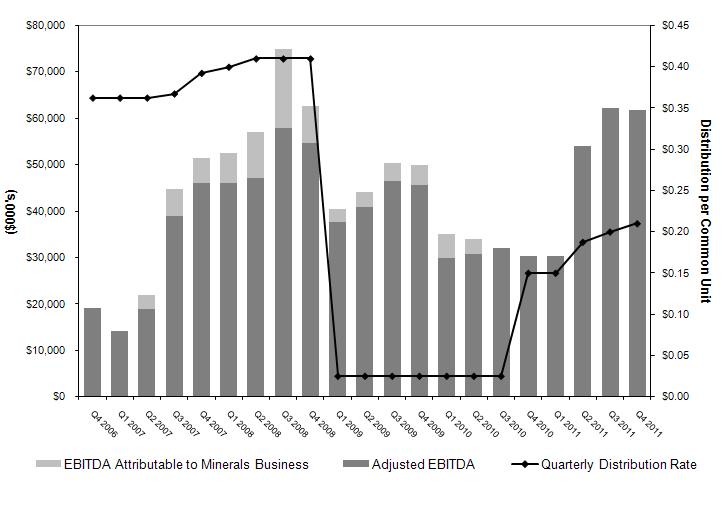 ______________________________
Note: Q4 2006 represents a prorated distribution to the common unitholders from the IPO date of October 24, 2006 through December 31, 2006. In addition, "hedge resets " (as defined below) contributed $4.2 million, $46.8 million and $2.2 million to Adjusted EBITDA for the fourth quarter 2008, the year ended December 31, 2009 and the first quarter of 2010, respectively.
For a definition of Adjusted EBITDA and reconciliation to GAAP, see Part II, Item 6. Selected Financial Data-Non-GAAP Financial Measures.
From the time of our initial public offering through the third quarter of 2008, we increased our Adjusted EBITDA and the distribution per unit paid to our unitholders. Our financial results during this period benefited from our acquisition activity, as described above, and from the positive impact of increasing commodity prices, including the resulting increased producer drilling activity in our core Midstream Business areas. Beginning in the third quarter of 2008, however, commodity prices began to fall significantly. This downward trend in commodity prices continued throughout the first quarter of 2009, and resulted in a substantial slowdown in the drilling activity of virtually all the major producer customers of our Midstream Business. Against this backdrop of declining midstream volumes and cash flows, our board of directors elected to substantially reduce our distribution beginning with the distribution with respect to the first quarter of 2009 and continuing through the distributions for the first three quarters of 2010. This decision was made in order to enhance our liquidity and financial flexibility, and to avoid breaching the covenants in our revolving credit facility. Due to our enhanced liquidity position resulting from the Recapitalization and Related Transactions described below, our debt reduction efforts and improved economic conditions, we increased our distribution for the fourth quarter of 2010 and throughout 2011.
Our Adjusted EBITDA benefited substantially in 2009 from our hedge portfolio, including from “hedge resets,” in which we pay our hedge counterparties to increase the strike price of existing swaps. Such hedge resets contributed approximately $46.8 million to our Adjusted EBITDA in 2009 and contributed $4.2 million and $2.2 million in 2008 and 2010, respectively.
Recapitalization and Related Transactions
In 2010, we completed a series of transactions (the "Recapitalization and Related Transactions") which simplified our capital structure and provided us with added financial liquidity. This series of transactions included:
| |
| • | the contribution, and resulting cancellation, of our incentive distribution rights and 20,691,495 subordinated units held by Eagle Rock Holdings, L.P. ("Holdings") which occurred on May 24, 2010; |
| |
| • | the sale of all of our fee mineral and royalty interests, as well as our equity investment in Ivory Working Interests, L.P., (collectively "the Minerals Business") to Black Stone Minerals Company, L.P. for total consideration of $174.5 million which sale was completed on May 24, 2010; |
| |
| • | a rights offering, which was launched on June 1, 2010 and expired on June 30, 2010, and for which we received gross proceeds of $53.9 million and issued 21,557,164 common units and 21,557,164 warrants and; |
| |
| • | an option, which was exercised on July 30, 2010 by the issuance to Holdings of 1,000,000 newly-issued common units, to capture the value of the controlling interest in us through (a) acquiring our general partner entities from Holdings and immediately thereafter eliminating our 844,551 outstanding general partner units owned by Holdings and (b) reconstituting our Board to allow our common unitholders not affiliated with NGP to elect the majority of our directors. |
An investment in our common units involves risks associated with our business, regulatory and legal matters, our limited partnership structure and the tax characteristics of our common units. Please read carefully the risks described under Part I, Item 1A. Risk Factors.
Our Two Lines of Business and Our Five Reporting Segments
Midstream Business
Midstream Industry Overview
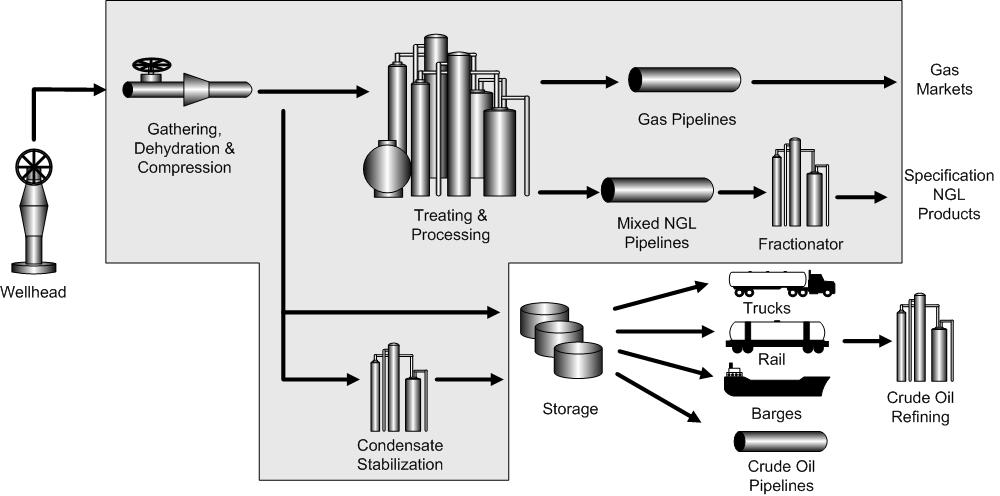
General. Raw natural gas produced from the wellhead is gathered and delivered to a processing plant or markets located near the production field, where it is treated, dehydrated, and/or processed. Processing natural gas involves the separation and treating of raw natural gas resulting in a pipeline quality natural gas, primarily methane, mixed NGLs and condensate for sale. Natural gas treating entails the removal of impurities, such as water, sulfur compounds, carbon dioxide and nitrogen. Interstate and intrastate pipelines deliver the processed natural gas to markets. Mixed NGLs are typically transported via NGL pipelines or by truck to a fractionator which separates the NGLs into its components such as ethane, propane, normal butane, isobutane and natural gasoline. The component NGLs are then sold to end users. In many cases condensate is stabilized to further reduce its vapor pressure in order to meet truck transport requirements. Blending of light and heavy gravity condensate is also done to improve the quality, market optionality and associated sales price.
The following diagram shows the process of gathering, processing, marketing and transporting natural gas, NGLs and condensate.
_________________________
Note: The shaded area above represents processes in which we are directly involved in our Midstream Business and for which we own the underlying assets.
Gathering. A gathering system typically consists of a network of small diameter pipelines and a compression system which together collect natural gas from producing wells and delivers it to larger pipelines for further transportation. We own and operate large gathering systems in four geographic regions of the United States.
Compression. Gathering systems are operated at design pressures that seek to maximize the total throughput volumes from all connected wells. Since wells produce at progressively lower field pressures as they age, the raw natural gas must be compressed to deliver the remaining production against higher pressure that exists in the connected gathering system or transport pipelines. Natural gas compression is a mechanical process in which a volume of natural gas at a lower pressure is increased, or compressed, to a desired higher pressure, allowing natural gas that no longer naturally flows into a higher pressure downstream pipeline to be brought to market. Field compression is used to lower the wellhead pressure while maintaining the exit pressure of a gathering system to deliver natural gas into higher pressure downstream pipelines and plants. We own or lease, and operate, all compression on our systems.
Treating and Processing. Raw natural gas produced at the wellhead is often unsuitable for pipeline transportation or commercial use and must be processed and/or treated to remove the heavier hydrocarbon components and/or contaminants. The principal components of pipeline-quality natural gas are methane and ethane, but most raw natural gas also contains varying amounts of heavier hydrocarbon components (such as propane, normal butane, isobutane, and natural gasoline) and impurities (such as water, sulfur compounds, carbon dioxide, or nitrogen). We own and operate natural gas processing and/or treating plants in four geographic regions.
Fractionation. NGL fractionation facilities separate mixed NGL streams into discrete NGL products: ethane, propane, normal butane, isobutane and natural gasoline. Ethane is primarily used in the petrochemical industry as feedstock for ethylene, one of the basic building blocks for a wide range of plastics and other chemical products. Propane is used both as a petrochemical feedstock and as a heating fuel, an engine fuel and an industrial fuel. Normal butane is used as a petrochemical, and as a blend stock for motor gasoline. Isobutane is typically fractionated from mixed butane (a stream of normal butane and isobutane in solution), principally for use in enhancing the octane content of motor gasoline. Natural gasoline, a mixture of pentanes and heavier hydrocarbons, is used primarily as motor gasoline blend stock or petrochemical feedstock. We operate a fractionation facility to produce propane at one of our facilities in the Texas Panhandle Segment. In our East Texas and Other Midstream Segment we own a 2.63% interest, which was updated to 4.49% interest in January 2012, in the Tebone Fractionator, a fractionation facility operated by Enterprise Products Partners L.P. in southern Louisiana.
Condensate Stabilization. Natural gas condensate is a low-density mixture of hydrocarbon liquids found in the raw natural gas stream. Condensate stabilization is a process by which the vapor pressure of the condensate is reduced. As a result, the condensate is better positioned to meet truck transportation limitations and end-user specifications. We own and operate condensate stabilization facilities in our Texas Panhandle Segment.
Marketing and Trading. Natural gas marketing and trading involves the sale of natural gas either produced by processing plants or purchased from gathering systems or other pipelines. NGL marketing involves the sale of the unfractionated or y-grade products or fractionated products recovered at the processing plants. We market and trade natural gas, and market NGLs and condensate for our own account and for the benefit of certain of our producer customers in our Midstream Business and for certain working interest owners in our Upstream Business. In the fourth quarter of 2010, we created a marketing subsidiary to develop, implement, and launch marketing uplift strategies surrounding crude and condensate in Alabama and in the Texas Panhandle. Strategies include marketing, transportation, and product blending to enhance product prices. Currently, our crude marketing subsidiary does not own marketing-related natural gas or natural gas liquid pipelines, storage or other transportation assets, nor does it utilize financial derivatives in the marketing of our products. In 2011, we created a natural gas marketing and trading subsidiary to capitalize on the physical and financial opportunities that naturally extend from our upstream and midstream assets. Where in the past, we generally sold to wholesale buyers at the tailgates and wellheads of our assets, now this subsidiary holds transportation agreements and moves our product to many locations and types of buyers. This strategy diversifies our credit and performance risk and allows us to capitalize on daily, monthly and seasonal changes in market conditions. With these transportation and marketing options in place, our gas marketing and trading subsidiary has been successful in buying and marketing third party gas in various operating areas.
Transportation. Natural gas transportation consists of moving pipeline-quality natural gas from gathering systems, processing plants and other pipelines and delivering it to wholesalers, utilities and other pipelines. Other than our North and Central systems in Texas, we do not own any natural gas transportation assets. Condensate is typically transported locally by truck and aggregated into storage tanks before being delivered to end markets via a range of transportation alternatives, including truck, rail, barge or pipeline.
Natural gas is gathered and processed pursuant to a variety of industry-standard arrangements generally categorized as fee-based, percent-of-proceeds, fixed recovery, percent-of-index and keep-whole, described in greater detail as follows:
| |
| • | Fee-Based Arrangements. Under these arrangements, we are paid a fixed cash fee per unit volume for performing the gathering and processing service. This fee is directly related to the volume of natural gas that flows through our systems and is not directly dependent on commodity prices. A sustained decline, however, in commodity prices could result in a decline in volumes and, thus, a decrease in fee revenues. These arrangements provide stable cash flows, but minimal, if any, upside in higher commodity price environments. |
| |
| • | Percent-of-Proceeds Arrangements. Under these arrangements, raw natural gas is gathered from producers at the wellhead, moved through the gathering system, processed and sold at prices based on published index prices. Producers are paid an agreed-upon percentage of the proceeds. The value paid to producers is based on an agreed percentage of the products produced multiplied by the actual sale price or an index price. Contracts in which the gatherer/processor shares only in specified percentages of the proceeds from the sale of NGLs and in which the producer receives 100% of the proceeds from natural gas sales, are referred to as “percent-of-liquids” arrangements but are still generally categorized as percent-of-proceeds arrangements. Under percent-of-proceeds arrangements, the margin correlates directly with the prices of natural gas and NGLs, as applicable; under percent-of-liquids arrangements, the margin correlates directly with the price of NGLs. Percentage-of-Proceeds arrangements provide upside in high commodity price environments, but result in lower margins in low commodity price environments. |
| |
| • | Fixed Recovery Arrangements. Under these arrangements, raw natural gas is gathered from producers at the wellhead, transported through our gathering system and processed. We sell the processed natural gas and NGLs at prices based on published index prices. The value paid to the producers for NGLs is calculated as the product of agreed-upon theoretical product recovery factors multiplied by the theoretical wellhead gallons for each NGL component. Each resulting component volume is then multiplied by a contractual percentage and an index price or the actual sales price. The value paid for the remaining share of natural gas is multiplied by a contractual percentage and an index price or the actual sales price. These arrangements provide upside in high commodity price environments, but result in lower margins in low commodity price environments. These arrangements also provide greater upside to us for greater efficiency and better actual recoveries and tend to penalize us when efficiency and recoveries turn-out not to be as expected. |
| |
| • | Percent-of-Index Arrangements. Under percent-of-index arrangements, we purchase either liquids-rich or dry wellhead natural gas at either (i) a percentage discount to a specified index price, (ii) a specified index price less a fixed amount or (iii) a weighted average sales price based on natural gas sales. We generally then gather and deliver the dry natural gas to third-party pipelines and gather and process the liquids-rich natural gas and sell the resulting NGLs and residue gas to third parties. Generally, when we gather dry natural gas and deliver it directly into a third-party pipeline, we are able to resell the natural gas at the index price or at a different percentage discount to the index price which reduces commodity price exposure. Generally, when we gather and process liquids-rich natural gas, our revenues and net operating margins increase as the price of NGLs and condensate increases relative to the price of natural gas and decrease as the price of NGLs and condensate decrease relative to the price of natural gas, resulting in commodity exposure to us that is similar to that of a keep-whole arrangement. |
| |
| • | Keep-Whole Arrangements. Under these arrangements, raw natural gas is processed to extract NGLs, and the processor pays the producer the full thermal equivalent volume of raw natural gas received from the producer in the form of either processed natural gas or its cash equivalent. Processors are generally entitled to retain the processed NGLs and to sell them for their account. Margin is a function of the difference between the value of the NGLs produced and the cost of the natural gas needed to replace the thermal equivalent volume of natural gas used in processing (i.e. the frac spread). The profitability of these arrangements is subject not only to the commodity price risk of natural gas and NGLs, but also to the price of natural gas relative to NGL prices. These arrangements can provide improved profit margins in favorable commodity price environments, but also can be subject to losses if the cost of natural gas exceeds the value of its thermal equivalent of NGLs. Many keep-whole arrangements include provisions that reduce commodity price exposure, including (i) conditioning floors that require the keep-whole arrangements to convert to a fee-based arrangement if the NGLs have a lower value than their thermal equivalent in natural gas, (ii) discounts to the applicable natural gas index price used to reimburse the producer an amount in cash for the thermal equivalent volume of raw natural gas acquired from the producer, or (iii) fixed cash fees for ancillary services, such as gathering, treating and compressing. |
Midstream Business Overview
We own natural gas gathering and processing assets in four significant natural gas producing regions: the Texas Panhandle, East Texas/Louisiana, South Texas and the Gulf of Mexico. During 2011, we remained focused on contracting new gas to our systems and initiating organic growth projects to meet the increasing demand for processing services by our producer customers. The majority of our growth projects are designed to enhance and expand our processing capacity in the Granite Wash and surrounding plays in the Texas Panhandle. In 2011, we expanded the processing capacity of our Phoenix-Arrington Ranch cryogenic plant in Hemphill county from 50 MMcf/d to 80 MMcf/d. We also initiated construction on two new cryogenic processing plants in the area. Our 60 MMcf/d Woodall plant is expected to be in service by the second quarter of 2012, and our 60 MMcf/d Wheeler plant is expected to be in service in the first half of 2013. In total, we anticipate increasing our high-efficiency processing capacity servicing Granite Wash production from approximately 100 MMcf/d at the beginning of 2010 to approximately 250 MMcf/d in 2013, depending on prevailing market conditions.
Within our geographic areas of operation, we strive to be a competitive and low cost natural gas gatherer and processor. To achieve this end, we coordinate the operations and commercial activities of our gathering and processing assets to provide better customer service. From an operations perspective, our key strategy is to provide our customers safe and reliable service at reasonable costs and to improve our competitiveness in securing new customers through more efficient operations. From a commercial perspective, our focus is to assist our customers in maximizing the value of their production by providing options and capacity for the movement and marketing of their natural gas and NGLs. We are well positioned to take advantage of continued growth opportunities in the Texas Panhandle Granite Wash play and in the Austin Chalk play in East Texas. As of December 31, 2011, the percentage of natural gas throughput volumes under various contractual arrangements were 15% fixed recovery, 21% fee-based, 51% percent-of-proceeds (which includes percent-of-liquids) and 13% percent-of-index.
As of December 31, 2011, our Midstream Business consisted of the following:
|
| | | | | | | | | |
Asset | | Length (miles) | | Available Compression (Horsepower) | | Processing Plant Through-put Volume Capacity (MMcf/d) |
| Texas Panhandle Segment | | 3,963 |
| | 141,000 |
| | 210 |
|
| Canadian cryogenic plant and gathering system | | 359 |
| | |
| | 25 |
|
| Phoenix Arrington Ranch cryogenic plant and gathering system | | 537 |
| | |
| | 80 |
|
| Red Deer cryogenic plant (a)(b) | | n/a |
| | |
| | 24 |
|
| Roberts County refrigeration plant and gathering system (a)(c) | | 14 |
| | |
| | 20 |
|
| System 97 gathering system (d) | | 77 |
| | |
| | n/a |
|
| Buffalo Wallow gathering system (d) | | 113 |
| | |
| | n/a |
|
| East Hemphill | | 220 |
| | | | n/a |
|
| Cargray cryogenic plant and gathering system | | 905 |
| | |
| | 30 |
|
| Gray cryogenic plant and gathering system (a) | | 615 |
| | |
| | 20 |
|
| Lefors cryogenic plant and gathering system | | 663 |
| | |
| | 11 |
|
| Stinnett gathering system | | 451 |
| | |
| | n/a |
|
| Turkey Creek gathering system | | 9 |
| | |
| | n/a |
|
| East Texas and Other Midstream Segment | | 1,620 |
| | 74,719 |
| | 494 |
|
| Brookeland cryogenic plant and gathering system | | 633 |
| | |
| | 100 |
|
| Indian Springs cryogenic plant (25% non-operated) and Camp Ruby gathering system (20% non-operated) (e) | | n/a |
| | |
| | 36 |
|
| Tyler County gathering system | | 73 |
| | |
| | n/a |
|
| Panola gathering system | | 33 |
| | |
| | n/a |
|
| Quitman gathering system | | 51 |
| | |
| | n/a |
|
| Rosewood mechanical refrigeration plant and gathering system (a) | | 42 |
| | |
| | 10 |
|
| Vixen gathering system (d) | | 7 |
| | |
| | n/a |
|
| Belle Bower JT plant and gathering system (a) | | 68 |
| | |
| | 20 |
|
| Simsboro gathering system (d) | | 30 |
| | |
| | n/a |
|
| Sligo gathering system (d) | | 10 |
| | |
| | n/a |
|
| ETML gathering system and JT Plant (d) | | 221 |
| | |
| | 15 |
|
| Douglas East gathering system (d) | | 14 |
| | |
| | n/a |
|
| BGS gathering system (d) | | 24 |
| | |
| | n/a |
|
| Robertson County gathering system (d) | | 36 |
| | |
| | n/a |
|
| North gathering system (h) | | 85 |
| | |
| | n/a |
|
| Central mechanical refrigeration plant and gathering system (h) | | 102 |
| | |
| | 2 |
|
| New Ulm gathering system | | 15 |
| | |
| | n/a |
|
| Phase 1 gathering system | | 70 |
| | |
| | n/a |
|
| Raymondville gathering system | | 31 |
| | |
| | n/a |
|
| Raymondville JT plant (a) | | n/a |
| | |
| | 40 |
|
| San Ignacio gathering system | | 6 |
| | |
| | n/a |
|
| TGP McAllen JT plant and gathering system | | 13 |
| | |
| | 40 |
|
| Sweeny gathering system (50% non-operated) | | 16 |
| | |
| | n/a |
|
| Yscloskey refrigerated lean oil plant (10.54% non-operated) (f) | | n/a |
| | |
| | 195 |
|
| North Terrebonne refrigerated lean oil plant (2.63% non-operated) (f) | | n/a |
| | |
| | 36 |
|
| Tebone Fractionator (2.63% non-operated) (g) | | n/a |
| | |
| | n/a |
|
| Galveston Bay gathering (50% non-operated) | | 12 |
| | |
| | n/a |
|
| CMA Pipeline segments (non-operated) | | 28 |
| | |
| | n/a |
|
| TOTAL Midstream Businesses | | 5,583 |
| | 215,719 |
| | 704 |
|
_______________________________
| |
| (a) | The plant is owned by us, but we lease the plant site. |
| |
| (b) | The plant processes gas from the Canadian gathering system. |
| |
| (c) | The Roberts County Plant has 21 MMcf/d of capacity but currently only has installed compression to process 20 MMcf/d. |
| |
| (d) | The systems gather dry natural gas that does not require processing to meet pipeline hydrocarbon dew point quality specifications. |
| |
| (e) | Our net plant capacity is based on the plant expansion to 145 MMcf/d total capacity in February 2008. |
| |
| (f) | The available capacity shown is net to our ownership share. Available capacity is based on the previous year's allocated throughput volume for each owner and to existing owners and potential new owners who are adding new production volumes. Our ownership interest in Yscloskey changed in September 2011 to 10.54% from 11.45%. Our ownership in North Terrebonne changed in January 2012 to 4.49% from 2.63%. |
| |
| (g) | The Tebone Fractionator has 30,000 Bbl/d of capacity. Our ownership share is tied to our ownership percentage in the North Terrebonne Plant which changed to 4.49% from 2.63% in January 2012. |
| |
| (h) | Sections of the system are subject to FERC jurisdiction under Section 311 of the NGPA. |
The following graph depicts plant processing capacity and utilization by month and includes the start-up of the Phoenix-Arrington Ranch Plant in 2010 (as discussed further below). The volumes shown include only the gas volumes that we gathered that required processing in order to meet the interstate or intrastate gas quality specifications (we refer to such natural gas as wet gas) and excludes the gas volumes that we gathered that did not require plant processing prior to delivery to the interstate or intrastate pipeline systems (we refer to such natural gas as dry gas).
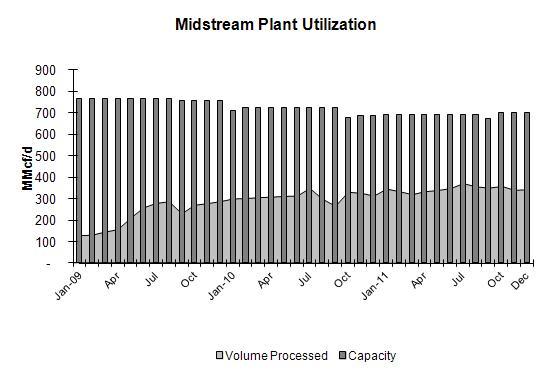 _______________________________
Note. Reflects the installation of the Phoenix-Arrington Ranch plant in 2010 and its expansion in October of 2011. Other changes are attributable to adjustments of plant ownership percentages at North Terrebonne and Yscloskey and the abandonment of two small JT plants.
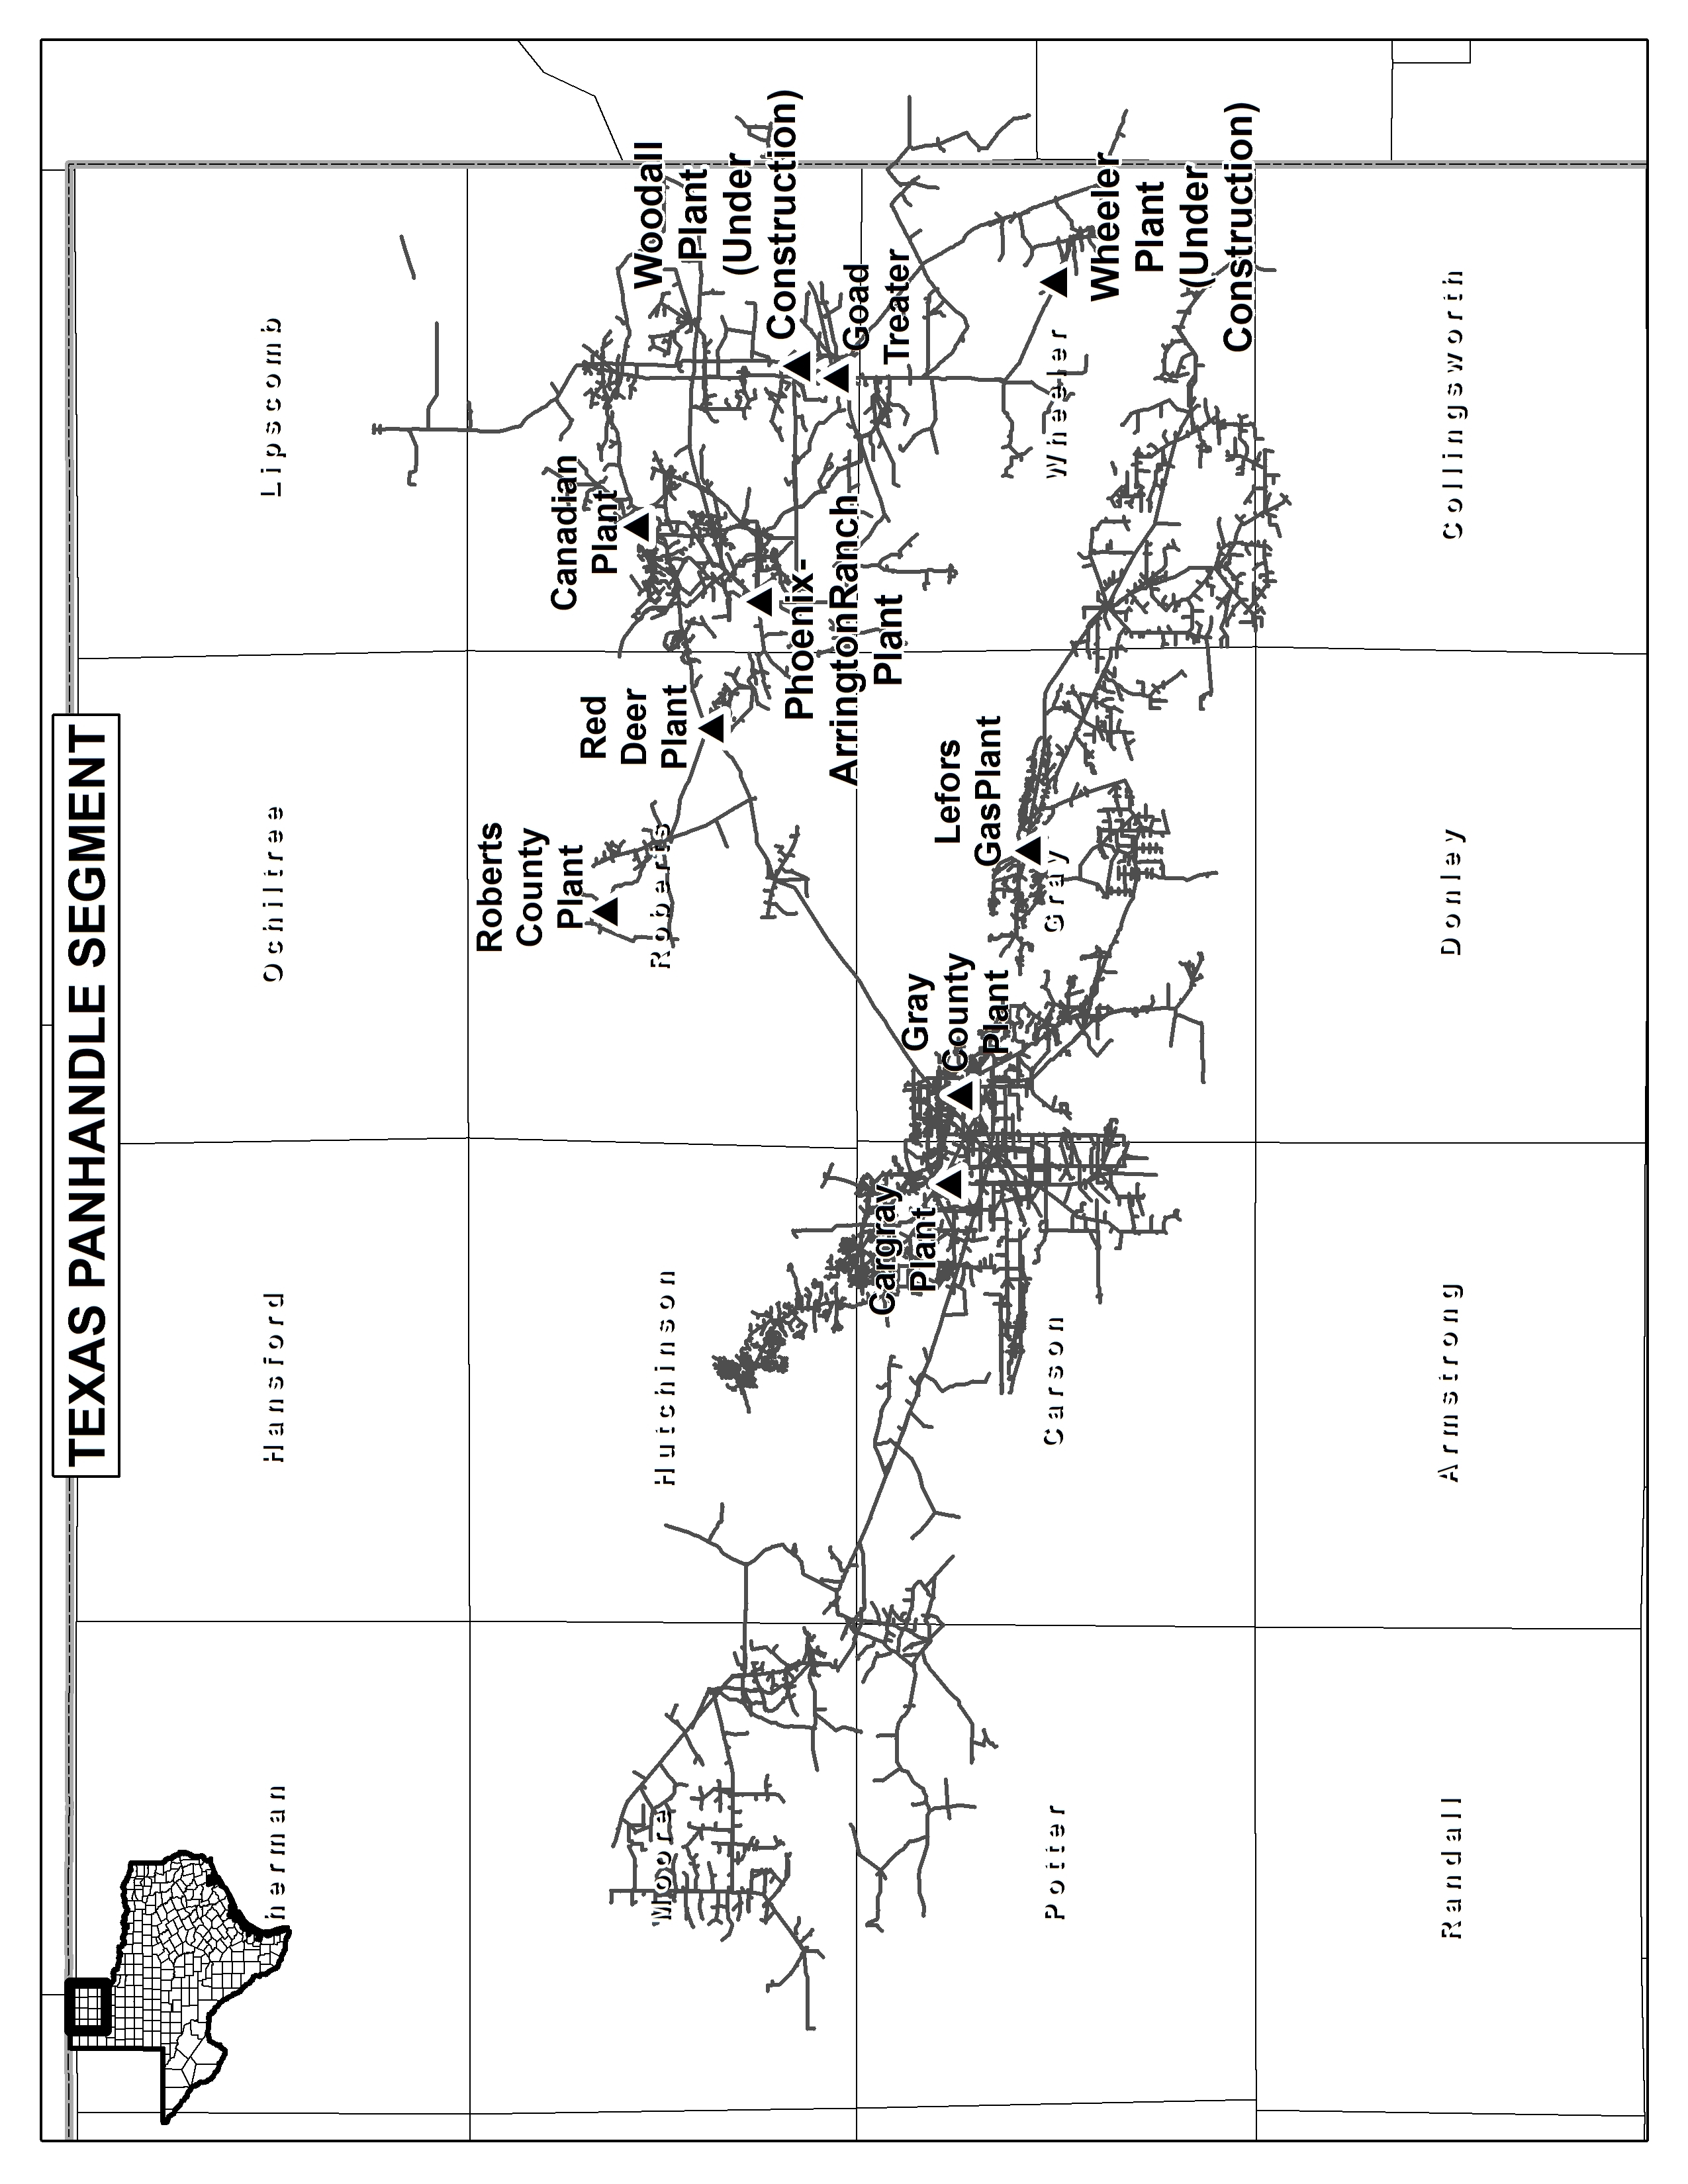
Texas Panhandle Segment
Our Texas Panhandle Segment covers ten counties in Texas and two counties in Oklahoma. Through the systems within this segment we offer midstream wellhead-to-market services, including gathering, compressing, treating, processing and selling of natural gas, and fractionating and selling of NGLs. As of December 31, 2011, approximately 213 producers and 2,072 wells and central delivery points were connected to the systems in our Texas Panhandle Segment. The Texas Panhandle Segment averaged gathered volumes for 2011 of approximately 155.1 MMcf/d. As of December 2011, Chesapeake Energy and BP America Production represented 14% and 11%, respectively, of the total volumes of our Texas Panhandle Segment. The following is a map of our Texas Panhandle Segment:
Our Texas Panhandle systems are located in the Texas Railroad Commission (the “TRRC”) District 10, which has experienced significant growth since 2002. This area experienced significant drilling activity from 2006 through early 2009 but saw a reduction in drilling activity during late 2009 and early 2010 as a result of reduced commodity prices. Starting in late 2010 this area has experienced an increase in drilling activity.
The Texas Panhandle Segment consists of approximately 3,963 miles of natural gas gathering pipelines, ranging from two inches to 24 inches in diameter; seven active natural gas processing plants with an aggregate capacity of 210 MMcf/d; a propane fractionation facility with capacity of 1.0 MBbls/d; and two condensate collection and stabilization facilities.
Natural Gas Supply. Our systems in the East Panhandle (defined as northern Wheeler, Hemphill and Roberts Counties, Texas) gather and process natural gas produced in the Morrow and Granite Wash reservoirs of the Anadarko basin. Approximately 75% of the natural gas gathered from these areas is processed to recover the NGL content, which generally ranges from 4.0 to 5.0 gpm, with the remaining volume not processed but treated for removal of carbon dioxide and hydrogen sulfide to make the natural gas marketable. This natural gas can be isolated and sent to treating facilities while the remaining system is used to gather the natural gas into the processing plants. This area has experienced substantial drilling and reserve growth since 2002. Producers are increasing their use of horizontal drilling in the Granite Wash play. The enhanced economics associated with horizontally drilled wells and the relatively high levels of liquids found in the reservoir has led to an overall increase in the number of wells permitted for the greater Granite Wash Play. In response to increased demand for processing capacity by our producer customers operating in the Granite Wash and surrounding plays, we are developing plans to construct two new high-efficiency processing plants in the area with combined capacity of approximately 120 MMcf/d, subject to the prevailing market conditions.
Our systems in the West Panhandle (defined as Moore, Potter, Gray, Hutchinson, Carson and southern Wheeler counties, Texas) gather and process natural gas produced from the Brown Dolomite formations in the Anadarko basin. These areas are fully developed, and as a result there is limited new drilling activity in the area served by our West Panhandle systems. Natural gas production from wells located within the West Panhandle area generally are low volume wells being gathered at very low pressure. Natural gas from wells located in this area generally have an annual rate of decline of 6% to 9%. This natural gas is processed to recover the NGL content which generally ranges from 8.0 to 18.0 gpm.
In the Panhandle Segment, natural gas is contracted at the wellhead primarily under (i) percent-of proceeds (which includes percent-of-liquids) (ii) fixed recovery, (iii) percent-of-index and (iv) fee-based arrangements that range from one to five years in term. As of December 31, 2011, approximately 52%, 23%, 17% and 7% of our total throughput was under percent-of-proceeds , fixed recovery, percent-of-index, and fee-based arrangements, respectively.
In addition, we produce over 2,600 equity barrels per day of condensate in the Texas Panhandle Segment. We currently stabilize approximately 2,000 barrels per day combined at our Superdrip and Cargray Stabilizers. Condensate stabilization lowers the product's vapor pressure, resulting in a higher value product for sale.
Competition. With the production growth in the Granite Wash play, a number of midstream companies have built plants in the area. Our primary competitors in this area are DCP Midstream, LLC and Enbridge Energy Partners, L.P. The key drivers in this high growth area, in order to continue to connect producer wells, are the ability to provide low pressure gathering services, to provide outlet capacity for the natural gas as it is brought into producing status and to provide high value efficient plant processing. We have extensive gathering systems that are situated in the Granite Wash play. In response to the increased need for processing capacity in this play, we have announced plans to construct two new high-efficiency processing plants with combined capacity of approximately 120 MMcf/d.
Texas Panhandle Markets. Our residue gas is marketed primarily by our natural gas marketing subsidiary. Our NGLs are marketed primarily to ONEOK Hydrocarbons ("ONEOK"). During 2011, NGL takeaway capacity from the Texas Panhandle became constrained, driven by the increase in liquids-focused drilling activity in areas such as the Granite Wash play. Several new pipeline projects are currently under development to increase NGL takeaway capacity from the Texas Panhandle, but these projects are not expected to be in service until mid- to late-2013. Until that time, we believe NGL takeaway capacity will continue to be constrained. Under our existing contractual relationship with ONEOK, we believe we have secured sufficient takeaway capacity for our existing operations and for the increased takeaway requirements associated with the installation of our Woodall Plant in 2012. Our condensate is sold under contract terms of one year or less. In addition, condensate produced and stabilized is sold to regional markets on a multi-month basis through various supply, trading and logistics companies such as High Sierra Crude Oil marketing and Musket Corporation.
East Texas and Other Midstream Segment
Our East Texas and Other Midstream Segment operates within the following natural gas producing regions: East Texas/Louisiana, South Texas and the Gulf of Mexico.
Through our East Texas/Louisiana region, we offer producers natural gas gathering, treating, processing and transportation and NGL transportation across 21 counties in East Texas and seven parishes in West Louisiana. Our systems in the East Texas/Louisiana region are located in the TRRC Districts 3, 5 and 6, which have experienced significant growth activity since 2002.
Our operations in the South Texas region primarily gather natural gas and recover NGLs and condensate from natural gas produced in the Frio, Vicksburg, Miocene, Canyon Sands and Wilcox formations in South Texas.
Our operations in the Gulf of Mexico region are non-operated ownership interests in pipelines and onshore plants which are all located in southern Louisiana. The Gulf of Mexico region also provides producer services by arranging for the processing of producers’ natural gas into third-party processing plants, which we describe as our Mezzanine Processing Services.
Natural Gas Supply. As of December 31, 2011, approximately 705 wells and central delivery points were connected to our systems in the East Texas and Other Midstream Segment. As of December 31, 2011, the East Texas and Other Midstream Segment provides gathering and/or marketing services to approximately 140 producers. The East Texas and Other Midstream Segment averaged gathered volumes of approximately 319.9 MMcf/d during 2011.
The supply of natural gas into our East Texas and Other Midstream Segment is highly dependent upon drilling activity over which we have no ownership or control. We have experienced throughput declines in this segment since 2008, primarily due to decreased drilling activity by our producer customers driven by low natural gas prices. As of December 31, 2011, Stone Energy Corporation and Anadarko Petroleum Company represented 18% and 9%, respectively, of the total volumes of our East Texas and Other Midstream Segment. The natural gas supplied to us in this region is generally dedicated to us under individually negotiated long-term and life-of-lease contracts. Contracts associated with this production are primarily percent-of-proceeds (which includes percent-of-liquids) and fee-based arrangements, with some percent-of-index and fixed recovery. As of December 31, 2011, the percentage of natural gas under the contract structures were 51% percent-of-proceeds, 30% fee-based, 10% percent-of-index, and 9% fixed recovery.
Markets. In the East Texas/Louisiana region residue gas remaining after processing or gathering is primarily taken in kind by the producer customers into the markets available at the tailgates of the plants or pipeline interconnects. Residue gas pipelines include Houston Pipeline Company, Natural Gas Pipeline Company, Tennessee Gas Pipeline, Crosstex Energy L.P. and Southern Natural Pipeline. Our NGLs are sold to various companies including Williams NGL Marketing, LLC.
In the South Texas region natural gas is processed primarily for hydrocarbon dewpoint control to satisfy the gas quality requirements of the receiving interstate pipelines such as Tennessee Gas Pipeline Company and Enterprise Texas Pipeline. Our systems in the Gulf of Mexico region primarily process natural gas from interstate pipelines including Transco and Tennessee Gas Pipeline and recover NGLs and condensate from natural gas produced in the Outer Continental Shelf of the Gulf of Mexico. The majority of NGLs produced from the Gulf of Mexico region are transported by pipelines for fractionation at the Norco, Toca and Tebone fractionators. Once fractionated, the NGLs are sold to Enterprise Products Partners L.P. under a year-to-year contract.
Many of the interstate pipelines in our area are constrained from time to time. Offering multiple market outlets is important to our customers to ensure that they can produce their natural gas.
Competition. Our primary competition in the East Texas/Louisiana and South Texas regions includes Crosstex Energy, L.P., DCP Midstream, LLC, Energy Transfer Partners, LP and Enterprise Products Partners, L.P. Producers in the East Texas / Louisiana area value high run-time rates of the processing assets, connections to premium markets and low pressure gathering services. During 2011, we continued to expand the Brookeland Gathering System and Tyler County gathering system to gather the expanding Austin Chalk drilling activity by over 19.2 miles of 4 inch to 8 inch pipeline at a cost of $9.0 million.
The key drivers in the South Texas region are low pressure gathering and multiple market outlets for natural gas. Much of the natural gas drilled within the vicinity of our gathering systems is of sufficient wellhead pressure to deliver directly to the high pressure interstate pipelines; however, the wells quickly decline in pressure. We operate our systems at lower pressures which offers the producers an alternative to installing their own compression.
Our competition in the Gulf of Mexico region at the Yscloskey Plant and the North Terrebonne Plant is primarily from other owners in those plants as well as the plant operators who are attempting to contract with the producers on behalf of all the plant owners. In our Mezzanine Processing Services, the primary competition comes from the plant operators at the various third party plants in which we have contracts.
The following is a map of our East Texas and Other Midstream Segment:
Marketing and Trading Segment
We formed our marketing subsidiary during the fourth quarter of 2010 to develop and implement marketing uplift strategies surrounding crude oil and condensate production in Alabama and in the Texas Panhandle. In Alabama, we purchase product from our Upstream Segment and certain other working interest owners in the Big Escambia Creek, Fanny Church and Flomaton fields, and seek to increase the value of the product through: (i) blending and treating to lower the gravity and reduce the contaminants, respectively, of the purchased condensate; and (ii) transporting the higher quality condensate to another market location. In this regard, neither our Upstream Segment nor the other participating working interest owners bear increased risk in the relocating and treating of the condensate.
In addition, in the second quarter of 2011, we created a natural gas marketing and trading subsidiary. The purpose of our trading subsidiary is to capitalize on the physical and financial arbitrage opportunities that naturally extend from our upstream and midstream assets. Where in the past we generally sold to wholesale buyers at the tailgates and wellheads of our assets, now, through our trading subsidiary, we hold transportation agreements and move our product to many locations and types of buyers. This strategy diversifies our credit and performance risk and allows us to capitalize on daily, monthly, and seasonal changes in market conditions.
Markets. Our Alabama and Texas Panhandle crude and condensate is sold to various customers, typically on a multi-month basis.
For natural gas, we sell to wholesale and retail markets at various market hubs and specific facility locations, depending on market conditions. These sales are typically priced based upon a published daily or monthly price index. We lease third-party pipeline capacity downstream of our natural gas assets under firm transportation contracts, which capacity is dependent on the volumes of natural gas from our natural gas assets. This capacity is leased for various lengths of times and at rates that allow us to diversify our customer base by expanding our service territory.
Competition. Our Marketing and Trading Segment has numerous competitors, including large natural gas marketing companies, marketing affiliates of pipelines, major oil and natural gas producers, independent aggregators and regional marketing companies.
Upstream Business
Upstream Business Overview
Our Upstream Business has long-lived, high working interest properties with extensive production histories and development opportunities located in four regions within the United States:
| |
| • | Southern Alabama, which includes the associated gathering, processing and treating assets; |
| |
| • | Mid-Continent, which includes areas in Oklahoma, Arkansas, Texas Panhandle and North Texas acquired in conjunction with our Crow Creek Acquisition in May 2011; |
| |
| • | Permian, which includes areas in West Texas; and |
| |
| • | East/South Texas/Mississippi assets. |
As of December 31, 2011, these working interest properties included 591 gross operated productive wells and 1,197 gross non-operated wells with net production of approximately 87.7 MMcfe/d and proved reserves of approximately 234.0 Bcf of natural gas, 11.5 MMBbls of crude oil, and 11.3 MMBbls of natural gas liquids, of which 76% are proved developed. The reserve life index is approximately 12 years based on our average daily production for the fourth quarter of 2011.
The following table summarizes our producing properties by region as of December 31, 2011:
|
| | | | | | | | | | | | | | | |
| Region | | Average net daily sales in 4Q2011 | | Gross productive wells in December 2011 |
| | Oil, Bbl/d | | Natural gas, Mcf/d | | Natural gas liquids, Bbl/d | | Operated | | Non- Operated |
| Southern Alabama Region | | 1,697 |
| | 3,796 |
| | 734 |
| | 26 |
| | 3 |
|
| Mid-Continent Region | | 1,319 |
| | 36,483 |
| | 1,459 |
| | 316 |
| | 1,054 |
|
| Permian Region | | 449 |
| | 1,371 |
| | 201 |
| | 206 |
| | 22 |
|
| East/South Texas/Mississippi Region | | 289 |
| | 5,788 |
| | 564 |
| | 43 |
| | 118 |
|
| Total | | 3,754 |
| | 47,438 |
| | 2,958 |
| | 591 |
| | 1,197 |
|
Southern Alabama Region. The Southern Alabama region includes the Big Escambia Creek, Flomaton and Fanny Church fields located in Escambia County, Alabama. These fields produce from either the Smackover or Norphlet formations at depths ranging from approximately 15,000 to 16,000 feet. The Big Escambia Creek field was discovered in 1971 and encompasses approximately 11,568 gross and 7,334 net Eagle Rock operated acres. We operate eighteen productive wells with an average ownership of 60% working interest and 51% net revenue interest in the Big Escambia Creek field. The Fanny Church field is located two miles east of Big Escambia Creek. Our ownership includes approximately 1,284 gross and 999 net operated acres that include three productive operated wells with an average ownership of 86% working interest and 66% net revenue interest. The Flomaton field is adjacent to and partially underlies the Big Escambia Creek field. The field encompasses approximately 1,280 gross and 1,256 net Eagle Rock operated acres and produces from the Norphlet formation at depths from approximately 15,000 to 16,000 feet. We operate three productive wells with an approximate average 91% working interest and 78% net revenue interest. The Smackover and Norphlet reservoirs are sour, gas condensate reservoirs which produce gas and fluids containing a high percentage of hydrogen sulfide and carbon dioxide. These impurities are extracted at the Eagle Rock-operated Big Escambia Creek Treating Facility or Flomaton Treating Facility, and the effluent gas is further processed for the removal of natural gas liquids in the Big Escambia Creek Gas Processing Facility. The operation of the wells and the facilities is closely connected, and we are the largest owner and operator of the combined assets. In addition to selling condensate, natural gas, and NGLs, we also market elemental sulfur. Please read carefully the risks described under Part I, Item 1A. Risk Factors
Mid-Continent Region. The Mid-Continent region consists of operated and non-operated properties across the Golden Trend Field, Cana Shale play, Verden Field, and other western Oklahoma fields located in the Anadarko Basin in Oklahoma, the Mansfield Field and other various fields in the Arkoma Basin in Arkansas and Oklahoma, various fields in the Texas Panhandle, and the Barnett Shale in north Texas. Within the Mid-Continent region, these various fields can generally be characterized as mature, low decline rate fields that produce from multiple reservoirs. Productive depths range from approximately 2,500 feet in the Arkoma fields of western Arkansas to greater than 18,000 feet in the Springer formation in certain western Oklahoma fields. Our largest producing field is the Golden Trend field that extends across Grady, McClain and Garvin counties in Oklahoma. The field is a large structural trap, discovered in 1947, that produces from the shallow Pennsylvanian age Deese formation to the deep Ordovician Arbuckle formation. Most of our current production is from the Bromide formation and the "Big Four" interval consisting of the Viola, Hunton, Woodford and Sycamore formations. We typically will drill through all these formations and perform multi-stage fracture stimulation completions in the Bromides and "Big Four" intervals. We have a significant ownership position in the new and expanding Cana (Woodford) Shale play in western Oklahoma. We have 14,621 net acres in the Cana Shale play extending across Canadian, Blaine and Dewey counties, Oklahoma. The Cana Shale produces from horizontal wells drilled to vertical depths of 11,000 - 13,000 feet and extended with horizontal lateral lengths of approximately 5,000 feet. The horizontal laterals are fracture stimulated in multiple stages to optimize productivity from the shale reservoir. In the total Mid-Continent region, we operate 316 productive wells and own a working interest in an additional 1,054 non-operated productive wells. The average working interest in these productive operated and non-operated wells is 83% and 9%, respectively. The net production averaged approximately 53.2 MMcfe/d in the fourth quarter of 2011, of which approximately 77% was produced from wells we operated. Most of the non-operated production comes from the properties within the Cana Shale play, Verden Field, and various fields located in the Arkoma and Anadarko Basin. The majority of the interests in the Cana Shale are operated by large upstream companies with significant experience and expertise in developing shale gas reserves.
Permian Region. The Permian region contains numerous fields including Block 27, Estes Block 34, H.S.A., Heiner, Monahans N., Payton, Running W., Ward S, and Ward-Estes N. located mainly in Ward, Pecos, and Crane Counties, Texas. These fields are located in the Central Basin Platform which extends from central Lea County in New Mexico to central Pecos County in Texas and encompasses hundreds of individual fields with multiple productive intervals from the Yates-Seven Rivers-Queen through the Ellenburger formations. The Ward County fields contains two major properties, the Louis Richter and the American National Life Ins. Co. leases, and encompasses approximately 10,285 gross and 10,215 net Eagle Rock acres. We operate multiple fields consisting of stacked multi-pay horizons that produce from depths of 2,300 feet (Yates) to 9,100 feet (Pennsylvanian). The Southern Unit is located in the Running “W” Waddell field discovered in the mid-1930s and produces predominantly oil at depths from approximately 5,750 to 5,900 feet. We operate approximately 5,875 net acres in this area. Our ownership in these wells averages 89% net working interest and 69% net revenue interest.
East/South Texas/Mississippi Region. The East/South Texas/Mississippi region includes the Aker, Birch, Edgewood, Eustace, Fruitvale, Ginger and Wesson fields in East Texas, the Jourdanton field in South Texas, and the Chicora W, High Road, and Stafford Springs fields in Mississippi.
The East Texas fields produce primarily from the Smackover Trend at depths from 12,000 to 12,700 feet and encompass approximately 18,991 gross and 15,872 net Eagle Rock acres. We operate 32 productive wells which produce gas that contains between approximately 30% to 69% of impurities (hydrogen sulfide, nitrogen, and carbon dioxide). The Edgewood field also contains two productive gas wells in the Cotton Valley at depths of 11,500 to 11,600 feet which produce "sweet" natural gas. The East Texas production, with the exception of a single well, is delivered to the third party owned Eustace Plant for separation of condensate, removal of impurities, and extraction of natural gas liquids and sulfur for a combination of fees and percentage of proceeds. The residue gas is sold by the midstream plant operator to various markets.
In South Texas, we operate wells in the Jourdanton field in Atascosa County, Texas, which was originally discovered in 1945 by Humble Oil Company. We operate nine productive wells with 100% working interest and 88% net revenue interest. Net leasehold ownership in the field is 926 acres. Our production from the field is primarily from the Edwards carbonates (7,300 to 7,400 feet); however, production has been established in multiple reservoirs above the Edwards interval, predominately the Georgetown, Austin Chalk, and Buda formations. In addition, the Eagle Ford shale is productive in the southern portion of Atascosa County, although it has not been widely tested in the immediate vicinity of our wells.
The Mississippi properties produce from the Smackover formation at depths of 16,500 feet to 17,200 feet, and our interests encompass approximately 800 gross and 790 net acres. We operate one productive oil well and one productive gas well.
Productive Wells
On December 31, 2011, we had under operation 290 gross (261 net) productive oil wells and 301 gross (251 net) productive natural gas wells. On December 31, 2011, we owned non-operated working interests in an additional 148 gross (18 net) productive oil wells and 1049 gross (72 net) productive natural gas wells.
Developed and Undeveloped Acreage
The following table describes the leasehold acreage we owned as of December 31, 2011:
|
| | | | | | | | | | | | | | | | | |
| | Developed Acreage(a) | | Undeveloped Acreage(b) | | Total Acreage |
| | Gross(c) | | Net(d) | | Gross(c) | | Net(d) | | Gross | | Net |
| Total | 447,962 |
| | 198,634 |
| | 6,756 |
| | 8,367 |
| | 454,718 |
| | 207,001 |
|
____________________________
| |
| (a) | Developed acres are acres pooled or assigned to productive wells. |
| |
| (b) | Undeveloped acres are acres on which wells have not been drilled or completed to a point that would permit the production of commercial quantities of natural gas or oil, regardless of whether such acreage contains proved reserves. |
| |
| (c) | A gross acre is an acre in which a working interest is owned. The number of gross acres is the total number of acres in which a working interest is owned. |
| |
| (d) | A net acre is deemed to exist when the sum of the fractional ownership working interests in gross acres equals one. The number of net acres is the sum of the fractional working interests owned in gross acres. |
Drilling and Recompletion Activity
Following the close of our Crow Creek Acquisition in May 2011, we drilled and completed eleven operated wells in our Mid-Continent region which included two wells in the Cana Shale play, four wells in the Golden Trend Field, and three wells in the
Texas Panhandle. Additionally we participated with a working interest in thirty-one non-operated wells drilled and completed in the region. In our remaining operated regions, we drilled and completed one well in our Edgewood field in East Texas, and one well in our Big Escambia Creek field. Our success rate in 2011 was approximately 81% for the forty-two well drilling program with a total program unit development cost of $13.86/Boe. We consider a drilled and completed well successful if the cash flows (including capital investment) are forecasted to have a positive net present value from the booked reserves developed from the project. In 2011, of the forty-two wells drilled, six of the operated wells and two of the non-operated wells were proved undeveloped locations.
During 2011, recompletion and capital workover projects were conducted on thirteen operated wells across our Upstream segment. Eight of the thirteen recompletion and capital workovers were successful. The program unit development cost for these operations was $7.44/Boe.
In 2010, we drilled and completed five successful operated wells in the Upstream Segment. All five wells were drilled and successfully completed in our Ward Estes field in the Permian basin from the Penn and Wolfcamp formations. A sixth operated well was drilled in our Southern Unit Field in the Permian Basin but was unsuccessful. The total program development cost of these six wells was $17.23/Boe. In 2010, of the six wells we drilled, five were proved undeveloped locations.
Recompletions, capital workovers or pipeline projects were conducted on fourteen operated wells across our Upstream Segment during 2010. Eight of the fourteen capital workovers were successful. The program unit development cost for these fourteen operations was $6.27/Boe.
In 2009, we drilled and completed three successful operated wells in the Upstream Segment. Two wells were drilled and successfully completed in our Ward Estes field in the Permian basin. These wells were drilled, completed and produced to sales from the Penn and Wolfcamp formations during the fourth quarter 2009. A third operated well was drilled during 2008, but completed and produced to sales in 2009, from the Smackover formation. The total development cost of these three wells was $9.12/Boe. In 2009, of the three wells we drilled, one was a proved undeveloped location. This well cost approximately $1.1 million, and its production performance has been consistent with our expectations.
Recompletions and capital workovers were conducted on ten operated wells across our West Texas and Alabama regions during 2009. Nine capital workovers or recompletions were executed in our Permian operations in multiple formations ranging from the shallow Queen formation to the deeper Penn formation. Seven of the nine Permian capital workovers were successful. One successful well sidetrack operation was conducted in our Alabama Big Escambia Creek field targeting the Smackover formation. The unit development cost for these ten operations was $3.66/Boe.
Oil and Natural Gas Reserves
Under the SEC's reserve reporting rules, proved oil and gas reserves are defined in part as “those quantities of oil and gas, which, by analysis of geoscience and engineering data, can be estimated with reasonable certainty to be economically producible—from a given date forward, from known reservoirs, and under existing economic conditions, operating methods, and government regulations—prior to the time at which contracts providing the right to operate expire, unless evidence indicates that renewal is reasonably certain, regardless of whether deterministic or probabilistic methods are used for the estimation.”
Estimates of proved reserves as of December 31, 2011 were based on estimates made by our independent engineers, Cawley, Gillespie & Associates, Inc (“CGA”). CGA has conducted the annual estimate of proved reserves for us since 2007. In 2011, CGA was engaged by and provided its reports to our senior management team. In order to enhance our controls regarding reserve reporting, in 2009 the Audit Committee charter was amended to delegate to the Audit Committee the authority to engage and terminate the independent reserve engineer. Management continues, however, to have direct oversight of the independent reserve engineer's activities. For 2012, management recommended, and the Audit Committee approved, our continued engagement of CGA.
We make representations to CGA that we have provided all relevant operating data and documents, and in turn, we review the reserve reports provided by CGA to ensure completeness and accuracy. Our review entails a comparison of the forecasts and other parameters in the reserve report to our internal estimates and our historical results. If discrepancies are identified, we discuss these issues with CGA and provide them with additional information. This process may or may not result in changes to their estimates, but the final report will represent their estimates, based on the data we provided and their engineering judgment.
Qualifications of Reserve Estimators
Our reserves reporting process involves two major steps: (i) the population of a reserves database by our Technical Evaluations staff, and (ii) the preparation of an independent reserves report which uses the database as its starting point. The independent reserves report is prepared by CGA, which is a Texas Registered Engineering Firm (F-693). The primary engineer on our account is Ms. Kellie Jordan who works under the supervision of Mr. Robert Ravnaas, Executive Vice President. Mr. Ravnaas is a State of Texas Licensed Professional Engineer (License #61304). CGA's report is attached as Exhibit 99.1 to this Annual Report on Form 10-K.
In the preparation of its report, CGA relies on engineering and other data provided by our staff and overseen by our Senior Vice President - Technical Evaluations, Mr. Steven Hendrickson. Mr. Hendrickson is a State of Texas Licensed Professional Engineer (License #65951) with over 28 years of experience in petroleum engineering, operations, economics, finance, acquisitions and risk management. He holds a bachelors of science degree in chemical engineering from the University of Texas and a masters of science degree in finance from the University of Houston. He is a member of the Society of Petroleum Engineers and the Society of Petroleum Evaluation Engineers.
Internal Controls Over Reserve Estimation
One of our primary controls with respect to reserve reporting is the independent reserve report; however, we also have various internal controls to ensure that the data we supply to CGA is accurate. Among other things, our internal controls include the following items:
| |
| • | A process to identify all of the newly-drilled producing wells and add them to our database. |
| |
| • | A process to retrieve production data from our IHS Software Application to use as the basis of our decline curve forecasts. |
| |
| • | A process to estimate various economic parameters, such as operating costs; price differentials; gas shrinkages; and condensate, NGL and sulfur yields. This process relies on historical data provided by our accounting department and our operations engineers. |
| |
| • | A process to check the working and net revenue interests in our reserves database to ensure they are consistent with our land and revenue accounting records. |
| |
| • | A process to identify and document the engineering and geological support for our developed non-producing and undeveloped reserves. |
| |
| • | Processes to estimate future capital expenditures and abandonment costs that are based on our prior experiences and engineering judgment. |
We use the data gathered and estimated in the processes above to populate our reserves database. Our Technical Evaluations staff prepares a reserves estimate for each well in which we own an interest (including non-producing and undeveloped locations). This database is then provided to CGA, along with any additional supporting information they request, and forms the primary basis for their reserve estimates.
After CGA has made their preliminary reserves estimate, the Senior Vice President – Technical Evaluations reviews their results and compares them to our historic production rates, operating costs, price differentials, severance tax rates and ad valorem tax rates. If they are not consistent with our historical results, the database is scrutinized to identify and correct possible sources of error. The Senior Vice President – Technical Evaluations and his staff also review the production forecasts prepared by CGA for possible errors, omissions or significant differences in engineering judgment. In those instances, the issue is discussed with CGA and additional supporting data is provided, if needed. Capital costs and investment timing are also reviewed to ensure that they are consistent with our five year development plan and our approved budget.
After CGA has completed their report, our Technical Evaluations group prepares the reserves reconciliation. During this process, we occasionally identify small discrepancies that we believe should be corrected and these discrepancies are discussed and resolved with CGA.
General Reserve Estimation Methods
Because the majority of our proved reserves are classified as proved developed producing reserves, we use production performance methods (decline curve analysis) extensively in the preparation of our proved reserves estimates. Our estimates of proved undeveloped and proved developed non-producing reserves are based on volumetric methods and analogy to offset producers. Where applicable, we occasionally use material balance methods to estimate reserve quantities. We have not used reservoir simulation or proprietary methods to prepare our reserves estimates.
Proved Reserves
The following table presents our estimated net proved natural gas and oil reserves in the Upstream Business on December 31, 2011. These values are based on independent reserve reports prepared by Cawley, Gillespie & Associates, Inc.
|
| | |
| | As of
December 31, 2011 |
| Reserve Data: Upstream Business | |
| Estimated net proved reserves: | |
| Natural gas (Bcf) | 234.0 |
|
| Oil (MMBbls) | 11.5 |
|
| Natural Gas Liquids (MMBbls) | 11.3 |
|
| Total (Bcfe) | 371.2 |
|
| Proved developed (Bcfe) | 282.7 |
|
| Proved developed reserves as % of total proved reserves | 76 | % |
| | |
|
| Estimated net undeveloped reserves: | |
|
| Natural gas (Bcf) | 68.8 |
|
| Oil (MMBbls) | 1.3 |
|
| Natural Gas Liquids (MMBbls) | 2.0 |
|
| Total (Bcfe) | 88.5 |
|
| Proved undeveloped (Bcfe) | 88.5 |
|
Proved Undeveloped Reserves
As a master limited partnership, we grow primarily through acquisitions of producing properties and subsequently conduct development activities on those properties to maintain our production rates. The acquisition candidates that meet our investment criteria often have a high ratio of developed to undeveloped reserves, and we rarely conduct exploration activities. We have over 210 proved undeveloped locations, most acquired in our the Crow Creek acquisition which we closed in May, 2011.
We approach the development of our undeveloped reserves in a measured pace, in order to hold our production rate fairly constant or slightly inclining. The development plan in our proved reserves report contemplates the drilling of all of our undeveloped locations within five years.
Our undeveloped drilling locations are concentrated in the Mid-Continent region, primarily in the Golden Trend Field of Grady County, Oklahoma and the Cana Shale Play in western Oklahoma.
For detail and discussion of our net production and realized prices by product for the years ended December 31, 2011, 2010 and 2009, see our discussion of the results of operations for our Upstream Business within Part II, Item 7. Management's Discussion and Analysis of Financial Condition and Results of Operations – Year Ended December 31, 2011 Compared with Year Ended December 31, 2010 and Year Ended December 31, 2010 Compared with Year Ended December 31, 2009. Production costs, excluding ad valorem and severance taxes for our Upstream Business for the years ended December 31, 2011, 2010 and 2009 were $7.44/Boe, $12.72/Boe and $9.60/Boe, respectively.
Regulation of Our Operations
Safety and Maintenance Regulation
Midstream Business
Our Midstream Business is subject to several federal and state laws and regulations, including federal safety standards developed under the Occupational Safety and Health Act of 1970, as amended (“OSHA”), and comparable state statutes, the purpose of which are to protect the safety and health of workers. We incur costs related to compliance (including training) with
all of these laws and regulations and for monitoring and maintaining our facilities in safe operating conditions. Consequences of non-compliance with these laws and regulations are potential fines from the federal or state government agencies and disruption of operations due to injuries or equipment failure.
The OSHA process safety management (“PSM”) standard is designed to prevent or minimize the consequences of catastrophic releases of toxic, reactive, flammable or explosive chemicals. This standard applies to most processes that involve a chemical at or above the specified thresholds and certain processes which handle more than 10,000 lbs. of flammable liquids or gas, as defined in the regulation, excluding such flammable materials or processes specifically exempted within the regulation. Some of our facilities are covered by the PSM standard. Among other things, the PSM standard requires us to conduct compliance audits every three years. We are on schedule to timely complete these audits.
We are also subject to the EPA’s Risk Management Plan (“RMP”) regulations at certain facilities. These regulations are intended to work with the OSHA Process Safety Management regulations to minimize the offsite consequences of catastrophic releases. The regulations require companies to develop and implement a risk management program that includes a five-year accident history, an offsite consequence analysis process, a prevention program and an emergency response program.
Safety matters associated with our pipelines are regulated at the federal level by the Pipeline and Hazardous Materials Safety Administration ("PHMSA") of the U.S. Department of Transportation ("DOT") Office of Pipeline Safety ("OPS"), which enforce federal laws applying to pipeline safety. The safety of our pipelines is also regulated by the states in which we operate. States are largely preempted by federal law from regulating pipeline safety for interstate lines but most are certified by the DOT to assume responsibility for enforcing federal intrastate pipeline regulations and inspection of intrastate pipelines. Because states can adopt stricter standards for intrastate pipelines than those imposed by the federal government for interstate lines, states vary considerably in their authority and capacity to address pipeline safety. For more information regarding the regulations that may impact us, see "Item 1A.Risk Factors - We may incur significant costs and liabilities resulting from safety and compliance-related regulations."
Upstream Business
Our Upstream Business implicates safety matters with respect to the drilling and production of hydrocarbons and carries consequences of non-compliance consistent with those discussed above under the safety matters for the Midstream Business. This segment of our business is subject to OSHA, EPA Risk Management Plan and DOT standards. For more information regarding the regulations that may impact us, see "Item 1A.Risk Factors - We may incur significant costs and liabilities resulting from safety and compliance-related regulations."
Our Upstream Business is also subject to safety rules and regulations promulgated by state agencies. While these agencies have established some regulations designed to protect worker and community health and safety, their primary focus is on environmentally sound drilling, servicing, and production operations. See "Item 1A. Risk Factors - We may incur significant costs and liabilities resulting from safety and compliance-related regulations."
FERC and Similar State Regulations
Under the Natural Gas Act of 1938, or NGA, as amended by the Energy Policy Act of 2005, or EPAct 2005, the Federal Energy Regulatory Commission (“FERC”) has jurisdiction over the transportation of natural gas in interstate commerce and the sale of natural gas for resale in interstate commerce, and entities engaged in such activities. FERC also possesses regulatory oversight over natural gas markets, including the purchase, sale and transportation activities of non-interstate pipelines and other natural gas market participants. FERC possesses substantial enforcement authority for violations of the NGA, including the ability to assess civil penalties, order disgorgement of profits and recommend criminal penalties.
EPAct 2005 amended the NGA to grant FERC new authority to facilitate price transparency in markets for the sale or transportation of physical natural gas in interstate commerce, and to prohibit market manipulation. FERC's anti-manipulation regulations apply to FERC jurisdictional activities, which has been broadly construed by the FERC. Should we fail to comply with all applicable FERC-administered statutes, rules, regulations and orders, we could be subject to substantial civil and criminal penalties, including civil penalties of up to $1.0 million per day, per violation.
In 2008, FERC took additional steps to enhance its market oversight and monitoring of the natural gas industry. Order No. 704, as clarified in orders on rehearing, requires buyers and sellers of natural gas above a de minimis level, including entities not otherwise subject to FERC jurisdiction, to submit an annual report to FERC describing their wholesale physical natural gas transactions that use an index or that contribute to or may contribute to the formation of a gas index.
Our natural gas gathering operations are generally exempt from direct FERC regulation under the NGA; however, FERC has enforcement authority over certain aspects of our business through its jurisdiction over natural gas markets and intrastate pipelines that engage in interstate transportation services.
Our Eagle Rock DeSoto Pipeline, L.P., (“DeSoto Pipeline”) operations are subject to FERC regulation of the rates, terms and conditions of service to the extent that the DeSoto Pipeline transports gas in interstate commerce under Section 311 of the Natural Gas Policy Act, or NGPA. Rates for Section 311 transportation service must be fair and equitable, and amounts collected in excess of fair and equitable rates are subject to refund with interest. For additional information regarding the applicability of Section 311 to us, see "Item 1A. Risk Factors - Our Eagle Rock DeSoto Pipeline, L.P. (“DeSoto Pipeline”) transports gas in interstate commerce on its Central and North Texas Systems and is therefore subject to FERC regulation under Section 311 of the NGPA."
In 2010, the FERC issued Order No. 735, to be effective April 1, 2011 (further clarified by Order No. 735-A on December 16, 2010), which requires intrastate pipelines providing transportation services under Section 311 of the NGPA to report on a quarterly basis more detailed transportation and storage transaction information, including: rates charged by the pipeline under each contract; receipt and delivery points and zones or segments covered by each contract; the quantity of natural gas the shipper is entitled to transport, store, or deliver; the duration of the contract; and whether there is an affiliate relationship between the pipeline and the shipper. Order No. 735 further requires that such information be supplied through a new electronic reporting system and will be posted on FERC's website, and that such quarterly reports may not contain information redacted as privileged. Order No. 735 also extends the Commission's periodic review of the rates charged by the subject pipelines from three years to five years.
FERC issued a Notice of Inquiry on October 21, 2010 requesting comments on whether and how holders of firm capacity on intrastate pipelines providing transportation services under Section 311 of the NGPA should be permitted to allow others to make use of their firm intrastate capacity. Comments were filed in January 2011, and FERC action is pending. The Notice of Inquiry may lead to regulations that impact our DeSoto Pipeline operations.
Midstream Business
Regulation of pipeline gathering and transportation services, natural gas sales and transportation of NGLs may affect certain aspects of our business and the market for our products and services.
Gathering Pipeline Regulation. Section 1(b) of the NGA exempts natural gas gathering facilities from direct regulation by the FERC, but does not define or provide any guidance as to what constitutes “gathering.” For more information regarding the applicability of Section 1(b) of the NGA, see "Item 1A. Risk Factors- A change in the jurisdictional characterization of some of our assets by federal, state or local regulatory agencies or a change in policy by those agencies may result in increased regulation of our assets, which may cause our revenues to decline and operating expenses to increase."
Our purchasing and gathering operations are subject to ratable take and common purchaser statutes. Texas and Louisiana have adopted a complaint-based form of regulation of natural gas gathering activities, which allows natural gas producers and shippers to file complaints to resolve grievances relating to natural gas gathering access and rate discrimination. The TRRC has authority to enforce its statutory duty to prevent discrimination in natural gas gathering and transportation, to enforce the requirement that parties participate in an informal complaint process, and to punish purchasers, transporters, and gatherers for taking discriminatory actions against shippers and sellers through the imposition of administrative, civil and criminal penalties. For more information on the applicability of the common purchaser and like statutes on us, see "Risk Factors Item 1.A- We may incur significant costs and liabilities resulting from safety and compliance-related regulations."
We note that the TRRC is subject to a sunset condition. The TRRC was subject to a sunset review during the 2011 legislation session. The sunset legislation did not pass, but the Texas Legislature approved continuation of the TRRC for an additional two-year period to September 1, 2013. If the Texas Legislature does not continue the TRRC in the 2013 legislation session, the TRRC will be abolished effective September 1, 2013, and will begin a one-year wind-down process. The Sunset Advisory Commission has recommended certain organizational changes be made to the TRRC. We cannot tell what, if any, changes will be made to the TRRC during the 2013 legislative session, but we do not believe that any such changes would affect our business in a way that would be materially different from the way such changes would affect our competition. For more discussion regarding common purchaser statutes and the TRRC's authority over us, see "Risk Factors Item 1.A- We may incur significant costs and liabilities resulting from safety and compliance-related regulations."
The DOT regulates the design, installation, testing, construction, operation, replacement, and management of our pipeline facilities. In addition, we must permit access to and copying of records, and must make certain reports and provide information, as required by the Secretary of Transportation. The states in which we have pipelines have comparable regulations.
We are subject to regulation by the DOT under the Accountable Pipeline and Safety Partnership Act of 1996, sometimes referred to as the Hazardous Liquid Pipeline Safety Act (“HLPSA”), and comparable state statutes relating to the design, installation, testing, construction, operation, replacement and management of our pipeline facilities. The HLPSA covers petroleum and petroleum products. The HLPSA requires any entity that owns or operates pipeline facilities to (i) comply with such regulations, (ii) permit access to and copying of records, (iii) file certain reports and (iv) provide information as required by the Secretary of Transportation.
We are subject to the DOT regulation requiring qualification of pipeline personnel. The regulation requires pipeline operators to develop and maintain a written qualification program for individuals performing covered tasks on pipeline facilities. The intent of this regulation is to ensure a qualified work force and to reduce the probability and consequence of incidents caused by human error. The regulation establishes qualification requirements for individuals performing covered tasks.
We are also subject to the DOT Integrity Management regulations, which specify how companies should assess, evaluate, validate and maintain the integrity of pipeline segments that, in the event of a release, could impact High Consequence Areas (“HCAs”). HCAs are defined to include populated areas, unusually sensitive environmental areas and commercially navigable waterways. We are required to develop and implement an Integrity Management Program (“IMP”) that utilizes internal pipeline inspection, pressure testing, or other equally effective means to assess the integrity of HCA pipeline segments. We are also required to periodically review HCA pipeline segments to ensure adequate preventative and mitigative measures exist and take prompt action to address integrity issues raised by the assessment and analysis.
Intrastate Pipeline Regulation. The TRRC has authority over the rates, terms and conditions of service for our DeSoto Pipeline's intrastate transportation activities.
Sales of Natural Gas. Our sales for resale of natural gas are conducted pursuant to a blanket marketing certificate issued by the FERC. The price at which we buy and sell natural gas currently is not subject to federal regulation and, for the most part, is not subject to state regulation. Our sales of natural gas are affected by the availability, terms and cost of pipeline transportation. As noted above, the price and terms of access to pipeline transportation are subject to extensive federal and state regulation. The FERC is continually proposing and implementing new rules and regulations affecting the natural gas industry. These initiatives may affect the intrastate transportation of natural gas under certain circumstances. FERC has imposed an annual reporting requirement on all industry participants, including otherwise non-jurisdictional entities, engaged in wholesale physical natural gas sales and purchases in excess of a de minimis level. Further, our physical purchases and sales of natural gas, our gathering and/or transportation of natural gas, and any related hedging activities that we undertake are subject to anti-market manipulation regulation by FERC and/or the Commodity Futures Trading Commission. These agencies hold substantial enforcement authority, including the ability to assess substantial civil penalties, to order disgorgement of profits, and to recommend criminal penalties for violations of anti-market manipulation laws and related regulations. Violation of the anti-market manipulation laws and regulations could also subject us to related third-party damage claims. We do not believe that we will be affected by these anti-market manipulation requirements materially differently than other natural gas marketers with whom we compete.
Intrastate NGL Pipeline Regulation. We do not own any NGL pipelines subject to FERC regulation. We do own and operate an intrastate common carrier NGL pipeline subject to the regulation of the TRRC. The TRRC requires that intrastate NGL pipelines file tariff publications that contain all the rules and regulations governing the rates and charges for service performed. The applicable Texas statutes require that NGL pipeline rates provide no more than a fair return on the aggregate value of the pipeline property used to render services. State commissions have generally not been aggressive in regulating common carrier pipelines and have generally not investigated the rates or practices of NGL pipelines in the absence of shipper complaints. Complaints to state agencies have been infrequent and are usually resolved informally. Although we cannot assure you that our intrastate rates would ultimately be upheld if challenged, we believe that, given this history, the tariffs now in effect are not likely to be challenged or, if challenged, are not likely to be ordered to be reduced.
Upstream Business
The natural gas and oil industry is extensively regulated by numerous federal, state and local authorities. Legislation affecting the natural gas and oil industry is constantly evolving, frequently increasing the regulatory burden. Numerous
departments and agencies, both federal and state, are authorized by statute to issue new and revised rules and regulations, some of which carry substantial penalties for failure to comply which could be applicable to our business. Although the regulatory burden on the natural gas and oil industry increases our cost of doing business and, consequently, affects our profitability, these burdens generally do not affect us any differently or to any greater or lesser extent than they affect other companies in the industry with similar types, quantities and locations of production.
Drilling and Production. The activities conducted by us and by the operators on our properties are subject to significant regulation at the federal, state and local levels. These regulations include requiring permits for the drilling of wells, posting of drilling bonds and filing reports concerning operations. Most states, and some counties and municipalities, in which we operate also regulate one or more of the following:
| |
| • | the method of drilling and casing wells; |
| |
| • | the surface use and restoration of properties upon which wells are drilled; |
| |
| • | the disposal of fluids and solids used in connection with our operations; |
| |
| • | air emissions associated with our operations; |
| |
| • | the plugging and abandoning of wells; and |
| |
| • | notice to surface owners and other third parties. |
State laws regulate the size and shape of drilling and spacing units or proration units governing the pooling of natural gas and oil properties. Some states allow forced pooling or integration of tracts to facilitate exploitation while other states rely on voluntary pooling of lands and leases. In some instances, forced pooling or unitization may be implemented by third parties and may reduce our interest in the unitized properties. In addition, state conservation laws establish maximum rates of production from natural gas and oil wells, generally prohibit the venting or flaring of natural gas and impose requirements regarding the ratability of production. These laws and regulations may limit the amount of natural gas and oil we can produce from our wells or limit the number of wells or the locations at which we can drill. Moreover, each state generally imposes a production or severance tax with respect to the production and sale of oil, natural gas and natural gas liquids within its jurisdiction. Additionally, some municipalities also impose property taxes on oil and natural gas interests, production equipment, and our production revenues. For more information regarding the regulations that govern us, see "Item 1A.Risk Factors - We may incur significant costs and liabilities resulting from safety and compliance-related regulations." and "Item 1A.Risk Factors - Federal and state legislation and regulatory initiatives relating to hydraulic fracturing could result in increased costs and additional operating restrictions or delays."
Federal Regulation. Although natural gas prices are currently unregulated, Congress historically has been active in the area of natural gas regulation. We cannot predict whether new legislation to regulate natural gas prices or market participants might be proposed, what proposals, if any, might actually be enacted by Congress or the various state legislatures, and what effect, if any, the proposals might have on the operations of the underlying properties. Sales of condensate and natural gas liquids are not currently regulated and are made at market prices.
State Regulation. The various states regulate the drilling for, and the production, gathering and sale of, natural gas, including imposing severance taxes and requirements for obtaining drilling permits. States also regulate the method of developing new fields, the spacing and operation of wells and the prevention of waste of natural gas resources. States may regulate rates of production and may establish maximum daily production allowables from natural gas wells based on market demand or resource conservation, or both. States do not regulate wellhead prices or engage in other similar direct economic regulation, but there can be no assurance that they will not do so in the future. For more information regarding the impact of state regulation on us and our operations, see "Item 1A.Risk Factors - We are subject to compliance with stringent environmental and safety laws and regulations that may expose us to significant costs and liabilities, and future regulations may be more stringent" and "Item 1A. Risk Factors - We may incur significant costs and liabilities resulting from safety and compliance-related regulations."
The petroleum industry is also subject to compliance with various other federal, state and local regulations and laws. Some of those laws relate to occupational safety, resource conservation and equal employment opportunity.
Environmental Matters
Midstream Business
We operate pipelines, plants, and other facilities for gathering, compressing, treating, processing, fractionating, or transporting natural gas, NGLs, and other products that are subject to stringent and complex federal, state, and local laws and
regulations governing the discharge of materials into the environment or otherwise relating to environmental protection or safety. We have programs and policies designed to keep our pipelines, plants, and other facilities in compliance with existing environmental laws and regulations. For more information regarding the impact of environmental regulations have on us, see "Item 1A.Risk Factors - We are subject to compliance with stringent environmental and safety laws and regulations that may expose us to significant costs and liabilities, and future regulations may be more stringent."
The following is a summary of the more significant existing environmental laws and regulations to which our business operations are subject:
The Federal Clean Air Act, as amended, and comparable state laws restrict the emission of air pollutants from many sources, including our processing plants and compressor stations. These laws and any implementing regulations may require us to obtain pre-approval for the construction or modification of certain projects or facilities expected to emit new pollutants or increased existing pollutants, obtain and comply with air permits containing various emission and operational limitations, and utilize specific equipment or technologies to control emissions. We may be required to incur certain capital expenditures in the future for air pollution control equipment in connection with obtaining and maintaining operating permits and approvals for air emissions. For instance, in 2010, the United States Environmental Protection Agency ("EPA") adopted final rules making more stringent the National Ambient Air Quality Standards (“NAAQS”) for sulfur dioxide and nitrogen dioxide. Further, EPA has proposed to lower the ozone NAAQS, and has projected a final action in 2011. Attainment of these new NAAQS will likely require us to install more stringent controls at our facilities, which would result in increased capital expenditures. In addition, on July 28, 2011, the EPA published proposed New Source Performance Standards (“NSPS”) and National Emissions Standards for Hazardous Air Pollutants (“NESHAP”) that will both amend existing NSPS and NESHAP standards for oil and gas facilities as well as create a new NSPS for oil and gas production, transmission and distribution facilities. Please refer to our discussion under “Item 1A. Risk Factors-We are subject to compliance with stringent environmental laws and regulations that may expose us to significant costs and liabilities, and future regulations may be more stringent” for further information on these subjects.
We could also be impacted by federal regulations limiting greenhouse gas emissions or imposing reporting obligations with respect to such emissions which have been proposed or finalized. For a discussion of the effects of greenhouse gas regulation, see “Item 1A. Risk Factors- Climate change laws or regulations restricting emissions of "greenhouse gases" could result in increased operating costs and a decreased demand for oil and natural gas that we produce or process.”
The Federal Water Pollution Control Act of 1972, as amended, also known as the “Clean Water Act,” and analogous state laws impose restrictions and controls on the discharge of pollutants into federal and state waters. Pursuant to these laws and regulations, we are required to obtain and maintain approvals or permits for certain wastewater and stormwater discharges and discharges of dredged or fill material in wetlands and other waters of the United States, as well as develop and to implement spill prevention, control and countermeasure plans, also referred to as “SPCC plans,” in connection with on-site storage of greater than threshold quantities of oil.
The primary federal law for oil spill liability is the Oil Pollution Act of 1990 (“OPA”), which addresses three principal areas of oil pollution—(a) prevention, (b) containment and cleanup, and (c) liability. OPA applies to vessels, offshore platforms and onshore facilities, including terminals, pipelines and transfer facilities, and subjects owners of such facilities to strict liability for containment and removal costs, natural resource damages and certain other consequences of an oil spill, where such spill is into waters of the U.S. Any unpermitted release of petroleum or other pollutants from our operations could result in penalty liability. Some states maintain groundwater protection programs that require permits for discharges or operations that may impact groundwater conditions. These programs may also require remedial activities or capital expenditures to mitigate groundwater contamination along our pipeline systems as a result of past or current operations. Contamination of groundwater resulting from spills or releases of oil or gas is an inherent risk within our industry.
The Comprehensive Environmental Response, Compensation and Liability Act, as amended, also known as “CERCLA” or “Superfund,” and comparable state laws impose liability, without regard to fault or the legality of the original conduct, on certain classes of persons who are considered to be responsible for the release of a hazardous substance into the environment. Under CERCLA, these “responsible persons” may be subject to joint and several, strict liability for the costs of cleaning up the hazardous substances that have been released into the environment, for damages to natural resources, and for the costs of certain health studies, and it is not uncommon for neighboring landowners and other third parties to file claims for personal injury and property damage allegedly caused by the release of hazardous substances into the environment. We generate materials in the course of our operations that may be regulated as hazardous substances We also may incur liability under the Resource Conservation and Recovery Act, as amended, also known as “RCRA,” which imposes requirements related to the handling and disposal of solid and hazardous wastes, as well as similar state laws. In the course of our operations we may generate petroleum product wastes and ordinary industrial wastes that may be regulated as solid and hazardous wastes
under RCRA.
We currently own or lease, and have in the past owned or leased, properties that for many years have been used for midstream natural gas and NGL activities. Although we used operating and disposal practices that were standard in the industry at the time, petroleum hydrocarbons or wastes may have been disposed of or released on or under the properties owned or leased by us or on or under other locations where such wastes have been taken for disposal. In addition, some of these properties have been operated by third parties whose treatment and disposal or release of petroleum hydrocarbons and wastes were not under our control. These properties and the materials disposed or released on them may be subject to CERCLA, RCRA and analogous state laws. Under such laws, we could be required to remove or remediate previously disposed wastes (including wastes disposed of by prior owners or operators) or contaminated property (including ground water contamination), or to perform activities to prevent future contamination.
The federal Endangered Species Act, as amended, or “ESA,” restricts activities that may affect endangered or threatened species or their habitats. While some of our facilities may be located in areas that are designated as habitat for endangered or threatened species, we believe that we are in substantial compliance with the ESA. However, the designation of previously unidentified endangered or threatened species could cause us to incur additional costs or become subject to operating restrictions or bans in the affected areas.
In addition to claims arising under state and federal statutes, where a release or spill of hazardous substances, oil and gas, or oil and gas wastes have occurred, private parties or landowners may bring lawsuits under state law. The plaintiffs in such lawsuits may seek property damages, personal injury damages, remediation costs or injunctions to require remediation or restoration of contaminated environmental media, including soil, sediment, groundwater or surface water. Some of our oil and gas operations are located near populated areas and routine emissions or accidental releases could affect the surrounding properties and population.
Upstream Business
Our Upstream Business involves acquiring, developing and producing oil and natural gas working interests.
Our and our lease operators’ operations are subject to stringent and complex federal, state and local laws and regulations governing the discharge of materials into the environment or otherwise relating to environmental protection or safety. Our Upstream Business is subject to the same environmental laws and regulations that are discussed in our Midstream Business section above. Like our Midstream Business, our Upstream Business could be impacted by any legislation or regulations that are adopted to address greenhouse gas emissions in the United States. For further discussion of these environmental laws and regulations, see “-Midstream Business” above and “Item 1A. Risk Factors-We are subject to compliance with stringent environmental laws and regulations that may expose us to significant costs and liabilities, and future regulations may be more stringent.”
On our working interest properties, and particularly our operated properties, we are responsible for conducting operations in a manner that complies with applicable environmental laws and regulations. These laws and regulations can adversely affect our capital expenditures, earnings and competitive position in many ways, such as:
| |
| • | requiring the acquisition of various permits before drilling commences; |
| |
| • | requiring the installation of expensive pollution control equipment; |
| |
| • | restricting the types, quantities and concentration of various substances that can be released into the environment in connection with drilling and production activities; |
| |
| • | limiting or prohibiting drilling activities on lands lying within wilderness, wetlands and other protected areas; |
| |
| • | requiring remedial measures to prevent pollution from former operations, such as pit closure and plugging of abandoned wells; |
| |
| • | imposing substantial liabilities for pollution resulting from our operations; |
| |
| • | with respect to operations affecting federal lands or leases, requiring preparation of a Resource Management Plan, an Environmental Assessment, and/or an Environmental Impact Statement; and |
| |
| • | restricting the rate of natural gas and oil production below the rate that would otherwise be possible. |
Consistent with normal industry practices, substantially all of our oil and gas leases require that, upon termination of economic production, the working interest owners’ plug and abandon non-producing wellbores, remove tanks, production equipment and flow lines and restore the wellsite. We have recorded liabilities for these asset retirement obligations in accordance with authoritative guidance which applies to obligations associated with the retirement of tangible long-lived assets that result from the acquisition, construction and development of the assets. The guidance requires that we record the fair value
of a liability for an asset retirement obligation in the period in which it is incurred and a corresponding increase in the carrying amount of the related long-lived asset.
Hydraulic fracturing. Hydraulic fracturing is an important and common practice that is used to stimulate production of hydrocarbons, particularly from tight formations. For additional information about hydraulic fracturing and related environmental matters, see “Item 1A. Risk Factors-Federal and state legislation and regulatory initiatives relating to hydraulic fracturing could result in increased costs and additional operating restrictions or delays.”
Title to Properties and Rights-of-Way
Midstream Business
Our midstream real property falls into two categories: (i) parcels that we own in fee simple and (ii) parcels in which our interest derives from leases, easements, rights-of-way, permits or licenses from landowners or governmental authorities permitting the use of such land for our operations. Portions of the land on which our plants and other major facilities are located are owned by us in fee title, and we believe that we have satisfactory title to these lands. The remainder of the land on which our plant sites and major facilities are located are held by us pursuant to ground leases between us, as lessee, and the fee owner of the lands, as lessors. We, or our predecessors, have leased these lands for many years without any material challenge known to us relating to the title to the land upon which the assets are located, and we believe that we have satisfactory leasehold estates to such lands. We have no knowledge of any challenge to the underlying fee title of any material lease, easement, right-of-way, permit or license held by us or to our title to any material lease, easement, right-of-way, permit or lease, and we believe that we have satisfactory title to all of our material leases, easements, rights-of-way, permits and licenses.
Upstream Business
As is customary in the natural gas and oil industry, we initially conduct only a cursory review of the title to our properties on which we do not have proved reserves. Prior to completing an acquisition of producing natural gas and/or oil properties, we perform title reviews on the most significant leases and, depending on the materiality of properties or irregularities we may observe in the title chain, we may obtain a title opinion or review previously obtained title opinions. As a result, we have obtained or reviewed title opinions on a significant portion of our natural gas and/or oil properties and believe that we have satisfactory title to our producing properties in accordance with standards generally accepted in the natural gas and oil industry. Our natural gas and/or oil properties are subject to customary royalty and other interests, liens for current taxes and other burdens which we believe do not materially interfere with the use of or affect our carrying value of the properties.
Employees
To carry out our operations, as of December 31, 2011, Eagle Rock Energy G&P, LLC or its affiliates employed approximately 462 people who provide direct support for our operations. None of these employees are covered by collective bargaining agreements. Eagle Rock Energy G&P, LLC considers its employee relations to be good.
Available Information
We provide access free of charge to all of our SEC filings, as soon as reasonably practicable after filing or furnishing it, on our internet site located at www.eaglerockenergy.com. We will also make available to any unitholder, without charge, copies of its Annual Report on Form 10-K as filed with the SEC. For copies of this, or any other filing, please contact: Eagle Rock Energy Partners, L.P., General Counsel or Chief Financial Officer, 1415 Louisiana Street, Suite 2700, Houston, TX 77002, or call 281-408-1200. Unless explicitly stated otherwise herein, the information on our website is not incorporated by reference into this Annual Report on Form 10-K.
In addition, the public may read and copy any materials Eagle Rock files with the SEC at the SEC’s Public Reference Room at 100 F Street, NE, Washington, DC 20549. The public may obtain information on the operation of the Public Reference Room by calling the SEC at 1-800-SEC-0330. The SEC maintains a website (www.sec.gov) that contains reports, proxy and information statements and other information regarding issuers that file electronically with the SEC.
Limited partner interests are inherently different from capital stock of a corporation, although many of the business risks to which we are subject are similar to those that would be faced by a corporation engaged in similar businesses.
If any of the following risks were actually to occur, our business, financial condition or results of operations could be materially adversely affected. In that case, we might not be able to pay a distribution on our common units, the trading price of our common units could decline and you could lose all or part of your investment.
Certain risks apply to both our midstream business and our upstream business. To the extent any risk applies to one or the other, we have indicated this in the appropriate risk factor.
Risks Related to Our Business
We may not have sufficient cash from operations following the establishment of cash reserves to enable us to make cash distributions at any particular level or at all.
The amount of cash available to us to distribute on our units may fluctuate from quarter to quarter based on, among other things:
| |
| • | the level of production of oil and natural gas we gather, treat, compress, process, transport and sell; and the volume of NGLs we capture, transport and sell in our Midstream Business; |
| |
| • | the level of oil, natural gas, NGLs and condensate that we produce in our Upstream Business; |
| |
| • | volatility in the realized prices for oil, natural gas, NGLs and condensate that we and others produce; |
| |
| • | the effectiveness of our hedging program and the creditworthiness of our hedging counterparties; |
| |
| • | our level of indebtedness, debt service requirements and need to reduce outstanding indebtedness; |
| |
| • | our ability to borrow funds and access capital markets; |
| |
| • | the level of our operating and general and administrative costs; |
| |
| • | our decisions regarding the level and use of available cash for growth versus maintenance capital expenditures; |
| |
| • | our operators’ and other producers’ drilling activities and success of such programs; and |
| |
| • | the level of competition from other upstream and midstream energy companies. |
As a result of these factors, the amount of cash we distribute to our unitholders may be significantly less than the current distribution level, or the distribution may be suspended. In addition, under our partnership agreement, our General Partner may determine to establish any cash reserve necessary for the proper conduct of our business including reserves for future capital expenditures, future credit needs and to better ensure continued compliance with our credit facility and the indenture governing our 8 3/8% Senior Notes Due 2019 (the "senior notes"), before making distributions to our unitholders.
Our general partner also determines the amount and timing of asset purchases and sales, capital expenditures, borrowings, and issuances of additional partnership securities, which, together with establishing reserves, can affect the amount of cash available for distribution to our unitholders. As a result, we may make distributions during periods when we record losses and may not make distributions during periods when we record net income.
Because of the natural decline in production from existing wells, our success depends on our ability to obtain new sources of production and supplies of oil, natural gas and NGLs, which are dependent on certain factors, many of which are beyond our control. Our success is also dependent on developing current reserves. Any decrease in production or supplies of oil, natural gas or NGLs could adversely affect our business and operating results.
The volume of gas that we gather, process and/or produce is dependent on the level of production from hydrocarbon-producing wells. The production rate of these wells naturally will decline over time, and as a result, our cash flows associated with them will also decline over time. In order to maintain or increase the throughput levels of our assets we must continually obtain new supplies of natural gas to offset these declines.
In our Midstream Business, the primary factors affecting our ability to obtain new supplies of natural gas and NGLs and attract new customers to our assets include: (i) the level of successful drilling activity by producers near our systems and (ii) our ability to compete for volumes from successful new wells. The level of drilling activity is dependent on economic and business factors that are beyond our control. The primary factor that impacts producers’ drilling decisions is natural gas prices. A sustained decline in natural gas prices could result in a decrease in exploration and development activities in the fields served by our gathering systems and our natural gas treating and processing plants, which would lead to reduced utilization of these
assets. Other factors that impact production decisions include producers’ capital budgets, the ability of producers to obtain capital and necessary drilling and other governmental permits and regulatory changes. Because of these factors, even if new natural gas reserves are discovered in areas served by our assets, we and other producers may choose not to develop those reserves.
In our Upstream Business, we also have risks inherent with declining reserves. Our producing reservoirs experience production rate declines that vary depending upon reservoir characteristics and other factors. The overall production decline rate of our upstream business may change when additional wells are drilled, make acquisitions and under other circumstances. Our future cash flows and income, and our ability to maintain and to increase distributions to unitholders, are partly dependent on our success in efficiently developing and exploiting our current reserves and economically finding or acquiring additional recoverable reserves. We may not be able to develop, find or acquire additional reserves to replace our current and future production at acceptable costs, which would adversely affect our business, financial condition and results of operations. Factors that may hinder our ability to acquire additional reserves or develop current reserves include competition, access to capital, prevailing oil and natural gas prices, the costs incurred by us to develop and exploit current and future oil and natural gas reserves, and the number and attractiveness of properties for sale.
Natural gas, NGLs, crude oil and other commodity prices are volatile, and an adverse movement in these prices could adversely affect our cash flow and our ability to make distributions.
We are subject to risks due to frequent and often substantial fluctuations in commodity prices. In the past, the prices of natural gas, NGLs and crude oil have been extremely volatile, and we expect this volatility to continue. A drop in prices can significantly affect our financial results and impede our growth, including our ability to maintain or increase our borrowing capacity, to repay current or future indebtedness and to obtain additional capital on attractive terms, all of which can affect our ability to pay distributions.
Changes in natural gas, NGL and crude oil prices have a significant impact on the value of our reserves and on our cash flows. In 2011, the settlement price of the prompt month NYMEX natural gas contract ranged from $2.99 per MMBtu to $4.85 per MMBtu, and the settlement price of prompt month NYMEX crude oil contract ranged from $75.67 per barrel to $113.93 per barrel.
The prices for natural gas, NGLs and crude oil depend upon the supply and demand for these products, which in turn depend on a large number of complex, interrelated factors that are beyond our control. These factors include:
| |
| • | the overall level of economic activity in the United States and the world; |
| |
| • | the impact of weather or other force majeure events; |
| |
| • | political and economic conditions and events in, as well as actions taken by, foreign oil and natural gas producing nations; |
| |
| • | significant crude oil or natural gas discoveries; |
| |
| • | application of new technologies that make the development of large resource plays economically attractive; |
| |
| • | the availability of local, intrastate and interstate transportation systems for natural gas, NGLs and crude oil; |
| |
| • | the availability and marketing of competitive fuels; |
| |
| • | delays or cancellations of crude oil and natural gas drilling and production activities; |
| |
| • | the impact of energy conservation efforts, including technological advances affecting energy consumption; and |
| |
| • | the extent of governmental regulation and taxation. |
Lower natural gas, NGL or crude oil prices may not only decrease our revenues and net proceeds, but may also reduce the amount of natural gas, NGLs or crude oil that our Upstream Business and our Midstream Business's producer-customers can economically produce. As a result, especially during periods of low commodity prices, we or our producer customers may decide to shut in or curtail production, or to plug and abandon marginal wells, which could have a material adverse effect on our future cash flows.
Low commodity prices may result in additional write-downs of our asset carrying values.
In our Upstream Business, low oil and natural gas prices may result in substantial downward adjustments to our estimated proved reserves. Furthermore, if our estimates of development costs increase, production data factors change or drilling results deteriorate, accounting rules may require us to write down, as a non-cash charge to earnings, the carrying value of our oil and natural gas properties. Low oil and natural gas prices also may result in reduced drilling activity and declines in future cash flows within our Midstream Business.
We are required to perform impairment tests on our assets periodically and whenever events or changes in circumstances warrant a review of our assets. To the extent such tests indicate a reduction of the estimated future cash flows of our assets, the carrying value may not be recoverable and therefore may require a write-down. During the year ended December 31, 2011, we incurred total impairment charges of $16.3 million, primarily as a result of future drilling locations that were no longer economical in the current natural gas price environment. See Note 2 and Note 12 to our consolidated financial statements included in Part II, Item 8. Financial Statements and Supplementary Data starting on page F-1 of this Annual Report on Form 10-K for further discussion. During the year ended December 31, 2010, we incurred total impairment charges of $6.7 million, primarily as a result of contract terminations notifications by significant producers in our East Texas and Other Midstream Segment. During the year ended December 31, 2009, we incurred total impairment charges of $21.8 million primarily as a result of lower drilling activity due to lower natural gas prices. We may incur additional impairment charges in the future, which could have a material adverse effect on our results of operations and financial position in the period incurred.
Our hedging activities may have a material adverse effect on our earnings, profitability, cash flows and financial condition.
Because we are exposed to risks associated with fluctuating commodity prices, we utilize various financial instruments (swaps, collars, and puts) to mitigate these risks within our overall hedge portfolio. Separate from our hedge portfolio, we capitalize on financial arbitrage opportunities and diversify our credit and performance risk for discrete products on a limited basis through our newly-formed gas marketing and trading subsidiary. It is possible that our various hedging activities may not be effective in reducing our exposure to commodity price risk. For instance, we may not produce or process sufficient volumes to cover our hedges, we may fail to hedge a sufficient portion of our future production or the instruments we use may not adequately correlate with changes in the prices we receive. Our current hedging portfolio is presented in Part II, Item 7A. Qualitative and Quantitative Disclosure About Market Risk. For more information about the activities of our trading and marketing subsidiary, which are not listed within our hedging portfolio, see "Part I, Item 1. Our Two Lines of Business - Midstream Business - Marketing and Trading Segment.
To the extent we hedge our commodity price and interest rate risk, we may forego the benefits we would otherwise experience when commodity prices or interest rates improve. Furthermore, because we have entered into derivative transactions related to only a portion of the commodity volumes and outstanding debt to which we have price and interest rate exposure, we will continue to have direct commodity price and interest rate risk on the unhedged portion. Our actual future supply and production may be significantly higher or lower than we estimated at the time we entered into the commodity derivative transactions for that period. If the actual amount is higher than we estimated, we will have more commodity price risk than we intended. If the actual amount is lower than the amount that is subject to our derivative financial instruments, we might be forced to satisfy all or a portion of our derivative transactions without the benefit of a corresponding settlement of the underlying physical commodity, which could, in certain circumstances, result in a reduction of our liquidity.
As a result of these factors, our hedging activities may not be as effective as we intend in reducing the volatility of our cash flows, and in certain extreme circumstances might actually increase the volatility of our cash flows. In addition, hedging activities may result in substantial losses. Such losses could occur under various circumstances, such as when a counterparty fails to perform its obligations under the applicable hedging arrangement, the hedging arrangement is imperfect or ineffective, or our hedging policies and procedures are not properly followed or otherwise do not work as planned. The steps we take to monitor our hedging activities may not detect and prevent violations of our risk management policies and procedures, particularly if deception or other intentional misconduct is involved.
Due to the enactment of the Dodd-Frank Wall Street Reform and Consumer Protection Act (Dodd-Frank), the hedges we execute are undertaken in a highly regulated market. At this time, significant components of the Dodd-Frank regulatory regime are subject to rulemaking by the Commodity Futures Trading Commission and other regulators. Issues such as our continued ability to pledge non-cash collateral and the scope of transactions that could be characterized as “swaps” could affect the cost and structure of our hedging program. While we expect these issues to be resolved during the first three quarters of 2012, we cannot be certain when final rules will be issued. Until final rules are issued, we cannot predict the impact to our hedging activities. For related discussion, see the risk factor below regarding Dodd-Frank.
We have significant indebtedness under our revolving credit facility and our senior notes, which may limit our flexibility in obtaining additional financing and in pursuing other business opportunities. In addition, we may incur substantial debt in the future to enable us to maintain or increase our reserve and production levels and to otherwise pursue our business plan. This debt may restrict our ability to make distributions.
As of December 31, 2011, we had $481.5 million outstanding under our senior secured credit facility leaving approximately $193.5 million of available borrowing capacity as of that date, and $298.0 million outstanding under our senior notes, net of unamortized discount. Our level of outstanding debt could have important consequences to us, including the following:
| |
| • | our ability to obtain additional financing, if necessary, for working capital, capital expenditures, acquisitions or other purposes may be impaired or such financing may not be available on favorable terms; |
| |
| • | we will need a portion of our cash flow to make interest payments on our debt, reducing the funds that would otherwise be available for operations, future business opportunities and distributions to unitholders; |
| |
| • | our debt level will make us more vulnerable to competitive pressures or a downturn in our business or the economy generally; and |
| |
| • | our debt level may limit our flexibility in responding to changing business and economic conditions. |
Our ability to service our debt will depend upon, among other things, our future financial and operating performance, which will be affected by prevailing economic conditions and financial, business, regulatory and other factors, some of which are beyond our control. In addition, our ability to service debt under our credit facility will depend on market interest rates, since we anticipate that the interest rates applicable to our borrowings will fluctuate with movements in interest rate markets. If our operating results are not sufficient to service our current or future indebtedness or comply with our financial covenants under our existing credit facility or senior notes, we will be forced to take actions such as eliminating, reducing or further reducing distributions, reducing or delaying our business activities and expenses, acquisitions, investments or capital expenditures, selling assets, restructuring or refinancing our debt, or seeking additional equity capital. We may not be able to affect any of these actions on satisfactory terms, or at all.
Decreases in commodity prices could result in decreases in the borrowing base under our revolving credit facility, which could materially and adversely affect our operations and financial condition.
Availability under our revolving credit facility is subject to a borrowing base comprised of two components: the upstream component and the midstream component. The upstream component of the borrowing base is determined semi-annually as an amount equal to the loan value of our proved oil and gas reserves. The midstream component of the borrowing base is determined quarterly as an amount equal to the lesser of (i) 55% of the total borrowing base (subject to increase for certain periods following certain material acquisitions up to 60% of the total borrowing base) and (ii) 3.75 times Consolidated EBITDA attributable to our midstream assets for the trailing four fiscal quarters.
As a result, a reduction in the value of our proved oil and gas reserves due to decreases in commodity prices could result in a reduction in the upstream component of our borrowing base. Moreover, because the midstream component of our borrowing base is limited to 55% of the total borrowing base, we have limited ability to offset any reductions in our upstream borrowing base with increases in our midstream borrowing base. If the amount outstanding under our revolving credit facility at any time exceeds the borrowing base at such time, we may be required to repay a portion of our outstanding borrowings. If such an event were to occur, it could materially and adversely affect our operations and financial condition.
Restrictions in our credit facility limit our ability to make distributions in certain circumstances and limit our ability to enter into certain types of acquisitions and other business opportunities.
Our credit facility contains covenants limiting our ability to make distributions, incur indebtedness, grant liens, make acquisitions, investments or dispositions and engage in transactions with affiliates. Furthermore, our credit facility and the indenture governing our senior notes contain covenants requiring us to maintain certain financial ratios and tests. Any subsequent replacement, restatement or amendment of our credit facility and the indenture governing our senior notes or any new indebtedness could impose similar or greater restrictions.
We may not be able to execute our business strategy if we encounter illiquid capital and commercial credit markets.
One component of our business strategy contemplates pursuing opportunities to acquire assets where we believe growth opportunities are attractive and our business strategies could be applied. We regularly consider and enter into discussions regarding strategic transactions that we believe will present opportunities to pursue our growth strategy.
We will require substantial new capital to finance strategic acquisitions. Any limitations on our access to capital or commercial credit will impair our ability to execute this component of our growth strategy. If the cost of such capital or credit becomes too expensive, our ability to develop or acquire accretive assets will be limited. We may not be able to raise the necessary funds on satisfactory terms, if at all. The primary factors that influence our cost of capital include our units’ market performance, conditions in the commercial credit, debt and equity markets and offering or borrowing costs such as interest rates or underwriting discounts.
Our operations require substantial capital expenditures, which will reduce our cash available for distribution. We may be unable to obtain needed capital or financing on satisfactory terms or at all, which could lead to a decline in our cash flows.
The oil and natural gas industry is capital intensive. We expect to continue to make substantial capital expenditures in our business for the maintenance, growth, construction and acquisition of midstream and upstream assets and oil and natural gas production and reserves. In 2012, our capital expenditure budget is expected to be approximately $280 million, excluding acquisitions. We intend to finance our future capital expenditures with cash flows from operations, borrowings under our credit facility and the issuance of debt and equity securities, when market conditions allow. The incurrence of debt will require that a portion of our cash flows from operations be used for the payment of interest and principal on our debt, thereby reducing our ability to use cash flows to fund working capital, capital expenditures and acquisitions. Our cash flows from operations and access to capital are subject to a number of variables, including:
| |
| • | volume throughput through our pipelines and processing facilities; |
| |
| • | the estimated quantities of our proved reserves; |
| |
| • | the amount of oil and natural gas produced from existing wells; |
| |
| • | the prices at which we sell our production or that of our midstream customers; |
| |
| • | the strike prices of our hedges; |
| |
| • | our operating and general and administrative expenses; and |
| |
| • | our ability to acquire, locate and produce new reserves. |
If our revenues or the borrowing base under our credit facility decrease as a result of lower commodity prices, operating difficulties, declines in reserves or for any other reason, we may have limited ability to obtain the capital necessary to sustain our operations at current levels, or to pursue our growth strategy. Our credit facility and the indenture governing our senior notes may restrict our ability to obtain new financing. If additional capital is needed, we may not be able to obtain debt or equity financing on terms favorable to us, or at all. If cash generated by operations or available under our credit facility is not sufficient to meet our capital requirements, the failure to obtain additional financing could result in a curtailment of our operations, which in turn could lead to a possible decline in our gathering and processing available capacity or in our natural gas and crude oil reserves and production. Even if we are successful in obtaining additional financing, the terms of such financing could limit our ability to pay distributions to our unitholders. In addition, incurring additional debt may significantly increase our interest expense and financial leverage, and issuing additional partnership interests may result in significant unitholder dilution which could have a material adverse effect on our ability to pay distributions at the then-current distribution rate. Further, we may lose opportunities to acquire oil and natural gas properties and businesses.
Our industry is highly competitive, and increased competitive pressure or loss of key customers could adversely affect our business and operating results.
We compete with similar enterprises in our respective areas of operation. Some of our competitors are large oil and natural gas companies that have greater financial resources and access to supplies of oil, natural gas and NGLs than we do.
In our Midstream Business, we rely on certain natural gas producer customers for a significant portion of our natural gas and NGL supply. The number and relative significance of gas suppliers can change for a number of reasons, including the relative success of the producers’ drilling programs, additions or cancellations of gathering and processing agreements, and the acquisition of new systems. Additionally, some of our competitors may expand or construct gathering, processing and transportation systems or may develop their own gathering, processing and transportation systems in lieu of using ours. Our ability to renew or replace existing contracts with our customers at rates sufficient to maintain current revenues and cash flows could be adversely affected by the activities of our competitors and our customers. Unless we are able to acquire comparable volumes from other sources, all of these competitive pressures could have a material adverse effect on our business, results of operations, financial condition and ability to make cash distributions.
In our Upstream Business, our ability to acquire additional properties and to discover reserves in the future will be dependent upon our ability to evaluate and select suitable properties and to consummate transactions in a highly competitive
environment. Many of our larger competitors not only drill for and produce oil and natural gas, but also conduct refining operations and market petroleum and other products on a regional, national or worldwide basis. These companies may be able to pay more for oil and natural gas properties and evaluate, bid for and purchase a greater number of properties than our financial or human resources permit. In addition, these companies may have a greater ability to continue drilling activities during periods of low oil and natural gas prices, to contract for drilling equipment, to secure trained personnel and to absorb the burden of present and future federal, state, local and other laws and regulations. The oil and natural gas industry has periodically experienced shortages of drilling rigs, equipment, pipe and personnel, which has delayed development drilling and other exploitation activities and has caused significant price increases. If a significant customer of ours reduces the volume of its purchases from us, we could experience a temporary interruption in sales of, or lower prices for, our production. As a result our revenues and cash available for distribution could decline which may adversely affect our ability to make cash distributions to our unitholders.
In both the Midstream and Upstream Businesses there is significant for experienced personnel, particularly in the engineering, accounting and financial reporting, tax and land departments. In addition, competition is strong for attractive midstream assets, oil and natural gas producing properties, oil and natural gas companies and undeveloped leases and drilling rights. We may often be outbid by competitors in our attempts to acquire assets, properties or companies. Our inability to compete effectively with larger companies could have a material adverse impact on our business activities, financial condition and results of operations.
If we do not make acquisitions on economically acceptable terms, our future growth will be limited.
Our ability to grow our business depends, in part, on our ability to make acquisitions that are accretive to our cash available for distributions on a per unit basis. If we are unable to make these accretive acquisitions because we are: (i) unable to identify attractive acquisition candidates or negotiate acceptable purchase contracts with them, (ii) unable to obtain financing for these acquisitions on economically acceptable terms, or (iii) outbid by competitors, then our future growth and ability to increase distributions will be limited. Furthermore, even if we do make acquisitions that we believe will be accretive, these acquisitions may nevertheless result in a decrease in the cash generated from operations per unit because of unforeseen circumstances.
All acquisitions involve potential risks, including, among other things:
| |
| • | mistaken assumptions about future prices, volumes, revenues and costs of oil and natural gas, including synergies and estimates of the oil and natural gas reserves attributable to a property we acquire; |
| |
| • | inefficiencies and complexities that can arise because of unfamiliarity with new assets, operations and the businesses associated with them, including their markets and geographic service areas; |
| |
| • | the assumption of unknown liabilities for which we are not indemnified or for which our indemnity is inadequate; |
| |
| • | mistaken assumptions about the overall costs of equity or debt; |
| |
| • | decrease in our liquidity as a result of our using a significant portion of our available cash or borrowing capacity to finance the acquisition; |
| |
| • | increases in our interest expense or financial leverage if we incur additional debt to finance the acquisition; and |
| |
| • | customer or key employee losses at the acquired businesses. |
If we consummate any future acquisitions, our capitalization and results of operations may change significantly, and our limited partners will not have the opportunity to evaluate the economic, financial and other relevant information that we will consider.
Our ability to derive benefits from our acquisitions will depend on our ability to successfully integrate the acquired operations.
Achieving the anticipated benefits from acquisitions depends in part upon whether we are able to successfully integrate the assets or businesses of these acquisitions, in an efficient and effective manner. The difficulties combining businesses or assets potentially will include, among other things:
| |
| • | geographically separated organizations and possible differences in corporate cultures and management philosophies; |
| |
| • | significant demands on management resources, which may distract management's attention from day-to-day business; and |
| |
| • | differences in the disclosure systems, accounting systems, and internal controls and procedures (including accounting controls and internal controls and procedures we are required to maintain under the Sarbanes-Oxley Act of 2002) of the two companies, which may interfere with our ability to make timely and accurate public disclosure. |
Any inability to realize the potential benefits of the acquisition, as well as any delays in integration, could have an adverse effect upon the revenues, level of expenses and operating results of the company, after the acquisitions, which may affect the value of our common units after the acquisition.
Failure of the natural gas, NGLs, condensate or other products produced at our plants or shipped on our pipelines to meet the specifications of interconnecting pipelines or markets could result in curtailments by the pipelines or markets.
The markets and pipelines to which we deliver natural gas, NGLs, condensate or other products typically establish specifications for the products that they are willing to accept. These specifications include requirements such as hydrocarbon dewpoint, compositions, temperature, and foreign content (such as water, sulfur, carbon dioxide, and hydrogen sulfide), and these specifications can vary by product, pipeline or markets. If the total mix of a product that we deliver to a pipeline or market fails to meet the applicable product quality specifications, the pipeline or market may refuse to accept all or a part of the products scheduled for delivery to it or may invoice us for the costs to handle the out-of-specification products. In those circumstances, we may be required to find alternative markets for that product or to shut-in the producers of the non-conforming natural gas that is causing the products to be out of specification, potentially reducing our through-put volumes or revenues.
Our businesses depend in part on gathering, transportation and processing facilities. Any limitation in the availability of, or our access to, those facilities would interfere with our ability to market the oil, natural gas and NGLs we produce, and could reduce our cash available for distribution and adversely impact expected increases in oil, natural gas and NGL production from our drilling program.
The marketability of our oil, gas and NGL production depends in part on the accessibility, availability, proximity and capacity of gathering, processing and pipeline systems. The amount of oil, natural gas and NGLs that can be produced and sold is subject to limitation in certain circumstances, such as pipeline interruptions due to scheduled and unscheduled maintenance, excessive pressure, physical damage to the gathering, processing or transportation system, weather, or lack of contracted capacity on such systems. The curtailments arising from these and similar circumstances may last from a few days to several months. In many cases, we are provided only with limited, if any, notice as to when these circumstances will arise and their duration. In addition, some of our wells may be drilled in locations that are not serviced by gathering, processing and transportation facilities, or the gathering and transportation pipelines in the area may not have sufficient capacity to transport additional production. As a result, we may not be able to sell the oil, gas and NGL production from these wells until the necessary gathering, processing and transportation facilities are constructed. Any significant curtailment in gathering system or pipeline capacity, or significant delay in the construction of necessary gathering, processing and transportation facilities, would interfere with our ability to market the oil, gas and NGLs we produce, and could reduce our cash available for distribution and adversely impact expected increases in oil and gas production from our drilling program. Our access to transportation options can also be affected by U.S. federal and state regulations of oil and natural gas production and transportation and other general economic conditions beyond our control. In addition, sulfur is a by-product associated with substantially all of the natural gas production in our upstream operations in Alabama. If we were unable to sell the sulfur we produce, we may be forced to store it or curtail our oil and gas production.
If third-party pipelines and other facilities interconnected to our midstream systems become unavailable to transport or produce natural gas and NGLs, our revenues and cash available for distribution could be adversely affected.
We depend upon third-party pipelines, natural gas gathering systems and other facilities that provide delivery options to and from our pipelines and facilities for the benefit of our midstream customers. Since we do not own or operate any of these pipelines or other facilities, their continuing operation is not within our control. If any of these third-party pipelines and other facilities become unavailable or limited in their ability to transport or produce natural gas and NGLs, our revenues and cash available for distribution could be adversely affected.
Inclement weather, unforeseen events or events of force majeure may limit our ability to operate our business and could adversely affect our operating results.
The weather, unforeseen events or events of force majeure (such as acts of nature or acts of terrorism) in the areas in which we operate can cause disruptions and, in some cases, suspension of our operations (whether directly or by virtue of disrupting or suspending operations of those upon whom we rely in our operations). For example, unseasonably wet or dry weather, extended periods of below freezing weather, hurricanes, lightning strikes, tornadoes, electrical outages, domestic attacks or threats of violence may cause disruptions or suspensions of our operations, which could result in our inability to cause physical delivery of commodities guaranteed under contract or require us to purchase third-party volumes at significantly
higher prices to satisfy our delivery obligations. Disruption or suspensions of our operations could adversely affect our operating results.
Our construction of new assets is subject to regulatory, environmental, political, legal and economic risks, and therefore, may not increase revenue as expected; this could adversely affect our results of operations and financial condition.
One of the ways we intend to grow our business is through the construction of new midstream assets. The construction of additions or modifications to our existing systems and the construction of new midstream assets involve numerous regulatory, environmental, political and legal uncertainties beyond our control and may require the expenditure of significant amounts of capital. If we undertake these projects, they may not be completed on schedule or at the budgeted cost, or at all.
Our revenues may not increase immediately upon the expenditure of funds on a particular project. For instance, if we expand a pipeline, the construction expenditures may occur over an extended period of time, yet we will not receive any material increases in revenues until the project is completed. Also, we may construct facilities to capture anticipated future growth in production in a region in which such growth does not materialize. To the extent we rely on estimates of future production in our decision to construct additions to our systems, such estimates may prove to be inaccurate. As a result, new or expanded facilities may not be able to attract enough throughput to achieve our expected investment return, which could adversely affect our results of operations and financial condition.
The construction of additions to our existing gathering and transportation assets may require us to obtain new rights-of-way prior to constructing new pipelines. We may be unable to obtain such rights-of-way to connect new natural gas supplies to our existing gathering lines or capitalize on other attractive expansion opportunities. Additionally, it may become more expensive for us to obtain new rights-of-way or to renew existing rights-of-way. If the cost of renewing or obtaining new rights-of-way increases, our cash flows could be adversely affected.
Our business involves many hazards and operational risks, some of which may not be partially or fully insured or insurable. If a significant accident or event occurs that is not fully insured or interrupts normal operations, our operations and financial results could be adversely affected.
Our operations are subject to many hazards inherent in the drilling, producing, gathering, compressing, treating, processing and transporting of oil, natural gas and NGLs, including:
| |
| • | damage to production equipment, gathering equipment, pipelines and treating or processing plants, compression and related equipment and surrounding properties caused by hurricanes, tornadoes, floods, fires and other natural disasters and acts of terrorism; |
| |
| • | inadvertent damage from construction, farm and utility equipment or acts of vandalism; |
| |
| • | leaks of natural gas, poisonous hydrogen sulfide gas, NGLs and other hydrocarbons or losses of natural gas or NGLs as a result of the malfunction of pipeline, equipment or facilities; |
| |
| • | mishandling of fluids, including chemical additives that may be toxic; |
| |
| • | surface spills or underground migration due to uncontrollable flows of oil, natural gas, formation water or well fluids; |
| |
| • | fires and explosions; and |
| |
| • | other hazards that could also result in personal injury and loss of life, pollution and suspension of operations. |
These risks could result in substantial losses due to personal injury and/or loss of life, severe damage to and destruction of property and equipment and pollution or other environmental damage and attorney's fees and other expenses incurred in the prosecution or defense of litigation and may result in curtailment or suspension of our related operations. A natural disaster or other hazard affecting the areas in which we operate could have a material adverse effect on our operations and ability to pay distributions to our unitholders.
As is customary in the industry, we maintain insurance against some but not all of these risks. Additionally, we may elect not to obtain insurance if we believe that the cost of available insurance is excessive relative to the perceived risks presented. Losses could therefore occur for uninsurable or uninsured risks or in amounts in excess of existing insurance coverage. We are not fully insured against all risks inherent to our business. For example, we are not fully insured against all environmental accidents which may include toxic tort claims. If a significant accident or event occurs that is not fully insured, it could adversely affect our operations and financial condition. In addition, we may not be able to maintain or obtain insurance of the type and amount we desire at reasonable rates. As a result of market conditions, premiums and deductibles for certain of our insurance policies have increased substantially, and could escalate further. In some instances, certain insurance could become unavailable or available only for reduced amounts of coverage. Additionally, we may be unable to recover from prior
owners of our assets, pursuant to our indemnification rights, for potential environmental liabilities. The occurrence of an event that is not fully covered by insurance could have a material adverse impact on our business activities, financial condition, results of operations and ability to pay distributions to our unitholders.
Increases in interest rates could adversely impact our unit price and our ability to issue additional equity, to incur debt to make acquisitions or for other purposes or to make cash distributions at our intended levels.
Credit markets recently have experienced record lows in interest rates. Interest rates on future credit facilities and debt offerings could be higher than current levels, causing our financing costs to increase accordingly. As with other yield-oriented securities, our unit price is impacted by the level of our cash distributions and implied distribution yield. The distribution yield is often used by investors to compare and rank related yield-oriented securities for investment decision-making purposes. Therefore, changes in interest rates, either positive or negative, may affect the yield requirements of investors who invest in our units, and a rising interest rate environment could have an adverse impact on our unit price and our ability to issue additional equity, to incur debt to make acquisitions or for other purposes or to make cash distributions at our intended levels.
Our and other operators’ drilling operations may be curtailed, delayed or cancelled as a result of a variety of factors.
Drilling for oil and gas involves numerous risks, including the risk that we will not encounter commercially productive oil or gas reservoirs. Our and other operators’ drilling operations may be curtailed, delayed or cancelled as a result of a variety of factors, including:
| |
| • | unexpected drilling conditions; |
| |
| • | drilling, production or transportation facility or equipment failure or accidents; |
| |
| • | mechanical difficulties, such as lost or stuck drilling or service tools; |
| |
| • | abnormally pressured formations or rock compaction; |
| |
| • | increasing costs for or shortages or delays in the availability of drilling rigs, experienced personnel and other services and equipment; |
| |
| • | adverse weather conditions; |
| |
| • | compliance with environmental and governmental requirements; |
| |
| • | unusual or unexpected geological formations; |
| |
| • | fires, blowouts, craterings and explosions; |
| |
| • | mishandling of fluids, including chemical additives that may be toxic; and |
| |
| • | surface spills or underground migration due to uncontrollable flows of oil, natural gas, formation water or well fluids. |
We do not provide midstream services to all of our upstream activities. Any curtailment to the gathering systems we use to deliver our oil and gas production for processing, storage or further delivery to end markets could require us to find alternative means to transport the oil and natural gas production from the underlying properties, which alternative means could require us to incur additional costs. Additionally, any delay in the drilling of new wells or significant increase in drilling costs could reduce our revenues. Any such curtailment, delay, cancellation, cost increase or revenue reduction may limit our ability to make cash distributions to our unitholders.
Due to our limited industry and geographic diversification in our midstream operations and in our upstream operated properties, adverse developments in our operations or operating areas would reduce our ability to make distributions to our unitholders.
All of our midstream assets are located in the Texas Panhandle, East, and South Texas and Louisiana, and all of our upstream operated properties are located in Texas, Oklahoma, Alabama, Arkansas, and Mississippi. Due to our limited diversification in industry type and location, an adverse development in one of these businesses or operating areas would have a significantly greater impact on our financial condition and results of operations than if we maintained more diverse assets and operating areas.
Our estimated oil and natural gas reserve quantities and future production rates are based on many assumptions that may prove to be inaccurate. Any material inaccuracies in these reserve estimates or the underlying assumptions will materially affect the quantities and present value of our reserves.
Numerous uncertainties are inherent in estimating quantities of oil and natural gas reserves. The process of estimating oil and natural gas reserves is complex, requiring significant decisions and assumptions in the evaluation of available
geological, engineering and economic data for each reservoir. Reserve reports rely upon many assumptions, including future oil and natural gas prices, production levels and operating and development costs. As a result, estimated quantities of proved reserves and projections of future production rates and the estimated timing of development expenditures may prove to be inaccurate. Over time, we may make material changes to reserve estimates that reflect the actual results of drilling and production. Any significant change in our assumptions or actual performance of our wells could affect our estimates of reserves, the classifications of the reserves and our estimates of the future net cash flows associated with the reserves. In addition, since many of our wells are mature and have low production rates, changes in future production costs assumptions could have a significant effect on our proved reserve estimates.
The standardized measure of discounted future net cash flows of our estimated net proved reserves is not the same as the current market value of our estimated net proved reserves. We base the discounted future net cash flows from our estimated net proved reserves on average prices observed in the previous twelve months and on cost estimates we believe reflect the costs at the end of the period. Actual prices received for production and actual costs of such production will be different than these assumptions, perhaps materially.
The timing of both our production and our incurrence of expenses in connection with the development and production of our properties will affect the timing of actual future net cash flows from proved reserves, and thus their actual present value. In addition, the discount factor we use when calculating discounted future net cash flows may not be the most appropriate discount factor based on actual interest rates and the risks associated with our firm in particular or the natural gas and oil industry in general. Any material inaccuracy in our reserve estimates or underlying assumptions will materially affect the quantities and present value of our reserves which could adversely affect our business, results of operations, financial condition and our ability to make cash distributions to our unitholders.
Our ability to manage and grow our business effectively may be adversely affected if we lose key management or operational personnel.
We depend on the continuing efforts of our key management and operational personnel. The departure of any of our key management or operational personnel could have a significant negative effect on our business, operating results, financial condition, and on our ability to compete effectively in the marketplace. Additionally, our ability to hire, train, and retain qualified personnel will continue to be important and will become more challenging as we grow and face more significant competition in the marketplace. Our ability to grow and perhaps even to continue our current level of service to our current customers will be adversely impacted if we are unable to successfully hire, train and retain these important personnel.
We may not successfully balance our purchases and sales of natural gas, which would increase our exposure to commodity price risks.
We purchase from producers and other parties a substantial amount of the natural gas that flows through our natural gas gathering, processing and transportation systems for resale to third parties, including natural gas pipelines, marketers and a reduced number of end-users. We may not be successful in balancing our purchases and sales. A producer or supplier could fail to deliver contracted volumes or deliver in excess of contracted volumes, or a purchaser could purchase less than contracted volumes. Any of these actions could cause our purchases and sales to be unbalanced. If our purchases and sales are unbalanced, we will face increased exposure to commodity price risks and could have increased volatility in our operating income and cash flows.
We have limited control over the activities on properties we do not operate, which includes a substantial number of the properties we acquired in the Crow Creek Acquisition.
Devon Energy Production Co LP, Continental Resources, Inc., Cimarex Energy Co. and others operate some of the properties in which we have an interest, including the properties we acquired in the Crow Creek Acquisition. We have less ability to influence or control the operation or future development of these non-operated properties or the amount of capital expenditures that we are required to fund with respect to them versus those fields in which we are the operator. The success and timing of development and exploitation activities on properties operated by others depend upon a number of factors that will be largely outside our control, including:
| |
| • | the operator's expertise and financial resources; |
| |
| • | the timing and amount of their capital expenditures; |
| |
| • | the rate of production of the reserves; |
| |
| • | approval of other participants to drill wells and implement other work programs; |
| |
| • | the availability of suitable drilling rigs, drilling equipment, production and transportation infrastructure and qualified |
operating personnel; and
| |
| • | selection of technology. |
Our dependence on the operator and other working interest owners for these projects and our reduced influence or ability to control the operation and future development of these properties could materially adversely affect our business, results of operations, financial condition and ability to pay distributions to our unitholders.
We are exposed to the credit risk of our customers and other counterparties, and a general increase in the nonperformance by counterparties could have an adverse impact on our cash flows, results of operations and financial condition.
We are subject to risks of loss resulting from nonperformance by our customers and other counterparties, such as our lenders and other hedge counterparties. Any deterioration in the financial health of our customers and counterparties or any factors causing reduced access to capital for them may result in the reduction in their ability to pay or otherwise perform on their obligations to us. Furthermore, some of our customers may be highly leveraged and subject to their own operating and regulatory risks, which increases the risk that they may default on their obligations to us. Any increase in the nonperformance by our counterparties, either as a result of recent changes in financial and economic conditions or otherwise, could have an adverse impact on our operating results and could adversely affect our liquidity.
We do not own all of the land on which our pipelines and facilities are located, so our operations could be disrupted by actions of the landowners.
We do not own all of the land on which our pipelines and facilities have been constructed, and we are therefore subject to the possibility of more onerous terms or increased costs to retain necessary land use if we do not have valid rights of way or if such rights of way lapse or terminate. We obtain the rights to construct and operate our pipelines on land owned by third parties and governmental agencies for a specific period of time. Our loss of these rights, through our inability to renew right-of-way contracts or otherwise, could have a material adverse effect on our business, results of operations and financial condition and our ability to make cash distributions.
The properties we acquired in the Crow Creek Acquisition are located in areas where we have not historically conducted upstream operations, which exposes us to additional risk.
Our Mid-Continent properties are located in North Texas, Oklahoma and Arkansas, all of which are areas where we have not historically conducted upstream operations. In addition, our Mid-Continent interests include properties in the emerging Cana Shale play in Oklahoma. Because we have limited production history in these geographic regions and do not have extensive experience in emerging unconventional resource plays like that Cana Shale, we are less able to use past operational results to help predict future results. Our lack of experience may result in our not being able to fully execute our expected drilling programs in this region, and the return on investment from our operations may not be as attractive as expected. We cannot assure you that our efforts will be successful, or if successful will achieve the resource potential levels that we currently anticipate or achieve the anticipated economic returns based on our current financial models. As a result, our business, results of operations, financial condition and ability to pay distributions to our unitholders may be affected.
We have recently begun conducting commodity derivatives trading activities, where we have limited experience, which exposes us to additional risks associated with selling and marketing products in energy markets.
We have recently begun conducting commodity derivatives trading activities through our natural gas marketing subsidiary, Eagle Rock Gas Services, LLC. Our portfolio of derivative and other energy contracts may consist of contracts to buy and sell commodities that are settled by the delivery of the commodity or cash. If the values of these contracts change in a direction or manner that we do not anticipate or cannot manage, it could negatively affect our results of operations. In the past, certain marketing and trading companies have experienced severe financial problems due to price volatility in the energy commodity markets. In certain instances this volatility has caused companies to be unable to deliver energy commodities that they had guaranteed under contract. If such a delivery failure were to occur in one of our contracts, we might incur additional losses to the extent of amounts, if any, already paid to, or received from, counterparties. In addition, our lack of experience in these activities may result in our not being able to execute our operations. As a result, our business, results of operations, financial condition and ability to pay distributions to our unitholders may be adversely affected.
Certain of our properties, including some of our operations in Oklahoma, are located on Native American tribal lands and are subject to various federal and tribal approvals and regulations, which may increase our costs and delay or prevent our efforts to conduct planned operations.
Various federal agencies within the U.S. Department of the Interior, particularly the Bureau of Indian Affairs, Bureau of Land Management and the Office of Natural Resources Revenue, along with each Native American tribe, promulgate and enforce regulations pertaining to gas and oil operations on Native American tribal lands. These regulations and approval requirements relate to such matters as lease provisions, drilling and production requirements, environmental standards and royalty considerations. In addition, each Native American tribe is a sovereign nation having the right to enforce laws and regulations and to grant approvals independent from federal, state and local statutes and regulations. These tribal laws and regulations include various taxes, fees, requirements to employ Native American tribal members and other conditions that apply to lessees, operators and contractors conducting operations on Native American tribal lands. Lessees and operators conducting operations on tribal lands are generally subject to the Native American tribal court system. In addition, if our relationships with any of the relevant Native American tribes were to deteriorate, we could face significant risks to our ability to continue the projected development of our leases on Native American tribal lands. One or more of these factors may increase our costs of doing business on Native American tribal lands and impact the viability of, or prevent or delay our ability to conduct, our natural gas or oil development and production operations on such lands.
Risks Inherent in an Investment in Us
The amount of cash we have available for distribution to holders of our common units depends primarily on our cash flow and not solely on profitability.
The amount of cash we have available for distribution depends primarily upon our cash flow and not solely on profitability, which will be affected by non-cash items. As a result, we may make cash distributions during periods when we record losses for financial accounting purposes and may not make cash distributions during periods when we record net earnings for financial accounting purposes.
NGP controls a substantial portion of our common units and appoints three of our directors, and thus it could exert certain significant influence over us.
Currently, NGP beneficially owns 50,912,685 common units and 488,635 warrants to purchase additional common units, representing over 39% of our outstanding common units. In addition, pursuant to our partnership agreement, NGP is entitled to appoint three of the nine members of our board of directors. As a result, NGP could exert certain significant influence over us. NGP may have interests that do not align with our interests and with the interests of our unitholders, which could have an adverse impact on our results of operations or cash available for distribution to unitholders. In addition, NGP's level of control may make any potential takeover bids more costly or difficult in the future.
Unitholders have less ability to influence management's decisions than holders of common stock in a corporation.
Unlike the holders of common stock in a corporation, unitholders have more limited voting rights on matters affecting our business, and therefore a more limited ability to influence management's decisions regarding our business. Our partnership agreement provides that our general partner may not withdraw and may not be removed at any time for any reason whatsoever. In addition, if unitholders are dissatisfied with the performance of our general partner, they only have the right to elect five of the nine directors.
Our partnership agreement restricts the voting rights of unitholders owning 20% or more of our common units.
Unitholders’ voting rights are further restricted by the partnership agreement provision providing that any units held by a person that owns 20% or more of any class of units then outstanding, other than our general partner, its affiliates, their transferees and persons who acquired such units with the prior approval of the board of directors of our general partner, cannot vote on any matter. Our partnership agreement also contains provisions limiting the ability of unitholders to call meetings or to acquire information about our operations, as well as other provisions limiting the unitholders’ ability to influence the manner or direction of management.
Our partnership agreement requires that we distribute all of our available cash, which could limit our ability to grow and make acquisitions.
We expect that we will distribute all of our available cash to our unitholders. As a result, we expect that we will rely primarily upon external financing sources, including commercial bank borrowings and the issuance of debt and equity securities, to fund our acquisitions and expansion capital expenditures. As a result, to the extent we are unable to finance growth externally, our cash distribution policy will significantly impair our ability to grow.
In addition, because we distribute all of our available cash, our growth may not be as fast as businesses that reinvest their available cash to expand ongoing operations. To the extent we issue additional units in connection with any acquisitions or expansion capital expenditures, the payment of distributions on those additional units may increase the risk that we will be unable to maintain or increase our per unit distribution level. There are no limitations in our partnership agreement, our credit facility or the indenture governing our senior notes on our ability to issue additional units, including units ranking senior to the common units. The incurrence of additional commercial borrowings or other debt to finance our growth strategy would result in increased interest expense, which in turn may impact the available cash that we have to distribute to our unitholders.
If we fail to maintain an effective system of internal controls, we may not be able to accurately report our financial results or prevent fraud. As a result, current and potential unitholders could lose confidence in our financial reporting, which would harm our business and the trading price of our units.
Effective internal controls are necessary for us to provide reliable financial reports, prevent fraud and operate successfully as a public company. If we cannot provide reliable financial reports or prevent fraud, our reputation and operating results would be harmed. We cannot be certain that our efforts to maintain our internal controls will be successful, that we will be able to maintain adequate controls over our financial processes and reporting in the future or that we will be able to continue to comply with our obligations under Section 404 of the Sarbanes-Oxley Act of 2002. Any failure to maintain effective internal controls, or difficulties encountered in implementing or improving our internal controls, could harm our operating results or cause us to fail to meet our reporting obligations. Ineffective internal controls could also cause investors to lose confidence in our reported financial information, which would likely have a negative effect on the trading price of our units.
Our partnership agreement contains provisions that modify and limit our general partner's fiduciary duties to our unitholders.
Our partnership agreement contains provisions that modify and limit our general partner's fiduciary duties to our unitholders. Our partnership agreement also contains provisions that restrict the remedies available to unitholders for actions taken by our general partner that might otherwise constitute breaches of fiduciary duty. For example, our partnership agreement:
| |
| • | provides that whenever our general partner makes a determination or takes, or declines to take, any other action in its capacity as our general partner, our general partner is required to make such determination, or take or decline to take such other action in good faith, and our general partner will not be subject to any other or different standard imposed by our partnership agreement, Delaware law or any other law, rule or regulation or at equity; |
| |
| • | provides that our general partner will not have any liability to us or our unitholders for decisions made in its capacity as a general partner so long as it acted in good faith, and our partnership agreement specifies that the satisfaction of this standard requires that our general partner must believe that the decision is in the best interests of our partnership; |
| |
| • | provides that our general partner and its officers and directors will not be liable for monetary damages to us, our limited partners or assignees for any acts or omissions unless there has been a final and non-appealable judgment entered by a court of competent jurisdiction determining that the general partner or those other persons acted in bad faith or engaged in fraud or willful misconduct or, in the case of a criminal matter, acted with knowledge that the conduct was criminal; and |
| |
| • | provides that our general partner will not be in breach of its obligations under the partnership agreement or its fiduciary duties to us or our unitholders if the resolution of a conflict is: |
| |
| • | approved by the conflicts committee of our general partner, although our general partner is not obligated to seek such approval; |
| |
| • | approved by the vote of a majority of the outstanding common units, excluding any common units owned by our general partner or any of its affiliates; |
| |
| • | on terms no less favorable to us than those generally being provided to or available from unrelated third parties; or |
| |
| • | fair and reasonable to us, taking into account the totality of the relationships among the parties involved, including other transactions that may be particularly favorable or advantageous to us. |
In connection with a situation involving a conflict of interest, any determination by our general partner involving the resolution of the conflict of interest must be made in good faith, provided that, if our general partner does not seek approval from the conflicts committee and its board of directors determines that the resolution or course of action taken with respect to the conflict of interest satisfies either of the standards set forth in the third and fourth bullet points above, then it will be presumed that, in making its decision, the board of directors acted in good faith, and in any proceeding brought by or on behalf of any limited partner or the partnership, the person bringing or prosecuting such proceeding will have the burden of overcoming such presumption.
We have the right to borrow to make distributions. Repayment of these borrowings will decrease cash available for future distributions, and covenants in our credit facility may restrict our ability to make distributions.
Our partnership agreement allows us to borrow to make distributions. We may borrow under our credit facility to make distributions. The primary purpose of these borrowings would be to mitigate the effects of short term fluctuation in our cash flow that would otherwise cause volatility in our quarter to quarter distributions.
The terms of our credit facility may restrict our ability to pay distributions if we do not satisfy the financial and other covenants in the facility.
We may issue additional units without limited partner approval, which would dilute ownership interests.
Our partnership agreement does not limit the number of additional limited partner interests that we may issue at any time without the approval of our unitholders. The issuance by us of additional common units or other equity securities of equal or senior rank will have the following effects:
| |
| • | our unitholders’ proportionate ownership interest in us will decrease; |
| |
| • | the amount of cash available for distribution on each unit may decrease; |
| |
| • | the ratio of taxable income to distributions may increase; |
| |
| • | the relative voting strength of each previously outstanding unit may be diminished; and |
| |
| • | the market price of the common units may decline. |
Our management team, directors and NGP may sell common units in the public markets, which sales could have an adverse impact on the trading price of the common units.
Currently, our management team, directors and NGP (including through their interests in Montierra) beneficially own an aggregate of 53,009,862 common units, including 1,208,856 common units which are still subject to a vesting requirement, and 517,206 warrants to purchase common units that expire on May 15, 2012. The resale of any of these common units in the public markets could have an adverse impact on the price of the common units or on any trading market that may develop.
Liability of a limited partner may not be limited if a court finds that unitholder action constitutes control of our business.
A general partner of a partnership generally has unlimited liability for the obligations of the partnership, except for those contractual obligations of the partnership that are expressly made without recourse to the general partner. Our partnership is organized under Delaware law and we conduct business in a number of other states. The limitations on the liability of holders of limited partner interests for the obligations of a limited partnership have not been clearly established in some of the other states in which we do business. Limited partners could be liable for any and all of our obligations as a general partner if:
| |
| • | a court or government agency determined that we were conducting business in a state but had not complied with that particular state's partnership statute; or |
| |
| • | the right to act with other unitholders to remove or replace the general partner, to approve some amendments to our partnership agreement or to take other actions under our partnership agreement constitute “control” of our business. |
Unitholders may have liability to repay distributions that were wrongfully distributed to them.
Under certain circumstances, unitholders may have to repay amounts wrongfully returned or distributed to them. Under Section 17-607 of the Delaware Revised Uniform Limited Partnership Act, we may not make a distribution if the distribution would cause our liabilities to exceed the fair value of our assets. Delaware law provides that for a period of three years from the date of the impermissible distribution, limited partners who received the distribution and who knew at the time of the distribution that it violated Delaware law will be liable to the limited partnership for the distribution amount. Substituted limited partners are liable for the obligations of the assignor to make contributions to the partnership that are known to the substituted limited partner at the time it became a limited partner and for unknown obligations if the liabilities could be determined from the partnership agreement. Liabilities to partners on account of their partnership interest and liabilities that are non-recourse to the partnership are not counted for purposes of determining whether a distribution is permitted.
Our simplified capital structure (i.e. only one common class of equity outstanding) could result in slower distribution growth and less certainty of minimum distributions.
Unlike many publicly-traded partnerships, we do not have incentive distribution rights. Incentive distribution rights generally entitle the general partner of a publicly-traded partnership to increasing percentages of the cash distributed by the partnership in excess of a specified level and are designed to encourage the general partner and its affiliates to grow distributions of the partnership through, among other things, the sale or contribution of additional assets to the partnership on an accretive basis. Since we no longer have an independently-controlled general partner with incentive distribution rights in us, we could have difficulty consummating accretive transactions at the same rate as, and see slower distribution growth than, other publicly-traded partnerships.
Unlike many publicly-traded partnerships, we also do not have subordinated units. Subordinated units generally are not entitled to receive any distributions until the common units have received a specified minimum quarterly distribution plus any arrearages from prior quarters. The practical effect of the existence of subordinated units in lieu of common units is to increase the likelihood that a specified minimum quarterly distribution will be distributed on the outstanding common units. Accordingly, there may be more risk that we will not distribute a specified minimum amount each quarter (either present or in arrears) on our common units than there would exist if a portion of our outstanding units were subordinated units rather than common units.
Risks Related to Governmental Regulation
We are subject to compliance with stringent environmental laws and regulations that may expose us to significant costs and liabilities, and future regulations may be more stringent.
Our operations are subject to stringent and complex federal, state and local environmental laws and regulations. These laws and regulations may impose numerous obligations on our operations including the acquisition of permits to conduct regulated activities, the incurrence of capital expenditures to limit or prevent releases of materials from our pipelines and facilities, and the imposition of substantial liabilities for pollution resulting from our operations. Failure or delay in obtaining regulatory approvals or drilling permits by us or our operators could have a material adverse effect on our ability to develop our properties, and receipt of drilling permits with onerous conditions could increase our compliance costs. In addition, regulations regarding conservation practices and the spacing, and density of wellbores may limit the quantity of oil and natural gas that may be produced and sold.
Numerous governmental authorities, such as the Environmental Protection Agency ("EPA") and analogous state agencies in which states we operate have the power to enforce compliance with these laws and regulations, oftentimes requiring difficult and costly actions. Failure to comply may result in the assessment of administrative, civil and criminal penalties, the imposition of remedial obligations, assessment of monetary penalties and the issuance of injunctions limiting or preventing some or all of our operations. Certain environmental statutes and analogous state laws impose strict, joint and several liability for costs required to clean up and restore sites where hazardous substances have been disposed of or otherwise released. Moreover, it is not uncommon for neighboring landowners and other third parties to file claims for personal injury and property damage allegedly caused by the release of hazardous substances or other waste products into the environment.
There is risk of incurring significant environmental costs and liabilities in connection with our operations as a result of our handling of petroleum hydrocarbons and wastes; operation of our wells, gathering systems and other facilities; air emissions and water discharges related to our operations and historical industry operations and waste disposal practices. Most of our midstream assets have been used for midstream activities for a number of years, oftentimes by third parties, whose treatment and disposal or release of petroleum hydrocarbons or wastes was not under our control. Private parties, including the
owners of properties through which our gathering systems pass and facilities where our petroleum hydrocarbons or wastes are taken for reclamation or disposal, may also have the right to pursue legal actions to enforce compliance as well as to seek damages for non-compliance with environmental laws and regulations or for personal injury or property damage. We may not be able to recover some or any of these costs from insurance. See Part I, Item 1. Business—Regulation of Our Operations.
Changes in environmental laws and regulations occur frequently and such laws and regulations tend to become more stringent over time. Stricter laws, regulations or enforcement policies could significantly increase our compliance costs and have a material adverse effect on our operations or financial position. For example, in response to the April 2010 fire and explosion aboard the Deepwater Horizon drilling platform operated by British Petroleum PLC and subsequent release of oil from the Macondo well in ultra-deep water in the Gulf of Mexico, the former federal Bureau of Ocean Energy Management, Regulation and Enforcement (“BOEMRE”) (which was replaced by the Bureau of Ocean Energy Management (“BOEM”) and the Bureau of Safety and Environmental Enforcement (“BSEE”) on October 1, 2011) adopted a series of regulatory initiatives that impose a variety of new safety and operating measures on oil and natural gas exploration and production operators in federal waters in the U.S. Gulf of Mexico that are intended to help prevent a similar incident in the future. BOEMRE's adoption of these regulatory requirements have resulted in delays in the resumption of drilling-related activities, including the issuance of drilling permits in federal outer continental shelf waters of the U.S. Gulf of Mexico, and we anticipate that there will continue to be such delays as these various regulatory requirements are fully implemented. Such delays have and may continue to have an adverse effect on our midstream business, which relies in part on the transport of natural gas from exploration and production operators situated in outer continental shelf waters. In addition to regulatory restrictions already issued by the BOEMRE, there has been discussion of additional proposed changes in laws, regulations, guidance and policy that could affect exploration and production operators in federal waters of the U.S. Gulf of Mexico and, in turn, adversely affect our midstream business that relies, in part, on the receipt of natural gas from such operators. For instance, at least one bill proposed in Congress and approved by the House of Representatives would have, among other things, amended the federal OPA by increasing the minimum level of financial responsibility for companies operating on the outer continental shelf from $35 million to $300 million. We currently do not know if similar OPA legislation will be introduced in the current session of Congress or whether such legislation, if introduced, would be adopted as law, but the adoption of any laws that increase the minimum level of financial responsibility may cause oil and natural gas exploration and production operators to experience a significant increase in costs to provide financial insurance under OPA, which effect could result in a decrease in production from the outer continental shelf of the U.S. Gulf of Mexico and a corresponding decrease in our midstream business that relies, in part, on such production.
In addition, on July 28, 2011, the EPA issued proposed rules that would subject all oil and gas operations (production, processing, transmission, storage and distribution) to regulation under the NSPS and NESHAPS programs. The EPA proposed rules also include NSPS standards for completions of hydraulically fractured gas wells. These standards include the reduced emission completion (REC) techniques developed in EPA's Natural Gas STAR program along with pit flaring of gas not sent to the gathering line. The standards would be applicable to newly drilled and fractured wells as well as existing wells that are re-fractured. Further, the proposed regulations under NESHAPS include maximum achievable control technology (MACT) standards for certain equipment not currently subject to such standards. We are currently evaluating the effect these proposed rules could have on our business. Final action on the proposed rules is expected no later than April 3, 2012. If these or other initiatives result in an increase in regulation, it could increase our costs or reduce our production, which could have a material adverse effect on our results of operations and cash flows.
Moreover, in mid-2010, the EPA enacted new National Ambient Air Quality Standards (“2010 NAAQS”) which substantially lowered the emissions limits for SO2 and mandated timelines for compliance. In order to fulfill permit obligations, comply with the new 2010 NAAQS requirements, and replace and upgrade certain assets in our Alabama facilities, we expect to spend approximately $50 million over the next several years at the locations of our Alabama operations. See “Capital Expenditures” for further discussion.
We may incur significant costs and liabilities resulting from safety and compliance-related regulations.
Our gathering operations may be or become subject to safety and operational regulations relating to the design, installation, testing, construction, operation, replacement and management of gathering facilities. Additional rules and legislation pertaining to these matters are considered or adopted from time to time. For example, Louisiana's Pipeline Operations Section of the Department of Natural Resources’ Office of Conservation is generally responsible for regulating gathering facilities in Louisiana, and has authority to review and authorize the construction, acquisition, abandonment and interconnection of physical pipeline facilities and may implement new regulations in the future. Historically, apart from pipeline safety, it has not acted to exercise this jurisdiction respecting gathering facilities. We cannot predict what effect, if any, such changes might have on our operations, but the industry could be required to incur additional capital expenditures and
increased costs depending on future legislative and regulatory changes.
Additionally, we are required to comply with common purchaser statutes which generally require gatherers to purchase without undue discrimination as to source of supply or producer. Ratable take statutes generally require gatherers to take, without undue discrimination, natural gas production that may be tendered to the gatherer for handling. These statutes restrict our right as an owner of gathering facilities to decide with whom we contract to purchase or gather oil or natural gas. Federal law leaves any economic regulation of natural gas gathering to the states. The states in which we operate have adopted complaint-based regulation of oil and natural gas gathering activities, which allows oil and natural gas producers and shippers to file complaints with state regulators in an effort to resolve grievances relating to oil and natural gas gathering access and rate discrimination. Other state regulations may not directly regulate our business, but may nonetheless affect the availability of natural gas for purchase, processing and sale; for example, state regulation of production rates and maximum daily production allowable from gas wells. Although our proprietary gathering lines are currently subject to limited state regulation, there is a risk that state laws will be changed, and this may give producers a stronger basis to challenge the proprietary status of a line, or the rates, terms and conditions of a gathering line providing gathering service. Please see Part I, Item 1. Business—Regulation of Our Operations.
The majority of our gathering systems in Texas have been deemed non-utilities by the TRRC, with the exception being our Turkey Creek gathering system, which is regulated as a utility by the TRRC. Our Hesco Pipeline Company, LLC and the East Texas segment of our DeSoto Pipeline are also regulated by the TRRC. The TRRC has authority over the rates, terms and conditions of service for our DeSoto Pipeline's intrastate transportation activities. Under Texas law, non-utilities are not subject to rate regulation by the TRRC. Should the status of these non-utility facilities change, they would become subject to rate regulation by the TRRC, which could adversely affect the rates that our facilities are allowed to charge their customers. Texas also administers federal pipeline safety standards under the Pipeline Safety Act of 1968. The non-jurisdictional gathering exemption under the Natural Gas Pipeline Safety Act of 1968 presently exempts most of our gathering facilities from jurisdiction under that statute. The “rural gathering exemption,” however, may be restricted in the future. As a result of recent pipeline incidents in other parts of the country, Congress and the Department of Transportation have passed or are considering imposing more stringent pipeline safety requirements. Costs associated with complying with and qualifying our facilities under these and other regulations could be material and have an adverse effect on us, our financial condition, and our results of operations.
We may incur significant costs and liabilities as a result of pipeline integrity management program testing and any related pipeline repair, or preventative or remedial measures.
The DOT has adopted regulations requiring pipeline operators to develop integrity management programs for transportation pipelines located where a leak or rupture could do the most harm in "high consequence areas." The regulations require operators to:
| |
| • | perform ongoing assessments of pipeline integrity; |
| |
| • | identify and characterize applicable threats to pipeline segments that could impact a high consequence area; |
| |
| • | improve data collection, integration and analysis; |
| |
| • | repair and remediate the pipeline as necessary; and |
| |
| • | implement preventive and mitigating actions. |
We currently estimate that we may incur costs of $950,000 in 2012 for specific pipeline integrity management program testing along certain segments of our pipeline, as required by existing DOT regulations to be completed this year. This estimate does not include the costs, if any, for repair, remediation, preventative or mitigating actions that may be determined to be necessary as a result of the testing program, which could be substantial.
The recent adoption of derivatives legislation by the United States Congress could have an adverse effect on our ability to use derivative instruments to reduce the effect of commodity price, interest rate and other risks associated with our business.
In 2010, Congress adopted, and the President signed into law, the Dodd-Frank Wall Street Reform and Consumer Protection Act ("Dodd-Frank"), which among other things, establishes a comprehensive framework for the regulation of derivatives, or swaps. The SEC, which has jurisdiction over security-based swaps, and the Commodity Futures Trading Commission (the "CFTC"), which has jurisdiction over swaps, are in the process of finalizing regulations to implement this new statutory regime. Once implemented, and subject to certain exemptions that may be adopted and available to us, entities such as Eagle Rock that enter into swaps will be subject to, among other things, swap recordkeeping and reporting requirements; position limits for referenced futures contracts in the major energy markets and economically equivalent futures, options and swaps; and clearing, trade execution and margin requirements (e.g.posting of collateral). Our swap counterparties
may be subject to even greater regulatory requirements and may be subject to regulated capital requirements.
The applicability of such provisions (and the availability of certain exemptions) to Eagle Rock, our hedging activities and our hedging counterparties is currently uncertain, as many of the implementing regulations have not been finalized. However, the legislation and related regulations could increase our cost of compliance, increase the cost and alter the terms of derivatives transactions, and adversely impact the number and creditworthiness of available swap counterparties. All of this could impact our available liquidity, require us to divert funds away from our core business and reduce our ability to hedge and otherwise manage our financial and commercial risks related to commodity price fluctuations.
If we reduce our use of derivatives as a result of the legislation and regulations, our results of operations may become more volatile and our cash flows may be less predictable, which could adversely affect our ability to plan for and fund capital expenditures. Any of these consequences could have a material, adverse effect on us, our financial condition, and our results of operations.
A change in the jurisdictional characterization of some of our assets by federal, state or local regulatory agencies or a change in policy by those agencies may result in increased regulation of our assets, which may cause our revenues to decline and operating expenses to increase.
FERC has developed tests for determining which facilities constitute gathering facilities exempt from Federal Energy Regulatory Commission (FERC) regulation under the Natural Gas Act of 1938 (NGA). From time to time, FERC may reconsider the elements of such tests. We cannot predict when and under what circumstances FERC may elect to re-examine activities that could fall within the scope of our business with respect to gathering.
We believe that, currently, the natural gas pipelines in our gathering systems meet the traditional tests FERC has used to establish a pipeline's status as a gatherer not subject to FERC jurisdiction. However, the distinction between FERC-regulated transmission services and federally unregulated gathering services is the subject of substantial, on-going litigation, so the classification and regulation of our gathering facilities are subject to change based on future determinations by FERC and the courts. State regulation of gathering facilities generally includes various safety, environmental and, in some circumstances, nondiscriminatory take requirements, and in some instances complaint-based rate regulation. Although our natural gas gathering and intrastate transportation operations are generally exempt from direct FERC regulation, FERC has jurisdiction over natural gas markets and intrastate pipelines engaged in interstate transportation services. FERC’s policies and practices across the range of its oil and natural gas regulatory activities, such as its policies on open access transportation, ratemaking, price transparency, market manipulation, capacity release and market center promotion, indirectly affect intrastate markets. In recent years, FERC has pursued policies to increase competition, which could increase FERC's regulation over Eagle Rock DeSoto Pipeline.
Our Eagle Rock DeSoto Pipeline, L.P. (“DeSoto Pipeline”) transports gas in interstate commerce on its Central and North Texas Systems and is therefore subject to FERC regulation under Section 311 of the NGPA.
Our Eagle Rock DeSoto Pipeline is subject to FERC regulation under Section 311 of the Natural Gas Policy Act, or NGPA. In October 2008, DeSoto Pipeline filed a request for FERC approval to continue to use DeSoto Pipeline's currently-effective rate for NGPA Section 311 service, which is based on a city-gate transportation rate approved by the TRRC as being fair and equitable and not in excess of a cost-based rate. In March 2009, FERC approved a settlement authorizing DeSoto Pipeline to continue to charge the currently-effective rate for NGPA Section 311 service, subject to a requirement that on or before May 1, 2010, DeSoto Pipeline must either file a new application for rate approval with FERC or file an election to use its then-effective rates for intrastate city-gate transportation service on file with the TRRC. If the latter, then DeSoto Pipeline was required to make a filing with the TRRC for a cost-based rate determination. On September 14, 2010, the FERC granted an extension of time to May 1, 2012 for DeSoto Pipeline to file a new application for rate approval or to file the election. DeSoto Pipeline is currently evaluating its options under the terms of the settlement. Any failure on our part to comply with the rates approved by the FERC for Section 311 service, to comply with the terms and conditions of service established in our FERC-approved Statement of Operating Conditions, or to comply with applicable FERC regulations, the NGPA, or certain state laws and regulations could result in an alteration of the jurisdictional status of DeSoto Pipeline and the imposition of civil and/or criminal penalties.
A change in the regulations related to a state's use of eminent domain could inhibit our ability to secure rights-of-way for future pipeline construction projects.
Certain states where we operate are considering the adoption of laws and regulations that would limit or eliminate a state's ability to exercise eminent domain over private property. This, in turn, could make it more difficult or costly for us to
secure rights-of-way for future pipeline construction and other projects.
Climate change laws or regulations restricting emissions of "greenhouse gases" could result in increased operating costs and a decreased demand for oil and natural gas that we produce or process.
In response to findings that emissions of carbon dioxide, methane, and other greenhouse gases, or “GHGs,” present an endangerment to public heath and the environment because emissions of such gases are contributing to the warming of the earth's atmosphere and other climate changes, the EPA has adopted regulations under existing provisions of the federal Clean Air Act that would require a reduction in emissions of GHGs from motor vehicles and also may trigger construction and operating permit review for GHG emissions from certain stationary sources. The EPA has asserted that the final motor vehicle GHG emission standards triggered Prevention of Significant Deterioration (“PSD”) and Title V permit requirements for stationary sources, commencing when the motor vehicle standards took effect on January 2, 2011. The EPA has published its final rule to address the permitting of GHG emissions from stationary sources under the PSD and Title V permitting programs, pursuant to which these permitting programs have been “tailored” to apply to certain stationary sources of GHG emissions in a multi-step process, with the largest sources first subject to permitting. It is widely expected that facilities required to obtain PSD permits for their GHG emissions also will be required to reduce those emissions according to “best available control technology” standards for GHG that have yet to be developed. These EPA rulemakings could adversely affect our operations and restrict or delay our ability to obtain air permits for new or modified facilities. With regards to the monitoring and reporting of GHGs, on November 30, 2010, the EPA published a final rule expanding its existing GHG emissions reporting rule published in October 2009 to include onshore and offshore oil and natural gas production and onshore oil and natural gas processing, transmission, storage, and distribution activities, which may include certain of our operations, beginning in 2012 for emissions occurring in 2011.
In addition, both houses of Congress have actively considered legislation to reduce emissions of GHGs, and almost one-half of the states have already taken legal measures to reduce emissions of GHGs, primarily through the planned development of GHG emission inventories and/or regional GHG cap and trade programs. Most of these cap and trade programs work by requiring either major sources of emissions or major producers of fuels to acquire and surrender emission allowances, with the number of allowances available for purchase reduced each year until the overall GHG emission reduction goal is achieved. These allowances would be expected to escalate significantly in cost over time. The adoption of any legislation or regulations that requires reporting of GHGs or otherwise limits emissions of GHGs from our equipment and operations could require us to incur costs to reduce emissions of GHGs associated with our operations or could adversely affect demand for the oil and natural gas we produce or the oil, natural gas and NGLs we gather and process or fractionate. Finally, it should be noted that some scientists have concluded that increasing concentrations of GHGs in the Earth's atmosphere may produce climate changes that have significant physical effects, such as increased frequency and severity of storms, floods and other climatic events; if any such effects were to occur, they could have an adverse effect on our upstream and midstream operations.
Federal and state legislation and regulatory initiatives relating to hydraulic fracturing could result in increased costs and additional operating restrictions or delays.
Hydraulic fracturing is an important and common practice that is used to stimulate production of hydrocarbons, particularly natural gas, from tight formations. We routinely utilize hydraulic fracturing techniques in many of our natural gas well drilling and completion programs. The process involves the injection of water, sand and chemicals under pressure into the formation to fracture the surrounding rock and stimulate production. The process is typically regulated by state oil and gas commissions. However, the EPA has asserted federal regulatory authority over hydraulic fracturing involving diesel additives under the Safe Drinking Water Act's Underground Injection Control Program and has begun the process of drafting guidance documents related to this newly asserted regulatory authority. In addition, legislation has been introduced before Congress to provide for federal regulation of hydraulic fracturing and to require disclosure of the chemicals used in the fracturing process.
In addition, certain states where we operate, including Texas have adopted, and other states are considering adopting, regulations that could impose more stringent permitting, disclosure and well construction requirements on hydraulic fracturing operations. For example, Texas adopted a law in June 2011 requiring disclosure to the Texas Railroad Commission ("TRRC") and the public of certain information regarding the components used in the hydraulic-fracturing process. In addition to state laws, local land use restrictions, such as city ordinances, may restrict or prohibit the performance of well drilling in general and/or hydraulic fracturing in particular. In the event state, local, or municipal legal restrictions are adopted in areas where we are currently conducting, or in the future plan to conduct operations, we may incur additional costs to comply with such requirements that may be significant in nature, experience delays or curtailment in the pursuit of exploration, development, or production activities, and perhaps even be precluded from the drilling of wells.
There are certain governmental reviews either underway or being proposed that focus on environmental aspects of hydraulic-fracturing practices. The White House Council on Environmental Quality is coordinating an administration-wide review of hydraulic-fracturing practices, and a committee of the United States House of Representatives has conducted an investigation of hydraulic-fracturing practices. Furthermore, a number of federal agencies are analyzing, or have been requested to review, a variety of environmental issues associated with hydraulic fracturing. The EPA has commenced a study of the potential environmental effects of hydraulic fracturing on drinking water and groundwater, with initial results expected to be available by late 2012 and final results by 2014. In addition, the U.S. Department of Energy is conducting an investigation into practices the agency could recommend to better protect the environment from drilling using hydraulic-fracturing completion methods. Also, the U.S. Department of the Interior is considering disclosure requirements or other mandates for hydraulic fracturing on federal lands. These on-going or proposed studies, depending on their course and any meaningful results obtained, could spur initiatives to further regulate hydraulic fracturing under the Safe Drinking Water Act or other regulatory mechanism.
If new laws or regulations that significantly restrict hydraulic fracturing are adopted, such laws could make it more difficult or costly for us to perform fracturing to stimulate production from tight formations. In addition, if hydraulic fracturing becomes regulated at the federal level as a result of federal legislation or regulatory initiatives by the EPA, our fracturing activities could become subject to additional permitting requirements, and also to attendant permitting delays and potential increases in costs. Restrictions on hydraulic fracturing could also reduce the amount of oil and natural gas that we are ultimately able to produce from our reserves.
Tax Risks to Common Unitholders
The tax efficiency of our partnership structure depends on our status as a partnership for federal income tax purposes, as well as our not being subject to a material amount of entity-level taxation by individual states. If the Internal Revenue Service were to treat us as a corporation for federal income tax purposes or if we become subject to a material amount of entity-level taxation for state tax purposes, it would reduce the amount of cash available for distribution.
The anticipated after-tax economic benefit of an investment in the common units depends largely on our being treated as a partnership for federal income tax purposes. We have not requested, and do not plan to request, a ruling from the Internal Revenue Service, which we refer to as the IRS, on this or any other tax matter affecting us.
A publicly traded partnership such as us may be treated as a corporation for federal income tax purposes unless it satisfies a “qualifying income” requirement. Based on our current operations we believe that we are treated as a partnership rather than a corporation for such purposes; however, a change in our business or a change in current law could cause us to be treated as a corporation for federal income tax purposes. In addition, because of widespread state budget deficits and other reasons, several states are evaluating ways to subject partnerships to entity-level taxation through the imposition of state income, franchise and other forms of taxation. We are, for example, subject to an entity level tax on the portion of our income that is generated in Texas. Imposition of such a tax on us by any state, will reduce the cash available for distribution.
If we were treated as a corporation for federal income tax purposes, we would pay federal income tax on our taxable income at the corporate tax rate, which is currently a maximum of 35% and would likely pay state income tax at varying rates. Distributions would generally be taxed again as corporate dividends, and no income, gains, losses or deductions would flow through to the limited partners. Because a tax would be imposed upon us as a corporation, our cash available for distributions would be substantially reduced. Therefore, treatment of us as a corporation would result in a material reduction in the anticipated cash flow and after-tax return to the unitholders, likely causing a substantial reduction in the value of our common units.
If the IRS contests the federal income tax positions we take, the market for our common units may be adversely impacted and the cost of any IRS challenge will reduce our cash available for distribution.
We have not requested a ruling from the IRS with respect to our treatment as a partnership for federal income tax purposes or any other matter affecting us. The IRS may adopt positions that differ from the positions we take. It may be necessary to resort to administrative or court proceedings to sustain some or all of the positions we take. A court may not agree with some or all of the positions we take. Any contest by the IRS may materially and adversely impact the market for our common units and the price at which they trade. In addition, our costs of any contest by the IRS will be borne indirectly by our unitholders because the costs will reduce our cash available for distribution.
The tax consequences relating to the warrants issued in connection with the Recapitalization and Related Transactions are unclear, and the IRS may adopt positions that differ from the positions we intend to take.
The tax consequences relating to the issuance and exercise of the warrants issued in connection with the Recapitalization and Related Transactions are unclear. There is no direct legal authority as to the proper federal income tax treatment of the warrants. However, we intend for our methods of maintaining capital accounts and allocating income, gain, loss and deduction with respect to the warrants to comply with proposed Treasury regulations issued on January 22, 2003, relating to the tax treatment of noncompensatory options issued by partnerships (the “Noncompensatory Option Regulations”). Under these rules, it is not anticipated that we or our existing common unitholders will recognize income or gain as a result of the issuance or exercise of the warrants. However, it is important to note that the Noncompensatory Option Regulations are proposed Treasury regulations that are subject to change and are not legally binding until they are finalized. There can be no assurance that the proposed Treasury Regulations will ever be finalized, or that they will not be finalized in a substantially different form. Consequently, no assurance can be provided that the issuance and exercise of the warrants will be tax free or that our methods to be adopted for allocating income and loss among our unitholders to take into account the outstanding warrants will be given effect for federal income tax purposes. If our allocations are not respected, a unitholder could be allocated more taxable income (or less taxable loss).
The sale or exchange of 50% or more of our capital and profits interests during any twelve-month period would result in the technical termination of our partnership for federal income tax purposes.
We will be considered constructively to have terminated our partnership for federal income tax purposes if there is a sale or exchange of 50% or more of the total interests in our capital and profits within a twelve-month period. A termination would not affect our consolidated financial statements nor would it affect our classification as a partnership or otherwise affect the nature of our “qualifying income” for U.S. federal income tax purposes. A termination would, among other things, result in the closing of our taxable year for all unitholders and would result in a deferral of depreciation deductions allowable in computing our taxable income. A deferral of depreciation deductions would result in increased taxable income or reduced taxable loss to certain unitholders, although the exact increase or reduction for each unitholder cannot be estimated at this time. The IRS has recently announced a relief procedure whereby if a publicly traded partnership that has technically terminated requests and the IRS grants special relief, among other things, the partnership will be required to provide only a single Schedule K-1 to unitholders for the tax years in which the technical termination occurs.
We prorate our items of income, gain, loss and deduction between transferors and transferees of our units each month based upon the ownership of our units on the first day of each month, instead of on the basis of the date a particular unit is transferred. The IRS may challenge this treatment, which could change the allocation of items of income, gain, loss and deduction among our unitholders.
We prorate our items of income, gain, loss and deduction between transferors and transferees of our units each month based upon the ownership of our units on the first day of each month, instead of on the basis of the date a particular unit is transferred. The use of this proration method may not be permitted under existing Treasury Regulations, and, accordingly, our counsel is unable to opine as to the validity of this method. Recently, the U.S. Treasury Department issued proposed Treasury Regulations that provide a safe harbor pursuant to which publicly traded partnerships may use a similar monthly simplifying convention to allocate tax items. Nonetheless, the proposed regulations do not specifically authorize the use of the proration method we have adopted. If the IRS were to challenge our proration method or new Treasury Regulations were issued, we may be required to change the allocation of items of income, gain, loss and deduction among our unitholders. If the IRS were to challenge this method or new Treasury Regulations were issued, we may be required to change the allocation of items of income, gain, loss and deduction among our unitholders.
A unitholder whose units are loaned to a “short seller” to cover a short sale of units may be considered as having disposed of those units. If so, he would no longer be treated for tax purposes as a partner with respect to those units during the period of the loan and may recognize gain or loss from the disposition.
Because a unitholder whose units are loaned to a “short seller” to cover a short sale of units may be considered as having disposed of the loaned units, he may no longer be treated for tax purposes as a partner with respect to those units during the period of the loan to the short seller and the unitholder may recognize gain or loss from such disposition. Moreover, during the period of the loan to the short seller, any of our income, gain, loss or deduction with respect to those units may not be reportable by the unitholder and any cash distributions received by the unitholder as to those units could be fully taxable as ordinary income. Unitholders desiring to assure their status as partners and avoid the risk of gain recognition from a loan to a short seller are urged to modify any applicable brokerage account agreements to prohibit their brokers from borrowing their units.
Unitholders may be required to pay taxes on their share of our income even if they do not receive any cash distributions
from us.
Because our unitholders will be treated as partners to whom we will allocate taxable income which could be different in amount than the cash we distribute, unitholders will be required to pay any federal income taxes and, in some cases, state and local income taxes on their share of our taxable income even if no cash distributions were received from us. Although not anticipated, our taxable income for a taxable year may include income without a corresponding receipt of cash by us, such as accrual of future income, original issue discount or cancellation of indebtedness income. Unitholders may not receive cash distributions from us equal to their share of our taxable income or even equal to the actual tax liability that result from that income.
Tax gain or loss on disposition of our common units could be more or less than expected.
If a unitholder sells common units, they will recognize a gain or loss equal to the difference between the amount realized and the tax basis in those common units. Prior distributions to a unitholder in excess of the total net taxable income allocated for a common unit, which decreased the unitholder’s tax basis in that common unit, will, in effect, become taxable income to the unitholder if the common unit is sold at a price greater than their tax basis in that common unit, even if the price received is less than the original cost. A substantial portion of the amount realized, whether or not representing gain, may be ordinary income. In addition, if a unitholder sells units, the unitholder may incur a tax liability in excess of the amount of cash received from the sale.
Tax-exempt entities and non-U.S. persons face unique tax issues from owning common units that may result in adverse tax consequences to them.
Investment in common units by tax-exempt entities, such as individual retirement accounts (known as IRAs), other retirement plans and non-U.S. persons raises issues unique to them. For example, virtually all of our income allocated to organizations that are exempt from federal income tax, including IRAs and other retirement plans, will be unrelated business taxable income and will be taxable to them. Distributions to non-U.S. persons will be reduced by withholding taxes at the highest applicable tax rate, and non-U.S. persons will be required to file U.S. federal tax returns and pay tax on their share of our taxable income. Tax-exempt entities or non-U.S. persons should consult a tax advisor before investing in our common units.
We will treat each purchaser of our common units as having the same tax benefits without regard to the actual common units purchased. The IRS may challenge this treatment, which could adversely affect the value of the common units.
To maintain the uniformity of the economic and tax characteristics of our common units, we will adopt depreciation and amortization positions that may not conform to all aspects of existing Treasury Regulations. A successful IRS challenge to those positions could adversely affect the amount of tax benefits available to the unitholders. It also could affect the timing of these tax benefits or the amount of gain from sales of common units and could have a negative impact on the value of our common units or result in audit adjustments to tax returns of our unitholders.
Unitholder will likely be subject to state and local taxes and return filing requirements in states where they do not live as a result of investing in our common units.
In addition to federal income taxes, a unitholder will likely be subject to other taxes, including state and local taxes, unincorporated business taxes and estate, inheritance or intangible taxes that are imposed by the various jurisdictions in which we do business or own property, even if the unitholder does not live in any of those jurisdictions. A unitholder will likely be required to file state and local income tax returns and pay state and local income taxes in some or all of these various jurisdictions. Further, a unitholder may be subject to penalties for failure to comply with those requirements. We own assets and conduct business in several states. Many of these states currently impose a personal income tax. As we make acquisitions or expand our business, we may own assets or conduct business in additional states that impose a personal income tax. It is a unitholder's responsibility to file all United States federal, state and local tax returns.
Certain U.S. federal income tax deductions currently available with respect to oil and gas exploration and development may be eliminated as a result of future legislation.
The Fiscal Year 2012 Budget proposed by the President recommends elimination of certain key U.S. tax incentives
currently available to oil and natural gas exploration and production companies. Among others, the provisions include: elimination of the ability to fully deduct intangible drilling costs in the year incurred; repeal of the percentage depletion
deduction for oil and gas properties; repeal of the manufacturing tax deduction for oil and gas companies; and an increase in the geological and geophysical amortization period for independent producers. It is unclear whether any such changes will be enacted or how soon any such changes would become effective. The passage of this legislation or any other similar changes in U.S. federal income tax laws could eliminate certain tax deductions that are currently available with respect to oil and gas exploration and development, and any such change could negatively affect the taxable income allocable to the unitholders.
| |
| Item 1B. | Unresolved Staff Comments. |
Not Applicable.
For a complete description of our significant properties, see Item 1. Business, which descriptions are incorporated into this item by this reference. Substantially all of our pipelines are constructed on rights-of-way granted by the apparent record owners of the property. Lands over which pipeline rights-of-way have been obtained may be subject to prior liens that may have been subordinated to the right-of-way grants. We have obtained, where deemed necessary, license or permit agreements from public authorities and railroad companies to cross over or under, or to lay facilities in or along, waterways, county or parish roads, municipal streets, railroad properties and state highways, as applicable. In some cases, property on which our pipeline was built was purchased in fee.
We believe that we have satisfactory title to our assets. Title to property may be subject to encumbrances and liens on substantially all of our assets as collateral support of our credit facility. We believe that none of these encumbrances will materially detract from the value of our properties or from our interest in these properties or will they materially interfere with their use in the operation of our business.
While we own our facilities, plants and gathering systems, in many cases we do not always own the land upon which the facilities, plants and gathering systems reside. In cases where the land is leased (and not owned), we are ordinarily in long-term leases. From time to time, these long-term leases expire, and we are forced to negotiate new terms at market rates or exit the premises. For more information, see our table of assets within Part I, Item 1 Business – Our Two Lines of Business and Our Five Reporting Segments – Midstream Business.
| |
| Item 3. | Legal Proceedings. |
Our operations are subject to a variety of risks and disputes normally incident to our business. As a result, we are and may, at any given time, be a defendant in various legal proceedings and litigation arising in the ordinary course of business. However, we are not currently a party to any material litigation. We maintain insurance policies with insurers in amounts and with coverage and deductibles that we, with the advice of our insurance advisors and brokers, believe are reasonable and prudent. We cannot, however, give assurance that this insurance will be adequate to protect us from all material expenses related to potential future claims for personal and property damage or that these levels of insurance will be available in the future at economical prices. We have been indemnified up to a certain dollar amount for two lawsuits. If there ultimately is a finding against us in these two indemnified cases, the Partnership would expect to make a claim against the indemnification up to limits of the indemnification.
| |
| Item 4. | Mine Safety Disclosures. |
Not applicable.
PART II
| |
| Item 5. | Market for Registrant's Common Equity, Related Unitholder Matters and Issuer Purchases of Equity Securities. |
Our common units are listed on the NASDAQ Global Select Market under the symbol “EROC.” The following table sets forth, for the periods indicated, the high and low sales prices of our common units as reported by the NASDAQ Global Select Market, as well as the amount of cash distributions declared per quarter.
|
| | | | | | | | | | | | | | | | |
| Quarter Ended | | High | | Low | | Distribution per Unit | | Record Date | | Payment Date |
| March 31, 2010 | | $ | 6.76 |
| | $ | 5.35 |
| | $ | 0.0250 |
| | May 7, 2010 | | May 14, 2010 |
| June 30, 2010 | | $ | 7.42 |
| | $ | 4.62 |
| | $ | 0.0250 |
| | August 9, 2010 | | August 13, 2010 |
| September 30, 2010 | | $ | 6.44 |
| | $ | 4.99 |
| | $ | 0.0250 |
| | November 8, 2010 | | November 12, 2010 |
| December 31, 2010 | | $ | 9.00 |
| | $ | 6.09 |
| | $ | 0.1500 |
| | February 7, 2011 | | February 14, 2011 |
| | | | | | | | | | | |
| March 31, 2011 | | $ | 10.35 |
| | $ | 8.61 |
| | $ | 0.1500 |
| | May 9, 2011 | | May 13, 2011 |
| June 30, 2011 | | $ | 13.00 |
| | $ | 10.00 |
| | $ | 0.1875 |
| | August 5, 2011 | | August 12, 2011 |
| September 30, 2011 | | $ | 11.48 |
| | $ | 8.50 |
| | $ | 0.2000 |
| | November 4, 2011 | | November 14, 2011 |
| December 31, 2011 | | $ | 11.73 |
| | $ | 8.50 |
| | $ | 0.2100 |
| | February 7, 2012 | | February 14, 2012 |
The last reported sale price of our common units on the NASDAQ Global Select Market on February 22, 2012 was $11.38. As of that date, there were 136 holders of record and approximately 28,138 beneficial owners of our common units.
Cash Distribution Policy
We intend to distribute to our unitholders, on a quarterly basis, all of our available cash in the manner described below and as further described in our partnership agreement. Available cash generally means, for any quarter ending prior to liquidation, all cash on hand at the end of that quarter less the amount of cash reserves that are necessary or appropriate in the reasonable discretion of the general partner to:
| |
| • | provide for the proper conduct of our business, including for future capital expenditures and credit and other needs; |
| |
| • | comply with applicable law or any partnership debt instrument or other agreement; or |
| |
| • | provide funds for distributions to unitholders and the general partner in respect of any one or more of the next four quarters. |
Under the terms of the agreements governing our debt, we are prohibited from declaring or paying any distribution to unitholders if a default or event of default (as defined in such agreements) exists. See Item 7. Management's Discussion and Analysis of Financial Condition and Results of Operations—Liquidity and Capital Resources—Capital Requirements—Revolving Credit Facility.
Our Board of Directors will evaluate our distribution policy from time to time as conditions warrant in the future.
Repurchases of Common Units
The following table sets forth certain information with respect to repurchases of common units during the three months ended December 31, 2011:
|
| | | | | | | | | | | | | |
| Period | | Total Number of Units Purchased | | Average Price Paid Per Unit | | Total Number of Units Purchased as Part of Publicly Announced Plans or Programs | | Maximum Number (or Approximate Dollar Value) of Units that May Yet Be Purchased Under the Plan or Programs |
| October 1, 2011 to October 31, 2011 | | — |
| | — |
| | — |
| | — |
|
| November 1, 2011 to November 30, 2011 | | 127,213 |
| | $ | 10.08 |
| | — |
| | — |
|
| December 1, 2011 to December 31, 2011 | | — |
| | — |
| | — |
| | — |
|
| Total | | 127,213 |
| | $ | 10.08 |
| | — |
| | — |
|
All of the units were surrendered by employees to pay tax withholding in connection with the vesting of restricted common units. As a result, we are deeming the surrenders to be “repurchases.” These repurchases were not part of a publicly announced program to repurchase our common units, nor do we have a publicly announced program to repurchase our common units.
Item 6. Selected Financial Data.
The following table shows selected historical financial data from our audited consolidated financial statements for the five fiscal years from January 1, 2007 to December 31, 2011. The following financial data should be read in conjunction with our consolidated financial statements and the accompanying notes and "Management's Discussion and Analysis of Financial Condition and Results of Operations" included elsewhere in this report.
Our historical results of operations for the periods presented below may not be comparable either from period to period or going forward, for the following reasons:
| |
| • | On April 30, 2007, we acquired certain fee minerals, royalties and working interest properties through purchases directly from Montierra Minerals & Production, L.P. and through purchases directly from NGP-VII Income Co-Investment Opportunities, L.P., which we refer to as the Montierra Acquisition, for 6,458,946 (recorded value of $133.8 million) of our common units and $5.4 million in cash. |
| |
| • | On May 3, 2007, we acquired Laser Midstream Energy, L.P. and certain of its subsidiaries, which we refer to as the Laser Acquisition, for $113.4 million in cash and 1,407,895 (recorded value of $29.2 million) of our common units. As a result, financial results for the periods prior to May 2007 do not include the financial results from these assets. |
| |
| • | On May 3, 2007, we completed the private placement of 7,005,495 common units for $127.5 million. |
| |
| • | On June 18, 2007, we acquired certain fee minerals and royalties from MacLondon Energy, L.P., which we refer to as the MacLondon Acquisition, for $18.2 million, financed with 757,065 (recorded value of $18.1 million) of our common units and cash of $0.1 million. |
| |
| • | On July 31, 2007, we completed the acquisition of Escambia Asset Co. LLC and Escambia Operating Co. LLC, which we refer to as the EAC Acquisition, for approximately $224.6 million in cash and 689,857 (recorded value of $17.2 million) of our common units, subject to post-closing adjustment. As a result, financial results for the periods prior to July 31, 2007 do not include the financial results from these assets. |
| |
| • | On July 31, 2007, we completed the acquisition of Redman Energy Holdings, L.P. and Redman Energy Holdings II, L.P. and certain assets owned by NGP Income Co-Investment Opportunities Fund II, L.P. (a Natural Gas Partners affiliate) which we refer to as the Redman Acquisition, for 4,428,334 (recorded value of $108.2 million) common units and $84.6 million. As a result, financial results for the periods prior to July 2007 do not include the financial results from these assets. |
| |
| • | On July 31, 2007, we completed the private placement of 9,230,770 common units for approximately $204.0 million. |
| |
| • | On April 30, 2008, we completed the acquisition of Stanolind Oil and Gas Corp., which we refer to as the Stanolind Acquisition, for an aggregate purchase price of $81.9 million in cash. As a result, financial results for the periods prior to May 2008 do not include the financial results from these assets. |
| |
| • | On October 1, 2008 we completed the acquisition of Millennium Midstream Partners, L.P. (“MMP”), which we refer to as the Millennium Acquisition, for approximately $183.6 million in cash and 3,362,280 (recorded value of $29.3 million) of our common units. As a result, financial results for the periods prior to October 2008 do not include the financial results from these assets. |
| |
| • | On May 24, 2010, we completed the sale of our Minerals Business (assets acquired from Montierra and MacLondon Acquisitions) to Black Stone for approximately $171.6 million, and resulted in a pre-tax gain in the disposition of approximately $37.7 million. We used these proceeds to pay down amounts outstanding under our senior secured credit facility. Operations related to these assets for 2010 have been recorded as part of discontinued operations. Financial information for these assets for 2007, 2008 and 2009 have been retrospectively adjusted to reflect as assets and liabilities held-for-sale and discontinued operations. |
| |
| • | On June 30, 2010, we closed our Rights Offering, for which we received gross proceeds of $53.9 million. We used these proceeds to pay down amounts outstanding under our senior secured credit facility. |
| |
| • | On September 30, 2010, we acquired certain additional interest in the Big Escambia Creek Field (and the nearby Flomaton and Fanny Church fields) from Indigo Minerals, LLC for approximately $3.9 million in cash on hand. As a |
result, financial results for the periods prior to October 2010 do not include the financial results from the assets.
| |
| • | On October 19, 2010, we completed the acquisition of certain natural gas gathering systems and related facilities from Centerpoint Energy Field Services, Inc. for $27.0 million of cash. As a result, financial results for the periods prior to October 19, 2010 do not include the financial results from these assets. |
| |
| • | On May 3, 2011, we completed the acquisition of all the outstanding membership interests of CC Energy II L.L.C. ("Crow Creek Energy") for total consideration of $563.7 million including 28.8 million common units valued at $336.1 million, debt assumed of $212.6 million and cash of approximately $15.0 million. As a result, financial results for the periods prior to May 3, 2011 do not include the financial results from these assets. |
| |
| • | On May 20, 2011, we sold our Wildhorse Gathering System in our East Texas and Other Midstream Segment. The Wildhorse Gathering System was acquired as part of the Millennium Acquisition on October 1, 2008. Operations related to these assets for 2011 have been recorded as part of discontinued operations. Financial information for these assets for 2008, 2009 and 2010 have been retrospectively adjusted to reflect as assets and liabilities held-for-sale and discontinued operations. |
| |
| • | On May 27, 2011, the Partnership, along with its subsidiary, Eagle Rock Energy Finance Corp. ("Finance Corp"), as co-issuer, issued $300 million of 8 3/8% senior unsecured notes (the "Senior Notes") through a private placement. The Senior Notes will mature on June 1, 2019, and interest is payable on each June 1 and December 1, commencing December 1, 2011. |
|
| | | | | | | | | | | | | | | | | | | |
| | Year Ended December 31, 2011 | | Year Ended December 31, 2010 | | Year Ended December 31, 2009 | | Year Ended December 31, 2008 | | Year Ended December 31, 2007 |
| Statement of Operations Data: | | | | | | | | | |
| Sales to external customers | $ | 1,027,398 |
| | $ | 741,095 |
| | $ | 679,220 |
| | $ | 1,266,992 |
| | $ | 760,853 |
|
| Unrealized derivative (losses)/gains | 52,876 |
| | 8,224 |
| | (189,590 | ) | | 207,824 |
| | (130,773 | ) |
| Realized derivative (losses)/gains | (20,366 | ) | | (17,010 | ) | | 83,300 |
| | (46,059 | ) | | (3,061 | ) |
| Total revenues | 1,059,908 |
| | 732,309 |
| | 572,930 |
| | 1,428,757 |
| | 627,019 |
|
| Cost of natural gas, NGLs and condensate | 633,184 |
| | 468,304 |
| | 470,099 |
| | 886,019 |
| | 553,248 |
|
| Operating and maintenance expense | 93,048 |
| | 76,415 |
| | 71,496 |
| | 73,203 |
| | 52,793 |
|
| Taxes other than income | 19,148 |
| | 12,226 |
| | 10,709 |
| | 18,210 |
| | 7,569 |
|
| General and administrative expense | 57,891 |
| | 45,775 |
| | 45,819 |
| | 45,618 |
| | 27,740 |
|
| Other operating expense (income) | (2,893 | ) | | — |
| | (3,552 | ) | | 10,699 |
| | 2,847 |
|
| Impairment expense | 16,288 |
| | 6,666 |
| | 21,788 |
| | 142,116 |
| | — |
|
| Goodwill impairment | — |
| | — |
| | — |
| | 30,994 |
| | — |
|
| Depreciation, depletion and amortization | 131,611 |
| | 106,398 |
| | 108,530 |
| | 108,356 |
| | 72,531 |
|
| Operating income (loss) | 111,631 |
| | 16,525 |
| | (151,959 | ) | | 113,542 |
| | (89,709 | ) |
| Interest expense, net | 41,023 |
| | 42,171 |
| | 27,751 |
| | 65,044 |
| | 49,764 |
|
| Other expense (income) | 184 |
| | (450 | ) | | 136 |
| | (363 | ) | | 8,244 |
|
| Income (loss) from continuing operations before income taxes | 70,424 |
| | (25,196 | ) | | (179,846 | ) | | 48,861 |
| | (147,717 | ) |
| Income tax (benefit) provision | (2,432 | ) | | (2,585 | ) | | 989 |
| | (1,459 | ) | | 13 |
|
| Income (loss) from continuing operations | 72,856 |
| | (22,611 | ) | | (180,835 | ) | | 50,320 |
| | (147,730 | ) |
| Discontinued operations, net of tax | 276 |
| | 17,262 |
| | 9,577 |
| | 37,200 |
| | 2,096 |
|
| Net income (loss) | $ | 73,132 |
| | $ | (5,349 | ) | | $ | (171,258 | ) | | $ | 87,520 |
| | $ | (145,634 | ) |
| Income (loss) from continuing operations per common unit - diluted | $ | 0.61 |
| | $ | (0.26 | ) | | $ | (2.38 | ) | | $ | 0.67 |
| | $ | (2.16 | ) |
| | | | | | | | | | |
| Balance Sheet Data (at period end): | | | | | | | | | |
| Property, plant and equipment, net | $ | 1,763,674 |
| | $ | 1,137,239 |
| | $ | 1,124,695 |
| | $ | 1,197,945 |
| | $ | 1,070,120 |
|
| Total assets | 2,045,688 |
| | 1,349,397 |
| | 1,534,818 |
| | 1,773,061 |
| | 1,609,927 |
|
| Long-term debt | 779,453 |
| | 530,000 |
| | 754,383 |
| | 799,383 |
| | 567,069 |
|
| Net equity | 1,007,347 |
| | 579,113 |
| | 530,398 |
| | 727,715 |
| | 726,768 |
|
| | | | | | | | | | |
| Cash Flow Data: | | | | | | | | | |
| Net cash flows provided by (used in): | | | | | | | | | |
| Operating activities | $ | 117,800 |
| | $ | 94,128 |
| | $ | 77,228 |
| | $ | 138,785 |
| | $ | 91,832 |
|
| Investing activities | (373,936 | ) | | 73,545 |
| | (37,284 | ) | | (330,667 | ) | | (475,790 | ) |
| Financing activities | 251,970 |
| | (175,446 | ) | | (73,260 | ) | | 102,816 |
| | 426,816 |
|
| Discontinued operations | 994 |
| | 9,090 |
| | 18,132 |
| | 38,430 |
| | 15,113 |
|
| Other Financial Data: | | | | | | | | | |
| Cash distributions per common unit (declared) | $ | 0.75 |
| | $ | 0.23 |
| | $ | 0.10 |
| | $ | 1.63 |
| | $ | 1.485 |
|
| Adjusted EBITDA(a) | $ | 208,208 |
| | $ | 126,026 |
| | $ | 172,587 |
| | $ | 206,418 |
| | $ | 118,042 |
|
________________________
| |
| (a) | See Part II Item 6. Selected Financial Data – Non-GAAP Financial Measures for reconciliation of “Adjusted EBITDA” to net cash flows from operating activities and net income (loss). |
Non-GAAP Financial Measures
We include in this report Adjusted EBITDA, which does not comply with accounting principles generally accepted in the United States ("GAAP"). We provide reconciliations of this non-GAAP financial measure to its most directly comparable financial measures as calculated and presented in accordance with GAAP.
We define Adjusted EBITDA as net income (loss) plus or (minus) income tax provision (benefit); interest-net, including realized interest rate risk management instruments and other expense; depreciation, depletion and amortization expense; impairment expense; other operating expense, non-recurring; other non-cash operating and general and administrative expenses, including non-cash compensation related to our equity-based compensation program; unrealized (gains) losses on commodity and interest rate risk management related instruments; gains (losses) on discontinued operations and other (income) expense. We use Adjusted EBITDA as a measure of our core profitability to assess the financial performance of our assets. Adjusted EBITDA is also used as a supplemental financial measure by external users of our financial statements such as investors, commercial banks and research analysts. For example, the compliance covenant used by our lenders under our revolving credit facility which is designed to measure our viability and our ability to perform under the terms of our revolving credit facility uses Adjusted EBITDA. We believe that investors benefit from having access to the same financial measures that our management team uses in evaluating performance. Adjusted EBITDA is useful in determining our ability to sustain or increase distributions. By excluding unrealized derivative gains (losses), a non-cash, mark-to-market benefit (charge) which represents the change in fair market value of our executed derivative instruments and is independent of our assets’ performance or cash flow generating ability, we believe Adjusted EBITDA reflects more accurately our ability to generate cash sufficient to pay interest costs, support our level of indebtedness, make cash distributions to our unitholders and general partner and finance our maintenance capital expenditures. We further believe that Adjusted EBITDA also describes more accurately the underlying performance of our operating assets by isolating the performance of our operating assets from the impact of an unrealized, non-cash measure designed to describe the fluctuating inherent value of a financial asset. Similarly, by excluding the impact of non-recurring discontinued operations, Adjusted EBITDA provides users of our financial statements a more accurate picture of our current assets’ cash generation ability, independently from that of assets which are no longer a part of our operations. Our Adjusted EBITDA definition may not be comparable to Adjusted EBITDA or similarly titled measures of other entities, as other entities may not calculate Adjusted EBITDA in the same manner as us. For example, we include in Adjusted EBITDA the actual settlement revenue created from our commodity hedges by virtue of transactions occasionally undertaken by us to reset commodity hedges to higher prices or purchase puts or other similar floors, despite the fact that we exclude from Adjusted EBITDA any charge for amortization of the cost of such commodity hedge reset transactions or puts.
Adjusted EBITDA does not include interest expense, income taxes or depreciation and amortization expense. Because we have borrowed money to finance our operations, interest expense is a necessary element of our costs and our ability to generate net income. Because we use capital assets, depreciation and amortization are also necessary elements of our costs. Therefore, any measures that exclude these elements have material limitations. To compensate for these limitations, we believe that it is important to consider both net income (loss) and net cash flows provided by operating activities determined under GAAP, as well as Adjusted EBITDA, to evaluate our performance and liquidity.
Adjusted EBITDA should not be considered an alternative to net income, operating income, cash flows provided by operating activities or any other measure of financial performance presented in accordance with U.S. GAAP.
The following table provides a reconciliation of Adjusted EBITDA to net cash flows provided by operating activities and net income (loss):
|
| | | | | | | | | | | | | | | | | | | |
| | Year Ended December 31, 2011 | | Year Ended December 31, 2010 | | Year Ended December 31, 2009 | | Year Ended December 31, 2008 | | Year Ended December 31, 2007 |
| Reconciliation of “Adjusted EBITDA” to net cash flows provided by operating activities and net income (loss): | | | | | | | | | |
| Net cash flows provided by operating activities | $ | 117,800 |
| | $ | 94,128 |
| | $ | 77,228 |
| | $ | 138,785 |
| | $ | 91,832 |
|
| Add (deduct): | | | | | | | | | |
| Discontinued operations, net of tax | 276 |
| | 17,262 |
| | 9,577 |
| | 37,200 |
| | 2,096 |
|
| Depreciation, depletion, amortization and impairment | (147,899 | ) | | (113,064 | ) | | (130,318 | ) | | (281,466 | ) | | (72,531 | ) |
| Amortization of debt issuance cost | (2,415 | ) | | (1,305 | ) | | (1,068 | ) | | (958 | ) | | (1,777 | ) |
| Risk management portfolio value changes | 84,753 |
| | 9,195 |
| | (147,751 | ) | | 199,339 |
| | (136,132 | ) |
| Reclassing financing derivative settlements | 6,267 |
| | 1,131 |
| | 8,939 |
| | (11,063 | ) | | (1,667 | ) |
| Other | (1,489 | ) | | (5,319 | ) | | (2,878 | ) | | (4,811 | ) | | (8,541 | ) |
| Accounts receivable and other current assets | 13,394 |
| | (10,500 | ) | | (18,810 | ) | | (45,688 | ) | | 13,215 |
|
| Accounts payable, due to affiliates and accrued liabilities | 189 |
| | 3,418 |
| | 34,903 |
| | 57,041 |
| | (31,464 | ) |
| Other assets and liabilities | 2,256 |
| | (295 | ) | | (1,080 | ) | | (859 | ) | | (665 | ) |
| Net income (loss) | 73,132 |
| | (5,349 | ) | | (171,258 | ) | | 87,520 |
| | (145,634 | ) |
| Add: | | | | | | | | | |
| Interest expense, net | 46,802 |
| | 35,058 |
| | 41,350 |
| | 38,282 |
| | 44,587 |
|
| Depreciation, depletion, amortization and impairment | 147,899 |
| | 113,064 |
| | 130,318 |
| | 281,466 |
| | 72,531 |
|
| Income tax (benefit) provision | (2,432 | ) | | (2,585 | ) | | 989 |
| | (1,459 | ) | | 13 |
|
| EBITDA | 265,401 |
| | 140,188 |
| | 1,399 |
| | 405,809 |
| | (28,503 | ) |
| Add: | | | | | | | | | |
| Risk management portfolio value changes | (58,471 | ) | | (1,060 | ) | | 177,061 |
| | (180,107 | ) | | 144,176 |
|
| Unrealized gains/loss from derivative activity | (772 | ) | | — |
| | — |
| | — |
| | — |
|
| Restricted unit compensation expense | 5,145 |
| | 5,407 |
| | 6,685 |
| | 7,694 |
| | 2,395 |
|
| Non-cash mark-to-market Upstream imbalances | 74 |
| | (746 | ) | | 1,505 |
| | 841 |
| | — |
|
| Discontinued operations, net of tax | (276 | ) | | (17,262 | ) | | (9,577 | ) | | (37,200 | ) | | (2,096 | ) |
| Other income | — |
| | (501 | ) | | (934 | ) | | (1,318 | ) | | 18 |
|
| Other operating (income) expense (a) | (2,893 | ) | | — |
| | (3,552 | ) | | 10,699 |
| | 2,052 |
|
| ADJUSTED EBITDA(b) | $ | 208,208 |
| | $ | 126,026 |
| | $ | 172,587 |
| | $ | 206,418 |
| | $ | 118,042 |
|
________________________
| |
| (a) | Includes $2.9 million related to the release of reserves due to the expiration of repurchase obligations for certain receivables which were sold in previous periods during the year ended December 31, 2011, $3.6 million due to the recovery of $2.2 million of assets previously written off and the release of $1.4 million of liabilities assumed as part of our purchase price allocation for our acquisitions of Escambia Asset Co. LLC and Redman Energy Holdings, L.P. during the year ended December 31, 2009; $10.7 million related to bad debt expense taken against our outstanding accounts receivable from SemGroup during the year ended December 31, 2008; and a settlement of arbitration for $1.4 million, severance to a former executive for $0.3 million and $1.1 million for liquidated damage related to the late registration of our common units during the year ended December 31, 2007. |
| |
| (b) | Adjusted EBITDA excludes amortization of commodity hedge costs (including costs of hedge reset transactions) for the years ended December 31, 2010, 2009, 2008 and 2007 of $4.0 million, $48.4 million, $13.3 million and $8.2 million, respectively. Including these amortization costs, our Adjusted EBITDA for the years ended December 31, 2010, 2009, 2008 and 2007, would have been $122.1 million, $124.2 million, $193.1 million and $109.8 million, respectively. |
The following table summarizes our quarterly financial data for 2011:
|
| | | | | | | | | | | | | | | |
| | For the Quarters Ended |
| | December 31,
2011 | | September 30,
2011 | | June 30,
2011 | | March 31,
2011 |
| | ($ in thousands, except earnings per unit) |
| Sales of natural gas, NGLs, oil and condensate | $ | 245,461 |
| | $ | 264,119 |
| | $ | 265,317 |
| | $ | 203,055 |
|
| Gathering and treating services | 10,654 |
| | 11,567 |
| | 12,304 |
| | 13,245 |
|
| Unrealized commodity derivative (losses) gains | (33,288 | ) | | 97,011 |
| | 43,151 |
| | (53,998 | ) |
| Realized commodity derivative (losses) gains | (2,408 | ) | | (2,698 | ) | | (8,813 | ) | | (6,447 | ) |
| Other revenues | 270 |
| | 141 |
| | (244 | ) | | 1,509 |
|
| Total revenues | 220,689 |
| | 370,140 |
| | 311,715 |
| | 157,364 |
|
| Cost of natural gas, NGLs, oil and condensate | 146,898 |
| | 166,293 |
| | 172,674 |
| | 147,319 |
|
| Operating and maintenance expense | 32,812 |
| | 29,453 |
| | 24,247 |
| | 22,791 |
|
| General and administrative expense | 14,145 |
| | 16,068 |
| | 15,902 |
| | 11,776 |
|
| Depreciation, depletion, amortization and impairment expense | 42,831 |
| | 44,910 |
| | 36,136 |
| | 24,022 |
|
| Interest—net including realized risk management instrument | (13,665 | ) | | (13,763 | ) | | (10,742 | ) | | (8,448 | ) |
| Unrealized interest rate derivative gains (losses) | 3,404 |
| | (3,165 | ) | | 2,791 |
| | 2,565 |
|
| Income tax benefit | (622 | ) | | (1,077 | ) | | (691 | ) | | (42 | ) |
| Other expense, net | (17 | ) | | (3 | ) | | (114 | ) | | (50 | ) |
| Discontinued operations, net of tax | 66 |
| | (197 | ) | | (311 | ) | | 718 |
|
| Net (loss) income | $ | (25,587 | ) | | $ | 97,365 |
| | $ | 55,071 |
| | $ | (53,717 | ) |
| Earnings (loss) per common unit - Diluted | $ | (0.21 | ) | | $ | 0.76 |
| | $ | 0.47 |
| | $ | (0.65 | ) |
During our fiscal year ended December 31, 2011, we recorded the following unusual or infrequently occurring items:
| |
| • | On May 3, 2011, we completed the acquisition of all the outstanding membership interests of Crow Creek Energy for an aggregate purchase price of $563.7 million. We commenced recording results of operations relating to this acquisition during our second quarter ended June 30, 2011. |
| |
| • | On May 20, 2011, we sold the Wildhorse Gathering System in our East Texas and Other Midstream Segment. Operations related to these assets for 2011 have been recorded as part of discontinued operations. |
| |
| • | During our quarter ended March 31, 2011, we incurred impairment charges of $0.3 million in our Upstream Segment. During our quarter ended June 30, 2011, we incurred impairment charges of $4.6 million related to our Upstream Segment and Texas Panhandle Segment. During our third quarter ended September 30, 2011, we incurred impairment charges of $9.9 million in our Upstream Segment. During our fourth quarter ended December 31, 2011, we incurred impairment charges of $1.5 million in our Upstream Segment. See Part II, Item 7. Management's Discussion and Analysis of Financial Condition and Results of Operations - Overview - Impairment for further discussion of our impairment charges during the year ended December 31, 2011. |
| |
| • | We experienced significant fluctuations in our unrealized commodity derivative gains and losses from quarter to quarter as a result of the volatility that was experience by commodity prices during 2011. For example, we recorded unrealized gains of $43.2 million and $97.0 million during our quarters ended June 30, 2011 and September 30, 2011, respectively, while we recorded unrealized losses of $54.0 million and $33.3 million during our quarters ended March 31, 2011 and December 31, 2011, respectively. See Part II, Item 7. Management’s Discussion and Analysis of Financial Condition and Results of Operations – Overview – General Trends and Outlook – Natural Gas Supply and Demand and Crude Oil Supply, Demand and Outlook for further discussion regarding the volatility of commodity prices. |
The following table summarizes our quarterly financial data for 2010:
|
| | | | | | | | | | | | | | | |
| | For the Quarters Ended |
| | December 31,
2010 | | September 30,
2010 | | June 30,
2010 | | March 31,
2010 |
| | ($ in thousands, except earnings per unit) |
| Sales of natural gas, NGLs, oil and condensate | $ | 171,776 |
| | $ | 159,303 |
| | $ | 164,972 |
| | $ | 192,001 |
|
| Gathering and treating services | 9,802 |
| | 12,093 |
| | 16,230 |
| | 12,483 |
|
| Unrealized commodity derivative gains (losses) | (29,615 | ) | | (17,044 | ) | | 41,405 |
| | 13,478 |
|
| Realized commodity derivative (losses) gains | (6,979 | ) | | (1,535 | ) | | (5,813 | ) | | (2,683 | ) |
| Other revenues | 2,550 |
| | 100 |
| | (251 | ) | | 36 |
|
| Total revenues | 147,534 |
| | 152,917 |
| | 216,543 |
| | 215,315 |
|
| Cost of natural gas, NGLs, oil and condensate | 115,077 |
| | 106,682 |
| | 108,643 |
| | 137,902 |
|
| Operating and maintenance expense | 22,181 |
| | 21,323 |
| | 22,732 |
| | 22,405 |
|
| General and administrative expense | 9,284 |
| | 10,674 |
| | 12,806 |
| | 13,011 |
|
| Depreciation, depletion, amortization and impairment expense | 25,697 |
| | 29,324 |
| | 30,599 |
| | 27,444 |
|
| Interest—net including realized risk management instrument | (8,123 | ) | | (8,419 | ) | | (9,163 | ) | | (9,302 | ) |
| Unrealized interest rate derivative (losses) gains | 5,124 |
| | (3,112 | ) | | (4,354 | ) | | (4,822 | ) |
| Income tax provision (benefit) | (1,615 | ) | | (1,244 | ) | | (425 | ) | | 699 |
|
| Other income (expense) | 402 |
| | (30 | ) | | (21 | ) | | 99 |
|
| Discontinued operations, net of tax | (26,549 | ) | | 166 |
| | 39,493 |
| | 4,152 |
|
| Net income (loss) | $ | (52,236 | ) | | $ | (25,237 | ) | | $ | 68,143 |
| | $ | 3,981 |
|
| Earnings (loss) per unit—diluted | | | | | | | |
| Common units | $ | (0.62 | ) | | $ | (0.31 | ) | | $ | 0.41 |
| | $ | 0.01 |
|
| Subordinated units |
|
| |
|
| | $ | 0.38 |
| | $ | (0.02 | ) |
| General partner |
|
| | $ | (0.34 | ) | | $ | 0.41 |
| | $ | 0.01 |
|
During our fiscal year ended December 31, 2010, we recorded the following unusual or infrequently occurring items:
| |
| • | During our quarter ended June 30, 2010, we completed the sale of our Minerals Business for approximately $171.6 million, which resulted in a pre-tax gain in the disposition of approximately $37.7 million. We used these proceeds to pay down amounts outstanding under our senior secured credit facility. Operations related to these assets for 2010 have been recorded as part of discontinued operations. |
| |
| • | On September 30, 2010, we acquired certain additional interest in the Big Escambia Creek Field (and the nearby Flomaton and Fanny Church fields) from Indigo Minerals, LLC for $3.9 million. During our fourth quarter ended December 31, 2010, we completed the acquisition of certain natural gas gathering systems and related facilities from Centerpoint Energy Field Services, Inc. for $27.0 million. We commenced recording results of operations relating to these acquisitions during our fourth quarter ended December 31, 2010. |
| |
| • | During our fourth quarter ended December 31, 2010, we incurred impairment charges of $26.2 million, recorded as part of discontinued operations in our East Texas and Other Midstream Segment, and $0.1 million in our Upstream Segment. During our quarter ended September 30, 2010, we incurred impairment charges of $3.4 million related to our Upstream Segment. During our quarter ended June 30, 2010, we incurred impairment charges of $3.1 million related to our East Texas and Other Midstream Segment. See Part II, Item 7. Management's Discussion and Analysis of Financial Condition and Results of Operations - Overview - Impairment for further discussion of our impairment charges during the year ended December 31, 2010. |
| |
| • | We experienced significant fluctuations in our unrealized commodity derivative gains and losses from quarter to quarter as a result of the volatility that was experience by commodity prices during 2010. For example, we recorded unrealized gains of $13.5 million and $41.4 million during our quarters ended March 31, 2010 and June 30, 2010, respectively, while we recorded unrealized losses of $17.0 million and $29.6 million during our quarters ended September 30, 2010 and December 31, 2010, respectively. See Part II, Item 7. Management’s Discussion and Analysis of Financial Condition and Results of Operations – Overview – General Trends and Outlook – Natural Gas Supply and Demand and Crude Oil Supply, Demand and Outlook for further discussion regarding the volatility of commodity prices. |
Item 7. Management's Discussion and Analysis of Financial Condition and Results of Operations.
The following discussion analyzes our financial condition and results of operations and should be read in conjunction with our historical consolidated financial statements and notes included elsewhere in this Annual Report.
OVERVIEW
We are a domestically-focused, growth-oriented, publicly-traded Delaware limited partnership engaged in the following two businesses:
| |
| • | Midstream Business—gathering, compressing, treating, processing, transporting, marketing and trading natural gas; fractionating, transporting and marketing natural gas liquids ("NGLs"); and crude oil logistics and marketing; and |
| |
| • | Upstream Business—developing and producing oil and natural gas property interests. |
During the fourth quarter of 2011, our chief executive officer (who is our chief operating decision-maker) decided that due to the relative size of the East Texas/Louisiana, South Texas and Gulf of Mexico segments, these three reporting segments would be collapsed into a single reporting segment and that a new Marketing and Trading reporting segment would be created. The Midstream Business's financial results are now reported in the following segments: (i) Texas Panhandle, which no longer includes the results of our Marketing and Trading operations, (ii) East Texas and Other Midstream, which consolidates our former East Texas/Louisiana, South Texas and Gulf of Mexico segments, and (iii) Marketing and Trading, which is a new reporting segment. Operating results for the reportable segments have been recast for the years ending December 31, 2010 and 2009 to reflect these changes. Our Upstream Segment and functional (Corporate) Segment remained unchanged from what has been previously reported.
We conduct, evaluate and report on our Midstream Business within three distinct segments—the Texas Panhandle Segment, the East Texas and Other Midstream Segment, and the Marketing and Trading Segment. Our Texas Panhandle Segment consists of gathering and processing assets in the Texas Panhandle. Our East Texas and Other Midstream Segment consists of gathering and processing assets in East Texas/Northern Louisiana, South Texas, Southern Louisiana, the Gulf of Mexico and Galveston Bay. Our Marketing and Trading Segment consists of crude oil logistics and marketing in Texas and Alabama, and natural gas marketing and trading. During the year ended December 31, 2011, our Midstream Business generated operating income from continuing operations of $57.5 million compared to operating income from continuing operations of $45.1 million generated during the year ended December 31, 2010.
We conduct, evaluate and report on our Upstream Business as one segment. On May 3, 2011, we completed our acquisition of CC Energy II L.L.C. ("Crow Creek Energy"), as discussed below. Our Upstream Segment includes operated and non-operated wells located in the Mid-Continent (which includes areas in Oklahoma, Arkansas, the Texas Panhandle and North Texas); Permian (which includes areas in West Texas); East/South Texas / Mississippi; and Southern Alabama (which also includes two treating facilities, and one natural gas processing plant and related gathering systems. During the year ended December 31, 2011, our Upstream Business generated operating income of $79.3 million compared to operating income of $28.0 million generated during the year ended December 31, 2010.
The final segment that we report on is our Corporate and Other Segment, which is where we account for our risk management activity (excluding any risk management activity associated with our natural gas marketing and trading activities), intersegment eliminations and our general and administrative expenses. During the year ended December 31, 2011, our Corporate Segment generated an operating loss, excluding intersegment eliminations, of $23.9 million compared to an operating loss of $56.1 million generated during the year ended December 31, 2010. Results reflected net gains, realized and unrealized, on our commodity derivatives of $32.5 million during the year ended December 31, 2011 compared to a net loss, realized and unrealized, on our commodity derivatives of $8.8 million during the year ended December 31, 2010. See "Summary of Consolidated Operating Results - Corporate and Other Segment" for a further discussion of the impact of our commodity derivatives.
Acquisition
On May 3, 2011, we completed the acquisition (the "Crow Creek Acquisition") of all of the outstanding membership interests of Crow Creek Energy, a portfolio company of Natural Gas Partners, VIII, L.P. ("NGP VIII"), for total consideration of $563.7 million consisting of 28.8 million common units valued at $336.1 million at the closing of the acquisition, debt assumed of $212.6 million and cash of approximately $15.0 million. The cash portion of the acquisition consideration and the repayment of Crow Creek Energy’s outstanding debt was funded through borrowings under our revolving credit facility. In
addition, we incurred $2.3 million of acquisition-related expenses, which are included within general and administrative expenses for the year ended December 31, 2011. The oil and natural gas properties acquired from Crow Creek Energy are located in multiple basins across Oklahoma, north Texas and Arkansas (the "Mid-Continent Properties") and provide us with an extensive inventory of low-risk development prospects.
Impairment
We incurred impairment charges during the year ended December 31, 2011 of $16.3 million. Of this amount, $4.6 million related to the write-down of our idle Turkey Creek plant in our Texas Panhandle Segment. We determined that the assets that made up our Turkey Creek plant could not be used elsewhere within our business, and thus we decided to remove all above ground equipment and structures. We also incurred impairment charges during the year ended December 31, 2011 of $11.7 million in our Upstream Business related to certain legacy proved undeveloped and unproved properties which we no longer intend to develop based on the current commodity price environment and the performance of offsetting wells. During the year ended December 31, 2010, we recorded $3.5 million in impairment charges within our Upstream Segment related to certain wells in our unproved properties as we determined it would not be economical to develop these unproved locations and $3.1 million in impairment charges within our East Texas and Other Midstream Segment due to the loss of a significant gathering contract.
Pursuant to GAAP, our impairment analysis does not take into account the value of our commodity derivative instruments, which generally increase as the estimates of future prices decline. Further declines in commodity prices and other factors could result in additional impairment charges and changes to the fair value of our derivative instruments.
Other Matters
Potential Impact of New Environmental Standards - We have certain obligations under our air emissions permit to lower the SO2 emissions of our Alabama plant operations. Additionally, in mid-2010, the Environmental Protection Agency (“EPA”) enacted new National Ambient Air Quality Standards (“2010 NAAQS”) which substantially lowered the emissions limits for SO2 and mandated timelines for compliance. In order to fulfill its permit obligations, comply with the new 2010 NAAQS requirements, and replace and upgrade certain assets in our Alabama facilities, we expect to spend approximately $50 million over the next several years at the locations of our Alabama operations. The expected facility upgrades to our Alabama operations should not only increase the marketable sulfur recovered from the inlet gas stream, but also are anticipated to reduce plant fuel consumption, improve the plant's operating reliability and extend the plant's operating life. Management does not anticipate, however, that the required spending will generate returns consistent with our internal rate of return thresholds for discretionary capital investment. At this time, management has identified no other operational areas impacted by the 2010 NAAQS.
Management expects that a substantial percentage of the total capital invested to achieve the SO2 emissions standard at our Alabama operations will be classified as maintenance capital, and therefore will reduce the amount of distributable cash flow we recognize in the periods in which the capital is spent.
Upstream Borrowing Base Redetermination
On October 4, 2011, we announced that the Upstream Segment component of the borrowing base under our revolving credit facility was set at $375 million by our commercial lenders as part of our regularly scheduled semi-annual borrowing base redetermination. This represented an increase of $22 million from the previous level of $353 million. The redetermined borrowing base was effective October 1, 2011. The midstream component of our borrowing base is redetermined quarterly based on our Midstream EBITDA (as defined in the revolving credit facility) for the trailing twelve months.
How We Evaluate Our Operations
Our management uses a variety of financial and operational measures to analyze our performance. We view these measures as important indicators of our profitability and review these measures on a monthly basis for consistency and trend analysis. These measures include volumes, margin, operating expenses and Adjusted EBITDA (defined on page 6178) on a company-wide basis.
Volumes (by Business)
Midstream Volumes. In our Midstream Business, due to the natural production decline of the wells connected to our systems we must continually obtain new supplies of natural gas to maintain or increase throughput volumes on our gathering
and processing systems. Our ability to maintain existing supplies of natural gas and obtain new supplies is impacted by (1) successful drilling activity and the level of workovers or recompletions of existing connected wells in areas currently dedicated to our pipelines, (2) our ability to compete for volumes from successful new wells in other areas and (3) our ability to obtain natural gas that has been released from other commitments. We routinely monitor producer activity in the areas served by our gathering and processing systems to pursue new supply opportunities.
We rely on producer drilling activity to maintain and grow our midstream volumes. Generally, producer drilling activity is correlated to the current and expected price of natural gas, and to NGLs in producing basins that have liquids-rich gas reservoirs. As such, throughput volume in our existing midstream assets will typically increase in times of rising natural gas and NGL prices and will typically decrease in times of falling natural gas and NGL prices. In producing basins that have liquids-rich gas reservoirs, the rise and fall of throughput volumes tends to correlate more predominately with the rise and fall of NGL prices, in particular when natural gas prices approach or achieve historical lows.
Upstream Volumes. In the Upstream Segment, we continually monitor the production rates of the wells we operate. This information is a critical indicator of the performance of our wells, and we evaluate and respond to any significant adverse changes. We employ an experienced team of engineering and operations professionals to monitor these rates on a well-by-well basis and to design and implement remediation activities when necessary. We also design and implement workover and drilling operations to increase production in order to offset the natural decline of our currently producing wells. Because our rates of return on new workover and drilling activity are determined in part on commodity prices, we may elect to scale back or cancel such activity during periods of low commodity prices. Furthermore, we may elect to shut-in existing production in extreme commodity downturns (i.e., when the realized prices we receive are below our operating costs on a per unit basis).
Margin
Commodity Pricing. The margins in our Midstream Business generally are positively correlated to NGL and condensate prices, and may be adversely impacted to the extent the price of NGLs decline in relation to the price of natural gas. We refer to the price of NGLs in relation to the price of natural gas as the "fractionation spread." In our Upstream Segment, our margins generally will correlate with changes in crude oil, natural gas, NGL and sulfur prices.
Risk Management. We conduct risk management activities to mitigate the effect of commodity price and interest rate fluctuations on our cash flows. Our primary method of risk management in this respect is entering into derivative contracts. The impact of our risk management activities are captured in our Corporate Segment. For a further discussion of our risk management activities, see Part II, Item 7A. Quantitative and Qualitative Disclosures About Market Risk.
Operating Expenses
Midstream Operating Expenses. We monitor midstream operating expenses as a measure of the operating efficiency of our field operations. Direct labor, repair and maintenance, utilities and contract services comprise the most significant portion of our operating expenses. These expenses are largely independent of the volumes through our systems, but fluctuate depending on the activities performed during a specific period.
Upstream Operating Expenses. We monitor and evaluate our Upstream Segment operating costs routinely, both on a total cost and unit cost basis. Many of the operating costs we incur are not directly related to the quantity of hydrocarbons that we produce, so we strive to maximize our production rates in order to improve our unit operating costs. The most significant portion of our Upstream Segment operating costs is associated with the operation of the Big Escambia Creek treating and processing facilities. These facilities are overseen by members of our midstream engineering and operations staff. The majority of the cost of operating these facilities is independent of their throughput. This includes items such as labor, chemicals, utilities and materials.
Adjusted EBITDA
See discussion of Adjusted EBITDA in Part II, Item 6. Selected Financial Data.
General Trends and Outlook
We expect our business to be affected by the following key trends. This expectation is based on assumptions made by us and information currently available to us; however, our actual results may vary materially from our expectations.
Natural Gas Supply and Demand
Natural gas prices are more dependent than crude oil prices on regional supply and demand due to the relative difficulty in transporting natural gas from producing to consuming regions of the world. In the United States, where we produce natural gas, the outlook for natural gas demand has improved since the depths of the recession, but we do not expect significant increases in the demand for natural gas during 2012. Over the longer term, however, we believe that the environmental advantages that natural gas has over coal, and its current low price, will result in the construction of additional natural gas-fired electricity generation capacity, both for new capacity and to replace aging coal-fired facilities.
During 2010 and 2011, natural gas prices continued to fall and remained relatively low compared to the prices experienced prior to the recession. Our expectation was that these lower prices would lead to reduced gas well drilling and lower natural gas production, and, combined with the resumption of growth in the United States economy, would provide support to natural gas prices. This did not occur in 2011, however. Operators continued to drill gas wells in emerging shale gas plays such as the Haynesville and Marcellus plays although at lower rates of drilling than in previous years. In addition, producers continued to increase their drilling in liquids-rich gas plays such as the Granite Wash and the Eagle Ford in order to extract the more valuable NGLs from the raw gas stream. These continued drilling activities have resulted in a significant oversupply of natural gas that has reduced prices to their lowest levels in 10 years. Because of the high prices received for the oil, condensate and natural gas liquids, we expect that drilling in these "liquids rich" plays will remain robust and they will continue to provide a source of future natural gas supply for the next several years, resulting in depressed natural gas prices at least through 2013.
Crude Oil Supply, Demand and Outlook
The majority of the world's crude oil production and reserves is controlled by foreign governments and state-owned oil companies. Many of these countries rely on crude oil exports to fund their governmental expenditures, and in some of these the export of crude oil represents the bulk of their economic output. Certain exporting countries have seen declines in their production rates due to low levels of capital re-investment in their oil industry. We believe that, while some oil exporting countries will be able to increase their production to meet future increases in demand, that others will have a difficult time maintaining their production levels and that this may result in an undersupplied market for crude oil within a few years.
There are several factors which influence the demand for crude oil, but ultimately the continued growth of the developing economies will result in much greater demand for crude oil. It is uncertain how quickly demand will exceed supply, but we believe that crude oil prices may remain high relative to historical averages or further strengthen over the next one to two years.
Historically, natural gas liquids prices have tended to have a high correlation to crude oil prices, especially for propane and heavier NGLs, but we believe this correlation may weaken in late 2012 and through 2013. The high levels of liquids-directed drilling in the United States has resulted in significant increases in the supply of NGL's and there are capacity constraints at various points in the NGL manufacturing infrastructure. Since the butane and heavier components of the NGL stream are more readily substituted for crude oil, we expect the correlation between the prices of those components and crude oil to remain fairly high, but we expect price weakness (relative to crude oil) in propane. The majority of the NGLs we produce are delivered into the Conway, Kansas hub. We also expect that basis differentials between the primary U.S. NGL hub at Mont Belvieu and other pricing points such as Conway will remain at their current high levels due to transportation and fractionation constraints until mid to late 2013.
Ethane prices historically have been less correlated to crude oil than have the heavier NGLs. Ethane demand is primarily driven by global petrochemical production and specifically by its use as a feedstock for ethylene production. Ethane's low price relative to heavier ethylene feedstocks has resulted in strong worldwide demand, and chemical manufacturers have recently announced projects to increase their ethylene production capacity using ethane. We believe this trend will provide support to ethane prices throughout 2012; however, the increase in liquids-directed drilling activity has and is expected to continue to substantially increase the supply of ethane, which could result in downward pressure on ethane prices over the medium-term. As with the other NGLs, we expect that basis differentials between Mont Belvieu and other pricing points will remain elevated by historical standards through 2013, at which time additional NGL infrastructure is expected to become operational, leading to a reduction of the basis differentials between Mont Belvieu and other pricing points around the country.
Sulfur Supply, Demand and Outlook
Much of the natural gas that we produce in the East Texas and Alabama regions within our Upstream Segment contains high, naturally-occurring concentrations of hydrogen sulfide. This is a corrosive, poisonous gas that must be removed from the natural gas stream before it can be processed for NGL extraction or sale. The process of removing the hydrogen sulfide yields a large amount of elemental sulfur, which we sell or otherwise dispose of. The process of removing hydrogen sulfide from natural gas, and similar processes for the removal of hydrogen sulfide from sour crude oils (prior to refining), is the primary source of sulfur production in the United States and the world.
The primary use of sulfur is the production of sulfuric acid, and one of the major uses of sulfuric acid is the production of phosphoric acid. Phosphoric acid is a key raw material in the manufacture of phosphate fertilizers. Therefore, one of the major factors influencing the demand for sulfur is the demand for fertilizer. The region around Tampa, Florida contains a large amount of fertilizer manufacturing facilities, and Tampa also serves as an export port for sulfur. For many years, the supply of sulfur was greater than the available demand, such that Tampa prices fluctuated within a narrow band of $20 to $40 per long ton. Depending on a seller's proximity to Tampa, transportation charges may have equaled or exceeded the selling price of the sulfur under this pricing environment.
Beginning in the second half of 2007, global demand for fertilizer increased significantly, and as a result, Tampa prices also rose to record levels. In late 2008, sulfur prices at Tampa peaked at over $600 per long ton. The global economic recession greatly reduced fertilizer demand; however, much of this demand has returned. As with many commodities, the developing economies are responsible for much of this demand growth. By the end of 2008, Tampa sulfur prices had fallen to $0 (zero dollars) per long ton, and they remained low throughout 2009. By the end of 2011, prices had risen to $172 per long ton. We expect demand to remain relatively strong in 2012, but not as great as that in 2007. Nevertheless, over the next few years, continued rapid growth in emerging economies could result in supply/demand imbalances that could lead to the types of price spikes we experienced in 2007.
Impact of Regulation of Greenhouse Gas Emissions
The operations of and use of the products produced by the natural gas and oil industry are sources of emissions of certain greenhouse gases ("GHG"), namely carbon dioxide and methane. Regulation of GHG emissions has not had an impact on our operations in the past, and the regulation of our GHG emissions as such has not occurred. However, there is a trend towards government-imposed limitation of GHG emissions at the state, regional, and federal level.
The United States Environmental Protection Agency ("EPA"), by virtue of a 2007 Supreme Court decision, was deemed to have authority to regulate carbon dioxide and other GHG emissions under the Clean Air Act, and they are drafting and preparing to implement regulations. It is possible that legislation will be proposed to amend the Clean Air Act to exclude GHG, although the probability of the enactment of such legislation is uncertain.
In addition, in 2009 there was a significant effort in the United States Congress to enact legislation to establish a cap-and-trade system as a means to regulate GHG emissions. A cap-and-trade bill was approved by the House of Representatives, but was not approved in the Senate. Given the House of Representatives is now under control of the Republican Party which has historically opposed to GHG regulation, the probability of enactment of a cap-and-trade bill during the next two years is low. Because of the uncertainty of the nature of any potential future federal GHG regulations at this time, we are unable to forecast how future regulation of GHG emissions would negatively impact our operations. We will continue to monitor regulatory developments and to assess our ability to reasonably predict the economic impact of these developments on our business.
The commercial risk associated with the exploration and production of fossil fuels lies in the uncertainty of regulations that may affect our customers, which could affect the demand for crude oil and natural gas. Such an impact on demand could have an adverse impact on the demand for our services, and could have an impact on our financial condition, results of operations and cash flows.
On the other hand, when burned, natural gas produces less greenhouse gas emissions than other fossil fuels, such as refined petroleum products or coal. As a result, climate change legislation or GHG emissions regulations could create an increased demand for natural gas.
Critical Accounting Policies and Estimates
Conformity with GAAP requires management to make estimates and judgments that affect the amounts reported in the financial statements and notes. On an ongoing basis, we make and evaluate estimates and judgments based on management's best available knowledge of previous, current, and expected future events. We base our estimates on historical experience and various other assumptions that we believe to be reasonable under the circumstances. Actual results may differ from these estimates, and estimates are subject to change due to modifications in the underlying conditions or assumptions. Currently, we do not foresee any reasonably likely changes to our current estimates and assumptions which would materially affect amounts reported in the financial statements and notes. Below are expanded discussions of our more significant accounting policies, estimates and judgments, i.e., those that reflect more significant estimates and assumptions used in the preparation of our financial statements. See Note 2 to our consolidated financial statements included in Part II, Item 8. Financial Statements and Supplementary Data starting on page F-1 of this Annual Report for details about additional accounting policies and estimates made by management.
Successful Efforts. We utilize the successful efforts method of accounting for our oil and natural gas properties. Leasehold costs are capitalized when incurred. Costs incurred to drill and complete development wells are capitalized. Unproved properties are assessed periodically within specific geographic areas and, if necessary, impairments are charged to expense. Geological and geophysical expenses and delay rentals are charged to expense as incurred. Exploratory drilling costs are initially capitalized, but charged to expense if the well is determined to be unsuccessful. We carry the costs of an exploratory well as an asset if the well finds a sufficient quantity of reserves to justify its capitalization as a producing well as long as we are making sufficient progress towards assessing the reserves and the economic and operating viability of the project.
Depletion of producing oil and natural gas properties is recorded based on units of production. Unit rates are computed for unamortized drilling and development costs using proved developed reserves and for acquisition costs using all proved reserves. GAAP authoritative guidance requires that acquisition costs of proved properties be amortized on the basis of all proved reserves (developed and undeveloped) and that capitalized development costs (wells and related equipment and facilities) be amortized on the basis of proved developed reserves. Since our units of production depletion and amortization rate are a function of our proved reserves, we experience a higher depletion and amortization rate than we would if we claimed undeveloped or non-producing reserves.
Upon sale or retirement of complete fields of depreciable or depleted property, the book value thereof, less proceeds or salvage value, is charged or credited to income.
We assess proved oil and natural gas properties in our Upstream Segment for possible impairment when events or circumstances indicate that the recorded carrying value of the properties may not be pre-tax recoverable. We recognize an impairment loss as a result of a triggering event and when the estimated undiscounted pre-tax future cash flows from a property are less than the carrying value. If impairment is indicated, the fair value is compared to the carrying value for determining the amount of the impairment loss to record. Estimated future cash flows are based on management's expectations for the future and include estimates of oil and natural gas reserves and future commodity prices and operating costs. Downward revisions in estimates of reserve quantities or expectations of falling commodity prices or rising operating costs could result in a reduction in undiscounted future cash flows and could indicate property impairment.
Unproved leasehold costs are capitalized and amortized on a composite basis if individually insignificant, based on past success, experience, drilling plans and average lease-term lives. Unamortized leasehold costs related to successful exploratory drilling are reclassified to proved properties and depleted on a units of production basis. Unproved properties (both individually significant and insignificant) are assessed periodically within specific geographic areas and, if necessary, impairments are charged to expense.
Our estimates of proved reserves are based on the quantities of oil and natural gas that engineering and geological analyses demonstrate, with reasonable certainty, to be recoverable from established reservoirs in the future under current operating and economic conditions. Annually, and on other occasions, Cawley, Gillespie & Associates, Inc. prepares an estimate of the proved reserves on all our properties, based on information provided by us.
Reserves and their relation to estimated future net cash flows impact our depletion and impairment calculations. As a result, adjustments to depletion and impairment are made concurrently with changes to reserve estimates. We prepare our reserve estimates, and the projected cash flows derived from these reserve estimates, in accordance with SEC guidelines. The independent engineering firm described above adheres to the same guidelines when preparing their reserve reports. The accuracy of our reserve estimates is a function of many factors including the following: the quality and quantity of available data, the interpretation of that data, the accuracy of various mandated economic assumptions and the judgments of the
individuals preparing the estimates. The data for a given reservoir may change substantially over time as a result of numerous factors, including additional development activity, evolving production history and continual reassessment of the viability of production under varying economic conditions. Changes in oil and natural gas prices, operating costs and expected performance from a given reservoir also will result in revisions to the amount of our estimated proved reserves.
Our proved reserve estimates are a function of many assumptions, all of which could deviate significantly from actual results. As such, reserve estimates may materially vary from the ultimate quantities of natural gas, natural gas liquids and oil eventually recovered.
Risk Management Activities. We have structured our hedging activities in order to minimize our commodity pricing and interest rate risks and to help maintain compliance with certain financial covenants in our revolving credit facility. These hedging activities rely upon forecasts of our expected operations and financial structure over the next few years. If our operations or financial structure are significantly different from these forecasts, we could be subject to adverse financial results as a result of these hedging activities. We mitigate this potential exposure by retaining an operational cushion between our forecasted transactions and the level of hedging activity executed. Based on our current production estimates, we have hedged approximately 85% of our 2012 expected hedgeable crude, condensate and natural gas liquids (heavier than propane) volumes and 85% of our natural gas and ethane production. Similarly based on the production estimates in our current forecast, we have hedged approximately 80% of our 2013 expected hedgeable crude, condensate and natural gas liquids (heavier than propane) volumes and 67% of our natural gas and ethane production.
From the inception of our hedging program, we used mark-to-market accounting for our commodity hedges and interest rate swaps. We record monthly realized gains and losses on hedge instruments based upon cash settlement information. The settlement amounts vary due to the volatility in the commodity market prices throughout each month. We also record unrealized gains and losses monthly based upon the future value on mark-to-market hedges through their expiration dates. The expiration dates vary but are currently no later than June 2015 for our interest rate hedges and December 2014 for our commodity hedges. Option premiums and costs incurred to reset contract prices or purchase swaps are amortized during the contract period through the unrealized risk management instruments in total revenue. We monitor and review hedging positions regularly.
Depreciation Expense and Cost Capitalization Policies. Our midstream assets consist primarily of natural gas gathering pipelines and processing plants. We capitalize all construction-related direct labor and material costs, as well as indirect construction costs. Indirect construction costs include general engineering and the cost of funds used in construction. The cost of funds used in construction represent capitalized interest. These costs are then expensed over the life of the constructed asset through the recording of depreciation expense.
As discussed in Note 2 to our consolidated financial statements included in Part II, Item 8. Financial Statements and Supplementary Data starting on page F-1 of this Annual Report, depreciation of our midstream assets is generally computed using the straight-line method over the estimated useful life of the assets. The costs of renewals and betterments which extend the useful life of property, plant and equipment are also capitalized. The costs of repairs, replacements and maintenance projects are expensed as incurred.
The computation of depreciation expense requires judgment regarding the estimated useful lives and salvage value of assets. As circumstances warrant, depreciation estimates are reviewed to determine if any changes are needed. Such changes could involve an increase or decrease in estimated useful lives or salvage values which would impact future depreciation expense.
Impairment of Long-Lived Assets. We assess our long-lived assets for impairment whenever events or changes in circumstances indicate its carrying amount may not be recoverable.
Examples of events or changes in circumstances include:
| |
| • | a significant decrease in the market price of a long-lived asset or asset group; |
| |
| • | a significant adverse change in the extent or manner in which a long-lived asset or asset group is being used or in its physical condition; |
| |
| • | a significant adverse change in legal factors or in the business climate could affect the value of a long-lived asset or asset group, including an adverse action or assessment by a regulator which would exclude allowable costs from the rate-making process; |
| |
| • | an accumulation of costs significantly in excess of the amount originally expected for the acquisition or construction of a long-lived asset or asset group; |
| |
| • | a current-period operating cash flow loss combined with a history of operating cash flow losses or a projection or forecast that demonstrates continuing losses associated with the use of a long-lived asset or asset group; and |
| |
| • | a current expectation that, more likely than not, a long-lived asset or asset group will be sold or otherwise disposed of significantly before the end of its previously estimated useful life. |
The carrying value of a long-lived asset is determined to not be recoverable when the carrying value of a long-lived asset exceeds our estimate of the undiscounted cash flows expected to result from the use and eventual disposition of the long-lived asset. If the carrying value of a long-lived asset is determined not to be recoverable, the impairment loss is measured as the excess of the carrying value over its fair value. For our the long-lived assets in our Midstream Business, our estimate of cash flows is based on assumptions regarding the long-lived asset, including future commodity prices and estimate future natural gas production in the region (which is dependent in part on commodity prices). Our estimate of natural gas volumes and future commodity prices are inherently subjective and contingent upon a number of variable factors, including but not limited to: (i) changes in the general economic conditions in which the long-lived asset is located, (ii) the availability and prices of the natural gas supply, (iii) our dependence on certain significant customers and producers of natural gas and (iv)improvements in exploration and production technologies.
Asset Retirement Obligations. The recognition of an asset retirement obligation requires that management make numerous estimates, assumptions and judgments regarding such factors as costs of remediation, timing of settlements, the credit-adjusted risk-free rate to be used and inflation rates. In periods subsequent to initial measurement of the asset retirement obligation, we must recognize period-to-period changes in the liability resulting from changes in the timing of settlement to changes in the estimate of the costs of remediation. Any such changes that result in upward or downward revisions in the estimated obligation will result in an adjustment to the related capitalized asset and corresponding liability on a prospective basis and an adjustment in our depreciation, depletion and amortization expense in future periods.
Presentation of Financial Information
For a description of the presentation of our financial information in this report, please see Part II, Item 6. Selected Financial Data.
Year Ended December 31, 2011 Compared with Year Ended December 31, 2010
Summary of Consolidated Operating Results
Below is a table of a summary of our consolidated operating results for the years ended December 31, 2011 and 2010. Operating results for our individual operating segments are also presented in tables in this Item 7.
|
| | | | | | | | |
| | | Year Ended December 31, |
| | | 2011 | | 2010 |
| | ($ in thousands) |
| Revenues: | | | | |
| Natural gas, natural gas liquids, oil, condensate and sulfur sales | | $ | 977,952 |
| | $ | 688,052 |
|
| Gathering, compression, processing and treating fees | | 47,770 |
| | 50,608 |
|
| Realized commodity derivative losses | | (20,366 | ) | | (17,010 | ) |
| Unrealized commodity derivative gains | | 52,876 |
| | 8,224 |
|
| Other revenue | | 1,676 |
| | 2,435 |
|
| Total revenues | | 1,059,908 |
| | 732,309 |
|
| Cost of natural gas, natural gas liquids, and condensate | | 633,184 |
| | 468,304 |
|
| Costs and expenses: | | |
| | |
|
| Operating and maintenance | | 93,048 |
| | 76,415 |
|
| Taxes other than income | | 19,148 |
| | 12,226 |
|
| General and administrative | | 57,891 |
| | 45,775 |
|
| Other operating income | | (2,893 | ) | | — |
|
| Impairment | | 16,288 |
| | 6,666 |
|
| Depreciation, depletion and amortization | | 131,611 |
| | 106,398 |
|
| Total costs and expenses | | 315,093 |
| | 247,480 |
|
| Total operating income | | 111,631 |
| | 16,525 |
|
| Other income (expense): | | |
| | |
|
| Interest income | | 25 |
| | 111 |
|
| Interest expense | | (29,647 | ) | | (15,147 | ) |
| Unrealized interest rate derivatives gains (losses) | | 5,595 |
| | (7,164 | ) |
| Realized interest rate derivative losses | | (16,996 | ) | | (19,971 | ) |
| Other (expense) income | | (184 | ) | | 450 |
|
| Total other income (expense) | | (41,207 | ) | | (41,721 | ) |
| Income (loss) from continuing operations before income taxes | | 70,424 |
| | (25,196 | ) |
| Income tax benefit | | (2,432 | ) | | (2,585 | ) |
| Income (loss) from continuing operations | | 72,856 |
| | (22,611 | ) |
| Discontinued operations, net of tax | | 276 |
| | 17,262 |
|
| Net income (loss) | | $ | 73,132 |
| | $ | (5,349 | ) |
| Adjusted EBITDA(a) | | $ | 208,208 |
| | $ | 126,026 |
|
________________________
| |
| (a) | See "- Non-GAAP Financial Measures" for a definition and reconciliation to GAAP. |
Midstream Business (Three Segments)
Texas Panhandle Segment
|
| | | | | | | |
| | Year Ended December 31, |
| | 2011 | | 2010 |
| | (Amounts in thousands, except volumes and realized prices) |
| Revenues: | | | |
| Natural gas, natural gas liquids, oil and condensate sales | $ | 378,917 |
| | $ | 334,614 |
|
| Intersegment sales - natural gas | 60,237 |
| | — |
|
| Gathering, compression, processing and treating fees | 17,074 |
| | 11,957 |
|
| Total revenue | 456,228 |
| | 346,571 |
|
| Cost of natural gas, natural gas liquids, and condensate | 327,775 |
| | 231,880 |
|
| Operating costs and expenses: | | | |
| Operations and maintenance | 41,749 |
| | 35,013 |
|
| Depreciation and amortization | 37,034 |
| | 45,876 |
|
| Impairment | 4,560 |
| | — |
|
| Total operating costs and expenses | 83,343 |
| | 80,889 |
|
| Operating income | $ | 45,110 |
| | $ | 33,802 |
|
| | | | |
| Capital expenditures | $ | 71,351 |
| | $ | 29,282 |
|
| | | | |
| Realized prices: | |
| | |
|
| Oil and condensate (per Bbl) | $ | 80.41 |
| | $ | 66.68 |
|
| Natural gas (per Mcf) | $ | 3.74 |
| | $ | 3.92 |
|
| NGLs (per Bbl) | $ | 52.67 |
| | $ | 45.85 |
|
| Production volumes: | |
| | |
|
| Gathering volumes (Mcf/d)(a) | 155,122 |
| | 131,925 |
|
| NGLs (net equity Bbls) | 880,348 |
| | 905,379 |
|
| Condensate (net equity Bbls) | 962,982 |
| | 1,034,275 |
|
| Natural gas (MMbtu/d)(a) | (5,622 | ) | | (4,811 | ) |
_______________________
| |
| (a) | Gathering volumes (Mcf/d) and natural gas short positions (MMbtu/d) are calculated by taking the total volume and then dividing by the number of days in the respective period. |
Revenue and Cost of Natural Gas and NGLs. For the year ended December 31, 2011, revenues minus cost of natural gas, NGLs and condensate for our Texas Panhandle Segment operations totaled $128.5 million compared to $114.7 million for the year ended December 31, 2010. The increase was primarily driven by higher commodity prices, increased volumes from new drilling activity in Wheeler, Hemphill and Roberts counties, and volumes associated with the acquisition of gathering assets from CenterPoint Energy Field Services (our "East Hemphill" system) in October of 2010. These benefits were substantially offset by operating downtime at three facilities and a reduction in existing volumes of natural gas, NGLs and condensate due to severe winter weather in our Texas Panhandle Segment in January and February 2011. This severe winter weather also caused damage to our Cargray processing facility, resulting in reduced recoveries of NGLs. The Cargray processing facility was repaired in late June 2011. The operating downtime and the affected recoveries at the Cargray facility impacted revenues minus cost of natural gas by $3.6 million across the Texas Panhandle Segment during the year ended December 31, 2011. We maintain business interruption insurance and are pursuing recovery of the lost net revenue above our 30-day deductible. As of December 31, 2011, we have not accrued any amounts related to our business interruption insurance claim.
Our Texas Panhandle Segment lies within ten counties in Texas and consists of our East Panhandle System and our West Panhandle System. The limited drilling activity in the West Panhandle System is not sufficient to offset the natural declines
experienced on this system. The combination of our contract mix and the high NGL content of the natural gas gathered in the West Panhandle System provides us with a high level of equity NGL and condensate production. As such, any declines in gathering volume from the West Panhandle System must be offset with increases in gathered volumes from other systems on a greater than one-to-one basis in order to maintain our total equity NGL and condensate production. We have seen continued drilling activity in the East Panhandle System by our producer customers beginning in the third quarter of 2010 as higher NGL prices and continued improvements in horizontal drilling technology and fracturing practices resulted in favorable drilling economics. We experienced increased drilling activity on our production volumes in the fourth quarter of 2010 and expect it would have continued in the first half of 2011 had it not been for the severe winter weather in January and February. We have seen and continue to expect drilling activity and the resulting volumes to continue to improve during the remainder of 2012, driven by increases in our East Panhandle System. Accordingly, in early August 2011, we entered into an amendment to our Natural Gas Liquids Exchange Agreement with ONEOK Hydrocarbon, L.P. ("ONEOK") to increase the maximum allowable volumes of natural gas that we may deliver from our East Panhandle System to ONEOK for transportation and fractionation services and correspondingly decrease the maximum allowable volumes from our West Panhandle System. The amendment also provided for additional volumes expected after completion of our Woodall Plant in the Granite Wash play, which is discussed below.
Operating Expenses. Operating expenses, including taxes other than income, for the year ended December 31, 2011, increased $6.7 million as compared to the year ended December 31, 2010. The increase was primarily driven by costs related to the East Hemphill gathering system acquired in October 2010, plant turnarounds and additional costs associated with our new high-efficiency cryogenic Phoenix-Arrington Ranch Plant and associated new field compression. Additionally, the costs incurred related to January's and February's extreme weather during the first six months of the year was approximately $1.3 million.
Depreciation and Amortization. Depreciation and amortization expenses for the year ended December 31, 2011 decreased $8.8 million from the year ended December 31, 2010. The major item impacting the decrease was a reduction in amortization expense due to certain intangible assets becoming fully amortized during the fourth quarter of 2010. This decrease was offset by increased depreciation expense associated with the capital expenditures placed into service during the period.
Impairment. During the year ended December 31, 2011, we recorded an impairment charge of $4.6 million in our Texas Panhandle Segment to fully write down our idle Turkey Creek plant. We determined that the components of our Turkey Creek plant could not be used elsewhere within our business, and thus we decided to remove all above ground equipment and structures. We did not incur any impairment charges during the year ended December 31, 2010.
Capital Expenditures. Capital expenditures for the year ended December 31, 2011 increased by $42.1 million compared to the year ended December 31, 2010. The increase was primarily driven by spending related to: (i) the construction of our Phoenix-Arrington Ranch Plant, including an interconnect between it and our System 97 gathering system, (ii) spending related to improvements to our Cargray Stabilizer and Goad Treater, and (iii) interconnects between our East Hemphill system and our Phoenix-Arrington Ranch Plant.
The Phoenix-Arrington Ranch Plant Expansion was completed in the fourth quarter of 2011 at a cost of $21.2 million. This expansion raised the plant's capacity to 80 MMcf/d and will allow us to accommodate the expected volume growth from the Granite Wash play. As announced in April 2011, due to the increased demand for additional processing capacity in the area, we do not intend to shut down and re-direct gas volumes from our Canadian Plant in Hemphill County, Texas into the Phoenix-Arrington Ranch Plant. Our Canadian Plant will remain operating, with total processing capacity of 25 MMcf/d.
On July 27, 2011, we announced plans to install a state-of-the-art 60 MMcf/d cryogenic processing facility in the Granite Wash play in the Texas Panhandle (the "Woodall Plant"). The construction of the Woodall Plant and associated gathering and compression is expected to cost approximately $70 million, of which $25.7 million was spent during the year ended December 31, 2011 and is expected to be accretive to our distributable cash flow upon being placed into service. We do not anticipate downtime or reduced throughput volumes across our systems in the Texas Panhandle Segment during the completion of the project. This project has an anticipated startup date of April 2012.
On October 31, 2011, we announced our intention to install a 125 MMcf/d high efficiency cryogenic processing plant in Wheeler County, Texas, in the heart of the prolific Granite Wash play, which was subsequently revised downward from 125 MMcf/d to 60 MMcf/d capacity. We expect the installation of the new processing plant (the “Wheeler Plant”) and construction of the associated infrastructure to be completed early in the first half of 2013. The addition of our Woodall and Wheeler Plants to our existing processing infrastructure in the Texas Panhandle Segment, together with the Phoenix-Arrington Ranch Plant Expansion, is in response to incremental processing needs driven by increased drilling activity by producers in the Granite Wash play.
East Texas and Other Midstream Segment
|
| | | | | | | |
| | Year Ended December 31, |
| | 2011 | | 2010 |
| | (Amounts in thousands, except volumes and realized prices) |
| Revenues: | | | |
| Natural gas, natural gas liquids, oil and condensate sales | $ | 243,673 |
| | $ | 255,537 |
|
| Intersegment sales - natural gas | 16,654 |
| | — |
|
| Gathering, compression, processing and treating fees | 30,688 |
| | 38,651 |
|
| Total revenue | 291,015 |
| | 294,188 |
|
| Cost of natural gas, natural gas liquids, and condensate | 231,642 |
| | 230,837 |
|
| Operating costs and expenses: | |
| | |
|
| Operations and maintenance | 22,790 |
| | 20,885 |
|
| Impairment | — |
| | 3,130 |
|
| Depreciation and amortization | 27,629 |
| | 28,548 |
|
| Total operating costs and expenses | 50,419 |
| | 52,563 |
|
| Operating income from continuing operations | 8,954 |
| | 10,788 |
|
| Discontinued operations (a) | (128 | ) | | (25,781 | ) |
| Operating income (loss) | $ | 8,826 |
| | $ | (14,993 | ) |
| | | | |
| Capital expenditures | $ | 10,860 |
| | $ | 16,026 |
|
| | | | |
| Realized prices: | |
| | |
|
| Oil and condensate (per Bbl) | $ | 95.08 |
| | $ | 78.50 |
|
| Natural gas (per Mcf) | $ | 4.15 |
| | $ | 4.69 |
|
| NGLs (per Bbl) | $ | 49.72 |
| | $ | 39.76 |
|
| Production volumes: | |
| | |
|
| Gathering volumes (Mcf/d)(b) (c) | 319,892 |
| | 357,403 |
|
| NGLs (net equity Bbls) | 451,048 |
| | 545,666 |
|
| Condensate (net equity Bbls) (c) | 46,242 |
| | 49,523 |
|
| Natural gas (MMbtu/d)(b) | 1,913 |
| | 1,698 |
|
_________________________
| |
| (a) | Includes sales of natural gas of $66 and $47 to the Upstream Segment for the years ended December 31, 2011 and 2010, respectively. |
| |
| (b) | Gathering volumes (Mcf/d) and natural gas short position (MMbtu/d) are calculated by taking the total volume and then dividing by the number of days in the respective period. |
| |
| (c) | For the year ended December 31, 2011, volumes from our Indian Springs plant, in which we own 25%, are included in equity NGL and condensate volumes, as we believe including these volumes is more illustrative of current operating trends. In addition, NGL and condensate volumes associated with a certain contract at our Brookeland plant have been excluded from the year ended December 31, 2011 due to a change in reporting methodology. This change is evident only in the reporting of 2011 production volumes above and does not impact any of the components of 2011 operating results. |
Revenue and Cost of Natural Gas and NGLs. For the year ended December 31, 2011, revenues minus cost of natural gas and NGLs for our East Texas and Other Midstream Segment totaled $59.4 million compared to $63.4 million for the year ended December 31, 2010. During the years ended December 31, 2011 and 2010, we recorded revenues associated with deficiency payments of $1.6 million and $10.4 million, respectively. We receive deficiency payments under certain of our gathering contracts when delivered volumes fail to meet certain thresholds. These amounts are included within gathering and treating services revenue. Excluding these deficiency payments, revenues minus cost of natural gas, NGLs and condensate for the years ended December 31, 2011 and 2010 would have been $57.8 million and $53.0 million, respectively. The increase, excluding deficiency payments, for the year ended December 31, 2011 compared to the year ended December 31, 2010, is primarily due to higher condensate and NGL prices, and is partially offset by a decrease in gathering volumes and lower natural gas prices.
The gathering volumes for the year ended December 31, 2011 decreased as compared to the year ended December 31, 2010, due to natural declines in the production of the existing wells, reduced drilling activity in dry-gas formations related to a decline in natural gas prices and to certain mechanical, completion difficulties experienced by our producer customers and the
loss of a significant producer during the third quarter of 2010.
Operating Expenses. Operating expenses for the year ended December 31, 2011 increased $1.9 million compared to the year ended December 31, 2010 as a result of higher compressor repair costs, contract labor costs, labor and benefits, maintenance supply costs and costs related to the cancellation of certain capital projects, offset by lower compressor rental costs.
Impairment. We recorded impairment expense of $3.1 million in the year ended December 31, 2010 due to the loss of a significant gathering contract. No impairment charges were incurred in the year ended December 31, 2011.
Depreciation and Amortization. Depreciation and amortization expenses for the year ended December 31, 2011 decreased $0.9 million compared to the year ended December 31, 2010. The decrease was due to assets which were impaired in 2010 and assets which became fully depreciated during the year ended December 31, 2011 and 2010.
Capital Expenditures. Capital expenditures for the year ended December 31, 2011 decreased $5.2 million compared to the year ended December 31, 2010. Costs incurred to connect new wells decreased during the period due to the reduced drilling activities in the dry-gas formations. In addition, capital expenditures for the year ended December 31, 2011 were offset by the sale of $2.9 million of excess pipe inventory related to the East Texas Mainline ("ETML") expansion project which was cancelled in 2010.
Discontinued Operations. On April 29, 2009, we sold our producer services line of business. As part of the sale, the Partnership received a monthly payment equivalent to $0.01 per MMbtu on the volume of gas that flowed pursuant to the assigned contracts through March 31, 2011 which are included in discontinued operations for the respective period. During the year ended, December 31, 2010, this business generated revenues of $0.1 million.
On May 20, 2011, we sold the Wildhorse Gathering System. We recorded a loss of $0.7 million on the sale, which is recorded as part of discontinued operations for the year ended December 31, 2011. For the year ended December 31, 2011, the Wildhorse Gathering System generated revenues of $6.9 million and loss from operations of $0.5 million. For the year ended December 31, 2010, we generated revenues of $26.1 million and a loss from operations of $25.9 million, which includes an impairment charge of $26.2 million. During the year ended December 31, 2011, we recorded a loss from discontinued operations of $0.2 million attributable to the Wildhorse Gathering System. During the year ended December 31, 2010, we recorded a loss from discontinued operations of $25.9 million. During each of the years ended December 31, 2011 and 2010, this system incurred state tax expense of less than $0.1 million.
Marketing and Trading Segment |
| | | | | | | |
| | Year Ended December 31, |
| | 2011 | | 2010 |
| | (Amounts in thousands, except volumes and realized prices) |
| Revenues: | | | |
| Natural gas, oil and condensate sales | $ | 200,931 |
| | $ | 11,664 |
|
| Intersegment sales - natural gas and condensate | (82,378 | ) | | — |
|
| Gathering, compression, processing and treating fees | 8 |
| | — |
|
| Total revenue | 118,561 |
| | 11,664 |
|
| Cost of oil and condensate | 73,767 |
| | 5,587 |
|
| Intersegment cost of oil and condensate | 41,382 |
| | 5,587 |
|
| Operating costs and expenses: | | | |
| Operations and maintenance | — |
| | 19 |
|
| Total operating costs and expenses | — |
| | 19 |
|
| Operating income | $ | 3,412 |
| | $ | 471 |
|
| | | | |
| Capital Expenditures | $ | 2,205 |
| | $ | — |
|
We formed a crude and condensate marketing subsidiary during the fourth quarter of 2010 to develop and implement marketing uplift strategies surrounding crude oil and condensate production in Alabama and in the Texas Panhandle. In Alabama, we purchase product from our Upstream Segment and certain other working interest owners in the Big Escambia Creek, Fanny Church and Flomaton fields, and seek to increase the value of the product through: (i) blending and treating to lower the gravity and reduce the contaminants, respectively, of the purchased condensate; and (ii) transporting the higher quality condensate to another market location. In this regard, neither our Upstream Segment nor the other participating working interest owners bear increased risk in the relocating and treating of the condensate.
In the Texas Panhandle area, we are currently evaluating various storage and transportation opportunities to aggregate our product along with other third-party condensate and move it to more attractive markets.
In addition, in the second quarter of 2011, we created a natural gas marketing and trading subsidiary. The purpose of this subsidiary is to capitalize on the physical and financial arbitrage opportunities that naturally extend from our upstream and midstream assets. Where in the past, we generally sold to wholesale buyers at the tailgates and wellheads of our assets, now we hold transportation agreements and moves our product to many locations and types of buyers. This strategy diversifies our credit and performance risk and allows us to capitalize on daily, monthly, and seasonal changes in market conditions.
The marketing and trading subsidiary enters into both financial derivatives and physical contracts. The subsidiary's financial derivatives, primarily basis swaps, are transacted: (i) to economically hedge subscribed capacity exposed to market rate fluctuations, and (ii) to mitigate the price risk related to other purchase and sales of natural gas. By entering into a basis swap, one pricing index is exchanged for another, effectively locking in the margin between the natural gas purchase and sale by removing index spread risk on the combined physical and financial transaction. Financial derivatives are transacted to mitigate price risk, and are not transacted with the purpose of taking a directional view of the market.
A commodity-related derivative contract may be designated as a "normal" purchase or sale if the commodity is to be physically received or delivered for use or sale in the normal course of business. If designated as normal, the derivative contact is accounted for under the accrual method of accounting (not marked-to-market) with no balance sheet or income statement recognition of the contract until settlement. Commodity-related contracts that do not qualify for the normal designation are accounted for as derivatives and are marked-to-market each period.
Revenues for the year ended December 31, 2011 include an unrealized mark-to-market gain of $0.8 million related to the financial derivatives and physical contracts.
Upstream Segment
|
| | | | | | | |
| | Year Ended December 31, |
| | 2011(a) | | 2010 |
| | (Amounts in thousands, except volumes and realized prices) |
| Revenues: | | | |
| Oil and condensate (b) | $ | 51,574 |
| | $ | 44,444 |
|
| Intersegment sales - condensate | 42,716 |
| | 6,063 |
|
| Natural gas (c) | 42,551 |
| | 15,027 |
|
| Intersegment sales - natural gas | 5,487 |
| | — |
|
| NGLs (d) | 42,553 |
| | 19,973 |
|
| Sulfur (e) | 17,753 |
| | 6,793 |
|
| Other | 1,676 |
| | 2,435 |
|
| Total revenue | 204,310 |
| | 94,735 |
|
| Operating Costs and expenses: | | | |
|
| Operations and maintenance (f) | 47,723 |
| | 32,042 |
|
| Sulfur disposal costs | — |
| | 729 |
|
| Depletion, depreciation and amortization | 65,531 |
| | 30,424 |
|
| Impairment | 11,728 |
| | 3,536 |
|
| Total operating costs and expenses | 124,982 |
| | 66,731 |
|
| Operating income | $ | 79,328 |
| | $ | 28,004 |
|
| | | | |
| Capital expenditures | $ | 92,660 |
| | $ | 26,772 |
|
| | | | |
| Realized average prices (g): | | | |
|
| Oil and condensate (per Bbl) | $ | 84.36 |
| | $ | 62.35 |
|
| Natural gas (per Mcf) | $ | 3.69 |
| | $ | 4.43 |
|
| NGLs (per Bbl) | $ | 54.66 |
| | $ | 47.00 |
|
| Sulfur (per Long ton) (h) | $ | 180.95 |
| | $ | 88.36 |
|
| Production volumes: | | | |
|
| Oil and condensate (Bbl) | 1,117,778 |
| | 808,077 |
|
| Natural gas (Mcf) | 12,636,473 |
| | 3,514,078 |
|
| NGLs (Bbl) | 805,359 |
| | 437,375 |
|
| Total (Mcfe) | 24,175,297 |
| | 10,986,790 |
|
| Sulfur (Long ton) (h) | 98,372 |
| | 84,065 |
|
________________________
| |
| (a) | Includes operations related to the Crow Creek Acquisition starting on May 3, 2011 |
| |
| (b) | Revenues include a change in the value of product imbalances by $(102) for the year ended December 31, 2010. |
| |
| (c) | Revenues include a change in the value of product imbalances by $43 and $430 for the years ended December 31, 2011 and 2010, respectively. |
| |
| (d) | Revenues include a change in the value of product imbalances by $(69) and $370 for the years ended December 31, 2011 and 2010, respectively. |
| |
| (e) | Revenues include a change in the value of product imbalances by $(48) and $48 for the years ended December 31, 2011 and 2010, respectively. |
| |
| (f) | Includes purchase of natural gas of $66 and $47 from the East Texas and Other Midstream Segment for the years ended December 31, 2011 and 2010, respectively. |
| |
| (g) | Calculation does not include impact of product imbalances. |
| |
| (h) | During the year ended December 31, 2010, an adjustment was made to decrease sulfur volumes by 5,230 long tons related to a prior period. This adjustment is excluded from the calculation of realized prices. |
Revenue. For the year ended December 31, 2011, Upstream Segment revenues increased by $109.6 million as compared to the year ended December 31, 2010. The addition of production volumes from the Crow Creek Acquisition positively impacted the Upstream Segment's revenues by $68.2 million during the year ended December 31, 2011. From closing on May 3, 2011 to December 31, 2011, the acquired properties contributed 8.6 Bcf natural gas, 261 Mbbl oil and 300 Mbbl of NGLs to the Upstream Segment's total production. In addition to the acquisition, revenues increased due to higher realized prices for oil, NGLs and sulfur during the year ended December 31, 2011 compared to the year ended December 31,
2010.
Revenues for both 2011 and 2010 were impacted by the shut-in of our East Texas production from August 11, 2010 through March 11, 2011. In August 2010, we announced that our East Texas oil and natural gas production was temporarily shut-in due to an unscheduled shut-down of the Eustace processing facility owned and operated by a third-party. The shut-down involved replacing all of the tubes in the reaction furnace's waste heat recovery unit, replacing the catalyst in the sulfur recovery unit and other equipment repairs. The operator originally estimated that the shut-down would take 30 to 45 days to complete, but the facility was not brought back into service until March 11, 2011. The shut-in negatively impacted our net revenues from January 1, 2011 to March 11, 2011 by approximately $3.9 million (excluding recoveries) and from August 11, 2010 through December 31, 2010 by $7.1 million (excluding recoveries). As of December 31, 2011, we had recognized $5.0 million related to our business interruption insurance claim in other revenue, of which $2.0 million was recognized in the three months ended March 31, 2011 and $3.0 million was recognized in the fourth quarter of 2010. The maximum recovery under our business interruption insurance policy is $5.0 million per occurrence.
Revenues for 2011 were impacted by turnarounds at our Big Escambia Creek and Flomaton facilities. During September 2011, we completed a scheduled turnaround (a complete shutdown of the facility to perform certain standard plant repairs and routine inspections of equipment) of our Big Escambia Creek facility. The duration of the plant turnaround was approximately nine days. The negative impact to our production during this period was a loss of approximately 49 MMcf of residue gas, 15 MBbls of oil, 6 MBbls of plant products and NGLs and 1,800 long tons of sulfur. The revenue impact of the loss in production was approximately $2.3 million during the year ended December 31, 2011. During October 2011, following the planned September turnaround, it became necessary to bring down the Big Escambia Creek facility to make additional repairs to its sulfur recovery unit. The facility and all Big Escambia Creek field wells were shut-in for seven days and the estimated revenue impact associated with the loss in production was approximately $1.9 million, and the additional repair expense was approximately $0.9 million associated with this October 2011 shutdown.
In October 2011, we completed a scheduled turnaround of our Flomaton facility in Escambia County, Alabama to make certain equipment repairs and routine inspections of equipment. During the turnaround, both the Flomaton facility and all wells in the Flomaton and Fanny Church fields were shut-in. The duration of the plant turnaround and the field shut-in was approximately twelve days. We estimate the revenue impact due to the loss of production was approximately $0.5 million and the turnaround expense was approximately $1.1 million.
Revenues for 2010 were also impacted by turnarounds at our Big Escambia Creek and Flomaton facilities. During late April and early May 2010, we completed a scheduled turnaround of our Big Escambia Creek facility. During the plant turnaround, all wells in the Big Escambia Creek field were shut-in. The duration of both the plant turnaround and the well shut-in was approximately twelve days. The revenue impact of the loss in production was approximately $1.8 million during the year ended December 31, 2010.
During the year ended December 31, 2010, we completed a reallocation of historical production results based on more accurate tests for our Big Escambia Creek wells for the period from August 2007 through March 2010. As a result of this reallocation of historical production, our revenues for the year ended December 31, 2010 were negatively impacted by $1.3 million.
During the year ended December 31, 2011, sulfur revenue was $17.8 million as compared to net revenue of $6.1 million during the year ended December 31, 2010. Historically, sulfur was viewed as a low value by-product in the production of oil and natural gas. During the year ended December 31, 2011, sulfur prices ranged from $185 per long ton on February 10, 2011 to $220 per long ton on October 17, 2011 at the Tampa, Florida market. On February 6, 2012, sulfur prices were $172 per long ton at the Tampa, Florida market. Our net realized price is lower than the price set at the Tampa, Florida hub due to transportation and marketing deductions and charges. These charges vary depending on how far from the Tampa, Florida market our product is produced.
Operating Expenses. Operating expenses, including severance and ad valorem taxes, increased by $15.7 million for the year ended December 31, 2011, as compared to the year ended December 31, 2010. The increase for the year ended December 31, 2011 is primarily due to expenses of $12.1 million incurred from May 3, 2011 through December 31, 2011 related to the Mid-Continent Properties. Included within these expenses are approximately $2.2 million of post-production expenses, which includes transportation, compression, and processing expenses. Total post-production expenses increased by $2.9 million. During the year ended December 31, 2011, we incurred an additional expense of $2.6 million related to ad valorem taxes and increase severance taxes as a result of the increase in revenues from properties outside the Mid-Continent.
Depletion, Depreciation and Amortization. Depletion, depreciation and amortization expense increased by $35.1
million for the year ended December 31, 2011, as compared to the same period in the prior year. The increase was primarily due to $26.2 million of depletion expense incurred for operations from the Mid-Continent Properties during the year ended December 31, 2011, respectively. This increase was partially offset due to decreases in production as a result of our East Texas wells being shut-in, as discussed above.
Impairment. Impairment charges of $11.7 million were incurred during the year ended December 31, 2011. These impairment charges included $9.7 million related to the proved properties of the Jourdanton Field in South Texas and $1.5 million related to proved properties in the Permian region which are not able to produce in commercially paying quantities in the current natural gas price environment, $0.3 million related to certain drilling locations in our unproved properties which we no longer intend to develop based on the performance of offsetting wells and the remaining $0.2 million related to certain other drilling locations in our unproved properties which we no longer intend to develop. During the year ended December 31, 2010, we incurred impairment charges of $3.5 million related to certain wells in our unproved properties as we determined it would not be economical to develop these unproved locations.
Capital Expenditures. Capital expenditures increased by $65.9 million for the year ended December 31, 2011, as compared to the year ended December 31, 2010. During the year ended December 31, 2011, we drilled and completed nine gross operated wells and participated in thirty-one gross non-operated wells on leases in the Mid-Continent region, and drilled and completed a gross operated well in both East Texas and Alabama. Additionally, during the year ended December 31, 2011, we conducted thirteen recompletions and capital workovers across our operations. As of December 31, 2011, we were operating two drilling rigs in the Mid-Continent and participating with a non-operated working interest in seven additional drilling locations.
Corporate and Other Segment
|
| | | | | | | |
| | Year Ended December 31, |
| | 2011 | | 2010 |
| | (Amounts in thousands) |
| Revenues: | | | |
| Realized commodity derivative losses | $ | (20,366 | ) | | $ | (17,010 | ) |
| Unrealized commodity derivative gains | 52,876 |
| | 8,224 |
|
| Intersegment elimination - Sales of natural gas and condensate | (42,716 | ) | | (6,063 | ) |
| Total revenue | (10,206 | ) | | (14,849 | ) |
| Intersegment elimination - Cost of natural gas and condensate | (41,382 | ) | | (5,587 | ) |
| General and administrative | 57,891 |
| | 45,775 |
|
| Intersegment elimination - Operations and maintenance | (66 | ) | | (47 | ) |
| Other operating income | (2,893 | ) | | — |
|
| Depreciation and amortization | 1,417 |
| | 1,550 |
|
| Operating loss | (25,173 | ) | | (56,540 | ) |
| Other income (expense): | |
| | |
|
| Interest income | 25 |
| | 111 |
|
| Interest expense | (29,647 | ) | | (15,147 | ) |
| Unrealized interest rate derivative gains (losses) | 5,595 |
| | (7,164 | ) |
| Realized interest rate derivative losses | (16,996 | ) | | (19,971 | ) |
| Other (expense) income | (184 | ) | | 450 |
|
| Total other income (expense) | (41,207 | ) | | (41,721 | ) |
| Loss from continuing operations before taxes | (66,380 | ) | | (98,261 | ) |
| Income tax benefit | (2,432 | ) | | (2,585 | ) |
| Loss from continuing operations | (63,948 | ) | | (95,676 | ) |
| Discontinued operations, net of tax | 404 |
| | 43,043 |
|
| Segment loss | $ | (63,544 | ) | | $ | (52,633 | ) |
Revenue. Our Corporate and Other Segment's revenue consists of our intersegment eliminations and our commodity
derivatives activity. Our commodity derivatives activities impact our Corporate and Other Segment revenues through (i) the unrealized, non-cash, mark-to-market of our commodity derivatives scheduled to settle in future periods; and (ii) the realized gains or losses on our commodity derivatives settled in the indicated period. Our unrealized commodity gains and losses reflect (i) the change in the mark-to-market value of our derivative position from the beginning of a period to the end and (ii) the amortization of put premiums and other derivative costs. In general, the change in the mark-to-market value of our derivative position may be due to several factors including the settlement of derivative instruments during the period, the addition of new derivative positions during the period, changes in the forward curves of the underlying commodities from the beginning to the end of the period, changes in interest rates used in the mark-to-market calculations from the beginning to the end of the period and the passage of time during the period.
During the year ended December 31, 2011, unrealized gains in our commodity derivative portfolio increased, as compared to the unrealized gains recorded for the year ended December 31, 2010, due to the hedging contracts we assumed in the Crow Creek Acquisition and to decreases in the natural gas forward curve. Included with our unrealized commodity derivative gain for the year ended December 31, 2010, is the amortization of put premiums and other derivative costs, including the costs of hedge resets, of $4.0 million.
We recognized realized commodity derivative losses during each of the years ended December 31, 2011 and 2010. The increase in the realized losses for the year ended December 31, 2011, as compared to the same period in the prior year, was due to higher crude oil and NGL market prices during the year ended December 31, 2011, in relation to the strike prices of our settled contracts, as compared to the same period in the prior year. The increase in the realized losses for year ended December 31, 2011 was partially offset by the net realized gains recorded for the derivative contracts assumed in the Crow Creek Acquisition that settled during the period.
Given the uncertainty surrounding future commodity prices, and the general inability to predict future commodity prices as they relate to the strike prices at which we have hedged our exposure, it is difficult to predict the magnitude and impact that marking our hedges to market will have on our income from operations in future periods.
Intersegment Eliminations. During the year ended December 31, 2011, our East Texas and Other Midstream Segment sold natural gas to our Upstream Segment to be used as fuel, and our Upstream Segment sold condensate to the Marketing and Trading Segment within our Midstream Business for resale.
General and Administrative Expenses. General and administrative expenses increased by $12.1 million for the year ended December 31, 2011 as compared to the same period in 2010. This increase was partially due to an increase in salaries and benefits of $5.6 million due to increased headcount over the year. The increase in salaries and benefits was offset by a decrease in equity-based compensation expense of approximately $0.3 million during the years ended December 31, 2011, as compared to the years ended December 31, 2010, primarily as a result of natural run-off (through vesting) of restricted common units granted in prior periods at higher prices. In addition, included within our general and administrative expenses for the years ended December 31, 2011 are legal and other professional advisory fees of $2.3 million and $1.4 million of transition services expenses related to the Crow Creek Acquisition while the year ended December 31, 2010 includes $2.1 million of legal and other professional advisory fees related to the recapitalization and related transactions and the associated lawsuit.
At the present time, we do not allocate our general and administrative expenses cost to our operational segments.
Other Operating Income. In July 2008, SemGroup, L.P. and certain of its subsidiaries (“SemGroup”) filed petitions for reorganization under Chapter 11 of the U.S. Bankruptcy Code. We historically sold portions of our condensate production from the Texas Panhandle and East Texas midstream systems to SemGroup. As a result of the bankruptcy, we took a $10.7 million bad debt charge during the year ended December 31, 2008, which was included in “Other Operating Expense” in the consolidated statement of operations. In August 2009, we sold $3.9 million of our outstanding receivables from SemGroup, which represented its 20-day administrative claims under 503(b)(9) of the United States Bankruptcy Code, for which we received a payment of $3.0 million. Due to certain repurchase obligations under the assignment agreement, we recorded the payment as a current liability within accounts payable and maintained the balance as a liability until it was clear that the repurchase obligations can no longer be triggered. Due to the expiration of the repurchase obligations during the year ended December 31, 2011, we released our reserve for these receivables and recorded other operating income of $2.9 million related to these reserves.
Total Other Expense. Total other expense primarily consists of both realized and unrealized gains and losses from our interest rate swaps and interest expense related to our senior secured credit facility and our senior unsecured notes. On June 22, 2011, we terminated a $150 million notional amount 2.56% fixed rate interest rate swap at a total cost of $5.0 million, and extended the maturity of $250 million notional amount of our 4.095% fixed rate interest rate swaps from December 31, 2012 to
June 22, 2015 with a fixed rate of 2.95%. During 2011, our realized settlements decreased by about $3.0 million as compared to 2010, as a result of increased LIBOR rates in 2011 and due to the two transactions described above. For the year ended December 31, 2011, we recognized an unrealized gain of $5.6 million as compared to unrealized losses of $7.2 million during the same period in 2010, as a result of an increase in the forward interest rate curves. These unrealized mark-to-market losses did not have any impact on cash activities for the period, and are excluded by definition from our calculation of Adjusted EBITDA.
Interest expense increased by $14.5 million during the year ended December 31, 2011 as compared to the prior year. Interest expense is shown before the impact of our interest rate derivatives, which convert a portion of our outstanding debt from variable-rate interest obligations to fixed-rate interest obligations. On May 27, 2011, we issued $300 million of senior unsecured notes with a coupon of 8 3/8% through a private placement, and on June 22, 2011, we entered into an Amended and Restated Credit Agreement (see Note 8 to our unaudited condensed consolidated financial statements), which bears interest currently at LIBOR plus 2.25%. The increase in interest expense is due to the transactions discussed above and to higher LIBOR rates during 2011, as compared to the same period in 2010.
Income Tax (Benefit) Provision. Income tax provision for 2011 and 2010 relates to (i) state taxes due by us and (ii) federal taxes due by Eagle Rock Energy Acquisition Co., Inc. (acquiring entity of certain entities acquired in the acquisition of Redman Energy Corporation in 2008) and Eagle Rock Energy Acquisition Co. II, Inc. (acquiring entity of certain entities acquired in the Stanolind Acquisition) and their wholly-owned subsidiary corporations, Eagle Rock Upstream Development Company, Inc. (successor entity to certain entities acquired in the Redman acquisition) and Eagle Rock Upstream Development Company II, Inc. (successor entity to certain entities acquired in the Stanolind acquisition), which are subject to federal income taxes (the “C Corporations”). During year ended December 31, 2011, our tax benefit decreased by $0.2 million, as compared to the same periods in the prior year, primarily due to the change of the deferred tax liabilities created by the book/tax differences as a result of the federal income taxes associated with the Redman and Stanolind Acquisitions, receipt of state tax refunds and true-ups related to our prior year provision.
Discontinued Operations. On May 24, 2010, we completed the sale of our fee mineral and royalty interests as well as our equity investment in Ivory Working Interests, L.P. (collectively, the "Minerals Business"). We recorded a gain of $37.7 million on the sale, which is recorded as part of discontinued operations for the year ended December 31, 2010. During the year ended December 31, 2011, we received payments of $0.5 million related to pre-effective date operations and recorded this amount as part of discontinued operations. For the year ended December 31, 2010, we generated revenues of $8.9 million and income from operations of $5.5 million. During the year ended December 31, 2010, we recorded income to discontinued operations of $5.4 million, excluding the gain on the sale.
Adjusted EBITDA
Adjusted EBITDA, as defined under "- Non-GAAP Financial Measures," increased by $82.2 million from $126.0 million for the year ended December 31, 2010 to $208.2 million for the year ended December 31, 2011.
As described above, revenues minus cost of natural gas and NGLs for the Midstream Business (excluding unrealized gains from the Marketing and Trading Segment) increased by $11.9 million during the year ended December 31, 2011, as compared to the comparable period in 2010. The Upstream Segment revenues increased $110.4 million during the year ended December 31, 2011, as compared to the comparable periods in 2010. Intercompany eliminations revenues minus cost of natural gas and NGLs resulted in a $0.9 million decrease. Our Corporate and Other Segment's realized commodity derivatives loss decreased by $3.4 million during the year ended December 31, 2011 as compared to the comparable period in 2010. This resulted in total incremental revenues minus cost of natural gas and NGLs increasing by $118.1 million during the year ended December 31, 2011 as compared to the comparable periods in 2010. The incremental revenue amounts are adjusted to exclude the impact of unrealized commodity derivatives, which includes the amortization of put premiums and other derivative costs, and the non-cash mark-to-market Upstream Segment imbalances, none of which are included in the calculation of Adjusted EBITDA.
Operating expenses (including taxes other than income) for our Midstream Business increased by $8.6 million for the year ended December 31, 2011, as compared to the same period in 2010, and operating expenses (including taxes other than income) for the Upstream Segment increased $15.0 million for the year ended December 31, 2011, as compared to the comparable period in 2010.
General and administrative expense, excluding the impact of non-cash compensation charges related to our long-term incentive program and other non-recurring items and captured within our Corporate and Other Segment, increased during the year ended December 31, 2011 by $12.4 million as compared to the respective period in 2010.
As a result, revenues (excluding the impact of unrealized commodity derivative activity) minus cost of natural gas and NGLs for the year ended December 31, 2011, as compared to the same period in 2010 increased by $153.9 million, operating expenses increased by $23.6 million, and general and administrative expenses increased by $12.4 million. The increases in revenues minus the cost of natural gas and NGLs, while partially offset by the increases in operating costs and general and administrative expenses, resulted in a increase to Adjusted EBITDA during each of the year ended December 31, 2011, as compared to the year ended December 31, 2010. Adjusted EBITDA excludes amortization of commodity hedge costs (including costs of hedge reset transactions) for the year ended December 31, 2010 of $4.0 million. Including these amortization costs, our Adjusted EBITDA for the year ended December 31, 2010 would have been $122.1 million.
Year Ended December 31, 2010 Compared with Year Ended December 31, 2009
Summary of Consolidated Operating Results
Below is a table of a summary of our consolidated operating results for the years ended December 31, 2010 and 2009. Operating results for our individual operating segments are presented in tables in this Item 7.
|
| | | | | | | |
| | Year Ended December 31, |
| | 2010 | | 2009 |
| | ($ in thousands) |
| Revenues: | | | |
| Natural gas, natural gas liquids, oil, condensate and sulfur sales | $ | 688,052 |
| | $ | 633,357 |
|
| Gathering, compression, processing and treating fees | 50,608 |
| | 44,005 |
|
| Realized commodity derivative (losses) gains | (17,010 | ) | | 83,300 |
|
| Unrealized commodity derivative gains (losses) | 8,224 |
| | (189,590 | ) |
| Other revenue | 2,435 |
| | 1,858 |
|
| Total revenues | 732,309 |
| | 572,930 |
|
| Cost of natural gas, natural gas liquids, and condensate | 468,304 |
| | 470,099 |
|
| Costs and expenses: | |
| | |
|
| Operating and maintenance | 76,415 |
| | 71,496 |
|
| Taxes other than income | 12,226 |
| | 10,709 |
|
| General and administrative | 45,775 |
| | 45,819 |
|
| Other operating income | — |
| | (3,552 | ) |
| Impairment | 6,666 |
| | 21,788 |
|
| Depreciation, depletion and amortization | 106,398 |
| | 108,530 |
|
| Total costs and expenses | 247,480 |
| | 254,790 |
|
| Total operating income (loss) | 16,525 |
| | (151,959 | ) |
| Other income (expense): | |
| | |
|
| Interest income | 111 |
| | 187 |
|
| Interest expense | (15,147 | ) | | (21,591 | ) |
| Unrealized interest rate derivatives (losses) gains | (7,164 | ) | | 12,529 |
|
| Realized interest rate derivative losses | (19,971 | ) | | (18,876 | ) |
| Other (expense) income | 450 |
| | (136 | ) |
| Total other income (expense) | (41,721 | ) | | (27,887 | ) |
| Loss from continuing operations before income taxes | (25,196 | ) | | (179,846 | ) |
| Income tax (benefit) provision | (2,585 | ) | | 989 |
|
| Loss from continuing operations | (22,611 | ) | | (180,835 | ) |
| Discontinued operations, net of tax | 17,262 |
| | 9,577 |
|
| Net loss | $ | (5,349 | ) | | $ | (171,258 | ) |
| Adjusted EBITDA(a) | $ | 126,026 |
| | $ | 172,587 |
|
________________________
| |
| (a) | See Part II, Item 6. Selected Financial Data – Non-GAAP Financial Measures for a definition and reconciliation to GAAP. |
Midstream Business (Three Segments)
Texas Panhandle Segment
|
| | | | | | | |
| | Year Ended December 31, |
| | 2010 | | 2009 |
| | (Amounts in thousands, except volumes and realized prices) |
| Revenues: | | | |
| Natural gas, natural gas liquids, oil and condensate sales | $ | 334,614 |
| | $ | 282,916 |
|
| Gathering and treating services | 11,957 |
| | 11,036 |
|
| Total revenues | 346,571 |
| | 293,952 |
|
| Cost of natural gas, natural gas liquids, oil & condensate | 231,880 |
| | 206,985 |
|
| Operating costs and expenses: | | | |
| Operations and maintenance | 35,013 |
| | 31,873 |
|
| Depreciation and amortization | 45,876 |
| | 46,085 |
|
| Total operating costs and expenses | 80,889 |
| | 77,958 |
|
| Operating income | $ | 33,802 |
| | $ | 9,009 |
|
| | | | |
| Capital expenditures | $ | 29,282 |
| | $ | 7,293 |
|
| | | | |
| Realized prices: | | | |
|
| Oil and condensate (per Bbl) | $ | 66.68 |
| | $ | 60.14 |
|
| Natural gas (per Mcf) | $ | 3.92 |
| | $ | 3.23 |
|
| NGLs (per Bbl) | $ | 45.85 |
| | $ | 33.45 |
|
| Production volumes: | | | |
|
| Gathering volumes (Mcf/d)(b) | 131,925 |
| | 138,450 |
|
| NGLs (net equity gallons) (b) | 905,379 |
| | 1,104,201 |
|
| Condensate (net equity gallons) (b) | 1,034,275 |
| | 840,295 |
|
| Natural gas short position (MMbtu/d)(a) | (4,811 | ) | | (6,010 | ) |
________________________
| |
| (a) | Gathering volumes (Mcf/d) and natural gas short position (MMbtu/d) are calculated by taking the total volume and then dividing by the number of days in the respective period. |
| |
| (b) | Installation of additional measurement facilities in January 2010 has improved the measurement of NGLs and condensate volumes, resulting in increased equity condensate volumes and a corresponding decrease in equity NGL volumes. |
Revenue and Cost of Natural Gas and Natural Gas Liquids. For the year ended December 31, 2010, revenues minus cost of natural gas and natural gas liquids for our Texas Panhandle Segment operations totaled $114.7 million compared to $87.0 million for the year ended December 31, 2009. The increase is primarily driven by the higher NGL, natural gas and condensate pricing offset by lower gathering and equity volumes. As footnoted above, additional measurement facilities installed in January 2010 have resulted in improved measurement of NGLs and condensate volumes, which in turn resulted in increased equity condensate volumes and a corresponding decrease in equity NGL volumes versus the prior year ending December 31, 2009.
Our Texas Panhandle Segment lies within ten counties in Texas and consists of our East Panhandle System and our
West Panhandle System. The limited drilling activity in the West Panhandle System is not sufficient to offset the natural declines experienced on this system. While our contract mix in the West Panhandle System provides us with a higher equity share of the production, the overall decline will continue. In the East Panhandle, volumes were lower in the first half of 2010 due to falling natural gas prices which constrained drilling activity by our producer customers as they evaluated the economics of the Granite Wash play. We saw a resurgence of drilling activity by our producer customers beginning in the third quarter of 2010 as NGL prices increased dramatically due to improved demand in the United States for NGLs by the petrochemical industry. Given the improvements in horizontal drilling technology and fracturing practices, our producer customers are active in the development of the Granite Wash play. We began to see the benefit of this increase in drilling activity during the fourth quarter of 2010, as we saw volumes increasing through our gathering and processing facilities. These increases through our gathering and processing facilities were somewhat slowed during the fourth quarter of 2010 as some of our producer customers
experienced delays in contracting well completion services. We expect this to improving drilling environment to carry into 2011.
We have extensive gathering and processing facilities in the Granite Wash play, especially in Wheeler, Roberts and Hemphill Counties, Texas and have long-term acreage dedications from several large producers, so we are focused on improving our processing capabilities in the Texas Panhandle. The processing plants in our East Panhandle System, given the current drilling activity, have sufficient processing capacity to accommodate our customers' current needs until drilling levels increase. In order to provide additional processing capacity to our East Panhandle System, we initiated a project to refurbish the Stinnett cryogenic processing plant, located in the West Panhandle System, and relocate it to the East Panhandle System to replace the existing Arrington lean oil processing plant (the "Phoenix-Arrington Ranch Plant"), resulting in additional processing capacity and improved processing economics. This project was temporarily postponed in early 2009, but in February 2010, we announced our intention to deploy the Phoenix-Arrington Ranch Plant to increase efficiency and accommodate volume growth from the Granite Wash play. The Phoenix-Arrington Ranch Plant began operations in October 2010 with an initial capacity of 50 MMcf/d and the ability to expand to 80 MMcf/d. In support of this project we installed a three mile pipeline to interconnect our System 97 gathering system and the new East Hemphill gathering system, as discussed below, to the new Phoenix-Arrington Ranch Plant providing access to drilling activity in Wheeler and Hemphill counties in Texas and adjoining counties in Oklahoma.
On October 19, 2010, we acquired our East Hemphill system from CEFS. This acquisition provided (i) an immediate increase in gathered volumes of approximately 18.2 MMBtu/d; (ii) a significant extension of our gathering infrastructure in the area; (iii) high and low pressure gathering services to accommodate growing volumes in the Wheeler County area; and (iv) a stronger platform from which we will be able to provide our customers the flexibility to direct liquids-rich gas to one or more of our processing facilities.
In the West Panhandle, the Super Drip and Cargray condensate collection stabilization facilities receive condensate collected from various gathering systems where it is then separated from the collected water and treated. We currently stabilize approximately 2,000 barrels per day combined at our Superdrip and Cargray Stabilizers. The Cargray Stabilizer became operational in October 2010 and has increased our stabilization capacity by 2,400 barrels per day. The additional condensate stabilization capacity at Cargray also allows us to increase operating efficiencies at the Superdrip Stabilizer. Condensate stabilization lowers the product's vapor pressure, resulting in a higher value product for sale. We continue to review additional condensate stabilization projects that may provide an opportunity to handle third party condensate for a fee. We continue to review additional plant consolidation projects in order to rationalize plant processing capacity and operating costs in an area where the gas decline continues in the range of 6% to 8% per year.
Operating Expenses. Operating expenses, including taxes other than income, for the year ended December 31, 2010 increased $3.1 million as compared to the year ended December 31, 2009. The increase was due to increased compressor rental expenses as we expanded the compressor station at our Roberts County Plant with leased units and replaced aging compressors at our Stinnett facility with more efficient leased units. In addition, the increase was also due to increased maintenance costs as we worked to improve our existing infrastructure to support our new Phoenix-Arrington Ranch Plant and extraordinary mechanical breakdowns of our Goad Treater. The installation of a new 26 MMcf/d treating facility, the Goad Treater, was completed in November 2010 and replaces an older original facility. This facility removes hydrogen sulfide and carbon dioxide from the natural gas prior to delivery to interstate pipelines.
Depreciation and Amortization. Depreciation and amortization expenses for the year ended December 31, 2010 decreased $0.2 million from the year ended December 31, 2009. The major item impacting the decrease was a reduction in amortization expense due to the completion of the amortization of certain intangible assets. This decrease was offset by depreciation expense associated with the capital expenditures placed into service during the period.
Capital Expenditures. Capital expenditures for the year ended December 31, 2010 increased $22.0 million compared to the year ended December 31, 2009. The increase was primarily driven by spending related to the Phoenix-Arrington Ranch Plant in 2010, including an interconnect between our System 97 gathering system and the Phoenix-Arrington Ranch Plant and spending related to improvements to the Cargray Stabilizer and Goad Treater.
East Texas and Other Midstream Segment
|
| | | | | | | |
| | Year Ended December 31, |
| | 2010 | | 2009 |
| | (Amounts in thousands, except volumes and realized prices) |
| Revenues: | | | |
| Natural gas, natural gas liquids, oil and condensate sales | $ | 255,537 |
| | $ | 287,047 |
|
| Gathering and treating services | 38,651 |
| | 32,969 |
|
| Other | — |
| | 1,619 |
|
| Total revenues | 294,188 |
| | 321,635 |
|
| Cost of natural gas and natural gas liquids | 230,837 |
| | 263,114 |
|
| Operating costs and expenses: |
|
| |
|
|
| Operations and maintenance | 20,885 |
| | 21,796 |
|
| Impairment | 3,130 |
| | 13,674 |
|
| Depreciation and amortization | 28,548 |
| | 27,363 |
|
| Total operating costs and expenses | 52,563 |
| | 62,833 |
|
| Operating loss from continuing operations | 10,788 |
| | (4,312 | ) |
| Discontinued operations (a) | (25,781 | ) | | 503 |
|
| Operating loss | $ | (14,993 | ) | | $ | (3,809 | ) |
| | | | |
| Capital expenditures | $ | 16,026 |
| | $ | 18,615 |
|
| | | | |
| Realized prices: | |
| | |
|
| Oil and condensate (per Bbl) | $ | 78.50 |
| | $ | 60.36 |
|
| Natural gas (per Mcf) | $ | 4.69 |
| | $ | 3.81 |
|
| NGLs (per Bbl) | $ | 39.76 |
| | $ | 34.95 |
|
| Production volumes: | |
| | |
|
| Gathering volumes (Mcf/d)(b) | 357,403 |
| | 442,711 |
|
| NGLs (net equity gallons) | 545,666 |
| | 619,805 |
|
| Condensate (net equity gallons) | 49,523 |
| | 69,219 |
|
| Natural gas short position (MMbtu/d)(a) | 1,698 |
| | 3,753 |
|
_______________________
| |
| (a) | Includes sales of natural gas of $47 to the Upstream Segment for the year ended December 31, 2010. |
| |
| (b) | Gathering volumes (Mcf/d) and natural gas short position (MMbtu/d) are calculated by taking the total volume and then dividing by the number of days in the respective period. |
Revenue and Cost of Natural Gas and Natural Gas Liquids. During the year ended December 31, 2010 the East Texas and Other Midstream Segment contributed revenues minus cost of natural gas and natural gas liquids of $63.4 million as compared to $58.5 million for the year ended December 31, 2009. During the year ended December 31, 2010 and 2009, we recorded revenues associated with deficiency payments of $10.4 million and $1.1 million, respectively, from certain of our producers. We receive deficiency payments under certain of our gathering contracts when delivered volumes fail to meet certain thresholds. These amounts are included within gathering and treating services revenue. Excluding these deficiency payments, revenues minus cost of natural gas and NGLs for the year ended December 31, 2010 and 2009 would have been $53.0 million and $57.4 million, respectively. The decrease for the year ended December 31, 2010 compared to the year ended December 31, 2009, excluding the impact of the deficiency payments, is primarily due to a decrease in gathering and equity volumes and lower NGL prices, partially offset by higher condensate and natural gas prices. In addition, during the first two months of 2009, we elected to not recover the ethane component in the natural gas stream in our plants and instead chose to leave the ethane component in the residue gas stream sold at the tailgate of our plants. We operate in this manner when the value of ethane is worth more in the gas stream than as a liquid.
Our gathering volumes on our ETML system and certain other East Texas/Louisiana systems for the year ended December 31, 2010 decreased as compared to the year ended December 31, 2009, due to natural declines in the production of
the existing wells and to reduced drilling activity in lean gas formations as a result of the continued depressed natural gas price environment. Our Brookeland and associated systems have seen a modest rebound in gathered volumes beginning in the fourth quarter of 2010. During the second half of 2010, we saw an increase in drilling activity by our producer customers as NGL prices increased dramatically as a result of the improved demand in the United States for NGL' by the petrochemical industry. Given the improvements in horizontal drilling technology and fracturing practices, our producer customers are active in the development of the Austin Chalk play. We have an extensive gathering footprint in the Austin Chalk play and we believe we have sufficient processing capacity today to accommodate increasing liquids rich natural gas volumes. We began to see the benefit of this increased drilling activity during the fourth quarter of 2010, as we saw volumes increasing through our gathering and processing facilities. These increases were somewhat slowed as some of our producer customers encountered delays due to permitting or water production issues. We expect this improving drilling environment to carry into 2011.
Our gathered volumes in the South Texas region decreased in 2010 compared to 2009. This decrease is due to natural declines from existing wells and to the loss of a significant producer during the third quarter of 2010. The reduction of natural gas prices throughout 2001, the low liquid content of the natural gas from the existing reservoirs that we gather and our lack of processing capabilities have negatively impacted the drilling activity around our assets in South Texas. As natural gas prices level or recover from the current levels, we expect to see improving natural gas volumes in the future. At this point we are unable to predict when we will see increasing natural gas volumes through our gathering systems in South Texas.
The reduction in volumes in the Gulf of Mexico region is due to natural declines in the underlying existing wells, reduced drilling activity during 2010 and 2009, on account of workovers and new shallow water drilling being generally reduced due to permitting delays by the federal government, and an adjustment downward in our ownership percentage at the North Terrebonne Plant. Our ownership percentage in North Terrebonne and Yscloskey adjusts up or down annually based upon our volume of gas from committed leases as compared to the total volumes of gas from all plant owners committed leases. Our ownership in Yscloskey decreased from 13.78% to 11.45% in 2010. Our ownership in North Terrebonne Plant decreased to 1.67% in 2010 from 5.16% for 2009 but increased in January 2011 to 2.63%.
During the year ended December 31, 2009, we also recorded other revenue of approximately $1.6 million from business interruption insurance related to damages caused by Hurricanes Gustav and Ike.
Operating Expenses. Operating expenses for the year ended December 31, 2010 decreased $0.9 million as compared to the year ended December 31, 2009. The decrease was primarily as a result of operating the gathering systems at lower volumes.
Depreciation and Amortization. Depreciation and amortization expenses for the year ended December 31, 2010 as compared to the year ended December 31, 2009 increased $1.2 million. The major items impacting the increase were (i) depreciation expense associated with the capital expenditures placed into service and (ii) an acceleration of the amortization related to certain intangibles (e.g., rights-of-ways) due to the cancellation of the ETML expansion project. These increases were offset by an adjustment of $0.9 million recorded during the three months ended June 30, 2009 to correct an overstatement of depreciation expense in a prior period.
Impairment. During the year ended December 31, 2010, we incurred impairment charges of $3.1 million in the South Texas region due to the termination of a significant gathering contract in the third quarter. During the year ended December 31, 2009, we incurred impairment charges of $13.7 million in pipeline assets as a result of reduced throughput volumes as our producer customers curtailed their drilling activity in response to lower natural gas prices
Capital Expenditures. Capital expenditures for the year ended December 31, 2010 decreased $2.6 million compared to the year ended December 31, 2009 due primarily to our overall lower capital spending on account of the reduced drilling activity of our producer customers.
Discontinued Operations. On April 1, 2009, we sold our producer services line of business, and thus have retrospectively classified the revenues minus the cost of natural gas and NGLs as discontinued operations. During the year ended December 31, 2010, this business generated revenues of $0.1 million, as compared to revenues of $19.2 million and cost of natural gas and natural gas liquids of $18.9 million during the year ended December 31, 2009.
On May 20, 2011, we sold the Wildhorse Gathering System and have retrospectively classified the operations as discontinued. For the year ended December 31, 2010, we generated revenues of $26.1 million and a loss from operations of $25.9 million, which includes an impairment charge of $26.2 million, attributable to the Wildhorse Gathering System. For the year ended December 31, 2009, we generated revenues of $21.8 million and income from operations of $0.2 million. During the year ended December 31, 2010, we recorded a loss from discontinued operations of $25.9 million attributable to the
Wildhorse Gathering System. During the year ended December 31, 2010, we recorded a loss from discontinued operations of $25.9 million. During the years ended December 31, 2010 and 2009, this system incurred state tax expense of less than $0.1 million.
Upstream Segment
|
| | | | | | | |
| | Year Ended December 31, |
| | 2010 | | 2009 |
| | (Amounts in thousands, except volumes and realized prices) |
| Revenues: | | | |
| Oil and condensate (a) | $ | 44,444 |
| | $ | 35,316 |
|
| Intersegment sales - condensate | 6,063 |
| | — |
|
| Natural gas (b) | 15,027 |
| | 12,021 |
|
| NGLs (c) | 19,973 |
| | 16,057 |
|
| Sulfur (d) | 6,793 |
| | — |
|
| Other | 2,435 |
| | 239 |
|
| Total revenues | 94,735 |
| | 63,633 |
|
| Operating Costs and expenses: |
| |
|
|
| Operations and maintenance (e) | 32,042 |
| | 26,336 |
|
| Sulfur disposal costs | 729 |
| | 2,200 |
|
| Other operating income | — |
| | (3,552 | ) |
| Depletion, depreciation and amortization | 30,424 |
| | 34,009 |
|
| Impairment | 3,536 |
| | 8,114 |
|
| Total operating costs and expenses | 66,731 |
| | 67,107 |
|
| Operating income (loss) | $ | 28,004 |
| | $ | (3,474 | ) |
| | | | |
| Capital expenditures | $ | 26,772 |
| | $ | 8,437 |
|
| |
| |
|
|
| Realized average prices (f): |
| |
|
|
| Oil and condensate (per Bbl) | $ | 62.35 |
| | $ | 45.30 |
|
| Natural gas (per Mcf) | $ | 4.43 |
| | $ | 3.69 |
|
| NGLs (per Bbl) | $ | 47.00 |
| | $ | 31.90 |
|
| Sulfur (per Long ton) (f) | $ | 88.36 |
| | — |
|
| Production volumes: |
| |
|
|
| Oil and condensate (Bbl) | 808,077 |
| | 811,075 |
|
| Natural gas (Mcf) | 3,514,078 |
| | 3,659,431 |
|
| NGLs (Bbl) | 437,375 |
| | 504,669 |
|
| Total (Mcfe) | 10,986,790 |
| | 11,553,895 |
|
| Sulfur (Long ton) (h) | 84,065 |
| | 119,812 |
|
________________________
| |
| (a) | Revenues include a change in the value of product imbalances by $(102) and $(260) for the year ended December 31, 2010 and 2009, respectively. |
| |
| (b) | Revenues include a change in the value of product imbalances by $430 and $(1,273)for the year ended December 31, 2010 and 2009, respectively. |
| |
| (c) | Revenues include a change in the value of product imbalances by $370 and $28 for the year ended December 31, 2010 and 2009, respectively. |
| |
| (d) | Revenues include a change in the value of product imbalances by $48 for year ended December 31, 2010. |
| |
| (e) | Includes purchases of natural gas of $47 from the East Texas and Other Midstream Segment for the year ended December 31, 2010. |
| |
| (f) | During year ended December 31, 2010, an adjustment was made to decrease sulfur volumes by 5,230 long tons related to a prior period. This adjustment is excluded from the calculation of realized prices. |
| |
| (g) | Calculation does not include impact of product imbalances. In addition, volumes and realized price for the year ended December 31, 2009 and the three months ended March 31, 2010 have been revised from prior period reported amounts due to a reallocation of historical production results based on more accurate well tests of our Alabama properties. |
Revenue. For the year ended December 31, 2010, Upstream Segment revenues increased by $31.1 million, as compared to the year ended December 31, 2009. The increase in revenue was due to higher realized prices for oil, natural gas,
NGLs and sulfur during year ended December 31, 2010 compared to the year ended December 31, 2009. This increase was partially offset by the shut-in of our East Texas production beginning August 11, 2010 (see further discussion of the shut-in below) and the turnarounds at our Big Escambia Creek and Flomaton facilities during the year ended December 31, 2010, as discussed below.
During late April and early May 2010, we completed a scheduled turnaround (i.e., a complete shutdown of the facility to perform certain standard plant repairs and routine inspections of equipment) of our Big Escambia Creek facility in Southern Alabama. During the plant turnaround, all wells in the Big Escambia Creek field were shut-in. The duration of both the plant turnaround and the well shut-in was approximately 12 days. The negative impact to our production during this period was a loss of approximately 48 MMcf of residue gas, 14 MBbls of oil, 8.7 MBbls of plant liquids and 2,000 long tons of sulfur. The
revenue impact of the loss in production was approximately $1.8 million during the year ended December 31, 2010. In addition, during the year ended December 31, 2010, we completed a reallocation of historical production results based on more accurate tests and product analyses for our Big Escambia Creek wells for the period from August 2007 through March 2010. As a result of this reallocation of historical production, our revenues for the year ended December 31, 2010 were negatively impacted by $1.3 million.
In August 2010, we announced that our East Texas oil and natural gas production was temporarily shut-in due to an unscheduled shutdown of the Eustace processing facility owned and operated by a third-party. The shutdown involved replacing all of the tubes in the reaction furnace's waste heat recovery unit, replacing the catalyst in the sulfur recovery unit and other equipment repairs. The operator originally estimated that the shutdown would take 30 to 45 days to complete. Subsequently, we were informed by the operator that more extensive repairs would be required and that the shutdown would last through mid-November of 2010. This estimate was later revised to late December 2010 and again to late-February 2011. As of March 10, 2011, the third-party operator was in the process of returning the facility to service. We estimate that the shut-in negatively impacted our 2010 net revenues by approximately $7.1 million (excluding recoveries) and assuming the latest estimate holds, we expect that our 2011 net revenues will be negatively impacted by approximately $3.4 million (excluding potential recoveries). We maintain business interruption insurance and are pursuing recovery of the lost net revenue above our 30-day deductible. As of December 31, 2010, we have recognized $3.0 million related to our business interruption insurance claim in other revenue. The maximum recovery under our business interruption insurance policy for this named facility is $5.0 million for each claimed event.
During the year ended December 31, 2010, sulfur revenue was $6.8 million. During the year ended December 31, 2009, however, sulfur prices were sufficiently low that we experienced costs to dispose of sulfur which exceeded their sales revenues by $2.2 million. In addition, during the year ended December 31, 2010, we recorded sulfur disposal costs of $0.7 million to adjust for a shortfall in a prior period accrual of sulfur disposal costs. Historically, sulfur was viewed as a low value byproduct in the production of oil and natural gas. During the year ended December 31, 2010, we saw a recovery in sulfur prices, with prices ranging from $90 per long ton on February 10, 2010 to $185 per long ton on February 12, 2011 at the Tampa, Florida market. Our net realized price will always be lower than the price set at the Tampa, Florida hub due to transportation and marketing deductions and charges. These charges vary depending on the distance our product is produced from the Tampa, Florida market.
Operating Expenses. Operating expenses, including severance and ad valorem taxes, increased by $5.7 million for the year ended December 31, 2010, as compared to the year ended December 31, 2009. The increase in operating expense for the year ended December 31, 2010, as compared to the same period in the prior year can be attributed increased well workovers in our Alabama operations and to $2.3 million of expenses related to the turnarounds at our facilities at Big Escambia Creek and Flomaton, as discussed above. In addition, during the year ended December 31, 2010, we recorded a reversal of $0.6 million of operating costs due to the reallocation of historical production for our Big Escambia Creek wells, as discussed above. During the year ended December 31, 2009, operating expenses were reduced due to the reversal of $1.6 million of environmental reserves determined to no longer be necessary and receipt of a $0.7 million credit for overbillings related to a non-operated asset. Also, during the year ended December 31, 2010, our severance taxes increased due to (i) the increase in revenue from the same periods in the prior year and (ii) additional severance taxes as a result of the reallocation of historical production discussed above. This increase for the year ended December 31, 2010 was offset by a refund of severance taxes from the state of Alabama for overpayment in prior periods.
Depletion, Depreciation and Amortization. Depletion, depreciation and amortization expense decreased by $3.6 million for the year ended December 31, 2010, as compared to the same period in the prior year. The decrease for the year ended December 31, 2010, as compared to the comparable period in 2009 is due to decreases in production as a result of our East Texas wells being shut-in, as discussed above.
Other Operating Income. Other operating income for the year ended December 31, 2009, includes the recovery of
$2.2 million of assets previously written off and the release of $1.4 million of liabilities assumed as part of our purchase price allocation for our acquisitions of Escambia Asset Co. LLC and Redman Energy Holdings, L.P. During the period, we received additional information about collectability of the referenced assets which enabled us to recover on them and we determined that we no longer had any obligation under the referenced liabilities which enabled us to release them.
Impairment. Impairment charges of $3.5 million incurred during the year ended December 31, 2010 of which (i) $3.4 million related to certain fields in our unproved properties we determined it would not be technologically feasible to develop these unproved locations and (ii) $0.1 million related to proved properties due to adjustments to our reserves. During the year ended December 31, 2009, we incurred impairment charges of $8.1 million of which (i) $7.9 million was a result of a decline in natural gas prices, production declines and lower natural gas liquids yields at our Flomaton field and (ii) $0.2 million in other fields due to lower natural gas prices.
Capital Expenditures. Capital expenditures increased by $18.3 million for the year ended December 31, 2010, as compared to the year ended December 31, 2009. The increase in capital expenditures is due to drilling activity in our Permian and Alabama operations, recompletions in our Jourdanton and Edgewood fields, leasing in our Edgewood and Flomaton fields, and the acquisition of compression equipment for the turnaround at our Big Escambia Creek facility, as discussed above. The two new compressors will provide improved reliability and backup for the existing residue gas and plant inlet compression. The new backup compression was placed in service in November 2010. During the year ended December 31, 2010, we drilled and completed five wells in our Permian operations. As of December 31, 2010, we were in the process of drilling one additional well in our Big Escambia Creek field.
Corporate and Other Segment
|
| | | | | | | |
| | Year Ended December 31, |
| | 2010 | | 2009 |
| | ($ in thousands) |
| Revenues: | | | |
| Realized commodity derivatives (losses) gains | $ | (17,010 | ) | | $ | 83,300 |
|
| Unrealized commodity derivatives gains (losses) | 8,224 |
| | (189,590 | ) |
| Intersegment elimination - Sales of natural gas, oil and condensate | (6,063 | ) | | — |
|
| Total revenues | (14,849 | ) | | (106,290 | ) |
| Intersegment elimination - Cost of oil and condensate | (5,587 | ) | | — |
|
| General and administrative | 45,775 |
| | 45,819 |
|
| Intersegment elimination - Operations and maintenance | (47 | ) | | — |
|
| Depreciation and amortization | 1,550 |
| | 1,073 |
|
| Operating loss | (56,540 | ) | | (153,182 | ) |
| Other income (expense): | |
| | |
|
| Interest income | 111 |
| | 187 |
|
| Interest expense | (15,147 | ) | | (21,591 | ) |
| Unrealized interest rate derivative (losses) gains | (7,164 | ) | | 12,529 |
|
| Realized interest rate derivative losses | (19,971 | ) | | (18,876 | ) |
| Other expense | 450 |
| | (136 | ) |
| Total other income (expense) | (41,721 | ) | | (27,887 | ) |
| Loss from continuing operations before taxes | (98,261 | ) | | (181,069 | ) |
| Income tax (benefit) provision | (2,585 | ) | | 989 |
|
| Loss from continuing operations | (95,676 | ) | | (182,058 | ) |
| Discontinued operations, net of tax | 43,043 |
| | 9,074 |
|
| Segment loss | $ | (52,633 | ) | | $ | (172,984 | ) |
Revenue. Our Corporate and Other Segment's revenue consists of our intersegment eliminations, see further discussion below, and our commodity derivatives activity. Our commodity hedging activities impact our Corporate segment revenues through (i) the unrealized, non-cash, mark-to-market of our commodity derivatives scheduled to settle in future periods; and (ii) the realized gains or losses on our commodity derivatives settled in the indicated period. Our unrealized commodity gains and losses reflect (i) the change in the mark-to-market value of our derivative position from the beginning of a period to the end and (ii) the amortization of put premiums and other derivative costs. In general, the change in the mark-to-market value of our derivative
position may be due to several factors including the settlement of derivative instruments during the period, the addition of new derivative positions during the period, changes in the forward curves of the underlying commodities from the beginning to the end of the period, changes in interest rates used in the mark to market calculations from the beginning to the end of the period, and the passage of time during the period.
During the year ended December 31, 2010, we experienced an unrealized gain on our commodity derivative portfolio due the difference in value between the contracts that settled and the new contracts added to our portfolio and decreases in the natural gas forward curve, offset by increases in the crude oil and natural gas liquids forward curves. This compares to the year ended December 31, 2009 during which we experienced an unrealized loss on our commodity derivative portfolio due to increases in the crude oil and natural gas liquids forward curves, partially offset by a decline in the natural gas forward curve. Included with our unrealized commodity derivative gains (losses) are the amortization of put premiums and other derivative costs, including the costs of hedge resets, of $4.0 million and $48.4 million for the years ended December 31, 2010 and 2009, respectively. The unrealized commodity derivative gains (losses), including the amortization of put premiums and other derivative costs, for the years ended December 31, 2010 and 2009, had no impact on cash activities for those periods and are excluded from our calculation of Adjusted EBITDA.
We recognized realized commodity derivative losses during the year ended December 31, 2010, as compared to realized commodity gains for the year ended December 31, 2009, primarily due to lower strike prices on our derivatives that settled during the year ended December 31, 2010 as a result of our hedging strategy in which we entered into hedges with strike prices above market during the year ended December 31, 2009, in addition to higher index prices for crude and NGLs in the year ended December 31, 2010 as compared to the year ended December 31, 2009.
Given the uncertainty surrounding future commodity prices, and the general inability to predict future commodity prices as they relate to the strike prices at which we have hedged our exposure, it is difficult to predict the magnitude and impact that marking our hedges to market will have on our income from operations in future periods.
Intersegment Eliminations. During the year ended December 31, 2010, our South Texas Segment within our Midstream Business began selling natural gas to our Upstream Segment to be used as fuel, and our Upstream Segment began selling oil and condensate to the marketing group within our Midstream Business for resale. We have included the eliminations of these transactions within our Corporate Segment.
General and Administrative Expenses. General and administrative expenses decreased by less than $0.1 million for the year ended December 31, 2010 as compared to the same period in 2009. During the year ended December 31, 2010, our salary and benefit expense, excluding equity based compensation, increased by $3.5 million. This increase was primarily the result of increased headcount in accounting, back-office, engineering, land and operations-related corporate personnel and due to increased health insurance costs. This increase was offset by a decrease in equity-based compensation expense of approximately $1.3 million during the year ended December 31, 2010, as compared to the year ended December 31, 2009. This decrease was primarily the result of natural run-off (through vesting) of restricted common units granted in prior periods at higher prices. In addition, equity based compensation during the years ended December 31, 2010 and 2009 included an allocation of expense of $0.1 million and $0.4 million, respectively, from Holdings on account of Holdings's issuance of incentive interests to certain of our executives. The increase in overall compensation and benefit was partially offset by a reduction of our allowance for bad debts. Also, due to the increase in headcount, we were able to reduce our contract labor and other professional services expenses by approximately $1.3 million during the year ended December 31, 2010, as compared to the year ended December 31, 2009. In addition, included within our general and administrative expenses for the year ended December 31, 2010 and 2009 are non-capitalizable legal and other professional advisory fees of $2.1 million and $0.7 million, respectively, related to the Recapitalization and Related Transactions and the related lawsuit.
At the present time, we do not allocate our general and administrative expenses cost to our operational segments. The Corporate Segment bears the entire amount.
Total Other Expense. Total other expense primarily consists of both realized and unrealized gains and losses from our interest rate swaps and interest expense related to our senior secured credit facility. During 2010, our realized settlements decreased by about $1.1 million, as compared to 2009, as a result of lower LIBOR rates in 2010. For the year ended December 31, 2010, we recognized an unrealized loss of $7.2 million, as compared to an unrealized gain of $12.5 million during the same period in 2009, as a result of a decrease to the forward interest rate curves. These unrealized mark-to-market losses did not have any impact on cash activities for the period, and are excluded by definition from our calculation of Adjusted EBITDA.
Interest expense decreased by $6.4 million during the year ended December 31, 2010, as compared to the same period
in the prior year. Interest expense is shown before the impact of our interest rate derivatives, which convert a portion of our outstanding debt from variable-rate interest obligations to fixed-rate interest obligations. All of our outstanding debt consists of borrowings under our revolving credit facility, which bears interest primarily based on a LIBOR rate plus the applicable margin. The decrease in interest expense is due to lower LIBOR rates during 2010, as compared to the same period in 2009, and lower outstanding debt balances as a result of our efforts to pay down debt over the past 21 months.
Income Tax (Benefit) Provision. Income tax provision for the 2010 and 2009 relates to (i) state taxes due by us and (ii) federal taxes due by Eagle Rock Energy Acquisition Co., Inc. (acquiring entity of certain entities acquired in the acquisition of Redman Energy Corporation “Redman Acquisition” in 2008) and Eagle Rock Energy Acquisition Co. II, Inc. (acquiring entity of certain entities acquired in the Stanolind Acquisition) and their wholly-owned corporations, Eagle Rock Upstream Development Company, Inc. (successor entity to certain entities acquired in the Redman acquisition) and Eagle Rock Upstream Development Company II, Inc. (successor entity to certain entities acquired in the Stanolind acquisition), which are subject to federal income taxes (the “C Corporations”). During 2010, our tax provision decreased by $3.6 million as compared to the same periods in the prior year, primarily due to the reduction of the deferred tax liabilities created by the book/tax differences as a result of the federal income taxes associated with the Redman and Stanolind Acquisitions, receipt of state tax refunds and true-ups related to our prior year provision. For further discussion of our income tax (benefit) provision, see Note 15 to our consolidated financial statements included in Part II, Item 8. Financial Statements and Supplementary Data staring on page F-1 of this Annual Report.
Discontinued Operations. On May 24, 2010, we completed the sale of our Minerals Business. We recorded a gain of $37.7 million on the sale, which is recorded as part of discontinued operations for the year ended December 31, 2010. Further upward or downward adjustments to the purchase price may occur post-closing to reflect customary true-ups. Subsequent to the sale, we received payments of $0.3 million related to pre-effective date operations and have recorded this amount as part of discontinued operations for the period. For the year ended December 31, 2010, we generated revenues of $8.9 million and income from operations of $5.5 million. For the year ended December 31, 2009, we generated revenues of $15.7 million and income from operations of $7.8 million. During the years ended December 31, 2010 and 2009, the Partnership incurred state tax expense on discontinued operations of $0.4 million and $0.2 million, respectively. During the years ended December 31, 2010 and 2009, we recorded income to discontinued operations, excluding the gain recognized by us on the sale of the Minerals Business, of $5.4 million and $9.1 million, respectively.
Adjusted EBITDA
Adjusted EBITDA, as defined under Part II, Item 6. Selected Financial Data - Non-GAAP Financial Measures, decreased by $46.6 million from $172.6 million for the year ended December 31, 2009 to $126.0 million for the year ended December 31, 2010.
As described above, revenues minus cost of natural gas and NGLs for the Midstream Business (excluding unrealized gains from the Marketing and Trading Segment) increased by $38.6 million during the year ended December 31, 2010, as compared to the comparable period in 2009. The Upstream Segment revenues increased $28.9 million during the year ended December 31, 2010, as compared to the comparable period in 2009. Intersegment eliminations revenues minus cost of natural gas and natural gas liquids resulted in a $0.4 million decrease. Our Corporate Segment's realized commodity derivatives gain decreased by $100.3 million during the year ended December 31, 2010 as compared to the comparable period in 2009. This resulted in total incremental revenues minus cost of natural gas and natural gas liquids decreasing by $33.3 million during the year ended December 31, 2010 as compared to the comparable period in 2009. The incremental revenue amounts are adjusted to exclude the impact of unrealized commodity derivatives, which includes the amortization of put premiums and other derivative costs, and the non-cash mark-to-market Upstream Segment imbalances, none of which are included in the calculation of Adjusted EBITDA.
Operating expenses (including taxes other than income) for our Midstream Business increased by $2.2 million for the year ended December 31, 2010, as compared to the same period in 2009, while operating expenses (including taxes other than income) for the Upstream Segment increased $4.2 million for the year ended December 31, 2010, as compared to the comparable period in 2009.
General and administrative expense, excluding the impact of non-cash compensation charges related to our long-term incentive program, Holding's Tier I incentive units and other non-recurring items and captured within our Corporate Segment, increased during the year ended December 31, 2010 by $1.2 million, as compared to the respective period in 2009.
As a result, revenues (excluding the impact of unrealized commodity derivative activity) minus cost of natural gas and natural gas liquids for the year ended December 31, 2010, as compared to the same period in 2009 decreased by $33.3 million,
operating expenses increased by $6.2 million and general and administrative expenses increased by $1.2 million. The decreases in revenues minus the cost of natural gas and natural gas liquids, the decreases in operating costs offset by the increase in general and administrative expenses resulted in a decrease to Adjusted EBITDA during the year ended December 31, 2010, as compared to the year ended December 31, 2009. Adjusted EBITDA excludes amortization of commodity hedge costs (including costs of hedge reset transactions) for the years ended December 31, 2010 and 2009 of $4.0 million and $48.4 million, respectively. Including these amortization costs, our Adjusted EBITDA for the years ended December 31, 2010 and 2009 would have been $122.1 million and $124.2 million, respectively.
LIQUIDITY AND CAPITAL RESOURCES
Historically, our sources of liquidity have included cash generated from operations, issuances of equity and debt securities and borrowings under our revolving credit facility. Our primary cash requirements have included general and administrative expenses, operating expenses, maintenance and growth capital expenditures, short-term working capital needs, interest payments on our outstanding debt, distributions to our unitholders and acquisitions of new assets or businesses. In 2010, we raised additional liquidity through a series of transactions that included the sale of our Minerals Business for approximately $171.6 million and a rights offering through which we received net proceeds of approximately $53.9 million. As part of the rights offering, we issued approximately 21.6 million warrants entitling holders to purchase a common unit of Eagle Rock for a price of $6.00 on certain designated exercise dates through May 2012. During the year ended December 31, 2011, 14,957,540 warrants were exercised for which we received proceeds of $89.7 million. A total of approximately 5,707,705 warrants remained outstanding as of December 31, 2011.
On May 27, 2011, we completed the sale of $300 million of our 8 3/8% senior unsecured notes (the "Senior Notes") through a private placement. The Senior Notes will mature on June 1, 2019, and interest is payable on June 1 and December 1 each year, commencing December 1, 2011. We used the net proceeds of approximately $290.3 million to repay borrowings outstanding under our revolving credit facility. For a further discussion of our Senior Notes, see Note 8 to our consolidated financial statements included in Part II, Item 8. Financial Statements and Supplementary Data starting on page F-1 of this Annual Report.
We believe that our historical sources of liquidity, including additional proceeds from warrant exercises, will be sufficient to satisfy our short-term liquidity needs and to fund our committed capital expenditures for at least the next twelve months. Our growth strategy entails substantial expenditures on organic projects in our Midstream Business and new drilling activity in our Upstream Business. We also intend to continue to pursue attractive development and acquisition opportunities in the midstream and upstream sectors. Accordingly, we may utilize various available financing sources, including the issuance of equity or debt securities, to fund all or a portion of our organic growth expenditures and potential acquisitions. Our ability to complete future offerings of equity or debt securities and the timing of these offerings will depend upon various factors including prevailing market conditions and our financial condition.
Capital Expenditures
The energy business can be capital intensive, requiring significant investment for the acquisition or development of new facilities. We categorize our capital expenditures as (and, as necessary, allocate the attributable portion of our capital expenditures between) either:
| |
| • | growth capital expenditures, which are made to (i) acquire, construct, expand or upgrade our gathering, processing and treating assets or (ii) grow our natural gas, NGL, crude or sulfur production; or |
| |
| • | maintenance capital expenditures, which are made to (i) replace partially or fully depreciated assets, meet regulatory requirements, or maintain the existing operating capacity of our gathering, processing and treating assets or (ii) maintain our natural gas, NGL, crude or sulfur production. |
The primary impact of this categorization is that we reduce the amount of cash we consider available for distribution by the amount of our maintenance capital expenditures.
Our current 2012 capital budget anticipates that we will spend approximately $280 million in total in 2012. Our capital expenditures, excluding acquisitions, were approximately $179.2 million for the year ended December 31, 2011, of which $40.9 million related to maintenance capital expenditures and $138.2 million related to growth capital expenditures.
We expect our capital expenditures to increase in response to environmental compliance associated with sulfur dioxide (SO2) emissions. We have certain permit obligations to lower our SO2 emissions at our Alabama plant operations.
Additionally, in mid-2010, the Environmental Protection Agency (“EPA”) enacted new National Ambient Air Quality Standards (“2010 NAAQS”) which substantially lowered the emissions limits for SO2 and mandated timelines for compliance. In order to fulfill our permit obligations, comply with the new 2010 NAAQS requirements, and replace and upgrade certain aging assets in the our Alabama facilities, we expect to spend approximately $50 million over the next couple of years to enhance the SO2 recovery capabilities at our Alabama operations. The expected facility upgrades to our Alabama operations should not only increase the marketable sulfur recovered from the inlet gas stream, but also are anticipated to reduce plant fuel consumption, improve the plant's operating reliability and extend the plant's operating life. Management does not anticipate, however, that the required spending will generate returns consistent with our internal rate of return thresholds for discretionary capital investment. At this time, management has identified no other operational areas impacted by the 2010 NAAQS.
Management expects a substantial percentage of the total capital invested to achieve the SO2 emissions standard at our Alabama operations will be classified as maintenance capital, and therefore will reduce the amount of distributable cash flow we recognize in the periods in which the capital is spent.
Distribution Policy
Our distribution policy is to distribute to our unitholders, on a quarterly basis, all of our available cash in the manner described below and as further described in our partnership agreement. Available cash generally means, for any quarter ending prior to liquidation, all cash on hand at the end of that quarter less the amount of cash reserves that the general partner determines to establish to:
| |
| • | provide for the proper conduct of our business, including for future capital expenditures and credit and other needs; |
| |
| • | comply with applicable law or any partnership debt instrument or other agreement; or |
| |
| • | provide funds for distributions to unitholders and the general partner in respect of any one or more of the next four quarters. |
The actual distributions we will declare will be subject to our operating performance, prevailing market conditions (including forward oil, natural gas and sulfur prices), the impact of unforeseen events and the approval of our Board of Directors and will be done pursuant to our distribution policy.
Revolving Credit Facility
On June 22, 2011, we entered into an Amended and Restated Credit Agreement (the “Credit Agreement”) with Wells Fargo Bank, National Association, as administrative agent and swingline lender, Bank of America, N.A. and The Royal Bank of Scotland plc, as co-syndication agents, BNP Paribas, as documentation agent, and the other lenders who are parties to the Credit Agreement. The Credit Agreement amended and restated our prior $880 million Credit Agreement (the “Prior Credit Agreement”). Upon the effectiveness of the Credit Agreement, all commitments of the lenders party to the Prior Credit Agreement were terminated and all loans and other indebtedness of the Partnership under the Prior Credit Agreement were renewed and extended, inclusive of new lender commitments, on the terms and conditions of the Credit Agreement. The Credit Agreement matures on June 22, 2016.
The credit facility under the Credit Agreement consists of aggregate commitments of $675 million that may, at our request and subject to the terms and conditions of the Credit Agreement, be increased up to a total aggregate amount of $1.2 billion. Availability under the credit facility is subject to a borrowing base comprised of two components: the upstream component and the midstream component. As of December 31, 2011, our borrowing base exceeded our total commitments of $675 million, and we had approximately $193.5 million of availability under the credit facility.
Debt Covenants
At December 31, 2011, we were in compliance with our covenants under the revolving credit facility. Our interest coverage ratio, as defined in the Credit Agreement (i.e., Consolidated EBITDA divided by Consolidated Interest Expense), was 4.8 as compared to a minimum interest coverage covenant of 2.5; our leverage ratio, as defined in the Credit Agreement (i.e., Total Funded Indebtedness divided by Consolidated EBITDA), was 3.3 as compared to a maximum leverage ratio of 4.5; and our current ratio, as defined in the Credit Agreement, was 1.9 as compared to a minimum current ratio covenant of 1.0. We believe that we will remain in compliance with our financial covenants through 2012.
Our goal is to maintain our ratio of outstanding debt to Adjusted EBITDA, or “leverage ratio,” at or below 3.5 on a
sustained basis. We believe this leverage ratio level to be appropriate for our business. We expect our efforts to maintain or reduce our leverage ratio during 2011 will be primarily through investing in attractive growth opportunities that will increase our Adjusted EBITDA. We also expect our leverage ratio to benefit from any exercise of our approximately 5,707,705 warrants outstanding as of December 31, 2011, which carry an exercise price of $6.00 per common unit and expire on May 15, 2012. Proceeds to us from the remaining warrants, if exercised in full, would total approximately $34 million. It is our intention to use future proceeds from warrants being exercised, if any, to pay for general partnership purposes, including to pay down borrowings outstanding under our revolving credit facility, absent any organic growth or acquisition opportunities.
Our senior notes are issued under an indenture that contains certain covenants limiting our ability to, among others, pay distributions, repurchase our equity securities, make certain investments, incur additional indebtedness, and sell assets. At December 31, 2011, we were in compliance with our covenants under the senior notes indenture.
For a further discussion of our Credit Agreement see Note 8 to our consolidated financial statements included in Part II, Item 8. Financial Statements and Supplementary Data starting on page F-1 of this Annual Report.
Cash Flows
Cash Distributions
With respect to the first three quarters of 2010, we declared a quarterly cash distribution of $0.025 to our general partner, only as of and for the record date associated with the first quarter, and our common unitholders (except for the restricted units granted on October 27, 2010) as of each of the three respective record dates. The total combined distribution amount was $9.3 million.
On January 27, 2011, we declared our fourth quarter 2010 cash distribution of $0.15 per unit to our common unitholders of record as of the close of business on February 7, 2011. The distribution was paid on February 14, 2011.
On April 26, 2011, we declared our first quarter 2011 cash distribution of $0.15 per unit to our common unitholders of record as of the close of business on May 9, 2011, except for the common units issued in connection with the acquisition of Crow Creek Energy on May 3, 2011 (see further discussion within "- Overview - Acquisitions"), which were not eligible to receive the first quarter 2011 distribution. This distribution was paid on May 13, 2011.
On July 27, 2011, we declared our second quarter 2011 cash distribution of $0.1875 per unit to our common unitholders of record as of the close of business on August 5, 2011. The distribution was paid on August 12, 2011.
On October 26, 2011, we declared our third quarter 2011 cash distribution of $0.20 per unit to our common unitholders of record as of the close of business on November 7, 2011, except for the restricted units granted on November 1, 2011 (see further discussion within "Overview - Subsequent Events"). The distribution was paid on November 14, 2011.
On January 26, 2012, we declared our fourth quarter 2011 cash distribution of $0.21 per unit to our common unitholders of record as of the close of business on February 7, 2012. The distribution was paid on February 14, 2012.
Working Capital
Working capital is the amount by which current assets exceed current liabilities. As of December 31, 2011, working capital was a negative $45.3 million as compared to a negative $54.2 million as of December 31, 2010.
The net increase in working capital of $8.9 million from December 31, 2010 to December 31, 2011 resulted primarily from the following factors:
| |
| • | cash balances and marketable securities decreased overall by $3.2 million; |
| |
| • | trade accounts receivable increased by $22.1 million primarily from the impact of the Crow Creek Acquisition and higher revenues due to higher crude and NGL prices; |
| |
| • | risk management net working capital balance increased by a net $40.8 million as a result of derivative contracts acquired as part of the Crow Creek Acquisition and changes in current portion of mark-to-market unrealized positions as a result of decreases to the forward crude oil, natural gas and NGL price curves; |
| |
| • | accounts payable increased by $54.1 million primarily as a result of the Crow Creek Acquisition, activities and timing of payments, including capital expenditure activities; and |
| |
| • | accrued liabilities increased by $1.8 million primarily reflecting payment of employee benefit accruals, higher interest payments and the timing of payment of unbilled expenditures related primarily to capital expenditures. |
Cash Flows for the Year Ended December 31, 2011 Compared to the Year Ended December 31, 2010
Cash Flow from Operating Activities. Cash flows from operating activities increased $23.7 million during the year ended December 31, 2011 as compared to the year ended December 31, 2010. This increase was primarily due to an increase in our results of operations from our Crow Creek Acquisition and higher commodity prices, which resulted in higher cash flows from the sale of our equity crude oil and NGLs volumes and higher cash flows from the sale of sulfur. Higher commodity prices also resulted in us realizing net settlement losses on our commodity derivatives during the year ended December 31, 2011. The increase in cash flow from operations was offset by our payment of $5.0 million to unwind an interest rate derivative contract, a payment of $4.8 million to unwind certain commodity derivative contracts and a payment of $14.6 million to adjust the strike price on certain existing commodity derivative contracts to the forward market price as of the date of the adjustment. For the year ended December 31, 2011, we paid $5.9 million to adjust the strike price on an existing commodity derivative contract to the forward market price as of the date the adjustment was executed and net payments of $2.2 million to unwind certain derivative contracts.
Cash Flows from Investing Activities. Cash flows used in investing activities for the year ended December 31, 2011 were $373.9 million as compared to cash flows provided by investing activities of $73.5 million for the year ended December 31, 2010. The key difference between periods is our net cash outlay of $220.3 million for the Crow Creek Acquisition during year ended December 31, 2011, as compared to the net proceeds of $171.7 million received from the sale of our Minerals Business during the year ended December 31, 2010. In addition, we incurred increased cash outlays of $90.4 million for capital expenditures, in particular spending related to our Phoenix-Arrington Ranch Plant Construction and Expansion, the Woodall Plant, as well as increased drilling in our Upstream Segment, partially offset by proceeds from the sale of our Wildhorse Gathering System of $5.7 million during the year ended December 31, 2011.
Cash Flows from Financing Activities. Cash flows provided by financing activities during the year ended December 31, 2011 were $252.0 million as compared to cash flows used in financing activities of $175.4 million for the year ended December 31, 2010. Key differences between periods include net repayments to our revolving credit facility of $48.5 million during the year ended December 31, 2011 as compared to net repayments of $224.4 million to our revolving credit facility during the year ended December 31, 2010. We also received $297.8 million from the sale of our Senior Notes during the year ended ended December 31, 2011. Cash outflows related to our distributions increased to $74.5 million during the year ended December 31, 2011 as compared to $7.2 million during the year ended December 31, 2010 as a result of increasing our quarterly distribution from $0.025 for the payments made in 2010 (for the fourth quarter of 2009 and the first three quarters of 2010) to $0.15 paid in the first two quarters of 2011 (for the fourth quarter of 2010 and the first quarter of 2011), $0.1875 paid in the third quarter of 2011 (for the second quarter of 2011) and the $0.20 paid in the fourth quarter of 2011 (for the third quarter 2011). We also received $89.7 million due to the exercise of warrants during the year ended December 31, 2011, as compared to $5.4 million from the exercise of warrants during the same period in 2010.
Cash Flows Year Ended December 31, 2010 Compared to Year Ended December 31, 2009
Cash Flow from Operating Activities. Cash flows from operating activities increased $16.9 million during 2010 as compared to 2009 as a result of higher commodity prices across our two businesses. These higher commodity prices resulted in higher cash flows from the sale of our equity crude oil, natural gas and NGLs volumes and higher cash flows from the sale of sulfur. Higher commodity prices also resulted in us realizing net settlement losses on our commodity derivatives during 2010, of which $1.1 million of cash received was reclassified to cash from financing activities, compared to $8.9 million of cash received being reclassified during 2009. In addition, our cash flows from operations for the year ended December 31, 2010 includes a payment of $5.9 million to adjust the strike price on an existing derivative contract and net payments of $2.2 million to unwind certain derivative contracts, compared to a payment of $19.6 million to reset certain derivative contracts and payments of $5.6 million to unwind certain derivative contracts included within cash flows from operating activities during 2009.
Cash Flows from Investing Activities. Cash flows provided by investing activities for 2010 were $73.5 million, as compared to cash flows used in investing activities of $37.3 million for 2009, primarily due to the sale of our Minerals Business. The cash inflow from the sale of our Minerals Business was offset by our acquisition of the additional working interests from Indigo Minerals, LLC and certain natural gas gathering systems from CEFS. In 2009 we did not make any
acquisitions. In addition, we increased our cash outlays for capital expenditures, in particular spending related to our Phoenix-Arrington Ranch Plant, as compared to our spending on capital expenditures in 2009.
Cash Flows from Financing Activities. Cash flows used in financing activities during 2010 as compared to 2009, increased by $102.2 million. Key differences between periods include net repayments to our revolving credit facility of $244.4 million during 2010 as compared to net repayments of $45.0 million from our revolving credit facility during 2009. We used the proceeds received from the sale of our Minerals Business and the proceeds received from our rights offering, in which we raised gross proceeds of $53.9 million, to pay down borrowings outstanding under our revolving credit facility. Cash outflows related to our distributions decreased to $7.2 million during 2010 as compared to $35.7 million during 2009 as a result of reducing our quarterly distribution to $0.025 for the payments made in 2010 (for the fourth quarter of 2009 and first three quarters of 2010) from $0.41 paid in the first quarter of 2009 (for the fourth quarter of 2008), coupled with $0.025 paid in the last three quarters of 2009 (for the first three quarters of 2009).
Hedging Strategy
We use a variety of hedging instruments such as fixed-price swaps, costless collars and put options to manage our risks related to our commodity price and interest rate exposure. At times our hedging strategy may involve adjusting strike prices of existing hedges to better reflect current market conditions or to meet other corporate objectives. In addition, we may also terminate or unwind hedges or portions of hedges when the expected future volumes do not support the level of hedges. Hedge transactions such as these impact our liquidity in that we are required to pay the present value of the difference between the hedged price and the current futures price. These transactions also increase our exposure to the counterparties through which we execute the hedges. Under this strategy, and in conjunction with the refinancing of our revolving credit facility, we novated a portfolio of calendar year 2011, 2012 and 2013 hedges from a counterparty that was not continuing as a lender under our revolving credit facility and, at a cost of $14.6 million, adjusted the strike price to reflect current market prices of several hedges. For further description of our hedging activity, see Notes 11 and 21 to our consolidated financial statements included in Part II, Item 8. Financial Statements and Supplementary Data starting on page F-1 of this Annual Report on Form 10-K.
Off-Balance Sheet Obligations.
We have no off-balance sheet transactions or obligations.
Total Contractual Obligations.
The following table summarizes our total contractual cash obligations as of December 31, 2011:
|
| | | | | | | | | | | | | | | | | | | | | | | | |
| | | Payments Due by Period |
Contractual Obligations | | Total | | 2012 | | 2013 | | 2014 | | 2015-2016 | | Thereafter |
| | | ($ in millions) |
| Revolving Credit Facility (including interest)(a) | | $ | 536,213 |
| | $ | 12,229 |
| | $ | 12,229 |
| | $ | 12,229 |
| | $ | 499,526 |
| | $ | — |
|
| Senior Notes | | 486,269 |
| | 25,125 |
| | 25,125 |
| | 25,125 |
| | 50,250 |
| | 360,644 |
|
| Operating leases | | 13,298 |
| | 5,696 |
| | 3,285 |
| | 2,291 |
| | 1,888 |
| | 138 |
|
| Purchase obligations(b) | | 7,673 |
| | 7,673 |
| | — |
| | — |
| | — |
| | — |
|
| Total contractual obligations | | $ | 1,043,453 |
| | $ | 50,723 |
| | $ | 40,639 |
| | $ | 39,645 |
| | $ | 551,664 |
| | $ | 360,782 |
|
__________________________
| |
| (a) | These amounts exclude estimates of the effect of our interest rate swap contracts on our future interest obligations. As of December 31, 2010, the fair value of our interest rate swap contracts, which expire on December 31, 2012 and June 22, 2015, totaled a liability of $24.0 million. |
| |
| (b) | Excludes physical and financial purchases of natural gas, NGLs, and other energy commodities due to the nature of both the price and volume components of such purchases, which vary on a daily or monthly basis. Additionally, we do not have contractual commitments for fixed price and/or fixed quantities of any material amount. |
Recent Accounting Pronouncements
For a recent accounting pronouncements, please see Note 3 of our consolidated financial statements included in Part II, Item 8. Financial Statements and Supplementary Data starting on page F-1 of this Annual Report on Form 10-K.
| |
| Item 7A. | Quantitative and Qualitative Disclosures About Market Risk. |
Risk and Accounting Policies
We are exposed to market risks associated with adverse changes in commodity prices, interest rates and counterparty credit. We may use financial instruments such as swaps, put and call options and other derivatives to mitigate the effects of the identified risks. Adverse effects on our cash flow from changes in crude oil, natural gas, NGL product prices or interest rates could adversely impact our ability to make distributions to our unitholders, meet debt service obligations, fund required capital expenditures, and other similar requirements. Our management has established a comprehensive review of our market risks and has developed risk management policies and procedures to monitor and manage these market risks. Our general partner is responsible for the overall approval of market risk management policies, delegation of transaction authority levels, and for the establishment of a Risk Management Committee ("RMC"). The RMC is composed of officers (including, on an ex officio basis, our chief executive officer) who receive regular briefings on positions and exposures, credit exposures and overall risk management in the context of market activities. The RMC is the entity responsible for creating and implementing a sound approach to managing our credit, commodity price and interest rate risk with respect to our budgetary exposure and stated risk tolerance. As such, the RMC’s responsibilities and authorities are to:
| |
| • | Identify sources of financial and credit risk; |
| |
| • | Establish financial risk management policies (or ensure they are developed by appropriate departments within the partnership); |
| |
| • | Develop, oversee, review, assess and implement the financial risk management processes and infrastructure; |
| |
| • | Advise on controls for risk management activities, including credit, hedging transactions and financial risk reporting; |
| |
| • | Measure and analyze our overall commodity price and interest rate risk exposure, at least quarterly; |
| |
| • | Recommend and approve derivative hedging transactions to reduce our commodity price and interest rate risk; |
| |
| • | Report quarterly to the Board of Directors on the performance of the hedge program. These reports disclose, but may not necessarily be limited to, the following: percentage of volumes and debt outstanding hedged; mark-to-market valuations of open positions; and realized hedge settlement; and |
| |
| • | Monitor and enforce the risk policy and controls for our natural gas marketing subsidiary, Eagle Rock Gas Services, LLC ("ERGS"). |
The RMC is specifically charged with the following:
| |
| • | Establishing an organizational structure for financial risk management controls; |
| |
| • | Establishing clearly-defined segregation of duties and delegations of authority related to derivatives hedging; |
| |
| • | Identifying permitted transaction and product types; and |
| |
| • | Executing derivative transactions on behalf of the Partnership. |
The Audit Committee of our Board of Directors monitors the implementation of our policy, and we have engaged an independent firm to provide additional oversight.
We have implemented a Risk Management Policy which allows management to execute hedging instruments, which may include swaps, collars, options and other derivatives, in order to reduce exposure to substantial adverse changes in the prices of commodities and in interest rates. The activities of ERGS are governed under a separate risk policy.We monitor and ensure compliance with our corporate Risk Management Policy through senior level executives in our operations, finance and legal departments. Our Risk Management Policy includes the following provisions:
1. Anti-speculation
Speculative buying and selling of commodity or interest rate products is prohibited. “Speculation” includes, but is not limited to, buying or selling commodity or financial instruments that are not necessary for meeting forecasted production, consumption, or outstanding debt service.
2. Maximum Transaction Term
The maximum term of any hedging transaction should be five (5) years, unless specifically approved by our Board of Directors.
3. Maximum Transaction Volumes
Hedged commodity volumes are not to exceed 80% of the expected production or consumption in any settlement
period, and hedged interest rates shall not exceed 100% of total outstanding indebtedness. Neither of these limitations shall be exceeded without the prior approval of the Board of Directors, which (with respect to commodity volumes) we did obtain for 2010 and 2011.
In any quarter, newly-hedged volumes (i.e., added during that quarter) shall not exceed 20% of the expected production, consumption, or indebtedness for any settlement period without the prior approval of the Board of Directors.
4. Portfolio Performance and Value Reporting
Our staff shall prepare performance reports containing an analysis of physical and financial positions of all energy price and interest rate hedge contracts for review by the Risk Management Committee and presentation to the Board of Directors. The frequency and content of performance reports shall be determined by the Risk Management Committee, but in no case will be done less frequently than quarterly.
Payment obligations in connection with our hedging transactions are secured by a first priority lien in the collateral securing our senior secured indebtedness that ranks equal in right of payment with liens granted in favor of our senior secured lenders. As long as this first priority lien is in effect, we will have no obligation to post cash, letters of credit, or other additional collateral to secure these hedges at any time even if our counterparty’s exposure to our credit increases over the term of the hedge as a result of higher commodity prices or because there has been a change in our creditworthiness.
We also have implemented a separate risk policy and controls document for ERGS to ensure appropriate identification, monitoring and control of risk relating to its trading activities. This document establishes the risk management methodologies that limit exposure and track potential changes in portfolio value. The ERGS risk policy and controls document is consistent with our corporate risk objectives, organizational structures and control environment.
See Notes 11 and 12 to our consolidated financial statements included in Part II, Item 8 Financial Statements and Supplementary Data starting on page F-1 of this Annual Report for additional discussion of our commodity hedging activities and related fair values.
We have not designated our contracts as accounting hedges based on authoritative guidance. As a result, we mark our derivatives to market with the resulting change in fair value included in our statement of operations.
We continually monitor our hedging and contract portfolio and expect to continue to adjust our hedge position as conditions warrant.
Our Board of Directors also plays an important role in our risk oversight function. The Audit Committee is primarily responsible for the oversight of: (i) the integrity of our financial statements and internal controls, (ii) our compliance with legal and regulatory requirements, (iii) our independent auditor's qualifications, independence and performance of our internal audit function, and (iv) matters related to our hedging activities, litigation/disputes and environmental issues.
See Part II, Item 7. Management's Discussion and Analysis of Financial Condition and Results of Operations —Critical Accounting Policies — Risk Management Activities and Note 11 to our consolidated financial statements included in Part II, Item 8. Financial Statements and Supplementary Data starting on page F-1 for further discussion of the accounting for our derivative contracts.
Commodity Price Risk
We are exposed to the impact of market fluctuations in the prices of crude oil, natural gas, NGLs and other commodities as a result of our gathering, processing, producing and marketing activities, which produce a naturally long position in these commodities. Our profitability and cash flow are affected by changes in prices of these commodities. These prices are impacted by changes in the supply and demand for these commodities, as well as market uncertainty and other factors beyond our control. Historically, changes in the prices of NGLs have generally correlated with changes in the price of crude oil. For a discussion of the volatility of crude oil, natural gas and NGL prices, please read “Risk Factors.”
We manage this commodity price exposure through an integrated strategy that includes management of our contract portfolio, matching sales prices of commodities with purchases, optimization of our portfolio by monitoring basis and other price differentials in our areas of operations, and the use of derivative contracts. Crude oil, natural gas and NGL prices can also indirectly affect our profitability by influencing the level of drilling activity and related opportunities for our service.
We frequently use financial derivatives (“hedges”), which may include swaps, collars and options, among others, to reduce our exposure to commodity price risk. These hedges are only intended to mitigate the risk associated with our natural physical position.
In 2011, we began conducting commodity derivative trading activities through ERGS, our natural gas marketing and trading subsidiary. ERGS's trading portfolio includes transactions that are settled through the physical delivery of the underlying product and financially settled contracts, primarily basis derivatives transacted to capture spread differentials between physical index points where transportation capacity has been subscribed. If the value of these positions change in a direction or manner that we did not anticipate or cannot manage, it could negatively impact our cash flows.
As of December 31, 2011, our commodity hedge portfolio totaled $42.8 million, which consists of assets aggregating $71.4 million less liabilities aggregating $28.6 million. For additional information, see Notes 11 and 12 of our consolidated financial statements included in Part II, Item 8. Financial Statements and Supplementary Data starting on page F-1 of this Annual Report on Form 10-K for additional discussion of our hedging activities and related fair values.
Effectiveness of Commodity Risk Management Activities
The goal of our commodity risk management activities is to reduce the impact of changing commodity prices on our ability to make future distributions to our unitholders. One way we evaluate the effectiveness of these activities is to analyze the theoretical change in our internal estimates of future Adjusted EBITDA given an assumed change in future commodity prices. Using this method, we estimate that a $10 per barrel increase in NYMEX crude oil prices, a $10 per barrel decrease in NYMEX crude oil prices and a $1 per MMbtu change in NYMEX natural gas prices would result in changes to 2012 Adjusted EBITDA of $13.2 million, $(12.6) million and $3.0 million, respectively, based on $85 per barrel and $2.75 per MMbtu commodity prices.
Users of this information should be aware that these estimates rely on a large number of assumptions that may ultimately prove to be false. These assumptions include, but are not limited to, future production rates, future volumes delivered to our plants and systems, future costs and other economic conditions, and future relationships between crude oil prices and natural gas liquids prices.
Interest Rate Risk
We are exposed to variable interest rate risk as a result of borrowings under our existing credit agreement. To mitigate its interest rate risk, we have entered into various interest rate swaps. These swaps convert the variable-rate term loan into a fixed-rate obligation. The purpose of entering into these swaps is to eliminate interest rate variability by converting LIBOR-based variable-rate payments to fixed-rate payments. Amounts received or paid under these swaps were recorded as reductions or increases in interest expense.
On March 30, 2009, we amended all of our existing interest rate swaps to change the interest rate received from three month LIBOR to one month LIBOR through January 9, 2011. During this time period, the fixed rate to be paid by us was reduced, on average, by 20 basis points. After January 9, 2011, the interest rate received by us changed back to three month LIBOR and the fixed rate we pay reverted back to the original rate and will remain at that rate through the end of swap maturities in 2012.
Based upon the transactions discussed in the paragraph above, we estimate that for 2012, a 10% increase or decrease in the current LIBOR rates would impact our interest expense by $0.1 million.
See Notes 11 and 12 of our consolidated financial statements included in Part II, Item 8. Financial Statements and Supplementary Data starting on page F-1 of this Annual Report on Form 10-K for additional discussion of our interest rate hedging activities and related fair values.
The table below summarizes the changes in commodity and interest rate risk management assets for the applicable periods:
|
| | | | | | | |
| | Year Ended |
| | December 31,
2011 | | December 31,
2010 |
| | ($ in thousands) |
| Net risk management assets at beginning of period | $ | (69,280 | ) | | $ | (78,476 | ) |
| Investment premium payments (amortization), net | — |
| | (3,957 | ) |
| Contracts acquired through acquisitions | 3,355 |
| | — |
|
| Cash paid (received) to terminate contracts, net | 25,510 |
| | 8,136 |
|
| Cash received (paid) from settled contracts | (37,362 | ) | | (36,981 | ) |
| Settlements of positions | 37,362 |
| | 36,981 |
|
| Unrealized mark-to-market valuations of positions | 59,243 |
| | 5,017 |
|
| Balance of risk management assets at end of period | $ | 18,828 |
| | $ | (69,280 | ) |
Credit Risk
Our principal natural gas sales customers are large gas marketing companies that, in turn, typically sell to large end users such as local distribution companies and electrical utilities. With respect to the sale of our NGLs and condensates, our principle customers are large natural gas liquids purchasers, fractionators and marketers, and large condensate aggregators that then typically sell to large multi-national petrochemical and refining companies. We also sell a small amount of propane to medium sized, local distributors.
For the year ended December 31, 2011, ONEOK, Inc. and Chevron Corporation, our largest customers, represented 28% and 11%, respectively, of our total sales revenue (including realized and unrealized gains on commodity derivatives). All of our natural gas sales are under 30 day payment term deals, with credit based upon 60 days of deliveries and almost all other product sales contracts are under 30 day payment term arrangements.
This concentration of credit risk may affect our overall credit risk in that these customers may be similarly affected by changes in the natural gas, natural gas liquids, petrochemical and other segments of the energy industry, the economy in general, the regulatory environment and other factors.
In evaluating credit risk exposure we analyze the financial condition of each counterparty before entering into an agreement. Our corporate credit policy lists the resource materials and information required to assess the financial condition of each prospective customer. The credit threshold for each customer is also based upon a time horizon for exposure, which is typically 60 days or less. We establish these credit limits and monitor and adjust them on an ongoing basis. We also require counterparties to provide letters of credit or other collateral financial agreements for exposure in excess of the established threshold. All of our sales agreements contain adequate assurance provisions to permit us to mitigate or eliminate future credit risk, at our sole discretion, by suspending deliveries until obligations and payments are satisfied or by canceling the agreement.
Our derivative counterparties include BNP Paribas, Wells Fargo Bank, National Association, Comerica Bank, Bank of Nova Scotia, The Royal Bank of Scotland plc, Bank of America N.A., J Aron and Company (an affiliate of Goldman Sachs), ING Capital Markets LLC and BBVA Compass Bank.
| |
| Item 8. | Financial Statements and Supplementary Data. |
Our consolidated financial statements, together with the report of KPMG, LLP ("KPMG") as the independent registered public accounting firm and the report of Deloitte & Touche, LLP ("Deloitte & Touche"), the former independent registered public accounting firm, begin on page F-1 of this Annual Report on Form 10-K.
| |
| Item 9. | Changes in and Disagreements With Accountants on Accounting and Financial Disclosure. |
None.
Item 9A. Controls and Procedures.
Disclosure Controls and Procedures
The Partnership maintains disclosure controls and procedures that are designed to ensure that information required to be disclosed in the Partnership's reports under the Securities Exchange Act of 1934, as amended (the “Exchange Act”) is recorded, processed, summarized and reported within the time periods specified in the SEC's rules and forms, and that such information is accumulated and communicated to management, including our Chief Executive Officer and Chief Financial Officer, and our Audit Committee of the Board of Directors, as appropriate, to allow timely decisions regarding required disclosure. In designing and evaluating the disclosure controls and procedures, management recognizes that any controls and procedures, no matter how well designed and operated, can provide only reasonable assurance of achieving the desired control objectives, and management is required to apply its judgment in evaluating the cost-benefit relationship of possible controls and procedures. In addition, a control system, no matter how well conceived and operated, can provide only reasonable, not absolute, assurance that the objectives of the internal control system are met. Because of the inherent limitations of any internal control system, no evaluation of controls can provide absolute assurance that all control issues, if any, within a company have been detected.
Our management, with the participation of our Chief Executive Officer (principal executive officer) and Chief Financial Officer (principal financial and accounting officer), evaluated the effectiveness of our disclosure controls and procedures as of December 31, 2011. Based on the evaluation of our disclosure controls and procedures (as defined in the Rules 13a-15(e) and 15d-15(e) under the Securities Exchange Act of 1934, as amended (the “Exchange Act”)) required by Exchange Act Rules 13a-15(b) or 15d-15(b), our principal executive officer and principal financial officer have concluded that as of the end of the period covered by this report, our disclosure controls and procedures were effective at the reasonable assurance level to ensure that information we are required to disclose in reports that we file or submit under the Exchange Act is recorded, processed, summarized and reported within the time periods specified in Securities and Exchange Commission rules and forms, and include controls and procedures designed to ensure that information required to be disclosed by us in such reports is accumulated and communicated to our management, including our principal executive officer and principal financial officer, as appropriate, to allow timely decisions regarding required disclosure.
2011 Acquisitions and Changes to Internal Control
We acquired all of the outstanding membership interests of CC Energy II LLC(together with its subsidiaries, “Crow Creek Energy”) during 2011. As the acquisition was completed in the second quarter of 2011, management did not include the internal control processes for Crow Creek Energy in its assessment of internal control over financial reporting as of December 31, 2011.Additionally, the acquisition is excluded from the certifications required under section 302 of the Sarbanes-Oxley Act of 2002, which are attached as exhibits to this Annual Report on Form 10-K. Management will include all aspects of internal controls for the acquisition in its 2012 assessment.
During the third quarter of 2011, we established Eagle Rock Gas Services, LLC ("ERGS"), with the purposes of marketing and trading natural gas. Management has included all aspects of internal control over financial reporting for this entity in its assessment of the effectiveness of internal control over financial reporting as of December 31, 2011, included in this Annual Report for the year ended December 31, 2011.
Other than the inclusion of ERGS in our 2011 internal control assessment included in this Annual Report for the year ended December 31, 2011, there were no changes in our internal control over financial reporting (as defined in Rules 13a-15(f) and 15d - 15(f) under the Exchange Act) that occurred during our most recent fiscal quarter that have materially affected, or are reasonably likely to materially affect, our internal control over financial reporting.
Management's Annual Report On Internal Control Over Financial Reporting
Management is responsible for establishing and maintaining adequate internal control over financial reporting. Management has conducted (i) an evaluation of the design of our internal control over financial reporting, and (ii) a testing of the effectiveness of our internal control over financial reporting, as it pertains to the calendar year 2011. The evaluation and testing was conducted by our internal auditor, under the supervision and with the participation of our management, including our Chief Executive Officer and our Chief Financial Officer. Our evaluation and testing followed the “Internal Control-Integrated Framework” issued by the Committee of Sponsoring Organizations of the Treadway Commission (“COSO”). Management elected to exclude Crow Creek Energy from its assessment of the effectiveness of internal control over financial reporting as of December 31, 2011. The Crow Creek Energy acquisition contributed total assets of $643.4 million and total revenues of $68.2 to the consolidated financial statements of the Partnership as of and for the year ended December 31, 2011. Our evaluation and testing was conducted as of the year ended December 31, 2011, which is the period
covered by this Annual Report on Form 10-K. Based on our assessment, we believe our internal controls over financial reporting are effective to provide reasonable assurance regarding the reliability of financial reporting and the preparation of financial statements for external purposes in accordance with generally accepted accounting principles based on the criteria of the COSO Framework.
KPMG LLP, the independent registered public accounting firm that audited the consolidated financial statements of the Partnership included in this Annual Report on Form 10-K, has issued an attestation report on the effectiveness of the Partnership's internal control over financial reporting as of December 31, 2011, which is included herein.
REPORT OF INDEPENDENT REGISTERED PUBLIC ACCOUNTING FIRM
The Board of Directors of Eagle Rock Energy G&P, LLC and Unitholders of Eagle Rock Energy Partners, L.P.:
We have audited Eagle Rock Energy Partners, L.P. and subsidiaries (collectively, the "Partnership") internal control over financial reporting as of December 31, 2011, based on criteria established in Internal Control - Integrated Framework issued by the Committee of Sponsoring Organizations of the Treadway Commission (COSO). The Partnership's management is responsible for maintaining effective internal control over financial reporting and for its assessment of the effectiveness of internal control over financial reporting, included in the accompanying Management's Annual Report on Internal Control Over Financial Reporting. Our responsibility is to express an opinion on the Partnership's internal control over financial reporting based on our audit.
We conducted our audit in accordance with the standards of the Public Company Accounting Oversight Board (United States). Those standards require that we plan and perform the audit to obtain reasonable assurance about whether effective internal control over financial reporting was maintained in all material respects. Our audit included obtaining an understanding of internal control over financial reporting, assessing the risk that a material weakness exists, and testing and evaluating the design and operating effectiveness of internal control based on the assessed risk. Our audit also included performing such other procedures as we considered necessary in the circumstances. We believe that our audit provides a reasonable basis for our opinion.
A company's internal control over financial reporting is a process designed to provide reasonable assurance regarding the reliability of financial reporting and the preparation of financial statements for external purposes in accordance with generally accepted accounting principles. A company's internal control over financial reporting includes those policies and procedures that (1) pertain to the maintenance of records that, in reasonable detail, accurately and fairly reflect the transactions and dispositions of the assets of the company; (2) provide reasonable assurance that transactions are recorded as necessary to permit preparation of financial statements in accordance with generally accepted accounting principles, and that receipts and expenditures of the company are being made only in accordance with authorizations of management and directors of the company; and (3) provide reasonable assurance regarding prevention or timely detection of unauthorized acquisition, use, or disposition of the company's assets that could have a material effect on the financial statements.
Because of its inherent limitations, internal control over financial reporting may not prevent or detect misstatements. Also, projections of any evaluation of effectiveness to future periods are subject to the risk that controls may become inadequate because of changes in conditions, or that the degree of compliance with the policies or procedures may deteriorate.
In our opinion, the Partnership maintained, in all material respects, effective internal control over financial reporting as of December 31, 2011, based on “criteria established in Internal Control - Integrated Framework issued by the Committee of Sponsoring Organizations of the Treadway Commission”.
The Partnership acquired all of the outstanding membership interests of CC Energy II L.L.C. and subsidiaries (Crow Creek Energy) during 2011, and management excluded from its assessment of the effectiveness of the Partnership's internal control over financial reporting as of December 31, 2011, Crow Creek Energy's internal control over financial reporting associated with total assets of $643.4 million and total revenues of $68.2 million included in the consolidated financial statements of the Partnership as of and for the year ended December 31, 2011. Our audit of internal control over financial reporting of the Partnership also excluded an evaluation of the internal control over financial reporting of Crow Creek Energy.
We also have audited, in accordance with the standards of the Public Company Accounting Oversight Board (United States), the consolidated balance sheet of the Partnership as of December 31, 2011, and the related consolidated statements of operations, members' equity, and cash flows for the year then ended, and our report dated February 28, 2012 expressed an unqualified opinion on those consolidated financial statements.
/s/KPMG LLP
Houston, Texas
February 28, 2012
| |
| Item 9B. | Other Information. |
None.
PART III
| |
| Item 10. | Directors, Executive Officers and Corporate Governance. |
Information required to be set forth in Item 10. Directors, Executive Officers and Corporate Governance, has been omitted and will be incorporated herein by reference, when filed, to our proxy statement for our 2012 Annual Meeting of Unitholders to be filed no later than April 30, 2012.
| |
| Item 11. | Executive Compensation. |
Information required to be set forth in Item 11. Executive Compensation, has been omitted and will be incorporated herein by reference, when filed, to our proxy statement for our 2012 Annual Meeting of Unitholders to be filed no later than April 30, 2012.
| |
| Item 12. | Security Ownership of Certain Beneficial Owners and Management and Related Unitholder Matters. |
Information required to be set forth in Item 12. Security Ownership of Certain Beneficial Owners and Management and Related Unitholder Matters, has been omitted and will be incorporated herein by reference, when filed, to our proxy statement for our 2012 Annual Meeting of Unitholders to be filed no later than April 30, 2012.
| |
| Item 13. | Certain Relationships and Related Transactions, and Director Independence. |
Information required to be set forth in Item 13. Certain Relationships and Related Transactions, and Director Independence, has been omitted and will be incorporated herein by reference, when filed, to our proxy statement for our 2012 Annual Meeting of Unitholders to be filed no later than April 30, 2012.
| |
| Item 14. | Principal Accounting Fees and Services. |
Information required to be set forth in Item 14. Principal Accountant Fees and Services, has been omitted and will be incorporated herein by reference, when filed, to our proxy statement for our 2012 Annual Meeting of Unitholders to be filed no later than April 30, 2012.
PART IV
| |
| Item 15. | Exhibits and Financial Statement Schedules. |
(a)(1) Financial Statements:
The following financial statements and the Report of Independent Registered Public Accounting Firm are filed as a part of this report on the pages indicated:
(a)(2) Financial Statement Schedules:
All other schedules have been omitted since the required information is not significant or is included in the Consolidated Financial Statements or Notes thereto or is not applicable.
(a)(3) Exhibits:
The following documents are included as exhibits to this report:
|
| |
Exhibit Number | Description |
| | |
2.1 | Membership Interest Contribution Agreement, by and among (i) CC Energy II L.L.C., Crow Creek Energy II L.L.C. and Crow Creek Operating Company II L.L.C., (ii) Natural Gas Partners VIII, L.P. and the other contributors party thereto and (iii) Eagle Rock Energy Partners, L.P., dated as of April 12, 2011 (incorporated by reference to Exhibit 2.1 to the Partnership's Current Report on From 8-K filed on April 13, 2011)
|
|
|
| 3.1 | Certificate of Limited Partnership of Eagle Rock Energy Partners, L.P. (incorporated by reference to Exhibit 3.1 of the registrant's registration statement on Form S-1 (File No. 333-134750))
|
| | |
| 3.2 | Second Amended and Restated Agreement of Limited Partnership of Eagle Rock Energy Partners, L.P. (incorporated by reference to Exhibit 3.1 of the registrant's current report on Form 8-K filed with the Commission on May 25, 2010)
|
| | |
| 3.3 | Certificate of Limited Partnership of Eagle Rock Energy GP, L.P. (incorporated by reference to Exhibit 3.3 of the registrant's registration statement on Form S-1 (File No. 333-134750))
|
|
|
| 3.4 | Limited Partnership Agreement of Eagle Rock Energy GP, L.P. (incorporated by reference to Exhibit 3.4 of the registrant’s registration statement on Form S-1 (File No. 333-134750)) |
| | |
| 3.5 | Certificate of Formation of Eagle Rock Energy G&P, LLC (incorporated by reference to Exhibit 3.5 of the registrant's registration statement on Form S-1 (File No. 333-134750))
|
| | |
| 3.6 | Third Amended and Restated Limited Liability Company Agreement of Eagle Rock Energy G&P, LLC (incorporated by reference to Exhibit 42 of the registrant's current report on Form 8-K filed with the Commission on July 30, 2010)
|
|
|
| 3.7 | Amendment No. 1 to the Second Amended and Restated Agreement of Limited Partnership of Eagle Rock Energy Partners, L.P. (incorporated by reference to Exhibit 4.1 of the registrant's current report on Form 8-K filed with the Commission on July 30, 2010) |
|
|
| 4.1 | Form of Common Unit Certificate (included as Exhibit A to the Second Amended and Restated Partnership Agreement of Eagle Rock Energy Partners, L.P.) (incorporated by reference to Exhibit 3.1 of the registrant’s current report on Form 8-K filed on May 25, 2010) |
|
|
| 4.2 | Form of Warrant Agent Agreement between Eagle Rock Energy Partners, L.P. and American Stock Transfer & Trust Company, LLC, as warrant agent (incorporated by reference to Exhibit 4.3 to the registrant's current report on Form 8-K filed on May 27, 2010) |
| | |
| 4.3 | Form of Warrant (included as Exhibit A to Exhibit 4.3 to the registrant's current report on Form 8-K filed on May 27, 2010)
|
|
|
| 4.4 | Indenture dated as of May 27, 2011 among Eagle Rock Energy Partners, L.P., Eagle Rock Energy Finance Corp., the Guarantors named therein and U.S. Bank National Association, as trustee (incorporated by reference to Exhibit 4.1 to the Partnership's Current Report on Form 8-K filed with the Commission on May 27, 2011) |
| | |
| 4.5 | Registration Rights Agreement dated as of May 27, 2011 among Eagle Rock Energy Partners, L.P., Eagle Rock Energy Finance Corp., the Guarantors named therein and the Initial Purchasers named therein (incorporated by reference to Exhibit 4.2 to the Partnership's Current Report on Form 8-K filed with the Commission on May 27, 2011) |
| | |
| 4.6 | First Supplemental Indenture dated as of June 28, 2011, among Eagle Rock Gas Services, LLC, a subsidiary of Eagle Rock Energy Partners, L.P., Eagle Rock Energy Finance Corp., the Guarantors named therein and U.S. Bank National Association, as trustee (incorporated by reference to Exhibit 4.2 to the Partnership's Quarterly Report on Form 10-Q filed with the Commission on August 4, 2011) |
| | |
| 10.1** | Amended and Restated Eagle Rock Energy Partners, L.P. Long-Term Incentive Plan dated September 17, 2010 (incorporated by reference to Exhibit 10.1 of the registrant’s current report on Form 8-K filed on September 17, 2010) |
|
|
| 10.2† | Natural Gas Liquids Exchange Agreement by and between ONEOK Hydrocarbon, L.P. and ONEOK Texas Field Services, L.P. (Eagle Rock Field Services, L.P.) (incorporated by reference to Exhibit 10.5 of the registrant’s registration statement on Form S-1 (File No. 333-134750)) |
|
|
| 10.3 | Gas Sales and Purchase Agreement between MC Panhandle, Inc. (Chesapeake Energy Marketing Inc.) and MidCon Gas Services Corp. (Eagle Rock Field Services, L.P.) (incorporated by reference to Exhibit 10.6 of the registrant’s registration statement on Form S-1 (File No. 333-134750)) |
| | |
| 10.4 | Brookeland Gas Facilities Gas Gathering and Processing Agreement between Union Pacific Resources Company (Anadarko E&P Company LP) and Sonat Exploration Company (Eagle Rock Field Services, L.P.) (incorporated by reference to Exhibit 10.7 of the registrant’s registration statement on Form S-1 (File No. 333-134750)) |
|
|
| 10.5 | Gas Purchase Contract between Warren Petroleum Company (Eagle Rock Field Services, L.P.) and Wallace Oil & Gas, Inc. (Cimarex Energy Co.) (incorporated by reference to Exhibit 10.10 of the registrant’s registration statement on Form S-1 (File No. 333-134750)) |
|
|
| 10.6 | Base Contract for Sale and Purchase of Natural Gas between Eagle Rock Field Services, L.P. and Odyssey Energy Services, LLC (incorporated by reference to Exhibit 10.13 of the registrant’s registration statement on Form S-1 (File No. 333-134750)) |
| | |
| 10.7** | Form of Supplemental Indemnification Agreement among Eagle Rock Energy G&P, LLC, Eagle Rock Energy GP, L.P., Eagle Rock Energy Partners, L.P. and officers and directors of Eagle Rock Energy G&P, LLC (incorporated by reference to Exhibit 10.1 of the registrant’s current report on Form 8-K filed with the Commission on December 30, 2009) |
| | |
| 10.8**† | Eagle Rock Energy G&P, LLC 2010 Short Term Incentive Bonus Plan approved and adopted on December 30, 2009 (incorporated by reference to Exhibit 10.3 of the registrant’s current report on Form 8-K filed with the Commission on December 30, 2009) |
|
|
|
| |
Exhibit Number | Description |
| | |
| 10.9 | Amended and Restated Securities Purchase and Global Transaction Agreement dated January 12, 2010 among Natural Gas Partners VII, L.P., Natural Gas Partners VIII, L.P., Montierra Minerals & Production, L.P., Montierra Management LLC, Eagle Rock Holdings, L.P., Eagle Rock Energy G&P, LLC, Eagle Rock Energy GP, L.P. and Eagle Rock Energy Partners, L.P. (incorporated by reference to Exhibit 10.1 of the registrant's current report on Form 8-K filed with the Commission on January 12, 2010)
|
| | |
| 10.10 | Amended and Restated Credit Agreement, dated as of June 22, 2011, among Eagle Rock Energy Partners, L.P., as borrower, Wells Fargo Bank, National Association, as administrative agent and swingline lender, Bank of America, N.A. and The Royal Bank of Scotland plc, as co-syndication agents, and BNP Paribas, as documentation agent, and the lenders party thereto (incorporated by reference to Exhibit 10.1 to the Partnership's Current Report on Form 8-K filed with the Commission on June 22, 2011)
|
| | |
| 10.11 | Contribution Agreement, dated May 24, 2010, by and among the Partnership, Eagle Rock Holdings, L.P. and Eagle Rock Energy GP, L.P. (incorporated by reference to Exhibit 10.1 to the registrant's current report on Form 8-K filed on May 25, 2010)
|
|
|
| 10.12** | Executive Change of Control Agreement Policy (incorporated by reference to Exhibit 10.1 to the registrant's current report on Form 8-K filed on July 28, 2010)
|
|
|
| 10.13** | Form of Executive Change of Control Agreement (incorporated by reference to Exhibit 10.2 to the registrant's current report on Form 8-K filed on July 28, 2010)
|
|
|
| 10.14** | Administrative Services Agreement, dated as of July 30, 2010, between Eagle Rock Energy Partners, L.P. and Eagle Rock Energy G&P, LLC (incorporated by reference to Exhibit 10.1 to the registrant's current report on Form 8-K filed on July 30, 2010)
|
|
|
| 10.15 | Form of Restricted Unit Agreement for Non-Employee Directors Under the Eagle Rock Energy Partners Long-Term Incentive Plan (incorporated by reference to Exhibit 10.3 to the registrant's current report on Form 8-K filed on July 30, 2010) |
|
|
| 10.16** | Form of Restricted Unit Agreement for Officers under the Eagle Rock Energy Partners Long-Term Incentive Plan (incorporated by reference to Exhibit 10.2 to the registrant's current report on Form 8-K filed on December 30, 2009) |
|
|
| 10.17† | Amendment to Natural Gas Liquids Exchange Agreement by and between ONEOK Hydrocarbon, L.P. and Eagle Rock Field Services L.P. (successor to ONEOK Texas Field Services, L.P.) dated December 3, 2010 (incorporated by reference to Exhibit 10.1 to the registrant's current report on Form 8-K filed on December 9, 2010)
|
|
|
| 10.18 | Amendment to Natural Gas Liquids Exchange Agreement by and between ONEOK Hydrocarbon, L.P, and Eagle Rock Field Services, L.P. (incorporated by reference to Exhibit 10.1 of the registrants current report on Form 8-K filed with the Commission on August 23, 2011) |
|
|
| 10.19**† | Eagle Rock Energy G&P, LLC 2011 Short Term Incentive Bonus Plan (incorporated by reference to Exhibit 10.1 to the registrant's current report on Form 8-K filed on February 14, 2011)
|
|
|
| 10.20** | Amendments to certain company performance goals under the Eagle Rock Energy G&P, LLC 2011 Short Term Incentive Bonus Plan (incorporated by reference to Exhibit 10.3 to the Partnership's Current Report on Form 8-K filed with the Commission on May 3, 2011) |
| | |
| 10.21** | Registration Rights Agreement dated May 3, 2011 by and between Eagle Rock Energy Partners, L.P. and Natural Gas Partners VIII, L.P. (incorporated by reference to Exhibit 10.1 to the Partnership's Current Report on Form 8-K filed with the Commission on May 3, 2011) |
| | |
| 10.22** | Voting Agreement dated May 3, 2011 by and between Eagle Rock Energy Partners, L.P. and Natural Gas Partners VIII, L.P. (incorporated by reference to Exhibit 10.2 to the Partnership's Current Report on Form 8-K filed with the Commission on May 3, 2011) |
| | |
| 10.23 | Purchase Agreement dated as of May 24, 2011 among Eagle Rock Energy Partners, L.P., Eagle Rock Energy Finance Corp., the Guarantors named therein and the Initial Purchasers named therein (incorporated by reference to Exhibit 10.1 to the Partnership's Current Report on Form 8-K filed with the Commission on May 27, 2011) |
| | |
| 12.1* | Statement Regarding Computation of Ratio of Earnings to Fixed Charges |
| | |
| 14.1 | Code of Ethics for Chief Executive Officer and Senior Financial Officers posted on the Company’s website at www.eaglerockenergy.com. |
| | |
| 21.1* | List of Subsidiaries of Eagle Rock Energy Partners, L.P. |
|
|
| 23.1* | Consent of KPMG LLP |
|
|
| 23.2* | Consent of Deloitte & Touche LLP |
| | |
| 23.3* | Consent of Cawley, Gillespie & Associates, Inc. |
|
|
| 31.1* | Certification of Periodic Financial Reports by Joseph A. Mills in satisfaction of Section 302 of the Sarbanes-Oxley Act of 2002 |
| | |
| 31.2* | Certification of Periodic Financial Reports by Jeffrey P. Wood in satisfaction of Section 302 of the Sarbanes-Oxley Act of 2002 |
| | |
| 32.1* | Certification of Periodic Financial Reports by Joseph A. Mills in satisfaction of Section 906 of the Sarbanes-Oxley Act of 2002 |
| | |
| 32.2* | Certification of Periodic Financial Reports by Jeffrey P. Wood in satisfaction of Section 906 of the Sarbanes-Oxley Act of 2002 |
| | |
| 99.1* | Report of Cawley, Gillespie & Associates, Inc. |
|
|
| 101.INS* | XBRL Instance Document |
|
|
| 101.SCH* | XBRL Taxonomy Extension Schema Document |
|
|
| 101.CAL* | XBRL Taxonomy Extension Calculation Linkbase Document |
|
|
|
| |
| 101.DEF* | XBRL Taxonomy Extension Definition Linkbase Document |
|
|
| 101.LAB* | XBRL Taxonomy Extension Label Linkbase Document |
| | |
| 101.PRE* | XBRL Taxonomy Extension Presentation Linkbase Document |
|
|
| |
| ** | Management contract or compensatory plan or arrangement required to be filed as an exhibit hereto. |
| |
| † | Portions of this exhibit have been omitted pursuant to a request for confidential treatment. |
SIGNATURES
Pursuant to the requirements of Section 13 or 15(d) of the Securities Exchange Act of 1934, the registrant has duly caused this report to be signed on its behalf by the undersigned, thereunto duly authorized, on February 28, 2012.
|
| | | | |
| | EAGLE ROCK ENERGY PARTNERS, L.P. |
| | | |
| | By: | Eagle Rock Energy GP, L.P., its general partner |
| | | |
| | By: | Eagle Rock Energy G&P, LLC, its general partner |
| | | |
| | By: | /s/ JOSEPH A. MILLS |
| | Name: | Joseph A. Mills |
| | Title: | Chief Executive Officer |
Pursuant to the requirements of the Securities Exchange Act of 1934, this report has been signed below by the following persons on behalf of the registrant and in the capacity and on the dates indicated:
|
| | |
| Signature | Title | Date |
| | | |
/s/ JOSEPH A. MILLS Joseph A. Mills | Chief Executive Officer (Principal Executive Officer) | February 28, 2012 |
| | | |
/s/ JEFFREY P. WOOD Jeffrey P. Wood | Senior Vice President and Chief Financial Officer (Principal Financial and Accounting Officer) | February 28, 2012 |
| | | |
/s/ PEGGY A. HEEG Peggy A. Heeg | Director | February 28, 2012 |
| | | |
/s/ CHRISTOPHER D. RAY Christopher D. Ray | Director | February 28, 2012 |
| | | |
/s/ WILLIAM J. QUINN William J. Quinn | Director | February 28, 2012 |
| | | |
/s/ PHILIP B. SMITH Philip B. Smith | Director | February 28, 2012 |
| | | |
/s/ WILLIAM A. SMITH William A. Smith | Director | February 28, 2012 |
| | | |
/s/ DAVID W. HAYES David W. Hayes | Director | February 28, 2012 |
| | | |
/s/ WILLIAM K. WHITE William K. White | Director | February 28, 2012 |
| | | |
/s/ HERBERT C. WILLIAMSON III Herbert C. Williamson III | Director | February 28, 2012 |
EAGLE ROCK ENERGY PARTNERS, L.P.
INDEX TO FINANCIAL STATEMENTS
|
| |
| Eagle Rock Energy Partners, L.P. Consolidated Financial Statements: | |
| F-2 |
| F-4 |
| F-5 |
| F-7 |
| F-8 |
| F-9 |
REPORT OF INDEPENDENT REGISTERED PUBLIC ACCOUNTING FIRM
The Board of Directors of Eagle Rock Energy G&P, LLC and Unitholders of Eagle Rock Energy Partners, L.P.:
We have audited the accompanying consolidated balance sheet of Eagle Rock Energy Partners, L.P. and subsidiaries (collectively, the "Partnership") as of December 31, 2011, and the related consolidated statements of operations, members' equity, and cash flows for the year then ended. These consolidated financial statements are the responsibility of the Partnership's management. Our responsibility is to express an opinion on these consolidated financial statements based on our audit. The accompanying consolidated financial statements of the Partnership as of December 31, 2010 and 2009, were audited by other auditors whose report thereon dated November 14, 2011 expressed an unqualified opinion on those statements, before the adjustments described in Note 14 to the consolidated financial statements.
We conducted our audit in accordance with the standards of the Public Company Accounting Oversight Board (United States). Those standards require that we plan and perform the audit to obtain reasonable assurance about whether the financial statements are free of material misstatement. An audit includes examining, on a test basis, evidence supporting the amounts and disclosures in the financial statements. An audit also includes assessing the accounting principles used and significant estimates made by management, as well as evaluating the overall financial statement presentation. We believe that our audit provides a reasonable basis for our opinion.
In our opinion, the 2011 consolidated financial statements referred to above present fairly, in all material respects, the financial position of the Partnership as of December 31, 2011, and the results of their operations and their cash flows for the year then ended in conformity with U.S. generally accepted accounting principles.
We also have audited the adjustments described in Note 14 that were applied to retrospectively adjust the 2010 and 2009 consolidated financial statements disclosures for changes made in 2011 to the composition of the Partnership's reportable segments. In our opinion, such adjustments are appropriate and have been properly applied. We were not engaged to audit, review, or apply any procedures to the 2010 or 2009 consolidated financial statements of the Partnership other than with respect to the adjustments and, accordingly, we do not express an opinion or any other form of assurance on the 2010 or 2009 consolidated financial statements taken as a whole.
We also have audited, in accordance with the standards of the Public Company Accounting Oversight Board (United States), Eagle Rock Energy Partners, L.P.'s internal control over financial reporting as of December 31, 2011, based on criteria established in Internal Control - Integrated Framework issued by the Committee of Sponsoring Organizations of the Treadway Commission (COSO), and our report dated February 28, 2012, expressed an unqualified opinion on the effectiveness of the Partnership's internal control over financial reporting.
/s/ KPMG LLP
Houston, Texas
February 28, 2012
REPORT OF INDEPENDENT REGISTERED PUBLIC ACCOUNTING FIRM
To the Board of Directors of Eagle Rock Energy G&P, LLC and Unitholders of Eagle Rock Energy Partners, L.P.
Houston, Texas
We have audited, before the effects of the adjustments to retrospectively apply the change to the consolidated financial statement disclosures for a change in the composition of reportable segments discussed in Note 14 to the consolidated financial statements, the consolidated balance sheet of Eagle Rock Energy Partners, L.P. and subsidiaries (the “Partnership”) as of December 31, 2010, and the related consolidated statements of operations, members' equity, and cash flows for the years ended December 31, 2010 and 2009 (the 2010 and 2009 consolidated financial statements before the effects of the adjustments discussed in Note 14 to the consolidated financial statements are not presented herein). These financial statements are the responsibility of the Partnership 's management. Our responsibility is to express an opinion on these financial statements based on our audits.
We conducted our audits in accordance with the standards of the Public Company Accounting Oversight Board (United States). Those standards require that we plan and perform the audit to obtain reasonable assurance about whether the financial statements are free of material misstatement. An audit includes examining, on a test basis, evidence supporting the amounts and disclosures in the financial statements. An audit also includes assessing the accounting principles used and significant estimates made by management, as well as evaluating the overall financial statement presentation. We believe that our audits provide a reasonable basis for our opinion.
In our opinion, such 2010 and 2009 consolidated financial statements, before the effects of the adjustments to retrospectively apply the change to the consolidated financial statement disclosures for a change in the composition of reportable segments discussed in Note 14 to the consolidated financial statements, present fairly, in all material respects, the financial position of the Partnership as of December 31, 2010, and the results of its operations and its cash flows for the years ended December 31, 2010 and 2009, in conformity with accounting principles generally accepted in the United States of America.
We were not engaged to audit, review, or apply any procedures to the adjustments to retrospectively apply the change to the consolidated financial statement disclosures for a change in the composition of reportable segments discussed in Note 14 to the consolidated financial statements and, accordingly, we do not express an opinion or any other form of assurance about whether such retrospective adjustments are appropriate and have been properly applied. Those retrospective adjustments were audited by other auditors.
/s/ DELOITTE & TOUCHE LLP
Houston, Texas
November 14, 2011
EAGLE ROCK ENERGY PARTNERS, L.P.
CONSOLIDATED BALANCE SHEETS
AS OF DECEMBER 31, 2011 AND 2010
($ in thousands)
|
| | | | | | | |
| | December 31,
2011 | | December 31,
2010 |
| ASSETS | | | |
| CURRENT ASSETS: | | | |
| Cash and cash equivalents | $ | 877 |
| | $ | 4,049 |
|
| Accounts receivable(a) | 97,832 |
| | 75,695 |
|
| Risk management assets | 13,080 |
| | — |
|
| Prepayments and other current assets | 13,739 |
| | 2,498 |
|
| Assets held for sale | — |
| | 8,615 |
|
| Total current assets | 125,528 |
| | 90,857 |
|
| PROPERTY, PLANT AND EQUIPMENT — Net | 1,763,674 |
| | 1,137,239 |
|
| INTANGIBLE ASSETS — Net | 109,702 |
| | 113,634 |
|
| DEFERRED TAX ASSET | 1,432 |
| | 1,969 |
|
| RISK MANAGEMENT ASSETS | 24,290 |
| | 1,075 |
|
| OTHER ASSETS | 21,062 |
| | 4,623 |
|
| TOTAL | $ | 2,045,688 |
| | $ | 1,349,397 |
|
| | |
| | |
|
| LIABILITIES AND MEMBERS' EQUITY | |
| | |
|
| CURRENT LIABILITIES: | |
| | |
|
| Accounts payable | $ | 145,939 |
| | $ | 91,886 |
|
| Due to affiliate | 46 |
| | 56 |
|
| Accrued liabilities | 12,734 |
| | 10,940 |
|
| Taxes payable | 487 |
| | 1,102 |
|
| Risk management liabilities | 11,649 |
| | 39,350 |
|
| Liabilities held for sale | — |
| | 1,705 |
|
| Total current liabilities | 170,855 |
| | 145,039 |
|
| LONG-TERM DEBT | 779,453 |
| | 530,000 |
|
| ASSET RETIREMENT OBLIGATIONS | 33,303 |
| | 24,711 |
|
| DEFERRED TAX LIABILITY | 45,216 |
| | 38,662 |
|
| RISK MANAGEMENT LIABILITIES | 6,893 |
| | 31,005 |
|
| OTHER LONG TERM LIABILITIES | 2,621 |
| | 867 |
|
| COMMITMENTS AND CONTINGENCIES (Note 13) |
|
| |
|
|
| MEMBERS' EQUITY (b) | 1,007,347 |
| | 579,113 |
|
| TOTAL | $ | 2,045,688 |
| | $ | 1,349,397 |
|
________________________
| |
| (a) | Net of allowance for bad debt of $1,347 as of December 31, 2011 and $4,496 as of December 31, 2010. |
| |
| (b) | 127,606,229 and 83,425,378 common units were issued and outstanding as of December 31, 2011 and December 31, 2010, respectively. These amounts do not include unvested restricted common units granted under the Partnership's long-term incentive plan of 2,560,110 and 1,744,454 as of December 31, 2011 and December 31, 2010, respectively. |
See accompanying notes to consolidated financial statements.
EAGLE ROCK ENERGY PARTNERS, L.P.
CONSOLIDATED STATEMENTS OF OPERATIONS
FOR THE YEARS ENDED DECEMBER 31, 2011, 2010, AND 2009
($ in thousands)
|
| | | | | | | | | | | | |
| | | Year Ended December 31, |
| | | 2011 | | 2010 | | 2009 |
| REVENUE: | | |
| | |
| | |
| Natural gas, natural gas liquids, oil, condensate and sulfur sales | | $ | 977,952 |
| | $ | 688,052 |
| | $ | 633,357 |
|
| Gathering, compression, processing and treating fees | | 47,770 |
| | 50,608 |
| | 44,005 |
|
| Commodity risk management gains (losses) | | 32,510 |
| | (8,786 | ) | | (106,290 | ) |
| Other revenue | | 1,676 |
| | 2,435 |
| | 1,858 |
|
| Total revenue | | 1,059,908 |
| | 732,309 |
| | 572,930 |
|
| COSTS AND EXPENSES: | | |
| | |
| | |
| Cost of natural gas, natural gas liquids, and condensate | | 633,184 |
| | 468,304 |
| | 470,099 |
|
| Operations and maintenance | | 93,048 |
| | 76,415 |
| | 71,496 |
|
| Taxes other than income | | 19,148 |
| | 12,226 |
| | 10,709 |
|
| General and administrative | | 57,891 |
| | 45,775 |
| | 45,819 |
|
| Other operating income | | (2,893 | ) | | — |
| | (3,552 | ) |
| Impairment | | 16,288 |
| | 6,666 |
| | 21,788 |
|
| Depreciation, depletion and amortization | | 131,611 |
| | 106,398 |
| | 108,530 |
|
| Total costs and expenses | | 948,277 |
| | 715,784 |
| | 724,889 |
|
| OPERATING INCOME (LOSS) | | 111,631 |
| | 16,525 |
| | (151,959 | ) |
| OTHER INCOME (EXPENSE): | | |
| | |
| | |
| Interest income | | 25 |
| | 111 |
| | 187 |
|
| Interest expense | | (29,647 | ) | | (15,147 | ) | | (21,591 | ) |
| Interest rate risk management losses | | (11,401 | ) | | (27,135 | ) | | (6,347 | ) |
| Other (expense) income | | (184 | ) | | 450 |
| | (136 | ) |
| Total other (expense) income | | (41,207 | ) | | (41,721 | ) | | (27,887 | ) |
| INCOME (LOSS) FROM CONTINUING OPERATIONS BEFORE INCOME TAXES | | 70,424 |
| | (25,196 | ) | | (179,846 | ) |
| INCOME TAX (BENEFIT) PROVISION | | (2,432 | ) | | (2,585 | ) | | 989 |
|
| INCOME (LOSS) FROM CONTINUING OPERATIONS | | 72,856 |
| | (22,611 | ) | | (180,835 | ) |
| DISCONTINUED OPERATIONS, NET OF TAX | | 276 |
| | 17,262 |
| | 9,577 |
|
| NET INCOME (LOSS) | | $ | 73,132 |
| | $ | (5,349 | ) | | $ | (171,258 | ) |
See accompanying notes to consolidated financial statements.
EAGLE ROCK ENERGY PARTNERS, L.P.
CONSOLIDATED STATEMENTS OF OPERATIONS (continued)
FOR THE YEARS ENDED DECEMBER 31, 2011, 2010, AND 2009
|
| | | | | | | | | | | |
| | Year Ended December 31, |
| | 2011 | | 2010 | | 2009 |
| NET INCOME PER COMMON UNIT—BASIC AND DILUTED: | | | | | |
| Income (loss) from Continuing Operations | | | | | |
| Common units - Basic | $ | 0.65 |
| | $ | (0.26 | ) | | $ | (2.38 | ) |
| Common units - Diluted | $ | 0.61 |
| | $ | (0.26 | ) | | $ | (2.38 | ) |
| Subordinated units - Basic and diluted | | | $ | (0.48 | ) | | $ | (2.48 | ) |
| General partner units - Basic and diluted | | | $ | (0.39 | ) | | $ | (2.38 | ) |
| Discontinued Operations | | | | | |
| Common units - Basic | $ | — |
| | $ | 0.22 |
| | $ | 0.13 |
|
| Common units - Diluted | $ | — |
| | $ | 0.22 |
| | $ | 0.13 |
|
| Subordinated units - Basic and diluted | | | $ | 0.22 |
| | $ | 0.13 |
|
| General partner units - Basic and diluted | | | $ | 0.22 |
| | $ | 0.13 |
|
| Net Income (loss) | | | | | |
| Common units - Basic | $ | 0.65 |
| | $ | (0.04 | ) | | $ | (2.26 | ) |
| Common units - Diluted | $ | 0.62 |
| | $ | (0.04 | ) | | $ | (2.26 | ) |
| Subordinated units - Basic and diluted | | | $ | (0.26 | ) | | $ | (2.36 | ) |
| General partner units - Basic and diluted | | | $ | (0.17 | ) | | $ | (2.26 | ) |
| Weighted Average Units Outstanding (in thousands) | | | | | |
| Common units - Basic | 110,435 |
| | 68,625 |
| | 53,496 |
|
| Common units - Diluted | 116,941 |
| | 68,625 |
| | 53,496 |
|
| Subordinated units - Basic and diluted | | | 8,163 |
| | 20,691 |
|
| General partner units - Basic and diluted | | | 488 |
| | 845 |
|
See accompanying notes to consolidated financial statements.
EAGLE ROCK ENERGY PARTNERS, L.P.
CONSOLIDATED STATEMENTS OF MEMBERS’ EQUITY
FOR THE YEARS ENDED DECEMBER 31, 2011, 2010, AND 2009
(in thousands, except unit amounts)
|
| | | | | | | | | | | | | | | | | | | | | |
| | General Partner | | Number of Common Units | | Common Units | | Number of Subordinated Units | | Subordinated Units | | Total |
| BALANCE — January 1, 2009 | $ | (3,714 | ) | | 53,043,767 |
| | $ | 625,590 |
| | 20,691,495 |
| | $ | 105,839 |
| | $ | 727,715 |
|
| Net income | (1,921 | ) | | — |
| | (122,270 | ) | | — |
| | (47,067 | ) | | (171,258 | ) |
| Distributions | (379 | ) | | — |
| | (26,738 | ) | | — |
| | (8,538 | ) | | (35,655 | ) |
| Vesting of restricted units | — |
| | 334,403 |
| | — |
| | — |
| | — |
| | — |
|
| Repurchase of common units | — |
| | (17,492 | ) | | (64 | ) | | — |
| | — |
| | (64 | ) |
| Equity based compensation | 72 |
| | — |
| | 4,789 |
| | — |
| | 1,824 |
| | 6,685 |
|
| Units returned from escrow | — |
| | (7,065 | ) | | (25 | ) | | — |
| | — |
| | (25 | ) |
| Units issued for acquisitions | — |
| | 849,858 |
| | 3,000 |
| | — |
| | — |
| | 3,000 |
|
| BALANCE — December 31, 2009 | (5,942 | ) | | 54,203,471 |
| | 484,282 |
| | 20,691,495 |
| | 52,058 |
| | 530,398 |
|
| Net income (loss) | 734 |
| | — |
| | (24,225 | ) | | — |
| | 18,142 |
| | (5,349 | ) |
| Distributions | (483 | ) | | — |
| | (35,869 | ) | | — |
| | — |
| | (36,352 | ) |
| Vesting of restricted units | — |
| | 798,301 |
| | — |
| | — |
| | — |
| | — |
|
| Rights offering | — |
| | 21,557,164 |
| | 53,893 |
| | — |
| | — |
| | 53,893 |
|
| Transaction costs from rights offering | — |
| | — |
| | (4,147 | ) | | — |
| | — |
| | (4,147 | ) |
| Exercised warrants | — |
| | 891,919 |
| | 5,351 |
| | — |
| | — |
| | 5,351 |
|
| Units issued for acquisitions | — |
| | 330,604 |
| | 2,089 |
| | — |
| | — |
| | 2,089 |
|
| Repurchase of common units | — |
| | (181,292 | ) | | (1,177 | ) | | — |
| | — |
| | (1,177 | ) |
| Equity based compensation | 43 |
| | — |
| | 4,570 |
| | — |
| | 794 |
| | 5,407 |
|
| Payment of transaction fee to Eagle Rock Holdings, L.P. | — |
| | 4,825,211 |
| | 29,000 |
| | — |
| | — |
| | 29,000 |
|
| Cancellation of subordinated units | — |
| | — |
| | 70,994 |
| | (20,691,495 | ) | | (70,994 | ) | | — |
|
| Acquisition of General Partner | 5,648 |
| | 1,000,000 |
| | (5,648 | ) | | — |
| | — |
| | — |
|
| BALANCE — December 31, 2010 | — |
| | 83,425,378 |
| | 579,113 |
| | — |
| | — |
| | 579,113 |
|
| Net income | — |
| | — |
| | 73,132 |
| | — |
| | — |
| | 73,132 |
|
| Distributions | — |
| | — |
| | (74,512 | ) | | — |
| | — |
| | (74,512 | ) |
| Vesting of restricted units | — |
| | 608,122 |
| | — |
| | — |
| | — |
| | — |
|
| Exercised warrants | — |
| | 14,957,540 |
| | 89,745 |
| | — |
| | — |
| | 89,745 |
|
| Repurchase of common units | — |
| | (137,985 | ) | | (1,401 | ) | | — |
| | — |
| | (1,401 | ) |
| Equity based compensation | — |
| | — |
| | 5,145 |
| | — |
| | — |
| | 5,145 |
|
| Units issued for acquisitions | — |
| | 28,753,174 |
| | 336,125 |
| | — |
| | — |
| | 336,125 |
|
| BALANCE — December 31, 2011 | $ | — |
| | 127,606,229 |
| | $ | 1,007,347 |
| | — |
| | $ | — |
| | $ | 1,007,347 |
|
See accompanying notes to consolidated financial statements.
EAGLE ROCK ENERGY PARTNERS, L.P.
CONSOLIDATED STATEMENTS OF CASH FLOWS
FOR THE YEARS ENDED DECEMBER 31, 2011, 2010, AND 2009
($ in thousands)
|
| | | | | | | | | | | |
| | Year Ended December 31, |
| | 2011 | | 2010 | | 2009 |
| CASH FLOWS FROM OPERATING ACTIVITIES: | | | | | |
| Net income | $ | 73,132 |
| | $ | (5,349 | ) | | $ | (171,258 | ) |
| Adjustments to reconcile net income to net cash provided by operating activities: |
| |
| | |
| Discontinued operations | (276 | ) | | (17,262 | ) | | (9,577 | ) |
| Depreciation, depletion and amortization | 131,611 |
| | 106,398 |
| | 108,530 |
|
| Impairment | 16,288 |
| | 6,666 |
| | 21,788 |
|
| Amortization of debt issuance costs | 2,415 |
| | 1,305 |
| | 1,068 |
|
| Equity in earnings of unconsolidated affiliates | 11 |
| | 20 |
| | (153 | ) |
| Distribution from unconsolidated affiliates—return on investment | 86 |
| | 67 |
| | 164 |
|
| Reclassing financing derivative settlements | (6,267 | ) | | (1,131 | ) | | (8,939 | ) |
| Equity-based compensation | 5,145 |
| | 5,407 |
| | 6,685 |
|
| Loss (gain) on sale of assets | 166 |
| | (371 | ) | | (476 | ) |
| Other operating income | (2,893 | ) | | — |
| | (3,552 | ) |
| Other | (1,026 | ) | | 196 |
| | 210 |
|
| Changes in assets and liabilities—net of acquisitions: | | | | | |
| Accounts receivable | (5,418 | ) | | 10,208 |
| | 18,982 |
|
| Prepayments and other current assets | (7,976 | ) | | 292 |
| | (172 | ) |
| Risk management activities | (84,753 | ) | | (9,195 | ) | | 147,751 |
|
| Accounts payable | (2,057 | ) | | (3,787 | ) | | (36,929 | ) |
| Due to affiliates | (10 | ) | | 328 |
| | 8,437 |
|
| Accrued liabilities | 1,878 |
| | 41 |
| | (6,411 | ) |
| Other assets | (1,216 | ) | | 1,058 |
| | 1,487 |
|
| Other current liabilities | (1,040 | ) | | (763 | ) | | (407 | ) |
| Net cash provided by operating activities | 117,800 |
| | 94,128 |
| | 77,228 |
|
| CASH FLOWS FROM INVESTING ACTIVITIES: | | | | | |
| Additions to property, plant and equipment | (154,916 | ) | | (64,497 | ) | | (36,134 | ) |
| Acquisitions, net of cash acquired | (220,326 | ) | | (30,984 | ) | | — |
|
| Proceeds from sale of assets | 5,712 |
| | 171,686 |
| | 476 |
|
| Purchase of intangible assets | (4,406 | ) | | (2,660 | ) | | (1,626 | ) |
| Net cash (used in) provided by investing activities | (373,936 | ) | | 73,545 |
| | (37,284 | ) |
| CASH FLOWS FROM FINANCING ACTIVITIES: | | | | | |
| Proceeds from long-term debt | 964,279 |
| | 90,617 |
| | 131,000 |
|
| Repayment of long-term debt | (1,012,779 | ) | | (315,000 | ) | | (176,000 | ) |
| Proceeds from senior notes | 297,837 |
| | — |
| | — |
|
| Payment of debt issuance costs | (17,466 | ) | | — |
| | — |
|
| Proceeds from derivative contracts | 6,267 |
| | 1,131 |
| | 8,939 |
|
| Proceeds from rights offering | — |
| | 53,893 |
| | — |
|
| Exercise of warrants | 89,745 |
| | 5,351 |
| | — |
|
| Payment of transaction costs | — |
| | (3,066 | ) | | (1,480 | ) |
| Repurchase of common units | (1,401 | ) | | (1,177 | ) | | (64 | ) |
| Distributions to members and affiliates | (74,512 | ) | | (7,195 | ) | | (35,655 | ) |
| Net cash provided by (used in) financing activities | 251,970 |
| | (175,446 | ) | | (73,260 | ) |
| CASH FLOWS FROM DISCONTINUED OPERATIONS: | | | | | |
| Operating activities | 994 |
| | 9,194 |
| | 19,713 |
|
| Investing activities | — |
| | (104 | ) | | (1,581 | ) |
| Net cash (used in) provided by discontinued operations | 994 |
| | 9,090 |
| | 18,132 |
|
| NET INCREASE IN CASH AND CASH EQUIVALENTS | (3,172 | ) | | 1,317 |
| | (15,184 | ) |
| CASH AND CASH EQUIVALENTS—Beginning of period | 4,049 |
| | 2,732 |
| | 17,916 |
|
| CASH AND CASH EQUIVALENTS—End of period | $ | 877 |
| | $ | 4,049 |
| | $ | 2,732 |
|
| | | | | | |
| NONCASH INVESTING AND FINANCING ACTIVITIES: | | | | | |
| Units issued for acquisitions | $ | 336,125 |
| | $ | 2,089 |
| | $ | 3,000 |
|
| Issuance of common units for transaction fee | $ | — |
| | $ | 29,000 |
| | $ | — |
|
| Transaction fees, not paid | $ | — |
| | $ | — |
| | $ | 1,155 |
|
| Investments in property, plant and equipment, not paid | $ | 31,374 |
| | $ | 10,922 |
| | $ | 3,761 |
|
| SUPPLEMENTAL DISCLOSURES OF CASH FLOW INFORMATION: | | | | | |
| Interest paid—net of amounts capitalized | $ | 24,682 |
| | $ | 14,272 |
| | $ | 26,311 |
|
| Cash paid for taxes | $ | 1,516 |
| | $ | 1,923 |
| | $ | 1,517 |
|
See accompanying notes to consolidated financial statements.
EAGLE ROCK ENERGY PARTNERS, L.P.
NOTES TO CONSOLIDATED FINANCIAL STATEMENTS
FOR THE YEARS ENDED DECEMBER 31, 2011, 2010 AND 2009
NOTE 1. ORGANIZATION AND DESCRIPTION OF BUSINESS
Description of Business—Eagle Rock Energy Partners, L.P. ("Eagle Rock Energy" or the "Partnership") is a growth-oriented limited partnership engaged in (i) the business of gathering, compressing, treating, processing, transporting, marketing and trading natural gas; fractionating, transporting and marketing natural gas liquids ("NGLs"); and crude oil logistics and marketing (the “Midstream Business”); and (ii) the business of developing and producing interests in oil and natural gas properties (the “Upstream Business”). The Partnership's midstream assets are strategically located in four productive, mature natural gas producing regions; the Texas Panhandle, East Texas/Louisiana, South Texas and the Gulf of Mexico, and its natural gas pipelines gather natural gas from designated points near producing wells and transport these volumes to third-party pipelines, the Partnership's gas processing plants, utilities and industrial consumers. Natural gas transported to the Partnership's gas processing plants, either in the Partnership's pipelines or third party pipelines, is treated to remove contaminants and conditioned or processed into marketable natural gas and NGLs. The Partnership reports its Midstream Business results through three segments: the Texas Panhandle Segment, the East Texas and Other Midstream Segment and the Marketing and Trading Segment. The Partnership's upstream assets are characterized by long-lived, high-working interest properties with extensive production histories and development opportunities. Its upstream assets are located primarily in South Alabama (where it also operates the associated gathering and processing assets), Texas, Oklahoma and Arkansas. The Partnership reports its Upstream Business through one segment.
The general partner of Eagle Rock Energy is Eagle Rock Energy GP, L.P, and the general partner of Eagle Rock Energy GP, L.P. is Eagle Rock Energy G&P, LLC, both of which became wholly-owned subsidiaries of the Partnership on July 30, 2010, as further discussed in Notes 9 and 10. The transaction with Eagle Rock Energy GP, L.P. was accounted for by the Partnership as a recapitalization. The acquisition of Eagle Rock Energy G&P, LLC was accounted for as an acquisition of entities under common control, which requires the Partnership to present its financial statements as if the two entities had always been combined, similar to the pooling of interests method.
NOTE 2. SUMMARY OF SIGNIFICANT ACCOUNTING POLICIES
Basis of Presentation and Principles of Consolidation—The accompanying audited consolidated financial statements have been prepared in accordance with accounting principles generally accepted in the United States of America (GAAP). Eagle Rock Energy is the owner of non-operating undivided interests in certain gas processing plants and gas gathering systems. Eagle Rock Energy owns these interests as tenants-in-common with the majority owner-operator of the facilities. Accordingly, Eagle Rock Energy includes its pro-rata share of assets, liabilities, revenues and expenses related to these assets in its financial statements. All intercompany accounts and transactions are eliminated in the consolidated financial statements.
Use of Estimates—The preparation of financial statements in conformity with GAAP requires management to make estimates and assumptions that affect the reported amounts of assets and liabilities and disclosure of contingent assets and liabilities at the date of the financial statements and the reported amounts of revenues and expenses during the reported period. Significant estimates are required for proved oil and natural gas reserves, which can affect the carrying value of oil and natural gas properties. The Partnership evaluates its estimates and assumptions on a regular basis. The Partnership bases its estimates on historical experience and various other assumptions that are believed to be reasonable under the circumstances, the results of which form the basis for making judgments about the carrying values of assets and liabilities that are not readily apparent from other sources. Actual results could differ from those estimates and such differences could be material.
Cash and Cash Equivalents—Cash and cash equivalents include certificates of deposit and other highly liquid investments with maturities of three months or less at the time of purchase.
Concentration and Credit Risk—Concentration and credit risk for the Partnership principally consists of cash and cash equivalents and accounts receivable.
The Partnership places its cash and cash equivalents with high-quality institutions and in money market funds. The Partnership derives its revenue from customers primarily in the natural gas industry. Industry concentrations have the potential to impact the Partnership's overall exposure to credit risk, either positively or negatively, in that the Partnership's customers could be affected by similar changes in economic, industry or other conditions. However, the Partnership believes the risk posed by this industry concentration is offset by the creditworthiness of the Partnership's customer base. The Partnership's portfolio of accounts receivable is comprised primarily of mid-size to large domestic corporate entities.
The following is the activity within the Partnership's allowance for doubtful accounts during the years ended December 31, 2011, 2010 and 2009.
|
| | | | | | | | | | | |
| | 2011 | | 2010 | | 2009 |
| ($ in thousands) | | | | | |
| Balance at beginning of period | $ | 4,496 |
| | $ | 4,818 |
| | $ | 12,080 |
|
| Charged to bad debt expense | 54 |
| | (122 | ) | | 535 |
|
| Write-offs/adjustments charged to allowance | (3,203 | ) | | (200 | ) | | (7,797 | ) |
| Balance at end of period | $ | 1,347 |
| | $ | 4,496 |
| | $ | 4,818 |
|
During the year ended December 31, 2011, the write off charged to the allowance related to the payment the Partnership received related to the sale of its 503(b)(9) claims related to SemGroup, L.P. ("SemGroup"). During the year ended December 31, 2009, the Partnership wrote off $7.3 million related to SemGroup. This amount relates to the non-503(b)(9) claims and the portion of the receivables sold in August 2009 (see Note 20 for further discussion).
Certain Other Concentrations—The Partnership relies on natural gas producers for its Midstream Business's natural gas and natural gas liquid supply, with the top two producers (by segment) accounting for 25% of its natural gas supply in the Texas Panhandle Segment and 27% of its natural gas supply in the East Texas and Other Midstream Segment for the year ended December 31, 2011. While there are numerous natural gas and natural gas liquid producers, and some of these producers are subject to long-term contracts, the Partnership may be unable to negotiate extensions or replacements of these contracts on favorable terms, if at all. If the Partnership were to lose all or even a portion of the natural gas volumes supplied by these producers and was unable to acquire comparable volumes, the Partnership's results of operations and financial position could be materially adversely affected. These percentages are calculated based on natural gas volumes gathered during the year ended December 31, 2011. For the year ended December 31, 2011, ONEOK, Inc. and Chevron Corporation, the Partnership's largest customers, represented 28% and 11%, respectively, of its total sales revenue (including realized and unrealized gains on commodity derivatives).
Inventory—Inventory is stated at the lower of cost or market, with cost being determined using the average cost method. At December 31, 2011 and December 31, 2010, the Partnership had $1.4 million and $0.5 million, respectively, of crude oil finished goods inventory which is recorded as part of Other Current Assets within the audited consolidated balance sheet.
Property, Plant and Equipment—Property, plant and equipment consists primarily of gas gathering systems, gas processing plants, NGL pipelines, conditioning and treating facilities and other related facilities, and oil and natural gas properties, which are carried at cost less accumulated depreciation, depletion and amortization. The Partnership charges repairs and maintenance against income when incurred and capitalizes renewals and betterments, which extend the useful life or expand the capacity of the assets. The Partnership calculates depreciation on the straight-line method over estimated useful lives of the Partnership's newly developed or acquired assets. The weighted average useful lives are as follows:
|
| |
| Plant Assets | 20 years |
| Pipelines and equipment | 20 years |
| Gas processing and equipment | 20 years |
| Office furniture and equipment | 5 years |
Oil and Natural Gas Properties—The Partnership utilizes the successful efforts method of accounting for its oil and natural gas properties. Leasehold costs are capitalized when incurred. Costs incurred to drill and complete development wells are capitalized. Geological and geophysical expenses and delay rentals are charged to expense as incurred. Exploratory drilling costs are initially capitalized, but charged to expense if the well is determined to be unsuccessful. The Partnership carries the costs of an exploratory well as an asset if the well is found to have a sufficient quantity of reserves to justify its capitalization as a producing well as long as the Partnership is making sufficient progress towards assessing the reserves and the economic and operating viability of the project.
Depletion of producing oil and natural gas properties is recorded based on units of production. Unit rates are computed for unamortized drilling and development costs using proved developed reserves and for acquisition costs using all proved
reserves. Authoritative guidance requires that acquisition costs of proved properties be amortized on the basis of all proved reserves (developed and undeveloped), and that capitalized development costs (wells and related equipment and facilities) be amortized on the basis of proved developed reserves.
Upon sale or retirement of complete fields of depreciable or depleted property, the book value thereof, less proceeds or salvage value, is charged or credited to income.
Costs related to unproved properties include costs incurred to acquire unproved reserves. Because these reserves do not meet the definition of proved reserves, the related costs are not classified as proved properties. Unproved leasehold costs are capitalized and amortized on a composite basis if individually insignificant, based on past success, experience, drilling plans and average lease-term lives. Unamortized leasehold costs related to successful exploratory drilling are reclassified to proved properties and depleted on a units of production basis. Unproved properties (both individually significant and insignificant) are assessed periodically within specific geographic areas and, if necessary, impairments are charged to expense.
Other Assets— As of December 31, 2011, other assets primarily consist of costs associated with debt issuance costs, net of amortization, of $15.1 million; business deposits to various providers and state or regulatory agencies of $4.9 million; and investment in unconsolidated affiliates of $1.0 million. As of December 31, 2010, other assets primarily consist of costs associated with debt issuance costs, net of amortization, of $1.9 million; business deposits to various providers and state or regulatory agencies of $1.6 million; and investment in unconsolidated affiliates of $1.1 million.
Within the Partnership's investments of unconsolidated affiliates, the Partnership owns common units of each of Buckeye Pipeline, L.P. and Trinity River, LLC. The Partnership also participates in a joint venture in Valley Pipeline, LLC and Sweeny Gathering, L.P. These investments are accounted for under the equity method and as of December 31, 2011 are not considered material to the Partnership's financial position or results of operations.
Impairment of Long-Lived Assets—Management evaluates whether the carrying value of non-oil and natural gas long-lived assets has been impaired when circumstances indicate the carrying value of those assets may not be recoverable. This evaluation is based on undiscounted cash flow projections. The carrying amount is not recoverable if it exceeds the undiscounted sum of cash flows expected to result from the use and eventual disposition of the assets. Management considers various factors when determining if these assets should be evaluated for impairment, including, but not limited to:
| |
| • | significant adverse changes in legal factors or in the business climate; |
| |
| • | a current-period operating or cash flow loss combined with a history of operating or cash flow losses or a projection or forecast which demonstrates continuing losses associated with the use of a long-lived asset; |
| |
| • | an accumulation of costs significantly in excess of the amount originally expected for the acquisition or construction of a long-lived asset; |
| |
| • | significant adverse changes in the extent or manner in which an asset is used or in its physical condition; |
| |
| • | a significant change in the market value of an asset; or |
| |
| • | a current expectation that, more likely than not, an asset will be sold or otherwise disposed of before the end of its estimated useful life. |
For its oil and natural gas long-lived assets, the Partnership reviews its proved properties at the field level when management determines that events or circumstances indicate that the recorded carrying value of the properties may not be recoverable. Such events include a negative revision or unfavorable projection of future oil and natural gas reserves and/or forward prices that will be produced from a field, the timing of this future production, future costs to produce the oil and natural gas, and future inflation levels.
If the carrying value is not recoverable on an undiscounted basis, the impairment loss is measured as the excess of the asset's carrying value over its fair value. Management assesses the fair value of long-lived assets using commonly accepted techniques, and may use more than one method, including, but not limited to, recent third party comparable sales, internally developed discounted cash flow analysis and analysis from outside advisors. Significant changes in market conditions resulting from events such as the condition of an asset or a change in management's intent to utilize the asset would generally require management to reassess the cash flows related to the long-lived assets.
See Note 5 for further discussion on impairment charges.
Revenue Recognition—Eagle Rock Energy's primary types of sales and service activities reported as operating revenue include:
| |
| • | sales of natural gas, NGLs, crude oil, condensate and sulfur; |
| |
| • | natural gas gathering, processing and transportation, from which Eagle Rock Energy generates revenues primarily through the compression, gathering, treating, processing and transportation of natural gas; and |
| |
| • | NGL transportation from which the Partnership generates revenues from transportation fees. |
Revenues associated with sales of natural gas, NGLs, crude oil, condensate and sulfur are recognized when title passes to the customer, which is when the risk of ownership passes to the customer and physical delivery occurs. Revenues associated with transportation and processing fees are recognized in the period when the services are provided.
For gathering and processing services, the Partnership either receives fees or commodities from natural gas producers under various types of contracts including percentage-of-proceeds, fixed recovery and percent-of-index arrangements. The Partnership also recognizes fee-based service revenues for services such as transportation, compression and processing.
The Partnership's Upstream Segment recognizes natural gas revenues based on the amount of natural gas sold to purchasers. The volumes of natural gas sold may differ from the volumes to which the Partnership is entitled based on its interests in the properties. Differences between volumes sold and volumes based on entitlements create natural gas imbalances. Material imbalances are reflected as adjustments to reported natural gas reserves and future cash flows. As of December 31, 2011 and December 31, 2010, the Partnership's Upstream Segment had an imbalance receivable balance of $0.3 million and $0.5 million, respectively, and it had a long-term payable balance of $1.6 million and zero as of December 31, 2011 and December 31, 2010, respectively.
Transportation and Exchange Imbalances—In the course of transporting natural gas and NGLs for others, the Partnership may receive for redelivery different quantities of natural gas or NGLs than the quantities actually delivered. These transactions result in transportation and exchange imbalance receivables or payables which are recovered or repaid through the receipt or delivery of natural gas or NGLs in future periods, if not subject to cash out provisions. Imbalance receivables are included in accounts receivable and imbalance payables are included in accounts payable on the consolidated balance sheets and marked-to-market using current market prices in effect for the reporting period of the outstanding imbalances. For the Midstream Business, as of December 31, 2011, the Partnership had imbalance receivables totaling $0.6 million and imbalance payables totaling $0.5 million. For the Midstream Business, as of December 31, 2010, the Partnership had imbalance receivables totaling $0.8 million and imbalance payables totaling $1.2 million. Changes in market value and the settlement of any such imbalance at a price greater than or less than the recorded imbalance results in either an upward or downward adjustment, as appropriate, to the cost of natural gas sold.
Environmental Expenditures—Environmental expenditures are expensed or capitalized as appropriate, depending upon the future economic benefit. Expenditures which relate to an existing condition caused by past operations and do not generate current or future revenue are expensed. Liabilities for these expenditures are recorded on an undiscounted basis when environmental assessments and/or clean-ups are probable and the costs can be reasonably estimated.
Income Taxes—Provision for income taxes is primarily applicable to the Partnership's state tax obligations under the Revised Texas Franchise Tax (the “Revised Texas Franchise Tax”) and certain federal and state tax obligations of Eagle Rock Energy Acquisition Co., Inc., Eagle Rock Acquisition Co. II, Inc., Eagle Rock Upstream Development Company, Inc. and Eagle Rock Upstream Development Company II, Inc., all of which are consolidated subsidiaries. Deferred income tax assets and liabilities are recognized for temporary differences between the assets and liabilities of the tax paying entities for financial reporting and tax purposes.
In general, legal entities that conduct business in Texas are subject to the Revised Texas Franchise Tax. In May 2006, the State of Texas expanded its pre-existing franchise tax to include limited partnerships, limited liability companies, corporations and limited liability partnerships. As a result of the change in tax law, the Partnership's tax status in the State of Texas changed from non-taxable to taxable effective with the 2007 tax year.
Since the Partnership is structured as a pass-through entity, it is not subject to federal income taxes. As a result, its partners are individually responsible for paying federal and certain income taxes on their share of the Partnership's taxable income. Since the Partnership does not have access to information regarding each partner's tax basis, it cannot readily determine the total difference in the basis of the Partnership's net assets for financial and tax reporting purposes.
Derivatives—Authoritative guidance establishes accounting and reporting standards for derivative instruments, including certain derivative instruments embedded in other contracts, and for hedging activities. It requires an entity to recognize all derivatives as either assets or liabilities in the statement of financial position and measure those instruments at fair value. The guidance provides that normal purchase and sale contracts, when appropriately designated, are not subject to the
guidance. Normal purchases and sales are contracts which provide for the purchase or sale of something, other than a financial instrument or derivative instrument that will be delivered in quantities expected to be used or sold by the reporting entity over a reasonable period in the normal course of business. The Partnership's forward natural gas and crude oil purchase and sales contracts are designated as normal purchases and normal sales, with the exception of certain contracts with our natural gas trading and marketing business. The Partnership uses financial instruments such as swaps, collars and other derivatives to mitigate the risks to cash flows resulting from changes in commodity prices and interest rates. The Partnership recognizes these financial instruments on its consolidated balance sheet at the instrument's fair value with changes in fair value reflected in the consolidated statement of operations, as the Partnership has not designated any of these derivative instruments as hedges. The cash flows from derivatives are reported as cash flows from operating activities unless the derivative contract is deemed to contain a financing element. Derivatives deemed to contain a financing element are reported as a financing activity in the statement of cash flows. See Note 11 for a description of the Partnership's risk management activities.
Other Reclassifications—Certain prior period financial statement balances have been reclassified to conform to the current year presentation. These reclassifications had no material effect on the recorded net income and are not significant.
NOTE 3. NEW ACCOUNTING PRONOUNCEMENTS
In January 2010, the FASB issued additional guidance on fair value disclosures. The new guidance clarifies two existing disclosure requirements and requires new disclosures such as: (1) a “gross” presentation of activities (purchases, sales, and settlements) within the Level 3 rollforward reconciliation, which will replace the “net” presentation format; and (2) detailed disclosures about the transfers in and out of Level 1 and 2 measurements. This guidance is effective for the first interim or annual reporting period beginning after December 15, 2009, except for the gross presentation of the Level 3 rollforward information, which is required for annual reporting periods beginning after December 15, 2010, and for interim reporting periods within those years. The Partnership adopted the fair value disclosures guidance on January 1, 2010, except for the gross presentation of the Level 3 rollforward, which was adopted by the Partnership on January 1, 2011 (see Note 12).
In May 2011, the FASB issued additional guidance intended to result in convergence between GAAP and International Financial Reporting Standards (“IFRS”) requirements for measurement of and disclosures about fair value. The amendments are not expected to have a significant impact on companies applying GAAP. Key provisions of the amendments include: a prohibition on grouping financial instruments for purposes of determining fair value, except when an entity manages market and credit risks on the basis of the entity’s net exposure to the group; an extension of the prohibition against the use of a blockage factor to all fair value measurements (that prohibition currently applies only to financial instruments with quoted prices in active markets); and a requirement that for recurring Level 3 fair value measurements, entities disclose quantitative information about unobservable inputs, a description of the valuation process used and qualitative details about the sensitivity of the measurements. In addition, for items not carried at fair value but for which fair value is disclosed, entities will be required to disclose the level within the fair value hierarchy that applies to the fair value measurement disclosed. This guidance is effective for interim and annual periods beginning after December 15, 2011. The adoption of this guidance is not expected to have a significant impact on the Partnership’s fair value measurements, financial condition, results of operations or cash flows.
NOTE 4. ACQUISITIONS
Acquisition of CC Energy II L.L.C.
On May 3, 2011, the Partnership completed the acquisition (the "Crow Creek Acquisition") of all of the outstanding membership interests of CC Energy II L.L.C (together with its subsidiaries, "Crow Creek Energy"), a portfolio company of Natural Gas Partners, VIII, L.P. ("NGP VIII"). Crow Creek Energy has oil and natural gas properties located in multiple basins across Oklahoma, north Texas and Arkansas (the "Mid-Continent" properties) and provides the Partnership with an extensive inventory of low-risk development prospects in established plays such as the Golden Trend field and developing plays such as the Cana Shale. The aggregate purchase price has been calculated as follows (in thousands, except unit and per unit amounts):
|
| | | |
| Number of Partnership Common Units Issued | 28,753,174 |
|
| Closing common unit price on May 3, 2011 | $ | 11.69 |
|
| Value of common units issued | $ | 336,125 |
|
| Crow Creek Energy outstanding debt assumed | 212,638 |
|
| Cash | 14,945 |
|
| Total purchase price | $ | 563,708 |
|
The number of common units of the Partnership issued was determined based on the value of the equity issued to the sellers of $301.9 million divided by $10.50, the ceiling price of the agreed upon range in the contribution agreement between the Partnership and Crow Creek Energy. The cash portion of the acquisition consideration and the repayment of Crow Creek Energy’s outstanding debt were funded through borrowings under the Partnership’s revolving credit facility. In addition, the Partnership incurred $2.3 million of acquisition related expenses, which are included within general and administrative expenses for the year ended December 31, 2011.
The following presents the purchase price allocation for the Crow Creek Energy assets, based on estimates of fair value (in thousands):
|
| | | |
| Current assets | $ | 25,329 |
|
| Oil and gas properties | 572,097 |
|
| Property, plant and equipment | 4,463 |
|
| Rights-of-way and easements | 3,192 |
|
| Other assets | 450 |
|
| Derivatives | 3,355 |
|
| Current liabilities | (37,032 | ) |
| Asset retirement obligations | (4,394 | ) |
| Deferred tax liability | (2,312 | ) |
| Other liabilities | (1,440 | ) |
| | $ | 563,708 |
|
The amounts of Crow Creek Energy's revenue and net income included within the Partnership's audited consolidated statement of operations for the year ended December 31, 2011, and the pro forma revenue and net income of the combined entity had the acquisition date been January 1, 2010, are as follows: |
| | | | | | | | | | | |
| | Revenue | | Net Income | | Net Income Per Diluted Common Unit |
| | ($ in thousands) | | |
| Actual from May 3, 2011 to December 31, 2011 | $ | 68,168 |
| | $ | 29,835 |
| | |
| Supplemental pro forma from January 1, 2011 to December 31, 2011 | $ | 1,080,964 |
| | $ | 78,591 |
| | $ | 0.62 |
|
| Supplemental pro forma from January 1, 2010 to December 31, 2010 | $ | 823,835 |
| | $ | 40,426 |
| | $ | 0.40 |
|
NOTE 5. PROPERTY PLANT AND EQUIPMENT
Fixed assets consisted of the following:
|
| | | | | | | |
| | December 31,
2011 | | December 31,
2010 |
| | ($ in thousands) |
| Land | $ | 2,607 |
| | $ | 2,629 |
|
| Plant | 290,460 |
| | 251,436 |
|
| Gathering and pipeline | 681,227 |
| | 666,163 |
|
| Equipment and machinery | 31,720 |
| | 26,408 |
|
| Vehicles and transportation equipment | 4,169 |
| | 4,251 |
|
| Office equipment, furniture, and fixtures | 1,318 |
| | 1,246 |
|
| Computer equipment | 9,539 |
| | 8,486 |
|
| Linefill | 4,324 |
| | 4,269 |
|
| Proved properties | 1,050,872 |
| | 471,781 |
|
| Unproved properties | 91,363 |
| | 1,304 |
|
| Construction in progress | 56,588 |
| | 42,416 |
|
| | 2,224,187 |
| | 1,480,389 |
|
| Less: accumulated depreciation, depletion and amortization | (460,513 | ) | | (343,150 | ) |
| Net property plant and equipment | $ | 1,763,674 |
| | $ | 1,137,239 |
|
The following table sets forth the total depreciation, depletion and impairment expense by type of asset within the Partnership's audited consolidated statements of operations (in thousands):
|
| | | | | | | | | | | |
| | Year Ended December 31, |
| | 2011 | | 2010 | | 2009 |
| | | | |
| Depreciation | $ | 54,606 |
| | $ | 54,183 |
| | $ | 51,544 |
|
| Depletion | $ | 65,380 |
| | $ | 30,023 |
| | $ | 33,744 |
|
| | | | | | |
| Capitalized interest costs | $ | 451 |
| | $ | 416 |
| | $ | 61 |
|
| | | | | | |
| Impairment expense: | | | | | |
| Proved properties (a) | $ | 11,239 |
| | $ | 104 |
| | $ | 8,114 |
|
| Unproved properties (b) | 489 |
| | 3,432 |
| | — |
|
| Plant assets (c) | 4,560 |
| | 576 |
| | — |
|
| Pipeline assets (d) | — |
| | 2,006 |
| | 13,674 |
|
| Total Impairment expense | $ | 16,288 |
| | $ | 6,118 |
| | $ | 21,788 |
|
__________________________________
| |
| (a) | During the year ended December 31, 2011, the Partnership incurred impairment charges related to proved properties in the Upstream Segment which reflected future drilling locations in the Permian region and a specific South Texas field that were no longer economical in the current natural gas price environment. During the year ended December 31, 2009, the Partnership incurred impairment charges related to proved properties in the Upstream Segment as a result of a decline in natural gas prices, production declines and lower natural gas liquids yields. |
| |
| (b) | During the year ended December 31, 2011, the Partnership incurred impairment charges related to certain drilling locations in its unproved properties which the Partnership no longer intends to develop based on the performance of offsetting wells. During the year ended December 31, 2010, the Partnership incurred impairment charges related to unproved properties related to certain fields in its unproved properties which we determined are not technologically feasible to develop. |
| |
| (c) | During the year ended December 31, 2011 the Partnership recorded an impairment charge in its Texas Panhandle Segment to fully write-down its idle Turkey Creek plant. In 2010, the Partnership recorded impairment charges related to its Midstream Business due to the notification during the second quarter 2010 that a significant gathering contract in the South Texas region within its East Texas and Other Midstream Segment was terminated. |
| |
| (d) | During the year ended December 31, 2010, the Partnership incurred impairment charges due to the notification during the second quarter 2010 that a significant gathering contract in the South Texas region within its East Texas and Other Midstream Segment was terminated. During the year ended December 31, 2009, the Partnership recorded impairment charges related to certain processing plants, pipelines and contracts in its Midstream business due to reduced throughput volumes. |
The Partnership capitalizes interest costs on major projects during extended construction time periods. Such interest costs are allocated to property, plant and equipment and amortized over the estimated useful lives of the related assets.
NOTE 6. ASSET RETIREMENT OBLIGATIONS
The Partnership recognizes asset retirement obligations associated with the retirement of tangible long-lived assets that result from the acquisition, construction and development of the assets. The Partnership records the fair value of a liability for an asset retirement obligation in the period in which it is incurred and a corresponding increase in the carrying amount of the related long-lived asset. For its producing oil and natural gas properties, the Partnership makes estimates of property abandonment costs that, in some cases, will not be incurred until a substantial number of years in the future. Such cost estimates could be subject to significant revisions in subsequent years due to changes in regulatory requirements, technological advances and other factors that may be difficult to predict. The Partnership recognizes asset retirement obligations for its midstream assets in accordance with the term “conditional asset retirement obligation,” which refers to a legal obligation to perform an asset retirement activity in which the timing and/or method of settlement are conditional upon a future event that may or may not be within the Partnership's control. Although uncertainty about the timing and/or method of settlement may exist and may be conditional upon a future event, the obligation to perform the asset retirement activity is unconditional. Accordingly, the Partnership is required to recognize a liability for the fair value of a conditional asset retirement obligation upon initial recognition if the fair value of the liability can be reasonably estimated. The fair value of additions to the asset retirement obligations is estimated using valuation techniques that covert future cash flows to a single discounted amount. Significant inputs to the valuation include estimates of (i) remediation costs, (ii) remaining lives, (iii) future inflation factors and (iv) a credit-adjusted risk free interest rate.
A reconciliation of the Partnership's liability for asset retirement obligations is as follows: |
| | | | | | | | | | | |
| | 2011 | | 2010 | | 2009 |
| | ($ in thousands) | | |
| Asset retirement obligations—January 1 | $ | 24,711 |
| | $ | 19,829 |
| | $ | 19,872 |
|
| Additional liabilities | 159 |
| | 1,019 |
| | — |
|
| Liabilities settled | (465 | ) | | (1,175 | ) | | (1,324 | ) |
| Revision to liabilities | 2,339 |
| | 2,582 |
| | — |
|
| Additional liability related to acquisitions | 4,413 |
| | 663 |
| | — |
|
| Accretion expense | 2,146 |
| | 1,793 |
| | 1,281 |
|
| Asset retirement obligations—December 31 | $ | 33,303 |
| | $ | 24,711 |
| | $ | 19,829 |
|
NOTE 7. INTANGIBLE ASSETS
Intangible assets consist of rights-of-way and easements and acquired customer contracts, which the Partnership amortizes over the term of the agreement or estimated useful life. The amortization period for the Partnership's rights-of-way and easements is 20 years. The amortization period for contracts ranges from 5 to 20 years and is approximately 8 years on average as of December 31, 2011. Amortization expense was approximately $11.6 million, $22.2 million, and $23.2 million for the years ended December 31, 2011, 2010 and 2009, respectively. Intangible assets consisted of the following:
|
| | | | | | | |
| | December 31,
2011 | | December 31,
2010 |
| | ($ in thousands) |
| Rights-of-way and easements—at cost | $ | 99,143 |
| | $ | 91,490 |
|
| Less: accumulated amortization | (25,570 | ) | | (20,552 | ) |
| Contracts | 121,387 |
| | 122,601 |
|
| Less: accumulated amortization | (85,258 | ) | | (79,905 | ) |
| Net intangible assets | $ | 109,702 |
| | $ | 113,634 |
|
|
| | | | | | | | | | | |
| | Year Ended December 31, |
| | 2011 | | 2010 | | 2009 |
| Impairment expense: | | | | | |
| Rights-of-way (a) | $ | — |
| | $ | 548 |
| | $ | — |
|
_____________________________________
| |
| (a) | During the year ended December 31, 2010, the Partnership incurred impairment charges due to the notification during the second quarter 2010 that a significant gathering contract in the South Texas region within its East Texas and Other Midstream Segment was terminated. |
Estimated future amortization expense related to the intangible assets at December 31, 2011, is as follows (in thousands):
|
| | | |
| Year ending December 31, | |
| 2012 | $ | 11,251 |
|
| 2013 | 10,132 |
|
| 2014 | 7,051 |
|
| 2015 | 7,051 |
|
| 2016 | 6,967 |
|
| Thereafter | 67,250 |
|
NOTE 8. LONG-TERM DEBT
Long-term debt consisted of the following:
|
| | | | | | | |
| | December 31,
2011 | | December 31,
2010 |
| | ($ in thousands) |
| Revolving credit facility: | $ | 481,500 |
| | $ | 530,000 |
|
| Senior notes: | | | |
| 8 3/8% senior notes due 2019 | 300,000 |
| | — |
|
| Unamortized bond discount senior notes due 2019 | (2,047 | ) | | — |
|
| Total senior notes | 297,953 |
| | — |
|
| Total long-term debt | $ | 779,453 |
| | $ | 530,000 |
|
Revolving Credit Facility
On June 22, 2011, the Partnership entered into an Amended and Restated Credit Agreement (the “Credit Agreement”) with Wells Fargo Bank, National Association, as administrative agent and swingline lender, Bank of America, N.A. and The Royal Bank of Scotland plc, as co-syndication agents, BNP Paribas, as documentation agent, and the other lenders who are parties to the Credit Agreement. The Credit Agreement amended and restated the Partnership’s prior $880 million Credit Agreement (the “Prior Credit Agreement”). Upon the effectiveness of the Credit Agreement, all commitments of the lenders party to the Prior Credit Agreement were terminated and all loans and other indebtedness of the Partnership under the Prior Credit Agreement were renewed and extended, inclusive of new lender commitments, on the terms and conditions of the Credit Agreement. The Credit Agreement matures on June 22, 2016.
The credit facility under the Credit Agreement consists of aggregate initial commitments of $675 million that may, at the Partnership’s request and subject to the terms and conditions of the Credit Agreement, be increased up to an aggregate total amount of $1.2 billion. Availability under the credit facility is subject to a borrowing base comprised of two components: the upstream component and the midstream component. The upstream component of the borrowing base is determined semi-annually as an amount equal to the loan value of the proved oil and gas reserves of the Partnership and its subsidiaries as determined by the lenders party to the Credit Agreement. The midstream component of the borrowing base is determined quarterly as an amount equal to the lesser of (i) 55% of the total borrowing base (subject to increase for certain periods following certain material acquisitions up to 60% of the total borrowing base) and (ii) 3.75 times Consolidated EBITDA (as defined in the Credit Agreement) attributable to the midstream assets of the Partnership and its subsidiaries for the trailing four fiscal quarters. Pro forma adjustments to each component of the borrowing base, and thus total availability under the credit facility, are made upon the occurrence of certain events including material acquisitions and dispositions. Availability under the Credit Agreement is based on the lower of the current borrowing base and the total commitments. As of December 31, 2011, the Partnership had approximately $193.5 million of availability under the credit facility. The Partnership currently pays a 0.45% commitment fee per year on the difference between total commitments and the amount drawn under the credit facility.
The initial borrowings under the Credit Agreement were used to repay in full the borrowings under the Prior Credit Agreement and to pay fees and expenses incurred in connection with the Credit Agreement. Also, in connection with the Credit Agreement, the Partnership incurred debt issuance costs of $6.6 million and recorded a charge of $0.4 million to write off a
portion of the unamortized debt issuance costs related to the Prior Credit Agreement. As of December 31, 2011, the Partnership had unamortized debt issuance costs of $6.8 million.
The Credit Agreement includes a sub-limit for the issuance of standby letters of credit for a total of $150 million. As of December 31, 2011, the Partnership had $8.6 million of outstanding letters of credit.
In general, at the Partnership's election, interest will accrue on the credit facility at either LIBOR plus a margin ranging from 1.75% to 2.75% (currently 2.25% per annum based on the Partnership's borrowing base utilization percentage) or the base rate plus a margin ranging from 0.75% to 1.75% (currently 1.25% per annum based on the Partnership's borrowing base utilization percentage). The applicable margin is determined based on the utilization of the then existing borrowing base. The borrowings under the Credit Agreement may be prepaid, without any premium or penalty, at any time. The base rate is generally the highest of the federal funds rate plus 0.5%, the prime rate as announced from time to time by the Administrative Agent, or daily LIBOR for a term of one month plus 1.0%. As of December 31, 2011, the weighted average interest rate (excluding the impact of interest rate swaps) on the Partnership's outstanding debt under its revolving credit facility was 2.54%.
The obligations under the Credit Agreement are secured by first priority liens on substantially all of the Partnership’s material assets, including a pledge of all of the equity interests of each of the Partnership’s material subsidiaries.
The Credit Agreement requires the Partnership and certain of its subsidiaries to make certain representations and warranties that are customary for credit facilities of this type. The Credit Agreement also contains affirmative and negative covenants that are customary for credit facilities of this type, including compliance with financial covenants. The financial covenants prohibit the Partnership from:
| |
| • | permitting, as of any fiscal quarter-end, the ratio of the Partnership’s Consolidated EBITDA (as defined in the Credit Agreement) for the four fiscal quarter period ending with such fiscal quarter to Consolidated Interest Expense (as defined in the Credit Agreement) for such four fiscal quarter period to be less than 2.50 to 1.00. The Partnership's interest rate coverage was 4.8 to 1.0 as of December 31, 2011; |
| |
| • | ;permitting, as of any fiscal quarter-end, the ratio of the Partnership's Total Funded Indebtedness (as defined in the Credit Agreement) to Consolidated EBITDA for the four fiscal quarter period ending with such fiscal quarter to be greater than 4.50 to 1.00. The Partnership's leverage ratio was 3.3 to 1.00 as of December 31, 2011; and |
| |
| • | .permitting the ratio of the Partnership’s consolidated current assets (including availability under the Credit Agreement up to the loan limit, as defined within the Credit Agreement but excluding non-cash assets under the accounting guidance for derivatives) to consolidated current liabilities (excluding non-cash obligations under the accounting guidance for derivatives) to be less than 1.00 to 1.00. The Partnership's current ratio was 1.9 to 1.0 as of December 31, 2011. |
As of December 31, 2011, the Partnership was in compliance with the financial covenants under the Credit Agreement.
Senior Notes
On May 27, 2011, the Partnership, along with its subsidiary, Eagle Rock Energy Finance Corp. ("Finance Corp"), as co-issuer, issued $300 million of senior unsecured notes (the "Senior Notes"), that bear a coupon of 8.375%, through a private placement. The Senior Notes will mature on June 1, 2019, and interest is payable on each June 1 and December 1, commencing December 1, 2011. After the original discount of $2.2 million and excluding related offering expenses, the Partnership received net proceeds of approximately $297.8 million, which were used to repay borrowings outstanding under the Prior Credit Agreement. As of December 31, 2011, the Partnership had an unamortized debt discount of $2.0 million, which is recorded as an offset to the principal amount of the Senior Notes, and unamortized debt issuance costs of $8.3 million.
The Senior Notes are general unsecured senior obligations and rank equally in right of payment with all of the Partnership's existing and future senior indebtedness and rank senior in right of payment to any of the Partnership's future subordinated indebtedness. The Senior Notes are effectively junior in right of payment to all of the Partnership's existing and future secured indebtedness and other obligations, including borrowings outstanding under the Partnership's Credit Agreement, to the extent of the value of the assets securing such indebtedness and other obligations. The Senior Notes are jointly and severally guaranteed on a senior unsecured basis by the Partnership's existing and future subsidiaries, who are referred to as the "subsidiary guarantors," that guarantee our credit facility or other indebtedness.
The indenture governing the Senior Notes, among other things, restricts the Partnership's ability and the ability of the
Partnership's restricted subsidiaries to: (i) incur, assume or guarantee additional indebtedness or issue redeemable stock; (ii) pay dividends on stock, repurchase stock or redeem subordinated debt; (iii) make certain investments; (iv) enter into certain transactions with affiliates; (v) create liens on their assets; (vi) sell or otherwise dispose of certain assets, including capital stock of subsidiaries; (vii) restrict dividends, loans or other asset transfers from the Partnership's restricted subsidiaries; (viii) enter into new lines of business; and (ix) consolidate with or merge with or into, or sell all or substantially all of their properties (taken as a whole) to another person.
The Partnership has the option to redeem all or a portion of the Senior Notes at any time on or after June 1, 2015 at the redemption prices specified in the indenture plus accrued and unpaid interest. The Partnership may also redeem the Senior Notes, in whole or in part, at a "make-whole" redemption price specified in the indenture, plus accrued and unpaid interest, at any time prior to June 1, 2015. In addition, the Partnership may redeem up to 35% of the Senior Notes prior to June 1, 2014 under certain circumstances with the net cash proceeds from certain equity offerings at 108.375% of the principal amount of the notes redeemed.
In connection with the issuance and sale of the Senior Notes, the Partnership entered into a registration rights agreement (the "Senior Notes Registration Rights Agreement") with representatives of the initial purchasers, in which the Partnership agreed to file a registration statement with the Securities and Exchange Commission so that holders can exchange the Senior Notes for registered notes that have substantially identical terms as the Senior Notes and evidence the same indebtedness as the Senior Notes. In addition, the subsidiary guarantors agreed to exchange the guarantee related to the Senior Notes for a registered guarantee having substantially the same terms as the original guarantees. The Partnership filed a registration statement with the Securities and Exchange Commission which became effective on January 12, 2012 and all of the Senior Notes were exchanged for registered notes as of February 15, 2012.
Scheduled maturities of long-term debt as of December 31, 2011, were as follows:
|
| | | |
| | Principal Amount |
| | ($ in thousands) |
| 2012 | — |
|
| 2013 | — |
|
| 2014 | — |
|
| 2015 | — |
|
| 2016 | 481,500 |
|
| 2017 and after | 300,000 |
|
| | $ | 781,500 |
|
NOTE 9. MEMBERS’ EQUITY
At December 31, 2011, there were 127,606,229 common units outstanding. In addition, there were 2,560,110 unvested restricted common units outstanding.
As a result of the approval of certain of the Recapitalization and Related Transactions, as further discussed in Note 10, on May 24, 2010, the Partnership's general partner and Eagle Rock Holdings, L.P. ("Holdings") contributed to the Partnership all 20,691,495 of the outstanding subordinated units and all of the outstanding incentive distribution rights in the Partnership. In connection with the contribution of the subordinated units and incentive distribution rights, the Partnership (i) issued 4,825,211 common units to Holdings as payment of the transaction fee contemplated by the Recapitalization and Relation Transactions and (ii) adopted and entered into a Second Amended and Restated Agreement of Limited Partnership.
Pursuant to the Partnership's Second Amended and Restated Agreement of Limited Partnership, among other things: (i) the subordinated units and incentive distribution rights were cancelled; (ii) the concepts of a subordination period and a minimum quarterly distribution (and, as a result, the concept of arrearages on the common units) were eliminated; and (iii) provisions were included that provide the Partnership an option to acquire its general partner and its general partner entities, which were acquired on July 30, 2010, as further discussed below.
On June 1, 2010, the Partnership launched its rights offering to the holders of its common and general partner units as of close of business on May 27, 2010, the record date. Each Right entitled the holder (including holders of Rights acquired
during the subscription period) to purchase (i) one common unit and (ii) one warrant to purchase one additional common unit at $6.00 on certain specified days beginning on August 15, 2010 and ending on May 15, 2012. The rights offering expired on June 30, 2010, and the Partnership issued 21,557,164 common units and 21,557,164 warrants on or about July 8, 2010 for gross proceeds of $53.9 million. During the years endedDecember 31, 2011 and 2010, 14,957,540 and 891,919 warrants were exercised for a total of 14,957,540 and 891,919 newly issued common units, respectively. As of December 31, 2011 and December 31, 2010, 5,707,705 and 20,665,245 warrants, respectively, were outstanding. The warrants that remain outstanding as of December 31, 2011 may be exercised only on March 15, 2012 or May 15, 2012.
On July 27, 2010, the Partnership gave notice to Holdings of its intention to exercise the GP Acquisition Option (as defined in Note 10). The transaction closed on July 30, 2010, and the Partnership issued 1,000,000 common units to Holdings to acquire the Partnership's general partner entities. As a result, the Partnership's 844,551 outstanding general partner units were cancelled. In connection with the completion of the GP Acquisition Option, the Partnership's board of directors (the "Board") was expanded to include two additional independent directors who were appointed by the Conflicts Committee on July 30, 2010.
The Partnership has declared a cash distribution for each quarter since its initial public offering. The table below summarizes these distributions for the last three years.
|
| | | | | | | | |
| Quarter Ended | | Distribution per Unit | | Record Date | | Payment Date |
| March 31, 2009* | | $ | 0.0250 |
| | May 11, 2009 | | May 15, 2009 |
| June 30, 2009* | | $ | 0.0250 |
| | August 10, 2009 | | August 14, 2009 |
| September 30, 2009* | | $ | 0.0250 |
| | November 9, 2009 | | November 13, 2009 |
| December 31, 2009* | | $ | 0.0250 |
| | February 8, 2010 | | February 12, 2010 |
| March 31, 2010* | | $ | 0.0250 |
| | May 7, 2010 | | May 14, 2010 |
| June 30, 2010* | | $ | 0.0250 |
| | August 9, 2010 | | August 13, 2010 |
| September 30, 2010+ | | $ | 0.0250 |
| | November 8, 2010 | | November 12, 2010 |
| December 31, 2010+ | | $ | 0.1500 |
| | February 7, 2011 | | February 14, 2011 |
| March 31, 2011+ | | $ | 0.1500 |
| | May 9, 2011 | | May 13, 2011 |
| June 30, 2011+ | | $ | 0.1875 |
| | August 5, 2011 | | August 12, 2011 |
| September 30, 2011+ | | $ | 0.2000 |
| | November 7, 2011 | | November 14, 2011 |
| December 31, 2011+ | | $ | 0.2100 |
| | February 7, 2012 | | February 14, 2012 |
_____________________________
| |
| + | The distribution per unit represents distributions made only on common units. |
| |
| * | The distribution per unit represents distributions made only on common units and general partner units. |
NOTE 10. RELATED PARTY TRANSACTIONS
The following table summarizes transactions between us and affiliated entities:
|
| | | | | | | | | | | | |
| | | Year Ended December 31, |
| | | 2011 | | 2010 | | 2009 |
| Affiliates of NGP: | | ($ in thousands) |
| Natural gas purchases from affiliates | | $ | 6,097 |
| | $ | 6,766 |
| | $ | 8,836 |
|
| Services performed by affiliates | | | | 617 |
| | 2,153 |
|
| Services performed for affiliates | | | | 18 |
| | 51 |
|
| Rental payments made to affiliates | | | | | | 100 |
|
| Payable as of December 31, | | 371 |
| | 472 |
| | |
| Investments of unconsolidated investments: | | | | | | |
| (Loss) income from investments | | (11 | ) | | (20 | ) | | 153 |
|
| Payable as of December 31, | | 46 |
| | 56 |
| | |
In connection with the closing of the Partnership's initial public offering, on October 24, 2006, it entered into a registration rights agreement with Eagle Rock Holdings, L.P. in connection with its contribution to the Partnership of all of Eagle Rock Holdings, L.P.'s limited and general partner interests in Eagle Rock's predecessor. In the registration rights agreement, the Partnership agreed, for the benefit of Eagle Rock Holdings, L.P., to register the common units it holds, the common units issuable upon conversion of the subordinated units that it holds and any common units or other equity securities
issuable in exchange for the common units and subordinated units it holds. The registration rights agreement is still in effect and the Partnership is in compliance with all obligations of the agreement.
In connection with the closing of the acquisition of certain fee minerals, royalties, overriding royalties and non-operated working interest properties from Montierra Minerals & Production, L.P. ("Montierra") and NGP-VII Co-Investment Opportunities, L.P. ("Co-Invest") on April 30, 2007, the Partnership entered into registration rights agreements with Montierra and Co-Invest. In the registration rights agreements, the Partnership agreed, for the benefit of Montierra and Co-Invest, to register the common units it holds, the common units issuable upon conversion of the subordinated units that it holds and any common units or other equity securities issuable in exchange for the common units and subordinated units it holds. The registration rights agreement is still in effect and the Partnership is in compliance with all obligations of the agreement.
On May 3, 2011, the Partnership completed the Crow Creek Acquisition. Due to Crow Creek Energy being a portfolio company of NGP VIII and NGP's ownership interest in the Partnership and Board of Directors representation, the Board of Directors of the general partner of the Partnership's general partner, authorized its Conflicts Committee to review, evaluate, and, if determined appropriate, approve the Crow Creek Acquisition, due to the potential conflict of interest among the Partnership, the NGP and the Partnership's public unitholders. The Conflicts Committee, consisting of independent directors of the Partnership, determined that the Crow Creek Acquisition was fair and reasonable to the Partnership and its public unitholders and recommended to the Board of Directors that the transaction be approved and authorized. In determining the consideration for the acquisition of Crow Creek Energy, the Conflicts Committee, with the assistance of a third-party, considered the valuation of the properties involved in the transaction, the valuation of the units to be offered as consideration in the transaction and the cash flows of Crow Creek Energy.
In connection with the closing of the Crow Creek Acquisition, the Partnership entered into a registration rights agreement ("Registration Rights Agreement") with NGP VIII. The Registration Rights Agreement grants NGP VIII and certain of its affiliates registration rights with respect to the common units acquired pursuant to the Partnership's acquisition of Crow Creek Energy and their outstanding warrants to purchase common units that were previously acquired by NGP VIII and certain of its affiliates in connection with the Partnership's previously completed recapitalization transaction. Pursuant to the Registration Rights Agreement, NGP VIII and certain of its affiliates have the ability to demand that the Partnership register for resale their common units acquired pursuant to the acquisition of Crow Creek Energy and their existing warrants to purchase common units. This registration may be an underwritten offering at the discretion of NGP VIII and certain of its affiliates. NGP VIII and certain of its affiliates may demand up to four such registrations, subject to an increase to up to seven if the registration rights are amended. Additionally, the Registration Rights Agreement provides that NGP VIII and certain of its affiliates have piggyback registration rights in certain circumstances, which would require inclusion of their common units and warrants on registration statements that the Partnership files, subject to certain customer exceptions. There are no limits on the number of times NGP VIII and certain of its affiliates can exercise these piggyback registration rights.
Recapitalization and Related Transactions
In 2010, we completed a series of transactions (the "Recapitalization and Related Transactions") which simplified our capital structure and provided us with added financial liquidity. This series of transactions included:
| |
| • | the contribution, and resulting cancellation, of our incentive distribution rights and subordinated units held by Holdings, which occurred on May 24, 2010 (see Note 9); |
| |
| • | the sale of all of our fee mineral and royalty interests, as well as our equity investment in Ivory Working Interests, L.P., (collectively "the Minerals Business") to Black Stone Minerals Company, L.P. The sale was completed on May 24, 2010 (See Note 19); |
| |
| • | a rights offering, which was launched on June 1, 2010 and expired on June 30, 2010 (See Note 9); |
| |
| • | an option to capture the value of the controlling interest in us through (a) acquiring our general partner entities from Holdings and immediately thereafter eliminating our outstanding general partner units owned by Holdings and (b) reconstituting our Board to allow our common unitholders not affiliated with NGP to elect the majority of our directors (the "GP Acquisition Option"). On July 30, 2010, we completed the GP Acquisition Option, and our board of directors was expanded to include two additional independent directors who were appointed by the conflicts committee on July 30, 2010 (See Note 9). |
NOTE 11. RISK MANAGEMENT ACTIVITIES
Interest Rate Swap Derivative Instruments
To mitigate its interest rate risk, the Partnership entered into various interest rate swaps. These swaps convert the variable-rate term loan into a fixed-rate obligation. The purpose of entering into these swaps is to eliminate interest rate variability by converting LIBOR-based variable-rate payments to fixed-rate payments. Amounts received or paid under these swaps were recorded as reductions or increases in interest expense.
The following table sets forth certain information regarding the Partnership's various interest rate swaps as of December 31, 2011:
|
| | | | | | | | |
| Effective Date | | Expiration Date | | Notional Amount | | Fixed Rate |
| 9/30/2008 | | 12/31/2012 | | 150,000,000 |
| | 4.295 | % |
| 10/3/2008 | | 12/31/2012 | | 50,000,000 |
| | 4.095 | % |
| 6/22/2011 | | 6/22/2015 | | 250,000,000 |
| | 2.95 | % |
The Partnership's interest rate derivative counterparties include Wells Fargo Bank National Association and The Royal Bank of Scotland plc.
Commodity Derivative Instruments
The prices of crude oil, natural gas and NGLs are subject to fluctuations in response to changes in supply, demand, market uncertainty and a variety of additional factors which are beyond the Partnership's control. These risks can cause significant changes in the Partnership's cash flows and affect its ability to achieve its distribution objectives and comply with the covenants of its revolving credit facility. In order to manage the risks associated with changes in the future prices of crude oil, natural gas and NGLs on its forecasted equity production, the Partnership engages in non-speculative risk management activities that take the form of commodity derivative instruments. The Partnership has determined that it is necessary to hedge a substantial portion of its expected production in order to meaningfully reduce its future cash flow volatility. The Partnership generally limits its hedging levels to 80%, on an incurrence basis, of expected future production and has historically hedged substantially less than 80%, on an incurrence basis, of its expected future production for periods beyond 24 months. While hedging at this level of production does not eliminate all of the volatility in the Partnership's cash flows, it allows the Partnership to mitigate the risk of situations where a modest loss of production would put it in an over-hedged position. At times, the Partnership's strategy may involve entering into hedges with strike prices above current future prices or resetting existing hedges to higher price levels in order to meet its cash flow objectives or to stay in compliance with its revolving credit facility. In addition, the Partnership may also terminate or unwind hedges or portions of hedges when the expected future volumes do not support the level of hedges. Expected future production for its Upstream Business is derived from the proved reserves, adjusted for price-dependent expenses and revenue deductions. For the Midstream Business, expected future production is based on the expected production from wells currently flowing to the Partnership's processing plants, plus additional volumes the Partnership expects to receive from future drilling activity by its producer customer base. The Partnership's expectations for its Midstream Business volumes associated with future drilling are based on information it receives from its producer customer base and historical observations. The Partnership applies the appropriate contract terms to these projections to determine its expected future equity share of the commodities.
The Partnership uses fixed-price swaps, costless collars and put options to achieve its hedging objectives and often hedges its expected future volumes of one commodity with derivatives of the same commodity. In some cases, however, the Partnership believes it is better to hedge future changes in the price of one commodity with a derivative of another commodity, which it refers to as “cross-commodity” hedging. The Partnership will often hedge the changes in future NGL prices using crude oil hedges because NGL prices have been highly correlated to crude oil prices and hedging NGLs directly is usually less attractive due to the relative illiquidity in the NGL forward market. The Partnership may use natural gas hedges to hedge a portion of its expected future ethane production because forward prices for ethane are often heavily discounted from its current prices. Also, natural gas prices provide support for ethane prices because in many processing plants ethane can be recombined with the residue gas stream and sold as natural gas. When the Partnership uses cross-commodity hedging, it will convert the expected volumes of the underlying commodity to equivalent volumes of the hedged commodity. In the case of NGLs hedged with crude oil derivatives, these conversions are based on the linear regression of the prices of the two commodities observed during the previous 36 months and management's judgment regarding future price relationships of the commodities. In the case where ethane is hedged with natural gas derivatives, the conversion is based on the thermal content of ethane.
The Partnership has not designated, for accounting purposes, any of its commodity derivative instruments as hedges and therefore marks these derivative contracts to fair value (see Note 12). Changes in fair values of the commodity derivative
instruments are recorded as an adjustment to the mark-to-market gains (losses) on risk management transactions within revenue.
By using derivative instruments to economically hedge exposure to changes in commodity prices, the Partnership exposes itself to counterparty credit risk. Historically, the Partnership's counterparties have all been participants or affiliates of participants within its revolving credit facility (see Note 8), which is secured by substantially all of the assets of the Partnership. Therefore, the Partnership is not required to post any collateral, nor does it require collateral from its counterparties. In July 2011, the Partnership created a subsidiary to enhance its ability to market natural gas on behalf of itself and third parties. This subsidiary, through its financial derivative activity, will have credit exposure to additional counterparties. The Partnership minimizes the credit risk in derivative instruments by limiting its exposure to any single counterparty and monitoring the creditworthiness of its counterparties on an ongoing basis. In addition, the Partnership's derivative contracts, for certain counterparties, are subject to counterparty netting agreements governing such derivatives.
The Partnership's commodity derivative counterparties include BNP Paribas, Wells Fargo Bank, National Association, Comerica Bank, Bank of Nova Scotia, The Royal Bank of Scotland plc, Bank of America N.A., J Aron and Company (an affiliate of Goldman Sachs), ING Capital Markets LLC and BBVA Compass Bank.
The following tables set forth certain information regarding the Partnership's commodity derivatives. Within each table, some trades of the same commodities with the same tenors have been aggregated and shown as weighted averages.
Commodity derivatives, as of December 31, 2011, that will mature during the years ended December 31, 2012, 2013 and 2014:
|
| | | | | | | | | | | | | |
| Underlying | | Type | | Notional Volumes (units) (a) | | Floor Strike Price ($/unit)(b) | | Cap Strike Price ($/unit)(b) |
| Portion of Contracts Maturing in 2012 | | | | | | | | |
| Natural Gas | | Costless Collar | | 4,110,000 |
| | $ | 5.45 |
| | $ | 6.78 |
|
| Natural Gas | | Swap (Pay Floating/Receive Fixed) | | 11,400,000 |
| | 5.76 |
| | |
| Natural Gas | | Swap (Pay Fixed/Receive Floating) | | (1,560,000 | ) | | 3.97 |
| | |
| Crude Oil | | Costless Collar | | 831,576 |
| | 76.73 |
| | 96.60 |
|
| Crude Oil | | Swap (Pay Floating/Receive Fixed) | | 902,868 |
| | 83.10 |
| | |
| Ethane | | Swap (Pay Floating/Receive Fixed) | | 18,900,000 |
| | 0.73 |
| | |
| Propane | | Swap (Pay Floating/Receive Fixed) | | 31,449,600 |
| | 1.38 |
| | |
| IsoButane | | Swap (Pay Floating/Receive Fixed) | | 7,963,200 |
| | 1.80 |
| | |
| Normal Butane | | Swap (Pay Floating/Receive Fixed) | | 14,112,000 |
| | 1.73 |
| | |
| Natural Gasoline | | Swap (Pay Floating/Receive Fixed) | | 5,140,800 |
| | 2.22 |
| | |
| Portion of Contracts Maturing in 2013 | | | | | | | | |
| Natural Gas | | Costless Collar | | 3,540,000 |
| | 4.84 |
| | 5.47 |
|
| Natural Gas | | Swap (Pay Floating/Receive Fixed) | | 8,570,000 |
| | 5.38 |
| | |
| Crude Oil | | Costless Collar | | 99,000 |
| | 74.85 |
| | 104.57 |
|
| Crude Oil | | Swap (Pay Floating/Receive Fixed) | | 2,271,000 |
| | 97.61 |
| | |
| Portion of Contracts Maturing in 2014 | | | | | | | | |
| Natural Gas | | Swap (Pay Floating/Receive Fixed) | | 4,200,000 |
| | 5.55 |
| | |
| Crude Oil | | Swap (Pay Floating/Receive Fixed) | | 1,080,000 |
| | 97.36 |
| | |
_______________________
| |
| (a) | Volumes of natural gas are measured in MMbtu, volumes of crude oil are measured in barrels, and volumes of natural gas liquids are measured in gallons. |
| |
| (b) | Amounts represent the weighted average price. The weighted average prices are in $/MMbtu for natural gas, $/barrel for crude oil and $/gallon for natural gas liquids. |
Commodity Derivative Instruments - Marketing & Trading
During the year ended December 31, 2011, the Partnership created a subsidiary to conduct natural gas marketing and trading activities. This subsidiary engages in activities intended to capitalize on favorable price differentials between various receipt and delivery locations. The subsidiary's activities are governed by its risk policy.
The subsidiary enters into both financial derivatives and physical contracts. The subsidiary's financial derivatives, primarily basis swaps, are transacted: (i) to economically hedge subscribed capacity exposed to market rate fluctuations, and (ii) to mitigate the price risk related to other purchase and sales of natural gas. By entering into a basis swap, one pricing index is exchanged for another, effectively locking in the margin between the natural gas purchase and sale by removing index spread risk on the combined physical and financial transaction. Financial derivatives are transacted to mitigate price risk, and are not transacted with the sole purpose of taking a directional view of the market. As of December 31, 2011, the Partnership had outstanding basis swaps to purchase 4.4 million MMBtu and sell 4.4 million MMBtu of natural gas. These basis swaps will all mature in 2012.
A commodity-related derivative contract may be designated as a "normal" purchase or sale if the commodity is to be physically received or delivered for use or sale in the normal course of business. If designated as normal, the derivative contact is accounted for under the accrual method of accounting (not marked-to-market) with no balance sheet or income statement recognition of the contract until settlement. Commodity-related contracts that do not qualify for the normal designation are accounted for as derivatives and are marked-to-market each period. As of December 31, 2011, the Partnership had outstanding physical contracts to purchase approximately 2.3 million MMBtu and sell 13.9 million MMBtu of natural gas which do not qualify for the normal purchase or sale designation and were marked-to-market. These contracts all mature in 2012.
Changes in the fair value of these financial and physical contracts are recorded as adjustments to natural gas sales.
Fair Value of Interest Rate and Commodity Derivatives
Fair values of interest rate and commodity derivative instruments not designated as hedging instruments in the consolidated balance sheet as of December 31, 2011 and December 31, 2010: |
| | | | | | | | | | | |
| | As of
December 31, 2011 |
| | Derivative Assets | | Derivative Liabilities |
| | Balance Sheet Classification | | Fair Value | | Balance Sheet Classification | | Fair Value |
| | ($ in thousands) |
| Interest rate derivatives - liabilities | Current assets | | $ | — |
| | Current liabilities | | $ | (12,678 | ) |
| Interest rate derivatives - liabilities | Long-term assets | | — |
| | Long-term liabilities | | (11,331 | ) |
| Commodity derivatives - assets | Current assets | | 24,240 |
| | Current liabilities | | 15,357 |
|
| Commodity derivatives - assets | Long-term assets | | 26,611 |
| | Long-term liabilities | | 5,217 |
|
| Commodity derivatives - liabilities | Current assets | | (11,160 | ) | | Current liabilities | | (14,328 | ) |
| Commodity derivatives - liabilities | Long-term assets | | (2,321 | ) | | Long-term liabilities | | (779 | ) |
| Total derivatives | | | $ | 37,370 |
| | | | $ | (18,542 | ) |
| | | | | | | | |
| | As of
December 31, 2010 |
| | Derivative Assets | | Derivative Liabilities |
| | Balance Sheet Classification | | Fair Value | | Balance Sheet Classification | | Fair Value |
| | ($ in thousands) |
| Interest rate derivatives - liabilities | Current assets | | $ | — |
| | Current liabilities | | $ | (19,822 | ) |
| Interest rate derivatives - liabilities | Long-term assets | | — |
| | Long-term liabilities | | (14,757 | ) |
| Commodity derivatives - assets | Current assets | | — |
| | Current liabilities | | 9,150 |
|
| Commodity derivatives - assets | Long-term assets | | 2,402 |
| | Long-term liabilities | | 5,347 |
|
| Commodity derivatives - liabilities | Current assets | | — |
| | Current liabilities | | (28,678 | ) |
| Commodity derivatives - liabilities | Long-term assets | | (1,327 | ) | | Long-term liabilities | | (21,595 | ) |
| Total derivatives | | | $ | 1,075 |
| | | | $ | (70,355 | ) |
The following table sets forth the location of gains and losses for derivatives not designated as hedging instruments within the Partnership's audited consolidated statement of operations (in thousands):
|
| | | | | | | | | | | | | |
| Amount of Gain (Loss) Recognized in Income on Derivatives | | Year Ended December 31, |
| | | | 2011 | | 2010 | | 2009 |
| Interest rate derivatives | Interest rate risk management losses | | $ | (11,401 | ) | | $ | (27,135 | ) | | $ | (6,347 | ) |
| Commodity derivatives | Commodity risk management gains (losses) | | 32,510 |
| | (8,786 | ) | | (106,290 | ) |
| Commodity derivatives -trading | Natural gas, natural gas liquids, oil, condensate and sulfur sales | | 772 |
| | — |
| | — |
|
| | Total | | $ | 21,881 |
| | $ | (35,921 | ) | | $ | (112,637 | ) |
NOTE 12. FAIR VALUE OF FINANCIAL INSTRUMENTS
Effective January 1, 2008, the Partnership adopted authoritative guidance which, among other things, requires enhanced disclosures about assets and liabilities carried at fair value.
Fair value is the price that would be received to sell an asset or paid to transfer a liability in an orderly transaction between market participants at the measurement date (exit price). The Partnership utilizes market data or assumptions that market participants would use in pricing the asset or liability, including assumptions about risk inherent in the inputs to the valuation technique. The authoritative guidance establishes a fair value hierarchy that prioritizes the inputs used to measure fair value. The hierarchy gives the highest priority to unadjusted quoted prices in active markets for identical assets or liabilities (Level 1 measurements) and the lowest priority to unobservable inputs (Level 3 measurements).
The three levels of the fair value hierarchy are as follows:
Level 1 – Quoted prices are available in active markets for identical assets and liabilities as of the reporting date. Active markets are those in which transactions for the asset or liability occur in sufficient frequency and volume to provide information on an ongoing basis.
Level 2 – Pricing inputs are other than quoted prices in active markets included in Level 1, which are either directly or indirectly observable as of the reporting date. Level 2 includes those financial instruments that are valued using models or other valuation methodologies. These models are primarily industry-standard models that consider various assumptions, including quoted forward prices for commodities, time value, volatility factors and current market and contractual prices for the underlying instruments, as well as other relevant economic measures. Substantially all of these assumptions are observable in the market place throughout the full term of the instrument, can be derived from observable data or are supported by observable levels at which transactions are executed in the marketplace.
Level 3 – Pricing inputs include significant inputs that are generally less observable from objective sources. These inputs may be used with internally developed methodologies that result in management's best estimate of fair value.
As of December 31, 2011, the Partnership has recorded its interest rate swaps and commodity derivative instruments (see Note 11), which includes crude oil, natural gas and NGLs, at fair value. The Partnership reviews the classification of the inputs at the end of each period and has classified the inputs to measure the fair value of its interest rate swaps, crude oil derivatives and natural gas derivatives as Level 2. In prior periods, the Partnership has classified the inputs to measure its NGL derivatives as Level 3 as the NGL market was considered to be less liquid and thinly traded. As of September 30, 2011, the Partnership concluded that the inputs for its NGL derivatives were considered to be more observable due to the NGL market being more liquid through the term of our contracts and has classified these inputs as Level 2. The following table discloses the fair value of the Partnership's derivative instruments as of December 31, 2011 and December 31, 2010:
|
| | | | | | | | | | | | | | | | | | | |
| | As of
December 31, 2011 |
| | Level 1 | | Level 2 | | Level 3 | | Netting (a) | | Total |
| | ($ in thousands) |
| Assets: | | | | | | | | | |
| Crude oil derivatives | $ | — |
| | $ | 11,795 |
| | $ | — |
| | $ | (14,150 | ) | | $ | (2,355 | ) |
| Natural gas derivatives | — |
| | 58,374 |
| | — |
| | (17,930 | ) | | 40,444 |
|
| NGL derivatives | — |
| | 1,256 |
| | — |
| | (1,975 | ) | | (719 | ) |
| Total | $ | — |
| | $ | 71,425 |
| | $ | — |
| | $ | (34,055 | ) | | $ | 37,370 |
|
| | | | | | | | | | |
| Liabilities: | |
| | |
| | |
| | |
| | |
|
| Crude oil derivatives | $ | — |
| | $ | (24,051 | ) | | $ | — |
| | $ | 14,150 |
| | $ | (9,901 | ) |
| Natural gas derivatives | — |
| | (1,290 | ) | | — |
| | 17,930 |
| | 16,640 |
|
| NGL derivatives | — |
| | (3,247 | ) | | — |
| | 1,975 |
| | (1,272 | ) |
| Interest rate swaps | — |
| | (24,009 | ) | | — |
| | — |
| | (24,009 | ) |
| Total | $ | — |
| | $ | (52,597 | ) | | $ | — |
| | $ | 34,055 |
| | $ | (18,542 | ) |
____________________________
| |
| (a) | Represents counterparty netting under agreement governing such derivative contracts. |
|
| | | | | | | | | | | | | | | | | | | |
| | As of
December 31, 2010 |
| | Level 1 | | Level 2 | | Level 3 | | Netting (a) | | Total |
| | ($ in thousands) |
| Assets: | | | | | | | | | |
| Crude oil derivatives | $ | — |
| | $ | — |
| | $ | — |
| | $ | (1,292 | ) | | $ | (1,292 | ) |
| Natural gas derivatives | — |
| | 16,731 |
| | — |
| | (14,364 | ) | | 2,367 |
|
| NGL derivatives | — |
| | — |
| | 168 |
| | (168 | ) | | — |
|
| Total | $ | — |
| | $ | 16,731 |
| | $ | 168 |
| | $ | (15,824 | ) | | $ | 1,075 |
|
| | | | | | | | | | |
| Liabilities: | |
| | |
| | |
| | |
| | |
|
| Crude oil derivatives | $ | — |
| | $ | (45,664 | ) | | $ | — |
| | $ | 1,292 |
| | $ | (44,372 | ) |
| Natural gas derivatives | — |
| | (35 | ) | | — |
| | 14,364 |
| | 14,329 |
|
| NGL derivatives | — |
| | — |
| | (5,901 | ) | | 168 |
| | (5,733 | ) |
| Interest rate swaps | — |
| | (34,579 | ) | | — |
| | — |
| | (34,579 | ) |
| Total | $ | — |
| | $ | (80,278 | ) | | $ | (5,901 | ) | | $ | 15,824 |
| | $ | (70,355 | ) |
____________________________
| |
| (a) | Represents counterparty netting under agreement governing such derivative contracts. |
The following table sets forth a reconciliation of changes in the fair value of the Level 3 NGL derivatives during the year ended December 31, 2011, 2010 and 2009 (in thousands):
|
| | | | | | | | | | | |
| | Year Ended December 31, |
| | 2011 | | 2010 | | 2009 |
| Net liability beginning balance | $ | (5,733 | ) | | $ | (14,784 | ) | | $ | 14,016 |
|
| Settlements | 15,562 |
| | 12,358 |
| | 66 |
|
| Total gains or losses (realized and unrealized) | (12,784 | ) | | (3,307 | ) | | (28,866 | ) |
| Transfers out of Level 3 | 2,955 |
| | — |
| | — |
|
| Net liability ending balance | $ | — |
| | $ | (5,733 | ) | | $ | (14,784 | ) |
The Partnership values its Level 3 NGL derivatives using forward curves, interest rate curves, and volatility parameters, when applicable. In addition, the impact of counterparty credit risk is factored into the value of derivative assets, and the Partnership's credit risk is factored into the value of derivative liabilities.
The Partnership recognized losses of $5.7 million and $15.2 million in the years ended December 31, 2010 and 2009, respectively, that are attributable to the change in unrealized gains or losses related to those Level 3 assets and liabilities still held at December 31, 2010 and 2009, which are included in the commodity risk management (losses) gains.
Realized and unrealized losses related to the interest rate derivatives are recorded as part of interest rate risk management gains and losses in the audited consolidated statements of operations. Realized and unrealized gains and losses and premium amortization related to the Partnership's commodity derivatives are recorded as a component of revenue in the audited consolidated statements of operations.
Fair Value of Assets and Liabilities Measured on a Non-recurring Basis
The following table discloses the fair value of the Partnership's assets measured at fair value on a nonrecurring basis for the year ended December 31, 2011 (in thousands): |
| | | | | | | | | | | | | | | | | | | |
| | December 31,
2011 | | Level 1 | | Level 2 | | Level 3 | | Total Losses |
| Proved properties | $ | 4,494 |
| | $ | — |
| | $ | — |
| | $ | 4,494 |
| | $ | 11,239 |
|
In connection with the preparation of these financial statements for the year ended December 31, 2011, the Partnership wrote down proved properties with a carrying value of $15.7 million to their fair value of $4.5 million, resulting in an impairment charge of $11.2 million being included in earnings for the year ended December 31, 2011. The impairment charges related to proved properties in the Upstream Segment reflected future drilling locations in the Permian region and a specific South Texas field that were no longer economical in the current natural gas price environment. The Partnership calculated the fair value of the impaired assets using discounted cash flow analysis to determine the excess of the asset's carrying value over its fair value. Significant inputs to the valuation of fair value of the proved properties included estimates of (i) reserves, (ii) future operating and development costs (ii) forward commodity prices and (iii) a discount rate reflective of our cost of capital. For the other assets impaired by the partnership during the year ended December 31, 2011, the assets were fully written down and are thus not included in the table above.
The carrying amount of cash equivalents is believed to approximate their fair values because of the short maturities of these instruments. The fair value of accounts receivable and accounts payable are not materially different from their carrying amounts because of the short-term nature of these instruments.
As of December 31, 2011, the outstanding debt associated with the Credit Agreement bore interest at a floating rate; as such, the Partnership believes that the carrying value of this debt approximates its fair value. The outstanding debt associated with the Senior Notes bears interest at a fixed rate; based on the market price of the Senior Notes as of December 31, 2011, the Partnership estimates that the fair value of the Senior Notes is $301.5 million compared to a carrying value of $298.0 million.
NOTE 13. COMMITMENTS AND CONTINGENT LIABILITIES
Litigation—The Partnership is subject to lawsuits which arise from time to time in the ordinary course of business, such as the interpretation and application of contractual terms related to the calculation of payment for liquids and natural gas proceeds. The Partnership had no accruals as of December 31, 2011 and December 31, 2010 related to legal matters, and current lawsuits are not expected to have a material adverse effect on our financial position, results of operations or cash flows. The Partnership has been indemnified up to a certain dollar amount for two lawsuits. If there ultimately is a finding against the Partnership in these two indemnified cases, the Partnership would expect to make a claim against the indemnification up to limits of the indemnification.
Insurance—The Partnership covers its operations and assets with insurance which management believes is consistent with that in force for other companies engaged in similar commercial operations with similar type properties. This insurance includes: (1) commercial general liability insurance covering liabilities to third parties for bodily injury, property damage and pollution arising out of Eagle Rock Energy operations; (2) workers’ compensation liability coverage for employees to required statutory limits; (3) automobile liability insurance covering liability to third parties for bodily injury and property damage arising out of the operation of all owned, hired and non-owned vehicles by its employees on company business; (4) property insurance covering the replacement cost of all owned real and personal property, including coverage for losses due to boiler and machinery breakdown, earthquake, flood and consequent business interruption/extra expense; (5) control of well/operator's extra expense insurance for operated and non-operated wells in the Upstream Segment; and (6) corporate liability insurance including coverage for Directors and Officers and Employment Practices liabilities. In addition, the Partnership maintains excess liability insurance providing limits in excess of the established primary limits for commercial general liability and
automobile liability insurance.
All coverages are subject to industry accepted policy terms, conditions, limits and deductibles comparable to that obtained by other energy companies with similar operations. The cost of insurance for the energy industry continued to fluctuate over the past year, reflecting the changing conditions in the insurance markets.
Environmental—The operation of pipelines, plants and other facilities for gathering, transporting, processing, treating, or storing natural gas, NGLs and other products is subject to stringent and complex laws and regulations pertaining to health, safety and the environment. As an owner or operator of these facilities, the Partnership must comply with United States laws and regulations at the federal, state and local levels that relate to air and water quality, hazardous and solid waste management and disposal and other environmental matters. The cost of planning, designing, constructing and operating pipelines, plants, and other facilities must incorporate compliance with environmental laws and regulations and safety standards. Failure to comply with these laws and regulations may trigger a variety of administrative, civil and potentially criminal enforcement measures, including citizen suits, which can include the assessment of monetary penalties, the imposition of remedial requirements and the issuance of injunctions or restrictions on operation. Management believes that, based on currently known information, compliance with these laws and regulations will not have a material adverse effect on the Partnership's combined results of operations, financial position or cash flows. At December 31, 2011 and December 31, 2010, the Partnership had accrued approximately $3.2 million and $4.0 million, respectively, for environmental matters.
Retained Revenue Interest—Certain assets of the Partnership's Upstream Segment are subject to retained revenue interests. These interests were established under purchase and sale agreements that were executed by the Partnership's predecessors in title. The terms of these agreements entitle the owners of the retained revenue interests to a portion of the revenues received from the sale of the hydrocarbons above specified base oil and natural gas prices. These retained revenue interests do not represent a real property interest in the hydrocarbons. The Partnership's reported revenues are reduced to account for the retained revenue interests on a monthly basis.
The retained revenue interests affect the Partnership's interest at the Big Escambia Creek, Flomaton and Fanny Church fields in Escambia County, Alabama. With respect to the Partnership's Flomaton and Fanny Church fields, these retained revenue interests are in effect for any calendar year in which the Partnership surpasses certain average net production rates. The Partnership did not surpass such rates in 2011 and does not anticipate doing so in 2012. With respect to the Partnership's Big Escambia Creek field, the retained revenue interest commenced in 2010 and continues through the end of 2019.
Other Commitments—The Partnership utilizes assets under operating leases for its corporate office, certain rights-of-way and facilities locations, vehicles and in several areas of its operations. Rental expense, including leases with no continuing commitment, amounted to approximately $7.8 million, $7.8 million and $8.9 million for the years ended December 31, 20111 2010 and 2009, respectively. Rental expense for leases with escalation clauses is recognized on a straight-line basis over the initial lease term. At December 31, 2011, commitments under long-term non-cancelable operating leases for the next five years are as follows: 2012 - $5.7 million: 2013 - $3.3 million: 2014 - $2.3 million: 2015 - $1.6 million and 2016 - $0.3 million.
NOTE 14. SEGMENTS
During the fourth quarter of 2011, the Partnership's chief operating decision-maker (“CODM”) decided that due to the relative size of the East Texas/Louisiana, South Texas and Gulf of Mexico segments, these three reporting segments would be collapsed into a single reporting segment and that a new Marketing and Trading reporting segment would be created. The Midstream Business's financial results are now reported in the following segments: (i) Texas Panhandle, which no longer includes the results of the Partnership's Marketing and Trading operations, (ii) East Texas and Other Midstream, which consolidates the Partnership's former East Texas/Louisiana, South Texas and Gulf of Mexico segments, and (iii) Marketing and Trading, which is a new reporting segment. Operating results for the reportable segments have been recast for the years ending December 31, 2010 and 2009 to reflect these changes. The Partnership's Upstream Segment and functional (Corporate) Segment remained unchanged from what has been previously reported.
Based on the Partnership’s approach to managing its assets, the Partnership believes its operations consist of three segments in its Midstream Business, one Upstream Segment and one Corporate segment:
(i) Midstream—Texas Panhandle Segment:
gathering, compressing, treating, processing and transporting natural gas; fractionating, transporting and marketing NGLs;
(ii) Midstream—East Texas and Other Midstream Segment:
gathering, compressing, processing and treating natural gas and marketing of natural gas, NGLs and condensate in South Texas,
East Texas, Louisiana, Gulf of Mexico and inland waters of Texas;
(iii) Midstream—Marketing and Trading Segment:
crude oil logistics and marketing in the Texas Panhandle and Alabama; and natural gas marketing and trading;
(iv) Upstream Segment:
crude oil, natural gas, NGLs and sulfur production from operated and non-operated wells; and
(v) Corporate and Other Segment:
risk management, intersegment eliminations and other corporate activities such as general and administrative expenses.
On May 20, 2011, the Partnership completed its sale of the Wildhorse Gathering System, which was previously reported under the East Texas and Other Midstream Segment. As authoritative guidance requires, the operations for components of entities disposed of shall be recorded as part of discontinued operations. Operating results for the Wildhorse Gathering System for each of the years ended December 31, 2010 and 2009, have been excluded from the Partnership’s segment presentation below. See Note 19 for a further discussion of the sale of the Partnership’s Wildhorse System.
The Partnership's CODM currently reviews its operations using these segments. The CODM evaluates segment performance based on segment operating income or loss from continuing operations. Summarized financial information concerning the Partnership's reportable segments is shown in the following tables:
|
| | | | | | | | | | | | | | | | | | | | | | | | | | | | | | |
Year Ended December 31, 2011 | | Texas Panhandle Segment | | East Texas and Other Midstream Segment | | Marketing and Trading Segment | | Total Midstream Business | | Upstream Segment | | Corporate and Other Segment | | Total Segments |
| ($ in thousands) | | | | | | | | | | | | | | | | |
| Sales to external customers | | $ | 395,991 |
| | $ | 274,361 |
| | $ | 200,939 |
| | $ | 871,291 |
| | $ | 156,107 |
| (c) | | $ | 32,510 |
| (a) | | $ | 1,059,908 |
|
| Intersegment sales | | 60,237 |
| | 16,654 |
| | (82,378 | ) | | (5,487 | ) | | 48,203 |
| | | (42,716 | ) | | | — |
|
| Cost of natural gas and natural gas liquids | | 327,775 |
| | 231,642 |
| | 73,767 |
| | 633,184 |
| | — |
| | | — |
| | | 633,184 |
|
| Intersegment cost of natural gas,oil and condensate | | — |
| | — |
| | 41,382 |
| | 41,382 |
| | — |
| | | (41,382 | ) | | | — |
|
| Operating costs and other expenses | | 41,749 |
| | 22,790 |
| | — |
| | 64,539 |
| | 47,657 |
| | | 54,998 |
| | | 167,194 |
|
| Intersegment operations and maintenance | | — |
| | — |
| | — |
| | — |
| | 66 |
| | | (66 | ) | | | — |
|
| Depreciation, depletion, amortization and impairment | | 41,594 |
| | 27,629 |
| | — |
| | 69,223 |
| | 77,259 |
| | | 1,417 |
| | | 147,899 |
|
| Operating income (loss) from continuing operations | | $ | 45,110 |
| | $ | 8,954 |
| | $ | 3,412 |
| | $ | 57,476 |
| | $ | 79,328 |
| | | $ | (25,173 | ) | | | $ | 111,631 |
|
| Capital Expenditures | | $ | 71,351 |
| | $ | 10,860 |
| | $ | 2,205 |
| | $ | 84,416 |
| | $ | 92,660 |
| | | $ | 2,132 |
| | | $ | 179,208 |
|
| Segment Assets | | $ | 599,688 |
| | $ | 374,030 |
| | $ | 40,173 |
| | $ | 1,013,891 |
| | $ | 979,331 |
| | | $ | 52,466 |
| (b) | | $ | 2,045,688 |
|
|
| | | | | | | | | | | | | | | | | | | | | | | | | | | | | | |
| Year Ended December 31, 2010 | | Texas Panhandle Segment | | East Texas and Other Midstream Segment | | Marketing and Trading Segment | | Total Midstream Business | | Upstream Segment | | Corporate and Other Segment | | Total Segments |
| ($ in thousands) | | | | | | | | | | | | | | | | |
| Sales to external customers | | $ | 346,571 |
| | $ | 294,188 |
| | $ | 11,664 |
| | $ | 652,423 |
| | $ | 88,672 |
| (c) | | $ | (8,786 | ) | (a) | | $ | 732,309 |
|
| Intersegment sales | | — |
| | — |
| | — |
| | — |
| | 6,063 |
| | | (6,063 | ) | | | — |
|
| Cost of natural gas and natural gas liquids | | 231,880 |
| | 230,837 |
| | 5,587 |
| | 468,304 |
| | — |
| | | — |
| | | 468,304 |
|
| Intersegment cost of natural gas,oil and condensate | | — |
| | — |
| | 5,587 |
| | 5,587 |
| | — |
| | | (5,587 | ) | | | — |
|
| Operating costs and other expenses | | 35,013 |
| | 20,885 |
| | 19 |
| | 55,917 |
| | 32,724 |
| (d) | | 45,775 |
| | | 134,416 |
|
| Intersegment operations and maintenance | | — |
| | — |
| | — |
| | — |
| | 47 |
| | | (47 | ) | | | — |
|
| Depreciation, depletion, amortization and impairment | | 45,876 |
| | 31,678 |
| | — |
| | 77,554 |
| | 33,960 |
| | | 1,550 |
| | | 113,064 |
|
| Operating income (loss) from continuing operations | | $ | 33,802 |
| | $ | 10,788 |
| | $ | 471 |
| | $ | 45,061 |
| | $ | 28,004 |
| | | $ | (56,540 | ) | | | $ | 16,525 |
|
| Capital Expenditures | | $ | 29,282 |
| | $ | 16,026 |
| | $ | — |
| | $ | 45,308 |
| | $ | 26,772 |
| | | $ | 1,609 |
| | | $ | 73,689 |
|
| Segment Assets | | $ | 559,405 |
| | $ | 409,076 |
| | $ | 7,236 |
| | $ | 975,717 |
| | $ | 359,474 |
| | | $ | 14,206 |
| (b) | | $ | 1,349,397 |
|
|
| | | | | | | | | | | | | | | | | | | | | | | | | | |
Year Ended December 31, 2009 | | Texas Panhandle Segment | | East Texas and Other Midstream Segment | | Total Midstream Business | | Upstream Segment | | Corporate and Other Segment | | Total Segments |
| ($ in thousands) | | | | | | | | | | | | | | |
| Sales to external customers | | $ | 293,952 |
| | $ | 321,635 |
| | $ | 615,587 |
| | $ | 63,633 |
| | | $ | (106,290 | ) | (a) | | $ | 572,930 |
|
| Cost of natural gas and natural gas liquids | | 206,985 |
| | 263,114 |
| | 470,099 |
| | — |
| | | — |
| | | 470,099 |
|
| Operating costs and other expenses | | 31,873 |
| | 21,796 |
| | 53,669 |
| | 24,984 |
| (d) | | 45,819 |
| | | 124,472 |
|
| Depreciation, depletion, amortization and impairment | | 46,085 |
| | 41,037 |
| | 87,122 |
| | 42,123 |
| | | 1,073 |
| | | 130,318 |
|
| Operating income (loss) from continuing operations | | $ | 9,009 |
| | $ | (4,312 | ) | | $ | 4,697 |
| | $ | (3,474 | ) | | | $ | (153,182 | ) | | | $ | (151,959 | ) |
| Capital Expenditures | | $ | 7,293 |
| | $ | 18,615 |
| | $ | 25,908 |
| | $ | 8,437 |
| | | $ | 2,022 |
| | | $ | 36,367 |
|
| Segment Assets | | $ | 539,899 |
| | $ | 466,944 |
| | $ | 1,006,843 |
| | $ | 363,667 |
| | | $ | 164,308 |
| | | $ | 1,534,818 |
|
______________________________
| |
| (a) | Represents results of the Partnership's commodity risk management activity. |
| |
| (b) | Includes elimination of intersegment transactions. |
| |
| (c) | Sales to external customers for the years ended December 31, 2011 and 2010 includes $2.0 million and $3.0 million, respectively, of business interruption insurance recovery related to the shutdown of the Eustace plant in 2010 in the Upstream Segment, which is recognized as part of Other revenue in the unaudited condensed consolidated statement of operations. |
| |
| (d) | Includes costs to dispose of sulfur in the Upstream Segment of $0.7 million and $2.2 million, respectively, for the years ended December 31, 2010 and 2009. |
NOTE 15. EMPLOYEE BENEFIT PLAN
The Partnership offers a defined contribution benefit plan to its employees. For the three years ended December 31, 2011, the plan provided for a dollar for dollar matching contribution by the Partnership of up to 3% of an employee's contribution and 50% of additional contributions up to an additional 2%. Additionally, the Partnership may, at its sole discretion and election, contribute up to 6% of a participating employee's base salary annually, subject to vesting requirements. Expenses under the plan for the years ended December 31, 2011, 2010 and 2009 were approximately $1.0 million, $1.0 million and $0.7 million, respectively.
NOTE 16. INCOME TAXES
The Partnership's provision for income taxes relates to (i) state taxes for the Partnership and (ii) federal taxes for Eagle Rock Energy Acquisition Co., Inc, (acquiring entity of Redman Energy Holdings, L.P. and Redman Energy Holdings II, L.P. and certain assets owned by NGP Income Co-Investment Opportunities Fund II, L.P. (collectively the "Redman Acquisition") in 2007) and Eagle Rock Energy Acquisition Co. II, Inc. (acquiring entity of certain entities acquired in the Stanolind Acquisition in 2008) and their wholly owned corporations, Eagle Rock Upstream Development Company, Inc., (successor entity of certain entities acquired in the Redman acquisition) and Eagle Rock Upstream Development Company II, Inc. (successor entity of certain entities acquired in the Stanolind acquisition), which are subject to federal income taxes (the “C Corporations”). In addition, the Partnership has become a taxable entity in the state of Texas. On May 18, 2006, the State of Texas enacted House Bill 3 which revised the pre-existing state franchise tax. In general, legal entities that conduct business in Texas are subject to the Revised Texas Franchise Tax, including previously non-taxable entities such as limited partnerships and limited liability partnerships. The tax is assessed on Texas sourced taxable margin which is defined as the lesser of (i) 70% of total revenue or (ii) total revenue less (a) cost of goods sold or (b) compensation and benefits. Although the bill states that the Revised Texas Franchise Tax is not an income tax, it has the characteristics of an income tax since it is determined by applying a tax rate to a base that considers both revenues and expenses.
The Partnership's federal and state income tax provision is summarized below (in thousands):
|
| | | | | | | | | | | |
| | For the Year Ended December 31, |
| | 2011 | | 2010 | | 2009 |
| Current: | | | | | |
| Federal | $ | 1,092 |
| | $ | 236 |
| | $ | 680 |
|
| State | 61 |
| | (240 | ) | | 1,464 |
|
| Total current provision | 1,153 |
| | (4 | ) | | 2,144 |
|
| Deferred: | | | | | |
| Federal | (3,862 | ) | | (2,204 | ) | | 1,862 |
|
| State | 277 |
| | 513 |
| | 235 |
|
| Total deferred | (3,585 | ) | | (1,691 | ) | | 2,097 |
|
| Total (benefit) provision for income taxes | (2,432 | ) | | (1,695 | ) | | 4,241 |
|
| Add Back: Valuation allowance for Federal tax attributes | — |
| | — |
| | (3,154 | ) |
| Total (benefit) provision for income taxes less valuation allowance | (2,432 | ) | | (1,695 | ) | | 1,087 |
|
| Income taxes from discontinued operations | — |
| | (890 | ) | | (98 | ) |
| Total (benefit) provision for income taxes on continuing operations | $ | (2,432 | ) | | (2,585 | ) | | 989 |
|
The effective rates for the years ended December 31, 2011, 2010 and 2009 are shown in the table below. For 2011, the effective tax rate is attributable to the state and federal taxes being applied to their book income. In 2010 and 2009, the federal and state based income taxes were applied against book losses which resulted in a 10.3% and100.0% effective tax rate, respectively. A reconciliation of the provision for income taxes with amounts determined by applying the statutory U.S. federal income tax rate to income before income taxes is as follows (in thousands):
|
| | | | | | | | | | | |
| | For the Year Ended December 31, |
| | 2011 | | 2010 | | 2009 |
| Pre-tax net book income (loss) from continuing operations | 70,424 |
| | (25,196 | ) | | (179,846 | ) |
| Texas Margin Tax current and deferred | 338 |
| | (617 | ) | | 1,601 |
|
| Federal income taxes computed by applying the federal statutory rate to NBI of corporate entities | (2,232 | ) | | (1,498 | ) | | (963 | ) |
| Tax attributes used | (538 | ) | | (470 | ) | | (2,803 | ) |
| Valuation allowance | — |
| | — |
| | 3,154 |
|
| (Benefit) provision for income taxes from continuing operations | $ | (2,432 | ) | | $ | (2,585 | ) | | $ | 989 |
|
| Effective income tax rate on continuing operations | (3.5 | )% | | 10.3 | % | | 100.0 | % |
Significant components of deferred tax liabilities and deferred tax assets as of December 31, 2011 and 2010 are as follows (in thousands):
|
| | | | | | | |
| | December 31, 2011 | | December 31, 2010 |
| Deferred Tax Assets: | | | |
| Statutory depletion carryover | $ | 1,372 |
| | $ | 1,765 |
|
| AMT credit carryforward | 60 |
| | 204 |
|
| Total deferred tax | 1,432 |
| | 1,969 |
|
| Less: valuation allowance | — |
| | — |
|
| Net Deferred Tax Assets | 1,432 |
| | 1,969 |
|
| | | | |
| Deferred Tax Liabilities: | | | |
| Property, plant, equipment & amortizable assets | (6,395 | ) | | (3,295 | ) |
| Unrealized hedging transactions | (126 | ) | | (540 | ) |
| Book/tax differences from partnership investment | (38,695 | ) | | (34,827 | ) |
| Total Deferred Tax Liabilities | (45,216 | ) | | (38,662 | ) |
| Total Net Deferred Tax Liabilities | (43,784 | ) | | (36,693 | ) |
| Current portion of total net deferred tax liabilities | — |
| | — |
|
| Long-term portion of total net deferred tax liabilities | $ | (43,784 | ) | | $ | (36,693 | ) |
The largest single component of the Partnership's deferred tax liabilities is related to federal income taxes of the C Corporations described above, where the book/tax differences were created by the Redman and Stanolind Acquisitions. These book/tax temporary differences will be reduced as allocation of built-in gain in proportion to the assets contributed brings the book and tax basis closer together over time. This net deferred tax liability was recognized in conjunction with the purchase accounting adjustments for long term assets.
Due to the enactment of the Revised Texas Franchise Tax, the Partnership recorded a net deferred tax liability related to the book/tax differences in property, plant and equipment and unrealized hedging transactions.
In assessing the realizability of deferred tax assets, management considers whether it is more likely than not that some portion or all of the deferred tax assets will not be realized. The ultimate realization of deferred tax assets is dependent upon the generation of future taxable income during the periods in which those temporary differences become deductible. Management considers the scheduled reversal of deferred tax liabilities, projected future taxable income and tax planning strategies in making this assessment. At December 31, 2011, based upon the level of historical taxable income and projections for future taxable income over the periods in which the deferred tax assets are deductible, management believes it is more likely than not that the Partnership will realize the benefits of these deductible differences. The amount of deferred tax assets considered realizable could be reduced in the future if estimates of future taxable income during the carryforward period are reduced. The AMT credit carryforward presented above does not have an expiration date.
The Partnership adopted authoritative guidance related to accounting for uncertainty in income taxes on January 1, 2007. The Partnership has taken a position which is deemed to be “more likely than not” to be upheld upon review, if any, with respect to the deductibility of certain costs for the purpose of its franchise tax liability on a state franchise return. The Partnership has recorded a provision for the portion of this tax liability equal to the probability of recognition. In addition, the Partnership has accrued interest and penalties associated with these liabilities and has recorded these amounts within its state deferred income tax expense. The amount stated below relates to the tax returns filed for 2011, 2010 and 2009, which are still open under current statute.
A reconciliation of the beginning and ending amount of the unrecognized tax benefits (liabilities) is as follows (in thousands):
|
| | | | | | | | | | | |
| | 2011 | | 2010 | | 2009 |
| Balance at beginning of period | $ | (569 | ) | | $ | (267 | ) | | $ | — |
|
| Increases related to prior year tax positions | — |
| | — |
| | — |
|
| Increases related to current year tax positions | (132 | ) | | (302 | ) | | (267 | ) |
| Increases related to tax interest and penalties | (34 | ) | | — |
| | — |
|
| Balance at end of period | $ | (735 | ) | | $ | (569 | ) | | $ | (267 | ) |
NOTE 17. EQUITY-BASED COMPENSATION
Eagle Rock Energy G&P, LLC, the general partner of the general partner of the Partnership, has a long-term incentive plan, as amended (“LTIP”), for its employees, directors and consultants who provide services to the Partnership and its subsidiaries and affiliates. The LTIP provides for the issuance of an aggregate of up to 7,000,000 common units, to be granted either as options, restricted units or phantom units. Distributions declared and paid on outstanding restricted units are paid directly to the holders of the restricted units. No options or phantom units have been issued to date.
The restricted units granted are valued at the market price as of the date issued. The weighted average fair value of the units granted during the years ended December 31, 2011, 2010 and 2009 was $10.13, $6.60 and $5.58, respectively. The awards generally vest over three years on the basis of one third of the award each year. The Partnership recognizes compensation expense on a straight-line basis over the requisite service period for the restricted unit grants. During the restriction period, distributions associated with the granted awards will be distributed to the awardees.
A summary of the restricted common units’ activity for the year ended December 31, 2011 is provided below:
|
| | | | | | |
| | Number of Restricted Units | | Weighted Average Fair Value |
| Outstanding at December 31, 2010 | 1,744,454 |
| | $ | 6.27 |
|
| Granted | 1,726,240 |
| | $ | 10.13 |
|
| Vested | (608,122 | ) | | $ | 6.25 |
|
| Forfeited | (302,462 | ) | | $ | 7.66 |
|
| Outstanding at December 31, 2011 | 2,560,110 |
| | $ | 8.71 |
|
For the years ended December 31, 2011, 2010 and 2009, non-cash compensation expense of approximately $5.1 million, $5.4 million and $6.3 million, respectively, was recorded related to the granted restricted units as general and administrative expense on the audited consolidated statements of operations.
As of December 31, 2011, unrecognized compensation costs related to the outstanding restricted units under the LTIP totaled approximately $19.2 million. The remaining expense is to be recognized over a weighted average of 2.46 years.
In connection with the vesting of certain restricted units during the years ended December 31, 2011, 2010 and 2009, 137,985, 181,292 and 17,492, respectively, of the newly-vested common units were cancelled by the Partnership in satisfaction of $1.4 million, $1.2 million and $0.1 million, respectively, of minimum employee tax liability paid by the Partnership. Pursuant to the terms of the LTIP, these cancelled units are available for future grants under the LTIP.
In addition to equity awards under the LTIP, Eagle Rock Holdings, L.P. (“Holdings”), which is controlled by NGP, granted, from time to time, equity in Holdings to certain employees working on behalf of the Partnership, some of which are named executive officers. During the years ended December 31, 2010 and 2009, Holdings granted 40,000 and 160,000, respectively, “Tier I” incentive interests to certain Eagle Rock Energy employees. The Partnership recorded a portion of the value of the incentive units as compensation expense in the Partnership's Consolidated Statements of Operations. This allocation is based on management's estimation of the total value of the incentive unit grant and of the grantees' portion of time dedicated to the Partnership. The Partnership recorded non-cash compensation expense of $0.1 million and $0.4 million based on management's estimates related to the Tier I incentive unit grants made by Holdings during the years ended December 31, 2010 and 2009, respectively.
NOTE 18. EARNINGS PER UNIT
Basic earnings per unit is computed by dividing the net income (loss) by the weighted average number of units outstanding during a period. To determine net income (loss) allocated to each class of ownership (common, subordinated and general partner), the Partnership first allocates net income (loss) in accordance with the amount of distributions made for the quarter by each class, if any. The remaining net income (loss) is allocated to each class in proportion to the class weighted average number of units outstanding for a period, as compared to the weighted average number of units for all classes for the period.
As of December 31, 2011 and 2010, the Partnership had unvested restricted common units outstanding, which are considered dilutive securities. These units will be considered in the diluted weighted average common unit outstanding number in periods of net income. In periods of net losses, these units are excluded from the diluted weighted average common unit outstanding number.
Any warrants outstanding during the period are considered to be dilutive securities. These outstanding warrants will be considered in the diluted weighted average common units outstanding number in periods of net income, except if the exercise price of the outstanding warrants is greater than the average market price of the common units for such periods. In periods of net losses, the outstanding warrants are excluded from the diluted weighted average common units outstanding.
Under the Partnership's original partnership agreement, which was amended and restated on May 24, 2010 in connection with approval of the recapitalization and related transactions, for any quarterly period, incentive distribution rights (“IDRs”) participated in net income only to the extent of the amount of cash distributions actually declared, thereby excluding the IDRs from participating in undistributed earnings or losses. Accordingly, undistributed net income is assumed to be allocated to the other ownership interests on a pro-rata basis. During the years ended December 31, 2010 and 2009, the Partnership did not declare a quarterly distribution for the IDRs. On May 24, 2010, the Partnership's general partner contributed all of the outstanding IDRs to the Partnership, and they were eliminated.
In addition, all of the subordinated units and general partner units were contributed to the Partnership and cancelled on May 24, 2010 and July 30, 2010, respectively.
The following table presents the Partnership's calculation of basic and diluted units outstanding for the periods indicated:
|
| | | | | | | | |
| | Year Ended December 31, |
| | 2011 | | 2010 | | 2009 |
| | (in thousands) |
| Weighted average units outstanding during period: | | | | | |
| Common units - Basic | 110,435 |
| | 68,625 |
| | 53,496 |
|
| Effect of Dilutive Securities: | | | | | |
| Warrants | 5,727 |
| | — |
| | — |
|
| Restricted Units | 779 |
| | — |
| | — |
|
| Common units - Diluted | 116,941 |
| | 68,625 |
| | 53,496 |
|
| Subordinated units - Basic and Diluted | | | 8,163 |
| | 20,691 |
|
| General partner units - Basic and Diluted | | | 488 |
| | 845 |
|
The restricted common units granted under the LTIP, as discussed in Note 17, contain non-forfeitable rights to the distributions declared by the Partnership and therefore meet the definition of participating securities. Participating securities are required to be included in the computation of earnings per unit pursuant to the two-class method. For the year ended December 31, 2011, the Partnership determined that it is more dilutive to apply the two-class method versus the treasury stock method in calculating dilutive earnings per unit. Thus, the unvested restricted common units are included in the computation of the diluted weighted average common unit outstanding calculation, but the denominator in the computation of diluted earnings per common unit only includes the basic weighted average common units outstanding and weighted average warrants outstanding.
The following table presents the Partnership's basic income per unit for the year ended December 31, 2011:
|
| | | | | | | | | | | | |
| | | Total | | Common Units | | Restricted Common Units |
| | | ($ in thousands, except for per unit amounts) |
| Income from continuing operations | | 72,856 |
| | | | |
| Distributions | | 89,062 |
| | $ | 87,525 |
| | $ | 1,537 |
|
| Assumed loss from continuing operations after distribution to be allocated | | (16,206 | ) | | (16,206 | ) | | — |
|
| Assumed allocation of income from continuing operations | | 72,856 |
| | 71,319 |
| | 1,537 |
|
| Discontinued operations | | 276 |
| | 276 |
| | — |
|
| Assumed net income to be allocated | | $ | 73,132 |
| | $ | 71,595 |
| | $ | 1,537 |
|
| | | | | | | |
| Basic income from continuing operations per unit | | | | $ | 0.65 |
| | |
| Basic discontinued operations per unit | | | | $ | — |
| | |
| Basic income per unit | | | | $ | 0.65 |
| | |
| | | | | | | |
| Diluted income from continuing operations per unit | | | | $ | 0.61 |
| | |
| Diluted discontinued operations per unit | | | | $ | — |
| | |
| Diluted income per unit | | | | $ | 0.62 |
| | |
The following table presents the Partnership's basic and diluted income per unit for the year ended December 31, 2010:
|
| | | | | | | | | | | | | | | | | | | | |
| | | Total | | Common Units | | Restricted Common Units | | Subordinated Units | | General Partner Units |
| | | ($ in thousands, except for per unit amounts) |
| Loss from continuing operations | | $ | (22,611 | ) | | | | | | | | |
| Distributions | | 14,943 |
| | $ | 14,658 |
| | $ | 243 |
| | $ | — |
| | $ | 42 |
|
| Assumed loss from continuing operations after distribution to be allocated | | (37,554 | ) | | (32,788 | ) | | (633 | ) | | (3,901 | ) | | (232 | ) |
| Assumed allocation of loss from continuing operations | | (22,611 | ) | | (18,130 | ) | | (390 | ) | | (3,901 | ) | | (190 | ) |
| Discontinued operations, net of tax | | 17,262 |
| | 15,071 |
| | 291 |
| | 1,793 |
| | 107 |
|
| Assumed net loss to be allocated | | $ | (5,349 | ) | | $ | (3,059 | ) | | $ | (99 | ) | | $ | (2,108 | ) | | $ | (83 | ) |
| | | | | | | | | | | |
| Basic and diluted loss from continuing operations per unit | | | | $ | (0.26 | ) | | | | $ | (0.48 | ) | | $ | (0.39 | ) |
| Basic and diluted discontinued operations per unit | | | | $ | 0.22 |
| | | | $ | 0.22 |
| | $ | 0.22 |
|
| Basic and diluted loss per unit | | | | $ | (0.04 | ) | | | | $ | (0.26 | ) | | $ | (0.17 | ) |
The following table presents the Partnership's basic and diluted income per unit for the year ended December 31, 2009:
|
| | | | | | | | | | | | | | | | | | | | |
| | | Total | | Common Units | | Restricted Common Units | | Subordinated Units | | General Partner Units |
| | | ($ in thousands, except for per unit amounts) |
| Loss from continuing operations | | $ | (180,835 | ) | | | | | | | | |
| Distributions | | 5,498 |
| | $ | 5,350 |
| | $ | 64 |
| | $ | — |
| | $ | 84 |
|
| Assumed loss from continuing operations after distribution to be allocated | | (186,333 | ) | | (132,851 | ) | | — |
| | (51,385 | ) | | (2,097 | ) |
| Assumed allocation of loss from continuing operations | | (180,835 | ) | | (127,501 | ) | | 64 |
| | (51,385 | ) | | (2,013 | ) |
| Discontinued operations, net of tax | | 9,577 |
| | 6,828 |
| | — |
| | 2,641 |
| | 108 |
|
| Assumed net loss to be allocated | | $ | (171,258 | ) | | $ | (120,673 | ) | | $ | 64 |
| | $ | (48,744 | ) | | $ | (1,905 | ) |
| | | | | | | | | | | |
| Basic and diluted loss from continuing operations per unit | | | | $ | (2.38 | ) | | | | $ | (2.48 | ) | | $ | (2.38 | ) |
| Basic and diluted discontinued operations per unit | | | | $ | 0.13 |
| | | | $ | 0.13 |
| | $ | 0.13 |
|
| Basic and diluted loss per unit | | | | $ | (2.26 | ) | | | | $ | (2.36 | ) | | $ | (2.26 | ) |
NOTE 19. DISCONTINUED OPERATIONS
The following table represents activity from discontinued operations for the years ended December 31, 2011, 2010 and 2009: |
| | | | | | | | | | | | |
| | | Wildhorse System (a) | | Minerals Business (b) | | Producer Services (c) |
| ($ in thousands) | | | | | | |
| Year Ended December 31, 2011: | | | | | | |
| Revenues | | $ | 6,859 |
| |
|
| | |
| Gain from Operations | | $ | 548 |
| |
|
| | |
| Discontinued operations, net of tax | | $ | (180 | ) | | $ | 456 |
| | |
| Loss from the sale (d) | | $ | (718 | ) | |
|
| | |
| Proceeds from sale | | $ | 5,712 |
| | | | |
| Year Ended December 31, 2010: | | | | | | |
| Revenues | | $ | 26,086 |
| | $ | 8,912 |
| | $ | 77 |
|
| Income (loss) from Operations | | $ | (25,905 | ) | | $ | 5,450 |
| | $ | 77 |
|
| Discontinued operations, net of tax | | $ | (25,858 | ) | | $ | 43,043 |
| | $ | 77 |
|
| Gain from the sale (d) | |
|
| | $ | 37,680 |
| | |
| Proceeds from sale | | | | $ | 171,631 |
| | |
| Year Ended December 31, 2009: | | | | | | |
| Revenues | | $ | 21,826 |
| | $ | 15,708 |
| | $ | 19,189 |
|
| Income from Operations | | $ | 213 |
| | $ | 7,777 |
| | $ | 18,899 |
|
| Discontinued operations, net of tax | | $ | 180 |
| | $ | 9,107 |
| | $ | 290 |
|
| Proceeds from sale | | | | | | $ | 190 |
|
| As of December 31, 2010: | | | | | | |
| Assets and Liabilities Held for Sale: | | | | | | |
| Accounts receivable | | $ | 2,115 |
| |
|
| | |
| Pipelines and equipment | | $ | 6,220 |
| |
|
| | |
| Intangible assets | | $ | 280 |
| |
|
| | |
| Accounts payable | | $ | 1,705 |
| |
|
| | |
_____________________________
| |
| (a) | On May 20, 2011, the Partnership sold its Wildhorse Gathering System (which was accounted for in its East Texas and Other Midstream Segment). In 2010, the Partnership incurred impairment charges related to the assets which is included in the loss from operations.. |
| |
| (b) | On May 24, 2010, the Partnership completed the sale of its Minerals Business. Cash proceeds from the sale exclude the cash retained by the Partnership from net revenues received from the Minerals Business after the effective date. During the year ended December 31, 2011, the Partnership received payments related to pre-effective date operations and recorded this amount as part of discontinued operations for the period. |
| |
| (c) | On April 1, 2009, the Partnership sold its producer services business (which was accounted for in its East Texas and Other Midstream Segment). As part of the sale, the Partnership received a monthly payment equivalent to $0.01 per MMbtu on the volume of gas that flowed pursuant to the assigned contracts through March 31, 2011 which is included in discontinued operations for the respective periods. |
| |
| (d) | Amounts are included in total discontinued operations, net of tax. |
Financial information for the years ended December 31, 2011, 2010 and 2009 have been retrospectively adjusted as assets and liabilities held for sale and discontinued operations.
NOTE 20. OTHER OPERATING INCOME
Other operating (income) expense for the year ended December 31, 2009, includes $3.6 million due to the recovery of $2.2 million of assets previously written off and the release of $1.4 million of liabilities assumed as part of the Partnership's purchase price allocation for its acquisitions of Escambia Asset Co., LLC and Redman Energy Holdings, L.P. During the period, the Partnership received additional information about collectability of these assets and determined that it no longer had any obligation under these liabilities.
In July 2008, SemGroup, L.P. and certain of its subsidiaries (“SemGroup”) filed petitions for reorganization under Chapter 11 of the U.S. Bankruptcy Code. The Partnership historically sold portions of its condensate production from its Texas Panhandle and East Texas midstream systems to SemGroup. In August 2009, the Partnership sold $3.9 million of its outstanding receivables from SemGroup, which represented its 20-day administrative claims under 503(b)(9) of the United States Bankruptcy Code, for which it received a payment of $3.0 million. Due to certain repurchase obligations under the assignment agreement, the Partnership recorded the payment as a current liability within accounts payable as of December 31, 2010 and maintained the balance as a liability until it was clear that the repurchase obligations can no longer be triggered. Due to the expiration of the repurchase obligations during the year ended December 31, 2011, the Partnership released its reserve for these receivables and recorded other operating income of $2.9 million related to these reserves.
NOTE 21. SUBSIDIARY GUARANTORS
As of December 31, 2011, the Partnership expected to issue (and, in fact, has now issued) registered debt securities guaranteed by its subsidiaries. As of December 31, 2011, the Partnership expected that all guarantors would be wholly-owned or available to be pledged and that such guarantees would be joint and several and full and unconditional. In accordance with Rule 3-10 of Regulation S-X, the Partnership has prepared Condensed Consolidating Financial Statements as supplemental information. The following condensed consolidating balance sheets at December 31, 2011 and December 31, 2010, condensed consolidating statements of operations for the years ended December 31, 2011, 2010 and 2009, and condensed consolidating statements of cash flows for the years ended December 31, 2011, 2010 and 2009, present financial information for Eagle Rock Energy as the Parent on a stand-alone basis (carrying any investments in subsidiaries under the equity method), financial information for the co-issuer and the subsidiary guarantors, which are all 100% owned by the Parent, on a stand-alone basis, and the consolidation and elimination entries necessary to arrive at the information for the Partnership on a consolidated basis. The subsidiary guarantors are not restricted from making distributions to the Partnership. As discussed in Note 8, the Senior Notes were all exchanged for registered notes as of February 15, 2012.
Condensed Consolidating Balance Sheet
December 31, 2011
|
| | | | | | | | | | | | | | | | | | | | | | | |
| | Parent Issuer | | Co-Issuer | | Subsidiary Guarantors | | Non-guarantor investments | | Consolidating Entries | | Total |
| | ($ in thousands) |
| ASSETS: | | | | | | | | | | | |
| Accounts receivable – related parties | $ | 541,384 |
| | $ | — |
| | $ | — |
| | $ | — |
| | $ | (541,384 | ) | | $ | — |
|
| Other current assets | 15,749 |
| | 1 |
| | 109,778 |
| | — |
| | — |
| | 125,528 |
|
| Total property, plant and equipment, net | 1,393 |
| | — |
| | 1,762,281 |
| | — |
| | — |
| | 1,763,674 |
|
| Investment in subsidiaries | 1,229,606 |
| | — |
| | — |
| | 1,033 |
| | (1,230,639 | ) | | — |
|
| Total other long-term assets | 30,928 |
| | — |
| | 125,558 |
| | — |
| | — |
| | 156,486 |
|
| Total assets | $ | 1,819,060 |
| | $ | 1 |
| | $ | 1,997,617 |
| | $ | 1,033 |
| | $ | (1,772,023 | ) | | $ | 2,045,688 |
|
| LIABILITIES AND EQUITY: | | | | | | | | | | | |
| Accounts payable – related parties | $ | — |
| | $ | — |
| | $ | 541,384 |
| | $ | — |
| | $ | (541,384 | ) | | $ | — |
|
| Other current liabilities | 18,110 |
| | — |
| | 152,745 |
| | — |
| | — |
| | 170,855 |
|
| Other long-term liabilities | 14,150 |
| | — |
| | 73,883 |
| | — |
| | — |
| | 88,033 |
|
| Long-term debt | 779,453 |
| | — |
| | — |
| | — |
| | — |
| | 779,453 |
|
| Equity | 1,007,347 |
| | 1 |
| | 1,229,605 |
| | 1,033 |
| | (1,230,639 | ) | | 1,007,347 |
|
| Total liabilities and equity | $ | 1,819,060 |
| | $ | 1 |
| | $ | 1,997,617 |
| | $ | 1,033 |
| | $ | (1,772,023 | ) | | $ | 2,045,688 |
|
Condensed Consolidating Balance Sheet
December 31, 2010
|
| | | | | | | | | | | | | | | | | | | | | | | |
| | Parent Issuer | | Co-Issuer | | Subsidiary Guarantors | | Non-guarantor investments | | Consolidating Entries | | Total |
| | ($ in thousands) |
| ASSETS: | | | | | | | | | | | |
| Accounts receivable – related parties | $ | 42,667 |
| | $ | — |
| | $ | — |
| | $ | — |
| | $ | (42,667 | ) | | $ | — |
|
| Assets held for sale | — |
| | — |
| | 8,615 |
| | — |
| | — |
| | 8,615 |
|
| Other current assets | 5,694 |
| | 1 |
| | 76,547 |
| | — |
| | — |
| | 82,242 |
|
| Total property, plant and equipment, net | 1,200 |
| | — |
| | 1,136,039 |
| | — |
| | — |
| | 1,137,239 |
|
| Investment in subsidiaries | 1,113,603 |
| | — |
| | — |
| | 1,116 |
| | (1,114,719 | ) | | — |
|
| Total other long-term assets | 3,622 |
| | — |
| | 117,679 |
| | — |
| | — |
| | 121,301 |
|
| Total assets | $ | 1,166,786 |
| | $ | 1 |
| | $ | 1,338,880 |
| | $ | 1,116 |
| | $ | (1,157,386 | ) | | $ | 1,349,397 |
|
| LIABILITIES AND EQUITY: | | | | | | | | | | | |
| Accounts payable – related parties | $ | — |
| | $ | — |
| | $ | 42,667 |
| | $ | — |
| | $ | (42,667 | ) | | $ | — |
|
| Liabilities held for sale | — |
| | — |
| | 1,705 |
| | — |
| | — |
| | 1,705 |
|
| Other current liabilities | 31,208 |
| | — |
| | 112,126 |
| | — |
| | — |
| | 143,334 |
|
| Other long-term liabilities | 26,465 |
| | — |
| | 68,780 |
| | — |
| | — |
| | 95,245 |
|
| Long-term debt | 530,000 |
| | — |
| | — |
| | — |
| | — |
| | 530,000 |
|
| Equity | 579,113 |
| | 1 |
| | 1,113,602 |
| | 1,116 |
| | (1,114,719 | ) | | 579,113 |
|
| Total liabilities and equity | $ | 1,166,786 |
| | $ | 1 |
| | $ | 1,338,880 |
| | $ | 1,116 |
| | $ | (1,157,386 | ) | | $ | 1,349,397 |
|
Condensed Consolidating Statement of Operations
For the Year Ended December 31, 2011
|
| | | | | | | | | | | | | | | | | | | | | | | |
| | Parent Issuer | | Co-Issuer | | Subsidiary Guarantors | | Non-guarantor investments | | Consolidating Entries | | Total |
| | ($ in thousands) |
| Total revenues | $ | 36,095 |
| | $ | — |
| | $ | 1,023,813 |
| | $ | — |
| | $ | — |
| | $ | 1,059,908 |
|
| Cost of natural gas and natural gas liquids | — |
| | — |
| | 633,184 |
| | — |
| | — |
| | 633,184 |
|
| Operations and maintenance | — |
| | — |
| | 93,048 |
| | — |
| | — |
| | 93,048 |
|
| Taxes other than income | — |
| | — |
| | 19,148 |
| | — |
| | — |
| | 19,148 |
|
| General and administrative | 5,299 |
| | — |
| | 52,592 |
| | — |
| | — |
| | 57,891 |
|
| Other operating income | — |
| | — |
| | (2,893 | ) | | — |
| | — |
| | (2,893 | ) |
| Depreciation, depletion and amortization | 196 |
| | — |
| | 131,415 |
| | — |
| | — |
| | 131,611 |
|
| Impairment | — |
| | — |
| | 16,288 |
| | — |
| | — |
| | 16,288 |
|
| Income from operations | 30,600 |
| | — |
| | 81,031 |
| | — |
| | — |
| | 111,631 |
|
| Interest expense | (29,639 | ) | | — |
| | (8 | ) | | — |
| | — |
| | (29,647 | ) |
| Other non-operating income | 8,804 |
| | — |
| | 5,607 |
| | — |
| | (14,386 | ) | | 25 |
|
| Other non-operating expense | (28,589 | ) | | — |
| | 2,628 |
| | (10 | ) | | 14,386 |
| | (11,585 | ) |
| Income (loss) before income taxes | (18,824 | ) | | — |
| | 89,258 |
| | (10 | ) | | — |
| | 70,424 |
|
| Income tax provision (benefit) | 339 |
| | — |
| | (2,771 | ) | | — |
| | — |
| | (2,432 | ) |
| Equity in earnings of subsidiaries | 92,295 |
| | — |
| | — |
| | — |
| | (92,295 | ) | | — |
|
| Income (loss) from continuing operations | 73,132 |
| | — |
| | 92,029 |
| | (10 | ) | | (92,295 | ) | | 72,856 |
|
| Discontinued operations, net of tax | — |
| | — |
| | 276 |
| | — |
| | — |
| | 276 |
|
| Net income (loss) | $ | 73,132 |
| | $ | — |
| | $ | 92,305 |
| | $ | (10 | ) | | $ | (92,295 | ) | | $ | 73,132 |
|
Condensed Consolidating Statement of Operations
For the Year Ended December 31, 2010
|
| | | | | | | | | | | | | | | | | | | | | | | |
| | Parent Issuer | | Co-Issuer | | Subsidiary Guarantors | | Non-guarantor investments | | Consolidating Entries | | Total |
| | ($ in thousands) |
| Total revenues | $ | (8,296 | ) | | $ | — |
| | $ | 740,605 |
| | $ | — |
| | $ | — |
| | $ | 732,309 |
|
| Cost of natural gas and natural gas liquids | — |
| | — |
| | 468,304 |
| | — |
| | — |
| | 468,304 |
|
| Operations and maintenance | — |
| | — |
| | 76,415 |
| | — |
| | — |
| | 76,415 |
|
| Taxes other than income | 2 |
| | — |
| | 12,224 |
| | — |
| | — |
| | 12,226 |
|
| General and administrative | 3,680 |
| | — |
| | 42,095 |
| | — |
| | — |
| | 45,775 |
|
| Depreciation, depletion and amortization | 165 |
| | — |
| | 106,233 |
| | — |
| | — |
| | 106,398 |
|
| Impairment | — |
| | — |
| | 6,666 |
| | — |
| | — |
| | 6,666 |
|
| Loss (income) from operations | (12,143 | ) | | — |
| | 28,668 |
| | — |
| | — |
| | 16,525 |
|
| Interest expense | (15,145 | ) | | — |
| | (2 | ) | | — |
| | — |
| | (15,147 | ) |
| Other non-operating income | 8,300 |
| | — |
| | 2,755 |
| | 26 |
| | (10,469 | ) | | 612 |
|
| Other non-operating expense | (14,988 | ) | | — |
| | (22,667 | ) | | — |
| | 10,469 |
| | (27,186 | ) |
| (Loss) income before income taxes | (33,976 | ) | | — |
| | 8,754 |
| | 26 |
| | — |
| | (25,196 | ) |
| Income tax provision (benefit) | 517 |
| | — |
| | (3,102 | ) | | — |
| | — |
| | (2,585 | ) |
| Equity in earnings of subsidiaries | 29,144 |
| | — |
| | — |
| | — |
| | (29,144 | ) | | — |
|
| (Loss) income from continuing operations | (5,349 | ) | | — |
| | 11,856 |
| | 26 |
| | (29,144 | ) | | (22,611 | ) |
| Discontinued operations, net of tax | — |
| | — |
| | 17,262 |
| | — |
| | — |
| | 17,262 |
|
| Net (loss) income | $ | (5,349 | ) | | $ | — |
| | $ | 29,118 |
| | $ | 26 |
| | $ | (29,144 | ) | | $ | (5,349 | ) |
Condensed Consolidating Statement of Operations
For the Year Ended December 31, 2009
|
| | | | | | | | | | | | | | | | | | | | | | | |
| | Parent Issuer | | Co-Issuer | | Subsidiary Guarantors | | Non-guarantor investments | | Consolidating Entries | | Total |
| | ($ in thousands) |
| Total revenues | $ | (37,432 | ) | | $ | — |
| | $ | 610,362 |
| | $ | — |
| | $ | — |
| | $ | 572,930 |
|
| Cost of natural gas and natural gas liquids | — |
| | — |
| | 470,099 |
| | — |
| | — |
| | 470,099 |
|
| Operations and maintenance | — |
| | — |
| | 71,496 |
| | — |
| | — |
| | 71,496 |
|
| Taxes other than income | — |
| | — |
| | 10,709 |
| | — |
| | — |
| | 10,709 |
|
| General and administrative | 2,803 |
| | — |
| | 43,016 |
| | — |
| | — |
| | 45,819 |
|
| Other operating income | — |
| | — |
| | (3,552 | ) | | — |
| | — |
| | (3,552 | ) |
| Depreciation, depletion and amortization | — |
| | — |
| | 108,530 |
| | — |
| | — |
| | 108,530 |
|
| Impairment | — |
| | — |
| | 21,788 |
| | — |
| | — |
| | 21,788 |
|
| Loss from operations | (40,235 | ) | | — |
| | (111,724 | ) | | — |
| | — |
| | (151,959 | ) |
| Interest expense | (21,568 | ) | | — |
| | (23 | ) | | — |
| | — |
| | (21,591 | ) |
| Other non-operating income | 6,886 |
| | — |
| | 2,788 |
| | 153 |
| | (8,706 | ) | | 1,121 |
|
| Other non-operating expense | (5,572 | ) | | — |
| | (10,551 | ) | | — |
| | 8,706 |
| | (7,417 | ) |
| Income (loss) before income taxes | (60,489 | ) | | — |
| | (119,510 | ) | | 153 |
| | — |
| | (179,846 | ) |
| Income tax provision (benefit) | 1,547 |
| | — |
| | (558 | ) | | — |
| | — |
| | 989 |
|
| Equity in earnings of subsidiaries | (109,222 | ) | | — |
| | — |
| | — |
| | 109,222 |
| | — |
|
| Income (loss) from continuing operations | (171,258 | ) | | — |
| | (118,952 | ) | | 153 |
| | 109,222 |
| | (180,835 | ) |
| Discontinued operations, net of tax | — |
| | — |
| | 9,577 |
| | — |
| | — |
| | 9,577 |
|
| Net income (loss) | $ | (171,258 | ) | | $ | — |
| | $ | (109,375 | ) | | $ | 153 |
| | $ | 109,222 |
| | $ | (171,258 | ) |
Condensed Consolidating Statement of Cash Flows
For the Year Ended December 31, 2011
|
| | | | | | | | | | | | | | | | | | | | | | | |
| | Parent Issuer | | Co-Issuer | | Subsidiary Guarantors | | Non-guarantor investments | | Consolidating Entries | | Total |
| | ($ in thousands) |
| Net cash flows provided by operating activities | $ | (27,569 | ) | | $ | — |
| | $ | 145,283 |
| | $ | 86 |
| | $ | — |
| | $ | 117,800 |
|
| CASH FLOWS FROM INVESTING ACTIVITIES: |
| | | |
| |
| |
| | |
| Acquisitions, net of cash acquired | — |
| | — |
| | (220,326 | ) | | — |
| | — |
| | (220,326 | ) |
| Additions to property, plant and equipment | (389 | ) | | — |
| | (154,527 | ) | | — |
| | — |
| | (154,916 | ) |
| Purchase of intangible assets | — |
| | — |
| | (4,406 | ) | | — |
| | — |
| | (4,406 | ) |
| Proceeds from sale of asset | — |
| | — |
| | 5,712 |
| | — |
| | — |
| | 5,712 |
|
| Contribution to subsidiaries | (227,583 | ) | | — |
| | — |
| | — |
| | 227,583 |
| | — |
|
| Net cash flows used in investing activities | (227,972 | ) | | — |
| | (373,547 | ) | | — |
| | 227,583 |
| | (373,936 | ) |
| CASH FLOWS FROM FINANCING ACTIVITIES: | | | | | | | | | | | |
| Proceeds from long-term debt | 964,279 |
| | — |
| | — |
| | — |
| | — |
| | 964,279 |
|
| Repayment of long-term debt | (1,012,779 | ) | | — |
| | — |
| | — |
| | — |
| | (1,012,779 | ) |
| Proceed from senior notes | 297,837 |
| | — |
| | — |
| | — |
| | — |
| | 297,837 |
|
| Payment of debt issuance cost | (17,466 | ) | | — |
| | — |
| | — |
| | — |
| | (17,466 | ) |
| Proceeds from derivative contracts | 6,267 |
| | — |
| | — |
| | — |
| | — |
| | 6,267 |
|
| Repurchase of common units | (1,401 | ) | | — |
| | — |
| | — |
| | — |
| | (1,401 | ) |
| Exercise of warrants | 89,745 |
| | — |
| | — |
| | — |
| | — |
| | 89,745 |
|
| Distributions to members and affiliates | (74,512 | ) | | — |
| | — |
| | — |
| | — |
| | (74,512 | ) |
| Contribution from parent | — |
| | — |
| | 227,583 |
| | — |
| | (227,583 | ) | | — |
|
| Net cash flows provided by financing activities | 251,970 |
| | — |
| | 227,583 |
| | — |
| | (227,583 | ) | | 251,970 |
|
| Net cash flows used in discontinued operations | — |
| | — |
| | 994 |
| | — |
| | — |
| | 994 |
|
| Net increase in cash and cash equivalents | (3,571 | ) | | — |
| | 313 |
| | 86 |
| | — |
| | (3,172 | ) |
| Cash and cash equivalents at beginning of year | 4,890 |
| | 1 |
| | (885 | ) | | 43 |
| | — |
| | 4,049 |
|
| Cash and cash equivalents at end of year | $ | 1,319 |
| | $ | 1 |
| | $ | (572 | ) | | $ | 129 |
| | $ | — |
| | $ | 877 |
|
Condensed Consolidating Statement of Cash Flows
For the Year Ended December 31, 2010
|
| | | | | | | | | | | | | | | | | | | | | | | |
| | Parent Issuer | | Co-Issuer | | Subsidiary Guarantors | | Non-guarantor Investments | | Consolidating Entries | | Total |
| | ($ in thousands) |
| Net cash flows provided by operating activities | $ | 43,756 |
| | $ | — |
| | $ | 50,318 |
| | $ | 54 |
| | $ | — |
| | $ | 94,128 |
|
| CASH FLOWS FROM INVESTING ACTIVITIES: | | | | | | | | | | | |
| Acquisitions, net of cash acquired | — |
| | — |
| | (30,984 | ) | | — |
| | — |
| | (30,984 | ) |
| Additions to property, plant and equipment | (1,152 | ) | | — |
| | (63,345 | ) | | — |
| | — |
| | (64,497 | ) |
| Purchase of intangible assets | — |
| | — |
| | (2,660 | ) | | — |
| | — |
| | (2,660 | ) |
| Proceeds from sale of asset | 171,686 |
| | — |
| | — |
| | — |
| | — |
| | 171,686 |
|
| Contributions to subsidiaries | (27,043 | ) | | — |
| | — |
| | — |
| | 27,043 |
| | — |
|
| Net cash flows provided by (used in) investing activities | 143,491 |
| | — |
| | (96,989 | ) | | — |
| | 27,043 |
| | 73,545 |
|
| CASH FLOWS FROM FINANCING ACTIVITIES: | | | | | | | | | | | |
| Proceeds from long-term debt | 90,617 |
| | — |
| | — |
| | — |
| | — |
| | 90,617 |
|
| Repayment of long-term debt | (315,000 | ) | | — |
| | — |
| | — |
| | — |
| | (315,000 | ) |
| Repurchase of common units | (1,177 | ) | | — |
| | — |
| | — |
| | — |
| | (1,177 | ) |
| Deferred transaction fees | (3,066 | ) | | — |
| | — |
| | — |
| | — |
| | (3,066 | ) |
| Proceeds from rights offering | 53,893 |
| | — |
| | — |
| | — |
| | — |
| | 53,893 |
|
| Exercise of warrants | 5,351 |
| | — |
| | — |
| | — |
| | — |
| | 5,351 |
|
| Proceeds from derivative contracts | — |
| | — |
| | 1,131 |
| | — |
| | — |
| | 1,131 |
|
| Contributions from parent | — |
| | — |
| | 27,043 |
| | — |
| | (27,043 | ) | | — |
|
| Distributions to members and affiliates | (7,195 | ) | | — |
| | — |
| | — |
| | — |
| | (7,195 | ) |
| Net cash flows (used in) provided by financing activities | (176,577 | ) | | — |
| | 28,174 |
| | — |
| | (27,043 | ) | | (175,446 | ) |
| Net cash flows provided by discontinued operations | — |
| | — |
| | 9,090 |
| | — |
| | — |
| | 9,090 |
|
| Net increase in cash and cash equivalents | 10,670 |
| | — |
| | (9,407 | ) | | 54 |
| | — |
| | 1,317 |
|
| Cash and cash equivalents at beginning of year | 4,922 |
| | 1 |
| | (2,180 | ) | | (11 | ) | | — |
| | 2,732 |
|
| Cash and cash equivalents at end of year | $ | 15,592 |
| | $ | 1 |
| | $ | (11,587 | ) | | $ | 43 |
| | $ | — |
| | $ | 4,049 |
|
Condensed Consolidating Statement of Cash Flows
For the Year Ended December 31, 2009
|
| | | | | | | | | | | | | | | | | | | | | | | |
| | Parent Issuer | | Co-Issuer | | Subsidiary Guarantors | | Non-guarantor Investments | | Consolidating Entries | | Total |
| | ($ in thousands) |
| Net cash flows provided by operating activities | $ | 57,934 |
| | $ | — |
| | $ | 19,305 |
| | $ | (11 | ) | | $ | — |
| | $ | 77,228 |
|
| CASH FLOWS FROM INVESTING ACTIVITIES: | | | | | | | | | | | |
| Additions to property, plant and equipment | (84 | ) | | — |
| | (36,050 | ) | | — |
| | — |
| | (36,134 | ) |
| Purchase of intangible assets | — |
| | — |
| | (1,626 | ) | | — |
| | — |
| | (1,626 | ) |
| Proceeds from sale of asset | — |
| | — |
| | 476 |
| | — |
| | — |
| | 476 |
|
| Contribution to subsidiaries | (1 | ) | | — |
| | — |
| | — |
| | 1 |
| | — |
|
| Net cash flows provided by (used in) investing activities | (85 | ) | | — |
| | (37,200 | ) | | — |
| | 1 |
| | (37,284 | ) |
| CASH FLOWS FROM FINANCING ACTIVITIES: | | | | | | | | | | | |
| Proceeds from long-term debt | 131,000 |
| | — |
| | — |
| | — |
| | — |
| | 131,000 |
|
| Repayment of long-term debt | (176,000 | ) | | — |
| | — |
| | — |
| | — |
| | (176,000 | ) |
| Repurchase of common units | (64 | ) | | — |
| | — |
| | — |
| | — |
| | (64 | ) |
| Deferred transaction fees | (1,480 | ) | | — |
| | — |
| | — |
| | — |
| | (1,480 | ) |
| Proceeds from derivative contracts | — |
| | — |
| | 8,939 |
| | — |
| | — |
| | 8,939 |
|
| Contributions from parent | — |
| | 1 |
| | — |
| | — |
| | (1 | ) | | — |
|
| Distributions to members and affiliates | (35,655 | ) | | — |
| | — |
| | — |
| | — |
| | (35,655 | ) |
| Net cash flows (used in) provided by financing activities | (82,199 | ) | | 1 |
| | 8,939 |
| | — |
| | (1 | ) | | (73,260 | ) |
| Net cash flows provided by discontinued operations | — |
| | — |
| | 18,132 |
| | — |
| | — |
| | 18,132 |
|
| Net increase in cash and cash equivalents | (24,350 | ) | | 1 |
| | 9,176 |
| | (11 | ) | | — |
| | (15,184 | ) |
| Cash and cash equivalents at beginning of year | 29,272 |
| | — |
| | (11,356 | ) | | — |
| | — |
| | 17,916 |
|
| Cash and cash equivalents at end of year | $ | 4,922 |
| | $ | 1 |
| | $ | (2,180 | ) | | $ | (11 | ) | | $ | — |
| | $ | 2,732 |
|
NOTE 22. SUPPLEMENTAL OIL AND GAS INFORMATION (UNAUDITED)
Oil and Natural Gas Reserves
Users of this information should be aware that the process of estimating quantities of proved oil and natural gas reserves is very complex, and requires significant subjective decisions in the evaluation of the available geological, engineering and economic data for each reservoir. The data for a given reservoir may also change substantially over time as a result of numerous factors including, but not limited to, additional development activity, evolving production history and changing operating and market conditions. As a result, revisions to existing reserve estimates may occur from time to time. Although reasonable effort is made to ensure the reported reserve estimates are accurate, the subjective decisions and variances in available data for various reservoirs make these estimates generally less precise than other estimates included in the financial statement disclosures.
There are numerous uncertainties inherent in estimating the quantities of proved reserves, the future rates of production and the timing of development expenditures. Reserves data represent estimates only and should not be construed as being exact. Moreover, the Standardized Measure of Oil and Gas (“SMOG”) should not be construed as the current market value of the proved oil and natural gas reserves or as the costs that would be incurred to obtain equivalent reserves. A market value determination would include many additional factors including (a) anticipated future changes in natural gas and crude oil prices, production and development costs, (b) an allowance for return on investment, (c) the value of additional reserves, not considered proved at present, which may be recovered as a result of further exploration and development activities, and (d) other business risks.
Recent Developments
On May 24, 2010, the Partnership sold its Minerals Business (see Note19). Financial information, including reserve amounts and changes, related to the Minerals Business have been retrospectively adjusted to be reflected as assets and liabilities held-for-sale and discontinued operations.
Proved Reserves Summary
The following table illustrates the Partnership's estimated net proved reserves, including changes, and proved developed reserves for the periods indicated, as estimated by Cawley, Gillespie and Associates. Oil and natural gas liquids prices for 2011 are based on a prior twelve month average West Texas Intermediate spot price of $96.19 per barrel and are adjusted for quality, transportation fees, and regional price differentials. Natural gas prices for 2011 are based on a prior 12 month average Henry Hub spot market price of $4.13 per MMBtu and are adjusted for energy content, transportation fees, and regional price differentials. All prices are held constant in accordance with SEC guidelines. All of the Partnership's reserves are located in the United States.
|
| | | | | | | | |
| | Proved Reserves |
| | Oil (MBbls) | | Gas (MMcf) | | Natural Gas Liquids (MBbls) |
| Proved reserves, January 1, 2009 | 10,006 |
| | 44,588 |
| | 5,639 |
|
| Extensions and discoveries | 298 |
| | 1,782 |
| | 241 |
|
| Purchase of minerals in place | 18 |
| | — |
| | — |
|
| Production | (829 | ) | | (6,647 | ) | | (493 | ) |
| Revision of previous estimates | 797 |
| | (1,030 | ) | | 718 |
|
| Changes from assets held for sale | 162 |
| | (53 | ) | | — |
|
| Proved reserves, December 31, 2009 | 10,452 |
| | 38,640 |
| | 6,105 |
|
| Extensions and discoveries | 7 |
| | 3,930 |
| | — |
|
| Purchase of minerals in place | 216 |
| | 555 |
| | 102 |
|
| Production | (808 | ) | | (3,514 | ) | | (437 | ) |
| Revision of previous estimates | 1,766 |
| | 3,590 |
| | 406 |
|
| Changes from assets held for sale | (54 | ) | | (342 | ) | | — |
|
| Sale of minerals in place | (2,883 | ) | | (4,477 | ) | | — |
|
| Proved reserves, December 31, 2010 | 8,696 |
| | 38,382 |
| | 6,176 |
|
| Extensions and discoveries | 215 |
| | 14,523 |
| | 903 |
|
| Purchase of minerals in place | 3,830 |
| | 198,826 |
| | 4,815 |
|
| Production | (1,118 | ) | | (12,636 | ) | | (805 | ) |
| Revision of previous estimates | (101 | ) | | (5,073 | ) | | 258 |
|
| Proved reserves, December 31, 2011 | 11,522 |
| | 234,022 |
| | 11,347 |
|
| | | | | | |
| Proved Developed Reserves | | | | | |
| Proved developed reserves - continuing operations, January 1, 2009 | 6,425 |
| | 31,286 |
| | 4,883 |
|
| Proved developed reserves - discontinued operations, January1, 2009 | 2,775 |
| | 4,871 |
| | — |
|
| Proved developed reserves - continuing operations, December 31, 2009 | 7,121 |
| | 26,263 |
| | 5,410 |
|
| Proved developed reserves - discontinued operations, December 31, 2009 | 2,937 |
| | 4,819 |
| | — |
|
| Proved developed reserves - continuing operations, December 31, 2010 | 8,299 |
| | 29,686 |
| | 5,758 |
|
| Proved developed reserves - continuing operations, December 31, 2011 | 10,271 |
| | 165,269 |
| | 9,307 |
|
| | | | | | |
| Proved Undeveloped Reserves | | | | | |
| Proved undeveloped reserves - continuing operations, January 1, 2009 | 806 |
| | 8,431 |
| | 756 |
|
| Proved undeveloped reserves - continuing operations, December 31, 2009 | 394 |
| | 7,558 |
| | 695 |
|
| Proved undeveloped reserves - continuing operations, December 31, 2010 | 397 |
| | 8,696 |
| | 418 |
|
| Proved undeveloped reserves - continuing operations, December 31, 2011 | 1,251 |
| | 68,753 |
| | 2,040 |
|
Proved Reserves Summary - Equity Method Entities
As part of the sale of the Minerals Business in 2010, the Partnership sold its limited partner interest in Ivory Working Interests, L.P. ("IWI"), which it had accounted for under the equity method. IWI is managed by Black Stone and is not required to make public disclosures about its proved reserves and the agreements that governed the Partnership's rights as limited partners in IWI do not require Black Stone to provide us with detailed reserve data of the type that would be sufficient to make all of the disclosures that the SEC now requires with respect to proved reserves of equity method entities. As a result, the Partnership lacks the data needed to prepare the Supplemental Oil and Gas Disclosures for its equity interests.
Capitalized Costs Relating to Oil and Natural Gas Producing Activities
The following table illustrates the total amount of capitalized costs relating to oil and natural gas producing activities and the total amount of related accumulated depreciation, depletion and amortization at December 31, 2011, 2010 and 2009:
|
| | | | | | | | | | | |
| | As of
December 31, 2011 | | As of
December 31, 2010 | | As of
December 31, 2009 |
| ($ in thousands) | | | | | |
| Evaluated properties | $ | 1,050,872 |
| | $ | 471,781 |
| | $ | 435,789 |
|
| Unevaluated properties—excluded from depletion | 91,363 |
| | 1,304 |
| | 7,264 |
|
| Gross oil and gas properties | 1,142,235 |
| | 473,085 |
| | 443,053 |
|
| Accumulated depreciation, depletion, amortization | (190,833 | ) | | (125,832 | ) | | (95,135 | ) |
| Net oil and gas properties | 951,402 |
| | 347,253 |
| | 347,918 |
|
| Net oil and gas properties held-for-sale | — |
| | — |
| | 120,149 |
|
| Total net oil and gas properties | $ | 951,402 |
| | $ | 347,253 |
| | $ | 468,067 |
|
Costs Incurred in Oil and Natural Gas Property Acquisition, Exploration and Development Activities
Costs incurred in property acquisition, exploration and development activities were as follows for the years ended December 31, 2011, 2010 and 2009:
|
| | | | | | | | | | | |
| | Year Ended December 31, |
| | 2011 | | 2010 | | 2009 |
| ($ in thousands) | | | | | |
| Property acquisition costs, proved | $ | 465,088 |
| | $ | 4,222 |
| | $ | 512 |
|
| Property acquisition costs, unproved | 103,337 |
| | 259 |
| | 20 |
|
| Exploration and extension well costs | — |
| | — |
| | 1 |
|
| Development costs | 90,418 |
| | 25,922 |
| | 8,137 |
|
| Total costs | $ | 658,843 |
| | $ | 30,403 |
| | $ | 8,670 |
|
The Partnership's exploration and extension well costs are primarily related to low risk drilling around its existing fields.
No costs were incurred associated with the Minerals Business which is classified as Discontinued Operations on the Consolidated Statements of Operations and Assets Held for Sale on the Consolidated Balances sheet.
Standardized Measure of Discounted Future Net Cash Flows Relating to Proved Oil and Natural Gas Reserves
The following information has been developed utilizing authoritative guidance procedures and is based on oil and natural gas reserves estimated by the Partnership's independent reserves engineer. It can be used for some comparisons, but should not be the only method used to evaluate the Partnership or its performance. Further, the information in the following table may not represent realistic assessments of future cash flows, nor should the Standardized Measure of Discounted Future Net Cash Flow be viewed as representative of the current value of the Partnership.
The Partnership believes that the following factors should be taken into account when reviewing the following information:
| |
| • | future costs and selling prices will probably differ from those required to be used in these calculations; |
| |
| • | due to future market conditions and governmental regulations, actual rates of production in future years may vary significantly from the rate of production assumed in the calculations; and |
| |
| • | a 10% discount rate may not be reasonable as a measure of the relative risk inherent in realizing future net oil and natural gas revenues. |
Under the Standardized Measure, future cash inflows were estimated by applying year-end oil and natural gas prices to the estimated future production of year-end proved reserves. Estimates of future income taxes are computed using current statutory income tax rates including consideration for estimated future statutory depletion and tax credits. The resulting net cash flows are reduced to present value amounts by applying a 10% discount factor.
A significant portion of the revenues associated with the Partnership's hydrocarbon reserves in Alabama and East Texas are from the sale of sulfur that is derived from the hydrogen sulfide that is removed from the natural gas stream. Although sulfur is not a hydrocarbon, it is intimately associated with the hydrocarbon stream, and must be removed to render the natural gas saleable. The Partnership's rationale for inclusion of these revenues is that the sulfur is produced with the natural gas, and that the cost of removing the sulfur is included in the operating costs of the properties. No reserve volumes have been booked for sulfur, but the inclusion of the sulfur revenues in the cash flows related to the reserves does have a very small positive impact on the hydrocarbon reserves estimates by lowering the properties' economic limit; our independent reserves engineer has concurred with this approach. Also, the Partnership has included the expected impact of the retained revenue interests as a revenue reduction.
The recent changes to the disclosure rules relating to proved reserves require the inclusion of the Partnership's share of the reserves associated with entities that it reports under the equity method. As discussed above, the Partnership sold these interests as part of the sale of its Minerals Business. As the Partnership did not have the right and has been unable to gather the data needed to include these reserves in its Standardized Measure calculations, the tables below reflect only the reserves for the Partnership's consolidated entities.
The Standardized Measure is as follows as of December 31, 2011, 2010 and 2009:
|
| | | | | | | | | | | |
| | As of
December 31, 2011 | | As of
December 31, 2010 | | As of
December 31, 2009 |
| ($ in thousands) | | | | | |
| Future cash inflows | $ | 2,562,650 |
| | $ | 1,027,417 |
| | $ | 650,564 |
|
| Future production costs | (742,749 | ) | | (336,080 | ) | | (307,605 | ) |
| Future development costs | (317,405 | ) | | (97,745 | ) | | (72,577 | ) |
| Future net cash flows before income taxes | 1,502,496 |
| | 593,592 |
| | 270,382 |
|
| Future income tax (expense) benefit | (2,379 | ) | | (1,005 | ) | | 554 |
|
| Future net cash flows before 10% discount | 1,500,117 |
| | 592,587 |
| | 270,936 |
|
| 10% annual discount for estimated timing of cash flows | (778,520 | ) | | (258,594 | ) | | (111,321 | ) |
| Standardized measure of discounted future net cash flows related to continuing operations | 721,597 |
| | 333,993 |
| | 159,615 |
|
| Standardized measure of discounted future net cash flows related to discontinued operations | — |
| | — |
| | 55,038 |
|
| Total standardized measure of discounted future net cash flows | $ | 721,597 |
| | $ | 333,993 |
| | $ | 214,653 |
|
Changes in Standardized Measure of Discounted Future Net Cash Flows Relating to Proved Oil and Natural Gas Reserves
The following is a summary of the changes in the Standardized Measure of discounted future net cash flows for the Partnership's proved oil and natural gas reserves for the years ended December 31, 2011, 2010 and 2009:
|
| | | | | | | | | | | |
| | Year Ended December 31, |
| | 2011 | | 2010 | | 2009 |
| ($ in thousands) | | | | | |
| Beginning of year | $ | 333,993 |
| | $ | 214,653 |
| | $ | 209,744 |
|
| Sale of oil and gas produced, net of production costs | (138,860 | ) | | (54,353 | ) | | (40,824 | ) |
| Net changes in prices and production costs | 170,917 |
| | 147,003 |
| | 6,146 |
|
| Extensions, discoveries and improved recovery, less related costs | 40,832 |
| | 5,492 |
| | 7,859 |
|
| Previously estimated development costs incurred during the period | 90,418 |
| | 25,922 |
| | (8,137 | ) |
| Net changes in future development costs | (117,783 | ) | | (30,033 | ) | | 8,733 |
|
| Revisions of previous quantity estimates | (26,447 | ) | | 74,864 |
| | 9,404 |
|
| Purchases of property | 324,652 |
| | 7,342 |
| | 347 |
|
| Sales of property | — |
| | (70,845 | ) | | — |
|
| Accretion of discount | 30,728 |
| | 14,528 |
| | 14,777 |
|
| Net changes in income taxes | (621 | ) | | (793 | ) | | (908 | ) |
| Other | 13,768 |
| | (15,594 | ) | | (793 | ) |
| Change from discontinued operations | — |
| | 15,807 |
| | 8,305 |
|
| End of year | $ | 721,597 |
| | $ | 333,993 |
| | $ | 214,653 |
|
Results of Operations
The following are the results of operations for the Partnership's oil and natural gas producing activities for the years ended December 31, 2011, 2010 and 2009:
|
| | | | | | | | | | | | |
| | | Year Ended December 31, |
| | | 2011 | | 2010 | | 2009 |
| ($ in thousands) | | | | | | |
| Revenues: | | | | | | |
| Sales to third parties | | $ | 138,383 |
| | $ | 81,148 |
| | $ | 67,159 |
|
| Intercompany sales | | 48,203 |
| | 6,063 |
| | — |
|
| Total revenues | | 186,586 |
| | 87,211 |
| | 67,159 |
|
| Costs and expenses: | | | | | | |
| Production costs | | 47,726 |
| | 32,858 |
| | 26,335 |
|
| General and administrative | | 11,124 |
| | 6,349 |
| | 5,151 |
|
| Depreciation, depletion, and amortization | | 65,531 |
| | 30,424 |
| | 34,009 |
|
| Impairment | | 11,728 |
| | 3,536 |
| | 8,114 |
|
| Total costs and expenses | | 136,109 |
| | 73,167 |
| | $ | 73,609 |
|
| Results of continuing operations | | 50,477 |
| | 14,044 |
| | (6,450 | ) |
| Discontinued operations | | — |
| | 5,262 |
| | 5,686 |
|
| Total result of operations | | $ | 50,477 |
| | $ | 19,306 |
| | $ | (764 | ) |
* * * *
Index to Exhibits
|
| |
Exhibit Number | Description |
| | |
2.1 | Membership Interest Contribution Agreement, by and among (i) CC Energy II L.L.C., Crow Creek Energy II L.L.C. and Crow Creek Operating Company II L.L.C., (ii) Natural Gas Partners VIII, L.P. and the other contributors party thereto and (iii) Eagle Rock Energy Partners, L.P., dated as of April 12, 2011 (incorporated by reference to Exhibit 2.1 to the Partnership's Current Report on From 8-K filed on April 13, 2011)
|
|
|
| 3.1 | Certificate of Limited Partnership of Eagle Rock Energy Partners, L.P. (incorporated by reference to Exhibit 3.1 of the registrant's registration statement on Form S-1 (File No. 333-134750))
|
| | |
| 3.2 | Second Amended and Restated Agreement of Limited Partnership of Eagle Rock Energy Partners, L.P. (incorporated by reference to Exhibit 3.1 of the registrant's current report on Form 8-K filed with the Commission on May 25, 2010)
|
| | |
| 3.3 | Certificate of Limited Partnership of Eagle Rock Energy GP, L.P. (incorporated by reference to Exhibit 3.3 of the registrant's registration statement on Form S-1 (File No. 333-134750))
|
|
|
| 3.4 | Limited Partnership Agreement of Eagle Rock Energy GP, L.P. (incorporated by reference to Exhibit 3.4 of the registrant’s registration statement on Form S-1 (File No. 333-134750)) |
| | |
| 3.5 | Certificate of Formation of Eagle Rock Energy G&P, LLC (incorporated by reference to Exhibit 3.5 of the registrant's registration statement on Form S-1 (File No. 333-134750))
|
| | |
| 3.6 | Third Amended and Restated Limited Liability Company Agreement of Eagle Rock Energy G&P, LLC (incorporated by reference to Exhibit 42 of the registrant's current report on Form 8-K filed with the Commission on July 30, 2010)
|
|
|
| 3.7 | Amendment No. 1 to the Second Amended and Restated Agreement of Limited Partnership of Eagle Rock Energy Partners, L.P. (incorporated by reference to Exhibit 4.1 of the registrant's current report on Form 8-K filed with the Commission on July 30, 2010) |
|
|
| 4.1 | Form of Common Unit Certificate (included as Exhibit A to the Second Amended and Restated Partnership Agreement of Eagle Rock Energy Partners, L.P.) (incorporated by reference to Exhibit 3.1 of the registrant’s current report on Form 8-K filed on May 25, 2010) |
|
|
| 4.2 | Form of Warrant Agent Agreement between Eagle Rock Energy Partners, L.P. and American Stock Transfer & Trust Company, LLC, as warrant agent (incorporated by reference to Exhibit 4.3 to the registrant's current report on Form 8-K filed on May 27, 2010) |
| | |
| 4.3 | Form of Warrant (included as Exhibit A to Exhibit 4.3 to the registrant's current report on Form 8-K filed on May 27, 2010)
|
|
|
| 4.4 | Indenture dated as of May 27, 2011 among Eagle Rock Energy Partners, L.P., Eagle Rock Energy Finance Corp., the Guarantors named therein and U.S. Bank National Association, as trustee (incorporated by reference to Exhibit 4.1 to the Partnership's Current Report on Form 8-K filed with the Commission on May 27, 2011) |
| | |
| 4.5 | Registration Rights Agreement dated as of May 27, 2011 among Eagle Rock Energy Partners, L.P., Eagle Rock Energy Finance Corp., the Guarantors named therein and the Initial Purchasers named therein (incorporated by reference to Exhibit 4.2 to the Partnership's Current Report on Form 8-K filed with the Commission on May 27, 2011) |
| | |
| 4.6 | First Supplemental Indenture dated as of June 28, 2011, among Eagle Rock Gas Services, LLC, a subsidiary of Eagle Rock Energy Partners, L.P., Eagle Rock Energy Finance Corp., the Guarantors named therein and U.S. Bank National Association, as trustee (incorporated by reference to Exhibit 4.2 to the Partnership's Quarterly Report on Form 10-Q filed with the Commission on August 4, 2011) |
| | |
| 10.1** | Amended and Restated Eagle Rock Energy Partners, L.P. Long-Term Incentive Plan dated September 17, 2010 (incorporated by reference to Exhibit 10.1 of the registrant’s current report on Form 8-K filed on September 17, 2010) |
|
|
| 10.2† | Natural Gas Liquids Exchange Agreement by and between ONEOK Hydrocarbon, L.P. and ONEOK Texas Field Services, L.P. (Eagle Rock Field Services, L.P.) (incorporated by reference to Exhibit 10.5 of the registrant’s registration statement on Form S-1 (File No. 333-134750)) |
|
|
| 10.3 | Gas Sales and Purchase Agreement between MC Panhandle, Inc. (Chesapeake Energy Marketing Inc.) and MidCon Gas Services Corp. (Eagle Rock Field Services, L.P.) (incorporated by reference to Exhibit 10.6 of the registrant’s registration statement on Form S-1 (File No. 333-134750)) |
| | |
| 10.4 | Brookeland Gas Facilities Gas Gathering and Processing Agreement between Union Pacific Resources Company (Anadarko E&P Company LP) and Sonat Exploration Company (Eagle Rock Field Services, L.P.) (incorporated by reference to Exhibit 10.7 of the registrant’s registration statement on Form S-1 (File No. 333-134750)) |
|
|
| 10.5 | Gas Purchase Contract between Warren Petroleum Company (Eagle Rock Field Services, L.P.) and Wallace Oil & Gas, Inc. (Cimarex Energy Co.) (incorporated by reference to Exhibit 10.10 of the registrant’s registration statement on Form S-1 (File No. 333-134750)) |
|
|
| 10.6 | Base Contract for Sale and Purchase of Natural Gas between Eagle Rock Field Services, L.P. and Odyssey Energy Services, LLC (incorporated by reference to Exhibit 10.13 of the registrant’s registration statement on Form S-1 (File No. 333-134750)) |
| | |
| 10.7** | Form of Supplemental Indemnification Agreement among Eagle Rock Energy G&P, LLC, Eagle Rock Energy GP, L.P., Eagle Rock Energy Partners, L.P. and officers and directors of Eagle Rock Energy G&P, LLC (incorporated by reference to Exhibit 10.1 of the registrant’s current report on Form 8-K filed with the Commission on December 30, 2009) |
| | |
| 10.8**† | Eagle Rock Energy G&P, LLC 2010 Short Term Incentive Bonus Plan approved and adopted on December 30, 2009 (incorporated by reference to Exhibit 10.3 of the registrant’s current report on Form 8-K filed with the Commission on December 30, 2009) |
|
|
|
| |
Exhibit Number | Description |
| | |
| 10.9 | Amended and Restated Securities Purchase and Global Transaction Agreement dated January 12, 2010 among Natural Gas Partners VII, L.P., Natural Gas Partners VIII, L.P., Montierra Minerals & Production, L.P., Montierra Management LLC, Eagle Rock Holdings, L.P., Eagle Rock Energy G&P, LLC, Eagle Rock Energy GP, L.P. and Eagle Rock Energy Partners, L.P. (incorporated by reference to Exhibit 10.1 of the registrant's current report on Form 8-K filed with the Commission on January 12, 2010)
|
| | |
| 10.10 | Amended and Restated Credit Agreement, dated as of June 22, 2011, among Eagle Rock Energy Partners, L.P., as borrower, Wells Fargo Bank, National Association, as administrative agent and swingline lender, Bank of America, N.A. and The Royal Bank of Scotland plc, as co-syndication agents, and BNP Paribas, as documentation agent, and the lenders party thereto (incorporated by reference to Exhibit 10.1 to the Partnership's Current Report on Form 8-K filed with the Commission on June 22, 2011)
|
| | |
| 10.11 | Contribution Agreement, dated May 24, 2010, by and among the Partnership, Eagle Rock Holdings, L.P. and Eagle Rock Energy GP, L.P. (incorporated by reference to Exhibit 10.1 to the registrant's current report on Form 8-K filed on May 25, 2010)
|
|
|
| 10.12** | Executive Change of Control Agreement Policy (incorporated by reference to Exhibit 10.1 to the registrant's current report on Form 8-K filed on July 28, 2010)
|
|
|
| 10.13** | Form of Executive Change of Control Agreement (incorporated by reference to Exhibit 10.2 to the registrant's current report on Form 8-K filed on July 28, 2010)
|
|
|
| 10.14** | Administrative Services Agreement, dated as of July 30, 2010, between Eagle Rock Energy Partners, L.P. and Eagle Rock Energy G&P, LLC (incorporated by reference to Exhibit 10.1 to the registrant's current report on Form 8-K filed on July 30, 2010)
|
|
|
| 10.15 | Form of Restricted Unit Agreement for Non-Employee Directors Under the Eagle Rock Energy Partners Long-Term Incentive Plan (incorporated by reference to Exhibit 10.3 to the registrant's current report on Form 8-K filed on July 30, 2010) |
|
|
| 10.16** | Form of Restricted Unit Agreement for Officers under the Eagle Rock Energy Partners Long-Term Incentive Plan (incorporated by reference to Exhibit 10.2 to the registrant's current report on Form 8-K filed on December 30, 2009) |
|
|
| 10.17† | Amendment to Natural Gas Liquids Exchange Agreement by and between ONEOK Hydrocarbon, L.P. and Eagle Rock Field Services L.P. (successor to ONEOK Texas Field Services, L.P.) dated December 3, 2010 (incorporated by reference to Exhibit 10.1 to the registrant's current report on Form 8-K filed on December 9, 2010) |
|
|
| 10.18 | Amendment to Natural Gas Liquids Exchange Agreement by and between ONEOK Hydrocarbon, L.P, and Eagle Rock Field Services, L.P. (incorporated by reference to Exhibit 10.1 of the registrants current report on Form 8-K filed with the Commission on August 23, 2011) |
|
|
| 10.19**† | Eagle Rock Energy G&P, LLC 2011 Short Term Incentive Bonus Plan (incorporated by reference to Exhibit 10.1 to the registrant's current report on Form 8-K filed on February 14, 2011)
|
|
|
| 10.20** | Amendments to certain company performance goals under the Eagle Rock Energy G&P, LLC 2011 Short Term Incentive Bonus Plan (incorporated by reference to Exhibit 10.3 to the Partnership's Current Report on Form 8-K filed with the Commission on May 3, 2011) |
| | |
| 10.21** | Registration Rights Agreement dated May 3, 2011 by and between Eagle Rock Energy Partners, L.P. and Natural Gas Partners VIII, L.P. (incorporated by reference to Exhibit 10.1 to the Partnership's Current Report on Form 8-K filed with the Commission on May 3, 2011) |
| | |
| 10.22** | Voting Agreement dated May 3, 2011 by and between Eagle Rock Energy Partners, L.P. and Natural Gas Partners VIII, L.P. (incorporated by reference to Exhibit 10.2 to the Partnership's Current Report on Form 8-K filed with the Commission on May 3, 2011) |
| | |
| 10.23 | Purchase Agreement dated as of May 24, 2011 among Eagle Rock Energy Partners, L.P., Eagle Rock Energy Finance Corp., the Guarantors named therein and the Initial Purchasers named therein (incorporated by reference to Exhibit 10.1 to the Partnership's Current Report on Form 8-K filed with the Commission on May 27, 2011) |
| | |
| 12.1* | Statement Regarding Computation of Ratio of Earnings to Fixed Charges |
| | |
| 14.1 | Code of Ethics for Chief Executive Officer and Senior Financial Officers posted on the Company’s website at www.eaglerockenergy.com. |
| | |
| 21.1* | List of Subsidiaries of Eagle Rock Energy Partners, L.P. |
|
|
| 23.1* | Consent of KPMG LLP |
|
|
| 23.2* | Consent of Deloitte & Touche LLP |
| | |
| 23.3* | Consent of Cawley, Gillespie & Associates, Inc. |
|
|
| 31.1* | Certification of Periodic Financial Reports by Joseph A. Mills in satisfaction of Section 302 of the Sarbanes-Oxley Act of 2002 |
| | |
| 31.2* | Certification of Periodic Financial Reports by Jeffrey P. Wood in satisfaction of Section 302 of the Sarbanes-Oxley Act of 2002 |
| | |
| 32.1* | Certification of Periodic Financial Reports by Joseph A. Mills in satisfaction of Section 906 of the Sarbanes-Oxley Act of 2002 |
| | |
| 32.2* | Certification of Periodic Financial Reports by Jeffrey P. Wood in satisfaction of Section 906 of the Sarbanes-Oxley Act of 2002 |
| | |
| 99.1* | Report of Cawley, Gillespie & Associates, Inc. |
|
|
| 101.INS* | XBRL Instance Document |
|
|
| 101.SCH* | XBRL Taxonomy Extension Schema Document |
|
|
| 101.CAL* | XBRL Taxonomy Extension Calculation Linkbase Document |
|
|
|
| |
| 101.DEF* | XBRL Taxonomy Extension Definition Linkbase Document |
|
|
| 101.LAB* | XBRL Taxonomy Extension Label Linkbase Document |
| | |
| 101.PRE* | XBRL Taxonomy Extension Presentation Linkbase Document |
|
|
| |
| ** | Management contract or compensatory plan or arrangement required to be filed as an exhibit hereto. |
| |
| † | Portions of this exhibit have been omitted pursuant to a request for confidential treatment. |