Exhibit 99.1
Proposed Transaction for Shareholder
Approval
November 2007

Safe Harbor Statement
This presentation has been filed with the SEC on November 7, 2007 as part of a Current Report on Form 8-K of the Company. The Company is
holding presentations for its security holders, as well as certain other persons, regarding the proposed vessel acquisition. A copy of the complete
presentation is available at the Securities and Exchange Commission's ("SEC") website (http://www.sec.gov).
Except for the historical information contained herein, this presentation contains among other things, certain forward looking statements, within the
meaning of the Private Securities Litigation Reform Act of 1995, that involve risks and uncertainties. Such statements may include, without limitation,
statements with respect to the Company's plans, objectives, expectations and intentions and other statements identified by words such as
“may,” “could,” “would,” “should,” “believes,” “expects,” “anticipates,” “estimates,” “intends,” “plans” or similar expressions. These statements are
based upon the current beliefs and expectations of the Company's management and are subject to significant risks and uncertainties, including those
detailed in the Company's filings with the Securities and Exchange Commission ("SEC"). Actual results, including, without limitation, operating or
financial results, if any, may differ from those set forth in the forward-looking statements. These forward-looking statements involve certain risks and
uncertainties that are subject to change based on various factors (many of which are beyond the Company's control).
Forward-looking statements include statements regarding:
The delivery to and operation of assets by the Company;
The Company's future operating or financial results;
Future, pending or recent acquisitions and business strategy;
Areas of possible expansion, and expected capital spending or operating expenses; and
Dry bulk market trends, including charter rates and factors affecting vessel supply and demand.
The financial information and data contained in this presentation is unaudited and does not conform to the SEC's Regulation S-X. Accordingly, such
information and data may not be included, or may be presented differently, in the Company's proxy statement to solicit shareholder approval for its
proposed business combination. This presentation includes certain estimated financial information and forecasts (EBIT, EBITDA, and Time Charter
Equivalent Revenue) that are not derived in accordance with generally accepted accounting principles ("GAAP"), and which may be deemed to be non-
GAAP financial measures within the meaning of Regulation G promulgated by the SEC.
2
Safe Harbor Statement
The Company believes that the presentation of these non-GAAP measures provides information that is useful to the Company’s shareholders as they
indicate the ability of the Company to meet capital expenditures, working capital requirements and other obligations, and make distributions to
its shareholders. However, EBIT, EBITDA and Time Charter Equivalent Revenue should be considered in addition to, and not as substitutes for, or
superior to, operating income, cash flows, revenue or other measures of financial performance prepared in accordance with GAAP. EBIT, EBITDA and
Time Charter Equivalent Revenue may not be comparable to similarly titled measures reported by other companies.
The Company undertakes no obligation to publicly update or revise any forward-looking statements or other information or data contained in this
presentation, whether to reflect any change in our expectations with respect to such statement or any change in events, conditions or circumstances
on which any statement is based, or otherwise.
The Company and its directors and executive officers may be deemed to be participants in the solicitation of proxies for the special meeting of the
Company’s shareholders to be held to approve the proposed vessel acquisition and other matters. Each of the Company’s officers and directors are
also shareholders of the Company and have waived their rights to any liquidation distribution the Company makes with respect to shares they acquired
before the IPO. Therefore, their securities will be worthless if the Company does not acquire a target business within two years of the IPO date, as
required by its Articles of Incorporation and as more fully described in its prospectus relating to the initial public offering of its securities.
Shareholders of the Company and other interested persons are advised to read the Company’s preliminary proxy statement and definitive proxy
statement, when available, in connection with the Company’s solicitation of proxies for the special meeting because these documents will contain
important information. The definitive proxy statement will be mailed to shareholders as of a record date to be established for voting on the proposed
vessel acquisition and other matters. Shareholders will also be able to obtain a copy of the definitive proxy statement, without charge, by directing a
request to:
Oceanaut, Inc.
17th Km National Road Athens-Lamia & Finikos Street
145 64 Nea Kifisia
Athens, Greece
The preliminary proxy statement and definitive proxy statement, once available, can also be obtained, without charge, at the Securities and Exchange
Commission’s website at http://www.sec.gov.
3

Oceanaut Overview
Oceanaut is a SPAC trading on the AMEX (ticker: OKN)
Formed to pursue a business combination in the shipping industry
Raised $150 million in proceeds via an Initial Public Offering in March 2007
$8.00 Unit – 1 common share and 1 warrant
Current unit price $10.71 up 33.9% since IPO
Oceanaut entered into a definitive agreement to acquire 9 dry bulk carriers
from companies controlled by the Restis family in October 2007
Vessel purchase price of $700 million
4 vessels currently on the water
2 vessels scheduled for delivery in 2008
3 vessels scheduled for delivery in 2009
Note: Unit price as of market close 11/6/2007.
4
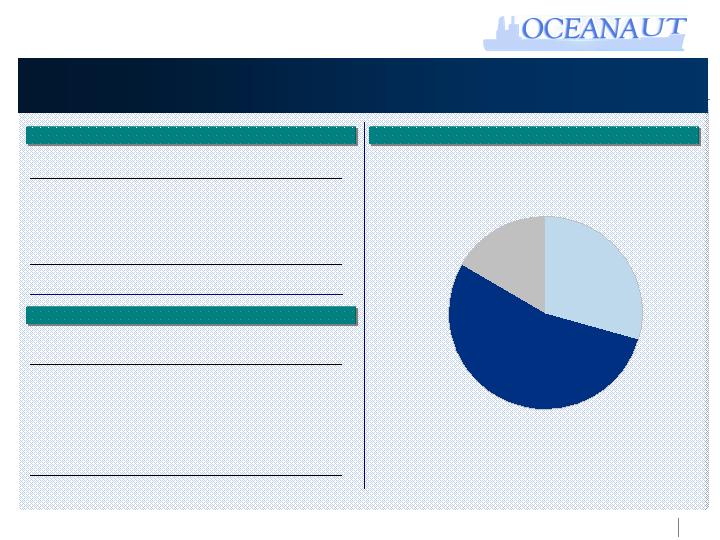
Transaction Structure
Transaction Sources
Transaction Uses
Post Closing Ownership (2)
Note: Sources and Uses exclude fees relating to proxy and debt financing.
(1) Expected to be provided by a credit facility, proceeds from the exercise of warrants and / or other sources. Payment to shipyard for newbuilds.
(2) Does not include shares underlying warrants.
$709.5
Total
260.8
Additional Funding Post Closing(1)
221.8
Funded Debt at Closing
82.5
Proceeds from Private Placement
$144.4
Cash in Trust
Sources
5.0
Working Capital
65.2
Initial Payment for Newbuilds
$709.5
Total
260.8
Additional Payment for Newbuilds
4.5
Deferred Underwriters’ Fee
$374.0
Purchased Vessels at Closing
Uses
Public
53.8%
Restis Family
29.6%
Excel Maritime /
Insiders
16.7%
$ in millions
5
$50.6
Value of Warrants
$299.1
Pro Forma Market Capitalization
$2.31
Oceanaut Warrant Price as of 11/6/07
21.9
Warrants Outstanding(2)
9.5x - 10.5x
Public Comps
7.8x
Implied FV / Est. Full Fleet EBITDA(1)
$815.5
Implied Firm Value
465.8
Net Debt (3)
$349.7
Diluted Pro Forma Market Capitalization
34.9
Total Common Shares
10.3
Private Placement Shares
24.6
Existing Common Shares
$8.57
Oceanaut Share Price as of 11/6/07
6.7x
Transaction Value / Est. Full Fleet EBITDA(1)
105
Estimated Full Fleet EBITDA(1)
$700
Acquisition Price
Value Creation
Significant Upside Remains
Potential Multiple Expansion
Pro Forma Valuation
Note: Vessels under charters which expire prior to achieving full run rate are assumed to operate under current forward market estimates.
(1) Represents full year of EBITDA in which all 9 vessels are on the water and generating revenue.
(2) Excludes founder’s warrants.
(3) Assumes debt is used to fund additional payment for newbuilds. $482.6 of total debt, $5.0 million of cash held for working capital and $11.8 mm of cash on balance sheet. Assumes warrants are
not yet exercised.
7.8x
7.8x
1.7x
9.5x
10.5x
2.7x
Pro Forma Firm
Value
Value Creation
Fully Distributed
$ in millions
6
Approximate
LQA
Firm Value /
# of
Average
(a)
Payout
FV/
Dividend
2008E
Vessels
Fleet Age
DWT
Ratio
(b)
TAV
Yield
EBITDA
21
5.4
2.4
100%
131.9%
5.4%
11.8x
49
2.0
2.7
100
102.3
6.0
14.0
9
11.7
0.7
85
137.8
7.6
6.8
11
6.5
0.7
75
110.6
7.6
6.8
32
7.0
2.7
55
127.8
3.9
9.5
37
5.2
4.1
50
89.9
4.6
9.9
54
4.8
5.4
20
112.9
1.6
8.1
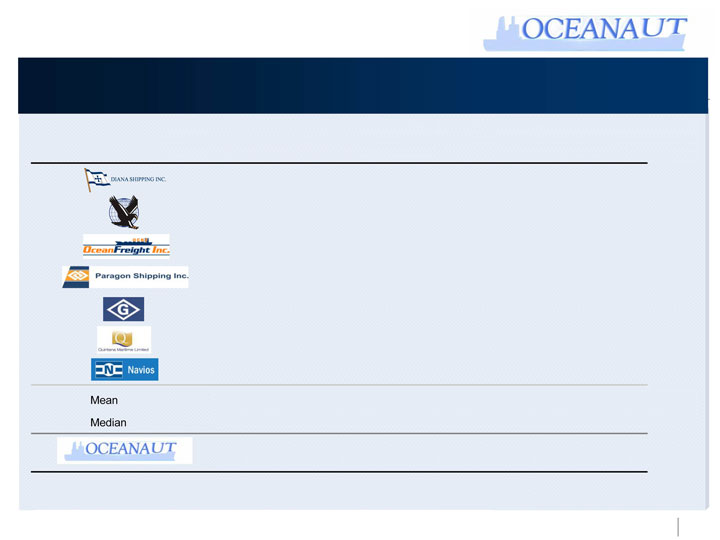
Mean
30
6.1
2.7
69%
116.2%
5.2%
9.6x
Median
32
5.4
2.7
75
112.9
5.4
9.5
9
6.1
0.8
114.7%
7.7x
(d)
(e)
(c)
High Payout Dry Bulk Peer Comparison
Note: Share prices as of November 6, 2007. Fleet information includes announced transactions and ordered newbuilds.
(a) In years.
(b) Dividend as percent of Distributable Cash Flow (DCF); DCF is defined as 2007E EBITDA - Interest Expense - Drydock.
(c) Total Asset Value does not include the value of the recently announced acquisition of 2 Panamax vessels.
(d) 21 of 26 newbuilds have charters of 10 or more years.
(e) Represents full year of EBITDA in which all 9 vessels are on the water and generating revenue.
7
Investment Highlights
Quality of Vessels and Diversity of Fleet
Weighted average age of ~6 years(1)
2 Capesize, 4 Panamax and 3 Supramax
Strong Industry Fundamentals
Demand for raw materials in developing countries has been driving growth in industry and
increases in rates
Extended delivery times for newbuildings in dry bulk
Predictable Revenues
Charter Parties with South African Marine provide predetermined charter rates
Sponsors’ Value Adding Experience
Significant knowledge and experience in the shipping industry in general and dry bulk in particular
Valuation Upside
(1) Weighted average based on dwt.
8

Company Overview
Oceanaut, Inc.
Company Overview
Oceanaut will operate 9 dry bulk carriers
2 Capesize
4 Panamax
3 Supramax
Carrying capacity of 809,000 deadweight tons
Vessels will be commercially managed by Safbulk, an affiliate of the Restis Family
Vessels will be technically managed by Maryville Maritime, a subsidiary of Excel
Maritime Carriers
7 of the 9 vessels will be on time charters to South African Marine Corporation, an
affiliate of the Restis Family
10
Distinguishing Factors and Business Strategy
Established Customer Relationships
Experienced Sponsors
Highly Efficient Operations
Staggered Charter Maturities
Modern and Diversified Fleet
Fleet Growth Potential
Intend to Pay Quarterly Dividends
11
Fleet Profile
$700.0
~6.1(3)
809,000
Total
36
33.0
64.0
Apr-09
55,000
Supramax
TBN
36
36.0
69.5
Oct-08
55,000
Supramax
TBN
36
42.0
69.5
Jun-08
55,000
Supramax
TBN
18
38.0
61.0
Jun-93
73,500
Panamax
Miden Max
24
55.0
63.5
Jun-94
73,500
Panamax
Hamburg Max
24
55.0
60.5
Jun-93
73,500
Panamax
Bremen Max
12
28.5
50.0
Jun-94
73,500
Panamax
Bergen Max
60
45.0
131.0
Dec-09
175,000
Capesize
TBN
60
$45.0
$131.0
Oct-09
175,000
Capesize
TBN
Charter
Period(2)
Gross
Charter
Rate
Price (mm)
Year Built
Dwt(1)
Type
Name
(1) All Dwt numbers are approximate.
(2) Charter Period in Months from vessel delivery date.
(3) Calculated as of delivery of final newbuild; weighted average based on dwt.
12

Overview of Excel Maritime
Excel Maritime Carriers Ltd. (NYSE: EXM) was incorporated in 1998
Has been a publicly traded company since 1998
Headquartered in Athens, Greece
Excel has an on the water fleet of 16 vessels with 2 additional vessels expected to be delivered in 4Q2007
10 Panamax
6 Handymax
2 Supramax to be delivered in December 2007
Maryville Maritime Inc. provides technical management to Excel
Established in 1983
First ship management company in Greece to voluntarily receive simultaneous ISM and ISO Safety and Quality Systems Certification in February 1996; currently ISO 9001:2000 and ISO 14001:2004 compliant
Wholly owned subsidiary of Excel Maritime since 2001
Excel’s Market Capitalization was $1.2 bn as of 11/6/07
Share price of $61.74
Firm value of $1.3 bn
FV / 2008E EBITDA of 6.8x
LQA dividend yield of 1.3%
13

Overview of the Restis Family
The Restis family has been engaged in international shipping for over 40 years
Companies associated with the Family manage, own or operate 62 vessels with an additional 30 vessels on order
Combined carrying capacity in excess of 7,700,000 dwt
Family members have strategic minority holdings in companies controlling an additional 92 vessels
Expertise in various sectors of the shipping industry, including: dry bulk carriers, product tankers, crude oil carriers,
refrigerated cargo ships and cruise ships
Companies associated with the Restis family include:
South African Marine Corp.
Safbulk Pty. Ltd.
Enterprises Shipping and Trading S.A.
First Financial Corp.
Golden Energy Management S.A.
Active in other sectors including: banking, energy production and distribution, media,
food services, ship repair and conversion, leisure, financial and advisory services,
trading, real estate investment and development and aviation
Golden Energy Marine Corp.
SwissMarine Corp.
Freeseas Inc.
Paramount Tankers Corp.
Bulk Energy Transportation (Holdings) Limited
14
Overview of South African Marine
South African Marine was established in 1946
From 1946-1999, South African Marine grew into the largest shipping group on the
African continent
In 1999, the Restis family acquired the non-liner business of South African Marine
from a subsidiary of Old Mutual
Included a fleet of 13 dry bulk vessels, as well as the South African Marine and
Safbulk shipping brand names
Under the Restis family, Safbulk has expanded its operations
significantly
Commercially manages over 50 dry bulk vessels
Transports more than 35 mm tons or cargo annually
Expected to generate over $500 mm in revenues in 2007
South African Marine today is held by South African Marine S.A.
Dedicated chartering company with a fleet of 16 vessels including the Oceanaut
ships
15

Financial Overview
Oceanaut, Inc.
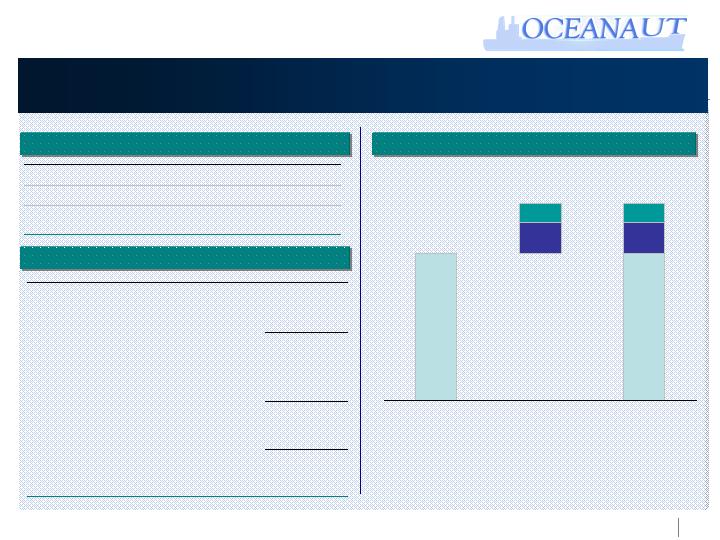
Estimated Annual Run Rate Performance
Run Rate Operating Performance
Total
Newbuilds
Ships on
Water Today
$45
(2)
(7)
$55
$60
(2)
(8)
$70
$105
EBITDA
(4)
General & Administrative Expense
(15)
Operating Expenses
$125
Net Charter Revenue
Note: Represents full year of EBITDA in which all 9 vessels are on the water and generating revenue.
Vessels under charters which expire prior to achieving full run rate are assumed to operate under current forward market estimates.
Numbers do not add due to rounding.
Assumptions:
Estimated Full Fleet EBITDA assumes all 9 vessels are on the water and generating revenue
Rates are based on chartering agreements
For charter contracts expiring prior to achieving full run rate, rates are based on forward industry
estimates
$55.0 thousand / day in 2009
$38.0 thousand / day in 2010
No taxes
$ in millions
17

Capital Structure and Dividend Policy
Oceanaut is in the process of finalizing a credit facility to help finance the fleet
acquisition
Over the long-term, Oceanaut will target a capital structure comparable to dividend oriented dry
bulk peers
Oceanaut plans to pay a quarterly dividend
Target payout is expected to be inline with industry peers
Oceanaut will update the market once a dividend policy has been set
18

Industry Highlights
Oceanaut, Inc.

Major Dry Bulk Seaborne Trade Routes
Source: Derived from industry sources.
To
Asia
From
Americas
Iron Ore
Coal
Grain
20
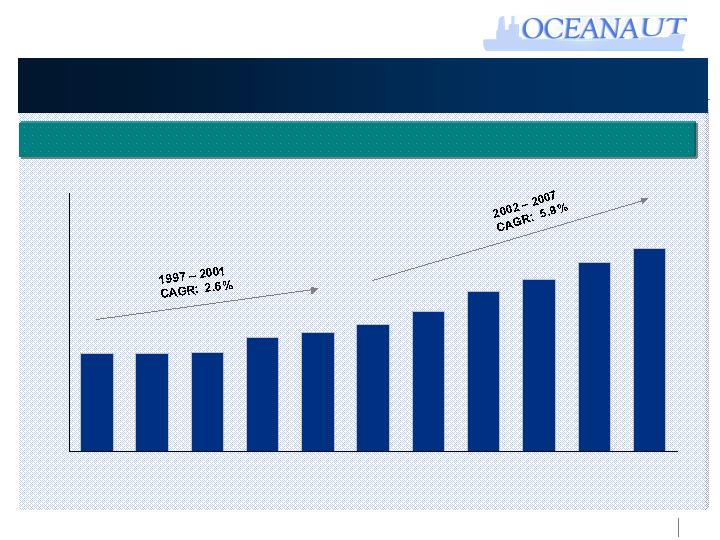
2,966
2,829
2,666
2,548
2,361
2,230
2,155
2,107
1,964
1,954
1,948
1,000
1,500
2,000
2,500
3,000
3,500
1997
1998
1999
2000
2001
2002
2003
2004
2005
2006
2007E
Dry Bulk Industry Performance
Source: Clarkson.
Seaborne Trade Growth
21
0.0
0.2
0.4
0.6
0.8
2000
2006
0.0
0.2
0.4
0.6
0.8
1.0
1.2
1.4
India
US
Europe
China
Japan
South
Korea
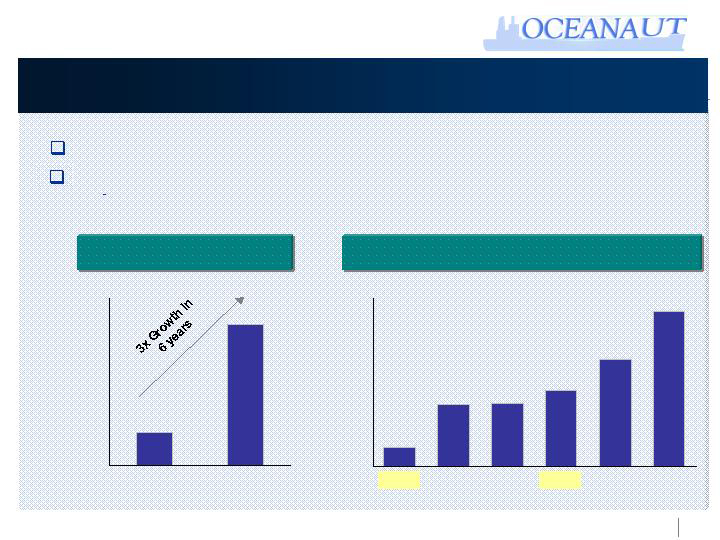
Increasing Steel Demand…
Rapid urbanization leads to increasing per capita consumption in China and India
Indian steel consumption expected to increase 400% to 200mm tons by 2020
India expanding investment in cities – 100mm people to move into urban areas in next 10 years
Tons per Urbanized Capita (2006)
China – Tons per Urbanized Capita
22
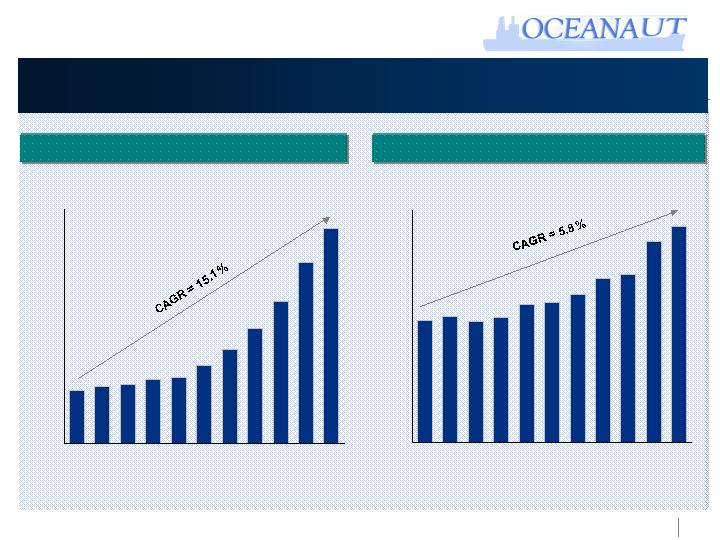
…Driving Steel Production and Dry Bulk Market
(Million Tons)
Indian Steel Production
Chinese Steel Production
(Million Tons)
0
50
100
150
200
250
300
350
400
450
1996
1997
1998
1999
2000
2001
2002
2003
2004
2005
2006
0
5
10
15
20
25
30
35
40
45
1996
1997
1998
1999
2000
2001
2002
2003
2004
2005
2006
Source: Clarkson.
23
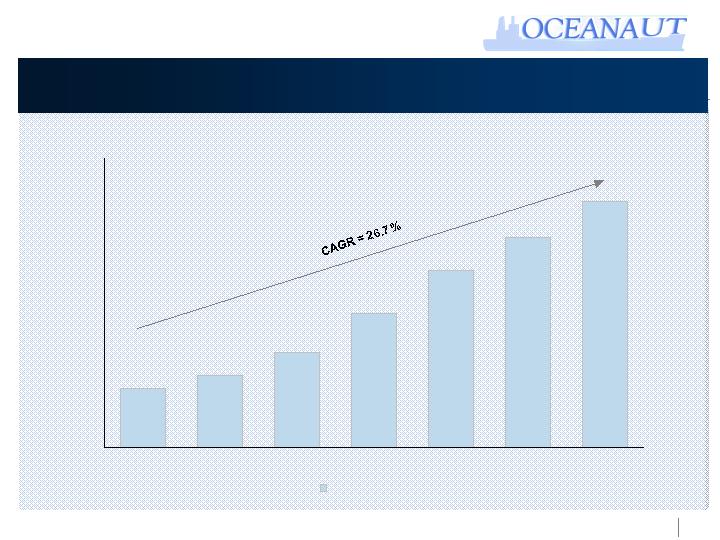
China’s Iron Ore Import Growth
Source: Clarkson.
(Million Tons)
0
50
100
150
200
250
300
350
400
450
2001
2002
2003
2004
2005
2006
2007E
Iron Ore Import (MT)
24
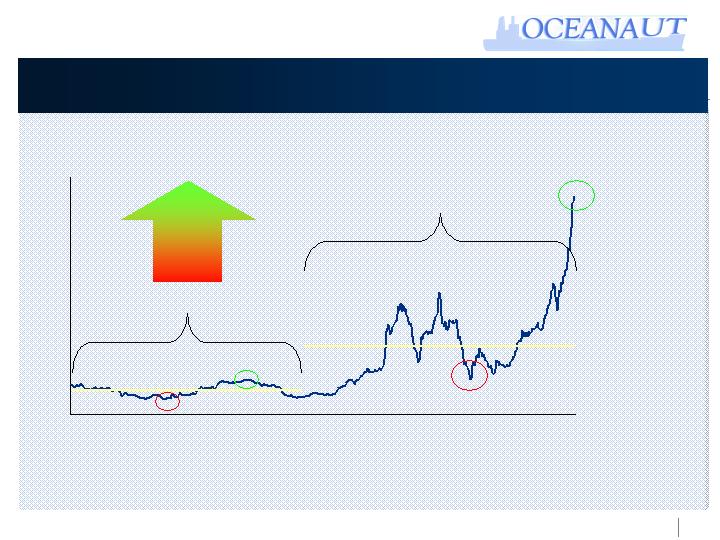
Baltic Dry Index Performance
Source: Bloomberg.
0
2,000
4,000
6,000
8,000
10,000
12,000
1/10/1997
3/5/1999
4/27/2001
6/20/2003
8/12/2005
10/5/2007
1997 – 2001 Average 1,235
2002 – 2007 Average 3,440
+ 178%
25
Dry Bulk Orderbook
Source: Clarkson and Drewry.
Existing Fleet (M DWT)
Deliveries Jan - Sep 07
Million DWT on Order
9/30/2007
Vessels
Million DWT
2007
2008
2009
2010
2011
2012
2013
Total
Capesize
128.10
42
7.86
2.39
11.32
20.03
40.44
17.32
3.77
0.36
103.49
Panamax
106.70
70
5.74
2.21
8.29
10.12
17.03
12.11
0.93
-
56.43
Handymax
75.20
76
3.96
1.53
8.38
13.79
12.52
5.35
1.00
-
46.52
Handysize
75.10
63
1.55
0.76
3.94
6.08
4.42
1.82
0.54
-
19.10
Total
385.10
251
19.11
6.88
31.92
50.02
74.41
36.60
6.24
0.36
225.54
% of Existing Fleet
-
-
5.0%
1.8%
8.3%
13.0%
19.3%
9.5%
1.6%
0.1%
58.6%
9/30/2007
9/30/2007
Existing Fleet (20+ years)
Existing DWT (vessels 20+ years)
Number of Vessels
% of Fleet
Total DWT (mm)
% of Orderbook
Capesize
140
18.6%
23.1
22.3%
Panamax
348
23.9%
23.3
41.3%
Handymax
389
24.8%
17.4
37.4%
Handysize
1,748
62.2%
47.1
246.6%
Total
2,625
39.8%
110.9
49.2%
26

Conclusion
Quality of Vessels and Diversity of Fleet
Weighted average age of ~6 years(1)
2 Capesize, 4 Panamax and 3 Supramax
Strong Industry Fundamentals
Demand for raw materials in developing countries has been driving growth in industry
and increases in rates
Extended delivery times for newbuildings in dry bulk
Predictable Revenues
Charter Parties with South African Marine provide predetermined charter rates
Sponsors’ Value Adding Experience
Significant knowledge and experience in the shipping industry in general and dry bulk
in particular
Valuation Upside
(1) Weighted average based on dwt.
27