 Q3 2010 Earnings Press Release Supplement 20 October 2010 Exhibit 99.2 |
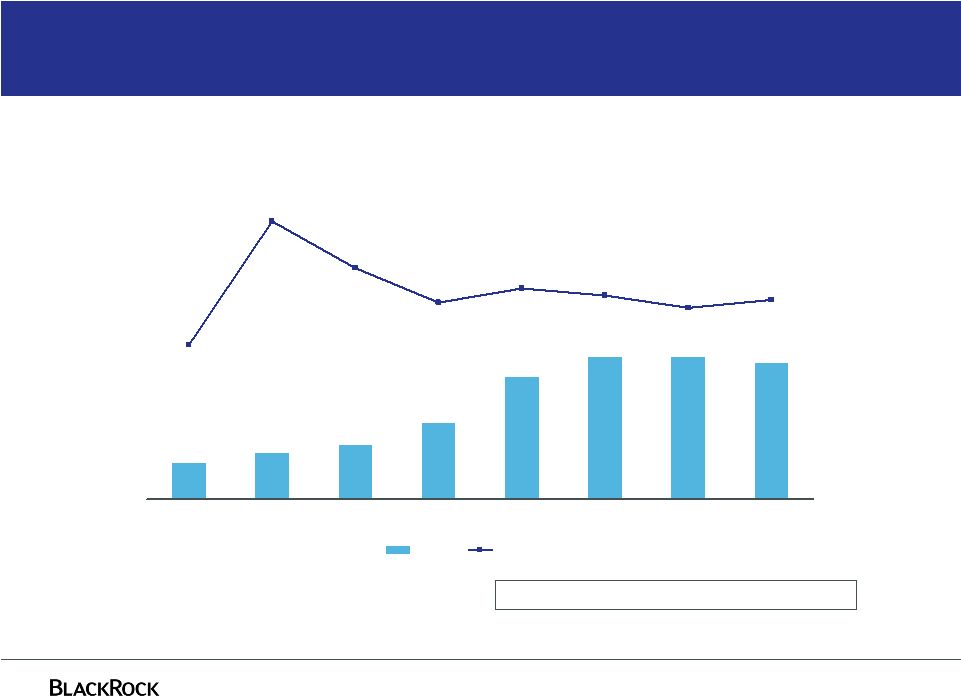
 1 $307 $302 $400 $561 $727 $741 $737 Q1 2009 Q2 2009 Q3 2009 Q4 2009 Q1 2010 Q2 2010 Q3 2010 $463 $469 $379 $110 $239 $293 $537 Strong financial performance marked by record EPS $0.81 $2.40 $2.37 $1.75 $2.75 $2.39 $2.10 Q1 2009 Q2 2009 Q3 2009 Q4 2009 Q1 2010 Q2 2010 Q3 2010 Operating and Net Income, as Adjusted Diluted Earnings Per Share, as Adjusted Reconciliation between GAAP and as Adjusted is provided in the appendix Operating Income Net Income |
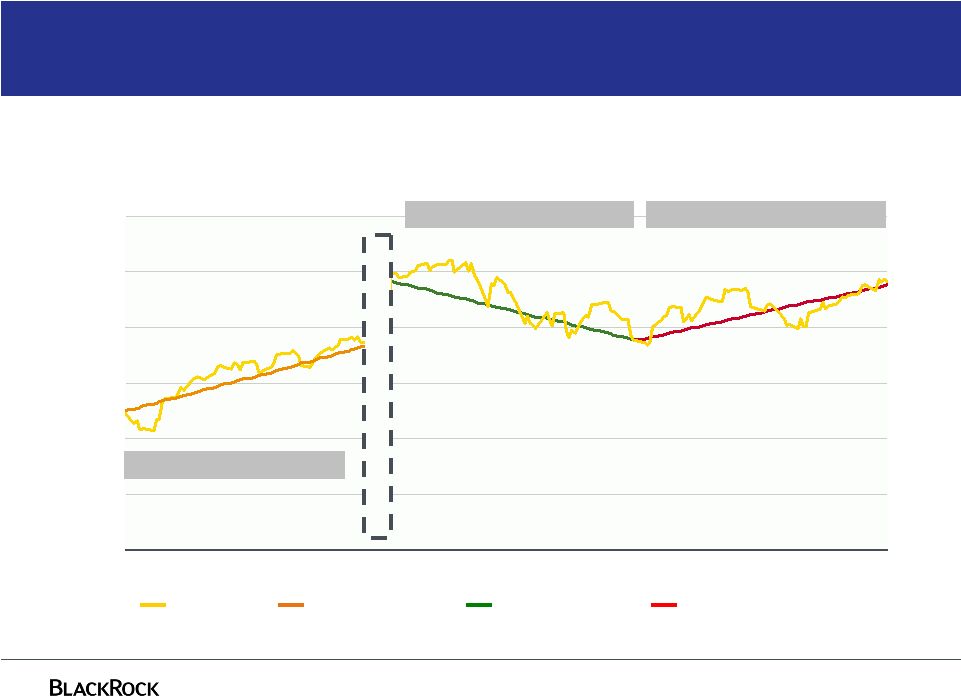
 2 37.4% 38.7% 36.8% 38.9% 38.8% 38.4% 2007 2008 2009 Pro Forma Q1 2010 Q2 2010 Q3 2010 While operating margins appear flat to reported BLK standalone results, margins actually have expanded by approximately 1.9 points YTD versus 2009 BLK/BGI ProForma 38.7% YTD We have expanded margins while investing in the business Operating Margins, as Adjusted For further information and reconciliation between GAAP and as Adjusted, see note (a) in the current earnings release as well as previously filed Forms 10-K, 10-Q and 8-K’s |
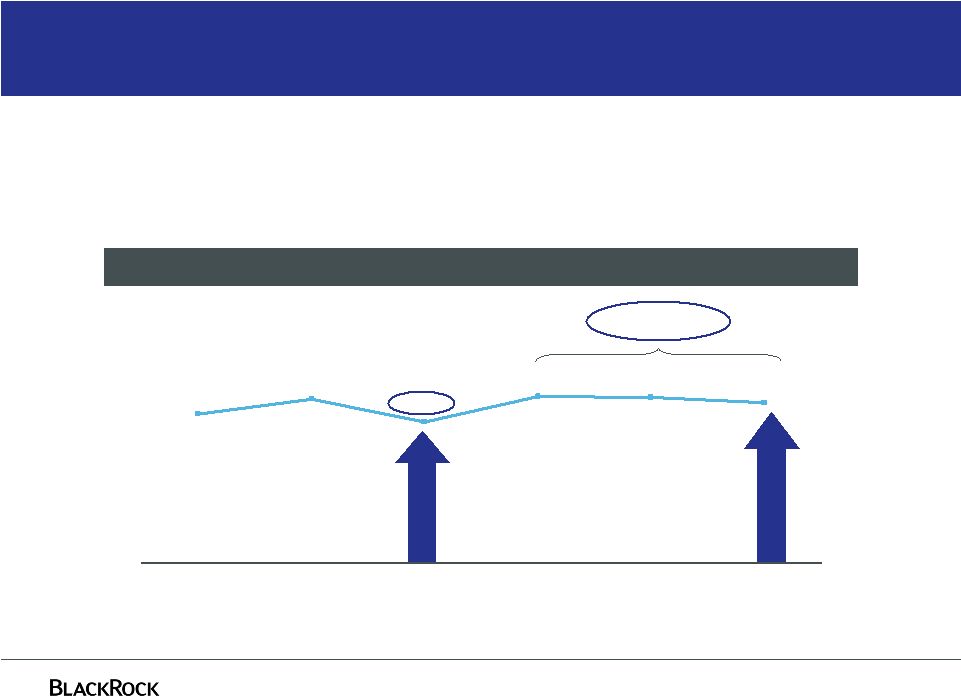
 3 Equity markets have been volatile Dow Jones Q2 2010 Spot to Spot Q3 2010 Spot to Spot Q2-10 Average: 10,565 Q3-10 Average: 10,390 6/30 7/31 8/31 Q3-09 Average: 9,221 Q3 2009 Spot to Spot 9/30 3/31 4/30 5/31 6/30 7/31 9/30 Equity markets in Q3 2010 were lower on average than Q2 2010, but higher than a year ago 6,000 7,000 8,000 9,000 10,000 11,000 12,000 8/31 |
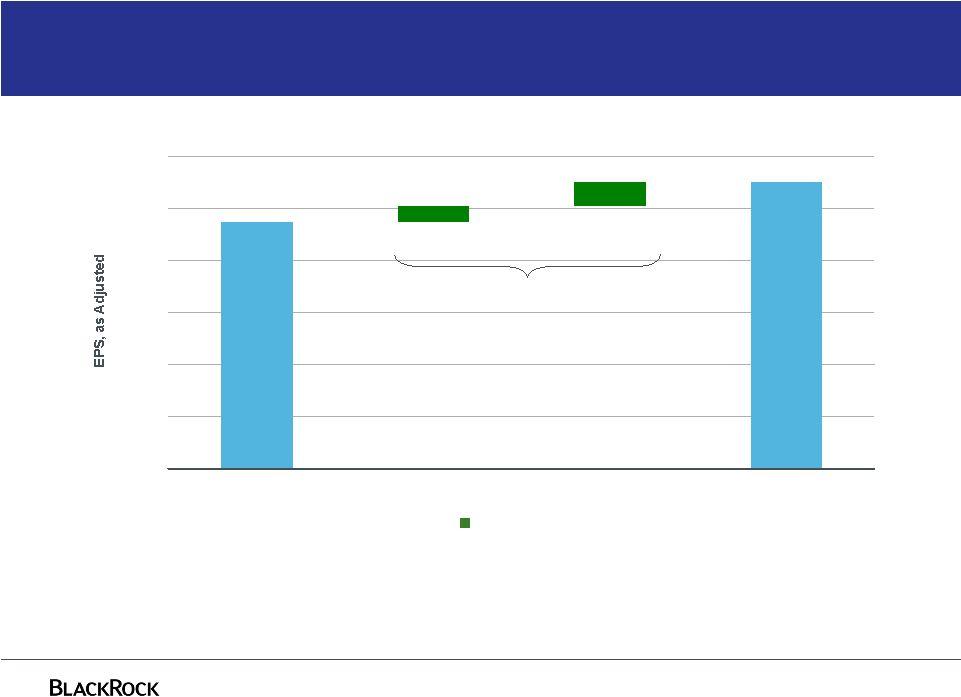 4 Improving operating & non-operating results $2.75 $2.37 $0.23 $0.15 $0.00 $0.50 $1.00 $1.50 $2.00 $2.50 $3.00 Q2-10 EPS Operating EPS Non-Operating EPS Q3-10 EPS $0.38 Increasing EPS Favorable tax rulings and the resolution of certain tax matters resulted in a YTD tax rate of 33.5% on an as adjusted basis. The Q3 EPS impact of the lower tax rate related to the first 6 months was $0.11. For further information and reconciliation between GAAP and as Adjusted, see notes (a) through (f) in the current earnings release |
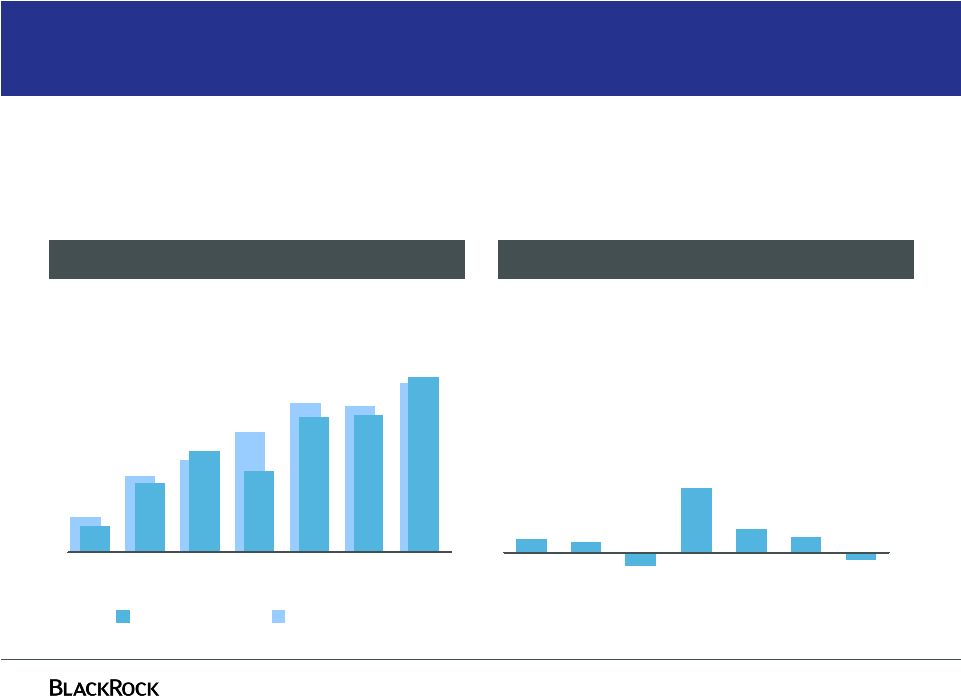
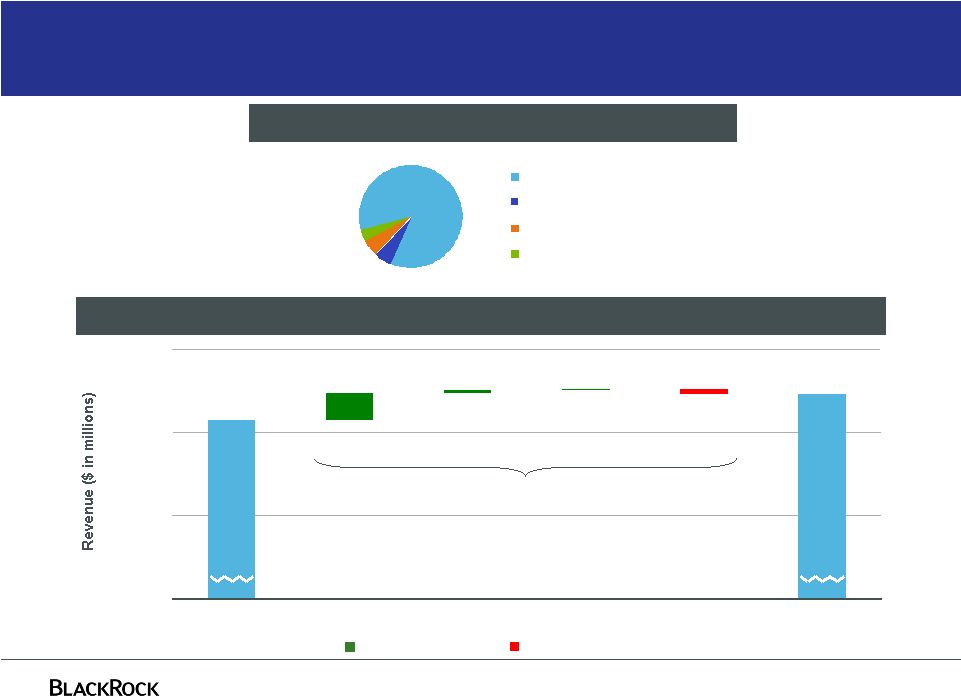 5 Strong investment performance drives revenue growth $2,092 $2,032 $7 $64 $2 ($13) Q2-10 Performance Fees Other Revenue Base Fees BRS & Advisory Q3-10 $60 million Decreasing Revenue Increasing Revenue 86% 5% 4% 5% Base Fees Performance Fees BRS and Advisory Other Revenue $2.09 billion $0 Q3-10 Total Revenue Q3-10 Compared to Q2-10 $1,800 $2,000 $2,200 |
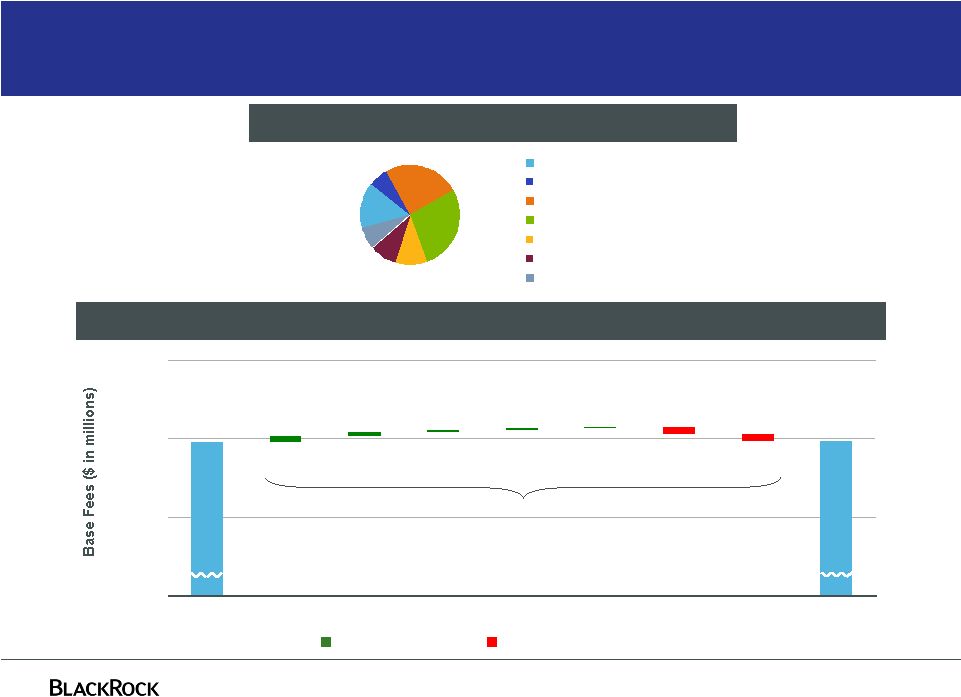 6 Base fees stable despite lower average markets 7% 9% 15% 6% 10% 28% 25% Active FI Index FI Active Equity Index Equity Multi-Asset Alternatives Cash Q3-10 Base Fees $0 Q3-10 Compared to Q2-10 $1.79 billion $1,600 $1,800 $2,000 $1,792 $1,794 $9 $15 $8 $3 $2 ($18) ($17) Q2-10 Index FI Active FI Multi-Asset Cash Alternatives Index Equity Active Equity Q3-10 Decreasing Base Fees Increasing Base Fees $2 million |
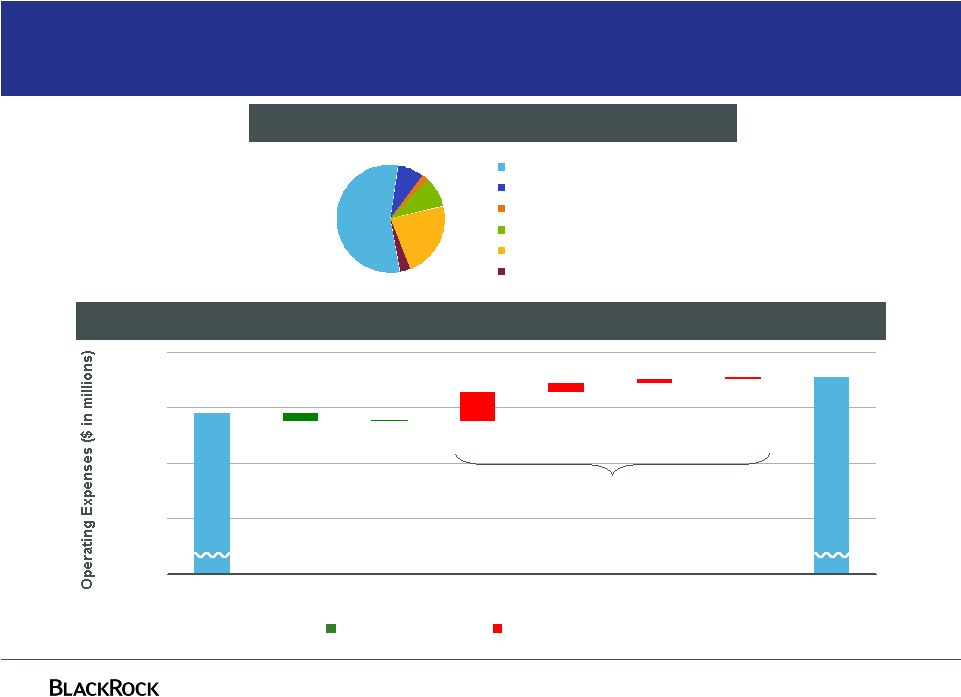 7 $1,291 $1,355 $2 $8 $17 $52 ($14) ($1) Q2-10 G&A Deferred Commissions Comp & Benefits Fund Launch Costs Distribution & Svcing Direct Fund Exp Q3-10 Expense increases linked to higher AUM and revenue AUM / Revenue related Increasing Expenses Decreasing Expenses 55% 2% 9% 23% 3% 8% Employee Comp & Benefits Distribution & Servicing Costs Amort. of Deferred Sales Commissions Direct Fund Expenses General & Administration Amortization of Intangibles $1.36 billion Q3-10 Expense, as Adjusted, by Category Q3-10 Compared to Q2-10 For further information and reconciliation between GAAP and as Adjusted, see note (a) in the current earnings release $0 $1,100 $1,200 $1,300 $1,400 |
 8 Substantial free cash flow To be reinvested in the business and available for dividends $3.00 $3.12 $3.12 $2.68 $1.68 $1.20 $1.00 $0.80 51% 48% 53% 56% 50% 64% 83% 33% 2010 YTD 2009 2008 2007 2006 2005 2004 2003* Dividend Payout Ratio 2010 YTD Share Repurchase = 0.9 million shares * 2003 dividend has been annualized Payout ratio = (dividends + share repurchases) / GAAP net income |
 Appendix |
 10 For further information and reconciliation between GAAP and as Adjusted, see note (a) in the current earnings release as well as previously filed Form 10-Q’s $737 $400 $302 $307 $561 $727 $741 Operating income – GAAP and As Adjusted $271 $261 $357 $389 $654 $697 $707 Q1 2009 Q2 2009 Q3 2009 Q4 2009 Q1 2010 Q2 2010 Q3 2010 Operating Income ($ in millions) Non-GAAP Adjustments ($ in millions) $30 $44 $73 $172 $43 $41 $36 Q1 2009 Q2 2009 Q3 2009 Q4 2009 Q1 2010 Q2 2010 Q3 2010 GAAP As Adjusted Non-GAAP adjustments include BGI transaction / integration costs, PNC LTIP funding obligation, Merrill Lynch compensation contribution, Restructuring, and Compensation related to appreciation (depreciation) on deferred compensation plans |
 11 $463 $469 $379 $110 $239 $293 $537 $218 $317 $256 $423 $432 $551 $84 Q1 2009 Q2 2009 Q3 2009 Q4 2009 Q1 2010 Q2 2010 Q3 2010 Net income – GAAP and As Adjusted $31 $46 $123 ($14) $26 $21 ($24) Q1 2009 Q2 2009 Q3 2009 Q4 2009 Q1 2010 Q2 2010 Q3 2010 Net Income ($ in millions) Non-GAAP Adjustments ($ in millions) Non-GAAP adjustments include BGI transaction / integration costs, PNC LTIP funding obligation, Merrill Lynch compensation contribution, Restructuring, and Tax law changes GAAP As Adjusted For further information and reconciliation between GAAP and as Adjusted, see notes (c) through (d) in the current earnings release as well as previously filed Form 10-Q’s |
 12 Forward looking statements This presentation, and other statements that BlackRock may make, may contain forward-looking statements within the meaning of the Private Securities Litigation Reform Act, with respect to BlackRock’s future financial or business performance, strategies or expectations. Forward-looking statements are typically identified by words or phrases such as “trend,” “potential,” “opportunity,” “pipeline,” “believe,” “comfortable,” “expect,” “anticipate,” “current,” “intention,” “estimate,” “position,” “assume,” “outlook,” “continue,” “remain,” “maintain,” “sustain,” “seek,” “achieve,” and similar expressions, or future or conditional verbs such as “will,” “would,” “should,” “could,” “may” or similar expressions. BlackRock cautions that forward-looking statements are subject to numerous assumptions, risks and uncertainties, which change over time. Forward-looking statements speak only as of the date they are made, and BlackRock assumes no duty to and does not undertake to update forward-looking statements. Actual results could differ materially from those anticipated in forward-looking statements and future results could differ materially from historical performance. |
 13 Forward looking statements In addition to risk factors previously disclosed in BlackRock’s Securities and Exchange Commission reports and those identified elsewhere in this presentation the following factors, among others, could cause actual results to differ materially from forward-looking statements or historical performance: (1) the introduction, withdrawal, success and timing of business initiatives and strategies; (2) changes and volatility in political, economic or industry conditions, the interest rate environment, foreign exchange rates or financial and capital markets, which could result in changes in demand for products or services or in the value of assets under management; (3) the relative and absolute investment performance of BlackRock’s investment products; (4) the impact of increased competition; (5) the impact of capital improvement projects; (6) the impact of future acquisitions or divestitures; (7) the unfavorable resolution of legal proceedings; (8) the extent and timing of any share repurchases; (9) the impact, extent and timing of technological changes and the adequacy of intellectual property protection; (10) the impact of legislative and regulatory actions and reforms, including the recently approved Dodd- Frank Wall Street Reform and Consumer Protection Act, and regulatory, supervisory or enforcement actions of government agencies relating to BlackRock, Barclays, Bank of America, Merrill Lynch or PNC; (11) terrorist activities and international hostilities, which may adversely affect the general economy, domestic and local financial and capital markets, specific industries or BlackRock; (12) the ability to attract and retain highly talented professionals; (13) fluctuations in the carrying value of BlackRock’s economic investments; (14) the impact of changes to tax legislation and, generally, the tax position of the Company; (15) BlackRock’s success in maintaining the distribution of its products; (16) the impact of BlackRock electing to provide support to its products from time to time; (17) the impact of problems at other financial institutions or the failure or negative performance of products at other financial institutions; and (18) the ability of BlackRock to integrate the operations of BGI. |
 |