|
Exhibit 99.2 
|
Q2 2016 Earnings
Earnings Release Supplement:
July 14, 2016
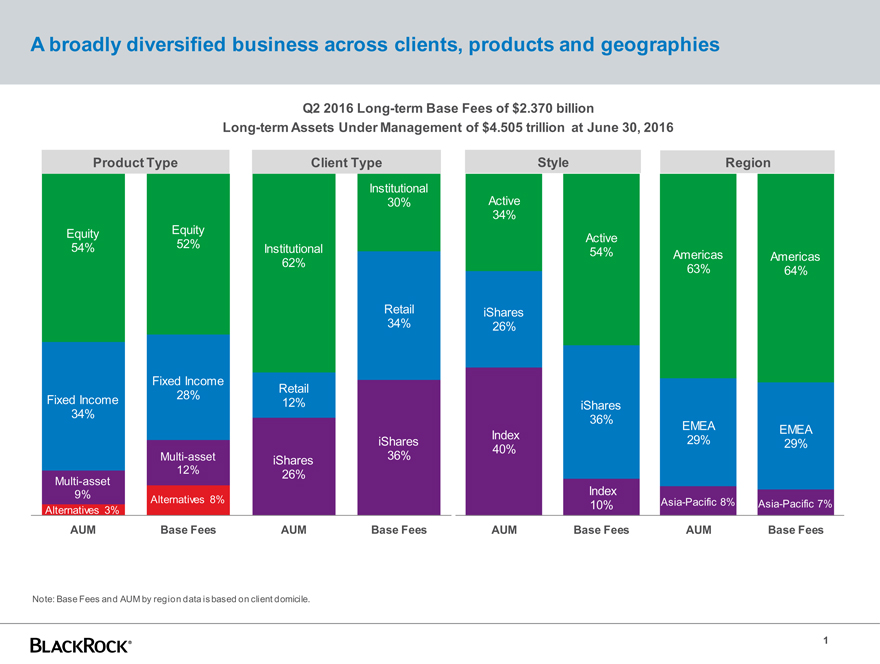
A broadly diversified business across clients, products and geographies
Q2 2016 Long-term Base Fees of $2.370 billion
Long-term Assets Under Management of $4.505 trillion at June 30, 2016
Product Type Client Type StyleRegion
Institutional
30%Active
34%
Equity Equity Active
54% 52% Institutional54%AmericasAmericas
62%63%64%
RetailiShares
34%26%
Fixed Income
Fixed Income 28% Retail 12%iShares
34% 36%
IndexEMEAEMEA
iShares29%29%
Multi-asset 36%40%
iShares
12% 26%
Multi-asset
9% Index
Alternatives 3% Alternatives 8% 10%Asia-Pacific 8%Asia-Pacific 7%
AUM Base Fees AUMBase FeesAUMBase FeesAUMBase Fees
Note: Base Fees and AUM by region data is based on client domicile.
1
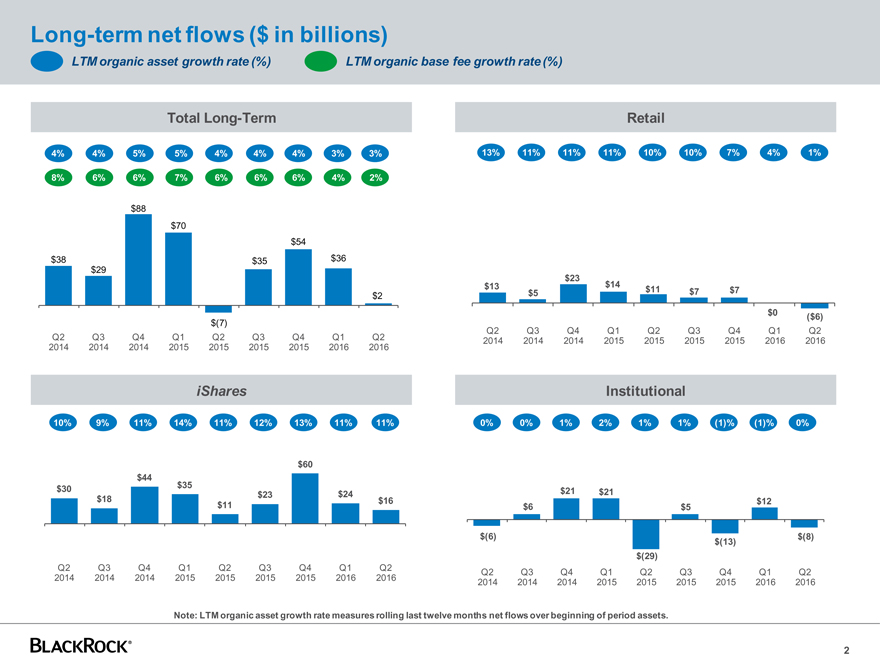
Long-term net flows ($ in billions)
LTM organic asset growth rate (%) LTM organic base fee growth rate (%)
Total Long-TermRetail
4% 4% 5%5%4%4%4%3%3%13%11%11%11%10%10%7%4%1%
8% 6% 6%7%6%6%6%4%2%
$88
$70
$54
$38 $35$36
$29
$23
$13$14$11
$2$5$7$7
$0($6)
$(7)
Q2Q3Q4Q1Q2Q3Q4Q1Q2
Q2 Q3 Q4Q1Q2Q3Q4Q1Q2201420142014201520152015201520162016
2014 2014 2014201520152015201520162016
iSharesInstitutional
10% 9% 11%14%11%12%13%11%11%0%0%1%2%1%1%(1)%(1)%0%
$60
$44
$30 $35$21$21
$23$24
$18 $16$12
$11$6$5
$(6)$(8)
$(13)
$(29)
Q2 Q3 Q4Q1Q2Q3Q4Q1Q2Q2Q3Q4Q1Q2Q3Q4Q1Q2
2014 2014 2014201520152015201520162016201420142014201520152015201520162016
Note: LTM organic asset growth rate measures rolling last twelve months net flows over beginning of period assets.
2
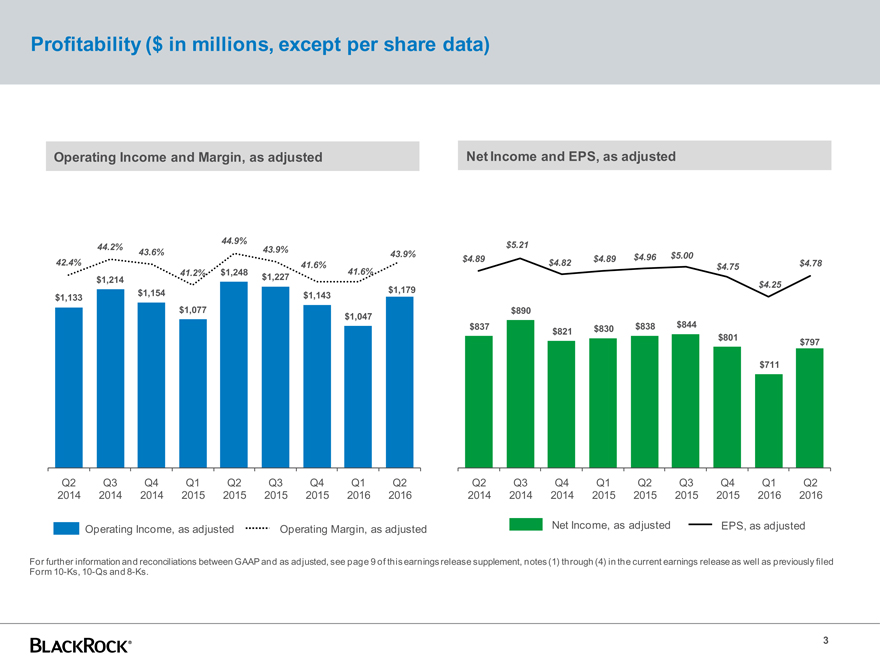
Profitability ($ in millions, except per share data)
Operating Income and Margin, as adjusted Net Income and EPS, as adjusted
$1,200$6.00
44.9%
44.2% 43.6%43.9%$5.21
43.9% $1,100 45.0%$4.89$4.89$4.96$5.00
42.4% 41.6%$4.82$4.75$4.78$5.00
41.2%$1,24841.6%
$1,214 $1,227
$1,154$1,179 $1,000$4.25
$1,133 $1,14340.0%
$1,077$890$4.00
$1,047$900
$837$821$830$838$844
35.0%$801$797
$800$3.00
900
$711
800 30.0% $700
$2.00
700 $600
600 25.0%$1.00
$500
500
400 20.$4000%$0.00
Q2 Q3 Q4Q1Q2Q3Q4Q1Q2Q2Q3Q4Q1Q2Q3Q4Q1Q2
2014 2014 2014201520152015201520162016201420142014201520152015201520162016
Operating Income, as adjusted Operating Margin, as adjustedNet Income, as adjustedEPS, as adjusted
For further information and reconciliations between GAAP and as adjusted, see page 9 of this earnings release supplement, notes (1) through (4) in the current earnings release as well as previously filed
Form 10-Ks, 10-Qs and 8-Ks.
3
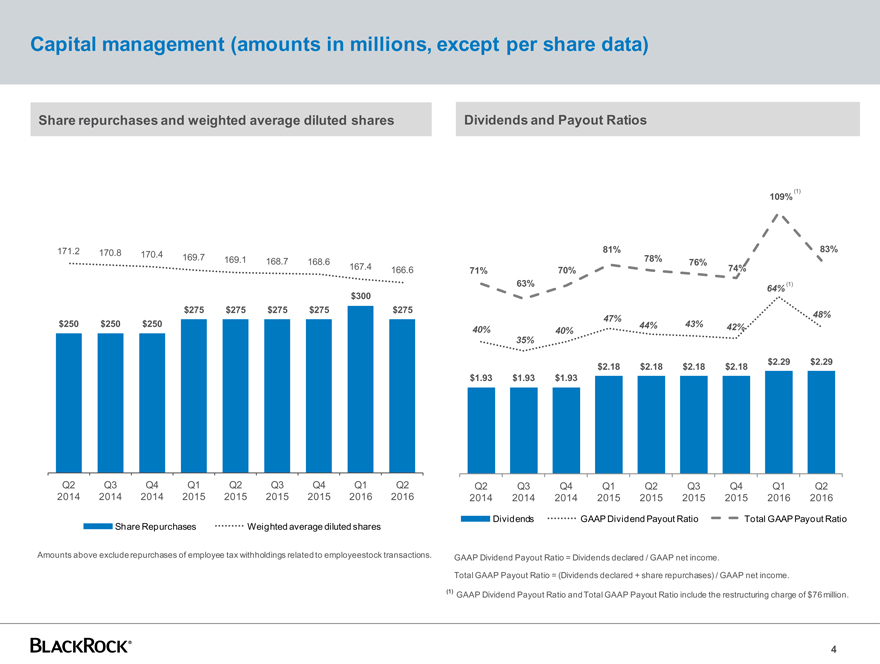
Capital management (amounts in millions, except per share data)
Share repurchases and weighted average diluted shares 8.00 Dividends and Payout Ratios
$7.50150%
$7.00
130%
$6.50
109% (1)
$6.00110%
$5.50
171.2 170.8 170.4$5.0081%83% 90%
169.7169.1168.7168.678%76%
167.4166.6$4.5071%70%74%
63%64% (1)70%
$300$4.00
$275$275$275$275$275
$3.5047%48%
$250 $250 $25040%40%44%43%42%50%
$3.0035%
$2.50$2.29$2.2930%
$2.18$2.18$2.18$2.18
$1.93$1.93$1.93
$2.00
10%
$1.50
$1.00
-10%
$0.50
-30%
Q2 Q3 Q4Q1Q2Q3Q4Q1Q2Q2Q3Q4Q1Q2Q3Q4Q1Q2
2014 2014 2014201520152015201520162016201420142014201520152015201520162016
DividendsGAAP Dividend Payout RatioTotal GAAP Payout Ratio
Share Repurchases Weighted average diluted shares
Amounts above exclude repurchases of employee tax withholdings related to employee stock transactions. GAAP Dividend Payout Ratio = Dividends declared / GAAP net income.
Total GAAP Payout Ratio = (Dividends declared + share repurchases) / GAAP net income.
(1) GAAP Dividend Payout Ratio and Total GAAP Payout Ratio include the restructuring charge of $76 million.
4
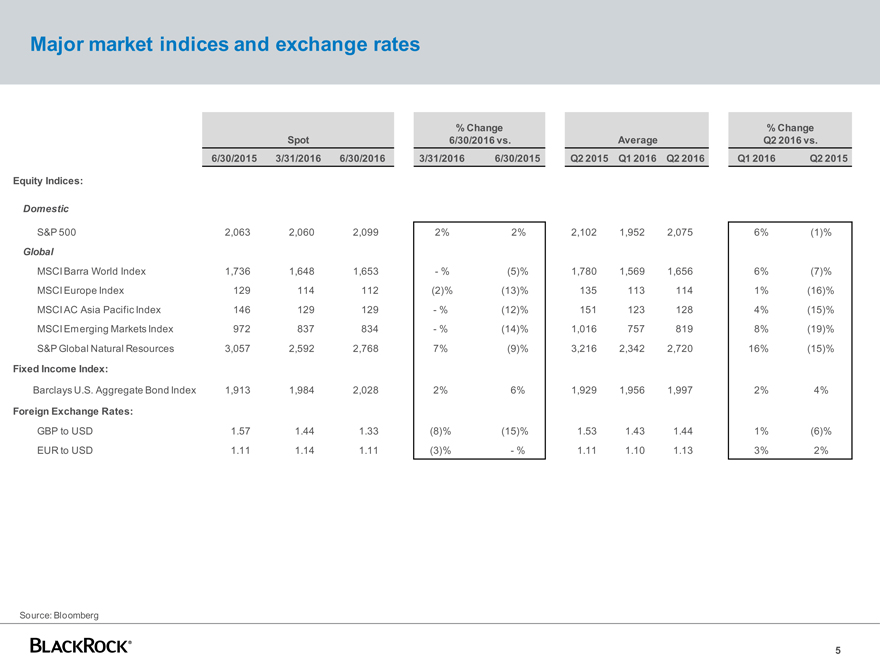
Major market indices and exchange rates
% Change% Change
Spot6/30/2016 vs.AverageQ2 2016 vs.
6/30/2015 3/31/20166/30/20163/31/20166/30/2015Q2 2015 Q1 2016 Q2 2016Q1 2016Q2 2015
Equity Indices:
Domestic
S&P 500 2,063 2,0602,0992%2%2,1021,9522,0756%(1)%
Global
MSCI Barra World Index 1,736 1,6481,653- %(5)%1,7801,5691,6566%(7)%
MSCI Europe Index 129 114112(2)%(13)%1351131141%(16)%
MSCI AC Asia Pacific Index 146 129129- %(12)%1511231284%(15)%
MSCI Emerging Markets Index 972 837834- %(14)%1,0167578198%(19)%
S&P Global Natural Resources 3,057 2,5922,7687%(9)%3,2162,3422,72016%(15)%
Fixed Income Index:
Barclays U.S. Aggregate Bond Index 1,913 1,9842,0282%6%1,9291,9561,9972%4%
Foreign Exchange Rates:
GBP to USD 1.57 1.441.33(8)%(15)%1.531.431.441%(6)%
EUR to USD 1.11 1.141.11(3)%- %1.111.101.133%2%
Source: Bloomberg
5
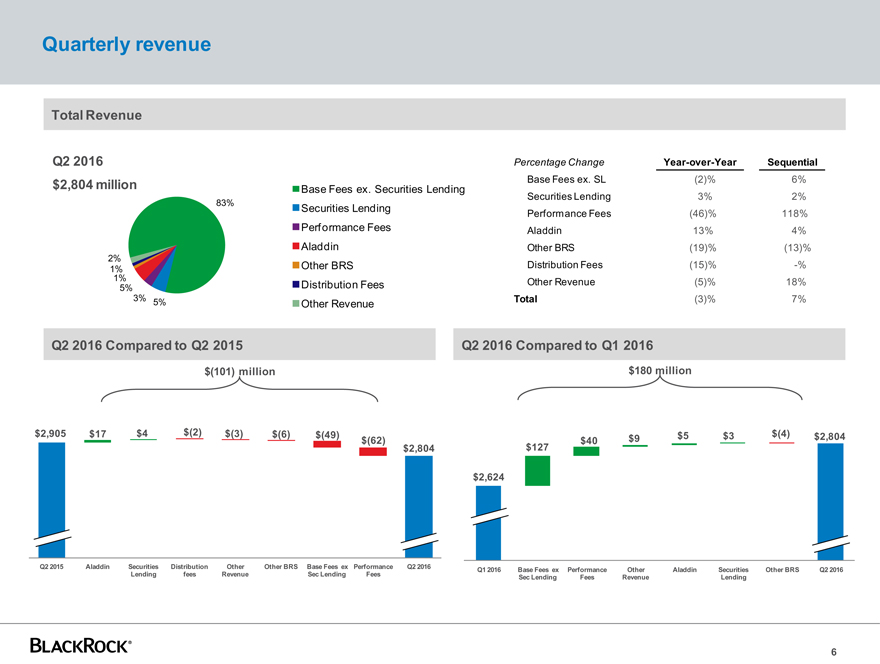
Quarterly revenue
Total Revenue
Q2 2016 Percentage ChangeYear-over-YearSequential
$2,804 million Base Fees ex. Securities LendingBase Fees ex. SL(2)%6%
Securities Lending3%2%
83%Securities Lending
Performance Fees(46)%118%
Performance FeesAladdin13%4%
AladdinOther BRS(19)%(13)%
2%
1% Other BRSDistribution Fees(15)%-%
1% 5% Distribution FeesOther Revenue(5)%18%
3% 5% Other RevenueTotal(3)%7%
Q2 2016 Compared to Q2 2015 Q2 2016Compared to Q1 2016
$(101) million$180 million
$2,905 $17 $4$(2)$(3)$(6)$(49)$(62)$40$9$5$3$(4)$2,804
$2,804$127
$2,624
Q2 2015 Aladdin SecuritiesDistributionOtherOther BRSBase Fees ex PerformanceQ2 2016Q1 2016Base Fees exPerformanceOtherAladdinSecuritiesOther BRSQ2 2016
LendingfeesRevenueSec Lending FeesSec LendingFeesRevenueLending
6
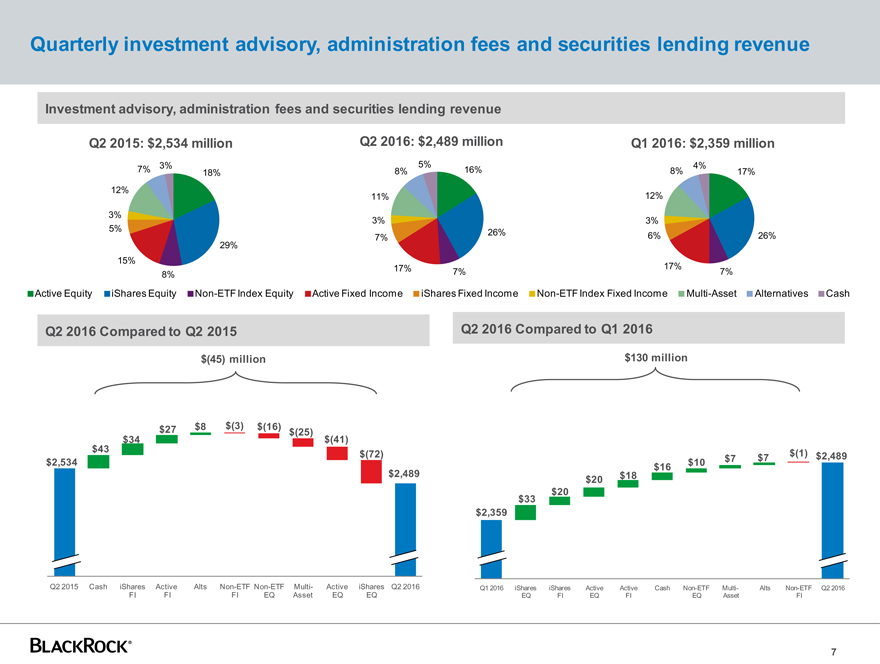
Quarterly investment advisory, administration fees and securities lending revenue
Investment advisory, administration fees and securities lending revenue
Q2 2015: $2,534 million Q2 2016: $2,489 million Q1 2016: $2,359 million
3% 5%4%
7% 18%8%16%8%17%
12%
11%12%
3% 3%3%
5% 26%
7%6%26%
29%
15%
17%7%17%7%
8%
Active Equity iShares Equity Non-ETF Index EquityActive Fixed IncomeiShares Fixed IncomeNon-ETF Index Fixed IncomeMulti-AssetAlternativesCash
Q2 2016 Compared to Q2 2015 Q2 2016Compared to Q1 2016
$(45) million$130 million
$27 $8$(3) $(16)$(25)
$34 $(41)
$43 $(72)$7$7$(1)$2,489
$2,534 $10
$16
$2,489$20$18
$20
$33
$2,359
Q2 2015 Cash iShares Active AltsNon-ETF Non-ETFMulti-ActiveiSharesQ2 2016Q1 2016iSharesiSharesActiveActiveCashNon-ETFMulti-AltsNon-ETFQ2 2016
FI FI FIEQAssetEQEQEQFIEQFIEQAssetFI
7
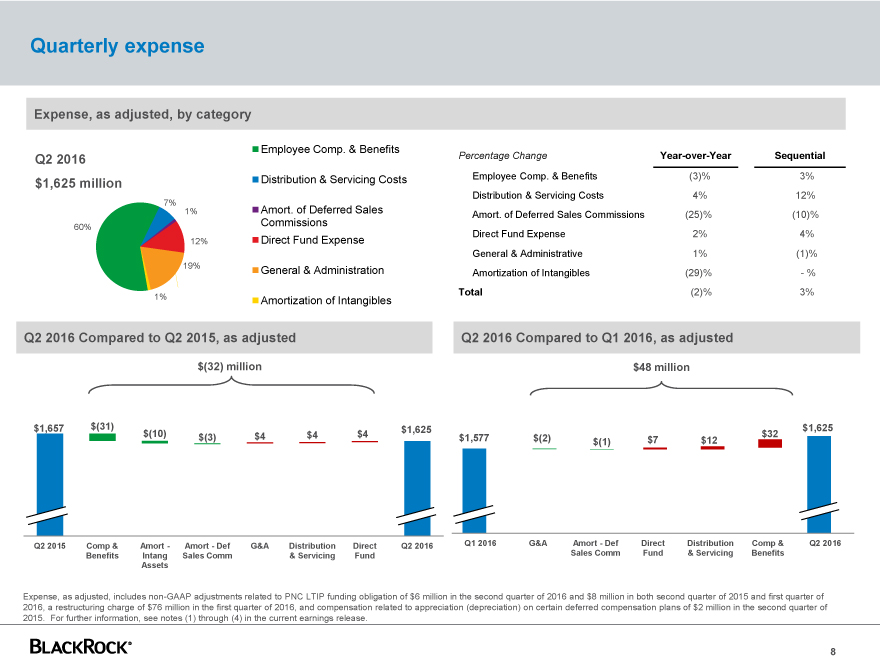
Quarterly expense
Expense, as adjusted, by category
Employee Comp. & Benefits
Q2 2016 Percentage ChangeYear-over-YearSequential
$1,625 million Distribution & Servicing Costs Employee Comp. & Benefits(3)%3%
Distribution & Servicing Costs4%12%
7%
1% Amort. of Deferred Sales Amort. of Deferred Sales Commissions(25)%(10)%
60% Commissions
12% Direct Fund Expense Direct Fund Expense2%4%
General & Administrative1%(1)%
19% General & Administration Amortization of Intangibles(29)%- %
Total(2)%3%
1% Amortization of Intangibles
Q2 2016 Compared to Q2 2015, as adjusted Q2 2016Compared to Q1 2016, as adjusted
$(32) million$48 million
$1,657 $(31) $1,625$1,625
$(10)$(3)$4$4$4$1,577$(2)$(1)$7$12$32
Q2 2015 Comp & Amort -Amort—DefG&ADistributionDirectQ2 2016Q1 2016G&AAmort—DefDirectDistributionComp &Q2 2016
Benefits IntangSales Comm& ServicingFundSales CommFund& ServicingBenefits
Assets
Expense, as adjusted, includes non-GAAP adjustments related to PNC LTIP funding obligation of $6 million in the second quarter of 2016 and $8 million in both second quarter of 2015 and first quarter of 2016, a restructuring charge of $76 million in the first quarter of 2016, and compensation related to appreciation (depreciation) on certain deferred compensation plans of $2 million in the second quarter of 2015. For further information, see notes (1) through (4) in the current earnings release.
8
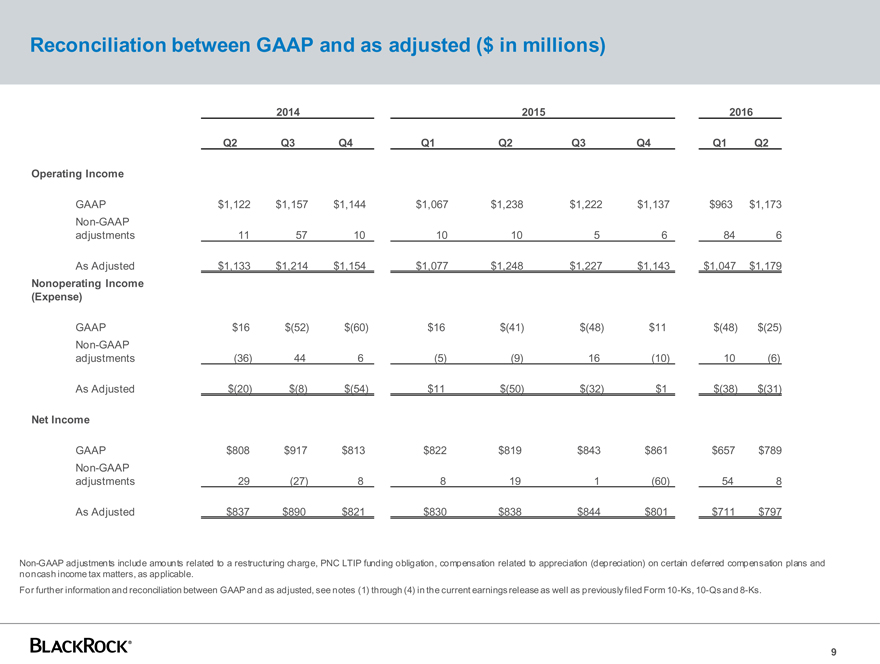
Reconciliation between GAAP and as adjusted ($ in millions)
201420152016
Q2 Q3Q4Q1Q2Q3Q4Q1Q2
Operating Income
GAAP $1,122 $1,157$1,144$1,067$1,238$1,222$1,137$963$1,173
Non-GAAP
adjustments 11 5710101056846
As Adjusted $1,133 $1,214$1,154$1,077$1,248$1,227$1,143$1,047$1,179
Nonoperating Income
(Expense)
GAAP $16 $(52)$(60)$16$(41)$(48)$11$(48)$(25)
Non-GAAP
adjustments (36) 446(5)(9)16(10)10(6)
As Adjusted $(20) $(8)$(54)$11$(50)$(32)$1$(38)$(31)
Net Income
GAAP $808 $917$813$822$819$843$861$657$789
Non-GAAP
adjustments 29 (27)88191(60)548
As Adjusted $837 $890$821$830$838$844$801$711$797
Non-GAAP adjustments include amounts related to a restructuring charge, PNC LTIP funding obligation, compensation related to appreciation (depreciation) on certain deferred compensation plans and noncash income tax matters, as applicable.
For further information and reconciliation between GAAP and as adjusted, see notes (1) through (4) in the current earnings release as well as previously filed Form 10-Ks, 10-Qs and 8-Ks.
9
Important Notes
This presentation, and other statements that BlackRock, Inc. (“BlackRock”) may make, may contain forward-looking statements within the meaning of the Private Securities Litigation Reform Act, with respect to BlackRock’s future financial or business performance, strategies or expectations. Forward-looking statements are typically identified by words or phrases such as “trend,” “potential,” “opportunity,” “pipeline,” “believe,” “comfortable,” “expect,” “anticipate,” “current,” “intention,” “estimate,” “position,” “assume,” “outlook,” “continue,” “remain,” “maintain,” “sustain,” “seek,” “achieve,” and similar expressions, or future or conditional verbs such as “will,” “would,” “should,” “could,” “may” and similar expressions.
BlackRock cautions that forward-looking statements are subject to numerous assumptions, risks and uncertainties, which change over time. Forward-looking statements speak only as of the date they are made, and BlackRock assumes no duty to and does not undertake to update forward-looking statements. Actual results could differ materially from those anticipated in forward-looking statements and future results could differ materially from historical performance.
In addition to risk factors previously disclosed in BlackRock’s Securities and Exchange Commission reports and those identified elsewhere in this presentation, the following factors, among others, could cause actual results to differ materially from forward-looking statements or historical performance: (1) the introduction, withdrawal, success and timing of business initiatives and strategies; (2) changes and volatility in political, economic or industry conditions, the interest rate environment, foreign exchange rates or financial and capital markets, which could result in changes in demand for products or services or in the value of assets under management; (3) the relative and absolute investment performance of BlackRock’s investment products; (4) the impact of increased competition; (5) the impact of future acquisitions or divestitures; (6) the unfavorable resolution of legal proceedings; (7) the extent and timing of any share repurchases; (8) the impact, extent and timing of technological changes and the adequacy of intellectual property, information and cyber security protection; (9) the impact of legislative and regulatory actions and reforms, including the Dodd-Frank Wall Street Reform and Consumer Protection Act, and regulatory, supervisory or enforcement actions of government agencies relating to BlackRock or The PNC Financial Services Group, Inc.; (10) terrorist activities, international hostilities and natural disasters, which may adversely affect the general economy, domestic and local financial and capital markets, specific industries or BlackRock; (11) the ability to attract and retain highly talented professionals; (12) fluctuations in the carrying value of BlackRock’s economic investments; (13) the impact of changes to tax legislation, including income, payroll and transaction taxes, and taxation on products or transactions, which could affect the value proposition to clients and, generally, the tax position of BlackRock; (14) BlackRock’s success in maintaining the distribution of its products; (15) the impact of BlackRock electing to provide support to its products from time to time and any potential liabilities related to securities lending or other indemnification obligations; and (16) the impact of problems at other financial institutions or the failure or negative performance of products at other financial institutions.
This presentation also includes non-GAAP financial measures. You can find our presentations on the most directly comparable GAAP financial measures calculated in accordance with GAAP and our reconciliations on page 9 of this earnings release supplement, our current earnings release dated July 14, 2016, and BlackRock’s other periodic reports, which are available on BlackRock’s website at www.blackrock.com.
10