|
Exhibit 99.1 
|
BlackRock
Fixed Income Investor Presentation
March 2017
Forward-looking Statements
This presentation, and other statements that BlackRock may make, may contain forward-looking statements within the meaning of the Private Securities Litigation Reform Act, with respect to BlackRock's future financial or business performance, strategies or expectations. Forward-looking statements are typically identified by words or phrases such as “trend,” “potential,” “opportunity,” “pipeline,” “believe,” “comfortable,” “expect,” “anticipate,” “current,” “intention,” “estimate,” “position,” “assume,” “outlook,” “continue,” “remain,” “maintain,” “sustain,” “seek,” “achieve,” and similar expressions, or future or conditional verbs such as “will,” “would,” “should,” “could,” “may” and similar expressions.
BlackRock cautions that forward-looking statements are subject to numerous assumptions, risks and uncertainties, which change over time. Forward-looking statements speak only as of the date they are made, and BlackRock assumes no duty to and does not undertake to update forward-looking statements. Actual results could differ materially from those anticipated in forward-looking statements and future results could differ materially from historical performance.
In addition to risk factors previously disclosed in BlackRock's Securities and Exchange Commission (“SEC”) reports and those identified elsewhere in this presentation, the following factors, among others, could cause actual results to differ materially from forward-looking statements or historical performance: (1) the introduction, withdrawal, success and timing of business initiatives and strategies; (2) changes and volatility in political, economic or industry conditions, the interest rate environment, foreign exchange rates or financial and capital markets, which could result in changes in demand for products or services or in the value of assets under management; (3) the relative and absolute investment performance of BlackRock's investment products; (4) the impact of increased competition; (5) the impact of future acquisitions or divestitures; (6) the unfavorable resolution of legal proceedings; (7) the extent and timing of any share repurchases; (8) the impact, extent and timing of technological changes and the adequacy of intellectual property, information and cyber security protection; (9) the potential for human error in connection with BlackRock's operational systems; (10) the impact of legislative and regulatory actions and reforms, including the Dodd-Frank Wall Street Reform and Consumer Protection Act, and regulatory, supervisory or enforcement actions of government agencies relating to BlackRock or The PNC Financial Services Group, Inc.; (11) changes in law and policy accompanying the new administration and uncertainty pending any such changes; (12) terrorist activities, international hostilities and natural disasters, which may adversely affect the general economy, domestic and local financial and capital markets, specific industries or BlackRock; (13) the ability to attract and retain highly talented professionals; (14) fluctuations in the carrying value of BlackRock's economic investments; (15) the impact of changes to tax legislation, including income, payroll and transaction taxes, and taxation on products or transactions, which could affect the value proposition to clients and, generally, the tax position of the Company; (16) BlackRock's success in negotiating distribution arrangements and maintaining distribution channels for its products; (17) the failure by a key vendor of BlackRock to fulfill its obligations to the Company; (18) any disruption to the operations of third parties whose
functions are integral to BlackRock's ETF platform; (19) the impact of BlackRock electing to provide support to its products from time to time and any potential liabilities related to securities lending or other indemnification obligations; and (20) the impact of problems at other financial institutions or the failure or negative performance of products at other financial institutions. BlackRock’s Annual Report on Form 10-K and BlackRock’s subsequent filings with the SEC, accessible on the SEC’s website at www.sec.gov and on BlackRock’s website at www.blackrock.com, discuss these factors in more detail and identify additional factors that can affect forward-looking statements.
This presentation also includes non-GAAP financial measures. These non-GAAP financial measures should not be considered in isolation from, or as a substitute for, financial information prepared in accordance with GAAP. You can find our presentations on the most directly comparable GAAP financial measures calculated in accordance with GAAP and our reconciliations in the appendix to this presentation and BlackRock’s other periodic reports which are available on BlackRock’s website at www.blackrock.com.
BlackRock reports its financial results in accordance with GAAP; however, management believes evaluating the BlackRock's ongoing operating results may be enhanced if investors have additional non-GAAP financial measures. Management reviews non-GAAP financial measures to assess ongoing operations and, for the reasons described in BlackRock's Annual Report on Form 10-K, considers them to be effective indicators, for both management and investors, of BlackRock’s financial performance over time. Management also uses non-GAAP financial measures as a benchmark to compare its performance with other companies and to enhance the comparability of this information for the reporting periods presented. Non-GAAP measures may pose limitations because they do not include all of BlackRock’s revenue and expense. BlackRock’s management does not advocate that investors consider such non-GAAP financial measures in isolation from, or as a substitute for, financial information prepared in accordance with GAAP.
BLACKROCK
BlackRock Overview
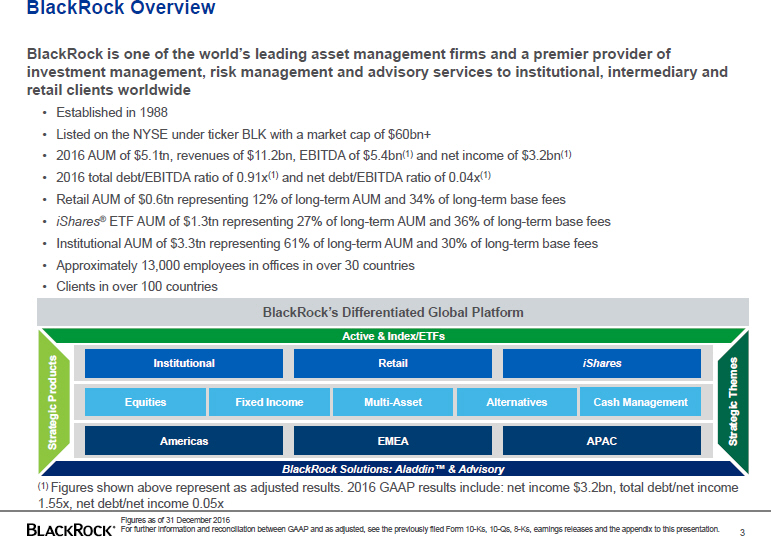
BlackRock is one of the world’s leading asset management firms and a premier provider of investment management, risk management and advisory services to institutional, intermediary and retail clients worldwide
Established in 1988
Listed on the NYSE under ticker BLK with a market cap of $60bn+
2016 AUM of $5.1tn, revenues of $11.2bn, EBITDA of $5.4bn(1) and net income of $3.2bn(1)
2016 total debt/EBITDA ratio of 0.91x(1) and net debt/EBITDA ratio of 0.04x(1)
Retail AUM of $0.6tn representing 12% of long-term AUM and 34% of long-term base fees • iShares® ETF AUM of $1.3tn representing 27% of long-term AUM and 36% of long-term base fees
Institutional AUM of $3.3tn representing 61% of long-term AUM and 30% of long-term base fees
Approximately 13,000 employees in offices in over 30 countries
Clients in over 100 countries
BlackRock’s Differentiated Global Platform
Active & Index/ETFs
Institutional Retail iShares Themes Products Equities Fixed Income Multi-Asset Alternatives Cash Management Strategic Americas EMEA APAC Strategic
BlackRock Solutions: Aladdin™ & Advisory
(1) Figures shown above represent as adjusted results. 2016 GAAP results include: net income $3.2bn, total debt/net income 1.55x, net debt/net income 0.05x
Figures as of 31 December 2016
For further information and reconciliation between GAAP and as adjusted, see the previously filed Form 10-Ks, 10-Qs, 8-Ks, earnings releases and the appendix to this presentation. 3
BLACKROCK
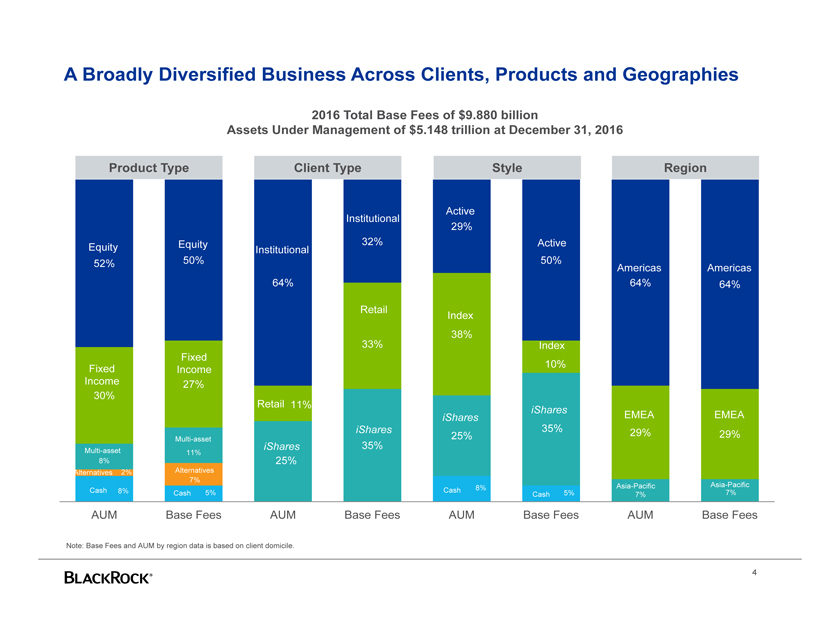
A Broadly Diversified Business Across Clients, Products and Geographies
2016 Total Base Fees of $9.880 billion
Assets Under Management of $5.148 trillion at December 31, 2016
Product Type Client Type Style Region
Active Institutional 29%
Equity 32% Active Equity Institutional 52% 50% 50%
Americas Americas 64% 64% 64%
Retail
Index 33% 38%
Index Fixed Fixed 10% Income Income 27% 30% Retail 11% iShares iShares EMEA EMEA iShares 35% 29% 25% 29%
Multi-asset
iShares 35%
Multi-asset 11%
8% 25%
Alternatives 2% Alternatives 7%
8% Asia-Pacific Asia-Pacific Cash 8% Cash 5% Cash 5% 7% Cash 7%
AUM Base Fees AUM Base Fees AUM Base Fees AUM Base Fees
Note: Base Fees and AUM by region data is based on client domicile.
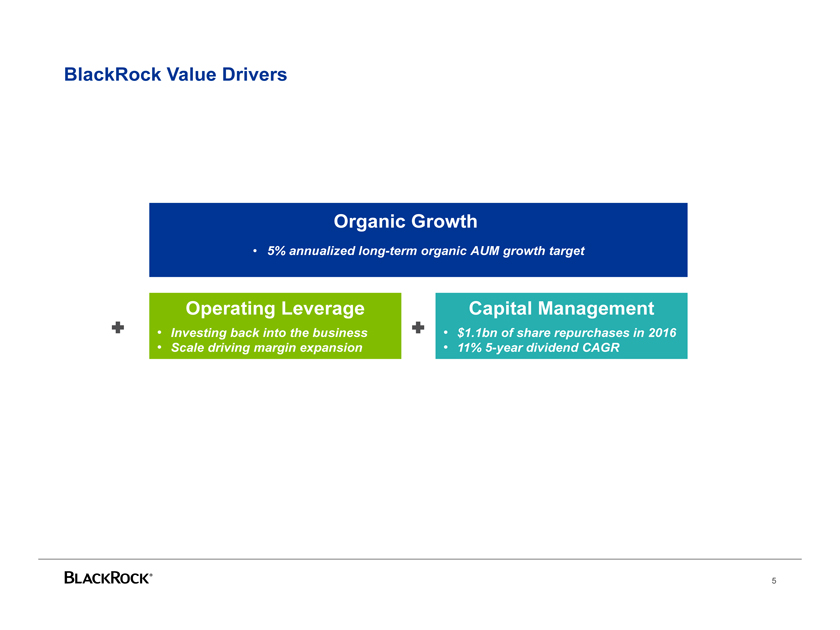
BlackRock Value Drivers
Organic Growth
• | | 5% annualized long-term organic AUM growth target |
Operating Leverage
• | | Investing back into the business |
• | | Scale driving margin expansion |
Capital Management
• | | $1.1bn of share repurchases in 2016 |
• | | 11% 5-year dividend CAGR |
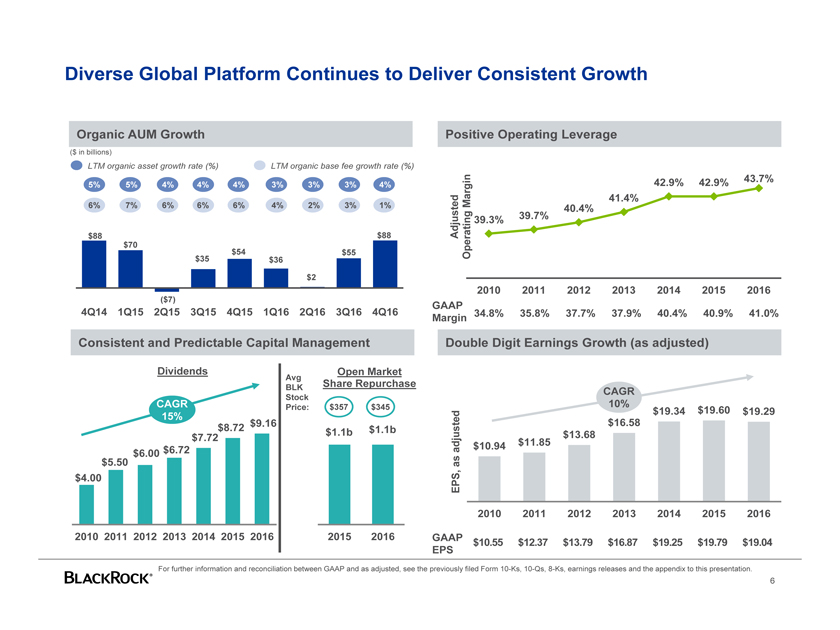
Diverse Global Platform Continues to Deliver Consistent Growth
Organic AUM Growth Positive Operating Leverage
($ in billions)
LTM organic asset growth rate (%) LTM organic base fee growth rate (%)
42.9% 42.9% 43.7%
5% 5% 4% 4% 4% 3% 3% 3% 4%
Margin 41.4%
6% 7% 6% 6% 6% 4% 2% 3% 1% 40.4%
39.3% 39.7%
$88 $88 Adjusted
$70 $54 $55 Operating
$35 $36 $2
2010 2011 2012 2013 2014 2015 2016
($7)
GAAP
4Q14 1Q15 2Q15 3Q15 4Q15 1Q16 2Q16 3Q16 4Q16 34.8% 35.8% 37.7% 37.9% 40.4% 40.9% 41.0% Margin
Consistent and Predictable Capital Management Double Digit Earnings Growth (as adjusted)
Dividends Open Market
Avg
BLK Share Repurchase
CAGR
Stock
CAGR Price: $357 $345 10%
$19.34 $19.60 $19.29 15% $9.16 $16.58 $8.72 $1.1b $1.1b $7.72 $13.68 adjusted $10.94 $11.85 $6.72 $6.00 $5.50 as $4.00 EPS, 2010 2011 2012 2013 2014 2015 2016
2010 2011 2012 2013 2014 2015 2016 2015 2016 GAAP $10.55 $12.37 $13.79 $16.87 $19.25 $19.79 $19.04 EPS
For further information and reconciliation between GAAP and as adjusted, see the previously filed Form 10-Ks, 10-Qs, 8-Ks, earnings releases and the appendix to this presentation.
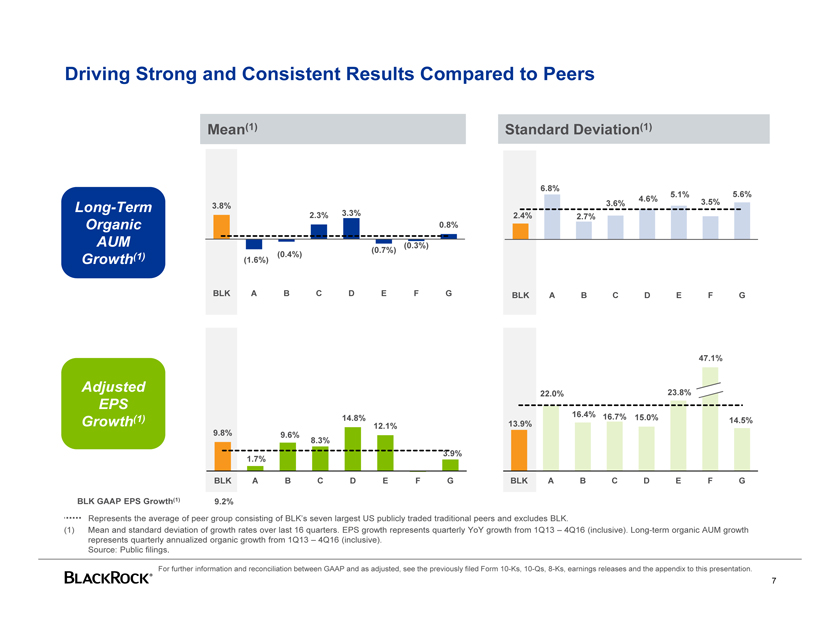
Driving Strong and Consistent Results Compared to Peers
Mean(1) Standard Deviation(1)
6.8%
5.1% 5.6% 4.6% 3.5%
Long-Term 3.8% 3.6%
2.3% 3.3% 2.4% 2.7%
Organic 0.8%
AUM (0.3%)
(0.7%) (1) (0.4%)
Growth (1.6%)
BLK ABCD E F G BLK A B C D E F G
47.1%
Adjusted 23.8%
EPS 22.0%
(1) 14.8% 16.4% 16.7% 15.0%
Growth 13.9% 14.5%
12.1% 9.8% 9.6% 8.3%
3.9% 1.7%
BLK ABCD E F G BLK A B C D E F G
BLK GAAP EPS Growth(1) 9.2%
Represents the average of peer group consisting of BLK’s seven largest US publicly traded traditional peers and excludes BLK.
(1) Mean and standard deviation of growth rates over last 16 quarters. EPS growth represents quarterly YoY growth from 1Q13 – 4Q16 (inclusive). Long-term organic AUM growth represents quarterly annualized organic growth from 1Q13 – 4Q16 (inclusive).
Source: Public filings.
For further information and reconciliation between GAAP and as adjusted, see the previously filed Form 10-Ks, 10-Qs, 8-Ks, earnings releases and the appendix to this presentation.
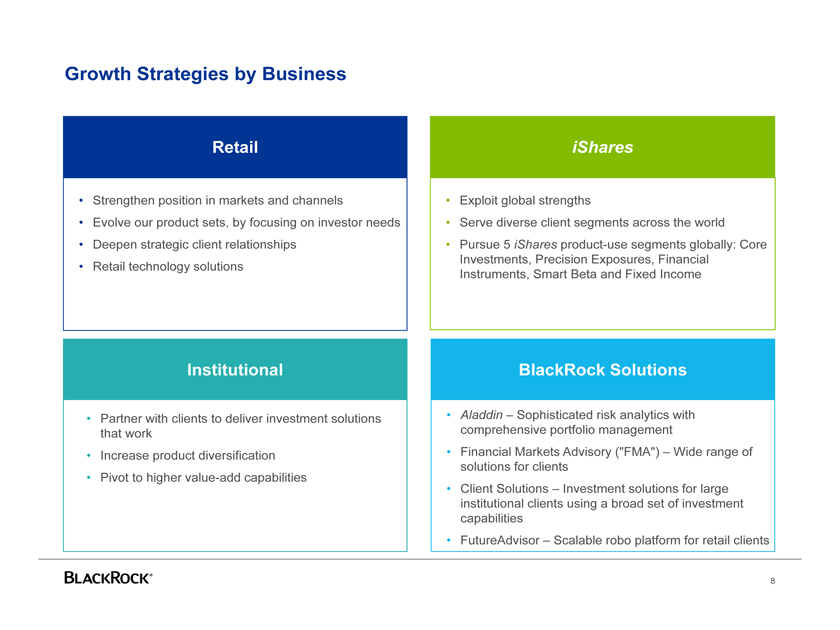
Growth Strategies by Business
Retail
Strengthen position in markets and channels
Evolve our product sets, by focusing on investor needs
Deepen strategic client relationships
Retail technology solutions
iShares
Exploit global strengths
Serve diverse client segments across the world
Pursue 5 iShares product-use segments globally: Core Investments, Precision Exposures, Financial Instruments, Smart Beta and Fixed Income
Institutional
Partner with clients to deliver investment solutions that work
Increase product diversification
Pivot to higher value-add capabilities
BlackRock Solutions
Aladdin – Sophisticated risk analytics with comprehensive portfolio management
Financial Markets Advisory (“FMA”) – Wide range of solutions for clients
Client Solutions – Investment solutions for large institutional clients using a broad set of investment capabilities
FutureAdvisor – Scalable robo platform for retail clients
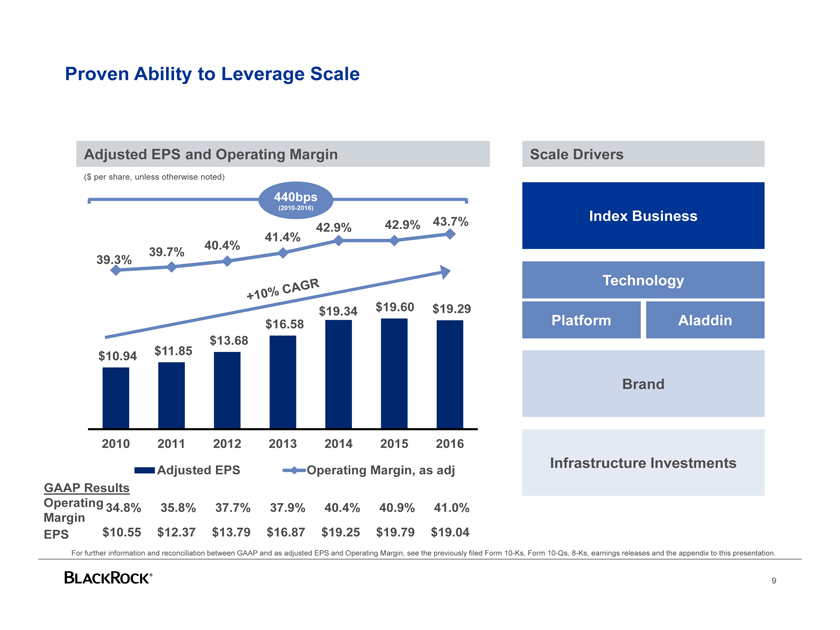
Proven Ability to Leverage Scale
Adjusted EPS and Operating Margin
($ per share, unless otherwise noted)
440bps
(2010-2016)
42.9% 43.7% 42.9% 41.4% 40.4% 39.7% 39.3%
$19.34 $19.60 $19.29 $16.58 $13.68 $10.94 $11.85
2010 2011 2012 2013 2014 2015 2016
Adjusted EPS Operating Margin, as adj GAAP Results Operating 34.8% 35.8% 37.7% 37.9% 40.4% 40.9% 41.0% Margin EPS $10.55 $12.37 $13.79 $16.87 $19.25 $19.79 $19.04
Scale Drivers
Index Business
Technology
Platform Aladdin
Brand
Infrastructure Investments
For further information and reconciliation between GAAP and as adjusted EPS and Operating Margin, see the previously filed Form 10-Ks, Form 10-Qs, 8-Ks, earnings releases and the appendix to this presentation.
Asset-Lite Balance Sheet
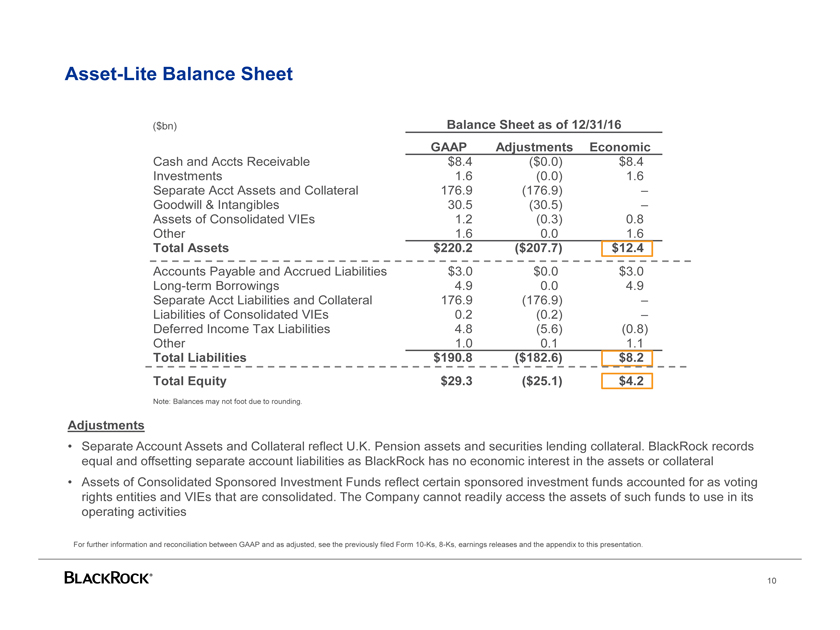
($bn) Balance Sheet as of 12/31/16 GAAP Adjustments Economic
Cash and Accts Receivable $8.4 ($0.0) $8.4 Investments 1.6 (0.0) 1.6 Separate Acct Assets and Collateral 176.9 (176.9) –Goodwill & Intangibles 30.5 (30.5) –Assets of Consolidated VIEs 1.2 (0.3) 0.8 Other 1.6 0.0 1.6
Total Assets $220.2 ($207.7) $12.4
Accounts Payable and Accrued Liabilities $3.0 $0.0 $3.0 Long-term Borrowings 4.9 0.0 4.9 Separate Acct Liabilities and Collateral 176.9 (176.9) –Liabilities of Consolidated VIEs 0.2 (0.2) –Deferred Income Tax Liabilities 4.8 (5.6) (0.8) Other 1.0 0.1 1.1
Total Liabilities $190.8 ($182.6) $8.2 Total Equity $29.3 ($25.1) $4.2
Note: Balances may not foot due to rounding.
Adjustments
Separate Account Assets and Collateral reflect U.K. Pension assets and securities lending collateral. BlackRock records equal and offsetting separate account liabilities as BlackRock has no economic interest in the assets or collateral
Assets of Consolidated Sponsored Investment Funds reflect certain sponsored investment funds accounted for as voting rights entities and VIEs that are consolidated. The Company cannot readily access the assets of such funds to use in its operating activities
For further information and reconciliation between GAAP and as adjusted, see the previously filed Form 10-Ks, 8-Ks, earnings releases and the appendix to this presentation.
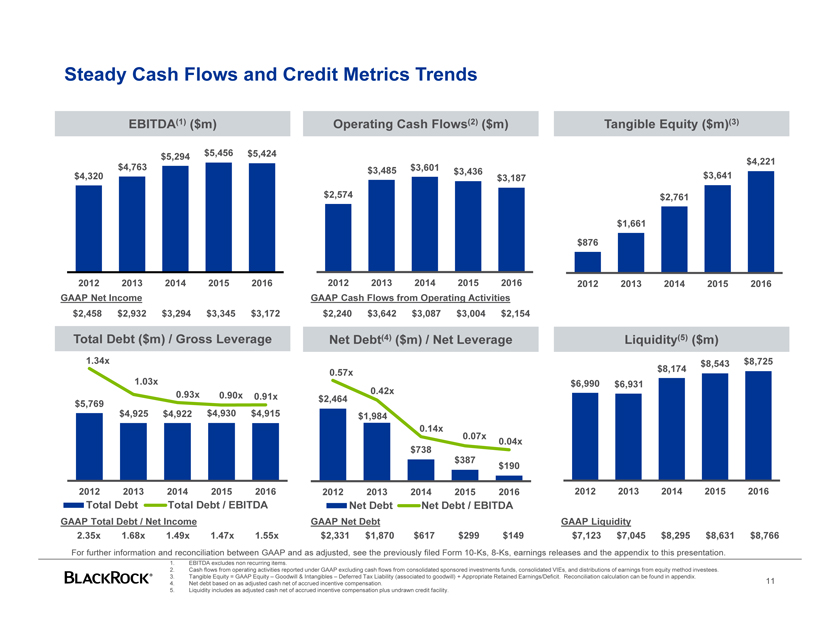
Steady Cash Flows and Credit Metrics Trends
EBITDA(1) ($m)
$5,294 $5,456 $5,424 $4,763 $4,320
2012 2013 2014 2015 2016 GAAP Net Income $2,458 $2,932 $3,294 $3,345 $3,172
Operating Cash Flows(2) ($m)
$3,485 $3,601 $3,436 $3,187 $2,574
2012 2013 2014 2015 2016 GAAP Cash Flows from Operating Activities $2,240 $3,642 $3,087 $3,004 $2,154
Tangible Equity ($m)(3)
$4,221 $3,641
$2,761
$1,661
$876
2012 2013 2014 2015 2016
Total Debt ($m) / Gross Leverage Net Debt(4) ($m) / Net Leverage Liquidity(5) ($m)
1.34x $8,174 $8,543 $8,725 0.57x 1.03x $6,990 $6,931 0.93x 0.42x $5,769 0.90x 0.91x $2,464 $4,925 $4,922 $4,930 $4,915 $1,984 0.14x 0.07x $738 0.04x $387 $190
2012 2013 2014 2015 2016 2012 2013 2014 2015 2016 2012 2013 2014 2015 2016
Total Debt Total Debt / EBITDA Net Debt Net Debt / EBITDA
GAAP Total Debt / Net Income GAAP Net Debt GAAP Liquidity
2.35x 1.68x 1.49x 1.47x 1.55x $2,331 $1,870 $617 $299 $149 $7,123 $7,045 $8,295 $8,631 $8,766
For further information and reconciliation between GAAP and as adjusted, see the previously filed Form 10-Ks, 8-Ks, earnings releases and the appendix to this presentation.
1. EBITDA excludes non recurring items.
2. Cash flows from operating activities reported under GAAP excluding cash flows from consolidated sponsored investments funds, consolidated VIEs, and distributions of earnings from equity method investees.
3. Tangible Equity = GAAP Equity – Goodwill & Intangibles – Deferred Tax Liability (associated to goodwill) + Appropriate Retained Earnings/Deficit. Reconciliation calculation can be found in appendix.
4. Net debt based on as adjusted cash net of accrued incentive compensation.
5. Liquidity includes as adjusted cash net of accrued incentive compensation plus undrawn credit facility.
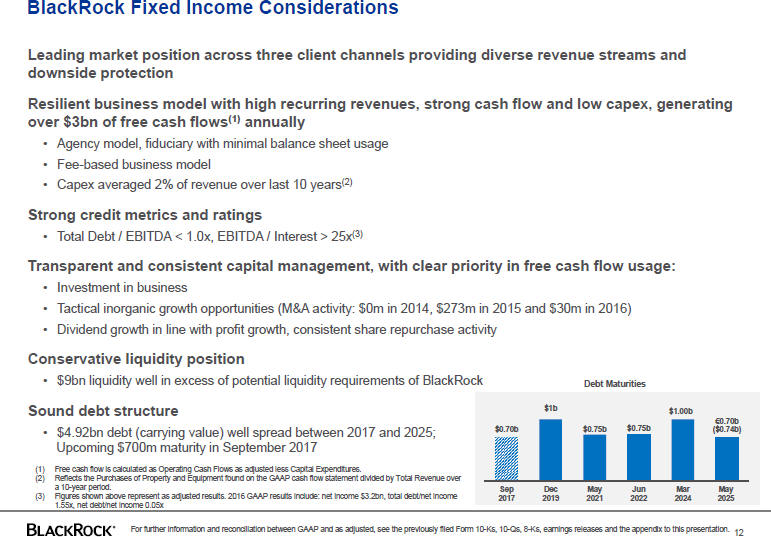
BlackRock Fixed Income Considerations
Leading market position across three client channels providing diverse revenue streams and downside protection
Resilient business model with high recurring revenues, strong cash flow and low capex, generating over $3bn of free cash flows(1) annually
• Agency model, fiduciary with minimal balance sheet usage
• Fee-based business model
• Capex averaged 2% of revenue over last 10 years(2)
Strong credit metrics and ratings
• Total Debt / EBITDA < 1.0x, EBITDA / Interest > 25x(3)
Transparent and consistent capital management, with clear priority in free cash flow usage:
• Investment in business
• Tactical inorganic growth opportunities (M&A activity: $0m in 2014, $273m in 2015 and $30m in 2016)
• Dividend growth in line with profit growth, consistent share repurchase activity
Conservative liquidity position
• $9bn liquidity well in excess of potential liquidity requirements of BlackRock Debt Maturities
Sound debt structure
• $4.92bn debt (carrying value) well spread between 2017 and 2025; Upcoming $700m maturity in September 2017
(1) Free cash flow is calculated as Operating Cash Flows as adjusted less Capital Expenditures.
(2) Reflects the Purchases of Property and Equipment found on the GAAP cash flow statement divided by Total Revenue over a 10-year period.
(3) Figures shown above represent as adjusted results. 2016 GAAP results include: net income $3.2bn, total debt/net income
1.55x, net debt/net income 0.05x
For further information and reconciliation between GAAP and as adjusted, see the previously filed Form 10-Ks, 10-Qs, 8-Ks, earnings releases and the appendix to this presentation.
12
$1b $1.00b
€0.70b $0.70b $0.75b $0.75b ($0.74b)
Sep Dec May Jun Mar May 2017 2019 2021 2022 2024 2025
Appendix
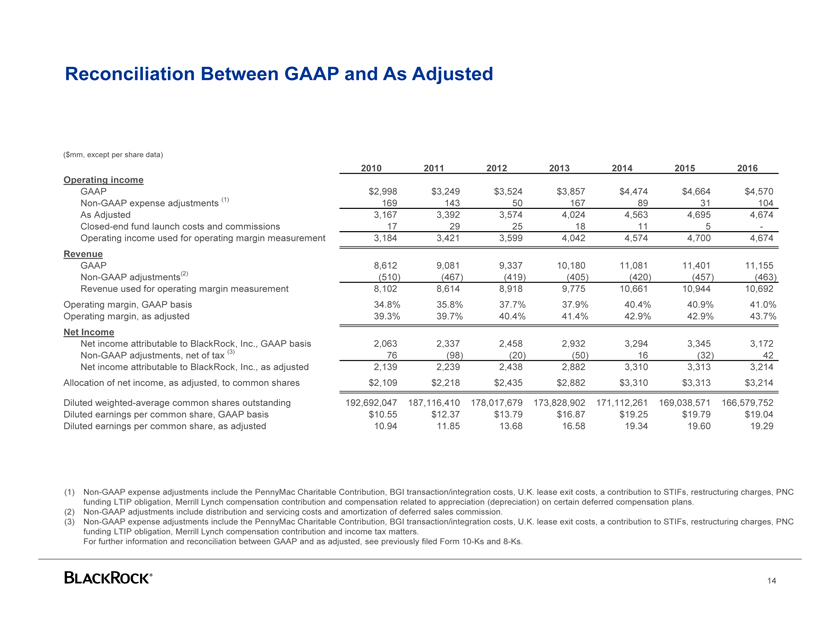
Reconciliation Between GAAP and As Adjusted
($mm, except per share data)
2010 2011 2012 2013 2014 2015 2016 Operating income
GAAP $2,998 $3,249 $3,524 $3,857 $4,474 $4,664 $4,570 Non-GAAP expense adjustments (1) 169 143 50 167 89 31 104 As Adjusted 3,167 3,392 3,574 4,024 4,563 4,695 4,674 Closed-end fund launch costs and commissions 17 29 25 18 11 5 -Operating income used for operating margin measurement 3,184 3,421 3,599 4,042 4,574 4,700 4,674
Revenue
GAAP 8,612 9,081 9,337 10,180 11,081 11,401 11,155 Non-GAAP adjustments(2) (510) (467) (419) (405) (420) (457) (463) Revenue used for operating margin measurement 8,102 8,614 8,918 9,775 10,661 10,944 10,692 Operating margin, GAAP basis 34.8% 35.8% 37.7% 37.9% 40.4% 40.9% 41.0% Operating margin, as adjusted 39.3% 39.7% 40.4% 41.4% 42.9% 42.9% 43.7%
Net Income
Net income attributable to BlackRock, Inc., GAAP basis 2,063 2,337 2,458 2,932 3,294 3,345 3,172 Non-GAAP adjustments, net of tax (3) 76 (98) (20) (50) 16 (32) 42 Net income attributable to BlackRock, Inc., as adjusted 2,139 2,239 2,438 2,882 3,310 3,313 3,214 Allocation of net income, as adjusted, to common shares $2,109 $2,218 $2,435 $2,882 $3,310 $3,313 $3,214
Diluted weighted-average common shares outstanding 192,692,047 187,116,410 178,017,679 173,828,902 171,112,261 169,038,571 166,579,752 Diluted earnings per common share, GAAP basis $10.55 $12.37 $13.79 $16.87 $19.25 $19.79 $19.04 Diluted earnings per common share, as adjusted 10.94 11.85 13.68 16.58 19.34 19.60 19.29
(1) Non-GAAP expense adjustments include the PennyMac Charitable Contribution, BGI transaction/integration costs, U.K. lease exit costs, a contribution to STIFs, restructuring charges, PNC funding LTIP obligation, Merrill Lynch compensation contribution and compensation related to appreciation (depreciation) on certain deferred compensation plans.
(2) Non-GAAP adjustments include distribution and servicing costs and amortization of deferred sales commission.
(3) Non-GAAP expense adjustments include the PennyMac Charitable Contribution, BGI transaction/integration costs, U.K. lease exit costs, a contribution to STIFs, restructuring charges, PNC funding LTIP obligation, Merrill Lynch compensation contribution and income tax matters.
For further information and reconciliation between GAAP and as adjusted, see previously filed Form 10-Ks and 8-Ks.
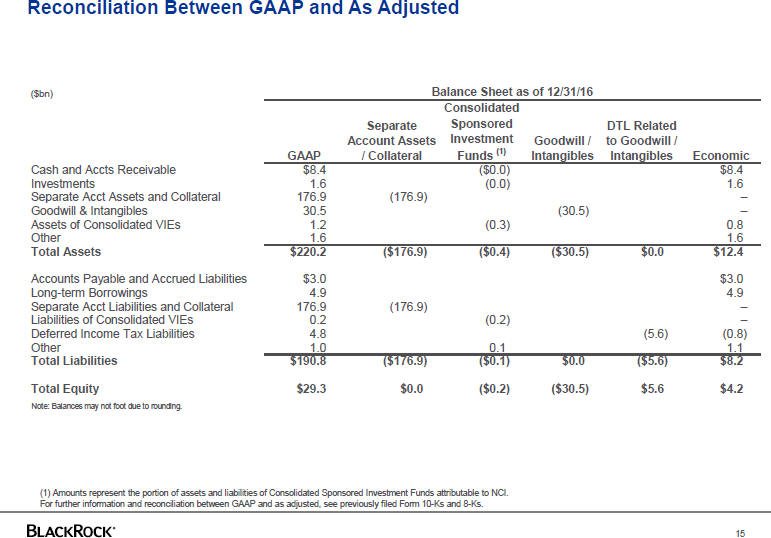
Reconciliation Between GAAP and As Adjusted ($bn)
Balance Sheet as of 12/31/16 Consolidated Separate Sponsored DTL Related Account Assets Investment Goodwill / to Goodwill / GAAP / Collateral Funds (1) Intangibles Intangibles Economic Cash and Accts Receivable $8.4 ($0.0) $8.4 Investments 1.6 (0.0) 1.6 Separate Acct Assets and Collateral 176.9 (176.9) – Goodwill & Intangibles 30.5 (30.5) – Assets of Consolidated VIEs 1.2 (0.3) 0.8 Other 1.6 1.6 Total Assets $220.2 ($176.9) ($0.4) ($30.5) $0.0 $12.4 Accounts Payable and Accrued Liabilities $3.0 $3.0
Long-term Borrowings 4.9 4.9 Separate Acct Liabilities and Collateral 176.9 (176.9) – Liabilities of Consolidated VIEs 0.2 (0.2) –
Deferred Income Tax Liabilities 4.8 (5.6) (0.8) Other 1.0 0.1 1.1 Total Liabilities $190.8 ($176.9) ($0.1) $0.0 ($5.6) $8.2 Total Equity $29.3 $0.0 ($0.2) ($30.5) $5.6 $4.2 Note: Balances may not foot due to rounding.
(1) Amounts represent the portion of assets and liabilities of Consolidated Sponsored Investment Funds attributable to NCI. For further information and reconciliation between GAAP and as adjusted, see previously filed Form 10-Ks and 8-Ks.
15
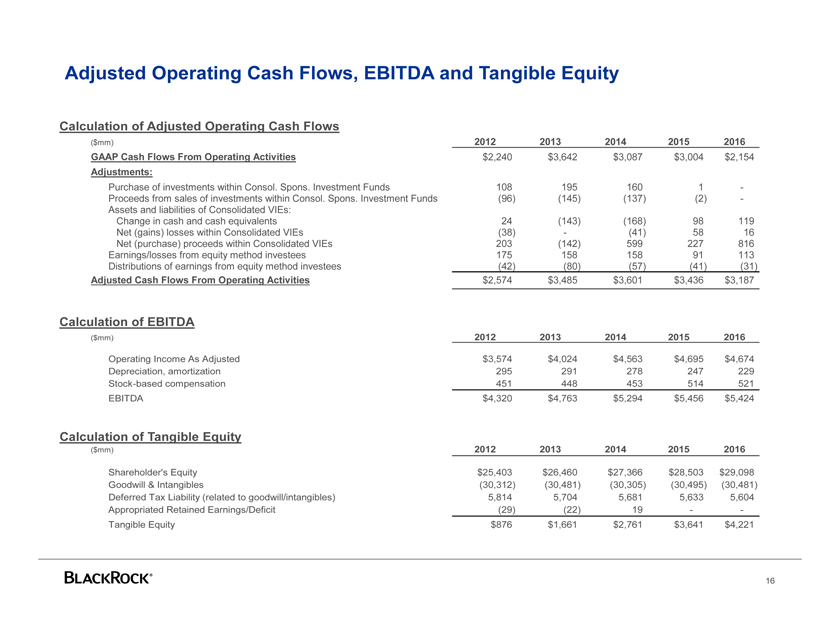
Adjusted Operating Cash Flows, EBITDA and Tangible Equity
Calculation of Adjusted Operating Cash Flows
($mm) 2012 2013 2014 2015 2016
GAAP Cash Flows From Operating Activities $2,240 $3,642 $3,087 $3,004 $2,154
Adjustments:
Purchase of investments within Consol. Spons. Investment Funds 108 195 160 1 -
Proceeds from sales of investments within Consol. Spons. Investment Funds (96) (145) (137) (2) -
Assets and liabilities of Consolidated VIEs:
Change in cash and cash equivalents 24 (143) (168) 98 119
Net (gains) losses within Consolidated VIEs (38) — (41) 58 16
Net (purchase) proceeds within Consolidated VIEs 203 (142) 599 227 816
Earnings/losses from equity method investees 175 158 158 91 113
Distributions of earnings from equity method investees (42) (80) (57) (41) (31)
Adjusted Cash Flows From Operating Activities $2,574 $3,485 $3,601 $3,436 $3,187
Calculation of EBITDA
($mm) 2012 2013 2014 2015 2016
Operating Income As Adjusted $3,574 $4,024 $4,563 $4,695 $4,674
Depreciation, amortization 295 291 278 247 229
Stock-based compensation 451 448 453 514 521
EBITDA $4,320 $4,763 $5,294 $5,456 $5,424
Calculation of Tangible Equity
($mm) 2012 2013 2014 2015 2016
Shareholder’s Equity $25,403 $26,460 $27,366 $28,503 $29,098
Goodwill & Intangibles (30,312) (30,481) (30,305) (30,495) (30,481)
Deferred Tax Liability (related to goodwill/intangibles) 5,814 5,704 5,681 5,633 5,604
Appropriated Retained Earnings/Deficit (29) (22) 19 — -
Tangible Equity $876 $1,661 $2,761 $3,641 $4,221
Important Notes
This document contains general information only and does not take into account an individual’s financial circumstances. An assessment should be made as to whether the information is appropriate in individual circumstances and consideration should be given to talking to a professional adviser before making an investment decision.
The opinions expressed are as of December 2016 and may change as subsequent conditions vary. The information and opinions contained in this material are derived from proprietary and non-proprietary sources deemed by BlackRock, Inc. and/or its subsidiaries (together, “BlackRock”) to be reliable, are not necessarily all inclusive and are not guaranteed as to accuracy.
There is no guarantee that any forecasts made will come to pass. Reliance upon information in this material is at the sole discretion of the reader. This material may contain “forward-looking” information that is not purely historical in nature. Such information may include, among other things, projections or forecasts. No representation is made that every assumption made in achieving, calculating or presenting either the forward-looking information or the historical performance information herein has been considered or stated in preparing this material. Any changes to assumptions that may have been made in preparing this material could have a material impact on the forecasts that are presented herein by way of example. Investing involves risk, including possible loss of principal. This material is not intended to provide, and should not be relied on for, accounting, legal or tax advice or investment recommendations. No part of this document may be reproduced, stored in a retrieval system or transmitted in any form or by any means, electronic, mechanical, photocopying, recording or otherwise, without the prior written consent of BlackRock.
A securities rating is not a recommendation to buy, sell or hold securities and may be subject to revision or withdrawal at any time.
© 2017 BlackRock, Inc. All Rights reserved. BLACKROCK, BLACKROCK SOLUTIONS, ALADDIN, iSHARES, are registered and unregistered trademarks of BlackRock, Inc. or its subsidiaries in the United States and elsewhere. All other trademarks are those of their respective owners.