UNITED STATES
SECURITIES AND EXCHANGE COMMISSION
Washington, D.C. 20549
FORM N-CSR
CERTIFIED SHAREHOLDER REPORT OF REGISTERED
MANAGEMENT INVESTMENT COMPANIES
Investment Company Act file number 811-21990
Fidelity Commonwealth Trust II
(Exact name of registrant as specified in charter)
245 Summer St., Boston, MA 02210
(Address of principal executive offices) (Zip code)
Marc Bryant, Secretary
245 Summer St.
Boston, Massachusetts 02210
(Name and address of agent for service)
Registrant's telephone number, including area code:
617-563-7000
Date of fiscal year end: | February 28 |
Date of reporting period: | August 31, 2016 |
Item 1.
Reports to Stockholders
Fidelity® Large Cap Growth Enhanced Index Fund Fidelity® Large Cap Value Enhanced Index Fund Fidelity® Large Cap Core Enhanced Index Fund Fidelity® Mid Cap Enhanced Index Fund Fidelity® Small Cap Enhanced Index Fund Fidelity® International Enhanced Index Fund Semi-Annual Report August 31, 2016 |
 |
Contents
To view a fund's proxy voting guidelines and proxy voting record for the 12-month period ended June 30, visit http://www.fidelity.com/proxyvotingresults or visit the Securities and Exchange Commission's (SEC) web site at http://www.sec.gov.
You may also call 1-800-544-8544 to request a free copy of the proxy voting guidelines.
The funds or securities referred to herein are not sponsored, endorsed, or promoted by MSCI, and MSCI bears no liability with respect to any such funds or securities or any index on which such funds or securities are based. The prospectus contains a more detailed description of the limited relationship MSCI has with Fidelity and any related funds.
Standard & Poor's, S&P and S&P 500 are registered service marks of The McGraw-Hill Companies, Inc. and have been licensed for use by Fidelity Distributors Corporation.
Other third-party marks appearing herein are the property of their respective owners.
All other marks appearing herein are registered or unregistered trademarks or service marks of FMR LLC or an affiliated company. © 2016 FMR LLC. All rights reserved.
This report and the financial statements contained herein are submitted for the general information of the shareholders of the Funds. This report is not authorized for distribution to prospective investors in the Funds unless preceded or accompanied by an effective prospectus.
A fund files its complete schedule of portfolio holdings with the SEC for the first and third quarters of each fiscal year on Form N-Q. Forms N-Q are available on the SEC’s web site at http://www.sec.gov. A fund's Forms N-Q may be reviewed and copied at the SEC’s Public Reference Room in Washington, DC. Information regarding the operation of the SEC's Public Reference Room may be obtained by calling 1-800-SEC-0330.
For a complete list of a fund's portfolio holdings, view the most recent holdings listing, semiannual report, or annual report on Fidelity's web site at http://www.fidelity.com, http://www.institutional.fidelity.com, or http://www.401k.com, as applicable.
NOT FDIC INSURED •MAY LOSE VALUE •NO BANK GUARANTEE
Neither the Funds nor Fidelity Distributors Corporation is a bank.
Fidelity® Large Cap Growth Enhanced Index Fund
Investment Summary (Unaudited)
Top Ten Stocks as of August 31, 2016
| % of fund's net assets | % of fund's net assets 6 months ago | |
| Apple, Inc. | 5.1 | 6.0 |
| Microsoft Corp. | 3.5 | 2.6 |
| Amazon.com, Inc. | 3.2 | 2.6 |
| Facebook, Inc. Class A | 3.1 | 2.6 |
| Alphabet, Inc. Class A | 2.1 | 2.1 |
| Home Depot, Inc. | 1.9 | 1.9 |
| Amgen, Inc. | 1.7 | 1.5 |
| PepsiCo, Inc. | 1.6 | 1.9 |
| Alphabet, Inc. Class C | 1.6 | 1.5 |
| Altria Group, Inc. | 1.5 | 1.6 |
| 25.3 |
Market Sectors as of August 31, 2016
| % of fund's net assets | % of fund's net assets 6 months ago | |
| Information Technology | 31.4 | 28.5 |
| Consumer Discretionary | 19.9 | 22.2 |
| Health Care | 18.2 | 17.7 |
| Consumer Staples | 10.5 | 10.1 |
| Industrials | 8.3 | 9.1 |
| Financials | 3.7 | 4.9 |
| Materials | 2.7 | 1.6 |
| Telecommunication Services | 1.7 | 3.4 |
| Energy | 0.7 | 1.2 |
Asset Allocation (% of fund's net assets)
| As of August 31, 2016* | ||
| Stocks and Equity Futures | 99.9% | |
| Short-Term Investments and Net Other Assets (Liabilities) | 0.1% | |

* Foreign investments - 3.2%
| As of February 29, 2016* | ||
| Stocks and Equity Futures | 100.0% | |

* Foreign investments - 4.1%
Fidelity® Large Cap Growth Enhanced Index Fund
Investments August 31, 2016 (Unaudited)
Showing Percentage of Net Assets
| Common Stocks - 97.1% | |||
| Shares | Value | ||
| CONSUMER DISCRETIONARY - 19.9% | |||
| Auto Components - 1.6% | |||
| BorgWarner, Inc. | 44,723 | $1,538,024 | |
| Gentex Corp. (a) | 198,408 | 3,529,678 | |
| Lear Corp. | 32,250 | 3,750,353 | |
| Tenneco, Inc. (b) | 32,588 | 1,819,388 | |
| Visteon Corp. | 2,527 | 178,659 | |
| 10,816,102 | |||
| Automobiles - 0.9% | |||
| Ford Motor Co. | 207,863 | 2,619,074 | |
| Thor Industries, Inc. (a) | 40,828 | 3,313,192 | |
| 5,932,266 | |||
| Distributors - 0.0% | |||
| LKQ Corp. (b) | 7,985 | 288,179 | |
| Hotels, Restaurants & Leisure - 2.1% | |||
| Darden Restaurants, Inc. (a) | 17,040 | 1,050,346 | |
| International Game Technology PLC | 55,209 | 1,260,421 | |
| McDonald's Corp. | 82,587 | 9,552,012 | |
| Starbucks Corp. | 28,284 | 1,590,409 | |
| Wendy's Co. | 57,370 | 584,600 | |
| 14,037,788 | |||
| Household Durables - 0.4% | |||
| Garmin Ltd. (a) | 28,764 | 1,411,737 | |
| Harman International Industries, Inc. | 6,399 | 541,931 | |
| Whirlpool Corp. | 3,103 | 554,320 | |
| 2,507,988 | |||
| Internet & Catalog Retail - 3.6% | |||
| Amazon.com, Inc. (b) | 28,100 | 21,613,396 | |
| Liberty Interactive Corp. QVC Group Series A (b) | 71,993 | 1,521,212 | |
| Priceline Group, Inc. (b) | 702 | 994,544 | |
| 24,129,152 | |||
| Leisure Products - 0.6% | |||
| Brunswick Corp. | 32,367 | 1,488,558 | |
| Hasbro, Inc. | 167 | 13,651 | |
| Polaris Industries, Inc. (a) | 29,341 | 2,542,104 | |
| 4,044,313 | |||
| Media - 4.6% | |||
| Cable One, Inc. | 166 | 89,826 | |
| Comcast Corp. Class A | 136,356 | 8,898,593 | |
| Discovery Communications, Inc.: | |||
| Class A (a)(b) | 103,645 | 2,643,984 | |
| Class C (non-vtg.) (b) | 132,630 | 3,291,877 | |
| DISH Network Corp. Class A (b) | 7,094 | 356,332 | |
| Omnicom Group, Inc. (a) | 20,462 | 1,762,392 | |
| Scripps Networks Interactive, Inc. Class A | 20,608 | 1,305,929 | |
| The Walt Disney Co. | 106,704 | 10,079,260 | |
| Time Warner, Inc. | 32,350 | 2,536,564 | |
| 30,964,757 | |||
| Multiline Retail - 0.6% | |||
| Big Lots, Inc. (a) | 14,721 | 726,040 | |
| Macy's, Inc. | 70,741 | 2,559,409 | |
| Target Corp. | 12,022 | 843,824 | |
| 4,129,273 | |||
| Specialty Retail - 4.7% | |||
| American Eagle Outfitters, Inc. (a) | 183,568 | 3,403,351 | |
| Best Buy Co., Inc. | 84,166 | 3,238,708 | |
| Foot Locker, Inc. | 5,520 | 362,333 | |
| Gap, Inc. (a) | 95,593 | 2,377,398 | |
| Home Depot, Inc. | 95,852 | 12,855,670 | |
| Lowe's Companies, Inc. | 48,041 | 3,678,019 | |
| Ross Stores, Inc. | 51,362 | 3,196,771 | |
| TJX Companies, Inc. | 515 | 39,882 | |
| Urban Outfitters, Inc. (a)(b) | 28,621 | 1,026,063 | |
| Williams-Sonoma, Inc. (a) | 30,701 | 1,616,101 | |
| 31,794,296 | |||
| Textiles, Apparel & Luxury Goods - 0.8% | |||
| Michael Kors Holdings Ltd. (a)(b) | 76,351 | 3,737,381 | |
| NIKE, Inc. Class B | 22,055 | 1,271,250 | |
| 5,008,631 | |||
| TOTAL CONSUMER DISCRETIONARY | 133,652,745 | ||
| CONSUMER STAPLES - 10.5% | |||
| Beverages - 3.0% | |||
| Dr. Pepper Snapple Group, Inc. | 32,689 | 3,062,959 | |
| PepsiCo, Inc. | 102,400 | 10,931,200 | |
| The Coca-Cola Co. | 145,817 | 6,332,832 | |
| 20,326,991 | |||
| Food & Staples Retailing - 1.7% | |||
| Costco Wholesale Corp. | 5,412 | 877,231 | |
| CVS Health Corp. | 42,958 | 4,012,277 | |
| Performance Food Group Co. | 2,312 | 59,418 | |
| Wal-Mart Stores, Inc. | 45,839 | 3,274,738 | |
| Walgreens Boots Alliance, Inc. | 38,234 | 3,085,866 | |
| 11,309,530 | |||
| Food Products - 2.1% | |||
| Campbell Soup Co. | 56,796 | 3,448,653 | |
| General Mills, Inc. | 49,289 | 3,490,647 | |
| Ingredion, Inc. | 9,373 | 1,283,726 | |
| Pilgrim's Pride Corp. (a) | 6,436 | 148,543 | |
| Post Holdings, Inc. (b) | 868 | 73,589 | |
| The Hershey Co. | 2,522 | 251,923 | |
| The J.M. Smucker Co. | 11,789 | 1,671,562 | |
| Tyson Foods, Inc. Class A | 52,014 | 3,930,698 | |
| 14,299,341 | |||
| Household Products - 1.6% | |||
| Church & Dwight Co., Inc. | 1,429 | 142,071 | |
| Clorox Co. | 31,821 | 4,169,824 | |
| Colgate-Palmolive Co. | 51,645 | 3,839,289 | |
| Procter & Gamble Co. | 26,408 | 2,305,682 | |
| Spectrum Brands Holdings, Inc. | 1,788 | 239,950 | |
| 10,696,816 | |||
| Tobacco - 2.1% | |||
| Altria Group, Inc. | 157,049 | 10,379,368 | |
| Philip Morris International, Inc. | 36,874 | 3,684,819 | |
| 14,064,187 | |||
| TOTAL CONSUMER STAPLES | 70,696,865 | ||
| ENERGY - 0.7% | |||
| Energy Equipment & Services - 0.2% | |||
| Dril-Quip, Inc. (b) | 18,901 | 1,050,329 | |
| Oil, Gas & Consumable Fuels - 0.5% | |||
| ONEOK, Inc. | 49,640 | 2,327,620 | |
| Tesoro Corp. | 18,717 | 1,411,636 | |
| 3,739,256 | |||
| TOTAL ENERGY | 4,789,585 | ||
| FINANCIALS - 3.7% | |||
| Capital Markets - 0.4% | |||
| Charles Schwab Corp. | 44,589 | 1,402,770 | |
| Federated Investors, Inc. Class B (non-vtg.) | 2,414 | 77,972 | |
| Lazard Ltd. Class A | 5,483 | 203,035 | |
| T. Rowe Price Group, Inc. | 9,811 | 682,257 | |
| 2,366,034 | |||
| Consumer Finance - 0.7% | |||
| American Express Co. | 37,992 | 2,491,515 | |
| Discover Financial Services | 28,315 | 1,698,900 | |
| Synchrony Financial | 19,115 | 531,970 | |
| 4,722,385 | |||
| Diversified Financial Services - 0.7% | |||
| Broadcom Ltd. | 3,063 | 540,374 | |
| MarketAxess Holdings, Inc. | 6,541 | 1,102,420 | |
| Morningstar, Inc. | 39,764 | 3,303,195 | |
| 4,945,989 | |||
| Real Estate Investment Trusts - 1.9% | |||
| Coresite Realty Corp. | 3,633 | 283,447 | |
| Equity Lifestyle Properties, Inc. | 17,302 | 1,341,424 | |
| Omega Healthcare Investors, Inc. | 5,075 | 183,715 | |
| PS Business Parks, Inc. | 300 | 33,234 | |
| Public Storage | 23,677 | 5,302,227 | |
| Ryman Hospitality Properties, Inc. | 1,096 | 59,140 | |
| Simon Property Group, Inc. | 9,521 | 2,051,490 | |
| Tanger Factory Outlet Centers, Inc. | 5,440 | 221,082 | |
| Weyerhaeuser Co. | 104,588 | 3,331,128 | |
| 12,806,887 | |||
| TOTAL FINANCIALS | 24,841,295 | ||
| HEALTH CARE - 18.2% | |||
| Biotechnology - 6.5% | |||
| AbbVie, Inc. | 151,398 | 9,704,612 | |
| Amgen, Inc. | 65,803 | 11,190,458 | |
| Biogen, Inc. (b) | 23,515 | 7,186,889 | |
| Celgene Corp. (b) | 16,008 | 1,708,694 | |
| Gilead Sciences, Inc. | 124,292 | 9,742,007 | |
| Medivation, Inc. (b) | 1,667 | 134,294 | |
| Myriad Genetics, Inc. (b) | 35,160 | 715,858 | |
| United Therapeutics Corp. (b) | 28,195 | 3,447,685 | |
| 43,830,497 | |||
| Health Care Equipment & Supplies - 1.7% | |||
| Abiomed, Inc. (b) | 2,230 | 263,006 | |
| Align Technology, Inc. (b) | 5,806 | 539,377 | |
| Baxter International, Inc. | 15,565 | 727,352 | |
| C.R. Bard, Inc. | 10,164 | 2,244,618 | |
| Edwards Lifesciences Corp. (b) | 41,426 | 4,770,618 | |
| Hill-Rom Holdings, Inc. | 994 | 58,954 | |
| Hologic, Inc. (b) | 56,248 | 2,161,048 | |
| Masimo Corp. (b) | 12,845 | 759,653 | |
| St. Jude Medical, Inc. | 1,129 | 87,972 | |
| 11,612,598 | |||
| Health Care Providers & Services - 4.7% | |||
| Aetna, Inc. | 31,123 | 3,645,126 | |
| Anthem, Inc. | 30,892 | 3,863,971 | |
| Cardinal Health, Inc. | 34,824 | 2,774,428 | |
| Express Scripts Holding Co. (b) | 79,634 | 5,789,392 | |
| Humana, Inc. | 3,123 | 558,111 | |
| McKesson Corp. | 29,824 | 5,506,107 | |
| UnitedHealth Group, Inc. | 58,669 | 7,981,917 | |
| Universal Health Services, Inc. Class B | 8,958 | 1,079,708 | |
| Wellcare Health Plans, Inc. (b) | 4,474 | 504,220 | |
| 31,702,980 | |||
| Life Sciences Tools & Services - 0.5% | |||
| Bruker Corp. | 68,614 | 1,534,209 | |
| Illumina, Inc. (b) | 5,148 | 866,614 | |
| INC Research Holdings, Inc. Class A (b) | 25,943 | 1,131,893 | |
| 3,532,716 | |||
| Pharmaceuticals - 4.8% | |||
| Allergan PLC (b) | 9,093 | 2,132,672 | |
| Bristol-Myers Squibb Co. | 152,307 | 8,740,899 | |
| Eli Lilly & Co. | 41,498 | 3,226,470 | |
| Johnson & Johnson | 56,794 | 6,777,796 | |
| Merck & Co., Inc. | 55,172 | 3,464,250 | |
| Mylan N.V. (b) | 84,517 | 3,580,140 | |
| Pfizer, Inc. | 113,573 | 3,952,340 | |
| 31,874,567 | |||
| TOTAL HEALTH CARE | 122,553,358 | ||
| INDUSTRIALS - 8.3% | |||
| Aerospace & Defense - 3.2% | |||
| BE Aerospace, Inc. | 1,359 | 68,697 | |
| BWX Technologies, Inc. | 12,550 | 487,066 | |
| General Dynamics Corp. | 15,603 | 2,375,089 | |
| Hexcel Corp. | 829 | 37,181 | |
| Honeywell International, Inc. | 21,318 | 2,488,024 | |
| Huntington Ingalls Industries, Inc. | 7,725 | 1,275,938 | |
| Lockheed Martin Corp. | 2,448 | 594,791 | |
| Raytheon Co. | 14,299 | 2,003,719 | |
| Spirit AeroSystems Holdings, Inc. Class A (b) | 74,925 | 3,433,064 | |
| Textron, Inc. | 26,046 | 1,063,979 | |
| The Boeing Co. | 61,234 | 7,926,741 | |
| 21,754,289 | |||
| Air Freight & Logistics - 0.3% | |||
| United Parcel Service, Inc. Class B | 16,184 | 1,767,616 | |
| Airlines - 0.9% | |||
| Alaska Air Group, Inc. | 14,530 | 981,211 | |
| Delta Air Lines, Inc. | 28,827 | 1,059,392 | |
| JetBlue Airways Corp. (b) | 57,573 | 918,289 | |
| Southwest Airlines Co. | 94,819 | 3,496,925 | |
| 6,455,817 | |||
| Building Products - 0.2% | |||
| A.O. Smith Corp. | 4,669 | 450,465 | |
| Fortune Brands Home & Security, Inc. | 10,885 | 691,851 | |
| 1,142,316 | |||
| Commercial Services & Supplies - 0.2% | |||
| Deluxe Corp. (a) | 13,061 | 890,368 | |
| KAR Auction Services, Inc. | 2,846 | 120,329 | |
| R.R. Donnelley & Sons Co. | 8,315 | 142,187 | |
| 1,152,884 | |||
| Electrical Equipment - 0.2% | |||
| Emerson Electric Co. | 10,439 | 549,927 | |
| EnerSys | 2,242 | 157,792 | |
| Fortive Corp. | 18,770 | 988,616 | |
| 1,696,335 | |||
| Industrial Conglomerates - 1.5% | |||
| 3M Co. | 51,562 | 9,241,973 | |
| Carlisle Companies, Inc. | 5,132 | 538,142 | |
| General Electric Co. | 4,900 | 153,076 | |
| 9,933,191 | |||
| Machinery - 1.4% | |||
| Cummins, Inc. | 20,618 | 2,589,827 | |
| Illinois Tool Works, Inc. | 11,065 | 1,315,075 | |
| PACCAR, Inc. | 27,166 | 1,625,613 | |
| Stanley Black & Decker, Inc. | 5,885 | 728,269 | |
| Toro Co. | 11,376 | 1,105,178 | |
| Wabtec Corp. | 21,514 | 1,648,188 | |
| Woodward, Inc. | 3,711 | 232,754 | |
| 9,244,904 | |||
| Professional Services - 0.3% | |||
| Robert Half International, Inc. | 61,329 | 2,350,741 | |
| Trading Companies & Distributors - 0.1% | |||
| MSC Industrial Direct Co., Inc. Class A | 6,682 | 488,053 | |
| TOTAL INDUSTRIALS | 55,986,146 | ||
| INFORMATION TECHNOLOGY - 31.4% | |||
| Communications Equipment - 1.3% | |||
| Cisco Systems, Inc. | 81,061 | 2,548,558 | |
| F5 Networks, Inc. (b) | 9,098 | 1,116,598 | |
| Juniper Networks, Inc. | 69,958 | 1,614,631 | |
| Motorola Solutions, Inc. | 46,260 | 3,561,557 | |
| 8,841,344 | |||
| Electronic Equipment & Components - 0.3% | |||
| Amphenol Corp. Class A | 7,339 | 457,293 | |
| Belden, Inc. | 5,978 | 445,899 | |
| Dolby Laboratories, Inc. Class A | 19,280 | 943,563 | |
| 1,846,755 | |||
| Internet Software & Services - 7.7% | |||
| Alphabet, Inc.: | |||
| Class A | 18,276 | 14,435,299 | |
| Class C (b) | 13,752 | 10,548,472 | |
| eBay, Inc. (b) | 172,264 | 5,540,010 | |
| Facebook, Inc. Class A (b) | 163,666 | 20,641,556 | |
| j2 Global, Inc. | 4,182 | 285,087 | |
| LinkedIn Corp. Class A (b) | 3,306 | 637,232 | |
| 52,087,656 | |||
| IT Services - 5.4% | |||
| Accenture PLC Class A | 16,038 | 1,844,370 | |
| Alliance Data Systems Corp. (b) | 20,095 | 4,111,035 | |
| Amdocs Ltd. | 17,992 | 1,081,679 | |
| Booz Allen Hamilton Holding Corp. Class A | 4,489 | 136,286 | |
| Cognizant Technology Solutions Corp. Class A (b) | 82,685 | 4,749,426 | |
| CoreLogic, Inc. (b) | 1,764 | 72,359 | |
| IBM Corp. | 16,222 | 2,577,351 | |
| Leidos Holdings, Inc. | 86,201 | 3,492,003 | |
| MasterCard, Inc. Class A | 33,259 | 3,213,817 | |
| Paychex, Inc. | 49,031 | 2,974,711 | |
| Teradata Corp. (a)(b) | 57,295 | 1,817,970 | |
| Total System Services, Inc. | 45,046 | 2,218,516 | |
| Vantiv, Inc. (b) | 33,457 | 1,797,979 | |
| Visa, Inc. Class A | 73,373 | 5,935,876 | |
| 36,023,378 | |||
| Semiconductors & Semiconductor Equipment - 3.3% | |||
| Applied Materials, Inc. | 156,893 | 4,681,687 | |
| Intel Corp. | 118,083 | 4,237,999 | |
| KLA-Tencor Corp. | 387 | 26,804 | |
| Lam Research Corp. (a) | 43,734 | 4,081,257 | |
| Qualcomm, Inc. | 71,757 | 4,525,714 | |
| Texas Instruments, Inc. | 62,216 | 4,326,501 | |
| 21,879,962 | |||
| Software - 8.1% | |||
| Activision Blizzard, Inc. | 73,405 | 3,036,765 | |
| Adobe Systems, Inc. (b) | 51,243 | 5,242,671 | |
| CA Technologies, Inc. | 40,500 | 1,373,355 | |
| Cadence Design Systems, Inc. (b) | 4,113 | 104,635 | |
| Citrix Systems, Inc. (b) | 46,567 | 4,060,642 | |
| Electronic Arts, Inc. (b) | 56,584 | 4,596,318 | |
| Intuit, Inc. | 43,407 | 4,837,710 | |
| Mentor Graphics Corp. | 2,715 | 65,187 | |
| Microsoft Corp. | 408,287 | 23,460,171 | |
| Oracle Corp. | 68,284 | 2,814,666 | |
| Symantec Corp. | 17,906 | 432,072 | |
| Synopsys, Inc. (b) | 52,580 | 3,117,468 | |
| VMware, Inc. Class A (a)(b) | 17,534 | 1,285,768 | |
| 54,427,428 | |||
| Technology Hardware, Storage & Peripherals - 5.3% | |||
| Apple, Inc. | 324,095 | 34,386,481 | |
| NetApp, Inc. | 34,341 | 1,187,855 | |
| Seagate Technology LLC (a) | 9,876 | 333,216 | |
| 35,907,552 | |||
| TOTAL INFORMATION TECHNOLOGY | 211,014,075 | ||
| MATERIALS - 2.7% | |||
| Chemicals - 1.4% | |||
| Celanese Corp. Class A | 16,462 | 1,060,647 | |
| E.I. du Pont de Nemours & Co. | 35,359 | 2,460,986 | |
| LyondellBasell Industries NV Class A | 51,768 | 4,083,978 | |
| Monsanto Co. | 10,578 | 1,126,557 | |
| PPG Industries, Inc. | 3,985 | 421,932 | |
| Trinseo SA | 4,269 | 247,004 | |
| 9,401,104 | |||
| Construction Materials - 0.0% | |||
| Eagle Materials, Inc. | 975 | 78,361 | |
| Containers & Packaging - 0.4% | |||
| Avery Dennison Corp. | 3,799 | 294,195 | |
| Berry Plastics Group, Inc. (b) | 17,801 | 807,987 | |
| Packaging Corp. of America | 16,456 | 1,293,935 | |
| 2,396,117 | |||
| Metals & Mining - 0.9% | |||
| Nucor Corp. | 58,385 | 2,832,256 | |
| Steel Dynamics, Inc. | 116,360 | 2,864,783 | |
| Worthington Industries, Inc. | 10,207 | 437,880 | |
| 6,134,919 | |||
| TOTAL MATERIALS | 18,010,501 | ||
| TELECOMMUNICATION SERVICES - 1.7% | |||
| Diversified Telecommunication Services - 1.7% | |||
| AT&T, Inc. | 43,681 | 1,785,679 | |
| Verizon Communications, Inc. | 188,867 | 9,883,410 | |
| 11,669,089 | |||
| TOTAL COMMON STOCKS | |||
| (Cost $560,246,691) | 653,213,659 | ||
| Principal Amount | Value | ||
| U.S. Treasury Obligations - 0.2% | |||
| U.S. Treasury Bills, yield at date of purchase 0.32% 9/15/16 (c) | |||
| (Cost $999,874) | 1,000,000 | 999,916 | |
| Shares | Value | ||
| Money Market Funds - 8.3% | |||
| Dreyfus Cash Management Institutional Shares, 0.30% (d) | 19,643,591 | $19,643,591 | |
| Fidelity Securities Lending Cash Central Fund 0.44% (e)(f) | 36,306,360 | 36,306,360 | |
| TOTAL MONEY MARKET FUNDS | |||
| (Cost $55,949,951) | 55,949,951 | ||
| TOTAL INVESTMENT PORTFOLIO - 105.6% | |||
| (Cost $617,196,516) | 710,163,526 | ||
| NET OTHER ASSETS (LIABILITIES) - (5.6)% | (37,761,895) | ||
| NET ASSETS - 100% | $672,401,631 |
| Futures Contracts | |||
| Expiration Date | Underlying Face Amount at Value | Unrealized Appreciation/(Depreciation) | |
| Purchased | |||
| Equity Index Contracts | |||
| 176 CME E-mini S&P 500 Index Contracts (United States) | Sept. 2016 | 19,091,600 | $692,556 |
The face value of futures purchased as a percentage of Net Assets is 2.8%
Legend
(a) Security or a portion of the security is on loan at period end.
(b) Non-income producing
(c) Security or a portion of the security was pledged to cover margin requirements for futures contracts. At period end, the value of securities pledged amounted to $739,938.
(d) The rate quoted is the annualized seven-day yield of the fund at period end.
(e) Affiliated fund that is generally available only to investment companies and other accounts managed by Fidelity Investments. The rate quoted is the annualized seven-day yield of the fund at period end. A complete unaudited listing of the fund's holdings as of its most recent quarter end is available upon request. In addition, each Fidelity Central Fund's financial statements are available on the SEC's website or upon request.
(f) Investment made with cash collateral received from securities on loan.
Affiliated Central Funds
Information regarding fiscal year to date income earned by the Fund from investments in Fidelity Central Funds is as follows:
| Fund | Income earned |
| Fidelity Securities Lending Cash Central Fund | $51,755 |
Investment Valuation
The following is a summary of the inputs used, as of August 31, 2016, involving the Fund's assets and liabilities carried at fair value. The inputs or methodology used for valuing securities may not be an indication of the risk associated with investing in those securities. For more information on valuation inputs, and their aggregation into the levels used below, please refer to the Investment Valuation section in the accompanying Notes to Financial Statements.
| Valuation Inputs at Reporting Date: | ||||
| Description | Total | Level 1 | Level 2 | Level 3 |
| Investments in Securities: | ||||
| Equities: | ||||
| Consumer Discretionary | $133,652,745 | $133,652,745 | $-- | $-- |
| Consumer Staples | 70,696,865 | 70,696,865 | -- | -- |
| Energy | 4,789,585 | 4,789,585 | -- | -- |
| Financials | 24,841,295 | 24,841,295 | -- | -- |
| Health Care | 122,553,358 | 122,553,358 | -- | -- |
| Industrials | 55,986,146 | 55,986,146 | -- | -- |
| Information Technology | 211,014,075 | 211,014,075 | -- | -- |
| Materials | 18,010,501 | 18,010,501 | -- | -- |
| Telecommunication Services | 11,669,089 | 11,669,089 | -- | -- |
| U.S. Government and Government Agency Obligations | 999,916 | -- | 999,916 | -- |
| Money Market Funds | 55,949,951 | 55,949,951 | -- | -- |
| Total Investments in Securities: | $710,163,526 | $709,163,610 | $999,916 | $-- |
| Derivative Instruments: | ||||
| Assets | ||||
| Futures Contracts | $692,556 | $692,556 | $-- | $-- |
| Total Assets | $692,556 | $692,556 | $-- | $-- |
| Total Derivative Instruments: | $692,556 | $692,556 | $-- | $-- |
Value of Derivative Instruments
The following table is a summary of the Fund's value of derivative instruments by primary risk exposure as of August 31, 2016. For additional information on derivative instruments, please refer to the Derivative Instruments section in the accompanying Notes to Financial Statements.
| Primary Risk Exposure / Derivative Type | Value | |
| Asset | Liability | |
| Equity Risk | ||
| Futures Contracts(a) | $692,556 | $0 |
| Total Equity Risk | 692,556 | 0 |
| Total Value of Derivatives | $692,556 | $0 |
(a) Reflects gross cumulative appreciation (depreciation) on futures contracts as presented in the Schedule of Investments. In the Statement of Assets and Liabilities, the period end daily variation margin is included in receivable or payable for daily variation margin for derivative instruments, and the net cumulative appreciation (depreciation) is included in net unrealized appreciation (depreciation).
See accompanying notes which are an integral part of the financial statements.
Fidelity® Large Cap Growth Enhanced Index Fund
Financial Statements
Statement of Assets and Liabilities
| August 31, 2016 (Unaudited) | ||
| Assets | ||
| Investment in securities, at value (including securities loaned of $35,251,999) — See accompanying schedule: Unaffiliated issuers (cost $580,890,156) | $673,857,166 | |
| Fidelity Central Funds (cost $36,306,360) | 36,306,360 | |
| Total Investments (cost $617,196,516) | $710,163,526 | |
| Receivable for investments sold | 5,662,885 | |
| Receivable for fund shares sold | 1,922,607 | |
| Dividends receivable | 1,144,340 | |
| Interest receivable | 4,068 | |
| Distributions receivable from Fidelity Central Funds | 10,700 | |
| Total assets | 718,908,126 | |
| Liabilities | ||
| Payable for investments purchased | $9,381,307 | |
| Payable for fund shares redeemed | 524,815 | |
| Accrued management fee | 164,701 | |
| Payable for daily variation margin for derivative instruments | 46,961 | |
| Other affiliated payables | 82,351 | |
| Collateral on securities loaned, at value | 36,306,360 | |
| Total liabilities | 46,506,495 | |
| Net Assets | $672,401,631 | |
| Net Assets consist of: | ||
| Paid in capital | $580,346,280 | |
| Undistributed net investment income | 4,315,762 | |
| Accumulated undistributed net realized gain (loss) on investments | (5,919,977) | |
| Net unrealized appreciation (depreciation) on investments | 93,659,566 | |
| Net Assets, for 43,877,196 shares outstanding | $672,401,631 | |
| Net Asset Value, offering price and redemption price per share ($672,401,631 ÷ 43,877,196 shares) | $15.32 |
See accompanying notes which are an integral part of the financial statements.
Statement of Operations
| Six months ended August 31, 2016 (Unaudited) | ||
| Investment Income | ||
| Dividends | $5,546,857 | |
| Interest | 18,205 | |
| Income from Fidelity Central Funds (including $51,755 from security lending) | 51,755 | |
| Total income | 5,616,817 | |
| Expenses | ||
| Management fee | $865,924 | |
| Transfer agent fees | 433,546 | |
| Independent trustees' fees and expenses | 1,253 | |
| Miscellaneous | 724 | |
| Total expenses before reductions | 1,301,447 | |
| Expense reductions | (108) | 1,301,339 |
| Net investment income (loss) | 4,315,478 | |
| Realized and Unrealized Gain (Loss) | ||
| Net realized gain (loss) on: | ||
| Investment securities: | ||
| Unaffiliated issuers | (1,085,994) | |
| Futures contracts | 699,061 | |
| Total net realized gain (loss) | (386,933) | |
| Change in net unrealized appreciation (depreciation) on: Investment securities | 48,536,541 | |
| Futures contracts | 522,075 | |
| Total change in net unrealized appreciation (depreciation) | 49,058,616 | |
| Net gain (loss) | 48,671,683 | |
| Net increase (decrease) in net assets resulting from operations | $52,987,161 |
See accompanying notes which are an integral part of the financial statements.
Statement of Changes in Net Assets
| Six months ended August 31, 2016 (Unaudited) | Year ended February 29, 2016 | |
| Increase (Decrease) in Net Assets | ||
| Operations | ||
| Net investment income (loss) | $4,315,478 | $5,942,877 |
| Net realized gain (loss) | (386,933) | 4,493,035 |
| Change in net unrealized appreciation (depreciation) | 49,058,616 | (38,693,142) |
| Net increase (decrease) in net assets resulting from operations | 52,987,161 | (28,257,230) |
| Distributions to shareholders from net investment income | – | (5,276,402) |
| Distributions to shareholders from net realized gain | – | (14,162,511) |
| Total distributions | – | (19,438,913) |
| Share transactions | ||
| Proceeds from sales of shares | 254,306,292 | 205,196,525 |
| Reinvestment of distributions | – | 18,634,238 |
| Cost of shares redeemed | (83,980,017) | (131,133,765) |
| Net increase (decrease) in net assets resulting from share transactions | 170,326,275 | 92,696,998 |
| Total increase (decrease) in net assets | 223,313,436 | 45,000,855 |
| Net Assets | ||
| Beginning of period | 449,088,195 | 404,087,340 |
| End of period | $672,401,631 | $449,088,195 |
| Other Information | ||
| Undistributed net investment income end of period | $4,315,762 | $284 |
| Shares | ||
| Sold | 17,116,702 | 13,841,828 |
| Issued in reinvestment of distributions | – | 1,270,101 |
| Redeemed | (5,637,243) | (8,915,319) |
| Net increase (decrease) | 11,479,459 | 6,196,610 |
See accompanying notes which are an integral part of the financial statements.
Financial Highlights — Fidelity Large Cap Growth Enhanced Index Fund
| Six months ended (Unaudited) August 31, | Years ended February 28, | |||||
| 2016 | 2016 A | 2015 | 2014 | 2013 | 2012 A | |
| Selected Per–Share Data | ||||||
| Net asset value, beginning of period | $13.86 | $15.42 | $14.22 | $11.77 | $10.93 | $10.19 |
| Income from Investment Operations | ||||||
| Net investment income (loss)B | .11 | .20 | .20 | .18 | .20 | .13 |
| Net realized and unrealized gain (loss) | 1.35 | (1.09) | 2.15 | 3.15 | .81 | .72 |
| Total from investment operations | 1.46 | (.89) | 2.35 | 3.33 | 1.01 | .85 |
| Distributions from net investment income | – | (.18) | (.15) | (.17) | (.17) | (.11) |
| Distributions from net realized gain | – | (.49) | (1.00) | (.71) | – | – |
| Total distributions | – | (.67) | (1.15) | (.88) | (.17) | (.11) |
| Net asset value, end of period | $15.32 | $13.86 | $15.42 | $14.22 | $11.77 | $10.93 |
| Total ReturnC,D | 10.53% | (6.01)% | 17.46% | 29.08% | 9.36% | 8.40% |
| Ratios to Average Net AssetsE,F | ||||||
| Expenses before reductions | .45%G | .45% | .45% | .45% | .45% | .45% |
| Expenses net of fee waivers, if any | .45%G | .45% | .45% | .45% | .45% | .45% |
| Expenses net of all reductions | .45%G | .45% | .45% | .45% | .45% | .45% |
| Net investment income (loss) | 1.49%G | 1.38% | 1.37% | 1.41% | 1.80% | 1.30% |
| Supplemental Data | ||||||
| Net assets, end of period (000 omitted) | $672,402 | $449,088 | $404,087 | $248,855 | $171,392 | $141,826 |
| Portfolio turnover rateH | 92%G | 89% | 69% | 83% | 87% | 77% |
A For the year ended February 29.
B Calculated based on average shares outstanding during the period.
C Total returns for periods of less than one year are not annualized.
D Total returns would have been lower if certain expenses had not been reduced during the applicable periods shown.
E Fees and expenses of any underlying Fidelity Central Funds are not included in the Fund's expense ratio. The Fund indirectly bears its proportionate share of the expenses of any underlying Fidelity Central Funds.
F Expense ratios reflect operating expenses of the Fund. Expenses before reductions do not reflect amounts reimbursed by the investment adviser or reductions from expense offset arrangements and do not represent the amount paid by the Fund during periods when reimbursements or reductions occur. Expenses net of fee waivers reflect expenses after reimbursement by the investment adviser but prior to reductions from expense offset arrangements. Expenses net of all reductions represent the net expenses paid by the Fund.
G Annualized
H Amount does not include the portfolio activity of any underlying Fidelity Central Funds.
See accompanying notes which are an integral part of the financial statements.
Fidelity® Large Cap Value Enhanced Index Fund
Investment Summary (Unaudited)
Top Ten Stocks as of August 31, 2016
| % of fund's net assets | % of fund's net assets 6 months ago | |
| Exxon Mobil Corp. | 3.7 | 3.9 |
| Johnson & Johnson | 3.0 | 3.2 |
| JPMorgan Chase & Co. | 2.8 | 2.7 |
| Wells Fargo & Co. | 2.7 | 2.6 |
| Procter & Gamble Co. | 2.6 | 2.5 |
| Pfizer, Inc. | 2.3 | 1.8 |
| Berkshire Hathaway, Inc. Class B | 2.2 | 2.7 |
| Merck & Co., Inc. | 2.1 | 1.8 |
| AT&T, Inc. | 2.1 | 2.4 |
| Bank of America Corp. | 2.1 | 1.9 |
| 25.6 |
Market Sectors as of August 31, 2016
| % of fund's net assets | % of fund's net assets 6 months ago | |
| Financials | 26.8 | 26.3 |
| Health Care | 13.2 | 13.7 |
| Information Technology | 11.8 | 12.8 |
| Energy | 11.1 | 11.3 |
| Consumer Staples | 8.6 | 8.6 |
| Industrials | 7.7 | 8.4 |
| Consumer Discretionary | 5.7 | 7.0 |
| Utilities | 5.2 | 5.1 |
| Materials | 4.5 | 2.0 |
| Telecommunication Services | 4.2 | 3.8 |
Asset Allocation (% of fund's net assets)
| As of August 31, 2016* | ||
| Stocks and Equity Futures | 100.0% | |

* Foreign investments - 4.7%
| As of February 29, 2016* | ||
| Stocks and Equity Futures | 99.9% | |
| Short-Term Investments and Net Other Assets (Liabilities) | 0.1% | |

* Foreign investments - 4.7%
Fidelity® Large Cap Value Enhanced Index Fund
Investments August 31, 2016 (Unaudited)
Showing Percentage of Net Assets
| Common Stocks - 98.8% | |||
| Shares | Value | ||
| CONSUMER DISCRETIONARY - 5.7% | |||
| Auto Components - 1.0% | |||
| Gentex Corp. (a) | 614,493 | $10,931,830 | |
| Johnson Controls, Inc. | 40,310 | 1,768,803 | |
| Lear Corp. | 43,367 | 5,043,148 | |
| Tenneco, Inc. (b) | 52,056 | 2,906,286 | |
| Visteon Corp. | 2,555 | 180,639 | |
| 20,830,706 | |||
| Automobiles - 1.6% | |||
| Ford Motor Co. | 1,521,668 | 19,173,017 | |
| General Motors Co. | 399,749 | 12,759,988 | |
| 31,933,005 | |||
| Hotels, Restaurants & Leisure - 0.5% | |||
| Carnival Corp. unit | 186,534 | 8,916,325 | |
| International Game Technology PLC | 18,881 | 431,053 | |
| 9,347,378 | |||
| Household Durables - 0.1% | |||
| Garmin Ltd. (a) | 30,429 | 1,493,455 | |
| Whirlpool Corp. | 3,306 | 590,584 | |
| 2,084,039 | |||
| Leisure Products - 0.3% | |||
| Brunswick Corp. | 119,965 | 5,517,190 | |
| Media - 0.7% | |||
| Discovery Communications, Inc. Class C (non-vtg.) (b) | 104,530 | 2,594,435 | |
| MSG Network, Inc. Class A (b) | 141,988 | 2,481,950 | |
| Time Warner, Inc. | 113,476 | 8,897,653 | |
| 13,974,038 | |||
| Multiline Retail - 0.5% | |||
| Dillard's, Inc. Class A | 6,035 | 363,548 | |
| Macy's, Inc. | 185,499 | 6,711,354 | |
| Target Corp. | 58,100 | 4,078,039 | |
| 11,152,941 | |||
| Specialty Retail - 1.0% | |||
| American Eagle Outfitters, Inc. (a) | 228,809 | 4,242,119 | |
| Best Buy Co., Inc. | 315,657 | 12,146,481 | |
| Foot Locker, Inc. | 8,620 | 565,817 | |
| Gap, Inc. (a) | 32,751 | 814,517 | |
| Staples, Inc. | 241,929 | 2,070,912 | |
| 19,839,846 | |||
| TOTAL CONSUMER DISCRETIONARY | 114,679,143 | ||
| CONSUMER STAPLES - 8.6% | |||
| Beverages - 0.7% | |||
| PepsiCo, Inc. | 124,774 | 13,319,625 | |
| Food & Staples Retailing - 2.0% | |||
| Wal-Mart Stores, Inc. | 421,111 | 30,084,170 | |
| Walgreens Boots Alliance, Inc. | 135,644 | 10,947,827 | |
| 41,031,997 | |||
| Food Products - 2.1% | |||
| Archer Daniels Midland Co. | 60,949 | 2,667,128 | |
| Bunge Ltd. | 22,905 | 1,463,630 | |
| Campbell Soup Co. | 151,314 | 9,187,786 | |
| General Mills, Inc. | 11,816 | 836,809 | |
| Ingredion, Inc. | 17,047 | 2,334,757 | |
| Mondelez International, Inc. | 51,593 | 2,322,717 | |
| Pilgrim's Pride Corp. | 5,684 | 131,187 | |
| The J.M. Smucker Co. | 67,673 | 9,595,355 | |
| Tyson Foods, Inc. Class A | 172,806 | 13,058,949 | |
| 41,598,318 | |||
| Household Products - 3.0% | |||
| Church & Dwight Co., Inc. | 8,851 | 879,966 | |
| Clorox Co. | 41,669 | 5,460,306 | |
| Colgate-Palmolive Co. | 3,772 | 280,410 | |
| Procter & Gamble Co. | 601,807 | 52,543,769 | |
| 59,164,451 | |||
| Tobacco - 0.8% | |||
| Philip Morris International, Inc. | 158,774 | 15,866,286 | |
| TOTAL CONSUMER STAPLES | 170,980,677 | ||
| ENERGY - 11.1% | |||
| Energy Equipment & Services - 2.0% | |||
| Baker Hughes, Inc. | 84,378 | 4,145,491 | |
| Diamond Offshore Drilling, Inc. (a) | 120,322 | 2,222,347 | |
| Dril-Quip, Inc. (b) | 168,356 | 9,355,543 | |
| FMC Technologies, Inc. (b) | 373,890 | 10,543,698 | |
| Oceaneering International, Inc. (a) | 71,970 | 1,908,644 | |
| Schlumberger Ltd. | 143,498 | 11,336,342 | |
| 39,512,065 | |||
| Oil, Gas & Consumable Fuels - 9.1% | |||
| Antero Resources Corp. (b) | 405,958 | 10,376,286 | |
| Apache Corp. | 122,411 | 6,083,827 | |
| Chesapeake Energy Corp. (a)(b) | 256,149 | 1,626,546 | |
| Chevron Corp. | 250,774 | 25,222,849 | |
| Cimarex Energy Co. | 5,349 | 707,031 | |
| ConocoPhillips Co. | 210,597 | 8,645,007 | |
| EOG Resources, Inc. | 32,718 | 2,895,216 | |
| EQT Corp. | 174,463 | 12,474,105 | |
| Exxon Mobil Corp. | 843,127 | 73,470,087 | |
| Marathon Petroleum Corp. | 76,611 | 3,256,734 | |
| Occidental Petroleum Corp. | 9,448 | 726,079 | |
| ONEOK, Inc. | 104,423 | 4,896,394 | |
| Range Resources Corp. (a) | 60,933 | 2,350,186 | |
| Southwestern Energy Co. (a)(b) | 90,288 | 1,255,906 | |
| Tesoro Corp. | 156,634 | 11,813,336 | |
| Valero Energy Corp. | 282,500 | 15,636,375 | |
| Western Refining, Inc. (a) | 34,645 | 871,668 | |
| World Fuel Services Corp. | 9,273 | 413,390 | |
| 182,721,022 | |||
| TOTAL ENERGY | 222,233,087 | ||
| FINANCIALS - 26.8% | |||
| Banks - 10.3% | |||
| Bank of America Corp. | 2,608,166 | 42,095,799 | |
| CIT Group, Inc. | 87,276 | 3,218,739 | |
| Citigroup, Inc. | 403,610 | 19,268,341 | |
| Citizens Financial Group, Inc. | 51,781 | 1,282,615 | |
| East West Bancorp, Inc. | 61,986 | 2,302,160 | |
| JPMorgan Chase & Co. | 838,761 | 56,616,368 | |
| KeyCorp | 38,460 | 483,058 | |
| PNC Financial Services Group, Inc. | 37,876 | 3,412,628 | |
| Regions Financial Corp. | 544,437 | 5,428,037 | |
| SunTrust Banks, Inc. | 310,180 | 13,669,633 | |
| U.S. Bancorp | 98,272 | 4,338,709 | |
| Wells Fargo & Co. | 1,051,711 | 53,426,919 | |
| 205,543,006 | |||
| Capital Markets - 2.5% | |||
| Charles Schwab Corp. | 44,589 | 1,402,770 | |
| Franklin Resources, Inc. | 176,660 | 6,448,090 | |
| Goldman Sachs Group, Inc. | 132,047 | 22,376,685 | |
| Morgan Stanley | 612,996 | 19,652,652 | |
| 49,880,197 | |||
| Consumer Finance - 2.9% | |||
| American Express Co. | 276,356 | 18,123,426 | |
| Capital One Financial Corp. | 241,719 | 17,307,080 | |
| Discover Financial Services | 235,739 | 14,144,340 | |
| Navient Corp. | 128,456 | 1,847,197 | |
| Santander Consumer U.S.A. Holdings, Inc. (b) | 37,985 | 477,851 | |
| Synchrony Financial | 210,937 | 5,870,377 | |
| 57,770,271 | |||
| Diversified Financial Services - 3.6% | |||
| Berkshire Hathaway, Inc. Class B (b) | 286,680 | 43,142,473 | |
| CME Group, Inc. | 158,400 | 17,162,640 | |
| Leucadia National Corp. | 605,375 | 11,592,931 | |
| 71,898,044 | |||
| Insurance - 2.9% | |||
| AFLAC, Inc. | 214,894 | 15,940,837 | |
| Allied World Assurance Co. Holdings AG | 19,178 | 777,860 | |
| American International Group, Inc. | 25,290 | 1,513,101 | |
| American National Insurance Co. | 4,643 | 542,395 | |
| AmTrust Financial Services, Inc. | 10,190 | 269,933 | |
| Aspen Insurance Holdings Ltd. | 115,312 | 5,299,740 | |
| Assured Guaranty Ltd. | 198,849 | 5,522,037 | |
| Brown & Brown, Inc. | 14,639 | 548,523 | |
| Chubb Ltd. | 8,337 | 1,058,215 | |
| CNA Financial Corp. | 5,928 | 197,462 | |
| Endurance Specialty Holdings Ltd. | 38,966 | 2,565,911 | |
| FNF Group | 39,802 | 1,500,137 | |
| Lincoln National Corp. | 120,748 | 5,799,526 | |
| MetLife, Inc. | 27,036 | 1,173,362 | |
| Old Republic International Corp. | 236,937 | 4,556,299 | |
| Principal Financial Group, Inc. | 53,691 | 2,634,617 | |
| Prudential Financial, Inc. | 63,622 | 5,050,314 | |
| Reinsurance Group of America, Inc. | 4,955 | 531,771 | |
| The Travelers Companies, Inc. | 22,486 | 2,669,313 | |
| 58,151,353 | |||
| Real Estate Investment Trusts - 4.6% | |||
| American Capital Agency Corp. | 52,821 | 1,019,974 | |
| Annaly Capital Management, Inc. (a) | 98,346 | 1,053,286 | |
| Brixmor Property Group, Inc. | 67,846 | 1,937,682 | |
| Care Capital Properties, Inc. | 121,046 | 3,630,170 | |
| Chimera Investment Corp. | 639,331 | 10,542,568 | |
| Colony Starwood Homes (a) | 34,696 | 1,075,576 | |
| Corrections Corp. of America | 44,653 | 711,322 | |
| Duke Realty LP | 40,436 | 1,137,060 | |
| EastGroup Properties, Inc. | 1,423 | 104,420 | |
| Forest City Realty Trust, Inc. | 19,095 | 451,788 | |
| Host Hotels & Resorts, Inc. (a) | 84,264 | 1,501,584 | |
| Kimco Realty Corp. | 34,708 | 1,042,975 | |
| Lamar Advertising Co. Class A (a) | 115,960 | 7,227,787 | |
| Liberty Property Trust (SBI) | 31,408 | 1,294,952 | |
| MFA Financial, Inc. (a) | 1,173,451 | 9,059,042 | |
| Mid-America Apartment Communities, Inc. | 12,925 | 1,214,821 | |
| Omega Healthcare Investors, Inc. (a) | 70,069 | 2,536,498 | |
| PS Business Parks, Inc. | 1,299 | 143,903 | |
| Public Storage | 43,865 | 9,823,128 | |
| RLJ Lodging Trust | 151,937 | 3,546,210 | |
| Senior Housing Properties Trust (SBI) | 11,540 | 257,804 | |
| Simon Property Group, Inc. | 27,346 | 5,892,243 | |
| Starwood Property Trust, Inc. | 70,009 | 1,603,206 | |
| Sunstone Hotel Investors, Inc. (a) | 213,800 | 2,969,682 | |
| The Macerich Co. | 31,585 | 2,586,496 | |
| Two Harbors Investment Corp. | 298,204 | 2,654,016 | |
| Weyerhaeuser Co. | 462,306 | 14,724,446 | |
| WP Carey, Inc. | 14,482 | 965,225 | |
| 90,707,864 | |||
| TOTAL FINANCIALS | 533,950,735 | ||
| HEALTH CARE - 13.2% | |||
| Biotechnology - 1.1% | |||
| Amgen, Inc. | 61,371 | 10,436,752 | |
| Biogen, Inc. (b) | 5,280 | 1,613,726 | |
| United Therapeutics Corp. (b) | 74,370 | 9,093,964 | |
| 21,144,442 | |||
| Health Care Equipment & Supplies - 1.0% | |||
| Abbott Laboratories | 121,973 | 5,125,305 | |
| Baxter International, Inc. | 36,469 | 1,704,196 | |
| Hill-Rom Holdings, Inc. | 4,492 | 266,421 | |
| Medtronic PLC | 145,253 | 12,641,369 | |
| 19,737,291 | |||
| Health Care Providers & Services - 2.3% | |||
| Aetna, Inc. | 76,767 | 8,990,951 | |
| Anthem, Inc. | 112,120 | 14,023,970 | |
| Cigna Corp. | 9,435 | 1,210,133 | |
| Express Scripts Holding Co. (b) | 149,301 | 10,854,183 | |
| McKesson Corp. | 45,895 | 8,473,135 | |
| UnitedHealth Group, Inc. | 10,894 | 1,482,129 | |
| 45,034,501 | |||
| Life Sciences Tools & Services - 0.2% | |||
| Bruker Corp. | 177,869 | 3,977,151 | |
| Pharmaceuticals - 8.6% | |||
| Allergan PLC (b) | 21,573 | 5,059,731 | |
| Bristol-Myers Squibb Co. | 158,656 | 9,105,268 | |
| Johnson & Johnson | 505,312 | 60,303,934 | |
| Mallinckrodt PLC (b) | 14,597 | 1,088,060 | |
| Merck & Co., Inc. | 683,336 | 42,906,667 | |
| Mylan N.V. (b) | 186,119 | 7,884,001 | |
| Pfizer, Inc. | 1,327,015 | 46,180,122 | |
| 172,527,783 | |||
| TOTAL HEALTH CARE | 262,421,168 | ||
| INDUSTRIALS - 7.7% | |||
| Aerospace & Defense - 2.2% | |||
| Curtiss-Wright Corp. | 2,342 | 210,546 | |
| General Dynamics Corp. | 66,549 | 10,130,089 | |
| Huntington Ingalls Industries, Inc. | 45,767 | 7,559,335 | |
| Raytheon Co. | 60,074 | 8,418,170 | |
| Spirit AeroSystems Holdings, Inc. Class A (b) | 237,141 | 10,865,801 | |
| Textron, Inc. | 53,534 | 2,186,864 | |
| United Technologies Corp. | 49,116 | 5,227,416 | |
| 44,598,221 | |||
| Airlines - 0.4% | |||
| Delta Air Lines, Inc. | 89,171 | 3,277,034 | |
| Southwest Airlines Co. | 118,797 | 4,381,233 | |
| 7,658,267 | |||
| Building Products - 0.6% | |||
| A.O. Smith Corp. | 4,669 | 450,465 | |
| Fortune Brands Home & Security, Inc. | 4,398 | 279,537 | |
| Owens Corning | 195,012 | 10,710,059 | |
| 11,440,061 | |||
| Commercial Services & Supplies - 0.1% | |||
| Deluxe Corp. (a) | 39,167 | 2,670,014 | |
| Construction & Engineering - 0.3% | |||
| EMCOR Group, Inc. | 11,426 | 654,253 | |
| Quanta Services, Inc. (b) | 214,050 | 5,507,507 | |
| 6,161,760 | |||
| Electrical Equipment - 0.5% | |||
| Eaton Corp. PLC | 100,857 | 6,711,025 | |
| EnerSys | 13,005 | 915,292 | |
| Fortive Corp. | 36,571 | 1,926,195 | |
| 9,552,512 | |||
| Industrial Conglomerates - 1.9% | |||
| 3M Co. | 21,584 | 3,868,716 | |
| Carlisle Companies, Inc. | 4,162 | 436,427 | |
| General Electric Co. | 1,073,738 | 33,543,575 | |
| 37,848,718 | |||
| Machinery - 1.6% | |||
| Allison Transmission Holdings, Inc. | 33,300 | 923,742 | |
| Cummins, Inc. | 109,958 | 13,811,824 | |
| Ingersoll-Rand PLC | 20,536 | 1,396,243 | |
| PACCAR, Inc. | 36,449 | 2,181,108 | |
| Stanley Black & Decker, Inc. | 33,372 | 4,129,785 | |
| Trinity Industries, Inc. | 292,043 | 7,131,690 | |
| Wabtec Corp. | 17,935 | 1,374,000 | |
| 30,948,392 | |||
| Professional Services - 0.0% | |||
| Manpower, Inc. | 2,314 | 165,358 | |
| Road & Rail - 0.1% | |||
| Union Pacific Corp. | 24,160 | 2,308,005 | |
| TOTAL INDUSTRIALS | 153,351,308 | ||
| INFORMATION TECHNOLOGY - 11.8% | |||
| Communications Equipment - 2.8% | |||
| Brocade Communications Systems, Inc. | 1,105,667 | 9,928,890 | |
| Cisco Systems, Inc. | 1,214,802 | 38,193,375 | |
| Juniper Networks, Inc. | 291,893 | 6,736,890 | |
| 54,859,155 | |||
| Electronic Equipment & Components - 0.6% | |||
| Belden, Inc. | 4,836 | 360,717 | |
| Corning, Inc. | 200,480 | 4,548,891 | |
| Dolby Laboratories, Inc. Class A | 10,282 | 503,201 | |
| Tech Data Corp. (b) | 87,893 | 6,525,176 | |
| 11,937,985 | |||
| Internet Software & Services - 1.0% | |||
| Alphabet, Inc. Class A | 12,347 | 9,752,278 | |
| eBay, Inc. (b) | 342,672 | 11,020,332 | |
| 20,772,610 | |||
| IT Services - 0.6% | |||
| Leidos Holdings, Inc. | 32,973 | 1,335,736 | |
| Xerox Corp. | 1,146,307 | 11,291,124 | |
| 12,626,860 | |||
| Semiconductors & Semiconductor Equipment - 3.9% | |||
| Applied Materials, Inc. | 386,460 | 11,531,966 | |
| Intel Corp. | 1,101,777 | 39,542,777 | |
| Lam Research Corp. (a) | 16,171 | 1,509,078 | |
| Qualcomm, Inc. | 377,093 | 23,783,256 | |
| Texas Instruments, Inc. | 16,415 | 1,141,499 | |
| 77,508,576 | |||
| Software - 0.7% | |||
| Electronic Arts, Inc. (b) | 4,091 | 332,312 | |
| Mentor Graphics Corp. | 8,085 | 194,121 | |
| Microsoft Corp. | 48,278 | 2,774,054 | |
| Oracle Corp. | 241,411 | 9,950,961 | |
| 13,251,448 | |||
| Technology Hardware, Storage & Peripherals - 2.2% | |||
| Apple, Inc. | 136,380 | 14,469,918 | |
| EMC Corp. | 194,596 | 5,641,338 | |
| HP, Inc. | 1,067,760 | 15,343,711 | |
| Seagate Technology LLC (a) | 56,356 | 1,901,451 | |
| Western Digital Corp. | 144,485 | 6,743,115 | |
| 44,099,533 | |||
| TOTAL INFORMATION TECHNOLOGY | 235,056,167 | ||
| MATERIALS - 4.5% | |||
| Chemicals - 2.1% | |||
| Celanese Corp. Class A | 3,700 | 238,391 | |
| Huntsman Corp. | 32,688 | 565,176 | |
| LyondellBasell Industries NV Class A | 166,591 | 13,142,364 | |
| Monsanto Co. | 9,363 | 997,160 | |
| The Dow Chemical Co. | 355,565 | 19,072,507 | |
| Trinseo SA | 26,336 | 1,523,801 | |
| Westlake Chemical Corp. | 134,134 | 6,950,824 | |
| 42,490,223 | |||
| Containers & Packaging - 0.0% | |||
| Avery Dennison Corp. | 3,799 | 294,195 | |
| Metals & Mining - 2.4% | |||
| Newmont Mining Corp. | 344,706 | 13,181,557 | |
| Nucor Corp. | 258,915 | 12,559,967 | |
| Reliance Steel & Aluminum Co. | 142,279 | 10,255,470 | |
| Steel Dynamics, Inc. | 390,728 | 9,619,723 | |
| Worthington Industries, Inc. | 20,817 | 893,049 | |
| 46,509,766 | |||
| TOTAL MATERIALS | 89,294,184 | ||
| TELECOMMUNICATION SERVICES - 4.2% | |||
| Diversified Telecommunication Services - 4.2% | |||
| AT&T, Inc. | 1,040,015 | 42,515,813 | |
| CenturyLink, Inc. | 401,652 | 11,165,926 | |
| Verizon Communications, Inc. | 569,953 | 29,825,640 | |
| 83,507,379 | |||
| UTILITIES - 5.2% | |||
| Electric Utilities - 3.7% | |||
| American Electric Power Co., Inc. | 46,925 | 3,029,947 | |
| Duke Energy Corp. | 251,413 | 20,027,560 | |
| Edison International | 66,303 | 4,821,554 | |
| Entergy Corp. | 43,683 | 3,416,011 | |
| Exelon Corp. | 359,351 | 12,217,934 | |
| FirstEnergy Corp. | 219,008 | 7,168,132 | |
| Great Plains Energy, Inc. | 9,419 | 255,820 | |
| NextEra Energy, Inc. | 67,315 | 8,141,076 | |
| PPL Corp. | 362,389 | 12,603,889 | |
| Southern Co. | 30,363 | 1,558,533 | |
| 73,240,456 | |||
| Gas Utilities - 0.6% | |||
| ONE Gas, Inc. | 1,373 | 84,069 | |
| UGI Corp. | 247,712 | 11,265,942 | |
| 11,350,011 | |||
| Multi-Utilities - 0.9% | |||
| MDU Resources Group, Inc. | 35,786 | 843,476 | |
| NiSource, Inc. | 191,129 | 4,575,628 | |
| Public Service Enterprise Group, Inc. | 318,514 | 13,619,659 | |
| Vectren Corp. | 3,376 | 165,120 | |
| 19,203,883 | |||
| TOTAL UTILITIES | 103,794,350 | ||
| TOTAL COMMON STOCKS | |||
| (Cost $1,822,814,843) | 1,969,268,198 | ||
| Principal Amount | Value | ||
| U.S. Treasury Obligations - 0.1% | |||
| U.S. Treasury Bills, yield at date of purchase 0.32% 9/15/16 (c) | |||
| (Cost $1,999,749) | 2,000,000 | 1,999,832 | |
| Shares | Value | ||
| Money Market Funds - 3.3% | |||
| Dreyfus Cash Management Institutional Shares, 0.30% (d) | 25,219,368 | $25,219,368 | |
| Fidelity Securities Lending Cash Central Fund 0.44% (e)(f) | 39,534,425 | 39,534,425 | |
| TOTAL MONEY MARKET FUNDS | |||
| (Cost $64,753,793) | 64,753,793 | ||
| TOTAL INVESTMENT PORTFOLIO - 102.2% | |||
| (Cost $1,889,568,385) | 2,036,021,823 | ||
| NET OTHER ASSETS (LIABILITIES) - (2.2)% | (43,190,019) | ||
| NET ASSETS - 100% | $1,992,831,804 |
| Futures Contracts | |||
| Expiration Date | Underlying Face Amount at Value | Unrealized Appreciation/(Depreciation) | |
| Purchased | |||
| Equity Index Contracts | |||
| 216 CME E-mini S&P 500 Index Contracts (United States) | Sept. 2016 | 23,430,600 | $1,306,216 |
The face value of futures purchased as a percentage of Net Assets is 1.2%
Legend
(a) Security or a portion of the security is on loan at period end.
(b) Non-income producing
(c) Security or a portion of the security was pledged to cover margin requirements for futures contracts. At period end, the value of securities pledged amounted to $1,256,894.
(d) The rate quoted is the annualized seven-day yield of the fund at period end.
(e) Investment made with cash collateral received from securities on loan.
(f) Affiliated fund that is generally available only to investment companies and other accounts managed by Fidelity Investments. The rate quoted is the annualized seven-day yield of the fund at period end. A complete unaudited listing of the fund's holdings as of its most recent quarter end is available upon request. In addition, each Fidelity Central Fund's financial statements are available on the SEC's website or upon request.
Affiliated Central Funds
Information regarding fiscal year to date income earned by the Fund from investments in Fidelity Central Funds is as follows:
| Fund | Income earned |
| Fidelity Securities Lending Cash Central Fund | $145,792 |
Investment Valuation
The following is a summary of the inputs used, as of August 31, 2016, involving the Fund's assets and liabilities carried at fair value. The inputs or methodology used for valuing securities may not be an indication of the risk associated with investing in those securities. For more information on valuation inputs, and their aggregation into the levels used below, please refer to the Investment Valuation section in the accompanying Notes to Financial Statements.
| Valuation Inputs at Reporting Date: | ||||
| Description | Total | Level 1 | Level 2 | Level 3 |
| Investments in Securities: | ||||
| Equities: | ||||
| Consumer Discretionary | $114,679,143 | $114,679,143 | $-- | $-- |
| Consumer Staples | 170,980,677 | 170,980,677 | -- | -- |
| Energy | 222,233,087 | 222,233,087 | -- | -- |
| Financials | 533,950,735 | 533,950,735 | -- | -- |
| Health Care | 262,421,168 | 262,421,168 | -- | -- |
| Industrials | 153,351,308 | 153,351,308 | -- | -- |
| Information Technology | 235,056,167 | 235,056,167 | -- | -- |
| Materials | 89,294,184 | 89,294,184 | -- | -- |
| Telecommunication Services | 83,507,379 | 83,507,379 | -- | -- |
| Utilities | 103,794,350 | 103,794,350 | -- | -- |
| U.S. Government and Government Agency Obligations | 1,999,832 | -- | 1,999,832 | -- |
| Money Market Funds | 64,753,793 | 64,753,793 | -- | -- |
| Total Investments in Securities: | $2,036,021,823 | $2,034,021,991 | $1,999,832 | $-- |
| Derivative Instruments: | ||||
| Assets | ||||
| Futures Contracts | $1,306,216 | $1,306,216 | $-- | $-- |
| Total Assets | $1,306,216 | $1,306,216 | $-- | $-- |
| Total Derivative Instruments: | $1,306,216 | $1,306,216 | $-- | $-- |
Value of Derivative Instruments
The following table is a summary of the Fund's value of derivative instruments by primary risk exposure as of August 31, 2016. For additional information on derivative instruments, please refer to the Derivative Instruments section in the accompanying Notes to Financial Statements.
| Primary Risk Exposure / Derivative Type | Value | |
| Asset | Liability | |
| Equity Risk | ||
| Futures Contracts(a) | $1,306,216 | $0 |
| Total Equity Risk | 1,306,216 | 0 |
| Total Value of Derivatives | $1,306,216 | $0 |
(a) Reflects gross cumulative appreciation (depreciation) on futures contracts as presented in the Schedule of Investments. In the Statement of Assets and Liabilities, the period end daily variation margin is included in receivable or payable for daily variation margin for derivative instruments, and the net cumulative appreciation (depreciation) is included in net unrealized appreciation (depreciation).
See accompanying notes which are an integral part of the financial statements.
Fidelity® Large Cap Value Enhanced Index Fund
Financial Statements
Statement of Assets and Liabilities
| August 31, 2016 (Unaudited) | ||
| Assets | ||
| Investment in securities, at value (including securities loaned of $38,304,293) — See accompanying schedule: Unaffiliated issuers (cost $1,850,033,960) | $1,996,487,398 | |
| Fidelity Central Funds (cost $39,534,425) | 39,534,425 | |
| Total Investments (cost $1,889,568,385) | $2,036,021,823 | |
| Receivable for investments sold | 14,946,988 | |
| Receivable for fund shares sold | 2,857,954 | |
| Dividends receivable | 5,952,666 | |
| Interest receivable | 5,300 | |
| Distributions receivable from Fidelity Central Funds | 6,639 | |
| Total assets | 2,059,791,370 | |
| Liabilities | ||
| Payable for investments purchased | $16,208,931 | |
| Payable for fund shares redeemed | 10,387,421 | |
| Accrued management fee | 496,896 | |
| Payable for daily variation margin for derivative instruments | 83,445 | |
| Other affiliated payables | 248,448 | |
| Collateral on securities loaned, at value | 39,534,425 | |
| Total liabilities | 66,959,566 | |
| Net Assets | $1,992,831,804 | |
| Net Assets consist of: | ||
| Paid in capital | $1,860,160,103 | |
| Undistributed net investment income | 21,631,052 | |
| Accumulated undistributed net realized gain (loss) on investments | (36,719,005) | |
| Net unrealized appreciation (depreciation) on investments | 147,759,654 | |
| Net Assets, for 175,784,891 shares outstanding | $1,992,831,804 | |
| Net Asset Value, offering price and redemption price per share ($1,992,831,804 ÷ 175,784,891 shares) | $11.34 |
See accompanying notes which are an integral part of the financial statements.
Statement of Operations
| Six months ended August 31, 2016 (Unaudited) | ||
| Investment Income | ||
| Dividends | $25,782,769 | |
| Interest | 32,363 | |
| Income from Fidelity Central Funds (including $145,792 from security lending) | 145,792 | |
| Total income | 25,960,924 | |
| Expenses | ||
| Management fee | $2,762,067 | |
| Transfer agent fees | 1,382,966 | |
| Independent trustees' fees and expenses | 4,101 | |
| Miscellaneous | 2,376 | |
| Total expenses before reductions | 4,151,510 | |
| Expense reductions | (150) | 4,151,360 |
| Net investment income (loss) | 21,809,564 | |
| Realized and Unrealized Gain (Loss) | ||
| Net realized gain (loss) on: | ||
| Investment securities: | ||
| Unaffiliated issuers | 983,327 | |
| Futures contracts | 1,547,793 | |
| Total net realized gain (loss) | 2,531,120 | |
| Change in net unrealized appreciation (depreciation) on: Investment securities | 209,609,455 | |
| Futures contracts | 803,563 | |
| Total change in net unrealized appreciation (depreciation) | 210,413,018 | |
| Net gain (loss) | 212,944,138 | |
| Net increase (decrease) in net assets resulting from operations | $234,753,702 |
See accompanying notes which are an integral part of the financial statements.
Statement of Changes in Net Assets
| Six months ended August 31, 2016 (Unaudited) | Year ended February 29, 2016 | |
| Increase (Decrease) in Net Assets | ||
| Operations | ||
| Net investment income (loss) | $21,809,564 | $29,451,038 |
| Net realized gain (loss) | 2,531,120 | (21,752,912) |
| Change in net unrealized appreciation (depreciation) | 210,413,018 | (148,264,686) |
| Net increase (decrease) in net assets resulting from operations | 234,753,702 | (140,566,560) |
| Distributions to shareholders from net investment income | (3,100,141) | (27,330,027) |
| Distributions to shareholders from net realized gain | – | (19,261,829) |
| Total distributions | (3,100,141) | (46,591,856) |
| Share transactions | ||
| Proceeds from sales of shares | 455,204,656 | 973,573,154 |
| Reinvestment of distributions | 3,018,173 | 45,246,065 |
| Cost of shares redeemed | (265,333,100) | (368,721,721) |
| Net increase (decrease) in net assets resulting from share transactions | 192,889,729 | 650,097,498 |
| Total increase (decrease) in net assets | 424,543,290 | 462,939,082 |
| Net Assets | ||
| Beginning of period | 1,568,288,514 | 1,105,349,432 |
| End of period | $1,992,831,804 | $1,568,288,514 |
| Other Information | ||
| Undistributed net investment income end of period | $21,631,052 | $2,921,629 |
| Shares | ||
| Sold | 42,145,132 | 90,741,261 |
| Issued in reinvestment of distributions | 282,336 | 4,311,676 |
| Redeemed | (24,390,006) | (34,436,496) |
| Net increase (decrease) | 18,037,462 | 60,616,441 |
See accompanying notes which are an integral part of the financial statements.
Financial Highlights — Fidelity Large Cap Value Enhanced Index Fund
| Six months ended (Unaudited) August 31, | Years ended February 28, | |||||
| 2016 | 2016 A | 2015 | 2014 | 2013 | 2012 A | |
| Selected Per–Share Data | ||||||
| Net asset value, beginning of period | $9.94 | $11.38 | $10.21 | $8.89 | $7.78 | $7.92 |
| Income from Investment Operations | ||||||
| Net investment income (loss)B | .13 | .24 | .26C | .20 | .18 | .15 |
| Net realized and unrealized gain (loss) | 1.29 | (1.32) | 1.28 | 1.87 | 1.21 | .10 |
| Total from investment operations | 1.42 | (1.08) | 1.54 | 2.07 | 1.39 | .25 |
| Distributions from net investment income | (.02) | (.21) | (.12) | (.16) | (.15) | (.13) |
| Distributions from net realized gain | – | (.15) | (.24) | (.59) | (.13) | (.26) |
| Total distributions | (.02) | (.36) | (.37)D | (.75) | (.28) | (.39) |
| Net asset value, end of period | $11.34 | $9.94 | $11.38 | $10.21 | $8.89 | $7.78 |
| Total ReturnE,F | 14.29% | (9.69)% | 15.37% | 23.92% | 18.38% | 3.58% |
| Ratios to Average Net AssetsG,H | ||||||
| Expenses before reductions | .45%I | .45% | .45% | .45% | .45% | .45% |
| Expenses net of fee waivers, if any | .45%I | .45% | .45% | .45% | .45% | .45% |
| Expenses net of all reductions | .45%I | .45% | .45% | .45% | .45% | .45% |
| Net investment income (loss) | 2.37%I | 2.20% | 2.34%C | 2.01% | 2.27% | 2.04% |
| Supplemental Data | ||||||
| Net assets, end of period (000 omitted) | $1,992,832 | $1,568,289 | $1,105,349 | $180,081 | $106,740 | $71,354 |
| Portfolio turnover rateJ | 90%I | 88% | 76%K | 85% | 76% | 85% |
A For the year ended February 29.
B Calculated based on average shares outstanding during the period.
C Net Investment income per share reflects a large, non-recurring dividend which amounted to $.04 per share. Excluding this non-recurring dividend, the ratio of net investment income (loss) to average net assets would have been 2.00%.
D Total distributions of $.37 per share is comprised of distributions from net investment income of $.124 and distributions from net realized gain of $.243 per share.
E Total returns for periods of less than one year are not annualized.
F Total returns would have been lower if certain expenses had not been reduced during the applicable periods shown.
G Fees and expenses of any underlying Fidelity Central Funds are not included in the Fund's expense ratio. The Fund indirectly bears its proportionate share of the expenses of any underlying Fidelity Central Funds.
H Expense ratios reflect operating expenses of the Fund. Expenses before reductions do not reflect amounts reimbursed by the investment adviser or reductions from expense offset arrangements and do not represent the amount paid by the Fund during periods when reimbursements or reductions occur. Expenses net of fee waivers reflect expenses after reimbursement by the investment adviser but prior to reductions from expense offset arrangements. Expenses net of all reductions represent the net expenses paid by the Fund.
I Annualized
J Amount does not include the portfolio activity of any underlying Fidelity Central Funds.
K Portfolio turnover rate excludes securities received or delivered in-kind.
See accompanying notes which are an integral part of the financial statements.
Fidelity® Large Cap Core Enhanced Index Fund
Investment Summary (Unaudited)
Top Ten Stocks as of August 31, 2016
| % of fund's net assets | % of fund's net assets 6 months ago | |
| Apple, Inc. | 3.5 | 3.6 |
| Microsoft Corp. | 2.7 | 2.6 |
| Johnson & Johnson | 2.2 | 2.2 |
| Amazon.com, Inc. | 2.1 | 1.7 |
| Facebook, Inc. Class A | 2.1 | 1.6 |
| Exxon Mobil Corp. | 2.0 | 2.1 |
| AT&T, Inc. | 1.8 | 1.8 |
| JPMorgan Chase & Co. | 1.8 | 1.7 |
| Procter & Gamble Co. | 1.7 | 1.7 |
| Wells Fargo & Co. | 1.6 | 1.7 |
| 21.5 |
Market Sectors as of August 31, 2016
| % of fund's net assets | % of fund's net assets 6 months ago | |
| Information Technology | 22.5 | 21.7 |
| Health Care | 16.3 | 16.2 |
| Financials | 14.3 | 13.8 |
| Consumer Discretionary | 11.6 | 14.2 |
| Consumer Staples | 10.8 | 11.3 |
| Industrials | 8.0 | 8.2 |
| Energy | 5.5 | 5.6 |
| Materials | 4.0 | 1.7 |
| Telecommunication Services | 3.8 | 4.5 |
| Utilities | 1.8 | 1.5 |
Asset Allocation (% of fund's net assets)
| As of August 31, 2016* | ||
| Stocks and Equity Futures | 99.9% | |
| Short-Term Investments and Net Other Assets (Liabilities) | 0.1% | |

* Foreign investments - 4.1%
| As of February 29, 2016* | ||
| Stocks and Equity Futures | 99.9% | |
| Short-Term Investments and Net Other Assets (Liabilities) | 0.1% | |

* Foreign investments - 5.0%
Fidelity® Large Cap Core Enhanced Index Fund
Investments August 31, 2016 (Unaudited)
Showing Percentage of Net Assets
| Common Stocks - 98.6% | |||
| Shares | Value | ||
| CONSUMER DISCRETIONARY - 11.6% | |||
| Auto Components - 0.8% | |||
| BorgWarner, Inc. | 846 | $29,094 | |
| Gentex Corp. | 90,013 | 1,601,331 | |
| Johnson Controls, Inc. | 3,900 | 171,132 | |
| Lear Corp. | 18,590 | 2,161,831 | |
| Tenneco, Inc. (a) | 1,440 | 80,395 | |
| 4,043,783 | |||
| Automobiles - 0.9% | |||
| Ford Motor Co. | 285,522 | 3,597,577 | |
| General Motors Co. | 21,115 | 673,991 | |
| 4,271,568 | |||
| Hotels, Restaurants & Leisure - 0.7% | |||
| Carnival Corp. unit | 57,308 | 2,739,322 | |
| International Game Technology PLC | 9,329 | 212,981 | |
| McDonald's Corp. | 5,057 | 584,893 | |
| 3,537,196 | |||
| Household Durables - 0.4% | |||
| Garmin Ltd. (b) | 27,669 | 1,357,995 | |
| Harman International Industries, Inc. | 6,033 | 510,935 | |
| 1,868,930 | |||
| Internet & Catalog Retail - 2.1% | |||
| Amazon.com, Inc. (a) | 13,335 | 10,256,749 | |
| Leisure Products - 0.2% | |||
| Brunswick Corp. | 19,107 | 878,731 | |
| Media - 2.7% | |||
| Comcast Corp. Class A | 74,355 | 4,852,407 | |
| Discovery Communications, Inc. Class C (non-vtg.) (a) | 15,980 | 396,624 | |
| MSG Network, Inc. Class A (a) | 131,856 | 2,304,843 | |
| The Walt Disney Co. | 58,710 | 5,545,747 | |
| 13,099,621 | |||
| Multiline Retail - 0.7% | |||
| Big Lots, Inc. | 9,937 | 490,093 | |
| Dillard's, Inc. Class A | 7,071 | 425,957 | |
| Macy's, Inc. | 29,279 | 1,059,314 | |
| Target Corp. | 24,741 | 1,736,571 | |
| 3,711,935 | |||
| Specialty Retail - 2.6% | |||
| Aarons, Inc. Class A | 1,832 | 44,628 | |
| American Eagle Outfitters, Inc. | 25,800 | 478,332 | |
| Best Buy Co., Inc. | 74,287 | 2,858,564 | |
| GNC Holdings, Inc. | 10,850 | 228,176 | |
| Home Depot, Inc. | 37,972 | 5,092,805 | |
| Lowe's Companies, Inc. | 45,537 | 3,486,313 | |
| Penske Automotive Group, Inc. (b) | 6,926 | 313,748 | |
| Staples, Inc. | 7,887 | 67,513 | |
| 12,570,079 | |||
| Textiles, Apparel & Luxury Goods - 0.5% | |||
| Michael Kors Holdings Ltd. (a)(b) | 54,143 | 2,650,300 | |
| TOTAL CONSUMER DISCRETIONARY | 56,888,892 | ||
| CONSUMER STAPLES - 10.8% | |||
| Beverages - 2.1% | |||
| Dr. Pepper Snapple Group, Inc. | 6,425 | 602,023 | |
| PepsiCo, Inc. | 59,698 | 6,372,762 | |
| The Coca-Cola Co. | 74,500 | 3,235,535 | |
| 10,210,320 | |||
| Food & Staples Retailing - 2.5% | |||
| CVS Health Corp. | 30,168 | 2,817,691 | |
| Sysco Corp. | 5,513 | 285,904 | |
| Wal-Mart Stores, Inc. | 73,316 | 5,237,695 | |
| Walgreens Boots Alliance, Inc. | 45,491 | 3,671,579 | |
| 12,012,869 | |||
| Food Products - 2.1% | |||
| Campbell Soup Co. | 42,519 | 2,581,754 | |
| Fresh Del Monte Produce, Inc. | 7,528 | 437,904 | |
| General Mills, Inc. | 25,231 | 1,786,859 | |
| Ingredion, Inc. | 1,482 | 202,975 | |
| Pilgrim's Pride Corp. | 6,436 | 148,543 | |
| The J.M. Smucker Co. | 14,888 | 2,110,970 | |
| Tyson Foods, Inc. Class A | 42,710 | 3,227,595 | |
| 10,496,600 | |||
| Household Products - 2.2% | |||
| Clorox Co. | 17,855 | 2,339,719 | |
| Colgate-Palmolive Co. | 1,245 | 92,553 | |
| Procter & Gamble Co. | 96,402 | 8,416,859 | |
| Spectrum Brands Holdings, Inc. | 556 | 74,615 | |
| 10,923,746 | |||
| Tobacco - 1.9% | |||
| Altria Group, Inc. | 86,029 | 5,685,657 | |
| Philip Morris International, Inc. | 35,971 | 3,594,582 | |
| 9,280,239 | |||
| TOTAL CONSUMER STAPLES | 52,923,774 | ||
| ENERGY - 5.5% | |||
| Energy Equipment & Services - 0.7% | |||
| Baker Hughes, Inc. | 17,237 | 846,854 | |
| Diamond Offshore Drilling, Inc. (b) | 34,581 | 638,711 | |
| Dril-Quip, Inc. (a) | 15,087 | 838,385 | |
| FMC Technologies, Inc. (a) | 25,692 | 724,514 | |
| Schlumberger Ltd. | 5,815 | 459,385 | |
| 3,507,849 | |||
| Oil, Gas & Consumable Fuels - 4.8% | |||
| Antero Resources Corp. (a) | 90,374 | 2,309,959 | |
| Apache Corp. | 2,637 | 131,059 | |
| Chesapeake Energy Corp. (a)(b) | 39,427 | 250,361 | |
| Chevron Corp. | 23,947 | 2,408,589 | |
| Cimarex Energy Co. | 1,243 | 164,300 | |
| ConocoPhillips Co. | 3,450 | 141,623 | |
| EOG Resources, Inc. | 1,156 | 102,294 | |
| EQT Corp. | 18,649 | 1,333,404 | |
| Exxon Mobil Corp. | 114,012 | 9,935,006 | |
| ONEOK, Inc. | 8,464 | 396,877 | |
| Pioneer Natural Resources Co. | 962 | 172,246 | |
| Tesoro Corp. | 33,009 | 2,489,539 | |
| Valero Energy Corp. | 59,724 | 3,305,723 | |
| 23,140,980 | |||
| TOTAL ENERGY | 26,648,829 | ||
| FINANCIALS - 14.3% | |||
| Banks - 5.1% | |||
| Bank of America Corp. | 430,669 | 6,950,998 | |
| Citigroup, Inc. | 26,256 | 1,253,461 | |
| JPMorgan Chase & Co. | 129,046 | 8,710,605 | |
| Wells Fargo & Co. | 155,386 | 7,893,609 | |
| 24,808,673 | |||
| Capital Markets - 1.5% | |||
| Goldman Sachs Group, Inc. | 23,167 | 3,925,880 | |
| Lazard Ltd. Class A | 2,303 | 85,280 | |
| Morgan Stanley | 94,547 | 3,031,177 | |
| T. Rowe Price Group, Inc. | 7,641 | 531,355 | |
| 7,573,692 | |||
| Consumer Finance - 2.1% | |||
| American Express Co. | 50,387 | 3,304,379 | |
| Capital One Financial Corp. | 50,164 | 3,591,742 | |
| Discover Financial Services | 54,845 | 3,290,700 | |
| 10,186,821 | |||
| Diversified Financial Services - 2.1% | |||
| Berkshire Hathaway, Inc. Class B (a) | 49,112 | 7,390,865 | |
| CME Group, Inc. | 5,402 | 585,307 | |
| Morningstar, Inc. | 29,372 | 2,439,932 | |
| 10,416,104 | |||
| Insurance - 0.7% | |||
| AFLAC, Inc. | 31,065 | 2,304,402 | |
| Lincoln National Corp. | 15,043 | 722,515 | |
| MetLife, Inc. | 7,520 | 326,368 | |
| Prudential Financial, Inc. | 707 | 56,122 | |
| 3,409,407 | |||
| Real Estate Investment Trusts - 2.8% | |||
| Care Capital Properties, Inc. | 3,682 | 110,423 | |
| CBL & Associates Properties, Inc. | 14,179 | 202,334 | |
| Chimera Investment Corp. | 118,999 | 1,962,294 | |
| Coresite Realty Corp. | 1,654 | 129,045 | |
| Equity Lifestyle Properties, Inc. | 6,262 | 485,493 | |
| MFA Financial, Inc. | 211,678 | 1,634,154 | |
| Mid-America Apartment Communities, Inc. | 3,136 | 294,753 | |
| PS Business Parks, Inc. | 2,535 | 280,827 | |
| Public Storage | 14,559 | 3,260,342 | |
| Ryman Hospitality Properties, Inc. | 1,134 | 61,191 | |
| Simon Property Group, Inc. | 8,506 | 1,832,788 | |
| Weyerhaeuser Co. | 100,361 | 3,196,498 | |
| 13,450,142 | |||
| TOTAL FINANCIALS | 69,844,839 | ||
| HEALTH CARE - 16.3% | |||
| Biotechnology - 4.0% | |||
| AbbVie, Inc. | 24,275 | 1,556,028 | |
| Amgen, Inc. | 34,510 | 5,868,771 | |
| Biogen, Inc. (a) | 13,646 | 4,170,627 | |
| Gilead Sciences, Inc. | 65,063 | 5,099,638 | |
| Myriad Genetics, Inc. (a) | 8,108 | 165,079 | |
| United Therapeutics Corp. (a) | 21,016 | 2,569,836 | |
| 19,429,979 | |||
| Health Care Equipment & Supplies - 1.7% | |||
| Abbott Laboratories | 88,826 | 3,732,469 | |
| Baxter International, Inc. | 1,462 | 68,319 | |
| C.R. Bard, Inc. | 1,252 | 276,492 | |
| Edwards Lifesciences Corp. (a) | 19,746 | 2,273,949 | |
| Hologic, Inc. (a) | 33,219 | 1,276,274 | |
| Masimo Corp. (a) | 1,908 | 112,839 | |
| Medtronic PLC | 6,723 | 585,103 | |
| St. Jude Medical, Inc. | 1,094 | 85,244 | |
| 8,410,689 | |||
| Health Care Providers & Services - 3.2% | |||
| Aetna, Inc. | 19,507 | 2,284,660 | |
| Anthem, Inc. | 24,877 | 3,111,615 | |
| Cigna Corp. | 2,548 | 326,806 | |
| Express Scripts Holding Co. (a) | 49,163 | 3,574,150 | |
| Humana, Inc. | 740 | 132,245 | |
| McKesson Corp. | 19,135 | 3,532,704 | |
| UnitedHealth Group, Inc. | 21,417 | 2,913,783 | |
| 15,875,963 | |||
| Life Sciences Tools & Services - 0.1% | |||
| Bruker Corp. | 5,097 | 113,969 | |
| Illumina, Inc. (a) | 921 | 155,041 | |
| 269,010 | |||
| Pharmaceuticals - 7.3% | |||
| Allergan PLC (a) | 6,714 | 1,574,702 | |
| Bristol-Myers Squibb Co. | 83,610 | 4,798,378 | |
| Eli Lilly & Co. | 9,098 | 707,370 | |
| Johnson & Johnson | 91,261 | 10,891,088 | |
| Mallinckrodt PLC (a) | 3,180 | 237,037 | |
| Merck & Co., Inc. | 112,419 | 7,058,789 | |
| Mylan N.V. (a) | 55,107 | 2,334,333 | |
| Pfizer, Inc. | 225,354 | 7,842,319 | |
| 35,444,016 | |||
| TOTAL HEALTH CARE | 79,429,657 | ||
| INDUSTRIALS - 8.0% | |||
| Aerospace & Defense - 2.8% | |||
| General Dynamics Corp. | 18,109 | 2,756,552 | |
| Honeywell International, Inc. | 7,738 | 903,102 | |
| Moog, Inc. Class A (a) | 12,223 | 721,035 | |
| Northrop Grumman Corp. | 2,049 | 434,531 | |
| Raytheon Co. | 14,652 | 2,053,185 | |
| Spirit AeroSystems Holdings, Inc. Class A (a) | 53,590 | 2,455,494 | |
| Textron, Inc. | 360 | 14,706 | |
| The Boeing Co. | 34,424 | 4,456,187 | |
| 13,794,792 | |||
| Airlines - 0.5% | |||
| Delta Air Lines, Inc. | 59,462 | 2,185,229 | |
| Building Products - 0.4% | |||
| A.O. Smith Corp. | 545 | 52,582 | |
| Fortune Brands Home & Security, Inc. | 463 | 29,428 | |
| Owens Corning | 30,433 | 1,671,380 | |
| 1,753,390 | |||
| Construction & Engineering - 0.0% | |||
| EMCOR Group, Inc. | 3,530 | 202,128 | |
| Electrical Equipment - 0.6% | |||
| Eaton Corp. PLC | 37,059 | 2,465,906 | |
| EnerSys | 6,518 | 458,737 | |
| 2,924,643 | |||
| Industrial Conglomerates - 2.1% | |||
| 3M Co. | 29,447 | 5,278,080 | |
| Carlisle Companies, Inc. | 2,024 | 212,237 | |
| General Electric Co. | 158,345 | 4,946,698 | |
| 10,437,015 | |||
| Machinery - 1.5% | |||
| Cummins, Inc. | 25,070 | 3,149,043 | |
| Illinois Tool Works, Inc. | 1,066 | 126,694 | |
| Ingersoll-Rand PLC | 10,065 | 684,319 | |
| PACCAR, Inc. | 26,324 | 1,575,228 | |
| Stanley Black & Decker, Inc. | 6,285 | 777,769 | |
| Trinity Industries, Inc. | 5,804 | 141,734 | |
| Wabtec Corp. | 6,154 | 471,458 | |
| Woodward, Inc. | 5,408 | 339,190 | |
| 7,265,435 | |||
| Professional Services - 0.1% | |||
| Robert Half International, Inc. | 13,006 | 498,520 | |
| TOTAL INDUSTRIALS | 39,061,152 | ||
| INFORMATION TECHNOLOGY - 22.5% | |||
| Communications Equipment - 2.1% | |||
| Brocade Communications Systems, Inc. | 229,076 | 2,057,102 | |
| Cisco Systems, Inc. | 213,230 | 6,703,951 | |
| Juniper Networks, Inc. | 25,260 | 583,001 | |
| Motorola Solutions, Inc. | 11,101 | 854,666 | |
| 10,198,720 | |||
| Electronic Equipment & Components - 0.6% | |||
| Corning, Inc. | 14,151 | 321,086 | |
| Dolby Laboratories, Inc. Class A | 9,010 | 440,949 | |
| Tech Data Corp. (a) | 26,612 | 1,975,675 | |
| 2,737,710 | |||
| Internet Software & Services - 4.7% | |||
| Alphabet, Inc.: | |||
| Class A | 7,549 | 5,962,578 | |
| Class C (a) | 4,191 | 3,214,707 | |
| eBay, Inc. (a) | 111,630 | 3,590,021 | |
| Facebook, Inc. Class A (a) | 79,979 | 10,086,951 | |
| 22,854,257 | |||
| IT Services - 1.8% | |||
| Accenture PLC Class A | 8,449 | 971,635 | |
| Cognizant Technology Solutions Corp. Class A (a) | 32,284 | 1,854,393 | |
| IBM Corp. | 7,287 | 1,157,759 | |
| Leidos Holdings, Inc. | 24,909 | 1,009,064 | |
| MasterCard, Inc. Class A | 474 | 45,803 | |
| Teradata Corp. (a)(b) | 5,476 | 173,753 | |
| The Western Union Co. | 7,520 | 161,830 | |
| Visa, Inc. Class A | 18,889 | 1,528,120 | |
| Xerox Corp. | 207,748 | 2,046,318 | |
| 8,948,675 | |||
| Semiconductors & Semiconductor Equipment - 3.5% | |||
| Applied Materials, Inc. | 108,125 | 3,226,450 | |
| Intel Corp. | 195,797 | 7,027,154 | |
| Lam Research Corp. (b) | 4,722 | 440,657 | |
| Qualcomm, Inc. | 77,824 | 4,908,360 | |
| Texas Instruments, Inc. | 22,672 | 1,576,611 | |
| 17,179,232 | |||
| Software - 5.2% | |||
| Activision Blizzard, Inc. | 18,849 | 779,783 | |
| Adobe Systems, Inc. (a) | 22,009 | 2,251,741 | |
| Citrix Systems, Inc. (a) | 8,065 | 703,268 | |
| Electronic Arts, Inc. (a) | 39,474 | 3,206,473 | |
| Intuit, Inc. | 17,355 | 1,934,215 | |
| Microsoft Corp. | 234,129 | 13,453,052 | |
| Oracle Corp. | 79,722 | 3,286,141 | |
| 25,614,673 | |||
| Technology Hardware, Storage & Peripherals - 4.6% | |||
| Apple, Inc. | 163,207 | 17,316,253 | |
| EMC Corp. | 30,492 | 883,963 | |
| HP, Inc. | 197,779 | 2,842,084 | |
| Seagate Technology LLC (b) | 7,176 | 242,118 | |
| Western Digital Corp. | 30,009 | 1,400,520 | |
| 22,684,938 | |||
| TOTAL INFORMATION TECHNOLOGY | 110,218,205 | ||
| MATERIALS - 4.0% | |||
| Chemicals - 2.3% | |||
| E.I. du Pont de Nemours & Co. | 13,015 | 905,844 | |
| LyondellBasell Industries NV Class A | 40,951 | 3,230,624 | |
| Monsanto Co. | 6,505 | 692,783 | |
| The Dow Chemical Co. | 72,342 | 3,880,425 | |
| Westlake Chemical Corp. | 44,520 | 2,307,026 | |
| 11,016,702 | |||
| Containers & Packaging - 0.0% | |||
| Berry Plastics Group, Inc. (a) | 4,768 | 216,420 | |
| Metals & Mining - 1.7% | |||
| Newmont Mining Corp. | 71,604 | 2,738,137 | |
| Nucor Corp. | 57,578 | 2,793,109 | |
| Reliance Steel & Aluminum Co. | 30,191 | 2,176,167 | |
| Steel Dynamics, Inc. | 26,151 | 643,838 | |
| Worthington Industries, Inc. | 3,300 | 141,570 | |
| 8,492,821 | |||
| TOTAL MATERIALS | 19,725,943 | ||
| TELECOMMUNICATION SERVICES - 3.8% | |||
| Diversified Telecommunication Services - 3.8% | |||
| AT&T, Inc. | 215,904 | 8,826,156 | |
| CenturyLink, Inc. | 71,305 | 1,982,279 | |
| Verizon Communications, Inc. | 150,565 | 7,879,066 | |
| 18,687,501 | |||
| UTILITIES - 1.8% | |||
| Electric Utilities - 1.3% | |||
| Duke Energy Corp. | 27,181 | 2,165,238 | |
| Exelon Corp. | 60,106 | 2,043,604 | |
| NextEra Energy, Inc. | 17,542 | 2,121,529 | |
| 6,330,371 | |||
| Gas Utilities - 0.1% | |||
| UGI Corp. | 9,439 | 429,286 | |
| Multi-Utilities - 0.4% | |||
| Public Service Enterprise Group, Inc. | 51,842 | 2,216,764 | |
| TOTAL UTILITIES | 8,976,421 | ||
| TOTAL COMMON STOCKS | |||
| (Cost $415,598,114) | 482,405,213 | ||
| Principal Amount | Value | ||
| U.S. Treasury Obligations - 0.1% | |||
| U.S. Treasury Bills, yield at date of purchase 0.32% 9/15/16 (c) | |||
| (Cost $499,937) | 500,000 | 499,958 | |
| Shares | Value | ||
| Money Market Funds - 2.4% | |||
| Dreyfus Cash Management Institutional Shares, 0.30% (d) | 5,640,628 | $5,640,628 | |
| Fidelity Securities Lending Cash Central Fund 0.44% (e)(f) | 5,926,250 | 5,926,250 | |
| TOTAL MONEY MARKET FUNDS | |||
| (Cost $11,566,878) | 11,566,878 | ||
| TOTAL INVESTMENT PORTFOLIO - 101.1% | |||
| (Cost $427,664,929) | 494,472,049 | ||
| NET OTHER ASSETS (LIABILITIES) - (1.1)% | (5,322,058) | ||
| NET ASSETS - 100% | $489,149,991 |
| Futures Contracts | |||
| Expiration Date | Underlying Face Amount at Value | Unrealized Appreciation/(Depreciation) | |
| Purchased | |||
| Equity Index Contracts | |||
| 59 CME E-mini S&P 500 Index Contracts (United States) | Sept. 2016 | 6,400,025 | $202,289 |
The face value of futures purchased as a percentage of Net Assets is 1.3%
Legend
(a) Non-income producing
(b) Security or a portion of the security is on loan at period end.
(c) Security or a portion of the security was pledged to cover margin requirements for futures contracts. At period end, the value of securities pledged amounted to $314,974.
(d) The rate quoted is the annualized seven-day yield of the fund at period end.
(e) Investment made with cash collateral received from securities on loan.
(f) Affiliated fund that is generally available only to investment companies and other accounts managed by Fidelity Investments. The rate quoted is the annualized seven-day yield of the fund at period end. A complete unaudited listing of the fund's holdings as of its most recent quarter end is available upon request. In addition, each Fidelity Central Fund's financial statements are available on the SEC's website or upon request.
Affiliated Central Funds
Information regarding fiscal year to date income earned by the Fund from investments in Fidelity Central Funds is as follows:
| Fund | Income earned |
| Fidelity Securities Lending Cash Central Fund | $25,763 |
Investment Valuation
The following is a summary of the inputs used, as of August 31, 2016, involving the Fund's assets and liabilities carried at fair value. The inputs or methodology used for valuing securities may not be an indication of the risk associated with investing in those securities. For more information on valuation inputs, and their aggregation into the levels used below, please refer to the Investment Valuation section in the accompanying Notes to Financial Statements.
| Valuation Inputs at Reporting Date: | ||||
| Description | Total | Level 1 | Level 2 | Level 3 |
| Investments in Securities: | ||||
| Equities: | ||||
| Consumer Discretionary | $56,888,892 | $56,888,892 | $-- | $-- |
| Consumer Staples | 52,923,774 | 52,923,774 | -- | -- |
| Energy | 26,648,829 | 26,648,829 | -- | -- |
| Financials | 69,844,839 | 69,844,839 | -- | -- |
| Health Care | 79,429,657 | 79,429,657 | -- | -- |
| Industrials | 39,061,152 | 39,061,152 | -- | -- |
| Information Technology | 110,218,205 | 110,218,205 | -- | -- |
| Materials | 19,725,943 | 19,725,943 | -- | -- |
| Telecommunication Services | 18,687,501 | 18,687,501 | -- | -- |
| Utilities | 8,976,421 | 8,976,421 | -- | -- |
| U.S. Government and Government Agency Obligations | 499,958 | -- | 499,958 | -- |
| Money Market Funds | 11,566,878 | 11,566,878 | -- | -- |
| Total Investments in Securities: | $494,472,049 | $493,972,091 | $499,958 | $-- |
| Derivative Instruments: | ||||
| Assets | ||||
| Futures Contracts | $202,289 | $202,289 | $-- | $-- |
| Total Assets | $202,289 | $202,289 | $-- | $-- |
| Total Derivative Instruments: | $202,289 | $202,289 | $-- | $-- |
Value of Derivative Instruments
The following table is a summary of the Fund's value of derivative instruments by primary risk exposure as of August 31, 2016. For additional information on derivative instruments, please refer to the Derivative Instruments section in the accompanying Notes to Financial Statements.
| Primary Risk Exposure / Derivative Type | Value | |
| Asset | Liability | |
| Equity Risk | ||
| Futures Contracts(a) | $202,289 | $0 |
| Total Equity Risk | 202,289 | 0 |
| Total Value of Derivatives | $202,289 | $0 |
(a) Reflects gross cumulative appreciation (depreciation) on futures contracts as presented in the Schedule of Investments. In the Statement of Assets and Liabilities, the period end daily variation margin is included in receivable or payable for daily variation margin for derivative instruments, and the net cumulative appreciation (depreciation) is included in net unrealized appreciation (depreciation).
See accompanying notes which are an integral part of the financial statements.
Fidelity® Large Cap Core Enhanced Index Fund
Financial Statements
Statement of Assets and Liabilities
| August 31, 2016 (Unaudited) | ||
| Assets | ||
| Investment in securities, at value (including securities loaned of $5,765,380) — See accompanying schedule: Unaffiliated issuers (cost $421,738,679) | $488,545,799 | |
| Fidelity Central Funds (cost $5,926,250) | 5,926,250 | |
| Total Investments (cost $427,664,929) | $494,472,049 | |
| Receivable for investments sold | 3,850,908 | |
| Receivable for fund shares sold | 337,201 | |
| Dividends receivable | 1,215,472 | |
| Interest receivable | 1,027 | |
| Distributions receivable from Fidelity Central Funds | 2,783 | |
| Total assets | 499,879,440 | |
| Liabilities | ||
| Payable for investments purchased | $4,271,329 | |
| Payable for fund shares redeemed | 331,087 | |
| Accrued management fee | 122,645 | |
| Payable for daily variation margin for derivative instruments | 16,815 | |
| Other affiliated payables | 61,323 | |
| Collateral on securities loaned, at value | 5,926,250 | |
| Total liabilities | 10,729,449 | |
| Net Assets | $489,149,991 | |
| Net Assets consist of: | ||
| Paid in capital | $434,001,487 | |
| Undistributed net investment income | 4,370,102 | |
| Accumulated undistributed net realized gain (loss) on investments | (16,231,007) | |
| Net unrealized appreciation (depreciation) on investments | 67,009,409 | |
| Net Assets, for 40,156,708 shares outstanding | $489,149,991 | |
| Net Asset Value, offering price and redemption price per share ($489,149,991 ÷ 40,156,708 shares) | $12.18 |
See accompanying notes which are an integral part of the financial statements.
Statement of Operations
| Six months ended August 31, 2016 (Unaudited) | ||
| Investment Income | ||
| Dividends | $5,460,972 | |
| Interest | 6,978 | |
| Income from Fidelity Central Funds (including $25,763 from security lending) | 25,763 | |
| Total income | 5,493,713 | |
| Expenses | ||
| Management fee | $700,869 | |
| Transfer agent fees | 350,938 | |
| Independent trustees' fees and expenses | 1,054 | |
| Miscellaneous | 617 | |
| Total expenses before reductions | 1,053,478 | |
| Expense reductions | (66) | 1,053,412 |
| Net investment income (loss) | 4,440,301 | |
| Realized and Unrealized Gain (Loss) | ||
| Net realized gain (loss) on: | ||
| Investment securities: | ||
| Unaffiliated issuers | 554,191 | |
| Futures contracts | 504,439 | |
| Total net realized gain (loss) | 1,058,630 | |
| Change in net unrealized appreciation (depreciation) on: Investment securities | 45,231,482 | |
| Futures contracts | 78,552 | |
| Total change in net unrealized appreciation (depreciation) | 45,310,034 | |
| Net gain (loss) | 46,368,664 | |
| Net increase (decrease) in net assets resulting from operations | $50,808,965 |
See accompanying notes which are an integral part of the financial statements.
Statement of Changes in Net Assets
| Six months ended August 31, 2016 (Unaudited) | Year ended February 29, 2016 | |
| Increase (Decrease) in Net Assets | ||
| Operations | ||
| Net investment income (loss) | $4,440,301 | $7,402,916 |
| Net realized gain (loss) | 1,058,630 | 1,390,162 |
| Change in net unrealized appreciation (depreciation) | 45,310,034 | (41,711,760) |
| Net increase (decrease) in net assets resulting from operations | 50,808,965 | (32,918,682) |
| Distributions to shareholders from net investment income | (673,635) | (6,567,904) |
| Distributions to shareholders from net realized gain | – | (8,297,616) |
| Total distributions | (673,635) | (14,865,520) |
| Share transactions | ||
| Proceeds from sales of shares | 99,903,870 | 207,509,960 |
| Reinvestment of distributions | 637,941 | 14,075,999 |
| Cost of shares redeemed | (73,225,999) | (143,985,591) |
| Net increase (decrease) in net assets resulting from share transactions | 27,315,812 | 77,600,368 |
| Total increase (decrease) in net assets | 77,451,142 | 29,816,166 |
| Net Assets | ||
| Beginning of period | 411,698,849 | 381,882,683 |
| End of period | $489,149,991 | $411,698,849 |
| Other Information | ||
| Undistributed net investment income end of period | $4,370,102 | $603,436 |
| Shares | ||
| Sold | 8,563,780 | 17,838,199 |
| Issued in reinvestment of distributions | 54,618 | 1,214,811 |
| Redeemed | (6,242,482) | (12,333,931) |
| Net increase (decrease) | 2,375,916 | 6,719,079 |
See accompanying notes which are an integral part of the financial statements.
Financial Highlights — Fidelity Large Cap Core Enhanced Index Fund
| Six months ended (Unaudited) August 31, | Years ended February 28, | |||||
| 2016 | 2016 A | 2015 | 2014 | 2013 | 2012 A | |
| Selected Per–Share Data | ||||||
| Net asset value, beginning of period | $10.90 | $12.29 | $11.30 | $10.70 | $9.68 | $9.09 |
| Income from Investment Operations | ||||||
| Net investment income (loss)B | .11 | .22 | .20 | .19 | .21 | .14 |
| Net realized and unrealized gain (loss) | 1.19 | (1.17) | 1.55 | 2.45 | 1.03 | .48 |
| Total from investment operations | 1.30 | (.95) | 1.75 | 2.64 | 1.24 | .62 |
| Distributions from net investment income | (.02) | (.19) | (.16) | (.27) | (.18) | (.03) |
| Distributions from net realized gain | – | (.25) | (.60) | (1.77) | (.05) | – |
| Total distributions | (.02) | (.44) | (.76) | (2.04) | (.22)C | (.03) |
| Net asset value, end of period | $12.18 | $10.90 | $12.29 | $11.30 | $10.70 | $9.68 |
| Total ReturnD,E | 11.91% | (7.94)% | 16.04% | 26.44% | 13.03% | 6.78% |
| Ratios to Average Net AssetsF,G | ||||||
| Expenses before reductions | .45%H | .45% | .45% | .45% | .45% | .45% |
| Expenses net of fee waivers, if any | .45%H | .45% | .45% | .45% | .45% | .45% |
| Expenses net of all reductions | .45%H | .45% | .45% | .45% | .45% | .45% |
| Net investment income (loss) | 1.90%H | 1.86% | 1.69% | 1.67% | 2.08% | 1.53% |
| Supplemental Data | ||||||
| Net assets, end of period (000 omitted) | $489,150 | $411,699 | $381,883 | $441,773 | $208,675 | $262,225 |
| Portfolio turnover rateI | 86%H | 84% | 101% | 125% | 85% | 104% |
A For the year ended February 29.
B Calculated based on average shares outstanding during the period.
C Total distributions of $.22 per share is comprised of distributions from net investment income of $.175 and distributions from net realized gain of $.049 per share.
D Total returns for periods of less than one year are not annualized.
E Total returns would have been lower if certain expenses had not been reduced during the applicable periods shown.
F Fees and expenses of any underlying Fidelity Central Funds are not included in the Fund's expense ratio. The Fund indirectly bears its proportionate share of the expenses of any underlying Fidelity Central Funds.
G Expense ratios reflect operating expenses of the Fund. Expenses before reductions do not reflect amounts reimbursed by the investment adviser or reductions from expense offset arrangements and do not represent the amount paid by the Fund during periods when reimbursements or reductions occur. Expenses net of fee waivers reflect expenses after reimbursement by the investment adviser but prior to reductions from expense offset arrangements. Expenses net of all reductions represent the net expenses paid by the Fund.
H Annualized
I Amount does not include the portfolio activity of any underlying Fidelity Central Funds.
See accompanying notes which are an integral part of the financial statements.
Fidelity® Mid Cap Enhanced Index Fund
Investment Summary (Unaudited)
Top Ten Stocks as of August 31, 2016
| % of fund's net assets | % of fund's net assets 6 months ago | |
| NVIDIA Corp. | 1.0 | 0.8 |
| Edwards Lifesciences Corp. | 0.9 | 0.9 |
| Electronic Arts, Inc. | 0.9 | 0.8 |
| Tyson Foods, Inc. Class A | 0.9 | 0.9 |
| Weyerhaeuser Co. | 0.9 | 0.8 |
| Synchrony Financial | 0.9 | 0.9 |
| PPL Corp. | 0.8 | 0.9 |
| SunTrust Banks, Inc. | 0.8 | 0.8 |
| PACCAR, Inc. | 0.8 | 0.8 |
| Public Service Enterprise Group, Inc. | 0.8 | 0.9 |
| 8.7 |
Market Sectors as of August 31, 2016
| % of fund's net assets | % of fund's net assets 6 months ago | |
| Financials | 21.0 | 22.5 |
| Information Technology | 16.3 | 15.8 |
| Consumer Discretionary | 15.0 | 18.3 |
| Health Care | 11.3 | 10.9 |
| Industrials | 10.8 | 11.7 |
| Consumer Staples | 7.1 | 5.8 |
| Materials | 6.2 | 3.5 |
| Energy | 5.4 | 3.9 |
| Utilities | 5.1 | 5.3 |
| Telecommunication Services | 0.7 | 1.0 |
Asset Allocation (% of fund's net assets)
| As of August 31, 2016* | ||
| Stocks and Equity Futures | 99.9% | |
| Short-Term Investments and Net Other Assets (Liabilities) | 0.1% | |

* Foreign investments - 5.3%
| As of February 29, 2016* | ||
| Stocks and Equity Futures | 99.9% | |
| Short-Term Investments and Net Other Assets (Liabilities) | 0.1% | |

* Foreign investments - 4.9%
Fidelity® Mid Cap Enhanced Index Fund
Investments August 31, 2016 (Unaudited)
Showing Percentage of Net Assets
| Common Stocks - 98.9% | |||
| Shares | Value | ||
| CONSUMER DISCRETIONARY - 15.0% | |||
| Auto Components - 2.7% | |||
| BorgWarner, Inc. | 138,204 | $4,752,836 | |
| Delphi Automotive PLC | 92,962 | 6,568,695 | |
| Gentex Corp. (a) | 334,465 | 5,950,132 | |
| Lear Corp. | 56,146 | 6,529,218 | |
| Tenneco, Inc. (b) | 5,122 | 285,961 | |
| The Goodyear Tire & Rubber Co. | 55,696 | 1,634,678 | |
| Visteon Corp. | 7,695 | 544,037 | |
| 26,265,557 | |||
| Automobiles - 0.6% | |||
| Thor Industries, Inc. (a) | 72,712 | 5,900,579 | |
| Distributors - 0.5% | |||
| Genuine Parts Co. | 11,444 | 1,176,672 | |
| LKQ Corp. (b) | 105,735 | 3,815,976 | |
| 4,992,648 | |||
| Hotels, Restaurants & Leisure - 0.9% | |||
| Brinker International, Inc. | 3,967 | 213,068 | |
| Darden Restaurants, Inc. (a) | 37,559 | 2,315,137 | |
| International Game Technology PLC | 99,566 | 2,273,092 | |
| Starwood Hotels & Resorts Worldwide, Inc. | 12,456 | 964,842 | |
| Wendy's Co. | 42,300 | 431,037 | |
| Wyndham Worldwide Corp. (a) | 37,715 | 2,669,845 | |
| 8,867,021 | |||
| Household Durables - 0.7% | |||
| D.R. Horton, Inc. | 17,630 | 565,218 | |
| Garmin Ltd. (a) | 39,198 | 1,923,838 | |
| Harman International Industries, Inc. | 12,154 | 1,029,322 | |
| Leggett & Platt, Inc. | 3,571 | 187,406 | |
| Mohawk Industries, Inc. (b) | 2,450 | 521,311 | |
| Toll Brothers, Inc. (b) | 205 | 6,373 | |
| Whirlpool Corp. | 16,644 | 2,973,284 | |
| 7,206,752 | |||
| Internet & Catalog Retail - 0.4% | |||
| Liberty Interactive Corp. QVC Group Series A (b) | 184,131 | 3,890,688 | |
| Leisure Products - 1.1% | |||
| Brunswick Corp. | 114,312 | 5,257,209 | |
| Hasbro, Inc. | 14,023 | 1,146,240 | |
| Polaris Industries, Inc. (a) | 52,379 | 4,538,117 | |
| 10,941,566 | |||
| Media - 2.0% | |||
| Discovery Communications, Inc.: | |||
| Class A (a)(b) | 211,285 | 5,389,880 | |
| Class C (non-vtg.) (b) | 232,108 | 5,760,921 | |
| MSG Network, Inc. Class A (a)(b) | 79,619 | 1,391,740 | |
| Omnicom Group, Inc. (a) | 16,488 | 1,420,111 | |
| Scripps Networks Interactive, Inc. Class A | 84,798 | 5,373,649 | |
| 19,336,301 | |||
| Multiline Retail - 1.3% | |||
| Dillard's, Inc. Class A | 18,319 | 1,103,537 | |
| Dollar General Corp. | 76,429 | 5,610,653 | |
| Kohl's Corp. | 2,991 | 132,741 | |
| Macy's, Inc. | 145,173 | 5,252,359 | |
| Target Corp. | 7,196 | 505,087 | |
| 12,604,377 | |||
| Specialty Retail - 3.8% | |||
| American Eagle Outfitters, Inc. | 53,965 | 1,000,511 | |
| Bed Bath & Beyond, Inc. | 97,323 | 4,512,868 | |
| Best Buy Co., Inc. | 179,264 | 6,898,079 | |
| Foot Locker, Inc. | 99,829 | 6,552,776 | |
| Gap, Inc. (a) | 234,434 | 5,830,374 | |
| Murphy U.S.A., Inc. (b) | 444 | 32,465 | |
| Penske Automotive Group, Inc. (a) | 29,752 | 1,347,766 | |
| Ross Stores, Inc. | 50,534 | 3,145,236 | |
| Staples, Inc. | 627,402 | 5,370,561 | |
| Urban Outfitters, Inc. (b) | 11,337 | 406,431 | |
| Williams-Sonoma, Inc. (a) | 38,765 | 2,040,590 | |
| 37,137,657 | |||
| Textiles, Apparel & Luxury Goods - 1.0% | |||
| Michael Kors Holdings Ltd. (a)(b) | 126,048 | 6,170,050 | |
| PVH Corp. | 36,073 | 3,887,226 | |
| 10,057,276 | |||
| TOTAL CONSUMER DISCRETIONARY | 147,200,422 | ||
| CONSUMER STAPLES - 7.1% | |||
| Beverages - 0.8% | |||
| Dr. Pepper Snapple Group, Inc. | 81,450 | 7,631,865 | |
| Food & Staples Retailing - 0.4% | |||
| Rite Aid Corp. (b) | 26,991 | 203,242 | |
| Sysco Corp. | 69,574 | 3,608,108 | |
| 3,811,350 | |||
| Food Products - 4.5% | |||
| Bunge Ltd. | 100,387 | 6,414,729 | |
| Campbell Soup Co. | 102,781 | 6,240,862 | |
| ConAgra Foods, Inc. | 30,357 | 1,414,940 | |
| Hormel Foods Corp. (a) | 43,145 | 1,650,728 | |
| Ingredion, Inc. | 45,452 | 6,225,106 | |
| Mead Johnson Nutrition Co. Class A | 5,141 | 437,345 | |
| Pilgrim's Pride Corp. (a) | 191,122 | 4,411,096 | |
| Post Holdings, Inc. (b) | 1,743 | 147,772 | |
| The Hershey Co. | 7,672 | 766,356 | |
| The J.M. Smucker Co. | 49,297 | 6,989,822 | |
| Tyson Foods, Inc. Class A | 116,781 | 8,825,140 | |
| WhiteWave Foods Co. (b) | 10,161 | 563,224 | |
| 44,087,120 | |||
| Household Products - 1.4% | |||
| Church & Dwight Co., Inc. | 56,096 | 5,577,064 | |
| Clorox Co. | 57,689 | 7,559,567 | |
| Energizer Holdings, Inc. | 7,611 | 376,136 | |
| 13,512,767 | |||
| TOTAL CONSUMER STAPLES | 69,043,102 | ||
| ENERGY - 5.4% | |||
| Energy Equipment & Services - 1.5% | |||
| Baker Hughes, Inc. | 4,736 | 232,680 | |
| Diamond Offshore Drilling, Inc. (a) | 85,498 | 1,579,148 | |
| Dril-Quip, Inc. (b) | 93,236 | 5,181,125 | |
| FMC Technologies, Inc. (b) | 176,274 | 4,970,927 | |
| Oceaneering International, Inc. (a) | 116,855 | 3,098,995 | |
| 15,062,875 | |||
| Oil, Gas & Consumable Fuels - 3.9% | |||
| Antero Resources Corp. (b) | 212,349 | 5,427,640 | |
| Cabot Oil & Gas Corp. | 11,277 | 277,753 | |
| Chesapeake Energy Corp. (a)(b) | 281,779 | 1,789,297 | |
| Cimarex Energy Co. | 1,934 | 255,636 | |
| EQT Corp. | 94,111 | 6,728,937 | |
| Laredo Petroleum, Inc. (b) | 25,175 | 309,149 | |
| Marathon Oil Corp. | 5,840 | 87,717 | |
| Noble Energy, Inc. | 6,101 | 210,362 | |
| ONEOK, Inc. (a) | 55,305 | 2,593,251 | |
| Pioneer Natural Resources Co. | 14,185 | 2,539,824 | |
| QEP Resources, Inc. | 96,179 | 1,837,019 | |
| Range Resources Corp. (a) | 67,374 | 2,598,615 | |
| Southwestern Energy Co. (a)(b) | 132,359 | 1,841,114 | |
| Tesoro Corp. | 83,785 | 6,319,065 | |
| Valero Energy Corp. | 65,896 | 3,647,344 | |
| World Fuel Services Corp. | 15,735 | 701,466 | |
| WPX Energy, Inc. (b) | 36,674 | 440,088 | |
| 37,604,277 | |||
| TOTAL ENERGY | 52,667,152 | ||
| FINANCIALS - 21.0% | |||
| Banks - 3.7% | |||
| CIT Group, Inc. | 90,556 | 3,339,705 | |
| Citizens Financial Group, Inc. | 264,799 | 6,559,071 | |
| East West Bancorp, Inc. | 38,778 | 1,440,215 | |
| Fifth Third Bancorp | 309,345 | 6,236,395 | |
| KeyCorp | 401,647 | 5,044,686 | |
| Regions Financial Corp. | 496,942 | 4,954,512 | |
| SunTrust Banks, Inc. | 184,429 | 8,127,786 | |
| TCF Financial Corp. | 11,076 | 162,263 | |
| Zions Bancorporation | 11,239 | 343,801 | |
| 36,208,434 | |||
| Capital Markets - 1.6% | |||
| Affiliated Managers Group, Inc. (a)(b) | 27,145 | 3,855,947 | |
| Ameriprise Financial, Inc. | 1,985 | 200,644 | |
| Federated Investors, Inc. Class B (non-vtg.) | 55,034 | 1,777,598 | |
| Franklin Resources, Inc. | 8,130 | 296,745 | |
| Lazard Ltd. Class A | 22,459 | 831,657 | |
| Legg Mason, Inc. | 31,437 | 1,087,406 | |
| Raymond James Financial, Inc. | 14,169 | 824,211 | |
| State Street Corp. | 2,752 | 193,300 | |
| T. Rowe Price Group, Inc. | 99,458 | 6,916,309 | |
| 15,983,817 | |||
| Consumer Finance - 2.2% | |||
| Ally Financial, Inc. | 45,990 | 921,640 | |
| Capital One Financial Corp. | 52,030 | 3,725,348 | |
| Discover Financial Services | 23,726 | 1,423,560 | |
| Navient Corp. | 404,653 | 5,818,910 | |
| Santander Consumer U.S.A. Holdings, Inc. (b) | 96,286 | 1,211,278 | |
| Synchrony Financial | 306,344 | 8,525,554 | |
| 21,626,290 | |||
| Diversified Financial Services - 1.4% | |||
| CBOE Holdings, Inc. | 62,109 | 4,266,267 | |
| CME Group, Inc. | 2,814 | 304,897 | |
| Leucadia National Corp. | 78,622 | 1,505,611 | |
| Morningstar, Inc. | 41,138 | 3,417,334 | |
| MSCI, Inc. Class A | 47,282 | 4,261,054 | |
| 13,755,163 | |||
| Insurance - 1.7% | |||
| Allied World Assurance Co. Holdings AG | 10,478 | 424,988 | |
| American International Group, Inc. warrants 1/19/21 (b) | 574 | 12,829 | |
| AmTrust Financial Services, Inc. | 11,406 | 302,145 | |
| Aspen Insurance Holdings Ltd. | 41,860 | 1,923,886 | |
| Assured Guaranty Ltd. | 124,378 | 3,453,977 | |
| FNF Group | 29,038 | 1,094,442 | |
| Lincoln National Corp. | 98,013 | 4,707,564 | |
| Old Republic International Corp. | 51,539 | 991,095 | |
| Progressive Corp. | 117,135 | 3,813,916 | |
| 16,724,842 | |||
| Real Estate Investment Trusts - 10.3% | |||
| American Capital Agency Corp. | 29,666 | 572,850 | |
| Annaly Capital Management, Inc. (a) | 248,937 | 2,666,115 | |
| Apple Hospitality (REIT), Inc. | 3,096 | 60,744 | |
| AvalonBay Communities, Inc. | 8,641 | 1,512,261 | |
| Brandywine Realty Trust (SBI) | 7,769 | 125,314 | |
| Brixmor Property Group, Inc. | 205,327 | 5,864,139 | |
| Care Capital Properties, Inc. | 151,351 | 4,539,016 | |
| Chimera Investment Corp. | 323,730 | 5,338,308 | |
| Colony Starwood Homes | 2,037 | 63,147 | |
| Columbia Property Trust, Inc. | 2,121 | 50,013 | |
| Coresite Realty Corp. | 14,752 | 1,150,951 | |
| Corporate Office Properties Trust (SBI) | 8,492 | 242,192 | |
| Corrections Corp. of America (a) | 198,232 | 3,157,836 | |
| CubeSmart | 23,001 | 633,218 | |
| CyrusOne, Inc. | 10,169 | 516,992 | |
| DCT Industrial Trust, Inc. | 16,957 | 825,975 | |
| Duke Realty LP | 25,007 | 703,197 | |
| DuPont Fabros Technology, Inc. | 3,889 | 164,894 | |
| Equity Commonwealth (b) | 3,952 | 123,658 | |
| Equity Lifestyle Properties, Inc. | 74,495 | 5,775,597 | |
| Equity Residential (SBI) | 11,208 | 727,063 | |
| Extra Space Storage, Inc. | 21,194 | 1,707,177 | |
| Forest City Realty Trust, Inc. | 34,591 | 818,423 | |
| Hospitality Properties Trust (SBI) | 173,242 | 5,282,149 | |
| Host Hotels & Resorts, Inc. (a) | 407,913 | 7,269,010 | |
| Kimco Realty Corp. | 79,181 | 2,379,389 | |
| Lamar Advertising Co. Class A (a) | 84,631 | 5,275,050 | |
| Liberty Property Trust (SBI) | 5,600 | 230,888 | |
| Life Storage, Inc. | 4,947 | 445,230 | |
| MFA Financial, Inc. | 706,135 | 5,451,362 | |
| Mid-America Apartment Communities, Inc. (a) | 42,339 | 3,979,443 | |
| National Retail Properties, Inc. (a) | 12,153 | 608,865 | |
| Omega Healthcare Investors, Inc. (a) | 60,839 | 2,202,372 | |
| Piedmont Office Realty Trust, Inc. Class A | 10,888 | 235,290 | |
| Prologis, Inc. | 2,213 | 117,532 | |
| PS Business Parks, Inc. | 1,079 | 119,532 | |
| Public Storage | 21,426 | 4,798,138 | |
| Rayonier, Inc. | 4,006 | 110,285 | |
| Retail Properties America, Inc. | 48,900 | 831,300 | |
| RLJ Lodging Trust | 19,944 | 465,493 | |
| Senior Housing Properties Trust (SBI) | 67,339 | 1,504,353 | |
| Starwood Property Trust, Inc. | 80,136 | 1,835,114 | |
| Store Capital Corp. | 4,620 | 136,891 | |
| Sunstone Hotel Investors, Inc. | 74,949 | 1,041,042 | |
| Tanger Factory Outlet Centers, Inc. | 15,059 | 611,998 | |
| Taubman Centers, Inc. | 16,608 | 1,289,943 | |
| The Macerich Co. | 81,963 | 6,711,950 | |
| Two Harbors Investment Corp. | 61,459 | 546,985 | |
| Welltower, Inc. | 8,153 | 625,743 | |
| Weyerhaeuser Co. | 275,064 | 8,760,788 | |
| WP Carey, Inc. | 2,696 | 179,688 | |
| 100,384,903 | |||
| Real Estate Management & Development - 0.1% | |||
| Jones Lang LaSalle, Inc. | 4,440 | 518,370 | |
| TOTAL FINANCIALS | 205,201,819 | ||
| HEALTH CARE - 11.3% | |||
| Biotechnology - 0.7% | |||
| Medivation, Inc. (b) | 7,438 | 599,205 | |
| United Therapeutics Corp. (a)(b) | 48,448 | 5,924,221 | |
| 6,523,426 | |||
| Health Care Equipment & Supplies - 3.9% | |||
| Abiomed, Inc. (b) | 9,590 | 1,131,045 | |
| Align Technology, Inc. (b) | 8,208 | 762,523 | |
| C.R. Bard, Inc. | 32,335 | 7,140,861 | |
| Edwards Lifesciences Corp. (b) | 78,861 | 9,081,633 | |
| Hill-Rom Holdings, Inc. | 6,571 | 389,726 | |
| Hologic, Inc. (b) | 173,005 | 6,646,852 | |
| Intuitive Surgical, Inc. (b) | 3,673 | 2,521,221 | |
| ResMed, Inc. (a) | 67,467 | 4,499,374 | |
| St. Jude Medical, Inc. | 30,257 | 2,357,625 | |
| The Cooper Companies, Inc. | 11,369 | 2,113,724 | |
| Varian Medical Systems, Inc. (a)(b) | 17,757 | 1,706,980 | |
| 38,351,564 | |||
| Health Care Providers & Services - 3.6% | |||
| Aetna, Inc. | 14,913 | 1,746,611 | |
| AmerisourceBergen Corp. | 70,497 | 6,131,124 | |
| AmSurg Corp. (b) | 5,530 | 359,008 | |
| Anthem, Inc. | 39,142 | 4,895,881 | |
| Cardinal Health, Inc. | 19,626 | 1,563,603 | |
| Express Scripts Holding Co. (b) | 3,241 | 235,621 | |
| Laboratory Corp. of America Holdings (b) | 25,839 | 3,538,134 | |
| McKesson Corp. | 26,047 | 4,808,797 | |
| Molina Healthcare, Inc. (b) | 3,962 | 213,195 | |
| Quest Diagnostics, Inc. | 78,145 | 6,471,969 | |
| Universal Health Services, Inc. Class B | 28,776 | 3,468,371 | |
| VCA, Inc. (b) | 3,253 | 230,345 | |
| Wellcare Health Plans, Inc. (b) | 10,778 | 1,214,681 | |
| 34,877,340 | |||
| Health Care Technology - 0.3% | |||
| Cerner Corp. (b) | 44,085 | 2,845,246 | |
| Life Sciences Tools & Services - 1.9% | |||
| Agilent Technologies, Inc. | 149,258 | 7,012,141 | |
| Bruker Corp. | 175,194 | 3,917,338 | |
| Charles River Laboratories International, Inc. (b) | 27,334 | 2,274,462 | |
| Illumina, Inc. (b) | 12,041 | 2,026,982 | |
| Quintiles Transnational Holdings, Inc. (b) | 50,522 | 3,905,351 | |
| 19,136,274 | |||
| Pharmaceuticals - 0.9% | |||
| Mallinckrodt PLC (b) | 60,187 | 4,486,339 | |
| Mylan N.V. (b) | 111,438 | 4,720,514 | |
| 9,206,853 | |||
| TOTAL HEALTH CARE | 110,940,703 | ||
| INDUSTRIALS - 10.8% | |||
| Aerospace & Defense - 2.4% | |||
| BE Aerospace, Inc. | 64,954 | 3,283,425 | |
| General Dynamics Corp. | 2,141 | 325,903 | |
| Hexcel Corp. | 4,298 | 192,765 | |
| Huntington Ingalls Industries, Inc. | 21,467 | 3,545,704 | |
| Northrop Grumman Corp. | 6,934 | 1,470,493 | |
| Raytheon Co. | 7,396 | 1,036,401 | |
| Rockwell Collins, Inc. | 30,441 | 2,547,607 | |
| Spirit AeroSystems Holdings, Inc. Class A (b) | 130,375 | 5,973,783 | |
| Textron, Inc. | 130,340 | 5,324,389 | |
| 23,700,470 | |||
| Air Freight & Logistics - 0.0% | |||
| C.H. Robinson Worldwide, Inc. | 4,818 | 334,466 | |
| Expeditors International of Washington, Inc. | 1,702 | 86,206 | |
| 420,672 | |||
| Airlines - 0.8% | |||
| Alaska Air Group, Inc. | 52,624 | 3,553,699 | |
| JetBlue Airways Corp. (b) | 159,823 | 2,549,177 | |
| Southwest Airlines Co. | 34,787 | 1,282,945 | |
| 7,385,821 | |||
| Building Products - 0.5% | |||
| A.O. Smith Corp. | 4,669 | 450,465 | |
| Fortune Brands Home & Security, Inc. | 12,498 | 794,373 | |
| Owens Corning | 71,602 | 3,932,382 | |
| 5,177,220 | |||
| Commercial Services & Supplies - 1.1% | |||
| Cintas Corp. | 50,485 | 5,932,492 | |
| KAR Auction Services, Inc. | 76,851 | 3,249,260 | |
| R.R. Donnelley & Sons Co. | 70,904 | 1,212,458 | |
| 10,394,210 | |||
| Construction & Engineering - 0.6% | |||
| Quanta Services, Inc. (b) | 211,145 | 5,432,761 | |
| Electrical Equipment - 0.3% | |||
| Fortive Corp. | 15,284 | 805,008 | |
| Regal Beloit Corp. | 5,461 | 334,923 | |
| Rockwell Automation, Inc. | 19,471 | 2,257,273 | |
| 3,397,204 | |||
| Industrial Conglomerates - 0.1% | |||
| Carlisle Companies, Inc. | 6,650 | 697,319 | |
| Machinery - 3.3% | |||
| Allison Transmission Holdings, Inc. | 163,017 | 4,522,092 | |
| Cummins, Inc. | 15,064 | 1,892,189 | |
| Ingersoll-Rand PLC | 20,970 | 1,425,750 | |
| PACCAR, Inc. | 135,703 | 8,120,468 | |
| Parker Hannifin Corp. | 25,046 | 3,068,886 | |
| Snap-On, Inc. | 2,479 | 380,006 | |
| Stanley Black & Decker, Inc. | 20,169 | 2,495,914 | |
| Toro Co. | 1,600 | 155,440 | |
| Trinity Industries, Inc. | 238,307 | 5,819,457 | |
| Wabtec Corp. (a) | 61,497 | 4,711,285 | |
| 32,591,487 | |||
| Professional Services - 1.4% | |||
| Equifax, Inc. | 40,811 | 5,382,971 | |
| Manpower, Inc. | 41,308 | 2,951,870 | |
| Robert Half International, Inc. | 141,412 | 5,420,322 | |
| 13,755,163 | |||
| Trading Companies & Distributors - 0.3% | |||
| Air Lease Corp. Class A | 29,535 | 867,738 | |
| HD Supply Holdings, Inc. (b) | 22,298 | 805,181 | |
| MSC Industrial Direct Co., Inc. Class A | 9,164 | 669,339 | |
| United Rentals, Inc. (b) | 1,600 | 131,696 | |
| 2,473,954 | |||
| TOTAL INDUSTRIALS | 105,426,281 | ||
| INFORMATION TECHNOLOGY - 16.3% | |||
| Communications Equipment - 2.6% | |||
| Arris International PLC (b) | 30,961 | 869,075 | |
| Brocade Communications Systems, Inc. | 599,457 | 5,383,124 | |
| F5 Networks, Inc. (b) | 51,660 | 6,340,232 | |
| Juniper Networks, Inc. | 267,890 | 6,182,901 | |
| Motorola Solutions, Inc. | 87,557 | 6,741,013 | |
| 25,516,345 | |||
| Electronic Equipment & Components - 0.6% | |||
| Avnet, Inc. | 37,093 | 1,546,036 | |
| CDW Corp. | 2,660 | 118,769 | |
| Corning, Inc. | 93,826 | 2,128,912 | |
| Dolby Laboratories, Inc. Class A | 39,678 | 1,941,841 | |
| 5,735,558 | |||
| Internet Software & Services - 0.8% | |||
| eBay, Inc. (b) | 168,586 | 5,421,726 | |
| LinkedIn Corp. Class A (b) | 11,587 | 2,233,394 | |
| 7,655,120 | |||
| IT Services - 3.9% | |||
| Alliance Data Systems Corp. (b) | 8,906 | 1,821,989 | |
| Amdocs Ltd. | 94,659 | 5,690,899 | |
| Cognizant Technology Solutions Corp. Class A (b) | 29,393 | 1,688,334 | |
| CSRA, Inc. | 61,574 | 1,563,364 | |
| DST Systems, Inc. | 10,013 | 1,216,680 | |
| Fiserv, Inc. (b) | 29,105 | 2,999,270 | |
| Leidos Holdings, Inc. | 89,639 | 3,631,276 | |
| Paychex, Inc. | 99,663 | 6,046,554 | |
| Teradata Corp. (a)(b) | 58,458 | 1,854,872 | |
| The Western Union Co. (a) | 217,263 | 4,675,500 | |
| Total System Services, Inc. | 45,794 | 2,255,355 | |
| Xerox Corp. | 526,187 | 5,182,942 | |
| 38,627,035 | |||
| Semiconductors & Semiconductor Equipment - 2.8% | |||
| Applied Materials, Inc. | 163,093 | 4,866,695 | |
| First Solar, Inc. (a)(b) | 1,686 | 63,765 | |
| KLA-Tencor Corp. | 8,760 | 606,718 | |
| Lam Research Corp. (a) | 79,697 | 7,437,324 | |
| Linear Technology Corp. | 17,120 | 997,069 | |
| NVIDIA Corp. | 165,207 | 10,133,794 | |
| ON Semiconductor Corp. (b) | 18,421 | 198,947 | |
| Skyworks Solutions, Inc. (a) | 25,936 | 1,941,569 | |
| Teradyne, Inc. | 34,178 | 719,789 | |
| Xilinx, Inc. | 11,920 | 646,183 | |
| 27,611,853 | |||
| Software - 4.3% | |||
| CA Technologies, Inc. | 188,077 | 6,377,691 | |
| Cadence Design Systems, Inc. (b) | 96,668 | 2,459,234 | |
| CDK Global, Inc. | 30,070 | 1,743,459 | |
| Citrix Systems, Inc. (b) | 80,916 | 7,055,875 | |
| Electronic Arts, Inc. (b) | 111,028 | 9,018,804 | |
| Intuit, Inc. | 12,629 | 1,407,502 | |
| Red Hat, Inc. (b) | 13,609 | 993,185 | |
| Symantec Corp. | 296,318 | 7,150,153 | |
| Synopsys, Inc. (b) | 104,142 | 6,174,579 | |
| 42,380,482 | |||
| Technology Hardware, Storage & Peripherals - 1.3% | |||
| HP, Inc. | 62,011 | 891,098 | |
| NetApp, Inc. | 139,173 | 4,813,994 | |
| Western Digital Corp. | 143,308 | 6,688,184 | |
| 12,393,276 | |||
| TOTAL INFORMATION TECHNOLOGY | 159,919,669 | ||
| MATERIALS - 6.2% | |||
| Chemicals - 2.4% | |||
| Cabot Corp. | 39,659 | 1,977,398 | |
| Celanese Corp. Class A | 44,786 | 2,885,562 | |
| Eastman Chemical Co. | 76,888 | 5,219,926 | |
| Huntsman Corp. | 74,275 | 1,284,215 | |
| LyondellBasell Industries NV Class A | 63,987 | 5,047,934 | |
| PPG Industries, Inc. | 7,245 | 767,101 | |
| Valspar Corp. | 1,489 | 156,955 | |
| Westlake Chemical Corp. | 109,683 | 5,683,773 | |
| 23,022,864 | |||
| Construction Materials - 0.1% | |||
| Eagle Materials, Inc. | 11,192 | 899,501 | |
| Containers & Packaging - 1.0% | |||
| Avery Dennison Corp. | 41,892 | 3,244,116 | |
| Berry Plastics Group, Inc. (b) | 22,222 | 1,008,657 | |
| Crown Holdings, Inc. (b) | 32,358 | 1,754,774 | |
| Packaging Corp. of America | 53,968 | 4,243,504 | |
| 10,251,051 | |||
| Metals & Mining - 2.7% | |||
| Newmont Mining Corp. | 205,689 | 7,865,547 | |
| Nucor Corp. | 150,009 | 7,276,937 | |
| Reliance Steel & Aluminum Co. | 74,704 | 5,384,664 | |
| Steel Dynamics, Inc. | 225,496 | 5,551,712 | |
| 26,078,860 | |||
| TOTAL MATERIALS | 60,252,276 | ||
| TELECOMMUNICATION SERVICES - 0.7% | |||
| Diversified Telecommunication Services - 0.7% | |||
| CenturyLink, Inc. | 251,473 | 6,990,949 | |
| Wireless Telecommunication Services - 0.0% | |||
| Telephone & Data Systems, Inc. | 4,466 | 124,467 | |
| TOTAL TELECOMMUNICATION SERVICES | 7,115,416 | ||
| UTILITIES - 5.1% | |||
| Electric Utilities - 2.6% | |||
| Edison International | 38,069 | 2,768,378 | |
| Entergy Corp. | 70,954 | 5,548,603 | |
| FirstEnergy Corp. | 203,618 | 6,664,417 | |
| Great Plains Energy, Inc. | 45,247 | 1,228,909 | |
| Hawaiian Electric Industries, Inc. | 2,987 | 89,640 | |
| ITC Holdings Corp. | 2,873 | 129,917 | |
| OGE Energy Corp. | 17,254 | 537,117 | |
| Pinnacle West Capital Corp. | 1,195 | 89,673 | |
| PPL Corp. | 236,601 | 8,228,983 | |
| Westar Energy, Inc. | 5,008 | 275,140 | |
| 25,560,777 | |||
| Gas Utilities - 0.6% | |||
| National Fuel Gas Co. | 1,975 | 112,694 | |
| UGI Corp. | 133,656 | 6,078,675 | |
| 6,191,369 | |||
| Multi-Utilities - 1.4% | |||
| CenterPoint Energy, Inc. | 2,956 | 66,421 | |
| DTE Energy Co. | 11,059 | 1,027,381 | |
| MDU Resources Group, Inc. | 61,684 | 1,453,892 | |
| NiSource, Inc. | 29,076 | 696,079 | |
| Public Service Enterprise Group, Inc. | 185,908 | 7,949,426 | |
| Sempra Energy | 8,747 | 915,199 | |
| Vectren Corp. | 6,801 | 332,637 | |
| WEC Energy Group, Inc. | 15,147 | 907,002 | |
| 13,348,037 | |||
| Water Utilities - 0.5% | |||
| American Water Works Co., Inc. | 60,367 | 4,466,554 | |
| Aqua America, Inc. | 1,784 | 54,251 | |
| 4,520,805 | |||
| TOTAL UTILITIES | 49,620,988 | ||
| TOTAL COMMON STOCKS | |||
| (Cost $899,085,827) | 967,387,828 | ||
| Principal Amount | Value | ||
| U.S. Treasury Obligations - 0.1% | |||
| U.S. Treasury Bills, yield at date of purchase 0.32% 9/15/16 (c) | |||
| (Cost $999,874) | 1,000,000 | 999,916 | |
| Shares | Value | ||
| Money Market Funds - 11.6% | |||
| Dreyfus Cash Management Institutional Shares, 0.30% (d) | 8,041,805 | $8,041,805 | |
| Fidelity Securities Lending Cash Central Fund 0.44% (e)(f) | 104,859,380 | 104,859,380 | |
| TOTAL MONEY MARKET FUNDS | |||
| (Cost $112,901,185) | 112,901,185 | ||
| TOTAL INVESTMENT PORTFOLIO - 110.6% | |||
| (Cost $1,012,986,886) | 1,081,288,929 | ||
| NET OTHER ASSETS (LIABILITIES) - (10.6)% | (103,491,900) | ||
| NET ASSETS - 100% | $977,797,029 |
| Futures Contracts | |||
| Expiration Date | Underlying Face Amount at Value | Unrealized Appreciation/(Depreciation) | |
| Purchased | |||
| Equity Index Contracts | |||
| 63 CME E-mini S&P MidCap 400 Index Contracts (United States) | Sept. 2016 | 9,851,940 | $686,009 |
The face value of futures purchased as a percentage of Net Assets is 1.0%
Legend
(a) Security or a portion of the security is on loan at period end.
(b) Non-income producing
(c) Security or a portion of the security was pledged to cover margin requirements for futures contracts. At period end, the value of securities pledged amounted to $455,962.
(d) The rate quoted is the annualized seven-day yield of the fund at period end.
(e) Investment made with cash collateral received from securities on loan.
(f) Affiliated fund that is generally available only to investment companies and other accounts managed by Fidelity Investments. The rate quoted is the annualized seven-day yield of the fund at period end. A complete unaudited listing of the fund's holdings as of its most recent quarter end is available upon request. In addition, each Fidelity Central Fund's financial statements are available on the SEC's website or upon request.
Affiliated Central Funds
Information regarding fiscal year to date income earned by the Fund from investments in Fidelity Central Funds is as follows:
| Fund | Income earned |
| Fidelity Securities Lending Cash Central Fund | $120,563 |
Investment Valuation
The following is a summary of the inputs used, as of August 31, 2016, involving the Fund's assets and liabilities carried at fair value. The inputs or methodology used for valuing securities may not be an indication of the risk associated with investing in those securities. For more information on valuation inputs, and their aggregation into the levels used below, please refer to the Investment Valuation section in the accompanying Notes to Financial Statements.
| Valuation Inputs at Reporting Date: | ||||
| Description | Total | Level 1 | Level 2 | Level 3 |
| Investments in Securities: | ||||
| Equities: | ||||
| Consumer Discretionary | $147,200,422 | $147,200,422 | $-- | $-- |
| Consumer Staples | 69,043,102 | 69,043,102 | -- | -- |
| Energy | 52,667,152 | 52,667,152 | -- | -- |
| Financials | 205,201,819 | 205,201,819 | -- | -- |
| Health Care | 110,940,703 | 110,940,703 | -- | -- |
| Industrials | 105,426,281 | 105,426,281 | -- | -- |
| Information Technology | 159,919,669 | 159,919,669 | -- | -- |
| Materials | 60,252,276 | 60,252,276 | -- | -- |
| Telecommunication Services | 7,115,416 | 7,115,416 | -- | -- |
| Utilities | 49,620,988 | 49,620,988 | -- | -- |
| U.S. Government and Government Agency Obligations | 999,916 | -- | 999,916 | -- |
| Money Market Funds | 112,901,185 | 112,901,185 | -- | -- |
| Total Investments in Securities: | $1,081,288,929 | $1,080,289,013 | $999,916 | $-- |
| Derivative Instruments: | ||||
| Assets | ||||
| Futures Contracts | $686,009 | $686,009 | $-- | $-- |
| Total Assets | $686,009 | $686,009 | $-- | $-- |
| Total Derivative Instruments: | $686,009 | $686,009 | $-- | $-- |
Value of Derivative Instruments
The following table is a summary of the Fund's value of derivative instruments by primary risk exposure as of August 31, 2016. For additional information on derivative instruments, please refer to the Derivative Instruments section in the accompanying Notes to Financial Statements.
| Primary Risk Exposure / Derivative Type | Value | |
| Asset | Liability | |
| Equity Risk | ||
| Futures Contracts(a) | $686,009 | $0 |
| Total Equity Risk | 686,009 | 0 |
| Total Value of Derivatives | $686,009 | $0 |
(a) Reflects gross cumulative appreciation (depreciation) on futures contracts as presented in the Schedule of Investments. In the Statement of Assets and Liabilities, the period end daily variation margin is included in receivable or payable for daily variation margin for derivative instruments, and the net cumulative appreciation (depreciation) is included in net unrealized appreciation (depreciation).
See accompanying notes which are an integral part of the financial statements.
Fidelity® Mid Cap Enhanced Index Fund
Financial Statements
Statement of Assets and Liabilities
| August 31, 2016 (Unaudited) | ||
| Assets | ||
| Investment in securities, at value (including securities loaned of $101,742,151) — See accompanying schedule: Unaffiliated issuers (cost $908,127,506) | $976,429,549 | |
| Fidelity Central Funds (cost $104,859,380) | 104,859,380 | |
| Total Investments (cost $1,012,986,886) | $1,081,288,929 | |
| Receivable for investments sold | 8,085,565 | |
| Receivable for fund shares sold | 1,339,969 | |
| Dividends receivable | 1,566,063 | |
| Interest receivable | 2,105 | |
| Distributions receivable from Fidelity Central Funds | 21,726 | |
| Total assets | 1,092,304,357 | |
| Liabilities | ||
| Payable for investments purchased | $7,894,770 | |
| Payable for fund shares redeemed | 1,230,501 | |
| Accrued management fee | 365,548 | |
| Payable for daily variation margin for derivative instruments | 35,280 | |
| Other affiliated payables | 121,849 | |
| Collateral on securities loaned, at value | 104,859,380 | |
| Total liabilities | 114,507,328 | |
| Net Assets | $977,797,029 | |
| Net Assets consist of: | ||
| Paid in capital | $926,471,473 | |
| Undistributed net investment income | 7,528,971 | |
| Accumulated undistributed net realized gain (loss) on investments | (25,191,467) | |
| Net unrealized appreciation (depreciation) on investments | 68,988,052 | |
| Net Assets, for 72,413,384 shares outstanding | $977,797,029 | |
| Net Asset Value, offering price and redemption price per share ($977,797,029 ÷ 72,413,384 shares) | $13.50 |
See accompanying notes which are an integral part of the financial statements.
Statement of Operations
| Six months ended August 31, 2016 (Unaudited) | ||
| Investment Income | ||
| Dividends | $10,144,975 | |
| Interest | 18,102 | |
| Income from Fidelity Central Funds (including $120,563 from security lending) | 120,563 | |
| Total income | 10,283,640 | |
| Expenses | ||
| Management fee | $2,063,333 | |
| Transfer agent fees | 688,432 | |
| Independent trustees' fees and expenses | 2,060 | |
| Miscellaneous | 1,204 | |
| Total expenses before reductions | 2,755,029 | |
| Expense reductions | (75) | 2,754,954 |
| Net investment income (loss) | 7,528,686 | |
| Realized and Unrealized Gain (Loss) | ||
| Net realized gain (loss) on: | ||
| Investment securities: | ||
| Unaffiliated issuers | (4,203,154) | |
| Futures contracts | 1,316,756 | |
| Total net realized gain (loss) | (2,886,398) | |
| Change in net unrealized appreciation (depreciation) on: Investment securities | 100,846,039 | |
| Futures contracts | 364,137 | |
| Total change in net unrealized appreciation (depreciation) | 101,210,176 | |
| Net gain (loss) | 98,323,778 | |
| Net increase (decrease) in net assets resulting from operations | $105,852,464 |
See accompanying notes which are an integral part of the financial statements.
Statement of Changes in Net Assets
| Six months ended August 31, 2016 (Unaudited) | Year ended February 29, 2016 | |
| Increase (Decrease) in Net Assets | ||
| Operations | ||
| Net investment income (loss) | $7,528,686 | $10,379,153 |
| Net realized gain (loss) | (2,886,398) | 5,509,202 |
| Change in net unrealized appreciation (depreciation) | 101,210,176 | (109,303,196) |
| Net increase (decrease) in net assets resulting from operations | 105,852,464 | (93,414,841) |
| Distributions to shareholders from net investment income | – | (8,742,049) |
| Distributions to shareholders from net realized gain | – | (30,376,224) |
| Total distributions | – | (39,118,273) |
| Share transactions | ||
| Proceeds from sales of shares | 202,149,048 | 510,890,785 |
| Reinvestment of distributions | – | 37,487,590 |
| Cost of shares redeemed | (135,452,219) | (219,096,797) |
| Net increase (decrease) in net assets resulting from share transactions | 66,696,829 | 329,281,578 |
| Redemption fees | 6,027 | 18,422 |
| Total increase (decrease) in net assets | 172,555,320 | 196,766,886 |
| Net Assets | ||
| Beginning of period | 805,241,709 | 608,474,823 |
| End of period | $977,797,029 | $805,241,709 |
| Other Information | ||
| Undistributed net investment income end of period | $7,528,971 | $285 |
| Shares | ||
| Sold | 15,613,537 | 37,966,163 |
| Issued in reinvestment of distributions | – | 2,951,931 |
| Redeemed | (10,439,922) | (16,655,539) |
| Net increase (decrease) | 5,173,615 | 24,262,555 |
See accompanying notes which are an integral part of the financial statements.
Financial Highlights — Fidelity Mid Cap Enhanced Index Fund
| Six months ended (Unaudited) August 31, | Years ended February 28, | |||||
| 2016 | 2016 A | 2015 | 2014 | 2013 | 2012 A | |
| Selected Per–Share Data | ||||||
| Net asset value, beginning of period | $11.98 | $14.16 | $13.60 | $10.97 | $9.79 | $10.28 |
| Income from Investment Operations | ||||||
| Net investment income (loss)B | .11 | .18 | .15 | .15 | .18 | .10 |
| Net realized and unrealized gain (loss) | 1.41 | (1.70) | 1.73 | 3.17 | 1.30 | .05 |
| Total from investment operations | 1.52 | (1.52) | 1.88 | 3.32 | 1.48 | .15 |
| Distributions from net investment income | – | (.14) | (.10) | (.12) | (.17) | (.07) |
| Distributions from net realized gain | – | (.51) | (1.22) | (.57) | (.13) | (.58) |
| Total distributions | – | (.66)C | (1.32) | (.69) | (.30) | (.64)D |
| Redemption fees added to paid in capitalB,E | – | – | – | – | – | – |
| Net asset value, end of period | $13.50 | $11.98 | $14.16 | $13.60 | $10.97 | $9.79 |
| Total ReturnF,G | 12.69% | (11.02)% | 15.22% | 30.97% | 15.57% | 1.91% |
| Ratios to Average Net AssetsH,I | ||||||
| Expenses before reductions | .60%J | .60% | .60% | .60% | .60% | .60% |
| Expenses net of fee waivers, if any | .60%J | .60% | .60% | .60% | .60% | .60% |
| Expenses net of all reductions | .60%J | .60% | .60% | .60% | .60% | .60% |
| Net investment income (loss) | 1.64%J | 1.34% | 1.08% | 1.24% | 1.80% | 1.03% |
| Supplemental Data | ||||||
| Net assets, end of period (000 omitted) | $977,797 | $805,242 | $608,475 | $271,674 | $128,130 | $79,061 |
| Portfolio turnover rateK | 93%J | 88% | 89% | 128% | 99% | 92% |
A For the year ended February 29.
B Calculated based on average shares outstanding during the period.
C Total distributions of $.66 per share is comprised of distributions from net investment income of $.144 and distributions from net realized gain of $.511 per share.
D Total distributions of $.64 per share is comprised of distributions from net investment income of $.069 and distributions from net realized gain of $.575 per share.
E Amount represents less than $.005 per share.
F Total returns for periods of less than one year are not annualized.
G Total returns would have been lower if certain expenses had not been reduced during the applicable periods shown.
H Fees and expenses of any underlying Fidelity Central Funds are not included in the Fund's expense ratio. The Fund indirectly bears its proportionate share of the expenses of any underlying Fidelity Central Funds.
I Expense ratios reflect operating expenses of the Fund. Expenses before reductions do not reflect amounts reimbursed by the investment adviser or reductions from expense offset arrangements and do not represent the amount paid by the Fund during periods when reimbursements or reductions occur. Expenses net of fee waivers reflect expenses after reimbursement by the investment adviser but prior to reductions from expense offset arrangements. Expenses net of all reductions represent the net expenses paid by the Fund.
J Annualized
K Amount does not include the portfolio activity of any underlying Fidelity Central Funds.
See accompanying notes which are an integral part of the financial statements.
Fidelity® Small Cap Enhanced Index Fund
Investment Summary (Unaudited)
Top Ten Stocks as of August 31, 2016
| % of fund's net assets | % of fund's net assets 6 months ago | |
| Deluxe Corp. | 0.7 | 0.7 |
| SYNNEX Corp. | 0.7 | 0.7 |
| American Eagle Outfitters, Inc. | 0.7 | 0.5 |
| Tenneco, Inc. | 0.7 | 0.7 |
| Masimo Corp. | 0.7 | 0.6 |
| MKS Instruments, Inc. | 0.7 | 0.5 |
| Umpqua Holdings Corp. | 0.7 | 0.6 |
| Curtiss-Wright Corp. | 0.6 | 0.6 |
| Dana Holding Corp. | 0.6 | 0.6 |
| Western Refining, Inc. | 0.6 | 0.5 |
| 6.7 |
Market Sectors as of August 31, 2016
| % of fund's net assets | % of fund's net assets 6 months ago | |
| Financials | 24.0 | 24.3 |
| Information Technology | 16.1 | 19.2 |
| Health Care | 14.8 | 15.5 |
| Consumer Discretionary | 12.5 | 14.2 |
| Industrials | 11.9 | 10.5 |
| Materials | 5.6 | 1.9 |
| Consumer Staples | 4.5 | 5.4 |
| Energy | 3.3 | 2.8 |
| Utilities | 2.4 | 2.7 |
| Telecommunication Services | 1.2 | 1.3 |
Asset Allocation (% of fund's net assets)
| As of August 31, 2016* | ||
| Stocks and Equity Futures | 100.0% | |

* Foreign investments - 4.3%
| As of February 29, 2016* | ||
| Stocks and Equity Futures | 99.9% | |
| Short-Term Investments and Net Other Assets (Liabilities) | 0.1% | |

* Foreign investments - 2.6%
Fidelity® Small Cap Enhanced Index Fund
Investments August 31, 2016 (Unaudited)
Showing Percentage of Net Assets
| Common Stocks - 96.3% | |||
| Shares | Value | ||
| CONSUMER DISCRETIONARY - 12.5% | |||
| Auto Components - 3.5% | |||
| American Axle & Manufacturing Holdings, Inc. (a) | 206,460 | $3,538,724 | |
| Cooper Tire & Rubber Co. | 110,560 | 3,757,934 | |
| Cooper-Standard Holding, Inc. (a) | 37,368 | 3,701,300 | |
| Dana Holding Corp. | 271,485 | 3,914,814 | |
| Drew Industries, Inc. | 10,885 | 1,108,637 | |
| Metaldyne Performance Group, Inc. | 35,535 | 563,940 | |
| Stoneridge, Inc. (a) | 9,455 | 163,855 | |
| Superior Industries International, Inc. | 14,570 | 424,133 | |
| Tenneco, Inc. (a) | 72,243 | 4,033,327 | |
| Tower International, Inc. | 9,146 | 222,248 | |
| 21,428,912 | |||
| Diversified Consumer Services - 0.8% | |||
| Capella Education Co. | 22,769 | 1,341,549 | |
| DeVry, Inc. (b) | 95,417 | 2,198,408 | |
| Grand Canyon Education, Inc. (a) | 3,671 | 152,457 | |
| K12, Inc. (a) | 84,875 | 1,014,256 | |
| 4,706,670 | |||
| Hotels, Restaurants & Leisure - 1.3% | |||
| BJ's Restaurants, Inc. (a) | 2,825 | 112,209 | |
| Bloomin' Brands, Inc. | 77,746 | 1,519,157 | |
| Boyd Gaming Corp. (a) | 8,165 | 159,218 | |
| Eldorado Resorts, Inc. (a) | 4,308 | 60,140 | |
| Interval Leisure Group, Inc. | 20,045 | 348,783 | |
| Isle of Capri Casinos, Inc. (a) | 168,052 | 2,915,702 | |
| Marriott Vacations Worldwide Corp. (b) | 36,504 | 2,814,458 | |
| 7,929,667 | |||
| Household Durables - 1.1% | |||
| Bassett Furniture Industries, Inc. | 9,321 | 230,788 | |
| CSS Industries, Inc. | 849 | 21,624 | |
| Ethan Allen Interiors, Inc. (b) | 23,364 | 781,759 | |
| Flexsteel Industries, Inc. | 47,419 | 2,250,032 | |
| iRobot Corp. (a)(b) | 9,748 | 388,555 | |
| La-Z-Boy, Inc. | 111,742 | 2,980,159 | |
| 6,652,917 | |||
| Leisure Products - 1.4% | |||
| Brunswick Corp. | 43,898 | 2,018,869 | |
| Nautilus, Inc. (a) | 126,547 | 2,947,280 | |
| Smith & Wesson Holding Corp. (a)(b) | 125,424 | 3,530,686 | |
| 8,496,835 | |||
| Media - 0.7% | |||
| A.H. Belo Corp. Class A | 12,118 | 75,738 | |
| Gannett Co., Inc. | 55,962 | 667,627 | |
| Media General, Inc. (a) | 3,255 | 57,516 | |
| Meredith Corp. | 6,097 | 323,385 | |
| MSG Network, Inc. Class A (a) | 51,734 | 904,310 | |
| New Media Investment Group, Inc. | 47,090 | 752,498 | |
| Saga Communications, Inc. Class A | 896 | 36,440 | |
| Sinclair Broadcast Group, Inc. Class A | 56,668 | 1,613,905 | |
| The McClatchy Co. Class A (a) | 6,229 | 102,654 | |
| 4,534,073 | |||
| Multiline Retail - 0.5% | |||
| Big Lots, Inc. (b) | 58,465 | 2,883,494 | |
| Specialty Retail - 2.7% | |||
| American Eagle Outfitters, Inc. (b) | 224,716 | 4,166,235 | |
| Big 5 Sporting Goods Corp. | 92,988 | 1,163,280 | |
| Caleres, Inc. | 87,022 | 2,257,351 | |
| DSW, Inc. Class A | 10,336 | 247,547 | |
| Express, Inc. (a) | 138,671 | 1,640,478 | |
| GNC Holdings, Inc. | 56,749 | 1,193,431 | |
| Group 1 Automotive, Inc. | 15,511 | 920,423 | |
| Office Depot, Inc. | 168,530 | 620,190 | |
| Rent-A-Center, Inc. | 196,537 | 2,401,682 | |
| Shoe Carnival, Inc. (b) | 42,826 | 1,270,219 | |
| The Cato Corp. Class A (sub. vtg.) | 9,996 | 342,663 | |
| 16,223,499 | |||
| Textiles, Apparel & Luxury Goods - 0.5% | |||
| Movado Group, Inc. | 88,890 | 2,017,803 | |
| Unifi, Inc. (a) | 41,302 | 1,075,091 | |
| 3,092,894 | |||
| TOTAL CONSUMER DISCRETIONARY | 75,948,961 | ||
| CONSUMER STAPLES - 4.5% | |||
| Beverages - 0.0% | |||
| National Beverage Corp. (a) | 5,795 | 288,185 | |
| Food & Staples Retailing - 1.4% | |||
| Ingles Markets, Inc. Class A | 41,845 | 1,582,996 | |
| SpartanNash Co. | 104,097 | 3,333,186 | |
| United Natural Foods, Inc. (a) | 77,136 | 3,517,402 | |
| Weis Markets, Inc. | 422 | 21,497 | |
| 8,455,081 | |||
| Food Products - 1.6% | |||
| Dean Foods Co. | 204,941 | 3,527,035 | |
| Fresh Del Monte Produce, Inc. | 34,061 | 1,981,328 | |
| John B. Sanfilippo & Son, Inc. | 1,224 | 62,938 | |
| Lancaster Colony Corp. | 715 | 96,189 | |
| Omega Protein Corp. (a) | 127,398 | 3,211,704 | |
| Seaboard Corp. (a) | 215 | 695,525 | |
| Seneca Foods Corp. Class A (a) | 8,967 | 264,527 | |
| 9,839,246 | |||
| Household Products - 0.5% | |||
| Central Garden & Pet Co. Class A (non-vtg.) (a) | 82,077 | 1,990,367 | |
| WD-40 Co. | 10,604 | 1,254,983 | |
| 3,245,350 | |||
| Personal Products - 0.5% | |||
| Avon Products, Inc. | 28,900 | 164,730 | |
| MediFast, Inc. | 5,865 | 215,656 | |
| Natural Health Trends Corp. (b) | 37,842 | 1,216,242 | |
| Nutraceutical International Corp. (a) | 3,821 | 96,786 | |
| USANA Health Sciences, Inc. (a) | 7,695 | 1,052,214 | |
| 2,745,628 | |||
| Tobacco - 0.5% | |||
| Universal Corp. (b) | 48,328 | 2,907,896 | |
| TOTAL CONSUMER STAPLES | 27,481,386 | ||
| ENERGY - 3.3% | |||
| Energy Equipment & Services - 1.6% | |||
| Archrock, Inc. | 40,384 | 445,032 | |
| Atwood Oceanics, Inc. (b) | 267,127 | 2,110,303 | |
| Dril-Quip, Inc. (a) | 50,116 | 2,784,946 | |
| Gulf Island Fabrication, Inc. | 786 | 6,917 | |
| Matrix Service Co. (a) | 117,970 | 2,181,265 | |
| McDermott International, Inc. (a)(b) | 400,499 | 2,094,610 | |
| Natural Gas Services Group, Inc. (a) | 3,638 | 86,002 | |
| PHI, Inc. (non-vtg.) (a) | 10,193 | 189,896 | |
| 9,898,971 | |||
| Oil, Gas & Consumable Fuels - 1.7% | |||
| Adams Resources & Energy, Inc. | 601 | 22,297 | |
| California Resources Corp. (b) | 51,412 | 510,521 | |
| Denbury Resources, Inc. (b) | 227,967 | 702,138 | |
| DHT Holdings, Inc. | 601,238 | 2,591,336 | |
| Golar LNG Ltd. (b) | 7,102 | 147,935 | |
| Navios Maritime Acquisition Corp. | 17,079 | 24,765 | |
| PDC Energy, Inc. (a) | 13,593 | 902,575 | |
| Renewable Energy Group, Inc. (a)(b) | 21,906 | 196,497 | |
| Rex American Resources Corp. (a)(b) | 13,549 | 1,089,882 | |
| Western Refining, Inc. (b) | 155,414 | 3,910,216 | |
| 10,098,162 | |||
| TOTAL ENERGY | 19,997,133 | ||
| FINANCIALS - 24.0% | |||
| Banks - 6.7% | |||
| Arrow Financial Corp. | 1,149 | 37,251 | |
| Atlantic Capital Bancshares, Inc. (a) | 8,060 | 124,205 | |
| BancFirst Corp. | 15,766 | 1,081,548 | |
| Banco Latinoamericano de Comercio Exterior SA Series E | 25,544 | 737,966 | |
| Bank of the Ozarks, Inc. (b) | 39,756 | 1,557,640 | |
| Banner Corp. | 5,759 | 255,009 | |
| Brookline Bancorp, Inc., Delaware | 12,508 | 149,346 | |
| Cathay General Bancorp | 27,961 | 878,535 | |
| Centerstate Banks of Florida, Inc. | 13,552 | 243,665 | |
| Chemical Financial Corp. | 52,972 | 2,448,896 | |
| Community Trust Bancorp, Inc. | 3,947 | 145,486 | |
| Fidelity Southern Corp. | 23,477 | 421,412 | |
| First Bancorp, North Carolina | 6,665 | 133,633 | |
| First Bancorp, Puerto Rico (a) | 189,201 | 927,085 | |
| First Busey Corp. | 12,041 | 281,157 | |
| First Citizen Bancshares, Inc. | 201 | 57,267 | |
| First Interstate Bancsystem, Inc. | 41,533 | 1,276,724 | |
| First Midwest Bancorp, Inc., Delaware | 37,110 | 726,243 | |
| First NBC Bank Holding Co. (a) | 23,812 | 310,985 | |
| Fulton Financial Corp. | 268,917 | 3,888,540 | |
| Great Southern Bancorp, Inc. | 16,805 | 707,322 | |
| Great Western Bancorp, Inc. | 51,308 | 1,756,786 | |
| Guaranty Bancorp | 20,184 | 373,000 | |
| Heritage Commerce Corp. | 5,031 | 57,806 | |
| Hilltop Holdings, Inc. (a) | 124,447 | 2,817,480 | |
| Huntington Bancshares, Inc. | 48,875 | 489,239 | |
| IBERIABANK Corp. | 22,298 | 1,533,433 | |
| International Bancshares Corp. | 27,571 | 817,480 | |
| Investors Bancorp, Inc. | 137,494 | 1,684,302 | |
| LegacyTexas Financial Group, Inc. | 32,541 | 986,969 | |
| MainSource Financial Group, Inc. | 3,484 | 84,069 | |
| Merchants Bancshares, Inc. | 18,218 | 604,838 | |
| Opus Bank | 24,521 | 856,273 | |
| Peapack-Gladstone Financial Corp. | 4,073 | 81,379 | |
| Preferred Bank, Los Angeles | 4,529 | 158,741 | |
| PrivateBancorp, Inc. | 13,359 | 613,846 | |
| Stonegate Bank | 3,152 | 102,629 | |
| UMB Financial Corp. | 8,852 | 538,202 | |
| Umpqua Holdings Corp. | 243,543 | 3,998,976 | |
| Univest Corp. of Pennsylvania | 4,445 | 103,746 | |
| Washington Trust Bancorp, Inc. | 7,124 | 300,277 | |
| Western Alliance Bancorp. (a) | 63,895 | 2,442,067 | |
| Wintrust Financial Corp. | 69,418 | 3,858,252 | |
| 40,649,705 | |||
| Capital Markets - 2.3% | |||
| Diamond Hill Investment Group, Inc. | 3,606 | 682,796 | |
| Financial Engines, Inc. (b) | 119,894 | 3,833,011 | |
| Gain Capital Holdings, Inc. | 50,189 | 322,715 | |
| GAMCO Investors, Inc. Class A | 2,779 | 85,232 | |
| INTL FCStone, Inc. (a) | 85,344 | 3,074,091 | |
| KCG Holdings, Inc. Class A (a) | 47,826 | 691,086 | |
| Manning & Napier, Inc. Class A | 17,042 | 130,883 | |
| OM Asset Management Ltd. | 22,003 | 297,041 | |
| Oppenheimer Holdings, Inc. Class A (non-vtg.) | 13,278 | 213,377 | |
| Piper Jaffray Companies (a) | 70,115 | 3,111,704 | |
| Vector Capital Corp. rights (a) | 8,300 | 0 | |
| Waddell & Reed Financial, Inc. Class A (b) | 75,414 | 1,402,700 | |
| 13,844,636 | |||
| Consumer Finance - 0.8% | |||
| Enova International, Inc. (a) | 56,056 | 537,577 | |
| LendingClub Corp. (a)(b) | 2,617 | 14,158 | |
| Nelnet, Inc. Class A | 85,604 | 3,030,382 | |
| Regional Management Corp. (a) | 11,839 | 255,959 | |
| World Acceptance Corp. (a)(b) | 19,791 | 952,145 | |
| 4,790,221 | |||
| Diversified Financial Services - 0.1% | |||
| Cotiviti Holdings, Inc. | 4,341 | 144,295 | |
| Marlin Business Services Corp. | 34,086 | 640,817 | |
| 785,112 | |||
| Insurance - 3.0% | |||
| Amerisafe, Inc. | 18,598 | 1,116,066 | |
| eHealth, Inc. (a) | 19,266 | 216,550 | |
| EMC Insurance Group | 4,916 | 136,911 | |
| Employers Holdings, Inc. | 43,210 | 1,316,609 | |
| Federated National Holding Co. | 101,467 | 1,853,802 | |
| Genworth Financial, Inc. Class A (a) | 213,062 | 1,007,783 | |
| HCI Group, Inc. | 25,386 | 807,021 | |
| Heritage Insurance Holdings, Inc. | 98,568 | 1,352,353 | |
| Horace Mann Educators Corp. | 47,226 | 1,726,110 | |
| National General Holdings Corp. | 30,282 | 690,127 | |
| Selective Insurance Group, Inc. | 94,740 | 3,780,126 | |
| United Fire Group, Inc. | 1,844 | 79,679 | |
| United Insurance Holdings Corp. | 106,663 | 1,679,942 | |
| Universal Insurance Holdings, Inc. (b) | 108,347 | 2,684,839 | |
| 18,447,918 | |||
| Real Estate Investment Trusts - 7.7% | |||
| Anworth Mortgage Asset Corp. | 131,330 | 642,204 | |
| Apollo Commercial Real Estate Finance, Inc. | 161,677 | 2,635,335 | |
| Ashford Hospitality Trust, Inc. | 82,738 | 576,684 | |
| Capstead Mortgage Corp. | 268,828 | 2,666,774 | |
| CBL & Associates Properties, Inc. | 78,876 | 1,125,561 | |
| Chesapeake Lodging Trust | 7,737 | 197,139 | |
| Colony Financial, Inc. | 1,887 | 34,853 | |
| Colony Starwood Homes (b) | 22,269 | 690,339 | |
| Coresite Realty Corp. | 47,800 | 3,729,356 | |
| CubeSmart | 106,093 | 2,920,740 | |
| DCT Industrial Trust, Inc. | 7,696 | 374,872 | |
| Education Realty Trust, Inc. | 23,432 | 1,061,704 | |
| Four Corners Property Trust, Inc. | 68,423 | 1,417,040 | |
| Gyrodyne LLC | 340 | 7,222 | |
| InfraReit, Inc. | 61,798 | 1,167,982 | |
| Life Storage, Inc. | 27,769 | 2,499,210 | |
| LTC Properties, Inc. | 12,215 | 634,203 | |
| MFA Financial, Inc. | 413,248 | 3,190,275 | |
| National Health Investors, Inc. | 1,450 | 116,406 | |
| National Storage Affiliates Trust | 51,005 | 1,035,912 | |
| New Residential Investment Corp. | 159,804 | 2,293,187 | |
| PS Business Parks, Inc. | 33,683 | 3,731,403 | |
| Redwood Trust, Inc. | 42,015 | 621,822 | |
| Resource Capital Corp. | 3,248 | 43,101 | |
| RLJ Lodging Trust | 159,060 | 3,712,460 | |
| Ryman Hospitality Properties, Inc. | 53,628 | 2,893,767 | |
| Sabra Health Care REIT, Inc. | 26,594 | 677,615 | |
| Summit Hotel Properties, Inc. | 39,482 | 564,593 | |
| Sunstone Hotel Investors, Inc. | 188,610 | 2,619,793 | |
| The GEO Group, Inc. (b) | 83,938 | 1,682,118 | |
| WP Glimcher, Inc. | 78,560 | 1,079,414 | |
| Xenia Hotels & Resorts, Inc. | 37,393 | 629,698 | |
| 47,272,782 | |||
| Real Estate Management & Development - 0.5% | |||
| Altisource Portfolio Solutions SA (a)(b) | 59,472 | 1,937,598 | |
| HFF, Inc. | 2,956 | 79,250 | |
| Marcus & Millichap, Inc. (a) | 30,279 | 788,768 | |
| RE/MAX Holdings, Inc. | 5,803 | 241,637 | |
| The RMR Group, Inc. | 4,589 | 176,906 | |
| 3,224,159 | |||
| Thrifts & Mortgage Finance - 2.9% | |||
| BofI Holding, Inc. (a)(b) | 158,280 | 3,403,020 | |
| Dime Community Bancshares, Inc. | 55,764 | 984,792 | |
| Essent Group Ltd. (a) | 143,462 | 3,813,220 | |
| EverBank Financial Corp. | 2,372 | 45,519 | |
| First Defiance Financial Corp. | 7,592 | 345,360 | |
| Hingham Institution for Savings | 918 | 119,267 | |
| Northwest Bancshares, Inc. | 227,719 | 3,534,199 | |
| Radian Group, Inc. | 80,354 | 1,101,653 | |
| Walker & Dunlop, Inc. (a) | 75,270 | 1,994,655 | |
| Waterstone Financial, Inc. | 20,098 | 339,656 | |
| WSFS Financial Corp. | 47,172 | 1,834,991 | |
| 17,516,332 | |||
| TOTAL FINANCIALS | 146,530,865 | ||
| HEALTH CARE - 14.8% | |||
| Biotechnology - 3.1% | |||
| Acceleron Pharma, Inc. (a) | 4,137 | 124,151 | |
| Achillion Pharmaceuticals, Inc. (a) | 25,271 | 208,738 | |
| Acorda Therapeutics, Inc. (a) | 26,736 | 643,803 | |
| Aduro Biotech, Inc. (a)(b) | 10,012 | 141,069 | |
| Alder Biopharmaceuticals, Inc. (a)(b) | 6,808 | 224,460 | |
| AMAG Pharmaceuticals, Inc. (a)(b) | 26,452 | 630,351 | |
| Amicus Therapeutics, Inc. (a) | 1,266 | 8,470 | |
| Applied Genetic Technologies Corp. (a) | 24,041 | 307,244 | |
| Aptevo Therapeutics, Inc. (a) | 14,478 | 39,380 | |
| ARIAD Pharmaceuticals, Inc. (a) | 65,165 | 673,806 | |
| Biospecifics Technologies Corp.(a) | 5,892 | 215,588 | |
| bluebird bio, Inc. (a)(b) | 6,818 | 336,400 | |
| Cepheid, Inc. (a) | 32,839 | 1,127,034 | |
| Concert Pharmaceuticals, Inc. (a) | 21,623 | 210,176 | |
| Dyax Corp. rights 12/31/19 (a) | 29,085 | 70,386 | |
| Emergent BioSolutions, Inc. (a)(b) | 22,063 | 587,979 | |
| Enanta Pharmaceuticals, Inc. (a)(b) | 19,281 | 423,989 | |
| Exact Sciences Corp. (a)(b) | 24,304 | 448,895 | |
| Exelixis, Inc. (a) | 116,784 | 1,302,142 | |
| FibroGen, Inc. (a) | 31,650 | 547,862 | |
| Five Prime Therapeutics, Inc. (a) | 15,954 | 701,657 | |
| Genomic Health, Inc. (a) | 17,201 | 455,310 | |
| Halozyme Therapeutics, Inc. (a)(b) | 7,046 | 69,051 | |
| Ironwood Pharmaceuticals, Inc. Class A (a) | 25,276 | 337,182 | |
| Kite Pharma, Inc. (a)(b) | 8,265 | 476,229 | |
| Lexicon Pharmaceuticals, Inc. (a)(b) | 37,096 | 514,892 | |
| Ligand Pharmaceuticals, Inc. Class B (a)(b) | 9,283 | 959,027 | |
| Loxo Oncology, Inc. (a)(b) | 8,332 | 229,463 | |
| Macrogenics, Inc. (a) | 1,062 | 31,658 | |
| MiMedx Group, Inc. (a)(b) | 74,914 | 542,377 | |
| Myriad Genetics, Inc. (a) | 37,030 | 753,931 | |
| Neurocrine Biosciences, Inc. (a) | 7,696 | 372,948 | |
| Novavax, Inc. (a)(b) | 50,573 | 345,919 | |
| Ophthotech Corp. (a)(b) | 7,615 | 402,148 | |
| PDL BioPharma, Inc. | 162,351 | 472,441 | |
| Pfenex, Inc. (a) | 12,814 | 92,645 | |
| Portola Pharmaceuticals, Inc. (a)(b) | 6,513 | 132,605 | |
| Prothena Corp. PLC (a)(b) | 5,898 | 294,782 | |
| Puma Biotechnology, Inc. (a)(b) | 3,293 | 194,781 | |
| Repligen Corp. (a)(b) | 15,012 | 465,222 | |
| Retrophin, Inc. (a)(b) | 30,617 | 490,484 | |
| Rigel Pharmaceuticals, Inc. (a) | 113,792 | 383,479 | |
| Sage Therapeutics, Inc. (a) | 1,363 | 50,663 | |
| Sarepta Therapeutics, Inc. (a)(b) | 3,515 | 91,636 | |
| Spark Therapeutics, Inc. (a)(b) | 4,053 | 229,319 | |
| TESARO, Inc. (a)(b) | 6,151 | 520,928 | |
| Ultragenyx Pharmaceutical, Inc. (a) | 7,748 | 510,748 | |
| Vanda Pharmaceuticals, Inc. (a) | 38,492 | 592,007 | |
| Xencor, Inc. (a) | 9,047 | 191,163 | |
| 19,176,618 | |||
| Health Care Equipment & Supplies - 4.4% | |||
| Anika Therapeutics, Inc. (a) | 3,849 | 181,827 | |
| Cantel Medical Corp. | 51,452 | 3,890,286 | |
| Exactech, Inc. (a) | 20,894 | 580,644 | |
| Globus Medical, Inc. (a) | 32,264 | 749,493 | |
| Halyard Health, Inc. (a) | 13,138 | 478,880 | |
| ICU Medical, Inc. (a) | 12,588 | 1,570,605 | |
| Inogen, Inc. (a)(b) | 25,985 | 1,507,650 | |
| Integer Holdings Corp. (a) | 48,709 | 1,178,758 | |
| LivaNova PLC (a)(b) | 47,502 | 2,851,070 | |
| Masimo Corp. (a) | 68,176 | 4,031,929 | |
| Meridian Bioscience, Inc. | 27,234 | 529,701 | |
| Merit Medical Systems, Inc. (a) | 104,574 | 2,534,874 | |
| Natus Medical, Inc. (a) | 49,262 | 1,916,784 | |
| NuVasive, Inc. (a)(b) | 3,440 | 225,217 | |
| NxStage Medical, Inc. (a) | 10,765 | 246,088 | |
| OraSure Technologies, Inc. (a) | 16,968 | 145,416 | |
| Orthofix International NV (a) | 18,053 | 814,371 | |
| Steris PLC | 5,345 | 377,785 | |
| SurModics, Inc. (a) | 33,107 | 942,556 | |
| Vascular Solutions, Inc. (a) | 6,240 | 300,581 | |
| West Pharmaceutical Services, Inc. | 19,731 | 1,614,588 | |
| 26,669,103 | |||
| Health Care Providers & Services - 4.5% | |||
| Air Methods Corp. (a)(b) | 7,283 | 256,216 | |
| Alliance Healthcare Services, Inc. (a) | 60,188 | 379,184 | |
| Chemed Corp. | 25,684 | 3,465,542 | |
| Community Health Systems, Inc. (a)(b) | 174,211 | 1,860,573 | |
| Corvel Corp. (a) | 27,856 | 1,070,785 | |
| Healthways, Inc. (a) | 31,697 | 792,742 | |
| Magellan Health Services, Inc. (a) | 60,369 | 3,448,277 | |
| Molina Healthcare, Inc. (a)(b) | 67,809 | 3,648,802 | |
| National Healthcare Corp. | 12,211 | 793,471 | |
| Owens & Minor, Inc. | 31,917 | 1,096,987 | |
| PharMerica Corp. (a) | 104,852 | 2,648,562 | |
| Select Medical Holdings Corp. (a)(b) | 76,853 | 913,014 | |
| Surgical Care Affiliates, Inc. (a) | 63,047 | 2,600,689 | |
| Team Health Holdings, Inc. (a) | 9,022 | 300,433 | |
| Triple-S Management Corp. (a)(b) | 68,490 | 1,499,246 | |
| Wellcare Health Plans, Inc. (a) | 26,443 | 2,980,126 | |
| 27,754,649 | |||
| Health Care Technology - 1.0% | |||
| HMS Holdings Corp. (a) | 64,052 | 1,396,974 | |
| Omnicell, Inc. (a) | 52,594 | 1,976,483 | |
| Quality Systems, Inc. | 221,865 | 2,611,351 | |
| 5,984,808 | |||
| Life Sciences Tools & Services - 0.7% | |||
| Cambrex Corp. (a) | 13,921 | 596,236 | |
| INC Research Holdings, Inc. Class A (a) | 21,245 | 926,919 | |
| Luminex Corp. (a)(b) | 27,564 | 580,773 | |
| PAREXEL International Corp. (a) | 20,046 | 1,363,729 | |
| PRA Health Sciences, Inc. (a) | 13,464 | 680,605 | |
| 4,148,262 | |||
| Pharmaceuticals - 1.1% | |||
| Amphastar Pharmaceuticals, Inc. (a) | 14,152 | 268,888 | |
| Catalent, Inc. (a) | 21,797 | 549,938 | |
| Corcept Therapeutics, Inc. (a)(b) | 12,799 | 68,219 | |
| DepoMed, Inc. (a)(b) | 5,554 | 112,691 | |
| Horizon Pharma PLC (a)(b) | 41,984 | 789,299 | |
| Impax Laboratories, Inc. (a) | 37,093 | 897,280 | |
| Innoviva, Inc. (b) | 465 | 5,157 | |
| Intra-Cellular Therapies, Inc. (a) | 4,297 | 173,341 | |
| Lannett Co., Inc. (a)(b) | 19,783 | 669,852 | |
| Nektar Therapeutics (a)(b) | 26,980 | 481,593 | |
| Pacira Pharmaceuticals, Inc. (a)(b) | 4,868 | 192,919 | |
| Prestige Brands Holdings, Inc. (a) | 24,001 | 1,155,168 | |
| Sucampo Pharmaceuticals, Inc. Class A (a) | 32,683 | 358,206 | |
| Supernus Pharmaceuticals, Inc. (a) | 3,160 | 67,561 | |
| The Medicines Company (a)(b) | 15,461 | 605,607 | |
| TherapeuticsMD, Inc. (a)(b) | 3,310 | 22,773 | |
| Theravance Biopharma, Inc. (a) | 1,467 | 41,604 | |
| 6,460,096 | |||
| TOTAL HEALTH CARE | 90,193,536 | ||
| INDUSTRIALS - 11.9% | |||
| Aerospace & Defense - 2.3% | |||
| Astronics Corp. (a) | 70,217 | 3,146,424 | |
| Astronics Corp. Class B | 8,594 | 384,582 | |
| Curtiss-Wright Corp. | 43,619 | 3,921,348 | |
| KLX, Inc. (a) | 7,913 | 295,471 | |
| Mercury Systems, Inc. (a) | 57,438 | 1,302,694 | |
| Moog, Inc. Class A (a) | 64,367 | 3,797,009 | |
| Teledyne Technologies, Inc. (a) | 9,030 | 967,474 | |
| Triumph Group, Inc. | 9,414 | 299,930 | |
| 14,114,932 | |||
| Airlines - 1.2% | |||
| Allegiant Travel Co. | 8,979 | 1,241,257 | |
| Hawaiian Holdings, Inc. (a) | 79,190 | 3,720,346 | |
| JetBlue Airways Corp. (a) | 147,627 | 2,354,651 | |
| 7,316,254 | |||
| Building Products - 0.7% | |||
| American Woodmark Corp. (a) | 13,923 | 1,211,301 | |
| Insteel Industries, Inc. | 16,570 | 551,781 | |
| NCI Building Systems, Inc. (a) | 59,902 | 906,916 | |
| Ply Gem Holdings, Inc. (a) | 22,404 | 312,984 | |
| Universal Forest Products, Inc. | 11,830 | 1,291,245 | |
| 4,274,227 | |||
| Commercial Services & Supplies - 2.4% | |||
| ARC Document Solutions, Inc. (a) | 22,816 | 77,118 | |
| Deluxe Corp. (b) | 62,637 | 4,269,964 | |
| Ennis, Inc. | 10,458 | 173,394 | |
| G&K Services, Inc. Class A | 576 | 56,062 | |
| Herman Miller, Inc. | 52,455 | 1,892,052 | |
| Kimball International, Inc. Class B | 121,728 | 1,515,514 | |
| Knoll, Inc. | 49,293 | 1,304,293 | |
| Quad/Graphics, Inc. | 8,649 | 234,301 | |
| Steelcase, Inc. Class A | 72,233 | 1,079,161 | |
| UniFirst Corp. | 29,399 | 3,774,538 | |
| West Corp. | 24,402 | 571,739 | |
| 14,948,136 | |||
| Construction & Engineering - 0.7% | |||
| Argan, Inc. | 71,297 | 3,408,710 | |
| EMCOR Group, Inc. | 11,580 | 663,071 | |
| 4,071,781 | |||
| Electrical Equipment - 0.4% | |||
| Allied Motion Technologies, Inc. | 7,036 | 158,521 | |
| EnerSys | 33,849 | 2,382,293 | |
| 2,540,814 | |||
| Machinery - 1.8% | |||
| Alamo Group, Inc. | 14,857 | 963,031 | |
| Federal Signal Corp. | 27,601 | 361,849 | |
| Global Brass & Copper Holdings, Inc. | 37,698 | 1,058,183 | |
| Greenbrier Companies, Inc. (b) | 66,038 | 2,238,028 | |
| Hurco Companies, Inc. | 15,067 | 406,960 | |
| Hyster-Yale Materials Handling Class A | 17,488 | 904,654 | |
| Joy Global, Inc. | 11,795 | 321,768 | |
| Kadant, Inc. | 16,926 | 907,911 | |
| Lydall, Inc. (a) | 3,161 | 151,854 | |
| Wabash National Corp. (a)(b) | 245,942 | 3,430,891 | |
| 10,745,129 | |||
| Marine - 0.6% | |||
| Matson, Inc. | 91,331 | 3,524,463 | |
| Professional Services - 1.7% | |||
| Barrett Business Services, Inc. | 6,253 | 291,765 | |
| Huron Consulting Group, Inc. (a) | 1,443 | 90,707 | |
| ICF International, Inc. (a) | 1,559 | 65,244 | |
| Insperity, Inc. | 49,535 | 3,247,019 | |
| Kelly Services, Inc. Class A (non-vtg.) | 8,861 | 169,422 | |
| Kforce, Inc. | 25,570 | 494,780 | |
| Korn/Ferry International | 69,264 | 1,651,254 | |
| Resources Connection, Inc. | 89,690 | 1,353,422 | |
| RPX Corp. (a) | 268,178 | 2,807,824 | |
| TrueBlue, Inc. (a) | 9,719 | 212,360 | |
| 10,383,797 | |||
| Road & Rail - 0.1% | |||
| ArcBest Corp. | 41,358 | 757,265 | |
| Roadrunner Transportation Systems, Inc. (a) | 19,587 | 163,356 | |
| 920,621 | |||
| TOTAL INDUSTRIALS | 72,840,154 | ||
| INFORMATION TECHNOLOGY - 16.1% | |||
| Communications Equipment - 1.2% | |||
| Bel Fuse, Inc. Class B (non-vtg.) | 2,040 | 46,859 | |
| Black Box Corp. | 13,575 | 189,371 | |
| Communications Systems, Inc. | 7,450 | 41,497 | |
| Digi International, Inc. (a) | 36,439 | 417,955 | |
| Finisar Corp. (a) | 14,424 | 305,500 | |
| InterDigital, Inc. | 8,971 | 640,619 | |
| Ixia (a) | 33,431 | 385,459 | |
| NETGEAR, Inc. (a) | 60,807 | 3,465,999 | |
| Plantronics, Inc. | 40,255 | 2,038,916 | |
| 7,532,175 | |||
| Electronic Equipment & Components - 5.2% | |||
| Anixter International, Inc. (a) | 13,130 | 839,532 | |
| Benchmark Electronics, Inc. (a) | 149,054 | 3,595,182 | |
| Cardtronics PLC (b) | 50,856 | 2,283,943 | |
| Coherent, Inc. (a) | 25,508 | 2,682,931 | |
| Insight Enterprises, Inc. (a) | 16,453 | 503,462 | |
| KEMET Corp. (a) | 14,013 | 47,784 | |
| Kimball Electronics, Inc. (a) | 111,805 | 1,355,077 | |
| Methode Electronics, Inc. Class A | 94,315 | 3,456,645 | |
| MTS Systems Corp. | 6,061 | 301,535 | |
| PC Connection, Inc. | 9,141 | 238,306 | |
| Plexus Corp. (a) | 36,727 | 1,694,951 | |
| Sanmina Corp. (a) | 121,324 | 3,188,395 | |
| ScanSource, Inc. (a) | 77,593 | 2,654,457 | |
| SYNNEX Corp. | 39,983 | 4,244,995 | |
| Tech Data Corp. (a) | 51,366 | 3,813,412 | |
| TTM Technologies, Inc. (a) | 32,161 | 345,088 | |
| Vishay Intertechnology, Inc. | 12,263 | 173,644 | |
| 31,419,339 | |||
| Internet Software & Services - 1.1% | |||
| Bankrate, Inc. (a) | 61,086 | 478,914 | |
| DHI Group, Inc. (a) | 29,428 | 227,773 | |
| EarthLink Holdings Corp. | 107,427 | 684,310 | |
| Global Sources Ltd. (a)(b) | 57,052 | 475,243 | |
| j2 Global, Inc. | 22,252 | 1,516,919 | |
| MeetMe, Inc. (a) | 21,304 | 122,711 | |
| RetailMeNot, Inc. (a) | 191,549 | 2,166,419 | |
| Stamps.com, Inc. (a)(b) | 2,073 | 200,501 | |
| WebMD Health Corp. (a)(b) | 19,857 | 1,024,025 | |
| 6,896,815 | |||
| IT Services - 2.4% | |||
| CACI International, Inc. Class A (a) | 5,066 | 503,358 | |
| Computer Task Group, Inc. | 9,179 | 43,325 | |
| CSG Systems International, Inc. | 72,590 | 3,173,635 | |
| EVERTEC, Inc. | 24,957 | 425,766 | |
| ExlService Holdings, Inc. (a) | 9,436 | 482,934 | |
| Hackett Group, Inc. | 13,046 | 213,302 | |
| Jack Henry & Associates, Inc. | 12,208 | 1,065,392 | |
| ManTech International Corp. Class A | 3,152 | 126,206 | |
| NCI, Inc. Class A | 18,628 | 224,654 | |
| Neustar, Inc. Class A (a)(b) | 132,378 | 3,363,725 | |
| Science Applications International Corp. | 18,095 | 1,154,642 | |
| Sykes Enterprises, Inc. (a) | 77,884 | 2,276,549 | |
| Syntel, Inc. (a) | 25,069 | 1,157,436 | |
| Travelport Worldwide Ltd. | 18,682 | 256,504 | |
| 14,467,428 | |||
| Semiconductors & Semiconductor Equipment - 4.0% | |||
| Advanced Micro Devices, Inc. (a)(b) | 365,714 | 2,706,284 | |
| Cabot Microelectronics Corp. | 63,212 | 3,142,901 | |
| Cirrus Logic, Inc. (a) | 53,250 | 2,702,438 | |
| Fairchild Semiconductor International, Inc. (a) | 8,133 | 161,847 | |
| Integrated Device Technology, Inc. (a) | 14,883 | 298,999 | |
| IXYS Corp. | 66,046 | 767,455 | |
| MaxLinear, Inc. Class A (a) | 35,167 | 674,151 | |
| MKS Instruments, Inc. | 82,659 | 4,028,800 | |
| NeoPhotonics Corp. (a) | 179,317 | 2,677,203 | |
| Photronics, Inc. (a) | 271,143 | 2,592,127 | |
| Rudolph Technologies, Inc. (a)(b) | 46,984 | 824,099 | |
| Silicon Laboratories, Inc. (a) | 4,812 | 275,728 | |
| Synaptics, Inc. (a) | 801 | 45,633 | |
| Tessera Technologies, Inc. | 110,040 | 3,690,742 | |
| 24,588,407 | |||
| Software - 1.9% | |||
| Aspen Technology, Inc. (a) | 47,913 | 2,178,125 | |
| Fleetmatics Group PLC (a) | 3,276 | 196,134 | |
| Manhattan Associates, Inc. (a) | 21,674 | 1,311,710 | |
| Mentor Graphics Corp. | 40,232 | 965,970 | |
| MicroStrategy, Inc. Class A (a) | 1,210 | 201,816 | |
| Monotype Imaging Holdings, Inc. | 38,228 | 806,611 | |
| Pegasystems, Inc. | 2,993 | 77,070 | |
| Progress Software Corp. (a) | 69,087 | 2,004,214 | |
| QAD, Inc. Class B | 4,123 | 78,543 | |
| Synchronoss Technologies, Inc. (a)(b) | 53,472 | 2,232,456 | |
| The Rubicon Project, Inc. (a) | 49,313 | 419,161 | |
| Verint Systems, Inc. (a) | 24,024 | 819,699 | |
| Zedge, Inc. (a) | 21,910 | 97,719 | |
| 11,389,228 | |||
| Technology Hardware, Storage & Peripherals - 0.3% | |||
| Super Micro Computer, Inc. (a) | 80,886 | 1,749,564 | |
| TOTAL INFORMATION TECHNOLOGY | 98,042,956 | ||
| MATERIALS - 5.6% | |||
| Chemicals - 1.7% | |||
| Chase Corp. | 3,161 | 203,474 | |
| FutureFuel Corp. | 145,376 | 1,699,445 | |
| Ingevity Corp. (a) | 3,115 | 138,244 | |
| Innophos Holdings, Inc. | 15,056 | 635,664 | |
| Innospec, Inc. | 4,632 | 274,585 | |
| KMG Chemicals, Inc. | 5,867 | 164,628 | |
| Minerals Technologies, Inc. | 33,214 | 2,343,912 | |
| Rayonier Advanced Materials, Inc. | 64,204 | 789,709 | |
| Stepan Co. | 3,233 | 227,151 | |
| The Chemours Co. LLC | 10,769 | 142,043 | |
| Trecora Resources (a) | 3,790 | 41,387 | |
| Trinseo SA | 64,721 | 3,744,757 | |
| 10,404,999 | |||
| Containers & Packaging - 0.4% | |||
| AEP Industries, Inc. | 21,713 | 2,401,458 | |
| Greif, Inc. Class A | 2,924 | 124,650 | |
| 2,526,108 | |||
| Metals & Mining - 2.9% | |||
| AK Steel Holding Corp. (a)(b) | 701,041 | 3,126,643 | |
| Cliffs Natural Resources, Inc. (a)(b) | 548,213 | 3,124,814 | |
| Coeur d'Alene Mines Corp. (a) | 168,286 | 2,143,964 | |
| Commercial Metals Co. | 181,648 | 2,819,177 | |
| Hecla Mining Co. | 639,620 | 3,569,080 | |
| Ryerson Holding Corp. (a) | 53,307 | 644,482 | |
| Worthington Industries, Inc. | 54,623 | 2,343,327 | |
| 17,771,487 | |||
| Paper & Forest Products - 0.6% | |||
| Schweitzer-Mauduit International, Inc. | 81,274 | 3,192,443 | |
| TOTAL MATERIALS | 33,895,037 | ||
| TELECOMMUNICATION SERVICES - 1.2% | |||
| Diversified Telecommunication Services - 1.1% | |||
| Atlantic Tele-Network, Inc. | 22,206 | 1,450,940 | |
| FairPoint Communications, Inc. (a) | 15,706 | 218,942 | |
| IDT Corp. Class B | 78,045 | 1,162,090 | |
| Inteliquent, Inc. | 156,589 | 2,605,641 | |
| Vonage Holdings Corp. (a) | 210,341 | 1,222,081 | |
| 6,659,694 | |||
| Wireless Telecommunication Services - 0.1% | |||
| Shenandoah Telecommunications Co. | 19,683 | 506,247 | |
| Spok Holdings, Inc. | 28,793 | 476,524 | |
| 982,771 | |||
| TOTAL TELECOMMUNICATION SERVICES | 7,642,465 | ||
| UTILITIES - 2.4% | |||
| Electric Utilities - 0.8% | |||
| Allete, Inc. | 25,338 | 1,502,543 | |
| IDACORP, Inc. | 22,066 | 1,678,561 | |
| Portland General Electric Co. | 17,336 | 730,019 | |
| Spark Energy, Inc. Class A, (b) | 27,261 | 790,296 | |
| 4,701,419 | |||
| Gas Utilities - 0.7% | |||
| Northwest Natural Gas Co. | 7,197 | 429,877 | |
| ONE Gas, Inc. | 55,504 | 3,398,510 | |
| Southwest Gas Corp. | 5,618 | 392,249 | |
| 4,220,636 | |||
| Independent Power and Renewable Electricity Producers - 0.4% | |||
| NRG Yield, Inc. Class A | 51,909 | 835,216 | |
| Ormat Technologies, Inc. | 9,586 | 463,962 | |
| Terraform Power, Inc. (b) | 84,978 | 1,091,118 | |
| 2,390,296 | |||
| Multi-Utilities - 0.1% | |||
| Avista Corp. | 13,214 | 536,753 | |
| Water Utilities - 0.4% | |||
| American States Water Co. | 69,173 | 2,696,348 | |
| TOTAL UTILITIES | 14,545,452 | ||
| TOTAL COMMON STOCKS | |||
| (Cost $520,459,377) | 587,117,945 | ||
| Principal Amount | Value | ||
| U.S. Treasury Obligations - 0.3% | |||
| U.S. Treasury Bills, yield at date of purchase 0.32% 9/15/16 (c) | |||
| (Cost $1,499,812) | 1,500,000 | 1,499,874 | |
| Shares | Value | ||
| Money Market Funds - 17.7% | |||
| Dreyfus Cash Management Institutional Shares, 0.30% (d) | 20,005,201 | $20,005,201 | |
| Fidelity Securities Lending Cash Central Fund 0.44% (e)(f) | 88,092,936 | 88,092,936 | |
| TOTAL MONEY MARKET FUNDS | |||
| (Cost $108,098,137) | 108,098,137 | ||
| TOTAL INVESTMENT PORTFOLIO - 114.3% | |||
| (Cost $630,057,326) | 696,715,956 | ||
| NET OTHER ASSETS (LIABILITIES) - (14.3)% | (87,236,806) | ||
| NET ASSETS - 100% | $609,479,150 |
| Futures Contracts | |||
| Expiration Date | Underlying Face Amount at Value | Unrealized Appreciation/(Depreciation) | |
| Purchased | |||
| Equity Index Contracts | |||
| 180 ICE Russell 2000 Index Contracts (United States) | Sept. 2016 | 22,298,400 | $1,068,810 |
The face value of futures purchased as a percentage of Net Assets is 3.7%
Legend
(a) Non-income producing
(b) Security or a portion of the security is on loan at period end.
(c) Security or a portion of the security was pledged to cover margin requirements for futures contracts. At period end, the value of securities pledged amounted to $988,917.
(d) The rate quoted is the annualized seven-day yield of the fund at period end.
(e) Investment made with cash collateral received from securities on loan.
(f) Affiliated fund that is generally available only to investment companies and other accounts managed by Fidelity Investments. The rate quoted is the annualized seven-day yield of the fund at period end. A complete unaudited listing of the fund's holdings as of its most recent quarter end is available upon request. In addition, each Fidelity Central Fund's financial statements are available on the SEC's website or upon request.
Affiliated Central Funds
Information regarding fiscal year to date income earned by the Fund from investments in Fidelity Central Funds is as follows:
| Fund | Income earned |
| Fidelity Securities Lending Cash Central Fund | $554,844 |
Investment Valuation
The following is a summary of the inputs used, as of August 31, 2016, involving the Fund's assets and liabilities carried at fair value. The inputs or methodology used for valuing securities may not be an indication of the risk associated with investing in those securities. For more information on valuation inputs, and their aggregation into the levels used below, please refer to the Investment Valuation section in the accompanying Notes to Financial Statements.
| Valuation Inputs at Reporting Date: | ||||
| Description | Total | Level 1 | Level 2 | Level 3 |
| Investments in Securities: | ||||
| Equities: | ||||
| Consumer Discretionary | $75,948,961 | $75,948,961 | $-- | $-- |
| Consumer Staples | 27,481,386 | 27,481,386 | -- | -- |
| Energy | 19,997,133 | 19,997,133 | -- | -- |
| Financials | 146,530,865 | 146,530,865 | -- | -- |
| Health Care | 90,193,536 | 90,123,150 | -- | 70,386 |
| Industrials | 72,840,154 | 72,840,154 | -- | -- |
| Information Technology | 98,042,956 | 98,042,956 | -- | -- |
| Materials | 33,895,037 | 33,895,037 | -- | -- |
| Telecommunication Services | 7,642,465 | 7,642,465 | -- | -- |
| Utilities | 14,545,452 | 14,545,452 | -- | -- |
| U.S. Government and Government Agency Obligations | 1,499,874 | -- | 1,499,874 | -- |
| Money Market Funds | 108,098,137 | 108,098,137 | -- | -- |
| Total Investments in Securities: | $696,715,956 | $695,145,696 | $1,499,874 | $70,386 |
| Derivative Instruments: | ||||
| Assets | ||||
| Futures Contracts | $1,068,810 | $1,068,810 | $-- | $-- |
| Total Assets | $1,068,810 | $1,068,810 | $-- | $-- |
| Total Derivative Instruments: | $1,068,810 | $1,068,810 | $-- | $-- |
Value of Derivative Instruments
The following table is a summary of the Fund's value of derivative instruments by primary risk exposure as of August 31, 2016. For additional information on derivative instruments, please refer to the Derivative Instruments section in the accompanying Notes to Financial Statements.
| Primary Risk Exposure / Derivative Type | Value | |
| Asset | Liability | |
| Equity Risk | ||
| Futures Contracts(a) | $1,068,810 | $0 |
| Total Equity Risk | 1,068,810 | 0 |
| Total Value of Derivatives | $1,068,810 | $0 |
(a) Reflects gross cumulative appreciation (depreciation) on futures contracts as presented in the Schedule of Investments. In the Statement of Assets and Liabilities, the period end daily variation margin is included in receivable or payable for daily variation margin for derivative instruments, and the net cumulative appreciation (depreciation) is included in net unrealized appreciation (depreciation).
See accompanying notes which are an integral part of the financial statements.
Fidelity® Small Cap Enhanced Index Fund
Financial Statements
Statement of Assets and Liabilities
| August 31, 2016 (Unaudited) | ||
| Assets | ||
| Investment in securities, at value (including securities loaned of $85,204,560) — See accompanying schedule: Unaffiliated issuers (cost $541,964,390) | $608,623,020 | |
| Fidelity Central Funds (cost $88,092,936) | 88,092,936 | |
| Total Investments (cost $630,057,326) | $696,715,956 | |
| Receivable for investments sold | 4,380,252 | |
| Receivable for fund shares sold | 361,615 | |
| Dividends receivable | 463,710 | |
| Interest receivable | 3,279 | |
| Distributions receivable from Fidelity Central Funds | 68,526 | |
| Total assets | 701,993,338 | |
| Liabilities | ||
| Payable for investments purchased | $3,696,111 | |
| Payable for fund shares redeemed | 259,166 | |
| Accrued management fee | 262,895 | |
| Payable for daily variation margin for derivative instruments | 127,245 | |
| Other affiliated payables | 75,835 | |
| Collateral on securities loaned, at value | 88,092,936 | |
| Total liabilities | 92,514,188 | |
| Net Assets | $609,479,150 | |
| Net Assets consist of: | ||
| Paid in capital | $545,653,006 | |
| Undistributed net investment income | 2,996,832 | |
| Accumulated undistributed net realized gain (loss) on investments | (6,898,128) | |
| Net unrealized appreciation (depreciation) on investments | 67,727,440 | |
| Net Assets, for 48,347,857 shares outstanding | $609,479,150 | |
| Net Asset Value, offering price and redemption price per share ($609,479,150 ÷ 48,347,857 shares) | $12.61 |
See accompanying notes which are an integral part of the financial statements.
Statement of Operations
| Six months ended August 31, 2016 (Unaudited) | ||
| Investment Income | ||
| Dividends | $4,345,756 | |
| Interest | 16,815 | |
| Income from Fidelity Central Funds (including $554,844 from security lending) | 554,844 | |
| Total income | 4,917,415 | |
| Expenses | ||
| Management fee | $1,489,249 | |
| Transfer agent fees | 429,951 | |
| Independent trustees' fees and expenses | 1,299 | |
| Miscellaneous | 763 | |
| Total expenses before reductions | 1,921,262 | |
| Expense reductions | (225) | 1,921,037 |
| Net investment income (loss) | 2,996,378 | |
| Realized and Unrealized Gain (Loss) | ||
| Net realized gain (loss) on: | ||
| Investment securities: | ||
| Unaffiliated issuers | 8,868,266 | |
| Futures contracts | 1,118,359 | |
| Total net realized gain (loss) | 9,986,625 | |
| Change in net unrealized appreciation (depreciation) on: Investment securities | 64,090,089 | |
| Futures contracts | 1,150,531 | |
| Total change in net unrealized appreciation (depreciation) | 65,240,620 | |
| Net gain (loss) | 75,227,245 | |
| Net increase (decrease) in net assets resulting from operations | $78,223,623 |
See accompanying notes which are an integral part of the financial statements.
Statement of Changes in Net Assets
| Six months ended August 31, 2016 (Unaudited) | Year ended February 29, 2016 | |
| Increase (Decrease) in Net Assets | ||
| Operations | ||
| Net investment income (loss) | $2,996,378 | $4,848,448 |
| Net realized gain (loss) | 9,986,625 | 4,382,965 |
| Change in net unrealized appreciation (depreciation) | 65,240,620 | (76,820,168) |
| Net increase (decrease) in net assets resulting from operations | 78,223,623 | (67,588,755) |
| Distributions to shareholders from net investment income | – | (4,016,522) |
| Distributions to shareholders from net realized gain | – | (24,264,444) |
| Total distributions | – | (28,280,966) |
| Share transactions | ||
| Proceeds from sales of shares | 69,714,804 | 247,736,855 |
| Reinvestment of distributions | – | 27,163,046 |
| Cost of shares redeemed | (67,489,579) | (123,045,531) |
| Net increase (decrease) in net assets resulting from share transactions | 2,225,225 | 151,854,370 |
| Redemption fees | 21,000 | 109,416 |
| Total increase (decrease) in net assets | 80,469,848 | 56,094,065 |
| Net Assets | ||
| Beginning of period | 529,009,302 | 472,915,237 |
| End of period | $609,479,150 | $529,009,302 |
| Other Information | ||
| Undistributed net investment income end of period | $2,996,832 | $454 |
| Shares | ||
| Sold | 5,899,667 | 19,800,031 |
| Issued in reinvestment of distributions | – | 2,244,291 |
| Redeemed | (5,694,292) | (10,146,784) |
| Net increase (decrease) | 205,375 | 11,897,538 |
See accompanying notes which are an integral part of the financial statements.
Financial Highlights — Fidelity Small Cap Enhanced Index Fund
| Six months ended (Unaudited) August 31, | Years ended February 28, | |||||
| 2016 | 2016 A | 2015 | 2014 | 2013 | 2012 A | |
| Selected Per–Share Data | ||||||
| Net asset value, beginning of period | $10.99 | $13.05 | $12.74 | $10.56 | $9.81 | $10.72 |
| Income from Investment Operations | ||||||
| Net investment income (loss)B | .06 | .11 | .08 | .08 | .20 | .07 |
| Net realized and unrealized gain (loss) | 1.56 | (1.52) | 1.04 | 2.91 | 1.30 | .14 |
| Total from investment operations | 1.62 | (1.41) | 1.12 | 2.99 | 1.50 | .21 |
| Distributions from net investment income | – | (.09) | (.06) | (.07) | (.20) | (.06) |
| Distributions from net realized gain | – | (.56) | (.75) | (.75) | (.55) | (1.08) |
| Total distributions | – | (.65) | (.81) | (.82) | (.75) | (1.13)C |
| Redemption fees added to paid in capitalB | –D | –D | –D | .01 | –D | .01 |
| Net asset value, end of period | $12.61 | $10.99 | $13.05 | $12.74 | $10.56 | $9.81 |
| Total ReturnE,F | 14.74% | (11.20)% | 9.53% | 29.35% | 16.15% | 2.87% |
| Ratios to Average Net AssetsG,H | ||||||
| Expenses before reductions | .67%I | .67% | .67% | .67% | .67% | .67% |
| Expenses net of fee waivers, if any | .67%I | .67% | .67% | .67% | .67% | .67% |
| Expenses net of all reductions | .67%I | .67% | .67% | .67% | .67% | .67% |
| Net investment income (loss) | 1.05%I | .90% | .63% | .70% | 2.02% | .69% |
| Supplemental Data | ||||||
| Net assets, end of period (000 omitted) | $609,479 | $529,009 | $472,915 | $415,344 | $157,567 | $121,874 |
| Portfolio turnover rateJ | 85%I | 87% | 99% | 107% | 106% | 79% |
A For the year ended February 29.
B Calculated based on average shares outstanding during the period.
C Total distributions of $1.13 per share is comprised of distributions from net investment income of $.056 and distributions from net realized gain of $1.075 per share.
D Amount represents less than $.005 per share.
E Total returns for periods of less than one year are not annualized.
F Total returns would have been lower if certain expenses had not been reduced during the applicable periods shown.
G Fees and expenses of any underlying Fidelity Central Funds are not included in the Fund's expense ratio. The Fund indirectly bears its proportionate share of the expenses of any underlying Fidelity Central Funds.
H Expense ratios reflect operating expenses of the Fund. Expenses before reductions do not reflect amounts reimbursed by the investment adviser or reductions from expense offset arrangements and do not represent the amount paid by the Fund during periods when reimbursements or reductions occur. Expenses net of fee waivers reflect expenses after reimbursement by the investment adviser but prior to reductions from expense offset arrangements. Expenses net of all reductions represent the net expenses paid by the Fund.
I Annualized
J Amount does not include the portfolio activity of any underlying Fidelity Central Funds.
See accompanying notes which are an integral part of the financial statements.
Fidelity® International Enhanced Index Fund
Investment Summary (Unaudited)
Geographic Diversification (% of fund's net assets)
| As of August 31, 2016 | ||
| Japan | 23.6% | |
| United Kingdom | 17.6% | |
| Switzerland | 10.0% | |
| Germany | 8.8% | |
| France | 8.1% | |
| Australia | 7.0% | |
| Netherlands | 4.9% | |
| Sweden | 2.7% | |
| Spain | 2.7% | |
| Other* | 14.6% | |
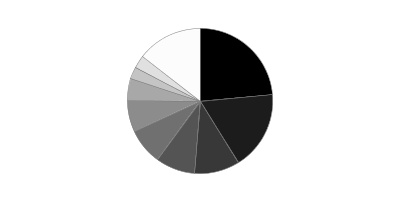
* Includes Short-Term investments and Net Other Assets (Liabilities).
Percentages are based on country or territory of incorporation and are adjusted for the effect of futures contracts, if applicable.
| As of February 29, 2016 | ||
| Japan | 23.5% | |
| United Kingdom | 17.5% | |
| Switzerland | 9.7% | |
| France | 8.9% | |
| Germany | 8.0% | |
| Australia | 5.9% | |
| Netherlands | 5.5% | |
| Hong Kong | 2.9% | |
| Sweden | 2.4% | |
| Other* | 15.7% | |
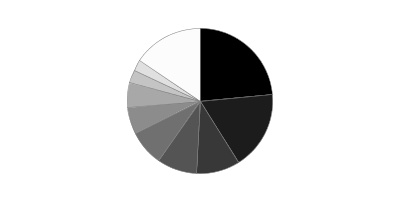
* Includes Short-Term investments and Net Other Assets (Liabilities).
Percentages are based on country or territory of incorporation and are adjusted for the effect of futures contracts, if applicable.
Asset Allocation as of August 31, 2016
| % of fund's net assets | % of fund's net assets 6 months ago | |
| Stocks and Equity Futures | 99.9 | 99.9 |
| Short-Term Investments and Net Other Assets (Liabilities) | 0.1 | 0.1 |
Top Ten Stocks as of August 31, 2016
| % of fund's net assets | % of fund's net assets 6 months ago | |
| Nestle SA (Switzerland, Food Products) | 2.5 | 2.4 |
| Roche Holding AG (participation certificate) (Switzerland, Pharmaceuticals) | 1.8 | 2.1 |
| Novartis AG (Switzerland, Pharmaceuticals) | 1.7 | 1.9 |
| Total SA (France, Oil, Gas & Consumable Fuels) | 1.3 | 1.0 |
| Siemens AG (Germany, Industrial Conglomerates) | 1.2 | 1.1 |
| Novo Nordisk A/S Series B (Denmark, Pharmaceuticals) | 1.2 | 1.4 |
| GlaxoSmithKline PLC (United Kingdom, Pharmaceuticals) | 1.1 | 1.1 |
| Bayer AG (Germany, Pharmaceuticals) | 1.1 | 0.4 |
| HSBC Holdings PLC (United Kingdom, Banks) | 1.0 | 1.1 |
| Australia & New Zealand Banking Group Ltd. (Australia, Banks) | 1.0 | 0.9 |
| 13.9 |
Market Sectors as of August 31, 2016
| % of fund's net assets | % of fund's net assets 6 months ago | |
| Financials | 22.0 | 21.6 |
| Health Care | 12.9 | 13.4 |
| Consumer Staples | 12.8 | 12.8 |
| Industrials | 12.5 | 11.9 |
| Consumer Discretionary | 11.0 | 12.8 |
| Materials | 7.9 | 4.4 |
| Telecommunication Services | 5.9 | 6.2 |
| Information Technology | 5.4 | 6.4 |
| Energy | 3.7 | 3.5 |
| Utilities | 3.4 | 4.6 |
Fidelity® International Enhanced Index Fund
Investments August 31, 2016 (Unaudited)
Showing Percentage of Net Assets
| Common Stocks - 96.8% | |||
| Shares | Value | ||
| Australia - 7.0% | |||
| Aristocrat Leisure Ltd. | 38,612 | $438,185 | |
| Australia & New Zealand Banking Group Ltd. | 81,942 | 1,656,596 | |
| BHP Billiton Ltd. | 82,420 | 1,265,490 | |
| Cimic Group Ltd. | 23,266 | 517,748 | |
| Cochlear Ltd. | 316 | 33,462 | |
| Commonwealth Bank of Australia | 13,685 | 738,563 | |
| CSL Ltd. | 15,781 | 1,282,089 | |
| Flight Centre Travel Group Ltd. | 2,123 | 58,796 | |
| Fortescue Metals Group Ltd. | 270,479 | 996,065 | |
| Goodman Group unit | 36,805 | 209,945 | |
| Harvey Norman Holdings Ltd. | 138,702 | 560,819 | |
| Macquarie Group Ltd. | 11,967 | 725,800 | |
| National Australia Bank Ltd. | 5,894 | 121,106 | |
| Qantas Airways Ltd. | 181,070 | 440,909 | |
| Rio Tinto Ltd. | 23,861 | 853,598 | |
| Tabcorp Holdings Ltd. | 67,565 | 252,369 | |
| Telstra Corp. Ltd. | 248,529 | 981,420 | |
| Wesfarmers Ltd. | 20,403 | 650,770 | |
| Westpac Banking Corp. | 12,258 | 270,946 | |
| Woolworths Ltd. | 8,229 | 146,635 | |
| TOTAL AUSTRALIA | 12,201,311 | ||
| Austria - 0.1% | |||
| Erste Group Bank AG | 6,616 | 185,861 | |
| Bailiwick of Jersey - 0.7% | |||
| Experian PLC | 581 | 11,551 | |
| Glencore Xstrata PLC | 73,934 | 168,979 | |
| Shire PLC | 3,162 | 197,472 | |
| WPP PLC | 38,993 | 900,269 | |
| TOTAL BAILIWICK OF JERSEY | 1,278,271 | ||
| Belgium - 0.5% | |||
| Anheuser-Busch InBev SA NV | 6,096 | 756,341 | |
| Groupe Bruxelles Lambert SA | 974 | 85,471 | |
| KBC Groep NV (a) | 162 | 9,590 | |
| TOTAL BELGIUM | 851,402 | ||
| Bermuda - 0.7% | |||
| Hongkong Land Holdings Ltd. | 15,500 | 100,595 | |
| Kerry Properties Ltd. | 234,500 | 681,655 | |
| Li & Fung Ltd. | 216,000 | 111,097 | |
| Yue Yuen Industrial (Holdings) Ltd. | 70,500 | 299,901 | |
| TOTAL BERMUDA | 1,193,248 | ||
| Cayman Islands - 0.7% | |||
| Cheung Kong Property Holdings Ltd. | 144,000 | 1,011,660 | |
| WH Group Ltd. | 166,500 | 130,924 | |
| TOTAL CAYMAN ISLANDS | 1,142,584 | ||
| Denmark - 1.8% | |||
| Danske Bank A/S | 330 | 9,685 | |
| Novo Nordisk A/S Series B | 43,772 | 2,048,564 | |
| Vestas Wind Systems A/S | 13,509 | 1,120,705 | |
| TOTAL DENMARK | 3,178,954 | ||
| Finland - 1.4% | |||
| Kone Oyj (B Shares) | 10,388 | 522,008 | |
| Neste Oyj | 21,000 | 874,669 | |
| Orion Oyj (B Shares) | 21,755 | 823,609 | |
| Sampo Oyj (A Shares) | 987 | 42,376 | |
| Stora Enso Oyj (R Shares) | 6,048 | 53,397 | |
| UPM-Kymmene Corp. | 5,208 | 104,625 | |
| TOTAL FINLAND | 2,420,684 | ||
| France - 8.1% | |||
| Atos Origin SA | 825 | 81,342 | |
| AXA SA | 39,158 | 824,169 | |
| BNP Paribas SA | 9,290 | 472,583 | |
| Bouygues SA | 24,520 | 777,584 | |
| Christian Dior SA | 2,940 | 508,311 | |
| Eurazeo SA | 4,593 | 278,654 | |
| Gecina SA | 957 | 149,715 | |
| Hermes International SCA | 793 | 334,891 | |
| L'Oreal SA | 3,663 | 691,946 | |
| LVMH Moet Hennessy - Louis Vuitton SA | 1,269 | 214,726 | |
| Natixis SA | 3,688 | 16,315 | |
| Orange SA | 75,717 | 1,154,224 | |
| Peugeot Citroen SA (a) | 62,876 | 927,536 | |
| Renault SA | 7,723 | 631,538 | |
| Safran SA | 10,099 | 706,086 | |
| Sanofi SA | 20,054 | 1,547,495 | |
| SFR Group SA | 3,456 | 91,942 | |
| Societe Generale Series A | 4,303 | 157,101 | |
| Thales SA | 808 | 69,967 | |
| Total SA | 47,527 | 2,270,668 | |
| Unibail-Rodamco | 2,181 | 598,468 | |
| Valeo SA | 2,100 | 108,666 | |
| VINCI SA | 16,861 | 1,281,050 | |
| Vivendi SA | 13,193 | 255,531 | |
| TOTAL FRANCE | 14,150,508 | ||
| Germany - 8.1% | |||
| Allianz SE | 7,906 | 1,175,282 | |
| BASF AG | 13,896 | 1,129,971 | |
| Bayer AG | 17,550 | 1,873,480 | |
| Commerzbank AG | 30,353 | 213,504 | |
| Continental AG | 2,958 | 619,976 | |
| Covestro AG | 17,982 | 936,308 | |
| Daimler AG (Germany) | 11,653 | 806,631 | |
| Deutsche Borse AG (a) | 2,913 | 248,897 | |
| Deutsche Telekom AG | 11,294 | 188,399 | |
| E.ON AG | 67,493 | 620,694 | |
| Evonik Industries AG | 10,535 | 354,124 | |
| Fresenius SE & Co. KGaA | 13,062 | 953,170 | |
| Infineon Technologies AG | 3,610 | 60,577 | |
| Metro AG | 15,911 | 471,591 | |
| Muenchener Rueckversicherungs AG | 3,071 | 554,564 | |
| OSRAM Licht AG | 11,938 | 625,064 | |
| ProSiebenSat.1 Media AG | 9,020 | 389,180 | |
| SAP AG | 5,989 | 525,954 | |
| Schaeffler AG | 11,119 | 172,149 | |
| Siemens AG | 17,675 | 2,108,570 | |
| TOTAL GERMANY | 14,028,085 | ||
| Hong Kong - 2.5% | |||
| AIA Group Ltd. | 35,200 | 222,565 | |
| Henderson Land Development Co. Ltd. | 17,600 | 102,888 | |
| HKT Trust/HKT Ltd. unit | 52,000 | 71,724 | |
| Hysan Development Co. Ltd. | 35,005 | 168,989 | |
| Link (REIT) | 121,500 | 883,346 | |
| New World Development Co. Ltd. | 197,581 | 247,818 | |
| Sino Land Ltd. | 210,438 | 360,245 | |
| Sun Hung Kai Properties Ltd. | 24,000 | 337,839 | |
| Wharf Holdings Ltd. | 140,000 | 988,972 | |
| Wheelock and Co. Ltd. | 164,000 | 938,647 | |
| TOTAL HONG KONG | 4,323,033 | ||
| Ireland - 0.1% | |||
| Paddy Power PLC (Ireland) | 1,671 | 199,719 | |
| Israel - 0.6% | |||
| Check Point Software Technologies Ltd. (a) | 13,141 | 1,008,440 | |
| Italy - 1.0% | |||
| Enel SpA | 172,522 | 761,676 | |
| EXOR SpA | 5,145 | 211,482 | |
| Intesa Sanpaolo SpA | 70,439 | 167,373 | |
| Mediobanca SpA | 32,828 | 243,510 | |
| UniCredit SpA | 171,024 | 439,913 | |
| TOTAL ITALY | 1,823,954 | ||
| Japan - 23.6% | |||
| Amada Holdings Co. Ltd. | 71,800 | 750,859 | |
| Asahi Glass Co. Ltd. | 147,000 | 934,867 | |
| Astellas Pharma, Inc. | 65,900 | 1,005,860 | |
| Bandai Namco Holdings, Inc. | 20,400 | 557,197 | |
| Canon, Inc. | 23,000 | 659,541 | |
| Central Japan Railway Co. | 6,500 | 1,067,366 | |
| Chubu Electric Power Co., Inc. | 64,700 | 874,840 | |
| Dai-ichi Mutual Life Insurance Co. | 30,800 | 428,518 | |
| Daicel Chemical Industries Ltd. | 25,000 | 318,707 | |
| Daito Trust Construction Co. Ltd. | 2,500 | 368,120 | |
| Fuji Heavy Industries Ltd. | 26,400 | 1,045,641 | |
| Fujifilm Holdings Corp. | 13,100 | 492,144 | |
| Fujitsu Ltd. | 26,000 | 131,979 | |
| Hitachi Chemical Co. Ltd. | 10,400 | 224,153 | |
| Hitachi Ltd. | 201,000 | 963,572 | |
| Hitachi Metals Ltd. | 7,300 | 88,335 | |
| Honda Motor Co. Ltd. | 8,200 | 252,610 | |
| Hoya Corp. | 27,800 | 1,077,178 | |
| Iida Group Holdings Co. Ltd. | 36,600 | 685,554 | |
| Itochu Corp. | 36,100 | 426,019 | |
| ITOCHU Techno-Solutions Corp. | 17,300 | 422,196 | |
| Japan Post Bank Co. Ltd. | 4,600 | 54,063 | |
| Japan Tobacco, Inc. | 7,200 | 278,912 | |
| JTEKT Corp. | 30,700 | 477,124 | |
| Kansai Electric Power Co., Inc. (a) | 70,300 | 602,474 | |
| Kao Corp. | 20,600 | 1,070,567 | |
| KDDI Corp. | 43,800 | 1,280,477 | |
| Mitsubishi Chemical Holdings Corp. | 172,300 | 1,087,106 | |
| Mitsubishi Electric Corp. | 62,000 | 809,269 | |
| Mitsubishi Tanabe Pharma Corp. | 45,400 | 842,488 | |
| Mitsubishi UFJ Financial Group, Inc. | 268,500 | 1,479,039 | |
| Mitsubishi UFJ Lease & Finance Co. Ltd. | 44,100 | 206,722 | |
| Mitsui Chemicals, Inc. | 103,000 | 492,775 | |
| mixi, Inc. | 14,500 | 515,029 | |
| Mizuho Financial Group, Inc. | 802,000 | 1,397,346 | |
| MS&AD Insurance Group Holdings, Inc. | 25,600 | 730,527 | |
| Murata Manufacturing Co. Ltd. | 3,600 | 483,816 | |
| Nexon Co. Ltd. | 23,400 | 320,474 | |
| Nippon Telegraph & Telephone Corp. | 27,000 | 1,187,165 | |
| Nissan Motor Co. Ltd. | 27,100 | 266,271 | |
| NKSJ Holdings, Inc. | 26,900 | 862,131 | |
| Nomura Holdings, Inc. | 140,200 | 661,881 | |
| Nomura Real Estate Master Fund, Inc. | 333 | 549,394 | |
| NSK Ltd. | 42,200 | 434,787 | |
| NTT DOCOMO, Inc. | 51,700 | 1,303,838 | |
| Obayashi Corp. | 15,900 | 146,760 | |
| Oracle Corp. Japan | 2,800 | 162,915 | |
| ORIX Corp. | 78,000 | 1,121,394 | |
| Resona Holdings, Inc. | 87,200 | 398,812 | |
| SBI Holdings, Inc. Japan | 4,300 | 51,036 | |
| Shin-Etsu Chemical Co. Ltd. | 17,700 | 1,299,123 | |
| Shionogi & Co. Ltd. | 5,800 | 258,930 | |
| SoftBank Corp. | 500 | 32,617 | |
| Sumitomo Chemical Co. Ltd. | 203,000 | 929,996 | |
| Sumitomo Mitsui Financial Group, Inc. | 21,900 | 766,108 | |
| Sumitomo Rubber Industries Ltd. | 7,000 | 103,784 | |
| Suzuki Motor Corp. | 19,500 | 646,262 | |
| TDK Corp. | 500 | 35,761 | |
| Teijin Ltd. | 34,000 | 126,845 | |
| Tokio Marine Holdings, Inc. | 31,900 | 1,253,000 | |
| Tokyo Electric Power Co., Inc. (a) | 241,600 | 973,732 | |
| Tokyo Electron Ltd. | 11,800 | 1,084,371 | |
| TonenGeneral Sekiyu K.K. | 11,000 | 101,532 | |
| Toyota Motor Corp. | 23,500 | 1,420,233 | |
| Toyota Tsusho Corp. | 800 | 18,294 | |
| TOTAL JAPAN | 41,100,436 | ||
| Luxembourg - 0.3% | |||
| RTL Group SA | 5,240 | 441,002 | |
| Netherlands - 4.9% | |||
| AerCap Holdings NV (a)(b) | 24,245 | 969,073 | |
| Ahold Delhaize NV | 44,065 | 1,055,054 | |
| CNH Industrial NV | 44,823 | 327,486 | |
| Fiat Chrysler Automobiles NV | 136,430 | 942,760 | |
| Heineken Holding NV | 10,741 | 863,354 | |
| Heineken NV (Bearer) | 1,907 | 170,386 | |
| ING Groep NV (Certificaten Van Aandelen) | 74,827 | 936,486 | |
| Koninklijke KPN NV | 3,493 | 11,420 | |
| NN Group NV | 11,012 | 327,658 | |
| QIAGEN NV (Germany) (a) | 2,775 | 73,484 | |
| RELX NV | 14,245 | 252,678 | |
| STMicroelectronics NV | 120,385 | 904,720 | |
| Unilever NV (Certificaten Van Aandelen) (Bearer) | 35,800 | 1,647,198 | |
| TOTAL NETHERLANDS | 8,481,757 | ||
| New Zealand - 0.1% | |||
| Spark New Zealand Ltd. | 93,354 | 257,742 | |
| Norway - 0.2% | |||
| DNB ASA | 15,222 | 185,052 | |
| Norsk Hydro ASA | 17,604 | 74,714 | |
| TOTAL NORWAY | 259,766 | ||
| Portugal - 0.1% | |||
| Galp Energia SGPS SA Class B | 15,840 | 230,224 | |
| Singapore - 1.3% | |||
| ComfortDelgro Corp. Ltd. | 200,900 | 417,298 | |
| Jardine Cycle & Carriage Ltd. | 4,800 | 149,730 | |
| StarHub Ltd. | 62,100 | 166,822 | |
| United Overseas Bank Ltd. | 40,000 | 528,753 | |
| Wilmar International Ltd. | 160,800 | 363,510 | |
| Yangzijiang Shipbuilding Holdings Ltd. | 1,278,200 | 717,695 | |
| TOTAL SINGAPORE | 2,343,808 | ||
| Spain - 2.7% | |||
| ACS Actividades de Construccion y Servicios SA | 3,559 | 100,855 | |
| Aena SA | 4,685 | 662,381 | |
| Amadeus IT Holding SA Class A | 1,626 | 74,716 | |
| Banco Bilbao Vizcaya Argentaria SA | 124,486 | 773,659 | |
| Banco Santander SA (Spain) | 258,570 | 1,159,809 | |
| Endesa SA | 3,231 | 65,809 | |
| Gas Natural SDG SA | 29,118 | 601,036 | |
| Inditex SA | 20,692 | 733,431 | |
| Repsol YPF SA | 25,591 | 343,688 | |
| Telefonica SA | 13,877 | 140,016 | |
| TOTAL SPAIN | 4,655,400 | ||
| Sweden - 2.7% | |||
| Electrolux AB (B Shares) | 7,751 | 201,909 | |
| Hakon Invest AB | 1,609 | 55,051 | |
| Investor AB (B Shares) | 2,732 | 96,379 | |
| Nordea Bank AB | 67,917 | 664,045 | |
| Skandinaviska Enskilda Banken AB (A Shares) | 4,998 | 48,867 | |
| Skanska AB (B Shares) | 17,226 | 377,696 | |
| Svenska Handelsbanken AB (A Shares) | 2,725 | 35,119 | |
| Swedbank AB (A Shares) | 937 | 21,552 | |
| Swedish Match Co. AB | 23,358 | 832,748 | |
| Telefonaktiebolaget LM Ericsson (B Shares) | 157,061 | 1,118,632 | |
| TeliaSonera AB | 135,960 | 614,156 | |
| Volvo AB (B Shares) | 61,315 | 659,301 | |
| TOTAL SWEDEN | 4,725,455 | ||
| Switzerland - 10.0% | |||
| ABB Ltd. (Reg.) | 64,052 | 1,389,409 | |
| Actelion Ltd. | 6,527 | 1,086,340 | |
| Coca-Cola HBC AG | 24,809 | 545,355 | |
| Credit Suisse Group AG | 3,891 | 50,731 | |
| Givaudan SA | 227 | 469,210 | |
| Kuehne & Nagel International AG | 4,543 | 634,186 | |
| Lonza Group AG | 857 | 162,417 | |
| Nestle SA | 54,267 | 4,324,684 | |
| Novartis AG | 38,740 | 3,051,279 | |
| Pargesa Holding SA | 4,172 | 287,593 | |
| Partners Group Holding AG | 122 | 55,942 | |
| Roche Holding AG (participation certificate) | 12,923 | 3,154,508 | |
| SGS SA (Reg.) | 138 | 303,206 | |
| Swiss Re Ltd. | 7,420 | 626,160 | |
| Syngenta AG (Switzerland) | 843 | 368,032 | |
| UBS Group AG | 43,530 | 629,349 | |
| Zurich Insurance Group AG | 1,085 | 277,331 | |
| TOTAL SWITZERLAND | 17,415,732 | ||
| United Kingdom - 17.6% | |||
| 3i Group PLC | 43,746 | 353,000 | |
| Aberdeen Asset Management PLC | 72,818 | 306,783 | |
| Anglo American PLC (United Kingdom) | 41,027 | 420,114 | |
| ARM Holdings PLC | 11,857 | 264,068 | |
| AstraZeneca PLC: | |||
| (United Kingdom) | 1,546 | 99,796 | |
| sponsored ADR | 26,552 | 871,171 | |
| Aviva PLC | 19,315 | 109,005 | |
| Barclays PLC | 107,393 | 242,717 | |
| Berkeley Group Holdings PLC | 15,311 | 537,223 | |
| BP PLC | 102,287 | 575,015 | |
| British American Tobacco PLC (United Kingdom) | 22,025 | 1,366,489 | |
| British Land Co. PLC | 41,905 | 364,975 | |
| BT Group PLC | 205,687 | 1,043,852 | |
| Burberry Group PLC | 5,867 | 100,463 | |
| Carnival PLC | 15,366 | 738,759 | |
| Compass Group PLC | 4,043 | 76,524 | |
| Diageo PLC | 11,812 | 327,369 | |
| GlaxoSmithKline PLC | 1,351 | 29,081 | |
| GlaxoSmithKline PLC sponsored ADR | 43,131 | 1,874,473 | |
| Hammerson PLC | 40,642 | 309,540 | |
| HSBC Holdings PLC: | |||
| (United Kingdom) | 38,442 | 285,813 | |
| sponsored ADR (b) | 38,871 | 1,446,001 | |
| Imperial Tobacco Group PLC | 26,720 | 1,401,214 | |
| Johnson Matthey PLC | 22,449 | 984,006 | |
| Kingfisher PLC | 188,962 | 921,579 | |
| Land Securities Group PLC | 20,765 | 298,307 | |
| Legal & General Group PLC | 173,980 | 480,455 | |
| Lloyds Banking Group PLC | 1,129,962 | 880,702 | |
| Marks & Spencer Group PLC | 141,955 | 642,104 | |
| Mediclinic International PLC | 3,470 | 46,569 | |
| Meggitt PLC | 21,512 | 132,288 | |
| National Grid PLC | 105,398 | 1,450,488 | |
| Persimmon PLC | 24,624 | 589,791 | |
| Prudential PLC | 21,152 | 380,503 | |
| Reckitt Benckiser Group PLC | 16,731 | 1,616,193 | |
| RELX PLC | 42,227 | 801,258 | |
| Rio Tinto PLC | 30,394 | 914,942 | |
| Royal Dutch Shell PLC: | |||
| Class A (United Kingdom) | 59,476 | 1,453,577 | |
| Class B (United Kingdom) | 27,865 | 709,358 | |
| Royal Mail PLC | 76,687 | 517,606 | |
| SABMiller PLC | 10,331 | 596,639 | |
| Sage Group PLC | 20,708 | 197,147 | |
| Segro PLC | 21,444 | 127,617 | |
| SKY PLC | 18,515 | 206,417 | |
| Standard Chartered PLC (United Kingdom) | 13,948 | 117,588 | |
| Tate & Lyle PLC | 26,315 | 253,465 | |
| Unilever PLC | 31,452 | 1,460,041 | |
| Vodafone Group PLC | 528,288 | 1,594,190 | |
| William Hill PLC | 51,421 | 215,044 | |
| TOTAL UNITED KINGDOM | 30,731,319 | ||
| TOTAL COMMON STOCKS | |||
| (Cost $165,098,769) | 168,628,695 | ||
| Nonconvertible Preferred Stocks - 0.7% | |||
| Germany - 0.7% | |||
| Henkel AG & Co. KGaA | |||
| (Cost $984,890) | 9,365 | 1,228,994 | |
| Principal Amount | Value | ||
| Government Obligations - 0.3% | |||
| United States of America - 0.3% | |||
| U.S. Treasury Bills, yield at date of purchase 0.32% 9/15/16 (Cost $499,937)(c) | 500,000 | 499,958 | |
| Shares | Value | ||
| Money Market Funds - 3.0% | |||
| Dreyfus Cash Management Institutional Shares, 0.30% (d) | 2,938,655 | 2,938,655 | |
| Fidelity Securities Lending Cash Central Fund 0.44% (e)(f) | 2,390,775 | 2,390,775 | |
| TOTAL MONEY MARKET FUNDS | |||
| (Cost $5,329,430) | 5,329,430 | ||
| TOTAL INVESTMENT PORTFOLIO - 100.8% | |||
| (Cost $171,913,026) | 175,687,077 | ||
| NET OTHER ASSETS (LIABILITIES) - (0.8)% | (1,408,350) | ||
| NET ASSETS - 100% | $174,278,727 |
| Futures Contracts | |||
| Expiration Date | Underlying Face Amount at Value | Unrealized Appreciation/(Depreciation) | |
| Purchased | |||
| Equity Index Contracts | |||
| 49 ICE E-mini MSCI EAFE Index Contracts (United States) | Sept. 2016 | 4,134,620 | $201,112 |
The face value of futures purchased as a percentage of Net Assets is 2.4%
Categorizations in the Schedule of Investments are based on country or territory of incorporation.
Legend
(a) Non-income producing
(b) Security or a portion of the security is on loan at period end.
(c) Security or a portion of the security was pledged to cover margin requirements for futures contracts. At period end, the value of securities pledged amounted to $238,980.
(d) The rate quoted is the annualized seven-day yield of the fund at period end.
(e) Investment made with cash collateral received from securities on loan.
(f) Affiliated fund that is generally available only to investment companies and other accounts managed by Fidelity Investments. The rate quoted is the annualized seven-day yield of the fund at period end. A complete unaudited listing of the fund's holdings as of its most recent quarter end is available upon request. In addition, each Fidelity Central Fund's financial statements are available on the SEC's website or upon request.
Affiliated Central Funds
Information regarding fiscal year to date income earned by the Fund from investments in Fidelity Central Funds is as follows:
| Fund | Income earned |
| Fidelity Securities Lending Cash Central Fund | $7,026 |
Investment Valuation
The following is a summary of the inputs used, as of August 31, 2016, involving the Fund's assets and liabilities carried at fair value. The inputs or methodology used for valuing securities may not be an indication of the risk associated with investing in those securities. For more information on valuation inputs, and their aggregation into the levels used below, please refer to the Investment Valuation section in the accompanying Notes to Financial Statements.
| Valuation Inputs at Reporting Date: | ||||
| Description | Total | Level 1 | Level 2 | Level 3 |
| Investments in Securities: | ||||
| Equities: | ||||
| Consumer Discretionary | $19,264,578 | $11,431,686 | $7,832,892 | $-- |
| Consumer Staples | 22,305,430 | 10,335,524 | 11,969,906 | -- |
| Energy | 6,558,731 | 1,550,113 | 5,008,618 | -- |
| Financials | 38,588,270 | 26,544,645 | 12,043,625 | -- |
| Health Care | 22,392,915 | 9,385,380 | 13,007,535 | -- |
| Industrials | 21,509,003 | 16,477,296 | 5,031,707 | -- |
| Information Technology | 9,507,394 | 6,156,628 | 3,350,766 | -- |
| Materials | 13,660,615 | 12,302,927 | 1,357,688 | -- |
| Telecommunication Services | 10,120,004 | 1,202,386 | 8,917,618 | -- |
| Utilities | 5,950,749 | 3,879,567 | 2,071,182 | -- |
| Government Obligations | 499,958 | -- | 499,958 | -- |
| Money Market Funds | 5,329,430 | 5,329,430 | -- | -- |
| Total Investments in Securities: | $175,687,077 | $104,595,582 | $71,091,495 | $-- |
| Derivative Instruments: | ||||
| Assets | ||||
| Futures Contracts | $201,112 | $201,112 | $-- | $-- |
| Total Assets | $201,112 | $201,112 | $-- | $-- |
| Total Derivative Instruments: | $201,112 | $201,112 | $-- | $-- |
The following is a summary of transfers between Level 1 and Level 2 for the period ended August 31, 2016. Transfers are assumed to have occurred at the beginning of the period, and are primarily attributable to the valuation techniques used for foreign equity securities, as discussed in the accompanying Notes to Financial Statements:
| Transfers | Total |
| Level 1 to Level 2 | $9,634,949 |
| Level 2 to Level 1 | $27,686,801 |
Value of Derivative Instruments
The following table is a summary of the Fund's value of derivative instruments by primary risk exposure as of August 31, 2016. For additional information on derivative instruments, please refer to the Derivative Instruments section in the accompanying Notes to Financial Statements.
| Primary Risk Exposure / Derivative Type | Value | |
| Asset | Liability | |
| Equity Risk | ||
| Futures Contracts(a) | $201,112 | $0 |
| Total Equity Risk | 201,112 | 0 |
| Total Value of Derivatives | $201,112 | $0 |
(a) Reflects gross cumulative appreciation (depreciation) on futures contracts as presented in the Schedule of Investments. In the Statement of Assets and Liabilities, the period end daily variation margin is included in receivable or payable for daily variation margin for derivative instruments, and the net cumulative appreciation (depreciation) is included in net unrealized appreciation (depreciation).
See accompanying notes which are an integral part of the financial statements.
Fidelity® International Enhanced Index Fund
Financial Statements
Statement of Assets and Liabilities
| August 31, 2016 (Unaudited) | ||
| Assets | ||
| Investment in securities, at value (including securities loaned of $2,360,889) — See accompanying schedule: Unaffiliated issuers (cost $169,522,251) | $173,296,302 | |
| Fidelity Central Funds (cost $2,390,775) | 2,390,775 | |
| Total Investments (cost $171,913,026) | $175,687,077 | |
| Foreign currency held at value (cost $268,881) | 265,560 | |
| Receivable for fund shares sold | 222,850 | |
| Dividends receivable | 705,193 | |
| Interest receivable | 578 | |
| Distributions receivable from Fidelity Central Funds | 626 | |
| Other receivables | 335 | |
| Total assets | 176,882,219 | |
| Liabilities | ||
| Payable for fund shares redeemed | $113,915 | |
| Accrued management fee | 68,026 | |
| Payable for daily variation margin for derivative instruments | 9,065 | |
| Other affiliated payables | 21,711 | |
| Collateral on securities loaned, at value | 2,390,775 | |
| Total liabilities | 2,603,492 | |
| Net Assets | $174,278,727 | |
| Net Assets consist of: | ||
| Paid in capital | $181,023,180 | |
| Undistributed net investment income | 3,171,854 | |
| Accumulated undistributed net realized gain (loss) on investments and foreign currency transactions | (13,882,813) | |
| Net unrealized appreciation (depreciation) on investments and assets and liabilities in foreign currencies | 3,966,506 | |
| Net Assets, for 21,233,973 shares outstanding | $174,278,727 | |
| Net Asset Value, offering price and redemption price per share ($174,278,727 ÷ 21,233,973 shares) | $8.21 |
See accompanying notes which are an integral part of the financial statements.
Statement of Operations
| Six months ended August 31, 2016 (Unaudited) | ||
| Investment Income | ||
| Dividends | $4,021,206 | |
| Interest | 2,201 | |
| Income from Fidelity Central Funds (including $7,026 from security lending) | 7,026 | |
| Income before foreign taxes withheld | 4,030,433 | |
| Less foreign taxes withheld | (333,168) | |
| Total income | 3,697,265 | |
| Expenses | ||
| Management fee | $392,952 | |
| Transfer agent fees | 125,529 | |
| Independent trustees' fees and expenses | 382 | |
| Miscellaneous | 227 | |
| Total expenses before reductions | 519,090 | |
| Expense reductions | (19) | 519,071 |
| Net investment income (loss) | 3,178,194 | |
| Realized and Unrealized Gain (Loss) | ||
| Net realized gain (loss) on: | ||
| Investment securities: | ||
| Unaffiliated issuers | (4,719,895) | |
| Foreign currency transactions | 42,816 | |
| Futures contracts | 160,246 | |
| Total net realized gain (loss) | (4,516,833) | |
| Change in net unrealized appreciation (depreciation) on: Investment securities | 17,693,406 | |
| Assets and liabilities in foreign currencies | 7,464 | |
| Futures contracts | 187,101 | |
| Total change in net unrealized appreciation (depreciation) | 17,887,971 | |
| Net gain (loss) | 13,371,138 | |
| Net increase (decrease) in net assets resulting from operations | $16,549,332 |
See accompanying notes which are an integral part of the financial statements.
Statement of Changes in Net Assets
| Six months ended August 31, 2016 (Unaudited) | Year ended February 29, 2016 | |
| Increase (Decrease) in Net Assets | ||
| Operations | ||
| Net investment income (loss) | $3,178,194 | $3,232,456 |
| Net realized gain (loss) | (4,516,833) | (8,202,367) |
| Change in net unrealized appreciation (depreciation) | 17,887,971 | (18,846,011) |
| Net increase (decrease) in net assets resulting from operations | 16,549,332 | (23,815,922) |
| Distributions to shareholders from net investment income | (104,124) | (2,909,905) |
| Distributions to shareholders from net realized gain | – | (40,835) |
| Total distributions | (104,124) | (2,950,740) |
| Share transactions | ||
| Proceeds from sales of shares | 33,452,255 | 120,458,928 |
| Reinvestment of distributions | 97,982 | 2,774,693 |
| Cost of shares redeemed | (28,416,815) | (49,141,729) |
| Net increase (decrease) in net assets resulting from share transactions | 5,133,422 | 74,091,892 |
| Redemption fees | 1,558 | 12,817 |
| Total increase (decrease) in net assets | 21,580,188 | 47,338,047 |
| Net Assets | ||
| Beginning of period | 152,698,539 | 105,360,492 |
| End of period | $174,278,727 | $152,698,539 |
| Other Information | ||
| Undistributed net investment income end of period | $3,171,854 | $97,784 |
| Shares | ||
| Sold | 4,211,299 | 14,156,866 |
| Issued in reinvestment of distributions | 12,172 | 343,487 |
| Redeemed | (3,573,163) | (5,937,186) |
| Net increase (decrease) | 650,308 | 8,563,167 |
See accompanying notes which are an integral part of the financial statements.
Financial Highlights — Fidelity International Enhanced Index Fund
| Six months ended (Unaudited) August 31, | Years ended February 28, | |||||
| 2016 | 2016 A | 2015 | 2014 | 2013 | 2012 A | |
| Selected Per–Share Data | ||||||
| Net asset value, beginning of period | $7.42 | $8.77 | $8.85 | $7.45 | $6.95 | $7.77 |
| Income from Investment Operations | ||||||
| Net investment income (loss)B | .15 | .19 | .20 | .28C | .21 | .20 |
| Net realized and unrealized gain (loss) | .65 | (1.38) | (.10) | 1.29 | .52 | (.82) |
| Total from investment operations | .80 | (1.19) | .10 | 1.57 | .73 | (.62) |
| Distributions from net investment income | (.01) | (.16) | (.16) | (.15) | (.21) | (.19) |
| Distributions from net realized gain | – | –D | (.02) | (.01) | (.02) | (.01) |
| Total distributions | (.01) | (.16) | (.18) | (.17)E | (.23) | (.20) |
| Redemption fees added to paid in capitalB,D | – | – | – | – | – | – |
| Net asset value, end of period | $8.21 | $7.42 | $8.77 | $8.85 | $7.45 | $6.95 |
| Total ReturnF,G | 10.72% | (13.71)% | 1.25% | 21.21% | 10.64% | (7.81)% |
| Ratios to Average Net AssetsH,I | ||||||
| Expenses before reductions | .62%J | .62% | .62% | .62% | .62% | .62% |
| Expenses net of fee waivers, if any | .62%J | .62% | .62% | .62% | .62% | .62% |
| Expenses net of all reductions | .62%J | .62% | .62% | .62% | .62% | .62% |
| Net investment income (loss) | 3.80%J | 2.27% | 2.31% | 3.40%C | 3.04% | 2.84% |
| Supplemental Data | ||||||
| Net assets, end of period (000 omitted) | $174,279 | $152,699 | $105,360 | $44,828 | $30,412 | $26,066 |
| Portfolio turnover rateK | 72%J | 77% | 75% | 63% | 56% | 49% |
A For the year ended February 29.
B Calculated based on average shares outstanding during the period.
C Net Investment income per share reflects a large, non-recurring dividend which amounted to $.06 per share. Excluding this non-recurring dividend, the ratio of net investment income (loss) to average net assets would have been 2.64%.
D Amount represents less than $.005 per share.
E Total distributions of $.17 per share is comprised of distributions from net investment income of $.153 and distributions from net realized gain of $.013 per share.
F Total returns for periods of less than one year are not annualized.
G Total returns would have been lower if certain expenses had not been reduced during the applicable periods shown.
H Fees and expenses of any underlying Fidelity Central Funds are not included in the Fund's expense ratio. The Fund indirectly bears its proportionate share of the expenses of any underlying Fidelity Central Funds.
I Expense ratios reflect operating expenses of the Fund. Expenses before reductions do not reflect amounts reimbursed by the investment adviser or reductions from expense offset arrangements and do not represent the amount paid by the Fund during periods when reimbursements or reductions occur. Expenses net of fee waivers reflect expenses after reimbursement by the investment adviser but prior to reductions from expense offset arrangements. Expenses net of all reductions represent the net expenses paid by the Fund.
J Annualized
K Amount does not include the portfolio activity of any underlying Fidelity Central Funds.
See accompanying notes which are an integral part of the financial statements.
Notes to Financial Statements (Unaudited)
For the period ended August 31, 2016
1. Organization.
Fidelity Large Cap Growth Enhanced Index Fund, Fidelity Large Cap Value Enhanced Index Fund, Fidelity Large Cap Core Enhanced Index Fund, Fidelity Mid Cap Enhanced Index Fund, Fidelity Small Cap Enhanced Index Fund and Fidelity International Enhanced Index Fund (the Funds) are funds of Fidelity Commonwealth Trust II (the Trust) and are authorized to issue an unlimited number of shares. Share transactions on the Statement of Changes in Net Assets may contain exchanges between affiliated funds. The Trust is registered under the Investment Company Act of 1940, as amended (the 1940 Act), as an open-end management investment company organized as a Delaware statutory trust.
2. Significant Accounting Policies.
The financial statements have been prepared in conformity with accounting principles generally accepted in the United States of America (GAAP), which require management to make certain estimates and assumptions at the date of the financial statements. Actual results could differ from those estimates. Subsequent events, if any, through the date that the financial statements were issued have been evaluated in the preparation of the financial statements. The following summarizes the significant accounting policies of the Funds:
Investment Valuation. Investments are valued as of 4:00 p.m. Eastern time on the last calendar day of the period. The Board of Trustees (the Board) has delegated the day to day responsibility for the valuation of each Fund's investments to the Strategic Advisers, Inc. (Strategic Advisers) Fair Value Committee (the Committee). In accordance with valuation policies and procedures approved by the Board, each Fund attempts to obtain prices from one or more third party pricing vendors or brokers to value its investments. When current market prices, quotations or currency exchange rates are not readily available or reliable, investments will be fair valued in good faith by the Committee, in accordance with procedures adopted by the Board. Factors used in determining fair value vary by investment type and may include market or investment specific events, changes in interest rates and credit quality. The frequency with which these procedures are used cannot be predicted and they may be utilized to a significant extent. The Committee oversees each Fund's valuation policies and procedures and reports to the Board on the Committee's activities and fair value determinations. The Board monitors the appropriateness of the procedures used in valuing each Fund's investments and ratifies the fair value determinations of the Committee.
Each Fund categorizes the inputs to valuation techniques used to value its investments into a disclosure hierarchy consisting of three levels as shown below:
- Level 1 – quoted prices in active markets for identical investments
- Level 2 – other significant observable inputs (including quoted prices for similar investments, interest rates, prepayment speeds, etc.)
- Level 3 – unobservable inputs (including the Fund's own assumptions based on the best information available)
Valuation techniques used to value each Fund's investments by major category are as follows:
Equity securities, including restricted securities, for which market quotations are readily available, are valued at the last reported sale price or official closing price as reported by a third party pricing vendor on the primary market or exchange on which they are traded and are categorized as Level 1 in the hierarchy. In the event there were no sales during the day or closing prices are not available, securities are valued at the last quoted bid price or may be valued using the last available price and are generally categorized as Level 2 in the hierarchy. For foreign equity securities, when market or security specific events arise, comparisons to the valuation of American Depositary Receipts (ADRs), futures contracts, Exchange-Traded Funds (ETFs) and certain indexes as well as quoted prices for similar securities may be used and would be categorized as Level 2 in the hierarchy. Utilizing these techniques may result in transfers between Level 1 and Level 2. For equity securities, including restricted securities, where observable inputs are limited, assumptions about market activity and risk are used and these securities may be categorized as Level 3 in the hierarchy.
Debt securities, including restricted securities, are valued based on evaluated prices received from third party pricing vendors or from brokers who make markets in such securities. U.S. government and government agency obligations are valued by pricing vendors who utilize matrix pricing which considers yield or price of bonds of comparable quality, coupon, maturity and type or by broker-supplied prices. When independent prices are unavailable or unreliable, debt securities may be valued utilizing pricing methodologies which consider similar factors that would be used by third party pricing vendors. Debt securities are generally categorized as Level 2 in the hierarchy but may be Level 3 depending on the circumstances.
Futures contracts are valued at the settlement price established each day by the board of trade or exchange on which they are traded and are categorized as Level 1 in the hierarchy. Investments in open-end mutual funds, including the Fidelity Central Funds, are valued at their closing net asset value (NAV) each business day and are categorized as Level 1 in the hierarchy. If an unaffiliated open-end mutual fund's NAV is unavailable, shares of that fund may be valued by another method that the Board believes reflects fair value in accordance with the Board's fair value pricing policies and is categorized as Level 2 in the hierarchy. Short-term securities with remaining maturities of sixty days or less may be valued at amortized cost, which approximates fair value, and are categorized as Level 2 in the hierarchy.
Changes in valuation techniques may result in transfers in or out of an assigned level within the disclosure hierarchy. The aggregate value of investments by input level as of August 31, 2016, including information on transfers between Levels 1 and 2, is included at the end of each Fund's Schedule of Investments.
Foreign Currency. The Funds may use foreign currency contracts to facilitate transactions in foreign-denominated securities. Gains and losses from these transactions may arise from changes in the value of the foreign currency or if the counterparties do not perform under the contracts' terms.
Foreign-denominated assets, including investment securities, and liabilities are translated into U.S. dollars at the exchange rates at period end. Purchases and sales of investment securities, income and dividends received and expenses denominated in foreign currencies are translated into U.S. dollars at the exchange rate in effect on the transaction date.
The effects of exchange rate fluctuations on investments are included with the net realized and unrealized gain (loss) on investment securities. Other foreign currency transactions resulting in realized and unrealized gain (loss) are disclosed separately.
Investment Transactions and Income. For financial reporting purposes, the Funds' investment holdings and NAV include trades executed through the end of the last business day of the period. The NAV per share for processing shareholder transactions is calculated as of the close of business of the New York Stock Exchange (NYSE), normally 4:00 p.m. Eastern time and includes trades executed through the end of the prior business day. Gains and losses on securities sold are determined on the basis of identified cost and may include proceeds received from litigation. Dividend income is recorded on the ex-dividend date, except for certain dividends from foreign securities where the ex-dividend date may have passed, which are recorded as soon as the Funds are informed of the ex-dividend date. Non-cash dividends included in dividend income, if any, are recorded at the fair market value of the securities received. Income and capital gain distributions from Fidelity Central Funds, if any, are recorded on the ex-dividend date. Distributions received on securities that represent a return of capital or capital gain are recorded as a reduction of cost of investments and/or as a realized gain. Subsequent to ex-dividend date the Funds determine the components of these distributions, based upon receipt of tax filings or other correspondence relating to the underlying investment. Interest income is accrued as earned and includes coupon interest and amortization of premium and accretion of discount on debt securities as applicable. Investment income is recorded net of foreign taxes withheld where recovery of such taxes is uncertain.
Expenses. Expenses directly attributable to a fund are charged to that fund. Expenses attributable to more than one fund are allocated among the respective funds on the basis of relative net assets or other appropriate methods. Expense estimates are accrued in the period to which they relate and adjustments are made when actual amounts are known.
Income Tax Information and Distributions to Shareholders. Each year, each Fund intends to qualify as a regulated investment company under Subchapter M of the Internal Revenue Code, including distributing substantially all of its taxable income and realized gains. As a result, no provision for U.S. Federal income taxes is required. Each Fund files a U.S. federal tax return, in addition to state and local tax returns as required. Each Fund's federal income tax returns are subject to examination by the Internal Revenue Service (IRS) for a period of three fiscal years after they are filed. State and local tax returns may be subject to examination for an additional fiscal year depending on the jurisdiction. Foreign taxes are provided for based on each Fund's understanding of the tax rules and rates that exist in the foreign markets in which it invests.
Distributions are declared and recorded on the ex-dividend date. Income and capital gain distributions are determined in accordance with income tax regulations, which may differ from GAAP.
Capital accounts within the financial statements are adjusted for permanent book-tax differences. These adjustments have no impact on net assets or the results of operations. Capital accounts are not adjusted for temporary book-tax differences which will reverse in a subsequent period.
Book-tax differences are primarily due to foreign currency transactions, futures contracts, partnerships, market discount, passive foreign investment companies (PFIC), capital loss carryforwards and losses deferred due to wash sales and excise tax regulations.
The federal tax cost of investment securities and unrealized appreciation (depreciation) as of period end were as follows for each Fund:
| Tax cost | Gross unrealized appreciation | Gross unrealized depreciation | Net unrealized appreciation (depreciation) on securities | |
| Fidelity Large Cap Growth Enhanced Index Fund | $618,844,210 | $104,996,012 | $(13,676,696) | $91,319,316 |
| Fidelity Large Cap Value Enhanced Index Fund | 1,907,165,022 | 179,588,560 | (50,731,759) | 128,856,801 |
| Fidelity Large Cap Core Enhanced Index Fund | 429,914,929 | 76,170,123 | (11,613,003) | 64,557,120 |
| Fidelity Mid Cap Enhanced Index Fund | 1,017,727,815 | 108,572,585 | (45,011,471) | 63,561,114 |
| Fidelity Small Cap Enhanced Index Fund | 634,189,582 | 96,701,509 | (34,175,135) | 62,526,374 |
| Fidelity International Enhanced Index Fund | 173,360,535 | 13,454,963 | (11,128,421) | 2,326,542 |
Capital loss carryforwards are only available to offset future capital gains of the Funds to the extent provided by regulations and may be limited. Under the Regulated Investment Company Modernization Act of 2010 (the Act), the Funds are permitted to carry forward capital losses incurred in taxable years beginning after December 22, 2010 for an unlimited period and such capital losses are required to be used prior to any losses that expire. The capital loss carryforward information presented below, including any applicable limitation, is estimated as of prior fiscal period end and is subject to adjustment.
| Fiscal year of expiration | |||
| 2018 | 2019 | Total with expiration | |
| Fidelity Large Cap Core Enhanced Index Fund | $(8,806,234) | $– | $(8,806,234) |
| Fidelity International Enhanced Index Fund | – | (545,047) | (545,047) |
| No expiration | ||||
| Short-term | Long-term | Total no expiration | Total capital loss carryforward | |
| Fidelity International Enhanced Index Fund | $(5,592,435) | $(1,664,060) | $(7,256,495) | $(7,801,543) |
Due to large redemptions in a prior period, capital losses that will be available to offset future capital gains of Fidelity Large Cap Core Enhanced Index Fund will be limited to approximately $4,403,117 per year.
Certain of the Funds elected to defer to the next fiscal year capital losses recognized during the period November 1, 2015 to February 29, 2016. Loss deferrals were as follows:
| Capital losses | |
| Fidelity Large Cap Growth Enhanced Index Fund | $(4,000,854) |
| Fidelity Large Cap Value Enhanced Index Fund | (24,174,317) |
| Fidelity Large Cap Core Enhanced Index Fund | (6,741,590) |
| Fidelity Mid Cap Enhanced Index Fund | (17,690,140) |
| Fidelity Small Cap Enhanced Index Fund | (11,352,650) |
Short Term Trading (Redemption) Fees. Shares held by investors of Fidelity Small Cap Enhanced Index Fund less than 90 days may be subject to a redemption fee equal to 1.50% of the NAV of shares redeemed. Shares held by investors of Fidelity Mid Cap Enhanced Index Fund and Fidelity International Enhanced Index Fund less than 30 days may be subject to a redemption fee equal to 0.75% and 1.00%, respectively, of the net asset value of shares redeemed. All redemption fees, which reduce the proceeds of the shareholder redemption, are retained by the Funds and accounted for as an addition to paid in capital.
3. Derivative Instruments.
Risk Exposures and the Use of Derivative Instruments. The Funds' investment objective allows the Funds to enter into various types of derivative contracts, including futures contracts. Derivatives are investments whose value is primarily derived from underlying assets, indices or reference rates and may be transacted on an exchange or over-the-counter (OTC). Derivatives may involve a future commitment to buy or sell a specified asset based on specified terms, to exchange future cash flows at periodic intervals based on a notional principal amount, or for one party to make one or more payments upon the occurrence of specified events in exchange for periodic payments from the other party.
The Funds used derivatives to increase returns and to manage exposure to certain risks as defined below. The success of any strategy involving derivatives depends on analysis of numerous economic factors, and if the strategies for investment do not work as intended, the Funds may not achieve their objectives.
The Funds' use of derivatives increased or decreased their exposure to the following risk:
| Equity Risk | Equity risk relates to the fluctuations in the value of financial instruments as a result of changes in market prices (other than those arising from interest rate risk or foreign exchange risk), whether caused by factors specific to an individual investment, its issuer, or all factors affecting all instruments traded in a market or market segment. |
The Funds are also exposed to additional risks from investing in derivatives, such as liquidity risk and counterparty credit risk. Liquidity risk is the risk that the Funds will be unable to close out the derivative in the open market in a timely manner. Counterparty credit risk is the risk that the counterparty will not be able to fulfill its obligation to the Funds. Counterparty credit risk related to exchange-traded futures contracts may be mitigated by the protection provided by the exchange on which they trade.
Investing in derivatives may involve greater risks than investing in the underlying assets directly and, to varying degrees, may involve risk of loss in excess of any initial investment and collateral received and amounts recognized in the Statement of Assets and Liabilities. In addition, there may be the risk that the change in value of the derivative contract does not correspond to the change in value of the underlying instrument.
Net Realized Gain (Loss) and Change in Net Unrealized Appreciation (Depreciation) on Derivatives. The table below, which reflects the impacts of derivatives on the financial performance of the Funds, summarizes the net realized gain (loss) and change in net unrealized appreciation (depreciation) for derivatives during the period as presented in the Statement of Operations.
| Primary Risk Exposure / Derivative Type | Net Realized Gain (Loss) | Change in Net Unrealized Appreciation (Depreciation) |
| Fidelity Large Cap Growth Enhanced Index Fund | ||
| Equity Risk | ||
| Futures Contracts(a) | $699,061 | $522,075 |
| Fidelity Large Cap Value Enhanced Index Fund | ||
| Equity Risk | ||
| Futures Contracts(a) | 1,547,793 | 803,563 |
| Fidelity Large Cap Core Enhanced Index Fund | ||
| Equity Risk | ||
| Futures Contracts(a) | 504,439 | 78,552 |
| Fidelity Mid Cap Enhanced Index Fund | ||
| Equity Risk | ||
| Futures Contracts(a) | 1,316,756 | 364,137 |
| Fidelity Small Cap Enhanced Index Fund | ||
| Equity Risk | ||
| Futures Contracts(a) | 1,118,359 | 1,150,531 |
| Fidelity International Enhanced Index Fund | ||
| Equity Risk | ||
| Futures Contracts(a) | 160,246 | 187,101 |
(a) A summary of the value of derivatives by primary risk exposure as of period end is included at the end of the Schedule of Investments
Futures Contracts. A futures contract is an agreement between two parties to buy or sell a specified underlying instrument for a fixed price at a specified future date. The Funds used futures contracts to manage their exposure to the stock market.
Upon entering into a futures contract, a fund is required to deposit either cash or securities (initial margin) with a clearing broker in an amount equal to a certain percentage of the face value of the contract. Futures contracts are marked-to-market daily and subsequent daily payments (variation margin) are made or received by a fund depending on the daily fluctuations in the value of the futures contracts and are recorded as unrealized appreciation or (depreciation). This receivable and/or payable, if any, is included in daily variation margin for derivative instruments in the Statement of Assets and Liabilities. Realized gain or (loss) is recorded upon the expiration or closing of a futures contract.
Any open futures contracts at period end are presented in the Schedule of Investments under the caption "Futures Contracts". The underlying face amount at value reflects each contract's exposure to the underlying instrument or index at period end and is representative of volume of activity during the period. Securities deposited to meet initial margin requirements are identified in the Schedule of Investments.
4. Purchases and Sales of Investments.
Purchases and sales of securities, other than short-term securities, are noted in the table below.
| Purchases ($) | Sales ($) | |
| Fidelity Large Cap Growth Enhanced Index Fund | 421,066,596 | 258,527,362 |
| Fidelity Large Cap Value Enhanced Index Fund | 1,023,660,588 | 817,308,652 |
| Fidelity Large Cap Core Enhanced Index Fund | 227,584,794 | 197,281,642 |
| Fidelity Mid Cap Enhanced Index Fund | 499,389,483 | 420,892,820 |
| Fidelity Small Cap Enhanced Index Fund | 239,347,676 | 239,782,611 |
| Fidelity International Enhanced Index Fund | 66,359,773 | 58,535,788 |
5. Fees and Other Transactions with Affiliates.
Management Fee and Expense Contract. FMR Co., Inc. (the investment adviser), an affiliate of Fidelity Management & Research Company (FMR), provides the Funds with investment management related services. For these services, the Funds pay a monthly management fee to the investment adviser. The management fee is based on an annual rate of 0.30% of average net assets for Fidelity Large Cap Growth Enhanced Index, Fidelity Large Cap Value Enhanced Index and Fidelity Large Cap Core Enhanced Index, 0.45% of average net assets for Fidelity Mid Cap Enhanced Index, 0.52% of average net assets for Fidelity Small Cap Enhanced Index and 0.47% of average net assets for Fidelity International Enhanced Index. Under the management contract, the investment adviser pays all other ordinary fund-wide operating expenses (such as custody, audit, legal and pricing and bookkeeping fees), except the compensation of the independent Trustees and certain other expenses such as interest expense. The management fee is reduced by an amount equal to the fees and expenses paid by the Funds to the independent Trustees.
In addition, under the expense contract, the investment adviser pays other expenses such as those listed above for each of the Funds so that the total expenses do not exceed certain amounts of each Fund's average net assets with certain exceptions, as noted in the following table:
| Fidelity Large Cap Growth Enhanced Index Fund | .45% |
| Fidelity Large Cap Value Enhanced Index Fund | .45% |
| Fidelity Large Cap Core Enhanced Index Fund | .45% |
| Fidelity Mid Cap Enhanced Index Fund | .60% |
| Fidelity Small Cap Enhanced Index Fund | .67% |
| Fidelity International Enhanced Index Fund | .62% |
Sub-Adviser. Geode Capital Management, LLC (Geode), serves as sub-adviser for the Funds. Geode provides discretionary investment advisory services to the Funds and is paid by the investment adviser for providing these services.
Transfer Agent Fees. Fidelity Investments Institutional Operations Company, Inc. (FIIOC), an affiliate of the investment adviser, is the Funds' transfer, dividend disbursing and shareholder servicing agent. FIIOC receives account fees and asset-based fees that vary according to type of account. FIIOC pays for typesetting, printing and mailing of shareholder reports, except proxy statements. Under the expense contract, each fund paid transfer agent fees at the annualized rate of .15% of average net assets.
6. Investments in Fidelity Central Funds.
The Funds invest in Fidelity Central Funds, which are open-end investment companies available only to other investment companies and accounts managed by the investment adviser and its affiliates. The Funds' Schedules of Investments list each of the Fidelity Central Funds held as of period end, if any, as an investment of each Fund, but does not include the underlying holdings of each Fidelity Central Fund. As an Investing Fund, each Fund indirectly bears its proportionate share of the expenses of the underlying Fidelity Central Funds.
The Fidelity Securities Lending Cash Central Fund seeks preservation of capital and current income and is managed by Fidelity Investments Money Management, Inc. (FIMM), an affiliate of the investment adviser. Annualized expenses of the Money Market Central Funds as of their most recent shareholder report date are less than .005%.
A complete unaudited list of holdings for each Fidelity Central Fund is available upon request or at the Securities and Exchange Commission (the SEC) website at www.sec.gov. In addition, the financial statements of the Fidelity Central Funds are available on the SEC website or upon request.
Interfund Trades. The Funds may purchase from or sell securities to other Fidelity Funds under procedures adopted by the Board. The procedures have been designed to ensure these interfund trades are executed in accordance with Rule 17a-7 of the 1940 Act. Interfund trades are included within the respective purchases and sales amounts shown in the Purchases and Sales of Investments note.
7. Committed Line of Credit.
Certain Funds participate with other funds managed by the investment adviser or an affiliate in a $4.25 billion credit facility (the "line of credit") to be utilized for temporary or emergency purposes to fund shareholder redemptions or for other short-term liquidity purposes. The participating funds have agreed to pay commitment fees on their pro-rata portion of the line of credit, which are reflected in Miscellaneous expenses on the Statement of Operations, and are as follows:
| Fidelity Large Cap Growth Enhanced Index Fund | $724 |
| Fidelity Large Cap Value Enhanced Index Fund | 2,376 |
| Fidelity Large Cap Core Enhanced Index Fund | 617 |
| Fidelity Mid Cap Enhanced Index Fund | 1,204 |
| Fidelity Small Cap Enhanced Index Fund | 763 |
| Fidelity International Enhanced Index Fund | 227 |
During the period, the Funds did not borrow on this line of credit.
8. Security Lending.
Certain Funds lend portfolio securities through a lending agent from time to time in order to earn additional income. On the settlement date of the loan, each applicable Fund receives collateral (in the form of U.S. Treasury obligations, letters of credit and/or cash) against the loaned securities and maintains collateral in an amount not less than 100% of the market value of the loaned securities during the period of the loan. The market value of the loaned securities is determined at the close of business of the Funds and any additional required collateral is delivered to the Funds on the next business day. The Funds or borrower may terminate the loan at any time, and if the borrower defaults on its obligation to return the securities loaned because of insolvency or other reasons, the Funds may apply collateral received from the borrower against the obligation. The Funds may experience delays and costs in recovering the securities loaned. Any cash collateral received is invested in the Fidelity Securities Lending Cash Central Fund. The value of loaned securities and cash collateral at period end are disclosed on each applicable Fund's Statement of Assets and Liabilities. Security lending income represents the income earned on investing cash collateral, less rebates paid to borrowers and any lending agent fees associated with the loan, plus any premium payments received for lending certain types of securities. Security lending income is presented on each applicable Fund's Statement of Operations as a component of income from Fidelity Central Funds.
9. Expense Reductions.
Through arrangements with each applicable Fund's custodian, credits realized as a result of certain uninvested cash balances were used to reduce each applicable Fund's expenses. All of the applicable expense reductions are noted in the table below.
| Expense reduction | |
| Fidelity Large Cap Growth Enhanced Index Fund | $108 |
| Fidelity Large Cap Value Enhanced Index Fund | 150 |
| Fidelity Large Cap Core Enhanced Index Fund | 66 |
| Fidelity Mid Cap Enhanced Index Fund | 75 |
| Fidelity Small Cap Enhanced Index Fund | 225 |
| Fidelity International Enhanced Index Fund | 19 |
10. Other.
The Funds' organizational documents provide former and current trustees and officers with a limited indemnification against liabilities arising in connection with the performance of their duties to the Funds. In the normal course of business, the Funds may also enter into contracts that provide general indemnifications. The Funds' maximum exposure under these arrangements is unknown as this would be dependent on future claims that may be made against the Funds. The risk of material loss from such claims is considered remote.
Shareholder Expense Example
As a shareholder of the Fund, you incur two types of costs: (1) transaction costs, including redemption fees and (2) ongoing costs, including management fees and other Fund expenses. This Example is intended to help you understand your ongoing costs (in dollars) of investing in the Fund and to compare these costs with the ongoing costs of investing in other mutual funds.
The Example is based on an investment of $1,000 invested at the beginning of the period and held for the entire period (March 1, 2016 to August 31, 2016).
Actual Expenses
The first line of the accompanying table for each fund provides information about actual account values and actual expenses. You may use the information in this line, together with the amount you invested, to estimate the expenses that you paid over the period. Simply divide your account value by $1,000.00 (for example, an $8,600 account value divided by $1,000.00 = 8.6), then multiply the result by the number in the first line for a fund under the heading entitled "Expenses Paid During Period" to estimate the expenses you paid on your account during this period. In addition to the direct expenses incurred by each Fund presented in the table, as a shareholder of the underlying non-affiliated funds (the Underlying Funds), each Fund also indirectly bears its proportionate share of the expenses of the Underlying Funds. These fees and expenses are not included in each Fund's annualized expense ratio used to calculate the expense estimate in the table below. A small balance maintenance fee of $12.00 that is charged once a year may apply for certain accounts with a value of less than $2,000. This fee is not included in the table below. If it was, the estimate of expenses you paid during the period would be higher, and your ending account value lower, by this amount. In addition, each Fund, as a shareholder in the underlying Fidelity Central Funds, will indirectly bear its pro-rata share of the fees and expenses incurred by the underlying Fidelity Central Funds. These fees and expenses are not included in the Fund's annualized expense ratio used to calculate the expense estimate in the table below.
Hypothetical Example for Comparison Purposes
The second line of the accompanying table for each fund provides information about hypothetical account values and hypothetical expenses based on a fund's actual expense ratio and an assumed rate of return of 5% per year before expenses, which is not the Fund's actual return. The hypothetical account values and expenses may not be used to estimate the actual ending account balance or expenses you paid for the period. You may use this information to compare the ongoing costs of investing in the Fund and other funds. To do so, compare this 5% hypothetical example with the 5% hypothetical examples that appear in the shareholder reports of the other funds. In addition to the direct expenses incurred by each Fund presented in the table, as a shareholder of the underlying non-affiliated funds (the Underlying Funds), each Fund also indirectly bears its proportionate share of the expenses of the Underlying Funds. These fees and expenses are not included in each Fund's annualized expense ratio used to calculate the expense estimate in the table below. A small balance maintenance fee of $12.00 that is charged once a year may apply for certain accounts with a value of less than $2,000. This fee is not included in the table below. If it was, the estimate of expenses you paid during the period would be higher, and your ending account value lower, by this amount. In addition, each Fund, as a shareholder in the underlying Fidelity Central Funds, will indirectly bear its pro-rata share of the fees and expenses incurred by the underlying Fidelity Central Funds. These fees and expenses are not included in the Fund's annualized expense ratio used to calculate the expense estimate in the table below.
Please note that the expenses shown in the table are meant to highlight your ongoing costs only and do not reflect any transaction costs. Therefore, the second line of the table is useful in comparing ongoing costs only, and will not help you determine the relative total costs of owning different funds. In addition, if these transactional costs were included, your costs would have been higher.
| Annualized Expense Ratio-A | Beginning Account Value March 1, 2016 | Ending Account Value August 31, 2016 | Expenses Paid During Period-B March 1, 2016 to August 31, 2016 | |
| Fidelity Large Cap Growth Enhanced Index Fund | .45% | |||
| Actual | $1,000.00 | $1,105.30 | $2.39 | |
| Hypothetical-C | $1,000.00 | $1,022.94 | $2.29 | |
| Fidelity Large Cap Value Enhanced Index Fund | .45% | |||
| Actual | $1,000.00 | $1,142.90 | $2.43 | |
| Hypothetical-C | $1,000.00 | $1,022.94 | $2.29 | |
| Fidelity Large Cap Core Enhanced Index Fund | .45% | |||
| Actual | $1,000.00 | $1,119.10 | $2.40 | |
| Hypothetical-C | $1,000.00 | $1,022.94 | $2.29 | |
| Fidelity Mid Cap Enhanced Index Fund | .60% | |||
| Actual | $1,000.00 | $1,126.90 | $3.22 | |
| Hypothetical-C | $1,000.00 | $1,022.18 | $3.06 | |
| Fidelity Small Cap Enhanced Index Fund | .67% | |||
| Actual | $1,000.00 | $1,147.40 | $3.63 | |
| Hypothetical-C | $1,000.00 | $1,021.83 | $3.41 | |
| Fidelity International Enhanced Index Fund | .62% | |||
| Actual | $1,000.00 | $1,107.20 | $3.29 | |
| Hypothetical-C | $1,000.00 | $1,022.08 | $3.16 |
A Annualized expense ratio reflects expenses net of applicable fee waivers.
B Expenses are equal to each Fund's annualized expense ratio, multiplied by the average account value over the period, multiplied by 184/365 (to reflect the one-half year period).
C 5% return per year before expenses
![]()
GEI-SANN-1016
1.855142.109
Item 2.
Code of Ethics
Not applicable.
Item 3.
Audit Committee Financial Expert
Not applicable.
Item 4.
Principal Accountant Fees and Services
Not applicable.
Item 5.
Audit Committee of Listed Registrants
Not applicable.
Item 6.
Investments
(a)
Not applicable.
(b)
Not applicable
Item 7.
Disclosure of Proxy Voting Policies and Procedures for Closed-End Management Investment Companies
Not applicable.
Item 8.
Portfolio Managers of Closed-End Management Investment Companies
Not applicable.
Item 9.
Purchase of Equity Securities by Closed-End Management Investment Company and Affiliated Purchasers
Not applicable.
Item 10.
Submission of Matters to a Vote of Security Holders
There were no material changes to the procedures by which shareholders may recommend nominees to the Fidelity Commonwealth Trust II’s Board of Trustees.
Item 11.
Controls and Procedures
(a)(i) The President and Treasurer and the Chief Financial Officer have concluded that the Fidelity Commonwealth Trust II’s (the “Trust”) disclosure controls and procedures (as defined in Rule 30a-3(c) under the Investment Company Act) provide reasonable
assurances that material information relating to the Trust is made known to them by the appropriate persons, based on their evaluation of these controls and procedures as of a date within 90 days of the filing date of this report.
(a)(ii) There was no change in the Trust’s internal control over financial reporting (as defined in Rule 30a-3(d) under the Investment Company Act) that occurred during the second fiscal quarter of the period covered by this report that has materially affected, or is reasonably likely to materially affect, the Trust’s internal control over financial reporting.
Item 12.
Exhibits
(a) | (1) | Not applicable. |
(a) | (2) | Certification pursuant to Rule 30a-2(a) under the Investment Company Act of 1940 (17 CFR 270.30a-2(a)) is filed and attached hereto as Exhibit 99.CERT. |
(a) | (3) | Not applicable. |
(b) | Certification pursuant to Rule 30a-2(b) under the Investment Company Act of 1940 (17 CFR 270.30a-2(b)) is furnished and attached hereto as Exhibit 99.906CERT. |
SIGNATURES
Pursuant to the requirements of the Securities Exchange Act of 1934 and the Investment Company Act of 1940, the registrant has duly caused this report to be signed on its behalf by the undersigned, thereunto duly authorized.
Fidelity Commonwealth Trust II
By: | /s/Stephanie J. Dorsey |
Stephanie J. Dorsey | |
President and Treasurer | |
Date: | October 25, 2016 |
Pursuant to the requirements of the Securities Exchange Act of 1934 and the Investment Company Act of 1940, this report has been signed below by the following persons on behalf of the registrant and in the capacities and on the dates indicated.
By: | /s/Stephanie J. Dorsey |
Stephanie J. Dorsey | |
President and Treasurer | |
Date: | October 25, 2016 |
By: | /s/Howard J. Galligan III |
Howard J. Galligan III | |
Chief Financial Officer | |
Date: | October 25, 2016 |