UNITED STATES
SECURITIES AND EXCHANGE COMMISSION
Washington, D.C. 20549
FORM N-CSR
CERTIFIED SHAREHOLDER REPORT OF REGISTERED
MANAGEMENT INVESTMENT COMPANIES
Investment Company Act file number 811-21990
Fidelity Commonwealth Trust II
(Exact name of registrant as specified in charter)
245 Summer St., Boston, Massachusetts 02210
(Address of principal executive offices) (Zip code)
Cynthia Lo Bessette, Secretary
245 Summer St.
Boston, Massachusetts 02210
(Name and address of agent for service)
Registrant's telephone number, including area code:
617-563-7000
Date of fiscal year end: | August 31 |
|
|
Date of reporting period: | August 31, 2019 |
Item 1.
Reports to Stockholders
Fidelity® Large Cap Growth Enhanced Index Fund Fidelity® Large Cap Value Enhanced Index Fund Fidelity® Large Cap Core Enhanced Index Fund Fidelity® Mid Cap Enhanced Index Fund Fidelity® International Enhanced Index Fund Annual Report August 31, 2019 |
 |
Beginning on January 1, 2021, as permitted by regulations adopted by the Securities and Exchange Commission, paper copies of a fund’s shareholder reports will no longer be sent by mail, unless you specifically request paper copies of the reports from the fund or from your financial intermediary, such as a financial advisor, broker-dealer or bank. Instead, the reports will be made available on a website, and you will be notified by mail each time a report is posted and provided with a website link to access the report.
If you already elected to receive shareholder reports electronically, you will not be affected by this change and you need not take any action. You may elect to receive shareholder reports and other communications from a fund electronically, by contacting your financial intermediary. For Fidelity customers, visit Fidelity's web site or call Fidelity using the contact information listed below.
You may elect to receive all future reports in paper free of charge. If you wish to continue receiving paper copies of your shareholder reports, you may contact your financial intermediary or, if you are a Fidelity customer, visit Fidelity’s website, or call Fidelity at the applicable toll-free number listed below. Your election to receive reports in paper will apply to all funds held with the fund complex/your financial intermediary.
| Account Type | Website | Phone Number |
| Brokerage, Mutual Fund, or Annuity Contracts: | fidelity.com/mailpreferences | 1-800-343-3548 |
| Employer Provided Retirement Accounts: | netbenefits.fidelity.com/preferences (choose 'no' under Required Disclosures to continue to print) | 1-800-343-0860 |
| Advisor Sold Accounts Serviced Through Your Financial Intermediary: | Contact Your Financial Intermediary | Your Financial Intermediary's phone number |
| Advisor Sold Accounts Serviced by Fidelity: | institutional.fidelity.com | 1-877-208-0098 |
Contents
To view a fund's proxy voting guidelines and proxy voting record for the 12-month period ended June 30, visit http://www.fidelity.com/proxyvotingresults or visit the Securities and Exchange Commission's (SEC) web site at http://www.sec.gov.
You may also call 1-800-544-8544 to request a free copy of the proxy voting guidelines.
The funds or securities referred to herein are not sponsored, endorsed, or promoted by MSCI, and MSCI bears no liability with respect to any such funds or securities or any index on which such funds or securities are based. The prospectus contains a more detailed description of the limited relationship MSCI has with Fidelity and any related funds.
Standard & Poor's, S&P and S&P 500 are registered service marks of The McGraw-Hill Companies, Inc. and have been licensed for use by Fidelity Distributors Corporation.
Other third-party marks appearing herein are the property of their respective owners.
All other marks appearing herein are registered or unregistered trademarks or service marks of FMR LLC or an affiliated company. © 2019 FMR LLC. All rights reserved.
This report and the financial statements contained herein are submitted for the general information of the shareholders of the Funds. This report is not authorized for distribution to prospective investors in the Funds unless preceded or accompanied by an effective prospectus.
A fund files its complete schedule of portfolio holdings with the SEC for the first and third quarters of each fiscal year on Form N-PORT. Forms N-PORT are available on the SEC’s web site at http://www.sec.gov. A fund's Forms N-PORT may be reviewed and copied at the SEC’s Public Reference Room in Washington, DC. Information regarding the operation of the SEC's Public Reference Room may be obtained by calling 1-800-SEC-0330.
For a complete list of a fund's portfolio holdings, view the most recent holdings listing, semiannual report, or annual report on Fidelity's web site at http://www.fidelity.com, http://www.institutional.fidelity.com, or http://www.401k.com, as applicable.
NOT FDIC INSURED •MAY LOSE VALUE •NO BANK GUARANTEE
Neither the Funds nor Fidelity Distributors Corporation is a bank.
Note to Shareholders:
In January 2019, the Board of Trustees approved to change the funds' investment advisor from FMR Co., Inc. (FMRC) to Fidelity Management & Research Company (FMR) effective February 1, 2019. There was no change to the management fee.
Fidelity® Large Cap Growth Enhanced Index Fund
Performance: The Bottom Line
Average annual total return reflects the change in the value of an investment, assuming reinvestment of distributions from dividend income and capital gains (the profits earned upon the sale of securities that have grown in value, if any) and assuming a constant rate of performance each year. The hypothetical investment and the average annual total returns do not reflect the deduction of taxes that a shareholder would pay on fund distributions or the redemption of fund shares. During periods of reimbursement by Fidelity, a fund’s total return will be greater than it would be had the reimbursement not occurred. How a fund did yesterday is no guarantee of how it will do tomorrow.
Average Annual Total Returns
| For the periods ended August 31, 2019 | Past 1 year | Past 5 years | Past 10 years |
| Fidelity® Large Cap Growth Enhanced Index Fund | 1.28% | 11.12% | 14.34% |
$10,000 Over 10 Years
Let's say hypothetically that $10,000 was invested in Fidelity® Large Cap Growth Enhanced Index Fund on August 31, 2009.
The chart shows how the value of your investment would have changed, and also shows how the Russell 1000® Growth Index performed over the same period.
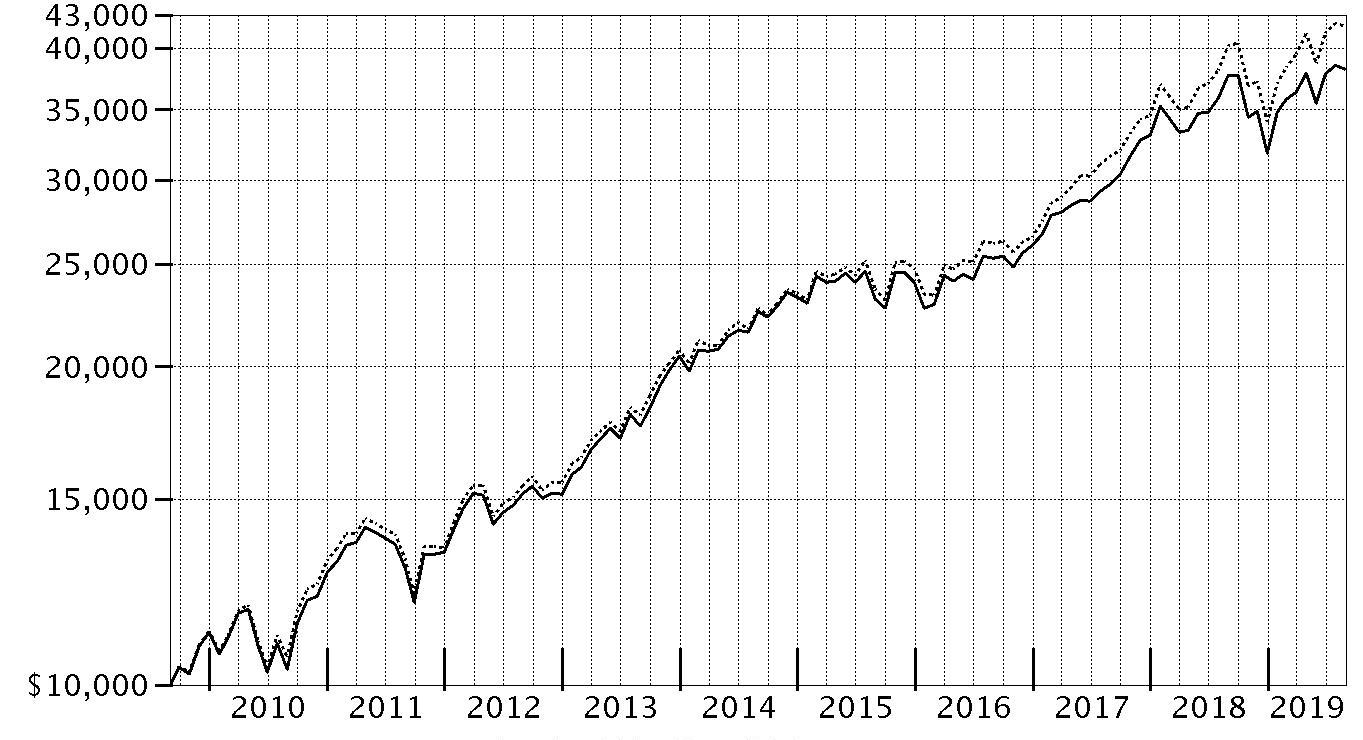
| Period Ending Values | ||
| $38,199 | Fidelity® Large Cap Growth Enhanced Index Fund | |
| $41,941 | Russell 1000® Growth Index | |
Fidelity® Large Cap Growth Enhanced Index Fund
Management's Discussion of Fund Performance
Market Recap: The S&P 500® index gained 2.92% for the 12 months ending August 31, 2019, a choppy period in which stocks seesawed due to trade tension, interest rates, economic data and an inverted yield curve, among other factors. Equities began the new year on a high note after enduring a historically volatile final quarter of 2018. Upbeat company earnings and outlooks, along with signs the Federal Reserve may pause on rates, boosted stocks to an all-time high on April 30. In May, however, the index sunk amid the Fed’s decision to hold interest rates steady and signal it had little appetite to adjust them any time soon, as well as retaliatory tariffs imposed on the U.S. by China. The bull market roared back in June and recorded a series of highs in July, when the Fed cut interest rates for the first time since 2008. Volatility intensified in August, however, as the U.S. Treasury yield curve inverted for the first time since 2007, which some investors viewed as a sign the world's biggest economy could be heading for recession. For the full 12 months, three defensive sectors led the way: utilities (+21%), real estate (+20%) and consumer staples (+16%). The information technology sector rose about 8%, boosted by software & services (+18%), the market’s largest industry segment. Communication services stocks gained roughly 5%. In contrast, energy (-20%) was by far the weakest sector, followed by financials (-3%) and materials (-3%). Other notable laggards included health care (-1%), industrials (+1%) and consumer discretionary (+2%).Comments from Maximilian Kaufmann, Senior Portfolio Manager of the Geode Capital Management, LLC, investment management team: For the fiscal year, the fund gained 1.28%, trailing the 4.27% advance of the benchmark Russell 1000® Growth Index. Security selection in the information technology, materials and health care sectors detracted most from performance, while an underweighting in the outperforming real estate sector also weighed on the portfolio's relative result. Conversely, the fund modestly benefited from picks in consumer staples, although the positive impact was offset by an underweighting in this strong-performing group. Individually, our biggest detractor was biotechnology stock Biogen (-37%), which fell sharply in March following disappointing results in two late-stage drug trials involving its potential treatment for Alzheimer's disease. Meanwhile, the fund's stake in luxury fashion brand company Tapestry (formerly Coach), returned -49% with much of this decline coming late in the period after the company reported weak financial results. Consequently, we sold the stock in August. Another detractor was CarGurus (-33%), a provider of internet automotive research and shopping tools. In contrast, shares of consumer branded-goods company Procter & Gamble (+50%) contributed after reporting strong sales growth trends. Lastly, another holding that added relative value was Red Hat, gaining 27% for the fund. We sold most of this position last October after the company agreed to be acquired by IBM, and then sold our remaining position in July, shortly after the merger closed.The views expressed above reflect those of the portfolio manager(s) only through the end of the period as stated on the cover of this report and do not necessarily represent the views of Fidelity or any other person in the Fidelity organization. Any such views are subject to change at any time based upon market or other conditions and Fidelity disclaims any responsibility to update such views. These views may not be relied on as investment advice and, because investment decisions for a Fidelity fund are based on numerous factors, may not be relied on as an indication of trading intent on behalf of any Fidelity fund.
Fidelity® Large Cap Growth Enhanced Index Fund
Investment Summary (Unaudited)
Top Ten Stocks as of August 31, 2019
| % of fund's net assets | |
| Microsoft Corp. | 7.8 |
| Apple, Inc. | 6.3 |
| Amazon.com, Inc. | 5.6 |
| Facebook, Inc. Class A | 3.7 |
| Visa, Inc. Class A | 2.7 |
| Alphabet, Inc. Class A | 2.5 |
| Alphabet, Inc. Class C | 2.3 |
| MasterCard, Inc. Class A | 2.3 |
| UnitedHealth Group, Inc. | 2.1 |
| Merck & Co., Inc. | 2.0 |
| 37.3 |
Top Market Sectors as of August 31, 2019
| % of fund's net assets | |
| Information Technology | 37.9 |
| Health Care | 16.1 |
| Consumer Discretionary | 14.0 |
| Communication Services | 11.4 |
| Industrials | 8.5 |
| Consumer Staples | 5.9 |
| Financials | 3.8 |
| Real Estate | 1.5 |
| Materials | 0.1 |
Asset Allocation (% of fund's net assets)
| As of August 31, 2019 * | ||
| Stocks and Equity Futures | 100.0% | |

* Foreign investments - 2.8%
Fidelity® Large Cap Growth Enhanced Index Fund
Schedule of Investments August 31, 2019
Showing Percentage of Net Assets
| Common Stocks - 99.2% | |||
| Shares | Value | ||
| COMMUNICATION SERVICES - 11.4% | |||
| Diversified Telecommunication Services - 0.4% | |||
| Verizon Communications, Inc. | 80,022 | $4,654,080 | |
| Entertainment - 1.2% | |||
| Electronic Arts, Inc. (a) | 44,837 | 4,200,330 | |
| Netflix, Inc. (a) | 29,153 | 8,563,694 | |
| 12,764,024 | |||
| Interactive Media & Services - 8.6% | |||
| Alphabet, Inc.: | |||
| Class A (a) | 23,495 | 27,971,502 | |
| Class C (a) | 21,860 | 25,971,866 | |
| CarGurus, Inc. Class A (a)(b) | 29,518 | 962,877 | |
| Facebook, Inc. Class A (a) | 217,564 | 40,395,108 | |
| 95,301,353 | |||
| Media - 1.1% | |||
| Comcast Corp. Class A | 133,926 | 5,927,565 | |
| Omnicom Group, Inc. | 77,569 | 5,899,898 | |
| 11,827,463 | |||
| Wireless Telecommunication Services - 0.1% | |||
| T-Mobile U.S., Inc. (a) | 19,740 | 1,540,707 | |
| TOTAL COMMUNICATION SERVICES | 126,087,627 | ||
| CONSUMER DISCRETIONARY - 14.0% | |||
| Auto Components - 0.5% | |||
| Gentex Corp. | 219,043 | 5,826,544 | |
| Diversified Consumer Services - 0.5% | |||
| Bright Horizons Family Solutions, Inc. (a) | 4,624 | 763,191 | |
| Frontdoor, Inc. (a) | 102,909 | 5,283,348 | |
| 6,046,539 | |||
| Hotels, Restaurants & Leisure - 2.2% | |||
| Chipotle Mexican Grill, Inc. (a) | 5,954 | 4,991,953 | |
| Darden Restaurants, Inc. | 2,154 | 260,591 | |
| Norwegian Cruise Line Holdings Ltd. (a) | 75,764 | 3,845,023 | |
| Starbucks Corp. | 157,059 | 15,165,617 | |
| 24,263,184 | |||
| Household Durables - 0.6% | |||
| NVR, Inc. (a) | 1,858 | 6,686,942 | |
| Internet & Direct Marketing Retail - 6.3% | |||
| Amazon.com, Inc. (a) | 34,812 | 61,836,207 | |
| eBay, Inc. | 124,884 | 5,031,576 | |
| Etsy, Inc. (a) | 12,270 | 647,733 | |
| The Booking Holdings, Inc. (a) | 1,042 | 2,048,999 | |
| 69,564,515 | |||
| Multiline Retail - 0.2% | |||
| Dollar General Corp. | 12,100 | 1,888,689 | |
| Target Corp. | 6,610 | 707,534 | |
| 2,596,223 | |||
| Specialty Retail - 2.8% | |||
| AutoZone, Inc. (a) | 7,131 | 7,856,151 | |
| IAA Spinco, Inc. (a) | 19,325 | 944,026 | |
| Lowe's Companies, Inc. | 8,035 | 901,527 | |
| The Home Depot, Inc. | 76,191 | 17,364,691 | |
| TJX Companies, Inc. | 14,629 | 804,156 | |
| Ulta Beauty, Inc. (a) | 10,640 | 2,529,447 | |
| 30,399,998 | |||
| Textiles, Apparel & Luxury Goods - 0.9% | |||
| Deckers Outdoor Corp. (a) | 34,074 | 5,024,211 | |
| lululemon athletica, Inc. (a) | 12,122 | 2,238,570 | |
| NIKE, Inc. Class B | 30,881 | 2,609,445 | |
| 9,872,226 | |||
| TOTAL CONSUMER DISCRETIONARY | 155,256,171 | ||
| CONSUMER STAPLES - 5.9% | |||
| Beverages - 2.3% | |||
| Coca-Cola Bottling Co. Consolidated | 7,482 | 2,518,516 | |
| PepsiCo, Inc. | 113,962 | 15,582,024 | |
| The Coca-Cola Co. | 130,727 | 7,195,214 | |
| 25,295,754 | |||
| Food & Staples Retailing - 1.2% | |||
| Costco Wholesale Corp. | 14,134 | 4,166,138 | |
| Sysco Corp. | 101,714 | 7,560,402 | |
| Walmart, Inc. | 17,503 | 1,999,893 | |
| 13,726,433 | |||
| Food Products - 0.8% | |||
| General Mills, Inc. | 101,474 | 5,459,301 | |
| The Hershey Co. | 21,461 | 3,401,139 | |
| 8,860,440 | |||
| Household Products - 1.4% | |||
| Colgate-Palmolive Co. | 80,657 | 5,980,717 | |
| Kimberly-Clark Corp. | 17,471 | 2,465,333 | |
| Procter & Gamble Co. | 58,482 | 7,031,291 | |
| 15,477,341 | |||
| Tobacco - 0.2% | |||
| Altria Group, Inc. | 47,707 | 2,086,704 | |
| TOTAL CONSUMER STAPLES | 65,446,672 | ||
| FINANCIALS - 3.8% | |||
| Capital Markets - 2.1% | |||
| FactSet Research Systems, Inc. | 5,700 | 1,550,913 | |
| LPL Financial | 71,769 | 5,379,087 | |
| MarketAxess Holdings, Inc. | 3,205 | 1,274,372 | |
| Morningstar, Inc. | 4,885 | 789,318 | |
| MSCI, Inc. | 28,519 | 6,691,413 | |
| Raymond James Financial, Inc. | 30,678 | 2,408,530 | |
| SEI Investments Co. | 96,526 | 5,551,210 | |
| 23,644,843 | |||
| Consumer Finance - 0.5% | |||
| American Express Co. | 2,161 | 260,120 | |
| Discover Financial Services | 10,455 | 836,086 | |
| Synchrony Financial | 155,864 | 4,995,441 | |
| 6,091,647 | |||
| Insurance - 1.1% | |||
| FNF Group | 15,109 | 663,889 | |
| Kemper Corp. | 3,067 | 214,629 | |
| Primerica, Inc. | 5,189 | 618,373 | |
| Progressive Corp. | 88,220 | 6,687,076 | |
| Selective Insurance Group, Inc. | 28,610 | 2,278,214 | |
| W.R. Berkley Corp. | 18,294 | 1,303,448 | |
| 11,765,629 | |||
| Thrifts & Mortgage Finance - 0.1% | |||
| Essent Group Ltd. | 12,336 | 598,296 | |
| TOTAL FINANCIALS | 42,100,415 | ||
| HEALTH CARE - 16.1% | |||
| Biotechnology - 4.2% | |||
| AbbVie, Inc. | 199,064 | 13,086,467 | |
| Alexion Pharmaceuticals, Inc. (a) | 3,104 | 312,759 | |
| Amgen, Inc. | 72,733 | 15,173,558 | |
| Biogen, Inc. (a) | 29,923 | 6,575,579 | |
| Celgene Corp. (a) | 43,063 | 4,168,498 | |
| Exact Sciences Corp. (a) | 2,541 | 302,938 | |
| Incyte Corp. (a) | 6,870 | 562,103 | |
| Regeneron Pharmaceuticals, Inc. (a) | 20,261 | 5,876,703 | |
| Sage Therapeutics, Inc. (a) | 383 | 65,750 | |
| 46,124,355 | |||
| Health Care Equipment & Supplies - 3.5% | |||
| Abbott Laboratories | 126,804 | 10,818,917 | |
| Boston Scientific Corp. (a) | 129,301 | 5,525,032 | |
| DexCom, Inc. (a) | 6,047 | 1,037,726 | |
| Edwards Lifesciences Corp. (a) | 41,563 | 9,220,336 | |
| Haemonetics Corp. (a) | 4,581 | 611,701 | |
| Hill-Rom Holdings, Inc. | 20,025 | 2,156,292 | |
| Hologic, Inc. (a) | 17,109 | 844,671 | |
| IDEXX Laboratories, Inc. (a) | 758 | 219,623 | |
| Masimo Corp. (a) | 12,425 | 1,904,131 | |
| Medtronic PLC | 7,286 | 786,087 | |
| Novocure Ltd. (a) | 5,135 | 466,566 | |
| STERIS PLC | 4,411 | 681,058 | |
| Stryker Corp. | 304 | 67,081 | |
| Tandem Diabetes Care, Inc. (a) | 54,114 | 3,919,477 | |
| 38,258,698 | |||
| Health Care Providers & Services - 3.0% | |||
| AmerisourceBergen Corp. | 4,316 | 355,077 | |
| Anthem, Inc. | 6,904 | 1,805,534 | |
| Centene Corp. (a) | 8,750 | 407,925 | |
| Chemed Corp. | 6,139 | 2,636,271 | |
| Molina Healthcare, Inc. (a) | 36,420 | 4,744,798 | |
| UnitedHealth Group, Inc. | 98,034 | 22,939,956 | |
| 32,889,561 | |||
| Health Care Technology - 0.6% | |||
| Veeva Systems, Inc. Class A (a) | 44,823 | 7,188,713 | |
| Life Sciences Tools & Services - 0.5% | |||
| Agilent Technologies, Inc. | 70,670 | 5,025,344 | |
| Medpace Holdings, Inc. (a) | 4,321 | 349,612 | |
| Thermo Fisher Scientific, Inc. | 2,704 | 776,210 | |
| 6,151,166 | |||
| Pharmaceuticals - 4.3% | |||
| Bristol-Myers Squibb Co. (b) | 125,137 | 6,015,336 | |
| Eli Lilly & Co. | 101,122 | 11,423,752 | |
| Johnson & Johnson | 60,755 | 7,798,512 | |
| Merck & Co., Inc. | 260,821 | 22,553,192 | |
| 47,790,792 | |||
| TOTAL HEALTH CARE | 178,403,285 | ||
| INDUSTRIALS - 8.5% | |||
| Aerospace & Defense - 2.5% | |||
| Arconic, Inc. | 27,290 | 705,174 | |
| Harris Corp. | 7,129 | 1,507,142 | |
| HEICO Corp. | 29,954 | 4,333,445 | |
| Lockheed Martin Corp. | 4,874 | 1,872,152 | |
| Raytheon Co. | 7,310 | 1,354,689 | |
| Teledyne Technologies, Inc. (a) | 6,200 | 1,913,258 | |
| The Boeing Co. | 43,038 | 15,669,705 | |
| United Technologies Corp. | 877 | 114,220 | |
| 27,469,785 | |||
| Air Freight & Logistics - 0.0% | |||
| United Parcel Service, Inc. Class B | 4,254 | 504,780 | |
| Airlines - 0.4% | |||
| Southwest Airlines Co. | 79,726 | 4,171,264 | |
| Construction & Engineering - 0.5% | |||
| EMCOR Group, Inc. | 68,287 | 5,971,015 | |
| Industrial Conglomerates - 0.0% | |||
| 3M Co. | 574 | 92,827 | |
| Machinery - 1.8% | |||
| Allison Transmission Holdings, Inc. | 127,366 | 5,658,871 | |
| Caterpillar, Inc. | 45,157 | 5,373,683 | |
| Cummins, Inc. | 34,704 | 5,180,266 | |
| IDEX Corp. | 21,280 | 3,505,029 | |
| 19,717,849 | |||
| Professional Services - 1.6% | |||
| CoStar Group, Inc. (a) | 11,648 | 7,162,006 | |
| FTI Consulting, Inc. (a) | 10,438 | 1,128,765 | |
| Insperity, Inc. | 30,637 | 3,034,901 | |
| Robert Half International, Inc. | 109,618 | 5,861,274 | |
| 17,186,946 | |||
| Road & Rail - 1.7% | |||
| CSX Corp. | 97,914 | 6,562,196 | |
| Landstar System, Inc. | 3,974 | 443,180 | |
| Union Pacific Corp. | 70,536 | 11,424,011 | |
| 18,429,387 | |||
| TOTAL INDUSTRIALS | 93,543,853 | ||
| INFORMATION TECHNOLOGY - 37.9% | |||
| Communications Equipment - 1.9% | |||
| Ciena Corp. (a) | 82,097 | 3,360,230 | |
| Cisco Systems, Inc. | 356,367 | 16,681,539 | |
| F5 Networks, Inc. (a) | 4,404 | 566,927 | |
| Ubiquiti, Inc. | 3,081 | 340,481 | |
| 20,949,177 | |||
| Electronic Equipment & Components - 1.4% | |||
| Keysight Technologies, Inc. (a) | 65,187 | 6,314,013 | |
| National Instruments Corp. | 78,372 | 3,291,624 | |
| Zebra Technologies Corp. Class A (a) | 30,446 | 6,242,343 | |
| 15,847,980 | |||
| IT Services - 9.6% | |||
| Accenture PLC Class A | 80,078 | 15,869,057 | |
| Amdocs Ltd. | 89,663 | 5,804,783 | |
| Automatic Data Processing, Inc. | 7,036 | 1,194,994 | |
| Booz Allen Hamilton Holding Corp. Class A | 4,001 | 302,116 | |
| Fiserv, Inc. (a) | 30,338 | 3,244,346 | |
| Genpact Ltd. | 56,845 | 2,328,371 | |
| IBM Corp. | 73,235 | 9,925,540 | |
| MasterCard, Inc. Class A | 91,790 | 25,826,952 | |
| Maximus, Inc. | 26,234 | 2,018,444 | |
| Okta, Inc. (a) | 2,720 | 344,080 | |
| PayPal Holdings, Inc. (a) | 46,412 | 5,061,229 | |
| Total System Services, Inc. | 5,477 | 735,123 | |
| VeriSign, Inc. (a) | 15,291 | 3,117,070 | |
| Visa, Inc. Class A | 167,211 | 30,235,093 | |
| 106,007,198 | |||
| Semiconductors & Semiconductor Equipment - 3.4% | |||
| Advanced Micro Devices, Inc. (a) | 62,844 | 1,976,444 | |
| Applied Materials, Inc. | 157,749 | 7,575,107 | |
| Broadcom, Inc. | 10,110 | 2,857,490 | |
| Cirrus Logic, Inc. (a) | 1,136 | 60,935 | |
| Enphase Energy, Inc. (a) | 15,946 | 473,118 | |
| Intel Corp. | 118,903 | 5,637,191 | |
| Lam Research Corp. | 29,397 | 6,188,362 | |
| NVIDIA Corp. | 10,211 | 1,710,445 | |
| Qualcomm, Inc. | 17,322 | 1,347,132 | |
| Texas Instruments, Inc. | 26,257 | 3,249,304 | |
| Xilinx, Inc. | 61,610 | 6,411,137 | |
| 37,486,665 | |||
| Software - 15.3% | |||
| Adobe, Inc. (a) | 28,503 | 8,109,389 | |
| Alteryx, Inc. Class A (a) | 45,342 | 6,458,968 | |
| Atlassian Corp. PLC (a) | 1,140 | 153,341 | |
| Avalara, Inc. (a) | 15,253 | 1,286,438 | |
| Cadence Design Systems, Inc. (a) | 103,420 | 7,082,202 | |
| Citrix Systems, Inc. | 26,147 | 2,431,148 | |
| Dropbox, Inc. Class A (a) | 56,107 | 1,004,315 | |
| Fair Isaac Corp. (a) | 1,323 | 466,649 | |
| Fortinet, Inc. (a) | 26,482 | 2,096,845 | |
| Intuit, Inc. | 40,609 | 11,710,011 | |
| Manhattan Associates, Inc. (a) | 15,008 | 1,240,111 | |
| Microsoft Corp. | 629,685 | 86,808,378 | |
| Oracle Corp. | 76,852 | 4,000,915 | |
| RingCentral, Inc. (a) | 15,508 | 2,188,644 | |
| Salesforce.com, Inc. (a) | 88,682 | 13,840,600 | |
| ServiceNow, Inc. (a) | 7,916 | 2,072,725 | |
| Smartsheet, Inc. (a) | 37,842 | 1,839,121 | |
| Synopsys, Inc. (a) | 53,281 | 7,555,779 | |
| The Trade Desk, Inc. (a)(b) | 4,900 | 1,204,273 | |
| Verint Systems, Inc. (a) | 62,527 | 3,332,064 | |
| VMware, Inc. Class A | 13,085 | 1,850,742 | |
| Workday, Inc. Class A (a) | 4,604 | 816,197 | |
| Zscaler, Inc. (a) | 18,546 | 1,274,852 | |
| 168,823,707 | |||
| Technology Hardware, Storage & Peripherals - 6.3% | |||
| Apple, Inc. | 335,031 | 69,934,371 | |
| TOTAL INFORMATION TECHNOLOGY | 419,049,098 | ||
| MATERIALS - 0.1% | |||
| Chemicals - 0.1% | |||
| Axalta Coating Systems Ltd. (a) | 753 | 21,747 | |
| NewMarket Corp. | 3,052 | 1,448,937 | |
| 1,470,684 | |||
| REAL ESTATE - 1.5% | |||
| Equity Real Estate Investment Trusts (REITs) - 1.4% | |||
| American Assets Trust, Inc. | 11,590 | 543,107 | |
| American Tower Corp. | 41,392 | 9,528,024 | |
| CubeSmart | 2,492 | 89,438 | |
| PS Business Parks, Inc. | 1,603 | 287,915 | |
| Realty Income Corp. | 26,643 | 1,966,520 | |
| SBA Communications Corp. Class A | 10,730 | 2,815,874 | |
| Store Capital Corp. | 9,029 | 340,935 | |
| 15,571,813 | |||
| Real Estate Management & Development - 0.1% | |||
| CBRE Group, Inc. (a) | 22,522 | 1,177,225 | |
| TOTAL REAL ESTATE | 16,749,038 | ||
| TOTAL COMMON STOCKS | |||
| (Cost $780,997,554) | 1,098,106,843 | ||
| Principal Amount | Value | ||
| U.S. Treasury Obligations - 0.1% | |||
| U.S. Treasury Bills, yield at date of purchase 2.46% 9/12/19 (c) | |||
| (Cost $999,261) | 1,000,000 | 999,534 | |
| Shares | Value | ||
| Money Market Funds - 0.8% | |||
| Fidelity Cash Central Fund 2.13% (d) | 7,282,398 | $7,283,854 | |
| Fidelity Securities Lending Cash Central Fund 2.13% (d)(e) | 1,341,616 | 1,341,750 | |
| TOTAL MONEY MARKET FUNDS | |||
| (Cost $8,625,604) | 8,625,604 | ||
| TOTAL INVESTMENT IN SECURITIES - 100.1% | |||
| (Cost $790,622,419) | 1,107,731,981 | ||
| NET OTHER ASSETS (LIABILITIES) - (0.1)% | (1,234,733) | ||
| NET ASSETS - 100% | $1,106,497,248 |
| Futures Contracts | |||||
| Number of contracts | Expiration Date | Notional Amount | Value | Unrealized Appreciation/(Depreciation) | |
| Purchased | |||||
| Equity Index Contracts | |||||
| CME E-mini S&P 500 Index Contracts (United States) | 59 | Sept. 2019 | $8,628,160 | $130,738 | $130,738 |
The notional amount of futures purchased as a percentage of Net Assets is 0.8%
For the period, the average monthly notional amount at value for futures contracts in the aggregate was $13,938,840.
Legend
(a) Non-income producing
(b) Security or a portion of the security is on loan at period end.
(c) Security or a portion of the security was pledged to cover margin requirements for futures contracts. At period end, the value of securities pledged amounted to $526,755.
(d) Affiliated fund that is generally available only to investment companies and other accounts managed by Fidelity Investments. The rate quoted is the annualized seven-day yield of the fund at period end. A complete unaudited listing of the fund's holdings as of its most recent quarter end is available upon request. In addition, each Fidelity Central Fund's financial statements, which are not covered by the Fund's Report of Independent Registered Public Accounting Firm, are available on the SEC's website or upon request.
(e) Investment made with cash collateral received from securities on loan.
Affiliated Central Funds
Information regarding fiscal year to date income earned by the Fund from investments in Fidelity Central Funds is as follows:
| Fund | Income earned |
| Fidelity Cash Central Fund | $232,454 |
| Fidelity Securities Lending Cash Central Fund | 61,840 |
| Total | $294,294 |
Amounts in the income column in the above table include any capital gain distributions from underlying funds, which are presented in the corresponding line-item in the Statement of Operations, if applicable. Amount for Fidelity Securities Lending Cash Central Fund represents the income earned on investing cash collateral, less rebates paid to borrowers and any lending agent fees associated with the loan, plus any premium payments received for lending certain types of securities.
Investment Valuation
The following is a summary of the inputs used, as of August 31, 2019, involving the Fund's assets and liabilities carried at fair value. The inputs or methodology used for valuing securities may not be an indication of the risk associated with investing in those securities. For more information on valuation inputs, and their aggregation into the levels used below, please refer to the Investment Valuation section in the accompanying Notes to Financial Statements.
| Valuation Inputs at Reporting Date: | ||||
| Description | Total | Level 1 | Level 2 | Level 3 |
| Investments in Securities: | ||||
| Equities: | ||||
| Communication Services | $126,087,627 | $126,087,627 | $-- | $-- |
| Consumer Discretionary | 155,256,171 | 155,256,171 | -- | -- |
| Consumer Staples | 65,446,672 | 65,446,672 | -- | -- |
| Financials | 42,100,415 | 42,100,415 | -- | -- |
| Health Care | 178,403,285 | 178,403,285 | -- | -- |
| Industrials | 93,543,853 | 93,543,853 | -- | -- |
| Information Technology | 419,049,098 | 419,049,098 | -- | -- |
| Materials | 1,470,684 | 1,470,684 | -- | -- |
| Real Estate | 16,749,038 | 16,749,038 | -- | -- |
| U.S. Government and Government Agency Obligations | 999,534 | -- | 999,534 | -- |
| Money Market Funds | 8,625,604 | 8,625,604 | -- | -- |
| Total Investments in Securities: | $1,107,731,981 | $1,106,732,447 | $999,534 | $-- |
| Derivative Instruments: | ||||
| Assets | ||||
| Futures Contracts | $130,738 | $130,738 | $-- | $-- |
| Total Assets | $130,738 | $130,738 | $-- | $-- |
| Total Derivative Instruments: | $130,738 | $130,738 | $-- | $-- |
Value of Derivative Instruments
The following table is a summary of the Fund's value of derivative instruments by primary risk exposure as of August 31, 2019. For additional information on derivative instruments, please refer to the Derivative Instruments section in the accompanying Notes to Financial Statements.
| Primary Risk Exposure / Derivative Type | Value | |
| Asset | Liability | |
| Equity Risk | ||
| Futures Contracts(a) | $130,738 | $0 |
| Total Equity Risk | 130,738 | 0 |
| Total Value of Derivatives | $130,738 | $0 |
(a) Reflects gross cumulative appreciation (depreciation) on futures contracts as presented in the Schedule of Investments. In the Statement of Assets and Liabilities, the period end daily variation margin is included in receivable or payable for daily variation margin on futures contracts, and the net cumulative appreciation (depreciation) is included in distributable earnings.
See accompanying notes which are an integral part of the financial statements.
Fidelity® Large Cap Growth Enhanced Index Fund
Financial Statements
Statement of Assets and Liabilities
| August 31, 2019 | ||
| Assets | ||
| Investment in securities, at value (including securities loaned of $1,307,216) — See accompanying schedule: Unaffiliated issuers (cost $781,996,815) | $1,099,106,377 | |
| Fidelity Central Funds (cost $8,625,604) | 8,625,604 | |
| Total Investment in Securities (cost $790,622,419) | $1,107,731,981 | |
| Receivable for investments sold | 4,154,994 | |
| Receivable for fund shares sold | 329,521 | |
| Dividends receivable | 1,197,413 | |
| Distributions receivable from Fidelity Central Funds | 13,137 | |
| Total assets | 1,113,427,046 | |
| Liabilities | ||
| Payable for investments purchased | $4,314,355 | |
| Payable for fund shares redeemed | 913,603 | |
| Accrued management fee | 357,491 | |
| Payable for daily variation margin on futures contracts | 2,599 | |
| Collateral on securities loaned | 1,341,750 | |
| Total liabilities | 6,929,798 | |
| Net Assets | $1,106,497,248 | |
| Net Assets consist of: | ||
| Paid in capital | $767,246,943 | |
| Total distributable earnings (loss) | 339,250,305 | |
| Net Assets, for 54,679,316 shares outstanding | $1,106,497,248 | |
| Net Asset Value, offering price and redemption price per share ($1,106,497,248 ÷ 54,679,316 shares) | $20.24 |
See accompanying notes which are an integral part of the financial statements.
Statement of Operations
| Year ended August 31, 2019 | ||
| Investment Income | ||
| Dividends | $15,540,677 | |
| Interest | 23,242 | |
| Income from Fidelity Central Funds (including $61,840 from security lending) | 294,294 | |
| Total income | 15,858,213 | |
| Expenses | ||
| Management fee | $4,227,861 | |
| Independent trustees' fees and expenses | 6,372 | |
| Commitment fees | 2,913 | |
| Total expenses before reductions | 4,237,146 | |
| Expense reductions | (715) | |
| Total expenses after reductions | 4,236,431 | |
| Net investment income (loss) | 11,621,782 | |
| Realized and Unrealized Gain (Loss) | ||
| Net realized gain (loss) on: | ||
| Investment securities: | ||
| Unaffiliated issuers | 28,447,048 | |
| Fidelity Central Funds | 68 | |
| Futures contracts | 1,083,902 | |
| Total net realized gain (loss) | 29,531,018 | |
| Change in net unrealized appreciation (depreciation) on: | ||
| Investment securities: | ||
| Unaffiliated issuers | (33,858,055) | |
| Futures contracts | (384,101) | |
| Total change in net unrealized appreciation (depreciation) | (34,242,156) | |
| Net gain (loss) | (4,711,138) | |
| Net increase (decrease) in net assets resulting from operations | $6,910,644 |
See accompanying notes which are an integral part of the financial statements.
Statement of Changes in Net Assets
| Year ended August 31, 2019 | Year ended August 31, 2018 | |
| Increase (Decrease) in Net Assets | ||
| Operations | ||
| Net investment income (loss) | $11,621,782 | $12,362,157 |
| Net realized gain (loss) | 29,531,018 | 67,173,651 |
| Change in net unrealized appreciation (depreciation) | (34,242,156) | 166,554,471 |
| Net increase (decrease) in net assets resulting from operations | 6,910,644 | 246,090,279 |
| Distributions to shareholders | (74,861,683) | – |
| Distributions to shareholders from net investment income | – | (9,595,922) |
| Distributions to shareholders from net realized gain | – | (24,876,385) |
| Total distributions | (74,861,683) | (34,472,307) |
| Share transactions | ||
| Proceeds from sales of shares | 170,935,114 | 257,337,762 |
| Reinvestment of distributions | 71,477,254 | 32,926,414 |
| Cost of shares redeemed | (249,950,148) | (244,227,679) |
| Net increase (decrease) in net assets resulting from share transactions | (7,537,780) | 46,036,497 |
| Total increase (decrease) in net assets | (75,488,819) | 257,654,469 |
| Net Assets | ||
| Beginning of period | 1,181,986,067 | 924,331,598 |
| End of period | $1,106,497,248 | $1,181,986,067 |
| Other Information | ||
| Undistributed net investment income end of period | $7,947,045 | |
| Shares | ||
| Sold | 8,835,455 | 13,103,171 |
| Issued in reinvestment of distributions | 4,077,425 | 1,756,075 |
| Redeemed | (13,010,061) | (12,568,315) |
| Net increase (decrease) | (97,181) | 2,290,931 |
See accompanying notes which are an integral part of the financial statements.
Financial Highlights
Fidelity Large Cap Growth Enhanced Index Fund
| Years ended August 31, | 2019 | 2018 | 2017 A | 2017 B | 2016 C | 2015 B |
| Selected Per–Share Data | ||||||
| Net asset value, beginning of period | $21.58 | $17.61 | $16.65 | $13.86 | $15.42 | $14.22 |
| Income from Investment Operations | ||||||
| Net investment income (loss)D | .21 | .23 | .12 | .22 | .20 | .20 |
| Net realized and unrealized gain (loss) | (.15) | 4.40 | 1.04 | 2.73 | (1.09) | 2.15 |
| Total from investment operations | .06 | 4.63 | 1.16 | 2.95 | (.89) | 2.35 |
| Distributions from net investment income | (.24)E | (.18) | (.04) | (.16) | (.18) | (.15) |
| Distributions from net realized gain | (1.16)E | (.48) | (.16) | – | (.49) | (1.00) |
| Total distributions | (1.40) | (.66) | (.20) | (.16) | (.67) | (1.15) |
| Net asset value, end of period | $20.24 | $21.58 | $17.61 | $16.65 | $13.86 | $15.42 |
| Total ReturnF,G | 1.28% | 26.86% | 7.04% | 21.33% | (6.01)% | 17.46% |
| Ratios to Average Net AssetsH,I | ||||||
| Expenses before reductions | .39% | .39% | .40%J | .45% | .45% | .45% |
| Expenses net of fee waivers, if any | .39% | .39% | .40%J | .45% | .45% | .45% |
| Expenses net of all reductions | .39% | .39% | .40%J | .45% | .45% | .45% |
| Net investment income (loss) | 1.07% | 1.18% | 1.44%J | 1.43% | 1.38% | 1.37% |
| Supplemental Data | ||||||
| Net assets, end of period (000 omitted) | $1,106,497 | $1,181,986 | $924,332 | $825,463 | $449,088 | $404,087 |
| Portfolio turnover rateK | 85% | 100% | 110%J | 86% | 89% | 69% |
A For the six month period ended August 31. The Fund changed its fiscal year end from February 28 to August 31, effective August 31, 2017.
B For the year ended February 28.
C For the year ended February 29.
D Calculated based on average shares outstanding during the period.
E The amounts shown reflect certain reclassifications related to book to tax differences that were made in the year shown.
F Total returns for periods of less than one year are not annualized.
G Total returns would have been lower if certain expenses had not been reduced during the applicable periods shown.
H Fees and expenses of any underlying Fidelity Central Funds are not included in the Fund's expense ratio. The Fund indirectly bears its proportionate share of the expenses of any underlying Fidelity Central Funds.
I Expense ratios reflect operating expenses of the Fund. Expenses before reductions do not reflect amounts reimbursed by the investment adviser or reductions from expense offset arrangements and do not represent the amount paid by the Fund during periods when reimbursements or reductions occur. Expenses net of fee waivers reflect expenses after reimbursement by the investment adviser but prior to reductions from expense offset arrangements. Expenses net of all reductions represent the net expenses paid by the Fund.
J Annualized
K Amount does not include the portfolio activity of any underlying Fidelity Central Funds.
See accompanying notes which are an integral part of the financial statements.
Fidelity® Large Cap Value Enhanced Index Fund
Performance: The Bottom Line
Average annual total return reflects the change in the value of an investment, assuming reinvestment of distributions from dividend income and capital gains (the profits earned upon the sale of securities that have grown in value, if any) and assuming a constant rate of performance each year. The hypothetical investment and the average annual total returns do not reflect the deduction of taxes that a shareholder would pay on fund distributions or the redemption of fund shares. During periods of reimbursement by Fidelity, a fund’s total return will be greater than it would be had the reimbursement not occurred. How a fund did yesterday is no guarantee of how it will do tomorrow.
Average Annual Total Returns
| For the periods ended August 31, 2019 | Past 1 year | Past 5 years | Past 10 years |
| Fidelity® Large Cap Value Enhanced Index Fund | (0.77)% | 6.82% | 11.66% |
$10,000 Over 10 Years
Let's say hypothetically that $10,000 was invested in Fidelity® Large Cap Value Enhanced Index Fund on August 31, 2009.
The chart shows how the value of your investment would have changed, and also shows how the Russell 1000® Value Index performed over the same period.
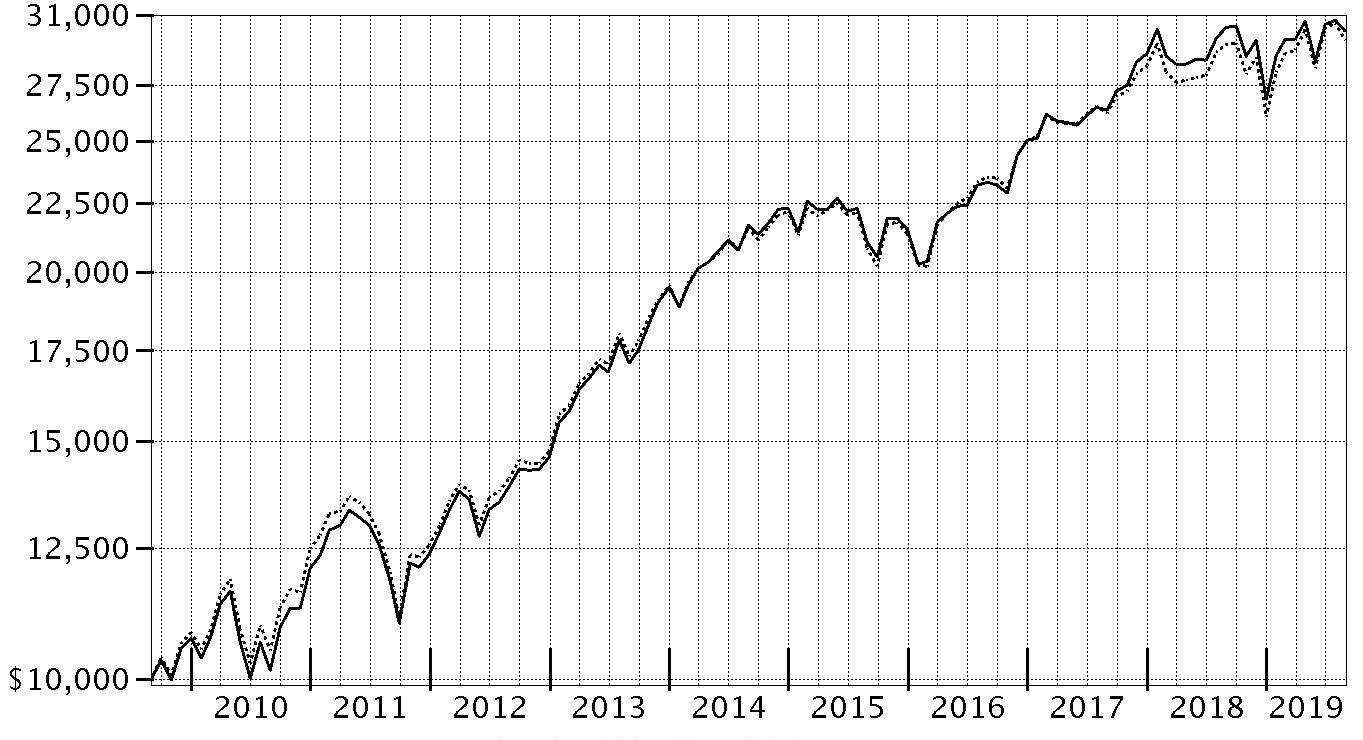
| Period Ending Values | ||
| $30,138 | Fidelity® Large Cap Value Enhanced Index Fund | |
| $29,682 | Russell 1000® Value Index | |
Fidelity® Large Cap Value Enhanced Index Fund
Management's Discussion of Fund Performance
Market Recap: The S&P 500® index gained 2.92% for the 12 months ending August 31, 2019, a choppy period in which stocks seesawed due to trade tension, interest rates, economic data and an inverted yield curve, among other factors. Equities began the new year on a high note after enduring a historically volatile final quarter of 2018. Upbeat company earnings and outlooks, along with signs the Federal Reserve may pause on rates, boosted stocks to an all-time high on April 30. In May, however, the index sunk amid the Fed’s decision to hold interest rates steady and signal it had little appetite to adjust them any time soon, as well as retaliatory tariffs imposed on the U.S. by China. The bull market roared back in June and recorded a series of highs in July, when the Fed cut interest rates for the first time since 2008. Volatility intensified in August, however, as the U.S. Treasury yield curve inverted for the first time since 2007, which some investors viewed as a sign the world's biggest economy could be heading for recession. For the full 12 months, three defensive sectors led the way: utilities (+21%), real estate (+20%) and consumer staples (+16%). The information technology sector rose about 8%, boosted by software & services (+18%), the market’s largest industry segment. Communication services stocks gained roughly 5%. In contrast, energy (-20%) was by far the weakest sector, followed by financials (-3%) and materials (-3%). Other notable laggards included health care (-1%), industrials (+1%) and consumer discretionary (+2%).Comments from Maximilian Kaufmann, Senior Portfolio Manager of the Geode Capital Management, LLC, investment management team: For the fiscal year, the fund returned -0.77%, trailing the 0.62% gain in the benchmark Russell 1000® Value Index. Security selection in the health care, consumer discretionary and real estate sectors detracted most from performance during the reporting period. Conversely, the fund benefited from investment choices in industrials, while a combination of stock picking and an underweighting in the lagging energy group also contributed. Individually, the portfolio's biggest detractor was Antero Resources, which returned -82% for the fund the past 12 months. With energy pricing weak for much of the year, Antero and other energy exploration and production companies struggled. As a result, we ultimately sold this stock. Another detractor was chemical manufacturer Huntsman (-33%), which in July reported weaker-than-anticipated financial results. Also hampering the fund's result this period was PVH, an owner of well-known clothing brands that returned -37% in the portfolio. After the company issued disappointing financial guidance in May, we eliminated our position in June. In contrast, oilfield services company Schlumberger was our leading relative contributor. For most of the period, we avoided this poor-performing stock, resulting in a -26% return for the fund, compared with -46% in the index. Lastly, another key contributor was consumer branded-goods company Procter & Gamble (+49%), which reported strong sales growth trends.The views expressed above reflect those of the portfolio manager(s) only through the end of the period as stated on the cover of this report and do not necessarily represent the views of Fidelity or any other person in the Fidelity organization. Any such views are subject to change at any time based upon market or other conditions and Fidelity disclaims any responsibility to update such views. These views may not be relied on as investment advice and, because investment decisions for a Fidelity fund are based on numerous factors, may not be relied on as an indication of trading intent on behalf of any Fidelity fund.
Fidelity® Large Cap Value Enhanced Index Fund
Investment Summary (Unaudited)
Top Ten Stocks as of August 31, 2019
| % of fund's net assets | |
| JPMorgan Chase & Co. | 3.0 |
| Procter & Gamble Co. | 2.6 |
| Berkshire Hathaway, Inc. Class B | 2.4 |
| AT&T, Inc. | 2.4 |
| Exxon Mobil Corp. | 2.4 |
| Verizon Communications, Inc. | 2.2 |
| Chevron Corp. | 2.2 |
| Intel Corp. | 2.1 |
| Wells Fargo& Co. | 1.9 |
| Johnson & Johnson | 1.8 |
| 23.0 |
Top Market Sectors as of August 31, 2019
| % of fund's net assets | |
| Financials | 20.9 |
| Health Care | 14.5 |
| Industrials | 10.1 |
| Consumer Staples | 9.8 |
| Communication Services | 9.3 |
| Information Technology | 7.7 |
| Energy | 6.5 |
| Consumer Discretionary | 5.9 |
| Utilities | 5.8 |
| Real Estate | 3.7 |
Asset Allocation (% of fund's net assets)
| As of August 31, 2019 * | ||
| Stocks and Equity Futures | 100.1% | |
| Short-Term Investments and Net Other Assets (Liabilities) | (0.1)% | |

* Foreign investments - 6.3%
Fidelity® Large Cap Value Enhanced Index Fund
Schedule of Investments August 31, 2019
Showing Percentage of Net Assets
| Common Stocks - 97.5% | |||
| Shares | Value | ||
| COMMUNICATION SERVICES - 9.3% | |||
| Diversified Telecommunication Services - 5.0% | |||
| AT&T, Inc. | 2,546,810 | $89,800,521 | |
| CenturyLink, Inc. (a) | 1,307,673 | 14,881,319 | |
| Verizon Communications, Inc. | 1,451,131 | 84,397,779 | |
| 189,079,619 | |||
| Entertainment - 1.8% | |||
| Electronic Arts, Inc. (b) | 217,341 | 20,360,505 | |
| The Walt Disney Co. | 341,303 | 46,847,250 | |
| 67,207,755 | |||
| Interactive Media & Services - 0.5% | |||
| Alphabet, Inc. Class A (b) | 15,335 | 18,256,778 | |
| TripAdvisor, Inc. (b) | 38,674 | 1,469,225 | |
| 19,726,003 | |||
| Media - 1.9% | |||
| Comcast Corp. Class A | 1,102,592 | 48,800,722 | |
| Liberty Media Corp.: | |||
| Liberty SiriusXM Series A (b) | 215,562 | 8,728,105 | |
| Liberty SiriusXM Series C (b) | 119,991 | 4,896,833 | |
| Omnicom Group, Inc. (a) | 126,685 | 9,635,661 | |
| Sinclair Broadcast Group, Inc. Class A (a) | 6,893 | 307,221 | |
| 72,368,542 | |||
| Wireless Telecommunication Services - 0.1% | |||
| Telephone & Data Systems, Inc. | 115,996 | 2,923,099 | |
| TOTAL COMMUNICATION SERVICES | 351,305,018 | ||
| CONSUMER DISCRETIONARY - 5.9% | |||
| Auto Components - 0.1% | |||
| BorgWarner, Inc. | 128,944 | 4,207,443 | |
| Gentex Corp. | 43,563 | 1,158,776 | |
| 5,366,219 | |||
| Automobiles - 0.6% | |||
| Ford Motor Co. | 2,352,418 | 21,571,673 | |
| Distributors - 0.0% | |||
| LKQ Corp. (b) | 40,774 | 1,071,133 | |
| Diversified Consumer Services - 0.4% | |||
| Frontdoor, Inc. (b) | 183,272 | 9,409,184 | |
| Graham Holdings Co. | 723 | 509,035 | |
| Laureate Education, Inc. Class A (b) | 68,719 | 1,257,558 | |
| Service Corp. International (a) | 68,755 | 3,183,357 | |
| 14,359,134 | |||
| Hotels, Restaurants & Leisure - 1.5% | |||
| ARAMARK Holdings Corp. | 40,794 | 1,666,843 | |
| Carnival Corp. | 50,620 | 2,231,330 | |
| Chipotle Mexican Grill, Inc. (b) | 2,383 | 1,997,955 | |
| Cracker Barrel Old Country Store, Inc. | 5,677 | 938,976 | |
| Darden Restaurants, Inc. | 112,867 | 13,654,650 | |
| Extended Stay America, Inc. unit | 911,415 | 12,805,381 | |
| International Game Technology PLC (a) | 370,125 | 4,434,098 | |
| McDonald's Corp. | 88,659 | 19,325,002 | |
| 57,054,235 | |||
| Household Durables - 1.0% | |||
| Garmin Ltd. | 174,427 | 14,228,010 | |
| Meritage Homes Corp. (b) | 22,695 | 1,482,891 | |
| PulteGroup, Inc. | 450,051 | 15,211,724 | |
| Toll Brothers, Inc. | 205,352 | 7,431,689 | |
| 38,354,314 | |||
| Internet & Direct Marketing Retail - 0.2% | |||
| eBay, Inc. | 164,023 | 6,608,487 | |
| Multiline Retail - 0.8% | |||
| Target Corp. | 284,405 | 30,442,711 | |
| Specialty Retail - 0.8% | |||
| Advance Auto Parts, Inc. (a) | 41,323 | 5,700,508 | |
| AutoNation, Inc. (b) | 66,255 | 3,144,462 | |
| AutoZone, Inc. (b) | 11,086 | 12,213,335 | |
| The Home Depot, Inc. | 41,805 | 9,527,778 | |
| 30,586,083 | |||
| Textiles, Apparel & Luxury Goods - 0.5% | |||
| Deckers Outdoor Corp. (b) | 46,135 | 6,802,606 | |
| Ralph Lauren Corp. (a) | 120,457 | 10,641,171 | |
| 17,443,777 | |||
| TOTAL CONSUMER DISCRETIONARY | 222,857,766 | ||
| CONSUMER STAPLES - 9.8% | |||
| Beverages - 0.3% | |||
| Boston Beer Co., Inc. Class A (a)(b) | 3,865 | 1,694,493 | |
| Coca-Cola Bottling Co. Consolidated | 1,506 | 506,935 | |
| Molson Coors Brewing Co. Class B | 93,024 | 4,777,713 | |
| PepsiCo, Inc. | 17,798 | 2,433,521 | |
| The Coca-Cola Co. | 17,071 | 939,588 | |
| 10,352,250 | |||
| Food & Staples Retailing - 2.6% | |||
| Casey's General Stores, Inc. | 6,023 | 1,010,961 | |
| Costco Wholesale Corp. | 28,001 | 8,253,575 | |
| Kroger Co. | 959,140 | 22,712,435 | |
| U.S. Foods Holding Corp. (b) | 60,107 | 2,431,328 | |
| Walmart, Inc. | 552,060 | 63,078,376 | |
| 97,486,675 | |||
| Food Products - 3.0% | |||
| Flowers Foods, Inc. | 18,368 | 418,790 | |
| General Mills, Inc. | 487,618 | 26,233,848 | |
| Ingredion, Inc. | 37,635 | 2,908,056 | |
| Mondelez International, Inc. | 668,560 | 36,917,883 | |
| Pilgrim's Pride Corp. (b) | 6,305 | 196,464 | |
| Seaboard Corp. | 44 | 181,728 | |
| The Hershey Co. | 126,183 | 19,997,482 | |
| The J.M. Smucker Co. | 62,686 | 6,592,060 | |
| The Kraft Heinz Co. | 322,909 | 8,240,638 | |
| Tyson Foods, Inc. Class A | 132,072 | 12,287,979 | |
| 113,974,928 | |||
| Household Products - 3.1% | |||
| Clorox Co. | 3,028 | 478,908 | |
| Colgate-Palmolive Co. | 30,347 | 2,250,230 | |
| Kimberly-Clark Corp. | 116,426 | 16,428,873 | |
| Procter & Gamble Co. | 798,689 | 96,026,378 | |
| Spectrum Brands Holdings, Inc. | 18,318 | 1,023,427 | |
| 116,207,816 | |||
| Tobacco - 0.8% | |||
| Altria Group, Inc. | 187,844 | 8,216,297 | |
| Philip Morris International, Inc. | 281,645 | 20,303,788 | |
| 28,520,085 | |||
| TOTAL CONSUMER STAPLES | 366,541,754 | ||
| ENERGY - 6.5% | |||
| Oil, Gas & Consumable Fuels - 6.5% | |||
| Chevron Corp. | 685,965 | 80,751,800 | |
| ConocoPhillips Co. | 661,642 | 34,524,480 | |
| Exxon Mobil Corp. | 1,311,082 | 89,782,895 | |
| HollyFrontier Corp. | 100,328 | 4,450,550 | |
| Kinder Morgan, Inc. | 1,421,924 | 28,822,399 | |
| Marathon Oil Corp. | 466,069 | 5,518,257 | |
| 243,850,381 | |||
| FINANCIALS - 20.9% | |||
| Banks - 9.3% | |||
| Bank of America Corp. | 2,434,056 | 66,960,881 | |
| Citigroup, Inc. | 893,388 | 57,489,518 | |
| JPMorgan Chase & Co. | 1,039,075 | 114,152,780 | |
| M&T Bank Corp. | 131,853 | 19,278,227 | |
| Regions Financial Corp. | 906,283 | 13,249,857 | |
| SunTrust Banks, Inc. | 63,173 | 3,885,771 | |
| U.S. Bancorp | 52,623 | 2,772,706 | |
| Wells Fargo & Co. | 1,531,465 | 71,320,325 | |
| 349,110,065 | |||
| Capital Markets - 1.6% | |||
| Affiliated Managers Group, Inc. | 22,319 | 1,710,305 | |
| Charles Schwab Corp. | 25,803 | 987,481 | |
| CME Group, Inc. | 7,572 | 1,645,320 | |
| Donnelley Financial Solutions, Inc. (b) | 8,441 | 89,728 | |
| FactSet Research Systems, Inc. | 7,591 | 2,065,435 | |
| Goldman Sachs Group, Inc. | 5,844 | 1,191,650 | |
| Invesco Ltd. (a) | 1,099,644 | 17,264,411 | |
| Legg Mason, Inc. | 49,662 | 1,827,065 | |
| Morgan Stanley | 793,585 | 32,925,842 | |
| State Street Corp. | 32,909 | 1,688,561 | |
| 61,395,798 | |||
| Consumer Finance - 2.5% | |||
| Ally Financial, Inc. | 692,927 | 21,723,261 | |
| American Express Co. | 135,007 | 16,250,793 | |
| Capital One Financial Corp. | 326,482 | 28,279,871 | |
| Discover Financial Services | 40,651 | 3,250,860 | |
| Navient Corp. | 207,521 | 2,643,818 | |
| Santander Consumer U.S.A. Holdings, Inc. | 24,032 | 627,476 | |
| Synchrony Financial | 663,999 | 21,281,168 | |
| 94,057,247 | |||
| Diversified Financial Services - 2.6% | |||
| AXA Equitable Holdings, Inc. | 5,099 | 105,906 | |
| Berkshire Hathaway, Inc. Class B (b) | 446,636 | 90,850,229 | |
| Jefferies Financial Group, Inc. | 319,398 | 5,953,579 | |
| 96,909,714 | |||
| Insurance - 4.5% | |||
| Alleghany Corp. (b) | 218 | 163,350 | |
| Allstate Corp. | 254,592 | 26,067,675 | |
| American National Insurance Co. | 4,678 | 533,619 | |
| Arch Capital Group Ltd. (b) | 247,509 | 9,776,606 | |
| Assurant, Inc. | 7,253 | 892,119 | |
| Axis Capital Holdings Ltd. | 41,763 | 2,563,831 | |
| Chubb Ltd. | 2,157 | 337,096 | |
| CNA Financial Corp. | 8,538 | 402,396 | |
| Everest Re Group Ltd. | 2,578 | 608,099 | |
| First American Financial Corp. | 369,716 | 21,609,900 | |
| FNF Group | 271,159 | 11,914,726 | |
| Hanover Insurance Group, Inc. | 29,992 | 3,993,435 | |
| Hartford Financial Services Group, Inc. | 249,420 | 14,536,198 | |
| Kemper Corp. | 23,293 | 1,630,044 | |
| Lincoln National Corp. | 56,182 | 2,970,904 | |
| Loews Corp. | 322,745 | 15,514,352 | |
| Old Republic International Corp. | 470,635 | 10,994,034 | |
| Primerica, Inc. | 14,681 | 1,749,535 | |
| Progressive Corp. | 328,806 | 24,923,495 | |
| Prudential Financial, Inc. | 69,926 | 5,600,373 | |
| Selective Insurance Group, Inc. | 23,739 | 1,890,337 | |
| Unum Group | 338,734 | 8,607,231 | |
| 167,279,355 | |||
| Mortgage Real Estate Investment Trusts - 0.4% | |||
| Annaly Capital Management, Inc. | 879,189 | 7,297,269 | |
| MFA Financial, Inc. | 961,669 | 6,895,167 | |
| 14,192,436 | |||
| Thrifts & Mortgage Finance - 0.0% | |||
| Radian Group, Inc. | 52,162 | 1,176,253 | |
| TOTAL FINANCIALS | 784,120,868 | ||
| HEALTH CARE - 14.5% | |||
| Biotechnology - 2.2% | |||
| Amgen, Inc. | 103,504 | 21,593,004 | |
| Biogen, Inc. (b) | 114,751 | 25,216,532 | |
| Gilead Sciences, Inc. | 270,812 | 17,207,394 | |
| Regeneron Pharmaceuticals, Inc. (b) | 59,083 | 17,137,024 | |
| 81,153,954 | |||
| Health Care Equipment & Supplies - 4.7% | |||
| Abbott Laboratories | 494,338 | 42,176,918 | |
| Baxter International, Inc. | 285,199 | 25,083,252 | |
| Boston Scientific Corp. (b) | 69,655 | 2,976,358 | |
| CONMED Corp. | 908 | 91,499 | |
| Danaher Corp. | 118,971 | 16,904,589 | |
| Dentsply Sirona, Inc. | 41,619 | 2,170,431 | |
| Edwards Lifesciences Corp. (b) | 24,616 | 5,460,813 | |
| Haemonetics Corp. (b) | 20,895 | 2,790,109 | |
| Hill-Rom Holdings, Inc. (a) | 92,309 | 9,939,833 | |
| Hologic, Inc. (b) | 210,520 | 10,393,372 | |
| Integer Holdings Corp. (b) | 1,771 | 128,220 | |
| Integra LifeSciences Holdings Corp. (b) | 13,418 | 805,348 | |
| Medtronic PLC | 470,825 | 50,797,309 | |
| Zimmer Biomet Holdings, Inc. | 43,234 | 6,018,173 | |
| 175,736,224 | |||
| Health Care Providers & Services - 1.5% | |||
| AmerisourceBergen Corp. | 9,391 | 772,598 | |
| Anthem, Inc. | 8,648 | 2,261,625 | |
| CVS Health Corp. | 494,250 | 30,109,710 | |
| Molina Healthcare, Inc. (b) | 128,322 | 16,717,790 | |
| UnitedHealth Group, Inc. | 23,245 | 5,439,330 | |
| 55,301,053 | |||
| Health Care Technology - 0.0% | |||
| Cerner Corp. | 18,365 | 1,265,532 | |
| Life Sciences Tools & Services - 0.5% | |||
| Agilent Technologies, Inc. | 156,882 | 11,155,879 | |
| Thermo Fisher Scientific, Inc. | 31,570 | 9,062,484 | |
| 20,218,363 | |||
| Pharmaceuticals - 5.6% | |||
| Allergan PLC | 56,108 | 8,961,570 | |
| Bristol-Myers Squibb Co. (a) | 680,949 | 32,733,218 | |
| Corteva, Inc. | 285,319 | 8,365,553 | |
| Johnson & Johnson | 534,605 | 68,621,898 | |
| Merck & Co., Inc. | 267,171 | 23,102,276 | |
| Mylan NV (b) | 1,103,696 | 21,488,961 | |
| Pfizer, Inc. | 1,301,103 | 46,254,212 | |
| 209,527,688 | |||
| TOTAL HEALTH CARE | 543,202,814 | ||
| INDUSTRIALS - 10.1% | |||
| Aerospace & Defense - 3.0% | |||
| Arconic, Inc. | 818,341 | 21,145,931 | |
| Harris Corp. | 105,701 | 22,346,248 | |
| Lockheed Martin Corp. | 27,171 | 10,436,653 | |
| Moog, Inc. Class A | 78,524 | 6,380,075 | |
| Parsons Corp. | 77,446 | 2,634,713 | |
| Raytheon Co. | 8,268 | 1,532,226 | |
| United Technologies Corp. | 368,171 | 47,950,591 | |
| 112,426,437 | |||
| Airlines - 0.3% | |||
| JetBlue Airways Corp. (b) | 167,404 | 2,899,437 | |
| Southwest Airlines Co. | 141,424 | 7,399,304 | |
| 10,298,741 | |||
| Building Products - 0.8% | |||
| Johnson Controls International PLC | 684,702 | 29,229,928 | |
| Commercial Services & Supplies - 1.1% | |||
| ABM Industries, Inc. | 2,321 | 86,480 | |
| KAR Auction Services, Inc. | 279,932 | 7,434,994 | |
| Republic Services, Inc. | 259,736 | 23,181,438 | |
| UniFirst Corp. | 32,208 | 6,309,869 | |
| Waste Management, Inc. | 53,309 | 6,362,429 | |
| 43,375,210 | |||
| Construction & Engineering - 0.4% | |||
| EMCOR Group, Inc. | 147,426 | 12,890,929 | |
| Valmont Industries, Inc. | 6,561 | 889,016 | |
| 13,779,945 | |||
| Electrical Equipment - 0.3% | |||
| Eaton Corp. PLC | 152,079 | 12,275,817 | |
| Industrial Conglomerates - 0.4% | |||
| Carlisle Companies, Inc. | 10,530 | 1,526,429 | |
| General Electric Co. | 1,528,824 | 12,612,798 | |
| ITT, Inc. | 25,483 | 1,450,492 | |
| 15,589,719 | |||
| Machinery - 1.7% | |||
| AGCO Corp. | 289,727 | 20,025,930 | |
| Allison Transmission Holdings, Inc. | 39,625 | 1,760,539 | |
| Caterpillar, Inc. | 89,213 | 10,616,347 | |
| Crane Co. | 12,325 | 939,658 | |
| Cummins, Inc. | 141,787 | 21,164,545 | |
| Gates Industrial Corp. PLC (a)(b) | 41,607 | 361,981 | |
| Oshkosh Corp. | 46,109 | 3,240,079 | |
| PACCAR, Inc. | 9,295 | 609,380 | |
| Timken Co. | 67,104 | 2,696,239 | |
| Woodward, Inc. | 19,281 | 2,079,456 | |
| 63,494,154 | |||
| Professional Services - 1.0% | |||
| FTI Consulting, Inc. (a)(b) | 129,173 | 13,968,768 | |
| IHS Markit Ltd. (b) | 278,984 | 18,304,140 | |
| Manpower, Inc. | 14,911 | 1,218,825 | |
| Nielsen Holdings PLC | 135,600 | 2,815,056 | |
| 36,306,789 | |||
| Road & Rail - 1.1% | |||
| CSX Corp. | 358,410 | 24,020,638 | |
| Kansas City Southern | 142,620 | 17,941,596 | |
| Norfolk Southern Corp. | 5,077 | 883,652 | |
| 42,845,886 | |||
| TOTAL INDUSTRIALS | 379,622,626 | ||
| INFORMATION TECHNOLOGY - 7.7% | |||
| Communications Equipment - 0.7% | |||
| Ciena Corp. (b) | 229,642 | 9,399,247 | |
| Cisco Systems, Inc. | 162,326 | 7,598,480 | |
| Juniper Networks, Inc. | 429,862 | 9,955,604 | |
| 26,953,331 | |||
| Electronic Equipment & Components - 0.6% | |||
| Avnet, Inc. | 231,624 | 9,702,729 | |
| Keysight Technologies, Inc. (b) | 61,181 | 5,925,992 | |
| National Instruments Corp. | 46,798 | 1,965,516 | |
| Tech Data Corp. (b) | 60,851 | 5,642,713 | |
| 23,236,950 | |||
| IT Services - 1.4% | |||
| Amdocs Ltd. | 330,545 | 21,399,483 | |
| CACI International, Inc. Class A (b) | 940 | 208,953 | |
| CoreLogic, Inc. (a)(b) | 42,614 | 2,062,518 | |
| Genpact Ltd. | 38,605 | 1,581,261 | |
| IBM Corp. | 214,298 | 29,043,808 | |
| 54,296,023 | |||
| Semiconductors & Semiconductor Equipment - 3.1% | |||
| Cirrus Logic, Inc. (b) | 123,770 | 6,639,023 | |
| Intel Corp. | 1,644,380 | 77,960,056 | |
| Micron Technology, Inc. (b) | 237,882 | 10,768,918 | |
| Qualcomm, Inc. | 260,771 | 20,280,161 | |
| Silicon Laboratories, Inc. (b) | 3,024 | 329,616 | |
| 115,977,774 | |||
| Software - 1.5% | |||
| Cadence Design Systems, Inc. (b) | 213,636 | 14,629,793 | |
| LogMeIn, Inc. | 11,013 | 736,109 | |
| Nuance Communications, Inc. (b) | 657,720 | 11,056,273 | |
| Symantec Corp. | 11,903 | 276,745 | |
| Synopsys, Inc. (b) | 144,737 | 20,525,154 | |
| Verint Systems, Inc. (b) | 137,326 | 7,318,103 | |
| 54,542,177 | |||
| Technology Hardware, Storage & Peripherals - 0.4% | |||
| Xerox Holdings Corp. | 487,801 | 14,141,351 | |
| TOTAL INFORMATION TECHNOLOGY | 289,147,606 | ||
| MATERIALS - 3.3% | |||
| Chemicals - 1.7% | |||
| CF Industries Holdings, Inc. | 179,007 | 8,626,347 | |
| DowDuPont, Inc. | 286,007 | 19,428,456 | |
| Eastman Chemical Co. | 134,708 | 8,805,862 | |
| Huntsman Corp. | 999,864 | 19,917,291 | |
| Linde PLC | 48,692 | 9,198,406 | |
| 65,976,362 | |||
| Containers & Packaging - 0.2% | |||
| Graphic Packaging Holding Co. | 203,221 | 2,806,482 | |
| International Paper Co. | 81,219 | 3,175,663 | |
| 5,982,145 | |||
| Metals & Mining - 1.2% | |||
| Newmont Goldcorp Corp. | 601,737 | 24,003,289 | |
| Reliance Steel & Aluminum Co. | 215,881 | 20,990,110 | |
| 44,993,399 | |||
| Paper & Forest Products - 0.2% | |||
| Domtar Corp. (a) | 256,295 | 8,444,920 | |
| TOTAL MATERIALS | 125,396,826 | ||
| REAL ESTATE - 3.7% | |||
| Equity Real Estate Investment Trusts (REITs) - 3.7% | |||
| American Assets Trust, Inc. | 51,629 | 2,419,335 | |
| American Campus Communities, Inc. | 37,915 | 1,762,289 | |
| American Homes 4 Rent Class A | 69,600 | 1,780,368 | |
| Apple Hospitality (REIT), Inc. | 553,489 | 8,817,080 | |
| Brixmor Property Group, Inc. | 907,785 | 16,730,478 | |
| Camden Property Trust (SBI) | 38,307 | 4,146,733 | |
| Corrections Corp. of America | 91,988 | 1,559,197 | |
| EastGroup Properties, Inc. | 23,770 | 2,959,840 | |
| Empire State Realty Trust, Inc. | 95,657 | 1,344,937 | |
| Equity Commonwealth | 23,869 | 803,431 | |
| Essex Property Trust, Inc. | 7,832 | 2,516,108 | |
| Gaming & Leisure Properties | 172,976 | 6,766,821 | |
| Hospitality Properties Trust (SBI) | 140,389 | 3,388,990 | |
| Host Hotels & Resorts, Inc. | 498,424 | 7,994,721 | |
| Life Storage, Inc. | 71,020 | 7,525,279 | |
| Outfront Media, Inc. | 338,542 | 9,303,134 | |
| Park Hotels & Resorts, Inc. | 430,700 | 10,142,985 | |
| PS Business Parks, Inc. | 25,642 | 4,605,560 | |
| Realty Income Corp. | 18,281 | 1,349,321 | |
| Retail Properties America, Inc. | 146,630 | 1,665,717 | |
| RLJ Lodging Trust | 15,425 | 250,039 | |
| Spirit MTA REIT | 68,598 | 576,223 | |
| Store Capital Corp. | 342,363 | 12,927,627 | |
| Sunstone Hotel Investors, Inc. | 353,482 | 4,644,753 | |
| Ventas, Inc. | 158,908 | 11,662,258 | |
| VEREIT, Inc. | 1,055,916 | 10,295,181 | |
| Weingarten Realty Investors (SBI) | 36,970 | 979,335 | |
| 138,917,740 | |||
| UTILITIES - 5.8% | |||
| Electric Utilities - 3.8% | |||
| Allete, Inc. | 6,051 | 518,752 | |
| Duke Energy Corp. | 180,457 | 16,735,582 | |
| Evergy, Inc. | 32,832 | 2,134,080 | |
| Exelon Corp. | 669,767 | 31,653,188 | |
| IDACORP, Inc. | 20,268 | 2,225,629 | |
| NextEra Energy, Inc. | 44,859 | 9,827,710 | |
| OGE Energy Corp. | 447,180 | 19,170,607 | |
| PNM Resources, Inc. | 118,477 | 6,043,512 | |
| Portland General Electric Co. | 328,080 | 18,664,471 | |
| PPL Corp. | 546,627 | 16,152,828 | |
| Southern Co. | 17,088 | 995,547 | |
| Vistra Energy Corp. | 122,674 | 3,060,716 | |
| Xcel Energy, Inc. | 223,661 | 14,363,509 | |
| 141,546,131 | |||
| Gas Utilities - 0.7% | |||
| National Fuel Gas Co. | 14,784 | 691,004 | |
| Southwest Gas Holdings, Inc. | 48,719 | 4,444,634 | |
| UGI Corp. | 418,014 | 20,344,741 | |
| 25,480,379 | |||
| Independent Power and Renewable Electricity Producers - 0.1% | |||
| The AES Corp. | 128,309 | 1,966,977 | |
| Multi-Utilities - 1.0% | |||
| Ameren Corp. | 255,932 | 19,745,154 | |
| MDU Resources Group, Inc. | 659,052 | 17,721,908 | |
| NorthWestern Energy Corp. | 12,537 | 908,180 | |
| 38,375,242 | |||
| Water Utilities - 0.2% | |||
| American States Water Co. (a) | 2,998 | 277,405 | |
| American Water Works Co., Inc. | 68,131 | 8,674,439 | |
| 8,951,844 | |||
| TOTAL UTILITIES | 216,320,573 | ||
| TOTAL COMMON STOCKS | |||
| (Cost $3,308,044,777) | 3,661,283,972 | ||
| Principal Amount | Value | ||
| U.S. Treasury Obligations - 0.1% | |||
| U.S. Treasury Bills, yield at date of purchase 2.46% 9/12/19 (c) | |||
| (Cost $3,997,045) | 4,000,000 | 3,998,137 | |
| Shares | Value | ||
| Money Market Funds - 3.9% | |||
| Fidelity Cash Central Fund 2.13% (d) | 82,686,990 | $82,703,527 | |
| Fidelity Securities Lending Cash Central Fund 2.13% (d)(e) | 64,092,683 | 64,099,092 | |
| TOTAL MONEY MARKET FUNDS | |||
| (Cost $146,802,619) | 146,802,619 | ||
| TOTAL INVESTMENT IN SECURITIES - 101.5% | |||
| (Cost $3,458,844,441) | 3,812,084,728 | ||
| NET OTHER ASSETS (LIABILITIES) - (1.5)% | (54,732,172) | ||
| NET ASSETS - 100% | $3,757,352,556 |
| Futures Contracts | |||||
| Number of contracts | Expiration Date | Notional Amount | Value | Unrealized Appreciation/(Depreciation) | |
| Purchased | |||||
| Equity Index Contracts | |||||
| CME E-mini S&P 500 Index Contracts (United States) | 658 | Sept. 2019 | $96,225,920 | $1,503,360 | $1,503,360 |
The notional amount of futures purchased as a percentage of Net Assets is 2.6%
For the period, the average monthly notional amount at value for futures contracts in the aggregate was $58,411,076.
Legend
(a) Security or a portion of the security is on loan at period end.
(b) Non-income producing
(c) Security or a portion of the security was pledged to cover margin requirements for futures contracts. At period end, the value of securities pledged amounted to $3,998,137.
(d) Affiliated fund that is generally available only to investment companies and other accounts managed by Fidelity Investments. The rate quoted is the annualized seven-day yield of the fund at period end. A complete unaudited listing of the fund's holdings as of its most recent quarter end is available upon request. In addition, each Fidelity Central Fund's financial statements, which are not covered by the Fund's Report of Independent Registered Public Accounting Firm, are available on the SEC's website or upon request.
(e) Investment made with cash collateral received from securities on loan.
Affiliated Central Funds
Information regarding fiscal year to date income earned by the Fund from investments in Fidelity Central Funds is as follows:
| Fund | Income earned |
| Fidelity Cash Central Fund | $982,715 |
| Fidelity Securities Lending Cash Central Fund | 42,714 |
| Total | $1,025,429 |
Amounts in the income column in the above table include any capital gain distributions from underlying funds, which are presented in the corresponding line-item in the Statement of Operations, if applicable. Amount for Fidelity Securities Lending Cash Central Fund represents the income earned on investing cash collateral, less rebates paid to borrowers and any lending agent fees associated with the loan, plus any premium payments received for lending certain types of securities.
Investment Valuation
The following is a summary of the inputs used, as of August 31, 2019, involving the Fund's assets and liabilities carried at fair value. The inputs or methodology used for valuing securities may not be an indication of the risk associated with investing in those securities. For more information on valuation inputs, and their aggregation into the levels used below, please refer to the Investment Valuation section in the accompanying Notes to Financial Statements.
| Valuation Inputs at Reporting Date: | ||||
| Description | Total | Level 1 | Level 2 | Level 3 |
| Investments in Securities: | ||||
| Equities: | ||||
| Communication Services | $351,305,018 | $351,305,018 | $-- | $-- |
| Consumer Discretionary | 222,857,766 | 222,857,766 | -- | -- |
| Consumer Staples | 366,541,754 | 366,541,754 | -- | -- |
| Energy | 243,850,381 | 243,850,381 | -- | -- |
| Financials | 784,120,868 | 784,120,868 | -- | -- |
| Health Care | 543,202,814 | 543,202,814 | -- | -- |
| Industrials | 379,622,626 | 379,622,626 | -- | -- |
| Information Technology | 289,147,606 | 289,147,606 | -- | -- |
| Materials | 125,396,826 | 125,396,826 | -- | -- |
| Real Estate | 138,917,740 | 138,917,740 | -- | -- |
| Utilities | 216,320,573 | 216,320,573 | -- | -- |
| U.S. Government and Government Agency Obligations | 3,998,137 | -- | 3,998,137 | -- |
| Money Market Funds | 146,802,619 | 146,802,619 | -- | -- |
| Total Investments in Securities: | $3,812,084,728 | $3,808,086,591 | $3,998,137 | $-- |
| Derivative Instruments: | ||||
| Assets | ||||
| Futures Contracts | $1,503,360 | $1,503,360 | $-- | $-- |
| Total Assets | $1,503,360 | $1,503,360 | $-- | $-- |
| Total Derivative Instruments: | $1,503,360 | $1,503,360 | $-- | $-- |
Value of Derivative Instruments
The following table is a summary of the Fund's value of derivative instruments by primary risk exposure as of August 31, 2019. For additional information on derivative instruments, please refer to the Derivative Instruments section in the accompanying Notes to Financial Statements.
| Primary Risk Exposure / Derivative Type | Value | |
| Asset | Liability | |
| Equity Risk | ||
| Futures Contracts(a) | $1,503,360 | $0 |
| Total Equity Risk | 1,503,360 | 0 |
| Total Value of Derivatives | $1,503,360 | $0 |
(a) Reflects gross cumulative appreciation (depreciation) on futures contracts as presented in the Schedule of Investments. In the Statement of Assets and Liabilities, the period end daily variation margin is included in receivable or payable for daily variation margin on futures contracts, and the net cumulative appreciation (depreciation) is included in distributable earnings.
See accompanying notes which are an integral part of the financial statements.
Fidelity® Large Cap Value Enhanced Index Fund
Financial Statements
Statement of Assets and Liabilities
| August 31, 2019 | ||
| Assets | ||
| Investment in securities, at value (including securities loaned of $62,592,841) — See accompanying schedule: Unaffiliated issuers (cost $3,312,041,822) | $3,665,282,109 | |
| Fidelity Central Funds (cost $146,802,619) | 146,802,619 | |
| Total Investment in Securities (cost $3,458,844,441) | $3,812,084,728 | |
| Segregated cash with brokers for derivative instruments | 162,972 | |
| Receivable for investments sold | 13,842,627 | |
| Receivable for fund shares sold | 1,852,552 | |
| Dividends receivable | 9,877,075 | |
| Distributions receivable from Fidelity Central Funds | 144,334 | |
| Other receivables | 4,642 | |
| Total assets | 3,837,968,930 | |
| Liabilities | ||
| Payable for investments purchased | $13,591,968 | |
| Payable for fund shares redeemed | 1,662,396 | |
| Accrued management fee | 1,202,583 | |
| Payable for daily variation margin on futures contracts | 62,443 | |
| Collateral on securities loaned | 64,096,984 | |
| Total liabilities | 80,616,374 | |
| Net Assets | $3,757,352,556 | |
| Net Assets consist of: | ||
| Paid in capital | $3,327,298,256 | |
| Total distributable earnings (loss) | 430,054,300 | |
| Net Assets, for 293,380,704 shares outstanding | $3,757,352,556 | |
| Net Asset Value, offering price and redemption price per share ($3,757,352,556 ÷ 293,380,704 shares) | $12.81 |
See accompanying notes which are an integral part of the financial statements.
Statement of Operations
| Year ended August 31, 2019 | ||
| Investment Income | ||
| Dividends | $100,262,615 | |
| Interest | 82,374 | |
| Income from Fidelity Central Funds (including $42,714 from security lending) | 1,025,429 | |
| Total income | 101,370,418 | |
| Expenses | ||
| Management fee | $14,311,509 | |
| Independent trustees' fees and expenses | 21,641 | |
| Interest | 14,664 | |
| Commitment fees | 9,902 | |
| Total expenses before reductions | 14,357,716 | |
| Expense reductions | (1,934) | |
| Total expenses after reductions | 14,355,782 | |
| Net investment income (loss) | 87,014,636 | |
| Realized and Unrealized Gain (Loss) | ||
| Net realized gain (loss) on: | ||
| Investment securities: | ||
| Unaffiliated issuers | 54,390,039 | |
| Fidelity Central Funds | 2,506 | |
| Futures contracts | 4,867,476 | |
| Total net realized gain (loss) | 59,260,021 | |
| Change in net unrealized appreciation (depreciation) on: | ||
| Investment securities: | ||
| Unaffiliated issuers | (169,611,505) | |
| Futures contracts | (371,112) | |
| Total change in net unrealized appreciation (depreciation) | (169,982,617) | |
| Net gain (loss) | (110,722,596) | |
| Net increase (decrease) in net assets resulting from operations | $(23,707,960) |
See accompanying notes which are an integral part of the financial statements.
Statement of Changes in Net Assets
| Year ended August 31, 2019 | Year ended August 31, 2018 | |
| Increase (Decrease) in Net Assets | ||
| Operations | ||
| Net investment income (loss) | $87,014,636 | $80,930,411 |
| Net realized gain (loss) | 59,260,021 | 171,412,266 |
| Change in net unrealized appreciation (depreciation) | (169,982,617) | 236,349,018 |
| Net increase (decrease) in net assets resulting from operations | (23,707,960) | 488,691,695 |
| Distributions to shareholders | (231,584,709) | – |
| Distributions to shareholders from net investment income | – | (54,064,321) |
| Distributions to shareholders from net realized gain | – | (84,958,215) |
| Total distributions | (231,584,709) | (139,022,536) |
| Share transactions | ||
| Proceeds from sales of shares | 875,552,334 | 3,117,051,859 |
| Reinvestment of distributions | 225,314,715 | 135,660,919 |
| Cost of shares redeemed | (1,013,499,571) | (2,739,945,144) |
| Net increase (decrease) in net assets resulting from share transactions | 87,367,478 | 512,767,634 |
| Total increase (decrease) in net assets | (167,925,191) | 862,436,793 |
| Net Assets | ||
| Beginning of period | 3,925,277,747 | 3,062,840,954 |
| End of period | $3,757,352,556 | $3,925,277,747 |
| Other Information | ||
| Undistributed net investment income end of period | $53,264,514 | |
| Shares | ||
| Sold | 69,275,964 | 238,097,759 |
| Issued in reinvestment of distributions | 18,657,416 | 10,395,472 |
| Redeemed | (78,854,901) | (209,314,245) |
| Net increase (decrease) | 9,078,479 | 39,178,986 |
See accompanying notes which are an integral part of the financial statements.
Financial Highlights
Fidelity Large Cap Value Enhanced Index Fund
| Years ended August 31, | 2019 | 2018 | 2017 A | 2017 B | 2016 C | 2015 B |
| Selected Per–Share Data | ||||||
| Net asset value, beginning of period | $13.81 | $12.50 | $12.53 | $9.94 | $11.38 | $10.21 |
| Income from Investment Operations | ||||||
| Net investment income (loss)D | .30 | .30 | .14 | .25 | .24 | .26E |
| Net realized and unrealized gain (loss) | (.46) | 1.57 | (.04) | 2.55 | (1.32) | 1.28 |
| Total from investment operations | (.16) | 1.87 | .10 | 2.80 | (1.08) | 1.54 |
| Distributions from net investment income | (.31) | (.22) | (.04) | (.21) | (.21) | (.12) |
| Distributions from net realized gain | (.54) | (.34) | (.09) | – | (.15) | (.24) |
| Total distributions | (.84)F | (.56) | (.13) | (.21) | (.36) | (.37)G |
| Net asset value, end of period | $12.81 | $13.81 | $12.50 | $12.53 | $9.94 | $11.38 |
| Total ReturnH,I | (.77)% | 15.20% | .79% | 28.30% | (9.69)% | 15.37% |
| Ratios to Average Net AssetsJ,K | ||||||
| Expenses before reductions | .39% | .39% | .40%L | .45% | .45% | .45% |
| Expenses net of fee waivers, if any | .39% | .39% | .40%L | .45% | .45% | .45% |
| Expenses net of all reductions | .39% | .39% | .40%L | .45% | .45% | .45% |
| Net investment income (loss) | 2.37% | 2.27% | 2.27%L | 2.23% | 2.20% | 2.34%E |
| Supplemental Data | ||||||
| Net assets, end of period (000 omitted) | $3,757,353 | $3,925,278 | $3,062,841 | $2,889,227 | $1,568,289 | $1,105,349 |
| Portfolio turnover rateM | 94% | 99% | 93%L | 81% | 88% | 76%N |
A For the six month period ended August 31. The Fund changed its fiscal year end from February 28 to August 31, effective August 31, 2017.
B For the year ended February 28.
C For the year ended February 29.
D Calculated based on average shares outstanding during the period.
E Net investment income per share reflects a large, non-recurring dividend which amounted to $.04 per share. Excluding this non-recurring dividend, the ratio of net investment income (loss) to average net assets would have been 2.00%.
F Total distributions of $.84 per share is comprised of distributions from net investment income of $.305 and distributions from net realized gain of $.536 per share
G Total distributions of $.37 per share is comprised of distributions from net investment income of $.124 and distributions from net realized gain of $.243 per share.
H Total returns for periods of less than one year are not annualized.
I Total returns would have been lower if certain expenses had not been reduced during the applicable periods shown.
J Fees and expenses of any underlying Fidelity Central Funds are not included in the Fund's expense ratio. The Fund indirectly bears its proportionate share of the expenses of any underlying Fidelity Central Funds.
K Expense ratios reflect operating expenses of the Fund. Expenses before reductions do not reflect amounts reimbursed by the investment adviser or reductions from expense offset arrangements and do not represent the amount paid by the Fund during periods when reimbursements or reductions occur. Expenses net of fee waivers reflect expenses after reimbursement by the investment adviser but prior to reductions from expense offset arrangements. Expenses net of all reductions represent the net expenses paid by the Fund.
L Annualized
M Amount does not include the portfolio activity of any underlying Fidelity Central Funds.
N Portfolio turnover rate excludes securities received or delivered in-kind.
See accompanying notes which are an integral part of the financial statements.
Fidelity® Large Cap Core Enhanced Index Fund
Performance: The Bottom Line
Average annual total return reflects the change in the value of an investment, assuming reinvestment of distributions from dividend income and capital gains (the profits earned upon the sale of securities that have grown in value, if any) and assuming a constant rate of performance each year. The hypothetical investment and the average annual total returns do not reflect the deduction of taxes that a shareholder would pay on fund distributions or the redemption of fund shares. During periods of reimbursement by Fidelity, a fund’s total return will be greater than it would be had the reimbursement not occurred. How a fund did yesterday is no guarantee of how it will do tomorrow.
Average Annual Total Returns
| For the periods ended August 31, 2019 | Past 1 year | Past 5 years | Past 10 years |
| Fidelity® Large Cap Core Enhanced Index Fund | 0.65% | 9.01% | 12.85% |
$10,000 Over 10 Years
Let's say hypothetically that $10,000 was invested in Fidelity® Large Cap Core Enhanced Index Fund on August 31, 2009.
The chart shows how the value of your investment would have changed, and also shows how the S&P 500® Index performed over the same period.
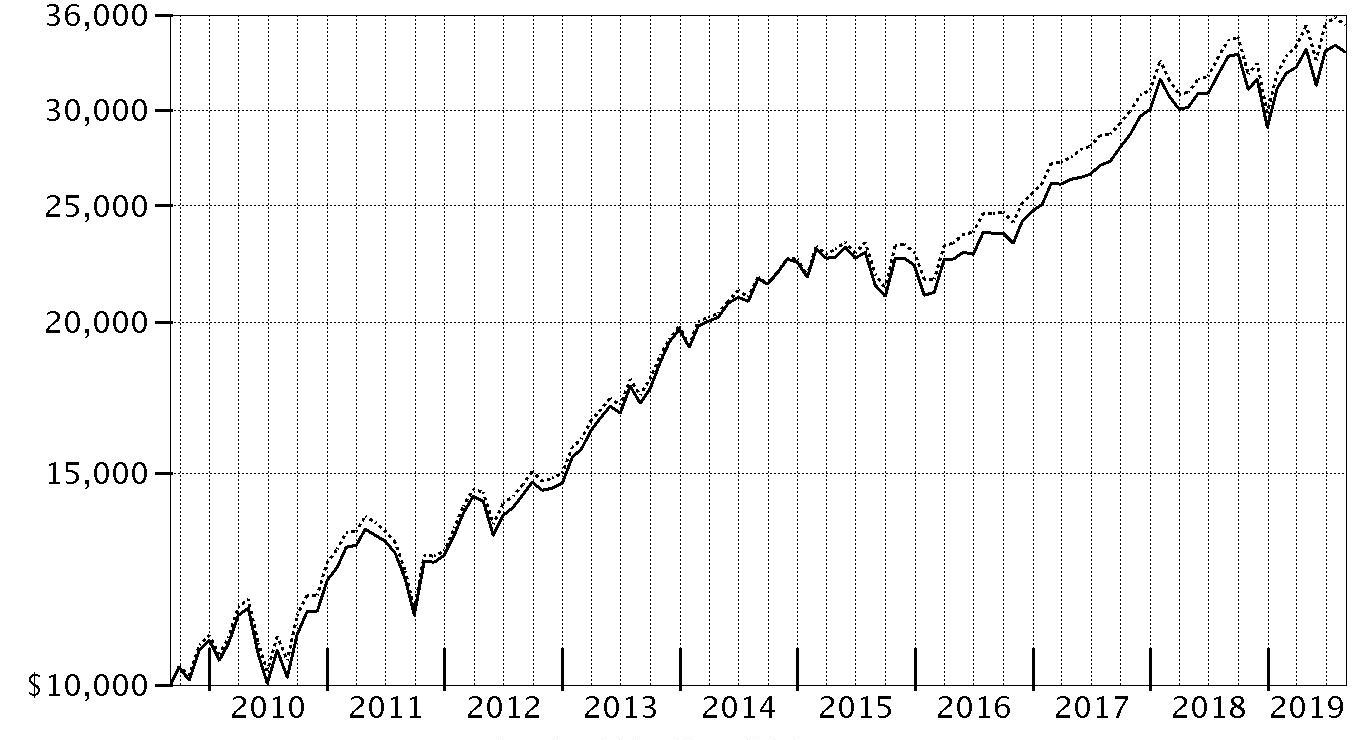
| Period Ending Values | ||
| $33,501 | Fidelity® Large Cap Core Enhanced Index Fund | |
| $35,308 | S&P 500® Index | |
Fidelity® Large Cap Core Enhanced Index Fund
Management's Discussion of Fund Performance
Market Recap: The S&P 500® index gained 2.92% for the 12 months ending August 31, 2019, a choppy period in which stocks seesawed due to trade tension, interest rates, economic data and an inverted yield curve, among other factors. Equities began the new year on a high note after enduring a historically volatile final quarter of 2018. Upbeat company earnings and outlooks, along with signs the Federal Reserve may pause on rates, boosted stocks to an all-time high on April 30. In May, however, the index sunk amid the Fed’s decision to hold interest rates steady and signal it had little appetite to adjust them any time soon, as well as retaliatory tariffs imposed on the U.S. by China. The bull market roared back in June and recorded a series of highs in July, when the Fed cut interest rates for the first time since 2008. Volatility intensified in August, however, as the U.S. Treasury yield curve inverted for the first time since 2007, which some investors viewed as a sign the world's biggest economy could be heading for recession. For the full 12 months, three defensive sectors led the way: utilities (+21%), real estate (+20%) and consumer staples (+16%). The information technology sector rose about 8%, boosted by software & services (+18%), the market’s largest industry segment. Communication services stocks gained roughly 5%. In contrast, energy (-20%) was by far the weakest sector, followed by financials (-3%) and materials (-3%). Other notable laggards included health care (-1%), industrials (+1%) and consumer discretionary (+2%).Comments from Maximilian Kaufmann, Senior Portfolio Manager of the Geode Capital Management, LLC, investment management team: For the fiscal year, the fund gained 0.65%, trailing the 2.92% advance of the benchmark S&P 500® index. Security selection in the information technology, health care, real estate and consumer discretionary sectors detracted most from performance during the reporting period, as did an underweighting in the strong performing real estate and utilities groups. Conversely, the fund benefited from picks in consumer discretionary as well as broad exposure to energy stocks. Individually, the portfolio's biggest detractor was chemical manufacturer Huntsman (-36%), an out-of-benchmark position. In July, the firm reported weaker-than-anticipated financial results. Another detractor was DXC Technology, an IT services provider that returned about -39% for the fund and which we ultimately sold in June. Biogen (-38%) also hampered the fund's relative result, as the stock fell sharply in March following disappointing results in two late-stage drug trials involving a potential treatment for Alzheimer's disease. Meanwhile, Procter & Gamble was the fund's leading contributor. Shares of this consumer branded-goods company rose approximately 49% the past 12 months, benefiting from strong sales growth trends. Lastly, adding further relative value was Red Hat, which gained 26% for the fund. We sold most of this position last October after the company agreed to be acquired by IBM, and then sold our remaining position in July, shortly after the merger closed.The views expressed above reflect those of the portfolio manager(s) only through the end of the period as stated on the cover of this report and do not necessarily represent the views of Fidelity or any other person in the Fidelity organization. Any such views are subject to change at any time based upon market or other conditions and Fidelity disclaims any responsibility to update such views. These views may not be relied on as investment advice and, because investment decisions for a Fidelity fund are based on numerous factors, may not be relied on as an indication of trading intent on behalf of any Fidelity fund.
Fidelity® Large Cap Core Enhanced Index Fund
Investment Summary (Unaudited)
Top Ten Stocks as of August 31, 2019
| % of fund's net assets | |
| Microsoft Corp. | 4.8 |
| Amazon.com, Inc. | 3.2 |
| Apple, Inc. | 3.2 |
| Facebook, Inc. Class A | 2.3 |
| Alphabet, Inc. Class C | 2.0 |
| JPMorgan Chase & Co. | 1.9 |
| Procter & Gamble Co. | 1.7 |
| Johnson & Johnson | 1.7 |
| AT&T, Inc. | 1.6 |
| Visa, Inc. Class A | 1.5 |
| 23.9 |
Top Market Sectors as of August 31, 2019
| % of fund's net assets | |
| Information Technology | 23.6 |
| Health Care | 15.6 |
| Communication Services | 11.9 |
| Financials | 10.9 |
| Consumer Discretionary | 10.4 |
| Consumer Staples | 8.8 |
| Industrials | 8.5 |
| Energy | 3.9 |
| Utilities | 2.1 |
| Real Estate | 1.9 |
Asset Allocation (% of fund's net assets)
| As of August 31, 2019 * | ||
| Stocks and Equity Futures | 100.0% | |

* Foreign investments - 2.0%
Fidelity® Large Cap Core Enhanced Index Fund
Schedule of Investments August 31, 2019
Showing Percentage of Net Assets
| Common Stocks - 99.1% | |||
| Shares | Value | ||
| COMMUNICATION SERVICES - 11.9% | |||
| Diversified Telecommunication Services - 3.1% | |||
| AT&T, Inc. | 370,769 | $13,073,315 | |
| Verizon Communications, Inc. | 213,497 | 12,416,986 | |
| 25,490,301 | |||
| Entertainment - 0.9% | |||
| Electronic Arts, Inc. (a) | 36,407 | 3,410,608 | |
| Netflix, Inc. (a) | 913 | 268,194 | |
| The Walt Disney Co. | 29,092 | 3,993,168 | |
| 7,671,970 | |||
| Interactive Media & Services - 5.8% | |||
| Alphabet, Inc.: | |||
| Class A (a) | 10,205 | 12,149,359 | |
| Class C (a) | 14,060 | 16,704,686 | |
| Facebook, Inc. Class A (a) | 103,726 | 19,258,806 | |
| 48,112,851 | |||
| Media - 2.1% | |||
| Comcast Corp. Class A | 252,814 | 11,189,548 | |
| DISH Network Corp. Class A (a)(b) | 50,589 | 1,697,767 | |
| Omnicom Group, Inc. | 60,601 | 4,609,312 | |
| 17,496,627 | |||
| Wireless Telecommunication Services - 0.0% | |||
| Telephone & Data Systems, Inc. | 3,626 | 91,375 | |
| TOTAL COMMUNICATION SERVICES | 98,863,124 | ||
| CONSUMER DISCRETIONARY - 10.4% | |||
| Auto Components - 0.1% | |||
| Gentex Corp. | 39,725 | 1,056,685 | |
| Automobiles - 0.6% | |||
| Ford Motor Co. | 546,949 | 5,015,522 | |
| Diversified Consumer Services - 0.5% | |||
| Bright Horizons Family Solutions, Inc. (a) | 1,497 | 247,080 | |
| Frontdoor, Inc. (a) | 80,955 | 4,156,230 | |
| 4,403,310 | |||
| Hotels, Restaurants & Leisure - 2.1% | |||
| Chipotle Mexican Grill, Inc. (a) | 6,117 | 5,128,615 | |
| Extended Stay America, Inc. unit | 129,837 | 1,824,210 | |
| McDonald's Corp. | 12,481 | 2,720,484 | |
| Norwegian Cruise Line Holdings Ltd. (a) | 42,971 | 2,180,778 | |
| Starbucks Corp. | 57,148 | 5,518,211 | |
| 17,372,298 | |||
| Household Durables - 0.1% | |||
| NVR, Inc. (a) | 325 | 1,169,675 | |
| Internet & Direct Marketing Retail - 3.8% | |||
| Amazon.com, Inc. (a) | 15,206 | 27,010,266 | |
| eBay, Inc. | 118,077 | 4,757,322 | |
| 31,767,588 | |||
| Multiline Retail - 0.6% | |||
| Target Corp. | 48,428 | 5,183,733 | |
| Specialty Retail - 2.2% | |||
| AutoZone, Inc. (a) | 4,721 | 5,201,078 | |
| Best Buy Co., Inc. | 8,758 | 557,447 | |
| IAA Spinco, Inc. (a) | 60,208 | 2,941,161 | |
| Lithia Motors, Inc. Class A (sub. vtg.) | 769 | 100,793 | |
| The Home Depot, Inc. | 40,583 | 9,249,272 | |
| 18,049,751 | |||
| Textiles, Apparel & Luxury Goods - 0.4% | |||
| Ralph Lauren Corp. | 34,559 | 3,052,942 | |
| TOTAL CONSUMER DISCRETIONARY | 87,071,504 | ||
| CONSUMER STAPLES - 8.8% | |||
| Beverages - 1.6% | |||
| Coca-Cola Bottling Co. Consolidated | 8,391 | 2,824,495 | |
| PepsiCo, Inc. | 52,592 | 7,190,904 | |
| The Coca-Cola Co. | 61,480 | 3,383,859 | |
| 13,399,258 | |||
| Food & Staples Retailing - 2.6% | |||
| Costco Wholesale Corp. | 30,151 | 8,887,309 | |
| Kroger Co. | 127,285 | 3,014,109 | |
| Walgreens Boots Alliance, Inc. | 3,434 | 175,786 | |
| Walmart, Inc. | 83,823 | 9,577,616 | |
| 21,654,820 | |||
| Food Products - 0.6% | |||
| General Mills, Inc. | 75,143 | 4,042,693 | |
| The Hershey Co. | 5,293 | 838,835 | |
| Tyson Foods, Inc. Class A | 5,571 | 518,326 | |
| 5,399,854 | |||
| Household Products - 2.9% | |||
| Colgate-Palmolive Co. | 64,845 | 4,808,257 | |
| Kimberly-Clark Corp. | 32,101 | 4,529,772 | |
| Procter & Gamble Co. | 120,703 | 14,512,122 | |
| 23,850,151 | |||
| Personal Products - 0.6% | |||
| Estee Lauder Companies, Inc. Class A | 26,242 | 5,195,654 | |
| Tobacco - 0.5% | |||
| Altria Group, Inc. | 45,551 | 1,992,401 | |
| Philip Morris International, Inc. | 31,552 | 2,274,584 | |
| 4,266,985 | |||
| TOTAL CONSUMER STAPLES | 73,766,722 | ||
| ENERGY - 3.9% | |||
| Oil, Gas & Consumable Fuels - 3.9% | |||
| Chevron Corp. | 99,832 | 11,752,223 | |
| ConocoPhillips Co. | 118,207 | 6,168,041 | |
| Exxon Mobil Corp. | 176,445 | 12,082,954 | |
| Kinder Morgan, Inc. | 128,279 | 2,600,215 | |
| 32,603,433 | |||
| FINANCIALS - 10.9% | |||
| Banks - 5.2% | |||
| Bank of America Corp. | 326,687 | 8,987,159 | |
| Citigroup, Inc. | 115,802 | 7,451,859 | |
| JPMorgan Chase & Co. | 145,849 | 16,022,971 | |
| SunTrust Banks, Inc. | 1,641 | 100,938 | |
| Wells Fargo & Co. | 230,521 | 10,735,363 | |
| 43,298,290 | |||
| Capital Markets - 1.4% | |||
| Invesco Ltd. | 187,407 | 2,942,290 | |
| MarketAxess Holdings, Inc. | 6,626 | 2,634,630 | |
| Morgan Stanley | 146,709 | 6,086,956 | |
| 11,663,876 | |||
| Consumer Finance - 0.9% | |||
| Ally Financial, Inc. | 37,592 | 1,178,509 | |
| Capital One Financial Corp. | 5,179 | 448,605 | |
| Discover Financial Services | 38,181 | 3,053,335 | |
| Synchrony Financial | 77,019 | 2,468,459 | |
| 7,148,908 | |||
| Diversified Financial Services - 1.3% | |||
| Berkshire Hathaway, Inc. Class B (a) | 45,017 | 9,156,908 | |
| Jefferies Financial Group, Inc. | 98,210 | 1,830,634 | |
| 10,987,542 | |||
| Insurance - 2.1% | |||
| Allstate Corp. | 5,338 | 546,558 | |
| CNA Financial Corp. | 31,367 | 1,478,327 | |
| First American Financial Corp. | 71,324 | 4,168,888 | |
| FNF Group | 14,268 | 626,936 | |
| Hartford Financial Services Group, Inc. | 11,668 | 680,011 | |
| Kemper Corp. | 3,873 | 271,033 | |
| Primerica, Inc. | 17,350 | 2,067,600 | |
| Progressive Corp. | 73,520 | 5,572,816 | |
| Selective Insurance Group, Inc. | 18,362 | 1,462,166 | |
| The Travelers Companies, Inc. | 1,458 | 214,268 | |
| Unum Group | 12,340 | 313,559 | |
| W.R. Berkley Corp. | 4,145 | 295,331 | |
| 17,697,493 | |||
| Mortgage Real Estate Investment Trusts - 0.0% | |||
| MFA Financial, Inc. | 7,755 | 55,603 | |
| TOTAL FINANCIALS | 90,851,712 | ||
| HEALTH CARE - 15.6% | |||
| Biotechnology - 3.2% | |||
| AbbVie, Inc. | 106,940 | 7,030,236 | |
| Alexion Pharmaceuticals, Inc. (a) | 447 | 45,040 | |
| Amgen, Inc. | 40,911 | 8,534,853 | |
| Biogen, Inc. (a) | 24,471 | 5,377,502 | |
| Celgene Corp. (a) | 14,570 | 1,410,376 | |
| Gilead Sciences, Inc. | 40,748 | 2,589,128 | |
| Regeneron Pharmaceuticals, Inc. (a) | 5,428 | 1,574,391 | |
| 26,561,526 | |||
| Health Care Equipment & Supplies - 3.2% | |||
| Abbott Laboratories | 111,259 | 9,492,618 | |
| Baxter International, Inc. | 1,774 | 156,023 | |
| Boston Scientific Corp. (a) | 74,551 | 3,185,564 | |
| Danaher Corp. | 25,941 | 3,685,957 | |
| Edwards Lifesciences Corp. (a) | 13,441 | 2,981,751 | |
| Hologic, Inc. (a) | 61,746 | 3,048,400 | |
| IDEXX Laboratories, Inc. (a) | 236 | 68,379 | |
| Medtronic PLC | 35,425 | 3,822,003 | |
| 26,440,695 | |||
| Health Care Providers & Services - 3.0% | |||
| AmerisourceBergen Corp. | 27,082 | 2,228,036 | |
| Anthem, Inc. | 19,290 | 5,044,721 | |
| CVS Health Corp. | 97,366 | 5,931,537 | |
| McKesson Corp. | 2,181 | 301,567 | |
| UnitedHealth Group, Inc. | 50,195 | 11,745,630 | |
| 25,251,491 | |||
| Health Care Technology - 0.4% | |||
| Cerner Corp. | 28,672 | 1,975,788 | |
| Veeva Systems, Inc. Class A (a) | 8,342 | 1,337,890 | |
| 3,313,678 | |||
| Life Sciences Tools & Services - 0.6% | |||
| Agilent Technologies, Inc. | 69,099 | 4,913,630 | |
| Thermo Fisher Scientific, Inc. | 686 | 196,923 | |
| 5,110,553 | |||
| Pharmaceuticals - 5.2% | |||
| Allergan PLC | 3,848 | 614,603 | |
| Bristol-Myers Squibb Co. (b) | 148,458 | 7,136,376 | |
| Eli Lilly & Co. | 61,676 | 6,967,538 | |
| Johnson & Johnson | 109,881 | 14,104,325 | |
| Merck & Co., Inc. | 138,665 | 11,990,363 | |
| Pfizer, Inc. | 70,870 | 2,519,429 | |
| 43,332,634 | |||
| TOTAL HEALTH CARE | 130,010,577 | ||
| INDUSTRIALS - 8.5% | |||
| Aerospace & Defense - 2.7% | |||
| Arconic, Inc. | 2,581 | 66,693 | |
| Harris Corp. | 26,804 | 5,666,634 | |
| Lockheed Martin Corp. | 6,051 | 2,324,250 | |
| Moog, Inc. Class A | 48,114 | 3,909,263 | |
| Northrop Grumman Corp. | 5,252 | 1,932,053 | |
| Parsons Corp. | 43,924 | 1,494,294 | |
| Raytheon Co. | 4,649 | 861,553 | |
| The Boeing Co. | 15,910 | 5,792,672 | |
| United Technologies Corp. | 4,307 | 560,944 | |
| 22,608,356 | |||
| Building Products - 0.1% | |||
| Johnson Controls International PLC | 27,791 | 1,186,398 | |
| Commercial Services & Supplies - 0.8% | |||
| Herman Miller, Inc. | 13,982 | 591,159 | |
| KAR Auction Services, Inc. | 34,504 | 916,426 | |
| Republic Services, Inc. | 33,610 | 2,999,693 | |
| UniFirst Corp. | 8,555 | 1,676,010 | |
| Waste Management, Inc. | 1,749 | 208,743 | |
| 6,392,031 | |||
| Construction & Engineering - 0.5% | |||
| EMCOR Group, Inc. | 51,391 | 4,493,629 | |
| Industrial Conglomerates - 0.4% | |||
| Honeywell International, Inc. | 9,880 | 1,626,446 | |
| Roper Technologies, Inc. | 5,557 | 2,038,085 | |
| 3,664,531 | |||
| Machinery - 2.2% | |||
| AGCO Corp. | 58,367 | 4,034,327 | |
| Allison Transmission Holdings, Inc. | 16,614 | 738,160 | |
| Caterpillar, Inc. | 47,786 | 5,686,534 | |
| Cummins, Inc. | 26,198 | 3,910,575 | |
| Dover Corp. | 35,061 | 3,286,618 | |
| Oshkosh Corp. | 7,062 | 496,247 | |
| 18,152,461 | |||
| Professional Services - 0.4% | |||
| Robert Half International, Inc. | 65,641 | 3,509,824 | |
| Road & Rail - 1.4% | |||
| CSX Corp. | 72,683 | 4,871,215 | |
| Union Pacific Corp. | 39,629 | 6,418,313 | |
| 11,289,528 | |||
| TOTAL INDUSTRIALS | 71,296,758 | ||
| INFORMATION TECHNOLOGY - 23.6% | |||
| Communications Equipment - 1.9% | |||
| Ciena Corp. (a) | 45,748 | 1,872,466 | |
| Cisco Systems, Inc. | 232,311 | 10,874,478 | |
| F5 Networks, Inc. (a) | 3,476 | 447,465 | |
| Juniper Networks, Inc. | 128,116 | 2,967,167 | |
| 16,161,576 | |||
| Electronic Equipment & Components - 0.2% | |||
| Keysight Technologies, Inc. (a) | 13,670 | 1,324,076 | |
| Tech Data Corp. (a) | 3,569 | 330,953 | |
| 1,655,029 | |||
| IT Services - 5.7% | |||
| Accenture PLC Class A | 272 | 53,902 | |
| Alliance Data Systems Corp. | 1,396 | 171,638 | |
| Amdocs Ltd. | 67,138 | 4,346,514 | |
| Automatic Data Processing, Inc. | 7,634 | 1,296,559 | |
| Booz Allen Hamilton Holding Corp. Class A | 9,363 | 707,000 | |
| CACI International, Inc. Class A (a) | 3,905 | 868,042 | |
| Fiserv, Inc. (a) | 58,450 | 6,250,643 | |
| Genpact Ltd. | 12,955 | 530,637 | |
| IBM Corp. | 60,392 | 8,184,928 | |
| MasterCard, Inc. Class A | 40,212 | 11,314,450 | |
| PayPal Holdings, Inc. (a) | 1,436 | 156,596 | |
| VeriSign, Inc. (a) | 2,314 | 471,709 | |
| Visa, Inc. Class A | 71,522 | 12,932,608 | |
| 47,285,226 | |||
| Semiconductors & Semiconductor Equipment - 3.3% | |||
| Applied Materials, Inc. | 60,104 | 2,886,194 | |
| Cirrus Logic, Inc. (a) | 19,529 | 1,047,536 | |
| Intel Corp. | 241,461 | 11,447,666 | |
| Lam Research Corp. | 23,712 | 4,991,613 | |
| Micron Technology, Inc. (a) | 35,850 | 1,622,930 | |
| Qualcomm, Inc. | 59,165 | 4,601,262 | |
| Xilinx, Inc. | 12,074 | 1,256,420 | |
| 27,853,621 | |||
| Software - 8.6% | |||
| Adobe, Inc. (a) | 7,963 | 2,265,553 | |
| Anaplan, Inc. | 2,953 | 160,436 | |
| Cadence Design Systems, Inc. (a) | 70,853 | 4,852,013 | |
| Intuit, Inc. | 12,560 | 3,621,802 | |
| Microsoft Corp. | 288,783 | 39,811,615 | |
| Nuance Communications, Inc. (a) | 119,103 | 2,002,121 | |
| Oracle Corp. | 67,122 | 3,494,371 | |
| Salesforce.com, Inc. (a) | 45,879 | 7,160,336 | |
| Synopsys, Inc. (a) | 37,704 | 5,346,804 | |
| Verint Systems, Inc. (a) | 37,899 | 2,019,638 | |
| Workiva, Inc. (a) | 10,952 | 526,901 | |
| 71,261,590 | |||
| Technology Hardware, Storage & Peripherals - 3.9% | |||
| Apple, Inc. | 127,325 | 26,577,821 | |
| HP, Inc. | 123,079 | 2,251,115 | |
| Xerox Holdings Corp. | 129,607 | 3,757,307 | |
| 32,586,243 | |||
| TOTAL INFORMATION TECHNOLOGY | 196,803,285 | ||
| MATERIALS - 1.5% | |||
| Chemicals - 0.2% | |||
| CF Industries Holdings, Inc. | 15,257 | 735,235 | |
| Ecolab, Inc. | 1,956 | 403,542 | |
| Huntsman Corp. | 34,986 | 696,921 | |
| 1,835,698 | |||
| Containers & Packaging - 0.2% | |||
| Packaging Corp. of America | 10,518 | 1,057,900 | |
| Metals & Mining - 1.1% | |||
| Newmont Goldcorp Corp. | 136,759 | 5,455,317 | |
| Reliance Steel & Aluminum Co. | 38,991 | 3,791,095 | |
| 9,246,412 | |||
| TOTAL MATERIALS | 12,140,010 | ||
| REAL ESTATE - 1.9% | |||
| Equity Real Estate Investment Trusts (REITs) - 1.8% | |||
| American Tower Corp. | 12,049 | 2,773,559 | |
| Apartment Investment & Management Co. Class A | 32,977 | 1,681,827 | |
| Corrections Corp. of America | 92,970 | 1,575,842 | |
| National Retail Properties, Inc. | 751 | 42,169 | |
| PS Business Parks, Inc. | 5,986 | 1,075,145 | |
| Public Storage | 205 | 54,272 | |
| Realty Income Corp. | 66,342 | 4,896,703 | |
| Retail Properties America, Inc. | 22,653 | 257,338 | |
| SBA Communications Corp. Class A | 1,844 | 483,921 | |
| Simon Property Group, Inc. | 16,854 | 2,510,235 | |
| 15,351,011 | |||
| Real Estate Management & Development - 0.1% | |||
| Jones Lang LaSalle, Inc. | 5,638 | 755,774 | |
| TOTAL REAL ESTATE | 16,106,785 | ||
| UTILITIES - 2.1% | |||
| Electric Utilities - 1.7% | |||
| Duke Energy Corp. | 16,982 | 1,574,911 | |
| Exelon Corp. | 118,149 | 5,583,722 | |
| IDACORP, Inc. | 7,442 | 817,206 | |
| Pinnacle West Capital Corp. | 17,860 | 1,702,237 | |
| Portland General Electric Co. | 71,341 | 4,058,589 | |
| PPL Corp. | 23,474 | 693,657 | |
| 14,430,322 | |||
| Gas Utilities - 0.1% | |||
| Southwest Gas Holdings, Inc. | 4,077 | 371,945 | |
| UGI Corp. | 4,718 | 229,625 | |
| 601,570 | |||
| Independent Power and Renewable Electricity Producers - 0.1% | |||
| The AES Corp. | 41,173 | 631,182 | |
| Multi-Utilities - 0.1% | |||
| NorthWestern Energy Corp. | 3,682 | 266,724 | |
| WEC Energy Group, Inc. | 7,774 | 744,516 | |
| 1,011,240 | |||
| Water Utilities - 0.1% | |||
| American States Water Co. (b) | 5,462 | 505,399 | |
| TOTAL UTILITIES | 17,179,713 | ||
| TOTAL COMMON STOCKS | |||
| (Cost $658,656,860) | 826,693,623 | ||
| Principal Amount | Value | ||
| U.S. Treasury Obligations - 0.1% | |||
| U.S. Treasury Bills, yield at date of purchase 2.46% 9/12/19 (c) | |||
| (Cost $999,261) | 1,000,000 | 999,534 | |
| Shares | Value | ||
| Money Market Funds - 1.6% | |||
| Fidelity Cash Central Fund 2.13% (d) | 5,359,344 | $5,360,416 | |
| Fidelity Securities Lending Cash Central Fund 2.13% (d)(e) | 8,318,587 | 8,319,419 | |
| TOTAL MONEY MARKET FUNDS | |||
| (Cost $13,679,800) | 13,679,835 | ||
| TOTAL INVESTMENT IN SECURITIES - 100.8% | |||
| (Cost $673,335,921) | 841,372,992 | ||
| NET OTHER ASSETS (LIABILITIES) - (0.8)% | (6,737,824) | ||
| NET ASSETS - 100% | $834,635,168 |
| Futures Contracts | |||||
| Number of contracts | Expiration Date | Notional Amount | Value | Unrealized Appreciation/(Depreciation) | |
| Purchased | |||||
| Equity Index Contracts | |||||
| CME E-mini S&P 500 Index Contracts (United States) | 54 | Sept. 2019 | $7,896,960 | $112,867 | $112,867 |
The notional amount of futures purchased as a percentage of Net Assets is 0.9%
For the period, the average monthly notional amount at value for futures contracts in the aggregate was $13,464,570.
Legend
(a) Non-income producing
(b) Security or a portion of the security is on loan at period end.
(c) Security or a portion of the security was pledged to cover margin requirements for futures contracts. At period end, the value of securities pledged amounted to $425,802.
(d) Affiliated fund that is generally available only to investment companies and other accounts managed by Fidelity Investments. The rate quoted is the annualized seven-day yield of the fund at period end. A complete unaudited listing of the fund's holdings as of its most recent quarter end is available upon request. In addition, each Fidelity Central Fund's financial statements , which are not covered by the Fund's Report of Independent Registered Public Accounting Firm, are available on the SEC's website or upon request.
(e) Investment made with cash collateral received from securities on loan.
Affiliated Central Funds
Information regarding fiscal year to date income earned by the Fund from investments in Fidelity Central Funds is as follows:
| Fund | Income earned |
| Fidelity Cash Central Fund | $307,321 |
| Fidelity Securities Lending Cash Central Fund | 41,448 |
| Total | $348,769 |
Amounts in the income column in the above table include any capital gain distributions from underlying funds, which are presented in the corresponding line-item in the Statement of Operations, if applicable. Amount for Fidelity Securities Lending Cash Central Fund represents the income earned on investing cash collateral, less rebates paid to borrowers and any lending agent fees associated with the loan, plus any premium payments received for lending certain types of securities.
Investment Valuation
The following is a summary of the inputs used, as of August 31, 2019, involving the Fund's assets and liabilities carried at fair value. The inputs or methodology used for valuing securities may not be an indication of the risk associated with investing in those securities. For more information on valuation inputs, and their aggregation into the levels used below, please refer to the Investment Valuation section in the accompanying Notes to Financial Statements.
| Valuation Inputs at Reporting Date: | ||||
| Description | Total | Level 1 | Level 2 | Level 3 |
| Investments in Securities: | ||||
| Equities: | ||||
| Communication Services | $98,863,124 | $98,863,124 | $-- | $-- |
| Consumer Discretionary | 87,071,504 | 87,071,504 | -- | -- |
| Consumer Staples | 73,766,722 | 73,766,722 | -- | -- |
| Energy | 32,603,433 | 32,603,433 | -- | -- |
| Financials | 90,851,712 | 90,851,712 | -- | -- |
| Health Care | 130,010,577 | 130,010,577 | -- | -- |
| Industrials | 71,296,758 | 71,296,758 | -- | -- |
| Information Technology | 196,803,285 | 196,803,285 | -- | -- |
| Materials | 12,140,010 | 12,140,010 | -- | -- |
| Real Estate | 16,106,785 | 16,106,785 | -- | -- |
| Utilities | 17,179,713 | 17,179,713 | -- | -- |
| U.S. Government and Government Agency Obligations | 999,534 | -- | 999,534 | -- |
| Money Market Funds | 13,679,835 | 13,679,835 | -- | -- |
| Total Investments in Securities: | $841,372,992 | $840,373,458 | $999,534 | $-- |
| Derivative Instruments: | ||||
| Assets | ||||
| Futures Contracts | $112,867 | $112,867 | $-- | $-- |
| Total Assets | $112,867 | $112,867 | $-- | $-- |
| Total Derivative Instruments: | $112,867 | $112,867 | $-- | $-- |
Value of Derivative Instruments
The following table is a summary of the Fund's value of derivative instruments by primary risk exposure as of August 31, 2019. For additional information on derivative instruments, please refer to the Derivative Instruments section in the accompanying Notes to Financial Statements.
| Primary Risk Exposure / Derivative Type | Value | |
| Asset | Liability | |
| Equity Risk | ||
| Futures Contracts(a) | $112,867 | $0 |
| Total Equity Risk | 112,867 | 0 |
| Total Value of Derivatives | $112,867 | $0 |
(a) Reflects gross cumulative appreciation (depreciation) on futures contracts as presented in the Schedule of Investments. In the Statement of Assets and Liabilities, the period end daily variation margin is included in receivable or payable for daily variation margin on futures contracts, and the net cumulative appreciation (depreciation) is included in distributable earnings.
See accompanying notes which are an integral part of the financial statements.
Fidelity® Large Cap Core Enhanced Index Fund
Financial Statements
Statement of Assets and Liabilities
| August 31, 2019 | ||
| Assets | ||
| Investment in securities, at value (including securities loaned of $8,118,961) — See accompanying schedule: Unaffiliated issuers (cost $659,656,121) | $827,693,157 | |
| Fidelity Central Funds (cost $13,679,800) | 13,679,835 | |
| Total Investment in Securities (cost $673,335,921) | $841,372,992 | |
| Receivable for investments sold | 2,647,177 | |
| Receivable for fund shares sold | 1,178,052 | |
| Dividends receivable | 1,768,458 | |
| Distributions receivable from Fidelity Central Funds | 16,242 | |
| Total assets | 846,982,921 | |
| Liabilities | ||
| Payable for investments purchased | $3,277,491 | |
| Payable for fund shares redeemed | 480,370 | |
| Accrued management fee | 268,249 | |
| Payable for daily variation margin on futures contracts | 2,393 | |
| Collateral on securities loaned | 8,319,250 | |
| Total liabilities | 12,347,753 | |
| Net Assets | $834,635,168 | |
| Net Assets consist of: | ||
| Paid in capital | $658,239,811 | |
| Total distributable earnings (loss) | 176,395,357 | |
| Net Assets, for 54,890,908 shares outstanding | $834,635,168 | |
| Net Asset Value, offering price and redemption price per share ($834,635,168 ÷ 54,890,908 shares) | $15.21 |
See accompanying notes which are an integral part of the financial statements.
Statement of Operations
| Year ended August 31, 2019 | ||
| Investment Income | ||
| Dividends | $16,991,272 | |
| Interest | 23,047 | |
| Income from Fidelity Central Funds (including $41,448 from security lending) | 348,769 | |
| Total income | 17,363,088 | |
| Expenses | ||
| Management fee | $3,073,974 | |
| Independent trustees' fees and expenses | 4,516 | |
| Commitment fees | 2,056 | |
| Total expenses before reductions | 3,080,546 | |
| Expense reductions | (546) | |
| Total expenses after reductions | 3,080,000 | |
| Net investment income (loss) | 14,283,088 | |
| Realized and Unrealized Gain (Loss) | ||
| Net realized gain (loss) on: | ||
| Investment securities: | ||
| Unaffiliated issuers | 2,145,716 | |
| Fidelity Central Funds | (56) | |
| Futures contracts | (846,003) | |
| Total net realized gain (loss) | 1,299,657 | |
| Change in net unrealized appreciation (depreciation) on: | ||
| Investment securities: | ||
| Unaffiliated issuers | (6,800,802) | |
| Fidelity Central Funds | 226 | |
| Futures contracts | (441,633) | |
| Total change in net unrealized appreciation (depreciation) | (7,242,209) | |
| Net gain (loss) | (5,942,552) | |
| Net increase (decrease) in net assets resulting from operations | $8,340,536 |
See accompanying notes which are an integral part of the financial statements.
Statement of Changes in Net Assets
| Year ended August 31, 2019 | Year ended August 31, 2018 | |
| Increase (Decrease) in Net Assets | ||
| Operations | ||
| Net investment income (loss) | $14,283,088 | $11,366,481 |
| Net realized gain (loss) | 1,299,657 | 50,090,622 |
| Change in net unrealized appreciation (depreciation) | (7,242,209) | 64,091,459 |
| Net increase (decrease) in net assets resulting from operations | 8,340,536 | 125,548,562 |
| Distributions to shareholders | (50,637,921) | – |
| Distributions to shareholders from net investment income | – | (7,652,635) |
| Distributions to shareholders from net realized gain | – | (13,164,116) |
| Total distributions | (50,637,921) | (20,816,751) |
| Share transactions | ||
| Proceeds from sales of shares | 284,994,927 | 234,510,657 |
| Reinvestment of distributions | 47,753,158 | 19,696,589 |
| Cost of shares redeemed | (214,551,667) | (134,439,243) |
| Net increase (decrease) in net assets resulting from share transactions | 118,196,418 | 119,768,003 |
| Total increase (decrease) in net assets | 75,899,033 | 224,499,814 |
| Net Assets | ||
| Beginning of period | 758,736,135 | 534,236,321 |
| End of period | $834,635,168 | $758,736,135 |
| Other Information | ||
| Undistributed net investment income end of period | $7,483,302 | |
| Shares | ||
| Sold | 19,184,670 | 15,527,264 |
| Issued in reinvestment of distributions | 3,462,883 | 1,357,449 |
| Redeemed | (14,537,369) | (8,984,401) |
| Net increase (decrease) | 8,110,184 | 7,900,312 |
See accompanying notes which are an integral part of the financial statements.
Financial Highlights
Fidelity Large Cap Core Enhanced Index Fund
| Years ended August 31, | 2019 | 2018 | 2017 A | 2017 B | 2016 C | 2015 B |
| Selected Per–Share Data | ||||||
| Net asset value, beginning of period | $16.22 | $13.74 | $13.21 | $10.90 | $12.29 | $11.30 |
| Income from Investment Operations | ||||||
| Net investment income (loss)D | .27 | .27 | .12 | .22 | .22 | .20 |
| Net realized and unrealized gain (loss) | (.27) | 2.74 | .45 | 2.29 | (1.17) | 1.55 |
| Total from investment operations | – | 3.01 | .57 | 2.51 | (.95) | 1.75 |
| Distributions from net investment income | (.24) | (.19) | (.04) | (.20) | (.19) | (.16) |
| Distributions from net realized gain | (.78) | (.33) | – | – | (.25) | (.60) |
| Total distributions | (1.01)E | (.53)F | (.04) | (.20) | (.44) | (.76) |
| Net asset value, end of period | $15.21 | $16.22 | $13.74 | $13.21 | $10.90 | $12.29 |
| Total ReturnG,H | .65% | 22.32% | 4.29% | 23.09% | (7.94)% | 16.04% |
| Ratios to Average Net AssetsI,J | ||||||
| Expenses before reductions | .39% | .39% | .40%K | .45% | .45% | .45% |
| Expenses net of fee waivers, if any | .39% | .39% | .40%K | .45% | .45% | .45% |
| Expenses net of all reductions | .39% | .39% | .40%K | .45% | .45% | .45% |
| Net investment income (loss) | 1.81% | 1.78% | 1.85%K | 1.82% | 1.86% | 1.69% |
| Supplemental Data | ||||||
| Net assets, end of period (000 omitted) | $834,635 | $758,736 | $534,236 | $524,986 | $411,699 | $381,883 |
| Portfolio turnover rateL | 77% | 92% | 88%K | 82% | 84% | 101% |
A For the six month period ended August 31. The Fund changed its fiscal year end from February 28 to August 31, effective August 31, 2017.
B For the year ended February 28.
C For the year ended February 29.
D Calculated based on average shares outstanding during the period.
E Total distributions of $1.01 per share is comprised of distributions from net investment income of $.237 and distributions from net realized gain of $.775 per share.
F Total distributions of $.53 per share is comprised of distributions from net investment income of $.193 and distributions from net realized gain of $.332 per share.
G Total returns for periods of less than one year are not annualized.
H Total returns would have been lower if certain expenses had not been reduced during the applicable periods shown.
I Fees and expenses of any underlying Fidelity Central Funds are not included in the Fund's expense ratio. The Fund indirectly bears its proportionate share of the expenses of any underlying Fidelity Central Funds.
J Expense ratios reflect operating expenses of the Fund. Expenses before reductions do not reflect amounts reimbursed by the investment adviser or reductions from expense offset arrangements and do not represent the amount paid by the Fund during periods when reimbursements or reductions occur. Expenses net of fee waivers reflect expenses after reimbursement by the investment adviser but prior to reductions from expense offset arrangements. Expenses net of all reductions represent the net expenses paid by the Fund.
K Annualized
L Amount does not include the portfolio activity of any underlying Fidelity Central Funds.
See accompanying notes which are an integral part of the financial statements.
Fidelity® Mid Cap Enhanced Index Fund
Performance: The Bottom Line
Average annual total return reflects the change in the value of an investment, assuming reinvestment of distributions from dividend income and capital gains (the profits earned upon the sale of securities that have grown in value, if any) and assuming a constant rate of performance each year. The hypothetical investment and the average annual total returns do not reflect the deduction of taxes that a shareholder would pay on fund distributions or the redemption of fund shares. During periods of reimbursement by Fidelity, a fund’s total return will be greater than it would be had the reimbursement not occurred. How a fund did yesterday is no guarantee of how it will do tomorrow.
Average Annual Total Returns
| For the periods ended August 31, 2019 | Past 1 year | Past 5 years | Past 10 years |
| Fidelity® Mid Cap Enhanced Index Fund | (2.19)% | 6.84% | 12.75% |
$10,000 Over 10 Years
Let's say hypothetically that $10,000 was invested in Fidelity® Mid Cap Enhanced Index Fund on August 31, 2009.
The chart shows how the value of your investment would have changed, and also shows how the Russell Midcap® Index performed over the same period.

| Period Ending Values | ||
| $33,191 | Fidelity® Mid Cap Enhanced Index Fund | |
| $35,402 | Russell Midcap® Index | |
Fidelity® Mid Cap Enhanced Index Fund
Management's Discussion of Fund Performance
Market Recap: The S&P 500® index gained 2.92% for the 12 months ending August 31, 2019, a choppy period in which stocks seesawed due to trade tension, interest rates, economic data and an inverted yield curve, among other factors. Equities began the new year on a high note after enduring a historically volatile final quarter of 2018. Upbeat company earnings and outlooks, along with signs the Federal Reserve may pause on rates, boosted stocks to an all-time high on April 30. In May, however, the index sunk amid the Fed’s decision to hold interest rates steady and signal it had little appetite to adjust them any time soon, as well as retaliatory tariffs imposed on the U.S. by China. The bull market roared back in June and recorded a series of highs in July, when the Fed cut interest rates for the first time since 2008. Volatility intensified in August, however, as the U.S. Treasury yield curve inverted for the first time since 2007, which some investors viewed as a sign the world's biggest economy could be heading for recession. For the full 12 months, three defensive sectors led the way: utilities (+21%), real estate (+20%) and consumer staples (+16%). The information technology sector rose about 8%, boosted by software & services (+18%), the market’s largest industry segment. Communication services stocks gained roughly 5%. In contrast, energy (-20%) was by far the weakest sector, followed by financials (-3%) and materials (-3%). Other notable laggards included health care (-1%), industrials (+1%) and consumer discretionary (+2%).Comments from Maximilian Kaufmann, Senior Portfolio Manager of the Geode Capital Management, LLC, investment management team: For the fiscal year, the fund returned -2.19%, trailing the 0.54% gain of the benchmark Russell MidCap® Index. Security selection in the materials and health care sectors detracted most from performance, as did broad exposure to utilities stocks during the reporting period. Conversely, the fund benefited from picks in financials and an underweighting in the poor-performing energy group. Individually, the portfolio's biggest detractor was IT service provider DXC Technology (-63%). More than half of this stock's decline came on a single day in August after the company issued disappointing full-year earnings and revenue guidance. Another key detractor was pharmaceutical company Mylan (-50%), which reported worse-than-anticipated financial results this period. Further hampering our relative result was Devon Energy, which returned about -48% for the fund. With energy pricing weak for much of the period, Devon and other energy exploration and production companies struggled. In contrast, our top relative contributor was California utility firm Pacific Gas & Electric (PG&E), a benchmark component that we almost entirely avoided the past 12 months. The portfolio's stake in the company returned about -5% during our brief holding period, well below the stock's full-period return of roughly -77%, reflecting the company's serious financial challenges in the wake of last summer's California wildfires. Lastly, another strong relative performer was Australian software company Atlassian, whose shares rose about 51% within the fund thanks to the company's strong financial results.The views expressed above reflect those of the portfolio manager(s) only through the end of the period as stated on the cover of this report and do not necessarily represent the views of Fidelity or any other person in the Fidelity organization. Any such views are subject to change at any time based upon market or other conditions and Fidelity disclaims any responsibility to update such views. These views may not be relied on as investment advice and, because investment decisions for a Fidelity fund are based on numerous factors, may not be relied on as an indication of trading intent on behalf of any Fidelity fund.
Fidelity® Mid Cap Enhanced Index Fund
Investment Summary (Unaudited)
Top Ten Stocks as of August 31, 2019
| % of fund's net assets | |
| Harris Corp. | 1.1 |
| Lam Research Corp. | 1.0 |
| Newmont Goldcorp Corp. | 1.0 |
| Tyson Foods, Inc. Class A | 0.9 |
| Advanced Micro Devices, Inc. | 0.9 |
| Xilinx, Inc. | 0.9 |
| AutoZone, Inc. | 0.8 |
| Synopsys, Inc. | 0.8 |
| The Hershey Co. | 0.8 |
| Discover Financial Services | 0.8 |
| 9.0 |
Top Market Sectors as of August 31, 2019
| % of fund's net assets | |
| Information Technology | 19.1 |
| Financials | 14.5 |
| Industrials | 12.5 |
| Consumer Discretionary | 12.3 |
| Health Care | 11.9 |
| Real Estate | 8.1 |
| Utilities | 5.8 |
| Consumer Staples | 5.3 |
| Materials | 4.6 |
| Communication Services | 3.1 |
Asset Allocation (% of fund's net assets)
| As of August 31, 2019 * | ||
| Stocks and Equity Futures | 99.9% | |
| Short-Term Investments and Net Other Assets (Liabilities) | 0.1% | |

* Foreign investments - 5.6%
Fidelity® Mid Cap Enhanced Index Fund
Schedule of Investments August 31, 2019
Showing Percentage of Net Assets
| Common Stocks - 99.1% | |||
| Shares | Value | ||
| COMMUNICATION SERVICES - 3.1% | |||
| Diversified Telecommunication Services - 0.7% | |||
| CenturyLink, Inc. (a) | 762,348 | $8,675,520 | |
| Zayo Group Holdings, Inc. (b) | 1,270 | 42,748 | |
| 8,718,268 | |||
| Entertainment - 0.5% | |||
| Electronic Arts, Inc. (b) | 71,886 | 6,734,280 | |
| Viacom, Inc. Class B (non-vtg.) | 1,717 | 42,891 | |
| 6,777,171 | |||
| Interactive Media & Services - 0.3% | |||
| IAC/InterActiveCorp (b) | 5,232 | 1,332,276 | |
| TripAdvisor, Inc. (b) | 79,091 | 3,004,667 | |
| 4,336,943 | |||
| Media - 1.6% | |||
| CBS Corp. Class B | 25,852 | 1,087,335 | |
| DISH Network Corp. Class A (b) | 222,596 | 7,470,322 | |
| Liberty Media Corp.: | |||
| Liberty SiriusXM Series A (b) | 28,379 | 1,149,066 | |
| Liberty SiriusXM Series C (b) | 26,880 | 1,096,973 | |
| News Corp. Class B | 12,401 | 175,598 | |
| Omnicom Group, Inc. | 109,877 | 8,357,245 | |
| Sinclair Broadcast Group, Inc. Class A | 15,624 | 696,362 | |
| 20,032,901 | |||
| TOTAL COMMUNICATION SERVICES | 39,865,283 | ||
| CONSUMER DISCRETIONARY - 12.3% | |||
| Auto Components - 0.8% | |||
| BorgWarner, Inc. | 175,741 | 5,734,429 | |
| Gentex Corp. | 48,920 | 1,301,272 | |
| Lear Corp. | 25,447 | 2,856,680 | |
| 9,892,381 | |||
| Automobiles - 0.2% | |||
| Ford Motor Co. | 247,302 | 2,267,759 | |
| General Motors Co. | 1,056 | 39,167 | |
| 2,306,926 | |||
| Diversified Consumer Services - 1.1% | |||
| Bright Horizons Family Solutions, Inc. (b) | 19,042 | 3,142,882 | |
| Frontdoor, Inc. (b) | 144,616 | 7,424,585 | |
| Grand Canyon Education, Inc. (b) | 3,213 | 403,553 | |
| Service Corp. International | 58,478 | 2,707,531 | |
| 13,678,551 | |||
| Hotels, Restaurants & Leisure - 3.2% | |||
| ARAMARK Holdings Corp. | 43,777 | 1,788,728 | |
| Chipotle Mexican Grill, Inc. (b) | 11,575 | 9,704,712 | |
| Darden Restaurants, Inc. | 24,163 | 2,923,240 | |
| Extended Stay America, Inc. unit | 478,484 | 6,722,700 | |
| International Game Technology PLC | 85,223 | 1,020,972 | |
| MGM Mirage, Inc. | 165,200 | 4,635,512 | |
| Royal Caribbean Cruises Ltd. | 33,177 | 3,459,698 | |
| Wyndham Destinations, Inc. | 14,479 | 641,999 | |
| Yum China Holdings, Inc. | 208,484 | 9,471,428 | |
| 40,368,989 | |||
| Household Durables - 2.6% | |||
| D.R. Horton, Inc. | 99,566 | 4,925,530 | |
| Garmin Ltd. | 85,013 | 6,934,510 | |
| NVR, Inc. (b) | 2,415 | 8,691,585 | |
| PulteGroup, Inc. | 152,810 | 5,164,978 | |
| Roku, Inc. Class A (b) | 22,473 | 3,401,513 | |
| Toll Brothers, Inc. | 112,059 | 4,055,415 | |
| 33,173,531 | |||
| Internet & Direct Marketing Retail - 0.4% | |||
| eBay, Inc. | 133,164 | 5,365,178 | |
| Multiline Retail - 0.6% | |||
| Dollar General Corp. | 3,867 | 603,600 | |
| Kohl's Corp. | 22,228 | 1,050,495 | |
| Target Corp. | 52,315 | 5,599,798 | |
| 7,253,893 | |||
| Specialty Retail - 2.5% | |||
| AutoNation, Inc. (b) | 45,286 | 2,149,274 | |
| AutoZone, Inc. (b) | 9,648 | 10,629,105 | |
| Best Buy Co., Inc. | 107,033 | 6,812,650 | |
| IAA Spinco, Inc. (b) | 152,230 | 7,436,436 | |
| O'Reilly Automotive, Inc. (b) | 11,526 | 4,423,218 | |
| Ulta Beauty, Inc. (b) | 730 | 173,543 | |
| 31,624,226 | |||
| Textiles, Apparel & Luxury Goods - 0.9% | |||
| lululemon athletica, Inc. (b) | 30,759 | 5,680,265 | |
| Ralph Lauren Corp. | 43,772 | 3,866,818 | |
| Tapestry, Inc. | 98,227 | 2,028,388 | |
| 11,575,471 | |||
| TOTAL CONSUMER DISCRETIONARY | 155,239,146 | ||
| CONSUMER STAPLES - 5.3% | |||
| Beverages - 0.6% | |||
| Molson Coors Brewing Co. Class B | 143,544 | 7,372,420 | |
| Food & Staples Retailing - 1.2% | |||
| Kroger Co. | 305,240 | 7,228,083 | |
| U.S. Foods Holding Corp. (b) | 197,907 | 8,005,338 | |
| 15,233,421 | |||
| Food Products - 2.7% | |||
| Archer Daniels Midland Co. | 201,282 | 7,658,780 | |
| Pilgrim's Pride Corp. (b) | 91,314 | 2,845,344 | |
| The Hershey Co. | 66,689 | 10,568,873 | |
| The Kraft Heinz Co. | 44,486 | 1,135,283 | |
| Tyson Foods, Inc. Class A | 122,701 | 11,416,101 | |
| 33,624,381 | |||
| Household Products - 0.8% | |||
| Church & Dwight Co., Inc. | 2,312 | 184,451 | |
| Clorox Co. | 20,763 | 3,283,876 | |
| Kimberly-Clark Corp. | 46,188 | 6,517,589 | |
| Spectrum Brands Holdings, Inc. | 10,655 | 595,295 | |
| 10,581,211 | |||
| TOTAL CONSUMER STAPLES | 66,811,433 | ||
| ENERGY - 1.9% | |||
| Energy Equipment & Services - 0.0% | |||
| Halliburton Co. | 12,460 | 234,746 | |
| Oil, Gas & Consumable Fuels - 1.9% | |||
| Cabot Oil & Gas Corp. | 246,286 | 4,216,416 | |
| ConocoPhillips Co. | 27,075 | 1,412,774 | |
| Devon Energy Corp. | 233,080 | 5,125,429 | |
| Kinder Morgan, Inc. | 308,065 | 6,244,478 | |
| Marathon Oil Corp. | 463,780 | 5,491,155 | |
| The Williams Companies, Inc. | 54,175 | 1,278,530 | |
| 23,768,782 | |||
| TOTAL ENERGY | 24,003,528 | ||
| FINANCIALS - 14.5% | |||
| Banks - 1.9% | |||
| Comerica, Inc. | 55,408 | 3,415,903 | |
| Fifth Third Bancorp | 19,067 | 504,322 | |
| KeyCorp | 48,171 | 799,639 | |
| M&T Bank Corp. | 55,229 | 8,075,032 | |
| Regions Financial Corp. | 530,198 | 7,751,495 | |
| SunTrust Banks, Inc. | 52,750 | 3,244,653 | |
| 23,791,044 | |||
| Capital Markets - 3.8% | |||
| Ameriprise Financial, Inc. | 23,676 | 3,053,730 | |
| E*TRADE Financial Corp. | 51,632 | 2,155,120 | |
| FactSet Research Systems, Inc. | 27,167 | 7,391,869 | |
| Invesco Ltd. | 195,435 | 3,068,330 | |
| LPL Financial | 87,004 | 6,520,950 | |
| MarketAxess Holdings, Inc. | 2,922 | 1,161,846 | |
| Morningstar, Inc. | 46,080 | 7,445,606 | |
| MSCI, Inc. | 29,850 | 7,003,706 | |
| Raymond James Financial, Inc. | 9,621 | 755,345 | |
| SEI Investments Co. | 104,949 | 6,035,617 | |
| State Street Corp. | 33,465 | 1,717,089 | |
| T. Rowe Price Group, Inc. | 10,812 | 1,196,023 | |
| 47,505,231 | |||
| Consumer Finance - 2.4% | |||
| Ally Financial, Inc. | 270,310 | 8,474,219 | |
| Discover Financial Services | 132,000 | 10,556,040 | |
| OneMain Holdings, Inc. | 39,019 | 1,398,831 | |
| Synchrony Financial | 300,304 | 9,624,743 | |
| 30,053,833 | |||
| Diversified Financial Services - 0.5% | |||
| Jefferies Financial Group, Inc. | 347,516 | 6,477,698 | |
| Insurance - 5.5% | |||
| Allstate Corp. | 375 | 38,396 | |
| American International Group, Inc. warrants 1/19/21 (b) | 574 | 6,389 | |
| Arch Capital Group Ltd. (b) | 186,153 | 7,353,044 | |
| Assurant, Inc. | 12,473 | 1,534,179 | |
| CNA Financial Corp. | 49,254 | 2,321,341 | |
| First American Financial Corp. | 128,953 | 7,537,303 | |
| FNF Group | 197,679 | 8,686,015 | |
| Hanover Insurance Group, Inc. | 18,437 | 2,454,887 | |
| Hartford Financial Services Group, Inc. | 171,917 | 10,019,323 | |
| Lincoln National Corp. | 59,168 | 3,128,804 | |
| Loews Corp. | 151,217 | 7,269,001 | |
| Old Republic International Corp. | 326,780 | 7,633,581 | |
| Primerica, Inc. | 12,804 | 1,525,853 | |
| Progressive Corp. | 21,300 | 1,614,540 | |
| Prudential Financial, Inc. | 33,382 | 2,673,564 | |
| Reinsurance Group of America, Inc. | 20,748 | 3,194,570 | |
| Selective Insurance Group, Inc. | 3,184 | 253,542 | |
| Unum Group | 116,281 | 2,954,700 | |
| 70,199,032 | |||
| Mortgage Real Estate Investment Trusts - 0.4% | |||
| MFA Financial, Inc. | 704,382 | 5,050,419 | |
| TOTAL FINANCIALS | 183,077,257 | ||
| HEALTH CARE - 11.9% | |||
| Biotechnology - 1.5% | |||
| Alnylam Pharmaceuticals, Inc. (b) | 5,795 | 467,599 | |
| Biogen, Inc. (b) | 27,976 | 6,147,726 | |
| bluebird bio, Inc. (a)(b) | 2,999 | 309,827 | |
| Incyte Corp. (b) | 60,398 | 4,941,764 | |
| Regeneron Pharmaceuticals, Inc. (b) | 21,987 | 6,377,329 | |
| Sage Therapeutics, Inc. (b) | 1,588 | 272,612 | |
| United Therapeutics Corp. (b) | 9,308 | 768,468 | |
| 19,285,325 | |||
| Health Care Equipment & Supplies - 3.9% | |||
| Baxter International, Inc. | 74,262 | 6,531,343 | |
| Boston Scientific Corp. (b) | 23,539 | 1,005,821 | |
| Dentsply Sirona, Inc. | 10,847 | 565,671 | |
| DexCom, Inc. (b) | 31,094 | 5,336,041 | |
| Edwards Lifesciences Corp. (b) | 7,916 | 1,756,085 | |
| Hill-Rom Holdings, Inc. | 72,561 | 7,813,368 | |
| Hologic, Inc. (b) | 178,812 | 8,827,948 | |
| IDEXX Laboratories, Inc. (b) | 13,304 | 3,854,701 | |
| Masimo Corp. (b) | 51,119 | 7,833,987 | |
| Varian Medical Systems, Inc. (b) | 10,903 | 1,154,955 | |
| Zimmer Biomet Holdings, Inc. | 33,529 | 4,667,237 | |
| 49,347,157 | |||
| Health Care Providers & Services - 3.2% | |||
| AmerisourceBergen Corp. | 87,997 | 7,239,513 | |
| Cardinal Health, Inc. | 124,905 | 5,387,153 | |
| Centene Corp. (b) | 123,973 | 5,779,621 | |
| Chemed Corp. | 2,982 | 1,280,560 | |
| DaVita HealthCare Partners, Inc. (b) | 24,259 | 1,367,480 | |
| Humana, Inc. | 5,059 | 1,432,759 | |
| McKesson Corp. | 21,363 | 2,953,862 | |
| Molina Healthcare, Inc. (b) | 39,712 | 5,173,679 | |
| Quest Diagnostics, Inc. | 81,744 | 8,368,133 | |
| Universal Health Services, Inc. Class B | 7,172 | 1,036,928 | |
| Wellcare Health Plans, Inc. (b) | 3,227 | 873,678 | |
| 40,893,366 | |||
| Health Care Technology - 1.4% | |||
| Cerner Corp. | 126,869 | 8,742,543 | |
| Veeva Systems, Inc. Class A (b) | 59,003 | 9,462,901 | |
| 18,205,444 | |||
| Life Sciences Tools & Services - 1.1% | |||
| Agilent Technologies, Inc. | 145,489 | 10,345,723 | |
| Bruker Corp. | 55,677 | 2,403,576 | |
| IQVIA Holdings, Inc. (b) | 4,165 | 646,200 | |
| 13,395,499 | |||
| Pharmaceuticals - 0.8% | |||
| Corteva, Inc. | 35,533 | 1,041,828 | |
| Jazz Pharmaceuticals PLC (b) | 16,649 | 2,133,569 | |
| Mylan NV (b) | 345,342 | 6,723,809 | |
| 9,899,206 | |||
| TOTAL HEALTH CARE | 151,025,997 | ||
| INDUSTRIALS - 12.5% | |||
| Aerospace & Defense - 2.6% | |||
| Aerojet Rocketdyne Holdings, Inc. (b) | 14,971 | 781,935 | |
| Arconic, Inc. | 319,949 | 8,267,482 | |
| Curtiss-Wright Corp. | 9,706 | 1,190,344 | |
| Harris Corp. | 67,841 | 14,342,265 | |
| HEICO Corp. | 33,287 | 4,815,630 | |
| HEICO Corp. Class A | 11,000 | 1,213,960 | |
| Parsons Corp. | 1,562 | 53,139 | |
| Spirit AeroSystems Holdings, Inc. Class A | 4,079 | 328,767 | |
| Textron, Inc. | 45,135 | 2,031,075 | |
| 33,024,597 | |||
| Airlines - 0.2% | |||
| JetBlue Airways Corp. (b) | 172,397 | 2,985,916 | |
| Commercial Services & Supplies - 1.5% | |||
| Cintas Corp. | 3,784 | 998,219 | |
| KAR Auction Services, Inc. | 275,990 | 7,330,294 | |
| Republic Services, Inc. | 93,253 | 8,322,830 | |
| UniFirst Corp. | 1,639 | 321,096 | |
| Waste Management, Inc. | 15,580 | 1,859,473 | |
| 18,831,912 | |||
| Construction & Engineering - 0.3% | |||
| EMCOR Group, Inc. | 30,980 | 2,708,891 | |
| Valmont Industries, Inc. | 3,824 | 518,152 | |
| 3,227,043 | |||
| Electrical Equipment - 0.5% | |||
| Acuity Brands, Inc. | 21,406 | 2,684,526 | |
| Regal Beloit Corp. | 44,445 | 3,151,151 | |
| 5,835,677 | |||
| Industrial Conglomerates - 0.3% | |||
| Roper Technologies, Inc. | 9,634 | 3,533,366 | |
| Machinery - 4.4% | |||
| AGCO Corp. | 103,939 | 7,184,264 | |
| Allison Transmission Holdings, Inc. | 164,494 | 7,308,468 | |
| Crane Co. | 26,136 | 1,992,609 | |
| Cummins, Inc. | 63,384 | 9,461,330 | |
| Ingersoll-Rand PLC | 60,446 | 7,319,406 | |
| Oshkosh Corp. | 87,253 | 6,131,268 | |
| PACCAR, Inc. | 149,845 | 9,823,838 | |
| Stanley Black & Decker, Inc. | 41,679 | 5,537,472 | |
| Woodward, Inc. | 12,996 | 1,401,619 | |
| 56,160,274 | |||
| Professional Services - 2.0% | |||
| CoStar Group, Inc. (b) | 1,867 | 1,147,962 | |
| IHS Markit Ltd. (b) | 154,171 | 10,115,159 | |
| Manpower, Inc. | 75,788 | 6,194,911 | |
| Nielsen Holdings PLC | 88,921 | 1,846,000 | |
| Robert Half International, Inc. | 106,645 | 5,702,308 | |
| 25,006,340 | |||
| Road & Rail - 0.6% | |||
| CSX Corp. | 3,178 | 212,990 | |
| Kansas City Southern | 63,125 | 7,941,125 | |
| Norfolk Southern Corp. | 688 | 119,746 | |
| 8,273,861 | |||
| Trading Companies & Distributors - 0.1% | |||
| W.W. Grainger, Inc. | 5,032 | 1,377,007 | |
| TOTAL INDUSTRIALS | 158,255,993 | ||
| INFORMATION TECHNOLOGY - 19.1% | |||
| Communications Equipment - 1.3% | |||
| Ciena Corp. (b) | 169,892 | 6,953,680 | |
| EchoStar Holding Corp. Class A (b) | 19,619 | 828,903 | |
| F5 Networks, Inc. (b) | 10,822 | 1,393,116 | |
| Juniper Networks, Inc. | 296,633 | 6,870,020 | |
| 16,045,719 | |||
| Electronic Equipment & Components - 2.2% | |||
| Avnet, Inc. | 9,304 | 389,745 | |
| Dolby Laboratories, Inc. Class A | 32,766 | 2,017,075 | |
| Jabil, Inc. | 10,678 | 307,633 | |
| Keysight Technologies, Inc. (b) | 97,198 | 9,414,598 | |
| National Instruments Corp. | 171,472 | 7,201,824 | |
| Trimble, Inc. (b) | 43,161 | 1,619,401 | |
| Zebra Technologies Corp. Class A (b) | 36,772 | 7,539,363 | |
| 28,489,639 | |||
| IT Services - 5.0% | |||
| Alliance Data Systems Corp. | 21,744 | 2,673,425 | |
| Amdocs Ltd. | 127,431 | 8,249,883 | |
| Booz Allen Hamilton Holding Corp. Class A | 61,630 | 4,653,681 | |
| CACI International, Inc. Class A (b) | 12,581 | 2,796,630 | |
| CoreLogic, Inc. (b) | 15,409 | 745,796 | |
| DXC Technology Co. | 145,075 | 4,819,392 | |
| Euronet Worldwide, Inc. (b) | 1,682 | 257,581 | |
| Fiserv, Inc. (b) | 78,215 | 8,364,312 | |
| Genpact Ltd. | 130,030 | 5,326,029 | |
| GoDaddy, Inc. (b) | 23,431 | 1,484,120 | |
| Leidos Holdings, Inc. | 34,964 | 3,054,455 | |
| Okta, Inc. (b) | 23,873 | 3,019,935 | |
| Paychex, Inc. | 26,414 | 2,158,024 | |
| Perspecta, Inc. | 11,526 | 299,100 | |
| Sabre Corp. | 313,067 | 7,400,904 | |
| Total System Services, Inc. | 19,165 | 2,572,326 | |
| Twilio, Inc. Class A (a)(b) | 44,490 | 5,804,610 | |
| 63,680,203 | |||
| Semiconductors & Semiconductor Equipment - 4.6% | |||
| Advanced Micro Devices, Inc. (b) | 362,039 | 11,386,127 | |
| Cypress Semiconductor Corp. | 3,748 | 86,241 | |
| Enphase Energy, Inc. (b) | 15,471 | 459,025 | |
| Lam Research Corp. | 57,751 | 12,157,163 | |
| Marvell Technology Group Ltd. | 58,699 | 1,407,015 | |
| Maxim Integrated Products, Inc. | 110,713 | 6,038,287 | |
| Micron Technology, Inc. (b) | 150,849 | 6,828,934 | |
| ON Semiconductor Corp. (b) | 94,588 | 1,683,666 | |
| Qorvo, Inc. (b) | 19,570 | 1,397,885 | |
| Teradyne, Inc. | 111,761 | 5,919,980 | |
| Xilinx, Inc. | 102,726 | 10,689,668 | |
| 58,053,991 | |||
| Software - 5.5% | |||
| Atlassian Corp. PLC (b) | 56,044 | 7,538,478 | |
| Autodesk, Inc. (b) | 2,555 | 364,905 | |
| Avalara, Inc. (b) | 80,407 | 6,781,526 | |
| Cadence Design Systems, Inc. (b) | 139,499 | 9,552,892 | |
| Citrix Systems, Inc. | 87,434 | 8,129,613 | |
| Dropbox, Inc. Class A (b) | 386,090 | 6,911,011 | |
| Fair Isaac Corp. (b) | 1,516 | 534,724 | |
| Fortinet, Inc. (b) | 12,888 | 1,020,472 | |
| LogMeIn, Inc. | 53,384 | 3,568,187 | |
| Manhattan Associates, Inc. (b) | 11,482 | 948,758 | |
| Nuance Communications, Inc. (b) | 440,135 | 7,398,669 | |
| ServiceNow, Inc. (b) | 3,787 | 991,588 | |
| Smartsheet, Inc. (b) | 28,801 | 1,399,729 | |
| SS&C Technologies Holdings, Inc. | 58,668 | 2,734,515 | |
| Symantec Corp. | 37,124 | 863,133 | |
| Synopsys, Inc. (b) | 74,620 | 10,581,862 | |
| Zscaler, Inc. (b) | 1,765 | 121,326 | |
| 69,441,388 | |||
| Technology Hardware, Storage & Peripherals - 0.5% | |||
| Xerox Holdings Corp. | 212,273 | 6,153,794 | |
| TOTAL INFORMATION TECHNOLOGY | 241,864,734 | ||
| MATERIALS - 4.6% | |||
| Chemicals - 1.7% | |||
| CF Industries Holdings, Inc. | 168,306 | 8,110,666 | |
| Eastman Chemical Co. | 86,345 | 5,644,373 | |
| Huntsman Corp. | 357,926 | 7,129,886 | |
| 20,884,925 | |||
| Construction Materials - 0.0% | |||
| nVent Electric PLC | 21,843 | 442,539 | |
| Containers & Packaging - 0.3% | |||
| Graphic Packaging Holding Co. | 268,657 | 3,710,153 | |
| International Paper Co. | 4,446 | 173,839 | |
| 3,883,992 | |||
| Metals & Mining - 2.6% | |||
| Newmont Goldcorp Corp. | 303,119 | 12,091,417 | |
| Nucor Corp. | 145,003 | 7,102,247 | |
| Reliance Steel & Aluminum Co. | 64,832 | 6,303,615 | |
| Steel Dynamics, Inc. | 253,820 | 6,853,140 | |
| 32,350,419 | |||
| TOTAL MATERIALS | 57,561,875 | ||
| REAL ESTATE - 8.1% | |||
| Equity Real Estate Investment Trusts (REITs) - 7.8% | |||
| American Homes 4 Rent Class A | 53,723 | 1,374,234 | |
| Apartment Investment & Management Co. Class A | 51,056 | 2,603,856 | |
| Apple Hospitality (REIT), Inc. | 375,441 | 5,980,775 | |
| AvalonBay Communities, Inc. | 21,576 | 4,586,195 | |
| Brixmor Property Group, Inc. | 390,524 | 7,197,357 | |
| Camden Property Trust (SBI) | 75,724 | 8,197,123 | |
| Columbia Property Trust, Inc. | 14,184 | 303,396 | |
| Crown Castle International Corp. | 10,428 | 1,513,833 | |
| Douglas Emmett, Inc. | 33,007 | 1,392,895 | |
| Equity Commonwealth | 125,265 | 4,216,420 | |
| Equity Lifestyle Properties, Inc. | 7,584 | 1,021,716 | |
| Equity Residential (SBI) | 7,661 | 649,346 | |
| Essex Property Trust, Inc. | 5,011 | 1,609,834 | |
| Gaming & Leisure Properties | 158,660 | 6,206,779 | |
| Healthcare Trust of America, Inc. | 33,566 | 951,932 | |
| Hospitality Properties Trust (SBI) | 244,506 | 5,902,375 | |
| Host Hotels & Resorts, Inc. | 453,647 | 7,276,498 | |
| Liberty Property Trust (SBI) | 95,672 | 4,986,425 | |
| Life Storage, Inc. | 14,858 | 1,574,354 | |
| Mid-America Apartment Communities, Inc. | 1,021 | 129,340 | |
| Outfront Media, Inc. | 76,765 | 2,109,502 | |
| Park Hotels & Resorts, Inc. | 222,580 | 5,241,759 | |
| Prologis, Inc. | 5,958 | 498,208 | |
| Realty Income Corp. | 56,660 | 4,182,075 | |
| Retail Properties America, Inc. | 506,735 | 5,756,510 | |
| SBA Communications Corp. Class A | 14,010 | 3,676,644 | |
| Simon Property Group, Inc. | 667 | 99,343 | |
| Ventas, Inc. | 51,958 | 3,813,198 | |
| VEREIT, Inc. | 4,947 | 48,233 | |
| Welltower, Inc. | 30,549 | 2,735,968 | |
| Weyerhaeuser Co. | 116,992 | 3,078,060 | |
| 98,914,183 | |||
| Real Estate Management & Development - 0.3% | |||
| CBRE Group, Inc. (b) | 59,901 | 3,131,025 | |
| TOTAL REAL ESTATE | 102,045,208 | ||
| UTILITIES - 5.8% | |||
| Electric Utilities - 3.1% | |||
| Entergy Corp. | 16,074 | 1,813,790 | |
| Exelon Corp. | 657 | 31,050 | |
| IDACORP, Inc. | 14,731 | 1,617,611 | |
| OGE Energy Corp. | 162,437 | 6,963,674 | |
| Portland General Electric Co. | 48,164 | 2,740,050 | |
| PPL Corp. | 306,378 | 9,053,470 | |
| Vistra Energy Corp. | 324,974 | 8,108,101 | |
| Xcel Energy, Inc. | 136,735 | 8,781,122 | |
| 39,108,868 | |||
| Gas Utilities - 0.7% | |||
| Southwest Gas Holdings, Inc. | 11,892 | 1,084,907 | |
| UGI Corp. | 162,698 | 7,918,512 | |
| 9,003,419 | |||
| Independent Power and Renewable Electricity Producers - 0.2% | |||
| The AES Corp. | 157,063 | 2,407,776 | |
| Multi-Utilities - 1.7% | |||
| Ameren Corp. | 104,808 | 8,085,937 | |
| DTE Energy Co. | 51,725 | 6,706,664 | |
| MDU Resources Group, Inc. | 244,295 | 6,569,093 | |
| Public Service Enterprise Group, Inc. | 10,053 | 607,905 | |
| Sempra Energy | 385 | 54,528 | |
| 22,024,127 | |||
| Water Utilities - 0.1% | |||
| American Water Works Co., Inc. | 4,488 | 571,412 | |
| TOTAL UTILITIES | 73,115,602 | ||
| TOTAL COMMON STOCKS | |||
| (Cost $1,158,983,226) | 1,252,866,056 | ||
| Principal Amount | Value | ||
| U.S. Treasury Obligations - 0.1% | |||
| U.S. Treasury Bills, yield at date of purchase 2.46% 9/12/19 (c) | |||
| (Cost $999,261) | 1,000,000 | 999,534 | |
| Shares | Value | ||
| Money Market Funds - 1.5% | |||
| Fidelity Cash Central Fund 2.13% (d) | 8,092,868 | $8,094,487 | |
| Fidelity Securities Lending Cash Central Fund 2.13% (d)(e) | 10,801,736 | 10,802,816 | |
| TOTAL MONEY MARKET FUNDS | |||
| (Cost $18,897,303) | 18,897,303 | ||
| TOTAL INVESTMENT IN SECURITIES - 100.7% | |||
| (Cost $1,178,879,790) | 1,272,762,893 | ||
| NET OTHER ASSETS (LIABILITIES) - (0.7)% | (9,443,529) | ||
| NET ASSETS - 100% | $1,263,319,364 |
| Futures Contracts | |||||
| Number of contracts | Expiration Date | Notional Amount | Value | Unrealized Appreciation/(Depreciation) | |
| Purchased | |||||
| Equity Index Contracts | |||||
| CME E-mini S&P MidCap 400 Index Contracts (United States) | 56 | Sept. 2019 | $10,535,840 | $104,863 | $104,863 |
The notional amount of futures purchased as a percentage of Net Assets is 0.8%
Legend
(a) Security or a portion of the security is on loan at period end.
(b) Non-income producing
(c) Security or a portion of the security was pledged to cover margin requirements for futures contracts. At period end, the value of securities pledged amounted to $452,789.
(d) Affiliated fund that is generally available only to investment companies and other accounts managed by Fidelity Investments. The rate quoted is the annualized seven-day yield of the fund at period end. A complete unaudited listing of the fund's holdings as of its most recent quarter end is available upon request. In addition, each Fidelity Central Fund's financial statements, which are not covered by the Fund's Report of Independent Registered Public Accounting Firm, are available on the SEC's website or upon request.
(e) Investment made with cash collateral received from securities on loan.
Affiliated Central Funds
Information regarding fiscal year to date income earned by the Fund from investments in Fidelity Central Funds is as follows:
| Fund | Income earned |
| Fidelity Cash Central Fund | $261,409 |
| Fidelity Securities Lending Cash Central Fund | 14,036 |
| Total | $275,445 |
Amounts in the income column in the above table include any capital gain distributions from underlying funds, which are presented in the corresponding line-item in the Statement of Operations, if applicable. Amount for Fidelity Securities Lending Cash Central Fund represents the income earned on investing cash collateral, less rebates paid to borrowers and any lending agent fees associated with the loan, plus any premium payments received for lending certain types of securities.
Investment Valuation
The following is a summary of the inputs used, as of August 31, 2019, involving the Fund's assets and liabilities carried at fair value. The inputs or methodology used for valuing securities may not be an indication of the risk associated with investing in those securities. For more information on valuation inputs, and their aggregation into the levels used below, please refer to the Investment Valuation section in the accompanying Notes to Financial Statements.
| Valuation Inputs at Reporting Date: | ||||
| Description | Total | Level 1 | Level 2 | Level 3 |
| Investments in Securities: | ||||
| Equities: | ||||
| Communication Services | $39,865,283 | $39,865,283 | $-- | $-- |
| Consumer Discretionary | 155,239,146 | 155,239,146 | -- | -- |
| Consumer Staples | 66,811,433 | 66,811,433 | -- | -- |
| Energy | 24,003,528 | 24,003,528 | -- | -- |
| Financials | 183,077,257 | 183,077,257 | -- | -- |
| Health Care | 151,025,997 | 151,025,997 | -- | -- |
| Industrials | 158,255,993 | 158,255,993 | -- | -- |
| Information Technology | 241,864,734 | 241,864,734 | -- | -- |
| Materials | 57,561,875 | 57,561,875 | -- | -- |
| Real Estate | 102,045,208 | 102,045,208 | -- | -- |
| Utilities | 73,115,602 | 73,115,602 | -- | -- |
| U.S. Government and Government Agency Obligations | 999,534 | -- | 999,534 | -- |
| Money Market Funds | 18,897,303 | 18,897,303 | -- | -- |
| Total Investments in Securities: | $1,272,762,893 | $1,271,763,359 | $999,534 | $-- |
| Derivative Instruments: | ||||
| Assets | ||||
| Futures Contracts | $104,863 | $104,863 | $-- | $-- |
| Total Assets | $104,863 | $104,863 | $-- | $-- |
| Total Derivative Instruments: | $104,863 | $104,863 | $-- | $-- |
Value of Derivative Instruments
The following table is a summary of the Fund's value of derivative instruments by primary risk exposure as of August 31, 2019. For additional information on derivative instruments, please refer to the Derivative Instruments section in the accompanying Notes to Financial Statements.
| Primary Risk Exposure / Derivative Type | Value | |
| Asset | Liability | |
| Equity Risk | ||
| Futures Contracts(a) | $104,863 | $0 |
| Total Equity Risk | 104,863 | 0 |
| Total Value of Derivatives | $104,863 | $0 |
(a) Reflects gross cumulative appreciation (depreciation) on futures contracts as presented in the Schedule of Investments. In the Statement of Assets and Liabilities, the period end daily variation margin is included in receivable or payable for daily variation margin on futures contracts, and the net cumulative appreciation (depreciation) is included in distributable earnings.
See accompanying notes which are an integral part of the financial statements.
Fidelity® Mid Cap Enhanced Index Fund
Financial Statements
Statement of Assets and Liabilities
| August 31, 2019 | ||
| Assets | ||
| Investment in securities, at value (including securities loaned of $10,465,011) — See accompanying schedule: Unaffiliated issuers (cost $1,159,982,487) | $1,253,865,590 | |
| Fidelity Central Funds (cost $18,897,303) | 18,897,303 | |
| Total Investment in Securities (cost $1,178,879,790) | $1,272,762,893 | |
| Receivable for investments sold | 6,387,760 | |
| Receivable for fund shares sold | 1,358,421 | |
| Dividends receivable | 1,854,076 | |
| Distributions receivable from Fidelity Central Funds | 21,936 | |
| Receivable for daily variation margin on futures contracts | 21,231 | |
| Total assets | 1,282,406,317 | |
| Liabilities | ||
| Payable for investments purchased | $6,237,097 | |
| Payable for fund shares redeemed | 1,429,861 | |
| Accrued management fee | 615,798 | |
| Collateral on securities loaned | 10,804,197 | |
| Total liabilities | 19,086,953 | |
| Net Assets | $1,263,319,364 | |
| Net Assets consist of: | ||
| Paid in capital | $1,139,523,424 | |
| Total distributable earnings (loss) | 123,795,940 | |
| Net Assets, for 86,595,447 shares outstanding | $1,263,319,364 | |
| Net Asset Value, offering price and redemption price per share ($1,263,319,364 ÷ 86,595,447 shares) | $14.59 |
See accompanying notes which are an integral part of the financial statements.
Statement of Operations
| Year ended August 31, 2019 | ||
| Investment Income | ||
| Dividends | $23,769,624 | |
| Interest | 20,507 | |
| Income from Fidelity Central Funds (including $14,036 from security lending) | 275,445 | |
| Total income | 24,065,576 | |
| Expenses | ||
| Management fee | $6,923,778 | |
| Independent trustees' fees and expenses | 6,941 | |
| Interest | 1,394 | |
| Commitment fees | 3,167 | |
| Total expenses before reductions | 6,935,280 | |
| Expense reductions | (187) | |
| Total expenses after reductions | 6,935,093 | |
| Net investment income (loss) | 17,130,483 | |
| Realized and Unrealized Gain (Loss) | ||
| Net realized gain (loss) on: | ||
| Investment securities: | ||
| Unaffiliated issuers | 28,142,442 | |
| Fidelity Central Funds | 998 | |
| Futures contracts | (658,237) | |
| Total net realized gain (loss) | 27,485,203 | |
| Change in net unrealized appreciation (depreciation) on: | ||
| Investment securities: | ||
| Unaffiliated issuers | (82,449,326) | |
| Futures contracts | (180,394) | |
| Total change in net unrealized appreciation (depreciation) | (82,629,720) | |
| Net gain (loss) | (55,144,517) | |
| Net increase (decrease) in net assets resulting from operations | $(38,014,034) |
See accompanying notes which are an integral part of the financial statements.
Statement of Changes in Net Assets
| Year ended August 31, 2019 | Year ended August 31, 2018 | |
| Increase (Decrease) in Net Assets | ||
| Operations | ||
| Net investment income (loss) | $17,130,483 | $20,809,115 |
| Net realized gain (loss) | 27,485,203 | 97,906,251 |
| Change in net unrealized appreciation (depreciation) | (82,629,720) | 73,686,124 |
| Net increase (decrease) in net assets resulting from operations | (38,014,034) | 192,401,490 |
| Distributions to shareholders | (100,749,904) | – |
| Distributions to shareholders from net investment income | – | (16,317,390) |
| Distributions to shareholders from net realized gain | – | (56,685,523) |
| Total distributions | (100,749,904) | (73,002,913) |
| Share transactions | ||
| Proceeds from sales of shares | 323,476,818 | 223,076,939 |
| Reinvestment of distributions | 95,690,621 | 68,383,542 |
| Cost of shares redeemed | (306,502,044) | (305,302,063) |
| Net increase (decrease) in net assets resulting from share transactions | 112,665,395 | (13,841,582) |
| Total increase (decrease) in net assets | (26,098,543) | 105,556,995 |
| Net Assets | ||
| Beginning of period | 1,289,417,907 | 1,183,860,912 |
| End of period | $1,263,319,364 | $1,289,417,907 |
| Other Information | ||
| Undistributed net investment income end of period | $11,923,900 | |
| Shares | ||
| Sold | 22,114,078 | 14,135,009 |
| Issued in reinvestment of distributions | 7,238,322 | 4,408,997 |
| Redeemed | (21,299,474) | (19,306,709) |
| Net increase (decrease) | 8,052,926 | (762,703) |
See accompanying notes which are an integral part of the financial statements.
Financial Highlights
Fidelity Mid Cap Enhanced Index Fund
| Years ended August 31, | 2019 | 2018 | 2017 A | 2017 B | 2016 C | 2015 B |
| Selected Per–Share Data | ||||||
| Net asset value, beginning of period | $16.42 | $14.93 | $14.77 | $11.98 | $14.16 | $13.60 |
| Income from Investment Operations | ||||||
| Net investment income (loss)D | .21 | .26 | .12 | .21 | .18 | .15 |
| Net realized and unrealized gain (loss) | (.71) | 2.17 | .13 | 2.76 | (1.70) | 1.73 |
| Total from investment operations | (.50) | 2.43 | .25 | 2.97 | (1.52) | 1.88 |
| Distributions from net investment income | (.25) | (.21) | (.02) | (.18) | (.14) | (.10) |
| Distributions from net realized gain | (1.09) | (.73) | (.07) | – | (.51) | (1.22) |
| Total distributions | (1.33)E | (.94) | (.09) | (.18) | (.66)F | (1.32) |
| Redemption fees added to paid in capitalD | – | – | –G | –G | –G | –G |
| Net asset value, end of period | $14.59 | $16.42 | $14.93 | $14.77 | $11.98 | $14.16 |
| Total ReturnH,I | (2.19)% | 16.67% | 1.72% | 24.85% | (11.02)% | 15.22% |
| Ratios to Average Net AssetsJ,K | ||||||
| Expenses before reductions | .59% | .59% | .59%L | .60% | .60% | .60% |
| Expenses net of fee waivers, if any | .59% | .59% | .59%L | .60% | .60% | .60% |
| Expenses net of all reductions | .59% | .59% | .59%L | .60% | .60% | .60% |
| Net investment income (loss) | 1.46% | 1.64% | 1.62%L | 1.53% | 1.34% | 1.08% |
| Supplemental Data | ||||||
| Net assets, end of period (000 omitted) | $1,263,319 | $1,289,418 | $1,183,861 | $1,176,023 | $805,242 | $608,475 |
| Portfolio turnover rateM | 90% | 108% | 94%L | 87% | 88% | 89% |
A For the six month period ended August 31. The Fund changed its fiscal year end from February 28 to August 31, effective August 31, 2017.
B For the year ended February 28.
C For the year ended February 29.
D Calculated based on average shares outstanding during the period.
E Total distributions of $1.33 per share is comprised of distributions from net investment income of $.248 and distributions from net realized gain of $1.085 per share.
F Total distributions of $.66 per share is comprised of distributions from net investment income of $.144 and distributions from net realized gain of $.511 per share.
G Amount represents less than $.005 per share.
H Total returns for periods of less than one year are not annualized.
I Total returns would have been lower if certain expenses had not been reduced during the applicable periods shown.
J Fees and expenses of any underlying Fidelity Central Funds are not included in the Fund's expense ratio. The Fund indirectly bears its proportionate share of the expenses of any underlying Fidelity Central Funds.
K Expense ratios reflect operating expenses of the Fund. Expenses before reductions do not reflect amounts reimbursed by the investment adviser or reductions from expense offset arrangements and do not represent the amount paid by the Fund during periods when reimbursements or reductions occur. Expenses net of fee waivers reflect expenses after reimbursement by the investment adviser but prior to reductions from expense offset arrangements. Expenses net of all reductions represent the net expenses paid by the Fund.
L Annualized
M Amount does not include the portfolio activity of any underlying Fidelity Central Funds.
See accompanying notes which are an integral part of the financial statements.
Fidelity® International Enhanced Index Fund
Performance: The Bottom Line
Average annual total return reflects the change in the value of an investment, assuming reinvestment of distributions from dividend income and capital gains (the profits earned upon the sale of securities that have grown in value, if any) and assuming a constant rate of performance each year. The hypothetical investment and the average annual total returns do not reflect the deduction of taxes that a shareholder would pay on fund distributions or the redemption of fund shares. During periods of reimbursement by Fidelity, a fund’s total return will be greater than it would be had the reimbursement not occurred. How a fund did yesterday is no guarantee of how it will do tomorrow.
Average Annual Total Returns
| For the periods ended August 31, 2019 | Past 1 year | Past 5 years | Past 10 years |
| Fidelity® International Enhanced Index Fund | (6.51)% | 2.08% | 5.53% |
$10,000 Over 10 Years
Let's say hypothetically that $10,000 was invested in Fidelity® International Enhanced Index Fund on August 31, 2009.
The chart shows how the value of your investment would have changed, and also shows how the MSCI EAFE Index performed over the same period.

| Period Ending Values | ||
| $17,126 | Fidelity® International Enhanced Index Fund | |
| $16,552 | MSCI EAFE Index | |
Fidelity® International Enhanced Index Fund
Management's Discussion of Fund Performance
Market Recap: The MSCI ACWI (All Country World Index) ex USA Index returned -3.09% for the year ending August 31, 2019, as performance reflected a confluence of negative factors, including escalating trade tension, lackluster global economic growth, uncertainty about the U.K.’s planned “Brexit” from the European Union and reports of slowing in China’s economy. In late December, the U.S. Federal Reserve shifted from raising interest rates to a more dovish policy in 2019, joining many foreign central banks that had been cutting rates. Sentiment driven by geopolitical factors, including elections and trade disputes, ebbed and flowed in 2019 – resulting in increased volatility and a negative return for international equities. In June, stocks rebounded 6.06%, as policy stimulus in China stabilized that country’s economic growth trajectory. In July, the Fed cut its policy rate for the first time since 2007. However, the index returned -1.21% for the month, followed by a -3.08% return in August, and ended the final three months of the period with a 1.53% gain. For the full 12 months, seven sectors had negative performance, with energy (-10%), materials (-7%) and financials (-6%) faring worst. Conversely, four sectors had a positive return, led by utilities (+11%) and consumer staples (+7%). By region, Japan and the U.K. each returned about -5%, followed by emerging markets (-4%) and Europe ex U.K (-1%). Both Canada and Asia Pacific ex Japan eked out a modest gain of about 1%.Comments from Maximilian Kaufmann, Senior Portfolio Manager of the Geode Capital Management, LLC, investment management team: For the fiscal year, the fund returned -6.51%, trailing the -3.04% return of the benchmark MSCI EAFE Index. Security selection in the industrials, consumer discretionary and information technology sectors hampered the fund's relative result most during the reporting period, as did a broadly stronger U.S. dollar. Conversely, a combination of favorable investment choices and a beneficial underweighting in the lagging financials sector modestly contributed. (The fund may use fair-value pricing techniques to better reflect the value of foreign securities whose prices may be stale due to differences in market-closure times and dates around the world. Fair-value pricing is an adjustment process that attempts to best represent the value of fund holdings as of the close in trading in U.S. markets, accounting for any major changes occurring after the close of foreign markets. The MSCI EAFE Index does not engage in fair-value pricing; differences between fund and index pricing methodologies may cause short-term discrepancies in performance, which tend to smooth out over time.) Individually, the portfolio's biggest detractor was German chemicals company Covestro (-45%), which struggled in a challenging business and global economic environment. Another stock that weighed on performance was Eisai (-42%), a Japanese pharmaceutical stock that fell sharply in March, after news broke of an unsuccessful trial of an Alzheimer's-disease treatment the company was co-developing. Further weighing on the fund's return was German bearings maker Schaeffler (-47%), whose earnings proved disappointing to investors due to weak demand. Meanwhile, several mining stocks in the portfolio gained ground in response to often-rising commodity prices. These included the fund's stakes in BHP Group (+12%), Rio Tinto (+21%) and Fortescue Metals (+45%), each of which were meaningful contributors the past 12 months.The views expressed above reflect those of the portfolio manager(s) only through the end of the period as stated on the cover of this report and do not necessarily represent the views of Fidelity or any other person in the Fidelity organization. Any such views are subject to change at any time based upon market or other conditions and Fidelity disclaims any responsibility to update such views. These views may not be relied on as investment advice and, because investment decisions for a Fidelity fund are based on numerous factors, may not be relied on as an indication of trading intent on behalf of any Fidelity fund.
Fidelity® International Enhanced Index Fund
Investment Summary (Unaudited)
Geographic Diversification (% of fund's net assets)
| As of August 31, 2019 | ||
| Japan | 23.3% | |
| United Kingdom | 16.2% | |
| France | 11.8% | |
| Switzerland | 8.4% | |
| Germany | 7.3% | |
| Australia | 6.1% | |
| Netherlands | 5.2% | |
| Spain | 4.0% | |
| Italy | 2.5% | |
| Other* | 15.2% | |
* Includes Short-Term investments and Net Other Assets (Liabilities).
Percentages are based on country or territory of incorporation and are adjusted for the effect of futures contracts, if applicable.
Asset Allocation as of August 31, 2019
| % of fund's net assets | |
| Stocks and Equity Futures | 100.0 |
Top Ten Stocks as of August 31, 2019
| % of fund's net assets | |
| Nestle SA (Reg. S) (Switzerland, Food Products) | 3.0 |
| Novartis AG (Switzerland, Pharmaceuticals) | 1.9 |
| Roche Holding AG (participation certificate) (Switzerland, Pharmaceuticals) | 1.9 |
| Diageo PLC (United Kingdom, Beverages) | 1.2 |
| HSBC Holdings PLC (United Kingdom, Banks) | 1.2 |
| Unilever NV (Netherlands, Personal Products) | 1.1 |
| Allianz SE (Germany, Insurance) | 1.1 |
| Novo Nordisk A/S Series B (Denmark, Pharmaceuticals) | 1.1 |
| CSL Ltd. (Australia, Biotechnology) | 1.1 |
| Royal Dutch Shell PLC Class B (United Kingdom) (United Kingdom, Oil, Gas & Consumable Fuels) | 1.0 |
| 14.6 |
Top Market Sectors as of August 31, 2019
| % of fund's net assets | |
| Financials | 16.9 |
| Industrials | 14.1 |
| Health Care | 13.7 |
| Consumer Staples | 13.5 |
| Consumer Discretionary | 9.7 |
| Communication Services | 7.1 |
| Information Technology | 6.8 |
| Materials | 5.3 |
| Utilities | 4.3 |
| Energy | 3.6 |
Fidelity® International Enhanced Index Fund
Schedule of Investments August 31, 2019
Showing Percentage of Net Assets
| Common Stocks - 98.1% | |||
| Shares | Value | ||
| Australia - 6.1% | |||
| Aurizon Holdings Ltd. | 1,911,034 | $7,606,086 | |
| BHP Billiton Ltd. | 490,272 | 12,034,894 | |
| Cimic Group Ltd. | 6,508 | 135,867 | |
| Coca-Cola Amatil Ltd. | 1,066,002 | 7,803,563 | |
| Cochlear Ltd. | 4,099 | 601,783 | |
| Commonwealth Bank of Australia | 55,355 | 2,946,891 | |
| CSL Ltd. | 96,693 | 15,684,949 | |
| DEXUS Property Group unit | 167,752 | 1,457,346 | |
| Fortescue Metals Group Ltd. | 1,586,094 | 8,545,240 | |
| Goodman Group unit | 178,065 | 1,741,208 | |
| Macquarie Group Ltd. | 102,329 | 8,534,244 | |
| Newcrest Mining Ltd. | 78,629 | 1,959,250 | |
| Rio Tinto Ltd. | 113,077 | 6,669,366 | |
| Telstra Corp. Ltd. | 604,129 | 1,513,485 | |
| The GPT Group unit | 110,753 | 476,608 | |
| Vicinity Centres unit | 168,198 | 293,377 | |
| Wesfarmers Ltd. | 152,023 | 4,003,054 | |
| Woodside Petroleum Ltd. | 355,068 | 7,682,943 | |
| Woolworths Group Ltd. | 79,266 | 2,016,226 | |
| TOTAL AUSTRALIA | 91,706,380 | ||
| Austria - 0.0% | |||
| Verbund AG | 11,133 | 662,564 | |
| Belgium - 2.1% | |||
| Ageas | 116,047 | 6,211,269 | |
| Anheuser-Busch InBev SA NV | 157,502 | 14,887,002 | |
| Colruyt NV | 51,365 | 2,629,002 | |
| KBC Groep NV | 22,587 | 1,306,748 | |
| Proximus | 10,905 | 322,280 | |
| UCB SA | 87,945 | 6,566,805 | |
| TOTAL BELGIUM | 31,923,106 | ||
| Bermuda - 0.1% | |||
| Kerry Properties Ltd. | 512,423 | 1,724,573 | |
| Cayman Islands - 1.1% | |||
| Cheung Kong Property Holdings Ltd. | 1,349,828 | 9,141,489 | |
| Melco Crown Entertainment Ltd. sponsored ADR | 41,532 | 863,866 | |
| Sands China Ltd. | 1,512,400 | 6,846,994 | |
| TOTAL CAYMAN ISLANDS | 16,852,349 | ||
| Denmark - 1.9% | |||
| Carlsberg A/S Series B | 29,025 | 4,284,520 | |
| Coloplast A/S Series B | 20,549 | 2,447,265 | |
| H Lundbeck A/S | 95,056 | 3,460,632 | |
| Novo Nordisk A/S Series B | 335,820 | 17,497,021 | |
| Vestas Wind Systems A/S | 16,302 | 1,197,802 | |
| TOTAL DENMARK | 28,887,240 | ||
| Finland - 0.0% | |||
| Fortum Corp. | 23,695 | 521,100 | |
| Orion Oyj (B Shares) | 730 | 27,094 | |
| TOTAL FINLAND | 548,194 | ||
| France - 11.8% | |||
| Arkema SA | 33,249 | 2,914,615 | |
| Atos Origin SA | 19,010 | 1,439,106 | |
| AXA SA | 492,209 | 11,286,634 | |
| bioMerieux SA | 11,483 | 933,278 | |
| BNP Paribas SA | 279,196 | 12,585,014 | |
| Capgemini SA | 28,456 | 3,413,619 | |
| CNP Assurances | 171,316 | 3,110,466 | |
| Compagnie de St. Gobain | 247,712 | 8,935,175 | |
| Danone SA | 25,031 | 2,242,511 | |
| Dassault Aviation SA | 433 | 615,800 | |
| Dassault Systemes SA | 61,953 | 8,725,662 | |
| EDF SA | 283,032 | 3,441,949 | |
| Eiffage SA | 50,132 | 5,192,395 | |
| Eurazeo SA | 21,018 | 1,389,455 | |
| Eutelsat Communications | 300,527 | 5,225,254 | |
| Faurecia SA | 8,626 | 376,846 | |
| Hermes International SCA | 14,236 | 9,716,213 | |
| Kering SA | 14,868 | 7,196,433 | |
| L'Oreal SA | 53,919 | 14,731,956 | |
| Legrand SA | 11,033 | 778,720 | |
| LVMH Moet Hennessy Louis Vuitton SE | 16,669 | 6,647,368 | |
| Orange SA | 683,957 | 10,391,643 | |
| Peugeot Citroen SA | 401,859 | 8,979,012 | |
| Publicis Groupe SA (a) | 171,571 | 8,230,820 | |
| Rexel SA | 392,596 | 4,163,807 | |
| Sanofi SA | 39,493 | 3,392,753 | |
| Sartorius Stedim Biotech | 8,128 | 1,257,777 | |
| Schneider Electric SA | 150,981 | 12,646,762 | |
| Societe Generale Series A | 204,457 | 5,175,757 | |
| Thales SA | 14,455 | 1,670,494 | |
| Total SA | 117,392 | 5,862,404 | |
| Veolia Environnement SA | 139,186 | 3,327,149 | |
| Wendel SA | 6,301 | 882,952 | |
| Worldline SA (b)(c) | 1 | 69 | |
| TOTAL FRANCE | 176,879,868 | ||
| Germany - 6.8% | |||
| adidas AG | 8,349 | 2,474,759 | |
| Allianz SE | 77,017 | 16,997,959 | |
| BASF AG | 18,326 | 1,212,576 | |
| Bayer AG | 2,513 | 186,776 | |
| Bayer AG sponsored ADR | 4,967 | 92,436 | |
| Beiersdorf AG | 69,806 | 8,784,473 | |
| Carl Zeiss Meditec AG | 22,763 | 2,624,354 | |
| Continental AG | 64,028 | 7,726,787 | |
| Covestro AG (c) | 171,838 | 7,779,084 | |
| Deutsche Borse AG | 3,149 | 462,693 | |
| Evonik Industries AG | 24,207 | 616,697 | |
| Fraport AG Frankfurt Airport Services Worldwide | 4,034 | 336,862 | |
| Hannover Reuck SE | 18,655 | 2,968,802 | |
| HeidelbergCement Finance AG | 2,272 | 157,414 | |
| Henkel AG & Co. KGaA | 10,042 | 927,631 | |
| Infineon Technologies AG | 25,067 | 434,434 | |
| Knorr-Bremse AG | 16,090 | 1,502,939 | |
| Metro AG (b) | 365,583 | 1,866,333 | |
| Metro Wholesale & Food Specialist AG | 94,167 | 1,457,199 | |
| MTU Aero Engines Holdings AG | 32,034 | 8,741,890 | |
| Muenchener Rueckversicherungs-Gesellschaft AG in Muenchen | 14,708 | 3,522,316 | |
| ProSiebenSat.1 Media AG | 232,992 | 3,070,207 | |
| RWE AG | 69,031 | 1,967,863 | |
| SAP SE | 46,597 | 5,562,628 | |
| SAP SE sponsored ADR | 1,240 | 147,746 | |
| Schaeffler AG | 762,466 | 5,170,388 | |
| Siemens AG | 150,339 | 15,034,262 | |
| Siemens Healthineers AG (c) | 7,589 | 297,846 | |
| TOTAL GERMANY | 102,125,354 | ||
| Hong Kong - 2.4% | |||
| AIA Group Ltd. | 572,632 | 5,541,222 | |
| Henderson Land Development Co. Ltd. | 645,584 | 2,997,980 | |
| New World Development Co. Ltd. | 712,517 | 886,693 | |
| Sun Hung Kai Properties Ltd. | 596,333 | 8,429,196 | |
| Swire Pacific Ltd. (A Shares) | 521,813 | 5,104,635 | |
| Swire Properties Ltd. | 273,400 | 896,128 | |
| Techtronic Industries Co. Ltd. | 848,000 | 5,849,270 | |
| Wharf Holdings Ltd. | 1,011,646 | 2,209,368 | |
| Wheelock and Co. Ltd. | 804,506 | 4,666,381 | |
| TOTAL HONG KONG | 36,580,873 | ||
| Israel - 1.1% | |||
| Bank Leumi le-Israel BM | 145,506 | 991,380 | |
| Check Point Software Technologies Ltd. (b) | 71,496 | 7,700,119 | |
| CyberArk Software Ltd. (b) | 67,514 | 7,584,523 | |
| Mizrahi Tefahot Bank Ltd. | 12,999 | 299,022 | |
| TOTAL ISRAEL | 16,575,044 | ||
| Italy - 2.5% | |||
| Davide Campari-Milano SpA | 25,611 | 239,960 | |
| Enel SpA | 1,921,095 | 13,937,151 | |
| Intesa Sanpaolo SpA | 1,412,011 | 3,107,072 | |
| Leonardo SpA | 142,182 | 1,739,231 | |
| Poste Italiane SpA (c) | 758,342 | 8,144,530 | |
| Snam Rete Gas SpA | 1,678,583 | 8,484,450 | |
| Terna SpA | 279,357 | 1,753,126 | |
| TOTAL ITALY | 37,405,520 | ||
| Japan - 23.3% | |||
| ABC-MART, Inc. | 3,200 | 204,528 | |
| Advantest Corp. | 209,700 | 8,616,186 | |
| Asahi Kasei Corp. | 431,130 | 3,900,806 | |
| Astellas Pharma, Inc. | 745,225 | 10,286,705 | |
| Bandai Namco Holdings, Inc. | 65,600 | 3,859,368 | |
| Calbee, Inc. | 49,300 | 1,503,572 | |
| Central Japan Railway Co. | 42,700 | 8,446,750 | |
| Dai Nippon Printing Co. Ltd. | 91,880 | 1,988,348 | |
| Dai-ichi Mutual Life Insurance Co. | 226,467 | 3,086,781 | |
| Daiichi Sankyo Kabushiki Kaisha | 35,300 | 2,331,957 | |
| Dainippon Sumitomo Pharma Co. Ltd. | 52,484 | 916,932 | |
| Daiwa House Industry Co. Ltd. | 184,400 | 5,783,601 | |
| Eisai Co. Ltd. | 137,510 | 7,028,562 | |
| Fujifilm Holdings Corp. | 116,826 | 5,002,508 | |
| Fujitsu Ltd. | 116,255 | 8,976,700 | |
| Hakuhodo DY Holdings, Inc. | 118,097 | 1,744,192 | |
| Hitachi High-Technologies Corp. | 32,200 | 1,739,803 | |
| Hitachi Ltd. | 325,852 | 11,131,142 | |
| Hoya Corp. | 129,084 | 10,509,225 | |
| Itochu Corp. | 271,851 | 5,421,154 | |
| ITOCHU Techno-Solutions Corp. | 11,100 | 305,933 | |
| Japan Post Bank Co. Ltd. | 10,300 | 93,852 | |
| Japan Post Holdings Co. Ltd. | 899,177 | 8,176,260 | |
| Japan Real Estate Investment Corp. | 1,259 | 8,378,717 | |
| Kamigumi Co. Ltd. | 177,100 | 4,149,310 | |
| KDDI Corp. | 474,120 | 12,628,576 | |
| Keio Corp. | 6,200 | 387,518 | |
| Kintetsu Group Holdings Co. Ltd. | 5,500 | 273,874 | |
| Konica Minolta, Inc. | 200,613 | 1,427,622 | |
| Marubeni Corp. | 750,250 | 4,788,860 | |
| Medipal Holdings Corp. | 340,157 | 7,226,755 | |
| Mitsubishi Electric Corp. | 676,258 | 8,170,350 | |
| Mitsubishi Estate Co. Ltd. | 51,589 | 987,735 | |
| Mitsubishi Heavy Industries Ltd. | 88,400 | 3,321,813 | |
| Mitsubishi UFJ Financial Group, Inc. | 2,773,612 | 13,350,093 | |
| Mitsubishi UFJ Lease & Finance Co. Ltd. | 833,871 | 4,505,502 | |
| Mitsui & Co. Ltd. | 264,742 | 4,144,265 | |
| Mizuho Financial Group, Inc. | 6,453,613 | 9,377,350 | |
| Nexon Co. Ltd. (b) | 218,600 | 2,940,457 | |
| Nikon Corp. | 71,300 | 882,567 | |
| Nippon Telegraph & Telephone Corp. | 229,185 | 10,993,804 | |
| Nomura Holdings, Inc. | 2,160,500 | 8,709,087 | |
| Nomura Research Institute Ltd. | 243,200 | 4,837,216 | |
| NTT DOCOMO, Inc. | 446,060 | 11,261,194 | |
| OBIC Co. Ltd. | 60,500 | 6,919,330 | |
| Oriental Land Co. Ltd. | 35,000 | 5,096,720 | |
| ORIX Corp. | 419,632 | 6,197,605 | |
| Otsuka Corp. | 209,600 | 7,783,424 | |
| Rakuten, Inc. | 879,600 | 8,288,037 | |
| Recruit Holdings Co. Ltd. | 10,719 | 324,794 | |
| Resona Holdings, Inc. | 680,400 | 2,670,747 | |
| Sankyo Co. Ltd. (Gunma) | 16,400 | 567,327 | |
| Seibu Holdings, Inc. | 56,200 | 953,816 | |
| Sekisui House Ltd. | 306,400 | 5,438,106 | |
| Shin-Etsu Chemical Co. Ltd. | 41,300 | 4,159,914 | |
| Shionogi & Co. Ltd. | 157,251 | 8,429,844 | |
| Showa Denko K.K. | 7,600 | 196,161 | |
| SoftBank Corp. | 577,900 | 8,108,062 | |
| SoftBank Corp. | 114,900 | 5,217,467 | |
| Sony Corp. sponsored ADR | 10,119 | 575,872 | |
| Sumitomo Corp. | 209,419 | 3,139,264 | |
| Sumitomo Mitsui Financial Group, Inc. | 374,192 | 12,261,617 | |
| Suzuken Co. Ltd. | 43,065 | 2,314,691 | |
| Teijin Ltd. | 40,400 | 726,352 | |
| Tokio Marine Holdings, Inc. | 31,800 | 1,637,969 | |
| Tokyo Electric Power Co., Inc. (b) | 1,065,280 | 5,073,956 | |
| Toppan Printing Co. Ltd. | 36,500 | 581,677 | |
| Toyo Suisan Kaisha Ltd. | 61,400 | 2,499,694 | |
| Toyota Motor Corp. | 206,959 | 13,552,912 | |
| USS Co. Ltd. | 33,700 | 636,980 | |
| West Japan Railway Co. | 29,100 | 2,451,593 | |
| Yahoo! Japan Corp. | 45,500 | 113,927 | |
| Yamazaki Baking Co. Ltd. | 50,900 | 884,467 | |
| TOTAL JAPAN | 350,599,855 | ||
| Netherlands - 5.2% | |||
| ABN AMRO Group NV GDR (c) | 184,425 | 3,280,575 | |
| Airbus Group NV | 64,529 | 8,891,672 | |
| ASML Holding NV (Netherlands) | 20,247 | 4,503,070 | |
| EXOR NV | 116,848 | 7,897,940 | |
| Heineken Holding NV | 67,175 | 6,640,890 | |
| Heineken NV (Bearer) | 30,504 | 3,243,920 | |
| ING Groep NV (Certificaten Van Aandelen) | 22,337 | 213,400 | |
| Koninklijke Ahold Delhaize NV | 14,382 | 336,904 | |
| Koninklijke Philips Electronics NV | 260,334 | 12,270,666 | |
| NXP Semiconductors NV | 16,680 | 1,703,695 | |
| Randstad NV | 49,092 | 2,290,371 | |
| Unilever NV | 279,460 | 17,340,019 | |
| Wolters Kluwer NV | 133,297 | 9,598,684 | |
| TOTAL NETHERLANDS | 78,211,806 | ||
| New Zealand - 0.0% | |||
| Fisher & Paykel Healthcare Corp. | 29,585 | 310,381 | |
| Meridian Energy Ltd. | 89,410 | 280,559 | |
| TOTAL NEW ZEALAND | 590,940 | ||
| Norway - 0.5% | |||
| Equinor ASA | 299,699 | 5,124,240 | |
| Gjensidige Forsikring ASA | 46,575 | 899,330 | |
| Orkla ASA | 112,073 | 1,027,231 | |
| Telenor ASA | 41,293 | 847,866 | |
| TOTAL NORWAY | 7,898,667 | ||
| Singapore - 2.2% | |||
| ComfortDelgro Corp. Ltd. | 3,325,467 | 5,870,938 | |
| DBS Group Holdings Ltd. | 373,500 | 6,602,021 | |
| Genting Singapore Ltd. | 8,085,160 | 5,185,222 | |
| Singapore Exchange Ltd. | 200,100 | 1,182,360 | |
| Singapore Technologies Engineering Ltd. | 326,155 | 925,996 | |
| United Overseas Bank Ltd. | 457,655 | 8,231,359 | |
| Yangzijiang Shipbuilding Holdings Ltd. | 6,935,746 | 4,548,030 | |
| TOTAL SINGAPORE | 32,545,926 | ||
| Spain - 4.0% | |||
| ACS Actividades de Construccion y Servicios SA | 225,731 | 8,542,024 | |
| Aena Sme SA (c) | 34,669 | 6,248,886 | |
| Banco Bilbao Vizcaya Argentaria SA | 425,619 | 2,019,204 | |
| Banco Santander SA (Spain) | 667,712 | 2,528,748 | |
| Enagas SA | 213,308 | 4,654,730 | |
| Endesa SA | 88,183 | 2,264,963 | |
| Grifols SA | 25,821 | 817,303 | |
| Iberdrola SA | 1,206,151 | 12,416,136 | |
| Inditex SA | 24,625 | 761,992 | |
| Red Electrica Corporacion SA | 408,069 | 8,103,664 | |
| Telefonica SA | 1,589,593 | 11,043,633 | |
| TOTAL SPAIN | 59,401,283 | ||
| Sweden - 2.4% | |||
| Atlas Copco AB: | |||
| (A Shares) | 68,316 | 2,040,156 | |
| (B Shares) | 19,880 | 529,680 | |
| Essity AB Class B | 18,488 | 576,605 | |
| H&M Hennes & Mauritz AB (B Shares) | 415,976 | 7,967,189 | |
| ICA Gruppen AB | 31,306 | 1,535,213 | |
| Sandvik AB | 182,944 | 2,623,565 | |
| Securitas AB (B Shares) | 134,018 | 2,006,587 | |
| Skandinaviska Enskilda Banken AB (A Shares) | 95,230 | 818,532 | |
| SKF AB (B Shares) | 449,734 | 7,256,028 | |
| Volvo AB (B Shares) | 721,155 | 9,956,188 | |
| TOTAL SWEDEN | 35,309,743 | ||
| Switzerland - 8.4% | |||
| ABB Ltd. (Reg.) | 8,816 | 167,646 | |
| Adecco SA (Reg.) | 35,585 | 1,871,740 | |
| Baloise Holdings AG | 11,814 | 2,013,662 | |
| Credit Suisse Group AG | 518,532 | 6,066,905 | |
| Nestle SA (Reg. S) | 405,650 | 45,584,693 | |
| Novartis AG | 319,882 | 28,838,873 | |
| Roche Holding AG (participation certificate) | 104,409 | 28,530,830 | |
| Sonova Holding AG Class B | 36,718 | 8,521,470 | |
| Swatch Group AG (Bearer) | 1,003 | 271,689 | |
| Zurich Insurance Group Ltd. | 12,202 | 4,342,050 | |
| TOTAL SWITZERLAND | 126,209,558 | ||
| United Kingdom - 16.2% | |||
| 3i Group PLC | 36,603 | 488,365 | |
| Anglo American PLC (United Kingdom) | 314,704 | 6,793,977 | |
| AstraZeneca PLC: | |||
| (United Kingdom) | 49,751 | 4,443,833 | |
| sponsored ADR | 25,246 | 1,136,827 | |
| Auto Trader Group PLC (c) | 122,574 | 792,871 | |
| Aviva PLC | 908,350 | 3,921,478 | |
| BAE Systems PLC | 1,433,917 | 9,535,735 | |
| Barclays PLC | 2,373,719 | 3,954,209 | |
| Barratt Developments PLC | 1,036,126 | 7,973,034 | |
| Berkeley Group Holdings PLC | 56,446 | 2,690,332 | |
| BHP Billiton PLC | 443,374 | 9,591,778 | |
| BP PLC | 1,020,392 | 6,214,450 | |
| British American Tobacco PLC (United Kingdom) | 54,949 | 1,927,520 | |
| BT Group PLC | 1,914,380 | 3,856,739 | |
| Burberry Group PLC | 306,135 | 8,061,010 | |
| Diageo PLC | 437,234 | 18,719,635 | |
| GlaxoSmithKline PLC sponsored ADR | 98,193 | 4,082,865 | |
| HSBC Holdings PLC: | |||
| (United Kingdom) | 325,790 | 2,345,581 | |
| sponsored ADR | 446,299 | 16,022,134 | |
| Imperial Tobacco Group PLC | 325,063 | 8,403,176 | |
| Investec PLC | 227,244 | 1,167,980 | |
| Legal & General Group PLC | 1,338,913 | 3,577,700 | |
| Lloyds Banking Group PLC | 4,238,837 | 2,578,982 | |
| London Stock Exchange Group PLC | 41,965 | 3,550,922 | |
| Meggitt PLC | 176,664 | 1,330,632 | |
| Persimmon PLC | 289,919 | 6,711,515 | |
| Prudential PLC | 172,887 | 2,881,695 | |
| RELX PLC: | |||
| (London Stock Exchange) | 146,354 | 3,502,013 | |
| sponsored ADR (a) | 7,947 | 191,125 | |
| Rio Tinto PLC | 196,931 | 9,981,607 | |
| Royal Dutch Shell PLC: | |||
| Class A (United Kingdom) | 551,980 | 15,335,780 | |
| Class B (United Kingdom) | 556,746 | 15,416,212 | |
| Royal Mail PLC | 1,251,821 | 3,139,348 | |
| Sage Group PLC | 698,177 | 5,951,890 | |
| Schroders PLC | 6,724 | 223,362 | |
| Smith & Nephew PLC | 406,431 | 9,739,269 | |
| Standard Chartered PLC (United Kingdom) | 18,626 | 140,971 | |
| Tate & Lyle PLC | 705,799 | 6,178,324 | |
| Taylor Wimpey PLC | 2,099,798 | 3,729,072 | |
| Unilever PLC | 240,616 | 15,201,690 | |
| United Utilities Group PLC | 149,785 | 1,483,583 | |
| Vodafone Group PLC | 5,883,502 | 11,131,695 | |
| TOTAL UNITED KINGDOM | 244,100,916 | ||
| TOTAL COMMON STOCKS | |||
| (Cost $1,477,935,500) | 1,476,739,759 | ||
| Nonconvertible Preferred Stocks - 0.5% | |||
| Germany - 0.5% | |||
| Henkel AG & Co. KGaA | 80,613 | 8,071,252 | |
| Sartorius AG (non-vtg.) | 1,166 | 233,103 | |
| TOTAL GERMANY | 8,304,355 | ||
| Principal Amount | Value | ||
| Government Obligations - 0.1% | |||
| United States of America - 0.1% | |||
| U.S. Treasury Bills, yield at date of purchase 2.46% 9/12/19(d) | |||
| (Cost $1,199,113) | $1,200,000 | 1,199,441 | |
| Shares | Value | ||
| Money Market Funds - 1.0% | |||
| Fidelity Cash Central Fund 2.13% (e) | 14,633,880 | 14,636,807 | |
| Fidelity Securities Lending Cash Central Fund 2.13% (e)(f) | 315,613 | 315,644 | |
| TOTAL MONEY MARKET FUNDS | |||
| (Cost $14,952,451) | 14,952,451 | ||
| TOTAL INVESTMENT IN SECURITIES - 99.7% | |||
| (Cost $1,502,367,581) | 1,501,196,006 | ||
| NET OTHER ASSETS (LIABILITIES) - 0.3% | 4,692,751 | ||
| NET ASSETS - 100% | $1,505,888,757 |
| Futures Contracts | |||||
| Number of contracts | Expiration Date | Notional Amount | Value | Unrealized Appreciation/(Depreciation) | |
| Purchased | |||||
| Equity Index Contracts | |||||
| ICE E-mini MSCI EAFE Index Contracts (United States) | 228 | Sept. 2019 | $21,020,460 | $553,511 | $553,511 |
The notional amount of futures purchased as a percentage of Net Assets is 1.4%
Categorizations in the Schedule of Investments are based on country or territory of incorporation.
Legend
(a) Security or a portion of the security is on loan at period end.
(b) Non-income producing
(c) Security exempt from registration under Rule 144A of the Securities Act of 1933. These securities may be resold in transactions exempt from registration, normally to qualified institutional buyers. At the end of the period, the value of these securities amounted to $26,543,861 or 1.8% of net assets.
(d) Security or a portion of the security was pledged to cover margin requirements for futures contracts. At period end, the value of securities pledged amounted to $1,199,441.
(e) Affiliated fund that is generally available only to investment companies and other accounts managed by Fidelity Investments. The rate quoted is the annualized seven-day yield of the fund at period end. A complete unaudited listing of the fund's holdings as of its most recent quarter end is available upon request. In addition, each Fidelity Central Fund's financial statements, which are not covered by the Fund's Report of Independent Registered Public Accounting Firm, are available on the SEC's website or upon request.
(f) Investment made with cash collateral received from securities on loan.
Affiliated Central Funds
Information regarding fiscal year to date income earned by the Fund from investments in Fidelity Central Funds is as follows:
| Fund | Income earned |
| Fidelity Cash Central Fund | $224,499 |
| Fidelity Securities Lending Cash Central Fund | 356,297 |
| Total | $580,796 |
Amounts in the income column in the above table include any capital gain distributions from underlying funds, which are presented in the corresponding line-item in the Statement of Operations, if applicable. Amount for Fidelity Securities Lending Cash Central Fund represents the income earned on investing cash collateral, less rebates paid to borrowers and any lending agent fees associated with the loan, plus any premium payments received for lending certain types of securities.
Investment Valuation
The following is a summary of the inputs used, as of August 31, 2019, involving the Fund's assets and liabilities carried at fair value. The inputs or methodology used for valuing securities may not be an indication of the risk associated with investing in those securities. For more information on valuation inputs, and their aggregation into the levels used below, please refer to the Investment Valuation section in the accompanying Notes to Financial Statements.
| Valuation Inputs at Reporting Date: | ||||
| Description | Total | Level 1 | Level 2 | Level 3 |
| Investments in Securities: | ||||
| Equities: | ||||
| Communication Services | $109,434,172 | $49,080,859 | $60,353,313 | $-- |
| Consumer Discretionary | 145,824,464 | 110,288,411 | 35,536,053 | -- |
| Consumer Staples | 199,678,848 | 83,438,874 | 116,239,974 | -- |
| Energy | 55,636,029 | 12,807,183 | 42,828,846 | -- |
| Financials | 252,480,754 | 127,116,054 | 125,364,700 | -- |
| Health Care | 203,040,860 | 87,854,134 | 115,186,726 | -- |
| Industrials | 214,254,853 | 153,587,482 | 60,667,371 | -- |
| Information Technology | 103,906,425 | 93,406,293 | 10,500,132 | -- |
| Materials | 77,239,731 | 40,258,962 | 36,980,769 | -- |
| Real Estate | 55,175,035 | 19,118,592 | 36,056,443 | -- |
| Utilities | 68,372,943 | 31,948,129 | 36,424,814 | -- |
| Government Obligations | 1,199,441 | -- | 1,199,441 | -- |
| Money Market Funds | 14,952,451 | 14,952,451 | -- | -- |
| Total Investments in Securities: | $1,501,196,006 | $823,857,424 | $677,338,582 | $-- |
| Derivative Instruments: | ||||
| Assets | ||||
| Futures Contracts | $553,511 | $553,511 | $-- | $-- |
| Total Assets | $553,511 | $553,511 | $-- | $-- |
| Total Derivative Instruments: | $553,511 | $553,511 | $-- | $-- |
Value of Derivative Instruments
The following table is a summary of the Fund's value of derivative instruments by primary risk exposure as of August 31, 2019. For additional information on derivative instruments, please refer to the Derivative Instruments section in the accompanying Notes to Financial Statements.
| Primary Risk Exposure / Derivative Type | Value | |
| Asset | Liability | |
| Equity Risk | ||
| Futures Contracts(a) | $553,511 | $0 |
| Total Equity Risk | 553,511 | 0 |
| Total Value of Derivatives | $553,511 | $0 |
(a) Reflects gross cumulative appreciation (depreciation) on futures contracts as presented in the Schedule of Investments. In the Statement of Assets and Liabilities, the period end daily variation margin is included in receivable or payable for daily variation margin on futures contracts, and the net cumulative appreciation (depreciation) is included in distributable earnings.
See accompanying notes which are an integral part of the financial statements.
Fidelity® International Enhanced Index Fund
Financial Statements
Statement of Assets and Liabilities
| August 31, 2019 | ||
| Assets | ||
| Investment in securities, at value (including securities loaned of $300,644) — See accompanying schedule: Unaffiliated issuers (cost $1,487,415,130) | $1,486,243,555 | |
| Fidelity Central Funds (cost $14,952,451) | 14,952,451 | |
| Total Investment in Securities (cost $1,502,367,581) | $1,501,196,006 | |
| Foreign currency held at value (cost $769,258) | 768,414 | |
| Receivable for investments sold | 14,422,077 | |
| Receivable for fund shares sold | 746,460 | |
| Dividends receivable | 6,863,858 | |
| Distributions receivable from Fidelity Central Funds | 61,927 | |
| Receivable for daily variation margin on futures contracts | 101,101 | |
| Total assets | 1,524,159,843 | |
| Liabilities | ||
| Payable for investments purchased | $15,028,168 | |
| Payable for fund shares redeemed | 2,203,551 | |
| Accrued management fee | 723,723 | |
| Collateral on securities loaned | 315,644 | |
| Total liabilities | 18,271,086 | |
| Net Assets | $1,505,888,757 | |
| Net Assets consist of: | ||
| Paid in capital | $1,629,813,374 | |
| Total distributable earnings (loss) | (123,924,617) | |
| Net Assets, for 167,738,861 shares outstanding | $1,505,888,757 | |
| Net Asset Value, offering price and redemption price per share ($1,505,888,757 ÷ 167,738,861 shares) | $8.98 |
See accompanying notes which are an integral part of the financial statements.
Statement of Operations
| Year ended August 31, 2019 | ||
| Investment Income | ||
| Dividends | $63,594,825 | |
| Interest | 4,387 | |
| Income from Fidelity Central Funds (including $356,297 from security lending) | 580,796 | |
| Income before foreign taxes withheld | 64,180,008 | |
| Less foreign taxes withheld | (4,785,792) | |
| Total income | 59,394,216 | |
| Expenses | ||
| Management fee | $9,075,798 | |
| Independent trustees' fees and expenses | 9,015 | |
| Interest | 16,512 | |
| Commitment fees | 4,227 | |
| Total expenses before reductions | 9,105,552 | |
| Expense reductions | (46) | |
| Total expenses after reductions | 9,105,506 | |
| Net investment income (loss) | 50,288,710 | |
| Realized and Unrealized Gain (Loss) | ||
| Net realized gain (loss) on: | ||
| Investment securities: | ||
| Unaffiliated issuers | (138,150,009) | |
| Fidelity Central Funds | 720 | |
| Foreign currency transactions | 79,045 | |
| Futures contracts | (871,796) | |
| Total net realized gain (loss) | (138,942,040) | |
| Change in net unrealized appreciation (depreciation) on: | ||
| Investment securities: | ||
| Unaffiliated issuers | (19,986,276) | |
| Assets and liabilities in foreign currencies | (41,801) | |
| Futures contracts | 448,044 | |
| Total change in net unrealized appreciation (depreciation) | (19,580,033) | |
| Net gain (loss) | (158,522,073) | |
| Net increase (decrease) in net assets resulting from operations | $(108,233,363) |
See accompanying notes which are an integral part of the financial statements.
Statement of Changes in Net Assets
| Year ended August 31, 2019 | Year ended August 31, 2018 | |
| Increase (Decrease) in Net Assets | ||
| Operations | ||
| Net investment income (loss) | $50,288,710 | $30,712,947 |
| Net realized gain (loss) | (138,942,040) | (10,781,844) |
| Change in net unrealized appreciation (depreciation) | (19,580,033) | (31,900,542) |
| Net increase (decrease) in net assets resulting from operations | (108,233,363) | (11,969,439) |
| Distributions to shareholders | (34,087,909) | – |
| Distributions to shareholders from net investment income | – | (12,641,480) |
| Distributions to shareholders from net realized gain | – | (2,690,142) |
| Total distributions | (34,087,909) | (15,331,622) |
| Share transactions | ||
| Proceeds from sales of shares | 476,609,275 | 1,480,868,009 |
| Reinvestment of distributions | 20,553,992 | 14,714,616 |
| Cost of shares redeemed | (540,104,018) | (353,536,211) |
| Net increase (decrease) in net assets resulting from share transactions | (42,940,751) | 1,142,046,414 |
| Redemption fees | – | 19,770 |
| Total increase (decrease) in net assets | (185,262,023) | 1,114,765,123 |
| Net Assets | ||
| Beginning of period | 1,691,150,780 | 576,385,657 |
| End of period | $1,505,888,757 | $1,691,150,780 |
| Other Information | ||
| Undistributed net investment income end of period | $23,544,715 | |
| Shares | ||
| Sold | 52,495,990 | 146,438,695 |
| Issued in reinvestment of distributions | 2,401,167 | 1,478,856 |
| Redeemed | (59,211,314) | (35,086,750) |
| Net increase (decrease) | (4,314,157) | 112,830,801 |
See accompanying notes which are an integral part of the financial statements.
Financial Highlights
Fidelity International Enhanced Index Fund
| Years ended August 31, | 2019 | 2018 | 2017 A | 2017 B | 2016 C | 2015 B |
| Selected Per–Share Data | ||||||
| Net asset value, beginning of period | $9.83 | $9.73 | $8.48 | $7.42 | $8.77 | $8.85 |
| Income from Investment Operations | ||||||
| Net investment income (loss)D | .30 | .27 | .18 | .20 | .19 | .20 |
| Net realized and unrealized gain (loss) | (.95) | –E | 1.07 | 1.08 | (1.38) | (.10) |
| Total from investment operations | (.65) | .27 | 1.25 | 1.28 | (1.19) | .10 |
| Distributions from net investment income | (.20) | (.14)F | – | (.20) | (.16) | (.16) |
| Distributions from net realized gain | – | (.03)F | – | (.02) | –E | (.02) |
| Total distributions | (.20) | (.17) | – | (.22) | (.16) | (.18) |
| Redemption fees added to paid in capitalD | – | –E | –E | –E | –E | –E |
| Net asset value, end of period | $8.98 | $9.83 | $9.73 | $8.48 | $7.42 | $8.77 |
| Total ReturnG,H | (6.51)% | 2.71% | 14.74% | 17.31% | (13.71)% | 1.25% |
| Ratios to Average Net AssetsI,J | ||||||
| Expenses before reductions | .59% | .59% | .59%K | .62% | .62% | .62% |
| Expenses net of fee waivers, if any | .59% | .59% | .59%K | .62% | .62% | .62% |
| Expenses net of all reductions | .59% | .59% | .59%K | .62% | .62% | .62% |
| Net investment income (loss) | 3.27% | 2.69% | 3.86%K | 2.53% | 2.27% | 2.31% |
| Supplemental Data | ||||||
| Net assets, end of period (000 omitted) | $1,505,889 | $1,691,151 | $576,386 | $271,576 | $152,699 | $105,360 |
| Portfolio turnover rateL | 103% | 66% | 70%K | 75% | 77% | 75% |
A For the six month period ended August 31. The Fund changed its fiscal year end from February 28 to August 31, effective August 31, 2017.
B For the year ended February 28.
C For the year ended February 29.
D Calculated based on average shares outstanding during the period.
E Amount represents less than $.005 per share.
F The amounts shown reflect certain reclassifications related to book to tax differences that were made in the year shown.
G Total returns for periods of less than one year are not annualized.
H Total returns would have been lower if certain expenses had not been reduced during the applicable periods shown.
I Fees and expenses of any underlying Fidelity Central Funds are not included in the Fund's expense ratio. The Fund indirectly bears its proportionate share of the expenses of any underlying Fidelity Central Funds.
J Expense ratios reflect operating expenses of the Fund. Expenses before reductions do not reflect amounts reimbursed by the investment adviser or reductions from expense offset arrangements and do not represent the amount paid by the Fund during periods when reimbursements or reductions occur. Expenses net of fee waivers reflect expenses after reimbursement by the investment adviser but prior to reductions from expense offset arrangements. Expenses net of all reductions represent the net expenses paid by the Fund.
K Annualized
L Amount does not include the portfolio activity of any underlying Fidelity Central Funds.
See accompanying notes which are an integral part of the financial statements.
Notes to Financial Statements
For the period ended August 31, 2019
1. Organization.
Fidelity Large Cap Growth Enhanced Index Fund, Fidelity Large Cap Value Enhanced Index Fund, Fidelity Large Cap Core Enhanced Index Fund, Fidelity Mid Cap Enhanced Index Fund and Fidelity International Enhanced Index Fund (the Funds) are funds of Fidelity Commonwealth Trust II (the Trust) and are authorized to issue an unlimited number of shares. Share transactions on the Statement of Changes in Net Assets may contain exchanges between affiliated funds. The Trust is registered under the Investment Company Act of 1940, as amended (the 1940 Act), as an open-end management investment company organized as a Delaware statutory trust.
2. Significant Accounting Policies.
Each Fund is an investment company and applies the accounting and reporting guidance of the Financial Accounting Standards Board (FASB) Accounting Standards Codification Topic 946 Financial Services – Investments Companies. The financial statements have been prepared in conformity with accounting principles generally accepted in the United States of America (GAAP), which require management to make certain estimates and assumptions at the date of the financial statements. Actual results could differ from those estimates. Subsequent events, if any, through the date that the financial statements were issued have been evaluated in the preparation of the financial statements. The following summarizes the significant accounting policies of the Funds:
Investment Valuation. Investments are valued as of 4:00 p.m. Eastern time on the last calendar day of the period. The Board of Trustees (the Board) has delegated the day to day responsibility for the valuation of each Fund's investments to the Fair Value Committee (the Committee) established by each Fund's investment adviser. In accordance with valuation policies and procedures approved by the Board, each Fund attempts to obtain prices from one or more third party pricing vendors or brokers to value its investments. When current market prices, quotations or currency exchange rates are not readily available or reliable, investments will be fair valued in good faith by the Committee, in accordance with procedures adopted by the Board. Factors used in determining fair value vary by investment type and may include market or investment specific events, changes in interest rates and credit quality. The frequency with which these procedures are used cannot be predicted and they may be utilized to a significant extent. The Committee oversees each Fund's valuation policies and procedures and reports to the Board on the Committee's activities and fair value determinations. The Board monitors the appropriateness of the procedures used in valuing each Fund's investments and ratifies the fair value determinations of the Committee.
Each Fund categorizes the inputs to valuation techniques used to value its investments into a disclosure hierarchy consisting of three levels as shown below:
- Level 1 – quoted prices in active markets for identical investments
- Level 2 – other significant observable inputs (including quoted prices for similar investments, interest rates, prepayment speeds, etc.)
- Level 3 – unobservable inputs (including the Fund's own assumptions based on the best information available)
Valuation techniques used to value each Fund's investments by major category are as follows:
Equity securities, including restricted securities, for which market quotations are readily available, are valued at the last reported sale price or official closing price as reported by a third party pricing vendor on the primary market or exchange on which they are traded and are categorized as Level 1 in the hierarchy. In the event there were no sales during the day or closing prices are not available, securities are valued at the last quoted bid price or may be valued using the last available price and are generally categorized as Level 2 in the hierarchy. For foreign equity securities, when market or security specific events arise, comparisons to the valuation of American Depositary Receipts (ADRs), futures contracts, Exchange-Traded Funds (ETFs) and certain indexes as well as quoted prices for similar securities may be used and would be categorized as Level 2 in the hierarchy. For equity securities, including restricted securities, where observable inputs are limited, assumptions about market activity and risk are used and these securities may be categorized as Level 3 in the hierarchy.
Debt securities, including restricted securities, are valued based on evaluated prices received from third party pricing vendors or from brokers who make markets in such securities. U.S. government and government agency obligations are valued by pricing vendors who utilize matrix pricing which considers yield or price of bonds of comparable quality, coupon, maturity and type or by broker-supplied prices. When independent prices are unavailable or unreliable, debt securities may be valued utilizing pricing methodologies which consider similar factors that would be used by third party pricing vendors. Debt securities are generally categorized as Level 2 in the hierarchy but may be Level 3 depending on the circumstances.
Futures contracts are valued at the settlement price established each day by the board of trade or exchange on which they are traded and are categorized as Level 1 in the hierarchy. Investments in open-end mutual funds, including the Fidelity Central Funds, are valued at their closing net asset value (NAV) each business day and are categorized as Level 1 in the hierarchy.
Changes in valuation techniques may result in transfers in or out of an assigned level within the disclosure hierarchy. The aggregate value of investments by input level as of August 31, 2019 is included at the end of each Fund's Schedule of Investments.
Foreign Currency. The Funds may use foreign currency contracts to facilitate transactions in foreign-denominated securities. Gains and losses from these transactions may arise from changes in the value of the foreign currency or if the counterparties do not perform under the contracts' terms.
Foreign-denominated assets, including investment securities, and liabilities are translated into U.S. dollars at the exchange rates at period end. Purchases and sales of investment securities, income and dividends received and expenses denominated in foreign currencies are translated into U.S. dollars at the exchange rate in effect on the transaction date.
The effects of exchange rate fluctuations on investments are included with the net realized and unrealized gain (loss) on investment securities. Other foreign currency transactions resulting in realized and unrealized gain (loss) are disclosed separately.
Investment Transactions and Income. For financial reporting purposes, the Funds' investment holdings and NAV include trades executed through the end of the last business day of the period. The NAV per share for processing shareholder transactions is calculated as of the close of business of the New York Stock Exchange (NYSE), normally 4:00 p.m. Eastern time and includes trades executed through the end of the prior business day. Gains and losses on securities sold are determined on the basis of identified cost and for certain Funds include proceeds received from litigation. Dividend income is recorded on the ex-dividend date, except for certain dividends from foreign securities where the ex-dividend date may have passed, which are recorded as soon as the Funds are informed of the ex-dividend date. Non-cash dividends included in dividend income, if any, are recorded at the fair market value of the securities received. Income and capital gain distributions from Fidelity Central Funds, if any, are recorded on the ex-dividend date. Certain distributions received by the Funds represent a return of capital or capital gain. The Funds determine the components of these distributions subsequent to the ex-dividend date, based upon receipt of tax filings or other correspondence relating to the underlying investment. These distributions are recorded as a reduction of cost of investments and/or as a realized gain. Interest income is accrued as earned and includes coupon interest and amortization of premium and accretion of discount on debt securities as applicable. Investment income is recorded net of foreign taxes withheld where recovery of such taxes is uncertain.
Expenses. Expenses directly attributable to a fund are charged to that fund. Expenses attributable to more than one fund are allocated among the respective funds on the basis of relative net assets or other appropriate methods. Expense estimates are accrued in the period to which they relate and adjustments are made when actual amounts are known.
Income Tax Information and Distributions to Shareholders. Each year, each Fund intends to qualify as a regulated investment company under Subchapter M of the Internal Revenue Code, including distributing substantially all of its taxable income and realized gains. As a result, no provision for U.S. Federal income taxes is required. As of August 31, 2019, each Fund did not have any unrecognized tax benefits in the financial statements; nor is each Fund aware of any tax positions for which it is reasonably possible that the total amounts of unrecognized tax benefits will significantly change in the next twelve months. Each Fund files a U.S. federal tax return, in addition to state and local tax returns as required. Each Fund's federal income tax returns are subject to examination by the Internal Revenue Service (IRS) for a period of three fiscal years after they are filed. State and local tax returns may be subject to examination for an additional fiscal year depending on the jurisdiction. Foreign taxes are provided for based on each Fund's understanding of the tax rules and rates that exist in the foreign markets in which it invests.
Distributions are declared and recorded on the ex-dividend date. Income and capital gain distributions are determined in accordance with income tax regulations, which may differ from GAAP. These differences resulted in distribution reclassifications for Fidelity Large Cap Growth Enhanced Index Fund. In addition, the Funds claimed a portion of the payment made to redeeming shareholders as a distribution for income tax purposes.
Capital accounts within the financial statements are adjusted for permanent book-tax differences. These adjustments have no impact on net assets or the results of operations. Capital accounts are not adjusted for temporary book-tax differences which will reverse in a subsequent period.
Book-tax differences are primarily due to certain deemed distributions, futures contracts, foreign currency transactions, passive foreign investment companies (PFIC), market discount, partnerships, capital loss carryforwards and losses deferred due to wash sales and excise tax regulations.
As of period end, the cost and unrealized appreciation (depreciation) in securities, and derivatives if applicable, for federal income tax purposes were as follows for each Fund:
| Tax cost | Gross unrealized appreciation | Gross unrealized depreciation | Net unrealized appreciation (depreciation) | |
| Fidelity Large Cap Growth Enhanced Index Fund | $793,067,776 | $332,225,460 | $(17,561,255) | $314,664,205 |
| Fidelity Large Cap Value Enhanced Index Fund | 3,474,111,974 | 481,668,262 | (143,695,508) | 337,972,754 |
| Fidelity Large Cap Core Enhanced Index Fund | 676,204,006 | 188,484,145 | (23,315,159) | 165,168,986 |
| Fidelity Mid Cap Enhanced Index Fund | 1,181,226,186 | 162,660,045 | (71,123,338) | 91,536,707 |
| Fidelity International Enhanced Index Fund | 1,511,932,465 | 95,512,749 | (105,142,186) | (9,629,437) |
The tax-based components of distributable earnings as of period end were as follows for each Fund:
| Undistributed ordinary income | Undistributed long-term capital gain | Capital loss carryforward | Net unrealized appreciation (depreciation) on securities and other investments | |
| Fidelity Large Cap Growth Enhanced Index Fund | $6,567,362 | $18,018,738 | $– | $314,664,205 |
| Fidelity Large Cap Value Enhanced Index Fund | 55,499,309 | 33,653,294 | – | 337,972,754 |
| Fidelity Large Cap Core Enhanced Index Fund | 10,185,685 | 1,040,684 | – | 165,168,986 |
| Fidelity Mid Cap Enhanced Index Fund | 9,716,536 | 22,542,700 | – | 91,536,707 |
| Fidelity International Enhanced Index Fund | 38,295,582 | – | (151,436,632) | (9,676,546) |
Capital loss carryforwards are only available to offset future capital gains of the Funds to the extent provided by regulations and may be limited. Under the Regulated Investment Company Modernization Act of 2010 (the Act), the Funds are permitted to carry forward capital losses incurred in taxable years beginning after December 22, 2010 for an unlimited period and such capital losses are required to be used prior to any losses that expire. The capital loss carryforward information presented below, including any applicable limitation, is estimated as of fiscal period end and is subject to adjustment.
| No expiration | ||||
| Short-term | Long-term | Total no expiration | Total capital loss carryfoward | |
| Fidelity International Enhanced Index Fund | $(119,475,623) | $(31,961,009) | $(151,436,632) | $(151,436,632) |
The tax character of distributions paid was as follows:
| August 31, 2019 | |||
| Ordinary Income | Long-term Capital Gains | Total | |
| Fidelity Large Cap Growth Enhanced Index Fund | $20,441,146 | $54,420,537 | $74,861,683 |
| Fidelity Large Cap Value Enhanced Index Fund | 114,100,411 | 117,484,298 | 231,584,709 |
| Fidelity Large Cap Core Enhanced Index Fund | 18,063,528 | 32,574,393 | 50,637,921 |
| Fidelity Mid Cap Enhanced Index Fund | 24,110,443 | 76,639,461 | 100,749,904 |
| Fidelity International Enhanced Index Fund | 34,087,909 | – | 34,087,909 |
| August 31, 2018 | |||
| Ordinary Income | Long-term Capital Gains | Total | |
| Fidelity Large Cap Growth Enhanced Index Fund | $16,688,560 | $17,783,747 | $34,472,307 |
| Fidelity Large Cap Value Enhanced Index Fund | 79,726,187 | 59,296,349 | 139,022,536 |
| Fidelity Large Cap Core Enhanced Index Fund | 8,524,955 | 12,291,796 | 20,816,751 |
| Fidelity Mid Cap Enhanced Index Fund | 16,549,391 | 56,453,522 | 73,002,913 |
| Fidelity International Enhanced Index Fund | 15,145,025 | 186,597 | 15,331,622 |
Restricted Securities. The Funds may invest in securities that are subject to legal or contractual restrictions on resale. These securities generally may be resold in transactions exempt from registration or to the public if the securities are registered. Disposal of these securities may involve time-consuming negotiations and expense, and prompt sale at an acceptable price may be difficult. Information regarding restricted securities is included at the end of each applicable Fund's Schedule of Investments.
New Rule Issuance. During August 2018, the U.S. Securities and Exchange Commission issued Final Rule Release No. 33-10532, Disclosure Update and Simplification. This Final Rule includes amendments specific to registered investment companies that are intended to eliminate overlap in disclosure requirements between Regulation S-X and GAAP. In accordance with these amendments, certain line-items in the Funds' financial statements have been combined or removed for the current period as outlined in the table below.
| Financial Statement | Current Line-Item Presentation (As Applicable) | Prior Line-Item Presentation (As Applicable) |
| Statement of Assets and Liabilities | Total distributable earnings (loss) | Undistributed/Distributions in excess of/Accumulated net investment income (loss) Accumulated/Undistributed net realized gain (loss) Net unrealized appreciation (depreciation) |
| Statement of Changes in Net Assets | N/A - removed | Undistributed/Distributions in excess of/Accumulated net investment income (loss) end of period |
| Statement of Changes in Net Assets | Distributions to shareholders | Distributions to shareholders from net investment income Distributions to shareholders from net realized gain |
3. Derivative Instruments.
Risk Exposures and the Use of Derivative Instruments. The Funds' investment objective allows the Funds to enter into various types of derivative contracts, including futures contracts . Derivatives are investments whose value is primarily derived from underlying assets, indices or reference rates and may be transacted on an exchange or over-the-counter (OTC). Derivatives may involve a future commitment to buy or sell a specified asset based on specified terms, to exchange future cash flows at periodic intervals based on a notional principal amount, or for one party to make one or more payments upon the occurrence of specified events in exchange for periodic payments from the other party.
The Funds used derivatives to increase returns and to manage exposure to certain risks as defined below. The success of any strategy involving derivatives depends on analysis of numerous economic factors, and if the strategies for investment do not work as intended, the Funds may not achieve their objectives.
The Funds' use of derivatives increased or decreased their exposure to the following risk:
| Equity Risk | Equity risk relates to the fluctuations in the value of financial instruments as a result of changes in market prices (other than those arising from interest rate risk or foreign exchange risk), whether caused by factors specific to an individual investment, its issuer, or all factors affecting all instruments traded in a market or market segment. |
The Funds are also exposed to additional risks from investing in derivatives, such as liquidity risk and counterparty credit risk. Liquidity risk is the risk that the Funds will be unable to close out the derivative in the open market in a timely manner. Counterparty credit risk is the risk that the counterparty will not be able to fulfill its obligation to the Funds. Counterparty credit risk related to exchange-traded futures contracts may be mitigated by the protection provided by the exchange on which they trade.
Investing in derivatives may involve greater risks than investing in the underlying assets directly and, to varying degrees, may involve risk of loss in excess of any initial investment and collateral received and amounts recognized in the Statement of Assets and Liabilities. In addition, there may be the risk that the change in value of the derivative contract does not correspond to the change in value of the underlying instrument.
Futures Contracts. A futures contract is an agreement between two parties to buy or sell a specified underlying instrument for a fixed price at a specified future date. The Funds used futures contracts to manage their exposure to the stock market.
Upon entering into a futures contract, a fund is required to deposit either cash or securities (initial margin) with a clearing broker in an amount equal to a certain percentage of the face value of the contract. Futures contracts are marked-to-market daily and subsequent daily payments (variation margin) are made or received by a fund depending on the daily fluctuations in the value of the futures contracts and are recorded as unrealized appreciation or (depreciation). This receivable and/or payable, if any, is included in daily variation margin on futures contracts in the Statement of Assets and Liabilities. Realized gain or (loss) is recorded upon the expiration or closing of a futures contract. The net realized gain (loss) and change in net unrealized appreciation (depreciation) on futures contracts during the period is presented in the Statement of Operations.
Any open futures contracts at period end are presented in the Schedule of Investments under the caption "Futures Contracts". The notional amount at value reflects each contract's exposure to the underlying instrument or index at period end and is representative of volume of activity during the period for Fidelity International Enhanced Index Fund and Fidelity Mid Cap Enhanced Index Fund. Securities deposited to meet initial margin requirements are identified in the Schedule of Investments. Cash deposited to meet initial margin requirements is presented as segregated cash with brokers for derivative instruments in the Statement of Assets and Liabilities.
4. Purchases and Sales of Investments.
Purchases and sales of securities, other than short-term securities, are noted in the table below.
| Purchases ($) | Sales ($) | |
| Fidelity Large Cap Growth Enhanced Index Fund | 922,590,753 | 986,084,592 |
| Fidelity Large Cap Value Enhanced Index Fund | 3,435,514,862 | 3,535,130,944 |
| Fidelity Large Cap Core Enhanced Index Fund | 696,993,056 | 599,505,841 |
| Fidelity Mid Cap Enhanced Index Fund | 1,093,663,223 | 1,056,061,103 |
| Fidelity International Enhanced Index Fund | 1,572,698,823 | 1,607,459,874 |
5. Fees and Other Transactions with Affiliates.
Management Fee. Fidelity Management & Research Company (the investment adviser) and its affiliates provide the Funds with investment management related services for which the Funds pay a monthly management fee. Each Fund pays an all-inclusive management fee based on the annual rates noted in the following table; and the investment adviser pays all ordinary operating expenses of each Fund, except fees and expenses of the independent Trustees and certain miscellaneous expenses such as proxy and shareholder meeting expenses. The management fees are reduced by an amount equal to the fees and expenses paid by the Funds to the independent Trustees. During January 2019, the Board approved to change the investment adviser from FMR Co., Inc. to Fidelity Management & Research Company effective February 1, 2019. There was no change to the management fee.
| Fidelity Large Cap Growth Enhanced Index Fund | .39% |
| Fidelity Large Cap Value Enhanced Index Fund | .39% |
| Fidelity Large Cap Core Enhanced Index Fund | .39% |
| Fidelity Mid Cap Enhanced Index Fund | .59% |
| Fidelity International Enhanced Index Fund | .59% |
Sub-Adviser. Geode Capital Management, LLC (Geode), serves as sub-adviser for the Funds. Geode provides discretionary investment advisory services to the Funds and is paid by the investment adviser for providing these services.
Interfund Lending Program. Pursuant to an Exemptive Order issued by the SEC, the Funds, along with other registered investment companies having management contracts with Fidelity Management & Research Company (FMR) or other affiliated entities of FMR, may participate in an interfund lending program. This program provides an alternative credit facility allowing the funds to borrow from, or lend money to, other participating affiliated funds. At period end, there were no interfund loans outstanding. Each applicable fund's activity in this program during the period for which loans were outstanding was as follows:
| Borrower or Lender | Average Loan Balance | Weighted Average Interest Rate | Interest Expense | |
| Fidelity Large Cap Value Enhanced Index Fund | Borrower | $105,715,500 | 2.50% | $14,664 |
| Fidelity Mid Cap Enhanced Index Fund | Borrower | $18,805,000 | 2.67% | $1,394 |
| Fidelity International Enhanced Index Fund | Borrower | $8,152,846 | 2.57% | $15,146 |
Interfund Trades. The Funds may purchase from or sell securities to other Fidelity Funds under procedures adopted by the Board. The procedures have been designed to ensure these interfund trades are executed in accordance with Rule 17a-7 of the 1940 Act. Interfund trades are included within the respective purchases and sales amounts shown in the Purchases and Sales of Investments note.
6. Investments in Fidelity Central Funds.
The Funds invest in Fidelity Central Funds, which are open-end investment companies available only to other investment companies and accounts managed by the investment adviser and its affiliates. The Funds' Schedules of Investments list each of the Fidelity Central Funds held as of period end, if any, as an investment of each Fund, but do not include the underlying holdings of each Fidelity Central Fund. As an Investing Fund, each Fund indirectly bears its proportionate share of the expenses of the underlying Fidelity Central Funds.
The Fidelity Money Market Central Funds are managed by Fidelity Investments Money Management, Inc. (FIMM), an affiliate of the investment adviser. Annualized expenses of the Money Market Central Funds as of their most recent shareholder report date ranged from less than .005% to .01%.
A complete unaudited list of holdings for each Fidelity Central Fund is available upon request or at the Securities and Exchange Commission (the SEC) website at www.sec.gov. In addition, the financial statements of the Fidelity Central Funds, which are not covered by the Funds' Report of Independent Registered Public Accounting Firm, are available on the SEC website or upon request.
7. Committed Line of Credit.
Certain Funds participate with other funds managed by the investment adviser or an affiliate in a $4.25 billion credit facility (the "line of credit") to be utilized for temporary or emergency purposes to fund shareholder redemptions or for other short-term liquidity purposes. The participating funds have agreed to pay commitment fees on their pro-rata portion of the line of credit, which are reflected in Commitment fees on the Statement of Operations, and are as follows:
| Fidelity Large Cap Growth Enhanced Index Fund | $2,913 |
| Fidelity Large Cap Value Enhanced Index Fund | 9,902 |
| Fidelity Large Cap Core Enhanced Index Fund | 2,056 |
| Fidelity Mid Cap Enhanced Index Fund | 3,167 |
| Fidelity International Enhanced Index Fund | 4,227 |
During the period, the Funds did not borrow on this line of credit.
8. Security Lending.
Certain Funds lend portfolio securities from time to time in order to earn additional income. For equity securities, lending agents are used, including National Financial Services (NFS), an affiliate of the Funds. Pursuant to a securities lending agreement, NFS will receive a fee, which is capped at 9.9% of a Fund's daily lending revenue, for its services as lending agent. The Funds may lend securities to certain qualified borrowers, including NFS. On the settlement date of the loan, each applicable Fund receives collateral (in the form of U.S. Treasury obligations, letters of credit and/or cash) against the loaned securities and maintains collateral in an amount not less than 100% of the market value of the loaned securities during the period of the loan. The market value of the loaned securities is determined at the close of business of the Funds and any additional required collateral is delivered to the Funds on the next business day. The Funds or borrower may terminate the loan at any time, and if the borrower defaults on its obligation to return the securities loaned because of insolvency or other reasons, the Funds may apply collateral received from the borrower against the obligation. The Funds may experience delays and costs in recovering the securities loaned. Any cash collateral received is invested in the Fidelity Securities Lending Cash Central Fund. The value of loaned securities and cash collateral at period end are disclosed on each applicable Fund's Statement of Assets and Liabilities. At period end, there were no security loans outstanding with NFS, as affiliated borrower. Security lending income represents the income earned on investing cash collateral, less rebates paid to borrowers and any lending agent fees associated with the loan, plus any premium payments received for lending certain types of securities. Security lending income is presented on each applicable Fund's Statement of Operations as a component of income from Fidelity Central Funds. Affiliated security lending activity was as follows:
| Total Security Lending Income Fees Paid to NFS | Security Lending Income From Securities Loaned to NFS | |
| Fidelity Large Cap Growth Enhanced Index Fund | $14 | $– |
| Fidelity Large Cap Value Enhanced Index Fund | $451 | $3 |
| Fidelity Large Cap Core Enhanced Index Fund | $13 | $– |
| Fidelity Mid Cap Enhanced Index Fund | $84 | $– |
| Fidelity International Enhanced Index Fund | $47 | $– |
9. Bank Borrowings.
Each Fund is permitted to have bank borrowings for temporary or emergency purposes to fund shareholder redemptions or for other short-term liquidity requirements. Each Fund has established borrowing arrangements with certain banks. The interest rate on the borrowings is the bank's base rate, as revised from time to time. At period end, there were no bank borrowings outstanding. Each applicable Fund's activity in this program during the period for which loans were outstanding was as follows:
| Average Loan Balance | Weighted Average Interest Rate | Interest Expense | |
| Fidelity International Enhanced Index Fund | $8,478,000 | 2.90% | $1,366 |
10. Expense Reductions.
Through arrangements with each applicable Fund's custodian, credits realized as a result of certain uninvested cash balances were used to reduce each applicable Fund's expenses. All of the applicable expense reductions are noted in the table below.
| Expense reduction | |
| Fidelity Large Cap Growth Enhanced Index Fund | $715 |
| Fidelity Large Cap Value Enhanced Index Fund | 1,934 |
| Fidelity Large Cap Core Enhanced Index Fund | 546 |
| Fidelity Mid Cap Enhanced Index Fund | 187 |
| Fidelity International Enhanced Index Fund | 46 |
11. Other.
The Funds' organizational documents provide former and current trustees and officers with a limited indemnification against liabilities arising in connection with the performance of their duties to the Funds. In the normal course of business, the Funds may also enter into contracts that provide general indemnifications. The Funds' maximum exposure under these arrangements is unknown as this would be dependent on future claims that may be made against the Funds. The risk of material loss from such claims is considered remote.
At the end of the period, Strategic Advisers Fidelity U.S. Total Stock Fund was the owner of record of approximately 46% of the total outstanding shares of Fidelity Large Cap Value Enhanced Index Fund.
Report of Independent Registered Public Accounting Firm
To the Board of Trustees of Fidelity Commonwealth Trust II and the Shareholders of Fidelity Large Cap Growth Enhanced Index Fund, Fidelity Large Cap Value Enhanced Index Fund, Fidelity Large Cap Core Enhanced Index Fund, Fidelity Mid Cap Enhanced Index Fund and Fidelity International Enhanced Index Fund:
Opinions on the Financial Statements
We have audited the accompanying statements of assets and liabilities, including the schedules of investments, of Fidelity Large Cap Growth Enhanced Index Fund, Fidelity Large Cap Value Enhanced Index Fund, Fidelity Large Cap Core Enhanced Index Fund, Fidelity Mid Cap Enhanced Index Fund and Fidelity International Enhanced Index Fund (five of the funds constituting Fidelity Commonwealth Trust II, hereafter collectively referred to as the “Funds”) as of August 31, 2019, the related statements of operations for the year ended August 31, 2019, the statements of changes in net assets for each of the two years in the period ended August 31, 2019, including the related notes, and the financial highlights periods indicated therein (collectively referred to as the “financial statements”). In our opinion, the financial statements present fairly, in all material respects, the financial position of each of the Funds as of August 31, 2019, the results of each of their operations for the year then ended, the changes in each of their net assets for each of the two years in the period ended August 31, 2019 and the financial highlights for each of the periods indicated therein in conformity with accounting principles generally accepted in the United States of America.
Basis for Opinions
These financial statements are the responsibility of the Funds’ management. Our responsibility is to express an opinion on the Funds’ financial statements based on our audits. We are a public accounting firm registered with the Public Company Accounting Oversight Board (United States) (PCAOB) and are required to be independent with respect to the Fund in accordance with the U.S. federal securities laws and the applicable rules and regulations of the Securities and Exchange Commission and the PCAOB.
We conducted our audits of these financial statements in accordance with the standards of the PCAOB. Those standards require that we plan and perform the audit to obtain reasonable assurance about whether the financial statements are free of material misstatement, whether due to error or fraud.
Our audits included performing procedures to assess the risks of material misstatement of the financial statements, whether due to error or fraud, and performing procedures that respond to those risks. Such procedures included examining, on a test basis, evidence regarding the amounts and disclosures in the financial statements. Our audits also included evaluating the accounting principles used and significant estimates made by management, as well as evaluating the overall presentation of the financial statements. Our procedures included confirmation of securities owned as of August 31, 2019 by correspondence with the custodian and brokers; when replies were not received from brokers, we performed other auditing procedures. We believe that our audits provide a reasonable basis for our opinions.
PricewaterhouseCoopers LLP
Boston, Massachusetts
October 17, 2019
We have served as the auditor of one or more investment companies in the Fidelity group of funds since 1932.
Trustees and Officers
The Trustees, Members of the Advisory Board (if any), and officers of the trust and funds, as applicable, are listed below. The Board of Trustees governs each fund and is responsible for protecting the interests of shareholders. The Trustees are experienced executives who meet periodically throughout the year to oversee each fund's activities, review contractual arrangements with companies that provide services to each fund, oversee management of the risks associated with such activities and contractual arrangements, and review each fund's performance. Except for Michael E. Wiley each of the Trustees oversees 298 funds. Mr. Wiley oversees 197 funds.
The Trustees hold office without limit in time except that (a) any Trustee may resign; (b) any Trustee may be removed by written instrument, signed by at least two-thirds of the number of Trustees prior to such removal; (c) any Trustee who requests to be retired or who has become incapacitated by illness or injury may be retired by written instrument signed by a majority of the other Trustees; and (d) any Trustee may be removed at any special meeting of shareholders by a two-thirds vote of the outstanding voting securities of the trust. Each Trustee who is not an interested person (as defined in the 1940 Act) of the trust and the funds is referred to herein as an Independent Trustee. Each Independent Trustee shall retire not later than the last day of the calendar year in which his or her 75th birthday occurs. The Independent Trustees may waive this mandatory retirement age policy with respect to individual Trustees. Officers and Advisory Board Members hold office without limit in time, except that any officer or Advisory Board Member may resign or may be removed by a vote of a majority of the Trustees at any regular meeting or any special meeting of the Trustees. Except as indicated, each individual has held the office shown or other offices in the same company for the past five years.
Each fund’s Statement of Additional Information (SAI) includes more information about the Trustees. To request a free copy, call Fidelity at 1-800-544-8544.
Experience, Skills, Attributes, and Qualifications of the Trustees. The Governance and Nominating Committee has adopted a statement of policy that describes the experience, qualifications, attributes, and skills that are necessary and desirable for potential Independent Trustee candidates (Statement of Policy). The Board believes that each Trustee satisfied at the time he or she was initially elected or appointed a Trustee, and continues to satisfy, the standards contemplated by the Statement of Policy. The Governance and Nominating Committee also engages professional search firms to help identify potential Independent Trustee candidates who have the experience, qualifications, attributes, and skills consistent with the Statement of Policy. From time to time, additional criteria based on the composition and skills of the current Independent Trustees, as well as experience or skills that may be appropriate in light of future changes to board composition, business conditions, and regulatory or other developments, have also been considered by the professional search firms and the Governance and Nominating Committee. In addition, the Board takes into account the Trustees' commitment and participation in Board and committee meetings, as well as their leadership of standing and ad hoc committees throughout their tenure.
In determining that a particular Trustee was and continues to be qualified to serve as a Trustee, the Board has considered a variety of criteria, none of which, in isolation, was controlling. The Board believes that, collectively, the Trustees have balanced and diverse experience, qualifications, attributes, and skills, which allow the Board to operate effectively in governing each fund and protecting the interests of shareholders. Information about the specific experience, skills, attributes, and qualifications of each Trustee, which in each case led to the Board's conclusion that the Trustee should serve (or continue to serve) as a trustee of the funds, is provided below.
Board Structure and Oversight Function. James C. Curvey is an interested person and currently serves as Chairman. The Trustees have determined that an interested Chairman is appropriate and benefits shareholders because an interested Chairman has a personal and professional stake in the quality and continuity of services provided to the funds. Independent Trustees exercise their informed business judgment to appoint an individual of their choosing to serve as Chairman, regardless of whether the Trustee happens to be independent or a member of management. The Independent Trustees have determined that they can act independently and effectively without having an Independent Trustee serve as Chairman and that a key structural component for assuring that they are in a position to do so is for the Independent Trustees to constitute a substantial majority for the Board. The Independent Trustees also regularly meet in executive session. Ned C. Lautenbach serves as Chairman of the Independent Trustees and as such (i) acts as a liaison between the Independent Trustees and management with respect to matters important to the Independent Trustees and (ii) with management prepares agendas for Board meetings.
Fidelity® funds are overseen by different Boards of Trustees. The funds' Board oversees Fidelity's high income and certain equity funds, and other Boards oversee Fidelity's investment-grade bond, money market, asset allocation, and other equity funds. The asset allocation funds may invest in Fidelity® funds overseen by the funds' Board. The use of separate Boards, each with its own committee structure, allows the Trustees of each group of Fidelity® funds to focus on the unique issues of the funds they oversee, including common research, investment, and operational issues. On occasion, the separate Boards establish joint committees to address issues of overlapping consequences for the Fidelity® funds overseen by each Board.
The Trustees operate using a system of committees to facilitate the timely and efficient consideration of all matters of importance to the Trustees, each fund, and fund shareholders and to facilitate compliance with legal and regulatory requirements and oversight of the funds' activities and associated risks. The Board, acting through its committees, has charged FMR and its affiliates with (i) identifying events or circumstances the occurrence of which could have demonstrably adverse effects on the funds' business and/or reputation; (ii) implementing processes and controls to lessen the possibility that such events or circumstances occur or to mitigate the effects of such events or circumstances if they do occur; and (iii) creating and maintaining a system designed to evaluate continuously business and market conditions in order to facilitate the identification and implementation processes described in (i) and (ii) above. Because the day-to-day operations and activities of the funds are carried out by or through FMR, its affiliates, and other service providers, the funds' exposure to risks is mitigated but not eliminated by the processes overseen by the Trustees. While each of the Board's committees has responsibility for overseeing different aspects of the funds' activities, oversight is exercised primarily through the Operations, Audit, and Compliance Committees. Appropriate personnel, including but not limited to the funds' Chief Compliance Officer (CCO), FMR's internal auditor, the independent accountants, the funds' Treasurer and portfolio management personnel, make periodic reports to the Board's committees, as appropriate, including an annual review of Fidelity's risk management program for the Fidelity® funds. The responsibilities of each standing committee, including their oversight responsibilities, are described further under "Standing Committees of the Trustees."
Interested Trustees*:
Correspondence intended for a Trustee who is an interested person may be sent to Fidelity Investments, 245 Summer Street, Boston, Massachusetts 02210.
Name, Year of Birth; Principal Occupations and Other Relevant Experience+
James C. Curvey (1935)
Year of Election or Appointment: 2018
Trustee
Chairman of the Board of Trustees
Mr. Curvey also serves as Trustee of other Fidelity® funds. Mr. Curvey is Vice Chairman (2007-present) and Director of FMR LLC (diversified financial services company). In addition, Mr. Curvey is an Overseer Emeritus for the Boston Symphony Orchestra, a Director of Artis-Naples, and a Trustee of Brewster Academy in Wolfeboro, New Hampshire. Previously, Mr. Curvey served as a Director of Fidelity Research & Analysis Co. (investment adviser firm, 2009-2018), Director of Fidelity Investments Money Management, Inc. (investment adviser firm, 2009-2014) and a Director of FMR and FMR Co., Inc. (investment adviser firms, 2007-2014).
* Determined to be an “Interested Trustee” by virtue of, among other things, his or her affiliation with the trust or various entities under common control with FMR.
+ The information includes the Trustee's principal occupation during the last five years and other information relating to the experience, attributes, and skills relevant to the Trustee's qualifications to serve as a Trustee, which led to the conclusion that the Trustee should serve as a Trustee for each fund.
Independent Trustees:
Correspondence intended for an Independent Trustee may be sent to Fidelity Investments, P.O. Box 55235, Boston, Massachusetts 02205-5235.
Name, Year of Birth; Principal Occupations and Other Relevant Experience+
Dennis J. Dirks (1948)
Year of Election or Appointment: 2018
Trustee
Mr. Dirks also serves as Trustee of other Fidelity® funds. Prior to his retirement in May 2003, Mr. Dirks was Chief Operating Officer and a member of the Board of The Depository Trust & Clearing Corporation (DTCC). He also served as President, Chief Operating Officer, and Board member of The Depository Trust Company (DTC) and President and Board member of the National Securities Clearing Corporation (NSCC). In addition, Mr. Dirks served as Chief Executive Officer and Board member of the Government Securities Clearing Corporation, Chief Executive Officer and Board member of the Mortgage-Backed Securities Clearing Corporation, as a Trustee and a member of the Finance Committee of Manhattan College (2005-2008), as a Trustee and a member of the Finance Committee of AHRC of Nassau County (2006-2008), as a member of the Independent Directors Council (IDC) Governing Council (2010-2015), and as a member of the Board of Directors for The Brookville Center for Children’s Services, Inc. (2009-2017). Mr. Dirks is a member of the Finance Committee (2016-present) and Board of Directors (2017-present) and is Treasurer (2018-present) of the Asolo Repertory Theatre.
Donald F. Donahue (1950)
Year of Election or Appointment: 2017
Trustee
Mr. Donahue also serves as a Trustee of other Fidelity® funds. Mr. Donahue is President and Chief Executive Officer of Miranda Partners, LLC (risk consulting for the financial services industry, 2012-present). Previously, Mr. Donahue served as a Member of the Advisory Board of certain Fidelity® funds (2015-2018) and Chief Executive Officer (2006-2012), Chief Operating Officer (2003-2006), and Managing Director, Customer Marketing and Development (1999-2003) of The Depository Trust & Clearing Corporation (financial markets infrastructure). Mr. Donahue serves as a Member (2007-present) and Co-Chairman (2016-present) of the Board of Directors of United Way of New York, Member of the Board of Directors of NYC Leadership Academy (2012-present) and Member of the Board of Advisors of Ripple Labs, Inc. (financial services, 2015-present). He also served as Chairman (2010-2012) and Member of the Board of Directors (2012-2013) of Omgeo, LLC (financial services), Treasurer of United Way of New York (2012-2016), and Member of the Board of Directors of XBRL US (financial services non-profit, 2009-2012) and the International Securities Services Association (2009-2012).
Alan J. Lacy (1953)
Year of Election or Appointment: 2018
Trustee
Mr. Lacy also serves as Trustee of other Fidelity® funds. Mr. Lacy serves as a Director of Bristol-Myers Squibb Company (global pharmaceuticals, 2008-present). He is a Trustee of the California Chapter of The Nature Conservancy (2015-present) and a Director of the Center for Advanced Study in the Behavioral Sciences at Stanford University (2015-present). In addition, Mr. Lacy served as Senior Adviser (2007-2014) of Oak Hill Capital Partners, L.P. (private equity) and also served as Chief Executive Officer (2005) and Vice Chairman (2005-2006) of Sears Holdings Corporation (retail) and Chief Executive Officer and Chairman of the Board of Sears, Roebuck and Co. (retail, 2000-2005). Previously, Mr. Lacy served as Chairman (2014-2017) and a member (2010-2017) of the Board of Directors of Dave & Buster’s Entertainment, Inc. (restaurant and entertainment complexes), as Chairman (2008-2011) and a member (2006-2015) of the Board of Trustees of the National Parks Conservation Association, and as a member of the Board of Directors for The Hillman Companies, Inc. (hardware wholesalers, 2010-2014), Earth Fare, Inc. (retail grocery, 2010-2014), and The Western Union Company (global money transfer, 2006-2011).
Ned C. Lautenbach (1944)
Year of Election or Appointment: 2018
Trustee
Chairman of the Independent Trustees
Mr. Lautenbach also serves as Trustee of other Fidelity® funds. Mr. Lautenbach currently serves as Chair (2018-present) and Member (2013-present) of the Board of Governors, State University System of Florida and is a member of the Council on Foreign Relations (1994-present). He is also a member and has most recently served as Chairman of the Board of Directors of Artis-Naples (2012-present). Previously, Mr. Lautenbach served as a member and then Lead Director of the Board of Directors of Eaton Corporation (diversified industrial, 1997-2016). He was also a Partner and Advisory Partner at Clayton, Dubilier & Rice, LLC (private equity investment, 1998-2010), as well as a Director of Sony Corporation (2006-2007). In addition, Mr. Lautenbach also had a 30-year career with IBM (technology company) during which time he served as Senior Vice President and a member of the Corporate Executive Committee (1968-1998).
Joseph Mauriello (1944)
Year of Election or Appointment: 2018
Trustee
Mr. Mauriello also serves as Trustee of other Fidelity® funds. Prior to his retirement in January 2006, Mr. Mauriello served in numerous senior management positions including Deputy Chairman and Chief Operating Officer (2004-2005), and Vice Chairman of Financial Services (2002-2004) of KPMG LLP US (professional services, 1965-2005). Mr. Mauriello currently serves as a member of the Independent Directors Council (IDC) Governing Council (2015-present). Previously, Mr. Mauriello served as a member of the Board of Directors of XL Group plc. (global insurance and re-insurance, 2006-2018).
Cornelia M. Small (1944)
Year of Election or Appointment: 2018
Trustee
Ms. Small also serves as Trustee of other Fidelity® funds. Ms. Small is a member of the Board of Directors (2009-present) and Chair of the Investment Committee (2010-present) of the Teagle Foundation. Ms. Small also serves on the Investment Committee of the Berkshire Taconic Community Foundation (2008-present). Previously, Ms. Small served as Chairperson (2002-2008) and a member of the Investment Committee and Chairperson (2008-2012) and a member of the Board of Trustees of Smith College. In addition, Ms. Small served as Chief Investment Officer, Director of Global Equity Investments, and a member of the Board of Directors of Scudder, Stevens & Clark and Scudder Kemper Investments.
Garnett A. Smith (1947)
Year of Election or Appointment: 2017
Trustee
Mr. Smith also serves as Trustee of other Fidelity® funds. Prior to Mr. Smith's retirement, he served as Chairman and Chief Executive Officer of Inbrand Corp. (manufacturer of personal absorbent products, 1990-1997). He also served as President (1986-1990) of Inbrand Corp. Prior to his employment with Inbrand Corp., he was employed by a retail fabric chain and North Carolina National Bank. In addition, Mr. Smith served as a Member of the Advisory Board of certain Fidelity® funds (2012-2013) and as a board member of the Jackson Hole Land Trust (2009-2012).
David M. Thomas (1949)
Year of Election or Appointment: 2018
Trustee
Mr. Thomas also serves as Trustee of other Fidelity® funds. Mr. Thomas serves as Non-Executive Chairman of the Board of Directors of Fortune Brands Home and Security (home and security products, 2011-present) and as a member of the Board of Directors (2004-present) and Presiding Director (2013-present) of Interpublic Group of Companies, Inc. (marketing communication). Previously, Mr. Thomas served as Executive Chairman (2005-2006) and Chairman and Chief Executive Officer (2000-2005) of IMS Health, Inc. (pharmaceutical and healthcare information solutions), a Director of Fortune Brands, Inc. (consumer products, 2000-2011), and a member of the Board of Trustees of the University of Florida (2013-2018).
Michael E. Wiley (1950)
Year of Election or Appointment: 2017
Trustee
Mr. Wiley also serves as Trustee or Member of the Advisory Board of other Fidelity® funds. Mr. Wiley serves as a Director of High Point Resources (exploration and production, 2005-present). Previously, Mr. Wiley served as a Director of Andeavor Corporation (independent oil refiner and marketer, 2005-2018), a Director of Andeavor Logistics LP (natural resources logistics, 2015-2018), a Director of Post Oak Bank (privately-held bank, 2004-2018), a Director of Asia Pacific Exploration Consolidated (international oil and gas exploration and production, 2008-2013), a member of the Board of Trustees of the University of Tulsa (2000-2006; 2007-2010), a Senior Energy Advisor of Katzenbach Partners, LLC (consulting, 2006-2007), an Advisory Director of Riverstone Holdings (private investment), a Director of Spinnaker Exploration Company (exploration and production, 2001-2005) and Chairman, President, and CEO of Baker Hughes, Inc. (oilfield services, 2000-2004).
+ The information includes the Trustee's principal occupation during the last five years and other information relating to the experience, attributes, and skills relevant to the Trustee's qualifications to serve as a Trustee, which led to the conclusion that the Trustee should serve as a Trustee for each fund.
Advisory Board Members and Officers:
Correspondence intended for a Member of the Advisory Board (if any) may be sent to Fidelity Investments, P.O. Box 55235, Boston, Massachusetts 02205-5235. Correspondence intended for an officer or Peter S. Lynch may be sent to Fidelity Investments, 245 Summer Street, Boston, Massachusetts 02210. Officers appear below in alphabetical order.
Name, Year of Birth; Principal Occupation
Vicki L. Fuller (1957)
Year of Election or Appointment: 2018
Member of the Advisory Board
Ms. Fuller also serves as Member of the Advisory Board of other Fidelity® funds. Ms. Fuller serves as a member of the Board of Directors, Audit Committee, and Nominating and Governance Committee of The Williams Companies, Inc. (natural gas infrastructure, 2018-present). Previously, Ms. Fuller served as the Chief Investment Officer of the New York State Common Retirement Fund (2012-2018) and held a variety of positions at AllianceBernstein L.P. (global asset management, 1985-2012), including Managing Director (2006-2012) and Senior Vice President and Senior Portfolio Manager (2001-2006).
Peter S. Lynch (1944)
Year of Election or Appointment: 2018
Member of the Advisory Board
Mr. Lynch also serves as Member of the Advisory Board of other Fidelity® funds. Mr. Lynch is Vice Chairman and a Director of FMR (investment adviser firm) and FMR Co., Inc. (investment adviser firm). In addition, Mr. Lynch serves as a Trustee of Boston College and as the Chairman of the Inner-City Scholarship Fund. Previously, Mr. Lynch served on the Special Olympics International Board of Directors (1997-2006).
Elizabeth Paige Baumann (1968)
Year of Election or Appointment: 2017
Anti-Money Laundering (AML) Officer
Ms. Baumann also serves as AML Officer of other funds. She is Chief AML Officer (2012-present) and Senior Vice President (2014-present) of FMR LLC (diversified financial services company) and is an employee of Fidelity Investments. Previously, Ms. Baumann served as AML Officer of the funds (2012-2016), and Vice President (2007-2014) and Deputy Anti-Money Laundering Officer (2007-2012) of FMR LLC.
Craig S. Brown (1977)
Year of Election or Appointment: 2019
Assistant Treasurer
Mr. Brown also serves as Assistant Treasurer of other funds. Mr. Brown is an employee of Fidelity Investments (2013-present).
John J. Burke III (1964)
Year of Election or Appointment: 2018
Chief Financial Officer
Mr. Burke also serves as Chief Financial Officer of other funds. Mr. Burke serves as Head of Investment Operations for Fidelity Fund and Investment Operations (2018-present) and is an employee of Fidelity Investments (1998-present). Previously Mr. Burke served as head of Asset Management Investment Operations (2012-2018).
William C. Coffey (1969)
Year of Election or Appointment: 2019
Assistant Secretary
Mr. Coffey also serves as Assistant Secretary of other funds. He is Senior Vice President and Deputy General Counsel of FMR LLC (diversified financial services company, 2010-present), and is an employee of Fidelity Investments. Previously, Mr. Coffey served as Secretary and CLO of certain funds (2018-2019); CLO, Secretary, and Senior Vice President of Fidelity Management & Research Company and FMR Co., Inc. (investment adviser firms, 2018-2019); Secretary of Fidelity SelectCo, LLC and Fidelity Investments Money Management, Inc. (investment adviser firms, 2018-2019); CLO of Fidelity Management & Research (Hong Kong) Limited, FMR Investment Management (UK) Limited, and Fidelity Management & Research (Japan) Limited (investment adviser firms, 2018-2019); and Assistant Secretary of certain funds (2009-2018).
Timothy M. Cohen (1969)
Year of Election or Appointment: 2018
Vice President
Mr. Cohen also serves as Vice President of other funds. Mr. Cohen serves as Executive Vice President of Fidelity SelectCo, LLC (2019-present), Co-Head of Equity (2018-present), a Director of Fidelity Management & Research (Japan) Limited (investment adviser firm, 2016-present), and is an employee of Fidelity Investments. Previously, Mr. Cohen served as Head of Global Equity Research (2016-2018), Chief Investment Officer - Equity and a Director of Fidelity Management & Research (U.K.) Inc. (investment adviser firm, 2013-2015) and as a Director of Fidelity Management & Research (Hong Kong) Limited (investment adviser firm, 2017).
Jonathan Davis (1968)
Year of Election or Appointment: 2017
Assistant Treasurer
Mr. Davis also serves as Assistant Treasurer of other funds. Mr. Davis serves as Assistant Treasurer of FMR Capital, Inc. (2017-present) and is an employee of Fidelity Investments. Previously, Mr. Davis served as Vice President and Associate General Counsel of FMR LLC (diversified financial services company, 2003-2010).
Adrien E. Deberghes (1967)
Year of Election or Appointment: 2018
Assistant Treasurer
Mr. Deberghes also serves as an officer of other funds. He serves as Assistant Treasurer of FMR Capital, Inc. (2017-present), Executive Vice President of Fidelity Investments Money Management, Inc. (FIMM) (investment adviser firm, 2016-present), and is an employee of Fidelity Investments (2008-present). Previously, Mr. Deberghes served as President and Treasurer of certain Fidelity® funds (2013-2018). Prior to joining Fidelity Investments, Mr. Deberghes was Senior Vice President of Mutual Fund Administration at State Street Corporation (2007-2008), Senior Director of Mutual Fund Administration at Investors Bank & Trust (2005-2007), and Director of Finance for Dunkin' Brands (2000-2005). Previously, Mr. Deberghes served in other fund officer roles.
Laura M. Del Prato (1964)
Year of Election or Appointment: 2018
Assistant Treasurer
Ms. Del Prato also serves as an officer of other funds. Ms. Del Prato is an employee of Fidelity Investments (2017-present). Prior to joining Fidelity Investments, Ms. Del Prato served as a Managing Director and Treasurer of the JPMorgan Mutual Funds (2014-2017). Prior to JPMorgan, Ms. Del Prato served as a partner at Cohen Fund Audit Services (accounting firm, 2012-2013) and KPMG LLP (accounting firm, 2004-2012).
Colm A. Hogan (1973)
Year of Election or Appointment: 2018
Deputy Treasurer
Mr. Hogan also serves as an officer of other funds. Mr. Hogan serves as Assistant Treasurer of FMR Capital, Inc. (2017-present) and is an employee of Fidelity Investments (2005-present). Previously, Mr. Hogan served as Assistant Treasurer of certain Fidelity® funds (2016-2018).
Pamela R. Holding (1964)
Year of Election or Appointment: 2018
Vice President
Ms. Holding also serves as Vice President of other funds. Ms. Holding serves as Executive Vice President of Fidelity SelectCo, LLC (2019-present), Co-Head of Equity (2018-present) and is an employee of Fidelity Investments (2013-present). Previously, Ms. Holding served as Chief Investment Officer of Fidelity Institutional Asset Management (2013-2018).
Cynthia Lo Bessette (1969)
Year of Election or Appointment: 2019
Secretary and Chief Legal Officer (CLO)
Ms. Lo Bessette also serves as Secretary and CLO of other funds. She is a Senior Vice President and Deputy General Counsel of FMR LLC (diversified financial services company, 2019-present), and is an employee of Fidelity Investments. Previously, Ms. Lo Bessette served as Executive Vice President, General Counsel (2016-2019) and Senior Vice President, Deputy General Counsel (2015-2016) of OppenheimerFunds (investment management company) and Deputy Chief Legal Officer (2013-2015) of Jennison Associates LLC (investment adviser firm).
Chris Maher (1972)
Year of Election or Appointment: 2017
Assistant Treasurer
Mr. Maher serves as Assistant Treasurer of other funds. Mr. Maher is Vice President of Valuation Oversight, serves as Assistant Treasurer of FMR Capital, Inc. (2017-present), and is an employee of Fidelity Investments. Previously, Mr. Maher served as Vice President of Asset Management Compliance (2013), Vice President of the Program Management Group of FMR (investment adviser firm, 2010-2013), and Vice President of Valuation Oversight (2008-2010).
Kenneth B. Robins (1969)
Year of Election or Appointment: 2018
Chief Compliance Officer
Mr. Robins also serves as an officer of other funds. Mr. Robins serves as Compliance Officer of Fidelity Management & Research Company and FMR Co., Inc. (investment adviser firms, 2016-present) and is an employee of Fidelity Investments (2004-present). Previously, Mr. Robins served as Executive Vice President of Fidelity Investments Money Management, Inc. (investment adviser firm, 2013-2016) and served in other fund officer roles.
Stacie M. Smith (1974)
Year of Election or Appointment: 2018
President and Treasurer
Ms. Smith also serves as an officer of other funds. Ms. Smith serves as Assistant Treasurer of FMR Capital, Inc. (2017-present), is an employee of Fidelity Investments (2009-present), and has served in other fund officer roles. Prior to joining Fidelity Investments, Ms. Smith served as Senior Audit Manager of Ernst & Young LLP (accounting firm, 1996-2009). Previously, Ms. Smith served as Assistant Treasurer (2013-2018) and Deputy Treasurer (2013-2016) of certain Fidelity® funds.
Marc L. Spector (1972)
Year of Election or Appointment: 2017
Assistant Treasurer
Mr. Spector also serves as an officer of other funds. Mr. Spector serves as Assistant Treasurer of FMR Capital, Inc. (2017-present) and is an employee of Fidelity Investments (2016-present). Prior to joining Fidelity Investments, Mr. Spector served as Director at the Siegfried Group (accounting firm, 2013-2016), and prior to Siegfried Group as audit senior manager at Deloitte & Touche (accounting firm, 2005-2013).
Jim Wegmann (1979)
Year of Election or Appointment: 2019
Assistant Treasurer
Mr. Wegmann also serves as Assistant Treasurer of other funds. Mr. Wegmann is an employee of Fidelity Investments (2011-present).
Shareholder Expense Example
As a shareholder of a Fund, you incur two types of costs: (1) transaction costs, and (2) ongoing costs, including management fees and other Fund expenses. This Example is intended to help you understand your ongoing costs (in dollars) of investing in the Funds and to compare these costs with the ongoing costs of investing in other mutual funds.
The Example is based on an investment of $1,000 invested at the beginning of the period and held for the entire period (March 1, 2019 to August 31, 2019).
Actual Expenses
The first line of the accompanying table for each fund provides information about actual account values and actual expenses. You may use the information in this line, together with the amount you invested, to estimate the expenses that you paid over the period. Simply divide your account value by $1,000.00 (for example, an $8,600 account value divided by $1,000.00 = 8.6), then multiply the result by the number in the first line for a fund under the heading entitled "Expenses Paid During Period" to estimate the expenses you paid on your account during this period. In addition, each Fund, as a shareholder in the underlying Fidelity Central Funds, will indirectly bear its pro-rata share of the fees and expenses incurred by the underlying Fidelity Central Funds. These fees and expenses are not included in the Fund's annualized expense ratio used to calculate the expense estimate in the table below.
Hypothetical Example for Comparison Purposes
The second line of the accompanying table for each fund provides information about hypothetical account values and hypothetical expenses based on a fund's actual expense ratio and an assumed rate of return of 5% per year before expenses, which is not the Fund's actual return. The hypothetical account values and expenses may not be used to estimate the actual ending account balance or expenses you paid for the period. You may use this information to compare the ongoing costs of investing in the Fund and other funds. To do so, compare this 5% hypothetical example with the 5% hypothetical examples that appear in the shareholder reports of the other funds. In addition, each Fund, as a shareholder in the underlying Fidelity Central Funds, will indirectly bear its pro-rata share of the fees and expenses incurred by the underlying Fidelity Central Funds. These fees and expenses are not included in the Fund's annualized expense ratio used to calculate the expense estimate in the table below.
Please note that the expenses shown in the table are meant to highlight your ongoing costs only and do not reflect any transaction costs. Therefore, the second line of the table is useful in comparing ongoing costs only, and will not help you determine the relative total costs of owning different funds.
| Annualized Expense Ratio-A | Beginning Account Value March 1, 2019 | Ending Account Value August 31, 2019 | Expenses Paid During Period-B March 1, 2019 to August 31, 2019 | |
| Fidelity Large Cap Growth Enhanced Index Fund | .39% | |||
| Actual | $1,000.00 | $1,068.10 | $2.03 | |
| Hypothetical-C | $1,000.00 | $1,023.24 | $1.99 | |
| Fidelity Large Cap Value Enhanced Index Fund | .39% | |||
| Actual | $1,000.00 | $1,013.40 | $1.98 | |
| Hypothetical-C | $1,000.00 | $1,023.24 | $1.99 | |
| Fidelity Large Cap Core Enhanced Index Fund | .39% | |||
| Actual | $1,000.00 | $1,039.60 | $2.00 | |
| Hypothetical-C | $1,000.00 | $1,023.24 | $1.99 | |
| Fidelity Mid Cap Enhanced Index Fund | .59% | |||
| Actual | $1,000.00 | $1,010.40 | $2.99 | |
| Hypothetical-C | $1,000.00 | $1,022.23 | $3.01 | |
| Fidelity International Enhanced Index Fund | .59% | |||
| Actual | $1,000.00 | $974.00 | $2.94 | |
| Hypothetical-C | $1,000.00 | $1,022.23 | $3.01 |
A Annualized expense ratio reflects expenses net of applicable fee waivers.
B Expenses are equal to each Fund's annualized expense ratio, multiplied by the average account value over the period, multiplied by 184/ 365 (to reflect the one-half year period).
C 5% return per year before expenses
Distributions (Unaudited)
The funds hereby designate as capital gain dividend the amounts noted below for the taxable year ended August 31, 2019, or, if subsequently determined to be different, the net capital gain of such year.
| Fidelity Large Cap Growth Enhanced Index Fund | $26,098,115 |
| Fidelity Large Cap Value Enhanced Index Fund | $52,700,333 |
| Fidelity Large Cap Core Enhanced Index Fund | $1,082,294 |
| Fidelity Mid Cap Enhanced Index Fund | $27,034,589 |
| Fidelity International Enhanced Index Fund | $0 |
A percentage of the dividends distributed during the fiscal year for the following funds qualify for the dividends–received deduction for corporate shareholders:
| Fidelity Large Cap Growth Enhanced Index Fund | |
| December 7, 2018 | 73% |
| Fidelity Large Cap Value Enhanced Index Fund | |
| December 7, 2018 | 77% |
| December 28, 2018 | 96% |
| Fidelity Large Cap Core Enhanced Index Fund | |
| December 7, 2018 | 74% |
| Fidelity Mid Cap Enhanced Index Fund | |
| December 7, 2018 | 74% |
| Fidelity International Enhanced Index Fund | |
| December 7, 2018 | 0% |
A percentage of the dividends distributed during the fiscal year for the following funds may be taken into account as a dividend for purposes of the maximum rate under section 1(h)(11) of the Internal Revenue Code.
| Fidelity Large Cap Growth Enhanced Index Fund | |
| December 7, 2018 | 76% |
| Fidelity Large Cap Value Enhanced Index Fund | |
| December 7, 2018 | 79% |
| December 28, 2018 | 99% |
| Fidelity Large Cap Core Enhanced Index Fund | |
| December 7, 2018 | 76% |
| Fidelity Mid Cap Enhanced Index Fund | |
| December 7, 2018 | 76% |
| Fidelity International Enhanced Index Fund | |
| December 7, 2018 | 99% |
The amounts per share which represent income derived from sources within, and taxes paid to, foreign countries or possessions of the United States are as follows:
| Pay Date | Income | Taxes | |
| Fidelity International Enhanced Index Fund | 12/10/2018 | $0.2201 | $0.0201 |
The funds will notify shareholders in January 2020 of amounts for use in preparing 2019 income tax returns.
![]()
GEI-ANN-1019
1.855140.113
Item 2.
Code of Ethics
As of the end of the period, August 31, 2019, Fidelity Commonwealth Trust II (the trust) has adopted a code of ethics, as defined in Item 2 of Form N-CSR, that applies to its President and Treasurer and its Chief Financial Officer. A copy of the code of ethics is filed as an exhibit to this Form N-CSR.
Item 3.
Audit Committee Financial Expert
The Board of Trustees of the trust has determined that Joseph Mauriello is an audit committee financial expert, as defined in Item 3 of Form N-CSR. Mr. Mauriello is independent for purposes of Item 3 of Form N-CSR.
Item 4.
Principal Accountant Fees and Services
Fees and Services
The following table presents fees billed by PricewaterhouseCoopers LLP (“PwC”) in each of the last two fiscal years for services rendered to Fidelity International Enhanced Index Fund, Fidelity Large Cap Core Enhanced Index Fund, Fidelity Large Cap Growth Enhanced Index Fund, Fidelity Large Cap Value Enhanced Index Fund and Fidelity Mid Cap Enhanced Index Fund (the “Funds”):
Services Billed by PwC
August 31, 2019 FeesA
| Audit Fees | Audit-Related Fees | Tax Fees | All Other Fees |
Fidelity International Enhanced Index Fund | $45,000 | $3,600 | $3,700 | $1,700 |
Fidelity Large Cap Core Enhanced Index Fund | $45,000 | $3,600 | $3,700 | $1,600 |
Fidelity Large Cap Growth Enhanced Index Fund | $45,000 | $3,600 | $3,700 | $1,600 |
Fidelity Large Cap Value Enhanced Index Fund | $45,000 | $3,600 | $5,300 | $1,600 |
Fidelity Mid Cap Enhanced Index Fund | $45,000 | $3,600 | $3,700 | $1,600 |
|
|
|
|
|
August 31, 2018 FeesA
| Audit Fees | Audit-Related Fees | Tax Fees | All Other Fees |
Fidelity International Enhanced Index Fund | $40,000 | $3,400 | $6,300 | $1,700 |
Fidelity Large Cap Core Enhanced Index Fund | $40,000 | $3,300 | $3,700 | $1,700 |
Fidelity Large Cap Growth Enhanced Index Fund | $40,000 | $3,300 | $5,300 | $1,700 |
Fidelity Large Cap Value Enhanced Index Fund | $40,000 | $3,300 | $3,700 | $1,700 |
Fidelity Mid Cap Enhanced Index Fund | $40,000 | $3,300 | $3,700 | $1,700 |
|
|
|
|
|
A Amounts may reflect rounding.
The following table presents fees billed by PwC that were required to be approved by the Audit Committee for services that relate directly to the operations and financial reporting of the Funds and that are rendered on behalf of Fidelity Management & Research Company (“FMR”) and entities controlling, controlled by, or under common control with FMR (not including any sub-adviser whose role is primarily portfolio management and is subcontracted with or overseen by another investment adviser) that provide ongoing services to the Funds (“Fund Service Providers”):
Services Billed by PwC
| August 31, 2019A | August 31, 2018A |
Audit-Related Fees | $7,775,000 | $7,745,000 |
Tax Fees | $10,000 | $20,000 |
All Other Fees | $- | $- |
A Amounts may reflect rounding.
“Audit-Related Fees” represent fees billed for assurance and related services that are reasonably related to the performance of the fund audit or the review of the fund's financial statements and that are not reported under Audit Fees.
“Tax Fees” represent fees billed for tax compliance, tax advice or tax planning that relate directly to the operations and financial reporting of the fund.
“All Other Fees” represent fees billed for services provided to the fund or Fund Service Provider, a significant portion of which are assurance related, that relate directly to the operations and financial reporting of the fund, excluding those services that are reported under Audit Fees, Audit-Related Fees or Tax Fees.
Assurance services must be performed by an independent public accountant.
* * *
The aggregate non-audit fees billed by PwC for services rendered to the Funds, FMR (not including any sub-adviser whose role is primarily portfolio management and is subcontracted with or overseen by another investment adviser), and any Fund Service Provider for each of the last two fiscal years of the Funds are as follows:
Billed By | August 31, 2019A | August 31, 2018A | ||
PwC | $12,500,000 | $10,950,000 | ||
|
|
|
| |
A Amounts may reflect rounding.
The trust's Audit Committee has considered non-audit services that were not pre-approved that were provided by PwC to Fund Service Providers to be compatible with maintaining the independence of PwC in its audit of the Funds, taking into account representations from PwC, in accordance with Public Company Accounting Oversight Board rules, regarding its independence from the Funds and their related entities and FMR’s review of the appropriateness and permissibility under applicable law of such non-audit services prior to their provision to the Fund Service Providers.
Audit Committee Pre-Approval Policies and Procedures
The trust’s Audit Committee must pre-approve all audit and non-audit services provided by a fund’s independent registered public accounting firm relating to the operations or financial reporting of the fund. Prior to the commencement of any audit or non-audit services to a fund, the Audit Committee reviews the services to determine whether they are appropriate and permissible under applicable law.
The Audit Committee has adopted policies and procedures to, among other purposes, provide a framework for the Committee’s consideration of non-audit services by the audit firms that audit the Fidelity funds. The policies and procedures require that any non-audit service provided by a fund audit firm to a Fidelity fund and any non-audit service provided by a fund auditor to a Fund Service Provider that relates directly to the operations and financial reporting of a Fidelity fund (“Covered Service”) are subject to approval by the Audit Committee before such service is provided.
All Covered Services must be approved in advance of provision of the service either: (i) by formal resolution of the Audit Committee, or (ii) by oral or written approval of the service by the Chair of the Audit Committee (or if the Chair is unavailable, such other member of the Audit Committee as may be designated by the Chair to act in the Chair’s absence). The approval contemplated by (ii) above is permitted where the Treasurer determines that action on such an engagement is necessary before the next meeting of the Audit Committee.
Non-audit services provided by a fund audit firm to a Fund Service Provider that do not relate directly to the operations and financial reporting of a Fidelity fund are reported to the Audit Committee periodically.
Non-Audit Services Approved Pursuant to Rule 2-01(c)(7)(i)(C) and (ii) of Regulation S-X (“De Minimis Exception”)
There were no non-audit services approved or required to be approved by the Audit Committee pursuant to the De Minimis Exception during the Funds’ last two fiscal years relating to services provided to (i) the Funds or (ii) any Fund Service Provider that relate directly to the operations and financial reporting of the Funds.
Item 5.
Audit Committee of Listed Registrants
Not applicable.
Item 6.
Investments
(a)
Not applicable.
(b)
Not applicable
Item 7.
Disclosure of Proxy Voting Policies and Procedures for Closed-End Management Investment Companies
Not applicable.
Item 8.
Portfolio Managers of Closed-End Management Investment Companies
Not applicable.
Item 9.
Purchase of Equity Securities by Closed-End Management Investment Company and Affiliated Purchasers
Not applicable.
Item 10.
Submission of Matters to a Vote of Security Holders
There were no material changes to the procedures by which shareholders may recommend nominees to the trust’s Board of Trustees.
Item 11.
Controls and Procedures
(a)(i) The President and Treasurer and the Chief Financial Officer have concluded that the trust’s disclosure controls and procedures (as defined in Rule 30a-3(c) under the Investment Company Act) provide reasonable assurances that material information relating to the trust is made known to them by the appropriate persons, based on their evaluation of these controls and procedures as of a date within 90 days of the filing date of this report.
(a)(ii) There was no change in the trust’s internal control over financial reporting (as defined in Rule 30a-3(d) under the Investment Company Act) that occurred during the period covered by this report that has materially affected, or is reasonably likely to materially affect, the trust’s internal control over financial reporting.
Item 12.
Disclosure of Securities Lending Activities for Closed-End Management
Investment Companies
Not applicable.
Item 13.
Exhibits
(a) | (1) | Code of Ethics pursuant to Item 2 of Form N-CSR is filed and attached hereto as EX-99.CODE ETH. |
(a) | (2) | Certification pursuant to Rule 30a-2(a) under the Investment Company Act of 1940 (17 CFR 270.30a-2(a)) is filed and attached hereto as Exhibit 99.CERT. |
(a) | (3) | Not applicable. |
(b) |
| Certification pursuant to Rule 30a-2(b) under the Investment Company Act of 1940 (17 CFR 270.30a-2(b)) is furnished and attached hereto as Exhibit 99.906CERT. |
SIGNATURES
Pursuant to the requirements of the Securities Exchange Act of 1934 and the Investment Company Act of 1940, the registrant has duly caused this report to be signed on its behalf by the undersigned, thereunto duly authorized.
Fidelity Commonwealth Trust II
By: | /s/Stacie M. Smith |
| Stacie M. Smith |
| President and Treasurer |
|
|
Date: | October 25, 2019 |
Pursuant to the requirements of the Securities Exchange Act of 1934 and the Investment Company Act of 1940, this report has been signed below by the following persons on behalf of the registrant and in the capacities and on the dates indicated.
By: | /s/Stacie M. Smith |
| Stacie M. Smith |
| President and Treasurer |
|
|
Date: | October 25, 2019 |
By: | /s/John J. Burke III |
| John J. Burke III |
| Chief Financial Officer |
|
|
Date: | October 25, 2019 |