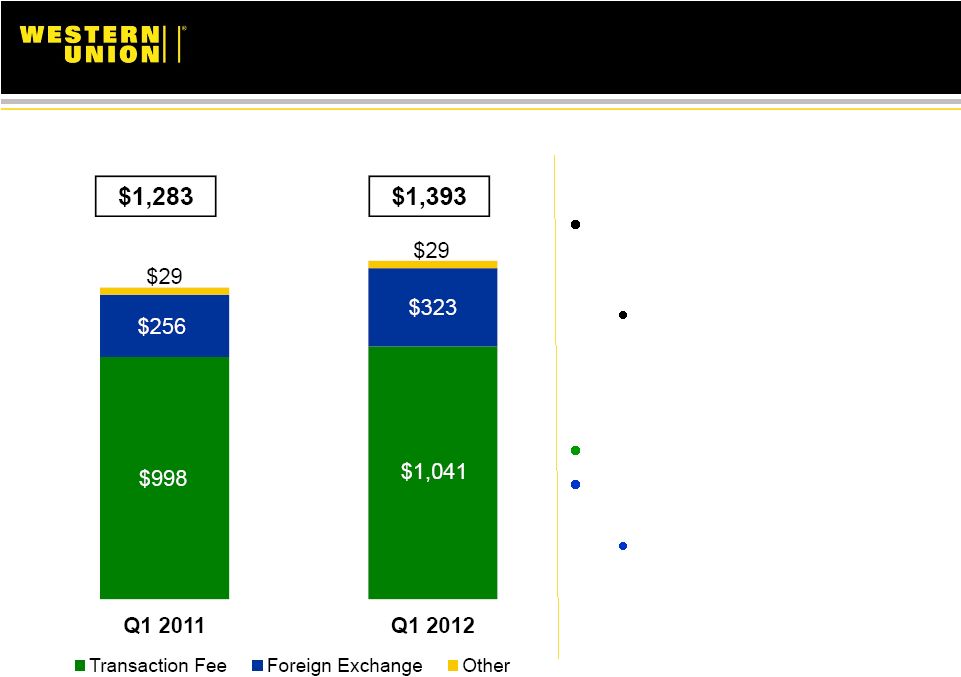
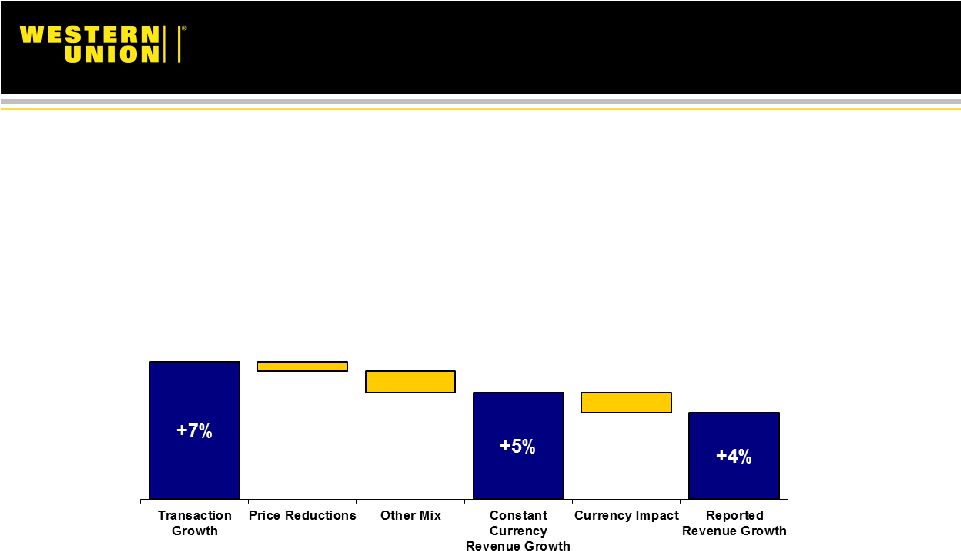
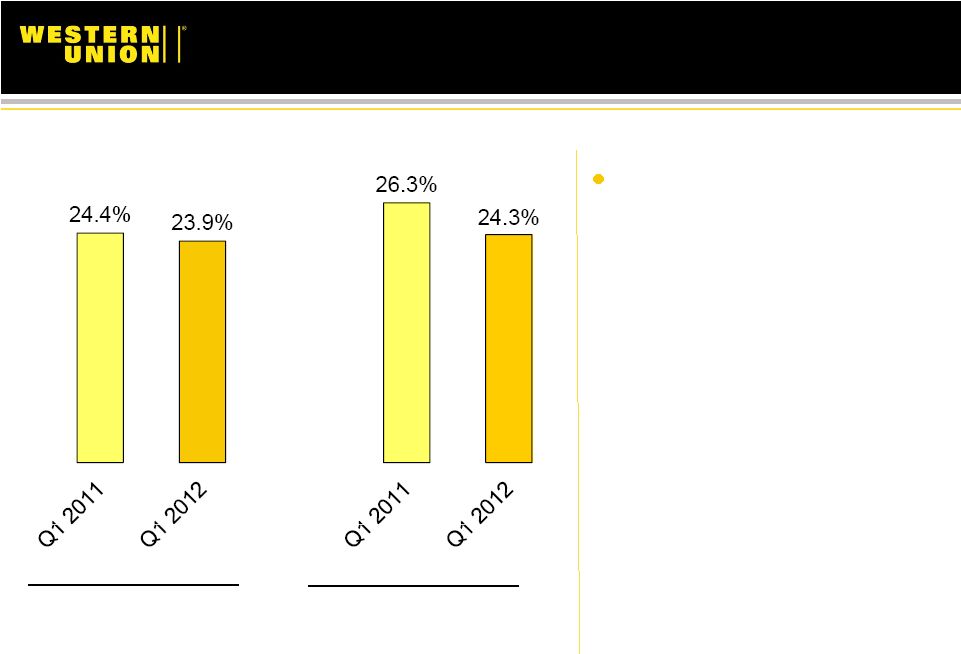
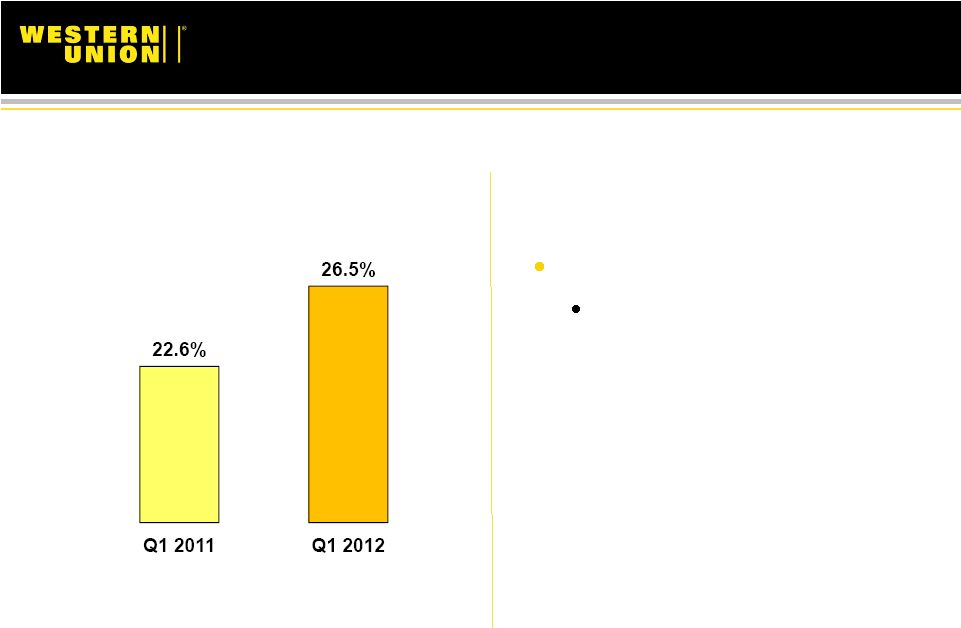
Reconciliation of Non-GAAP Measures 25 1Q11 2Q11 3Q11 4Q11 FY2011 1Q12 Consolidated Metrics Revenues, as reported (GAAP) 1,283.0 $ 1,366.3 $ 1,410.8 $ 1,431.3 $ 5,491.4 $ 1,393.4 $ Foreign currency translation impact (a) 2.3 (32.5) (18.2) 10.4 (38.0) 8.1 Revenues, constant currency adjusted 1,285.3 $ 1,333.8 $ 1,392.6 $ 1,441.7 $ 5,453.4 $ 1,401.5 $ Prior year revenues, as reported (GAAP) 1,232.7 $ 1,273.4 $ 1,329.6 $ 1,357.0 $ 5,192.7 $ 1,283.0 $ Pro forma prior year revenues, TGBP adjusted (b) N/A N/A N/A N/A N/A 1,338.0 $ Revenue change, as reported (GAAP) 4 % 7 % 6 % 5 % 6 % 9 % Revenue change, constant currency adjusted 4 % 5 % 5 % 6 % 5 % 9 % Pro forma revenue change, TGBP adjusted N/A N/A N/A N/A N/A 4 % Pro forma revenue change, TGBP and constant currency adjusted N/A N/A N/A N/A N/A 5 % Operating income, as reported (GAAP) 312.9 $ 350.7 $ 363.0 $ 358.4 $ 1,385.0 $ 332.5 $ Reversal of restructuring and related expenses (c) 24.0 8.9 13.9 - 46.8 - Reversal of TGBP integration expense (d) N/A N/A N/A 4.8 4.8 6.4 Operating income, excl. restructuring and TGBP integration expense 336.9 $ 359.6 $ 376.9 $ 363.2 $ 1,436.6 $ 338.9 $ Operating income margin, as reported (GAAP) 24.4% 25.7% 25.7% 25.0% 25.2% 23.9% Operating income margin, excl. restructuring 26.3% 26.3% 26.7% 25.0% 26.1% 23.9% Operating income margin, excl. restructuring and TGBP integration expense N/A N/A N/A 25.4% 26.2% 24.3% Operating income, as reported (GAAP) 312.9 $ 350.7 $ 363.0 $ 358.4 $ 1,385.0 $ 332.5 $ Reversal of depreciation and amortization (e) 44.7 46.6 45.9 55.4 192.6 63.9 EBITDA (e) 357.6 $ 397.3 $ 408.9 $ 413.8 $ 1,577.6 $ 396.4 $ Reversal of restructuring and related expenses (c) 23.4 8.2 13.9 - 45.5 - Reversal of TGBP integration expense (d) N/A N/A N/A 4.8 4.8 6.4 EBITDA, excl. restructuring and TGBP integration expense 381.0 $ 405.5 $ 422.8 $ 418.6 $ 1,627.9 $ 402.8 $ EBITDA margin 27.9% 29.1% 29.0% 28.9% 28.7% 28.4% EBITDA margin, excl. restructuring and TGBP integration expense 29.7% 29.7% 30.0% 29.2% 29.6% 28.9% Net income, as reported (GAAP) 210.2 $ 263.2 $ 239.7 $ 452.3 $ 1,165.4 $ 247.3 $ Reversal of restructuring and related expenses, net of income tax benefit (c) 16.4 5.9 9.7 - 32.0 - Net income, restructuring adjusted 226.6 $ 269.1 $ 249.4 $ 452.3 $ 1,197.4 $ 247.3 $ Reversal of IRS Agreement tax provision benefit (f) N/A N/A N/A (204.7) (204.7) - Net income, restructuring and IRS Agreement adjusted 226.6 $ 269.1 $ 249.4 $ 247.6 $ 992.7 $ 247.3 $ Reversal of TGBP integration expense, net of income tax benefit (d) N/A N/A N/A 3.1 3.1 4.3 Net income, restructuring, IRS Agreement and TGBP integration expense adjusted 226.6 $ 269.1 $ 249.4 $ 250.7 $ 995.8 $ 251.6 $ Diluted earnings per share ("EPS"), as reported (GAAP) ($ - dollars) 0.32 $ 0.41 $ 0.38 $ 0.73 $ 1.84 $ 0.40 $ Impact from restructuring and related expenses, net of income tax benefit (c) ($ - dollars) 0.03 0.01 0.02 - 0.05 - Diluted EPS, restructuring adjusted ($ - dollars) 0.35 $ 0.42 $ 0.40 $ 0.73 $ 1.89 $ 0.40 $ Impact from IRS Agreement tax provision benefit (f) ($ - dollars) N/A N/A N/A (0.33) (0.32) - Diluted EPS, restructuring and IRS Agreement adjusted ($ - dollars) 0.35 $ 0.42 $ 0.40 $ 0.40 $ 1.57 $ 0.40 $ Impact from TGBP integration expense, net of income tax benefit (d) ($ - dollars) N/A N/A N/A - - - Diluted EPS, restructuring, IRS Agreement and TGBP integration expense adjusted ($ - dollars) 0.35 $ 0.42 $ 0.40 $ 0.40 $ 1.57 $ 0.40 $ Diluted weighted-average shares outstanding 652.1 635.8 627.1 621.7 634.2 621.9 |