|
Exhibit 99.1 
|
OPENING VIDEO
Agenda
8:30 AM 9:00 AM 9:15 AM 9:30 AM 10:05 AM
Overview Brand & Platform Retail C2C & C2B Break
& WU 2020 Consumer
Strategy Insights
Odilon Almeida &
Hikmet Ersek Libby Chambers David Thompson Jean Claude Farah
10:25 AM 10:45 AM 11:00 AM 11:20 AM 11:55 AM
wu.com & Business Financial Q&A Closing
Digital C2C Solutions Overview & Remarks
Capital Allocation
Khalid Fellahi Kerry Agiasotis Raj Agrawal Hikmet Ersek
Disclaimers
The following presentations contain certain statements that are forward-looking within the meaning of the Private Securities Litigation Reform Act of 1995. These statements are not guarantees of future performance and involve certain risks, uncertainties and assumptions that are difficult to predict. Actual outcomes and results may differ materially from those expressed in, or implied by, our forward-looking statements. Words such as “expects,” “intends,” “anticipates,” “believes,” “estimates,” “guides,” “provides guidance,” “provides outlook” and other similar expressions or future or conditional verbs such as “may,” “will,” “should,” “would,” “could,” and “might” are intended to identify such forward-looking statements. Readers of this presentation of The Western Union Company (the “Company,” “Western Union,” “we,” “our” or “us”) should not rely solely on the forward-looking statements and should consider all uncertainties and risks discussed in the “Risk Factors” section and throughout the Annual Report on Form 10-K for the year ended December 31, 2015. The statements are only as of the date they are made, and the Company undertakes no obligation to update any forward-looking statement.
Possible events or factors that could cause results or performance to differ materially from those expressed in our forward-looking statements include the following: (i) events related to our business and industry, such as: changes in general economic conditions and economic conditions in the regions and industries in which we operate, including global economic and trade downturns, or significantly slower growth or declines in the money transfer, payment service, and other markets in which we operate, including downturns or declines related to interruptions in migration patterns, or non-performance by our banks, lenders, insurers, or other financial services providers; failure to compete effectively in the money transfer and payment service industry, including among other things, with respect to price, with global and niche or corridor money transfer providers, banks and other money transfer and payment service providers, including electronic, mobile and Internet-based services, card associations, and card-based payment providers, and with digital currencies and related protocols, and other innovations in technology and business models; deterioration in customer confidence in our business, or in money transfer and payment service providers generally; our ability to adopt new technology and develop and gain market acceptance of new and enhanced services in response to changing industry and consumer needs or trends; changes in, and failure to manage effectively, exposure to foreign exchange rates, including the impact of the regulation of foreign exchange spreads on money transfers and payment transactions; any material breach of security, including cybersecurity, or safeguards of or interruptions in any of our systems or those of our vendors or other third parties; cessation of or defects in various services provided to us by third-party vendors; mergers, acquisitions and integration of acquired businesses and technologies into our Company, and the failure to realize anticipated financial benefits from these acquisitions, and events requiring us to write down our goodwill; political conditions and related actions in the United States and abroad which may adversely affect our business and economic conditions as a whole, including interruptions of United States or other government relations with countries in which we have or are implementing significant business relationships with agents or clients; failure to manage credit and fraud risks presented by our agents, clients and consumers; failure to maintain our agent network and business relationships under terms consistent with or more advantageous to us than those currently in place, including due to increased costs or loss of business as a result of increased compliance requirements or difficulty for us, our agents or their subagents in establishing or maintaining relationships with banks needed to conduct our services; decisions to change our business mix; changes in tax laws, or their interpretation, and unfavorable resolution of tax contingencies; adverse rating actions by credit rating agencies; our ability to realize the anticipated benefits from productivity and cost-savings and other related initiatives, which may include decisions to downsize or to transition operating activities from one location to another, and to minimize any disruptions in our workforce that may result from those initiatives; our ability to protect our brands and our other intellectual property rights and to defend ourselves against potential intellectual property infringement claims; our ability to attract and retain qualified key employees and to manage our workforce successfully; material changes in the market value or liquidity of securities that we hold; restrictions imposed by our debt obligations; (ii) events related to our regulatory and litigation environment, such as: liabilities or loss of business resulting from a failure by us, our agents or their subagents to comply with laws and regulations and regulatory or judicial interpretations thereof, including laws and regulations designed to protect consumers, or detect and prevent money laundering, terrorist financing, fraud and other illicit activity; increased costs or loss of business due to regulatory initiatives and changes in laws, regulations and industry practices and standards, including changes in interpretations in the United States and globally, affecting us, our agents or their subagents, or the banks with which we or our agents maintain bank accounts needed to provide our services, including related to anti-money laundering regulations, anti-fraud measures, customer due diligence, agent and subagent due diligence, registration and monitoring requirements, and consumer protection requirements; liabilities or loss of business and unanticipated developments resulting from governmental investigations and consent agreements with or enforcement actions by regulators, including those associated with compliance with or failure to comply with the settlement agreement with the State of Arizona, as amended; the potential impact on our business from the Dodd-Frank Wall Street Reform and Consumer Protection Act (the “Dodd-Frank Act”), as well as regulations issued pursuant to it and the actions of the Consumer Financial Protection Bureau and similar legislation and regulations enacted by other governmental authorities related to consumer protection; liabilities resulting from litigation, including class-action lawsuits and similar matters, including costs, expenses, settlements and judgments; failure to comply with regulations and evolving industry standards regarding consumer privacy and data use and security; effects of unclaimed property laws; failure to maintain sufficient amounts or types of regulatory capital or other restrictions on the use of our working capital to meet the changing requirements of our regulators worldwide; changes in accounting standards, rules and interpretations or industry standards affecting our business; and (iii) other events, such as: adverse tax consequences from our spin-off from First Data Corporation; catastrophic events; and management’s ability to identify and manage these and other risks.
The following presentations include data based on internal Company studies and surveys, including the Western Union Brand Tracking Study 2015, WU Tracker, the WU Customer Database, Western Union Consumer Research with Social Media Users 2015, US and UK, the Western Union Brand Tracking Study 2015, the 2015 WU Customer Research Study, and the 2014 Global Consumer Tracking Study. The Company’s internal surveys, studies and data were not verified by independent third parties and were generally prepared for internal purposes. These studies and surveys are not necessarily based on statistically significant sample sizes and the Company can give no assurance that the studies or surveys accurately reflect the views of the larger population from which the samples were taken.
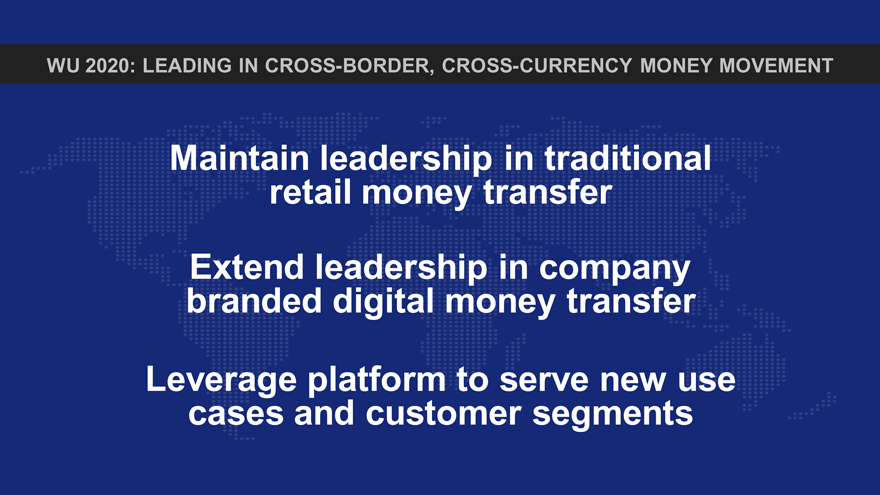
WU 2020: LEADING IN CROSS-BORDER, CROSS-CURRENCY MONEY MOVEMENT
Maintain leadership in traditional retail money transfer
Extend leadership in company branded digital money transfer
Leverage platform to serve new use cases and customer segments
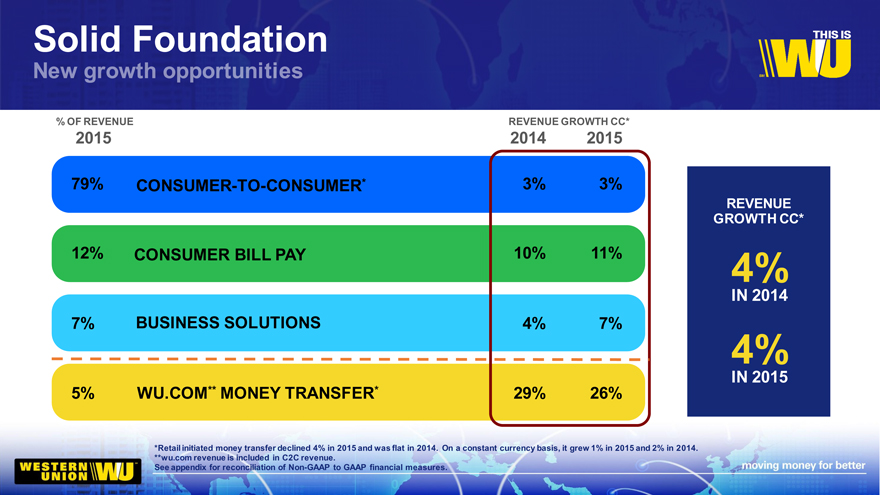
Solid Foundation
% OF REVENUE REVENUE GROWTH CC*
2015 2014 2015
79% CONSUMER-TO-CONSUMER* 3% 3%
REVENUE
GROWTH CC*
12% CONSUMER BILL PAY 10% 11% 4%
IN 2014
7% BUSINESS SOLUTIONS 4% 7%
4%
IN 2015
5% WU.COM** MONEY TRANSFER* 29% 26%
*Retail initiated money transfer declined 4% in 2015 and was flat in 2014. On a constant currency basis, it grew 1% in 2015 and 2% in 2014.
**wu.com revenue is included in C2C revenue.
See appendix for reconciliation of Non-GAAP to GAAP financial measures.
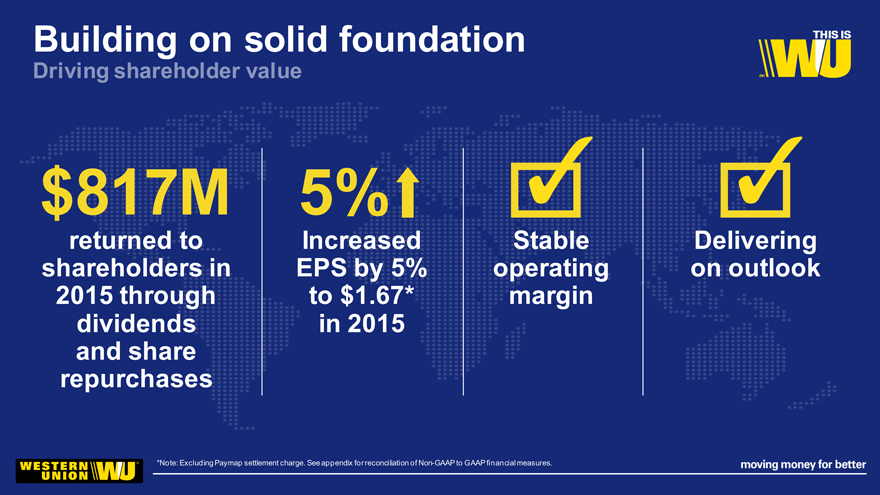
Building on solid foundation
$817M 5%
returned to Increased Stable Delivering
shareholders in EPS by 5% operating on outlook
2015 through to $1.67* margin
dividends in 2015
and share
repurchases
*Note: Excluding Paymap settlement charge. See appendix for reconciliation of Non-GAAP to GAAP financial measures.
BUSINESS IN
COUNTRIES
AND TERRITORIES
+
RETAIL LOCATIONS
ATMS & KIOSKS
ACCOUNTS
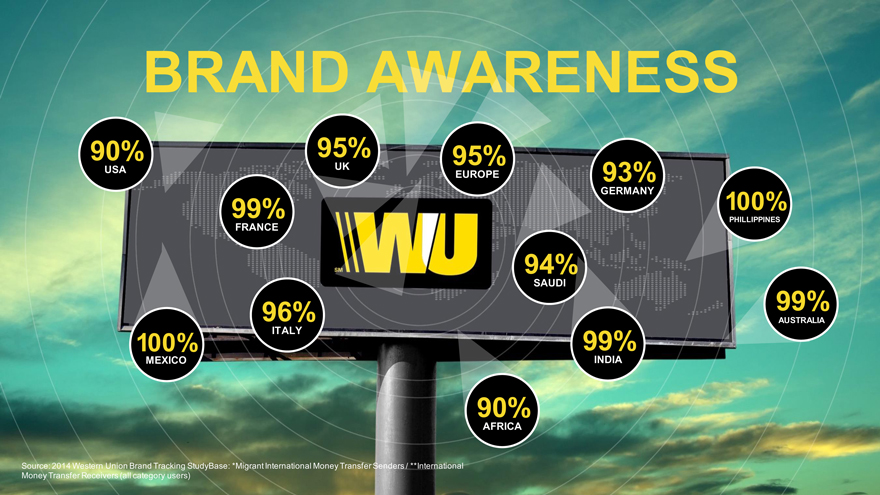
BRAND AWARENESS
90% 95% 95%
USA UK
EUROPE 93%
GERMANY 100%
99%
FRANCE PHILLIPPINES
94%
SAUDI
96% 99%
AUSTRALIA
100% ITALY 99% MEXICO INDIA
90%
AFRICA
Source: 2014 Western Union Brand Tracking StudyBase: *Migrant International Money Transfer Senders / **International Money Transfer Receivers (all category users)
CURRENCIES AVAILABLE
CORRIDORS
CONSUMERS
World Class Management Team
HIKMET ERSEK RAJ AGRAWAL LIBBY CHAMBERS DAVID THOMPSON ODILON ALMEIDA JEAN CLAUDE FARAH RICHARD WILLIAMS
President, CEO EVP and CFO EVP, Chief Strategy and EVP, Chief Technology Officer EVP and President Americas EVP and President EVP and Chief Human
Product Officer Global Operations and and European Union Middle East, Africa, Resources Officer
Technology (GO-Tech) Asia, Eastern Europe & CIS
JOHN R. DYE JACQUELINE D. KERRY AGIASOTIS KHALID FELLAHI MOLLY SHEA SCOTT COAD CHRISTINA HAMILTON
EVP, General Counsel MOLNAR President, Western Union SVP and GM, SVP, and GM, Chief Transformation Vice President, Chief of
and Secretary SVP, Chief Business Solutions WU Digital WU Digital Officer Staff, Office of the CEO
Compliance Officer
World Class Board of Directors
Hikmet Ersek Jack M. Greenberg
Frances Fragos Solomon D. Trujillo
Townsend
Betsy D. Holden
Martin I. Cole
Robert W. Selander
Michael A. Miles, Jr.
Roberto G. Mendoza
Jeffrey A. Joerres
Richard A. Goodman
Linda Fayne Levinson
TO BE THE LEADER IN CROSS-BORDER, CROSS-CURRENCY MONEY MOVEMENT
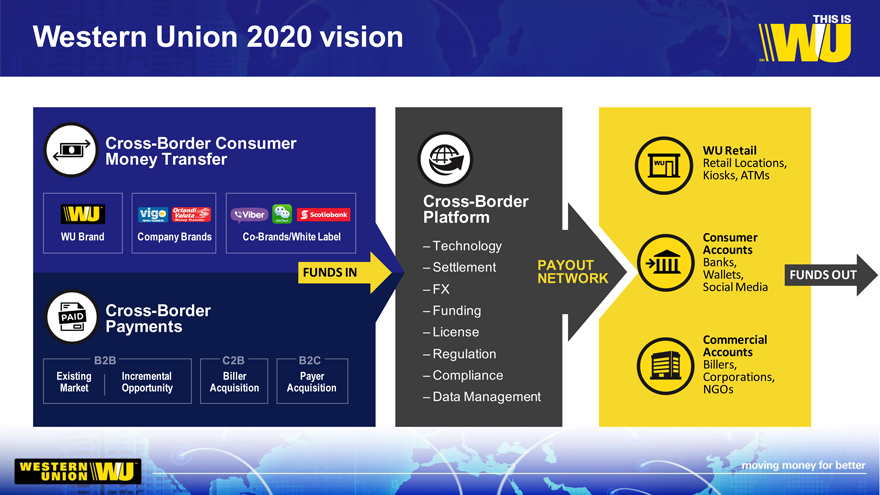
Western Union 2020 vision
Cross-Border Consumer
Money Transfer
Cross-Border
Platform
– Technology
– Settlement PAYOUT
FUNDS IN NETWORK
–FX
Cross-Border – Funding
Payments – License
– Regulation
– Compliance
– Data Management
WU Retail
Retail Locations,
Kiosks, ATMs
Consumer
Accounts
Banks,
Wallets, FUNDS OUT
Social Media
Commercial
Accounts
Billers,
Corporations,
NGOs
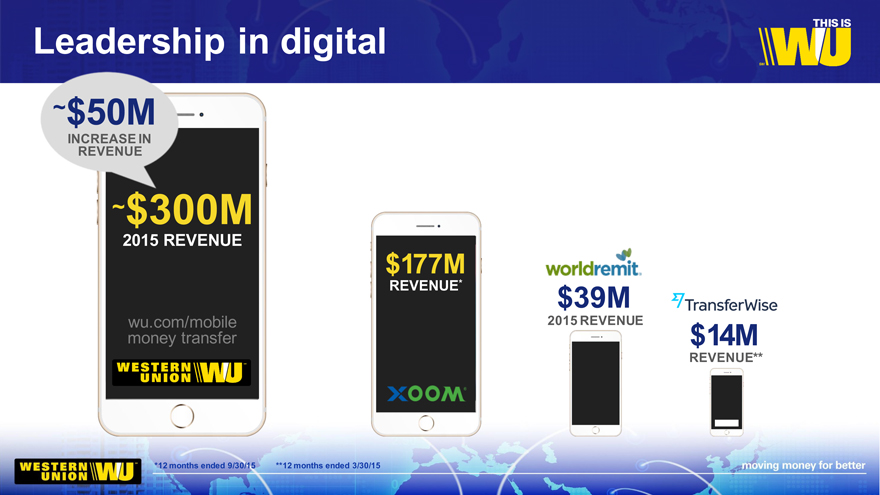
Leadership in digital
~$50M
INCREASE IN
REVENUE
~$300M
2015 REVENUE
$177M
REVENUE* $39M
wu. money com/mobile transfer 2015 REVENUE $ 4M
REVENUE**
*12 months ended 9/30/15 **12 months ended 3/30/15
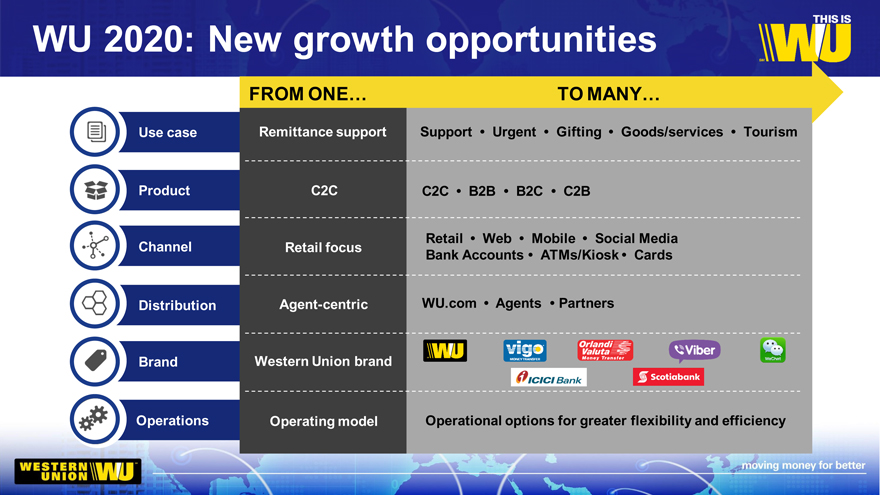
WU 2020: New growth opportunities
Use case Product Channel Distribution Brand Operations
FROM ONE… TO MANY…
Remittance support Support • Urgent • Gifting • Goods/services • Tourism
C2C C2C • B2B • B2C • C2B
Retail • Web • Mobile • Social Media
Retail focus Bank Accounts • ATMs/Kiosk • Cards
Agent-centric WU.com • Agents • Partners
Western Union brand
Operating model Operational options for greater flexibility and efficiency
WU 2020: LEADING IN CROSS-BORDER, CROSS-CURRENCY MONEY MOVEMENT
Maintain leadership in traditional retail money transfer
Extend leadership in company branded digital money transfer
Leverage platform to serve new use cases and customer segments
CUSTOMER VOICES
1
EVP, Chief Strategy and Product Officer
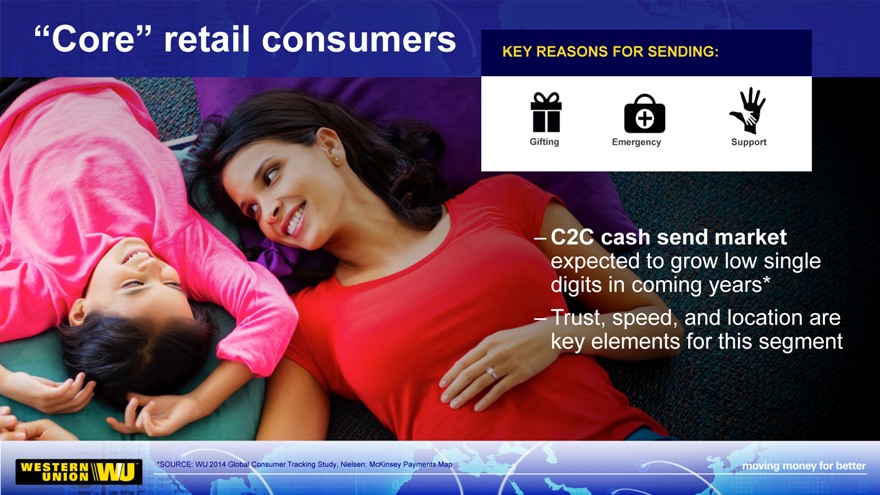
Meeting the needs of many customer segments
“Core” retail consumers KEY REASONS FOR SENDING:
Gifting Emergency Support
– C2C cash send market expected to grow low single digits in coming years*
– Trust, speed, and location are key elements for this segment
*SOURCE: WU 2014 Global Consumer Tracking Study, Nielsen; McKinsey Payments Map
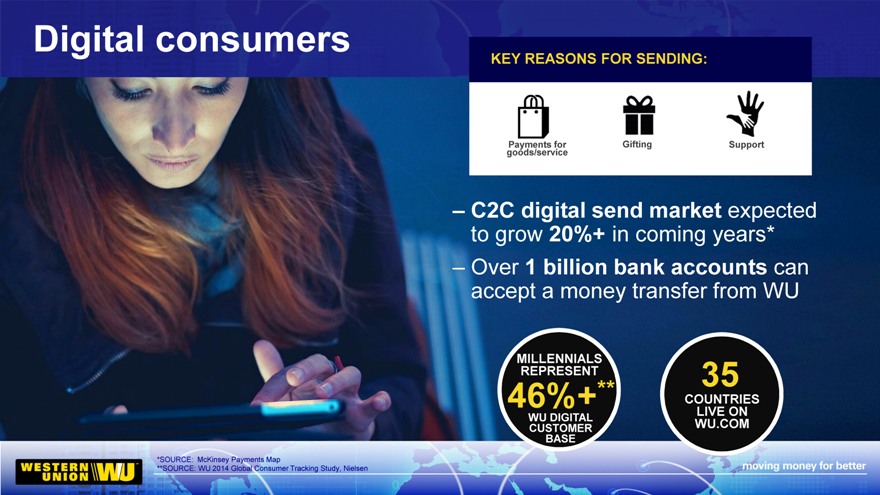
Digital consumers
Payments for Gifting Support
goods/service
– C2C digital send market expected to grow 20%+ in coming years*
– Over 1 billion bank accounts can accept a money transfer from WU
MILLENNIALS
REPRESENT 35
**
46%+ COUNTRIES LIVE ON
WU DIGITAL
CUSTOMER WU.COM BASE
*SOURCE: McKinsey Payments Map
**SOURCE: WU 2014 Global Consumer Tracking Study, Nielsen
Social media consumers KEY REASONS FOR SENDING:
Bill/payback Sharing Gifting Support
– Future growth opportunity, driven by smart phone adoption and desire for immediacy
– WU Connect is a leading solution for social media platforms
Viber (+600 million users)
WeChat (+500 million users)
Others in pipeline
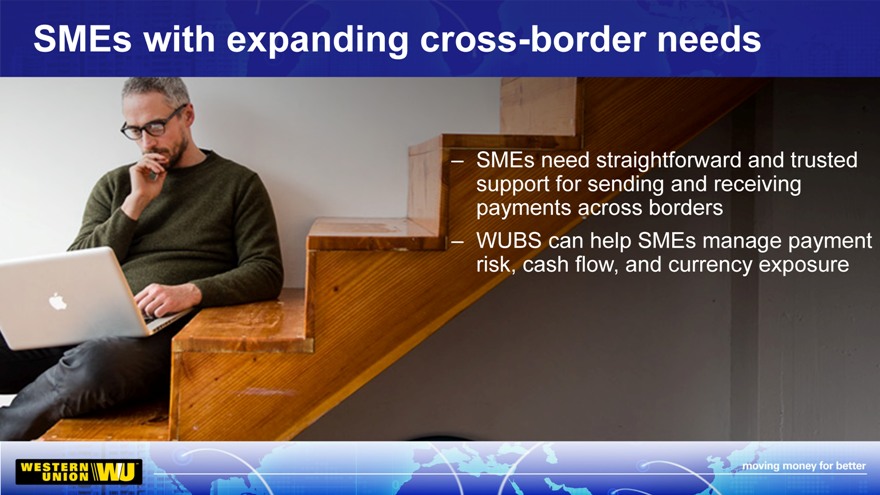
SMEs with expanding cross-border needs
– SMEs need straightforward and trusted
support for sending and receiving
payments across borders
– WUBS can help SMEs manage payment
risk, cash flow, and currency exposure
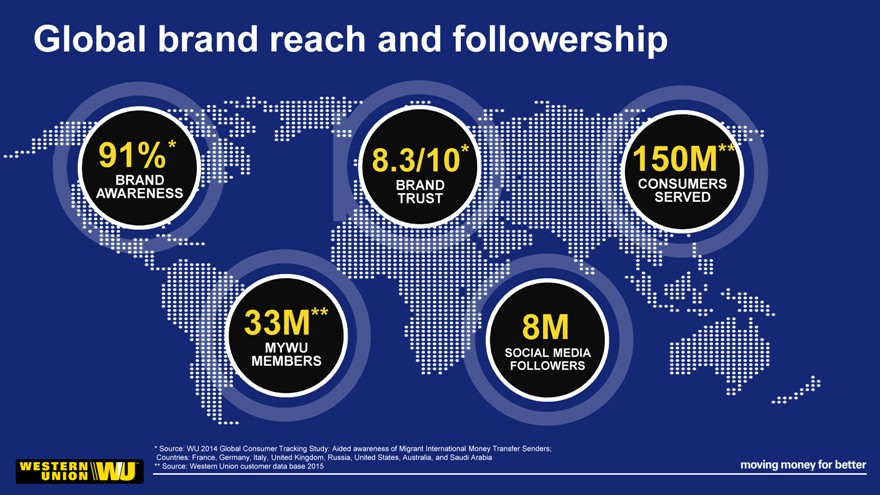
Global brand reach and followership
91%* 8.3/10* 150M**
BRAND BRAND CONSUMERS
AWARENESS TRUST SERVED
33M** 8M
MYWU SOCIAL MEDIA
MEMBERS FOLLOWERS
* Source: WU 2014 Global Consumer Tracking Study: Aided awareness of Migrant International Money Transfer Senders;
Countries: France, Germany, Italy, United Kingdom, Russia, United States, Australia, and Saudi Arabia
** Source: Western Union customer data base 2015
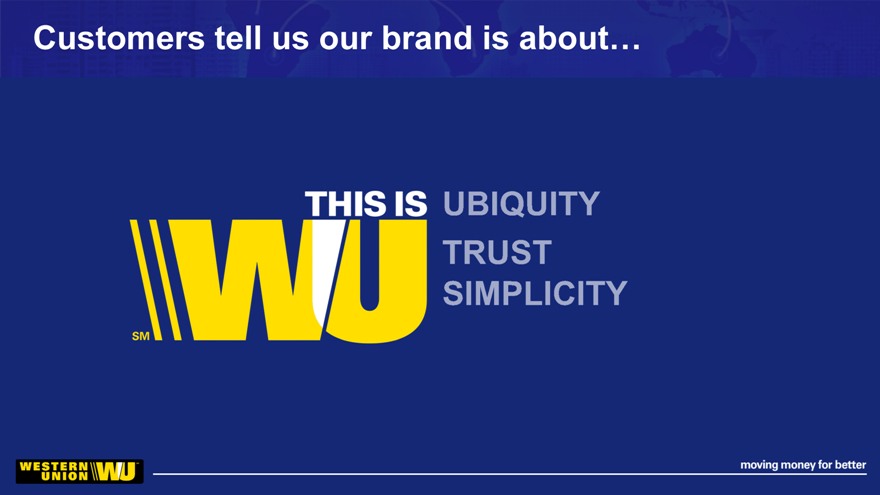
Customers tell us our brand is about…
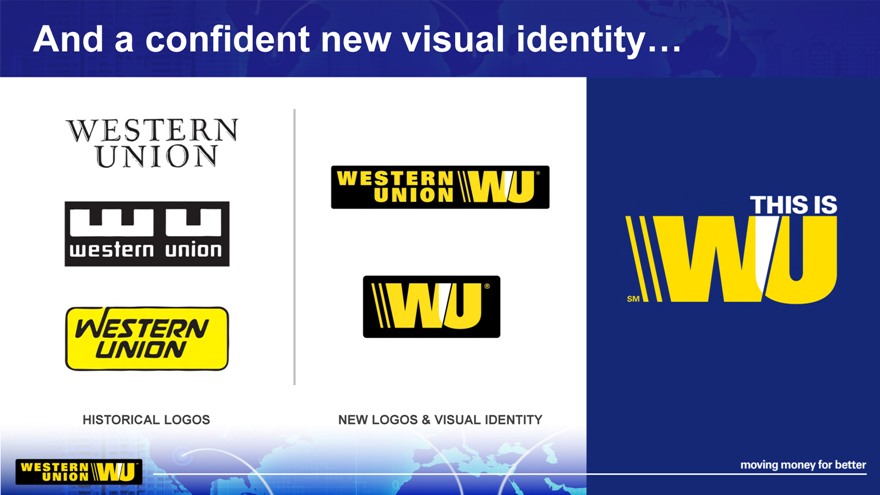
And a confident new visual identity…
HISTORICAL LOGOS NEW LOGOS & VISUAL IDENTITY
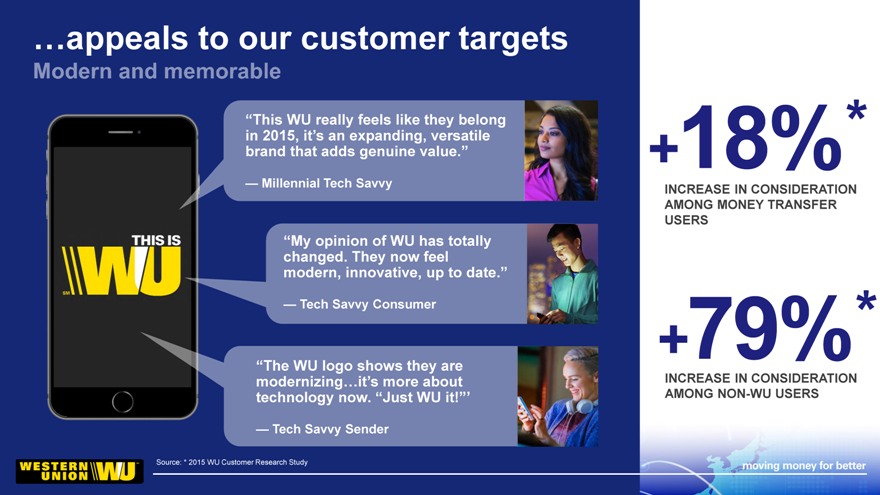
…appeals to our customer targets
“This WU really feels like they belong
in 2015, it’s an expanding, versatile *
brand that adds genuine value.” +
— Millennial Tech Savvy INCREASE IN CONSIDERATION
AMONG MONEY TRANSFER
USERS
“My opinion of WU has totally
changed. They now feel
modern, innovative, up to date.”
— Tech Savvy Consumer *
+
“The WU logo shows they are
modernizing…it’s more about INCREASE IN CONSIDERATION
technology now. “Just WU it!”’ AMONG NON-WU USERS
— Tech Savvy Sender
Source: * 2015 WU Customer Research Study
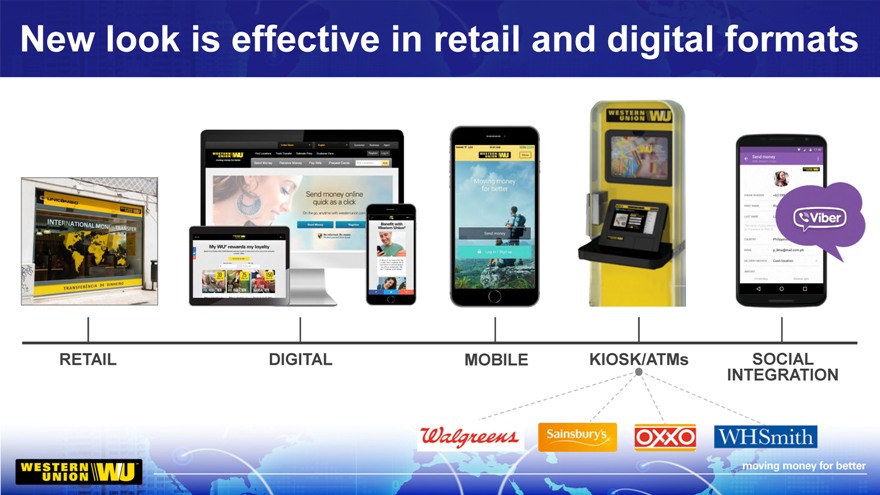
New look is effective in retail and digital formats
RETAIL DIGITAL MOBILE KIOSK/ATMs SOCIAL
INTEGRATION
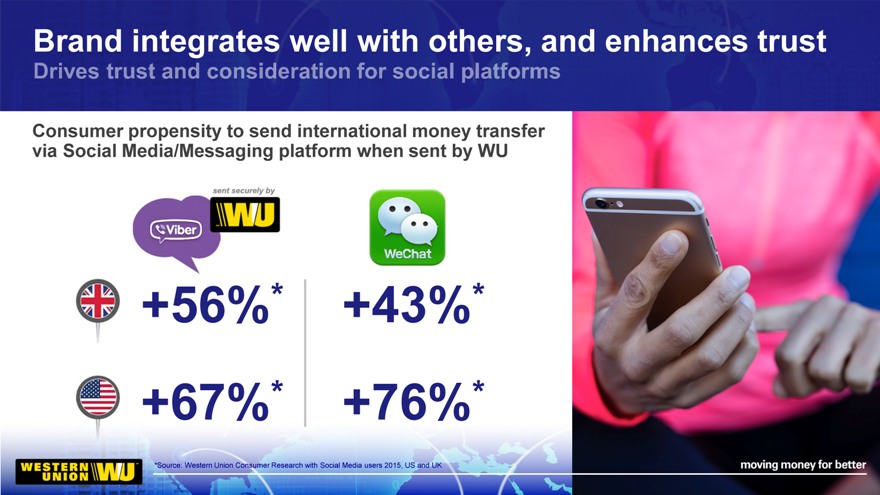
Brand integrates well with others, and enhances trust
Consumer propensity to send international money transfer
via Social Media/Messaging platform when sent by WU
+56%* +43%*
+67%* +76%*
*Source: Western Union Consumer Research with Social Media users 2015, US and UK
Positioning the brand for businesses and their needs
Positioning the brand for businesses and their needs
Marketing campaigns
…and we are fully embracing our brand purpose
EDUCATION FOR BETTER CHAIN OF BETTERS
Aligning Foundation Activities Aligning Marketing Activities
to our Brand Purpose to our Brand Purpose
THIS IS DAVID THOMPSON
EVP, Chief Technology Officer
Global Operations and
Technology (GO-Tech)
Cross Border Platform
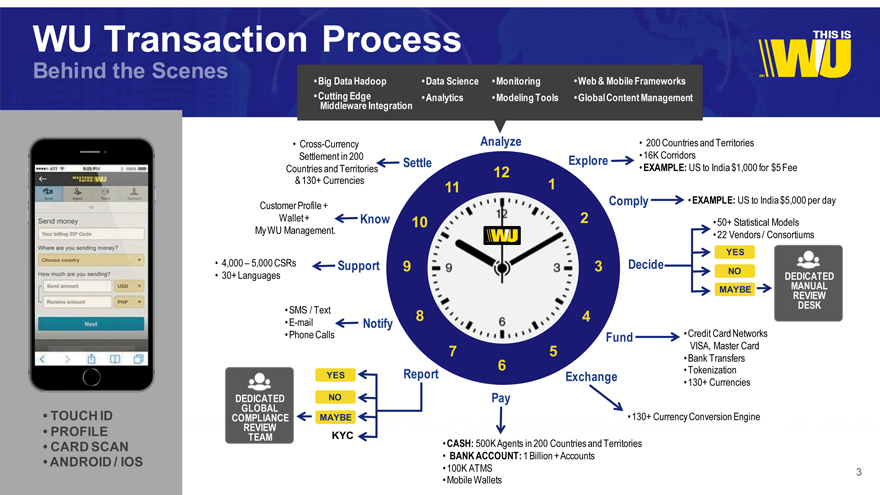
WU Transaction Process
Behind the Scenes
TOUCH ID
PROFILE
CARD SCAN
ANDROID / IOS
Big Data Hadoop Data Science Monitoring Web & Mobile Frameworks
Cutting Edge Analytics Modeling Tools Global Content Management
Middleware Integration
Cross-Currency Analyze 200 Countries and Territories
Settlement in 200 Settle Explore 16K Corridors
Countries and Territories 12 EXAMPLE: US to India $1,000 for $5 Fee
& 130+ Currencies 11 1
Customer Profile + Comply
Wallet + Know 10 2
My WU Management.
EXAMPLE: US to India $5,000 per day
50+ Statistical Models
22 Vendors / Consortiums
YES
4,000 – 5,000 CSRs Support 9 3 Decide NO
30+ Languages DEDICATED
MAYBE MANUAL
REVIEW
SMS / Text 8 4 DESK
E-mail Notify
Phone Calls Fund Credit Card Networks
YES Report Exchange Tokenization
130+ Currencies
DEDICATED NO Pay
GLOBAL
COMPLIANCE MAYBE 130+ Currency Conversion Engine
REVIEW
TEAM KYC CASH: 500K Agents in 200 Countries and Territories
BANK ACCOUNT: 1 Billion + Accounts
100K ATMS 3
Mobile Wallets
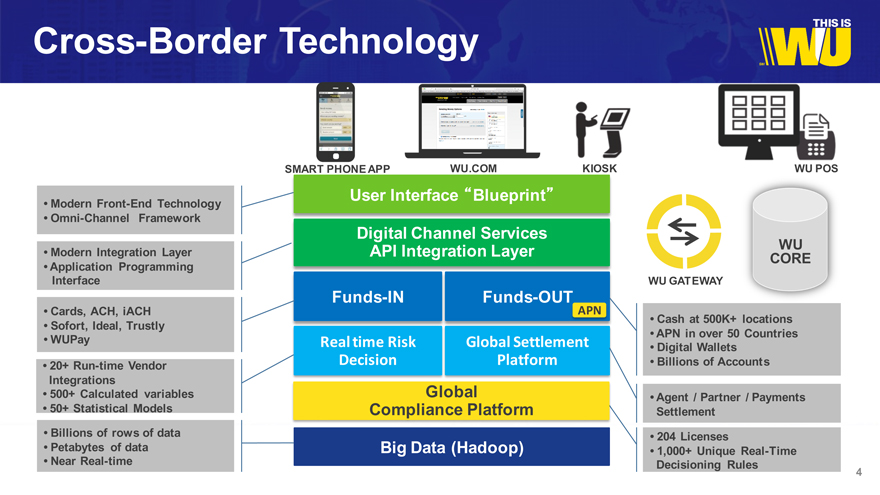
Cross-Border Technology
Modern Front-End Technology
Omni-Channel Framework
Modern Integration Layer
Application Programming
Interface
Cards, ACH, iACH
Sofort, Ideal, Trustly
WUPay
20+ Run-time Vendor Integrations
500+ Calculated variables
50+ Statistical Models
Billions of rows of data
Petabytes of data
Near Real-time
SMART PHONE APP KIOSK
User Interface “Blueprint”
Digital Channel Services
API Integration Layer
Funds-IN Funds-OUT
APN
Real time Risk Global Settlement
Decision Platform
Global
Compliance Platform
Big Data (Hadoop)
WU POS
WU CORE
WU GATEWAY
Cash at 500K+ locations
APN in over 50 Countries
Digital Wallets
Billions of Accounts
Agent / Partner / Payments
Settlement
204 Licenses
1,000+ Unique Real-Time
Decisioning Rules 4
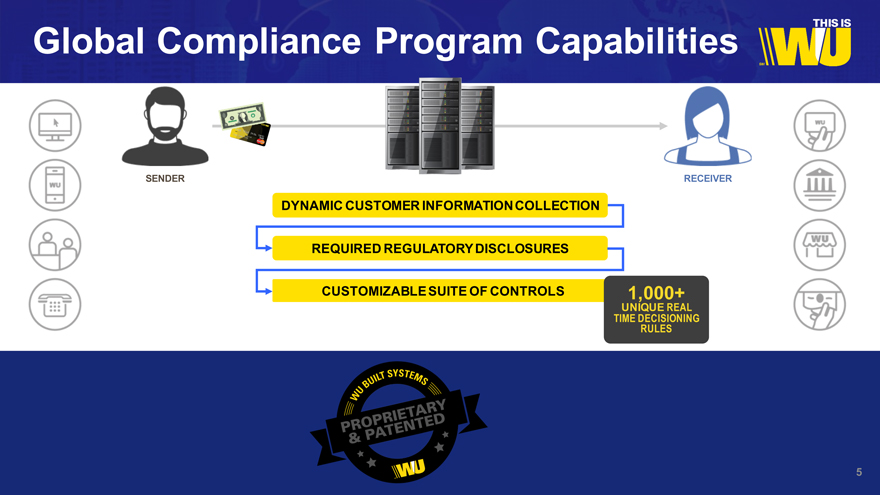
Global Compliance Program Capabilities
SENDER RECEIVER
DYNAMIC CUSTOMER INFORMATION COLLECTION
REQUIRED REGULATORY DISCLOSURES
CUSTOMIZABLE SUITE OF CONTROLS 1,000+
UNIQUE REAL
TIME DECISIONING
RULES
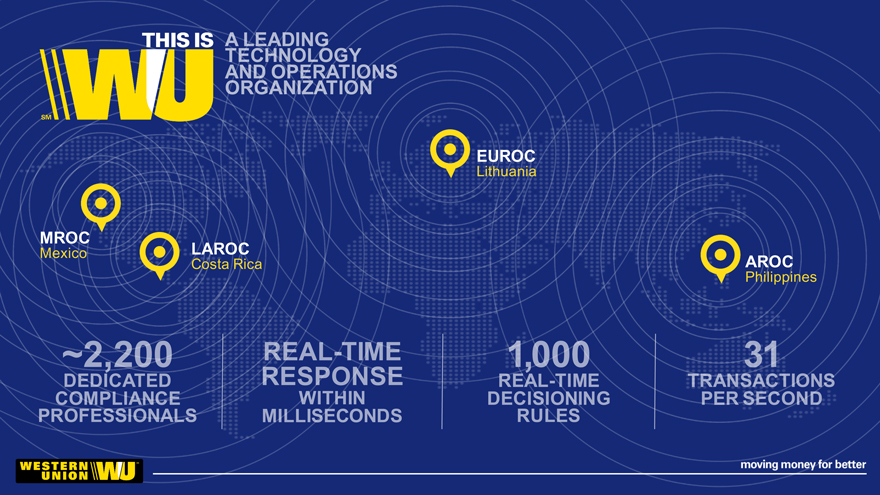
A LEADING
TECHNOLOGY
AND OPERATIONS
ORGANIZATION
MROC
Mexico
LAROC
Costa Rica
EUROC
Lithuania
AROC
Philippines
~2,200
DEDICATED
COMPLIANCE PROFESSIONALS
REAL-TIME
RESPONSE
WITHIN MILLISECONDS
1,000
REAL-TIME
DECISIONING
RULES
31
TRANSACTIONS
PER SECOND
EVP and President Middle East, Africa, Asia Pacific, Eastern Europe and CIS
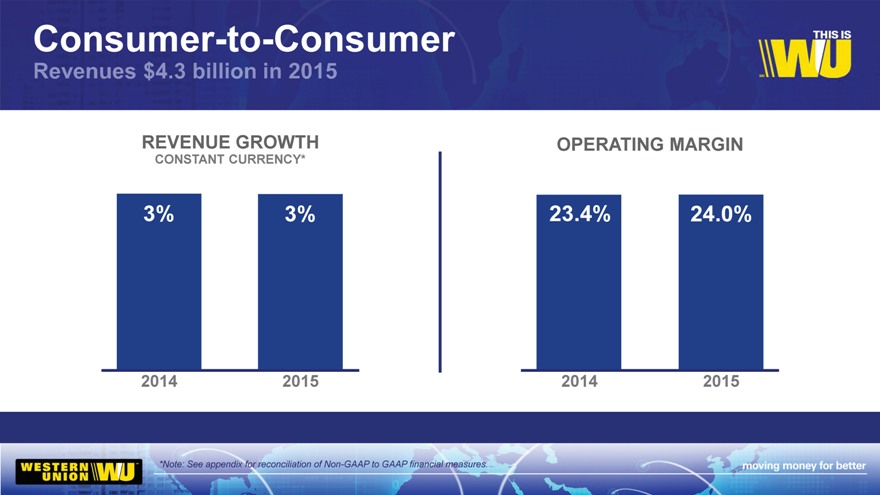
Consumer-to-Consumer
REVENUE GROWTH OPERATING MARGIN
CONSTANT CURRENCY*
3% 3% 23.4% 24.0%
2014
2015
2014
2015
*Note: See appendix for reconciliation of Non-GAAP to GAAP financial measures.
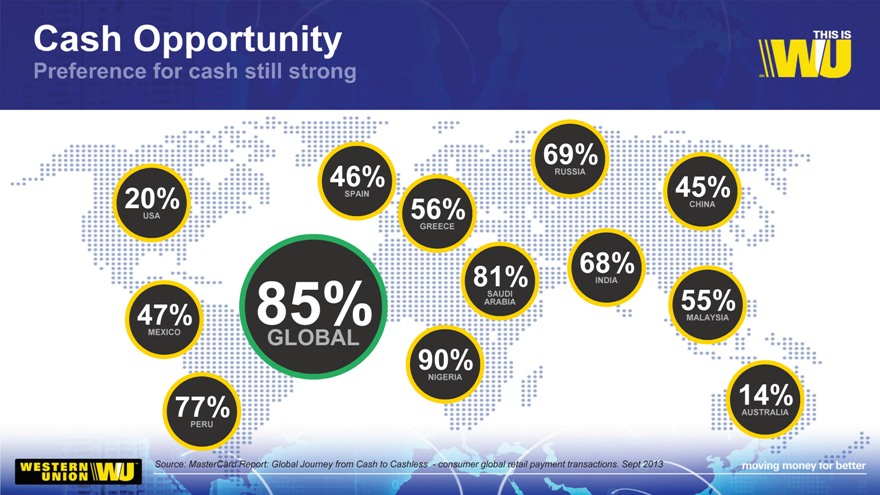
Cash Opportunity
69%
RUSSIA
46% SPAIN 45%
20% CHINA
USA 56%
GREECE
68%
81% INDIA
SAUDI
ARABIA 55%
47% 85% MALAYSIA
MEXICO GLOBAL
90%
NIGERIA
14%
77% AUSTRALIA
PERU
Source: MasterCard Report: Global Journey from Cash to Cashless—consumer global retail payment transactions. Sept 2013
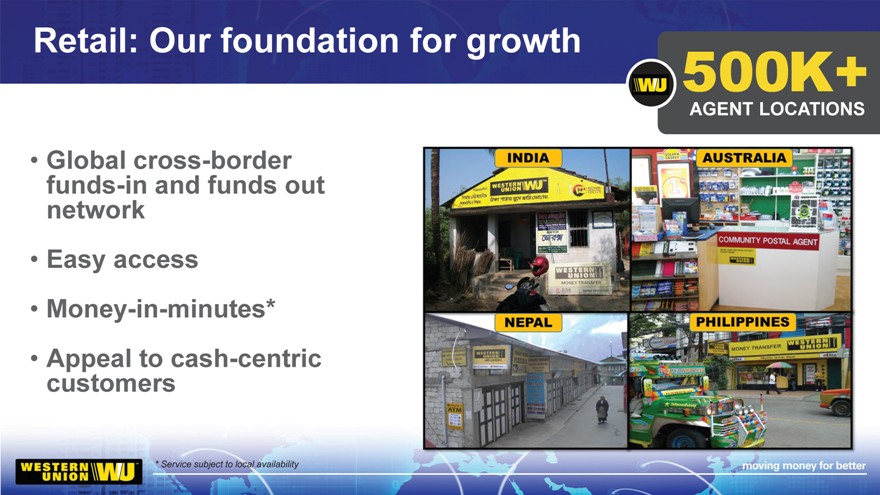
Retail: Our foundation for growth
500K+
Retail: Our foundation for growth AGENT LOCATIONS
Global cross-border funds-in and funds out network
Easy access
Money-in-minutes*
Appeal to cash-centric customers
* | | Service subject to local availability |
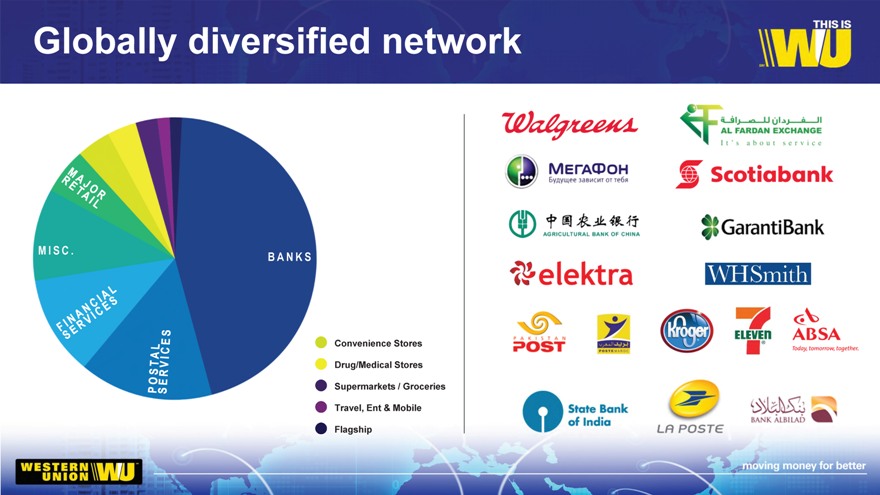
Globally diversified network
M I S C .
B A N K S
Convenience Stores Drug/Medical Stores Supermarkets / Groceries Travel, Ent & Mobile Flagship
Excellence in Execution DOUBLE-
DIGIT
REVENUE GROWTH IN 2015: WU.COM & TO ACCOUNTS
Excellence in Execution DOUBLE-
DIGIT
REVENUE GROWTH IN 2015: WU.COM & TO ACCOUNTS
Omni-channel messaging for cash and account
Introductory pricing into Account
Media and grassroots activation
Direct engagement with 150K+ consumers
Excellence in Execution
Consumer choice enabling faster-than-market growth
Multi-brand pay-in and pay-out options
Mexico pay-out network doubled in the last 2 years
DOUBLE-DIGIT
REVENUE GROWTH FY 2015
M E X I C O N E W S Locations expand for remittance receivers
Capitalizing on an opportunity
Approximately 300 workers’ facilities visited
Majority Asian population
Detailed mapping and activation
Over 180 promoters and brand ambassadors
150K
Nepal earthquake
Mobilization in 24hrs
Remote CSC Technology
Fee Waiver supported by global awareness
Committed Agents
72HRS
FULLY OPERATIONAL
Continuing the path of growth
Building our global funds in/out capabilities
Capitalization on global diaspora trends
Enhancing our customer experience
EVP and President Americas and European Union
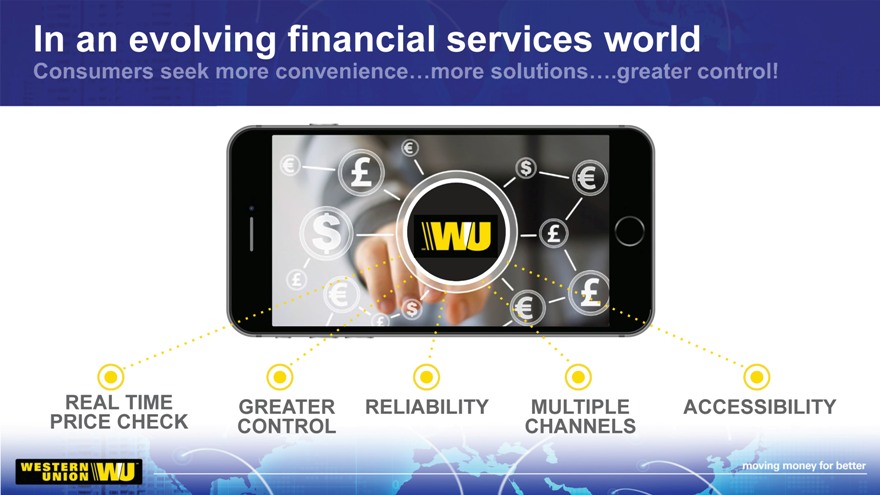
In an evolving financial services world
REAL TIME GREATER RELIABILITY MULTIPLE ACCESSIBILITY
PRICE CHECK CONTROL CHANNELS
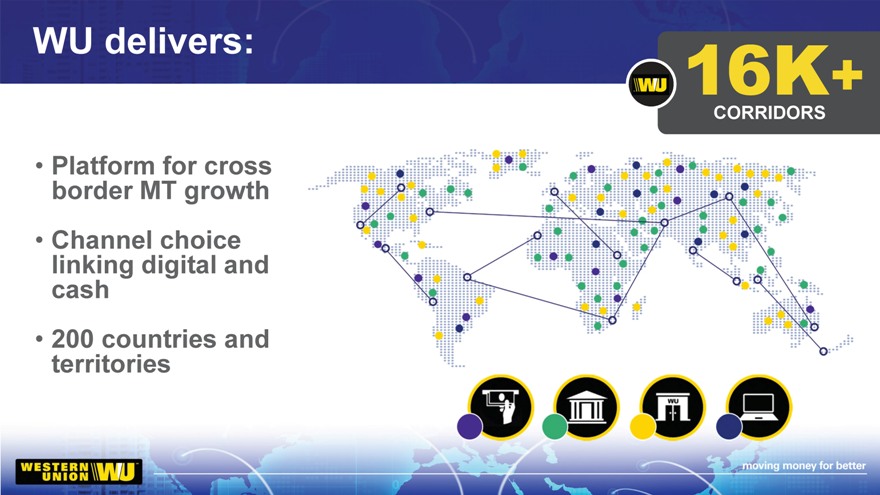
WU delivers:
16K+
CORRIDORS
Platform for cross border MT growth
Channel choice linking digital and cash
200 countries and territories
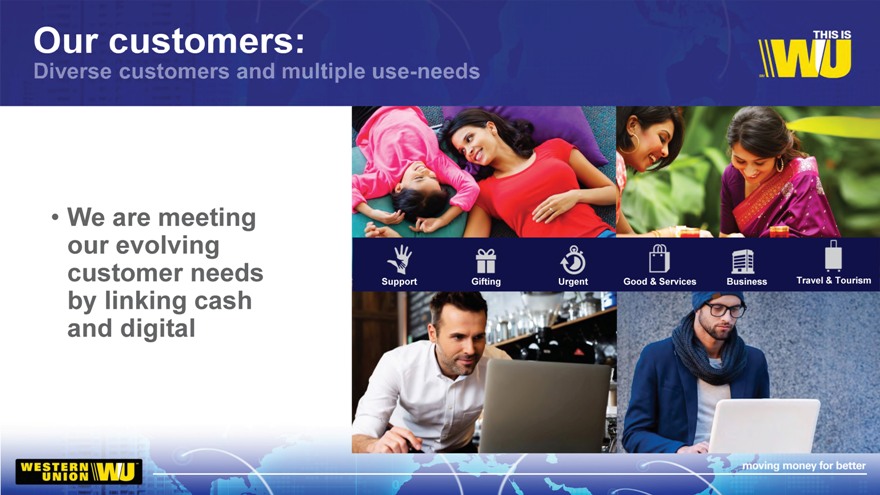
Our customers:
We are meeting our evolving
customer needs Support Gifting Urgent Good & Services Business Travel & Tourism
by linking cash and digital
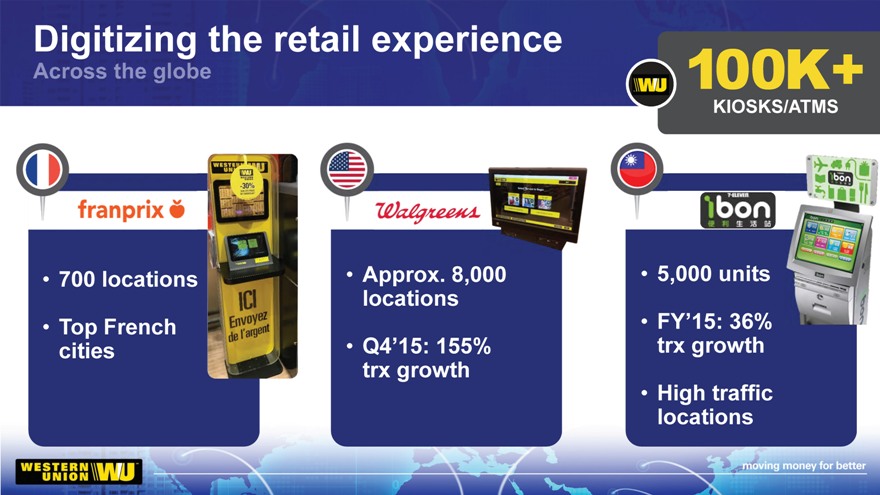
Digitizing the retail experience
100K+
KIOSKS/ATMS
700 locations Approx. 8,000 5,000 units
locations
Top French FY’15: 36%
cities Q4’15: 155% trx growth
trx growth
High traffic
locations
15
Excellence in Execution
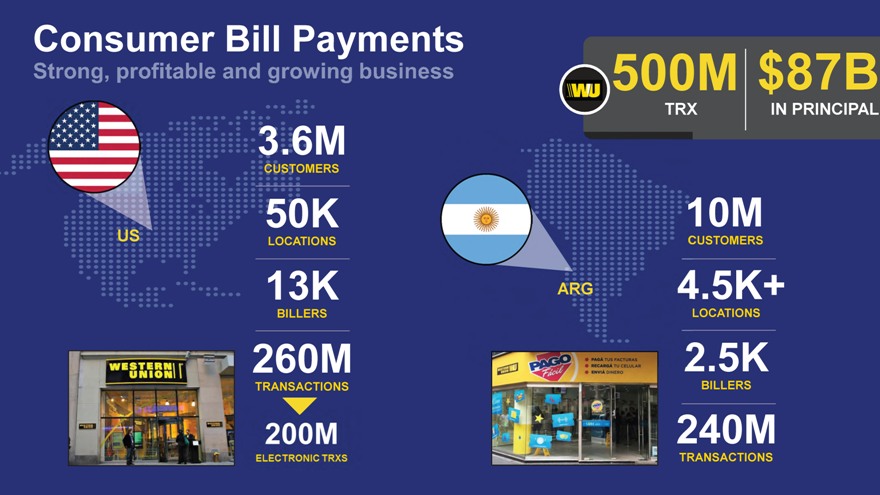
Consumer Bill Payments
500M $87B
TRX IN PRINCIPAL
3.6M
CUSTOMERS
50K 10M
US LOCATIONS USTOMERS
13K ARG .5K+
BILLERS LOCATIONS
260M 2.5K
TRANSACTIONS BILLERS
240M
TRANSACTIONS
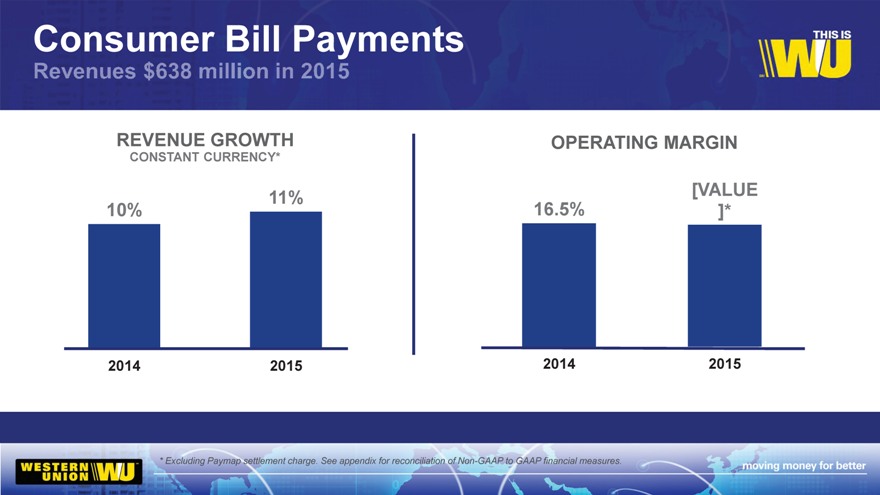
Consumer Bill Payments
REVENUE GROWTH OPERATING MARGIN
CONSTANT CURRENCY*
11% [VALUE
10% 16.5% ]*
2014 2015 2014 2015
* | | Excluding Paymap settlement charge. See appendix for reconciliation of Non-GAAP to GAAP financial measures. |
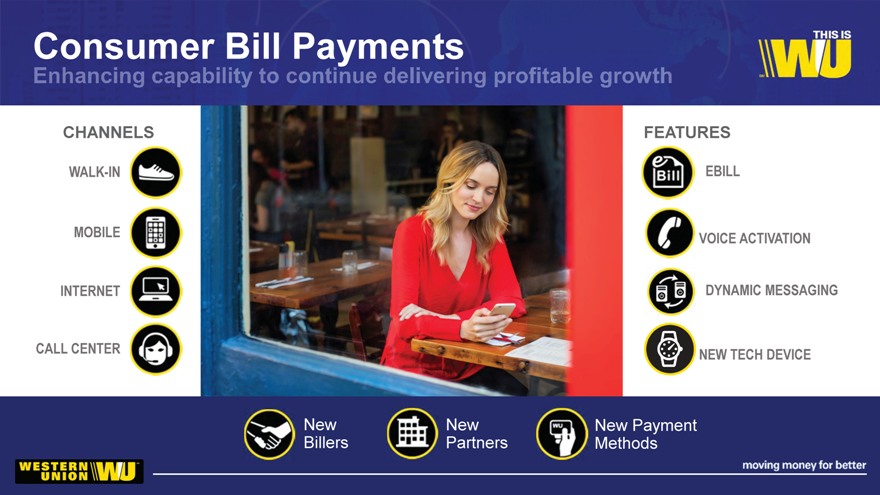
Consumer Bill Payments
CHANNELS FEATURES
WALK-IN EBILL
MOBILE VOICE ACTIVATION
INTERNET DYNAMIC MESSAGING
CALL CENTER NEW TECH DEVICE
New New New Payment
Billers Partners Methods
TESTIMONIAL VIDEO
20
SVP and GM, WU Digital
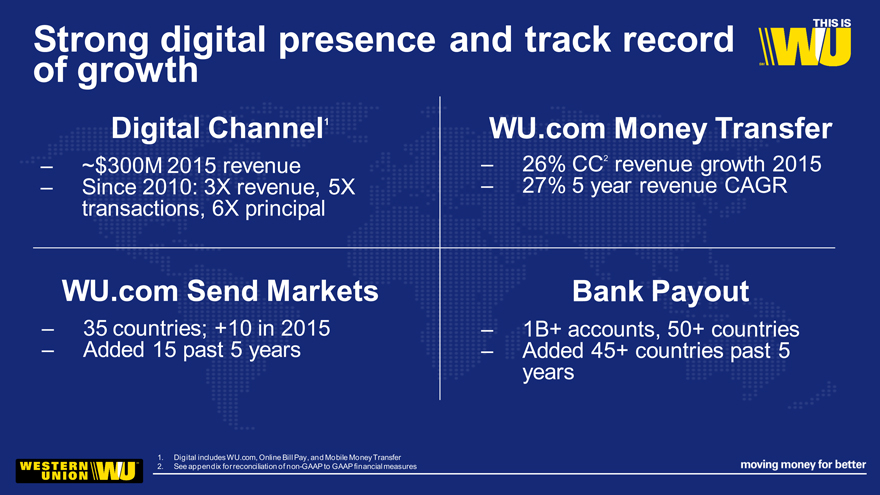
Strong digital presence and track record
of growth
Digital Channel1 WU.com Money Transfer
? ~$300M 2015 revenue ? 26% CC2 revenue growth 2015
? Since 2010: 3X revenue, 5X ? 27% 5 year revenue CAGR
transactions, 6X principal
WU.com Send Markets Bank Payout
? 35 countries; +10 in 2015 ? 1B+ accounts, 50+ countries
? Added 15 past 5 years ? Added 45+ countries past 5
years
1. Digital includes WU.com, Online Bill Pay, and Mobile Money Transfer
2. See appendix for reconciliation of non-GAAP to GAAP financial measures
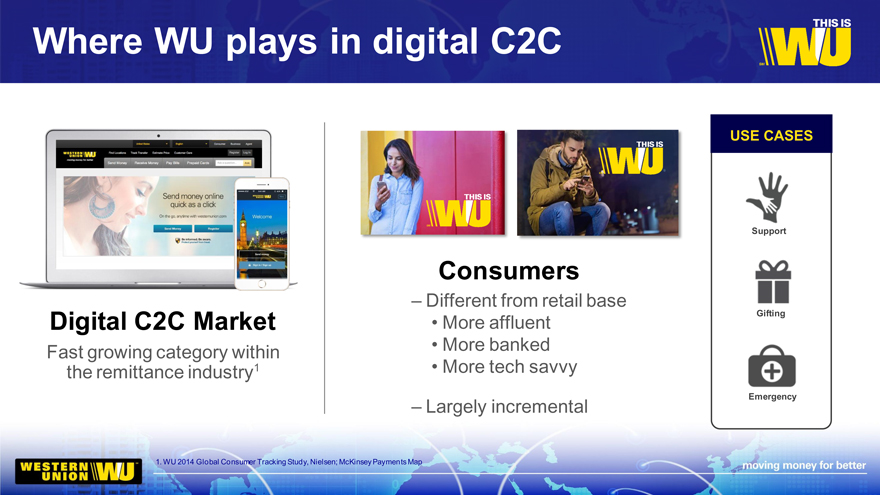
Where WU plays in digital C2C
USE CASES
Support
Consumers
– Different from retail base
Digital C2C Market More affluent Gifting
Fast growing category within More banked
the remittance industry1 More tech savvy
Emergency
– Largely incremental
1. WU 2014 Global Consumer Tracking Study, Nielsen; McKinsey Payments Map
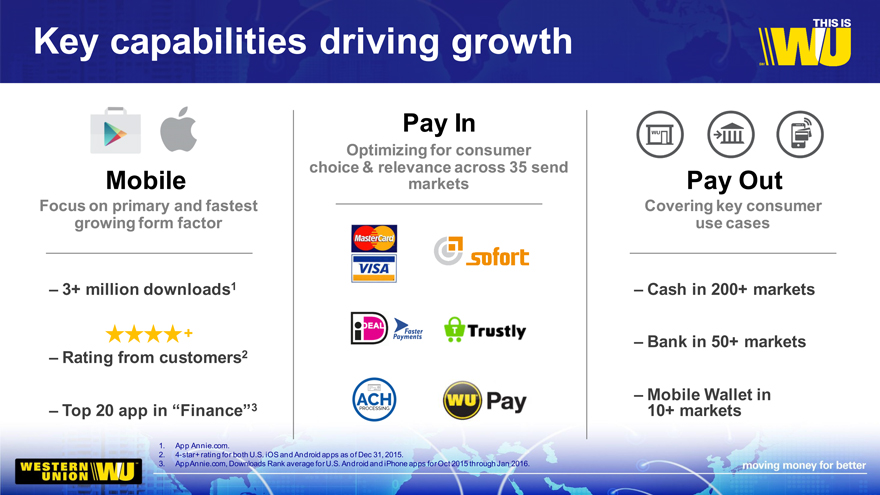
Key capabilities driving growth
Pay In
Mobile
– 3+ million downloads1 – Cash in 200+ markets
+ – Bank in 50+ markets
– Rating from customers2
– Mobile Wallet in
– Top 20 app in “Finance“3 10+ markets
1. App Annie.com.
2. 4-star+ rating for both U.S. iOS and Android apps as of Dec 31, 2015.
3. AppAnnie.com, Downloads Rank average for U.S. Android and iPhone apps for Oct 2015 through Jan 2016.
Key capabilities driving growth
Mobile
– 3+ million downloads1
+
– Rating from customers2
– Top 20 app in “Finance“3
1. App Annie.com.
2. 4-star+ rating for both U.S. iPhone and Android apps as of Dec 31, 2015.
3. AppAnnie.com, Downloads Rank average for U.S. Android and iPhone apps for Oct 2015 through Jan 2016.
Key capabilities driving growth
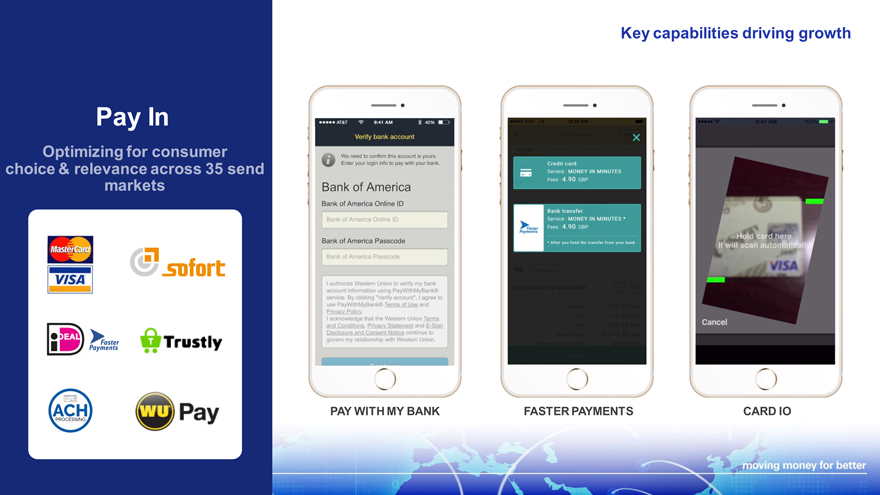
Pay In Optimizing for consumer choice & relevance across 35 send markets
PAY WITH MY BANK FASTER PAYMENTS CARD IO
Key capabilities driving growth
India Direct to Bank Send
Pay Out
– Cash in 200+ markets
– Bank in 50+ markets
Sent: 4:41 EDT Received: 4:47 EDT
– Mobile Wallet in 10+ markets
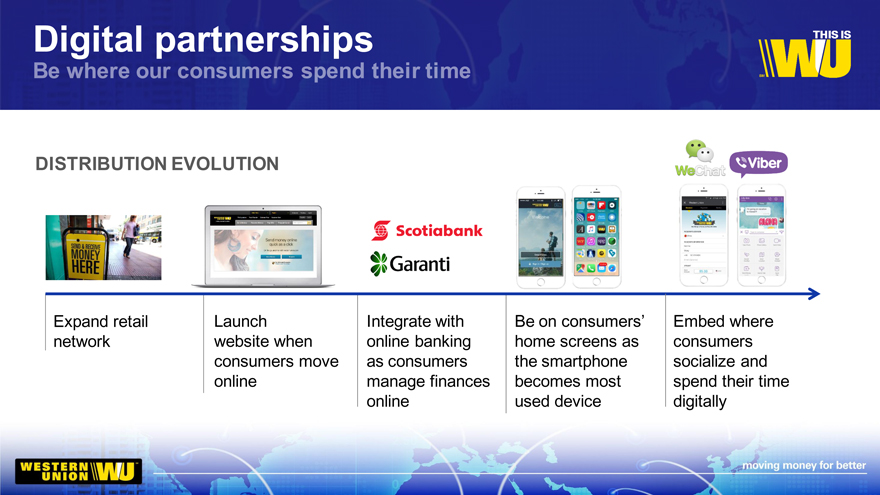
Digital partnerships
DISTRIBUTION EVOLUTION
Expand retail Launch Integrate with Be on consumers’ Embed where
network website when online banking home screens as consumers
consumers move as consumers the smartphone socialize and
online manage finances becomes most spend their time
online used device digitally
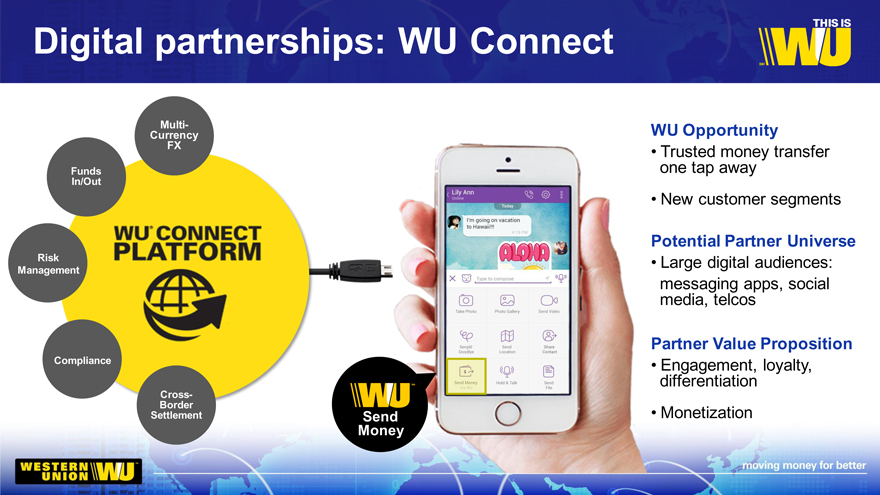
Digital partnerships: WU Connect
Multi- WU Opportunity
Currency
FX Trusted money transfer
Funds one tap away
In/Out
New customer segments
Potential Partner Universe
Risk Large digital audiences:
Management
messaging apps, social
media, telcos
Partner Value Proposition
Compliance Engagement, loyalty,
differentiation
Cross-
Settlement Border Send Monetization
Money
THIS IS KERRY AGIASOTIS
President, Western Union Business Solutions
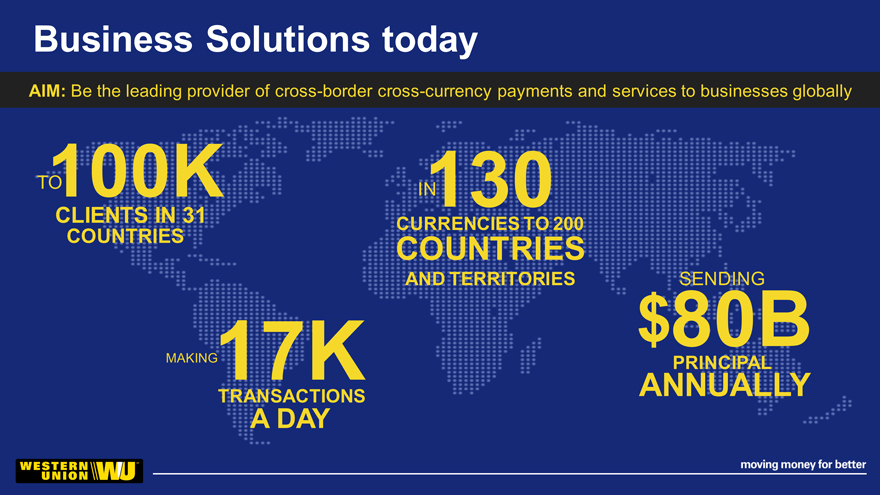
Business Solutions today
AIM: Be the leading provider of cross-border cross-currency payments and services to businesses globally
TO
100K
CLIENTS IN 31
COUNTRIES
130
CURRENCIES TO 200
COUNTRIES
AND TERRITORIES
17K
MAKING
TRANSACTIONS
A DAY
SENDING
$ 80B
PRINCIPAL
ANNUALLY
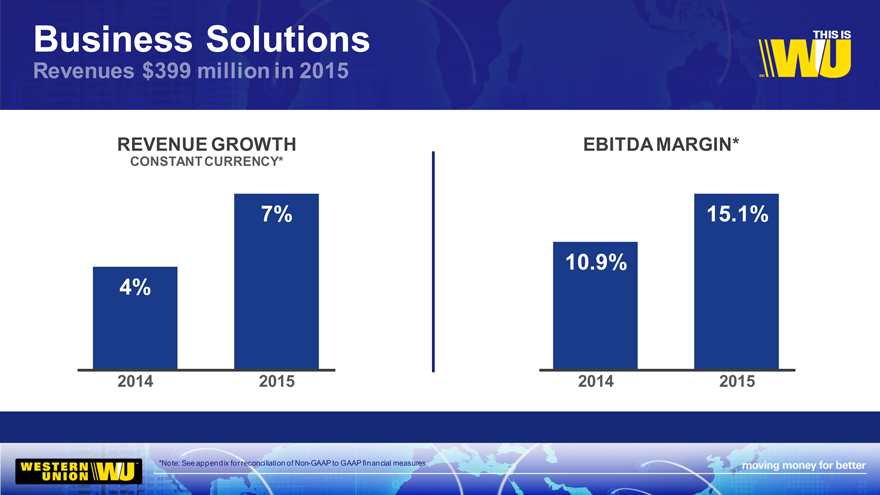
Business Solutions
Revenues $399 million in 2015
REVENUE GROWTH
CONSTANT CURRENCY*
7%
4%
2014 2015
EBITDA MARGIN*
15.1%
10.9%
2014 2015
*Note: See appendix for reconciliation of Non-GAAP to GAAP financial measures.
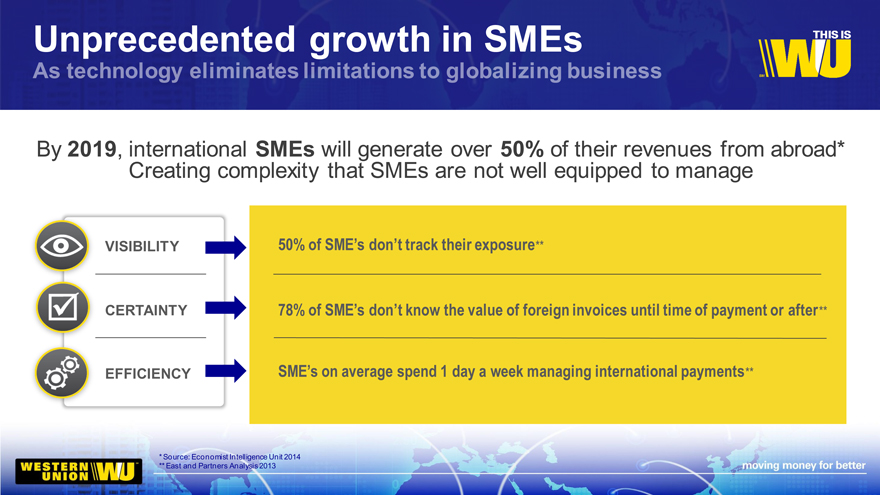
Unprecedented growth in SMEs
By 2019, international SMEs will generate over 50% of their revenues from abroad*
Creating complexity that SMEs are not well equipped to manage
VISIBILITY 50% of SME’s don’t track their exposure**
CERTAINTY 78% of SME_s don_t know the value of foreign invoices until time of payment or after**
EFFICIENCY SME_s on average spend 1 day a week managing international payments**
Source: Economist Intelligence Unit 2014
East and Partners Analysis 2013
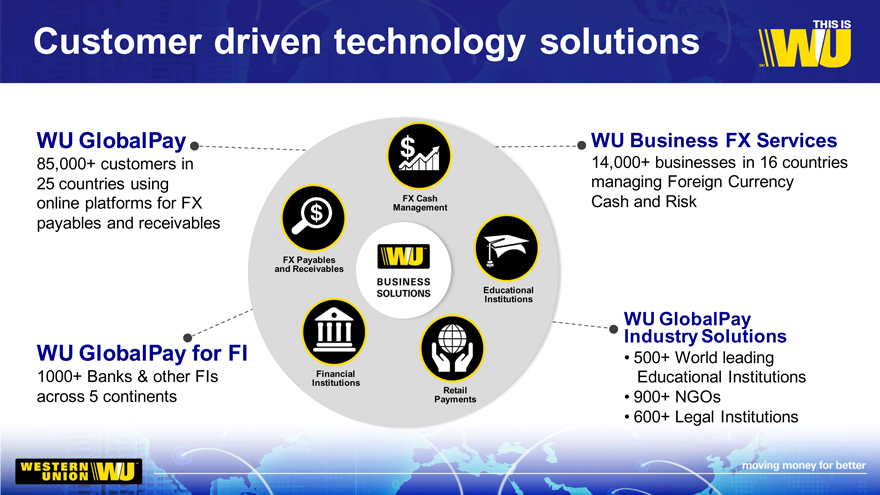
Customer driven technology solutions
WU GlobalPay WU Business FX Services
85,000+ customers in 14,000+ businesses in 16 countries
25 countries using managing Foreign Currency
online platforms for FX FX Cash Cash and Risk
Management
payables and receivables
FX Payables
and Receivables
Educational
Institutions
WU GlobalPay
Industry Solutions
WU GlobalPay for FI 500+ World leading
1000+ Banks & other FIs Institutions Financial Educational Institutions
across 5 continents Payments Retail 900+ NGOs
600+ Legal Institutions

Customer success
“I can set profit margins and budgets more
effectively.” – Jo Sujana, Director, Gideon
Services Inc.
SOLUTION:
GlobalPay
BUSINESS NEEDS
Streamlined solution for capturing and managing foreign invoices and sales orders
Greater visibility and management of fx exposures
Reduction in the time & effort to manage international payments and receipts
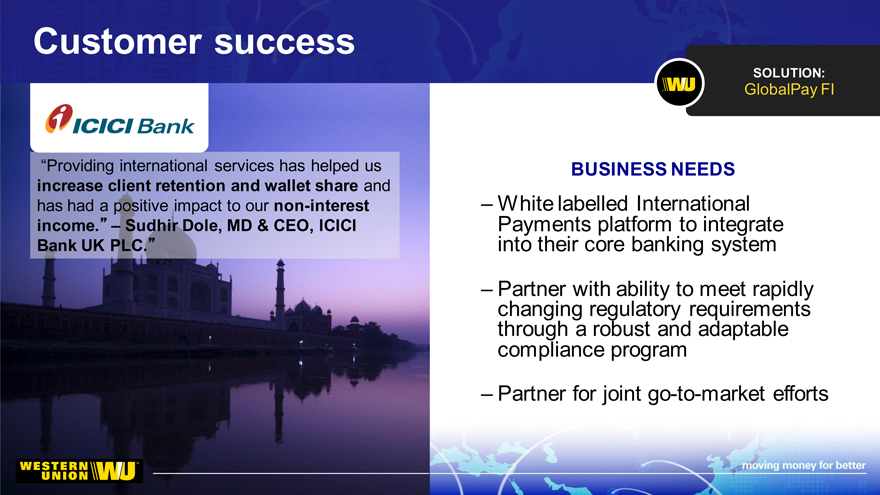
Customer success
_Providing international services has helped us increase client retention and wallet share and has had a positive impact to our non-interest income. Sudhir Dole, MD & CEO, ICICI Bank UK PLC._
[Graphic Appears Here]
SOLUTION:
GlobalPay FI
BUSINESS NEEDS
White labelled International Payments platform to integrate into their core banking system
Partner with ability to meet rapidly changing regulatory requirements through a robust and adaptable compliance program
Partner for joint go-to-market efforts
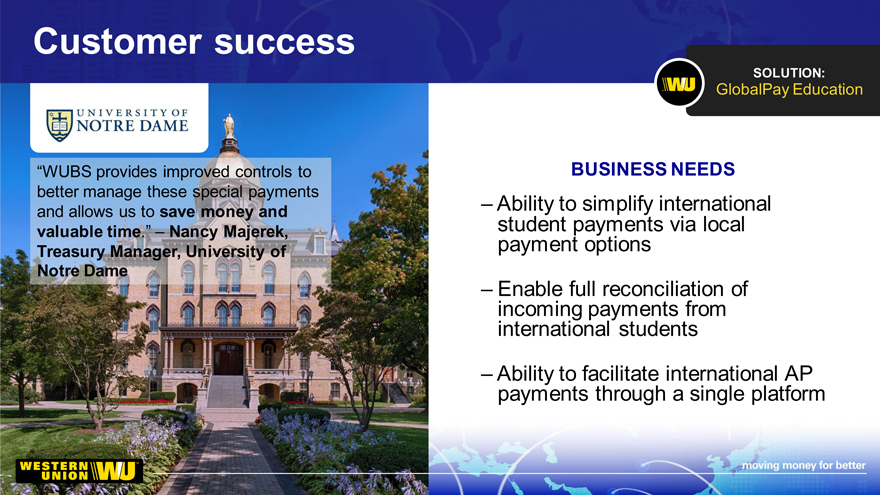
Customer success
SOLUTION:
GlobalPay Education
“WUBS provides improved controls to BUSINESS NEEDS
better manage these special payments
and allows us to save money and – Ability to simplify international
valuable time.” – Nancy Majerek, student payments via local
Treasury Manager, University of payment options
Notre Dame
– Enable full reconciliation of
incoming payments from
international students
– Ability to facilitate international AP
payments through a single platform
[Graphic Appears Here]
Customer success
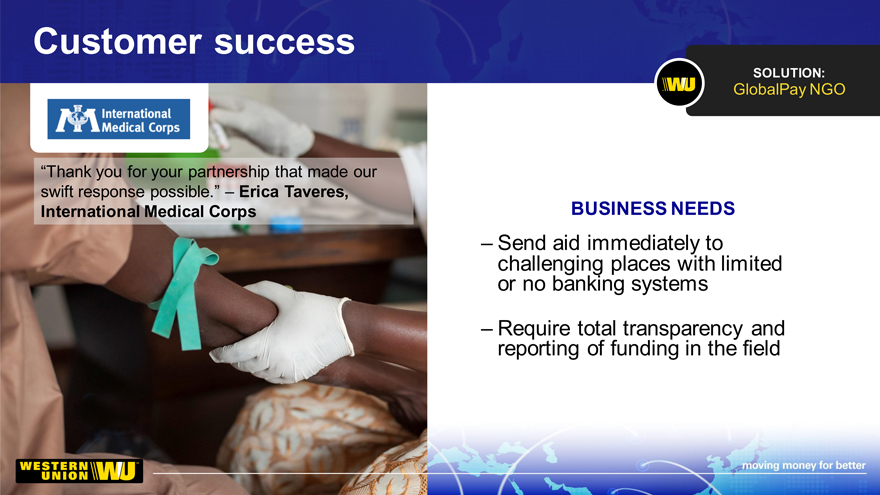
_Thank you for your partnership that made our swift response possible. Erica Taveres,
International Medical Corps
[Graphic Appears Here]
SOLUTION:
GlobalPay NGO
BUSINESS NEEDS
Send aid immediately to challenging places with limited or no banking systems
Require total transparency and reporting of funding in the field
NGO GLOBALPAY VIDEO
10
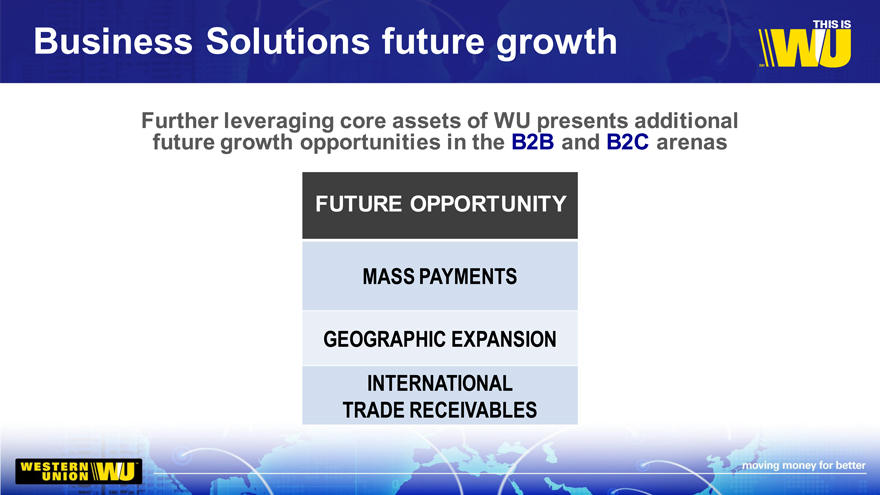
Business Solutions future growth
Further leveraging core assets of WU presents additional
future growth opportunities in the B2B and B2C arenas
FUTURE OPPORTUNITY
MASS PAYMENTS
GEOGRAPHIC EXPANSION
INTERNATIONAL
TRADE RECEIVABLES
This is RAJ AGARWAL
EVP and CFO
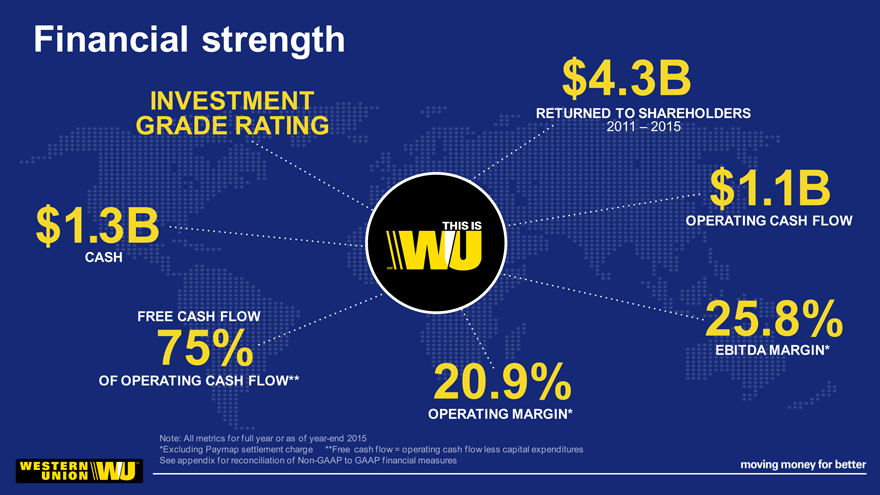
Financial strength
INVESTMENT
$4.3B
RETURNED TO SHAREHOLDERS
GRADE RATING
2011 – 2015
$1.1B
$1.3B
OPERATING CASH FLOW
CASH
FREE CASH FLOW
25.8%
75%
EBITDA MARGIN*
OF OPERATING CASH FLOW**
20.9%
OPERATING MARGIN*
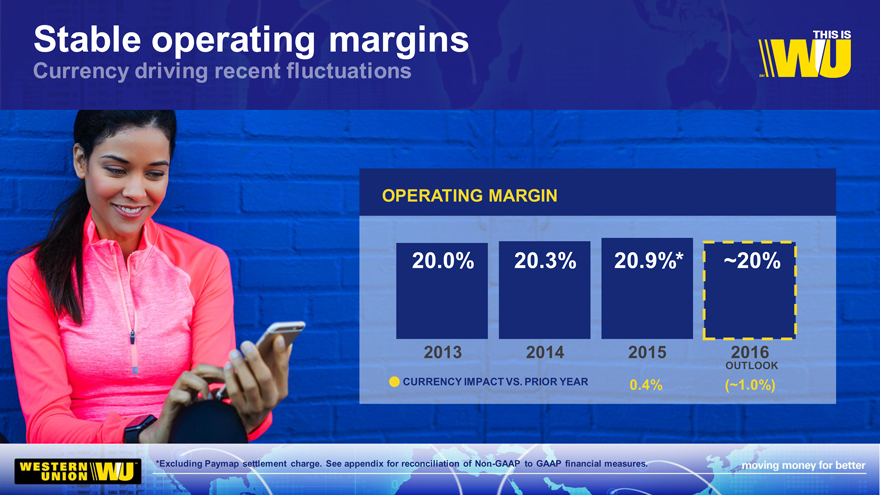
Stable operating margins
Currency driving recent fluctuations
OPERATING MARGIN
20.0%
20.3%
20.9%*
~20%
2013 2014 2015 2016
OUTLOOK
CURRENCY IMPACT VS. PRIOR YEAR 0.4% (~1.0%)
*Excluding Paymap settlement charge. See appendix for reconciliation of Non-GAAP to GAAP financial measures.
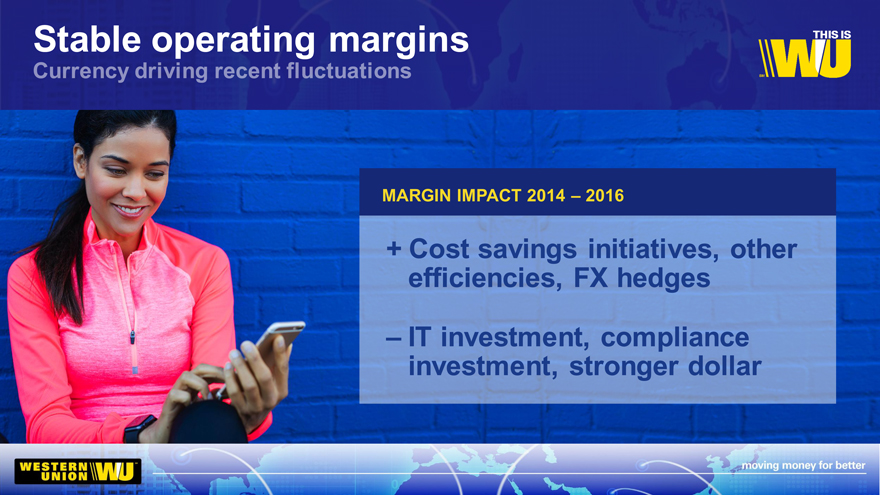
Stable operating margins
MARGIN IMPACT 2014 – 2016
+ Cost savings initiatives, other
efficiencies, FX hedges
– IT investment, compliance
investment, stronger dollar
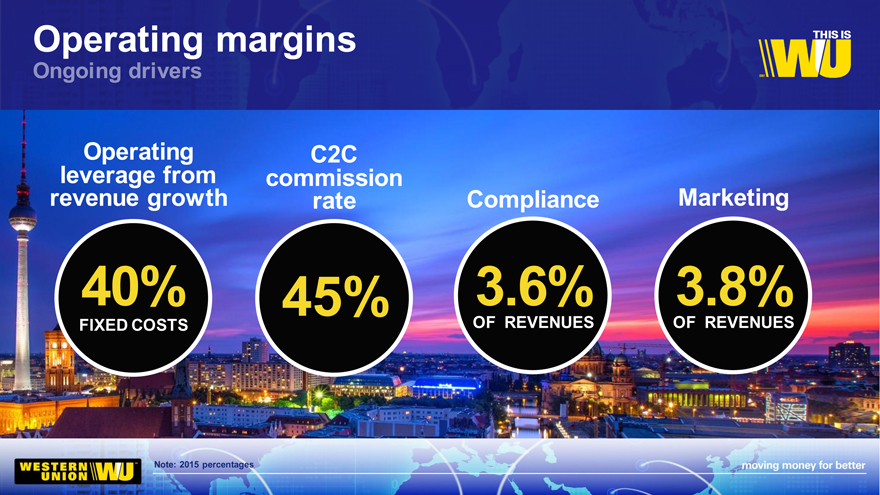
Operating margins
Operating leverage from revenue growth
C2C commission rate
Compliance
Marketing
40% 45% 3.6% 3.8%
FIXED COSTS OF REVENUES OF REVENUES
Note: 2015 percentages

Operating margins
Cost savings Currency/ New
initiatives hedges businesses
– Models still
HEDGES evolving
$32M MINIMIZE
NEAR-TERM – IT investment
INCREMENTAL FX IMPACTS ON – Incremental
SAVINGS 2015 PROFIT revenue is key

Capital allocation
Reinvest in business
CAPITAL SPENDING
4%
OF REVENUES 2013 – 2015
Return to shareholders
– Balanced payout between dividends and share repurchases
– Maintain investment grade rating
Strategic M&A
– Evaluate opportunities in cross-border money movement
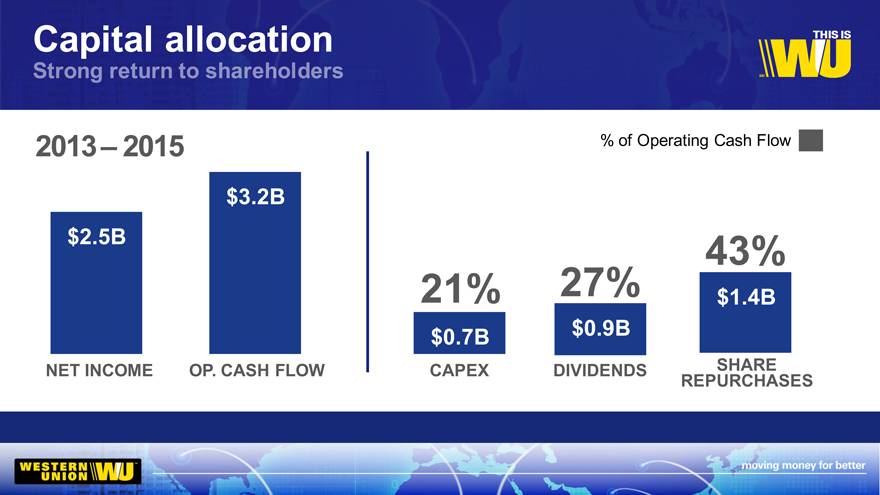
Capital allocation
2013 – 2015 % of Operating Cash Flow
$3.2B
$2.5B 43%
21% 27% $1.4B
$0.7B $0.9B
NET INCOME OP. CASH FLOW CAPEX DIVIDENDS SHARE
REPURCHASES
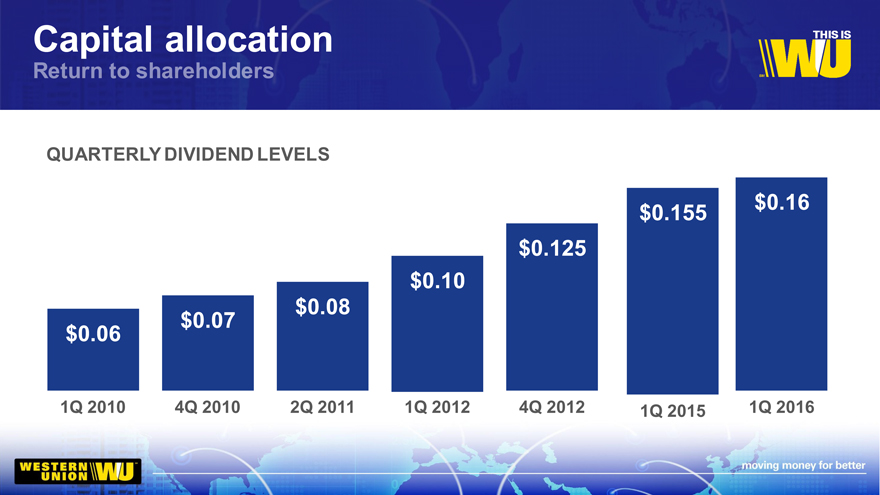
Capital allocation
QUARTERLY DIVIDEND LEVELS
$0.16
$0.155
$0.125
$0.10
$0.08
$0.07
$0.06
1Q 2010
4Q 2010
2Q 2011
1Q 2012
4Q 2012
1Q 2015
1Q 2016
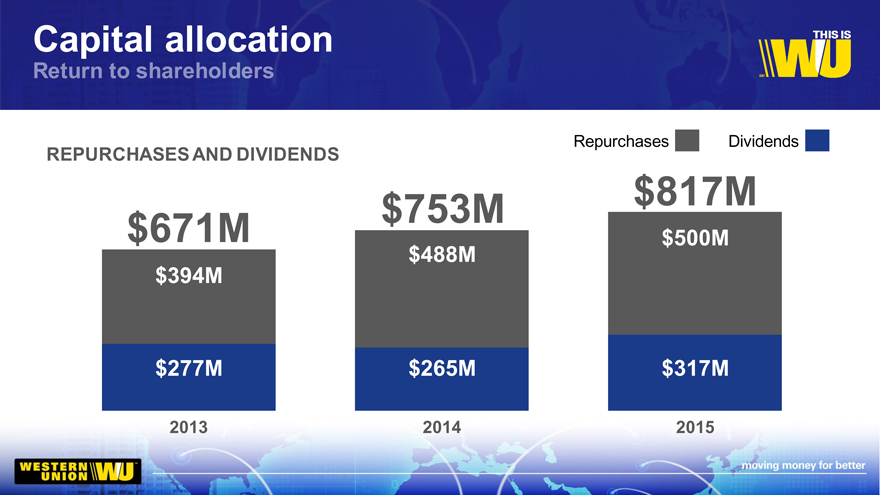
Capital allocation
Repurchases Dividends
REPURCHASES AND DIVIDENDS
$753M $817M
$671M $500M
$488M
$394M
$277M
$265M
$317M
2013
2014
2015
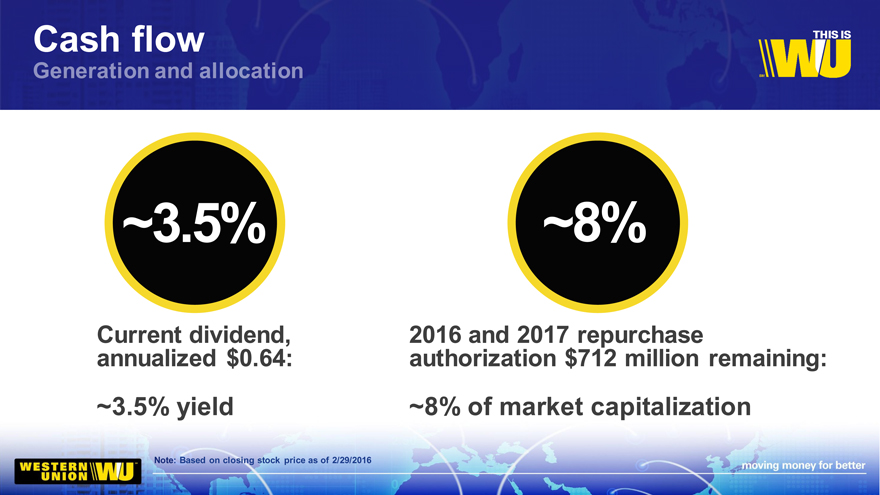
Cash flow
~3.5%
~8%
Current dividend, 2016 and 2017 repurchase
annualized $0.64: authorization $712 million remaining:
~3.5% yield ~8% of market capitalization
Note: Based on closing stock price as of 2/29/2016

Solid core business generating
strong cash flow combined with strong balance sheet
– Provides flexibility for – Allows for continued
growth investments high returns of cash
flow to shareholders
Non GAAP Measures
Western Union’s management believes the non-GAAP financial measures presented provide meaningful supplemental information regarding our operating results to assist management, investors, analysts, and others in understanding our financial results and to better analyze trends in our underlying business, because they provide consistency and comparability to prior periods.
These non-GAAP financial measures include revenue change constant currency adjusted; operating income margin, excluding Paymap settlement agreement; EBITDA margin; adjusted EBITDA margin, excluding Paymap settlement agreement; diluted earnings per share, excluding Paymap settlement agreement; Consumer-to-Consumer segment revenue change constant currency adjusted; Consumer-to-Consumer segment retail initiated money transfer revenue change, constant currency adjusted; Consumer-to-Consumer segment westernunion.com region revenue change constant currency adjusted; Consumer-to-Business segment revenue change constant currency adjusted; Consumer-to-Business segment adjusted operating income margin, excluding Paymap settlement agreement; Business Solutions segment revenue change constant currency adjusted; and Business Solutions segment EBITDA margin. Constant currency results assume foreign revenues are translated from foreign currencies to the U.S. dollar, net of the effect of foreign currency hedges, at rates consistent with those in the prior year.
A non-GAAP financial measure should not be considered in isolation or as a substitute for the most comparable GAAP financial measure. A non-GAAP financial measure reflects an additional way of viewing aspects of our operations that, when viewed with our GAAP results and the reconciliation to the corresponding GAAP financial measure, provide a more complete understanding of our business. Users of the financial statements are encouraged to review our financial statements and publicly-filed reports in their entirety and not to rely on any single financial measure. A reconciliation of non-GAAP financial measures to the most directly comparable GAAP financial measures is included below. All adjusted year-over-year changes were calculated using prior year reported amounts. Amounts included below are in millions, unless indicated otherwise.
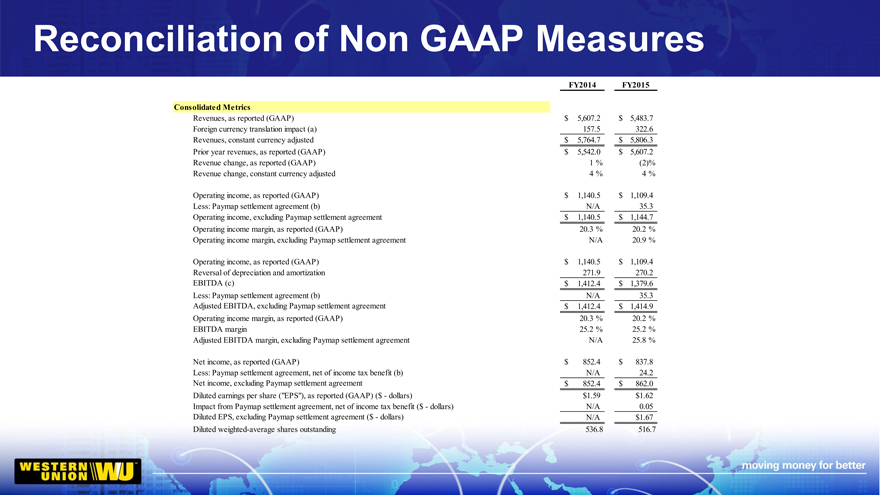
Reconciliation of Non GAAP Measures
FY2014 FY2015
Consolidated Metrics
Revenues, as reported (GAAP) $ 5,607.2 $ 5,483.7
Foreign currency translation impact (a) 157.5 322.6
Revenues, constant currency adjusted $ 5,764.7 $ 5,806.3
Prior year revenues, as reported (GAAP) $ 5,542.0 $ 5,607.2
Revenue change, as reported (GAAP) 1 % (2)%
Revenue change, constant currency adjusted 4 % 4 %
Operating income, as reported (GAAP) $ 1,140.5 $ 1,109.4
Less: Paymap settlement agreement (b) N/A 35.3
Operating income, excluding Paymap settlement agreement $ 1,140.5 $ 1,144.7
Operating income margin, as reported (GAAP) 20.3 % 20.2 %
Operating income margin, excluding Paymap settlement agreement N/A 20.9 %
Operating income, as reported (GAAP) $ 1,140.5 $ 1,109.4
Reversal of depreciation and amortization 271.9 270.2
EBITDA (c) $ 1,412.4 $ 1,379.6
Less: Paymap settlement agreement (b) N/A 35.3
Adjusted EBITDA, excluding Paymap settlement agreement $ 1,412.4 $ 1,414.9
Operating income margin, as reported (GAAP) 20.3 % 20.2 %
EBITDA margin 25.2 % 25.2 %
Adjusted EBITDA margin, excluding Paymap settlement agreement N/A 25.8 %
Net income, as reported (GAAP) $ 852.4 $ 837.8
Less: Paymap settlement agreement, net of income tax benefit (b) N/A 24.2
Net income, excluding Paymap settlement agreement $ 852.4 $ 862.0
Diluted earnings per share (“EPS”), as reported (GAAP) ($—dollars) $1.59 $1.62
Impact from Paymap settlement agreement, net of income tax benefit ($—dollars) N/A 0.05
Diluted EPS, excluding Paymap settlement agreement ($—dollars) N/A $1.67
Diluted weighted-average shares outstanding 536.8 516.7
Reconciliation of Non GAAP Measures
FY2014 FY2015
Consumer-to-Consumer Segment
Revenues, as reported (GAAP) $ 4485, .8 $ 4,343.9
Foreign currency translation impact (a) 80.7 256.0
Revenues, constant currency adjusted $ 4,566.5 $ 4,599.9
Prior year revenues, as reported (GAAP) $ 4,433.6 $ 4,485.8
Revenue change, as reported (GAAP) 1 % (3)%
Revenue change, constant currency adjusted 3 % 3 %
Consumer-to-Consumer segment retail initiated money transfer revenue change, as reported (GAAP) 0 % (4)%
Consumer-to-Consumer segment retail initiated money transfer foreign currency translation impact (a) 2 % 5 %
Consumer-to-Consumer segment retail initiated money transfer revenue change, constant currency adjusted 2 % 1 %
westernunion.com region revenue change, as reported (GAAP) 28 % 21 %
westernunion.com region foreign currency translation impact (a) 1 % 5 %
westernunion.com region revenue change, constant currency adjusted 29 % 26 %
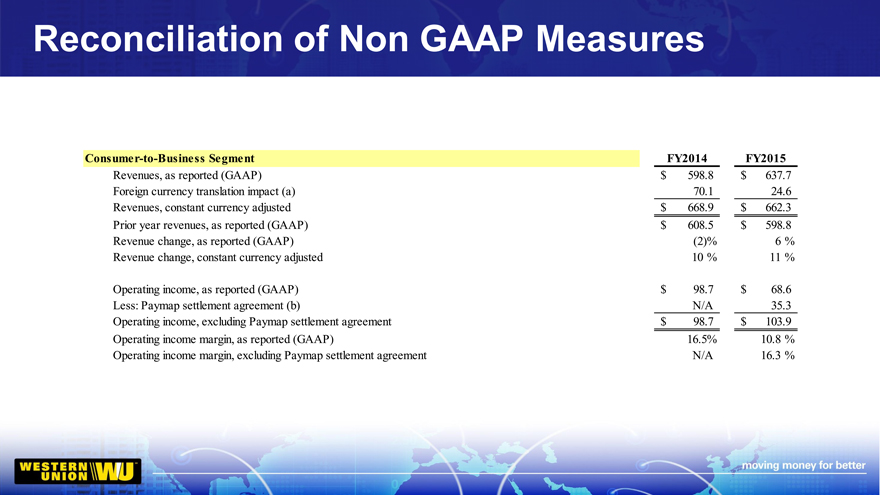
Reconciliation of Non GAAP Measures
Consumer-to-Business Segment FY2014 FY2015
Revenues, as reported (GAAP) $ 598.8 $ 637.7
Foreign currency translation impact (a) 70.1 24.6
Revenues, constant currency adjusted $ 668.9 $ 662.3
Prior year revenues, as reported (GAAP) $ 608.5 $ 598.8
Revenue change, as reported (GAAP) (2)% 6 %
Revenue change, constant currency adjusted 10 % 11 %
Operating income, as reported (GAAP) $ 98.7 $ 68.6
Less: Paymap settlement agreement (b) N/A 35.3
Operating income, excluding Paymap settlement agreement $ 98.7 $ 103.9
Operating income margin, as reported (GAAP) 16.5% 10.8 %
Operating income margin, excluding Paymap settlement agreement N/A 16.3 %
Reconciliation of Non GAAP Measures
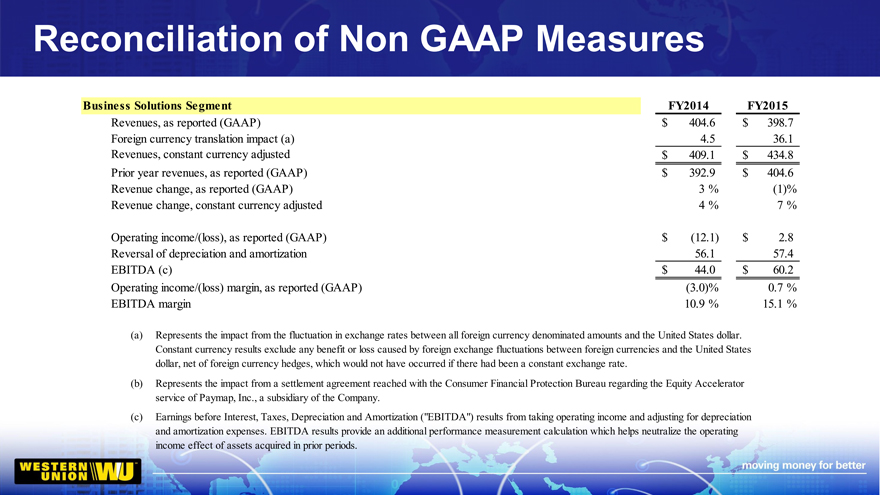
Business Solutions Segment FY2014 FY2015
Revenues, as reported (GAAP) $ 404.6 $ 398.7
Foreign currency translation impact (a) 4.5 36.1
Revenues, constant currency adjusted $ 409.1 $ 434.8
Prior year revenues, as reported (GAAP) $ 392.9 $ 404.6
Revenue change, as reported (GAAP) 3 % (1)%
Revenue change, constant currency adjusted 4 % 7 %
Operating income/(loss), as reported (GAAP) $ (12.1) $ 2.8
Reversal of depreciation and amortization 56.1 57.4
EBITDA (c) $ 44.0 $ 60.2
Operating income/(loss) margin, as reported (GAAP) (3.0)% 0.7 %
EBITDA margin 10.9 % 15.1 %
(a) Represents the impact from the fluctuation in exchange rates between all foreign currency denominated amounts and the United States dollar. Constant currency results exclude any benefit or loss caused by foreign exchange fluctuations between foreign currencies and the United States dollar, net of foreign currency hedges, which would not have occurred if there had been a constant exchange rate.
(b) Represents the impact from a settlement agreement reached with the Consumer Financial Protection Bureau regarding the Equity Accelerator service of Paymap, Inc., a subsidiary of the Company.
(c) Earnings before Interest, Taxes, Depreciation and Amortization (“EBITDA”) results from taking operating income and adjusting for depreciation and amortization expenses. EBITDA results provide an additional performance measurement calculation which helps neutralize the operating income effect of assets acquired in prior periods.