
AmTrust Financial
Exhibit 99.1

Forward Looking Statements
This presentation may include forward-looking statements. These forward-looking
statements include comments with respect to our objectives and strategies, and the
results of our operations and business.
By their nature, however, these forward-looking statements involve numerous
assumptions, risks, uncertainties and opportunities, both general and specific. The
risk exists that these statements may not be fulfilled. Investors should not place
undue reliance on these forward-looking statements as a number of factors could
cause future company results to differ materially from these statements.
Potential risks and uncertainties include effects of government regulation, the
outcome of our efforts to manage growth, the extent to which our premium rates and
reserves are adequate, the extent of availability of reinsurance on favorable terms,
changes in our financial ratings, the outcome of our efforts to enter our new specialty
middle-market property and casualty segment, ability to retain and recruit key
executives and other key personnel and changes in general economic conditions,
including inflation and other factors.
When relying on forward-looking statements to make decisions, investors should
carefully consider the aforementioned factors as well as other uncertainties and
events including those discussed in the “Forward-Looking Statements” and “Risk
Factors” sections of the prospectus.
2

Who We Are
Multinational specialty property and casualty insurance company
NASDAQ ticker symbol “AFSI”
Inside ownership 57%
“A-” rating from A.M. Best
We focus on underserved, niche markets:
Low hazard
Predictable
Non-catastrophic
Low volatility
High ROE business model (22.7% annualized for Q1 2008)
3

Company Financial Highlights
Gross Premium Written
Net Income from
Continuing Operations
$97.5
$210.9
$526.0
$286.1
$839.4
$286.1
$210.9
$97.5
$89.8
$89.3
$57.7
$51.9
$87.8
$47.9
$189.7
$234.8
$22.3
$21.5
$17.5
$25.7
All graphs represent figures in millions
4
Business Overview
$89.3 MM GPW in Q1 2008
$308.8 MM GPW in 2007
$87.8 MM
$306.4 MM
$57.7 MM
$224.2 MM
Specialty Middle-Market P&C
Insurance
Specialty Risk and Extended
Warranty
Small Business Workers’
Compensation
Mix of Business
US only (40 states and DC)
Main Street small businesses
Low-hazard
Typically underserved
by larger carriers
Europe, US
Warranty coverage for selected
consumer and commercial goods
55% of GPW in 2007 was written
outside US
US only (nationwide)
Low hazard
Specialty commercial programs
with MGAs
5

Small Business Workers’ Compensation
Target Customers
Low to mid hazard small
businesses
Restaurants
Retail
Average annual premium
less than $5,000
Average 6 employees
Competitors include
state funds and
regional carriers
AmTrust Approach
Cost efficient expense
control
Paperless proprietary
underwriting system
Risks individually
underwritten
Prompt response to
agents and insureds
9,000 active agents
Result
$89.3 MM GPW Q1 2008
$308.8 MM GPW in 2007
Historically high retention and
renewal rates (over 80%)
Historical organic premium
growth of over 15% annually
Combined ratio of 76.3% for
Q1 2008
Combined ratio of 81.7%
for 2007
We focus on low hazard small businesses
6

Specialty Risk and Extended Warranty
We provide extended warranties for a wide range
of consumer and commercial goods
Target Customers
Manufacturers and retailers
of consumer and
commercial goods
Benefit from profit center
or cost reduction
Low-hazard
Non-catastrophic
Covered products include
yellow goods and laptops
AmTrust Approach
Extensive front-end
diligence and actuarial
review for each new
product and client
Develop customized and
strictly defined policy forms
that fit the needs of the client
Proactively managing
claims and adjusting
premiums if needed
Result
$87.8 MM GPW in Q1 2008
$306.4 MM GPW in 2007
Cost effective for
warranty buyer
Europe (55% of GPW
for 2007)
Combined ratio of 71.9% for
Q1 2008
Combined ratio of 80.8%
for 2007
7

Specialty Middle Market P&C
Target Customers
Retail, wholesale, service
operations
Workers’ compensation
General liability
Commercial auto liability
Distributed through
wholesalers with geographic
and product expertise
AmTrust Approach
Extensive front-end
diligence and actuarial
review for each new
product and client
Develop customized and
strictly defined policy forms
that fit the needs of the client
Leverage proprietary
technology systems to
process business efficiently
MGA shares in the
underwritten risk
Result
$57.7 MM GPW in Q1 2008
$224.2 MM GPW in 2007
Diverse book of commercial
program business
Combined ratio of 86.4% for Q1
2008
Combined ratio of 90.1%
for 2007
Expansion of workers’ comp, general liability &
commercial auto and property coverage
8

Since 1998, we have grown our business organically and through:
Key hires of underwriting teams in the US and Europe
Opportunistic renewal rights transactions and acquisitions
History of Disciplined Growth
Dec.
2002
Princeton Insurance
Company
Total book
of business:
Approximately
$111 MM
Renewal
Rights
Early
2003
Hired specialty
risk and extended
warranty insurance
team in London
Key Hires
Dec.
2003
The Covenant Group
Total book
of business:
Approximately
$62 MM
Renewal
Rights
Dec.
2005
Alea US
Small-, Middle-market
P&C book
Total book of business:
Approximately
$360 MM through
9/30/05
Renewal
Rights
May
2006
Renewal
Rights
Muirfield Underwriters
Total book
of business:
Approximately
$60 MM
June
2006
Shell
Acquisition
Acquisition of Wesco
Insurance Co. (WIC),
from HSBC
Insurance Co.,
an affiliate of HIG
Feb.
2006
Raised ~$166 MM
to finance acquisition
of renewal rights
of Alea and fund
growth in existing
businesses
144A Offering
April
2007
Acquisition of IGI
Group, Ltd.
Acquisition
June
2007
Reinsurance
Agreement
40% quota-share
reinsurance
agreement with
Maiden Insurance Co.
Sep.
2007
Associated Industries
Insurance
Services, Inc.
Acquisition
June
2008
Renewal
Rights
Closed Unitrin, Inc.
transaction
Total book of business:
Approximately $165 MM
2006
Aug.
2004
Associated Industries
Insurance Company
Total book
of business:
Approximately $100 MM
Renewal
Rights
9

Maiden Transaction Rationale
Long-term capital partner for future growth
Organic growth
Acquisition of additional books of business
Higher ROE
Ability to write additional premium on existing capital base
Ceding commission on reinsured premium
Accretive to earnings per share
$0.43 operating earnings per basic share in 1st quarter 2008 vs.
$0.29 in 1st quarter 2007
10
Financial Performance
$97.5
$210.9
$526.0
91.9%
95.1%
94.8%
98.4%
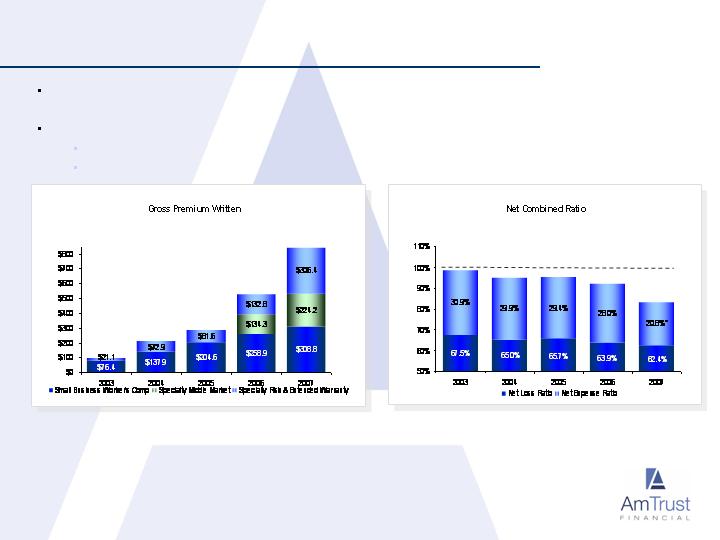
We produce an underwriting profit by having consistent loss ratios and focusing on expenses
As our premium has grown, we have:
Increased our operating leverage – Combined ratio 77.2% for Q1 2008 vs. 89.1% for Q1 2007
Decreased our expense ratio – ER 20.5% Q1 2008 vs. 26.3% for Q1 2007
$286.1
$839.4
83.2%
* Q1 2008 expense ratio without Maiden Insurance ceding commission revenue would have been 24.9%
11

Recent Financial Results
Summary Income Statement
($ in millions)
Gross Premium Written
Net Premium Written
Net Premium Earned
Fee Income
2006
$526.1
436.3
329.0
12.4
2007
$839.4
419.9
444.2
20.4
Q1 2008
Net Investment Income and Realized Gains
Loss and LAE Expense
Acquisition Expense
Salaries and G&A Expense
Operating Income from Continuing Operations
Income Tax Expense
Net Income from Continuing Operations
Annualized ROE from Net Income from Continuing Operations
Net Loss Ratio
Net Expense Ratio
Net Combined Ratio
42.4
210.1
43.3
49.1
70.9
17.8
$48.9
21.3%
63.9%
28.0%
91.9%
55.5
277.0
74.2
77.4
130.8
36.7
$90.1
24.7%
62.4%
20.8%
83.2%
Ceding Commission
-
59.1
* Q1 2008 expense ratio without Maiden Insurance ceding commission revenue would have been 24.9%
Earnings per Basic Share
$0.86
$1.49
$234.8
117.4
97.4
6.3
8.3
55.2
18.3
21.9
29.2
7.3
$22.3
22.7%
56.6%
20.5%*
77.2%
20.2
$0.37
12

Recent Financial Position
Balance Sheet Highlights
($ in millions except for book value per share)
Cash and Investments
Reinsurance Recoverable
Premiums Receivable, Net
Other
Loss and LAE Reserve
Unearned Premium Reserve
(1)
Junior Subordinate Debentures
Other
Shareholders' Equity
Total Liabilities and Shareholders' Equity
1.
Trust Preferred Securities
Book Value Per Share
12/31/06
$824.2
44.1
147.8
207.6
$1,223.7
295.8
323.2
82.5
181.7
883.2
340.5
$1,223.7
12/31/07
$1,289.6
281.9
257.8
493.5
$2,322.8
775.4
527.8
123.7
505.5
1,932.4
390.4
$2,322.8
$5.68
3/31/08
$1,464.0
320.2
296.8
527.5
$2,608.6
786.1
570.3
123.7
717.9
2,198
394.9
$2,608.6
$6.51
$6.60
13
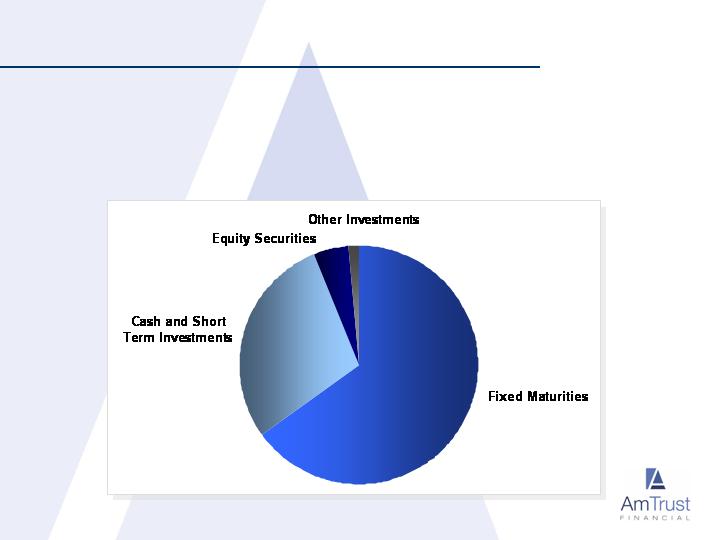
Investment Portfolio
5%
29%
65%
1%
Total invested assets as of 3/31/08 - $1.5 Billion
56.4% of fixed maturities are rated AAA or US Government and Agencies
90% of fixed maturities are rated A or better
No exposure to sub-prime
14

Business Model
Continue to deliver 20%+ ROE through:
Focus on underwriting profit:
Economies of scale
Lower expense ratio
20.5% net expense ratio for Q1 2008
Disciplined pricing and risk selection
56.6% net loss ratio for Q1 2008
Proprietary technology platform designed to process small policies
Effective tax rate less than 30%
15

AmTrust Financial