UNITED STATES
SECURITIES AND EXCHANGE COMMISSION
Washington, D.C. 20549
SECURITIES AND EXCHANGE COMMISSION
Washington, D.C. 20549
FORM N-CSR
CERTIFIED SHAREHOLDER REPORT OF REGISTERED MANAGEMENT INVESTMENT COMPANIES
Investment Company Act file number 811-21910
Claymore Exchange-Traded Fund Trust 2
(Exact name of registrant as specified in charter)
(Exact name of registrant as specified in charter)
227 West Monroe Street, Chicago, IL 60606
(Address of principal executive offices) (Zip code)
(Address of principal executive offices) (Zip code)
Amy J. Lee
227 West Monroe Street, Chicago, IL 60606
(Name and address of agent for service)
227 West Monroe Street, Chicago, IL 60606
(Name and address of agent for service)
Registrant's telephone number, including area code: (312) 827-0100
Date of fiscal year end: August 31
Date of reporting period: September 1, 2016 - February 28, 2017
Item 1. Reports to Stockholders.
The registrant's semi-annual report transmitted to shareholders pursuant to Rule 30e-1 under the Investment Company Act of 1940, as amended (the “Investment Company Act”), is as follows:
GUGGENHEIMINVESTMENTS.COM
. . . YOUR ROAD TO THE LATEST, MOST UP - TO - DATE INFORMATION
The shareholder report you are reading right now is just the beginning of the story. Online at guggenheiminvestments.com, you will find:
| • | Daily and historical fund pricing, fund returns, portfolio holdings and characteristics, and distribution history. |
| • | Investor guides and fund fact sheets. |
| • | Regulatory documents including a prospectus and copies of shareholder reports. |
Guggenheim Funds Distributors, LLC is constantly updating and expanding shareholder information services on each Fund's website, in an ongoing effort to provide you with the most current information about how your Fund's assets are managed, and the results of our efforts. It is just one more small way we are working to keep you better informed about your investment.
| Contents | ||
| Dear Shareholder | 3 | |
| Economic and Market Overview | 4 | |
| Management Discussion of Fund Performance | 6 | |
| Performance Report and Fund Profile | 16 | |
| About Shareholders' Fund Expenses | 25 | |
| Schedule of Investments | 26 | |
| Statement of Assets and Liabilities | 47 | |
| Statement of Operations | 49 | |
| Statements of Changes in Net Assets | 51 | |
| Financial Highlights | 55 | |
| Notes to Financial Statements | 62 | |
| Supplemental Information | 71 | |
| Trust Information | 74 | |
| About the Trust Adviser | Back Cover |
| (Unaudited) | February 28, 2017 |
DEAR SHAREHOLDER
Guggenheim Funds Investment Advisors, LLC and Guggenheim Partners Investment Management, LLC (the "Investment Advisors") are pleased to present the semiannual shareholder report for several of our exchange-traded funds ("ETFs" or "Funds"). This report covers performance of the Funds for the semiannual fiscal period ended February 28, 2017.
The Investment Advisors are part of Guggenheim Investments, which represents the investment management businesses of Guggenheim Partners, LLC ("Guggenheim"), a global diversified financial services firm.
Guggenheim Funds Distributors, LLC, the distributor of the Funds, is committed to providing investors with innovative investment solutions. We have built on the investment management strengths of Guggenheim Investments and worked with a diverse group of index providers to create some of the most distinctive ETFs available.
To learn more about economic and market conditions over the last year and the objective and performance of each ETF, we encourage you to read the Economic and Market Overview section of the report, which follows this letter, and the Management Discussion of Fund Performance for each ETF, which begins on page 6.
Sincerely,

Donald Cacciapaglia
President and Chief Executive Officer
Claymore Exchange-Traded Fund Trust 2
President and Chief Executive Officer
Claymore Exchange-Traded Fund Trust 2
March 31, 2017
| CLAYMORE EXCHANGE-TRADED FUND TRUST 2 SEMIANNUAL REPORT l 3 |
| ECONOMIC AND MARKET OVERVIEW (Unaudited) | February 28, 2017 |
For much of the period, U.S. risk assets rallied in anticipation of growth-oriented fiscal policy outcomes, but there are obvious risks: no one wins in a trade war; border taxes and tariffs are notoriously regressive; deportations and immigration limits deprive our labor force of a critically vibrant component; and geopolitical tensions could needlessly escalate if the new administration is not careful. Discounting such events, the U.S. economic backdrop is strong and risk assets should continue to perform well, even if a healthy dose of caution causes consolidation around current levels.
Much of the rise in asset valuations since Donald Trump's victory has been based on anticipation of his pro-growth policies coming to fruition, an outcome that is far from certain. Asset valuations could be getting a bit ahead of themselves, and becoming more sensitive to a temporary growth scare or setback, especially since the rollout of Trump's new policies will not be smooth or easy.
Nevertheless, the underlying economy remains on a good trajectory. U.S. real gross domestic product (GDP) growth in the fourth quarter was solid but unspectacular, like most of the post-crisis period. The early readings came in at around 2%, down from 3.5% in the third quarter. The quarterly volatility seen in the second half of 2016 resulted mainly from large swings in the contribution of net exports. Smoothing through the quarterly noise reveals a trend-like pace of 1.9% real GDP growth over the past year. Growth has benefited from recent gains in consumer and business confidence, which should continue to support consumption and investment spending as precautionary savings are reduced.
We forecast the unemployment rate to fall below 4% before the end of the expansion as faster GDP growth boosts employment while demographic constraints limit gains in the size of the labor force. This would be well below the Fed's estimate of the natural rate of unemployment; however, we believe the Trump administration's fiscal agenda will not push up inflation materially because the Fed will respond by tightening monetary policy faster.
A strong corporate earnings recovery, expansionary fiscal policies, falling unemployment, and upward wage pressure should lead the Fed to raise the fed funds rate more than the market is currently expecting. This should cause the yield curve to flatten as rates in the short end rise while the long end is stabilized by confidence in the Fed's willingness to contain inflation.
Time will tell how successful President Trump will be in implementing his policy proposals, but the various thematic areas being discussed—tax reform, infrastructure spending, and deregulation—are all constructive for U.S. economic growth. The United States is the locomotive of the world. When our economy is growing, dynamic, and strong, it is a boon to the global economy, which is already experiencing a synchronous expansion.
For the six months ended February 28, 2017, the Standard & Poor's 500® ("S&P 500") Index returned 10.01%. The MSCI Europe-Australasia-Far East ("EAFE") Index returned 4.90%. The return of the MSCI Emerging Markets Index was 5.51%.
In the bond market, the Bloomberg Barclays U.S. Aggregate Bond Index posted a -2.19% return for the period, while the Bloomberg Barclays U.S. Corporate High Yield Index returned 1.64%. The return of the Bank of America Merrill Lynch 3-Month U.S. Treasury Bill Index was 0.22% for the six-month period.
The opinions and forecasts expressed may not actually come to pass. This information is subject to change at any time, based on market and other conditions, and should not be construed as a recommendation of any specific security or strategy.
| 4 l CLAYMORE EXCHANGE-TRADED FUND TRUST 2 SEMIANNUAL REPORT |
| (Unaudited) | February 28, 2017 |
Index Definitions
All indices described below are unmanaged and reflect no expenses. It is not possible to invest directly in any index.
All indices described below are unmanaged and reflect no expenses. It is not possible to invest directly in any index.
The Bank of America Merrill Lynch 3-Month U.S. Treasury Bill Index is an unmanaged market Index of U.S. Treasury securities maturing in 90 days that assumes reinvestment of all income.
The Bloomberg Barclays U.S. Aggregate Bond Index is a broad-based flagship benchmark that measures the investment grade, U.S. dollar-denominated, fixed-rate taxable bond market, including U.S. Treasuries, government-related and corporate securities, mortgage-backed securities or "MBS" (agency fixed-rate and hybrid adjustable-rate mortgage, or "ARM", pass-throughs), asset-backed securities ("ABS"), and commercial mortgage-backed securities ("CMBS") (agency and non-agency).
The Bloomberg Barclays U.S. Corporate High Yield Index measures the U.S. dollar-denominated, high yield, fixed-rate corporate bond market. Securities are classified as high yield if the middle rating of Moody's, Fitch, and S&P is Ba1/BB +/BB + or below.
The Dow Jones Global Utilities Index includes those companies in the Dow Jones Global Index associated with generating and distributing electricity through the burning of fossil fuels such as coal, petroleum and natural gas, and through nuclear energy; alternative electricity companies generating and distributing electricity from a renewable source; distributors of gas to end users; and multi-utility and water companies.
The MSCI China Index is a capitalization-weighted index that measures the performance of large- and mid-cap securities in the Chinese equity markets and includes representation across China H shares, B shares, Red chips and P chips.
The MSCI EAFE Index is a capitalization-weighted measure of stock markets in Europe, Australasia, and the Far East.
The MSCI Emerging Markets Index is a free float-adjusted market capitalization-weighted index that is designed to measure equity market performance in the global emerging markets.
The MSCI World Index measures performance from a diverse range of global stock markets, including the U.S., Canada, Europe, Australia, New Zealand, and the Far East.
The Standard and Poor's 500 Index (S&P 500®) is a broad-based index, the performance of which is based on the performance of 500 widely held common stocks chosen for market size, liquidity, and industry group representation.
The Standard & Poor's Global BMI (Broad Market Index), which comprises the S&P Developed BMI and S&P Emerging BMI, is a comprehensive, rules-based index measuring global stock market performance.
Industry Sectors
Comments about industry sectors in these Fund commentaries are based on Bloomberg industry classifications.
Comments about industry sectors in these Fund commentaries are based on Bloomberg industry classifications.
| CLAYMORE EXCHANGE-TRADED FUND TRUST 2 SEMIANNUAL REPORT l 5 |
| MANAGEMENT DISCUSSION OF FUND PERFORMANCE (Unaudited) | February 28, 2017 |
YAO Guggenheim China All-Cap ETF
Fund Overview
The Guggenheim China All-Cap ETF, NYSE Arca ticker: YAO (the "Fund") seeks investment results that correspond generally to the performance, before the Fund's fees and expenses, of an equity index called the AlphaShares China All-Cap Index (the "Index").
The Guggenheim China All-Cap ETF, NYSE Arca ticker: YAO (the "Fund") seeks investment results that correspond generally to the performance, before the Fund's fees and expenses, of an equity index called the AlphaShares China All-Cap Index (the "Index").
The Index is designed to measure and monitor the performance of the investable universe of publicly traded companies based in mainland China. The Index was created by AlphaShares, LLC ("AlphaShares") and is maintained by Standard & Poor's. The Index includes equity securities of companies of all capitalizations, as defined by AlphaShares, subject to certain minimum capitalization requirements. The Fund will invest at least 80% of its total assets in common stock, American depositary receipts ("ADRs"), American depositary shares ("ADSs"), global depositary receipts ("GDRs"), and international depositary receipts ("IDRs") that comprise the Index and depositary receipts or shares representing common stocks included in the Index (or underlying securities representing ADRs, ADSs, GDRs, and IDRs included in the Index). The Fund generally will invest in all of the securities comprising the Index in proportion to their weightings in the Index.
Fund Performance
All Fund returns cited—whether based on net asset value ("NAV") or market price—assume the reinvestment of all distributions. This report discusses the semiannual fiscal period ended February 28, 2017.
All Fund returns cited—whether based on net asset value ("NAV") or market price—assume the reinvestment of all distributions. This report discusses the semiannual fiscal period ended February 28, 2017.
On a market price basis, the Fund generated a total return of 5.81%, which included an increase in market price over the period to $27.15 on February 28, 2017, from $26.23 on August 31, 2016. On an NAV basis, the Fund generated a total return of 5.91%, which included an increase in NAV over the period to $27.14 on February 28, 2017, from $26.19 on August 31, 2016. At the end of the period, the Fund's shares were trading at a market price premium to NAV, which is to be expected from time to time. All NAV returns include the deduction of management fees, operating expenses, and other Fund expenses.
For comparison, the Index returned 6.28%, and the MSCI China Index returned 5.34% for the same period.
The Fund made an annual income distribution of $0.5415 per share on December 30, 2016, to shareholders of record on December 28, 2016.
Performance Attribution
For the six-month period ended February 28, 2017, the financials sector contributed the most to the Fund's return, followed by the consumer discretionary sector. The telecommunications services sector detracted the most from return, followed by the utilities sector.
For the six-month period ended February 28, 2017, the financials sector contributed the most to the Fund's return, followed by the consumer discretionary sector. The telecommunications services sector detracted the most from return, followed by the utilities sector.
Positions that contributed the most to the Fund's return included NetEase, Inc. ADR, a Chinese Internet technology company; China Construction Bank Corp. Class H, a commercial bank that provides a wide range of financial services; and China Life Insurance Company Ltd. Class H, which provides life, accident, and health insurance, as well as reinsurance and fund investment (2.1%, 5.1%, and 2.1%, respectively, of the Fund's long-term investments at period end).
Positions that detracted the most from the Fund's return included China Mobile Ltd., a telecommunications services provider in Mainland China; China Overseas Land & Investment Ltd., which through its subsidiaries develops and invests in properties, constructs buildings, invests in treasury securities, and infrastructure projects; and 58.com, Inc. Class A ADR, a local life-service platform that enables transfer of products and services between purchasers and sellers (4.8%, 1.2%, and 0.3%, respectively, of the Fund's long-term investments at period end).
| 6 l CLAYMORE EXCHANGE-TRADED FUND TRUST 2 SEMIANNUAL REPORT |
| MANAGEMENT DISCUSSION OF FUND PERFORMANCE (Unaudited) continued | February 28, 2017 |
CQQQ Guggenheim China Technology ETF
Fund Overview
The Guggenheim China Technology ETF, NYSE Arca ticker: CQQQ (the "Fund") seeks investment results that correspond generally to the performance, before the Fund's fees and expenses, of an equity index called the AlphaShares China Technology Index (the "Index").
The Guggenheim China Technology ETF, NYSE Arca ticker: CQQQ (the "Fund") seeks investment results that correspond generally to the performance, before the Fund's fees and expenses, of an equity index called the AlphaShares China Technology Index (the "Index").
The Index is designed to measure and monitor the performance of the universe of publicly traded companies that are based in mainland China, Hong Kong, or Macau, are in the Information Technology Sector, as defined by Standard & Poor's Global Industry Classification Standard, and are open to foreign investment. The Index was created by AlphaShares, LLC ("AlphaShares") and is maintained by Standard & Poor's. The Index includes equity securities of companies of all categories of market capitalizations, as defined by AlphaShares (subject to certain minimum capitalization requirements).
The Index may include Hong Kong-listed securities, including China H-shares and Red Chips. China H-shares are issued by companies incorporated in mainland China and listed on the Hong Kong Stock Exchange. Red Chip shares are issued by companies with controlling Chinese shareholders that are incorporated outside mainland China and listed on the Hong Kong Stock Exchange. The Index may also include N-shares, which are issued by companies based in mainland China and listed on the NYSE Arca, Inc. or NASDAQ Stock Market. The Index does not include China A-Shares (which are subject to substantial restrictions on foreign investment) or China B-Shares (which offer a generally smaller market and limited liquidity), each of which trade on the Shanghai Stock Exchange and the Shenzhen Stock Exchange.
The Fund will invest at least 80% of its total assets in common stock, American depositary receipts ("ADRs"), American depositary shares ("ADSs"), global depositary receipts ("GDRs"), and international depositary receipts ("IDRs") that comprise the Index and depositary receipts or shares representing common stocks included in the Index (or underlying securities representing ADRs, ADSs, GDRs, and IDRs included in the Index). The Fund generally will invest in all of the securities comprising the Index in proportion to their weightings in the Index.
Fund Performance
All Fund returns cited—whether based on net asset value ("NAV") or market price—assume the reinvestment of all distributions. This report discusses the semiannual fiscal period ended February 28, 2017.
All Fund returns cited—whether based on net asset value ("NAV") or market price—assume the reinvestment of all distributions. This report discusses the semiannual fiscal period ended February 28, 2017.
On a market price basis, the Fund generated a total return of 5.15%, which included an increase in market price over the period to $40.41 on February 28, 2017, from $39.08 on August 31, 2016. On an NAV basis, the Fund generated a total return of 3.92%, which included an increase in NAV over the period to $40.13 on February 28, 2017, from $39.26 on August 31, 2016. At the end of the period, the Fund's shares were trading at a market price premium to NAV, which is to be expected from time to time. All NAV returns include the deduction of management fees, operating expenses, and other Fund expenses.
For comparison, the Index returned 4.19%, and the MSCI China Index returned 5.34% for the same period.
The Fund made an annual income distribution of $0.5953 per share on December 30, 2016, to shareholders of record on December 28, 2016.
Performance Attribution
For the six-month period ended February 28, 2017, all of the holdings were in the information technology sector, which had positive return for the period.
For the six-month period ended February 28, 2017, all of the holdings were in the information technology sector, which had positive return for the period.
Positions that contributed the most to the Fund's return included NetEase, Inc. ADR, a Chinese Internet company; Sunny Optical Technology Group Company Ltd, which designs and manufactures optical and optical related products; and Semiconductor Manufacturing International Corp., which operates a semiconductor foundry (8.7%, 4.4%, and 4.0%, respectively, of the Fund's long-term investments at period end).
Positions that detracted the most from the Fund's return included 58.com, Inc. ADR, a local life-service platform that enables transfer of products and services between purchasers and sellers; Fang Holdings Ltd. ADR, which operates a real estate Internet portal; and Coolpad Group Ltd., which provides a range of wireless system solutions and wireless terminal products (3.4%, 0.7%, and 0.3%, respectively, of the Fund's long-term investments at period end).
| CLAYMORE EXCHANGE-TRADED FUND TRUST 2 SEMIANNUAL REPORT l 7 |
| MANAGEMENT DISCUSSION OF FUND PERFORMANCE (Unaudited) continued | February 28, 2017 |
TAN Guggenheim Solar ETF
Fund Overview
The Guggenheim Solar ETF, NYSE Arca ticker: TAN (the "Fund") seeks investment results that correspond generally to the performance, before the Fund's fees and expenses, of an equity index called the MAC Global Solar Energy Index (the "Index").
The Guggenheim Solar ETF, NYSE Arca ticker: TAN (the "Fund") seeks investment results that correspond generally to the performance, before the Fund's fees and expenses, of an equity index called the MAC Global Solar Energy Index (the "Index").
As of February 28, 2017, the Index is comprised of approximately 26 securities selected based on the relative importance of solar power within the company's business model, as determined by MAC Indexing LLC (the "Index Provider"). The Index is designed to track companies within the following business segments of the solar energy industry: companies that produce solar power equipment and products for end users; companies that produce fabrication products (such as the equipment used by solar cell and module producers to manufacture solar power equipment) or services (such as companies specializing in the solar cell manufacturing or the provision of consulting services to solar cell and module producers) for solar power equipment producers; companies that supply raw materials or components to solar power equipment producers or integrators; companies that derive a significant portion of their business (as defined in the Fund prospectus under "Index Methodology") from solar power system sales, distribution, installation, integration, or financing; and companies that specialize in selling electricity derived from solar power.
The Index is generally comprised of equity securities, including American depositary receipts ("ADRs"), and global depositary receipts ("GDRs"), traded in developed markets, as defined by the Index Provider. While the equity securities comprising the Index are traded in developed markets, the issuers of such securities may be located in emerging markets. Emerging market countries are countries that major international financial institutions, such as the World Bank, generally consider to be less economically mature than developed nations. The Fund will invest at least 90% of its total assets in common stock, ADRs, and GDRs that comprise the Index and depositary receipts representing common stocks included in the Index (or underlying securities representing ADRs and GDRs included in the Index). The Fund generally will invest in all of the securities comprising the Index in proportion to their weightings in the Index. The Fund will concentrate its investments (i.e., hold 25% or more of its assets) in a particular industry or group of industries to the extent the Index is so concentrated.
Fund Performance
All Fund returns cited—whether based on net asset value ("NAV") or market price—assume the reinvestment of all distributions. This report discusses the semiannual fiscal period ended February 28, 2017.
All Fund returns cited—whether based on net asset value ("NAV") or market price—assume the reinvestment of all distributions. This report discusses the semiannual fiscal period ended February 28, 2017.
On a market price basis, the Fund generated a total return of -5.76%, which included a decrease in market price over the period to $18.76 on February 28, 2017, from $20.91 on August 31, 2016. On an NAV basis, the Fund generated a total return of -5.87%, which included a decrease in NAV over the period to $18.72 on February 28, 2017, from $20.89 on August 31, 2016. At the end of the period, the Fund's shares were trading at a market price premium to NAV, which is to be expected from time to time. All NAV returns include the deduction of management fees, operating expenses, and other Fund expenses.
For comparison, the Index returned -6.93%, and the MSCI World Index returned 7.78% for the same period.
The Fund made an annual income distribution of $0.8349 per share on December 30, 2016, to shareholders of record on December 28, 2016.
Performance Attribution
The utilities and consumer discretionary contributed the most to the Fund's return for the six-month period ended February 28, 2017. The information technology sector detracted the most from return, followed by the industrials sector.
The utilities and consumer discretionary contributed the most to the Fund's return for the six-month period ended February 28, 2017. The information technology sector detracted the most from return, followed by the industrials sector.
Positions that contributed the most to the Fund's return included Atlantica Yield plc, which owns a diversified portfolio of contracted renewable energy, power generation, and electric transmission assets; TerraForm Global, Inc. Class A, which owns and operates contracted clean power generation assets including wind, geothermal, hydroelectric, and hybrid energy solutions; and Canadian Solar, Inc., which designs, manufactures, and sells solar module products that convert sunlight into electricity (5.4%, 3.6%, and 5.2%, respectively, of the Fund's long-term investments at period end).
Positions that detracted the most from the Fund's return included JA Solar Holdings Co. Ltd ADR, which manufactures solar cells; Xinyi Solar Holdings Ltd., a maker of solar glass; and SMA Solar Technology AG, which manufactures solar inverters (3.5%, 5.5%, and 3.8%, respectively, of the Fund's long-term investments at period end).
| 8 l CLAYMORE EXCHANGE-TRADED FUND TRUST 2 SEMIANNUAL REPORT |
| MANAGEMENT DISCUSSION OF FUND PERFORMANCE (Unaudited) continued | February 28, 2017 |
CGW Guggenheim S&P Global Water Index ETF
Fund Overview
The Guggenheim S&P Global Water Index ETF, NYSE Arca ticker: CGW (the "Fund"), seeks investment results that correspond generally to the performance, before the Fund's fees and expenses, of an equity index called the S&P Global Water Index (the "Index").
The Guggenheim S&P Global Water Index ETF, NYSE Arca ticker: CGW (the "Fund"), seeks investment results that correspond generally to the performance, before the Fund's fees and expenses, of an equity index called the S&P Global Water Index (the "Index").
The Index is comprised of approximately 50 equity securities selected, based on investment and other criteria, from a universe of companies listed on global developed market exchanges. Standard & Poor's ("S&P") generally defines "developed markets" as the capital markets of those countries with high levels of per capita income and strict market regulation resulting in greater transparency. The universe of companies includes all companies classified by Standard & Poor's Global Industry Classifications as being associated (in a manner representing a major component of such companies' business) with the global demand for water, including water utilities, infrastructure, equipment, instruments, and materials. Total market capitalization and float-adjusted market capitalization of securities in the Index must be at least $250 million and $100 million, respectively, at the time of each reconstitution, which includes small-, mid-, and large-capitalization securities as defined by S&P. The companies in the universe are selected using criteria as identified by S&P. The Fund will invest at least 90% of its total assets in common stock and American depositary receipts ("ADRs") that comprise the Index and depositary receipts representing common stocks included in the Index (or underlying securities representing ADRs included in the Index). The Fund generally will invest in all of the securities comprising the Index in proportion to their weightings in the Index. The Fund will concentrate its investments (i.e., hold 25% or more of its assets) in a particular industry or group of industries to the extent the Index is so concentrated.
Fund Performance
All Fund returns cited—whether based on net asset value ("NAV") or market price—assume the reinvestment of all distributions. This report discusses the semiannual fiscal period ended February 28, 2017.
All Fund returns cited—whether based on net asset value ("NAV") or market price—assume the reinvestment of all distributions. This report discusses the semiannual fiscal period ended February 28, 2017.
On a market price basis, the Fund generated a total return of 0.85%, which included a decrease in market price over the period to $30.08 on February 28, 2017, from $30.32 on August 31, 2016. On an NAV basis, the Fund generated a total return of 1.08%, which included a decrease in NAV over the period to $30.10 on February 28, 2017, from $30.27 on August 31, 2016. At the end of the period, shares of the Fund at NAV were trading at a market price discount to NAV, which is to be expected from time to time. All NAV returns include the deduction of management fees, operating expenses, and other Fund expenses.
For comparison, the Index returned 1.25%, the MSCI World Index returned 7.78%, and the Dow Jones Global Utilities Index returned 3.03% for the same period.
The Fund made an annual income distribution of $0.4701 per share on December 30, 2016, to shareholders of record on December 28, 2016.
Performance Attribution
For the six-month period ended February 28, 2017, the materials sector contributed the most to return, followed by the industrials sector. The utilities sector detracted the most from return, followed by the information technology sector.
For the six-month period ended February 28, 2017, the materials sector contributed the most to return, followed by the industrials sector. The utilities sector detracted the most from return, followed by the information technology sector.
Positions that contributed the most to the Fund's return included Olin Corp., a manufacturer of chemicals and ammunition products; American Water Works Co., Inc., which provides drinking water, wastewater, and other water-related services in multiple U.S. states and Ontario, Canada; and Alfa Laval AB, which provides specialized products and engineering solutions (2.7%, 8.1%, and 2.7%, respectively, of the Fund's long-term investments at period end).
Positions that detracted the most from the Fund's return included Veolia Environnement S.A., which is engaged in providing environmental management services; Pentair Plc, a U.K-based provider of services related to water and other fluids, thermal management, and equipment protection; and Halma Plc, a group of technology companies that makes products for hazard detection and life protection (3.7%, 5.0%, and 2.4%, respectively, of the Fund's long-term investments at period end).
| CLAYMORE EXCHANGE-TRADED FUND TRUST 2 SEMIANNUAL REPORT l 9 |
| MANAGEMENT DISCUSSION OF FUND PERFORMANCE (Unaudited) continued | February 28, 2017 |
GHII Guggenheim S&P High Income Infrastructure ETF
Fund Overview
The Guggenheim S&P High Income Infrastructure ETF, NYSE Arca ticker: GHII (the "Fund") seeks investment results that correspond generally to the performance, before the Fund's fees and expenses, of the S&P High Income Infrastructure Index (the "Index"). The Fund, using a "passive" or "indexing" investment approach, seeks to replicate, before the Fund's fees and expenses, the performance of the Index.
The Guggenheim S&P High Income Infrastructure ETF, NYSE Arca ticker: GHII (the "Fund") seeks investment results that correspond generally to the performance, before the Fund's fees and expenses, of the S&P High Income Infrastructure Index (the "Index"). The Fund, using a "passive" or "indexing" investment approach, seeks to replicate, before the Fund's fees and expenses, the performance of the Index.
The Index is designed to measure and monitor the performance of 50 high-yielding global equity securities of companies that engage in various infrastructure-related sub-industries. Index constituents must meet size, listing, and liquidity requirements and also be part of the S&P Global BMI Index, which is a rules-based index that measures global stock market performance.
The Fund will invest at least 80% of its total assets in common stocks, American depositary receipts ("ADRs"), American depositary shares ("ADSs"), global depositary receipts ("GDRs"), and international depositary receipts ("IDRs") that comprise the Index and depositary receipts representing common stocks included in the Index (or underlying securities representing the ADRs, ADSs, GDRs, and IDRs included in the Index).
Fund Performance
All Fund returns cited—whether based on net asset value ("NAV") or market price—assume the reinvestment of all distributions. This report discusses the semiannual fiscal period ended February 28, 2017.
All Fund returns cited—whether based on net asset value ("NAV") or market price—assume the reinvestment of all distributions. This report discusses the semiannual fiscal period ended February 28, 2017.
On a market price basis, the Fund generated a total return of 4.11%, which included an increase in market price over the period to $27.08 on February 28, 2017, from $26.48 on August 31, 2016. On an NAV basis, the Fund generated a total return of 4.22%, which included an increase in NAV over the period to $26.90 on February 28, 2017, from $26.28 on August 31, 2016. At the end of the period the Fund's shares were trading at a market price premium to NAV, which is to be expected from time to time. All NAV returns include the deduction of management fees, operating expenses, and other Fund expenses.
For comparison, the Index returned 4.50%, and the S&P Global BMI Index returned 7.86% for the same period.
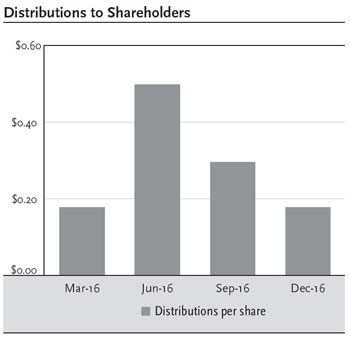
The Fund made the following quarterly income distributions for the semiannual period ended February 28, 2017:
| Payable Date | Amount | |||
| September 30, 2016 | $ | 0.2954 | ||
| December 30, 2016 | $ | 0.1778 | ||
| Total | $ | 0.4732 |
The total distribution on December 30, 2016 was composed of $0.1676 in ordinary income and $0.0102 in short-term capital gains.
Performance Attribution
For the semiannual fiscal period ended February 28, 2017, the energy sector contributed the most to the Fund's performance, followed by the industrials sector. No sector detracted, but the utilities sector contributed least.
For the semiannual fiscal period ended February 28, 2017, the energy sector contributed the most to the Fund's performance, followed by the industrials sector. No sector detracted, but the utilities sector contributed least.
Positions that contributed the most to the Fund's return included Golar LNG Ltd., an independent owner and operator of liquefied natural gas (LNG) infrastructure (not held in the portfolio at period end); Targa Resources Corp., a midstream energy corporation (4.1% of the Fund's long-term investments at period end); and ONEOK, Inc., a diversified energy company (not held in the portfolio at period end).
Positions that detracted the most from the Fund's return included Nordic American Tankers Ltd., a shipping company that owns and charters tankers for oil transportation; Electricite de France S.A., an electric utility largely owned by the French state; and Engie S.A., which offers a full range of electricity, gas, and associated energy and environment services throughout the world (4.6%, 2.8%, and 2.3%, respectively, of the Fund's long-term investments at period end).
| 10 l CLAYMORE EXCHANGE-TRADED FUND TRUST 2 SEMIANNUAL REPORT |
| MANAGEMENT DISCUSSION OF FUND PERFORMANCE (Unaudited) continued | February 28, 2017 |
GTO Guggenheim Total Return Bond ETF
Fund Overview
The Guggenheim Total Return Bond ETF, NYSE Arca ticker: GTO (the "Fund") seeks maximum total return, comprised of income and capital appreciation.
In managing the Fund, Guggenheim Partners Investment Management, LLC ("GPIM") uses a process for selecting securities for purchase and sale that is based on intensive credit research and involves extensive due diligence on each issuer, region, and sector. GPIM also considers macroeconomic outlook and geopolitical issues. GPIM maintains targets with respect to portfolio maturity and duration, which are reviewed continually by various teams, including the portfolio management team. These targets are set based on the interest rate outlook, the macro environment, and can be either absolute or relative to a portfolio's positioning to a benchmark.
The Fund will normally invest in a portfolio of fixed income instruments of varying maturities and of any credit quality. The Fund will normally invest at least 80% of its assets in fixed income instruments and also include exchange-traded funds ("ETFs") and closed-end funds ("CEFs") that invest substantially all of their assets in fixed income instruments. The Fund may invest in short-term instruments such as commercial paper, repurchase agreements, reverse repurchase agreements and short-term investment funds.
The fixed-income instruments in which the Fund invests include corporate debt securities of U.S. and non-U.S. issuers, including corporate bonds and other similar instruments, such as Treasury securities, collateralized loan obligations ("CLOs"), mortgage-backed securities ("MBS"), and asset-backed securities ("ABS"), issued by various U.S. and non-U.S. public- or private-sector entities, and municipal securities.
The Fund may invest up to 33 1/3% of its total assets in high yield debt securities ("junk bonds"), which are debt securities that are rated below investment grade by nationally recognized statistical rating organizations, or are unrated securities that GPIM believes are of comparable below investment grade quality. The Fund may also invest up to 20% of its total assets in participations in, or assignments of, bank loans or corporate loans.
The Fund also may seek certain exposures through derivative transactions, which may also create economic leverage in the Fund. The Fund may engage in derivative transactions for speculative purposes to enhance total return, to seek to hedge against fluctuations in securities prices, interest rates or currency rates, to change the effective duration of its portfolio, to manage certain investment risks and/or as a substitute for the purchase or sale of securities or currencies. The Fund may use leverage to the extent permitted by applicable law by entering into reverse repurchase agreements and borrowing transactions (principally lines of credit) for investment purposes.
Fund Performance
All Fund returns cited—whether based on net asset value ("NAV") or market price—assume the reinvestment of all distributions. This report discusses the semiannual fiscal period ended February 28, 2017.
All Fund returns cited—whether based on net asset value ("NAV") or market price—assume the reinvestment of all distributions. This report discusses the semiannual fiscal period ended February 28, 2017.
On a market price basis, the Fund generated a total return of -0.24%, which included a decrease in market price over the period to $51.43 on February 28, 2017, from $52.60 on August 31, 2016. On an NAV basis, the Fund generated a total return of 0.01%, which included a decrease in NAV over the period to $51.49 on February 28, 2017, from $52.54 on August 31, 2016. At the end of the period the Fund's shares were trading at a market price discount to NAV, which is to be expected from time to time. All NAV returns include the deduction of management fees, operating expenses, and all other Fund expenses.
For comparison, the Bloomberg Barclays U.S. Aggregate Bond Index returned -2.19% for the same period.
The Fund made the following monthly distributions for the semiannual fiscal period ended February 28, 2017:
| Payable Date | Amount | |||
| September 8, 2016 | $ | 0.1283 | ||
| October 7, 2016 | $ | 0.1164 | ||
| November 7, 2016 | $ | 0.0688 | ||
| December 7, 2016 | $ | 0.1155 | ||
| January 4, 2017 | $ | 0.4440 | ||
| February 7, 2017 | $ | 0.1619 | ||
| Total | $ | 1.0349 |
The total distribution on December 30, 2016 was composed of $0.1365 in ordinary income and $0.3075 in short-term capital gains.
| CLAYMORE EXCHANGE-TRADED FUND TRUST 2 SEMIANNUAL REPORT l 11 |
| MANAGEMENT DISCUSSION OF FUND PERFORMANCE (Unaudited) continued | February 28, 2017 |
GTO Guggenheim Total Return Bond ETF continued
Performance Review
Positive returns were attributed to continued spreads tightening across fixed income sectors despite the headwinds of a sharp increase in interest rates following the U.S. presidential election. The Fund's allocation to asset-backed securities, corporate bonds, and non-agency mortgaged-backed securities contributed to positive performance and relative outperformance versus the benchmark.
Positive returns were attributed to continued spreads tightening across fixed income sectors despite the headwinds of a sharp increase in interest rates following the U.S. presidential election. The Fund's allocation to asset-backed securities, corporate bonds, and non-agency mortgaged-backed securities contributed to positive performance and relative outperformance versus the benchmark.
The investment-grade CLO market performed well during the period given strong investor demand for floating-rate securities. Volatility during early 2016 had kept many CLO issuers on the sidelines, even though investors continued to increase allocations to floating-rate CLO debt in response to rising USD London Interbank Offered Rate (LIBOR) and low to negative yields in Japan and Europe. Not surprisingly, CLO spreads tightened significantly in the last months of 2016. Already hoping to issue or refinance CLOs ahead of the December 2016 risk retention deadline, CLO issuers were only too happy to meet strong CLO demand. November represented the highest monthly CLO issuance of the year. The Fund will continue to focus on allocating to investment grade structured credit that may shield investors from rate volatility without having to sacrifice yield.
January's new issuance volume of investment grade corporate credit reached $167 billion, which was the second largest on record. On the whole, the positive technical environment for US bonds and other fixed income instruments should continue. U.S. investment-grade corporate bond yields look attractive relative to European investment-grade corporates with some at premiums of 200 basis points or more. Adding this to the continuing Asian flows into the U.S., the foreign flows should limit potential spread widening in the U.S. corporate bond market.
High-yield spreads tightened as that sector continued to rebound. The depressed commodity-price environment ultimately pressured earnings in oil, gas and metals, causing a wave of defaults to materialize. Based on the 1998 default cycle, we predicted that defaults would peak in 2016. Since peaking at 5.7% in August, the 12-month trailing default rate for all U.S. speculative-grade borrowers rated by Moody's has fallen to 5.5%. It is expected to decline further in 2017 according to Moody's.
Non-agency RMBS positioning was a positive contributor in the period due to low-duration, floating-rate structures that saw limited impact from higher interest rates. The sector benefited from ongoing improvements in credit fundamentals and tracked the rally in credit sectors. In addition to having an income advantage, non-agency RMBS saw price appreciation from spread tightening across all subsectors. Strongest performers were spread duration securities which are expected to experience improving cash flows from ongoing improvements in mortgage credit.
Given the Fed interest rate hike in December 2016, the upward trend in the 10-year U.S. Treasury note yield, and the anticipation of three to four additional rate hikes in 2017, the portfolio remains adherent to a "barbell" duration strategy. Around half of the portfolio was floating rate. At the other end of the "barbell" are longer-term government debt, with higher yields and longer durations. We anticipate over time the yield curve will bear flatten and thus we believe the longer duration securities to be more insulated to losses than the intermediate part of the curve.
| 12 l CLAYMORE EXCHANGE-TRADED FUND TRUST 2 SEMIANNUAL REPORT |
| MANAGEMENT DISCUSSION OF FUND PERFORMANCE (Unaudited) continued | February 28, 2017 |
OVLC Guggenheim U.S. Large Cap Optimized Volatility ETF
Fund Overview
The Guggenheim U.S. Large Cap Optimized Volatility ETF, NYSE Arca ticker: OVLC (the "Fund") seeks investment results that correspond generally to the performance, before the Fund's fees and expenses, of the Guggenheim U.S. Large Cap Optimized Volatility Index (the "Index"). The Index, composed of approximately 120 securities, is designed to capture the benefits of low volatility investing while outperforming these strategies during market rallies. The Index's optimized volatility methodology attempts to have a low volatility exposure much of the time but adopts a higher volatility exposure as market reward-to-risk levels dictate. By utilizing a systematic process to optimize the index methodology's volatility profile, the Index is designed to provide attractive risk-adjusted returns across a market cycle.
The Guggenheim U.S. Large Cap Optimized Volatility ETF, NYSE Arca ticker: OVLC (the "Fund") seeks investment results that correspond generally to the performance, before the Fund's fees and expenses, of the Guggenheim U.S. Large Cap Optimized Volatility Index (the "Index"). The Index, composed of approximately 120 securities, is designed to capture the benefits of low volatility investing while outperforming these strategies during market rallies. The Index's optimized volatility methodology attempts to have a low volatility exposure much of the time but adopts a higher volatility exposure as market reward-to-risk levels dictate. By utilizing a systematic process to optimize the index methodology's volatility profile, the Index is designed to provide attractive risk-adjusted returns across a market cycle.
Index constituents must be constituents of the S&P 500 Index. Guggenheim Index ServicesSM is the Index Provider ("Index Provider.") The Index Provider was previously named Accretive Asset Management, LLC. The Index Provider is affiliated with Guggenheim Investment Advisors, LLC and Guggenheim Fund Distributors, LLC. The Index Provider selects securities from the constituents of the S&P 500 Index for inclusion in the Index using a proprietary methodology that calculates the reward to risk of each security in the investable universe.
The Fund will invest at least 80% of its total assets in securities that comprise the Index. The Fund generally will invest in all of the securities comprising the Index in proportion to their weightings in the Index.
Fund Performance
All Fund returns cited—whether based on net asset value ("NAV") or market price—assume the reinvestment of all distributions. This report discusses the semiannual fiscal period ended February 28, 2017.
All Fund returns cited—whether based on net asset value ("NAV") or market price—assume the reinvestment of all distributions. This report discusses the semiannual fiscal period ended February 28, 2017.
On a market price basis, the Fund generated a total return of 6.96%, which included an increase in market price over the period to $27.69 on February 28, 2017, from $26.14 on August 31, 2016. On an NAV basis, the Fund generated a total return of 6.95%, which included an increase in NAV over the period to $27.75 on February 28, 2017, from $26.20 on August 31, 2016. At the end of the period the Fund's shares were trading at a market price discount to NAV, which is to be expected from time to time. All NAV returns include the deduction of management fees, operating expenses, and all other Fund expenses.
For comparison, the Index returned 7.18%, and the S&P 500 Index returned 10.01% for the six-month period ended February 28, 2017.
The Fund made an annual income distribution of $0.2591 per share on December 30, 2016, to shareholders of record on December 28, 2016.
Performance Attribution
For the six-month period ended February 28, 2017, the financials sector contributed the most to the Fund's return, followed by the information technology sector. The telecommunications services sector detracted the most from the Fund's return, followed by the consumer staples sector.
For the six-month period ended February 28, 2017, the financials sector contributed the most to the Fund's return, followed by the information technology sector. The telecommunications services sector detracted the most from the Fund's return, followed by the consumer staples sector.
Positions that contributed the most to the Fund's return included Apple, Inc., a technology company that designs, develops, and sells consumer electronics, computer software, and online services (2.5% of the Fund's long-term investments at period end); Wells Fargo & Co., a diversified financial services company (0.3% of the Fund's long-term investments at period end); and M&T Bank Corp., a regional bank holding company based in Buffalo (not held in the portfolio at period end).
Positions that detracted the most from the Fund's return included Target Corp., a U.S. discount retailer; General Mills, Inc., a maker of branded consumer foods sold through retail stores; and Under Armour, Inc. Class A, an American company that manufactures footwear, sports and casual apparel (0.9%, 1.1%, and 0.3%, respectively, of the Fund's long-term investments at period end).
| CLAYMORE EXCHANGE-TRADED FUND TRUST 2 SEMIANNUAL REPORT l 13 |
| (Unaudited) | February 28, 2017 |
Risks and Other Considerations
The views expressed in this report reflect those of the portfolio managers, Guggenheim Partners Investment Management, LLC and Guggenheim Funds Investment Advisors, LLC only through the report period as stated on the cover. These views are subject to change at any time, based on market and other conditions and should not be construed as a recommendation of any kind. The material may also contain forward looking statements that involve risk and uncertainty, and there is no guarantee they will come to pass.
The views expressed in this report reflect those of the portfolio managers, Guggenheim Partners Investment Management, LLC and Guggenheim Funds Investment Advisors, LLC only through the report period as stated on the cover. These views are subject to change at any time, based on market and other conditions and should not be construed as a recommendation of any kind. The material may also contain forward looking statements that involve risk and uncertainty, and there is no guarantee they will come to pass.
This information does not represent an offer to sell securities of the Funds and it is not soliciting an offer to buy securities of the Funds. An investment in the various Guggenheim ETFs is subject to certain risks and other considerations. Below are some general risks and considerations associated with investing in a Fund, which may cause you to lose money, including the entire principal that you invest. Please refer to each individual ETF prospectus for a more detailed discussion of Fund-specific risks and considerations.
Investment Risk. An investment in a Fund is subject to investment risk, including the possible loss of the entire principal amount that you invest.
Equity Risk. The value of the securities held by each Fund may fall due to general market and economic conditions, perceptions regarding the industries in which the issuers of securities held by each Fund participate, or factors relating to specific companies in which such Fund invests.
Foreign Investment Risk. A Fund's investments in non-U.S. issuers may involve unique risks compared to investing in securities of U.S. issuers, including, among others, greater market volatility than U.S. securities and less complete financial information than for U.S. issuers. In addition, adverse political, economic, or social developments could undermine the value of such Fund's investments or prevent such Fund from realizing the full value of its investments. Financial reporting standards for companies based in foreign markets differ from those in the U.S. Finally, the value of the currency of the country in which a Fund has invested could decline relative to the value of the U.S. dollar, which may affect the value of the investment to U.S. investors. In addition, the underlying issuers of certain depositary receipts, particularly unsponsored or unregistered depositary receipts, are under no obligation to distribute shareholder communications to the holders of such receipts, or to pass through to them any voting rights with respect to the deposited securities.
Emerging Markets Risk. Investment in securities of issuers based in developing or "emerging market" countries entails all of the risks of investing in securities of non-U.S. issuers, as previously described, but to a heightened degree.
Micro-, Small-, and Medium-Sized Company Risk. Investing in securities of these companies involves greater risk as their stocks may be more volatile and less liquid than investing in more established companies. These stocks may have returns that vary, sometimes significantly, from the overall stock market. Micro-cap companies may be newly formed, less developed, and there may be less available information about the company.
Replication Management Risk (except GTO). The Funds are not "actively" managed. Therefore, a Fund would not necessarily sell a security because the stock's issuer was in financial trouble unless that stock is removed from such Fund's Index.
Non-Correlation Risk (except GTO). A Fund's return may not match the return of such Fund's index for a number of reasons. For example, the Fund incurs a number of operating expenses not applicable to the Index, and incurs costs in buying and selling securities, especially when rebalancing the Fund's securities holdings to reflect changes in the composition of the Index. A Fund may not be fully invested at times, either as a result of cash flows into such Fund or reserves of cash held by a Fund to meet redemptions and expenses. If a Fund utilizes a sampling approach or futures or other derivative positions, its return may not correlate as well with the return on the Index, as would be the case if it purchased all of the securities in the Index with the same weightings as the Index.
Issuer-Specific Changes. The value of an individual security or particular type of security can be more volatile than the market as a whole and can perform differently from the value of the market as a whole. The value of securities of smaller issuers can be more volatile than that of larger issuers.
Non-Diversified Fund Risk. Certain Funds are considered non-diversified and can invest a greater portion of assets in securities of individual issuers than a diversified fund. As a result, changes in the market value of a single investment could cause greater fluctuations in share price than would occur in a diversified fund.
Concentration Risk. If the Index concentrates in an industry or group of industries, the Fund's investments will be concentrated accordingly. In such event, the value of the Fund's shares may rise and fall more than the value of shares of a fund that invests in securities of companies in a broader range of industries.
China Investment Risk (YAO and CQQQ). Investing in securities of Chinese companies involves additional risks, including, but not limited to: the economy of China differs, often unfavorably, from the U.S. economy in such respects as structure, general development, government involvement, wealth distribution, rate of inflation, growth rate, allocation of resources, and capital reinvestment, among others; the central government has historically exercised substantial control over virtually every sector of the Chinese economy through administrative regulation and/or state ownership; and actions of the Chinese central and local government authorities continue to have a substantial effect on economic conditions in China.
Recent Market Developments Risk. Global and domestic financial markets have experienced periods of unprecedented turmoil. Recently, markets have witnessed more stabilized economic activity as expectations for an economic recovery increased. However, risks to a robust resumption of growth persist. Continuing uncertainty as to the status of the euro and the European Monetary Union has created significant volatility in currency and financial markets generally. A return to unfavorable economic conditions or sustained economic slowdown could adversely impact the Funds' portfolios. Financial
| 14 l CLAYMORE EXCHANGE-TRADED FUND TRUST 2 SEMIANNUAL REPORT |
| (Unaudited) | February 28, 2017 |
market conditions, as well as various social and political tensions in the U.S. and around the world, have contributed to increased market volatility and may have long-term effects on the U.S. and worldwide financial markets and cause further economic uncertainties or deterioration in the U.S. and worldwide. The Investment Advisors do not know how long the financial markets will continue to be affected by these events and cannot predict the effects of these or similar events in the future on the U.S. and global economies and securities markets.
There is no assurance that the requirements of the NYSE Arca necessary to maintain the listing of the Funds will continue to be met or will remain unchanged.
In addition to the risks described, there are certain other risks related to investing in the Funds. These risks are described further in each Fund's Prospectus and Statement of Additional Information and at guggenheiminvestments.com.
| CLAYMORE EXCHANGE-TRADED FUND TRUST 2 SEMIANNUAL REPORT l 15 |
| PERFORMANCE REPORT AND FUND PROFILE (Unaudited) | February 28, 2017 |
YAO Guggenheim China All-Cap ETF
| Fund Statistics | |||
| Share Price | $ | 27.15 | |
| Net Asset Value | $ | 27.14 | |
| Premium to NAV | 0.04% | ||
| Net Assets ($000) | $ | 21,716 |
| AVERAGE ANNUAL TOTAL RETURNS FOR THE | |
| PERIOD ENDED FEBRUARY 28, 2017 |
| Six | |||||
| Month | Since | ||||
| (non- | One | Three | Five | Inception | |
| annualized) | Year | Year | Year | (10/19/09) | |
| Guggenheim China All-Cap ETF | |||||
| NAV | 5.91% | 31.46% | 4.35% | 3.65% | 3.39% |
| Market | 5.81% | 30.61% | 4.76% | 3.82% | 3.39% |
| AlphaShares | |||||
| China All | |||||
| Cap Index | 6.28% | 32.51% | 4.53% | 4.06% | 3.92% |
| MSCI China | |||||
| Index | 5.34% | 31.13% | 5.05% | 3.65% | 2.92% |
Performance data quoted represents past performance, which is no guarantee of future results and current performance may be lower or higher than the figures shown. All NAV returns include the deduction of management fees, operating expenses and all other Fund expenses. The deduction of taxes that a shareholder would pay on Fund distributions or the redemption of Fund shares is not reflected in the total returns. For the most recent month-end performance figures, please visit guggenheiminvestments.com. The investment return and principal value of an investment will fluctuate with changes in market conditions and other factors so that an investor's shares, when redeemed, may be worth more or less than their original cost.
Since inception returns assume a purchase of the Fund at the initial share price of $24.82 per share for share price returns or initial net asset value (NAV) of $24.82 per share for NAV returns. Returns for periods of less than one year are not annualized.
The MSCI China Index is a capitalization-weighted index that measures the performance of large- and mid-cap securities in the Chinese equity markets and includes representation across China H shares, B shares, Red chips and P chips.
The referenced index is unmanaged and not available for direct investment. Index performance does not reflect transaction costs, fees or expenses.
The Fund's annual operating expense ratio of 0.70% is expressed as a unitary fee and covers all expenses of the Fund, except for distribution fees, if any, brokerage expenses, taxes, interest, litigation expenses and other extraordinary expenses. Please see Financial Highlights for recent expense ratios.
| Portfolio Breakdown | % of Net Assets |
| Financial | 35.6% |
| Communications | 27.3% |
| Consumer, Non-cyclical | 8.0% |
| Energy | 7.6% |
| Consumer, Cyclical | 6.8% |
| Industrial | 6.3% |
| Technology | 3.5% |
| Other | 4.9% |
| Total Common Stocks | 100.0% |
| Securities Lending Collateral | 1.7% |
| Total Investments | 101.7% |
| Other Assets & Liabilities, net | -1.7% |
| Net Assets | 100.0% |
| Ten Largest Holdings | |
| (% of Total Net Assets) | |
| Alibaba Group Holding Ltd. ADR | 5.2% |
| Tencent Holdings Ltd. | 5.1% |
| China Construction Bank Corp. — Class H | 5.1% |
| China Mobile Ltd. | 4.8% |
| Industrial & Commercial Bank of China Ltd. — Class H | 4.7% |
| Baidu, Inc. ADR | 4.3% |
| Bank of China Ltd. — Class H | 3.5% |
| JD.com, Inc. ADR | 2.7% |
| Ping An Insurance Group Company of China Ltd. — Class H | 2.5% |
| China Life Insurance Company Ltd. — Class H | 2.1% |
| Top Ten Total | 40.0% |
"Ten Largest Holdings" excludes any temporary cash investments.
| 16 l CLAYMORE EXCHANGE-TRADED FUND TRUST 2 SEMIANNUAL REPORT |
| PERFORMANCE REPORT AND FUND PROFILE (Unaudited) continued | February 28, 2017 |
CQQQ Guggenheim China Technology ETF
| Fund Statistics | |||
| Share Price | $ | 40.41 | |
| Net Asset Value | $ | 40.13 | |
| Premium to NAV | 0.70% | ||
| Net Assets ($000) | $ | 58,193 |
| AVERAGE ANNUAL TOTAL RETURNS FOR THE |
| PERIOD ENDED FEBRUARY 28, 2017 |
| Six | |||||
| Month | Since | ||||
| (non- | One | Three | Five | Inception | |
| annualized) | Year | Year | Year | (12/08/09) | |
| Guggenheim China Technology ETF | |||||
| NAV | 3.92% | 30.48% | 3.90% | 11.73% | 8.27% |
| Market | 5.15% | 30.70% | 4.24% | 12.11% | 8.37% |
| AlphaShares | |||||
| China | |||||
| Technology | |||||
| Index | 4.19% | 31.15% | 3.34% | 11.58% | 8.21% |
| MSCI China | |||||
| Index | 5.34% | 31.13% | 5.05% | 3.65% | 2.25% |
Performance data quoted represents past performance, which is no guarantee of future results and current performance may be lower or higher than the figures shown. All NAV returns include the deduction of management fees, operating expenses and all other Fund expenses. The deduction of taxes that a shareholder would pay on Fund distributions or the redemption of Fund shares is not reflected in the total returns. For the most recent month-end performance figures, please visit guggenheiminvestments.com. The investment return and principal value of an investment will fluctuate with changes in market conditions and other factors so that an investor's shares, when redeemed, may be worth more or less than their original cost.
Since inception returns assume a purchase of the Fund at the initial share price of $25.06 per share for share price returns or initial net asset value (NAV) of $25.06 per share for NAV returns. Returns for periods of less than one year are not annualized.
The MSCI China Index is a capitalized-weighted index that measures the performance of large- and mid-cap securities in the Chinese equity markets and includes representation across China H shares, B shares, Red chips, and P chips.
The referenced index is unmanaged and not available for direct investment. Index performance does not reflect transaction costs, fees or expenses.
The Fund's annual operating expense ratio of 0.70% is expressed as a unitary fee and covers all expenses of the Fund, except for distribution fees, if any, brokerage expenses, taxes, interest, litigation expenses and other extraordinary expenses. Please see Financial Highlights for recent expense ratios.
| Portfolio Breakdown | % of Net Assets |
| Communications | 46.8% |
| Technology | 27.5% |
| Industrial | 14.1% |
| Energy | 4.7% |
| Basic Materials | 3.2% |
| Consumer, Cyclical | 1.3% |
| Consumer, Non-cyclical | 1.1% |
| Diversified | 0.9% |
| Financial | 0.4% |
| Total Common Stocks | 100.0% |
| Securities Lending Collateral | 8.1% |
| Total Investments | 108.1% |
| Other Assets & Liabilities, net | -8.1% |
| Net Assets | 100.0% |
| Ten Largest Holdings | |
| (% of Total Net Assets) | |
| Tencent Holdings Ltd. | 10.0% |
| Alibaba Group Holding Ltd. ADR | 9.0% |
| NetEase, Inc. ADR | 8.7% |
| Baidu, Inc. ADR | 7.3% |
| Sunny Optical Technology Group Company Ltd. | 4.4% |
| AAC Technologies Holdings, Inc. | 4.4% |
| Semiconductor Manufacturing International Corp. | 4.0% |
| SINA Corp. | 3.6% |
| Lenovo Group Ltd. | 3.5% |
| 58.com, Inc. ADR | 3.4% |
| Top Ten Total | 58.3% |
"Ten Largest Holdings" excludes any temporary cash investments.
| CLAYMORE EXCHANGE-TRADED FUND TRUST 2 SEMIANNUAL REPORT l 17 |
| PERFORMANCE REPORT AND FUND PROFILE (Unaudited) continued | February 28, 2017 |
TAN Guggenheim Solar ETF
| Fund Statistics | |||
| Share Price | $ | 18.76 | |
| Net Asset Value | $ | 18.72 | |
| Premium to NAV | 0.21% | ||
| Net Assets ($000) | $ | 214,361 |
| AVERAGE ANNUAL TOTAL RETURNS FOR THE |
| PERIOD ENDED FEBRUARY 28, 2017 |
| Six | |||||
| Month | Since | ||||
| (non- | One | Three | Five | Inception | |
| annualized) | Year | Year | Year | (04/15/08) | |
| Guggenheim Solar ETF | |||||
| NAV | -5.87% | -15.78% | -24.21% | -5.06% | -23.06% |
| Market | -5.76% | -15.97% | -24.13% | -4.86% | -23.04% |
| MAC Global | |||||
| Solar Energy | |||||
| Index | -6.93% | -18.50% | -26.96% | -8.23% | -24.61% |
| MSCI World | |||||
| Index | 7.78% | 21.26% | 5.20% | 9.41% | 4.90% |
Performance data quoted represents past performance, which is no guarantee of future results and current performance may be lower or higher than the figures shown. All NAV returns include the deduction of management fees, operating expenses and all other Fund expenses. The deduction of taxes that a shareholder would pay on Fund distributions or the redemption of Fund shares is not reflected in the total returns. For the most recent month-end performance figures, please visit guggenheiminvestments.com. The investment return and principal value of an investment will fluctuate with changes in market conditions and other factors so that an investor's shares, when redeemed, may be worth more or less than their original cost.
Since inception returns assume a purchase of the Fund at the initial share price of $251.30* per share for share price returns or initial net asset value (NAV) of $251.30* per share for NAV returns. Returns for periods of less than one year are not annualized.
The Morgan Stanley Capital International (MSCI) World Index measures performance from a diverse range of global stock markets, including the U.S., Canada, Europe, Australia, New Zealand, and the Far East.
The referenced index is unmanaged and not available for direct investment. Index performance does not reflect transaction costs, fees or expenses.
Per the most recent prospectus, the Fund's annualized gross operating expense ratio, gross of any fee waivers or expense reimbursements, was 0.88%. In the Financial Highlights section of this Semi-annual Report, the Fund's annualized net operating expense ratio was 0.69% while the Fund's annualized gross operating expense ratio, gross of any fee waivers or expense reimbursements, was 0.78%. There is a contractual fee waiver currently in place for this Fund through December 31, 2019 to the extent necessary in keeping the Fund's operating expense ratio from exceeding 0.65% of average net assets per year. Some expenses fall outside of this expense cap and actual expenses may be higher than 0.65%. Without this expense cap, actual returns would be lower. Please see Financial Highlights for recent expense ratios.
| Country Diversification | % of Common Stocks |
| Country | |
| United States | 38.8% |
| Cayman Islands | 35.4% |
| United Kingdom | 5.4% |
| Canada | 5.1% |
| Norway | 4.3% |
| Germany | 3.8% |
| Switzerland | 3.8% |
| Bermuda | 3.4% |
| Total Common Stocks | 100.0% |
| Ten Largest Holdings | |
| (% of Total Net Assets) | |
| First Solar, Inc. | 6.1% |
| GCL-Poly Energy Holdings Ltd. | 5.5% |
| Xinyi Solar Holdings Ltd. | 5.4% |
| Atlantica Yield plc | 5.4% |
| Canadian Solar, Inc. | 5.1% |
| Trina Solar Ltd. ADR | 5.1% |
| SunPower Corp. — Class A | 4.7% |
| Shunfeng International Clean Energy Ltd. | 4.6% |
| SolarEdge Technologies, Inc. | 4.3% |
| JinkoSolar Holding Company Ltd. ADR | 4.3% |
| Top Ten Total | 50.5% |
"Ten Largest Holdings" excludes any temporary cash investments.
*Reflects 1 for 10 reverse stock split that occurred on February 15, 2012.
| 18 l CLAYMORE EXCHANGE-TRADED FUND TRUST 2 SEMIANNUAL REPORT |
| PERFORMANCE REPORT AND FUND PROFILE (Unaudited) continued | February 28, 2017 |
CGW Guggenheim S&P Global Water Index ETF
| Fund Statistics | |||
| Share Price | $ | 30.08 | |
| Net Asset Value | $ | 30.10 | |
| Discount to NAV | -0.07% | ||
| Net Assets ($000) | $ | 482,795 |
| AVERAGE ANNUAL TOTAL RETURNS FOR THE |
| PERIOD ENDED FEBRUARY 28, 2017 |
| Six | |||||
| Month | Since | ||||
| (non- | One | Three | Five | Inception | |
| annualized) | Year | Year | Year | (05/14/07) | |
| Guggenheim S&P Global Water Index ETF | |||||
| NAV | 1.08% | 16.56% | 3.05% | 9.62% | 4.39% |
| Market | 0.85% | 16.62% | 3.02% | 9.75% | 4.38% |
| S&P Global | |||||
| Water Index | 1.25% | 16.79% | 3.29% | 9.93% | 4.87% |
| MSCI World | |||||
| Index | 7.78% | 21.26% | 5.20% | 9.41% | 3.61% |
| Dow Jones | |||||
| Utilities | |||||
| Index | 3.03% | 13.48% | 4.97% | 5.97% | -0.36% |
Performance data quoted represents past performance, which is no guarantee of future results and current performance may be lower or higher than the figures shown. All NAV returns include the deduction of management fees, operating expenses and all other Fund expenses. The deduction of taxes that a shareholder would pay on Fund distributions or the redemption of Fund shares is not reflected in the total returns. For the most recent month-end performance figures, please visit guggenheiminvestments.com. The investment return and principal value of an investment will fluctuate with changes in market conditions and other factors so that an investor's shares, when redeemed, may be worth more or less than their original cost.
Since inception returns assume a purchase of the Fund at the initial share price of $24.78 per share for share price returns or initial net asset value (NAV) of $24.78 per share for NAV returns. Returns for periods of less than one year are not annualized.
The Morgan Stanley Capital International (MSCI) World Index measures performance from a diverse range of global stock markets, including the U.S., Canada, Europe, Australia, New Zealand, and the Far East. The Dow Jones Global Utilities Index consists of companies that provide electrical, water, natural gas, and telephone utilities. The index is quoted in USD.
The referenced indices are unmanaged and not available for direct investment. Index performance does not reflect transaction costs, fees or expenses.
Per the most recent prospectus, the Fund's annualized gross operating expense ratio, gross of any fee waivers or expense reimbursements, was 0.64%. In the Financial Highlights section of this Semi-annual Report, the Fund's annualized net operating expense ratio was 0.63% while the Fund's annualized gross operating expense ratio, gross of any fee waivers or expense reimbursements, was 0.63%. There is a contractual fee waiver currently in place for this Fund through December 31, 2019 to the extent necessary in keeping the Fund's operating expense ratio from exceeding 0.65% of average net assets per year. Some expenses fall outside of this expense cap and actual expenses may be higher than 0.65%. Without this expense cap, actual returns would be lower. Please see Financial Highlights for recent expense ratios.
| Country Diversification | % of Common Stocks |
| Country | |
| United States | 39.6% |
| United Kingdom | 15.2% |
| Switzerland | 9.0% |
| France | 6.8% |
| Ireland | 5.0% |
| China | 4.2% |
| Japan | 3.0% |
| Other | 17.2% |
| Total Common Stocks | 100.0% |
| Ten Largest Holdings | |
| (% of Total Net Assets) | |
| Geberit AG | 8.3% |
| American Water Works Co., Inc. | 8.0% |
| Danaher Corp. | 5.3% |
| Pentair plc | 5.0% |
| United Utilities Group plc | 4.8% |
| Xylem, Inc. | 4.5% |
| Severn Trent plc | 4.0% |
| Veolia Environnement S.A. | 3.7% |
| IDEX Corp. | 3.6% |
| Aqua America, Inc. | 3.3% |
| Top Ten Total | 50.5% |
"Ten Largest Holdings" excludes any temporary cash investments.
| CLAYMORE EXCHANGE-TRADED FUND TRUST 2 SEMIANNUAL REPORT l 19 |
| PERFORMANCE REPORT AND FUND PROFILE (Unaudited) continued | February 28, 2017 |
GHII Guggenheim S&P High Income Infrastructure ETF
| Fund Statistics | |||
| Share Price | $ | 27.08 | |
| Net Asset Value | $ | 26.90 | |
| Premium to NAV | 0.67% | ||
| Net Assets ($000) | $ | 28,249 |
| AVERAGE ANNUAL TOTAL RETURNS FOR THE |
| PERIOD ENDED FEBRUARY 28, 2017 |
| Six | |||
| Month | Since | ||
| (non- | One | Inception | |
| annualized) | Year | (02/11/15) | |
| Guggenheim S&P High Income Infrastructure ETF | |||
| NAV | 4.22% | 31.31% | 8.22% |
| Market | 4.11% | 34.58% | 8.53% |
| S&P High Income | |||
| Infrastructure Index | 4.50% | 32.35% | 9.30% |
| S&P Global BMI Index | 7.86% | 23.30% | 5.66% |
Performance data quoted represents past performance, which is no guarantee of future results and current performance may be lower or higher than the figures shown. All NAV returns include the deduction of management fees, operating expenses and all other Fund expenses. The deduction of taxes that a shareholder would pay on Fund distributions or the redemption of Fund shares is not reflected in the total returns. For the most recent month-end performance figures, please visit guggenheiminvestments.com. The investment return and principal value of an investment will fluctuate with changes in market conditions and other factors so that an investor's shares, when redeemed, may be worth more or less than their original cost.
Since inception returns assume a purchase of the Fund at the initial share price of $25.05 per share for share price returns or initial net asset value (NAV) of $25.05 per share for NAV returns. Returns for periods of less than one year are not annualized.
The S&P Global BMI is a comprehensive, rules-based index designed to measure global stock market performance. The index covers all publicly listed equities with float adjusted market values of $100 million or more and annual dollar value traded of at least $50 million in all included countries. The S&P Global BMI is made up of the S&P Developed BMI and the S&P Emerging BMI indices. The referenced indices are unmanaged and not available for direct investment. Index performance does not reflect transaction costs, fees or expenses.
The Fund's annual operating expense ratio of 0.45% is expressed as a unitary fee and covers all expenses of the Fund, except for distribution fees, if any, brokerage expenses, taxes, interest, litigation expenses and other extraordinary expenses. Please see Financial Highlights for recent expense ratios.
| Country Diversification | % of Common Stocks |
| Country | |
| Canada | 17.4% |
| Bermuda | 12.3% |
| China | 10.6% |
| United States | 9.9% |
| Spain | 9.4% |
| France | 6.0% |
| Italy | 5.3% |
| Other | 29.1% |
| Total Common Stocks | 100.0% |
| Ten Largest Holdings | |
| (% of Total Net Assets) | |
| Ship Finance International Ltd. | 4.9% |
| Nordic American Tankers Ltd. | 4.6% |
| Snam SpA | 4.4% |
| Targa Resources Corp. | 4.1% |
| Veresen, Inc. | 3.9% |
| Abertis Infraestructuras S.A. | 3.6% |
| Williams Companies, Inc. | 3.5% |
| Inter Pipeline Ltd. | 3.4% |
| DHT Holdings, Inc. | 3.3% |
| Pembina Pipeline Corp. | 3.1% |
| Top Ten Total | 38.8% |
"Ten Largest Holdings" excludes any temporary cash investments.
| 20 l CLAYMORE EXCHANGE-TRADED FUND TRUST 2 SEMIANNUAL REPORT |
| PERFORMANCE REPORT AND FUND PROFILE (Unaudited) continued | February 28, 2017 |
GHII Guggenheim S&P High Income Infrastructure ETF continued
| CLAYMORE EXCHANGE-TRADED FUND TRUST 2 SEMIANNUAL REPORT l 21 |
| PERFORMANCE REPORT AND FUND PROFILE (Unaudited) continued | February 28, 2017 |
GTO Guggenheim Total Return Bond ETF
| Fund Statistics | |||
| Share Price | $ | 51.43 | |
| Net Asset Value | $ | 51.49 | |
| Discount to NAV | -0.12% | ||
| Net Assets ($000) | $ | 28,321 |
AVERAGE ANNUAL TOTAL RETURNS FOR THE PERIOD ENDED FEBRUARY 28, 2017 | |||
| Six | |||
| Month | Since | ||
| (non- | One | Inception | |
| annualized) | Year | (02/10/16) | |
| Guggenheim Total Return Bond ETF | |||
| NAV | 0.01% | 6.37% | 6.00% |
| Market | -0.24% | 5.84% | 5.88% |
| Bloomberg Barclays U.S. | |||
| Aggregate Bond Index | -2.19% | 1.42% | 1.44% |
Performance data quoted represents past performance, which is no guarantee of future results and current performance may be lower or higher than the figures shown. All NAV returns include the deduction of management fees, operating expenses and all other Fund expenses. The deduction of taxes that a shareholder would pay on Fund distributions or the redemption of Fund shares is not reflected in the total returns. For the most recent month-end performance figures, please visit guggenheiminvestments.com. The investment return and principal value of an investment will fluctuate with changes in market conditions and other factors so that an investor's shares, when redeemed, may be worth more or less than their original cost.
Since inception returns assume a purchase of the Fund at the initial share price of $49.97 per share for share price returns or initial net asset value (NAV) of $49.97 per share for NAV returns. Returns for periods of less than one year are not annualized.
The Bloomberg Barclays U.S. Aggregate Bond Index is a broad-based benchmark that measures the investment grade, U.S. dollar denominated, fixed-rate taxable bond market, including Treasuries, government-related and corporate securities, MBS (agency fixed-rate and hybrid ARM passthroughs), ABS and CMBS. The referenced indices are unmanaged and not available for direct investment. Index performance does not reflect transaction costs, fees or expenses.The referenced indices are unmanaged and not available for direct investment. Index performance does not reflect transaction costs, fees or expenses.
The Fund's annual operating expense ratio of 0.50% is expressed as a unitary fee and covers all expenses of the Fund, except for distribution fees, if any, brokerage expenses, taxes, interest, litigation expenses and other extraordinary expenses. For the period ended February 28, 2017, the Fund's total net expense ratio was 0.48% due to voluntary expense waivers. Please see Financial Highlights for recent expense ratios.
| Portfolio Breakdown | % of Net Assets |
| Corporate Bonds | 33.1% |
| Collateralized Mortgage Obligations | 17.6% |
| Asset Backed Securities | 16.5% |
| Commercial Paper | 7.1% |
| Municipal Bonds | 5.9% |
| U.S. Treasury Bills | 5.9% |
| Repurchase Agreements | 4.9% |
| Senior Floating Rate Interests | 4.5% |
| Money Market Fund | 3.2% |
| Exchange Traded Funds | 2.5% |
| Closed End Funds | 1.3% |
| Foreign Government Bonds | 1.3% |
| Securities Lending Collateral | 0.4% |
| Total Investments | 104.2% |
| Other Assets & Liabilities, net | -4.2% |
| Net Assets | 100.0% |
| Ten Largest Holdings | |
| (% of Total Net Assets) | |
| U.S. Treasury Bonds, 0.00% | 5.7% |
| Guggenheim Enhanced Short Duration ETF | 2.5% |
| Cerberus Loan Funding XVI, LP Class A2, 3.24% | 1.8% |
| Golub Capital Partners CLO Ltd. Class A, 3.39% | 1.7% |
| Apollo Aviation Securitization Equity Trust Class A, 4.21% | 1.7% |
| Fort Knox Military Housing Privatization Project, 5.82% | 1.4% |
| Guggenheim Strategic Opportunities Fund | 1.4% |
| Citigroup, Inc., 5.95% | 1.3% |
| Freddie Mac Multifamily Structured Pass Through | |
| Certificates Class X1, 1.02% | 1.3% |
| Hospitality Properties Trust, 5.25% | 1.3% |
| Top Ten Total | 20.1% |
"Ten Largest Holdings" excludes any temporary cash investments.
| 22 l CLAYMORE EXCHANGE-TRADED FUND TRUST 2 SEMIANNUAL REPORT |
| PERFORMANCE REPORT AND FUND PROFILE (Unaudited) continued | February 28, 2017 |
GTO Guggenheim Total Return Bond ETF continued
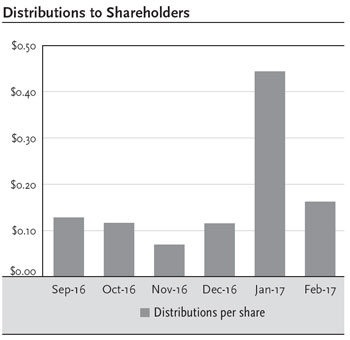
| CLAYMORE EXCHANGE-TRADED FUND TRUST 2 SEMIANNUAL REPORT l 23 |
| PERFORMANCE REPORT AND FUND PROFILE (Unaudited) continued | February 28, 2017 |
OVLC Guggenheim U.S. Large Cap Optimized Volatility ETF
| Fund Statistics | ||||
| Share Price | $ | 27.69 | ||
| Net Asset Value | $ | 27.75 | ||
| Discount to NAV | -0.22% | |||
| Net Assets ($000) | $ | 2,775 |
| AVERAGE ANNUAL TOTAL RETURNS FOR THE | |
| PERIOD ENDED FEBRUARY 28, 2017 | |
| Since | ||
| Six | Inception | |
| Month | (05/10/16) | |
| (non- | (non- | |
| annualized) | annualized) | |
| Guggenheim U.S. Large Cap Optimized Volatility ETF | ||
| NAV | 6.95% | 11.46% |
| Market | 6.96% | 11.21% |
| Guggenheim U.S. Large Cap | ||
| Optimized Volatility Index | 7.18% | 11.84% |
| S&P 500 Index | 10.01% | 16.88% |
Performance data quoted represents past performance, which is no guarantee of future results and current performance may be lower or higher than the figures shown. All NAV returns include the deduction of management fees, operating expenses and all other Fund expenses. The deduction of taxes that a shareholder would pay on Fund distributions or the redemption of Fund shares is not reflected in the total returns. For the most recent month-end performance figures, please visit guggenheiminvestments.com. The investment return and principal value of an investment will fluctuate with changes in market conditions and other factors so that an investor's shares, when redeemed, may be worth more or less than their original cost.
Since inception returns assume a purchase of the Fund at the initial share price of $25.14 per share for share price returns or initial net asset value (NAV) of $25.14 per share for NAV returns. Returns for periods of less than one year are not annualized.
The Standard and Poor's 500 Index (S&P 500®) is a broad-based index, the performance of which is based on the performance of 500 widely held common stocks chosen for market size, liquidity and industry group representation. The referenced indices are unmanaged and not available for direct investment. Index performance does not reflect transaction costs, fees or expenses.
The Fund's annual operating expense ratio of 0.30% is expressed as a unitary fee and covers all expenses of the Fund, except for distribution fees, if any, brokerage expenses, taxes, interest, litigation expenses and other extraordinary expenses. Please see Financial Highlights for recent expense ratios.
| Portfolio Breakdown | % of Net Assets |
| Consumer, Non-cyclical | 28.3% |
| Financial | 17.0% |
| Consumer, Cyclical | 13.5% |
| Industrial | 9.7% |
| Technology | 9.1% |
| Utilities | 7.3% |
| Communications | 6.3% |
| Energy | 5.0% |
| Basic Materials | 3.2% |
| Total Investments | 99.4% |
| Securities Lending Collateral | 0.4% |
| Total Investments | 99.8% |
| Other Assets & Liabilities, net | 0.2% |
| Net Assets | 100.0% |
| Ten Largest Holdings | |
| (% of Total Net Assets) | |
| Exxon Mobil Corp. | 2.5% |
| Apple, Inc. | 2.5% |
| AT&T, Inc. | 2.2% |
| Pfizer, Inc. | 2.0% |
| Verizon Communications, Inc. | 1.9% |
| Merck & Company, Inc. | 1.9% |
| International Business Machines Corp. | 1.8% |
| PepsiCo, Inc. | 1.8% |
| Oracle Corp. | 1.7% |
| McDonald's Corp. | 1.5% |
| Top Ten Total | 19.8% |
"Ten Largest Holdings" excludes any temporary cash investments.
| 24 l CLAYMORE EXCHANGE-TRADED FUND TRUST 2 SEMIANNUAL REPORT |
| ABOUT SHAREHOLDERS' FUND EXPENSES (Unaudited) | February 28, 2017 |
All funds have operating expenses and it is important for our shareholders to understand the impact of costs on their investments. Shareholders of a Fund incur advisory fees and other Fund expenses which are deducted from a Fund's gross income and reduce the investment return of the Fund.
A fund's expenses are expressed as a percentage of its average net assets, which is known as the expense ratio. The following examples are intended to help investors understand the ongoing costs (in dollars) of investing in a Fund and to compare these costs with the ongoing costs of investing in other funds.
The examples are based on an investment of $1,000 made at the beginning of the period and held for the entire six-month period beginning August 31, 2016 and ending February 28, 2017.
The following tables illustrate a Fund's costs in two ways:
Table 1. Based on actual Fund return. This section helps investors estimate the actual expenses paid over the period. The "Ending Account Value" shown is derived from the Fund's actual return, and the fifth column shows the dollar amount that would have been paid by an investor who started with $1,000 in the Fund. Investors may use the information here, together with the amount invested, to estimate the expenses paid over the period. Simply divide the Fund's account value by $1,000 (for example, an $8,600 account value divided by $1,000 = 8.6), then multiply the result by the number provided under the heading "Expenses Paid During Period."
Table 2. Based on hypothetical 5% return. This section is intended to help investors compare a Fund's cost with those of other funds. The table provides information about hypothetical account values and hypothetical expenses based on the Fund's actual expense ratio and an assumed rate of return of 5% per year before expenses, which is not the Fund's actual return. The hypothetical account values and expenses may not be used to estimate the actual ending account balance or expenses paid during the period. The example is useful in making comparisons because the U.S. Securities and Exchange Commission (the "SEC") requires all mutual funds to calculate expenses based on the 5% return. Investors can assess a Fund's costs by comparing this hypothetical example with the hypothetical examples that appear in shareholder reports of other funds.
The calculations illustrated above assume no shares were bought or sold during the period. Actual costs may have been higher or lower, depending on the amount of investment and the timing of any purchases or redemptions.
Please note that the expenses shown in the table are meant to highlight your ongoing costs only and do not reflect any transactional costs, such as sales charges (loads) on purchase payments, and contingent deferred sales charges ("CDSC") on redemptions, if any. Therefore, the second table is useful in comparing ongoing costs only, and will not help you determine the relative total costs of owning different funds. In addition, if these transactional costs were included, your costs would have been higher.
More information about a Fund's expenses, including annual expense ratios for the past five years, can be found in the Financial Highlights section of this report. For additional information on operating expenses and other shareholder costs, please refer to the appropriate Fund prospectus.
| Expenses | ||||||||||||||||
| Beginning | Ending | Paid | ||||||||||||||
| Expense | Fund | Account Value | Account Value | During | ||||||||||||
Ratio1 | Return | August 31, 2016 | February 28, 2017 | Period2 | ||||||||||||
Table 1. Based on actual Fund return3 | ||||||||||||||||
| Guggenheim China All-Cap ETF | 0.70 | % | 5.91 | % | $ | 1,000.00 | $ | 1,059.14 | $ | 3.57 | ||||||
| Guggenheim China Technology ETF | 0.70 | % | 3.92 | % | 1,000.00 | 1,039.25 | 3.54 | |||||||||
| Guggenheim Solar ETF | 0.69 | % | (5.87 | )% | 1,000.00 | 941.34 | 3.32 | |||||||||
| Guggenheim S&P Global Water Index ETF | 0.63 | % | 1.08 | % | 1,000.00 | 1,010.79 | 3.14 | |||||||||
| Guggenheim S&P High Income Infrastructure ETF | 0.45 | % | 4.22 | % | 1,000.00 | 1,042.19 | 2.28 | |||||||||
| Guggenheim Total Return Bond ETF | 0.48 | % | 0.01 | % | 1,000.00 | 1,000.14 | 2.38 | |||||||||
| Guggenheim U.S. Large Cap Optimized Volatility ETF | 0.30 | % | 6.95 | % | 1,000.00 | 1,069.54 | 1.54 | |||||||||
| Table 2. Based on hypothetical 5% return (before expenses) | ||||||||||||||||
| Guggenheim China All-Cap ETF | 0.70 | % | 5.00 | % | $ | 1,000.00 | $ | 1,021.32 | $ | 3.51 | ||||||
| Guggenheim China Technology ETF | 0.70 | % | 5.00 | % | 1,000.00 | 1,021.32 | 3.51 | |||||||||
| Guggenheim Solar ETF | 0.69 | % | 5.00 | % | 1,000.00 | 1,021.37 | 3.46 | |||||||||
| Guggenheim S&P Global Water Index ETF | 0.63 | % | 5.00 | % | 1,000.00 | 1,021.67 | 3.16 | |||||||||
| Guggenheim S&P High Income Infrastructure ETF | 0.45 | % | 5.00 | % | 1,000.00 | 1,022.56 | 2.26 | |||||||||
| Guggenheim Total Return Bond ETF | 0.48 | % | 5.00 | % | 1,000.00 | 1,022.41 | 2.41 | |||||||||
| Guggenheim U.S. Large Cap Optimized Volatility ETF | 0.30 | % | 5.00 | % | 1,000.00 | 1,023.31 | 1.51 |
1 | Annualized and excludes expenses of the underlying funds in which the Funds invest, if any. |
2 | Expenses are equal to the Fund's annualized expense ratio, net of any applicable fee waivers, multiplied by the average account value over the period, multiplied by 181/365 (to reflect the one-half year period). |
3 | Actual cumulative return at net asset value for the period August 31, 2016 to February 28, 2017. |
| CLAYMORE EXCHANGE-TRADED FUND TRUST 2 SEMIANNUAL REPORT l 25 |
| SCHEDULE OF INVESTMENTS (Unaudited) | February 28, 2017 |
YAO Guggenheim China All-Cap ETF
| Shares | Value | ||||||
COMMON STOCKS† - 100.0% | |||||||
| Financial - 35.6% | |||||||
| China Construction Bank Corp. — Class H | 1,353,549 | $ | 1,114,234 | ||||
| Industrial & Commercial Bank of China Ltd. — Class H | 1,552,126 | 1,017,761 | |||||
| Bank of China Ltd. — Class H | 1,512,466 | 765,736 | |||||
| Ping An Insurance Group Company of China Ltd. — Class H | 100,652 | 536,814 | |||||
| China Life Insurance Company Ltd. — Class H | 148,995 | 453,946 | |||||
| Bank of Communications Company Ltd. — Class H | 440,993 | 351,660 | |||||
| China Overseas Land & Investment Ltd. | 85,995 | 264,773 | |||||
| Agricultural Bank of China Ltd. — Class H | 528,982 | 243,964 | |||||
| China Pacific Insurance Group Company Ltd. — Class H | 55,600 | 203,778 | |||||
| China Merchants Bank Company Ltd. — Class H | 74,993 | 199,500 | |||||
| CITIC Ltd. | 128,000 | 183,695 | |||||
| China CITIC Bank Corporation Ltd. — Class H | 246,993 | 169,595 | |||||
| China Resources Land Ltd. | 53,999 | 147,477 | |||||
| China Minsheng Banking Corporation Ltd. — Class H | 124,990 | 142,663 | |||||
| PICC Property & Casualty Company Ltd. — Class H | 91,995 | 140,556 | |||||
| Haitong Securities Company Ltd. — Class H | 62,400 | 114,310 | |||||
| Country Garden Holdings Company Ltd. | 157,873 | 113,080 | |||||
| CITIC Securities Company Ltd. — Class H | 45,501 | 97,304 | |||||
China Huarong Asset Management Company Ltd. — Class H*,1 | 220,000 | 87,009 | |||||
| New China Life Insurance Company Ltd. — Class H | 15,200 | 74,899 | |||||
| GF Securities Company Ltd. — Class H | 31,272 | 68,889 | |||||
| China Galaxy Securities Company Ltd. — Class H | 69,500 | 68,135 | |||||
| China Cinda Asset Management Company Ltd. — Class H | 172,000 | 67,803 | |||||
| China Taiping Insurance Holdings Company Ltd.* | 28,800 | 67,451 | |||||
| China Vanke Company Ltd. — Class H | 26,396 | 66,309 | |||||
Huatai Securities Company Ltd. — Class H1 | 31,927 | 65,150 | |||||
| People's Insurance Company Group of China Ltd. — Class H | 136,000 | 55,890 | |||||
China Evergrande Group2 | 70,994 | 53,320 | |||||
Fullshare Holdings Ltd.2 | 134,384 | 52,109 | |||||
| Far East Horizon Ltd. | 42,000 | 40,418 | |||||
| Credit China Fintech Holdings Ltd.* | 266,515 | 38,797 | |||||
| Longfor Properties Company Ltd. | 23,999 | 38,399 | |||||
| Bank of Jinzhou Company Ltd. — Class H | 32,000 | 36,813 | |||||
Sunac China Holdings Ltd.2 | 35,000 | 36,387 | |||||
| China Everbright Ltd. | 18,000 | 35,710 | |||||
| Chongqing Rural Commercial Bank Company Ltd. — Class H | 49,994 | 35,101 | |||||
| Shimao Property Holdings Ltd. | 23,999 | 34,441 | |||||
| Sino-Ocean Group Holding Ltd. | 59,993 | 29,832 | |||||
Guangzhou R&F Properties Company Ltd. — Class H2 | 20,000 | 27,620 | |||||
| Shanghai Industrial Holdings Ltd. | 9,000 | 25,102 | |||||
| Shenzhen Investment Ltd. | 55,999 | 24,023 | |||||
| China Jinmao Holdings Group Ltd. | 75,998 | 23,595 | |||||
China International Capital Corporation Ltd. — Class H*,1 | 13,600 | 20,359 | |||||
Harbin Bank Company Ltd. — Class H1 | 60,000 | 20,174 | |||||
| Yuexiu Property Company Ltd. | 119,992 | 19,477 | |||||
| SOHO China Ltd. | 36,999 | 19,161 | |||||
| CIFI Holdings Group Company Ltd. | 56,000 | 18,757 | |||||
| Agile Group Holdings Ltd. | 28,000 | 18,468 | |||||
| Huishang Bank Corporation Ltd. — Class H | 32,000 | 16,572 | |||||
| KWG Property Holding Ltd. | 25,815 | 16,296 | |||||
| Guotai Junan International Holdings Ltd. | 47,000 | 15,803 | |||||
Poly Property Group Company Ltd.*,2 | 36,999 | 15,538 | |||||
| Shui On Land Ltd. | 66,993 | 15,017 | |||||
Shengjing Bank Company Ltd. — Class H1 | 13,818 | 14,134 | |||||
| Yanlord Land Group Ltd. | 13,200 | 13,733 | |||||
China South City Holdings Ltd.2 | 62,000 | 12,939 | |||||
| Joy City Property Ltd. | 76,000 | 11,749 | |||||
| Greentown China Holdings Ltd.* | 12,500 | 11,417 | |||||
| Central China Securities Company Ltd. — Class H | 20,000 | 11,311 | |||||
Noah Holdings Ltd. ADR*,2 | 424 | 11,105 | |||||
| Hopson Development Holdings Ltd. | 12,000 | 10,883 | |||||
Renhe Commercial Holdings Company Ltd.*,2 | 375,930 | 10,654 | |||||
| Bank of Tianjin Company Ltd. — Class H | 12,500 | 8,325 | |||||
| Total Financial | 7,725,920 | ||||||
| Communications - 27.3% | |||||||
| Alibaba Group Holding Ltd. ADR* | 10,905 | 1,122,125 | |||||
| Tencent Holdings Ltd. | 41,842 | 1,115,795 | |||||
| China Mobile Ltd. | 95,451 | 1,052,581 | |||||
| Baidu, Inc. ADR* | 5,383 | 937,342 | |||||
| JD.com, Inc. ADR* | 19,064 | 582,786 | |||||
| Ctrip.com International Ltd. ADR* | 7,581 | 359,643 | |||||
| China Unicom Hong Kong Ltd. | 119,995 | 145,927 | |||||
| China Telecom Corporation Ltd. — Class H | 277,981 | 130,710 | |||||
| Vipshop Holdings Ltd. ADR* | 7,187 | 93,503 | |||||
| SINA Corp.* | 1,193 | 82,949 | |||||
58.com, Inc. ADR*,2 | 1,808 | 66,173 | |||||
Weibo Corp. ADR*,2 | 919 | 46,428 | |||||
| Autohome, Inc. ADR* | 1,080 | 35,878 | |||||
| YY, Inc. ADR* | 687 | 30,427 | |||||
| ZTE Corp. — Class H | 15,048 | 24,503 | |||||
| Sohu.com, Inc.* | 613 | 24,416 | |||||
| 51job, Inc. ADR* | 451 | 16,213 | |||||
| Fang Holdings Ltd. ADR* | 5,236 | 15,603 | |||||
Bitauto Holdings Ltd. ADR*,2 | 808 | 15,400 | |||||
| BYD Electronic International Company Ltd. | 12,500 | 13,527 | |||||
21Vianet Group, Inc. ADR*,2 | 1,220 | 8,821 | |||||
| CITIC Telecom International Holdings Ltd. | 26,000 | 8,139 | |||||
| Total Communications | 5,928,889 |
| See notes to financial statements. |
| 26 l CLAYMORE EXCHANGE-TRADED FUND TRUST 2 SEMIANNUAL REPORT |
| SCHEDULE OF INVESTMENTS (Unaudited) continued | February 28, 2017 |
YAO Guggenheim China All-Cap ETF continued
| Shares | Value | ||||||
COMMON STOCKS† - 100.0% (continued) | |||||||
| Consumer, Non-cyclical - 8.0% | |||||||
| Hengan International Group Company Ltd. | 15,001 | $ | 128,125 | ||||
| New Oriental Education & Technology Group, Inc. ADR* | 2,602 | 125,963 | |||||
| Sinopharm Group Company Ltd. — Class H | 24,001 | 111,001 | |||||
| CSPC Pharmaceutical Group Ltd. | 90,000 | 110,145 | |||||
WH Group Ltd.1 | 140,500 | 109,867 | |||||
| China Mengniu Dairy Company Ltd. | 53,998 | 106,432 | |||||
| Want China Holdings Ltd. | 125,993 | 81,155 | |||||
| TAL Education Group ADR* | 905 | 78,255 | |||||
| Sino Biopharmaceutical Ltd. | 89,992 | 77,674 | |||||
| China Resources Beer Holdings Company Ltd.* | 32,000 | 72,636 | |||||
| China Conch Venture Holdings Ltd. | 36,000 | 71,328 | |||||
| China Medical System Holdings Ltd. | 26,495 | 43,143 | |||||
| Tingyi Cayman Islands Holding Corp. | 37,999 | 42,589 | |||||
| Tsingtao Brewery Company Ltd. — Class H | 8,000 | 36,793 | |||||
| China Biologic Products, Inc.* | 369 | 36,236 | |||||
| Jiangsu Expressway Company Ltd. — Class H | 26,000 | 34,299 | |||||
| Zhejiang Expressway Company Ltd. — Class H | 29,999 | 33,738 | |||||
| BeiGene Ltd* | 797 | 31,059 | |||||
| Shenzhen International Holdings Ltd. | 18,822 | 26,963 | |||||
| Shanghai Fosun Pharmaceutical Group Company | |||||||
Ltd. — Class H2 | 7,500 | 25,797 | |||||
3SBio, Inc.*,1,2 | 20,454 | 24,901 | |||||
China Huishan Dairy Holdings Company Ltd.2 | 68,000 | 24,879 | |||||
| Shandong Weigao Group Medical Polymer Company | |||||||
| Ltd. — Class H | 40,001 | 24,065 | |||||
| Luye Pharma Group Ltd. | 36,000 | 23,560 | |||||
| China First Capital Group Ltd.* | 50,000 | 21,836 | |||||
| Tong Ren Tang Technologies Company Ltd. — Class H | 11,000 | 20,179 | |||||
China Agri-Industries Holdings Ltd.*,2 | 39,999 | 19,736 | |||||
| CAR, Inc.* | 17,818 | 16,871 | |||||
| Guangzhou Baiyunshan Pharmaceutical Holdings Company | |||||||
| Ltd. — Class H | 6,000 | 15,884 | |||||
| Uni-President China Holdings Ltd. | 23,000 | 15,704 | |||||
| China Resources Phoenix Healthcare Holdings Company Ltd.* | 12,000 | 14,856 | |||||
China Shengmu Organic Milk Ltd.*,1 | 48,000 | 13,171 | |||||
| China Modern Dairy Holdings Ltd.* | 51,989 | 12,792 | |||||
| Universal Medical Financial & Technical Advisory Services | |||||||
Company Ltd.1 | 13,636 | 12,121 | |||||
| CP Pokphand Company Ltd. | 119,993 | 12,057 | |||||
| SSY Group Ltd. | 38,000 | 11,945 | |||||
| Vinda International Holdings Ltd. | 6,000 | 11,749 | |||||
| Biostime International Holdings Ltd.* | 3,500 | 11,610 | |||||
| Tibet Water Resources Ltd. | 27,000 | 11,131 | |||||
| Shenzhen Expressway Company Ltd. — Class H | 12,000 | 11,084 | |||||
| Fu Shou Yuan International Group Ltd. | 18,000 | 10,481 | |||||
Hua Han Health Industry Holdings Ltd.*,†††,3 | 91,200 | 2,644 | |||||
China Animal Healthcare Ltd.*,†††,3 | 36,000 | — | |||||
| Total Consumer, Non-cyclical | 1,726,454 | ||||||
| Energy - 7.6% | |||||||
| China Petroleum & Chemical Corp. — Class H | 507,183 | 393,334 | |||||
| CNOOC Ltd. | 321,990 | 380,791 | |||||
| PetroChina Company Ltd. — Class H | 421,986 | 321,282 | |||||
| China Shenhua Energy Company Ltd. — Class H | 67,996 | 142,256 | |||||
| China Everbright International Ltd. | 52,999 | 68,686 | |||||
| Kunlun Energy Company Ltd. | 67,994 | 59,126 | |||||
| China Longyuan Power Group Corporation Ltd. — Class H | 61,998 | 53,193 | |||||
| China Oilfield Services Ltd. — Class H | 37,999 | 37,888 | |||||
GCL-Poly Energy Holdings Ltd.*,2 | 245,995 | 33,592 | |||||
Yanzhou Coal Mining Company Ltd. — Class H2 | 35,999 | 28,939 | |||||
Xinyi Solar Holdings Ltd.*,2 | 78,000 | 27,432 | |||||
| China Coal Energy Company Ltd. — Class H* | 37,993 | 20,116 | |||||
| Sinopec Engineering Group Company Ltd. — Class H | 22,000 | 19,981 | |||||
Trina Solar Ltd. ADR*,2 | 1,753 | 18,407 | |||||
Shougang Fushan Resources Group Ltd.*,2 | 72,000 | 16,046 | |||||
| Beijing Jingneng Clean Energy Co. Ltd. — Class H | 38,000 | 11,553 | |||||
| Sinopec Kantons Holdings Ltd. | 20,000 | 10,461 | |||||
| Sinopec Oilfield Service Corp. — Class H* | 40,000 | 8,245 | |||||
| Total Energy | 1,651,328 | ||||||
| Consumer, Cyclical - 6.8% | |||||||
| Geely Automobile Holdings Ltd. | 99,993 | 136,029 | |||||
| Belle International Holdings Ltd. | 132,993 | 91,661 | |||||
| Brilliance China Automotive Holdings Ltd. | 57,996 | 91,151 | |||||
BYD Company Ltd. — Class H2 | 14,000 | 82,332 | |||||
| Guangzhou Automobile Group Company Ltd. — Class H | 45,999 | 77,154 | |||||
| Great Wall Motor Company Ltd. — Class H | 62,000 | 76,198 | |||||
| Dongfeng Motor Group Company Ltd. — Class H | 56,000 | 66,443 | |||||
| Shenzhou International Group Holdings Ltd. | 10,999 | 65,746 | |||||
| ANTA Sports Products Ltd. | 20,000 | 60,548 | |||||
| Haier Electronics Group Company Ltd. | 25,000 | 45,991 | |||||
| Xinyi Glass Holdings Ltd.* | 49,999 | 45,346 | |||||
| Minth Group Ltd. | 14,000 | 44,548 | |||||
| Sun Art Retail Group Ltd. | 43,499 | 41,916 | |||||
| Intime Retail Group Company Ltd. | 33,500 | 41,646 | |||||
| Alibaba Pictures Group Ltd.* | 230,000 | 38,519 | |||||
| China Lodging Group Ltd. ADR* | 623 | 36,115 | |||||
| Shanghai Pharmaceuticals Holding Company Ltd. — Class H | 14,000 | 36,071 | |||||
| Weichai Power Company Ltd. — Class H | 19,800 | 34,843 | |||||
| GOME Electrical Appliances Holding Ltd. | 226,991 | 31,582 | |||||
Fuyao Glass Industry Group Company Ltd. — Class H1 | 10,063 | 31,372 | |||||
| Air China Ltd. — Class H | 37,999 | 29,322 | |||||
| Skyworth Digital Holdings Ltd. | 37,999 | 24,672 |
| See notes to financial statements. |
| CLAYMORE EXCHANGE-TRADED FUND TRUST 2 SEMIANNUAL REPORT l 27 |
| SCHEDULE OF INVESTMENTS (Unaudited) continued | February 28, 2017 |
YAO Guggenheim China All-Cap ETF continued
| Shares | Value | ||||||
COMMON STOCKS† - 100.0% (continued) | |||||||
| Consumer, Cyclical - 6.8% (continued) | |||||||
Red Star Macalline Group Corporation Ltd. — Class H1 | 20,637 | $ | 22,119 | ||||
| Li Ning Company Ltd.* | 31,500 | 21,061 | |||||
| China Southern Airlines Company Ltd. — Class H | 32,000 | 20,818 | |||||
BAIC Motor Corporation Ltd. — Class H1 | 18,453 | 20,753 | |||||
| Zhongsheng Group Holdings Ltd. | 12,500 | 18,132 | |||||
| Imperial Pacific International Holdings Ltd.* | 980,000 | 18,054 | |||||
| China Eastern Airlines Corporation Ltd. — Class H | 32,000 | 17,768 | |||||
Digital China Holdings Ltd.*,2 | 17,000 | 15,178 | |||||
| BEP International Holdings Ltd. | 221,817 | 13,716 | |||||
| Golden Eagle Retail Group Ltd. | 9,000 | 13,380 | |||||
| China Travel International Investment Hong Kong Ltd. | 41,999 | 12,444 | |||||
| China Dongxiang Group Company Ltd. | 60,000 | 11,362 | |||||
| Pou Sheng International Holdings Ltd. | 40,000 | 9,739 | |||||
| China Minsheng Financial Holding Corporation Ltd.* | 120,000 | 9,275 | |||||
China Jicheng Holdings Ltd.*,1 | 329,690 | 8,112 | |||||
| Xtep International Holdings Ltd. | 15,500 | 7,089 | |||||
| Total Consumer, Cyclical | 1,468,205 | ||||||
| Industrial - 6.3% | |||||||
| AAC Technologies Holdings, Inc. | 14,982 | 157,782 | |||||
| China Communications Construction Company Ltd. — Class H | 87,993 | 113,583 | |||||
| Sunny Optical Technology Group Company Ltd. | 13,970 | 89,894 | |||||
| Anhui Conch Cement Company Ltd. — Class H | 23,500 | 81,891 | |||||
| CRRC Corporation Ltd. — Class H | 81,000 | 77,739 | |||||
| China Railway Group Ltd. — Class H | 76,993 | 67,347 | |||||
| Zhuzhou CRRC Times Electric Company Ltd. — Class H | 11,000 | 59,234 | |||||
| China State Construction International Holdings Ltd. | 33,999 | 55,625 | |||||
| China Railway Construction Corporation Ltd. — Class H | 37,999 | 53,750 | |||||
| China National Building Material Company Ltd. — Class H | 53,998 | 39,373 | |||||
| Yangzijiang Shipbuilding Holdings Ltd. | 51,000 | 33,731 | |||||
| Beijing Capital International Airport Company Ltd. — Class H | 30,000 | 32,155 | |||||
| China Communications Services Corp. Ltd. — Class H | 47,993 | 32,088 | |||||
| AviChina Industry & Technology Company Ltd. — Class H | 40,999 | 29,842 | |||||
| China High Speed Transmission Equipment Group Co. Ltd. | 24,000 | 29,249 | |||||
| Haitian International Holdings Ltd. | 13,000 | 27,332 | |||||
| Lee & Man Paper Manufacturing Ltd. | 29,999 | 27,207 | |||||
Shanghai Electric Group Company Ltd. — Class H*,2 | 51,998 | 26,929 | |||||
| COSCO SHIPPING Holdings Company Ltd. — Class H* | 51,500 | 24,548 | |||||
| China Energy Engineering Corporation Ltd. — Class H | 124,000 | 23,482 | |||||
| BBMG Corp. — Class H | 43,000 | 20,108 | |||||
| China Railway Signal & Communication Corporation | |||||||
Ltd. — Class H1 | 26,077 | 19,888 | |||||
| COSCO SHIPPING Development Company Ltd. — Class H* | 74,990 | 17,582 | |||||
| Guangshen Railway Company Ltd. — Class H | 28,000 | 17,494 | |||||
| Sinotrans Ltd. — Class H | 38,000 | 17,232 | |||||
| Hollysys Automation Technologies Ltd | 972 | 16,971 | |||||
| China Resources Cement Holdings Ltd. | 32,000 | 16,655 | |||||
| COSCO SHIPPING Energy Transportation Company | |||||||
| Ltd. — Class H | 26,000 | 15,709 | |||||
| China International Marine Containers Group Co. Ltd. — Class H | 8,300 | 14,499 | |||||
| Xinjiang Goldwind Science & Technology Company | |||||||
Ltd. — Class H2 | 8,800 | 14,420 | |||||
| China Lesso Group Holdings Ltd. | 19,000 | 14,270 | |||||
| SITC International Holdings Company Ltd. | 22,000 | 14,114 | |||||
| China Logistics Property Holdings Company Ltd.* | 31,000 | 13,099 | |||||
| China Zhongwang Holdings Ltd. | 25,599 | 12,169 | |||||
| Zoomlion Heavy Industry Science and Technology Company | |||||||
Ltd. — Class H2 | 23,199 | 12,134 | |||||
| Beijing Enterprises Clean Energy Group Ltd.* | 387,270 | 11,126 | |||||
| Tianneng Power International Ltd. | 12,000 | 10,621 | |||||
| China Machinery Engineering Corp. — Class H | 15,000 | 10,435 | |||||
| Chaowei Power Holdings Ltd. | 13,000 | 10,249 | |||||
| CT Environmental Group Ltd. | 48,000 | 10,017 | |||||
China Shanshui Cement Group Ltd.*,†††,3 | 105,999 | — | |||||
| Total Industrial | 1,371,573 | ||||||
| Technology - 3.5% | |||||||
| NetEase, Inc. ADR | 1,487 | 453,624 | |||||
Semiconductor Manufacturing International Corp.*,2 | 69,698 | 90,687 | |||||
| Lenovo Group Ltd. | 141,995 | 85,243 | |||||
| TravelSky Technology Ltd. — Class H | 19,000 | 41,464 | |||||
| Kingsoft Corporation Ltd. | 15,000 | 33,005 | |||||
| Chinasoft International Ltd.* | 38,000 | 18,651 | |||||
NetDragon Websoft Holdings Ltd.2 | 5,500 | 15,588 | |||||
| Kingdee International Software Group Company Ltd.* | 34,000 | 13,140 | |||||
| AGTech Holdings Ltd.* | 56,000 | 11,615 | |||||
| Total Technology | 763,017 | ||||||
| Utilities - 2.7% | |||||||
| Guangdong Investment Ltd. | 55,998 | 76,324 | |||||
| Beijing Enterprises Water Group Ltd.* | 97,986 | 70,058 | |||||
| China Gas Holdings Ltd. | 45,999 | 68,266 | |||||
| China Resources Power Holdings Company Ltd. | 35,999 | 65,204 | |||||
CGN Power Company Ltd. — Class H1 | 203,271 | 61,800 | |||||
| Huaneng Power International, Inc. — Class H | 83,994 | 57,241 | |||||
| China Resources Gas Group Ltd. | 18,000 | 54,957 | |||||
| Beijing Enterprises Holdings Ltd. | 10,000 | 52,303 | |||||
| China Power International Development Ltd. | 65,999 | 25,592 | |||||
| Huaneng Renewables Corporation Ltd. — Class H | 71,992 | 24,484 | |||||
| Datang International Power Generation Company Ltd. — Class H | 53,996 | 15,790 | |||||
| Huadian Power International Corporation Ltd. — Class H | 28,000 | 12,300 | |||||
| Huadian Fuxin Energy Corporation Ltd. — Class H | 46,000 | 11,200 | |||||
| Total Utilities | 595,519 |
| See notes to financial statements. |
| 28 l CLAYMORE EXCHANGE-TRADED FUND TRUST 2 SEMIANNUAL REPORT |
| SCHEDULE OF INVESTMENTS (Unaudited) continued | February 28, 2017 |
YAO Guggenheim China All-Cap ETF continued
| Shares | Value | ||||||
COMMON STOCKS† - 100.0% (continued) | |||||||
| Basic Materials - 1.9% | |||||||
| Kingboard Chemical Holdings Ltd. | 13,300 | $ | 47,032 | ||||
| Zijin Mining Group Company Ltd. — Class H | 113,992 | 43,026 | |||||
| Nine Dragons Paper Holdings Ltd. | 32,999 | 41,874 | |||||
| Sinopec Shanghai Petrochemical Company Ltd. — Class H | 67,998 | 41,171 | |||||
Aluminum Corporation of China Ltd. — Class H*,2 | 77,994 | 38,884 | |||||
| Jiangxi Copper Company Ltd. — Class H | 22,999 | 38,754 | |||||
| China Molybdenum Co. Ltd. — Class H | 72,000 | 27,548 | |||||
| China Hongqiao Group Ltd. | 27,000 | 27,131 | |||||
Huabao International Holdings Ltd.*,2 | 35,999 | 19,339 | |||||
| Angang Steel Company Ltd. — Class H* | 22,000 | 17,090 | |||||
| MMG Ltd.* | 40,000 | 15,768 | |||||
Zhaojin Mining Industry Company Ltd. — Class H2 | 15,500 | 15,176 | |||||
Yingde Gases Group Company Ltd.†† | 18,500 | 12,703 | |||||
| Fufeng Group Ltd. | 20,000 | 12,625 | |||||
| China BlueChemical Ltd. — Class H | 31,999 | 11,089 | |||||
| Total Basic Materials | 409,210 | ||||||
| Diversified - 0.3% | |||||||
| China Merchants Port Holdings Company Ltd. | 15,630 | 43,593 | |||||
Legend Holdings Corp. — Class H1 | 6,350 | 15,068 | |||||
| Carnival Group International Holdings Ltd.* | 110,000 | 11,762 | |||||
| Total Diversified | 70,423 | ||||||
| Total Common Stocks | |||||||
| (Cost $21,655,694) | 21,710,538 |
| Face | |||||||
| Amount | Value | ||||||
SECURITIES LENDING COLLATERAL††,4 - 1.7% | |||||||
| Joint Repurchase Agreements | |||||||
| RBC Dominion Securities, Inc. | |||||||
| issued 02/28/17 at 0.51% | |||||||
| due 03/01/17 | $ | 250,000 | 250,000 | ||||
| Citigroup Global Markets, Inc. | |||||||
| issued 02/28/17 at 0.54% | |||||||
| due 03/01/17 | 130,091 | 130,091 | |||||
| Total Securities Lending Collateral | |||||||
| (Cost $380,091) | 380,091 | ||||||
| Total Investments - 101.7% | |||||||
| (Cost $22,035,785) | $ | 22,090,629 | |||||
| Other Assets & Liabilities, net - (1.7)% | (375,128 | ) | |||||
| Total Net Assets - 100.0% | $ | 21,715,501 |
| * | Non-income producing security. | |
| † | Value determined based on Level 1 inputs, unless otherwise noted — See Note 4. | |
| †† | Value determined based on Level 2 inputs — See Note 4. | |
| ††† | Value determined based on Level 3 inputs — See Note 4. | |
| 1 | Security is a 144A or Section 4(a)(2) security. These securities have been determined to be liquid under guidelines established by the Board of Trustees. The total market value of 144A or Section 4(a)(2) liquid securities is $545,998 (cost $537,775), or 2.5% of total net assets. | |
| 2 | All or portion of this security is on loan at February 28, 2017 — See Note 2. | |
| 3 | Security was fair valued by the Valuation Committee at February 28, 2017. The total market value of fair valued securities amounts to $2,644, (cost $124,546) or less than 0.1% of total net assets. | |
| 4 | Securities lending collateral — See Note 2. | |
| ADR | American Depositary Receipt |
See Sector Classification in Supplemental Information section.
| Country Diversification | |||
| % of Common | |||
| Country | Stocks | ||
| China | 99.9% | ||
| Singapore | 0.1% | ||
| Total Common Stocks | 100.0% | ||
| Currency Denomination | |||
| % of Common | |||
| Currency | Stocks | ||
| Hong Kong Dollar | 80.2% | ||
| United States Dollar | 19.6% | ||
| Singapore Dollar | 0.2% | ||
| Total Common Stocks | 100.0% | ||
The following table summarizes the inputs used to value the Fund's investments at February 28, 2017 (See Note 4 in the Notes to Financial Statements):
| Level 2 | Level 3 | |||||||||||||||
| Significant | Significant | |||||||||||||||
| Level 1 | Observable | Unobservable | ||||||||||||||
| Quoted Prices | Inputs | Inputs | Total | |||||||||||||
| Assets | ||||||||||||||||
| Common Stocks | $ | 21,695,191 | $ | 12,703 | $ | 2,644 | $ | 21,710,538 | ||||||||
| Securities Lending | ||||||||||||||||
| Collateral | — | 380,091 | — | 380,091 | ||||||||||||
| Total | $ | 21,695,191 | $ | 392,794 | $ | 2,644 | $ | 22,090,629 | ||||||||
| See notes to financial statements. |
| CLAYMORE EXCHANGE-TRADED FUND TRUST 2 SEMIANNUAL REPORT l 29 |
| SCHEDULE OF INVESTMENTS (Unaudited) continued | February 28, 2017 |
YAO Guggenheim China All-Cap ETF continued
The following is a summary of significant unobservable inputs used in the, fair valuation of assets and liabilities categorized within Level 3 of the fair value hierarchy:
| Ending | ||||||||||
| Balance | Valuation | Unobservable | ||||||||
| Category | at 2/28/2017 | Technique | Inputs | |||||||
| Last trade with | 25% - | |||||||||
| Common Stocks | $ | 2,644 | adjustment | 100% Discount |
Transfers between investment levels may occur as the markets fluctuate and/or the availability of data used in an investment's valuation changes. Transfers between valuation levels, if any, are in comparison to the valuation levels at the end of the previous fiscal year, and are effective using the fair value as of the end of the current fiscal period.
The transfers in and out of the valuation levels as of February 28, 2017, compared to the valuation levels at the end of the previous fiscal year are detailed below:
| Transfer from Level 1 to Level 2 | $ | 12,703 | ||
| Transfer from Level 1 to Level 3 | 2,644 |
The transfer from Level 1 to Level 2 and the transfer from Level 1 to Level 3 are the results of the securities being halted on the principal exchange on which they trade.
Summary of Fair Value Level 3 Activity
Following is a reconciliation of Level 3 assets for which significant unobservable inputs were used to determine fair value for the period ended February 28, 2017:
Following is a reconciliation of Level 3 assets for which significant unobservable inputs were used to determine fair value for the period ended February 28, 2017:
| Common | ||||
| Stocks | ||||
| Beginning Balance | $ | — | * | |
| Transfers into Level 3 | 2,644 | |||
| Ending Balance | $ | 2,644 | ||
| Net change in unrealized appreciation | ||||
| (depreciation) for investments in | ||||
| securities still held at | ||||
| February 28, 2017 | $ | — | ||
* Market value is less than $1.
| See notes to financial statements. |
| 30 l CLAYMORE EXCHANGE-TRADED FUND TRUST 2 SEMIANNUAL REPORT |
| SCHEDULE OF INVESTMENTS (Unaudited) continued | February 28, 2017 |
CQQQ Guggenheim China Technology ETF
| Shares | Value | ||||||
COMMON STOCKS† - 100.0% | |||||||
| Communications - 46.8% | |||||||
| Tencent Holdings Ltd. | 217,357 | $ | 5,796,224 | ||||
| Alibaba Group Holding Ltd. ADR* | 50,972 | 5,245,019 | |||||
| Baidu, Inc. ADR* | 24,353 | 4,240,588 | |||||
| SINA Corp.* | 30,241 | 2,102,657 | |||||
58.com, Inc. ADR*,1 | 53,666 | 1,964,177 | |||||
Weibo Corp. ADR*,1 | 27,268 | 1,377,579 | |||||
| Autohome, Inc. ADR* | 32,193 | 1,069,451 | |||||
| YY, Inc. ADR* | 20,476 | 906,882 | |||||
| ZTE Corp. — Class H | 451,217 | 734,740 | |||||
Sohu.com, Inc.*,1 | 18,245 | 726,698 | |||||
Bitauto Holdings Ltd. ADR*,1 | 23,972 | 456,906 | |||||
Fang Holdings Ltd. ADR*,1 | 142,730 | 425,335 | |||||
| BYD Electronic International Company Ltd. | 373,884 | 404,592 | |||||
21Vianet Group, Inc. ADR*,1 | 36,126 | 261,191 | |||||
| China All Access Holdings Ltd. | 766,707 | 234,088 | |||||
Baozun Inc. ADR*,1 | 15,329 | 220,431 | |||||
| Yangtze Optical Fibre and Cable Joint Stock Limited | |||||||
Co. — Class H2 | 91,000 | 203,748 | |||||
| SUNeVision Holdings Ltd. | 360,000 | 191,074 | |||||
| Coolpad Group Ltd.* | 1,849,868 | 181,116 | |||||
| Comba Telecom Systems Holdings Ltd. | 832,540 | 156,588 | |||||
KongZhong Corp. ADR*,1 | 18,954 | 135,900 | |||||
Yirendai Ltd. ADR*,1 | 4,670 | 111,146 | |||||
| Renren, Inc. ADR* | 10,183 | 83,093 | |||||
| Total Communications | 27,229,223 | ||||||
| Technology - 27.5% | |||||||
| NetEase, Inc. ADR | 16,572 | 5,055,454 | |||||
| Semiconductor Manufacturing International Corp.* | 1,770,322 | 2,303,429 | |||||
| Lenovo Group Ltd. | 3,396,701 | 2,039,128 | |||||
| TravelSky Technology Ltd. — Class H | 555,860 | 1,213,054 | |||||
| Kingsoft Corporation Ltd. | 433,744 | 954,382 | |||||
| Chinasoft International Ltd.* | 1,244,252 | 610,709 | |||||
| Momo, Inc. ADR* | 19,651 | 523,503 | |||||
NetDragon Websoft Holdings Ltd.1 | 167,591 | 474,979 | |||||
| Kingdee International Software Group Company Ltd.* | 1,127,242 | 435,652 | |||||
AGTech Holdings Ltd.*,1 | 1,768,869 | 366,879 | |||||
PAX Global Technology Ltd.1 | 442,727 | 312,549 | |||||
Hua Hong Semiconductor Ltd.2 | 211,060 | 252,322 | |||||
Tian Ge Interactive Holdings Ltd.1,2 | 369,956 | 204,460 | |||||
NQ Mobile, Inc. — Class A ADR*,1 | 50,814 | 195,634 | |||||
| Ju Teng International Holdings Ltd. | 498,623 | 188,852 | |||||
| Changyou.com Ltd. ADR* | 6,694 | 184,888 | |||||
| Shunfeng International Clean Energy Ltd.* | 1,792,120 | 184,696 | |||||
Cheetah Mobile Inc ADR*,1 | 16,795 | 168,118 | |||||
| Boyaa Interactive International Ltd.* | 310,001 | 154,952 | |||||
| Shanghai Fudan Microelectronics Group Company | |||||||
| Ltd. — Class H* | 149,204 | 102,641 | |||||
| Sinosoft Technology Group Ltd. | 302,000 | 89,871 | |||||
| Total Technology | 16,016,152 | ||||||
| Industrial - 14.1% | |||||||
| Sunny Optical Technology Group Company Ltd. | 399,340 | 2,569,683 | |||||
| AAC Technologies Holdings, Inc. | 242,728 | 2,556,281 | |||||
| Tongda Group Holdings Ltd. | 2,242,040 | 753,850 | |||||
| China Railway Signal & Communication Corporation | |||||||
Ltd. — Class H2 | 846,854 | 645,850 | |||||
| Hollysys Automation Technologies Ltd. | 28,833 | 503,424 | |||||
Truly International Holdings Ltd.1 | 917,856 | 394,932 | |||||
GCL New Energy Holdings Ltd.*,1 | 4,357,577 | 221,739 | |||||
| Wasion Group Holdings Ltd. | 294,534 | 158,604 | |||||
| China Aerospace International Holdings Ltd. | 1,136,570 | 150,812 | |||||
| Technovator International Ltd. | 305,630 | 129,537 | |||||
| China Electronics Corporation Holdings Company Ltd. | 498,164 | 102,682 | |||||
| Landing International Development Ltd.* | 6,835,055 | 49,310 | |||||
| Total Industrial | 8,236,704 | ||||||
| Energy - 4.7% | |||||||
GCL-Poly Energy Holdings Ltd.*,1 | 7,329,446 | 1,000,872 | |||||
Xinyi Solar Holdings Ltd.1 | 2,378,578 | 836,529 | |||||
Trina Solar Ltd. ADR*,1 | 52,029 | 546,305 | |||||
JinkoSolar Holding Company Ltd. ADR*,1 | 12,643 | 213,413 | |||||
| JA Solar Holdings Company Ltd. ADR* | 23,386 | 119,269 | |||||
| Total Energy | 2,716,388 | ||||||
| Basic Materials - 3.2% | |||||||
| Kingboard Chemical Holdings Ltd. | 388,858 | 1,375,101 | |||||
| Kingboard Laminates Holdings Ltd. | 445,913 | 499,770 | |||||
| Total Basic Materials | 1,874,871 | ||||||
| Consumer, Cyclical - 1.3% | |||||||
Digital China Holdings Ltd.1 | 540,579 | 482,607 | |||||
| VST Holdings Ltd. | 422,800 | 136,713 | |||||
| HNA Holding Group Company Ltd.* | 2,323,297 | 116,727 | |||||
| Total Consumer, Cyclical | 736,047 | ||||||
| Consumer, Non-cyclical - 1.1% | |||||||
| HC International, Inc.* | 368,254 | 302,196 | |||||
| China Innovationpay Group Ltd.* | 2,798,566 | 174,854 | |||||
| Hi Sun Technology China Ltd.* | 1,080,869 | 172,662 | |||||
Anxin-China Holdings Ltd.*,†††,3 | 2,144,054 | — | |||||
| Total Consumer, Non-cyclical | 649,712 | ||||||
| Diversified - 0.9% | |||||||
Legend Holdings Corp. — Class H2 | 212,000 | 503,068 | |||||
| Financial - 0.4% | |||||||
| Rentian Technology Holdings Ltd.* | 2,080,000 | 115,221 |
| See notes to financial statements. |
| CLAYMORE EXCHANGE-TRADED FUND TRUST 2 SEMIANNUAL REPORT l 31 |
| SCHEDULE OF INVESTMENTS (Unaudited) continued | February 28, 2017 |
CQQQ Guggenheim China Technology ETF continued
| Shares | Value | ||||||
COMMON STOCKS† - 100.0% (continued) | |||||||
| Financial - 0.4% (continued) | |||||||
| National Agricultural Holdings Ltd.* | 498,446 | $ | 96,319 | ||||
| Total Financial | 211,540 | ||||||
| Total Common Stocks | |||||||
| (Cost $57,214,706) | 58,173,705 |
| Face | |||||||
| Amount | Value | ||||||
SECURITIES LENDING COLLATERAL††,4 - 8.1% | |||||||
| Joint Repurchase Agreements | |||||||
| Citigroup Global Markets, Inc. | |||||||
| issued 02/28/17 at 0.54% due 03/01/17 | $ | 1,095,810 | 1,095,810 | ||||
| BNP Paribas Securities Corp. | |||||||
| issued 02/28/17 at 0.53% due 03/01/17 | 1,095,810 | 1,095,810 | |||||
| Merrill Lynch, Pierce, Fenner & Smith, Inc. | |||||||
| issued 02/28/17 at 0.52% due 03/01/17 | 1,095,810 | 1,095,810 | |||||
| RBC Dominion Securities, Inc. | |||||||
| issued 02/28/17 at 0.51% due 03/01/17 | 1,095,810 | 1,095,810 | |||||
| J.P. Morgan Securities LLC | |||||||
| issued 02/28/17 at 0.52% | |||||||
| due 03/01/17 | 324,785 | 324,785 | |||||
| Total Securities Lending Collateral | |||||||
| (Cost $4,708,025) | 4,708,025 | ||||||
| Total Investments - 108.1% | |||||||
| (Cost $61,922,731) | $ | 62,881,730 | |||||
| Other Assets & Liabilities, net - (8.1)% | (4,688,930 | ) | |||||
| Total Net Assets - 100.0% | $ | 58,192,800 |
| * | Non-income producing security. | |
| † | Value determined based on Level 1 inputs, unless otherwise noted — See Note 4. | |
| †† | Value determined based on Level 2 inputs — See Note 4. | |
| ††† | Value determined based on Level 3 inputs — See Note 4. | |
| 1 | All or portion of this security is on loan at February 28, 2017 — See Note 2. | |
| 2 | Security is a 144A or Section 4(a)(2) security. These securities have been determined to be liquid under guidelines established by the Board of Trustees. The total market value of 144A or Section 4(a)(2) liquid securities is $1,809,448 (cost $1,707,532), or 3.1% of total net assets. | |
| 3 | Security was fair valued by the Valuation Committee at February 28, 2017. The total market value of fair valued securities amounts to $0, (cost $436,315) or less than 0.1% of total net assets. | |
| 4 | Securities lending collateral — See Note 2. | |
| ADR | American Depositary Receipt |
See Sector Classification in Supplemental Information section.
| Country Diversification | ||
% of Common | ||
| Country | Stocks | |
| China | 99.8% | |
| Singapore | 0.2% | |
| Total Common Stocks | 100.0% | |
| Currency Denomination | ||
% of Common | ||
| Currency | Stocks | |
| Hong Kong Dollar | 53.9% | |
| United States Dollar | 46.1% | |
| Total Common Stocks | 100.0% | |
The following table summarizes the inputs used to value the Fund's investments at February 28, 2017 (See Note 4 in the Notes to Financial Statements):
| Level 2 | Level 3 | ||||||||||||
| Significant | Significant | ||||||||||||
| Level 1 | Observable | Unobservable | |||||||||||
| Quoted Prices | Inputs | Inputs | Total | ||||||||||
| Assets | |||||||||||||
| Common Stocks | $ | 58,173,705 | $ | — | $ | — | * | $ | 58,173,705 | ||||
| Securities Lending | |||||||||||||
| Collateral | — | 4,708,025 | — | 4,708,025 | |||||||||
| Total | $ | 58,173,705 | $ | 4,708,025 | $ | — | * | $ | 62,881,730 |
* Market value is less than $1.
The following is a summary of significant unobservable inputs used in the fair valuation of assets and liabilities categorized within Level 3 of the fair value hierarchy:
| Ending | ||||||||||
| Balance | Valuation | Unobservable | ||||||||
| Category | at 2/28/2017 | Technique | Inputs | |||||||
| Last trade with | ||||||||||
| Common Stocks | $ | — | * | adjustment | 100% Discount |
* Market value is less than $1.
Transfers between investment levels may occur as the markets fluctuate and/or the availability of data used in an investment's valuation changes. Transfers between valuation levels, if any, are in comparison to the valuation levels at the end of the previous fiscal year, and are effective using the fair value as of the end of the current fiscal period.
For the period ended February 28, 2017, there were no transfers between levels.
Summary of Fair Value Level 3 Activity
Following is a reconciliation of Level 3 assets for which significant unobservable inputs were used to determine fair value for the period ended February 28, 2017:
| Level 3 – Fair value measurement using significant unobservable inputs | ||||
| Beginning Balance | $ | — | * | |
| Change in Unrealized Gain/Loss | — | |||
| Ending Balance | $ | — | * |
* Market value is less than $1.
| Net change in unrealized appreciation/depreciation for investments still held at 2/28/17 | $ | — |
| See notes to financial statements. |
| 32 l CLAYMORE EXCHANGE-TRADED FUND TRUST 2 SEMIANNUAL REPORT |
| SCHEDULE OF INVESTMENTS (Unaudited) continued | February 28, 2017 |
TAN Guggenheim Solar ETF
| Shares | Value | ||||||
COMMON STOCKS† - 99.6% | |||||||
| United States - 38.6% | |||||||
| First Solar, Inc.* | 361,737 | $ | 13,091,261 | ||||
SunPower Corp. — Class A*,1 | 1,153,914 | 10,108,287 | |||||
SolarEdge Technologies, Inc.*,1 | 636,191 | 9,320,198 | |||||
| Hannon Armstrong Sustainable Infrastructure Capital, Inc. REIT | 463,627 | 9,175,178 | |||||
Sunrun, Inc.*,1 | 1,563,965 | 8,898,961 | |||||
8Point3 Energy Partners, LP1 | 667,696 | 8,887,034 | |||||
| TerraForm Power, Inc. — Class A* | 701,207 | 8,070,893 | |||||
Vivint Solar, Inc.*,1 | 2,215,039 | 7,641,885 | |||||
| TerraForm Global, Inc. — Class A* | 1,751,490 | 7,618,982 | |||||
| Total United States | 82,812,679 | ||||||
| Cayman Islands - 35.2% | |||||||
GCL-Poly Energy Holdings Ltd.*,1 | 85,849,464 | 11,723,159 | |||||
Xinyi Solar Holdings Ltd.*,1 | 33,122,964 | 11,649,117 | |||||
| Trina Solar Ltd. ADR* | 1,037,319 | 10,891,850 | |||||
| Shunfeng International Clean Energy Ltd.* | 94,746,342 | 9,764,582 | |||||
JinkoSolar Holding Company Ltd. ADR*,1 | 544,569 | 9,192,324 | |||||
Daqo New Energy Corp.*,1 | 357,143 | 8,853,575 | |||||
JA Solar Holdings Company Ltd. ADR*,1 | 1,454,411 | 7,417,496 | |||||
Hanwha Q Cells Co. Ltd.*,1 | 697,043 | 6,036,392 | |||||
| Total Cayman Islands | 75,528,495 | ||||||
| United Kingdom - 5.4% | |||||||
| Atlantica Yield plc | 533,322 | 11,605,086 | |||||
| Canada - 5.1% | |||||||
Canadian Solar, Inc.*,1 | 747,104 | 10,997,371 | |||||
| Norway - 4.3% | |||||||
REC Silicon ASA*,1 | 61,992,490 | 9,108,961 | |||||
| Germany - 3.8% | |||||||
SMA Solar Technology AG1 | 324,671 | 8,207,440 | |||||
| Switzerland - 3.8% | |||||||
Meyer Burger Technology AG*,1 | 10,360,388 | 8,069,402 | |||||
| Bermuda - 3.4% | |||||||
China Singyes Solar Technologies Holdings Ltd.1 | 15,290,672 | 7,189,863 | |||||
| Total Common Stocks | |||||||
| (Cost $297,632,204) | 213,519,297 |
| Face | |||||||
| Amount | Value | ||||||
SECURITIES LENDING COLLATERAL††,2 - 37.9% | |||||||
| Joint Repurchase Agreements | |||||||
| Citigroup Global Markets, Inc. | |||||||
| issued 02/28/17 at 0.54% due 03/01/17 | $ | 18,913,266 | 18,913,266 | ||||
| BNP Paribas Securities Corp. | |||||||
| issued 02/28/17 at 0.53% due 03/01/17 | 18,913,266 | 18,913,266 | |||||
| Merrill Lynch, Pierce, Fenner & Smith, Inc. | |||||||
| issued 02/28/17 at 0.52% due 03/01/17 | 18,913,266 | 18,913,266 |
| RBC Dominion Securities, Inc. | |||||||
| issued 02/28/17 at 0.51% due 03/01/17 | 18,913,266 | 18,913,266 | |||||
| J.P. Morgan Securities LLC | |||||||
| issued 02/28/17 at 0.52% due 03/01/17 | 5,605,685 | 5,605,685 | |||||
| Total Securities Lending Collateral | |||||||
| (Cost $81,258,749) | 81,258,749 | ||||||
| Total Investments - 137.5% | |||||||
| (Cost $378,890,953) | $ | 294,778,046 | |||||
| Other Assets & Liabilities, net - (37.5)% | (80,417,177 | ) | |||||
| Total Net Assets - 100.0% | $ | 214,360,869 |
| * | Non-income producing security. | |
| † | Value determined based on Level 1 inputs — See Note 4. | |
| †† | Value determined based on Level 2 inputs — See Note 4. | |
| 1 | All or portion of this security is on loan at February 28, 2017 — See Note 2. | |
| 2 | Securities lending collateral — See Note 2. | |
| ADR | American Depositary Receipt | |
| plc | Public Limited Company | |
| REIT | Real Estate Investment Trust |
% of | |
| Portfolio Breakdown | Net Assets |
| Energy | 57.2% |
| Industrial | 15.7% |
| Utilities | 9.5% |
| Technology | 8.8% |
| Financial | 4.3% |
| Basic Materials | 4.1% |
| Total Common Stocks | 99.6% |
| Securities Lending Collateral | 37.9% |
| Total Investments | 137.5% |
| Other Assets & Liabilities, net | -37.5% |
| Net Assets | 100.0% |
| Currency Denomination | |
% of Common | |
| Currency | Stocks |
| United States Dollar | 69.2% |
| Hong Kong Dollar | 18.9% |
| Norwegian Krone | 4.3% |
| Euro | 3.8% |
| Swiss Franc | 3.8% |
| Total Common Stocks | 100.0% |
| See notes to financial statements. |
| CLAYMORE EXCHANGE-TRADED FUND TRUST 2 SEMIANNUAL REPORT l 33 |
| SCHEDULE OF INVESTMENTS (Unaudited) continued | February 28, 2017 |
TAN Guggenheim Solar ETF continued
The following table summarizes the inputs used to value the Fund's investments at February 28, 2017 (See Note 4 in the Notes to Financial Statements):
| Level 2 | Level 3 | ||||||||||||
| Significant | Significant | ||||||||||||
| Level 1 | Observable | Unobservable | |||||||||||
| Quoted Prices | Inputs | Inputs | Total | ||||||||||
| Assets | |||||||||||||
| Common Stocks | $ | 213,519,297 | $ | — | $ | — | $ | 213,519,297 | |||||
| Securities Lending | |||||||||||||
| Collateral | — | 81,258,749 | — | 81,258,749 | |||||||||
| Total | $ | 213,519,297 | $ | 81,258,749 | $ | — | $ | 294,778,046 |
Transfers between investment levels may occur as the markets fluctuate and/or the availability of data used in an investment's valuation changes. Transfers between valuation levels, if any, are in comparison to the valuation levels at the end of the previous fiscal year, and are effective using the fair value as of the end of the current fiscal period.
For the period ended February 28, 2017, there were no transfers between levels.
| See notes to financial statements. |
| 34 l CLAYMORE EXCHANGE-TRADED FUND TRUST 2 SEMIANNUAL REPORT |
| SCHEDULE OF INVESTMENTS (Unaudited) continued | February 28, 2017 |
CGW Guggenheim S&P Global Water Index ETF
| Shares | Value | ||||||
COMMON STOCKS† - 99.6% | |||||||
| United States - 39.4% | |||||||
| American Water Works Co., Inc. | 497,646 | $ | 38,816,389 | ||||
| Danaher Corp. | 301,130 | 25,761,672 | |||||
| Xylem, Inc. | 447,401 | 21,528,937 | |||||
| IDEX Corp. | 190,091 | 17,524,490 | |||||
| Aqua America, Inc. | 496,047 | 15,744,532 | |||||
| Olin Corp. | 412,399 | 12,817,361 | |||||
| Tetra Tech, Inc. | 160,648 | 6,466,082 | |||||
| Mueller Industries, Inc. | 142,756 | 5,970,055 | |||||
| Rexnord Corp.* | 256,462 | 5,685,763 | |||||
| Mueller Water Products, Inc. — Class A | 403,715 | 5,002,029 | |||||
| California Water Service Group | 134,186 | 4,931,336 | |||||
| American States Water Co. | 102,264 | 4,573,246 | |||||
| Watts Water Technologies, Inc. — Class A | 69,563 | 4,448,554 | |||||
| Franklin Electric Company, Inc. | 95,778 | 4,013,098 | |||||
| Badger Meter, Inc. | 72,649 | 2,658,953 | |||||
| Aegion Corp. — Class A* | 96,791 | 2,202,963 | |||||
Lindsay Corp.1 | 26,538 | 2,124,898 | |||||
| Advanced Drainage Systems, Inc. | 88,367 | 1,948,492 | |||||
| Connecticut Water Service, Inc. | 31,418 | 1,792,397 | |||||
| Calgon Carbon Corp. | 126,398 | 1,782,212 | |||||
| Middlesex Water Co. | 45,537 | 1,714,468 | |||||
| Gorman-Rupp Co. | 43,649 | 1,358,793 | |||||
| York Water Co. | 36,004 | 1,296,144 | |||||
| Total United States | 190,162,864 | ||||||
| United Kingdom - 15.1% | |||||||
| United Utilities Group plc | 1,907,448 | 23,225,957 | |||||
| Severn Trent plc | 666,615 | 19,394,548 | |||||
| Pennon Group plc | 1,150,900 | 12,409,841 | |||||
| Halma plc | 943,533 | 11,418,440 | |||||
| Rotork plc | 2,166,423 | 6,658,866 | |||||
| Total United Kingdom | 73,107,652 | ||||||
| Switzerland - 9.0% | |||||||
| Geberit AG | 92,485 | 40,135,783 | |||||
| Sulzer AG | 31,652 | 3,299,684 | |||||
| Total Switzerland | 43,435,467 | ||||||
| France - 6.8% | |||||||
| Veolia Environnement S.A. | 1,079,162 | 17,716,784 | |||||
| Suez | 997,397 | 15,001,949 | |||||
| Total France | 32,718,733 | ||||||
| Ireland - 5.0% | |||||||
| Pentair plc | 416,015 | 24,153,831 | |||||
| China - 4.2% | |||||||
| Guangdong Investment Ltd. | 7,892,000 | 10,756,573 | |||||
| China Everbright International Ltd. | 7,400,000 | 9,590,271 | |||||
| Total China | 20,346,844 | ||||||
| Japan - 3.0% | |||||||
| Ebara Corp. | 260,900 | 7,718,452 | |||||
| Kurita Water Industries Ltd. | 276,900 | 6,632,632 | |||||
| Total Japan | 14,351,084 | ||||||
| Sweden - 2.7% | |||||||
| Alfa Laval AB | 716,581 | 13,000,898 | |||||
| South Korea - 2.5% | |||||||
| Coway Company Ltd. | 148,837 | 11,780,598 | |||||
| Bermuda - 2.3% | |||||||
| Beijing Enterprises Water Group Ltd. | 13,638,000 | 9,750,903 | |||||
| China Water Affairs Group Ltd. | 2,330,000 | 1,524,828 | |||||
| Total Bermuda | 11,275,731 | ||||||
| Netherlands - 2.3% | |||||||
| Aalberts Industries N.V. | 240,214 | 8,310,985 | |||||
| Arcadis N.V. | 199,829 | 2,717,930 | |||||
| Total Netherlands | 11,028,915 | ||||||
| Brazil - 2.1% | |||||||
Cia de Saneamento Basico do Estado de Sao Paulo ADR1 | 955,994 | 10,123,976 | |||||
| Austria - 1.9% | |||||||
| Andritz AG | 176,581 | 9,252,279 | |||||
| Italy - 1.7% | |||||||
| Hera SpA | 1,666,683 | 4,144,180 | |||||
| Interpump Group SpA | 198,460 | 4,053,182 | |||||
| Total Italy | 8,197,362 | ||||||
| Israel - 1.1% | |||||||
| Israel Chemicals Ltd. | 1,273,643 | 5,423,033 | |||||
| Spain - 0.4% | |||||||
Fomento de Construcciones y Contratas S.A.*,1 | 201,630 | 1,872,563 | |||||
| Cayman Islands - 0.1% | |||||||
Kangda International Environmental Co. Ltd.2 | 2,603,000 | 637,131 | |||||
| Total Common Stocks | |||||||
| (Cost $382,378,432) | 480,868,961 |
| Face | |||||||
| Amount | Value | ||||||
SECURITIES LENDING COLLATERAL††,3 - 0.4% | |||||||
| Joint Repurchase Agreements | |||||||
| Citigroup Global Markets, Inc. | |||||||
| issued 02/28/17 at 0.54% | |||||||
| due 03/01/17 | $ | 394,235 | 394,235 | ||||
| BNP Paribas Securities Corp. | |||||||
| issued 02/28/17 at 0.53% | |||||||
| due 03/01/17 | 394,235 | 394,235 | |||||
| Merrill Lynch, Pierce, Fenner & Smith, Inc. | |||||||
| issued 02/28/17 at 0.52% | |||||||
| due 03/01/17 | 394,235 | 394,235 | |||||
| RBC Dominion Securities, Inc. | |||||||
| issued 02/28/17 at 0.51% | |||||||
| due 03/01/17 | 394,235 | 394,235 |
| See notes to financial statements. |
| CLAYMORE EXCHANGE-TRADED FUND TRUST 2 SEMIANNUAL REPORT l 35 |
| SCHEDULE OF INVESTMENTS (Unaudited) continued | February 28, 2017 |
CGW Guggenheim S&P Global Water Index ETF continued
| Face | |||||||
| Amount | Value | ||||||
SECURITIES LENDING COLLATERAL††,3 - 0.4% (continued) | |||||||
| Joint Repurchase Agreements (continued) | |||||||
| J.P. Morgan Securities LLC | |||||||
| issued 02/28/17 at 0.52% | |||||||
| due 03/01/17 | $ | 116,849 | $ | 116,849 | |||
| Total Securities Lending Collateral | |||||||
| (Cost $1,693,789) | 1,693,789 | ||||||
| Total Investments - 100.0% | |||||||
| (Cost $384,072,221) | $ | 482,562,750 | |||||
| Other Assets & Liabilities, net - 0.0%** | 232,471 | ||||||
| Total Net Assets - 100.0% | $ | 482,795,221 |
| * | Non-income producing security. | |
| ** | Less than 0.1%. | |
| † | Value determined based on Level 1 inputs — See Note 4. | |
| †† | Value determined based on Level 2 inputs — See Note 4. | |
| 1 | All or portion of this security is on loan at February 28, 2017 — See Note 2. | |
| 2 | Security is a 144A or Section 4(a)(2) security. These securities have been determined to be liquid under guidelines established by the Board of Trustees. The total market value of 144A or Section 4(a)(2) liquid securities is $637,131 (cost $1,374,827), or 0.1% of total net assets. | |
| 3 | Securities lending collateral — See Note 2. | |
| ADR | American Depositary Receipt | |
| plc | Public Limited Company |
% of | |
| Portfolio Breakdown | Net Assets |
| Industrial | 46.1% |
| Utilities | 39.6% |
| Consumer, Non-cyclical | 5.3% |
| Basic Materials | 4.2% |
| Consumer, Cyclical | 2.4% |
| Energy | 2.0% |
| Total Common Stocks | 99.6% |
| Securities Lending Collateral | 0.4% |
| Total Investments | 100.0% |
| Other Assets & Liabilities, net | 0.0% |
| Net Assets | 100.0% |
| Currency Denomination | |
% of Common | |
| Currency | Stocks |
| United States Dollar | 46.7% |
| Pound Sterling | 15.2% |
| Euro | 13.1% |
| Swiss Franc | 9.0% |
| Hong Kong Dollar | 6.7% |
| All other currencies | 9.3% |
| Total Common Stocks | 100.0% |
The following table summarizes the inputs used to value the Fund's investments at February 28, 2017 (See Note 4 in the Notes to Financial Statements):
| Level 2 | Level 3 | ||||||||||||
| Significant | Significant | ||||||||||||
| Level 1 | Observable | Unobservable | |||||||||||
| Quoted Prices | Inputs | Inputs | Total | ||||||||||
| Assets | |||||||||||||
| Common Stocks | $ | 480,868,961 | $ | — | $ | — | $ | 480,868,961 | |||||
| Securities Lending | |||||||||||||
| Collateral | — | 1,693,789 | — | 1,693,789 | |||||||||
| Total | $ | 480,868,961 | $ | 1,693,789 | $ | — | $ | 482,562,750 |
Transfers between investment levels may occur as the markets fluctuate and/or the availability of data used in an investment's valuation changes. Transfers between valuation levels, if any, are in comparison to the valuation levels at the end of the previous fiscal year, and are effective using the fair value as of the end of the current fiscal period.
For the period ended February 28, 2017, there were no transfers between levels.
| See notes to financial statements. |
| 36 l CLAYMORE EXCHANGE-TRADED FUND TRUST 2 SEMIANNUAL REPORT |
| SCHEDULE OF INVESTMENTS (Unaudited) continued | February 28, 2017 |
GHII Guggenheim S&P High Income Infrastructure ETF
| Shares | Value | ||||||
COMMON STOCKS† - 99.2% | |||||||
| Canada - 17.2% | |||||||
| Veresen, Inc. | 107,611 | $ | 1,098,494 | ||||
| Inter Pipeline Ltd. | 45,370 | 954,022 | |||||
| Pembina Pipeline Corp. | 26,908 | 871,978 | |||||
| Capital Power Corp. | 25,284 | 481,455 | |||||
| Gibson Energy, Inc. | 26,411 | 370,705 | |||||
| Northland Power, Inc. | 18,580 | 343,136 | |||||
| Superior Plus Corp. | 32,813 | 305,226 | |||||
TransAlta Renewables, Inc.1 | 22,654 | 253,659 | |||||
| Just Energy Group, Inc. | 33,422 | 191,278 | |||||
| Total Canada | 4,869,953 | ||||||
| Bermuda - 12.2% | |||||||
Ship Finance International Ltd.1 | 94,464 | 1,393,344 | |||||
Nordic American Tankers Ltd.1 | 163,560 | 1,298,666 | |||||
| Frontline Ltd. | 69,650 | 487,538 | |||||
| Tsakos Energy Navigation Ltd. | 55,641 | 257,618 | |||||
| Total Bermuda | 3,437,166 | ||||||
| China - 10.6% | |||||||
| China Power International Development Ltd. | 1,864,951 | 723,161 | |||||
| Huaneng Power International, Inc. — Class H | 1,035,573 | 705,728 | |||||
| Huadian Power International Corporation Ltd. — Class H | 1,476,957 | 648,819 | |||||
| China Resources Power Holdings Company Ltd. | 304,511 | 551,556 | |||||
| Datang International Power Generation Company Ltd. — | |||||||
| Class H | 1,197,311 | 350,134 | |||||
| Total China | 2,979,398 | ||||||
| United States - 9.8% | |||||||
| Targa Resources Corp. | 20,228 | 1,142,882 | |||||
| Williams Companies, Inc. | 35,039 | 993,005 | |||||
| Pattern Energy Group, Inc. | 30,973 | 643,929 | |||||
| Total United States | 2,779,816 | ||||||
| Spain - 9.3% | |||||||
| Abertis Infraestructuras S.A. | 69,531 | 1,022,549 | |||||
| Gas Natural SDG S.A. | 28,726 | 560,883 | |||||
| Endesa S.A. | 23,678 | 505,595 | |||||
| Enagas S.A. | 16,984 | 418,605 | |||||
| Saeta Yield S.A. | 13,973 | 122,494 | |||||
| Total Spain | 2,630,126 | ||||||
| France - 6.0% | |||||||
Electricite de France S.A.1 | 78,918 | 775,689 | |||||
| Engie S.A. | 51,620 | 632,985 | |||||
| Gaztransport Et Technigaz S.A. | 7,271 | 268,986 | |||||
| Total France | 1,677,660 | ||||||
| Italy - 5.2% | |||||||
| Snam SpA | 308,223 | 1,231,467 | |||||
| ERG SpA | 21,400 | 249,681 | |||||
| Total Italy | 1,481,148 | ||||||
| Marshall Islands - 4.9% | |||||||
| DHT Holdings, Inc. | 204,004 | 944,538 | |||||
| Teekay Tankers Ltd. — Class A | 190,849 | 446,587 | |||||
| Total Marshall Islands | 1,391,125 | ||||||
| Australia - 4.6% | |||||||
| DUET Group | 230,484 | 487,321 | |||||
| AusNet Services | 332,108 | 413,653 | |||||
| Spark Infrastructure Group | 228,567 | 407,702 | |||||
| Total Australia | 1,308,676 | ||||||
| United Kingdom - 2.9% | |||||||
| SSE plc | 22,611 | 433,593 | |||||
| Centrica plc | 133,092 | 375,791 | |||||
| Total United Kingdom | 809,384 | ||||||
| New Zealand - 2.8% | |||||||
| Contact Energy Ltd. | 106,869 | 377,963 | |||||
| Mercury NZ Ltd. | 94,865 | 216,125 | |||||
| Infratil Ltd. | 99,434 | 207,477 | |||||
| Total New Zealand | 801,565 | ||||||
| Portugal - 2.4% | |||||||
| EDP - Energias de Portugal S.A. ADR | 163,048 | 505,731 | |||||
| REN - Redes Energeticas Nacionais SGPS S.A. | 59,948 | 167,342 | |||||
| Total Portugal | 673,073 | ||||||
| Singapore - 2.1% | |||||||
| Hutchison Port Holdings Trust — Class U | 1,251,915 | 475,728 | |||||
| Keppel Infrastructure Trust | 333,348 | 117,985 | |||||
| Total Singapore | 593,713 | ||||||
| Germany - 2.0% | |||||||
| E.ON SE | 72,067 | 561,013 | |||||
| South Korea - 1.9% | |||||||
| Korea Electric Power Corp. | 14,067 | 542,402 | |||||
| Finland - 1.9% | |||||||
| Fortum Oyj | 35,143 | 541,099 | |||||
| MULT - 1.7% | |||||||
HK Electric Investments & HK Electric Investments Ltd.2 | 551,447 | 481,653 | |||||
| Belgium - 1.7% | |||||||
| Euronav N.V. | 58,264 | 478,451 | |||||
| Total Common Stocks | |||||||
| (Cost $27,327,389) | 28,037,421 |
| Face | |||||||
| Amount | Value | ||||||
SECURITIES LENDING COLLATERAL††,3 - 12.0% | |||||||
| Joint Repurchase Agreements | |||||||
| BNP Paribas Securities Corp. | |||||||
| issued 02/28/17 at 0.53% | |||||||
| due 03/01/17 | $ | 785,796 | 785,796 | ||||
| Merrill Lynch, Pierce, Fenner & Smith, Inc. | |||||||
| issued 02/28/17 at 0.53% | |||||||
| due 03/01/17 | 785,796 | 785,796 |
| See notes to financial statements. |
| CLAYMORE EXCHANGE-TRADED FUND TRUST 2 SEMIANNUAL REPORT l 37 |
| SCHEDULE OF INVESTMENTS (Unaudited) continued | February 28, 2017 |
GHII Guggenheim S&P High Income Infrastructure ETF continued
| Face | |||||||
| Value | Amount | ||||||
SECURITIES LENDING COLLATERAL††,3 - 12.0% (continued) | |||||||
| Joint Repurchase Agreements (continued) | |||||||
| Mizuho Securities (USA), Inc. | |||||||
| issued 02/28/17 at 0.53% | |||||||
| due 03/01/17 | $ | 785,796 | $ | 785,796 | |||
| Citigroup Global Markets, Inc. | |||||||
| issued 02/28/17 at 0.51% | |||||||
| due 03/01/17 | 785,796 | 785,796 | |||||
| J.P. Morgan Securities LLC | |||||||
| issued 02/28/17 at 0.52% | |||||||
| due 03/01/17 | 232,902 | 232,902 | |||||
| Total Securities Lending Collateral | |||||||
| (Cost $3,376,086) | 3,376,086 | ||||||
| Total Investments - 111.2% | |||||||
| (Cost $30,703,475) | $ | 31,413,507 | |||||
| Other Assets & Liabilities, net - (11.2)% | (3,164,012 | ) | |||||
| Total Net Assets - 100.0% | $ | 28,249,495 |
| † | Value determined based on Level 1 inputs — See Note 4. | |
| †† | Value determined based on Level 2 inputs — See Note 4. | |
| 1 | All or portion of this security is on loan at February 28, 2017 — See Note 2. | |
| 2 | Security is a 144A or Section 4(a)(2) security. These securities have been determined to be liquid under guidelines established by the Board of Trustees. The total market value of 144A or Section 4(a)(2) liquid securities is $481,653 (cost $479,720), or 1.7% of total net assets. | |
| 3 | Securities lending collateral — See Note 2. | |
| ADR | American Depositary Receipt | |
| plc | Public Limited Company |
% of | |
| Portfolio Breakdown | Net Assets |
| Utilities | 50.3% |
| Energy | 22.8% |
| Industrial | 19.7% |
| Consumer, Non-cyclical | 5.3% |
| Consumer, Cyclical | 1.1% |
| Total Common Stocks | 99.2% |
| Securities Lending Collateral | 12.0% |
| Total Investments | 111.2% |
| Other Assets & Liabilities, net | -11.2% |
| Net Assets | 100.0% |
| Currency Denomination | |
% of Common | |
| Currency | Stocks |
| Euro | 28.7% |
| United States Dollar | 27.1% |
| Canadian Dollar | 17.4% |
| Hong Kong Dollar | 12.3% |
| Australian Dollar | 4.7% |
| British Pound | 2.9% |
| New Zealand Dollar | 2.9% |
| Other | 4.0% |
| Total Common Stocks | 100.0% |
The following table summarizes the inputs used to value the Fund's investments at February 28, 2017 (See Note 4 in the Notes to Financial Statements):
| Level 2 | Level 3 | ||||||||||||
| Significant | Significant | ||||||||||||
| Level 1 | Observable | Unobservable | |||||||||||
| Quoted Prices | Inputs | Inputs | Total | ||||||||||
| Assets | |||||||||||||
| Common Stocks | $ | 28,037,421 | $ | — | $ | — | $ | 28,037,421 | |||||
| Securities Lending | |||||||||||||
| Collateral | — | 3,376,086 | — | 3,376,086 | |||||||||
| Total | $ | 28,037,421 | $ | 3,376,086 | $ | — | $ | 31,413,507 |
Transfers between investment levels may occur as the markets fluctuate and/or the availability of data used in an investment's valuation changes. Transfers between valuation levels, if any, are in comparison to the valuation levels at the end of the previous fiscal year, and are effective using the fair value as of the end of the current fiscal period.
For the period ended February 28, 2017, there were no transfers between levels.
| See notes to financial statements. |
| 38 l CLAYMORE EXCHANGE-TRADED FUND TRUST 2 SEMIANNUAL REPORT |
| SCHEDULE OF INVESTMENTS (Unaudited) continued | February 28, 2017 |
GTO Guggenheim Total Return Bond ETF
| Shares | Value | ||||||
EXCHANGE-TRADED FUNDS† - 2.5% | |||||||
Guggenheim Enhanced Short Duration ETF1 | 13,938 | $ | 699,827 | ||||
| Total Exchange-Traded Funds | |||||||
| (Cost $700,106) | 699,827 | ||||||
CLOSED-END FUNDS† - 1.3% | |||||||
Guggenheim Strategic Opportunities Fund1 | 18,501 | 382,971 | |||||
| Total Closed-End Funds | |||||||
| (Cost $349,956) | 382,971 |
| Face | |||||||
| Amount | Value | ||||||
| SHORT TERM INVESTMENTS - 21.1% | |||||||
Commercial Paper†† - 7.1% | |||||||
| Reed Elsevier, Inc. | |||||||
0.00% due 03/01/172,3 | $ | 500,000 | 499,987 | ||||
| Western Union Co. | |||||||
0.00% due 03/01/172,3 | 500,000 | 499,987 | |||||
| Avery Dennison Corp. | |||||||
0.00% due 03/01/172,3 | 500,000 | 499,987 | |||||
| Cox Enterprises, Inc. | |||||||
0.00% due 03/01/172,3 | 500,000 | 499,987 | |||||
| Total Commercial Paper | |||||||
| (Cost $2,000,000) | 1,999,948 | ||||||
U.S. Treasury Bills†† - 5.9% | |||||||
| U.S. Treasury Bonds | |||||||
0.00% due 11/15/442 | 3,740,000 | 1,601,498 | |||||
| U.S. Treasury Notes | |||||||
| 2.88% due 11/15/46 | 72,000 | 70,602 | |||||
| Total U.S. Treasury Bills | |||||||
| (Cost $1,655,474) | 1,672,100 | ||||||
Repurchase Agreements†† - 4.9% | |||||||
| Jefferies & Company, Inc. | |||||||
3.87% due 03/16/174 | |||||||
| (Cost $1,400,000) | 1,400,000 | 1,400,000 | |||||
Money Market Fund† - 3.2% | |||||||
| Federated U.S. Treasury Cash Reserve Fund | |||||||
0.35%13 | |||||||
| (Cost $914,990) | 914,990 | 914,990 | |||||
| Total Short Term Investments | |||||||
| (Cost $5,970,464) | 5,987,038 | ||||||
CORPORATE BONDS†† - 33.1% | |||||||
| Financial - 18.5% | |||||||
| Fort Knox Military Housing Privatization Project | |||||||
5.82% due 02/15/523 | 393,684 | 395,400 | |||||
1.11% due 02/15/52†††,5,14 | 241,158 | 143,618 | |||||
| Citigroup, Inc. | |||||||
5.95% due 07/29/495,6 | 360,000 | 378,662 | |||||
| Hospitality Properties Trust | |||||||
| 5.25% due 02/15/26 | 350,000 | 364,051 | |||||
| Apollo Management Holdings, LP | |||||||
4.40% due 05/27/263 | 350,000 | 357,370 | |||||
| Camp Pendleton & Quantico Housing LLC | |||||||
5.94% due 10/01/433 | 310,000 | 346,602 | |||||
| Bank of America Corp. | |||||||
6.50% due 10/29/495,6,7 | 200,000 | 218,436 | |||||
6.30% due 12/29/495,6 | 100,000 | 109,000 | |||||
| Citizens Bank North America/Providence RI | |||||||
1.60% due 03/02/205 | 300,000 | 300,507 | |||||
| Sumitomo Trust & Banking Company Ltd. | |||||||
1.57% due 03/06/193 | 300,000 | 299,937 | |||||
| First American Financial Corp. | |||||||
| 4.30% due 02/01/23 | 300,000 | 299,573 | |||||
| Credit Agricole S.A. | |||||||
1.92% due 06/10/203,5 | 250,000 | 250,973 | |||||
| Mid-Atlantic Military Family Communities LLC | |||||||
5.30% due 08/01/503 | 235,985 | 223,516 | |||||
| Farmers Exchange Capital | |||||||
7.05% due 07/15/283 | 165,000 | 198,691 | �� | ||||
| Synchrony Financial | |||||||
| 3.70% due 08/04/26 | 200,000 | 196,261 | |||||
| AMC East Communities LLC | |||||||
6.01% due 01/15/5314 | 195,866 | 195,321 | |||||
| Fort Benning Family Communities LLC | |||||||
5.81% due 01/15/5114 | 200,000 | 187,390 | |||||
| Wilton Re Finance LLC | |||||||
5.88% due 03/30/333,5 | 150,000 | 152,812 | |||||
| Ares Finance Company LLC | |||||||
4.00% due 10/08/243 | 150,000 | 140,075 | |||||
| Pacific Beacon LLC | |||||||
5.38% due 07/15/263 | 122,167 | 132,204 | |||||
| Kennedy-Wilson, Inc. | |||||||
| 5.88% due 04/01/24 | 100,000 | 104,250 | |||||
| Voya Financial, Inc. | |||||||
5.65% due 05/15/535 | 100,000 | 102,250 | |||||
| WP Carey, Inc. | |||||||
| 4.25% due 10/01/26 | 100,000 | 100,312 | |||||
| GEO Group, Inc. | |||||||
| 6.00% due 04/15/26 | 30,000 | 31,230 | |||||
| 5.88% due 10/15/24 | 15,000 | 15,450 | |||||
| Total Financial | 5,243,891 | ||||||
| Consumer, Non-cyclical - 3.5% | |||||||
| Flowers Foods, Inc. | |||||||
| 3.50% due 10/01/26 | 375,000 | 363,881 | |||||
| Express Scripts Holding Co. | |||||||
| 4.50% due 02/25/26 | 350,000 | 363,350 | |||||
| WEX, Inc. | |||||||
4.75% due 02/01/233 | 265,000 | 263,675 | |||||
| Total Consumer, Non-cyclical | 990,906 | ||||||
| Energy - 3.0% | |||||||
| Buckeye Partners, LP | |||||||
| 3.95% due 12/01/26 | 200,000 | 198,756 | |||||
| 4.35% due 10/15/24 | 100,000 | 102,992 | |||||
| Sunoco Logistics Partners Operations, LP | |||||||
| 5.95% due 12/01/25 | 150,000 | 169,054 |
| See notes to financial statements. |
| CLAYMORE EXCHANGE-TRADED FUND TRUST 2 SEMIANNUAL REPORT l 39 |
| SCHEDULE OF INVESTMENTS (Unaudited) continued | February 28, 2017 |
GTO Guggenheim Total Return Bond ETF continued
| Face | |||||||
| Amount | Value | ||||||
CORPORATE BONDS†† - 33.1% (continued) | |||||||
| Energy - 3.0% (continued) | |||||||
| ConocoPhillips | |||||||
| 6.50% due 02/01/39 | $ | 130,000 | $ | 163,658 | |||
| MPLX, LP | |||||||
| 4.88% due 12/01/24 | 100,000 | 106,626 | |||||
| Hess Corp. | |||||||
| 4.30% due 04/01/27 | 100,000 | 100,029 | |||||
| Total Energy | 841,115 | ||||||
| Communications - 2.9% | |||||||
| Cox Communications, Inc. | |||||||
2.95% due 06/30/233 | 350,000 | 333,791 | |||||
| Discovery Communications LLC | |||||||
| 4.90% due 03/11/26 | 270,000 | 283,787 | |||||
| Juniper Networks, Inc. | |||||||
| 4.35% due 06/15/25 | 200,000 | 206,856 | |||||
| Total Communications | 824,434 | ||||||
| Consumer, Cyclical - 2.7% | |||||||
| HP Communities LLC | |||||||
5.78% due 03/15/4614 | 150,000 | 161,435 | |||||
5.86% due 09/15/5314 | 100,000 | 106,587 | |||||
| AutoNation, Inc. | |||||||
| 4.50% due 10/01/25 | 175,000 | 179,784 | |||||
| Hyatt Hotels Corp. | |||||||
| 4.85% due 03/15/26 | 150,000 | 161,599 | |||||
| Wyndham Worldwide Corp. | |||||||
5.10% due 10/01/257 | 150,000 | 159,422 | |||||
| Total Consumer, Cyclical | 768,827 | ||||||
| Basic Materials - 1.8% | |||||||
| Newcrest Finance Pty Ltd. | |||||||
4.20% due 10/01/223 | 200,000 | 205,444 | |||||
| Yamana Gold, Inc. | |||||||
| 4.95% due 07/15/24 | 180,000 | 183,373 | |||||
| BHP Billiton Finance USA Ltd. | |||||||
6.75% due 10/19/753,5 | 100,000 | 114,300 | |||||
| Total Basic Materials | 503,117 | ||||||
| Industrial - 0.7% | |||||||
| Reynolds Group Issuer Incorporated / Reynolds Group | |||||||
| Issuer LLC / Reynolds Group Issuer Lu | |||||||
| 5.75% due 10/15/20 | 200,000 | 206,000 | |||||
| Total Corporate Bonds | |||||||
| (Cost $9,207,782) | 9,378,290 | ||||||
COLLATERALIZED MORTGAGE OBLIGATIONS†† - 17.6% | |||||||
| Government Agency - 10.3% | |||||||
| Freddie Mac Multifamily Structured Pass Through Certificates | |||||||
2014-K037, 1.02% due 01/25/245 | 6,669,335 | 372,317 | |||||
2015-K042, 1.06% due 12/25/245,8 | 4,478,111 | 302,709 | |||||
2014-K038, 1.19% due 03/25/245,8 | 4,456,641 | 297,792 | |||||
2014-K036, 0.77% due 10/25/235,8 | 6,295,790 | 263,028 | |||||
2013-K026, 1.03% due 11/25/225,8 | 5,389,592 | 255,685 | |||||
2013-K035, 0.43% due 08/25/235,8 | 8,653,698 | 193,491 | |||||
| Fannie Mae Principal Strips | |||||||
0.00% due 05/15/292,9 | 900,000 | 589,615 | |||||
| Freddie Mac Coupon Strips | |||||||
6 3/4, 0.00% due 09/15/302 | 350,000 | 222,745 | |||||
| FREMF Mortgage Trust | |||||||
2013-K29, 0.13% due 05/25/463,8 | 30,709,613 | 180,867 | |||||
| Tennessee Valley Authority | |||||||
| 5.38% due 04/01/56 | 100,000 | 129,011 | |||||
| Freddie Mac | |||||||
0.00% due 12/14/292 | 150,000 | 99,551 | |||||
| Total Government Agency | 2,906,811 | ||||||
| Residential Mortgage Backed Securities - 5.1% | |||||||
| Alternative Loan Trust | |||||||
2007-OA7, 0.96% due 05/25/475 | 307,088 | 261,256 | |||||
| CSMC Series | |||||||
2015-12R, 1.27% due 11/30/373,5 | 245,752 | 232,095 | |||||
| LSTAR Securities Investment Trust | |||||||
2016-5, 2.78% due 11/01/213,5 | 209,642 | 207,632 | |||||
| RALI Series Trust | |||||||
2007-QO2, 0.93% due 02/25/475 | 348,969 | 207,619 | |||||
| LSTAR Commercial Mortgage Trust | |||||||
2016-7, 2.78% due 12/01/213,5 | 196,251 | 194,289 | |||||
| Washington Mutual Mortgage Pass-Through | |||||||
| Certificates WMALT Series Trust | |||||||
2006-7, 4.43% due 09/25/3610 | 350,876 | 189,214 | |||||
| VOLT XLI LLC | |||||||
2016-NPL1, 4.25% due 02/26/463,10 | 141,933 | 142,716 | |||||
| Total Residential Mortgage Backed Securities | 1,434,821 | ||||||
| Collateralized Mortgage Backed Securities - 2.2% | |||||||
| BAMLL Commercial Mortgage Securities Trust | |||||||
2014-ICTS, 2.67% due 06/15/283,5 | 250,000 | 247,767 | |||||
| GS Mortgage Securities Corporation Trust | |||||||
2016-ICE2, 5.02% due 02/15/333,5 | 200,000 | 204,853 | |||||
| Wells Fargo Commercial Mortgage Trust | |||||||
2016-NXS5, 1.57% due 01/15/595 | 1,983,531 | 181,124 | |||||
| Total Collateralized Mortgage Backed Securities | 633,744 | ||||||
| Total Collateralized Mortgage Obligations | |||||||
| (Cost $4,907,506) | 4,975,376 | ||||||
ASSET BACKED SECURITIES†† - 16.5% | |||||||
| Collateralized Loan Obligations - 13.6% | |||||||
| Cerberus Loan Funding XVI, LP | |||||||
2016-2A, 3.24% due 11/15/273,5 | 500,000 | 503,572 | |||||
| Golub Capital Partners CLO Ltd. | |||||||
2016-33A, 3.39% due 11/21/283,5 | 500,000 | 498,153 | |||||
| Newstar Commercial Loan Funding LLC | |||||||
2016-1A, 4.68% due 02/25/283,5 | 250,000 | 250,605 | |||||
| ACIS CLO Ltd. | |||||||
2013-1A, 3.97% due 04/18/243,5 | 250,000 | 250,540 | |||||
| Oaktree EIF I Series A1 Ltd. | |||||||
2016-A, 4.68% due 01/20/273,5 | 250,000 | 250,400 | |||||
| TICP CLO II Ltd. | |||||||
2014-2A, 4.03% due 07/20/263,5 | 250,000 | 249,982 |
| See notes to financial statements. |
| 40 l CLAYMORE EXCHANGE-TRADED FUND TRUST 2 SEMIANNUAL REPORT |
| SCHEDULE OF INVESTMENTS (Unaudited) continued | February 28, 2017 |
GTO Guggenheim Total Return Bond ETF continued
| Face | |||||||
| Amount | Value | ||||||
ASSET BACKED SECURITIES†† - 16.5% | |||||||
| Collateralized Loan Obligations - 13.6% (continued) | |||||||
| Oaktree EIF II Series Ltd. | |||||||
2014-A2, 4.24% due 11/15/253,5 | $ | 250,000 | $ | 249,384 | |||
| FS Senior Funding Ltd. | |||||||
2015-1A, 2.82% due 05/28/253,5 | 250,000 | 249,160 | |||||
| Flatiron CLO Ltd. | |||||||
2016-1A, 3.54% due 10/25/213,5 | 250,000 | 249,081 | |||||
| OZLM Funding II Ltd. | |||||||
2016-2A, 3.64% due 10/30/273,5 | 250,000 | 248,641 | |||||
| Northwoods Capital XI Ltd. | |||||||
2014-11A, 3.77% due 04/15/253,5 | 250,000 | 246,100 | |||||
| Ballyrock CLO LLC | |||||||
2014-1A, 6.03% due 10/20/263,5 | 250,000 | 233,125 | |||||
| Catamaran CLO 2014-1 Ltd. | |||||||
2014-1A, 5.53% due 04/20/263,5 | 250,000 | 227,666 | |||||
| Venture XIII CLO Ltd. | |||||||
2013-13A, 0.00% due 06/10/252,3 | 250,000 | 137,500 | |||||
| Total Collateralized Loan Obligations | 3,843,909 | ||||||
| Transportation - 2.4% | |||||||
| Apollo Aviation Securitization Equity Trust | |||||||
| 2016-2, 4.21% due 11/15/41 | 488,650 | 490,775 | |||||
| ECAF I Ltd. | |||||||
2015-1A, 3.47% due 06/15/403 | $ | 189,443 | $ | 187,098 | |||
| Total Transportation | 677,873 | ||||||
| Restaurant - 0.5% | |||||||
| Taco Bell Funding LLC | |||||||
2016-1A, 4.97% due 05/25/463 | 149,250 | 149,276 | |||||
| Total Asset Backed Securities | |||||||
| (Cost $4,541,340) | 4,671,058 | ||||||
MUNICIPAL BONDS†† - 5.9% | |||||||
| California - 3.6% | |||||||
| San Diego Unified School District General Obligation Unlimited | |||||||
0.00% due 07/01/362 | 800,000 | 358,728 | |||||
| Los Angeles Department of Power Revenue Bonds | |||||||
| 6.57% due 07/01/45 | 255,000 | 356,990 | |||||
| Los Angeles Community College District General Obligation | |||||||
| Unlimited 6.75% due 08/01/49 | 130,000 | 191,376 | |||||
| Stockton Unified School District General Obligation Unlimited | |||||||
0.00% due 08/01/362 | 250,000 | 105,905 | |||||
| Total California | 1,012,999 | ||||||
| New York - 1.3% | |||||||
| Port Authority of New York & New Jersey Revenue Bonds | |||||||
| 5.65% due 11/01/40 | 155,000 | 193,446 | |||||
| Metropolitan Transportation Authority Revenue Bonds | |||||||
| 6.69% due 11/15/40 | 140,000 | 189,568 | |||||
| Total New York | 383,014 | ||||||
| Ohio - 1.0% | |||||||
| American Municipal Power, Inc. Revenue Bonds | |||||||
| 7.50% due 02/15/50 | 200,000 | 277,910 | |||||
| Total Municipal Bonds | |||||||
| (Cost $1,684,201) | 1,673,923 | ||||||
SENIOR FLOATING RATE INTERESTS††,5 - 4.5% | |||||||
| Consumer, Cyclical - 1.7% | |||||||
| Floor & Decor Outlets of America, Inc. | |||||||
5.25% due 09/30/235 | 199,500 | 199,500 | |||||
| SRS Distribution, Inc. | |||||||
5.29% due 08/25/225 | 188,846 | 191,443 | |||||
| Acosta, Inc. | |||||||
4.28% due 09/26/215 | $ | 98,332 | $ | 95,904 | |||
| Total Consumer, Cyclical | 486,847 | ||||||
| Technology - 1.2% | |||||||
| Epicor Software Corp. | |||||||
4.75% due 06/01/225 | 196,386 | 196,877 | |||||
| Mitel US Holdings, Inc. | |||||||
5.54% due 04/29/225 | 135,128 | 135,889 | |||||
| Total Technology | 332,766 | ||||||
| Consumer, Non-cyclical - 1.0% | |||||||
| Chobani LLC | |||||||
5.25% due 10/09/235 | 175,000 | 177,079 | |||||
| DJO Finance LLC | |||||||
4.25% due 06/08/205 | 99,747 | 97,877 | |||||
| Total Consumer, Non-cyclical | 274,956 | ||||||
| Communications - 0.6% | |||||||
| Cengage Learning, Inc. | |||||||
5.25% due 06/07/235 | 199,249 | 188,073 | |||||
| Total Senior Floating Rate Interests | |||||||
| (Cost $1,286,604) | 1,282,642 | ||||||
FOREIGN GOVERNMENT BONDS†† - 1.3% | |||||||
| Kenya Government International Bond | |||||||
6.88% due 06/24/243 | 200,000 | 196,752 | |||||
| Dominican Republic International Bond | |||||||
6.85% due 01/27/453 | 170,000 | 175,525 | |||||
| Total Foreign Government Bonds | |||||||
| (Cost $356,353) | 372,277 | ||||||
SECURITIES LENDING COLLATERAL††,11 - 0.4% | |||||||
| Joint Repurchase Agreements | |||||||
| Merrill Lynch, Pierce, Fenner & Smith, Inc. | |||||||
| issued 02/28/17 at 0.52% due 03/01/17 | 20,672 | 20,672 | |||||
| Mizuho Securities (USA), Inc. | |||||||
| issued 02/28/17 at 0.52% due 03/01/17 | 20,672 | 20,672 | |||||
| HSBC Securities (USA), Inc. | |||||||
| issued 02/28/17 at 0.51% due 03/01/17 | 20,672 | 20,672 | |||||
| BNP Paribas Securities Corp. | |||||||
| issued 02/28/17 at 0.51% due 03/01/17 | 20,672 | 20,672 | |||||
| Citigroup Global Markets, Inc. | |||||||
| issued 02/28/17 at 0.53% due 03/01/17 | 6,123 | 6,123 | |||||
| Total Securities Lending Collateral | |||||||
| (Cost $88,811) | 88,811 | ||||||
| Total Investments - 104.2% | |||||||
| (Cost $29,093,123) | $ | 29,512,213 | |||||
| Other Assets & Liabilities, net - (4.2)% | (1,191,021 | ) | |||||
| Total Net Assets - 100.0% | $ | 28,321,192 |
| See notes to financial statements. |
| CLAYMORE EXCHANGE-TRADED FUND TRUST 2 SEMIANNUAL REPORT l 41 |
| SCHEDULE OF INVESTMENTS (Unaudited) continued | February 28, 2017 |
GTO Guggenheim Total Return Bond ETF continued
| † | Value determined based on Level 1 inputs — See Note 4. | |
| †† | Value determined based on Level 2 inputs, unless otherwise noted — See Note 4. | |
| ††† | Value determined based on Level 3 inputs — See Note 4. | |
| 1 | Investment in an affiliated issuer. See Note 8 in the Notes to Financial Statements. | |
| 2 | Zero coupon rate security. | |
| 3 | Security is a 144A or Section 4(a)(2) security. These securities have been determined to be liquid under guidelines established by the Board of Trustees. The total market value of 144A or Section 4(a)(2) liquid securities is $11,377,517 (cost $11,187,652), or 40.2% of total net assets. | |
| 4 | Repurchase agreements — See Note 5. | |
| 5 | Variable rate security. Rate indicated is rate effective at February 28, 2017. | |
| 6 | Perpetual maturity. | |
| 7 | All or portion of this security is on loan at February 28, 2017 — See Note 2. | |
| 8 | Interest only security. | |
| 9 | On September 7, 2008, the issuer was placed in conservatorship by the Federal Housing Finance Agency (FHFA). As conservator, the FHFA has full powers to control the assets and operations of the firm. | |
| 10 | Security is a step up/step down bond. The coupon increases or decreases at regular intervals until the bond reaches full maturity. | |
| 11 | Securities lending collateral — See Note 2. | |
| 12 | Affiliated issuer — See Note 11. | |
| 13 | Rate indicated is the 7-day yield as of February 28, 2017. | |
| 14 | Security is a 144A or Section 4(a)(2) security. These securities are considered illiquid and restricted under guidelines established by the Board of Trustees. The total market value of 144A or Section 4(a)(2) securities is $794,351 (cost $824,970), or 2.8% of total net assets — See Note 12. | |
| CLO | Collateralized Loan Obligation | |
| LLC | Limited Liability Company | |
| LP | Limited Partnership | |
| Pty | Proprietary | |
| S.A. | Corporation |
See Sector Classification in Supplemental Information section.
| Country Diversification | |
% of Long-Term | |
| Country | Investments |
| United States | 78.4% |
| Cayman Islands | 15.9% |
| Australia | 1.3% |
| Japan | 1.2% |
| Other | 3.2% |
| Total Long-Term Investments | 100.0% |
The following table summarizes the inputs used to value the Fund's investments at February 28, 2017 (See Note 4 in the Notes to Financial Statements):
| Level 2 | Level 3 | ||||||||||||
| Significant | Significant | ||||||||||||
| Level 1 | Observable | Unobservable | |||||||||||
| Quoted Prices | Inputs | Inputs | Total | ||||||||||
| Assets | |||||||||||||
| Exchange- | |||||||||||||
| Traded Funds | $ | 699,827 | $ | — | $ | — | $ | 699,827 | |||||
| Closed-End Funds | 382,971 | — | — | 382,971 | |||||||||
| Short Term | |||||||||||||
| Investments | 914,990 | 5,072,048 | — | 5,987,038 | |||||||||
| Corporate Bonds | — | 9,234,672 | 143,618 | 9,378,290 | |||||||||
| Collateralized | |||||||||||||
| Mortgage | |||||||||||||
| Obligations | — | 4,975,376 | — | 4,975,376 | |||||||||
| Asset Backed Securities | — | 4,671,058 | — | 4,671,058 | |||||||||
| Municipal Bonds | — | 1,673,923 | — | 1,673,923 | |||||||||
| Senior Floating | |||||||||||||
| Rate Interests | — | 1,282,642 | — | 1,282,642 | |||||||||
| Foreign Government | |||||||||||||
| Bonds | — | 372,277 | — | 372,277 | |||||||||
| Securities Lending | |||||||||||||
| Collateral | — | 88,811 | — | 88,811 | |||||||||
| Swap Agreements | — | 120,895* | — | 120,895* | |||||||||
| Total | $ | 1,997,788 | $ | 27,491,702 | $ | 143,618 | $ | 29,633,108 |
*Represents the unrealized gain/loss at period end.
If not referenced in the table, please refer to the Schedule of Investments for a breakdown of investment type by industry category.
The following is a summary of significant unobservable inputs used in the, fair valuation of assets and liabilities categorized within Level 3 of the fair value hierarchy:
| Ending | ||||||||||
| Balance | Valuation | Unobservable | ||||||||
| Category | at 2/28/2017 | Technique | Inputs | |||||||
| OAS off prior | ||||||||||
| month | Indicative | |||||||||
| Corporate Bonds | $ | 143,618 | broker quote | Quote |
Significant changes in an indicative quote, liquidation value, market comparable yield or valuation multiple would generally result in significant changes in the fair value of the security.
Transfers between investment levels may occur as the markets fluctuate and/or the availability of data used in an investment's valuation changes. Transfers between valuation levels, if any, are in comparison to the valuation levels at the end of the previous fiscal year, and are effective using the fair value as of the end of the current fiscal period.
For the period ended February 28, 2017, there were no transfers between levels.
| See notes to financial statements. |
| 42 l CLAYMORE EXCHANGE-TRADED FUND TRUST 2 SEMIANNUAL REPORT |
| SCHEDULE OF INVESTMENTS (Unaudited) continued | February 28, 2017 |
GTO Guggenheim Total Return Bond ETF continued
Summary of Fair Value Level 3 Activity
Following is a reconciliation of Level 3 assets for which significant unobservable inputs were used to determine fair value for the period ended February 28, 2017:
| Level 3 – Fair value measurement using significant unobservable inputs | ||||
| Beginning Balance | $ | — | ||
| Purchases | 127,893 | |||
| Change in Unrealized Gain/Loss | 15,725 | |||
| Ending Balance | $ | 143,618 | ||
| Net change in unrealized | ||||
| depreciation for investments in | ||||
| securities still held at February 28, 2017 | 15,725 |
| See notes to financial statements. |
| CLAYMORE EXCHANGE-TRADED FUND TRUST 2 SEMIANNUAL REPORT l 43 |
| SCHEDULE OF INVESTMENTS (Unaudited) continued | February 28, 2017 |
OVLC Guggenheim U.S. Large Cap Optimized Volatility ETF
| Shares | Value | ||||||
COMMON STOCKS† - 99.4% | |||||||
| Consumer, Non-cyclical - 28.3% | |||||||
| Pfizer, Inc. | 1,639 | $ | 55,923 | ||||
| Merck & Company, Inc. | 803 | 52,894 | |||||
| PepsiCo, Inc. | 447 | 49,340 | |||||
| Eli Lilly & Co. | 495 | 40,991 | |||||
| Colgate-Palmolive Co. | 523 | 38,169 | |||||
| Kimberly-Clark Corp. | 278 | 36,849 | |||||
| Anthem, Inc. | 219 | 36,096 | |||||
| Intuitive Surgical, Inc.* | 47 | 34,639 | |||||
| Cardinal Health, Inc. | 404 | 32,873 | |||||
| Express Scripts Holding Co.* | 464 | 32,782 | |||||
| McKesson Corp. | 218 | 32,728 | |||||
| Ecolab, Inc. | 257 | 31,860 | |||||
| General Mills, Inc. | 499 | 30,125 | |||||
| Sysco Corp. | 540 | 28,469 | |||||
| Tyson Foods, Inc. — Class A | 397 | 24,836 | |||||
| Clorox Co. | 176 | 24,079 | |||||
| AmerisourceBergen Corp. — Class A | 229 | 20,956 | |||||
| Nielsen Holdings plc | 460 | 20,406 | |||||
| Laboratory Corporation of America Holdings* | 141 | 20,059 | |||||
| Quest Diagnostics, Inc. | 190 | 18,514 | |||||
| Verisk Analytics, Inc. — Class A* | 213 | 17,662 | |||||
| Johnson & Johnson | 143 | 17,476 | |||||
| DaVita, Inc.* | 216 | 14,993 | |||||
| Patterson Companies, Inc. | 325 | 14,771 | |||||
| Perrigo Company plc | 196 | 14,655 | |||||
| Quanta Services, Inc.* | 374 | 13,958 | |||||
| Varian Medical Systems, Inc.* | 146 | 12,248 | |||||
| Endo International plc* | 829 | 11,316 | |||||
| Procter & Gamble Co. | 52 | 4,736 | |||||
| Total Consumer, Non-cyclical | 784,403 | ||||||
| Financial - 17.0% | |||||||
| Simon Property Group, Inc. REIT | 190 | 35,036 | |||||
| Marsh & McLennan Companies, Inc. | 459 | 33,727 | |||||
| Welltower, Inc. REIT | 457 | 32,164 | |||||
| AvalonBay Communities, Inc. REIT | 172 | 31,610 | |||||
| Ventas, Inc. REIT | 483 | 31,419 | |||||
| Equity Residential REIT | 465 | 29,328 | |||||
| Boston Properties, Inc. REIT | 210 | 29,196 | |||||
| Vornado Realty Trust REIT | 235 | 25,819 | |||||
| Digital Realty Trust, Inc. REIT | 217 | 23,436 | |||||
| Willis Towers Watson plc | 176 | 22,604 | |||||
| Essex Property Trust, Inc. REIT | 90 | 21,123 | |||||
| HCP, Inc. REIT | 640 | 20,986 | |||||
| Berkshire Hathaway, Inc. — Class B* | 98 | 16,799 | |||||
| JPMorgan Chase & Co. | 176 | 15,949 | |||||
| Mid-America Apartment Communities, Inc. REIT | 155 | 15,923 | |||||
| Arthur J Gallagher & Co. | 258 | 14,693 | |||||
| Apartment Investment & Management Co. — Class A REIT | 301 | 14,005 | |||||
| Federal Realty Investment Trust REIT | 98 | 13,792 | |||||
| UDR, Inc. REIT | 377 | 13,760 | |||||
| People's United Financial, Inc. | 695 | 13,344 | |||||
| Wells Fargo & Co. | 138 | 7,987 | |||||
| Bank of America Corp. | 209 | 5,158 | |||||
| Aflac, Inc. | 53 | 3,835 | |||||
| Total Financial | 471,693 | ||||||
| Consumer, Cyclical - 13.5% | |||||||
| McDonald's Corp. | 329 | 41,997 | |||||
| Wal-Mart Stores, Inc. | 580 | 41,139 | |||||
| NIKE, Inc. — Class B | 705 | 40,298 | |||||
| Ford Motor Co. | 2,638 | 33,054 | |||||
| Carnival Corp. | 573 | 32,059 | |||||
| Dollar Tree, Inc.* | 323 | 24,768 | |||||
| Target Corp. | 410 | 24,096 | |||||
| Genuine Parts Co. | 203 | 19,429 | |||||
| WW Grainger, Inc. | 75 | 18,597 | |||||
| Chipotle Mexican Grill, Inc. — Class A* | 40 | 16,750 | |||||
| Coach, Inc. | 383 | 14,588 | |||||
| LKQ Corp.* | 421 | 13,295 | |||||
| PVH Corp. | 144 | 13,190 | |||||
| Bed Bath & Beyond, Inc. | 281 | 11,352 | |||||
| Ralph Lauren Corp. — Class A | 140 | 11,106 | |||||
| Under Armour, Inc. — Class C* | 522 | 9,688 | |||||
Under Armour, Inc. — Class A*,1 | 437 | 9,011 | |||||
| Total Consumer, Cyclical | 374,417 | ||||||
| Industrial - 9.7% | |||||||
| Honeywell International, Inc. | 333 | 41,458 | |||||
| Union Pacific Corp. | 370 | 39,938 | |||||
| Roper Technologies, Inc. | 139 | 29,079 | |||||
| Stanley Black & Decker, Inc. | 206 | 26,193 | |||||
| AMETEK, Inc. | 317 | 17,108 | |||||
| Waters Corp.* | 110 | 17,049 | |||||
| Rockwell Collins, Inc. | 178 | 17,015 | |||||
| CH Robinson Worldwide, Inc. | 194 | 15,592 | |||||
| Stericycle, Inc.* | 172 | 14,255 | |||||
| Expeditors International of Washington, Inc. | 247 | 13,926 | |||||
| FLIR Systems, Inc. | 367 | 13,473 | |||||
| PerkinElmer, Inc. | 247 | 13,402 | |||||
| General Electric Co. | 373 | 11,119 | |||||
| Total Industrial | 269,607 |
| See notes to financial statements. |
| 44 l CLAYMORE EXCHANGE-TRADED FUND TRUST 2 SEMIANNUAL REPORT |
| SCHEDULE OF INVESTMENTS (Unaudited) continued | February 28, 2017 |
OVLC Guggenheim U.S. Large Cap Optimized Volatility ETF continued
| Shares | Value | ||||||
COMMON STOCKS† - 99.4% (continued) | |||||||
| Technology - 9.1% | |||||||
| Apple, Inc. | 500 | $ | 68,495 | ||||
| International Business Machines Corp. | 278 | 49,990 | |||||
| Oracle Corp. | 1,090 | 46,423 | |||||
| Microsoft Corp. | 637 | 40,755 | |||||
| Fidelity National Information Services, Inc. | 392 | 32,250 | |||||
| Paychex, Inc. | 234 | 14,372 | |||||
| Total Technology | 252,285 | ||||||
| Utilities - 7.3% | |||||||
| Duke Energy Corp. | 441 | 36,405 | |||||
| Southern Co. | 677 | 34,405 | |||||
| Dominion Resources, Inc. | 436 | 33,851 | |||||
| Exelon Corp. | 870 | 31,938 | |||||
| PPL Corp. | 860 | 31,717 | |||||
| Entergy Corp. | 245 | 18,782 | |||||
| CenterPoint Energy, Inc. | 589 | 16,091 | |||||
| Total Utilities | 203,189 | ||||||
| Communications - 6.3% | |||||||
| AT&T, Inc. | 1,478 | 61,766 | |||||
| Verizon Communications, Inc. | 1,066 | 52,906 | |||||
| Motorola Solutions, Inc. | 227 | 17,926 | |||||
| Amazon.com, Inc.* | 19 | 16,056 | |||||
| Facebook, Inc. — Class A* | 98 | 13,283 | |||||
| Alphabet, Inc. — Class A* | 8 | 6,759 | |||||
| Alphabet, Inc. — Class C* | 7 | 5,762 | |||||
| Total Communications | 174,458 | ||||||
| Energy - 5.0% | |||||||
| Exxon Mobil Corp. | 859 | 69,854 | |||||
| Kinder Morgan, Inc. | 1,508 | 32,135 | |||||
| National Oilwell Varco, Inc. | 517 | 20,897 | |||||
| Cabot Oil & Gas Corp. — Class A | 636 | 13,928 | |||||
| Chevron Corp. | 33 | 3,712 | |||||
| Total Energy | 140,526 | ||||||
| Basic Materials - 3.2% | |||||||
| Sherwin-Williams Co. | 109 | 33,631 | |||||
| Praxair, Inc. | 256 | 30,390 | |||||
| Newmont Mining Corp. | 726 | 24,858 | |||||
| Total Basic Materials | 88,879 | ||||||
| Total Common Stocks | |||||||
| (Cost $2,639,801) | 2,759,457 |
| Face | |||||||
| Amount | Value | ||||||
SECURITIES LENDING COLLATERAL††,2 - 0.4% | |||||||
| Joint Repurchase Agreements | |||||||
| Citigroup Global Markets, Inc. | |||||||
| issued 02/28/17 at 0.49% | |||||||
| due 03/01/17 | $ | 2,192 | $ | 2,192 | |||
| BNP Paribas Securities Corp. | |||||||
| issued 02/28/17 at 0.49% | |||||||
| due 03/01/17 | 2,192 | 2,192 | |||||
| Mizuho Securities (USA), Inc. | |||||||
| issued 02/28/17 at 0.49% | |||||||
| due 03/01/17 | 2,192 | 2,192 | |||||
| Merrill Lynch, Pierce, Fenner & Smith, Inc. | |||||||
| issued 02/28/17 at 0.49% | |||||||
| due 03/01/17 | 2,192 | 2,192 | |||||
| J.P. Morgan Securities LLC | |||||||
| issued 02/28/17 at 0.55% | |||||||
| due 03/01/17 | 651 | 651 | |||||
| Total Securities Lending Collateral | |||||||
| (Cost $9,419) | 9,419 | ||||||
| Total Investments - 99.8% | |||||||
| (Cost $2,649,220) | $ | 2,768,876 | |||||
| Other Assets & Liabilities, net - 0.2% | 6,594 | ||||||
| Total Net Assets - 100.0% | $ | 2,775,470 |
| * | Non-income producing security. | |
| † | Value determined based on Level 1 inputs — See Note 4. | |
| †† | Value determined based on Level 2 inputs — See Note 4. | |
| 1 | All or portion of this security is on loan at February 28, 2017 — See Note 2. | |
| 2 | Securities lending collateral — See Note 2. | |
| plc | Public Limited Company | |
| REIT | Real Estate Investment Trust |
See Sector Classification in Supplemental Information section.
| Country Diversification | |
% of Common | |
| Country | Stocks |
| United States | 97.0% |
| Ireland | 1.8% |
| United Kingdom | 1.2% |
| Total Common Stocks | 100.0% |
| Currency Denomination | |
% of Common | |
| Currency | Stocks |
| United States Dollar | 100.0% |
| See notes to financial statements. |
| CLAYMORE EXCHANGE-TRADED FUND TRUST 2 SEMIANNUAL REPORT l 45 |
| SCHEDULE OF INVESTMENTS (Unaudited) continued | February 28, 2017 |
OVLC Guggenheim U.S. Large Cap Optimized Volatility ETF continued
The following table summarizes the inputs used to value the Fund's investments at February 28, 2017 (See Note 4 in the Notes to Financial Statements):
| Level 2 | Level 3 | ||||||||||||
| Significant | Significant | ||||||||||||
| Level 1 | Observable | Unobservable | |||||||||||
| Quoted Prices | Inputs | Inputs | Total | ||||||||||
| Assets | |||||||||||||
| Common Stocks | $ | 2,759,457 | $ | — | $ | — | $ | 2,759,457 | |||||
| Securities Lending | |||||||||||||
| Collateral | — | 9,419 | — | 9,419 | |||||||||
| Total | $ | 2,759,457 | $ | 9,419 | $ | — | $ | 2,768,876 |
Transfers between investment levels may occur as the markets fluctuate and/or the availability of data used in an investment's valuation changes. Transfers between valuation levels, if any, are in comparison to the valuation levels at the end of the previous fiscal year, and are effective using the fair value as of the end of the current fiscal period.
For the period ended February 28, 2017, there were no transfers between levels.
| See notes to financial statements. |
| 46 l CLAYMORE EXCHANGE-TRADED FUND TRUST 2 SEMIANNUAL REPORT |
| STATEMENT OF ASSETS AND LIABILITIES (Unaudited) | February 28, 2017 |
| Guggenheim | Guggenheim S&P | ||||||||||||
| Guggenheim | China Technology | Guggenheim | Global Water | ||||||||||
| China All-Cap ETF | ETF | Solar ETF | Index ETF | ||||||||||
| (YAO | ) | (CQQQ | ) | (TAN | ) | (CGW | ) | ||||||
| ASSETS: | |||||||||||||
| Investments, at value — including securities on loan | $ | 21,710,538 | $ | 58,173,705 | $ | 213,519,297 | $ | 480,868,961 | |||||
| Repurchase agreements, at value | 380,091 | 4,708,025 | 81,258,749 | 1,693,789 | |||||||||
| Foreign currency, at value | 4,178 | — | 396 | 49,025 | |||||||||
| Cash | 11,000 | 37,727 | 785,743 | 694,954 | |||||||||
| Prepaid expenses | — | — | 786 | 1,697 | |||||||||
| Receivables: | |||||||||||||
| Securities lending income | 1,356 | 11,861 | 300,240 | 3,330 | |||||||||
| Fund shares sold | — | — | 34,904 | — | |||||||||
| Dividends | — | 2,365 | 130,535 | 1,036,004 | |||||||||
| Tax reclaims | — | — | 1,807 | 607,391 | |||||||||
| Total assets | 22,107,163 | 62,933,683 | 296,032,457 | 484,955,151 | |||||||||
| LIABILITIES: | |||||||||||||
| Payable for: | |||||||||||||
| Upon return of securities loaned | 380,091 | 4,708,025 | 81,258,749 | 1,693,789 | |||||||||
| Management fees | 11,571 | 30,059 | 9,801 | 195,712 | |||||||||
| Investments purchased | — | — | 171,171 | — | |||||||||
| Professional fees | — | — | 20,997 | 5,391 | |||||||||
| Intraday valuation fees | — | — | 2,971 | 24,994 | |||||||||
| Other liabilities | — | 2,799 | 207,899 | 240,044 | |||||||||
| Total liabilities | 391,662 | 4,740,883 | 81,671,588 | 2,159,930 | |||||||||
| NET ASSETS | $ | 21,715,501 | $ | 58,192,800 | $ | 214,360,869 | $ | 482,795,221 | |||||
| NET ASSETS CONSIST OF: | |||||||||||||
| Paid-in capital | $ | 31,764,786 | $ | 75,219,287 | $ | 786,949,851 | $ | 489,519,230 | |||||
| Undistributed (distributions in excess of) net investment income | (64,257 | ) | (197,530 | ) | (338,853 | ) | 765,289 | ||||||
| Accumulated net realized loss on investments | (10,039,868 | ) | (17,787,955 | ) | (488,136,881 | ) | (105,963,965 | ) | |||||
| Net unrealized appreciation (depreciation) on investments | 54,840 | 958,998 | (84,113,248 | ) | 98,474,667 | ||||||||
| NET ASSETS | $ | 21,715,501 | $ | 58,192,800 | $ | 214,360,869 | $ | 482,795,221 | |||||
| Shares outstanding ($0.01 par value with unlimited amount authorized) | 800,000 | 1,450,000 | 11,448,000 | 16,040,000 | |||||||||
| Net asset value | $ | 27.14 | $ | 40.13 | $ | 18.72 | $ | 30.10 | |||||
| Investments in securities, at cost | 21,655,694 | 57,214,706 | 297,632,204 | 382,378,432 | |||||||||
| Repurchase agreements, at cost | 380,091 | 4,708,025 | 81,258,749 | 1,693,789 | |||||||||
| Foreign currency, at cost | 4,182 | — | 397 | 49,320 | |||||||||
| Securities on loan, at value | 763,171 | 7,286,022 | 87,232,062 | 1,637,932 | |||||||||
| See notes to financial statements. |
| CLAYMORE EXCHANGE-TRADED FUND TRUST 2 SEMIANNUAL REPORT l 47 |
| STATEMENT OF ASSETS AND LIABILITIES (Unaudited) continued | February 28, 2017 |
| Guggenheim S&P | Guggenheim | Guggenheim U.S. | ||||||||
| High Income | Total Return | Large Cap Optimized | ||||||||
| Infrastructure ETF | Bond ETF | Volatility ETF | ||||||||
| (GHII | ) | (GTO | ) | (OVLC | ) | |||||
| ASSETS: | ||||||||||
| Investments, at value — including securities on loan | $ | 28,037,421 | $ | 26,940,604 | $ | 2,759,457 | ||||
| Investments in affiliated issuers, at value | — | 1,082,798 | — | |||||||
| Repurchase agreements, at value | 3,376,086 | 1,488,811 | 9,419 | |||||||
| Foreign currency, at value | 921 | — | — | |||||||
| Cash | 148,376 | 14,758 | 10,042 | |||||||
| Receivables: | ||||||||||
| Dividends | 56,626 | — | 6,555 | |||||||
| Securities lending income | 9,198 | 34 | 42 | |||||||
| Tax reclaims | 6,601 | — | — | |||||||
| Investments sold | — | 445,174 | — | |||||||
| Interest | — | 180,997 | — | |||||||
| Variation margin on swap agreements | — | 93,711 | — | |||||||
| Total assets | 31,635,229 | 30,246,887 | 2,785,515 | |||||||
| LIABILITIES: | ||||||||||
| Payable for: | ||||||||||
| Upon return of securities loaned | 3,376,086 | 88,811 | 9,419 | |||||||
| Management fees | 9,648 | 9,594 | 626 | |||||||
| Investments purchased | — | 1,824,566 | — | |||||||
| Other liabilities | — | 2,724 | — | |||||||
| Total liabilities | 3,385,734 | 1,925,695 | 10,045 | |||||||
| NET ASSETS | $ | 28,249,495 | $ | 28,321,192 | $ | 2,775,470 | ||||
| NET ASSETS CONSIST OF: | ||||||||||
| Paid-in capital | $ | 27,025,117 | $ | 28,138,074 | $ | 2,571,929 | ||||
| Undistributed net investment income | 154,459 | 95,581 | 10,708 | |||||||
| Accumulated net realized gain (loss) on investments | 360,200 | (452,469 | ) | 73,177 | ||||||
| Net unrealized appreciation on investments | 709,719 | 540,006 | 119,656 | |||||||
| NET ASSETS | $ | 28,249,495 | $ | 28,321,192 | $ | 2,775,470 | ||||
| Shares outstanding ($0.01 par value with unlimited amount authorized) | 1,050,000 | 550,000 | 100,000 | |||||||
| Net asset value | $ | 26.90 | $ | 51.44 | $ | 27.75 | ||||
| Investments in unaffiliated issuers, at cost | 27,327,389 | 26,554,229 | 2,639,801 | |||||||
| Investments in affiliated issuers, at cost | — | 1,050,062 | — | |||||||
| Repurchase agreements, at cost | 3,376,086 | 1,488,811 | 9,419 | |||||||
| Foreign currency, at cost | 921 | — | — | |||||||
| Securities on loan, at value | 3,271,161 | 259,774 | 8,825 | |||||||
| See notes to financial statements. |
| 48 l CLAYMORE EXCHANGE-TRADED FUND TRUST 2 SEMIANNUAL REPORT |
| STATEMENT OF OPERATIONS (Unaudited) | February 28, 2017 |
| For the period ended February 28, 2017 |
| Guggenheim | Guggenheim S&P | ||||||||||||
| Guggenheim | China Technology | Guggenheim | Global Water | ||||||||||
| China All-Cap ETF | ETF | Solar ETF | Index ETF | ||||||||||
| (YAO | ) | (CQQQ | ) | (TAN | ) | (CGW | ) | ||||||
| INVESTMENT INCOME: | |||||||||||||
| Dividends, net of foreign taxes withheld* | $ | 87,672 | $ | 259,811 | $ | 633,899 | $ | 3,147,130 | |||||
| Income from securities lending | 9,584 | 85,199 | 2,466,206 | 56,065 | |||||||||
| Total investment income | 97,256 | 345,010 | 3,100,105 | 3,203,195 | |||||||||
| EXPENSES: | |||||||||||||
| Management fees | 78,401 | 188,353 | 493,679 | 1,113,332 | |||||||||
| Listing fees | — | — | 2,500 | 3,800 | |||||||||
| Printing fees | — | — | 26,537 | 23,477 | |||||||||
| Intraday valuation fees | — | — | 3,496 | 7,421 | |||||||||
| Insurance | — | — | 1,577 | 2,355 | |||||||||
| Professional fees | — | — | 25,830 | 27,782 | |||||||||
| Administration fees | — | — | 26,823 | 51,487 | |||||||||
| Trustees' fees and expenses** | — | — | 7,480 | 11,147 | |||||||||
| Licensing fees | — | — | 135,707 | 110,123 | |||||||||
| Custodian fees | — | — | 49,427 | 44,942 | |||||||||
| Other expenses | — | — | 218 | 719 | |||||||||
| Total expenses | 78,401 | 188,353 | 773,274 | 1,396,585 | |||||||||
| Less: | |||||||||||||
| Expenses waived by advisor | — | — | (87,297 | ) | — | ||||||||
| Net expenses | 78,401 | 188,353 | 685,977 | 1,396,585 | |||||||||
| Net investment income | 18,855 | 156,657 | 2,414,128 | 1,806,610 | |||||||||
| NET REALIZED AND UNREALIZED GAIN (LOSS): | |||||||||||||
| Net realized gain (loss) on: | |||||||||||||
| Investments | 61,419 | (1,848,923 | ) | (65,369,429 | ) | (2,822,642 | ) | ||||||
| In-kind transactions | 277,713 | 1,979,462 | 4,474,818 | 1,110,598 | |||||||||
| Foreign currency transactions | 145 | (532 | ) | (49,644 | ) | (24,928 | ) | ||||||
| Net realized gain (loss) | 339,277 | 130,007 | (60,944,255 | ) | (1,736,972 | ) | |||||||
| Net change in unrealized appreciation (depreciation) on: | |||||||||||||
| Investments | 793,937 | 275,925 | 42,927,961 | 5,869,387 | |||||||||
| Foreign currency translations | (3 | ) | (5 | ) | 931 | 5,480 | |||||||
| Net change in unrealized appreciation (depreciation) | 793,934 | 275,920 | 42,928,892 | 5,874,867 | |||||||||
| Net realized and unrealized gain (loss) | 1,133,211 | 405,927 | (18,015,363 | ) | 4,137,895 | ||||||||
| Net increase (decrease) in net assets resulting from operations | $ | 1,152,066 | $ | 562,584 | $ | (15,601,235 | ) | $ | 5,944,505 | ||||
| * Foreign taxes withheld | $ | 4,301 | $ | — | $ | 8,977 | $ | 169,575 | |||||
** Related to Trustees not deemed "interested persons" within the meaning of Section 2(a)(19) of the 1940 Act.
| See notes to financial statements. |
| CLAYMORE EXCHANGE-TRADED FUND TRUST 2 SEMIANNUAL REPORT l 49 |
| STATEMENT OF OPERATIONS (Unaudited) continued | February 28, 2017 |
| For the period ended February 28, 2017 |
| Guggenheim S&P | Guggenheim | Guggenheim U.S. | ||||||||
| High Income | Total Return | Large Cap Optimized | ||||||||
| Infrastructure ETF | Bond ETF | Volatility ETF | ||||||||
| (GHII | ) | (GTO | ) | (OVLC | ) | |||||
| INVESTMENT INCOME: | ||||||||||
| Dividends from securities of unaffiliated issuers, net of foreign taxes withheld | $ | 329,915 | * | $ | 834 | $ | 35,869 | |||
| Dividends from securities of affiliated issuers | — | 26,449 | — | |||||||
| Income from securities lending | 28,999 | 2,044 | 104 | |||||||
| Interest, net of foreign taxes withheld | — | 470,761 | * | — | ||||||
| Total investment income | 358,914 | 500,088 | 35,973 | |||||||
| EXPENSES: | ||||||||||
| Management fees | 33,747 | 71,212 | 3,941 | |||||||
| Total expenses | 33,747 | 71,212 | 3,941 | |||||||
| Less: | ||||||||||
| Expenses waived by advisor | — | (2,216 | ) | — | ||||||
| Net expenses | 33,747 | 68,996 | 3,941 | |||||||
| Net investment income | 325,167 | 431,092 | 32,032 | |||||||
| NET REALIZED AND UNREALIZED GAIN (LOSS): | ||||||||||
| Net realized gain (loss) on: | ||||||||||
| Investments | (17,901 | ) | (433,778 | ) | (81,162 | ) | ||||
| In-kind transactions | 497,406 | — | 179,313 | |||||||
| Swap agreements | — | 19,728 | — | |||||||
| Foreign currency transactions | (7,903 | ) | — | — | ||||||
| Net realized gain (loss) | 471,602 | (414,050 | ) | 98,151 | ||||||
| Net change in unrealized appreciation (depreciation) on: | ||||||||||
| Investments | 667,138 | (325,971 | ) | 47,864 | ||||||
| Swap agreements | — | 120,008 | — | |||||||
| Foreign currency translations | (293 | ) | — | — | ||||||
| Net change in unrealized appreciation (depreciation) | 666,845 | (205,963 | ) | 47,864 | ||||||
| Net realized and unrealized gain | 1,138,447 | (620,013 | ) | 146,015 | ||||||
| Net increase (decrease) in net assets resulting from operations | $ | 1,463,614 | $ | (188,921 | ) | $ | 178,047 | |||
| * Foreign taxes withheld | $ | 22,926 | $ | 281 | $ | — | ||||
| See notes to financial statements. |
| 50 l CLAYMORE EXCHANGE-TRADED FUND TRUST 2 SEMIANNUAL REPORT |
| STATEMENTS OF CHANGES IN NET ASSETS | February 28, 2017 |
| Guggenheim China | Guggenheim China | ||||||||||||
| All-Cap ETF | Technology | ||||||||||||
| (YAO) | ETF (CQQQ) | ||||||||||||
| Period Ended | Period Ended | ||||||||||||
| February 28, 2017 | Year Ended | February 28, 2017 | Year Ended | ||||||||||
| (Unaudited) | August 31, 2016 | (Unaudited) | August 31, 2016 | ||||||||||
| INCREASE (DECREASE) IN NET ASSETS FROM OPERATIONS: | |||||||||||||
| Net investment income | $ | 18,855 | $ | 532,036 | $ | 156,657 | $ | 454,675 | |||||
| Net realized gain (loss) on investments | 339,277 | (1,599,684 | ) | 130,007 | 296,205 | ||||||||
| Net change in unrealized appreciation (depreciation) on investments | 793,934 | 3,785,213 | 275,920 | 14,087,143 | |||||||||
| Net increase in net assets resulting from operations | 1,152,066 | 2,717,565 | 562,584 | 14,838,023 | |||||||||
| DISTRIBUTIONS TO SHAREHOLDERS FROM: | |||||||||||||
| Net investment income | (433,200 | ) | (960,740 | ) | (773,890 | ) | (921,765 | ) | |||||
| SHAREHOLDER TRANSACTIONS: | |||||||||||||
| Proceeds from shares purchased | — | — | 22,374,895 | 1,611,539 | |||||||||
| Cost of shares redeemed | (2,577,484 | ) | (7,490,830 | ) | (9,123,755 | ) | (16,178,367 | ) | |||||
| Net increase (decrease) in net assets resulting from shareholder transactions | (2,577,484 | ) | (7,490,830 | ) | 13,251,140 | (14,566,828 | ) | ||||||
| Net increase (decrease) in net assets | (1,858,618 | ) | (5,734,005 | ) | 13,039,834 | (650,570 | ) | ||||||
| NET ASSETS: | |||||||||||||
| Beginning of period | 23,574,119 | 29,308,124 | 45,152,966 | 45,803,536 | |||||||||
| End of period | $ | 21,715,501 | $ | 23,574,119 | $ | 58,192,800 | $ | 45,152,966 | |||||
| Undistributed (distributions in excess of) net investment income at end of period | $ | (64,257 | ) | $ | 350,088 | $ | (197,530 | ) | $ | 419,703 | |||
| CHANGES IN SHARES OUTSTANDING: | |||||||||||||
| Shares sold | — | — | 550,000 | 50,000 | |||||||||
| Shares redeemed | (100,000 | ) | (300,000 | ) | (250,000 | ) | (450,000 | ) | |||||
| Net increase (decrease) in shares | (100,000 | ) | (300,000 | ) | 300,000 | (400,000 | ) | ||||||
| See notes to financial statements. |
| CLAYMORE EXCHANGE-TRADED FUND TRUST 2 SEMIANNUAL REPORT l 51 |
| STATEMENTS OF CHANGES IN NET ASSETS continued | February 28, 2017 |
| Guggenheim S&P | |||||||||||||
| Guggenheim Solar ETF | Global Water Index ETF | ||||||||||||
| (TAN) | (CGW) | ||||||||||||
| Period Ended | Period Ended | ||||||||||||
| February 28, 2017 | Year Ended | February 28, 2017 | Year Ended | ||||||||||
| (Unaudited) | August 31, 2016 | (Unaudited) | August 31, 2016 | ||||||||||
| INCREASE (DECREASE) IN NET ASSETS FROM OPERATIONS: | |||||||||||||
| Net investment income | $ | 2,414,128 | $ | 8,016,477 | $ | 1,806,610 | $ | 7,120,088 | |||||
| Net realized loss on investments | (60,944,255 | ) | (113,588,689 | ) | (1,736,972 | ) | (769,530 | ) | |||||
| Net change in unrealized appreciation (depreciation) on investments | 42,928,892 | 17,978,639 | 5,874,867 | 46,408,846 | |||||||||
| Net increase (decrease) in net assets resulting from operations | (15,601,235 | ) | (87,593,573 | ) | 5,944,505 | 52,759,404 | |||||||
| DISTRIBUTIONS TO SHAREHOLDERS FROM: | |||||||||||||
| Net investment income | (8,422,471 | ) | (4,984,353 | ) | (7,164,324 | ) | (5,868,264 | ) | |||||
| SHAREHOLDER TRANSACTIONS: | |||||||||||||
| Proceeds from shares purchased | 51,661,900 | 139,579,996 | 54,165,352 | 45,042,866 | |||||||||
| Cost of shares redeemed | (44,031,550 | ) | (82,793,098 | ) | (2,394,469 | ) | (6,399,035 | ) | |||||
| Net increase in net assets resulting from shareholder transactions | 7,630,350 | 56,786,898 | 51,770,883 | 38,643,831 | |||||||||
| Net increase (decrease) in net assets | (16,393,356 | ) | (35,791,028 | ) | 50,551,064 | 85,534,971 | |||||||
| NET ASSETS: | |||||||||||||
| Beginning of period | 230,754,225 | 266,545,253 | 432,244,157 | 346,709,186 | |||||||||
| End of period | $ | 214,360,869 | $ | 230,754,225 | $ | 482,795,221 | $ | 432,244,157 | |||||
| Undistributed (distributions in excess of) net investment income at end of period | $ | (338,853 | ) | $ | 5,669,490 | $ | 765,289 | $ | 6,123,003 | ||||
| CHANGES IN SHARES OUTSTANDING: | |||||||||||||
| Shares sold | 2,800,000 | 5,120,000 | 1,840,000 | 1,520,000 | |||||||||
| Shares redeemed | (2,400,000 | ) | (3,040,000 | ) | (80,000 | ) | (240,000 | ) | |||||
| Net increase in shares | 400,000 | 2,080,000 | 1,760,000 | 1,280,000 | |||||||||
| See notes to financial statements. |
| 52 l CLAYMORE EXCHANGE-TRADED FUND TRUST 2 SEMIANNUAL REPORT |
| STATEMENTS OF CHANGES IN NET ASSETS continued | February 28, 2017 |
| Guggenheim S&P High | Guggenheim | ||||||||||||
| Income Infrastructure ETF | Total Return Bond ETF | ||||||||||||
| (GHII) | (GTO) | ||||||||||||
| Period from | |||||||||||||
| Period Ended | Period Ended | February 10, 2016a | |||||||||||
| February 28, 2017 | Year Ended | February 28, 2017 | to | ||||||||||
| (Unaudited) | August 31, 2016 | (Unaudited) | August 31, 2016 | ||||||||||
| INCREASE (DECREASE) IN NET ASSETS FROM OPERATIONS: | |||||||||||||
| Net investment income | $ | 325,167 | $ | 150,376 | $ | 431,092 | $ | 281,496 | |||||
| Net realized gain (loss) on investments | 471,602 | 313,826 | (414,050 | ) | 172,679 | ||||||||
| Net change in unrealized appreciation (depreciation) on investments | 666,845 | 288,879 | (205,963 | ) | 745,969 | ||||||||
| Net increase (decrease) in net assets resulting from operations | 1,463,614 | 753,081 | (188,921 | ) | 1,200,144 | ||||||||
| DISTRIBUTIONS TO SHAREHOLDERS FROM: | |||||||||||||
| Net investment income | (207,930 | ) | (136,030 | ) | (408,205 | ) | (220,025 | ) | |||||
| Capital gains | (8,160 | ) | — | (199,875 | ) | — | |||||||
| Total distributions to shareholders | (216,090 | ) | (136,030 | ) | (608,080 | ) | (220,025 | ) | |||||
| SHAREHOLDER TRANSACTIONS: | |||||||||||||
| Proceeds from shares purchased | 25,761,846 | 3,586,109 | 18,238,714 | 22,624,859 | |||||||||
| Cost of shares redeemed | (2,702,401 | ) | (2,548,058 | ) | (10,134,546 | ) | (2,590,953 | ) | |||||
| Net increase in net assets resulting from shareholder transactions | 23,059,445 | 1,038,051 | 8,104,168 | 20,033,906 | |||||||||
| Net increase in net assets | 24,306,969 | 1,655,102 | 7,307,167 | 21,014,025 | |||||||||
| NET ASSETS: | |||||||||||||
| Beginning of period | 3,942,526 | 2,287,424 | 21,014,025 | — | |||||||||
| End of period | $ | 28,249,495 | $ | 3,942,526 | $ | 28,321,192 | $ | 21,014,025 | |||||
| Undistributed net investment income at end of period | $ | 154,459 | $ | 37,222 | $ | 95,581 | $ | 72,694 | |||||
| CHANGES IN SHARES OUTSTANDING: | |||||||||||||
| Shares sold | 1,000,000 | 150,000 | 350,000 | 450,000 | |||||||||
| Shares redeemed | (100,000 | ) | (100,000 | ) | (200,000 | ) | (50,000 | ) | |||||
| Net increase in shares | 900,000 | 50,000 | 150,000 | 400,000 | |||||||||
a Commencement of operations
| See notes to financial statements. |
| CLAYMORE EXCHANGE-TRADED FUND TRUST 2 SEMIANNUAL REPORT l 53 |
| STATEMENTS OF CHANGES IN NET ASSETS continued | February 28, 2017 |
| Guggenheim U.S. Large Cap | |||||||
| Optimized Volatility ETF | |||||||
(OVLC) | |||||||
| Period from | |||||||
| Period Ended | May 10, 2016a | ||||||
| February 28, 2017 | to | ||||||
| (Unaudited) | August 31, 2016 | ||||||
| INCREASE (DECREASE) IN NET ASSETS FROM OPERATIONS: | |||||||
| Net investment income | $ | 32,032 | $ | 18,240 | |||
| Net realized gain (loss) on investments | 98,151 | (3,948 | ) | ||||
| Net change in unrealized appreciation (depreciation) on investments | 47,864 | 71,792 | |||||
| Net increase in net assets resulting from operations | 178,047 | 86,084 | |||||
| DISTRIBUTIONS TO SHAREHOLDERS FROM: | |||||||
| Net investment income | (38,865 | ) | — | ||||
| SHAREHOLDER TRANSACTIONS: | |||||||
| Proceeds from shares purchased | 2,661,091 | 3,793,999 | |||||
| Cost of shares redeemed | (2,645,169 | ) | (1,259,717 | ) | |||
| Net increase in net assets resulting from shareholder transactions | 15,922 | 2,534,282 | |||||
| Net increase in net assets | 155,104 | 2,620,366 | |||||
| NET ASSETS: | |||||||
| Beginning of period | 2,620,366 | — | |||||
| End of period | $ | 2,775,470 | $ | 2,620,366 | |||
| Undistributed net investment income at end of period | $ | 10,709 | $ | 17,541 | |||
| CHANGES IN SHARES OUTSTANDING: | |||||||
| Shares sold | 100,000 | 150,000 | |||||
| Shares redeemed | (100,000 | ) | (50,000 | ) | |||
| Net increase in shares | — | 100,000 | |||||
a | Commencement of operations |
| See notes to financial statements. |
| 54 l CLAYMORE EXCHANGE-TRADED FUND TRUST 2 SEMIANNUAL REPORT |
| FINANCIAL HIGHLIGHTS | February 28, 2017 |
YAO Guggenheim China All-Cap ETF
This table is presented to show selected data for a share outstanding throughout each period and to assist shareholders in evaluating an ETF's performance for the periods presented.
| Period Ended | Year Ended | Year Ended | Year Ended | Year Ended | Year Ended | ||||||||||||||
| February 28, 2017 | August 31, | August 31, | August 31, | August 31, | August 31, | ||||||||||||||
| (Unaudited | ) | 2016 | 2015 | 2014 | 2013 | 2012 | |||||||||||||
| Per Share Data: | |||||||||||||||||||
| Net asset value, beginning of period | $ | 26.19 | $ | 24.42 | $ | 28.56 | $ | 24.63 | $ | 21.66 | $ | 25.04 | |||||||
| Income from investment operations: | |||||||||||||||||||
Net investment income(a) | 0.02 | 0.52 | 0.53 | 0.62 | 0.46 | 0.52 | |||||||||||||
| Net gain (loss) on investments (realized and unrealized) | 1.47 | 2.12 | (4.02 | ) | 3.80 | 3.07 | (3.32 | ) | |||||||||||
| Total from investment operations | 1.49 | 2.64 | (3.49 | ) | 4.42 | 3.53 | (2.80 | ) | |||||||||||
| Less distributions from: | |||||||||||||||||||
| Net investment income | (0.54 | ) | (0.87 | ) | (0.65 | ) | (0.49 | ) | (0.56 | ) | (0.58 | ) | |||||||
| Total distributions to shareholders | (0.54 | ) | (0.87 | ) | (0.65 | ) | (0.49 | ) | (0.56 | ) | (0.58 | ) | |||||||
| Net asset value, end of period | $ | 27.14 | $ | 26.19 | $ | 24.42 | $ | 28.56 | $ | 24.63 | $ | 21.66 | |||||||
| Market value, end of period | $ | 27.15 | $ | 26.23 | $ | 24.13 | $ | 28.52 | $ | 24.49 | $ | 21.76 | |||||||
Total Return(b) | |||||||||||||||||||
| Net asset value | 5.91 | % | 10.99 | % | -12.51 | % | 18.05 | % | 16.25 | % | -11.17 | % | |||||||
| Ratios/Supplemental Data: | |||||||||||||||||||
| Net assets, end of period (in thousands) | $ | 21,716 | $ | 23,574 | $ | 29,308 | $ | 54,262 | $ | 46,804 | $ | 49,822 | |||||||
| Ratio to average net assets of: | |||||||||||||||||||
| Net investment income | 0.17 | %(d) | 2.17 | % | 1.84 | % | 2.35 | % | 1.92 | % | 2.25 | % | |||||||
| Total expenses | 0.70 | %(d) | 0.70 | % | 0.70 | % | 0.71 | % | 0.70 | % | 0.70 | % | |||||||
| Net expenses | 0.70 | %(d) | 0.70 | % | 0.70 | % | 0.71 | % | 0.70 | % | 0.70 | % | |||||||
Portfolio turnover rate(c) | 7 | % | 26 | % | 17 | % | 12 | % | 16 | % | 12 | % | |||||||
| (a) | Based on average shares outstanding. |
| (b) | Total investment return is calculated assuming an initial investment made at the net asset value at the beginning of the period, reinvestment of all dividends and distribution at net asset value during the period, and redemption on the last day of the period. Transaction fees are not reflected in the calculation of total investment return. |
| (c) | Portfolio turnover does not include securities received or delivered from processing creations or redemptions. |
| (d) | Annualized. |
| See notes to financial statements. |
| CLAYMORE EXCHANGE-TRADED FUND TRUST 2 SEMIANNUAL REPORT l 55 |
| FINANCIAL HIGHLIGHTS continued | February 28, 2017 |
CQQQ Guggenheim China Technology ETF
This table is presented to show selected data for a share outstanding throughout each period and to assist shareholders in evaluating an ETF's performance for the periods presented.
| Period Ended | Year Ended | Year Ended | Year Ended | Year Ended | Year Ended | ||||||||||||||
| February 28, 2017 | August 31, | August 31, | August 31, | August 31, | August 31, | ||||||||||||||
| (Unaudited | ) | 2016 | 2015 | 2014 | 2013 | 2012 | |||||||||||||
| Per Share Data: | |||||||||||||||||||
| Net asset value, beginning of period | $ | 39.26 | $ | 29.55 | $ | 38.09 | $ | 29.55 | $ | 20.03 | $ | 25.44 | |||||||
| Income from investment operations: | |||||||||||||||||||
Net investment income(a) | 0.11 | 0.32 | 0.46 | 0.43 | 0.28 | 0.54 | |||||||||||||
| Net gain (loss) on investments (realized and unrealized) | 1.36 | 10.03 | (8.65 | ) | 8.39 | 9.67 | (5.38 | ) | |||||||||||
| Total from investment operations | 1.47 | 10.35 | (8.19 | ) | 8.82 | 9.95 | (4.84 | ) | |||||||||||
| Less distributions from: | |||||||||||||||||||
| Net investment income | (0.60 | ) | (0.64 | ) | (0.35 | ) | (0.28 | ) | (0.43 | ) | (0.57 | ) | |||||||
| Total distributions to shareholders | (0.60 | ) | (0.64 | ) | (0.35 | ) | (0.28 | ) | (0.43 | ) | (0.57 | ) | |||||||
| Net asset value, end of period | $ | 40.13 | $ | 39.26 | $ | 29.55 | $ | 38.09 | $ | 29.55 | $ | 20.03 | |||||||
| Market value, end of period | $ | 40.41 | $ | 39.08 | $ | 29.31 | $ | 37.88 | $ | 29.59 | $ | 19.96 | |||||||
Total Return(b) | |||||||||||||||||||
| Net asset value | 3.92 | % | 35.19 | % | -21.62 | % | 29.89 | % | 50.39 | % | -19.10 | % | |||||||
| Ratios/Supplemental Data: | |||||||||||||||||||
| Net assets, end of period (in thousands) | $ | 58,193 | $ | 45,153 | $ | 45,804 | $ | 78,077 | $ | 22,164 | $ | 17,029 | |||||||
| Ratio to average net assets of: | |||||||||||||||||||
| Net investment income | 0.58 | %(d) | 0.94 | % | 1.20 | % | 1.22 | % | 1.16 | % | 2.38 | % | |||||||
| Total expenses | 0.70 | %(d) | 0.70 | % | 0.70 | % | 0.71 | % | 0.70 | % | 0.70 | % | |||||||
| Net expenses | 0.70 | %(d) | 0.70 | % | 0.70 | % | 0.71 | % | 0.70 | % | 0.70 | % | |||||||
Portfolio turnover rate(c) | 10 | % | 48 | % | 32 | % | 39 | % | 26 | % | 43 | % | |||||||
| (a) | Based on average shares outstanding. |
| (b) | Total investment return is calculated assuming an initial investment made at the net asset value at the beginning of the period, reinvestment of all dividends and distribution at net asset value during the period, and redemption on the last day of the period. Transaction fees are not reflected in the calculation of total investment return. |
| (c) | Portfolio turnover does not include securities received or delivered from processing creations or redemptions. |
| (d) | Annualized. |
| See notes to financial statements. |
| 56 l CLAYMORE EXCHANGE-TRADED FUND TRUST 2 SEMIANNUAL REPORT |
| FINANCIAL HIGHLIGHTS continued | February 28, 2017 |
TAN Guggenheim Solar ETF
This table is presented to show selected data for a share outstanding throughout each period and to assist shareholders in evaluating an ETF's performance for the periods presented.
| Period Ended | Year Ended | Year Ended | Year Ended | Year Ended | Year Ended | ||||||||||||||
| February 28, 2017 | August 31, | August 31, | August 31, | August 31, | August 31, | ||||||||||||||
| (Unaudited | ) | 2016 | 2015 | 2014 | 2013 | 2012 | * | ||||||||||||
| Per Share Data: | |||||||||||||||||||
| Net asset value, beginning of period | $ | 20.89 | $ | 29.72 | $ | 43.58 | $ | 27.23 | $ | 16.74 | $ | 54.90 | |||||||
| Income from investment operations: | |||||||||||||||||||
Net investment income(a) | 0.23 | 0.80 | 0.72 | 0.52 | 0.56 | 1.84 | |||||||||||||
| Net gain (loss) on investments (realized and unrealized) | (1.57 | ) | (9.14 | ) | (13.94 | ) | 16.28 | 11.35 | (37.89 | ) | |||||||||
| Total from investment operations | (1.34 | ) | (8.34 | ) | (13.22 | ) | 16.80 | 11.91 | (36.05 | ) | |||||||||
| Less distributions from: | |||||||||||||||||||
| Net investment income | (0.83 | ) | (0.49 | ) | (0.64 | ) | (0.45 | ) | (1.42 | ) | (2.11 | ) | |||||||
| Total distributions to shareholders | (0.83 | ) | (0.49 | ) | (0.64 | ) | (0.45 | ) | (1.42 | ) | (2.11 | ) | |||||||
| Net asset value, end of period | $ | 18.72 | $ | 20.89 | $ | 29.72 | $ | 43.58 | $ | 27.23 | $ | 16.74 | |||||||
| Market value, end of period | $ | 18.76 | $ | 20.91 | $ | 29.57 | $ | 43.39 | $ | 27.16 | $ | 16.71 | |||||||
Total Return(b) | |||||||||||||||||||
| Net asset value | -5.87 | % | -28.59 | % | -30.51 | % | 62.06 | % | 77.60 | % | -66.93 | % | |||||||
| Ratios/Supplemental Data: | |||||||||||||||||||
| Net assets, end of period (in thousands) | $ | 214,361 | $ | 230,754 | $ | 266,545 | $ | 429,167 | $ | 170,150 | $ | 42,992 | |||||||
| Ratio to average net assets of: | |||||||||||||||||||
| Net investment income | 2.45 | %(d) | 3.26 | % | 1.83 | % | 1.28 | % | 2.71 | % | 7.07 | % | |||||||
| Total expenses | 0.78 | %(d) | 0.88 | % | 0.73 | % | 0.76 | % | 0.86 | % | 1.01 | % | |||||||
| Net expenses | 0.69 | %(d) | 0.71 | % | 0.70 | % | 0.71 | % | 0.70 | % | 0.70 | % | |||||||
Portfolio turnover rate(c) | 26 | % | 53 | % | 51 | % | 47 | % | 68 | % | 49 | % | |||||||
| * | Reflects 1 for 10 reverse stock split that occurred February 15, 2012. |
| (a) | Based on average shares outstanding. |
| (b) | Total investment return is calculated assuming an initial investment made at the net asset value at the beginning of the period, reinvestment of all dividends and distribution at net asset value during the period, and redemption on the last day of the period. Transaction fees are not reflected in the calculation of total investment return. |
| (c) | Portfolio turnover does not include securities received or delivered from processing creations or redemptions. |
| (d) | Annualized. |
| See notes to financial statements. |
| CLAYMORE EXCHANGE-TRADED FUND TRUST 2 SEMIANNUAL REPORT l 57 |
| FINANCIAL HIGHLIGHTS continued | February 28, 2017 |
CGW Guggenheim S&P Global Water Index ETF
This table is presented to show selected data for a share outstanding throughout each period and to assist shareholders in evaluating an ETF's performance for the periods presented.
| Period Ended | Year Ended | Year Ended | Year Ended | Year Ended | Year Ended | ||||||||||||||
| February 28, 2017 | August 31, | August 31, | August 31, | August 31, | August 31, | ||||||||||||||
| (Unaudited | ) | 2016 | 2015 | 2014 | 2013 | 2012 | |||||||||||||
| Per Share Data: | |||||||||||||||||||
| Net asset value, beginning of period | $ | 30.27 | $ | 26.67 | $ | 29.02 | $ | 23.90 | $ | 21.05 | $ | 20.06 | |||||||
| Income from investment operations: | |||||||||||||||||||
Net investment income(a) | 0.12 | 0.54 | 0.48 | 0.51 | 0.49 | 0.44 | |||||||||||||
| Net gain (loss) on investments (realized and unrealized) | 0.18 | 3.51 | (2.33 | ) | 5.03 | 2.81 | 0.96 | ||||||||||||
| Total from investment operations | 0.30 | 4.05 | (1.85 | ) | 5.54 | 3.30 | 1.40 | ||||||||||||
| Less distributions from: | |||||||||||||||||||
| Net investment income | (0.47 | ) | (0.45 | ) | (0.50 | ) | (0.42 | ) | (0.45 | ) | (0.41 | ) | |||||||
| Total distributions to shareholders | (0.47 | ) | (0.45 | ) | (0.50 | ) | (0.42 | ) | (0.45 | ) | (0.41 | ) | |||||||
| Net asset value, end of period | $ | 30.10 | $ | 30.27 | $ | 26.67 | $ | 29.02 | $ | 23.90 | $ | 21.05 | |||||||
| Market value, end of period | $ | 30.08 | $ | 30.32 | $ | 26.64 | $ | 29.08 | $ | 23.88 | $ | 20.98 | |||||||
Total Return(b) | |||||||||||||||||||
| Net asset value | 1.08 | % | 15.40 | % | -6.47 | % | 23.27 | % | 15.85 | % | 7.23 | % | |||||||
| Ratios/Supplemental Data: | |||||||||||||||||||
| Net assets, end of period (in thousands) | $ | 482,795 | $ | 432,244 | $ | 346,709 | $ | 367,914 | $ | 253,369 | $ | 199,547 | |||||||
| Ratio to average net assets of: | |||||||||||||||||||
| Net investment income | 0.82 | %(d) | 1.93 | % | 1.69 | % | 1.83 | % | 2.13 | % | 2.22 | % | |||||||
| Total expenses | 0.63 | %(d) | 0.64 | % | 0.64 | % | 0.65 | % | 0.71 | % | 0.76 | % | |||||||
| Net expenses | 0.63 | %(d) | 0.64 | % | 0.64 | % | 0.65 | % | 0.70 | % | 0.70 | % | |||||||
Portfolio turnover rate(c) | 5 | % | 6 | % | 9 | % | 7 | % | 21 | % | 31 | % | |||||||
| (a) | Based on average shares outstanding. |
| (b) | Total investment return is calculated assuming an initial investment made at the net asset value at the beginning of the period, reinvestment of all dividends and distribution at net asset value during the period, and redemption on the last day of the period. Transaction fees are not reflected in the calculation of total investment return. |
| (c) | Portfolio turnover does not include securities received or delivered from processing creations or redemptions. |
| (d) | Annualized. |
| See notes to financial statements. |
| 58 l CLAYMORE EXCHANGE-TRADED FUND TRUST 2 SEMIANNUAL REPORT |
| FINANCIAL HIGHLIGHTS continued | February 28, 2017 |
GHII Guggenheim S&P High Income Infrastructure ETF
This table is presented to show selected data for a share outstanding throughout each period and to assist shareholders in evaluating an ETF's performance for the periods presented.
| Period Ended | ||||||||||
| February 28, 2017 | Year Ended | Period Ended | ||||||||
| (Unaudited | ) | August 31, 2016 | August 31, 2015(a | ) | ||||||
| Per Share Data: | ||||||||||
| Net asset value, beginning of period | $ | 26.28 | $ | 22.87 | $ | 25.05 | ||||
| Income from investment operations: | ||||||||||
Net investment income(b) | 0.56 | 1.34 | 0.71 | |||||||
| Net gain (loss) on investments (realized and unrealized) | 0.53 | 3.34 | (2.45 | ) | ||||||
| Total from investment operations | 1.09 | 4.68 | (1.74 | ) | ||||||
| Less distributions from: | ||||||||||
| Net investment income | (0.46 | ) | (1.27 | ) | (0.44 | ) | ||||
| Capital gains | (0.01 | ) | — | — | ||||||
| Total distributions to shareholders | (0.47 | ) | (1.27 | ) | (0.44 | ) | ||||
| Net asset value, end of period | $ | 26.90 | $ | 26.28 | $ | 22.87 | ||||
| Market value, end of period | $ | 27.08 | $ | 26.48 | $ | 22.56 | ||||
Total Return(c) | ||||||||||
| Net asset value | 4.22 | % | 21.35 | % | -7.02 | % | ||||
| Ratios/Supplemental Data: | ||||||||||
| Net assets, end of period (in thousands) | $ | 28,249 | $ | 3,943 | $ | 2,287 | ||||
| Ratio to average net assets of: | ||||||||||
| Net investment income | 4.34 | %(e) | 5.82 | % | 5.13 | % | ||||
| Total expenses | 0.45 | %(e) | 0.45 | % | 0.45 | % | ||||
| Net expenses | 0.45 | %(e) | 0.45 | % | 0.45 | % | ||||
Portfolio turnover rate(d) | 42 | % | 61 | % | 13 | % |
| (a) | Since commencement of operations: February 11, 2015. Percentage amounts for the period, except total return and portfolio turnover rate, have been annualized. |
| (b) | Based on average shares outstanding. |
| (c) | Total investment return is calculated assuming an initial investment made at the net asset value at the beginning of the period, reinvestment of all dividends and distribution at net asset value during the period, and redemption on the last day of the period. Transaction fees are not reflected in the calculation of total investment return. |
| (d) | Portfolio turnover does not include securities received or delivered from processing creations or redemptions. |
| (e) | Annualized. |
| See notes to financial statements. |
| CLAYMORE EXCHANGE-TRADED FUND TRUST 2 SEMIANNUAL REPORT l 59 |
| FINANCIAL HIGHLIGHTS continued | February 28, 2017 |
GTO Guggenheim Total Return Bond ETF
This table is presented to show selected data for a share outstanding throughout each period and to assist shareholders in evaluating an ETF's performance for the periods presented.
| Period Ended | |||||||
| February 28, 2017 | Period Ended | ||||||
| (Unaudited | ) | August 31, 2016(a) | |||||
| Per Share Data: | |||||||
| Net asset value, beginning of period | $ | 52.54 | $ | 49.97 | |||
| Income from investment operations: | |||||||
Net investment income(b) | 0.77 | 0.72 | |||||
| Net gain (loss) on investments (realized and unrealized) | (0.78 | ) | 2.42 | ||||
| Total from investment operations | (0.01 | ) | 3.14 | ||||
| Less distributions from: | |||||||
| Net investment income | (0.73 | ) | (0.57 | ) | |||
| Capital gains | (0.31 | ) | — | ||||
| Total distributions to shareholders | (1.04 | ) | (0.57 | ) | |||
| Net asset value, end of period | $ | 51.49 | $ | 52.54 | |||
| Market value, end of period | $ | 51.43 | $ | 52.60 | |||
Total Return(c) | |||||||
| Net asset value | 0.01 | % | 6.29 | % | |||
| Ratios/Supplemental Data: | |||||||
| Net assets, end of period (in thousands) | $ | 28,321 | $ | 21,014 | |||
| Ratio to average net assets of: | |||||||
| Net investment income | 3.03 | %(e) | 2.56 | % | |||
| Total expenses | 0.50 | %(e) | 0.50 | % | |||
| Net expenses | 0.48 | %(e) | 0.49 | % | |||
Portfolio turnover rate(d) | 134 | % | 131 | % | |||
| (a) | Since commencement of operations: February 11, 2015. Percentage amounts for the period, except total return and portfolio turnover rate, have been annualized. |
| (b) | Based on average shares outstanding. |
| (c) | Total investment return is calculated assuming an initial investment made at the net asset value at the beginning of the period, reinvestment of all dividends and distribution at net asset value during the period, and redemption on the last day of the period. Transaction fees are not reflected in the calculation of total investment return. |
| (d) | Portfolio turnover does not include securities received or delivered from processing creations or redemptions. |
| (e) | Annualized. |
| See notes to financial statements. |
| 60 l CLAYMORE EXCHANGE-TRADED FUND TRUST 2 SEMIANNUAL REPORT |
| FINANCIAL HIGHLIGHTS continued | February 28, 2017 |
OVLC Guggenheim U.S. Large Cap Optimized Volatility ETF
This table is presented to show selected data for a share outstanding throughout each period and to assist shareholders in evaluating an ETF's performance for the periods presented.
| Period Ended | |||||||
| February 28, 2017 | Period Ended | ||||||
| (Unaudited | ) | August 31, 2016(a) | |||||
| Per Share Data: | |||||||
| Net asset value, beginning of period | $ | 26.20 | $ | 25.14 | |||
| Income from investment operations: | |||||||
Net investment income(b) | 0.31 | 0.18 | |||||
| Net gain on investments (realized and unrealized) | 1.50 | 0.88 | |||||
| Total from investment operations | 1.81 | 1.06 | |||||
| Less distributions from: | |||||||
| Net investment income | (0.26 | ) | — | ||||
| Total distributions to shareholders | (0.26 | ) | — | ||||
| Net asset value, end of period | $ | 27.75 | $ | 26.20 | |||
| Market value, end of period | $ | 27.69 | $ | 26.14 | |||
Total Return(c) | |||||||
| Net asset value | 6.95 | % | 4.22 | % | |||
| Ratios/Supplemental Data: | |||||||
| Net assets, end of period (in thousands) | $ | 2,775 | $ | 2,620 | |||
| Ratio to average net assets of: | |||||||
| Net investment income | 2.44 | %(e) | 2.25 | % | |||
| Total expenses | 0.30 | %(e) | 0.30 | % | |||
| Net expenses | 0.30 | %(e) | 0.30 | % | |||
Portfolio turnover rate(d) | 58 | % | 21 | % |
| (a) | Since commencement of operations: May 10, 2016. Percentage amounts for the period, except total return and portfolio turnover rate, have been annualized. |
| (b) | Based on average shares outstanding. |
| (c) | Total investment return is calculated assuming an initial investment made at the net asset value at the beginning of the period, reinvestment of all dividends and distribution at net asset value during the period, and redemption on the last day of the period. Transaction fees are not reflected in the calculation of total investment return. |
| (d) | Portfolio turnover does not include securities received or delivered from processing creations or redemptions. |
| (e) | Annualized. |
| See notes to financial statements. |
| CLAYMORE EXCHANGE-TRADED FUND TRUST 2 SEMIANNUAL REPORT l 61 |
| NOTES TO FINANCIAL STATEMENTS (Unaudited) | February 28, 2017 |
Note 1 – Organization:
Claymore Exchange-Traded Fund Trust 2 (the "Trust"), which is registered under the Investment Company Act of 1940, as amended (the "1940 Act"), is an open-end, management investment company that was organized as a Delaware statutory trust on June 8, 2006.
The following seven portfolios have a semi-annual reporting period ended on February 28, 2017:
| Guggenheim China All-Cap ETF | ||
| Guggenheim China Technology ETF | ||
| Guggenheim Solar ETF | ||
| Guggenheim S&P Global Water Index ETF | ||
| Guggenheim S&P High Income Infrastructure ETF | ||
| Guggenheim Total Return Bond ETF | ||
| Guggenheim U.S. Large Cap Optimized Volatility ETF |
Each portfolio represents a separate series of the Trust (each a "Fund" or collectively the "Funds"). Each Fund's shares are listed and traded on the NYSE Arca, Inc. ("NYSE Arca"). The Funds' market prices may differ to some degree from the net asset value ("NAV") of the shares of each Fund. Unlike conventional mutual funds, each Fund issues and redeems shares on a continuous basis, at NAV, only in a large specified number of shares; each called a "Creation Unit." Creation Units are issued and redeemed principally in-kind for securities included in the relevant index. Except when aggregated in Creation Units, shares are not individually redeemable securities of the Funds. The investment objective of each of the Funds is to correspond generally to the performance, before fees and expenses, of the following market indices:
| Fund | Index |
| Guggenheim China All-Cap ETF | AlphaShares China All-Cap Index |
| Guggenheim China Technology ETF | AlphaShares China Technology Index |
| Guggenheim Solar ETF | MAC Global Solar Energy Index |
| Guggenheim S&P Global Water Index ETF | S&P Global Water Index |
| Guggenheim S&P High Income Infrastructure ETF | S&P High Income Infrastructure Index |
| Guggenheim U.S. Large Cap | Guggenheim U.S. Large Cap |
| Optimized Volatility ETF | Optimized Volatility Index |
Guggenheim Total Return Bond ETF is an actively managed ETF and therefore does not track an index.
Note 2 – Accounting Policies:
The Trust operates as an investment company and accordingly follows the investment company accounting and reporting guidance of the Financial Accounting Standards Board ("FASB") Accounting Standards Codification Topic 946 Financial Services – Investment Companies.
The Trust operates as an investment company and accordingly follows the investment company accounting and reporting guidance of the Financial Accounting Standards Board ("FASB") Accounting Standards Codification Topic 946 Financial Services – Investment Companies.
The following significant accounting policies are in conformity with U.S. generally accepted accounting principles ("GAAP") and are consistently followed by the Funds. This requires management to make estimates and assumptions that affect the reported amount of assets and liabilities and disclosure of contingent assets and liabilities at the date of the financial statements and the reported amounts of revenues and expenses during the reporting period. Actual results could differ from these estimates. All time references are based on Eastern Time.
(a) Valuation of Investments
The Board of Trustees of the Funds (the "Board") has adopted policies and procedures for the valuation of the Funds' investments (the "Valuation Procedures"). Pursuant to the Valuation Procedures, the Board has delegated to a valuation committee, consisting of representatives from Guggenheim's investment management, fund administration, legal and compliance departments (the "Valuation Committee"), the day-to-day responsibility for implementing the Valuation Procedures, including, under most circumstances, the responsibility for determining the fair value of the Fund's securities or other assets.
The Board of Trustees of the Funds (the "Board") has adopted policies and procedures for the valuation of the Funds' investments (the "Valuation Procedures"). Pursuant to the Valuation Procedures, the Board has delegated to a valuation committee, consisting of representatives from Guggenheim's investment management, fund administration, legal and compliance departments (the "Valuation Committee"), the day-to-day responsibility for implementing the Valuation Procedures, including, under most circumstances, the responsibility for determining the fair value of the Fund's securities or other assets.
Valuations of the Funds' securities are supplied primarily by pricing services appointed pursuant to the processes set forth in the Valuation Procedures. The Valuation Committee convenes monthly, or more frequently as needed and will review the valuation of all assets which have been fair valued for reasonableness. The Funds' officers, through the Valuation Committee and consistent with the monitoring and review responsibilities set forth in the Valuation Procedures, regularly review procedures used by, and valuations provided by, the pricing services.
If the pricing service cannot or does not provide a valuation for a particular investment or such valuation is deemed unreliable, such investment is fair valued by the Valuation Committee.
Equity securities listed on an exchange (New York Stock Exchange ("NYSE") or American Stock Exchange) are valued at the last quoted sale price as of the close of U.S. business on the NYSE, usually 4:00 p.m. on the valuation date. Equity securities listed on the NASDAQ market system are valued at the NASDAQ Official Closing Price on the valuation date, which may not necessarily represent the last sale price. If there has been no sale on such exchange or NASDAQ on such day, the security is valued at the closing bid price on such day.
Open-end investment companies ("Mutual Funds") are valued at their NAV as of the close of business on the valuation date. Exchange traded funds ("ETFs") and closed-end investment companies are valued at the last quoted sale price.
Debt securities with a maturity of greater than 60 days at acquisition are valued at prices that reflect broker/dealer supplied valuations or are obtained from independent pricing services, which may consider the trade activity, treasury spreads, yields or price of bonds of comparable quality, coupon, maturity, and type, as well as prices quoted by dealers who make markets in such securities. Short-term debt securities with a maturity of 60 days or less are valued at market price, or if a market price is not available, at amortized cost, provided such amount approximates market value. Money market funds are valued at net asset value.
Generally, trading in foreign securities markets is substantially completed each day at various times prior to the close of the NYSE. The values of foreign securities are determined as of the close of such foreign markets or the close of the NYSE, if earlier. All investments quoted in foreign currency are valued in U.S. dollars on the basis of the foreign currency exchange rates prevailing at the close of U.S. business at 4:00 p.m. Investments in foreign securities may involve risks not present in domestic investments.
| 62 l CLAYMORE EXCHANGE-TRADED FUND TRUST 2 SEMIANNUAL REPORT |
| NOTES TO FINANCIAL STATEMENTS (Unaudited) continued | February 28, 2017 |
The Valuation Committee will determine the current value of such foreign securities by taking into consideration certain factors which may include those discussed above, as well as the following factors, among others: the value of the securities traded on other foreign markets, ADR trading, closed-end fund trading, foreign currency exchange activity, and the trading prices of financial products that are tied to foreign securities such as World Equity Benchmark Securities. In addition, under the Valuation Procedures, the Valuation Committee and Guggenheim Funds Investment Advisors, LLC and Guggenheim Partners Investment Management, LLC (for Guggenheim Total Return Bond ETF) ("GFIA", "GPIM" or the "Investment Adviser") are authorized to use prices and other information supplied by a third party pricing vendor in valuing foreign securities.
Investments for which market quotations are not readily available are fair valued as determined in good faith by the Investment Adviser, subject to review by the Valuation Committee, pursuant to methods established or ratified by the Board. Valuations in accordance with these methods are intended to reflect each security's (or asset's) "fair value." Each such determination is based on a consideration of all relevant factors, which are likely to vary from one pricing context to another. Examples of such factors may include, but are not limited to: market prices; sale prices; broker quotes; and models which derive prices based on inputs such as prices of securities with comparable maturities and characteristics, or based on inputs such as anticipated cash flows or collateral, spread over Treasuries, and other information analysis.
(b) Investment Transactions and Investment Income
Investment transactions are accounted for on the trade date for financial reporting purposes. Realized gains and losses on investments are determined on the identified cost basis. Dividend income is recorded net of applicable withholding taxes on the ex-dividend date. Interest income, including the amortization of premiums and accretion of discount, is accrued daily over the life of the security.
Investment transactions are accounted for on the trade date for financial reporting purposes. Realized gains and losses on investments are determined on the identified cost basis. Dividend income is recorded net of applicable withholding taxes on the ex-dividend date. Interest income, including the amortization of premiums and accretion of discount, is accrued daily over the life of the security.
Real Estate Investment Trust ("REIT") distributions received by a Fund are generally comprised of ordinary income, long-term and short-term capital gains and return of capital. The actual character of amounts received during the year is not known until after the REITs' fiscal year end. A Fund records the character of distributions received from REITs during the year based on historical information available. A Fund's characterization may be subsequently revised based on information received from REITs after their tax reporting periods conclude.
(c) Currency Translations
Assets and liabilities denominated in foreign currencies are translated into U.S. dollars at the mean of the bid and ask price of respective exchange rates on the last day of the period. Purchases and sales of investments denominated in foreign currencies are translated at the mean of the bid and ask price of respective exchange rates on the date of the transaction.
Assets and liabilities denominated in foreign currencies are translated into U.S. dollars at the mean of the bid and ask price of respective exchange rates on the last day of the period. Purchases and sales of investments denominated in foreign currencies are translated at the mean of the bid and ask price of respective exchange rates on the date of the transaction.
The Funds do not isolate that portion of the results of operations resulting from changes in foreign exchange rates on investments from the fluctuations arising from changes in market prices of securities held. Such fluctuations are included with the net realized and unrealized gain or loss from investments.
Foreign exchange realized gain or loss resulting from holding of a foreign currency, expiration of a currency exchange contract, difference in exchange rates between the trade date and settlement date of an investment purchased or sold, and the difference between dividends actually received compared to the amount shown in a Fund's accounting records on the date of receipt, if any, are included as net realized gains or losses on foreign currency transactions in the Funds' Statement of Operations.
Foreign exchange unrealized gain or loss on assets and liabilities, other than investments, if any, are included in the net change in unrealized appreciation (depreciation) on foreign currency translations in the Funds' Statement of Operations.
(d) Foreign Taxes
The Funds may be subject to foreign taxes (a portion of which may be reclaimable) on income, stock dividends, capital gains on investments or certain foreign currency transactions. All foreign taxes are recorded in accordance with the applicable foreign tax regulations and rates that exist in the foreign jurisdictions in which the Funds invest. These foreign taxes, if any, are paid by the Funds and reflected in their Statement of Operations as follows: foreign taxes withheld at source are presented as a reduction of income and foreign taxes on capital gains from sales of investments are included with the net realized gain (loss) on investments. Foreign taxes payable or deferred as of February 28, 2017, if any, are disclosed in the Funds' Statements of Assets and Liabilities.
The Funds may be subject to foreign taxes (a portion of which may be reclaimable) on income, stock dividends, capital gains on investments or certain foreign currency transactions. All foreign taxes are recorded in accordance with the applicable foreign tax regulations and rates that exist in the foreign jurisdictions in which the Funds invest. These foreign taxes, if any, are paid by the Funds and reflected in their Statement of Operations as follows: foreign taxes withheld at source are presented as a reduction of income and foreign taxes on capital gains from sales of investments are included with the net realized gain (loss) on investments. Foreign taxes payable or deferred as of February 28, 2017, if any, are disclosed in the Funds' Statements of Assets and Liabilities.
(e) Distributions
The Funds intend to pay substantially all of their net investment income to shareholders. Distribution frequency is as follows:
| Fund | Frequency |
| Guggenheim China All-Cap ETF | Annual |
| Guggenheim China Technology ETF | Annual |
| Guggenheim Solar ETF | Annual |
| Guggenheim S&P Global Water Index ETF | Annual |
| Guggenheim S&P High Income Infrastructure ETF | Quarterly |
| Guggenheim Total Return Bond ETF | Monthly |
| Guggenheim U.S. Large Cap Optimized Volatility ETF | Annual |
In addition, the Funds intend to distribute any capital gains to shareholders as capital gain dividends at least annually. The amount and timing of distributions are determined in accordance with federal income tax regulations, which may differ from GAAP.
(f) Securities Lending
Each Fund may lend portfolio securities to certain creditworthy borrowers, including the Funds' securities lending agent. The loans are collateralized at all times by cash and/or high grade debt obligations in an amount at least equal to 102% of the market value of domestic securities loaned and 105% of foreign securities loaned as determined at the close of business on the preceding business day. The cash collateral received is held in a separately managed account established for each respective Fund and maintained by the lending agent exclusively for the investment of
Each Fund may lend portfolio securities to certain creditworthy borrowers, including the Funds' securities lending agent. The loans are collateralized at all times by cash and/or high grade debt obligations in an amount at least equal to 102% of the market value of domestic securities loaned and 105% of foreign securities loaned as determined at the close of business on the preceding business day. The cash collateral received is held in a separately managed account established for each respective Fund and maintained by the lending agent exclusively for the investment of
| CLAYMORE EXCHANGE-TRADED FUND TRUST 2 SEMIANNUAL REPORT l 63 |
| NOTES TO FINANCIAL STATEMENTS (Unaudited) continued | February 28, 2017 |
securities lending cash collateral on behalf of each Fund. The separately managed accounts invest in short-term investments valued at amortized cost, which approximates market value. Each Fund receives compensation for lending securities from interest or dividends earned on the cash, cash equivalents or U.S. government securities held as collateral, net of fee rebates paid to the borrower plus reasonable administrative and custody fees paid to the lending agent. Such compensation is accrued daily and payable to the Fund monthly. The dividend and interest income earned on the securities loaned is accounted for in the same manner as other dividend and interest income. The borrower pays to the Funds an amount equal to any dividends or interest received on loaned securities. These payments from the borrower are not eligible for reduced tax rates as "qualified dividend income" under the Jobs and Growth Tax Reconciliation Act of 2003. The Funds retain all or a portion of the interest received on investments of cash collateral or receive a fee from the borrower. Lending portfolio securities could result in a loss or delay in recovering each Fund's securities if the borrower defaults. The securities lending income earned by the Funds is disclosed on the Statement of Operations.
| Gross Amounts Not Offset in the | ||||||||||
| Statement of Assets and Liabilities | ||||||||||
| Value of | ||||||||||
| Securities | Collateral | Net | ||||||||
| Fund | Loaned | Received* | Amount | |||||||
| Guggenheim China All-Cap ETF | $ | 763,171 | $ | (763,171 | ) | $ | — | |||
| Guggenheim China Technology ETF | 7,286,022 | (7,286,022 | ) | — | ||||||
| Guggenheim Solar ETF | 87,232,062 | (87,232,062 | ) | — | ||||||
| Guggenheim S&P Global Water Index ETF | 1,637,932 | (1,637,932 | ) | — | ||||||
| Guggenheim S&P High Income Infrastructure ETF | 3,271,161 | (3,271,161 | ) | �� | ||||||
| Guggenheim Total Return Bond ETF | 259,774 | (259,774 | ) | — | ||||||
| Guggenheim U.S. Large Cap Optimized Volatility ETF | 8,825 | (8,825 | ) | — | ||||||
| Securities Lending Collateral | ||||||||||
| Cash | ||||||||||
| Collateral | Non-Cash | Total | ||||||||
| Fund | Invested | Collateral | Collateral | |||||||
| Guggenheim China All-Cap ETF | $ | 380,091 | $ | 448,789 | $ | 828,880 | ||||
| Guggenheim China Technology ETF | 4,708,025 | 2,808,458 | 7,516,483 | |||||||
| Guggenheim Solar ETF | 81,258,749 | 15,171,866 | 96,430,615 | |||||||
| Guggenheim S&P Global Water Index ETF | 1,693,789 | — | 1,693,789 | |||||||
| Guggenheim S&P High Income Infrastructure ETF | 3,376,086 | — | 3,376,086 | |||||||
| Guggenheim Total Return Bond ETF | 88,811 | 178,103 | 266,914 | |||||||
| Guggenheim U.S. Large Cap Optimized Volatility ETF | 9,419 | — | 9,419 | |||||||
* Actual collateral received by the Fund is greater than the amount shown due to overcollateralization.
The following represents a breakdown of the collateral for the joint repurchase agreements at February 28, 2017:
| Counterparty and Terms of Agreement | Face Value | Repurchase Price | Collateral | Par Value | Fair Value | ||||||||||
| BNP Paribas Securities Corp. issued 02/28/17 | $ | 2,192 | $ | 2,192 | Various U.S. Government obligations and U.S. | $ | 5,557 | $ | 2,236 | ||||||
| at 0.49% due 03/01/17 | Government agency securities | ||||||||||||||
| BNP Paribas Securities Corp. issued 02/28/17 | 20,672 | 20,672 | Various U.S. Government obligations and U.S. | 21,008 | 21,086 | ||||||||||
| at 0.51% due 03/01/17 | Government agency securities | ||||||||||||||
| BNP Paribas Securities Corp. issued 02/28/17 | 21,189,107 | 21,189,107 | Various U.S. Government obligations and U.S. | 53,784,156 | 21,612,889 | ||||||||||
| at 0.53% due 03/01/17 | Government agency securities | ||||||||||||||
| Citigroup Global Markets, Inc. issued 02/28/17 | 2,192 | 2,192 | Various U.S. Government obligations and U.S. | 2,228 | 2,236 | ||||||||||
| at 0.49% due 03/01/17 | Government agency securities | ||||||||||||||
| Citigroup Global Markets, Inc. issued 02/28/17 | 785,796 | 785,796 | Various U.S. Government obligations and U.S. | 798,960 | 801,512 | ||||||||||
| at 0.51% due 03/01/17 | Government agency securities | ||||||||||||||
| Citigroup Global Markets, Inc. issued 02/28/17 | 6,123 | 6,123 | Various U.S. Government obligations and U.S. | 5,394 | 6,245 | ||||||||||
| at 0.53% due 03/01/17 | Government agency securities | ||||||||||||||
| Citigroup Global Markets, Inc. issued 02/28/17 | 20,533,402 | 20,533,402 | Various U.S. Government obligations and U.S. | 157,630,769 | 20,944,070 | ||||||||||
| at 0.54% due 03/01/17 | Government agency securities | ||||||||||||||
| HSBC Securities (USA), Inc. issued 02/28/17 | 20,672 | 20,672 | Various U.S. Government obligations and U.S. | 50,784 | 21,086 | ||||||||||
| at 0.51% due 03/01/17 | Government agency securities | ||||||||||||||
| J.P. Morgan Securities LLC issued 02/28/17 | 6,280,221 | 6,280,221 | Various U.S. Government obligations and U.S. | 5,742,392 | 6,405,853 | ||||||||||
| at 0.52% due 03/01/17 | Government agency securities | ||||||||||||||
| J.P. Morgan Securities LLC issued 02/28/17 | 651 | 651 | Various U.S. Government obligations and U.S. | 596 | 664 | ||||||||||
| at 0.55% due 03/01/17 | Government agency securities | ||||||||||||||
| Merrill Lynch, Pierce, Fenner & Smith, Inc. | 2,192 | 2,192 | Various U.S. Government obligations and U.S. | 4,832 | 2,236 | ||||||||||
| issued 02/28/17 at 0.49% due 03/01/17 | Government agency securities | ||||||||||||||
| Merrill Lynch, Pierce, Fenner & Smith, Inc. | 20,423,983 | 20,423,983 | Various U.S. Government obligations and U.S. | 20,207,271 | 20,832,463 | ||||||||||
| issued 02/28/17 at 0.52% due 03/01/17 | Government agency securities | ||||||||||||||
| Merrill Lynch, Pierce, Fenner & Smith, Inc. | 785,796 | 785,796 | Various U.S. Government obligations and U.S. | 1,732,348 | 801,512 | ||||||||||
| issued 02/28/17 at 0.53% due 03/01/17 | Government agency securities | ||||||||||||||
| Mizuho Securities (USA), Inc. issued 02/28/17 | 2,192 | 2,192 | Various U.S. Government obligations and U.S. | 2,263 | 2,236 | ||||||||||
| at 0.49% due 03/01/17 | Government agency securities | ||||||||||||||
| Mizuho Securities (USA), Inc. issued 02/28/17 | 20,672 | 20,672 | Various U.S. Government obligations and U.S. | 21,338 | 21,086 | ||||||||||
| at 0.52% due 03/01/17 | Government agency securities | ||||||||||||||
| Mizuho Securities (USA), Inc. issued 02/28/17 | 785,796 | 785,796 | Various U.S. Government obligations and U.S. | 811,090 | 801,512 | ||||||||||
| at 0.53% due 03/01/17 | Government agency securities | ||||||||||||||
| RBC Dominion Securities, Inc. issued 02/28/17 | 20,653,311 | 20,653,311 | Various U.S. Government obligations and U.S. | 45,981,488 | 21,066,379 | ||||||||||
| at 0.51% due 03/01/17 | Government agency securities | ||||||||||||||
| 64 l CLAYMORE EXCHANGE-TRADED FUND TRUST 2 SEMIANNUAL REPORT |
| NOTES TO FINANCIAL STATEMENTS (Unaudited) continued | February 28, 2017 |
(g) Indemnifications
Under the Trust's organizational documents, its Trustees and Officers are indemnified against certain liabilities arising out of the performance of their duties to the Trust. In addition, throughout the normal course of business, the Trust enters into contracts that contain a variety of representations and warranties which provide general indemnifications. The Trust's maximum exposure under these arrangements is unknown, as this would involve future claims that may be made against the Trust and/or its affiliates that have not yet occurred. However, based on experience, the Trust expects the risk of loss to be remote.
Under the Trust's organizational documents, its Trustees and Officers are indemnified against certain liabilities arising out of the performance of their duties to the Trust. In addition, throughout the normal course of business, the Trust enters into contracts that contain a variety of representations and warranties which provide general indemnifications. The Trust's maximum exposure under these arrangements is unknown, as this would involve future claims that may be made against the Trust and/or its affiliates that have not yet occurred. However, based on experience, the Trust expects the risk of loss to be remote.
Note 3 – Investment Advisory Agreement and Other Agreements:
Pursuant to an Investment Advisory Agreement (the "Agreement") between the Trust, on behalf of each Fund, GFIA or GPIM, the Investment Adviser manages the investment and reinvestment of each Fund's assets and administers the affairs of each Fund to the extent requested by the Board.
Pursuant to an Investment Advisory Agreement (the "Agreement") between the Trust, on behalf of each Fund, GFIA or GPIM, the Investment Adviser manages the investment and reinvestment of each Fund's assets and administers the affairs of each Fund to the extent requested by the Board.
Pursuant to the Agreement, each Fund listed in the following table pays the Investment Adviser an advisory fee. The advisory fee is payable on a monthly basis at the annual rate set forth below based on each Fund's average daily net assets:
| Investment | ||
| Fund | Advisor | Rate |
| Guggenheim Solar ETF | GFIA | 0.50% |
| Guggenheim S&P Global Water Index ETF | GFIA | 0.50% |
Pursuant to the Agreement, each Fund listed in the following table pays the Investment Adviser a unitary management fee for the services and facilities it provides. The unitary management fee is payable on a monthly basis at the annual rate set forth below based on each Fund's average daily net assets:
| Investment | ||
| Fund | Advisor | Rate |
| Guggenheim China All-Cap ETF | GFIA | 0.70% |
| Guggenheim China Technology ETF | GFIA | 0.70% |
| Guggenheim S&P High Income Infrastructure ETF | GFIA | 0.45% |
| Guggenheim Total Return Bond ETF | GPIM | 0.50% |
| Guggenheim U.S. Large Cap Optimized Volatility ETF | GFIA | 0.30% |
Out of the unitary management fee, the Investment Adviser pays substantially all the expenses of each Fund, including the cost of transfer agency, custody, fund administration, legal, audit and other services, except for the fee payments under the Agreement, distribution fees, if any, brokerage expenses, taxes, interest, litigation expenses and other extraordinary expenses.
On October 4, 2016, Rydex Fund Services, LLC ("RFS") was purchased by MUFG Investor Services and as of that date RFS ceased to be an affiliate of the Investment Adviser. In connection with its acquisition, RFS changed its name to MUFG Investor Services (US), LLC ("MUIS"). The change has no impact on the financial statements of the Funds.
MUIS acts as the Fund's administrator. The Bank of New York Mellon Corp. ("BNY") acts as the Funds' custodian, accounting agent, transfer agent and security lending agent. As custodian, BNY is responsible for the custody of the Funds' assets. As accounting agent, BNY is responsible for maintaining the books and records of the Funds. As transfer agent, BNY is responsible for performing transfer agency services for the Funds. As securities lending agent, BNY is responsible for executing the lending of portfolio securities to creditworthy borrowers. For providing administration, accounting and custody services, MUIS and BNY are entitled to receive a monthly fee equal to an annual percentage of the Fund's average daily net assets subject to certain minimum monthly fees and out of pocket expenses.
The Investment Adviser has contractually agreed to waive fees and/or pay Fund expenses to the extent necessary to prevent the operating expenses of Guggenheim Solar ETF and Guggenheim S&P Global Water Index ETF (excluding interest expense, a portion of the Fund's licensing fees, offering costs, brokerage commissions and other trading expenses, taxes and extraordinary expenses such as litigation and other expenses not incurred in the ordinary course of the Fund's business), from exceeding 0.65% of average net assets per year, at least until December 31, 2019.
For the period ended February 28, 2017, the Investment Adviser waived Advisory Fees as follows:
| Fund | Advisory Fees Waived | |||
| Guggenheim Solar ETF | $ | 87,297 | ||
| Guggenheim Total Return Bond ETF | 2,216 | |||
Amounts owed to each Fund from the Investment Adviser are shown in the Statement of Assets and Liabilities. This receivable is settled on a monthly basis.
Certain officers and trustees of the Trust may also be officers, directors and/or employees of the Investment Adviser. The Trust does not compensate its officers or trustees who are officers, directors and/or employees of the Investment Adviser.
Licensing Fee Agreements:
The Investment Adviser has entered into licensing agreements on behalf of certain Funds with the following Licensors:
| Fund | Licensor |
| Guggenheim China All-Cap ETF | AlphaShares, LLC |
| Guggenheim China Technology ETF | AlphaShares, LLC |
| Guggenheim Solar ETF | MAC Indexing LLC |
| Guggenheim S&P Global Water Index ETF | Standard & Poor's Financial Services LLC, |
| a division of McGraw-Hill Financial | |
| Guggenheim S&P High Income Infrastructure ETF | S&P Dow Jones Index Group |
| Guggenheim U.S. Large Cap Optimized Volatility ETF | Accretive Asset Management, LLC |
The Funds are not sponsored, endorsed, sold or promoted by the Licensors and the Licensors make no representation regarding the advisability of investing in shares of the Funds. Up to 5 basis points of licensing fees may be excluded from the expense cap for certain Funds without a unitary management fee.
Accretive Asset Management, LLC is affiliated with the Investment Adviser and Guggenheim Funds Distributors, LLC ("Distributor").
Note 4 – Fair Value Measurement:
In accordance with GAAP, fair value is defined as the price that the Funds would receive to sell an investment or pay to transfer a liability in an
| CLAYMORE EXCHANGE-TRADED FUND TRUST 2 SEMIANNUAL REPORT l 65 |
| NOTES TO FINANCIAL STATEMENTS (Unaudited) continued | February 28, 2017 |
orderly transaction with an independent buyer in the principal market, or in the absence of a principal market, the most advantageous market for the investment or liability. GAAP establishes a three-tier fair value hierarchy based on the types of inputs used to value assets and liabilities and requires corresponding disclosure. The hierarchy and the corresponding inputs are summarized below:
Level 1 — quoted prices in active markets for identical assets or liabilities.
Level 2 — significant other observable inputs (for example quoted prices for securities that are similar based on characteristics such as interest rates, prepayment speeds, credit risk, etc.).
Level 3— significant unobservable inputs based on the best information available under the circumstances, to the extent observable inputs are not available, which may include assumptions.
The types of inputs available depend on a variety of factors, such as the type of security and the characteristics of the markets in which it trades, if any. Fair valuation determinations that rely on fewer or no observable inputs require greater judgment. Accordingly, fair value determinations for Level 3 securities require the greatest amount of judgment.
Independent pricing services are used to value a majority of the Funds' investments. When values are not available from a pricing service, they will be determined under the valuation policies that have been reviewed and approved by the Board. In any event, values are determined using a variety of sources and techniques, including: market prices; broker quotes; and models which derive prices based on inputs such as prices of securities with comparable maturities and characteristics or based on inputs such as anticipated cash flows or collateral spread over Treasuries, and other information and analysis.
The inputs or methodologies used for valuing securities are not necessarily an indication of the risk associated with investing in those securities. The suitability of the techniques and sources employed to determine fair valuation are regularly monitored and subject to change.
Note 5 – Federal Income Taxes:
The Funds intend to comply with the requirements of Subchapter M of the Internal Revenue Code of 1986, as amended (the "Internal Revenue Code"), applicable to regulated investment companies. Accordingly, no provision for U.S. federal income taxes is required. In addition, by distributing substantially all of its ordinary income and long-term capital gains, if any, during each calendar year, each Fund intends not to be subject to U.S. federal excise tax.
The Funds intend to comply with the requirements of Subchapter M of the Internal Revenue Code of 1986, as amended (the "Internal Revenue Code"), applicable to regulated investment companies. Accordingly, no provision for U.S. federal income taxes is required. In addition, by distributing substantially all of its ordinary income and long-term capital gains, if any, during each calendar year, each Fund intends not to be subject to U.S. federal excise tax.
As of February 28, 2017, the cost of investments and accumulated unrealized appreciation/depreciation on investments, excluding foreign currency, for federal income tax purposes were as follows:
| Net Tax | |||||||||||||
| Unrealized | |||||||||||||
| Cost of | Gross Tax | Gross Tax | Appreciation | ||||||||||
| Investments for | Unrealized | Unrealized | (Depreciation) on | ||||||||||
| Fund | Tax Purposes | Appreciation | (Depreciation | ) | Investments | ||||||||
| Guggenheim China All-Cap ETF | $ | 22,146,153 | $ | 3,610,963 | $ | (3,666,487 | ) | $ | (55,524 | ) | |||
| Guggenheim China Technology ETF | 63,664,492 | 10,528,156 | (11,310,918 | ) | (782,762 | ) | |||||||
| Guggenheim Solar ETF | 407,914,211 | 928,487 | (114,064,652 | ) | (113,136,165 | ) | |||||||
| Guggenheim S&P Global Water Index ETF | 390,632,746 | 114,284,039 | (22,354,035 | ) | 91,930,004 | ||||||||
| Guggenheim S&P High Income Infrastructure ETF | 30,886,703 | 1,136,265 | (609,461 | ) | 526,804 | ||||||||
| Guggenheim Total Return Bond ETF | 29,275,792 | 593,276 | (356,855 | ) | 236,421 | ||||||||
| Guggenheim U.S. Large Cap Optimized Volatility ETF | 2,693,855 | 157,915 | (82,894 | ) | 75,021 |
Tax components of accumulated earnings (deficit) as of August 31, 2016 (the most recent fiscal year end for federal income tax purposes), were as follows:
| Undistributed | Undistributed | Net Unrealized | |||||||||||
| Ordinary | Long-Term | Appreciation/ | Capital Loss | ||||||||||
| Fund | Income | Capital Gains | (Depreciation | ) | Carryforward | ||||||||
| Guggenheim China All-Cap ETF | $ | 371,596 | $ | — | $ | (874,469 | ) | $ | (10,265,278 | ) | |||
| Guggenheim China Technology ETF | 773,914 | — | (1,446,800 | ) | (16,142,295 | ) | |||||||
| Guggenheim Solar ETF | 5,669,490 | — | (153,060,830 | ) | (401,173,936 | ) | |||||||
| Guggenheim S&P Global Water Index ETF | 6,123,003 | — | 88,0967,309 | (99,724,502 | ) | ||||||||
| Guggenheim S&P High Income Infrastructure ETF | 45,422 | — | (68,568 | ) | — | ||||||||
| Guggenheim Total Return Bond ETF | 247,857 | — | 732,262 | — | |||||||||
| Guggenheim U.S. Large Cap Optimized Volatility ETF | 17,541 | — | 65,613 | (18,795 | ) |
Note: Capital Loss Carryforward amounts may be limited due to Federal income tax regulations.
| 66 l CLAYMORE EXCHANGE-TRADED FUND TRUST 2 SEMIANNUAL REPORT |
| NOTES TO FINANCIAL STATEMENTS (Unaudited) continued | February 28, 2017 |
Distributions to Shareholders:
The tax character of distributions paid during the year ended August 31, 2016 (the most recent fiscal year end for federal income tax purposes), was as follows:
| Distributions | |||||||||||||
| Distributions | Paid from | Distributions | |||||||||||
| Paid from | Long-Term | Paid from | Total | ||||||||||
| Fund | Ordinary Income | Capital Gains | Return of Capital | Distributions | |||||||||
| Guggenheim China All-Cap ETF | $ | 960,740 | $ | — | $ | — | $ | 960,740 | |||||
| Guggenheim China Technology ETF | 921,765 | — | — | 921,765 | |||||||||
| Guggenheim Solar ETF | 4,984,353 | — | — | 4,984,353 | |||||||||
| Guggenheim S&P Global Water Index ETF | 5,868,264 | — | — | 5,868,264 | |||||||||
| Guggenheim S&P High Income Infrastructure ETF | 136,030 | — | — | 136,030 | |||||||||
| Guggenheim Total Return Bond ETF | 220,025 | — | — | 220,025 | |||||||||
| Guggenheim U.S. Large Cap Optimized Volatility ETF | — | — | — | — |
For Federal income tax purposes, the Funds have capital loss carryforwards available as shown in the table below, to the extent provided by the regulations, to offset future capital gains through the years indicated. To the extent that these loss carryforwards are used to offset future capital gains, it is probable that the capital gains so offset will not be distributed to shareholders. Per the Regulated Investment Company Modernization Act of 2010, capital loss carryforwards generated in taxable years beginning after December 22, 2010 must be fully used before capital loss carryforwards generated in taxable years prior to December 22, 2010 are used; therefore, under certain circumstances, capital loss carryforwards available as of the report date, if any, may expire unused. As of August 31, 2016 (the most recent fiscal year end for federal income tax purposes), capital loss carryforwards for the Funds were as follows:
| Unlimited | Unlimited | Total | |||||||||||||||||
| Capital Loss | Capital Loss | Capital Loss | Short-Term | Long-Term | Capital Loss | ||||||||||||||
| Fund | Expiring in 2017 | Expiring in 2018 | Expiring in 2019 | Capital Loss | Capital Loss | Carryforward | |||||||||||||
| Guggenheim China All-Cap ETF | $ | — | $ | (29,627 | ) | $ | (853,049 | ) | $ | (1,515,767 | ) | $ | (7,866,835 | ) | $ | (10,265,278 | ) | ||
| Guggenheim China Technology ETF | — | — | (188,097 | ) | (6,946,816 | ) | (9,007,382 | ) | (16,142,295 | ) | |||||||||
| Guggenheim Solar ETF | (6,030,482 | ) | (118,836,026 | ) | (21,764,929 | ) | (71,187,262 | ) | (183,355,237 | ) | (401,173,936 | ) | |||||||
| Guggenheim S&P Global Water Index ETF | (31,879,617 | ) | (38,476,281 | ) | (16,548,141 | ) | (1,163,511 | ) | (11,656,952 | ) | (99,724,502 | ) | |||||||
| Guggenheim S&P High Income Infrastructure ETF | — | — | — | — | — | — | |||||||||||||
| Guggenheim Total Return Bond ETF | — | — | — | — | — | — | |||||||||||||
| Guggenheim U.S. Large Cap Optimized Volatility ETF | — | — | — | (18,795 | ) | — | (19,795 | ) | |||||||||||
Tax basis capital losses in excess of capital gains are carried forward to offset future net capital gains.
For the year ended August 31, 2016 (the most recent fiscal year end for federal income tax purposes), the following capital loss carryforward amounts were expired or used:
| Fund | Amount | |||
| Guggenheim S&P Global Water Index ETF | $ | 30,357 | ||
| Guggenheim S&P High Income Infrastructure ETF | 20,789 |
For all open tax years and all major jurisdictions, management of the Trust has concluded that there are no significant uncertain tax positions that would require recognition in the financial statements. Uncertain tax positions are tax positions taken or expected to be taken in the course of preparing each Fund's tax returns that would not meet a more-likely-than-not threshold of being sustained by the applicable tax authority and would be recorded as a tax expense in the current year. Open tax years are those that are open for examination by taxing authorities (i.e. generally the last four tax year ends and the interim tax period since then). Furthermore, management of the Trust is also not aware of any tax positions for which it is reasonably possible that the total amounts of unrecognized tax benefits will significantly change in the next twelve months.
Note 6 – Investments in Securities:
For the period ended February 28, 2017, the cost of investments purchased and proceeds from sales of investments, excluding short-term investments and in-kind transactions, were as follows:
| Fund | Purchases | Sales | |||||
| Guggenheim China All-Cap ETF | $ | 1,663,087 | $ | 1,942,596 | |||
| Guggenheim China Technology ETF | 5,157,881 | 5,804,756 | |||||
| Guggenheim Solar ETF | 51,649,422 | 56,314,550 | |||||
| Guggenheim S&P Global Water Index ETF | 21,025,796 | 25,801,527 | |||||
| Guggenheim S&P High Income Infrastructure ETF | 6,516,320 | 6,388,286 | |||||
| Guggenheim Total Return Bond ETF | 38,952,209 | 31,208,102 | |||||
| Guggenheim U.S. Large Cap Optimized | |||||||
| Volatility ETF | 1,521,215 | 1,911,722 |
| CLAYMORE EXCHANGE-TRADED FUND TRUST 2 SEMIANNUAL REPORT l 67 |
| NOTES TO FINANCIAL STATEMENTS (Unaudited) continued | February 28, 2017 |
For the period ended February 28, 2017, in-kind transactions were as follows:
| Fund | Purchases | Sales | ||||||
| Guggenheim China All-Cap ETF | $ | 439 | $ | 2,567,111 | ||||
| Guggenheim China Technology ETF | 22,363,729 | 9,063,270 | ||||||
| Guggenheim Solar ETF | 50,545,626 | 43,833,717 | ||||||
| Guggenheim S&P Global Water Index ETF | 52,713,356 | 2,329,029 | ||||||
| Guggenheim S&P High Income Infrastructure ETF | 25,576,698 | 2,734,245 | ||||||
| Guggenheim Total Return Bond ETF | 76,883,097 | 45,852,598 | ||||||
| Guggenheim U.S. Large Cap Optimized | ||||||||
| Volatility ETF | 2,590,923 | 2,173,439 | ||||||
The Funds are permitted to purchase or sell securities from or to certain affiliated funds under specified conditions outlined in procedures adopted by the Board. The procedures have been designed to ensure that any purchase or sale of securities by a Fund from or to another fund or portfolio that is or could be considered an affiliate by virtue of having a common investment adviser (or affiliated investment advisers), common trustees and/or common officers complies with Rule 17a-7 of the 1940 Act. Further, as defined under these procedures, each transaction is effected at the current market price to minimize trading costs, where permissible. For the period ended February 28, 2017, the Funds engaged in purchases and sales of securities, pursuant to Rule 17a-7 of the 1940 Act, as follows:
| Realized | ||||||||||||
| Purchases | Sales | Gain (Loss) | ||||||||||
| Guggenheim Total Return Bond ETF | $ | 206,758 | $ | – | $ | 206,758 | ||||||
Note 7 – Capital:
Shares are issued and redeemed by the Funds only in creation unit size aggregations of 50,000 to 100,000 shares. Transactions are permitted on an in-kind basis, with a separate cash payment, which is balancing each component to equate the transaction to the net asset value per share of the Fund on the transaction date. Transaction fees ranging from $500 to $3,000 are charged to those persons creating or redeeming creation units. An additional charge on the transaction may be imposed with respect to transactions effected outside of the clearing process or to the extent that cash is used in lieu of securities to purchase creation units or redeem for cash.
Note 8 – Distribution and Service Plan:
The Board has adopted a distribution and service plan (the "Plan") pursuant to Rule 12b-1 under the 1940 Act. Under the Plan, each Fund is authorized to pay distribution fees in connection with the sale and distribution of its shares and pay service fees in connection with the provision of ongoing services to shareholders and the maintenance of shareholder accounts in an amount up to 0.25% of its average daily net assets each year. No 12b-1 fees are currently paid by the Funds, and there are no current plans to impose these fees. No such fee may be paid in the future without further approval by the Board.
Note 9 – Repurchase Agreements:
Each of the Funds may engage in repurchase agreements. Repurchase agreements are fixed income securities in the form of agreements backed by collateral. These agreements typically involve the acquisition by the Fund of securities from the selling institution coupled with the agreement that the selling institution will repurchase the underlying securities at a specified price and at a fixed time in the future. The Fund may accept a wide variety of underlying securities as collateral for the repurchase agreements entered into by the Fund. Any such securities serving as collateral are marked-to-market daily in order to maintain full collateralization. Securities purchased under repurchase agreements are reflected as an asset on the Statements of Assets and Liabilities. Interest earned is recorded as a component of interest income on the Statements of Operations.
The use of repurchase agreements involves certain risks. For example, if the selling institution defaults on its obligation to repurchase the underlying securities at a time when the value of securities has declined, the Fund may incur a loss upon disposition of them. In the event of an insolvency or bankruptcy by the selling institution, the Funds right to control the collateral could be affected and result in certain costs and delays. In addition the Fund could incur a loss if the value of the underlying collateral falls below the agreed upon repurchase price.
The use of repurchase agreements involves certain risks. For example, if the selling institution defaults on its obligation to repurchase the underlying securities at a time when the value of securities has declined, the Fund may incur a loss upon disposition of them. In the event of an insolvency or bankruptcy by the selling institution, the Funds right to control the collateral could be affected and result in certain costs and delays. In addition the Fund could incur a loss if the value of the underlying collateral falls below the agreed upon repurchase price.
As of February 28, 2017, the repurchase agreements held in Guggenheim Total Return Bond ETF in the joint account were as follows:
| Counterparty | |||||||||||||||||
| and Terms of | Repurchase | ||||||||||||||||
| Agreement | Face Value | Price | Collateral | Par Value | Fair Value | ||||||||||||
| Jefferies & | $ | 1,400,000 | $ | 1,403,010 | Neuberger | $ | 3,474,395 | $ | 2,153,847 | ||||||||
| Company, Inc., | Berman CLO | ||||||||||||||||
| 3.87% due | Ltd., 8.79%, | ||||||||||||||||
| 3/16/2017 | 07/15/2027 | ||||||||||||||||
Note 10 – Derivatives:
Derivatives are instruments whose values depend on, or are derived from, in whole or in part, the value of one or more other assets, such as securities, currencies, commodities or indices. Derivative instruments may be used to increase investment flexibility (including to maintain cash reserves while maintaining exposure to certain other assets), for risk management (hedging) purposes, to facilitate trading, to reduce transaction costs and to pursue higher investment returns. Derivative instruments may also be used to mitigate certain investment risks, such as foreign currency exchange rate risk, interest rate risk and credit risk. GAAP requires disclosures to enable investors to better understand how and why a Fund uses derivative instruments, how these derivative instruments are accounted for and their effects on the Fund's financial position and results of operations.
The Guggenheim Total Return Bond ETF utilized derivatives for the following purposes:
Hedge – an investment made in order to seek to reduce the risk of adverse price movements in a security, by taking an offsetting position to protect against broad market moves.
Duration – the use of an instrument to manage the interest rate risk of a portfolio.
Swap agreements are contracts between parties in which one party agrees to make periodic payments to the other party (the "Counterparty") based on the change in market value or level of a specified rate, index or asset. In return, the Counterparty agrees to make periodic payments to the first
| 68 l CLAYMORE EXCHANGE-TRADED FUND TRUST 2 SEMIANNUAL REPORT |
| NOTES TO FINANCIAL STATEMENTS (Unaudited) continued | February 28, 2017 |
party based on the return of a different specified rate, index or asset. Swap agreements will usually be done on a net basis, the Fund receiving or paying only the net amount of the two payments. The net amount of the excess, if any, of the Fund's obligations over its entitlements with respect to each swap is accrued on a daily basis and an amount of cash or liquid securities having an aggregate value at least equal to the accrued excess is maintained in an account at the Fund's custodian bank.
The Fund may enter into swap agreements to manage its exposure to interest rates and/or credit risk, to generate income or to manage duration. Interest rate swap agreements involve the exchange by the Fund with another party of their respective commitments to pay or receive interest. During the period that the swap agreement is open, the Fund may be subject to risk from the potential inability of the counterparty to meet the terms of the agreement. The swaps involve elements of both market and credit risk in excess of the amounts reflected on the Statement of Assets and Liabilities.
As of February 28, 2017, details of the swap agreements outstanding in Guggenheim Total Return Bond ETF, were as follows:
| Unrealized | |||||||||||||||
| Termination | Notional | Receive | Appreciation | ||||||||||||
| Broker | Exchange | Date | Amount ($000) | Fixed Rate | Floating Rate | (Depreciation) | |||||||||
| Merrill Lynch | CME | 8/10/2023 | $ | 500,000 | 1.3355 | % | 3 Month Libor | $ | 24,460 | ||||||
| Merrill Lynch | CME | 9/2/2025 | 1,383,000 | 1.4090 | % | 3 Month Libor | 94,820 | ||||||||
| Merrill Lynch | CME | 2/13/2027 | 820,000 | 2.3500 | % | 3 Month Libor | 525 | ||||||||
| Merrill Lynch | CME | 2/13/2024 | 950,000 | 2.1587 | % | 3 Month Libor | 1,090 | ||||||||
| $ | 120,895 | ||||||||||||||
The average notional value of swaps outstanding on a quarterly basis was $2,901,500.
Summary of Derivatives Information
The following table presents the types of derivatives in the Guggenheim Total Return Bond ETF by location as presented on the Statement of Assets Liabilities as of February 28, 2017.
| Statement of Assets and Liabilities | ||||||||
| Presentation of Fair Values of Derivative Instruments: | ||||||||
| Asset Derivatives | Liability Derivatives | |||||||
| Statement of Assets and | Fair Value | Statement of Assets and | Fair Value | |||||
| Primary Risk Exposure | Liabilities Location | Liabilities Location | ||||||
| Interest Rate Risk | Variation margin on | $ | 120,895* | Variation margin on | $ | – | ||
| swap agreements | swap agreements | |||||||
| Total | $ | 120,895* | $ | – | ||||
| * | Includes cumulative appreciation (depreciation) of swap agreements as reported in Note 10. Only current day's variation margin is reported within the Statement of Assets and Liabilities. |
The following table presents the effect of derivatives instruments on the Statement of Operations for the period ended February 28, 2017.
| Effect of Derivative Instruments on the Statement of Operations: | ||||||||
| Amount of Net Realized Gain (Loss) on Derivatives | ||||||||
| Swap | ||||||||
| Primary Risk Exposure | Agreements | Total | ||||||
| Interest Rate Risk | $ | 19,728 | $ | 19,728 | ||||
| Total | $ | 19,728 | $ | 19,728 | ||||
| Net Change in Unrealized Appreciation (Depreciation) on Derivatives | ||||||||
| Swap | ||||||||
| Primary Risk Exposure | Agreements | Total | ||||||
| Interest Rate Risk | $ | 120,008 | $ | 120,008 | ||||
| Total | $ | 120,008 | $ | 120,008 | ||||
| CLAYMORE EXCHANGE-TRADED FUND TRUST 2 SEMIANNUAL REPORT l 69 |
| NOTES TO FINANCIAL STATEMENTS (Unaudited) continued | February 28, 2017 |
Note 11 – Affiliated Transactions:
The Guggenheim Total Return Bond Fund ETF had the following transactions with affiliated funds during the period ended February 28, 2017.
| Share Activity | For the Period Ended February 28, 2017 | |||||||||||||||||||||||
| Dividends and | ||||||||||||||||||||||||
| Balance | Balance | Capital Gains | ||||||||||||||||||||||
| Security Name | 8/31/2016 | Purchases | Sales | 2/28/2017 | Value | Distributions Received | ||||||||||||||||||
| Guggenheim Strategic Opportunities Fund | 10,851 | 7,650 | – | 18,501 | $ | 382,971 | $ | 17,428 | ||||||||||||||||
| Guggenheim Enhanced Short Duration | ||||||||||||||||||||||||
| Bond ETF | – | 49,788 | $ | 35,850 | 13,938 | 699,827 | 6,894 | |||||||||||||||||
| Guggenheim BulletShares 2023 Corporate | ||||||||||||||||||||||||
| Bond ETF | – | 18,889 | 18,889 | – | – | 2,127 | ||||||||||||||||||
| $ | 1,082,798 | $ | 26,449 | |||||||||||||||||||||
Affiliated funds accounted for $11,920 of the net realized loss on investments and $32,796 of the change in net unrealized appreciation on investments during the period.
Note 12 – Restricted Securities
As of February 28, 2017, the securities below held in the Guggenheim Total Return Bond Fund ETF are considered illiquid under guidelines established by the Board:
| Restricted Securities | Acquisition Date | Cost | Value | ||||||
| AMC East Communities LLC, 6.01% due 01/15/53 | 7/28/16 | $ | 215,917 | $ | 195,321 | ||||
| Fort Benning Family Communities LLC, 5.81% due 01/15/51 | 5/26/16 | 189,000 | 187,390 | ||||||
| Fort Knox Military Housing Privatization Project, 1.11% due 02/15/52 | 2/8/17 | 127,900 | 143,618 | ||||||
| HP Communities LLC, 5.78% due 03/15/46 | 8/23/16 | 178,278 | 161,435 | ||||||
| HP Communities LLC, 5.86% due 09/15/53 | 10/6/16 | 113,875 | 106,587 | ||||||
| $ | 824,970 | $ | 794,351 | ||||||
Note 13 – Subsequent Event:
The Funds evaluated subsequent events through the date the financial statements were available for issue and determined there were no additional material events that would require disclosure in the Funds' financial statements.
| 70 l CLAYMORE EXCHANGE-TRADED FUND TRUST 2 SEMIANNUAL REPORT |
| SUPPLEMENTAL INFORMATION (Unaudited) | February 28, 2017 |
Federal Income Tax Information
In January 2018, shareholders will be advised on IRS Form 1099 DIV or substitute 1099 DIV as to the federal tax status of the distributions received by shareholders in the calendar year 2017.
In January 2018, shareholders will be advised on IRS Form 1099 DIV or substitute 1099 DIV as to the federal tax status of the distributions received by shareholders in the calendar year 2017.
Sector Classification
Information in the "Schedule of Investments" is categorized by sectors using sector-level classifications used by Bloomberg Industry Classification System, a widely recognized industry classification system provider. In the Fund's registration statement, the Funds have investment policies relating to concentration in specific industries. For purposes of these investment policies, the Funds usually classify industries based on industry-level classifications used by widely recognized industry classification system providers such as Bloomberg Industry Classification System, Global Industry Classification Standards and Barclays Global Classification Scheme.
Information in the "Schedule of Investments" is categorized by sectors using sector-level classifications used by Bloomberg Industry Classification System, a widely recognized industry classification system provider. In the Fund's registration statement, the Funds have investment policies relating to concentration in specific industries. For purposes of these investment policies, the Funds usually classify industries based on industry-level classifications used by widely recognized industry classification system providers such as Bloomberg Industry Classification System, Global Industry Classification Standards and Barclays Global Classification Scheme.
Trustees
The Statement of Additional Information that includes additional information about the Trustees is also available, without charge, upon request via our website at guggenheiminvestments.com or by calling (800) 345-7999.
The Statement of Additional Information that includes additional information about the Trustees is also available, without charge, upon request via our website at guggenheiminvestments.com or by calling (800) 345-7999.
The Trustees of the Trust and their principal business occupations during the past five years:
| Term of | Number of | |||||||||
| Position(s) | Office and | Portfolios in | ||||||||
| Name, Address* | Held | Length of | Principal Occupation(s) | Fund Complex | Other Directorships | |||||
| and Year of Birth | with Trust | Time Served** | During Past Five Years | Overseen | Held by Trustee | |||||
| Independent Trustees: | ||||||||||
Randall C. Barnes (1951) | Trustee | Since 2006 | Current: Private Investor (2001-present). Former: Senior Vice President and Treasurer, PepsiCo, Inc. (1993-1997); President, Pizza Hut International (1991-1993); Senior Vice President, Strategic Planning and New Business Development, PepsiCo, Inc. (1987-1990). | 96 | Current: Trustee, Purpose Investments Funds (2014-present). | |||||
Donald A. Chubb, Jr. (1946 ) | Trustee | Since 2014 | Current: Business broker and manager of commercial real estate, Griffith & Blair, Inc. (1997-present). | 93 | Current: Midland Care, Inc. (2011-present). | |||||
Jerry B. Farley (1946) | Trustee | Since 2014 | Current: President, Washburn University (1997-present). | 93 | Current: Westar Energy, Inc. (2004-present); Core First Bank & Trust (2000-present). | |||||
Roman Friedrich III (1946) | Trustee and Chairman of the Contracts Review Committee | Since 2010 | Current: Founder and Managing Partner, Roman Friedrich & Company (1998-present). Former: Senior Managing Director, MLV & Co. LLC (2010-2011). | 93 | Current: Zincore Metals, Inc. (2009-present). Former: Axiom Gold and Silver Corp. (2011-2012). | |||||
Robert B. Karn III (1942) | Trustee and Chairman of the Audit Committee | Since 2010 | Current: Consultant (1998-present). Former: Arthur Andersen (1965-1997) and Managing Partner, Financial and Economic Consulting, St. Louis office (1987-1997). | 93 | Current: Peabody Energy Company (2003-present); GP Natural Resource Partners, LLC (2002- present). | |||||
Ronald A. Nyberg (1953) | Trustee and Chairman of the Nominating and Governance Committee | Since 2006 | Current: Partner, Momkus McCluskey Roberts, LLC (2016-present). Former: Partner, Nyberg & Cassioppi, LLC (2000-2016); Executive Vice President, General Counsel and Corporate Secretary, Van Kampen Investments (1982-1999). | 98 | Current: Edward-Elmhurst Healthcare System (2012-present). | |||||
Maynard F. Oliverius (1943) | Trustee | Since 2014 | Current: Retired. Former: President and CEO, Stormont-Vail HealthCare (1996-2012). | 93 | Current: Fort Hays State University Foundation (1999-present); Stormont-Vail Foundation (2013- present); University of Minnesota MHA Alumni Philanthropy Committee (2009-present). Former: Topeka Community Foundation (2009-2014). |
| CLAYMORE EXCHANGE-TRADED FUND TRUST 2 SEMIANNUAL REPORT l 71 |
| SUPPLEMENTAL INFORMATION (Unaudited) continued | February 28, 2017 |
| Term of | Number of | |||||||||
| Position(s) | Office and | Portfolios in | ||||||||
| Name, Address* | Held | Length of | Principal Occupation(s) | Fund Complex | Other Directorships | |||||
| and Year of Birth | with Trust | Time Served** | During Past Five Years | Overseen | Held by Trustee | |||||
| Independent Trustees (continued): | ||||||||||
Ronald E. Toupin, Jr. (1958) | Trustee and Chairman of the Board | Since 2006 | Current: Portfolio Consultant (2010-present). Former: Vice President, Manager and Portfolio Manager, Nuveen Asset Management (1998-1999); Vice President, Nuveen Investment Advisory Corp. (1992-1999); Vice President and Manager, Nuveen Unit Investment Trusts (1991-1999); and Assistant Vice President and Portfolio Manager, Nuveen Unit Investment Trusts (1988-1999), each of John Nuveen & Co., Inc. (1982-1999). | 95 | Former: Bennett Group of Funds (2011-2013). | |||||
| Interested Trustee: | ||||||||||
Donald C. Cacciapaglia*** (1951) | President, Chief Executive Officer and Trustee | Since 2012 | Current: President and CEO, certain other funds in the Fund Complex (2012-present); Vice Chairman, Guggenheim Investments (2010-present). Former: Chairman and CEO, Channel Capital Group, Inc. (2002-2010). | 228 | Current: Clear Spring Life Insurance Company (2015-present); Guggenheim Partners Japan, Ltd. (2014-present); Guggenheim Partners Investment Management Holdings, LLC (2014-present); Delaware Life (2013-present); Guggenheim Life and Annuity Company (2011-present); Paragon Life Insurance Company of Indiana (2011-present). |
| * | The business address of each Trustee is c/o Guggenheim Investments, 227 West Monroe Street, Chicago, IL 60606. |
| ** | Each Trustee serves an indefinite term, until his successor is elected and qualified. |
| *** | This Trustee is deemed to be an "interested person" of the Funds under the 1940 Act by reason of his position with the Funds' Investment Adviser and/or the parent of the Investment Adviser. |
| Officers |
| The Officers of the Trust, who are not trustees, and their principal occupations during the past five years: |
| Term of Office | ||||||
| Name, Address* | Position(s) held | and Length of | Principal Occupations | |||
| and Year of Birth | with the Trust | Time Served** | During Past Five Years | |||
| Officers: | ||||||
William H. Belden, III (1965) | Vice President | Since 2006 | Current: Vice President, certain other funds in the Fund Complex (2006-present); Managing Director, Guggenheim Funds Investment Advisors, LLC (2005-present). | |||
| Former: Vice President of Management, Northern Trust Global Investments (1999-2005). | ||||||
Joanna M. Catalucci (1966) | Chief Compliance Officer | Since 2012 | Current: Chief Compliance Officer, certain funds in the Fund Complex (2012-present); Senior Managing Director, Guggenheim Investments (2012-present); AML officer, certain funds in the Fund Complex (2016-present). | |||
| Former: Chief Compliance Officer and Secretary, certain other funds in the Fund Complex (2008-2012); Senior Vice President & Chief Compliance Officer, Security Investors, LLC and certain affiliates (2010-2012); Chief Compliance Officer and Senior Vice President, Rydex Advisors, LLC and certain affiliates (2010-2011). | ||||||
James M. Howley (1972) | Assistant Treasurer | Since 2006 | Current: Director, Guggenheim Investments (2004-present); Assistant Treasurer, certain other funds in the Fund Complex (2006-present). | |||
| Former: Manager of Mutual Fund Administration, Van Kampen Investments, Inc. (1996-2004). |
| 72 l CLAYMORE EXCHANGE-TRADED FUND TRUST 2 SEMIANNUAL REPORT |
| SUPPLEMENTAL INFORMATION (Unaudited) continued | February 28, 2017 |
| Term of Office | ||||||
| Name, Address* | Position(s) held | and Length of | Principal Occupations | |||
| and Year of Birth | with the Trust | Time Served** | During Past Five Years | |||
| Officers continued: | ||||||
Keith Kemp (1960) | Assistant Treasurer | Since 2016 | Current: Treasurer and Assistant Treasurer, certain other funds in the Fund Complex (2010-present); Managing Director, Guggenheim Partners (1960) Treasurer Investment Management, LLC (2015-present); Chief Financial Officer, Guggenheim Specialized Products, LLC (2016-present). Former: Managing Director and Director, Transparent Value, LLC (2010-2016); Director, Guggenheim Investments (2010-2015); Chief Operating Officer, Macquarie Capital Investment Management (2007-2009). | |||
Amy J. Lee (1961) | Chief Legal Officer | Since 2013 | Current: Chief Legal Officer, certain other funds in the Fund Complex (2013-present); Senior Managing Director, Guggenheim Investments (2012-present). Former: Vice President, Associate General Counsel and Assistant Secretary, Security Benefit Life Insurance Company and Security Benefit Corporation (2004-2012). | |||
Mark E. Mathiasen (1978) | Secretary | Since 2011 | Current: Secretary, certain other funds in the Fund Complex (2007-present); Managing Director, Guggenheim Investments (2007-present). | |||
Glenn McWhinnie (1969) | Assistant Treasurer | Since 2016 | Current: Vice President, Guggenheim Investments (2009-present). Former: Tax Compliance Manager, Ernst & Young LLP (1996-2009). | |||
Michael P. Megaris (1984) | Assistant Secretary | Since 2014 | Current: Assistant Secretary, certain other funds in the Fund Complex (2014-present); Vice President, Guggenheim Investments (2012-present). Former: J.D., University of Kansas School of Law (2009-2012). | |||
Adam J. Nelson (1979) | Assistant Treasurer | Since 2015 | Current: Vice President, Guggenheim Investments (2015-present); Assistant Treasurer, certain other funds in the Fund Complex (2015-present). Former: Assistant Vice President and Fund Administration Director, State Street Corporation (2013-2015); Fund Administration Assistant Director, State Street (2011-2013); Fund Administration Manager, State Street (2009-2011). | |||
Kimberly J. Scott (1974) | Assistant Treasurer | Since 2012 | Current: Vice President, Guggenheim Investments (2012-present); Assistant Treasurer, certain other funds in the Fund Complex (2012-present). Former: Financial Reporting Manager, Invesco, Ltd. (2010-2011); Vice President/Assistant Treasurer of Mutual Fund Administration, Van Kampen Investments, Inc./Morgan Stanley Investment Management (2009-2010); Manager of Mutual Fund Administration, Van Kampen Investments, Inc./Morgan Stanley Investment Management (2005-2009). | |||
Bryan Stone (1979) | Vice President | Since 2014 | Current: Vice President, certain other funds in the Fund Complex (2014-present); Director, Guggenheim Investments (2013-present). Former: Senior Vice President, Neuberger Berman Group LLC (2009-2013); Vice President, Morgan Stanley (2002-2009). | |||
John L. Sullivan (1955) | Chief Financial Officer, Chief Accounting Officer and Treasurer | Since 2010 | Current: CFO, Chief Accounting Officer and Treasurer, certain other funds in the Fund Complex (2010-present); Senior Managing Director, Guggenheim Investments (2010-present). Former: Managing Director and CCO, each of the funds in the Van Kampen Investments fund complex (2004-2010); Managing Director and Head of Fund Accounting and Administration, Morgan Stanley Investment Management (2002-2004); CFO and Treasurer, Van Kampen Funds (1996-2004). |
| * | The business address of each officer is c/o Guggenheim Investments, 227 West Monroe Street, Chicago, IL 60606. |
| ** | Each officer serves an indefinite term, until his or her successor is duly elected and qualified. The date reflects the commencement date upon which the officer held any officer position with the Trust. |
| CLAYMORE EXCHANGE-TRADED FUND TRUST 2 SEMIANNUAL REPORT l 73 |
| TRUST INFORMATION | February 28, 2017 |
Board of Trustees Randall C. Barnes Donald C. Cacciapaglia* Donald A. Chubb, Jr. Jerry B. Farley Roman Friedrich III Robert B. Karn III Ronald A. Nyberg Maynard F. Oliverius Ronald E. Toupin, Jr., Chairman | Principal Executive Officers Donald C. Cacciapaglia President and Chief Executive Officer Joanna M. Catalucci Chief Compliance Officer Amy J. Lee Chief Legal Officer Mark E. Mathiasen Secretary John L. Sullivan Chief Financial Officer, Chief Accounting Officer and Treasurer | Investment Adviser Guggenheim Funds Investment Advisors, LLC Chicago, IL Investment Adviser (for Guggenheim Total Return Bond ETF) Guggenheim Partners Investment Management, LLC Santa Monica, CA Distributor Guggenheim Funds Distributors, LLC Chicago, IL Administrator MUFG Investor Services (US), LLC Rockville, MD | Accounting Agent, Custodian and Transfer Agent The Bank of New York Mellon Corp. New York, NY Legal Counsel Dechert LLP New York, NY Independent Registered Public Accounting Firm Ernst & Young LLP Chicago, IL | ||
| * | Trustee is an "interested person" (as defined in section 2(a)(19) of the 1940 Act) ("Interested Trustee") of the Trust because of his position as the President and CEO of the Investment Adviser and the Distributor. | ||||
Privacy Principles of the Trust for Shareholders
The Funds are committed to maintaining the privacy of their shareholders and to safeguarding their non-public personal information. The following information is provided to help you understand what personal information the Funds collect, how we protect that information and why, in certain cases, we may share information with select other parties.
The Funds are committed to maintaining the privacy of their shareholders and to safeguarding their non-public personal information. The following information is provided to help you understand what personal information the Funds collect, how we protect that information and why, in certain cases, we may share information with select other parties.
Generally, the Funds do not receive any non-public personal information relating to their shareholders, although certain non-public personal information of their shareholders may become available to the Funds. The Funds do not disclose any non-public personal information about their shareholders or former shareholders to anyone, except as permitted by law or as is necessary in order to service shareholder accounts (for example, to a transfer agent or third party administrator).
The Funds restrict access to non-public personal information about the shareholders to Guggenheim Funds Investment Advisors, LLC employees with a legitimate business need for the information. The Funds maintain physical, electronic and procedural safeguards designed to protect the non-public personal information of their shareholders.
Questions concerning your shares of the Trust?
• If your shares are held in a Brokerage Account, contact your Broker.
• If your shares are held in a Brokerage Account, contact your Broker.
This report is sent to shareholders of the Funds for their information. It is not a Prospectus, circular or representation intended for use in the purchase or sale of shares of the Funds or of any securities mentioned in this report.
A description of the Funds' proxy voting policies and procedures related to portfolio securities is available without charge, upon request, by calling the Funds at (800)345-7999.
Information regarding how the Funds voted proxies for portfolio securities, if applicable, during the most recent 12-month period ended June 30, is also available, without charge and upon request by calling (800) 345-7999, by visiting Guggenheim Investments' website at guggenheiminvestments.com or by accessing the Funds' Form N-PX on the U.S. Securities and Exchange Commission's ("SEC") website at www.sec.gov.
The Funds file their complete schedule of portfolio holdings with the SEC for the first and third quarters of each fiscal year on Form N-Q. The Funds' Form N-Q is available on the SEC website at www.sec.gov or by visiting Guggenheim Investments' website at guggenheiminvestments.com. The Funds' Form N-Q may also be viewed and copied at the SEC's Public Reference Room in Washington, DC; information on the operation of the Public Reference Room may be obtained by calling (800) SEC-0330.
| 74 l CLAYMORE EXCHANGE-TRADED FUND TRUST 2 SEMIANNUAL REPORT |
This Page Intentionally Left Blank.
| ABOUT THE TRUST ADVISER |
Guggenheim Funds Investment Advisors, LLC
Guggenheim Funds Investment Advisors, LLC (the "Investment Adviser") manages the investment and reinvestment of certain Funds' assets and administers the affairs of such Funds to the extent requested by the Board of Trustees. The Investment Adviser also acts as investment adviser to closed-end and open-end management investment companies. The Investment Adviser and its affiliates provide supervision, management or servicing of assets with a commitment to consistently delivering exceptional service. The Investment Adviser is a subsidiary of Guggenheim Partners, LLC, a global, diversified financial services firm with more than $260 billion in total assets as of December 31, 2016. Guggenheim Partners, LLC, through its affiliates, provides investment management, investment advisory, insurance, investment banking, and capital markets services. The firm is headquartered in Chicago and New York with a global network of offices throughout the United States, Europe, and Asia.
Guggenheim Funds Investment Advisors, LLC (the "Investment Adviser") manages the investment and reinvestment of certain Funds' assets and administers the affairs of such Funds to the extent requested by the Board of Trustees. The Investment Adviser also acts as investment adviser to closed-end and open-end management investment companies. The Investment Adviser and its affiliates provide supervision, management or servicing of assets with a commitment to consistently delivering exceptional service. The Investment Adviser is a subsidiary of Guggenheim Partners, LLC, a global, diversified financial services firm with more than $260 billion in total assets as of December 31, 2016. Guggenheim Partners, LLC, through its affiliates, provides investment management, investment advisory, insurance, investment banking, and capital markets services. The firm is headquartered in Chicago and New York with a global network of offices throughout the United States, Europe, and Asia.
Guggenheim Partners Investment Management, LLC
Guggenheim Partners Investment Management, LLC ("GPIM") is an indirect subsidiary of Guggenheim Partners, LLC, a diversified financial services firm. The firm provides capital markets services, portfolio and risk management expertise, wealth management, and investment advisory services. Clients of Guggenheim Partners, LLC subsidiaries are an elite mix of individuals, family offices, endowments, foundations, insurance companies and other institutions.
Guggenheim Partners Investment Management, LLC ("GPIM") is an indirect subsidiary of Guggenheim Partners, LLC, a diversified financial services firm. The firm provides capital markets services, portfolio and risk management expertise, wealth management, and investment advisory services. Clients of Guggenheim Partners, LLC subsidiaries are an elite mix of individuals, family offices, endowments, foundations, insurance companies and other institutions.
Portfolio Management
The portfolio managers who are currently responsible for the day-to-day management of Guggenheim China All-Cap ETF, Guggenheim China Technology ETF, Guggenheim Solar ETF, Guggenheim Emerging Markets Real Estate ETF, Guggenheim S&P High Income Infrastructure ETF and Guggenheim S&P Global Water Index ETF's portfolios are Michael P. Byrum, CFA, James R. King, CFA, and Cindy Gao. Mr. Byrum is a Senior Managing Director and Portfolio Manager of Guggenheim Investments and joined Guggenheim Investments in 1993. Mr. Byrum holds a degree in finance from Miami University of Ohio and is a member of the CFA Institute and the Washington Society of Investment Analysts. Mr. King is a Managing Director and Portfolio Manager of Guggenheim Investments and rejoined Guggenheim Investments in 2011 as the lead portfolio manager for exchange-traded products. Mr. King holds a bachelor's degree in finance from the University of Maryland, and has earned the Chartered Financial Analyst designation. Ms. Gao is an ETF Analyst in ETF Portfolio Management of Guggenheim Investments and joined Guggenheim Investments in December of 2010. Ms. Gao received a M.S. in Accounting from the University of Illinois at Chicago. Mr. Bachman is a Vice President and Portfolio Manager of Guggenheim Investments and joined Guggenheim in August of 2014. Mr. Bachman has a bachelor's degree in finance and international business from the University of Maryland, College Park and has earned the Chartered Financial Analysis designation.
The portfolio managers who are currently responsible for the day-to-day management of Guggenheim China All-Cap ETF, Guggenheim China Technology ETF, Guggenheim Solar ETF, Guggenheim Emerging Markets Real Estate ETF, Guggenheim S&P High Income Infrastructure ETF and Guggenheim S&P Global Water Index ETF's portfolios are Michael P. Byrum, CFA, James R. King, CFA, and Cindy Gao. Mr. Byrum is a Senior Managing Director and Portfolio Manager of Guggenheim Investments and joined Guggenheim Investments in 1993. Mr. Byrum holds a degree in finance from Miami University of Ohio and is a member of the CFA Institute and the Washington Society of Investment Analysts. Mr. King is a Managing Director and Portfolio Manager of Guggenheim Investments and rejoined Guggenheim Investments in 2011 as the lead portfolio manager for exchange-traded products. Mr. King holds a bachelor's degree in finance from the University of Maryland, and has earned the Chartered Financial Analyst designation. Ms. Gao is an ETF Analyst in ETF Portfolio Management of Guggenheim Investments and joined Guggenheim Investments in December of 2010. Ms. Gao received a M.S. in Accounting from the University of Illinois at Chicago. Mr. Bachman is a Vice President and Portfolio Manager of Guggenheim Investments and joined Guggenheim in August of 2014. Mr. Bachman has a bachelor's degree in finance and international business from the University of Maryland, College Park and has earned the Chartered Financial Analysis designation.
The portfolio managers who are currently responsible for the day-to-day management of the Guggenheim Total Return Bond ETF are B. Scott Minerd, Anne Walsh, CFA, James Michal, Steve Brown, CFA, and Adam Bloch. Messrs. Minerd, Michal and Brown and Ms. Walsh have each managed the Fund's portfolio since the Fund's inception in February 2016. Mr. Bloch has managed the Fund's portfolio since January 2017. Mr. Minerd is the Global Chief Investment Officer of Guggenheim Investments and joined Guggenheim Investments in 1998. Mr. Minerd is a member of the Portfolio Construction Group and guides the investment strategies of the sector portfolio managers. Mr. Minerd holds a B.S. degree in Economics from the Wharton School, University of Pennsylvania, and has completed graduate work at the University of Chicago Graduate School of Business and the Wharton School, University of Pennsylvania. Ms. Walsh is a Senior Managing Director and Assistant Chief Investment Officer of Guggenheim Investments and joined the firm in 2007. Ms. Walsh is head of the Portfolio Construction Group where she oversees more than $60 billion in fixed-income investments including Agencies, Credit, Municipals, Residential Mortgage Backed Securities, Commercial Mortgage Backed Securities and Asset Backed Securities across several Guggenheim affiliates. Ms. Walsh received her BSBA and MBA from Auburn University and her J.D. from the University of Miami School of Law. Mr. Michal is a Senior Managing Director and Portfolio Manager at Guggenheim Investments and joined the firm in 2008. Mr. Michal is dedicated to portfolio management for Guggenheim Investments' Total Return mandates. Mr. Michal earned a BSBA in Finance and International Business from Georgetown University. Mr. Brown is a Managing Director and Portfolio Manager at Guggenheim Investments and joined the firm in 2010. Mr. Brown is a part of the Portfolio Management team for Guggenheim Investments' Active Fixed-Income and Total Return mandates. Mr. Brown earned a BS in Finance from Indiana University's Kelley School of Business. Mr. Bloch is a Director and Portfolio Manager at Guggenheim Investments and joined the firm in 2012. Mr. Bloch works directly with sector traders, research heads, and risk managers and is responsible for buy and sell recommendations, day-to-day risk monitoring, and various special projects for Guggenheim Investments' Total Return mandates. Mr. Bloch graduated from the University of Pennsylvania.
Claymore Exchange-Traded Fund Trust 2 Overview
The Claymore Exchange-Traded Fund Trust 2 (the "Trust") is an investment company complex consisting of 14 separate exchange-traded "funds" as of April 1, 2017. The investment objective of each of the index funds is to correspond generally to the performance, before fees and expenses, of a specified market index.
The Claymore Exchange-Traded Fund Trust 2 (the "Trust") is an investment company complex consisting of 14 separate exchange-traded "funds" as of April 1, 2017. The investment objective of each of the index funds is to correspond generally to the performance, before fees and expenses, of a specified market index.
This material must be preceded or accompanied by a prospectus for the fund being offered. The prospectus contains information about the Fund including a discussion of investment objectives, risks, ongoing expenses and sales charges. If a prospectus did not accompany this report, you can obtain one from your financial adviser, from our website at http://guggenheiminvestments.com or by calling (800)345-7999. Please read the prospectus carefully before investing. All Funds are subject to market risk and shares when sold may be worth more or less than their original cost. You can lose money investing in the Funds.
Guggenheim Funds Distributors, LLC
227 West Monroe Street
Chicago, IL 60606
Member FINRA/SIPC
(04/17)
227 West Monroe Street
Chicago, IL 60606
Member FINRA/SIPC
(04/17)
NOT FDIC-INSURED l NOT BANK-GUARANTEED l MAY LOSE VALUE
ETF-002-SAR-0217
Item 2. Code of Ethics.
Not applicable for a semi-annual reporting period.
Item 3. Audit Committee Financial Expert.
Not applicable for a semi-annual reporting period.
Item 4. Principal Accountant Fees and Services.
Not applicable for a semi-annual reporting period.
Item 5. Audit Committee of Listed Registrants.
Not applicable for a semi-annual reporting period.
Item 6. Schedule of Investments.
The Schedule of Investments is included as part of Item 1.
Item 7. Disclosure of Proxy Voting Policies and Procedures for Closed-End Management Investment Companies.
Not Applicable.
Item 8. Portfolio Managers of Closed-End Management Investment Companies.
Not Applicable.
Item 9. Purchases of Equity Securities by Closed-End Management Investment Company and Affiliated Purchasers.
Not Applicable.
Item 10. Submission of Matters to a Vote of Security Holders.
Registrant has not made any material changes to the procedures by which shareholders may recommend nominees to the registrant’s Board of Trustees.
Item 11. Controls and Procedures.
(a) The registrant's principal executive officer and principal financial officer have evaluated the registrant's disclosure controls and procedures (as defined in Rule 30a-3(c) under the Investment Company Act) as of a date within 90 days of this filing and have concluded that based on such evaluation as required by Rule 30a-3(b) under the Investment Company Act, that the registrant's disclosure controls and procedures were effective as of that date in ensuring that information required to be disclosed by the registrant in this Form N-CSR was recorded, processed, summarized, and reported within the time periods specified in the Securities and Exchange Commission’s rules and forms.
(b) There were no changes in the registrant’s internal control over financial reporting (as defined in Rule 30a-3(d) under the Investment Company Act) that occurred during the registrant’s last fiscal quarter of the period covered by this report that have materially affected, or are reasonably likely to materially affect, the registrant’s internal control over financial reporting.
Item 12. Exhibits.
(a)(1) Not applicable.
(a)(2) Certifications of principal executive officer and principal financial officer pursuant to Rule 30a-2(a) under the Investment Company Act.
(a)(3) Not Applicable.
(b) Certifications of principal executive officer and principal financial officer pursuant to Rule 30a-2(b) under the Investment Company Act and Section 906 of the Sarbanes-Oxley Act of 2002.
SIGNATURES
Pursuant to the requirements of the Securities Exchange Act of 1934 and the Investment Company Act of 1940, the registrant has duly caused this report to be signed on its behalf by the undersigned, thereunto duly authorized.
Claymore Exchange-Traded Fund Trust 2
By: /s/ Donald C. Cacciapaglia
Name: Donald C. Cacciapaglia
Title: President and Chief Executive Officer
Date: May 5, 2017
Pursuant to the requirements of the Securities Exchange Act of 1934 and the Investment Company Act of 1940, this report has been signed by the following persons on behalf of the registrant and in the capacities and on the dates indicated.
By: /s/ Donald C. Cacciapaglia
Name: Donald C. Cacciapaglia
Title: President and Chief Executive Officer
Date: May 5, 2017
By: /s/ John L. Sullivan
Name: John L. Sullivan
Title: Chief Financial Officer, Chief Accounting Officer and Treasurer
Date: May 5, 2017