UNITED STATES
SECURITIES AND EXCHANGE COMMISSION
Washington, D.C. 20549
FORM N-CSR
CERTIFIED SHAREHOLDER REPORT OF REGISTERED MANAGEMENT
INVESTMENT COMPANIES
Investment Company Act file number 811-21910
Claymore Exchange-Traded Fund Trust 2
(Exact name of registrant as specified in charter)
| | |
| 2455 Corporate West Drive, Lisle, IL | | 60532 |
| (Address of principal executive offices) | | (Zip code) |
Nicholas Dalmaso,
2455 Corporate West Drive, Lisle, IL 60532
(Name and address of agent for service)
Registrant’s telephone number, including area code: (630) 505-3700
Date of fiscal year end: August 31
Date of reporting period: August 31, 2007
Form N-CSR is to be used by management investment companies to file reports with the Commission not later than 10 days after the transmission to stockholders of any report that is required to be transmitted to stockholders under Rule 30e-1 under the Investment Company Act of 1940 (17 CFR 270.30e-1). The Commission may use the information provided on Form N-CSR in its regulatory, disclosure review, inspection, and policymaking roles.
A registrant is required to disclose the information specified by Form N-CSR, and the Commission will make this information public. A registrant is not required to respond to the collection of information contained in Form N-CSR unless the Form displays a currently valid Office of Management and Budget (“OMB”) control number. Please direct comments concerning the accuracy of the information collection burden estimate and any suggestions for reducing the burden to Secretary, Securities and Exchange Commission, 450 Fifth Street, NW, Washington, DC 20549-0609. The OMB has reviewed this collection of information under the clearance requirements of 44 U.S.C. Section 3507.
| Item 1. | Reports to Stockholders. |
The registrant’s annual report transmitted to shareholders pursuant to Rule 30e-1 under the Investment Company Act of 1940, as amended (the “Investment Company Act”), is as follows:
www.claymore.com
… your road to the LATEST,
most up-to-date INFORMATION about the
Claymore Exchange-Traded Fund Trust 2
Contents
The shareholder report you are reading right now is just the beginning of the story. Online at www.claymore.com, you will find:
| | • | | Daily and historical fund pricing, fund returns, portfolio holdings and characteristics, and distribution history. |
| | • | | Investor guides and fund fact sheets. |
| | • | | Regulatory documents including a prospectus and copies of shareholder reports. |
Claymore Securities is constantly updating and expanding shareholder information services on each Fund’s website, in an ongoing effort to provide you with the most current information about how your Fund’s assets are managed, and the results of our efforts. It is just one more small way we are working to keep you better informed about your investment.
2 | Annual Report | August 31, 2007
Claymore Exchange-Traded Fund Trust 2
Dear Shareholder |
As Investment Adviser, Claymore Advisors, LLC (“Claymore”) is delighted to present the first annual shareholder report for three of our newly launched exchange-traded funds (“ETFs” or “Funds”). This report covers performance of these Funds from their inception through August 31, 2007.
Two of these ETFs commenced operations on March 1, 2007. They are:
| | • | | Claymore/Robeco Developed International Equity ETF (ticker: “EEN”) |
| | • | | Claymore/Robeco Developed World Equity ETF (ticker: “EEW”) |
The third Fund commenced operations on May 14, 2007. It is:
| | • | | Claymore S&P Global Water Index ETF (ticker: “CGW”) |
The investment objective of each Fund is to seek investment results that correspond generally to the performance, before each Fund’s fees and expenses, of its respective underlying index as named in its prospectus.
Claymore is committed to providing investors with innovative index-strategy-driven investment solutions. Accordingly, in addition to these three global-themed ETFs, during the last 12 months we have launched six other global-themed ETFs and 25 domestic-equity oriented ETFs as of August 31, 2007. Claymore has partnered with a diverse group of index providers to create some of the most distinctive ETFs currently available. The index providers design indices using defined selection methodologies in the creation of their indices. Unlike ETFs that track traditional indices representing broad market participation, the indices that many of Claymore’s ETFs track seek to capture the investment potential of unique strategies. We believe that a strategy-driven, quantitative process provides a disciplined investment approach offering the potential for superior performance over market cycles.
To learn more about the performance of each ETF, we encourage you to read the Management Discussion of Fund Performance section of the report, which begins on page 4.
|
| Sincerely, |
|
 |
| Nicholas Dalmaso |
| Chief Executive Officer |
| Claymore Exchange-Traded Fund Trust 2 |
Annual Report | August 31, 2007 | 3
Claymore Exchange-Traded Fund Trust 2
Management Discussion of Fund Performance |
EEN | Claymore/Robeco Developed International Equity ETF
Fund Overview
The Claymore/Robeco Developed International Equity ETF (the “Fund”) seeks investment results that correspond generally to the performance, before the Fund’s fees and expenses, of an equity index called the Robeco Developed International Equity Index (the “Index”). The Fund will normally invest at least 90% of its total assets in equities that comprise the Index and in American depositary receipts (“ADRs”) based on the securities in the Index. The Fund generally will invest in all of the stocks comprising the Index in proportion to their weightings in the Index. Claymore Advisors, LLC, the Fund’s investment adviser (the “Investment Adviser”), seeks a correlation over time of 95% or better between the Fund’s performance and the performance of the Index.
Index constituents are selected from a universe of equities listed on international developed market exchanges. “Developed markets” are countries whose economies have high income levels, strong legal protection and sophisticated stock exchanges. The current list of international developed markets consists of Australia, Austria, Belgium, Denmark, Finland, France, Germany, Hong Kong, Ireland, Italy, Japan, Netherlands, New Zealand, Norway, Portugal, Singapore, Spain, Sweden, Switzerland, and the United Kingdom. The Index is comprised of, at any given time, between 100-200 stocks, selected based on liquidity, ease of trading, valuation and momentum measures and other criteria. The companies in the Index are selected and weighted using a proprietary methodology developed by Robeco Investment Management, Inc. (the “Index Provider”).
Fund Performance
This report discusses an abbreviated annual fiscal period from the Fund’s inception date of March 1, 2007, through August 31, 2007.
On a market price basis, the Fund generated a total return of 4.97%, representing a change in market price to $25.35 on August 31, 2007, from $24.15 at inception. On a net asset value (“NAV”) basis, the Fund generated a total return of 4.72%, representing a change in NAV to $25.29 on August 31, 2007, from $24.15 at inception. At the end of the period the Fund’s shares were trading at a market price premium to NAV, which is to be expected from time to time. However, the Investment Adviser believes that large discounts or premiums to the NAV of the shares should not be sustained.
For index and broad market comparison purposes, the Index returned 5.49% and the Morgan Stanley Capital International Europe, Australasia and Far East Index (the “MSCI EAFE Index”) returned 7.27% for the same period. The MSCI EAFE Index is an unmanaged capitalization-weighted index that tracks international stock performance in the 21 developed markets of Europe, Australasia and the Far East. The index is calculated using closing local market prices and translated into US dollars using the London close foreign exchange rates. It is not possible to invest directly in an index.
Economic and Market Overview
The global economy continues to expand at or somewhat above its longer-term trend. Economies in Europe have been strong, and inflation remains modest. Asian economic growth has been driven by improving domestic demand, especially in China and India, and by export gains. Rates of resource utilization have increased, and energy prices have risen during 2007, heightening inflation risks. To guard against overly rapid growth, many central banks have moved toward mildly restraining monetary policies. In response to stronger growth and tighter monetary policies, real interest rates have risen and risk premiums have increased. Nonetheless, real interest rates remain modest by historical standards. Economic growth in Europe and Asia has reduced the reliance of the global economy on domestic demand in the U.S.
Trends in world stock markets have been generally positive during 2007; the strongest was China, up more than 50% from the end of 2006 through August 2007. European markets were up modestly, while the Japanese market was down somewhat during the first eight months of 2007.
Performance Attribution
The Fund’s strongest gains from the inception date of March 1, 2007, through August 31, 2007, were in the consumer goods sector, followed by the industrials and oil & gas sectors. Positioning in the financials and health care sectors detracted from performance. Holdings that contributed most to performance include Finnish mobile telephone producer Nokia OYJ, Japanese electronic game maker Nintendo Co. Ltd., and German automobile manufacturer Volkswagen AG (1.8%, 1.8% and 1.1% of total investments, respectively, as of 8/31/07). Holdings that detracted from performance include Swiss semiconductor producer Micronas Semiconductor Holding AG (not in the portfolio as of 8/31/07), global health care group GlaxoSmithKline PLC (not in the portfolio as of 8/31/07), and Japanese financial services firm Mitsubishi UFJ Financial Group Inc. (1.3% of total investments as of 8/31/07).
4 | Annual Report | August 31, 2007
Claymore Exchange-Traded Fund Trust 2 | Management Discussion of Fund Performance continued
EEW | Claymore/Robeco Developed World Equity ETF
Fund Overview
The Claymore/Robeco Developed World Equity ETF (the “Fund”) seeks investment results that correspond generally to the performance, before the Fund’s fees and expenses, of an equity index called the Robeco Developed World Equity Index (the “Index”). The Fund will normally invest at least 90% of its total assets in equities that comprise the Index and in American depositary receipts (“ADRs”) based on the securities in the Index. The Fund generally will invest in all of the stocks comprising the Index in proportion to their weightings in the Index. Claymore Advisors, LLC, the Fund’s investment adviser (the “Investment Adviser”), seeks a correlation over time of 95% or better between the Fund’s performance and the performance of the Index.
Index constituents are selected from a universe of equities listed on global developed market exchanges. Global developed markets are countries whose economies have high income levels, strong legal protection and sophisticated stock exchanges, including the U.S. and Canada. The current list of global developed markets consists of Australia, Austria, Belgium, Canada, Denmark, Finland, France, Germany, Hong Kong, Ireland, Italy, Japan, Netherlands, New Zealand, Norway, Portugal, Singapore, Spain, Sweden, Switzerland, the United Kingdom, and the U.S. The Robeco Developed World Equity Index is comprised of, at any given time, between 110-210 stocks, selected based on liquidity, ease of trading, valuation and momentum measures and other criteria. The companies in the Index are selected and weighted using a proprietary methodology developed by Robeco Investment Management, Inc. (the “Index Provider”).
Fund Performance
This report discusses an abbreviated annual fiscal period from the Fund’s inception date of March 1, 2007, through August 31, 2007.
On a market price basis, the Fund generated a total return of 6.53%, representing a change in market price to $25.78 on August 31, 2007, from $24.20 at inception. On a net asset value (“NAV”) basis, the Fund generated a total return of 5.78%, representing a change in NAV to $25.60 on August 31, 2007, from $24.20 at inception. At the end of the period the Fund’s shares were trading at a market price premium to NAV, which is to be expected from time to time. However, the Investment Adviser believes that large discounts or premiums to the NAV of the shares should not be sustained.
For index and broad market comparison purposes, the Index returned 6.54% and the Morgan Stanley Capital International World Index (the “MSCI World Index”) returned 6.99% for the same period. The MSCI World Index is an unmanaged, capitalization weighted measure of global stock markets, including the United States, Canada, Europe, Australia and the Far East. The index is calculated using closing market prices and converted to US dollars using the London close foreign exchange rates. It is not possible to invest directly in an index.
Economic and Market Overview
The global economy continues to expand at or somewhat above its longer-term trend. Economies in Europe have been strong, and inflation remains modest. Asian economic growth has been driven by improving domestic demand, especially in China and India, and by export gains. Rates of resource utilization have increased, and energy prices have risen during 2007, heightening inflation risks. To guard against overly rapid growth, many central banks have moved toward mildly restraining monetary policies. In response to stronger growth and tighter monetary policies, real interest rates have risen and risk premiums have increased. Nonetheless, real interest rates remain modest by historical standards. Economic growth in Europe and Asia has reduced the reliance of the global economy on domestic demand in the U.S.
Trends in world stock markets have been generally positive during 2007; the strongest was China, up more than 50% from the end of 2006 through August 2007. European markets were up modestly, while the Japanese market was down somewhat during the first eight months of 2007.
Performance Attribution
The Fund’s strongest gains from the Fund’s inception date of March 1, 2007, through August 31, 2007, were in the oil & gas sector, followed by the technology sector. Positioning in the financials and telecommunications sectors detracted from performance. Holdings that contributed most to performance include Japanese electronic game maker Nintendo Co. Ltd. and two U.S.-based integrated oil companies, Exxon Mobil Corporation and Chevron Corporation (0.9%, 2.5% and 1.4% of total investments, respectively, as of 8/31/07). Holdings that detracted include mortgage insurer MGIC Investment Corporation, Japanese financial services firm Mitsubishi UFJ Financial Group Inc. and global health care group GlaxoSmithKline PLC (0.3%, 1.0% and 0.1% of total investments, respectively, as of 8/31/07).
Annual Report | August 31, 2007 | 5
Claymore Exchange-Traded Fund Trust 2 | Management Discussion of Fund Performance continued
CGW | Claymore S&P Global Water Index ETF
Fund Overview
The Claymore S&P Global Water Index ETF (the “Fund”) seeks investment results that correspond generally to the performance, before the Fund’s fees and expenses, of an equity index called the S&P Global Water Index (the “Index”). The Index is comprised of 50 equity securities selected, based on investment and other criteria, from a universe of companies listed on global developed market exchanges. Specifically, all or any subset of the following countries/regions are currently considered to be developed markets – Austria, Australia, Belgium, Canada, Denmark, Finland, France, Germany, Greece, Hong Kong, Ireland, Italy, Japan, Netherlands, New Zealand, Norway, Portugal, Singapore, Spain, Sweden, Switzerland, United Kingdom and the U.S. The companies in the universe are selected using criteria as identified by Standard & Poor’s, a division of The McGraw-Hill Companies, Inc. (“S&P”). The Fund will normally invest at least 90% of its total assets in common stock and ADRs that comprise the Index. The Fund generally will invest in all of the stocks comprising the Index in proportion to their weightings in the Index. Claymore Advisors, LLC, the Fund’s investment adviser (the “Investment Adviser”), seeks a correlation over time of 95% or better between the Fund’s performance and the performance of the Index.
The S&P Global Water Index is comprised of 50 stocks selected based on the relative importance of the global water industry within the company’s business model. The Index is designed to have a balanced representation from different segments of the water industry consisting of the following two clusters: 25 water utilities and infrastructure companies (water supply, water utilities, waste water treatment, water, sewer and pipeline construction, water purification, water well drilling, water testing) and 25 water equipment and materials companies (water treatment chemicals, water treatment appliances, pumps and pumping equipment, fluid power pumps and motors, plumbing equipment, totalizing fluid meters and counting devices) based upon Standard & Poor’s Capital IQ (“CIQ”) industry classification. To ensure investability, a developed market listing and a minimum market capitalization of at least $250 million are required.
Fund Performance
This report discusses an abbreviated annual fiscal period from the Fund’s inception date of May 14, 2007, through August 31, 2007.
On a market price basis, the Fund generated a total return of 1.41%, representing a change in market price to $25.13 on August 31, 2007, from $24.78 at inception. On a net asset value (“NAV”) basis, the Fund generated a total return of 0.32%, representing a change in NAV to $24.86 on August 31, 2007, from $24.78 at inception. At the end of the period the Fund’s shares were trading at a market price premium to NAV, which is to be expected from time to time. However, the Investment Adviser believes that large discounts or premiums to the NAV of the shares should not be sustained.
For index and broad market comparison purposes, the Index returned 0.54% and the Morgan Stanley Capital International World Index (the “MSCI World Index”) returned 1.25% for the same period. The MSCI World Index is an unmanaged, capitalization weighted measure of global stock markets, including the United States, Canada, Europe, Australia and the Far East. The index is calculated using closing market prices and converted to US dollars using the London close foreign exchange rates. It is not possible to invest directly in an index.
Economic and Market Overview
The global economy continued to expand at or somewhat above its longer-term trend during 2007. Economies in Europe have been strong, and inflation remains modest. Asian economic growth has been driven by improving domestic demand, especially in China and India, and by export gains. Rates of resource utilization have increased, and energy prices have risen during 2007, heightening inflation risks. To guard against overly rapid growth, many central banks have moved toward mildly restraining monetary policies. In response to stronger growth and tighter monetary policies, real interest rates have risen and risk premiums have increased. Nonetheless, real interest rates remain modest by historical standards. Economic growth in Europe and Asia has reduced the reliance of the global economy on domestic demand in the U.S.
Trends in world stock markets have been generally positive during 2007; the strongest was China, up more than 50% from the end of 2006 through August 2007. European markets were up modestly, while the Japanese market was down somewhat during the first eight months of 2007.
Performance Attribution
Most of the Fund’s investments are categorized in four industry sectors: basic materials, industrials, utilities and financials. Since the Fund’s inception date of May 14, 2007, through August 31, 2007, basic materials and industrials contributed to performance, while utilities and financials detracted. Holdings that contributed strongly to performance include Companhia de Saneamento Basico do Estado de Sao Paulo, a Brazilian provider of water and sewage services; Danaher Corp., a producer of industrial water treatment solutions and other products; and Kurita Water Industries Ltd., a Japanese provider of water treatment services (2.4%, 4.4% and 3.7% of long-term investments, respectively). Positions that detracted from performance include Ciba Specialty Chemicals, a Swiss manufacturer of products used for water treatment; Veolia Environnement S.A., a French environmental services company; and Mueller Water Products, which manufactures water infrastructure and flow control products (1.7%, 10.1% and 1.3% of long-term investments, respectively).
6 | Annual Report | August 31, 2007
Claymore Exchange-Traded Fund Trust 2 | Management Discussion of Fund Performance continued
Risks and Other Considerations
The views expressed in this report reflect those of the portfolio managers and Claymore only through the report period as stated on the cover. These views are subject to change at any time, based on market and other conditions and should not be construed as a recommendation of any kind. The material may also contain forward looking statements that involve risk and uncertainty, and there is no guarantee they will come to pass.
This information does not represent an offer to sell securities of the Funds and it is not soliciting an offer to buy securities of the Funds. There can be no assurance that the Funds will achieve their investment objectives.
An investment in the Funds is subject to certain risks and other considerations that include, but are not limited to:
Investment Risk. This includes the risk of the possible loss of the entire principal amount that you invest.
Equity Risk. This includes the risk that the value of the securities held by the Funds will fall due to general market and economic conditions, perceptions regarding the industries in which the issuers of securities held by the Funds participate, or factors relating to specific companies in which the Funds invest.
Foreign Investment Risk. The Fund’s investments in non-U.S. issuers may involve unique risks compared to investing in securities of U.S. issuers, including, among others, less market liquidity, generally greater market volatility than U.S. securities and less complete financial information than for U.S. issuers. In addition, adverse political, economic or social developments could undermine the value of the Fund’s investments or prevent the Fund from realizing the full value of its investments. Financial reporting standards for companies based in foreign markets differ from those in the United States. Finally, the value of the currency of the country in which the Fund has invested could decline relative to the value of the U.S. dollar, which may affect the value of the investment to U.S. investors. In addition, the underlying issuers of certain depositary receipts, particularly unsponsored or unregistered depositary receipts, are under no obligation to distribute shareholder communications to the holders of such receipts, or to pass through to them any voting rights with respect to the deposited securities.
Replication Management Risk. Unlike many investment companies, the Funds are not “actively” managed. Therefore, the Funds won’t necessarily sell a stock because the stock’s issuer was in financial trouble unless that stock is removed from the Index.
Non-Correlation Risk. The Funds’ returns may not match the returns of the indices. For example, the Funds incur operating expenses not applicable to the indices, and incur costs in buying and selling securities, especially when rebalancing the Funds’ holdings to reflect changes in the composition of the indices.
Issuer-Specific Changes Risk. Investments in non-U.S. issuers may involve unique risks, including, among others, greater market volatility than U.S. securities and less complete financial information than for U.S. issuers.
Non-Diversified Fund Risk. The Funds are considered non-diversified and can invest a greater portion of assets in securities of individual issuers than a diversified fund. As a result, changes in the market value of a single investment could cause greater fluctuations in share price than would occur in a diversified fund.
Micro-, Small- and Medium-Sized Company Risk. Investing in securities of micro-, small-and medium-capitalization companies involves greater risk than investing in more established companies. These companies’ stocks may be more volatile and less liquid than those of more established companies.
Industry Risk. While the Funds do not concentrate in any industry, to the extent that the Funds’ focus their investments in a particular industry or group of related industries, the NAV of the Funds will be more susceptible to factors affecting that industry or sector.
There can be no assurance that the requirements of the AMEX necessary to maintain the listing of the Funds will continue to be met or will remain unchanged.
The Claymore S&P Global Water Index ETF is also subject to risks of concentrating in the water industry. Adverse developments in the water industry may significantly affect the value of the securities held by the Fund. Companies involved in the water industry are subject to environmental considerations, taxes, government regulation, price and supply fluctuations, competition and water conservation.
In addition to the risks described, there are certain other risks related to investing in the Funds. These risks are described further in the Prospectus and Statement of Additional Information.
Annual Report | August 31, 2007 | 7
Claymore Exchange-Traded Fund Trust 2
Fund Summary & Performance | As of August 31, 2007 (unaudited)
EEN | Claymore/Robeco Developed International Equity ETF
| | | | |
Fund Statistics | | | |
Share Price | | $ | 25.35 | |
Net Asset Value | | $ | 25.29 | |
Premium/Discount to NAV | | | 0.24 | % |
Net Assets ($000) | | $ | 5,108 | |
Total Returns
| | | |
(Inception 3/01/07) | | Since Inception | |
Claymore/Robeco Developed International Equity ETF | | | |
NAV | | 4.72 | % |
Market | | 4.97 | % |
| | | |
Robeco Developed International Equity Index | | 5.49 | % |
| | | |
Performance data quoted represents past performance, which is no guarantee of future results, and current performance may be lower or higher than the figures shown. For the most recent month-end performance figures, please visit www.claymore.com. The investment return and principal value of an investment will fluctuate with changes in market conditions and other factors so that an investor’s shares, when redeemed, may be worth more or less than their original cost.
Since inception returns assume a purchase of the ETF at the initial share price of $24.15 for share price returns or initial net asset value (NAV) of $24.15 per share for NAV returns. Returns for periods of less than one year are not annualized.
The Fund’s total annual operating expense ratio was estimated at 0.74%, per the prospectus, gross of any fee waivers or expense reimbursements. The Fund’s expense ratio for its initial fiscal year is based on an assumed average asset level of $100 million. If assets are lower than $100 million, the expense ratio will be higher due to the inclusion of offering costs during the first twelve months of operations. If average assets of the Fund exceed $100 million during the Fund’s first twelve months, the expense ratio may be lower. In the Financial Highlights section of this Annual Report, the Fund’s annualized net operating expense ratio was determined to be 1.32% while the Fund’s annualized gross operating expense ratio was determined to be 3.35%. There is a contractual fee waiver currently in place for this Fund through December 31, 2009 to the extent necessary in keeping the Fund’s operating expense ratio from exceeding 0.65% of average net assets per year. Some expenses fall outside of this expense cap and actual expenses will be higher than 0.65%. Without this expense cap, actual returns would be lower.
| | | |
Country Breakdown | | % of Long Term
Investments | |
Japan | | 22.8 | % |
United Kingdom | | 22.0 | % |
Germany | | 9.3 | % |
France | | 8.5 | % |
Switzerland | | 6.3 | % |
Netherlands | | 5.3 | % |
Australia | | 5.1 | % |
Italy | | 4.3 | % |
Spain | | 3.2 | % |
Finland | | 2.7 | % |
Sweden | | 2.7 | % |
Belgium | | 2.3 | % |
Hong Kong | | 1.7 | % |
Denmark | | 1.4 | % |
Singapore | | 1.2 | % |
Norway | | 0.9 | % |
Portugal | | 0.3 | % |
| | | |
Portfolio Breakdown | | % of Net Assets | |
Financials | | 28.2 | % |
Consumer Discretionary | | 13.0 | % |
Information Technology | | 9.5 | % |
Materials | | 9.1 | % |
Industrials | | 7.4 | % |
Energy | | 7.3 | % |
Consumer Staples | | 7.1 | % |
Telecommunication Services | | 6.6 | % |
Health Care | | 5.6 | % |
Utilities | | 5.1 | % |
| | | |
Total Investments | | 98.9 | % |
Other Assets in excess of Liabilities | | 1.1 | % |
| | | |
Net Assets | | 100.0 | % |
| | | |
| | | |
Top Ten Holdings | | % of Long Term
Investments | |
BP PLC | | 2.3 | % |
Nestle SA | | 2.1 | % |
Vodafone Group PLC | | 2.0 | % |
Nintendo Co. Ltd. | | 1.8 | % |
Nokia OYJ | | 1.8 | % |
E.ON AG | | 1.6 | % |
Royal Bank of Scotland Group PLC | | 1.5 | % |
Royal Dutch Shell PLC - Class B | | 1.5 | % |
Allianz SE | | 1.4 | % |
ENI SpA | | 1.4 | % |
Portfolio breakdown is as a percentage of net assets. Holdings and country breakdowns are as a percentage of long-term investments. Both are subject to change daily. For more current Fund information, please visit www.claymore.com. The above summaries are provided for informational purposes only, and should not be viewed as recommendations.
Performance of a $10,000 Investment
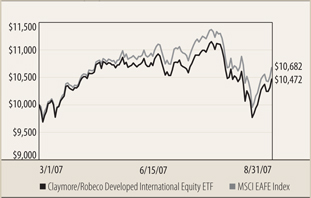
This graph compares a hypothetical $10,000 investment in the Fund, made at its inception, with a similar investment in the MSCI EAFE Index. Results include the reinvestment of all dividends and capital gains. Past performance is no guarantee of future results. The MSCI EAFE Index is a free float-adjusted market capitalization index that is designed to measure developed market equity performance, excluding the U.S. & Canada. It is not possible to invest directly in the MSCI EAFE Index. Investment return and principal value will fluctuate with changes in market conditions and other factors and fund shares, when redeemed, may be worth more or less than their original investment.
Index data source: Bloomberg
8 | Annual Report | August 31, 2007
Claymore Exchange-Traded Fund Trust 2 | Fund Summary & Performance (unaudited) continued
EEW | Claymore/Robeco Developed World Equity ETF
| | | | |
Fund Statistics | | | |
Share Price | | $ | 25.78 | |
Net Asset Value | | $ | 25.60 | |
Premium/Discount to NAV | | | 0.70 | % |
Net Assets ($000) | | $ | 15,412 | |
Total Returns
| | | |
(Inception 3/01/07) | | Since Inception | |
Claymore/Robeco Developed World Equity ETF | | | |
NAV | | 5.78 | % |
Market | | 6.53 | % |
| | | |
Robeco Developed World Equity Index | | 6.54 | % |
| | | |
Performance data quoted represents past performance, which is no guarantee of future results, and current performance may be lower or higher than the figures shown. For the most recent month-end performance figures, please visit www.claymore.com. The investment return and principal value of an investment will fluctuate with changes in market conditions and other factors so that an investor’s shares, when redeemed, may be worth more or less than their original cost.
Since inception returns assume a purchase of the ETF at the initial share price of $24.20 for share price returns or initial net asset value (NAV) of $24.20 per share for NAV returns. Returns for periods of less than one year are not annualized.
The Fund’s total annual operating expense ratio was estimated at 0.74%, per the prospectus, gross of any fee waivers or expense reimbursements. The Fund’s expense ratio for its initial fiscal year is based on an assumed average asset level of $100 million. If assets are lower than $100 million, the expense ratio will be higher due to the inclusion of offering costs during the first twelve months of operations. If average assets of the Fund exceed $100 million during the Fund’s first twelve months, the expense ratio may be lower. In the Financial Highlights section of this Annual Report, the Fund’s annualized net operating expense ratio was determined to be 0.98% while the Fund’s annualized gross operating expense ratio was determined to be 2.20%. There is a contractual fee waiver currently in place for this Fund through December 31, 2009 to the extent necessary in keeping the Fund’s operating expense ratio from exceeding 0.65% of average net assets per year. Some expenses fall outside of this expense cap and actual expenses will be higher than 0. 65%. Without this expense cap, actual returns would be lower.
| | | |
Country Breakdown | | % of Long Term
Investments | |
United States | | 47.4 | % |
United Kingdom | | 10.1 | % |
Japan | | 9.7 | % |
Canada | | 4.5 | % |
Germany | | 4.5 | % |
France | | 4.3 | % |
Italy | | 2.4 | % |
Switzerland | | 2.2 | % |
Sweden | | 2.1 | % |
Australia | | 2.0 | % |
Netherlands | | 1.9 | % |
Finland | | 1.9 | % |
Hong Kong | | 1.7 | % |
Singapore | | 1.5 | % |
Spain | | 1.0 | % |
Norway | | 0.8 | % |
Austria | | 0.7 | % |
Denmark | | 0.7 | % |
Belgium | | 0.4 | % |
Portugal | | 0.1 | % |
Bermuda | | 0.1 | % |
South Africa | | 0.0 | % |
| | | |
Portfolio Breakdown | | % of Net Assets | |
Financials | | 24.6 | % |
Information Technology | | 12.8 | % |
Consumer Discretionary | | 11.5 | % |
Health Care | | 11.3 | % |
Energy | | 10.4 | % |
Industrials | | 8.8 | % |
Materials | | 6.5 | % |
Consumer Staples | | 5.6 | % |
Utilities | | 4.1 | % |
Telecommunication Services | | 3.9 | % |
| | | |
Total Investments | | 99.5 | % |
Other Assets in excess of Liabilities | | 0.5 | % |
| | | |
Net Assets | | 100.0 | % |
| | | |
| | | |
Top Ten Holdings | | % of Long Term
Investments | |
Exxon Mobil Corp. | | 2.5 | % |
Chevron Corp. | | 1.4 | % |
International Business Machines Corp. | | 1.4 | % |
Pfizer, Inc. | | 1.4 | % |
Intel Corp. | | 1.3 | % |
Nokia OYJ | | 1.3 | % |
Altria Group, Inc. | | 1.3 | % |
Hewlett-Packard Co. | | 1.2 | % |
JPMorgan Chase & Co. | | 1.2 | % |
E.ON AG | | 1.2 | % |
Portfolio breakdown is as a percentage of net assets. Holdings and country breakdown are as a percentage of long-term investments. Both are subject to change daily. For more current Fund information, please visit www.claymore.com. The above summaries are provided for informational purposes only, and should not be viewed as recommendations.
Performance of a $10,000 Investment
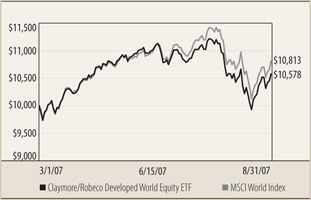
This graph compares a hypothetical $10,000 investment in the Fund, made at its inception, with a similar investment in the MSCI World Index. Results include the reinvestment of all dividends and capital gains. Past performance is no guarantee of future results. The MSCI World Index is a free float-adjusted market capitalization index that is designed to measure global developed market equity performance of the 23 developed market country indices of Europe, Australasia, the Far East, the United States, and Canada. It is not possible to invest directly in the MSCI World Index. Investment return and principal value will fluctuate with changes in market conditions and other factors and fund shares, when redeemed, may be worth more or less than their original investment.
Index data source: Bloomberg
Annual Report | August 31, 2007 | 9
Claymore Exchange-Traded Fund Trust 2 | Fund Summary & Performance (unaudited) continued
CGW | Claymore S&P Global Water Index ETF
| | | | |
Fund Statistics | | | |
Share Price | | $ | 25.13 | |
Net Asset Value | | $ | 24.86 | |
Premium/Discount to NAV | | | 1.09 | % |
Net Assets ($000) | | $ | 253,545 | |
Total Returns
| | | |
(Inception 5/14/07) | | | |
Claymore S&P Global Water ETF | | | |
NAV | | 0.32 | % |
Market | | 1.41 | % |
| | | |
S&P Global Water Index | | 0.54 | % |
| | | |
Performance data quoted represents past performance, which is no guarantee of future results, and current performance may be lower or higher than the figures shown. For the most recent month-end performance figures, please visit www.claymore.com. The investment return and principal value of an investment will fluctuate with changes in market conditions and other factors so that an investor’s shares, when redeemed, may be worth more or less than their original cost.
Since inception returns assume a purchase of the ETF at the initial share price of $24.78 for share price returns or initial net asset value (NAV) of $24.78 per share for NAV returns. Returns for periods of less than one year are not annualized.
The Fund’s total annual operating expense ratio was estimated at 0.90%, per the prospectus, gross of any fee waivers or expense reimbursements. The Fund’s expense ratio for its initial fiscal year is based on an assumed average asset level of $100 million. If assets are lower than $100 million, the expense ratio will be higher due to the inclusion of offering costs during the first twelve months of operations. If average assets of the Fund exceed $100 million during the Fund’s first twelve months, the expense ratio may be lower. In the Financial Highlights section of this Annual Report, the Fund’s annualized net operating expense ratio was determined to be 0.72% while the Fund’s annualized gross operating expense ratio was determined to be 0.83%. There is a contractual fee waiver currently in place for this Fund through December 31, 2009 to the extent necessary in keeping the Fund operating expense ratio from exceeding 0.65% of average net assets per year. Some expenses fall outside of this expense cap and actual expenses will be higher than 0.65%. Without this expense cap, actual returns would be lower.
| | | |
Country Breakdown | | % of Long-Term
Investments | |
United States | | 29.4 | % |
France | | 19.9 | % |
Japan | | 16.0 | % |
United Kingdom | | 12.9 | % |
Italy | | 5.3 | % |
Finland | | 4.9 | % |
Brazil | | 2.4 | % |
Spain | | 2.4 | % |
China | | 2.3 | % |
Switzerland | | 1.7 | % |
Singapore | | 1.3 | % |
Canada | | 1.0 | % |
Austria | | 0.3 | % |
Cayman Islands | | 0.2 | % |
| | | |
Portfolio Breakdown | | % of Net Assets | |
Utilities | | 45.9 | % |
Industrials | | 41.2 | % |
Materials | | 10.1 | % |
Financials | | 0.3 | % |
Consumer Discretionary | | 0.3 | % |
| | | |
Total Long-Term Investments | | 97.8 | % |
Short-Term Investments | | 0.2 | % |
Other Assets in excess of Liabilities | | 2.0 | % |
| | | |
Net Assets | | 100.0 | % |
| | | |
| | | |
Top Ten Holdings | | % of Long-Term
Investments | |
Veolia Environnement SA | | 10.1 | % |
Suez SA | | 9.8 | % |
Mitsubishi Heavy Industries Ltd. | | 6.4 | % |
United Utilities PLC | | 4.9 | % |
ITT Corp. | | 4.6 | % |
Danaher Corp. | | 4.4 | % |
Kubota Corp. | | 3.9 | % |
Kurita Water Industries Ltd. | | 3.7 | % |
Pentair, Inc. | | 3.5 | % |
Nalco Holding Co. | | 3.4 | % |
Portfolio breakdown is as a percentage of net assets. Country breakdown and holdings are as a percentage of long-term investments. All are subject to change daily. For more current Fund information, please visit www.claymore.com. The above summaries are provided for informational purposes only, and should not be viewed as recommendations.
Performance of a $10,000 Investment
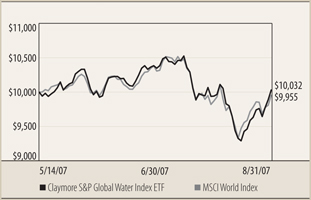
This graph compares a hypothetical $10,000 investment in the fund, made at its inception, with a similar investment in the MSCI World Index. Results include the reinvestment of all dividends and capital gains. Past performance is no guarantee of future results. The MSCI World Index is a free float-adjusted market capitalization index that is designed to measure global developed market equity performance of the 23 developed market country indices of Europe, Australasia, the Far East, the United States and Canada. It is not possible to invest directly in the MSCI World Index. Investment return and principal value will fluctuate with changes in market conditions and other factors and fund shares, when redeemed, may be worth more or less than their original investment.
Index data source: Bloomberg
10 | Annual Report | August 31, 2007
Claymore Exchange-Traded Fund Trust 2
Overview of Fund Expenses | As of August 31, 2007 (unaudited)
As a shareholder of Claymore/Robeco Developed International Equity ETF; Claymore/Robeco Developed World Equity ETF; or Claymore S&P Global Water Index ETF, you incur advisory fees and other Fund expenses. The expense examples below are intended to help you understand your ongoing costs (in dollars) of investing in the Funds and to compare these costs with the ongoing costs of investing in other mutual funds.
The example is based on an investment of $1,000 invested at the beginning of the period and held for the entire period ended 8/31/07.
Actual Expense
The first line of the table below provides information about actual account values and actual expenses. You may use the information in this line, together with the amount you invested, to estimate the expenses that you paid over the period. Simply divide your account value by $1,000 (for example, an $8,600 account value divided by $1,000 = 8.6), then multiply the result by the number in the first line under the heading entitled “Expenses Paid During Period” to estimate the expenses you paid on your account during this period.
Hypothetical Example for Comparison Purposes
The second line of the table below provides information about hypothetical account values and hypothetical expenses based on the Fund’s actual expense ratio and an assumed rate of return of 5% per year before expenses, which is not the Fund’s actual return. The hypothetical account values and expenses may not be used to estimate the actual ending account balance or expenses you paid for the period. You may use this information to compare the ongoing cost of investing in the Fund and other funds. To do so, compare this 5% hypothetical example with the 5% hypothetical examples that appear in the shareholder reports of the other funds.
Please note that the expenses shown in the table are meant to highlight your ongoing costs only and do not reflect any transactional costs, such as sales charges (loads) or contingent deferred sales charges. Therefore, the second line of the table is useful in comparing ongoing costs only, and will not help you determine the relative total costs of owning different funds. In addition, if these transactional costs were included, your costs would have been higher.
| | | | | | | | | | | | |
| | | Beginning
Account
Value | | Ending
Account
Value | | Annualized
Expense
Ratio for the
period ended | | | Expenses Paid During Period1 |
| | | 3/1/07 | | 8/31/07 | | 8/31/07 | | | 3/01/07 - 8/31/07 |
Claymore/Robeco Developed International Equity ETF3 | | | | | | | | | | | | |
Actual | | $ | 1,000.00 | | $ | 1,047.12 | | 1.32 | % | | $ | 6.81 |
Hypothetical (5% annual return before expenses) | | | 1,000.00 | | | 1,018.55 | | 1.32 | % | | | 6.72 |
Claymore/Robeco Developed World Equity ETF3 | | | | | | | | | | | | |
Actual | | | 1,000.00 | | | 1,057.84 | | 0.98 | % | | | 5.08 |
Hypothetical (5% annual return before expenses) | | | 1,000.00 | | | 1,020.27 | | 0.98 | % | | | 4.99 |
| | | | | | | | | | | | |
| | | Beginning
Account
Value | | Ending
Account
Value | | Annualized
Expense
Ratio for the
period ended | | | Expenses Paid During Period2 |
| | | 5/14/07 | | 8/31/07 | | 8/31/07 | | | 5/14/07 - 8/31/07 |
Claymore S&P Global Water Index ETF3 | | | | | | | | | | | | |
Actual | | $ | 1,000.00 | | $ | 1,003.23 | | 0.72 | % | | $ | 2.17 |
Hypothetical (5% annual return before expenses)4 | | | 1,000.00 | | | 1,021.58 | | 0.72 | % | | | 3.67 |
1 | Expenses are calculated using the annualized expense ratio. This represents the ongoing expenses of the Fund as a percentage of net assets for the period March 1, 2007 (commencement of investment operations) to August 31, 2007. Expenses are calculated by multiplying the Fund’s annualized expense ratio by the average account value over the period; then multiplying that result by 184/365 (to reflect the since inception period). |
2 | Expenses are calculated using the annualized expense ratio. This represents the ongoing expenses of the Fund as a percentage of net assets for the period May 14, 2007 (commencement of investment operations) to August 31, 2007. Expenses are calculated by multiplying the Fund’s annualized expense ratio by the average account value over the period; then multiplying that result by 110/365. |
3 | The expense ratios reflect an expense waiver. Please see the Notes to Financial Statements for more information. |
4 | Hypothetical expenses reflect ongoing expenses for a full six month period as opposed to the shorter since inception period. |
Assumes all dividends and distributions were reinvested.
Annual Report | August 31, 2007 | 11
Claymore Exchange-Traded Fund Trust 2
Portfolio of Investments | August 31, 2007
EEN | Claymore/Robeco Developed International Equity ETF
| | | | | |
Number
of Shares | | Description | | Value |
| | Total Investments - 98.8% | | | |
| | Common Stocks - 97.9% | | | |
| | Australia - 5.0% | | | |
| 2,241 | | Australia & New Zealand Banking Group Ltd. | | $ | 52,854 |
| 1,357 | | BHP Billiton Ltd. | | | 42,415 |
| 1,302 | | Commonwealth Bank of Australia | | | 58,417 |
| 521 | | Macquarie Bank Ltd. | | | 31,069 |
| 2,871 | | PaperlinX Ltd. | | | 7,895 |
| 94 | | Santos Ltd. | | | 1,013 |
| 1,351 | | Stockland | | | 9,441 |
| 66 | | Westfield Group | | | 1,124 |
| 2,407 | | Westpac Banking Corp. | | | 53,263 |
| | | | | |
| | | | | 257,491 |
| | | | | |
| | Belgium - 2.2% | | | |
| 13 | | Barco NV | | | 1,234 |
| 272 | | Belgacom SA | | | 11,925 |
| 263 | | Delhaize Group | | | 25,739 |
| 241 | | Groupe Bruxelles Lambert SA | | | 28,495 |
| 367 | | KBC Groep NV | | | 46,039 |
| 5 | | Omega Pharma SA | | | 441 |
| | | | | |
| | | | | 113,873 |
| | | | | |
| | Denmark - 1.4% | | | |
| 500 | | Jyske Bank (a) | | | 37,241 |
| 200 | | Topdanmark A/S (a) | | | 32,208 |
| | | | | |
| | | | | 69,449 |
| | | | | |
| | Finland - 2.7% | | | |
| 2,726 | | Nokia OYJ | | | 89,821 |
| 1,333 | | Orion OYJ - Class B | | | 31,783 |
| 965 | | Stora Enso OYJ | | | 17,207 |
| | | | | |
| | | | | 138,811 |
| | | | | |
| | France - 8.4% | | | |
| 6 | | Accor SA | | | 515 |
| 540 | | Bouygues | | | 42,557 |
| 928 | | Business Objects SA (a) | | | 40,850 |
| 416 | | Cap Gemini SA | | | 26,938 |
| 702 | | Cie Generale d’Optique Essilor International SA | | | 42,635 |
| 6 | | Gecina SA | | | 985 |
| 308 | | Peugeot SA | | | 26,243 |
| 732 | | Publicis Groupe | | | 31,653 |
| 822 | | Sanofi-Aventis | | | 67,146 |
| 10 | | Suez SA | | | 569 |
| 502 | | Technip SA | | | 40,096 |
| 109 | | Total SA | | | 8,210 |
| 179 | | Unibail-Rodamco | | | 43,131 |
| 28 | | Valeo SA | | | 1,358 |
| 1,346 | | Vivendi | | | 55,066 |
| | | | | |
| | | | | 427,952 |
| | | | | |
| | Germany - 8.3% | | | |
| 336 | | Allianz SE | | | 72,061 |
| 433 | | BASF AG | | | 57,335 |
| 677 | | Commerzbank AG | | | 27,771 |
| 457 | | Deutsche Bank AG | | | 56,463 |
| 471 | | E.ON AG | | | 79,073 |
| 298 | | Muenchener Rueckversicherungs AG | | | 51,504 |
| 455 | | ThyssenKrupp AG | | | 26,610 |
| 259 | | Volkswagen AG | | | 53,527 |
| | | | | |
| | | | | 424,344 |
| | | | | |
| | Hong Kong - 1.7% | | | |
| 900 | | Hang Seng Bank Ltd. | | | 14,117 |
| 7,000 | | HongKong Electric Holdings | | | 35,104 |
| 3,500 | | Swire Pacific Ltd. - Class A | | | 38,696 |
| | | | | |
| | | | | 87,917 |
| | | | | |
| | Italy - 4.2% | | | |
| 5,166 | | Enel SpA | | | 53,383 |
| 2,033 | | ENI SpA | | | 70,340 |
| 1,648 | | Fiat SpA | | | 43,809 |
| 10,503 | | Telecom Italia SpA | | | 23,554 |
| 2,883 | | UniCredito Italiano SpA | | | 24,721 |
| | | | | |
| | | | | 215,807 |
| | | | | |
| | Japan - 22.5% | | | |
| 400 | | Alps Electric Co. Ltd. | | | 4,690 |
| 1,000 | | Asahi Kasei Corp. | | | 7,506 |
| 200 | | Astellas Pharma, Inc. | | | 9,265 |
| 300 | | Canon, Inc. | | | 17,133 |
| 5,000 | | Central Glass Co. Ltd. | | | 25,752 |
| 612 | | Circle K Sunkus Co. Ltd. | | | 9,857 |
| 500 | | Daito Trust Construction Co. Ltd. | | | 23,595 |
| 1 | | East Japan Railway Co. | | | 7,963 |
| 300 | | Fanuc Ltd. | | | 29,168 |
| 1,000 | | FUJIFILM Holdings Corp. | | | 43,480 |
| 3,000 | | Fujitsu Ltd. | | | 20,472 |
| 3,000 | | Hitachi Ltd. | | | 19,359 |
| 9 | | Japan Tobacco, Inc. | | | 49,925 |
| 7 | | KDDI Corp. | | | 54,048 |
| 1,500 | | Komatsu Ltd. | | | 46,198 |
| 3,000 | | Matsushita Electric Industrial Co. Ltd. | | | 52,280 |
| 7,000 | | Mitsubishi Materials Corp. | | | 38,891 |
| 7 | | Mitsubishi UFJ Financial Group, Inc. | | | 67,032 |
| 6 | | Mizuho Financial Group, Inc. | | | 37,942 |
| 2,100 | | Namco Bandai Holdings, Inc. | | | 30,418 |
| 200 | | Nintendo Co. Ltd. | | | 92,654 |
| 2,000 | | Nippon Oil Corp. | | | 16,857 |
| 7,000 | | Nippon Steel Corp. | | | 49,036 |
See notes to financial statements.
12 | Annual Report | August 31, 2007
Claymore Exchange-Traded Fund Trust 2 | Portfolio of Investments continued
EEN | Claymore/Robeco Developed International Equity ETF (continued)
| | | | | |
Number
of Shares | | Description | | Value |
| | Japan (continued) | | | |
| 2,000 | | Nisshin Steel Co. Ltd. | | $ | 8,006 |
| 2,000 | | NOK Corp. | | | 38,735 |
| 7 | | NTT Data Corp. | | | 33,818 |
| 2,000 | | Sanwa Shutter Corp. | | | 11,698 |
| 100 | | Shin-Etsu Chemical Co. Ltd. | | | 7,229 |
| 1,100 | | Sony Corp. | | | 52,953 |
| 8,000 | | Sumitomo Metal Industries Ltd. | | | 40,512 |
| 2,000 | | Sumitomo Metal Mining Co. Ltd. | | | 39,684 |
| 300 | | Suzuken Co. Ltd. | | | 9,912 |
| 2,000 | | Taisho Pharmaceutical Co. Ltd. | | | 39,080 |
| 400 | | Takeda Pharmaceutical Co. Ltd. | | | 27,330 |
| 7,000 | | Teijin Ltd. | | | 34,965 |
| 400 | | TIS, Inc. | | | 8,627 |
| 400 | | Tokyo Electric Power Co., Inc. (The) | | | 10,491 |
| 2,000 | | Toyo Suisan Kaisha Ltd. | | | 34,939 |
| | | | | |
| | | | | 1,151,500 |
| | | | | |
| | Netherlands - 5.3% | | | |
| 1,430 | | ABN AMRO Holding NV | | | 66,535 |
| 380 | | ASML Holding NV (a) | | | 11,257 |
| 511 | | Heineken NV | | | 32,379 |
| 803 | | Koninklijke DSM NV | | | 41,084 |
| 3,046 | | Royal KPN NV | | | 47,504 |
| 2,255 | | STMicroelectronics NV | | | 39,287 |
| 1,013 | | Unilever NV - CVA | | | 30,975 |
| | | | | |
| | | | | 269,021 |
| | | | | |
| | Norway - 0.9% | | | |
| 1,200 | | Norsk Hydro ASA | | | 44,520 |
| | | | | |
| | Portugal - 0.3% | | | |
| 1,067 | | Portugal Telecom SGPS SA | | | 14,633 |
| | | | | |
| | Singapore - 1.2% | | | |
| 2,000 | | ComfortDelgro Corp., Ltd. | | | 2,559 |
| 3,000 | | Fraser and Neave Ltd. | | | 9,765 |
| 1,000 | | Haw Par Corp. Ltd. | | | 5,250 |
| 1,000 | | Keppel Corp. Ltd. | | | 8,400 |
| 10,000 | | Neptune Orient Lines Ltd. | | | 32,157 |
| 2,000 | | SMRT Corp. Ltd. | | | 2,284 |
| | | | | |
| | | | | 60,415 |
| | | | | |
| | Spain - 3.1% | | | |
| 1,392 | | Banco Santander S.A. | | | 25,429 |
| 667 | | Endesa SA | | | 36,272 |
| 700 | | Gas Natural SDG SA | | | 37,293 |
| 1,432 | | Gestevision Telecinco SA | | | 38,067 |
| 5,204 | | Iberia Lineas Aereas de Espana | | | 23,695 |
| | | | | |
| | | | | 160,756 |
| | | | | |
| | Sweden - 2.7% | | | |
| 175 | | Hennes & Mauritz AB - Class B | | | 9,871 |
| 200 | | Hoganas AB - Class B | | | 5,735 |
| 3,000 | | Nordea Bank AB | | | 45,733 |
| 1,200 | | Skandinaviska Enskilda Banken AB - Class A | | | 36,238 |
| 1,400 | | Svenska Handelsbanken AB - Class A | | | 38,923 |
| | | | | |
| | | | | 136,500 |
| | | | | |
| | Switzerland - 6.3% | | | |
| 2,387 | | ABB Ltd. | | | 58,672 |
| 930 | | Credit Suisse Group | | | 60,766 |
| 243 | | Nestle SA | | | 105,683 |
| 52 | | Rieter Holding AG | | | 27,715 |
| 49 | | Swatch Group AG | | | 14,670 |
| 185 | | Zurich Financial Services AG | | | 52,937 |
| | | | | |
| | | | | 320,443 |
| | | | | |
See notes to financial statements.
Annual Report | August 31, 2007 | 13
Claymore Exchange-Traded Fund Trust 2 | Portfolio of Investments continued
EEN | Claymore/Robeco Developed International Equity ETF (continued)
| | | | | |
Number
of Shares | | Description | | Value |
| | United Kingdom - 21.7% | | | |
| 1,842 | | 3i Group PLC | | $ | 39,198 |
| 731 | | Anglo American PLC | | | 41,934 |
| 1,220 | | AstraZeneca PLC | | | 60,167 |
| 1,087 | | Berkeley Group Holdings PLC | | | 35,234 |
| 2,052 | | Bovis Homes Group PLC | | | 31,829 |
| 10,322 | | BP PLC | | | 116,071 |
| 3,571 | | British Airways PLC (a) | | | 30,558 |
| 1,715 | | British Land Co. PLC - REIT | | | 44,728 |
| 6,464 | | BT Group PLC | | | 41,168 |
| 2,440 | | Daily Mail & General Trust - Class A | | | 33,393 |
| 1,252 | | Davis Service Group PLC | | | 14,912 |
| 1,543 | | Hammerson PLC - REIT | | | 41,331 |
| 740 | | Home Retail Group | | | 6,183 |
| 1,009 | | International Power PLC | | | 8,232 |
| 460 | | Invensys PLC | | | 3,171 |
| 1,691 | | J Sainsbury PLC | | | 18,896 |
| 744 | | Land Securities Group PLC - REIT | | | 27,192 |
| 5,368 | | Lloyds TSB Group PLC | | | 59,010 |
| 3,173 | | Marks & Spencer Group PLC | | | 40,001 |
| 144 | | Next PLC | | | 5,609 |
| 2,866 | | Rolls-Royce Group PLC | | | 29,540 |
| 6,583 | | Royal Bank of Scotland Group PLC | | | 76,284 |
| 1,926 | | Royal Dutch Shell PLC - Class B | | | 75,133 |
| 1,520 | | Schroders PLC | | | 40,593 |
| 5,467 | | Stagecoach Group PLC | | | 24,480 |
| 325 | | Travis Perkins PLC | | | 11,701 |
| 1,714 | | Unilever PLC | | | 54,036 |
| 30,842 | | Vodafone Group PLC | | | 99,411 |
| | | | | |
| | | | | 1,109,995 |
| | | | | |
| | Total Common Stocks - 97.9% | | | |
| | (Cost - $4,978,043) | | | 5,003,427 |
| | | | | |
| | Preferred Stock - 0.9% | | | |
| | Germany – 0.9% | | | |
| 366 | | Volkswagen AG | | | |
| | (Cost - $30,644) | | | 45,829 |
| | | | | |
| | Total Investments - 98.8% | | | |
| | (Cost - $5,008,687) | | | 5,049,256 |
| | Other Assets in Excess of Liabilities - 1.2% | | | 58,873 |
| | | | | |
| | Net Assets - 100.0% | | $ | 5,108,129 |
| | | | | |
AG – Stock Corporation
REIT – Real Estate Investment Trust
OYJ – Public Traded Company
PLC – Public Limited Company
SA – Corporation
SpA – Limited Share Corporation
| (a) | Non-Income producing security. |
See notes to financial statements.
14 | Annual Report | August 31, 2007
Claymore Exchange-Traded Fund Trust 2 | Portfolio of Investments continued
EEW | Claymore/Robeco Developed World Equity ETF
| | | | | |
Number
of Shares | | Description | | Value |
| | Common Stocks - 99.5% | | | |
| | Austria - 0.7% | | | |
| 1,634 | | Wiener Staedtische Versicherung AG | | $ | 112,313 |
| | | | | |
| | Australia - 2.0% | | | |
| 1,518 | | Amcor Ltd. | | | 9,386 |
| 5,220 | | Coca-Cola Amatil Ltd. | | | 40,386 |
| 2,106 | | Commonwealth Bank of Australia | | | 94,490 |
| 768 | | Goodman Fielder Ltd. | | | 1,625 |
| 1,904 | | Santos Ltd. | | | 20,524 |
| 6,126 | | Westpac Banking Corp. | | | 135,560 |
| | | | | |
| | | | | 301,971 |
| | | | | |
| | Belgium - 0.4% | | | |
| 724 | | Omega Pharma SA | | | 63,858 |
| | | | | |
| | Bermuda - 0.1% | | | |
| 87 | | Ingersoll-Rand Co. Ltd. - Class A | | | 4,518 |
| | | | | |
| | Canada - 4.5% | | | |
| 340 | | Alcan, Inc. | | | 33,507 |
| 2,675 | | Bank of Nova Scotia | | | 132,100 |
| 2,325 | | EnCana Corp. | | | 136,025 |
| 962 | | Fording Canadian Coal Trust | | | 31,656 |
| 1,641 | | George Weston Ltd. | | | 111,070 |
| 5,377 | | Methanex Corp. | | | 120,263 |
| 2,175 | | Royal Bank of Canada | | | 111,726 |
| 372 | | Teck Cominco Ltd. - Class B | | | 15,825 |
| | | | | |
| | | | | 692,172 |
| | | | | |
| | Denmark - 0.7% | | | |
| 1,475 | | Jyske Bank A/S (a) | | | 109,861 |
| | | | | |
| | Germany - 4.4% | | | |
| 1,429 | | Arcandor AG | | | 38,962 |
| 1,158 | | BASF AG | | | 153,334 |
| 1,061 | | Deutsche Bank AG | | | 131,088 |
| 1,053 | | E.ON AG | | | 176,782 |
| 377 | | Muenchener Rueckversicherungs AG | | | 65,158 |
| 583 | | Volkswagen AG | | | 120,488 |
| | | | | |
| | | | | 685,812 |
| | | | | |
| | Finland - 1.9% | | | |
| 5,942 | | Nokia OYJ | | | 195,787 |
| 3,195 | | Orion OYJ - Class B | | | 76,179 |
| 744 | | Stora Enso OYJ - Class R | | | 13,267 |
| | | | | |
| | | | | 285,233 |
| | | | | |
| | France - 4.3% | | | |
| 573 | | Bouygues | | | 45,158 |
| 2,736 | | Business Objects SA (a) | | | 120,437 |
| 155 | | Cie Generale d’Optique Essilor International SA | | | 9,414 |
| 361 | | Gecina SA | | | 59,287 |
| 1,917 | | Sanofi-Aventis | | | 156,592 |
| 528 | | Technip SA | | | 42,173 |
| 1,637 | | Thales SA | | | 92,948 |
| 3,367 | | Vivendi | | | 137,748 |
| | | | | |
| | | | | 663,757 |
| | | | | |
| | Hong Kong - 1.7% | | | |
| 2,000 | | Cheung Kong Holdings Ltd. | | | 29,423 |
| 7,800 | | Hang Seng Bank Ltd. | | | 122,351 |
| 10,000 | | Swire Pacific Ltd. - Class A | | | 110,559 |
| | | | | |
| | | | | 262,333 |
| | | | | |
| | Italy - 2.4% | | | |
| 12,965 | | Enel SpA | | | 133,973 |
| 4,178 | | Fiat SpA | | | 111,065 |
| 56,194 | | Telecom Italia SpA | | | 126,018 |
| | | | | |
| | | | | 371,056 |
| | | | | |
| | Japan - 9.6% | | | |
| 6,000 | | Central Glass Co. Ltd. | | | 30,902 |
| 6 | | Central Japan Railway Co. | | | 67,291 |
| 2,500 | | FUJIFILM Holdings Corp. | | | 108,700 |
| 24 | | Japan Tobacco, Inc. | | | 133,132 |
| 19 | | KDDI Corp. | | | 146,702 |
| 8,000 | | Matsushita Electric Industrial Co. Ltd. | | | 139,413 |
| 16 | | Mitsubishi UFJ Financial Group, Inc. | | | 153,216 |
| 5,800 | | NamCo Bandai Holdings, Inc. | | | 84,012 |
| 9,000 | | NEC Corp. | | | 42,471 |
| 300 | | Nintendo Co. Ltd. | | | 138,981 |
| 19,000 | | Nippon Steel Corp. | | | 133,097 |
| 27 | | NTT Data Corp. | | | 130,440 |
| 41 | | NTT DoCoMo, Inc. | | | 62,606 |
| 200 | | Shin-Etsu Chemical Co. Ltd. | | | 14,459 |
| 5,000 | | Sumitomo Metal Industries Ltd. | | | 25,320 |
| 1,200 | | Suzuken Co. Ltd. | | | 39,650 |
| 2,000 | | Toyo Suisan Kaisha Ltd. | | | 34,939 |
| | | | | |
| | | | | 1,485,331 |
| | | | | |
| | Netherlands - 1.9% | | | |
| 1,798 | | ABN AMRO Holding NV | | | 83,657 |
| 170 | | Heineken NV | | | 10,772 |
| 2,332 | | Koninklijke DSM NV | | | 119,312 |
| 3,626 | | Royal KPN NV | | | 56,550 |
| 1,443 | | STMicroelectronics NV | | | 25,140 |
| | | | | |
| | | | | 295,431 |
| | | | | |
See notes to financial statements.
Annual Report | August 31, 2007 | 15
Claymore Exchange-Traded Fund Trust 2 | Portfolio of Investments continued
EEW | Claymore/Robeco Developed World Equity ETF (continued)
| | | | | |
Number
of Shares | | Description | | Value |
| | Norway - 0.8% | | | |
| 650 | | Norsk Hydro ASA | | $ | 24,115 |
| 6,500 | | Orkla ASA | | | 105,391 |
| | | | | |
| | | | | 129,506 |
| | | | | |
| | Portugal - 0.1% | | | |
| 1,504 | | Portugal Telecom SGPS SA | | | 20,626 |
| | | | | |
| | Singapore - 1.5% | | | |
| 24,000 | | Fraser and Neave Ltd. | | | 78,120 |
| 2,000 | | Haw Par Corp. Ltd. | | | 10,500 |
| 1,000 | | Keppel Corp. Ltd. | | | 8,400 |
| 32,000 | | Neptune Orient Lines Ltd. | | | 102,901 |
| 1,000 | | Singapore Airlines Ltd. | | | 12,469 |
| 18,000 | | SMRT Corp. Ltd. | | | 20,554 |
| | | | | |
| | | | | 232,944 |
| | | | | |
| | South Africa - 0.0% | | | |
| 1 | | Mondi Ltd. | | | 10 |
| | | | | |
| | Spain - 1.0% | | | |
| 1,300 | | Gas Natural SDG SA | | | 69,259 |
| 2,827 | | Gestevision Telecinco SA | | | 75,151 |
| 2,056 | | Iberia Lineas Aereas de Espana | | | 9,361 |
| | | | | |
| | | | | 153,771 |
| | | | | |
| | Sweden - 2.1% | | | |
| 8,000 | | Nordea Bank AB | | | 121,954 |
| 2,900 | | Skandinaviska Enskilda Banken AB - Class A | | | 87,574 |
| 5,200 | | SKF AB - Class B | | | 106,071 |
| 100 | | Svenska Handelsbanken AB - Class A | | | 2,780 |
| | | | | |
| | | | | 318,379 |
| | | | | |
| | Switzerland - 2.2% | | | |
| 1,982 | | ABB Ltd. | | | 48,718 |
| 1,086 | | Credit Suisse Group | | | 70,959 |
| 49 | | Nestle SA | | | 21,311 |
| 575 | | Sonova Holding AG | | | 50,823 |
| 60 | | Swatch Group AG | | | 17,963 |
| 465 | | Zurich Financial Services AG | | | 133,058 |
| | | | | |
| | | | | 342,832 |
| | | | | |
| | United Kingdom - 10.0% | | | |
| 2,344 | | Anglo American PLC | | | 134,463 |
| 10,391 | | British Airways PLC (a) | | | 88,919 |
| 2,809 | | British Energy Group PLC | | | 26,261 |
| 4,651 | | British Land Co. PLC - REIT | | | 121,300 |
| 294 | | Daily Mail & General Trust - Class A | | | 4,024 |
| 9,372 | | Davis Service Group PLC | | | 111,627 |
| 880 | | GlaxoSmithKline PLC | | | 22,986 |
| 115 | | Hammerson PLC - REIT | | | 3,080 |
| 6,344 | | Home Retail Group PLC | | | 53,008 |
| 1,846 | | International Power PLC | | | 15,061 |
| 696 | | J Sainsbury PLC | | | 7,777 |
| 6,953 | | Lloyds TSB Group PLC | | | 76,434 |
| 4,057 | | London Stock Exchange Group PLC | | | 111,782 |
| 6,780 | | Marks & Spencer Group PLC | | | 85,472 |
| 10,798 | | Mondi PLC | | | 106,613 |
| 14,595 | | Royal Bank of Scotland Group PLC | | | 169,126 |
| 4,306 | | Royal Dutch Shell PLC - Class B | | | 167,976 |
| 44 | | SABMiller PLC | | | 1,207 |
| 3,085 | | Schroders PLC | | | 82,387 |
| 1,530 | | Stagecoach Group PLC | | | 6,851 |
| 1,065 | | Tomkins PLC | | | 5,129 |
| 4,394 | | Unilever PLC | | | 138,527 |
| | | | | |
| | | | | 1,540,010 |
| | | | | |
| | United States - 47.2% | | | |
| 6,403 | | ADC Telecommunications, Inc. (a) | | | 117,175 |
| 2,590 | | Aetna, Inc. | | | 131,857 |
| 64 | | Aflac, Inc. | | | 3,412 |
| 1,956 | | Allstate Corp. (The) | | | 107,091 |
| 1,647 | | Alltel Corp. | | | 112,424 |
| 2,793 | | Altria Group, Inc. | | | 193,862 |
| 1,655 | | Amazon.Com, Inc. (a) | | | 132,251 |
| 2,286 | | American International Group, Inc. | | | 150,876 |
| 702 | | Apple, Inc. (a) | | | 97,213 |
| 118 | | Avis Budget Group, Inc. (a) | | | 2,739 |
| 1,840 | | Biogen Idec, Inc. (a) | | | 117,429 |
| 1,352 | | Boeing Co. | | | 130,738 |
| 829 | | Career Education Corp. (a) | | | 24,621 |
| 1,741 | | CBS Corp. - Class B | | | 54,859 |
| 2,524 | | Chevron Corp. | | | 221,506 |
| 626 | | Cigna Corp. | | | 32,352 |
| 1,941 | | Citigroup, Inc. | | | 90,994 |
| 698 | | Discover Financial Services (a) | | | 16,152 |
| 519 | | Eastman Kodak Co. | | | 13,842 |
| 4,321 | | Electronic Data Systems Corp. | | | 98,908 |
| 1,803 | | Expedia, Inc. (a) | | | 53,820 |
| 2,302 | | Express Scripts, Inc. (a) | | | 126,034 |
| 4,406 | | Exxon Mobil Corp. | | | 377,726 |
| 1,826 | | FirstEnergy Corp. | | | 112,189 |
| 719 | | General Mills, Inc. | | | 40,178 |
| 753 | | Goldman Sachs Group, Inc. (The) | | | 132,535 |
| 3,877 | | Halliburton Co. | | | 134,105 |
| 3,799 | | Hewlett-Packard Co. | | | 187,481 |
| 2,130 | | HJ Heinz Co. | | | 96,042 |
| 7,803 | | Intel Corp. | | | 200,927 |
| 1,836 | | International Business Machines Corp. | | | 214,243 |
| 2,508 | | International Paper Co. | | | 88,056 |
| 1,562 | | Invitrogen Corp. (a) | | | 121,680 |
| 4,158 | | JPMorgan Chase & Co. | | | 185,114 |
| 3,079 | | Juniper Networks, Inc. (a) | | | 101,361 |
See notes to financial statements.
16 | Annual Report | August 31, 2007
Claymore Exchange-Traded Fund Trust 2 | Portfolio of Investments continued
EEW | Claymore/Robeco Developed World Equity ETF (continued)
| | | | | |
Number
of Shares | | Description | | Value |
| | Unitied States (continued) | | | |
| 1,095 | | Kroger Co. (The) | | $ | 29,105 |
| 1,580 | | Lehman Brothers Holdings, Inc. | | | 86,631 |
| 450 | | Lennar Corp. - Class A | | | 12,721 |
| 207 | | Liberty Media Corp. - Series A (a) | | | 22,561 |
| 1,312 | | Lockheed Martin Corp. | | | 130,072 |
| 1,838 | | Marathon Oil Corp. | | | 99,050 |
| 51 | | Mastercard, Inc. - Class A | | | 6,986 |
| 2,935 | | McDonald’s Corp. | | | 144,549 |
| 1,960 | | McKesson Corp. | | | 112,132 |
| 1,042 | | MedCo Health Solutions, Inc. (a) | | | 89,039 |
| 3,381 | | Merck & Co., Inc. | | | 169,625 |
| 1,755 | | Merrill Lynch & Co., Inc. | | | 129,343 |
| 1,762 | | MGIC Investment Corp. | | | 53,142 |
| 69 | | Microsoft Corp. | | | 1,982 |
| 1,406 | | Morgan Stanley | | | 87,692 |
| 687 | | National Oilwell Varco, Inc. (a) | | | 87,936 |
| 362 | | Novellus Systems, Inc. (a) | | | 9,908 |
| 181 | | NVR, Inc. (a) | | | 101,270 |
| 989 | | Occidental Petroleum Corp. | | | 56,066 |
| 351 | | Pactiv Corp. (a) | | | 10,267 |
| 619 | | Parker Hannifin Corp. | | | 66,524 |
| 8,370 | | Pfizer, Inc. | | | 207,911 |
| 751 | | PG&E Corp. | | | 33,419 |
| 1,518 | | Prudential Financial, Inc. | | | 136,286 |
| 748 | | Public Service Enterprise Group, Inc. | | | 63,573 |
| 481 | | Raytheon Co. | | | 29,505 |
| 1,132 | | Rockwell Automation, Inc. | | | 79,761 |
| 1,619 | | Safeco Corp. | | | 93,934 |
| 601 | | Sara Lee Corp. | | | 9,989 |
| 651 | | Sears Holdings Corp. (a) | | | 93,458 |
| 1,752 | | Sprint Nextel Corp. | | | 33,148 |
| 1,517 | | Sunoco, Inc. | | | 110,953 |
| 3,950 | | Texas Instruments, Inc. | | | 135,248 |
| 7,195 | | Time Warner, Inc. | | | 136,561 |
| 1,275 | | UnitedHealth Group, Inc. | | | 63,763 |
| 1,888 | | Valero Energy Corp. | | | 129,347 |
| 3,383 | | Walt Disney Co. (The) | | | 113,669 |
| 2,106 | | Washington Mutual, Inc. | | | 77,332 |
| 1,827 | | WellPoint, Inc. (a) | | | 147,238 |
| 2,552 | | Xerox Corp. (a) | | | 43,716 |
| | | | | |
| | | | | 7,267,204 |
| | | | | |
| | Total Investments - 99.5% | | | |
| | (Cost - $14,877,412) | | | 15,338,928 |
| | Other Assets in excess of Liabilities - 0.5% | | | 73,201 |
| | | | | |
| | Net Assets - 100.0% | | $ | 15,412,129 |
| | | | | |
ASA – Stock Company
AG – Stock Corporation
REIT – Real Estate Investment Trust
OYJ – Public Traded Company
PLC – Public Limited Company
SA – Corporation
SpA – Limited Share Corporation
| (a) | Non-income producing security. |
See notes to financial statements.
Annual Report | August 31, 2007 | 17
Claymore Exchange-Traded Fund Trust 2 | Portfolio of Investments continued
CGW | Claymore S&P Global Water Index ETF
| | | | | |
Number of Shares | | Description | | Value |
| | Common Stocks - 97.8% | | | |
| | Austria - 0.3% | | | |
| 41,360 | | Christ Water Technology AG (a) | | $ | 780,919 |
| | | | | |
| | Brazil - 2.4% | | | |
| 123,555 | | Cia de Saneamento Basico do Estado de Sao Paulo - ADR (a) | | | 6,057,902 |
| | | | | |
| | Canada - 1.0% | | | |
| 250,651 | | GLV, Inc., Class A (a) | | | 2,558,993 |
| | | | | |
| | Cayman Islands - 0.2% | | | |
| 15,108 | | Consolidated Water Co, Inc. | | | 445,837 |
| | | | | |
| | China - 2.3% | | | |
| 5,834,000 | | Guangdong Investment Ltd. (Hong Kong) | | | 3,658,994 |
| 3,218,000 | | Tianjin Capital Environmental Protection | | | 2,084,317 |
| | | | | |
| | | | | 5,743,311 |
| | | | | |
| | Finland - 4.8% | | | |
| 261,913 | | Kemira OYJ | | | 6,319,838 |
| 152,453 | | Uponor OYJ | | | 5,848,381 |
| | | | | |
| | | | | 12,168,219 |
| | | | | |
| | France - 19.4% | | | |
| 426,849 | | Suez SA | | | 24,288,591 |
| 325,214 | | Veolia Environnement SA | | | 24,951,630 |
| | | | | |
| | | | | 49,240,221 |
| | | | | |
| | Italy - 5.2% | | | |
| 220,505 | | ACEA SpA | | | 4,010,051 |
| 753,677 | | ASM SpA | | | 4,453,998 |
| 57,983 | | Acegas-APS SpA | | | 629,596 |
| 1,037,252 | | Hera SpA | | | 4,150,190 |
| | | | | |
| | | | | 13,243,835 |
| | | | | |
| | Japan - 15.6% | | | |
| 1,256,000 | | Kubota Corp. | | | 9,730,302 |
| 303,700 | | Kurita Water Industries Ltd. | | | 9,222,482 |
| 38,000 | | Maezawa Kyuso Industries Co., Ltd. | | | 673,683 |
| 2,600,000 | | Mitsubishi Heavy Industries Ltd. | | | 15,903,033 |
| 650,000 | | Mitsubishi Rayon Co., Ltd. | | | 4,138,377 |
| | | | | |
| | | | | 39,667,877 |
| | | | | |
| | Singapore - 1.3% | | | |
| 1,272,000 | | Hyflux Ltd. | | | 2,203,754 |
| 1,091,000 | | Sinomem Technology Ltd. | | | 959,404 |
| | | | | |
| | | | | 3,163,158 |
| | | | | |
| | Spain - 2.4% | | | |
| 165,093 | | Sociedad General de Aguas de Barcelona SA, Class A | | | 6,009,184 |
| | | | | |
| | Switzerland - 1.6% | | | |
| 75,497 | | Ciba Specialty Chemicals AG | | | 4,130,060 |
| | | | | |
| | United Kingdom - 12.6% | | | |
| 281,813 | | Kelda Group PLC | | | 4,956,713 |
| 529,578 | | Northumbrian Water Group PLC | | | 3,693,247 |
| 361,758 | | Pennon Group PLC | | | 4,389,045 |
| 245,166 | | Severn Trent PLC | | | 6,750,084 |
| 867,798 | | United Utilities PLC | | | 12,112,701 |
| | | | | |
| | | | | 31,901,790 |
| | | | | |
| | United States - 28.7% | | | |
| 19,406 | | American States Water Co. | | | 757,998 |
| 136,231 | | Aqua America, Inc. | | | 3,264,095 |
| 55,588 | | Arch Chemicals, Inc. | | | 2,408,072 |
| 28,554 | | Badger Meter, Inc. | �� | | 896,310 |
| 19,998 | | California Water Service Group | | | 774,523 |
| 140,206 | | Danaher Corp. | | | 10,888,398 |
| 79,098 | | Flow International Corp. (a) | | | 649,395 |
| 64,459 | | Flowserve Corp. | | | 4,603,017 |
| 50,523 | | Franklin Electric Co., Inc. | | | 2,085,589 |
| 91,342 | | IDEX Corp. | | | 3,513,927 |
| 168,921 | | ITT Corp. | | | 11,484,939 |
| 16,192 | | Layne Christensen Co. (a) | | | 799,399 |
| 296,956 | | Mueller Water Products, Inc., Class B | | | 3,251,668 |
| 341,804 | | Nalco Holding Co. | | | 8,545,100 |
| 233,453 | | Pentair, Inc. | | | 8,668,110 |
| 20,180 | | Pico Holdings, Inc. (a) | | | 887,920 |
| 93,621 | | Roper Industries, Inc. | | | 5,925,273 |
| 17,812 | | SJW Corp. | | | 611,130 |
| 21,745 | | Southwest Water Co. | | | 303,995 |
| 71,417 | | Watts Water Technologies, Inc., Class A | | | 2,529,590 |
| | | | | |
| | | | | 72,848,448 |
| | | | | |
| | Total Long-Term Investments - 97.8% | | | |
| | (Cost $253,940,161) | | | 247,959,754 |
| | | | | |
| | | | | | |
Principal
Amount | | Description | | Value |
| | | Short-Term Investments - 0.2% | | | |
| | | U.S. Government and Agency Securities - 0.2% | | | |
| $ | 455,000 | | Federal Home Loan Bank Discount Note, yielding 4.10%, | | | |
| | | maturing 9/04/07 | | | |
| | | (Cost $454,845) | | | 455,000 |
| | | | | | |
| | | Total Investments - 98.0% | | | |
| | | (Cost $254,395,006) | | | 248,414,754 |
| | | Other Assets in excess of Liabilities - 2.0% | | | 5,130,189 |
| | | | | | |
| | | Net Assets - 100.0% | | $ | 253,544,943 |
| | | | | | |
ADR – American Depositary Receipt
AG – Stock Corporation
OYJ – Public Traded Company
PLC – Public Limited Company
SA – Corporation
SpA – Limited Share Company
| (a) | Non-income producing security. |
See notes to financial statements.
18 | Annual Report | August 31, 2007
Claymore Exchange-Traded Fund Trust 2
Statement of Assets and Liabilities | August 31, 2007
| | | | | | | | | | |
| | | Claymore/Robeco
Developed
International
Equity ETF | | Claymore/Robeco
Developed World
Equity ETF | | Claymore S&P
Global Water
Index ETF | |
Assets | | | | | | | | | | |
Investments in securities, at value | | $ | 5,049,256 | | $ | 15,338,928 | | $ | 248,414,754 | |
Foreign currency, at value | | | — | | | 18,549 | | | 83,812 | |
Cash | | | 11,592 | | | — | | | 62,041 | |
Receivables: | | | | | | | | | | |
Fund shares sold | | | — | | | — | | | — | |
Dividends | | | 12,303 | | | 26,446 | | | 249,099 | |
Investments sold | | | 1,408 | | | 2,270 | | | 4,937,313 | |
Due from Adviser | | | 71,122 | | | 69,342 | | | – | |
Other assets | | | 40,094 | | | 40,160 | | | 50,084 | |
| | | | | | | | | | |
Total assets | | | 5,185,775 | | | 15,495,695 | | | 253,797,103 | |
| | | | | | | | | | |
Liabilities | | | | | | | | | | |
Custodian bank | | | 7,628 | | | 4,821 | | | — | |
Payables: | | | | | | | | | | |
Investments purchased | | | 1,379 | | | 10,333 | | | 12,076 | |
Administration fee payable | | | 174 | | | 352 | | | 5,448 | |
Offering costs payable | | | — | | | — | | | 41,396 | |
Accrued advisory fees | | | — | | | — | | | 86,480 | |
Accrued expenses | | | 68,465 | | | 68,060 | | | 106,760 | |
| | | | | | | | | | |
Total liabilities | | | 77,646 | | | 83,566 | | | 252,160 | |
| | | | | | | | | | |
Net Assets | | $ | 5,108,129 | | $ | 15,412,129 | | $ | 253,544,943 | |
| | | | | | | | | | |
Composition of Net Assets | | | | | | | | | | |
Paid-in capital | | $ | 4,902,384 | | $ | 14,672,527 | | $ | 258,915,459 | |
Undistributed net investment income (loss) | | | 119,839 | | | 156,964 | | | 751,169 | |
Net realized gain (loss) on investments and currency transactions | | | 45,269 | | | 120,710 | | | (137,407 | ) |
Net unrealized appreciation (depreciation) on investments and currency translation | | | 40,637 | | | 461,928 | | | (5,984,278 | ) |
| | | | | | | | | | |
Net Assets | | $ | 5,108,129 | | $ | 15,412,129 | | $ | 253,544,943 | |
| | | | | | | | | | |
Shares oustanding ($0.01 par value with unlimited amount authorized) | | | 202,000 | | | 602,000 | | | 10,200,000 | |
Net Asset Value | | $ | 25.29 | | $ | 25.60 | | $ | 24.86 | |
| | | | | | | | | | |
Investments in securities, at cost | | $ | 5,008,687 | | $ | 14,877,413 | | $ | 254,395,006 | |
| | | | | | | | | | |
Foreign currency, at cost | | $ | — | | $ | 10,203 | | $ | 83,812 | |
| | | | | | | | | | |
See notes to financial statements.
Annual Report | August 31, 2007 | 19
Claymore Exchange-Traded Fund Trust 2
Statement of Operations | For the period ended August 31, 2007
| | | | | | | | | | | | |
| | | Claymore/Robeco
Developed
International
Equity ETF* | | | Claymore/Robeco
Developed World
Equity ETF* | | | Claymore S&P
Global Water
Index ETF** | |
Investment Income | | | | | | | | | | | | |
Dividend income | | $ | 195,127 | | | $ | 232,432 | | | $ | 1,097,167 | |
Interest | | | — | | | | — | | | | 679 | |
Foreign taxes withheld | | | (20,568 | ) | | | (18,569 | ) | | | (25,693 | ) |
| | | | | | | | | | | | |
Total investment income | | | 174,559 | | | | 213,863 | | | | 1,072,153 | |
| | | | | | | | | | | | |
Expenses | | | | | | | | | | | | |
Advisory fee | | | 24,748 | | | | 39,080 | | | | 251,649 | |
Administration fee | | | 1,361 | | | | 2,149 | | | | 13,421 | |
Custodian fee | | | 49,435 | | | | 37,057 | | | | 14,676 | |
Licensing | | | 4,949 | | | | 7,816 | | | | 53,161 | |
Listing fee and expenses | | | 5,008 | | | | 5,012 | | | | 4,140 | |
Miscellaneous | | | 12,578 | | | | 12,856 | | | | 7,378 | |
Offering costs | | | 24,700 | | | | 24,700 | | | | 14,766 | |
Printing expenses | | | 8,224 | | | | 7,724 | | | | 14,800 | |
Professional fees | | | 33,404 | | | | 33,244 | | | | 34,060 | |
Registration & filings | | | 318 | | | | 1,571 | | | | 8,228 | |
Trustees’ fees and expenses | | | 1,175 | | | | 1,084 | | | | 1,156 | |
| | | | | | | | | | | | |
Total expenses | | | 165,900 | | | | 172,293 | | | | 417,435 | |
Advisory fees waived | | | (24,748 | ) | | | (39,080 | ) | | | (53,977 | ) |
Other expenses waived or reimbursed | | | (76,062 | ) | | | (56,124 | ) | | | — | |
| | | | | | | | | | | | |
Net Expenses | | | 65,090 | | | | 77,089 | | | | 363,458 | |
| | | | | | | | | | | | |
Net Investment Income (Loss) | | | 109,469 | | | | 136,774 | | | | 708,695 | |
| | | | | | | | | | | | |
Realized and Unrealized Gain (Loss) | | | | | | | | | | | | |
Net realized gain (loss) on | | | | | | | | | | | | |
Investments | | | 45,269 | | | | 120,710 | | | | (137,407 | ) |
In-kind transactions | | | (60,468 | ) | | | — | | | | 967,525 | |
Foreign currency transactions | | | (9,745 | ) | | | (566 | ) | | | 28,220 | |
| | | | | | | | | | | | |
Net realized gain (loss) | | | (24,944 | ) | | | 120,144 | | | | 858,338 | |
Net unrealized appreciation (depreciation) on | | | | | | | | | | | | |
Investments | | | 40,569 | | | | 461,516 | | | | (5,980,252 | ) |
Foreign currency translation | | | 68 | | | | 412 | | | | (4,026 | ) |
| | | | | | | | | | | | |
Net unrealized appreciation (depreciation) | | | 40,637 | | | | 461,928 | | | | (5,984,278 | ) |
| | | | | | | | | | | | |
Net realized and unrealized gain (loss) | | | 15,693 | | | | 582,072 | | | | (5,125,940 | ) |
| | | | | | | | | | | | |
Net Increase (Decrease) in Net Assets Resulting from Operations | | $ | 125,162 | | | $ | 718,846 | | | $ | (4,417,245 | ) |
| | | | | | | | | | | | |
| * | Commencement of investment operations – March 1, 2007 |
| ** | Commencement of investment operations – May 14, 2007 |
See notes to financial statements.
20 | Annual Report | August 31, 2007
Claymore Exchange-Traded Fund Trust 2
Statement of Changes in Net Assets | For the period ended August 31, 2007
| | | | | | | | | | | |
| | | Claymore/Robeco
Developed
International
Equity ETF* | | | Claymore/Robeco
Developed World
Equity ETF* | | Claymore S&P
Global Water
Index ETF** | |
Increase in Net Assets Resulting from Operations | | | | | | | | | | | |
Net investment income (loss) | | $ | 109,469 | | | $ | 136,774 | | $ | 708,695 | |
Net realized gain (loss) | | | (24,944 | ) | | | 120,144 | | | 858,338 | |
Net unrealized appreciation (depreciation) | | | 40,637 | | | | 461,928 | | | (5,984,278 | ) |
| | | | | | | | | | | |
Net increase (decrease) in net assets resulting from operations | | | 125,162 | | | | 718,846 | | | (4,417,245 | ) |
| | | | | | | | | | | |
Capital Share Transactions | | | | | | | | | | | |
Proceeds from sale of shares | | | 9,852,668 | | | | 14,643,283 | | | 282,633,313 | |
Cost of shares redeemed | | | (4,919,701 | ) | | | — | | | (24,671,125 | ) |
| | | | | | | | | | | |
Net increase from capital share transactions | | | 4,932,967 | | | | 14,643,283 | | | 257,962,188 | |
| | | | | | | | | | | |
Total increase (decrease) in net assets | | | 5,058,129 | | | | 15,362,129 | | | 253,544,943 | |
Net Assets | | | | | | | | | | | |
Beginning of period | | | 50,000 | | | | 50,000 | | | — | |
| | | | | | | | | | | |
End of period | | $ | 5,108,129 | | | $ | 15,412,129 | | $ | 253,544,943 | |
| | | | | | | | | | | |
Undistributed net investment income (loss) at end of period | | $ | 119,839 | | | $ | 156,964 | | $ | 751,169 | |
| | | | | | | | | | | |
Changes in Shares Outstanding | | | | | | | | | | | |
Shares sold | | | 400,000 | | | | 600,000 | | | 11,200,000 | |
Shares redeemed | | | (200,000 | ) | | | — | | | (1,000,000 | ) |
Shares outstanding, beginning of period | | | 2,000 | | | | 2,000 | | | — | |
| | | | | | | | | | | |
Shares outstanding, end of period | | | 202,000 | | | | 602,000 | | | 10,200,000 | |
| | | | | | | | | | | |
| * | Commencement of investment operations – March 1, 2007 |
| ** | Commencement of investment operations – May 14, 2007 |
See notes to financial statements.
Annual Report | August 31, 2007 | 21
Claymore Exchange-Traded Fund Trust 2
Financial Highlights |
EEN | Claymore/Robeco Developed International Equity ETF
| | | | |
Per share operating performance for a share outstanding throughout the period | | For the Period
March 1, 2007**
through
August 31, 2007 | |
Net asset value, beginning of period | | $ | 24.15 | |
| | | | |
Income from investment operations | | | | |
Net investment income (loss)(a) | | | 0.28 | |
Net realized and unrealized gain (loss) on investments | | | 0.86 | |
| | | | |
Total from investment operations | | | 1.14 | |
| | | | |
Net asset value, end of period | | $ | 25.29 | |
| | | | |
Market value, end of period | | $ | 25.35 | |
| | | | |
Total return*(b) | | | | |
Net asset value | | | 4.72 | % |
Ratios and supplemental data | | | | |
Net assets, end of period (thousands) | | $ | 5,108 | |
Ratio of net expenses to average net assets* | | | 1.32 | %(c) |
Ratio of net investment income (loss) to average net assets* | | | 2.21 | %(c) |
Portfolio turnover rate | | | 55 | %(d) |
| * | If certain expenses had not been waived or reimbursed by the Adviser, total return would have been lower and the ratios would have been as follows: |
| | | |
Ratio of total expenses to average assets | | 3.35 | %(c) |
Ratio of net investment income (loss) to average net assets | | 0.18 | %(c) |
| ** | Commencement of investment operations and initial listing date on the American Stock Exchange |
| (a) | Based on average shares outstanding during the period. |
| (b) | Total investment return is calculated assuming a purchase of a common share at the beginning of the period and a sale on the last day of the period reported at net asset value (“NAV”). Dividends and distributions are assumed to be reinvested at NAV. Total investment return does not reflect brokerage commissions. A return calculated for a period of less than one year is not annualized. |
| (d) | Portfolio turnover is not annualized and does not include securities received or delivered from processing creations or redemptions. |
See notes to financial statements.
22 | Annual Report | August 31, 2007
Claymore Exchange-Traded Fund Trust 2 | Financial Highlights (continued)
EEW | Claymore/Robeco Developed World Equity ETF
| | | | |
Per share operating performance for a share outstanding throughout the period | | For the Period
March 1, 2007**
through
August 31, 2007 | |
Net asset value, beginning of period | | $ | 24.20 | |
| | | | |
Income from investment operations | | | | |
Net investment income (loss)(a) | | | 0.23 | |
Net realized and unrealized gain (loss) on investments | | | 1.17 | |
| | | | |
Total from investment operations | | | 1.40 | |
| | | | |
Net asset value, end of period | | $ | 25.60 | |
| | | | |
Market value, end of period | | $ | 25.78 | |
| | | | |
Total return*(b) | | | | |
Net asset value | | | 5.78 | % |
Ratios and supplemental data | | | | |
Net assets, end of period (thousands) | | $ | 15,412 | |
Ratio of net expenses to average net assets* | | | 0.98 | %(c) |
Ratio of net investment income (loss) to average net assets* | | | 1.75 | %(c) |
Portfolio turnover rate | | | 52 | %(d) |
| * | If certain expenses had not been waived or reimbursed by the Adviser, total return would have been lower and the ratios would have been as follows: |
| | | |
Ratio of total expenses to average assets | | 2.20 | %(c) |
Ratio of net investment income (loss) to average net assets | | 0.53 | %(c) |
| ** | Commencement of investment operations and initial listing date on the American Stock Exchange |
| (a) | Based on average shares outstanding during the period. |
| (b) | Total investment return is calculated assuming a purchase of a common share at the beginning of the period and a sale on the last day of the period reported at net asset value (“NAV”). Dividends and distributions are assumed to be reinvested at NAV. Total investment return does not reflect brokerage commissions. A return calculated for a period of less than one year is not annualized. |
| (d) | Portfolio turnover is not annualized and does not include securities received or delivered from processing creations or redemptions. |
See notes to financial statements.
Annual Report | August 31, 2007 | 23
Claymore Exchange-Traded Fund Trust 2 | Financial Highlights (continued)
CGW | Claymore S&P Global Water Index ETF
| | | | |
Per share operating performance for a share outstanding throughout the period | | For the Period
May 14, 2007**
through
August 31, 2007 | |
Net asset value, beginning of period | | $ | 24.78 | |
| | | | |
Income from investment operations | | | | |
Net investment income (loss)(a) | | | 0.10 | |
Net realized and unrealized gain (loss) | | | (0.02 | ) |
| | | | |
Total from investment operations | | | 0.08 | |
| | | | |
Net asset value, end of period | | $ | 24.86 | |
| | | | |
Market value, end of period | | $ | 25.13 | |
| | | | |
Total return*(b) | | | | |
Net asset value | | | 0.32 | % |
Ratios and supplemental data | | | | |
Net assets, end of period (thousands) | | $ | 253,545 | |
Ratio of net expenses to average net assets* | | | 0.72 | %(c) |
Ratio of net investment income (loss) to average net assets* | | | 1.41 | %(c) |
Portfolio turnover rate | | | 1 | %(d) |
| * | If certain expenses had not been waived or reimbursed by the Adviser, total return would have been lower and the ratios would have been as follows: |
| | | |
Ratio of total expenses to average net assets | | 0.83 | %(c) |
Ratio of net investment income (loss) to average net assets | | 1.30 | %(c) |
| ** | Commencement of investment operations and initial listing date on the American Stock Exchange. |
| (a) | Based on average shares outstanding during the period. |
| (b) | Total investment return is calculated assuming a purchase of a common share at the beginning of the period and a sale on the last day of the period reported at net asset value (“NAV”). Dividends and distributions are assumed to be reinvested at NAV. Total investment return does not reflect brokerage commissions. A return calculated for a period of less than one year is not annualized. |
| (d) | Portfolio turnover is not annualized and does not include securities received or delivered from processing creations or redemptions. |
See notes to financial statements.
24 | Annual Report | August 31, 2007
Claymore Exchange-Traded Fund Trust 2
Notes to Financial Statements | August 31, 2007
Note 1 – Organization:
Claymore Exchange-Traded Fund Trust 2 (the “Trust”), which was organized as a Delaware business trust on June 8, 2006, is registered as an open-end, management investment company under the Investment Company Act of 1940, as amended (the “1940 Act”). At the end of the period, the Trust consisted of the following three portfolios:
| | |
Claymore/Robeco Developed International Equity ETF | | “Robeco Developed International Equity” |
| |
Claymore/Robeco Developed World Equity ETF | | “Robeco Developed World Equity” |
| |
Claymore S&P Global Water Index ETF | | “S&P Global Water Index” |
Each portfolio represents a separate series of the Trust (each a “Fund” or collectively the “Funds”). Each Funds’ shares are listed and traded on the American Stock Exchange. The Funds’ market prices may differ to some degree from the net asset value of the shares of each Fund. Unlike conventional mutual funds, each Fund issues and redeems shares on a continuous basis, at net asset value, only in a large specified number of shares, each called a “Creation Unit.” Creation Units are issued and redeemed principally in-kind for securities included in the relevant index. Except when aggregated in Creation Units, shares are not individually redeemable securities of the Funds. The investment objective of each of the Funds is to replicate as closely as possible, before fees and expenses, the performance of the following market indices:
| | |
Fund | | Index |
Robeco Developed International Equity | | Robeco Developed International Equity Index |
| |
Robeco Developed World Equity | | Robeco Developed World Equity Index |
| |
S&P Global Water Index | | S&P Global Water Index |
Note 2 –Accounting Policies:
The preparation of the financial statements in accordance with U.S. generally accepted accounting principles requires management to make estimates and assumptions that affect the reported amounts and disclosures in the financial statements. Actual results could differ from these estimates.
The following is a summary of the significant accounting policies followed by the Funds.
(a) Valuation of Investments
Equity securities are valued at the last reported sale price on the principal exchange or on the principal over-the-counter market on which such securities are traded, as of the close of regular trading on the NYSE on the day the securities are being valued or, if there are not sales, at the mean of the most recent bid and asked prices. Equity securities that are traded primarily on the NASDAQ Stock Market are valued at the NASDAQ Official Closing Price. Events occurring after the close of trading on non-United States exchanges may result in adjustments to the valuation of foreign securities to more accurately reflect their fair value as of the close of regular trading on the New York Stock Exchange. Debt securities are valued at the mean between the last available bid and asked prices for such securities or, if such prices are not available, at prices for securities of comparable maturity, quality and type. For those securities where quotations or prices are not available, valuations are determined in accordance with procedures established in good faith by the Board of Trustees. Short-term securities with maturities of 60 days or less at time of purchase are valued at amortized cost, which approximates market value.
(b) Investment Transactions and Investment Income
Investment transactions are accounted for on the trade date. Realized gains and losses on investments are determined on the identified cost basis. Dividend income is recorded net of applicable withholding taxes on the ex-dividend date and interest income is recorded on an accrual basis. Discounts or premiums on debt securities purchased are accreted or amortized to interest income over the lives of the respective securities using the effective interest method.
(c) Currency Translation
Assets and liabilities denominated in foreign currencies are translated into U.S. dollars at the mean of the bid and asked price of respective exchange rates on the last day of the period. Purchases and sales of investments denominated in foreign currencies are translated at the exchange rate on the date of the transaction.
Foreign exchange gain or loss resulting from holding of a foreign currency, expiration of a currency exchange contract, difference in exchange rates between the trade date and settlement date of an investment purchased or sold, and the difference between dividends actually received compared to the amount shown in a Fund’s accounting records on the date of receipt are included as net realized gains or losses on foreign currency transactions in the Fund’s Statement of Operations.
Foreign exchange gain or loss on assets and liabilities, other than investments, are included in unrealized appreciation/(depreciation) on foreign currency translations.
(d) Distributions
The Funds intend to pay substantially all of their net investment income to Shareholders through annual distributions. In addition, the Funds intend to distribute any capital gains to Shareholders as capital gain dividends at least annually. The amount and timing of distributions are determined in accordance with federal income tax regulations, which may differ from U.S. generally accepted accounting principles.
(e) Offering Costs
Offering costs in the amount of $49,000 were incurred by each Fund, and are being amortized over a one-year period. Claymore Advisors, LLC has agreed to pay all organizational expenses of each Fund incurred prior to the commencement of investment operations.
Note 3 – Investment Advisory Agreement, Sub-Advisory Agreement and Other Agreements:
Pursuant to an Investment Advisory Agreement (the “Agreement”) between the Trust, on behalf of each Fund, and Claymore Advisors, LLC (the “Adviser”), the Adviser manages the investment and reinvestment of each Fund’s assets and administers the affairs of each Fund to the extent requested by the Board of Trustees.
Pursuant to the Agreement, each Fund pays the Adviser an advisory fee payable on a monthly basis at the annual rate of 0.50% of each Fund’s average daily net assets.
Under a separate Fund Administration agreement, Claymore Advisors, LLC provides Fund Administration services to the Funds. Claymore Advisors, LLC receives a fund administration fee payable monthly at the annual rate set forth below as a percentage of the average daily net assets of each Fund:
| | | |
Net Assets | | Rate | |
First $200,000,000 | | 0.0275 | % |
Next $300,000,000 | | 0.0200 | % |
Next $500,000,000 | | 0.0150 | % |
Over $1,000,000,000 | | 0.0100 | % |
Annual Report | August 31, 2007 | 25
Claymore Exchange-Traded Fund Trust 2 | Notes to Financial Statements continued
For the period ended August 31, 2007, each Fund recognized Fund Administration expenses and waived Fund Administration expenses of approximately:
| | | | | | |
| | | Fund
Administration
Expense | | Fund
Administration
Expense Waived |
Robeco Developed World Equity | | $ | 2,149 | | $ | 2,149 |
Robeco Developed International Equity | | $ | 1,361 | | $ | 1,361 |
S&P Global Water Index | | $ | 13,421 | | $ | 0 |
The Bank of New York Mellon (“BNY”) acts as the Funds’ custodian, accounting agent and transfer agent. As custodian, BNY is responsible for the custody of the Funds’ assets. As accounting agent, BNY is responsible for maintaining the books and records of the Funds’ securities and cash. As transfer agent, BNY is responsible for performing transfer agency services for the Funds.
The Funds’ Adviser has contractually agreed to waive fees and/or pay fund expenses to the extent necessary to prevent the operating expenses of the Fund (excluding interest expense, a portion of the Fund’s licensing fees, offering costs, brokerage commissions and other trading expenses, taxes and extraordinary expenses such as litigation and other expenses not incurred in the ordinary course of the Fund’s business) from exceeding 0.65% of average net assets per year, at least until December 31, 2009. The offering costs excluded from the 0.65% expense cap are (a) legal fees pertaining to the Funds’ shares offered for sale; (b) SEC and state registration fees; and (c) initial fees paid to be listed on an exchange. The Trust and the Adviser have entered into an Expense Reimbursement Agreement in which for a period of five years subsequent to the Fund’s commencement of operations, the Adviser may recover from the Fund fees and expenses waived or reimbursed during the prior three years if the Fund’s expense ratio, including the recovered expenses, falls below the expense cap.
For the period ended August 31, 2007, the Adviser waived and assumed the following fees and expenses:
| | | | | | | | | |
| | | Fees
Waived | | Expenses
Assumed | | Potentially
Recoverable
Expense |
Robeco Developed World Equity | | $ | 39,080 | | $ | 56,124 | | $ | 95,204 |
Robeco Developed International Equity | | $ | 24,748 | | $ | 76,062 | | $ | 100,810 |
S&P Global Water Index | | $ | 53,977 | | $ | 0 | | $ | 53,977 |
Certain officers and/or trustees of the Trust are officers and/or directors of the Adviser. The Trust does not compensate its officers and /or trustees who are officers or directors of the Adviser.
Licensing Fee Agreements:
The Adviser has entered into licensing agreements on behalf of each Fund with the following Licensors:
| | |
Fund | | Licensor |
Robeco Developed International Equity | | Robeco Investment Management, Inc. |
| |
Robeco Developed World Equity | | Robeco Investment Management, Inc. |
| |
S&P Global Water Index | | Standard & Poor’s, a division of The McGraw-Hill Companies, Inc. |
The above trademarks are trademarks owned by the respective Licensors. These trademarks have been licensed to the Adviser for use for certain purposes with the Funds. The Funds are not sponsored, endorsed, sold or promoted by the Licensors and the Licensors make no representation regarding the advisability of investing in Shares of the Funds. Up to 5 basis points of licensing fees are excluded from the expense cap.
Note 4 – Federal Income Taxes:
The Funds intend to comply with the requirements of Subchapter M of the Internal Revenue Code of 1986, as amended, applicable to regulated investment companies. Accordingly, no provision for U.S. federal income taxes is required. In addition, by distributing substantially all of its ordinary income and long-term capital gains, if any, during each calendar year, the Funds intend not to be subject to U.S. federal excise tax.
At August 31, 2007, the cost of investments, accumulated unrealized appreciation/depreciation on investments and accumulated earnings/loss for federal income tax purposes were as follows:
| | | | | | | | | | | | | | | | | | | | | | | | | |
| | | Cost of
Investments for
Tax Purposes | | Gross Tax
Unrealized
Appreciation | | Gross Tax
Unrealized
Depreciation | | | Net Tax
Unrealized
Appreciation
(Depreciation) | | | Net Tax
Unrealized
Appreciation/
(Depreciation)
on Foreign
Currency | | | Undistributed
Ordinary
Income/
(Accumulated
Ordinary Loss) | | Long-Term
Gains/
(Accumulated
Capital &
Other Loss) | |
Robeco Developed International Equity | | $ | 5,013,279 | | $ | 289,175 | | $ | (253,198 | ) | | $ | 35,977 | | | $ | 68 | | | $ | 169,700 | | $ | 0 | |
Robeco Developed World Equity | | $ | 14,886,734 | | $ | 1,067,997 | | $ | (615,803 | ) | | $ | 452,194 | | | $ | 413 | | | $ | 286,995 | | $ | 0 | |
S&P Global Water Index | | $ | 254,398,951 | | $ | 3,795,431 | | $ | (9,779,628 | ) | | $ | (5,984,197 | ) | | $ | (4,026 | ) | | $ | 751,169 | | $ | (133,462 | ) |
The difference between book basis and tax basis unrealized appreciation/(depreciation) is attributable to the tax deferral of losses on wash sales and the mark to market on passive foreign investment companies.
26 | Annual Report | August 31, 2007
Claymore Exchange-Traded Fund Trust 2 | Notes to Financial Statements continued
Capital losses incurred after October 31 (“post-October losses”) within the taxable year are deemed to arise on the first business day of each Fund’s next taxable year. During the period ended August 31, 2007, the following Funds incurred and will elect to defer net capital losses as follows:
| | | |
| | | Post-October
Losses |
S&P Global Water Index | | $ | 133,462 |
At August 31, 2007 the following reclassifications were made to the capital accounts of the Funds, to reflect permanent book/tax differences and income and gains available for distributions under income tax regulations, which are primarily due to the differences between book and tax treatment of foreign currency income/loss, offering costs and redemption of in-kind transactions. Net investment income, net realized gains and net assets were not affected by these changes.
| | | | | | | | | | | |
| | | Undistributed
Net Investment
Income/(Loss) | | Accumulated
Net Realized
Gain/(Loss) | | | Paid in
Capital | |
Robeco Developed International Equity | | $ | 10,370 | | $ | 70,213 | | | $ | (80,583 | ) |
Robeco Developed World Equity | | $ | 20,190 | | $ | 566 | | | $ | (20,756 | ) |
S&P Global Water Index | | $ | 42,474 | | $ | (995,745 | ) | | $ | 953,271 | |
Note 5 – Investment Transactions:
For the period ended August 31, 2007, the cost of investments purchased and proceeds from sales of investments, excluding short-term investments and in-kind transactions, were as follows:
| | | | | | |
| | | Purchases | | Sales |
Robeco Developed International Equity | | $ | 5,405,604 | | $ | 5,183,770 |
Robeco Developed World Equity | | $ | 8,163,448 | | $ | 8,051,808 |
S&P Global Water Index | | $ | 2,778,681 | | $ | 7,581,071 |
For the period ended August 31, 2007, in-kind transactions were as follows:
| | | | | | |
| | | Purchases | | Sales |
Robeco Developed International Equity | | $ | 9,722,760 | | $ | 4,919,713 |
Robeco Developed World Equity | | $ | 14,645,566 | | $ | 0 |
S&P Global Water Index | | $ | 282,589,610 | | $ | 24,677,176 |
Note 6 – Capital:
Shares are issued and redeemed by the Funds only in Creation Unit size aggregations of 200,000 shares. Such transactions are only permitted on an in-kind basis, with separate cash payment, which is balancing each component to equate the transaction to the net asset value per unit of the Fund on the transaction date. Transaction fees ranging from $1,000 to $6,000 are charged to those persons creating or redeeming Creation Units. An additional charge of up to four times the Creation or Redemption Transaction Fee may be imposed with respect to transactions effected outside of the Clearing Process or to the extent that cash is used in lieu of securities to purchase Creation Units or redeem for cash.
Note 7 – Distribution Agreement:
The Board of Trustees of the Trust has adopted a distribution and services plan (the “Plan”) pursuant to Rule 12b-1 under the 1940 Act. Under the Plan, each Fund is authorized to pay distribution fees in connection with the sale and distribution of its shares and pay service fees in connection with the provision of ongoing services to shareholders of each class and the maintenance of shareholder accounts in an amount up to 0.25% of its average daily net assets each year. No 12b-1 fees are currently paid by the Funds, and there are no current plans to impose these fees.
Note 8 – Securities Lending:
Each Fund may lend its portfolio securities in order to earn income. Each Fund will receive collateral in cash or high quality securities at least equal to the current value of loaned securities. Each Fund earns interest on the securities it lends and income when it invests the collateral for the loaned securities. As of August 31, 2007, none of the Funds had loaned any securities.
Note 9 – Indemnifications:
In the normal course of business, the Funds enter into contracts that contain a variety of representations, which provide general indemnifications. Each Fund’s maximum exposure under these arrangements is unknown, as this would require future claims that may be made against a Fund that have not yet occurred. However, the Funds expect the risk of loss to be remote.
Note 10 – Accounting Pronouncements:
On July 13, 2006, the Financial Accounting Standards Board (“FASB”) released FASB Interpretation No. 48, “Accounting for Uncertainty in Income Taxes” (“FIN 48”). FIN 48 provides guidance for how uncertain tax positions should be recognized, measured, presented and disclosed in the financial statements. FIN 48 requires the evaluation of tax positions taken or expected to be taken in the course of preparing the Fund’s tax returns to determine whether the tax positions are “more-likely-than-not” of being sustained by the applicable tax authority. Tax positions not deemed to meet the more-likely-than-not threshold would be recorded as a tax benefit or expense in the current year. Management has evaluated the implications of FIN 48 and has determined it does not have any impact on the financial statements as of August 31, 2007.
On September 15, 2006, the FASB released Statement of Financial Accounting Standards No. 157, “Fair Valuation Measurements” (“FAS 157”) which provides enhanced guidance for measuring fair value. The standard requires companies to provide expanded information about the assets and liabilities measured at fair value and the potential effect of these fair valuations on an entity’s financial performance. The standard does not expand the use of fair value in any new circumstances, but provides clarification on acceptable fair valuation methods and applications. Adoption of FAS 157 is required for fiscal years beginning after November 15, 2007. At this time, management is evaluating the implications of FAS 157 and its impact in the financial statements has not yet been determined.
Annual Report | August 31, 2007 | 27
Claymore Exchange-Traded Fund Trust 2
Report of Independent Registered Public Accounting Firm |
To the Shareholders and Board of Trustees of
Claymore Exchange-Traded Fund Trust 2
We have audited the accompanying statements of assets and liabilities, including the portfolios of investments, of Claymore Exchange-Traded Fund Trust 2 (encompassing, respectively, the Claymore/Robeco Developed International Equity ETF, the Claymore/Robeco Developed World Equity ETF and the Claymore S&P Global Water Index ETF (collectively, the “Funds”)) as of August 31, 2007, and the related statements of operations, changes in net assets, and the financial highlights for the periods indicated therein. These financial statements and financial highlights are the responsibility of the Funds’ management. Our responsibility is to express an opinion on these financial statements and financial highlights based on our audits.
We conducted our audits in accordance with the standards of the Public Company Accounting Oversight Board (United States). Those standards require that we plan and perform the audits to obtain reasonable assurance about whether the financial statements and financial highlights are free of material misstatement. Our audits included consideration of internal control over financial reporting as a basis for designing audit procedures that are appropriate in the circumstances, but not for the purpose of expressing an opinion on the effectiveness of the Funds’ internal control over financial reporting. Accordingly, we express no such opinion. An audit also includes examining, on a test basis, evidence supporting the amounts and disclosures in the financial statements and financial highlights, assessing the accounting principles used and significant estimates made by management, and evaluating the overall financial statement presentation. Our procedures included confirmation of securities owned as of August 31, 2007, by correspondence with the custodian and brokers or by other appropriate auditing procedures where replies from brokers were not received. We believe that our audits provide a reasonable basis for our opinion.
In our opinion, the financial statements and financial highlights referred to above present fairly, in all material respects, the financial position of each of the respective Funds encompasing the Claymore Exchange-Traded Fund Trust 2 at August 31, 2007, and the results of their operations, changes in their net assets and the financial highlights for the periods indicated therein, in conformity with U.S. generally accepted accounting principles.
Chicago, Illinois
October 18, 2007
28 | Annual Report | August 31, 2007
Claymore Exchange-Traded Fund Trust 2
Supplemental Information | (unaudited)
Federal Income Tax Information
The Trust intends to designate the maximum amount of dividends that qualify for the reduced tax rate pursuant to the Jobs and Growth Tax Relief Reconciliation Act of 2003.
In January 2008, you will be advised on IRS Form 1099 DIV or substitute 1099 DIV as to the federal tax status of the distributions received by you in the calendar year 2007.
Claymore/Robeco Developed International Equity ETF intends to designate $20,541 of foreign tax withholding on foreign source income of $190,655.
Claymore/Robeco Developed World Equity ETF intends to designate $18,401 of foreign tax withholding on foreign source income of $169,689.
Claymore S&P Global Water ETF intends to designate $25,693 of foreign tax withholding on foreign source income of $940,528.
Trustees
The Trustees of the Claymore Exchange-Traded Fund Trust 2 and their principal business occupations during the past five years:
| | | | | | | | |
Name, Address*, Year of Birth and Position(s) held with Registrant | | Term of Office** and Length of Time Served | | Principal Occupations During the Past Five Years and Other Affiliations | | Number of Funds
in Fund Complex***
Overseen by Trustee | | Other Directorships
Held by Trustee |
| Independent Trustees: | | | | | | | | |
Randall C. Barnes Year of Birth: 1951 Trustee | | Since 2006 | | Formerly, Senior Vice President and Treasurer (1993-1997), President, Pizza Hut International (1991-1993) and Senior Vice President, Strategic Planning and New Business Development (1987-1990) of PepsiCo, Inc. (1987-1997). | | 45 | | None |
| | | | |
Ronald A. Nyberg Year of Birth: 1953 Trustee | | Since 2006 | | Partner of Nyberg & Cassioppi, LLC, a law firm specializing in corporate law, estate planning and business transactions (2000-present). Formerly, Executive Vice President, General Counsel and Corporate Secretary of Van Kampen Investments (1982-1999). | | 48 | | None |
| | | | |
Ronald E. Toupin, Jr. Year of Birth: 1958 Trustee | | Since 2006 | | Formerly, Vice President, Manager and Portfolio Manager of Nuveen Asset Management (1998-1999), Vice President of Nuveen Investment Advisory Corp. (1992-1999), Vice President and Manager of Nuveen Unit Investment Trusts (1991-1999), and Assistant Vice President and Portfolio Manager of Nuveen Unit Investment Trusts (1988-1999), each of John Nuveen & Co., Inc. (1982-1999). | | 45 | | None |
| Management Trustees: | | | | | | | | |
Nicholas Dalmaso† Year of Birth: 1965 Trustee; Chief Legal and Executive Officer | | Since 2006 | | Senior Managing Director and Chief Administrative Officer of Claymore Advisors, LLC and Claymore Securities, Inc. (2001-present). General Counsel of Claymore Advisors, LLC and Claymore Securities, Inc. (2001-2007). Formerly, Assistant General Counsel, John Nuveen and Co., Inc. (1999-2001). Former Vice President and Associate General Counsel of Van Kampen Investments, Inc. (1992-1999). | | 48 | | None |
| * | Address for all Trustees unless otherwise noted: 2455 Corporate West Drive, Lisle, IL 60532 |
| ** | This is the period for which the Trustee began serving the Trust. Each Trustee is expected to serve an indefinite term, until his successor is elected. |
| *** | The Claymore Fund Complex consists of U.S. registered investment companies advised or serviced by Claymore Advisors, LLC or Claymore Securities, Inc. The Claymore Fund Complex is overseen by multiple Boards of Trustees. |
| † | Mr. Dalmaso is an “interested person” (as defined in Section 2(a)(19) of the 1940 Act) of the Trust because of his position as an officer of Claymore Advisors, LLC, the Fund’s Investment Adviser. |
Annual Report | August 31, 2007 | 29
Claymore Exchange-Traded Fund Trust 2 | Supplemental Information (unaudited) continued
Officers
The Officers of the Trust and their principal occupations during the past five years:
| | | | |
Name, Address*, Year of Birth and Position(s) held with Registrant | | Term of Office** and Length of Time Served | | Principal Occupation During the Past Five Years and Other Affiliations |
| Officers: | | | | |
Steven M. Hill Year of Birth: 1964 Chief Financial Officer, Chief Accounting Officer and Treasurer | | Since 2006 | | Senior Managing Director of Claymore Advisors, LLC and Claymore Securities, Inc. (2005-present). Formerly, Chief Financial Officer (2005-2006) Claymore Group Inc. Managing Director of Claymore Advisors, LLC and Claymore Securities, Inc. (2003-3005). Previously, Treasurer of Henderson Global Funds and Operations Manager for Henderson Global Investors (NA) Inc., (2002-2003); Managing Director, FrontPoint Partners LLC (2001- 2002); Vice President, Nuveen Investments (1999-2001); Chief Financial Officer, Skyline Asset Management LP, (1999); Vice President, Van Kampen Investments and Assistant Treasurer, Van Kampen mutual funds (1989-1999). |
| | |
Bruce Saxon Year of Birth: 1957 Chief Compliance Officer | | Since 2006 | | Vice President – Fund Compliance Officer of Claymore Advisors, LLC (Feb. 2006 – present). Chief Compliance Officer/Assistant Secretary of Harris Investment Management, Inc. (2003-2006), Director – Compliance of Harrisdirect LLC (1999-2003). |
| | |
Melissa J. Nguyen Year of Birth: 1978 Secretary | | Since 2006 | | Vice President, Assistant General Counsel of Claymore Advisors, LLC. (2005-present); Secretary of certain funds in the Fund Complex. Previously, Associate, Vedder, Price, Kaufman & Kammholz, P.C. (2003-2005). |
| | |
William H. Belden III Year of Birth: 1965 Vice President | | Since 2006 | | Managing Director of Claymore Advisors, LLC. Previously, Vice President of Product Management at Northern Trust Global Investments (1999-2005); and Vice President of Product Development at Stein Roe & Farnham (1995-1999). |
| | |
Chuck Craig Year of Birth: 1967 Vice President | | Since 2006 | | Managing Director (2006-present), Vice President (2003-2006) of Claymore Advisors, LLC. Formerly, Assistant Vice President, First Trust Portfolios, L.P. (1999-2003); Analyst, PMA Securities, Inc. (1996-1999). |
| * | Address for all Officers: 2455 Corporate West Drive, Lisle, IL 60532 |
| ** | Officers serve at the pleasure of the Board of Trustees and until his or her successor is appointed and qualified or until his or her earlier resignation or removal. |
30 | Annual Report | August 31, 2007
Claymore Exchange-Traded Fund Trust 2
Board Considerations Regarding
Approval of Investment Advisory Agreement | (unaudited)
Claymore Exchange Traded Fund Trust 2 (the “Trust”)
Claymore/Robeco Developed International Equity ETF
Claymore/Robeco Developed World Equity ETF
Board Considerations Regarding
Approval of Investment Advisory Agreement
The Advisory Agreement between Claymore Advisors, LLC (the “Investment Adviser”) and the Trust on behalf of each of the above-named Funds was approved by the Board of Trustees, including all of the trustees who are not parties to such agreement or interested persons of any such party, on August 16, 2006. The Board of Trustees, including a majority of the independent trustees, determined that approval of the Advisory Agreement was in the best interests of each Fund. The independent trustees, with the assistance of independent legal counsel, met separately from the “interested” trustee of the Trust and officers and employees of the Investment Adviser to consider approval of the Advisory Agreement. The Board of Trustees, including the independent trustees, did not identify any single factor or group of factors as all important or controlling and considered all factors together. In evaluating whether to approve the Advisory Agreement for each Fund, the Board considered numerous factors, as described below.
With respect to the nature, extent and quality of the services to be provided by the Investment Adviser under the Advisory Agreement, the Board considered and reviewed information concerning the services proposed to be provided under the Advisory Agreement, the proposed investment parameters of the respective index for each Fund, the Investment Adviser’s Form ADV, financial information regarding the Investment Adviser and its parent company, information describing the Investment Adviser’s current organization and the background and experience of the persons who would be responsible for the day-to-day management of the Funds, the anticipated financial support of the Funds and the nature and quality of services provided to other open-end and closed-end funds by the Investment Adviser. The Board also considered the services to be provided by the Investment Adviser in its oversight of the Funds’ custodian, transfer agent, and accounting agent, as well as the respective index licensors for each Fund, and noted the significant time and effort that would be devoted to this oversight function. Since the Funds are newly organized and have no investment performance, the Board did not consider investment performance of the Funds. Based upon their review, the Board concluded that the Investment Adviser was qualified to manage the Funds and oversee the services to be provided by other service providers and that the services to be provided by the Investment Adviser to each Fund are expected to be satisfactory.
With respect to the costs of services to be provided and profits to be realized by the Investment Adviser, the Board considered the resources involved in managing each Fund as well as the proposed expense limitations for each Fund. The Board noted that because the Funds are newly organized, the Investment Adviser represented that profitability information was not yet determinable. However, based upon the impact of the proposed expense limitation for each Fund, the Board concluded that profitability was not expected to be unreasonable.
The Board also reviewed information provided by the Investment Adviser showing the proposed advisory fees for the Funds as compared to those of a peer group of exchange-traded funds (“ETFs”) provided by the Investment Adviser. The Board noted the services to be provided by the Investment Adviser for the annual advisory fee of 0.50% of each Fund’s average daily net assets and that the proposed advisory fee to be charged to each Fund was identical. The Board also considered that the Investment Adviser had contractually agreed to waive its fee and/or pay expenses of the Funds to the extent necessary to prevent the annual operating expenses of each Fund (excluding interest expenses, a portion of a Fund’s licensing fees, offering costs, brokerage commissions and other trading expenses, taxes and extraordinary expenses such as litigation and other expenses not incurred in the ordinary course of a Fund’s business) from exceeding 0.65% of average net assets, at least until December 31, 2009. The Board considered that the Funds’ proposed advisory fees were within the range of those in the peer group of ETFs provided by the Investment Adviser and that the Funds’ expense ratios were expected to be within range of the expense ratios of the peer group of ETFs provided by the Investment Adviser, taking into account the respective expense limitations for the Funds. The Board concluded that each Fund’s advisory fee was reasonable given the nature, extent and anticipated quality of the services to be provided under the Advisory Agreement and the expense limitation that would be in place.
The Board considered the extent to which economies of scale would be realized as each Fund grows and whether fee levels reflect a reasonable sharing of such economies of scale for the benefit of Fund investors. Because the Funds are newly organized, the Board reviewed the Funds’ proposed expense limitations and determined to review economies of scale in the future when the Funds had attracted assets. The Board also noted that the terms of the expense reimbursement agreement that the Investment Adviser had entered into with the Funds allow the Investment Adviser for a period of five years subsequent to the respective Fund’s commencement of operations to recover from the individual Fund’s fees and expenses waived or reimbursed during the prior three years if the Fund’s expense ratio, including the recovered expenses falls below the expense limitation.
The Board considered benefits to be derived by the Investment Adviser from its relationship with the Funds, including the benefits to the Investment Adviser from its separate Administrative Services Agreement with the Trust. The Board concluded that the advisory fees were reasonable, taking into account these benefits.
Annual Report | August 31, 2007 | 31
Claymore Exchange-Traded Fund Trust 2 | Board Considerations Regarding Approval of Investment Advisory Agreement (unaudited) continued
Claymore Exchange Traded Fund Trust 2 (the “Trust”)
Claymore S&P Global Water Index ETF
Board Considerations Regarding
Approval of Investment Advisory Agreement
The Advisory Agreement between Claymore Advisors, LLC (the “Investment Adviser”) and the Trust on behalf of the above-named fund (“Fund”) was approved by the Board of Trustees, including all of the trustees who are not parties to such agreement or interested persons of any such party, on March 7, 2007. The Board of Trustees, including a majority of the independent trustees, determined that approval of the Advisory Agreement was in the best interests of each Fund. The independent trustees, with the assistance of independent legal counsel, met separately from the “interested” trustee of the Trust and officers and employees of the Investment Adviser to consider approval of the Advisory Agreement. The Board of Trustees, including the independent trustees, did not identify any single factor or group of factors as all important or controlling and considered all factors together. In evaluating whether to approve the Advisory Agreement for the Fund, the Board considered numerous factors, as described below.
With respect to the nature, extent and quality of the services to be provided by the Investment Adviser under the Advisory Agreement, the Board considered and reviewed information concerning the services proposed to be provided under the Advisory Agreement, the proposed investment parameters of the respective index for each Fund, the Investment Adviser’s Form ADV, financial information regarding the Investment Adviser and its parent company, information describing the Investment Adviser’s current organization and the background and experience of the persons who would be responsible for the day-to-day management of the Funds, the anticipated financial support of the Fund and the nature and quality of services provided to other exchange-traded funds (“ETFs”) and closed-end funds by the Investment Adviser. The Board also considered the services to be provided by the Investment Adviser in its oversight of the Fund’s custodian, transfer agent, and accounting agent, as well as the respective index licensors for the Fund, and noted the significant time and effort that would be devoted to this oversight function. Since the Fund is newly organized and has no investment performance, the Board did not consider investment performance of the Fund. Based upon their review, the Board concluded that the Investment Adviser was qualified to manage the Fund and to oversee the services to be provided by other service providers and that the services to be provided by the Investment Adviser to the Fund are expected to be satisfactory.
With respect to the costs of services to be provided and profits to be realized by the Investment Adviser, the Board considered the resources involved in managing the Fund as well as the proposed expense limitation for the Fund. The Board noted that because the Fund is newly organized, the Investment Adviser represented that profitability information was not yet determinable. However, based upon the impact of the proposed expense limitation for the Fund, the Board concluded that profitability was not expected to be unreasonable.
The Board also reviewed information provided by the Investment Adviser showing the proposed advisory fees for the Fund as compared to those of a peer group of ETFs provided by the Investment Adviser. The Board noted the services to be provided by the Investment Adviser for the annual advisory fee of 0.50% of the Fund’s average daily net assets and that the proposed advisory fee to be charged to the Fund was identical. The Board also considered that the Investment Adviser had contractually agreed to waive its fee and/or pay expenses of the Fund to the extent necessary to absorb the annual operating expenses of the Fund (excluding interest expenses, a portion of a Fund’s licensing fees, offering costs, brokerage commissions and other trading expenses, taxes and extraordinary expenses such as litigation and other expenses not incurred in the ordinary course of a Fund’s business) over certain amounts at least until December 31, 2009. The Board considered that, although the Fund’s proposed advisory fees were at the high end of the range of those in the peer group of ETFs provided by the Investment Adviser, taking into account the respective expense limitations for the Fund, the Fund’s expense ratios were expected to be within range of the expense ratios of the peer group of ETFs provided by the Investment Adviser. The Board concluded that the Fund’s advisory fee was reasonable given the nature, extent and anticipated quality of the services to be provided under the Advisory Agreement and the expense limitation that would be in place.
The Board considered the extent to which economies of scale would be realized as the Fund grows and whether fee levels reflect a reasonable sharing of such economies of scale for the benefit of Fund investors. Because the Fund is newly organized, the Board reviewed the Fund’s proposed expense limitations and determined to review economies of scale in the future when the Fund had attracted assets. The Board also noted that the terms of the expense reimbursement agreement that the Investment Adviser had entered into with the Fund allow the Investment Adviser for a period of five years subsequent to the respective Fund’s commencement of operations to recover from the individual Fund’s fees and expenses waived or reimbursed during the prior three years if the Fund’s expense ratio, including the recovered expenses falls below the expense limitation.
The Board considered benefits to be derived by the Investment Adviser from its relationship with the Fund, including the benefits to the Investment Adviser from its separate Administration Agreement with the Trust. The Board concluded that the advisory fees were reasonable, taking into account these benefits.
32 | Annual Report | August 31, 2007
Claymore Exchange-Traded Fund Trust 2
Trust Information |
Board of Trustees
Randall C. Barnes
Nicholas Dalmaso*
Ronald A. Nyberg
Ronald E. Toupin, Jr.
| * | Trustee is an “interested person” of the Trust as defined in the Investment Company Act of 1940, as amended. |
Officers
Nicholas Dalmaso
Chief Executive Officer and
Chief Legal Officer
Steven M. Hill
Chief Accounting Officer,
Chief Financial Officer and Treasurer
Melissa J. Nguyen
Secretary
William H. Belden III
Vice President
Chuck Craig
Vice President
Investment Adviser
Claymore Advisors, LLC
Lisle, IL
Distributor
Claymore Securities, Inc.
Lisle, IL
Administrator
Claymore Advisors, LLC
Lisle, IL
Accounting Agent, Custodian
and Transfer Agent Fund
The Bank of New York Mellon
NewYork, NY
Legal Counsel
Clifford Chance US LLP
NewYork, NY
Independent Registered Public
Accounting Firm
Ernst & Young LLP
Chicago, IL
Privacy Principles of the Trust for Shareholders
The Funds are committed to maintaining the privacy of their shareholders and to safeguarding its non-public personal information. The following information is provided to help you understand what personal information the Funds collect, how we protect that information and why, in certain cases, we may share information with select other parties.
Generally, the Funds do not receive any non-public personal information relating to their shareholders, although certain non-public personal information of their shareholders may become available to the Funds. The Funds do not disclose any non-public personal information about their shareholders or former shareholders to anyone, except as permitted by law or as is necessary in order to service shareholder accounts (for example, to a transfer agent or third party administrator).
The Funds restrict access to non-public personal information about the shareholders to Claymore Advisors, LLC employees with a legitimate business need for the information. The Funds maintain physical, electronic and procedural safeguards designed to protect the non-public personal information of their shareholders.
Questions concerning your shares of the Trust?
| • | | If your shares are held in a Brokerage Account, contact your Broker. |
This report is sent to shareholders of the Funds for their information. It is not a Prospectus, circular or representation intended for use in the purchase or sale of shares of the Funds or of any securities mentioned in this report.
A description of the Funds’ proxy voting policies and procedures related to portfolio securities is available without charge, upon request, by calling the Funds at (800) 345-7999.
Information regarding how the Funds voted proxies for portfolio securities, if applicable, during the most recent 12-month period ended June 30, is also available, without charge and upon request by calling (800) 345-7999 or by accessing the Funds’ Form N-PX on the SEC’s website at http://www.sec.gov.
The Funds file their complete schedule of portfolio holdings with the SEC for the first and third quarters of each fiscal year on Form N-Q. The Funds’ Form N-Q is available on the SEC website at http://www.sec.gov. The Funds’ Form N-Q may also be viewed and copied at the SEC’s Public Reference Room in Washington, DC; information on the operation of the Public Reference Room may be obtained by calling (800) SEC-0330 or at www.claymore.com.
Annual Report | August 31, 2007 | 33
Claymore Exchange-Traded Fund Trust 2
About the Fund Manager |
Claymore Advisors, LLC
Claymore Advisors, LLC manages the investment and reinvestment of each Fund’s assets and administers the affairs of each Fund to the extent requested by the Board of Trustees. Claymore Advisors, LLC also acts as investment adviser to closed-end and open-end management investment companies. As of August 31, 2007, Claymore Advisors, LLC and its affiliates have provided supervision, management, servicing or distribution on approximately $17.5 billion in assets through closed-end funds, unit investment trusts, mutual funds and exchange-traded funds.
Portfolio Management
The portfolio manager who is currently responsible for the day-to-day management of the Funds’ portfolio is Chuck Craig, CFA. Mr. Craig has managed each Fund’s portfolio since its inception. Mr. Craig is a Managing Director, Research and Development, of the Investment Adviser and Claymore Securities, Inc. and joined Claymore Securities, Inc. in May of 2003. Before joining Claymore Securities, Inc., Mr. Craig spent four years with First Trust Portfolios L.P. (formerly Nike Securities) as an equity-research analyst and portfolio manager within the Equity Strategy Research group. Mr. Craig received a M.S. in Financial Markets from the Center for Law and Financial Markets at the Illinois Institute of Technology. He also earned a B.S. in Finance from Northern Illinois University
Claymore Exchange-Traded Fund Trust Overview
The Claymore Exchange-Traded Fund Trust 2 (the “Trust”) is an investment company currently consisting of nine separate exchange-traded “index funds” as of August 31, 2007. The investment objective of each of the funds is to replicate as closely as possible, before fees and expenses, the performance of a specified market index.
34 | Annual Report | August 31, 2007
(This page is intentionally left blank)
This material must be preceded or accompanied by a prospectus for the fund being offered. The prospectus contains information about the fund including a discussion of investment objectives, risks, ongoing expenses and sales charges. If a prospectus did not accompany this report, you can obtain one from your financial adviser, from our website at http://www.claymore.com or by calling (800) 345-7999. Please read the prospectus carefully before investing. The Statement of Additional Information that includes additional information about the Trustees is also available, without charge, upon request via our website at http://www.claymore.com or by calling (800) 345-7999. All funds are subject to market risk and shares when sold may be worth more or less than their original cost. You can lose money investing in the funds.
| | | | |
Claymore Securities, Inc. 2455 Corporate West Drive Lisle, IL 60532 Member FINRA/SIPC | | NOT FDIC-INSURED | NOT BANK-GUARANTEED | MAY LOSE VALUE | | |
| |
| | CETFT-002-AR-0807 |
(a) The registrant has adopted a code of ethics (the “Code of Ethics”) that applies to its principal executive officer, principal financial officer, principal accounting officer or controller, or persons performing similar functions.
(b) No information need be disclosed pursuant to this paragraph.
(c) During the period covered by the shareholder report presented in Item 1, there were no amendments to any provision of the registrant’s Code of Ethics applicable to the registrant’s principal executive officer, principal financial officer, principal accounting officer or controller, or persons performing similar functions.
(d) The registrant has not granted a waiver or an implicit waiver to its principal executive officer, principal financial officer, principal accounting officer or controller, or persons performing similar functions from a provision of its Code of Ethics during the period covered by this report.
(e) Not applicable.
(f) (1) The registrant’s Code of Ethics is attached hereto as an exhibit.
(2) Not applicable.
(3) Not applicable.
| Item 3. | Audit Committee Financial Expert. |
The registrant’s Board of Trustees has determined that it has at least one audit committee financial expert serving on its audit committee, Ronald E. Toupin, Jr. Mr. Toupin is an “independent” Trustee as defined in Item 3. Mr. Toupin qualifies as an audit committee financial expert by virtue of his experience obtained as a portfolio manager and research analyst, which included review and analysis of offering documents and audited and un-audited financial statements using GAAP to show accounting estimates, accruals and reserves.
(Under applicable securities laws, a person who is determined to be an audit committee financial expert will not be deemed an “expert” for any purpose, including without limitation for the purposes of Section 11 of the Securities Act of 1933, as amended, as a result of being designated or identified as an audit committee financial expert. The designation or identification of a person as an audit committee financial expert does not impose on such person any duties, obligations, or liabilities that are greater than the duties, obligations, and liabilities imposed on such person as a member of the audit committee and Board of Trustees in the absence of such designation or identification. The designation of identification of a person as an audit committee financial expert does not affect the duties, obligations or liability of any other member of the audit committee or Board of Trustees.)
| Item 4. | Principal Accountant Fees and Services. |
(a) Audit Fees: the aggregate fees billed for the Trust’s fiscal period ended August 31, 2007 for professional services rendered by the principal accountant for the audit of the registrant’s annual financial statements or services that are normally provided by the accountant in connection with statutory and regulatory filings or engagements for such fiscal period were $78,000.
(b) Audit-Related Fees: the aggregate fees billed for the Trust’s fiscal period ended August 31, 2007 for assurance and related services by the principal accountant that are reasonably related to the performance of the audit of the registrant’s financial statements and are not reported under paragraph 4(a), including agreed upon procedures reports performed for rating agencies and the issuance of comfort letters, were $0.
(c) Tax Fees: the aggregate fees billed for the Trust’s fiscal period ended August 31, 2007 for professional services rendered by the principal accountant for tax compliance, tax advice and tax planning, including federal, state and local income tax return preparation and related advice and determination of taxable income and miscellaneous tax advice were $18,000.
(d) All Other Fees: the aggregate fees billed for the Trust’s fiscal period ended August 31, 2007 for products and services provided by the principal accountant, other than the services reported in paragraphs (a) through (c) of this Item were $0.
(e) Audit Committee Pre-Approval Policies and Procedures:
In accordance with Rule 2-01(c)(7)(A), the Audit Committee pre-approves all of the Audit and Tax Fees of the registrant. All of the services described in paragraphs (b) through (d) above were approved by the Audit Committee in accordance with paragraph (c)(7)(i)(c) of Rule 2-01 of Regulation S-X.
The Trust’s Audit Committee has adopted written policies relating to the pre-approval of the audit and non-audit services performed by the Trust’s independent auditors. Unless a type of service to be provided by the independent auditors has received general pre-approval, it requires specific pre-approval by the Audit Committee. Under the policies, on an annual basis, the Trust’s Audit Committee reviews and pre-approves the services to be provided by the independent auditors without having obtained specific pre-approval from the Audit Committee. The Audit Committee has delegated pre-approval authority to the Audit Committee Chairperson. In addition, the Audit Committee pre-approves any permitted non-audit services to be provided by the independent auditors to the registrant’s investment adviser or any entity controlling, controlled by, or under common control with the adviser if such services related directly to the operations and financial reporting of the Trust.
(f) The percentage of hours expended on the principal accountant’s engagement to audit the Trust’s financial statements for the Trust’s fiscal period ended August 31, 2007 attributable to work performed by persons other than the principal accountant’s full-time, permanent employees was 0%.
(g) The aggregate non-audit fees billed by the registrant’s accountant for services rendered to the registrant, the registrant’s investment adviser (not including a sub-adviser whose role is primarily portfolio management and is sub-contracted with or overseen by another investment adviser) and/or any entity controlling, controlled by, or under common control with the adviser that provides ongoing services to the registrant that directly related to the operations and financial reporting of the registrant for the registrant’s fiscal period ended August 31, 2007 were $0.
(h) Not applicable.
| Item 5. | Audit Committee of Listed Registrants. |
The Registrant has a separately designated standing audit committee established in accordance with Section 3(a)(58)(A) of the Securities Exchange Act of 1934, as amended. The audit committee of the Registrant is comprised of: Ronald A. Nyberg; Ronald E. Toupin, Jr., and Randall C. Barnes.
| Item 6. | Schedule of Investments. |
The Schedule of Investments is included as part of Item 1.
| Item 7. | Disclosure of Proxy Voting Policies and Procedures for Closed-End Management Investment Companies. |
Not Applicable.
| Item 8. | Portfolio Managers of Closed-End Management Investment Companies. |
Not Applicable.
| Item 9. | Purchases of Equity Securities by Closed-End Management Investment Company and Affiliated Purchasers. |
Not Applicable.
| Item 10. | Submission of Matters to a Vote of Security Holders. |
Registrant has not made any material changes to the procedures by which shareholders may recommend nominees to the registrant’s Board of Trustees.
| Item 11. | Controls and Procedures. |
(a) The registrant’s principal executive officer and principal financial officer have evaluated the registrant’s disclosure controls and procedures (as defined in Rule 30a-3(c) under the Investment Company Act of 1940) within 90 days of this filing and have concluded that based on such evaluation, the registrant’s disclosure controls and procedures were effective as of that date in ensuring that information required to be disclosed by the registrant in this Form N-CSR was recorded, processed, summarized, and reported within the time periods specified in the Securities and Exchange Commission’s rules and forms.
(b) There were no changes in the registrant’s internal control over financial reporting (as defined in Rule 30a-3(d) under the Investment Company Act of 1940) that occurred during the period covered by this report that have materially affected, or are reasonably likely to materially affect, the registrant’s internal control over financial reporting.
| | |
| |
| (a)(1) | | Code of Ethics for Chief Executive and Senior Financial Officer. |
| |
| (a)(2) | | Certifications of principal executive officer and principal financial officer pursuant to Rule 30a-2(a) of the Investment Company Act of 1940. |
| |
| (a)(3) | | Not Applicable. |
| |
| (b) | | Certifications of principal executive officer and principal financial officer pursuant to Rule 30a-2(b) of the Investment Company Act of 1940. |
SIGNATURES
Pursuant to the requirements of the Securities Exchange Act of 1934 and the Investment Company Act of 1940, the registrant has duly caused this report to be signed on its behalf by the undersigned, thereunto duly authorized.
(Registrant) Claymore Exchange-Traded Fund Trust 2
| | |
| |
| By: | | /s/ Nicholas Dalmaso |
| Name: | | Nicholas Dalmaso |
| Title: | | Chief Legal and Executive Officer |
Date: November 5, 2007
Pursuant to the requirements of the Securities Exchange Act of 1934 and the Investment Company Act of 1940, this report has been signed by the following persons on behalf of the registrant and in the capacities and on the dates indicated.
| | |
| |
| By: | | /s/ Nicholas Dalmaso |
| Name: | | Nicholas Dalmaso |
| Title: | | Chief Legal and Executive Officer |
Date: November 5, 2007
| | |
| |
| By: | | /s/ Steven M. Hill |
| Name: | | Steven M. Hill |
| Title: | | Treasurer and Chief Financial Officer |
Date: November 5, 2007