Exhibit 99.03
Glu Mobile Q212 Earnings Call August 2, 2012 © Glu Mobile Inc. – Proprietary
Safe-Harbor Statement This presentation contains "forward-looking" statements including those regarding: the projected growth rate of the mobile game market; the expected benefits of our acquisition of GameSpy, including with respect to our long-term LTV; the number of freemium games that we expect to launch in the second half of 2012; when we expect our development teams to release their first products; our guidance for the third quarter of 2012 and the full fiscal year, and our target non-GAAP operating model. These forward-looking statements are subject to material risks and uncertainties that could cause actual results to differ materially from those in the forward-looking statements. Investors should consider important risk factors, which include: the risk that Glu will be unable to successfully integrate the companies that it acquired in August 2011, Griptonite and Blammo Games, and its employees and achieve expected synergies, the risk that Glu will have difficulty retaining key employees of the acquired companies; the risk that consumer demand for smartphones, tablets and next-generation platforms does not grow as significantly as we anticipate or that we will be unable to capitalize on any such growth; the risk that we do not realize a sufficient return on our investment with respect to our efforts to develop freemium games for smartphones and tablets, the risk that we do not maintain our good relationships with Apple and Google; the risk that our development expenses for games for smartphones are greater than we anticipate; the risk that our recently and newly launched games are less popular than anticipated; the risk that our newly released games will be of a quality less than desired by reviewers and consumers; the risk that the mobile games market, particularly with respect to social, freemium gaming, is smaller than anticipated; and other risks detailed under the caption "Risk Factors" in our Form 10-K filed with the Securities and Exchange Commission on May 10, 2012 and our other SEC filings. You can locate these reports through our website at http://www.glu.com/investors. These "forward-looking" statements are based on estimates and information available to us on August 2, 2012 and we are under no obligation, and expressly disclaim any obligation, to update or alter our forward-looking statements whether as a result of new information, future events or otherwise. © Glu Mobile Inc. – Proprietary
Use of Non-GAAP Financial Measures © Glu Mobile Inc. – Proprietary Glu uses in this presentation certain non-GAAP measures of financial performance. The presentation of these non-GAAP financial measures is not intended to be considered in isolation from, as a substitute for, or superior to, the financial information prepared and presented in accordance with GAAP, and may be different from non-GAAP financial measures used by other companies. In addition, these non-GAAP measures have limitations in that they do not reflect all of the amounts associated with Glu's results of operations as determined in accordance with GAAP. The non-GAAP financial measures used by Glu include non-GAAP revenues, non-GAAP smartphone revenues, non-GAAP freemium revenues, non-GAAP gross margins, non-GAAP operating margin, non-GAAP Profit/(Loss) and Adjusted EBITDA. These non-GAAP financial measures exclude the following items from Glu's unaudited consolidated statements of operations: • Change in deferred revenues and royalties; • Amortization of in-process development contracts; • Amortization of intangible assets; • Stock-based compensation expense; • Restructuring charges; • Change in fair value of Blammo earnout; • Transitional costs; • Release of tax liabilities; and • Foreign currency exchange gains and losses primarily related to the revaluation of assets and liabilities. In addition, Glu has included in this presentation “Adjusted EBITDA” figures which are used to evaluate Glu’s operating performance and is defined as non-GAAP operating income/(loss) excluding depreciation. Glu believes that these non-GAAP financial measures, when taken together with the corresponding GAAP financial measures, provide meaningful supplemental information regarding Glu's performance by excluding certain items that may not be indicative of Glu's core business, operating results or future outlook. Glu's management uses, and believes that investors benefit from referring to, these non-GAAP financial measures in assessing Glu's operating results, as well as when planning, forecasting and analyzing future periods. These non-GAAP financial measures also facilitate comparisons of Glu's performance to prior periods. For a reconciliation of these non-GAAP financial measures to their most directly comparable GAAP financial measures, please refer to the tables attached to Glu’s earnings press release for the quarter ended June 30, 2012, which is available on our website at http://www.glu.com/investors.

Growth Opportunity © Glu Mobile Inc. – Proprietary

Growth Opportunity © Glu Mobile Inc. – Proprietary Intersection of Two Rising Tides: 1)Growth in gaming on mobile devices 2)Growth in freemium gaming © Glu Mobile Inc. – Proprietary Leading Freemium Social Mobile Gaming Company
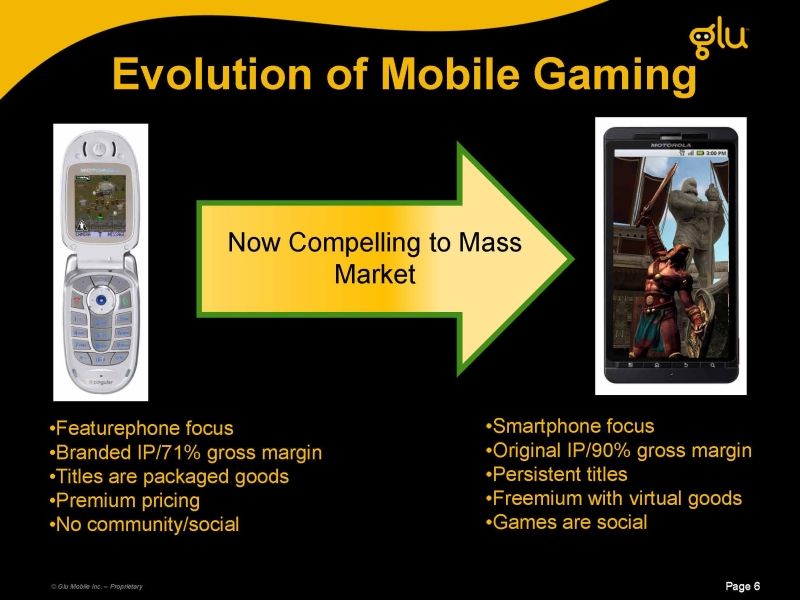
•Featurephone focus •Branded IP/71% gross margin •Titles are packaged goods •Premium pricing •No community/social •Smartphone focus •Original IP/90% gross margin •Persistent titles •Freemium with virtual goods •Games are social
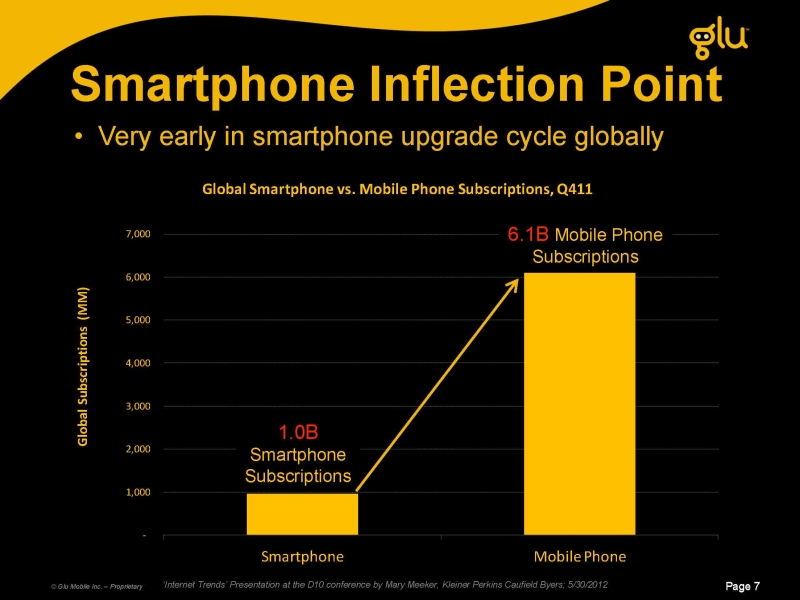
‘Internet Trends’ Presentation at the D10 conference by Mary Meeker, Kleiner Perkins Caufield Byers; 5/30/2012 •Very early in smartphone upgrade cycle globally 1.0B Smartphone Subscriptions 6.1B Mobile Phone Subscriptions
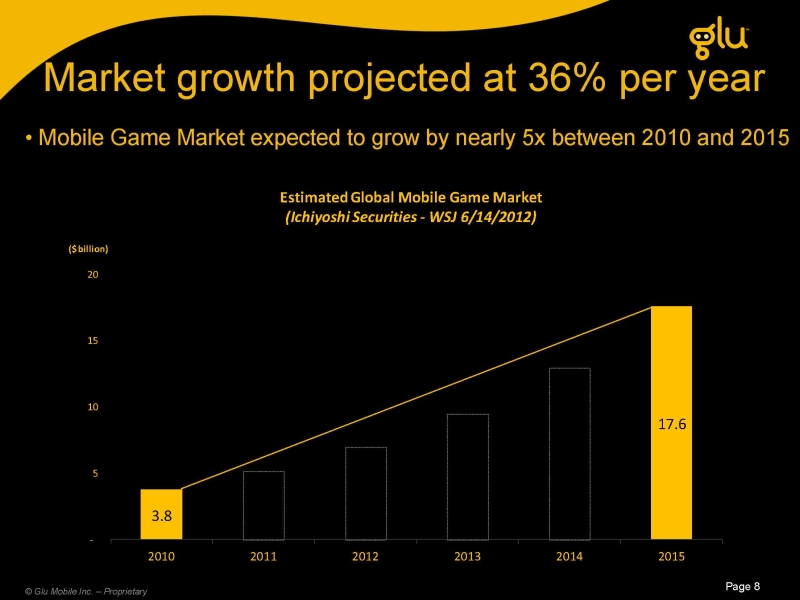
3.817.6-5 10 15 20 201020112012201320142015($ billion)Estimated Global Mobile Game Market(Ichiyoshi Securities -WSJ 6/14/2012)Market growth projected at 36% per year • Mobile Game Market expected to grow by nearly 5x between 2010 and 2015 © Glu Mobile Inc. – Proprietary
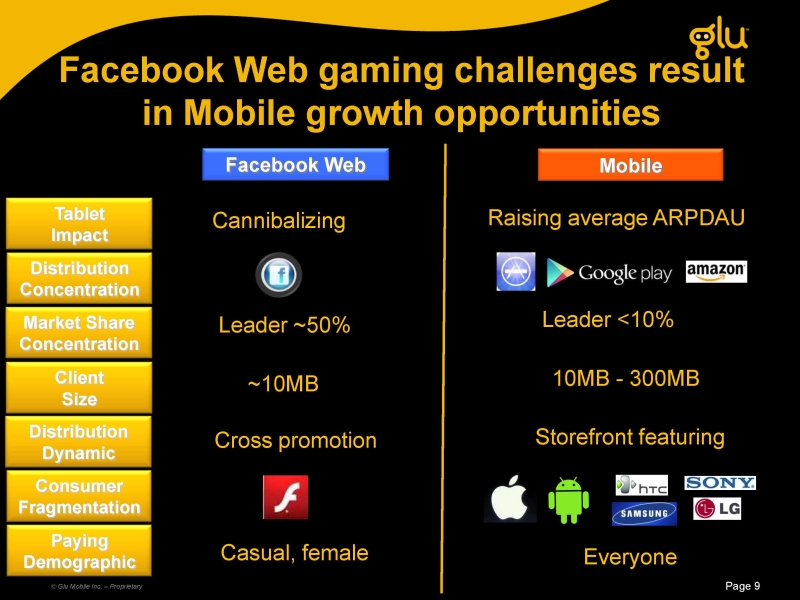
Mobile Distribution Dynamic Distribution Concentration Client Size Market Share Concentration Facebook Web © Glu Mobile Inc. – Proprietary Paying Demographic Tablet Impact Consumer Fragmentation Cannibalizing Raising average ARPDAU Leader ~50% Leader <10% ~10MB 10MB - 300MB Casual, female Everyone Cross promotion Storefront featuring Facebook Web gaming challenges result in Mobile growth opportunities

M&A
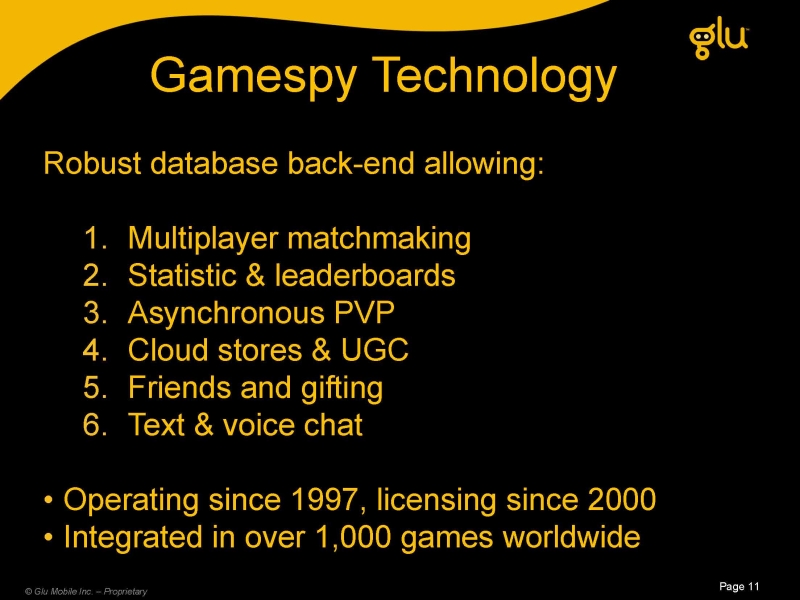
Robust database back-end allowing: 1.Multiplayer matchmaking 2.Statistic & leaderboards 3.Asynchronous PVP 4.Cloud stores & UGC 5.Friends and gifting 6.Text & voice chat •Operating since 1997, licensing since 2000 •Integrated in over 1,000 games worldwide
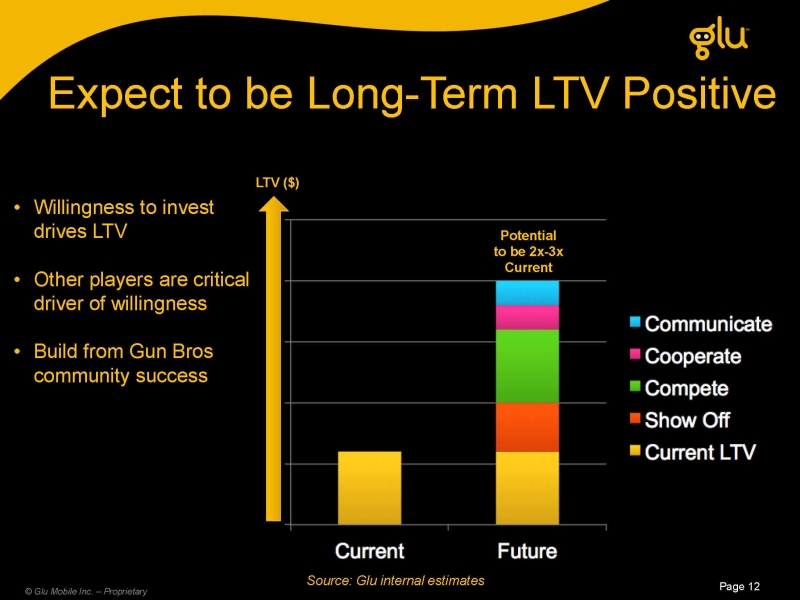
Expect to be Long-Term LTV Positive Source: Glu internal estimates
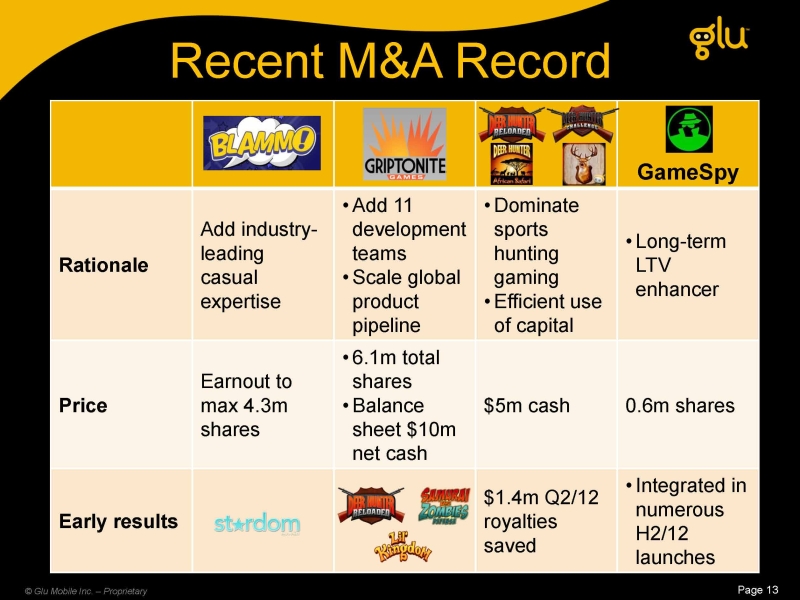
GameSpy Rationale Add industry-leading casual expertise •Add 11 development teams •Scale global product pipeline •Dominate sports hunting gaming •Efficient use of capital •Long-term LTV enhancer Price Earnout to max 4.3m shares •6.1m total shares •Balance sheet $10m net cash $5m cash 0.6m shares Early results $1.4m Q2/12 royalties saved •Integrated in numerous H2/12 launches

Corporate Overview © Glu Mobile Inc. – Proprietary
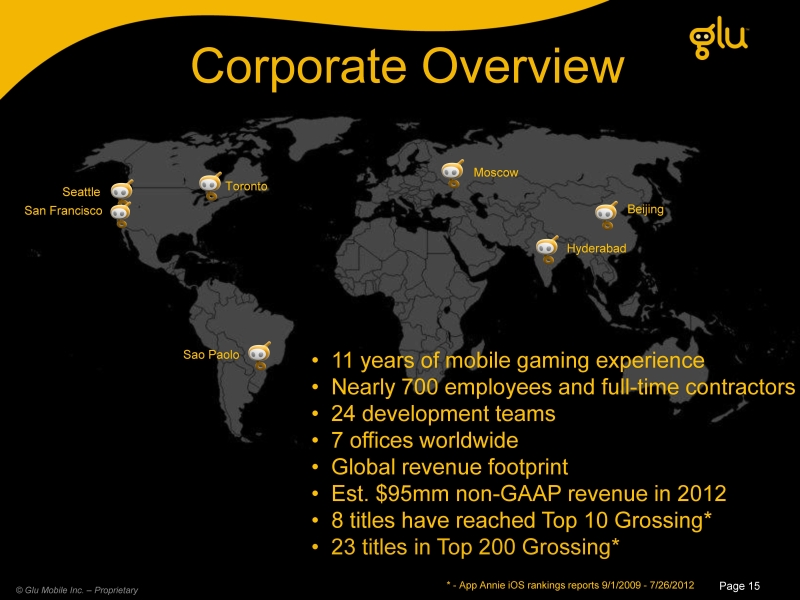
Corporate Overview •11 years of mobile gaming experience •Nearly 700 employees and full-time contractors •24 development teams •7 offices worldwide •Global revenue footprint •Est. $95mm non-GAAP revenue in 2012 •8 titles have reached Top 10 Grossing* •23 titles in Top 200 Grossing*
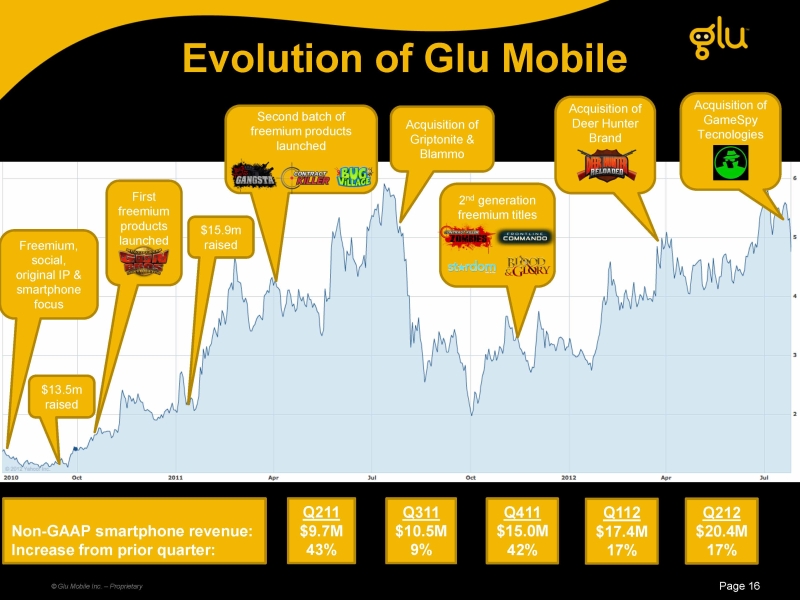
Evolution of Glu Mobile © Glu Mobile Inc. – Proprietary Freemium, social, original IP & smartphone focus $13.5m raised $15.9m raised First freemium products launched Second batch of freemium products launched Acquisition of Griptonite & Blammo 2nd generation freemium titles Non-GAAP smartphone revenue: Increase from prior quarter: Acquisition of Deer Hunter Brand Q:\Marketing\Creative Services\2012_ppt\2012 logos\DH_logo_04rev2.png Q112 $17.4M 17% Q411 $15.0M 42% Q311 $10.5M 9% Q211 $9.7M 43% Q212 $20.4M 17% GunBros_MPDM.png FrontComm_LOGO_FINALsm.png B-G.png Page 16 Acquisition of GameSpy Tecnologies
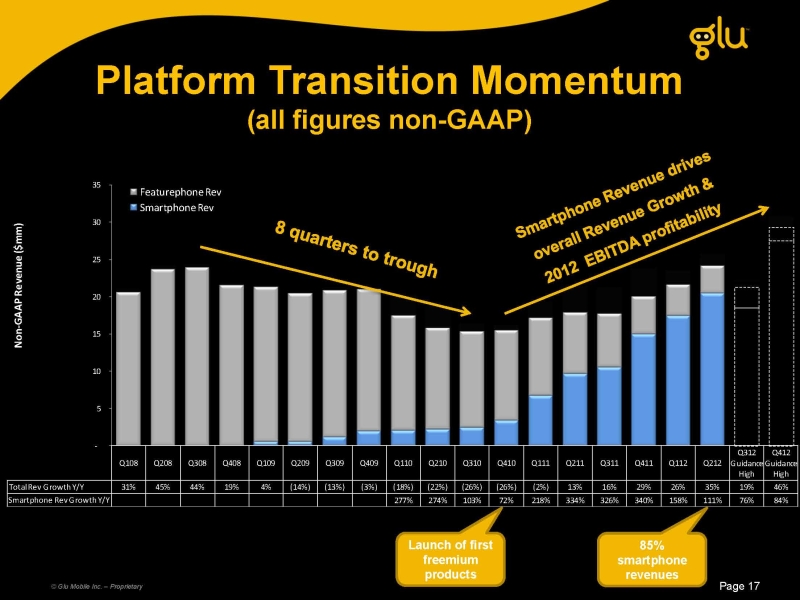

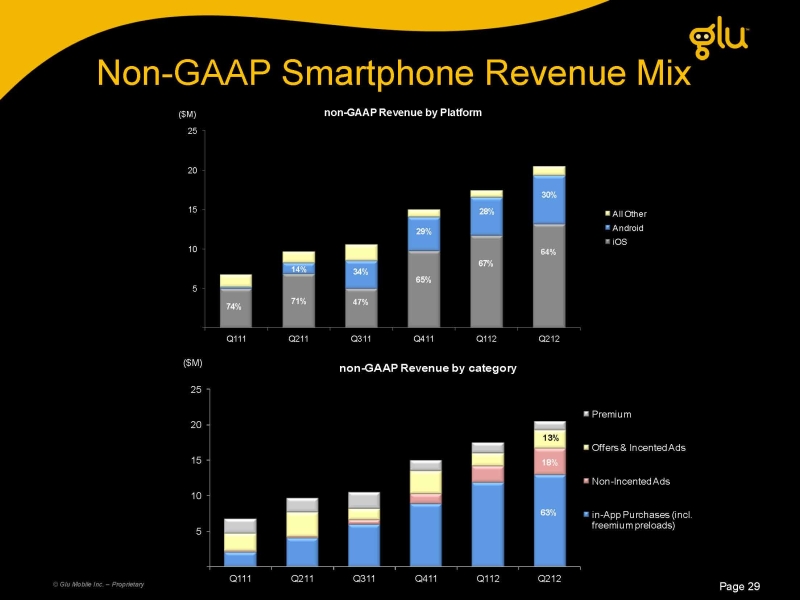
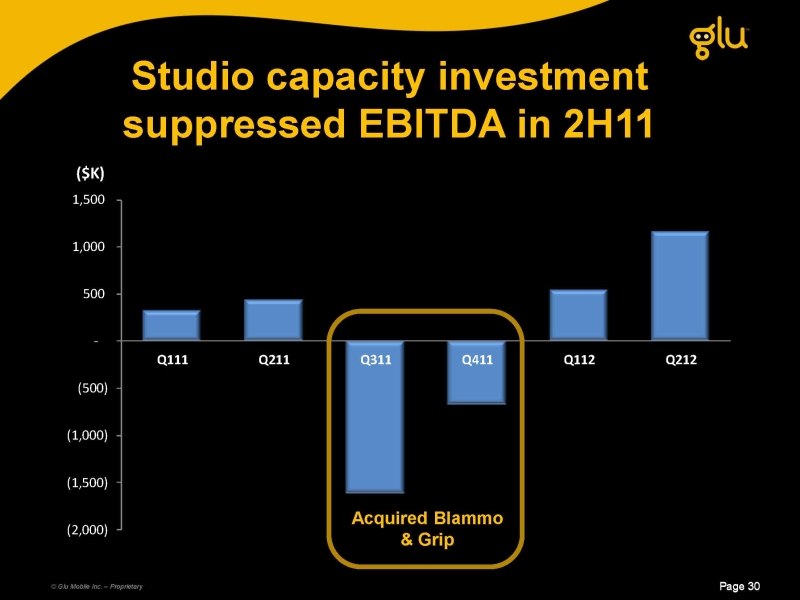
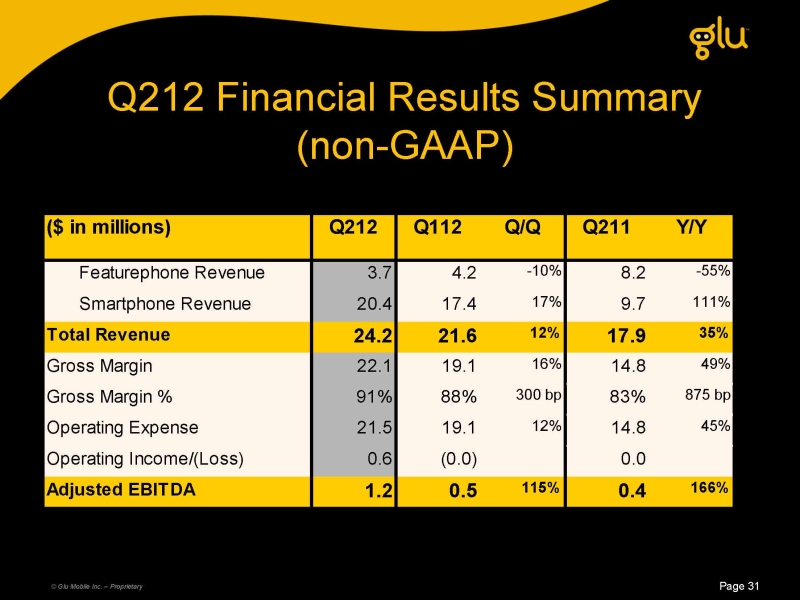
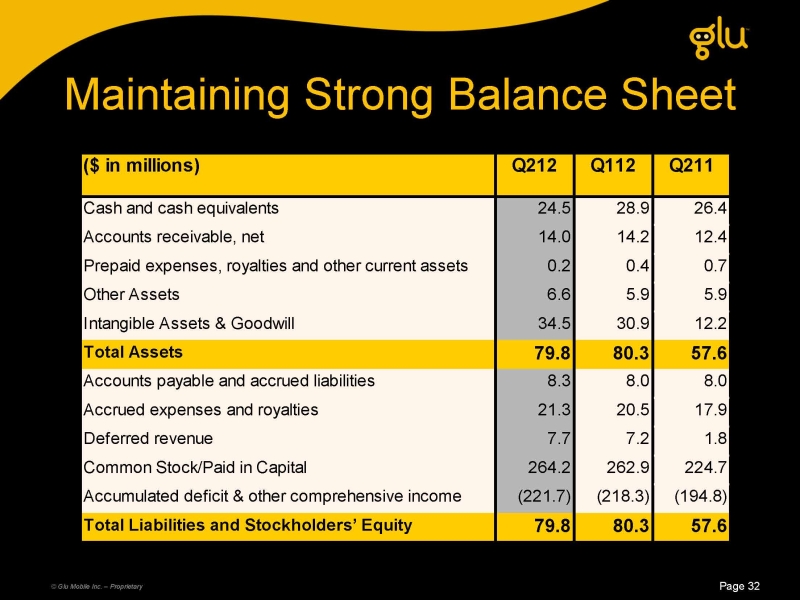
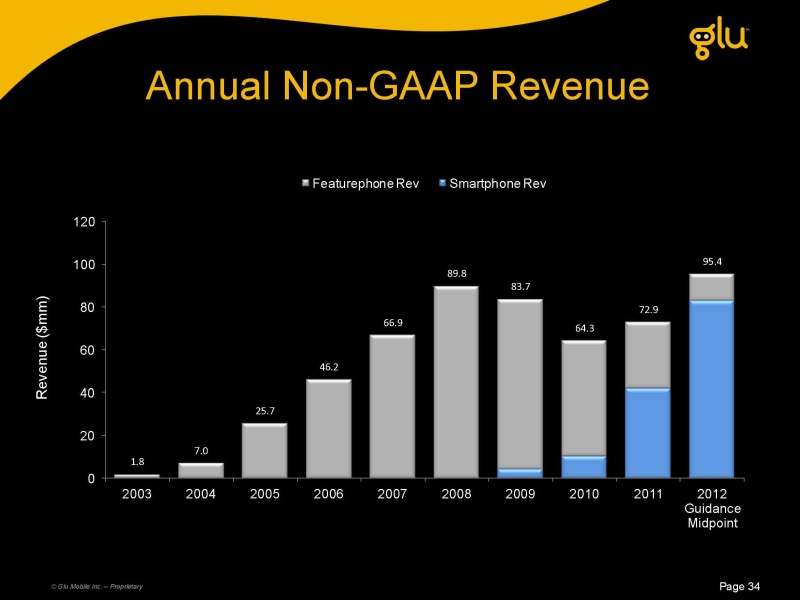
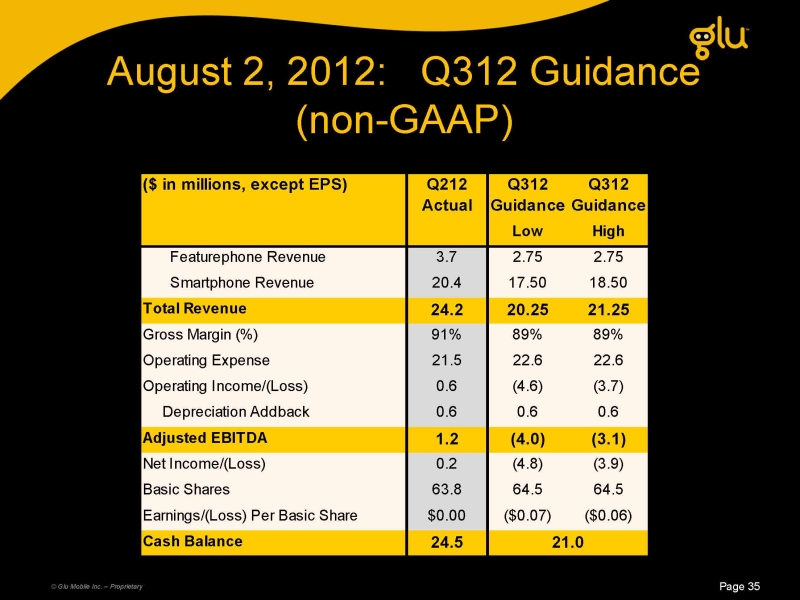
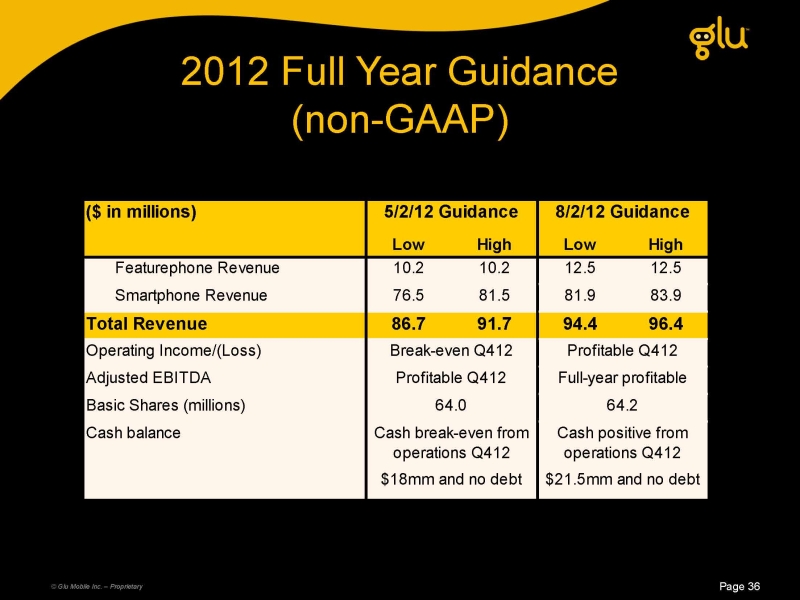
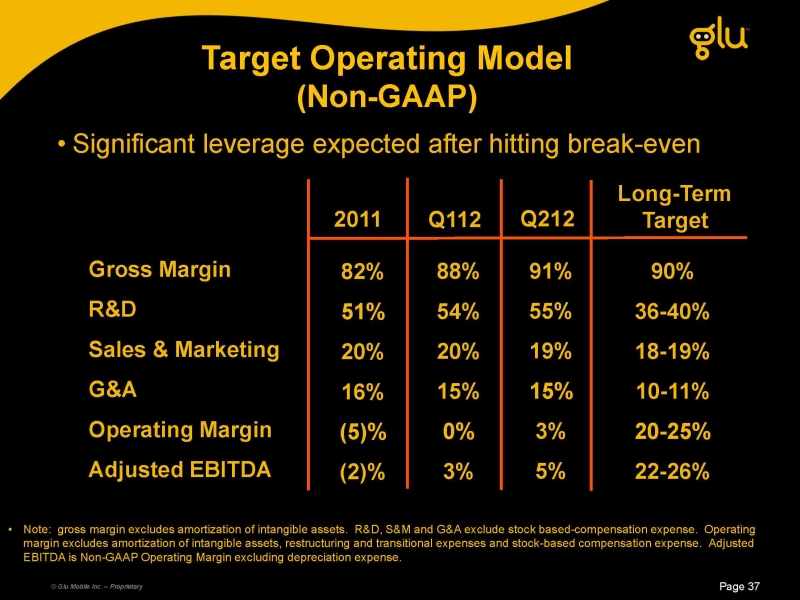
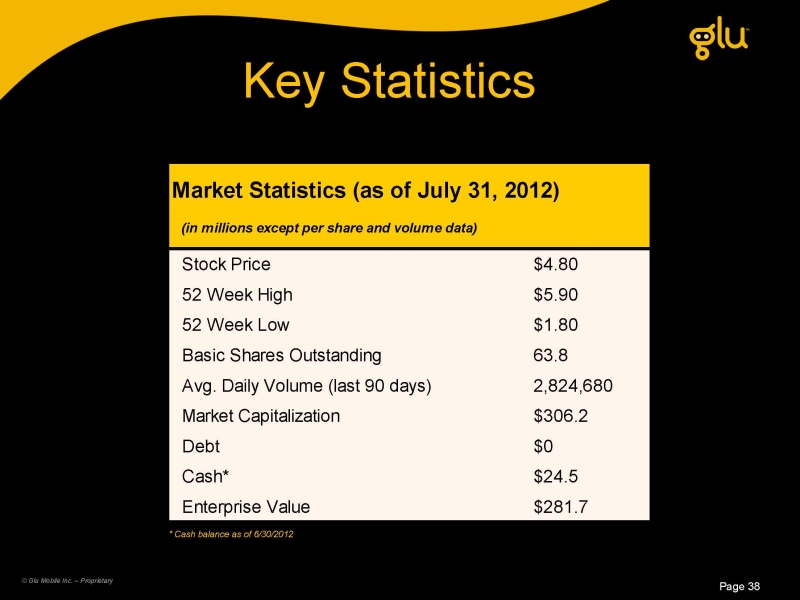
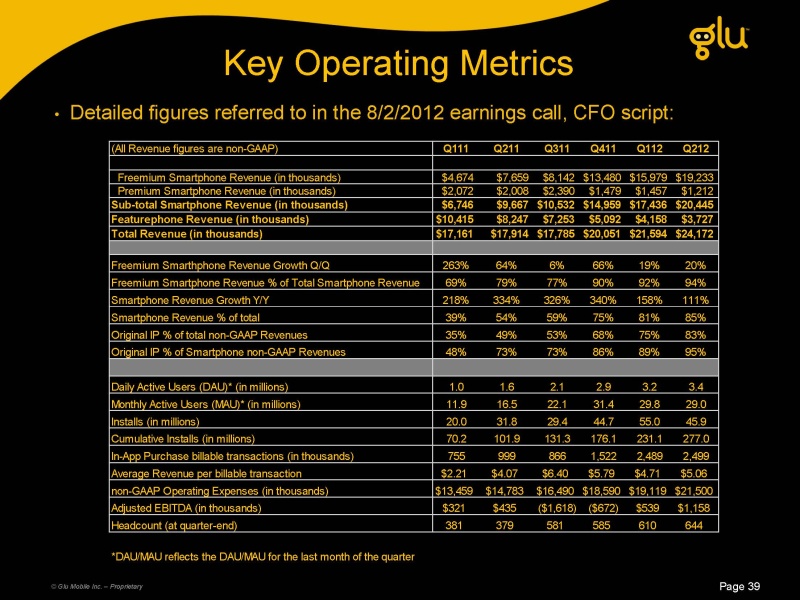
Platform Transition Momentum (all figures non-GAAP) 8 quarters to trough Smartphone Revenue drives overall Revenue Growth & 2012 EBITDA profitability 85% smartphone revenues Launch of first freemium products Page 17 0%25%50%75%100%2H101H112H111H122H12Original IP Success RateOriginal IP Failure RateOriginal IP* Successes © Glu Mobile Inc. – Proprietary

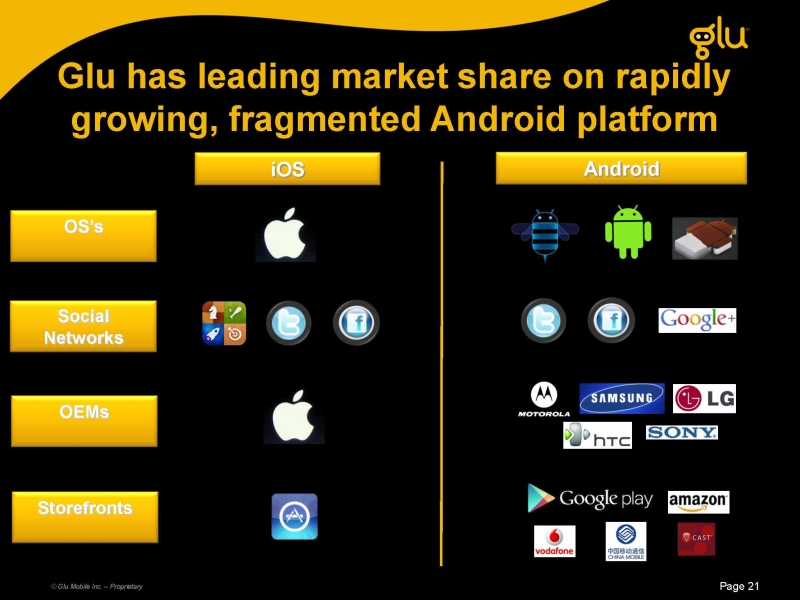
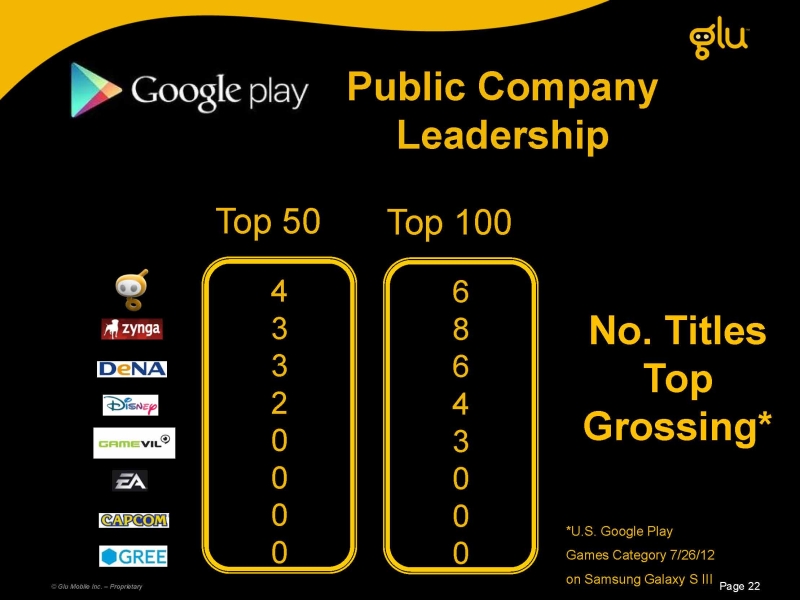

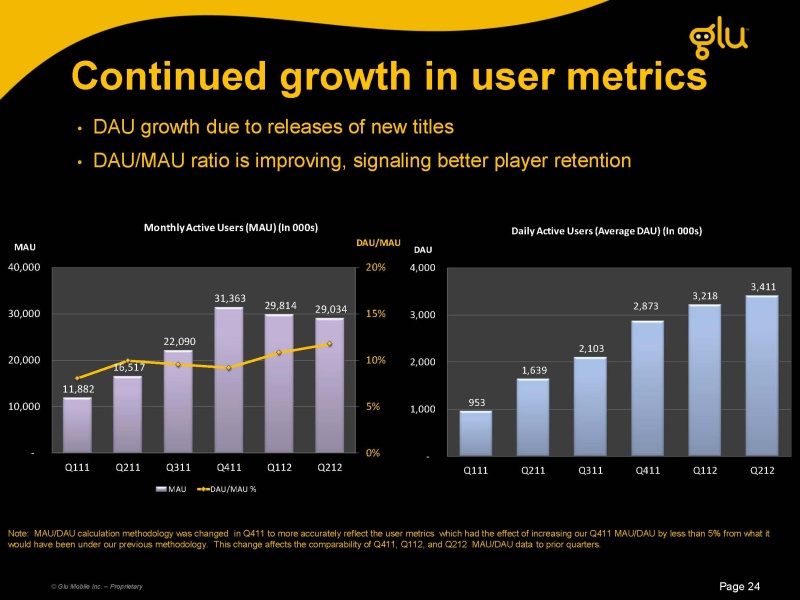
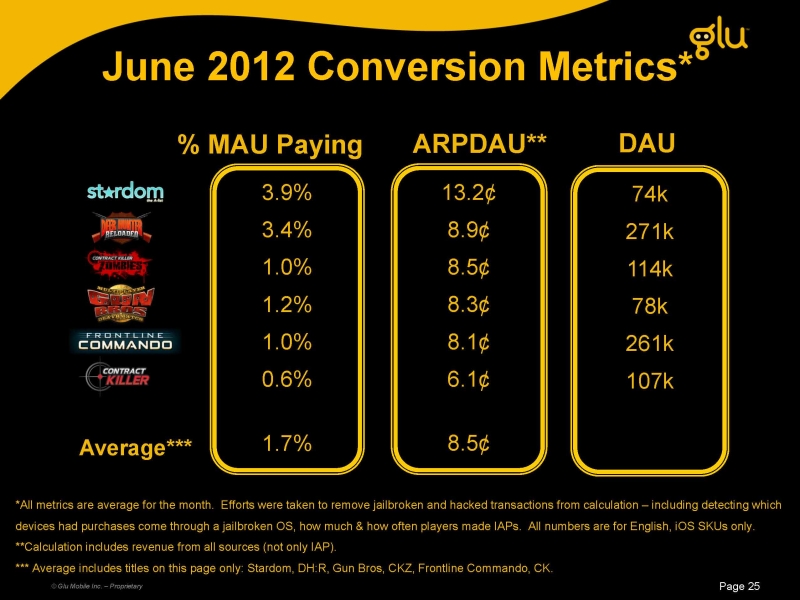

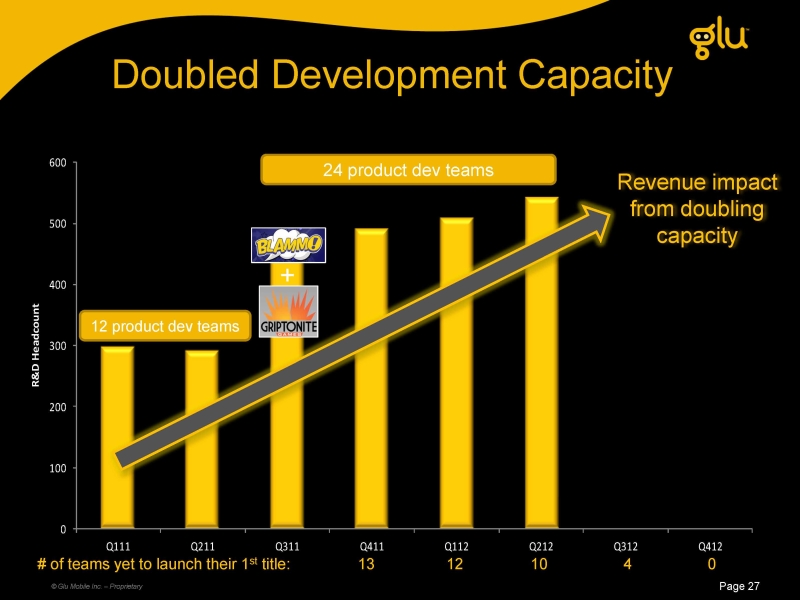
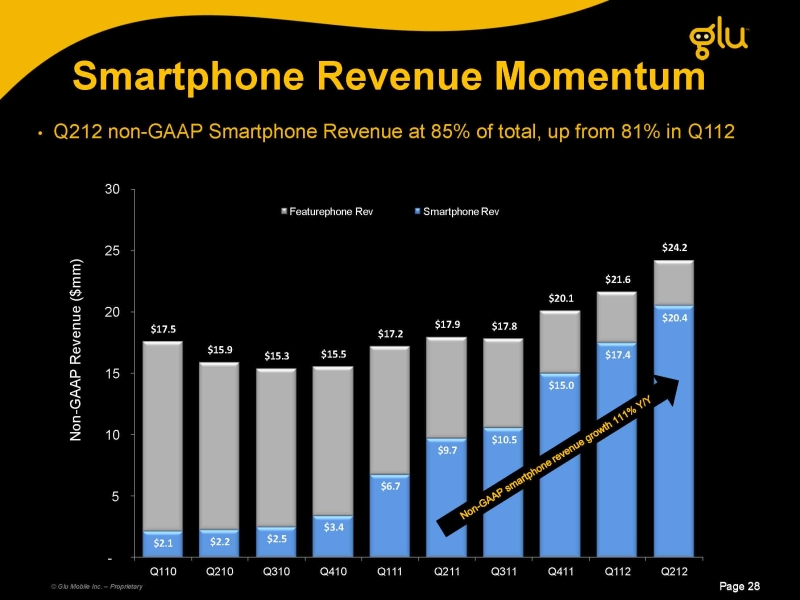

Subscription Billing on Android © Glu Mobile Inc. – Proprietary Page 20 Glu first to launch subscriptions and universal currency: •Universal Glu Credit currency across Glu games • $2–$20 per month VIP Clubs • Bonus Glu Credits • Monthly sweepstakes for prizes Page 21 iOS Android © Glu Mobile Inc. – Proprietary Page 21 OS’s Social Networks OEMs Storefronts Glu has leading market share on rapidly growing, fragmented Android platform App Store © Glu Mobile Inc. – Proprietary No. Titles Top Grossing* 4 3 3 2 0 0 0 0 Top 50 6 8 6 4 3 0 0 0 Top 100 *U.S. Google Play Games Category 7/26/12 on Samsung Galaxy S III Public Company Leadership Page 22 Cumulative Installs •46mm downloads in Q212 © Glu Mobile Inc. – Proprietary Page 23 70,174 101,934 131,320 176,054 231,063 276,995 -100,000 200,000 300,000 Q111Q211Q311Q411Q112Q212Cumulative Installs (Lifetime) (in 000s) 11,882 16,517 22,090 31,363 29,814 29,075 0%5%10%15%20%-10,000 20,000 30,000 40,000 Q111Q211Q311Q411Q112Q212DAU/MAU %MAUMonthly Active Users (MAU) (In 000s)MAUDAU/MAU %•DAU growth due to releases of new titles •DAU/MAU ratio is improving, signaling better player retention Continued growth in user metrics Note: MAU/DAU calculation methodology was changed in Q411 to more accurately reflect the user metrics which had the effect of increasing our Q411 MAU/DAU by less than 5% from what it would have been under our previous methodology. This change affects the comparability of Q411, Q112, and Q212 MAU/DAU data to prior quarters. © Glu Mobile Inc. – Proprietary Page 24 953 1,639 2,103 2,873 3,218 3,411 -1,000 2,000 3,000 4,000 Q111Q211Q311Q411Q112Q212DAUDaily Active Users (Average DAU) (In 000s) Page 25 June 2012 Conversion Metrics* © Glu Mobile Inc. – Proprietary 13.2¢ 8.9¢ 8.5¢ 8.3¢ 8.1¢ 6.1¢ 8.5¢ ARPDAU** Average*** *All metrics are average for the month. Efforts were taken to remove jailbroken and hacked transactions from calculation – including detecting which devices had purchases come through a jailbroken OS, how much & how often players made IAPs. All numbers are for English, iOS SKUs only. **Calculation includes revenue from all sources (not only IAP). *** Average includes titles on this page only: Stardom, DH:R, Gun Bros, CKZ, Frontline Commando, CK. 3.9% 3.4% 1.0% 1.2% 1.0% 0.6% 1.7% % MAU Paying 74k 271k 114k 78k 261k 107k DAU Financials © Glu Mobile Inc. – Proprietary 0100200300400500600Q111Q211Q311Q411Q112Q212Q312Q412R&D HeadcountDoubled Development Capacity © Glu Mobile Inc. – Proprietary + Revenue impact from doubling capacity # of teams yet to launch their 1st title: 13 12 10 4 0 Page 27 24 product dev teams 12 product dev teams •Q212 non-GAAP Smartphone Revenue at 85% of total, up from 81% in Q112 Page 28 Smartphone Revenue Momentum © Glu Mobile Inc. – Proprietary (in millions of dollars) Non-GAAP smartphonerevenue growth 111% Y/Y Page 28 Non-GAAP Smartphone Revenue Mix Page 29 © Glu Mobile Inc. – Proprietary Page 30 Studio capacity investment suppressed EBITDA in 2H11 © Glu Mobile Inc. – Proprietary (in millions of dollars) (2,000)(1,500)(1,000)(500)-500 1,000 1,500 Q111Q211Q311Q411Q112Q212($K) Acquired Blammo & Grip Page 30 Q212 Financial Results Summary (non-GAAP) © Glu Mobile Inc. – Proprietary Page 31 ($ in millions) Q212 Q112 Q/Q Q211 Y/Y Featurephone Revenue3.74.2-10%8.2-55% Smartphone Revenue20.417.417%9.7111%Total Revenue24.221.612%17.935%Gross Margin 22.119.116%14.849%Gross Margin %91%88%300 bp83%875 bpOperating Expense 21.519.112%14.845%Operating Income/(Loss)0.6(0.0)0.0Adjusted EBITDA1.20.5115%0.4166% Maintaining Strong Balance Sheet © Glu Mobile Inc. – Proprietary Page 32 ($ in millions) Q212Q112 Q211 Cash and cash equivalents 24.5 28.9 26.4 Accounts receivable, net 14.0 14.2 12.4 Prepaid expenses, royalties and other current assets 0.2 0.4 0.7 Other Assets 6.6 5.9 5.9 Intangible Assets & Goodwill 34.5 30.9 12.2 Total Assets79.880.357.6Accounts payable and accrued liabilities 8.3 8.0 8.0 Accrued expenses and royalties 21.3 20.5 17.9 Deferred revenue 7.7 7.2 1.8 Common Stock/Paid in Capital 264.2 262.9 224.7 Accumulated deficit & other comprehensive income(221.7)(218.3)(194.8)Total Liabilities and Stockholders’ Equity 79.880.357.6 title-bottom.png logo-cover.png title-top.png Q212 & 2012 Guidance and Long Term Model C:\Documents and Settings\joseph.donoghue\Desktop\default.png © Glu Mobile Inc. – Proprietary Annual Non-GAAP Revenue Page 34 © Glu Mobile Inc. – Proprietary August 2, 2012: Q312 Guidance (non-GAAP) © Glu Mobile Inc. – Proprietary ($ in millions, except EPS) Q212 ActualQ312 GuidanceQ312 Guidance High Low High Featurephone Revenue3.7 2.752.75 Smartphone Revenue20.4 17.5018.50Total Revenue24.2 20.2521.25Gross Margin (%) 91%89%89%Operating Expense21.5 22.622.6Operating Income/(Loss) 0.6 (4.6)(3.7) Depreciation Addback 0.6 0.60.6Adjusted EBITDA1.2 (4.0)(3.1)Net Income/(Loss)0.2 (4.8)(3.9)Basic Shares63.8 64.564.5Earnings/(Loss) Per Basic Share $0.00 ($0.07)($0.06)Cash Balance24.5 21.0 Page 35 2012 Full Year Guidance (non-GAAP) © Glu Mobile Inc. – Proprietary Page 36 ($ in millions)LowHighLow High Featurephone Revenue10.210.212.5 12.5 Smartphone Revenue76.581.581.9 83.9 Total Revenue86.791.794.496.4Operating Income/(Loss)Adjusted EBITDABasic Shares (millions)Cash balanceBreak-even Q412Profitable Q4125/2/12 Guidance8/2/12 GuidanceCash positive from operations Q412Cash break-even from operations Q412Profitable Q41264.0$21.5mm and no debtFull-year profitable64.2$18mm and no debt Target Operating Model (Non-GAAP) Gross Margin R&D Sales & Marketing G&A Operating Margin Adjusted EBITDA •Note: gross margin excludes amortization of intangible assets. R&D, S&M and G&A exclude stock based-compensation expense. Operating margin excludes amortization of intangible assets, restructuring and transitional expenses and stock-based compensation expense. Adjusted EBITDA is Non-GAAP Operating Margin excluding depreciation expense. 82% 51% 20% 16% (5)% (2)% 2011 90% 36-40% 18-19% 10-11% 20-25% 22-26% Long-Term Target © Glu Mobile Inc. – Proprietary Page 37 88% 54% 20% 15% 0% 3% Q112 •Significant leverage expected after hitting break-even Q212 91% 55% 19% 15% 3% 5% Key Statistics © Glu Mobile Inc. – Proprietary Page 38 (in millions except per share and volume data)Stock Price$4.80 52 Week High$5.90 52 Week Low$1.80 Basic Shares Outstanding63.8 Avg. Daily Volume (last 90 days)2,824,680 Market Capitalization$306.2 Debt$0 Cash*$24.5 Enterprise Value$281.7 Market Statistics (as of July 31, 2012) * Cash balance as of 6/30/2012 Key Operating Metrics © Glu Mobile Inc. – Proprietary •Detailed figures referred to in the 8/2/2012 earnings call, CFO script: (All Revenue figures are non-GAAP)Q111Q211Q311Q411Q112Q212Freemium Smartphone Revenue (in thousands)$4,674$7,659$8,142$13,480$15,979$19,233Premium Smartphone Revenue (in thousands)$2,072$2,008$2,390$1,479$1,457$1,212Sub-total Smartphone Revenue (in thousands)$6,746$9,667$10,532$14,959$17,436$20,445Featurephone Revenue (in thousands)$10,415$8,247$7,253$5,092$4,158$3,727Total Revenue (in thousands)$17,161$17,914$17,785$20,051$21,594$24,172Freemium Smarthphone Revenue Growth Q/Q263%64%6%66%19%20%Freemium Smartphone Revenue % of Total Smartphone Revenue69%79%77%90%92%94%Smartphone Revenue Growth Y/Y218%334%326%340%158%111%Smartphone Revenue % of total39%54%59%75%81%85%Original IP % of total non-GAAP Revenues35%49%53%68%75%83%Original IP % of Smartphone non-GAAP Revenues48%73%73%86%89%95%Daily Active Users (DAU)* (in millions)1.01.62.12.93.23.4Monthly Active Users (MAU)* (in millions)11.916.522.131.429.829.1Installs (in millions)20.031.829.444.755.045.9Cumulative Installs (in millions)70.2101.9131.3176.1231.1277.0In-App Purchase billable transactions (in thousands)7559998661,5222,4892,499Average Revenue per billable transaction$2.21$4.07$6.40$5.79$4.71$5.06non-GAAP Operating Expenses (in thousands)$13,459$14,783$16,490$18,590$19,119$21,500Adjusted EBITDA (in thousands)$321$435($1,618)($672)$539$1,158Headcount (at quarter-end)381379581585610644*DAU/MAU reflects the DAU/MAU for the last month of the quarter Page 39 Glu Mobile: Investment Overview •Leading freemium mobile gaming company •Original IP titles driving gross margin improvements •Acquired two companies to approximately double development capacity © Glu Mobile Inc. – Proprietary Page 40