Exhibit 99.02

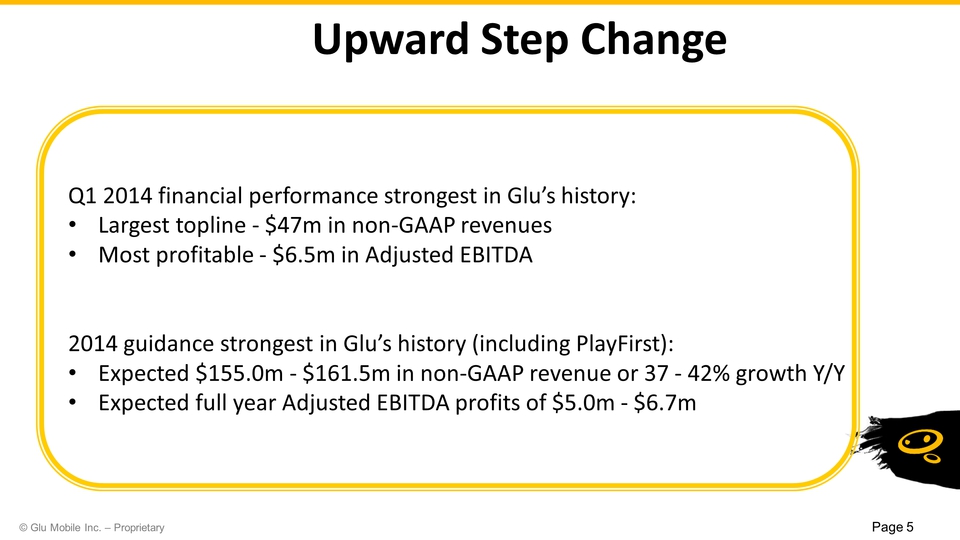
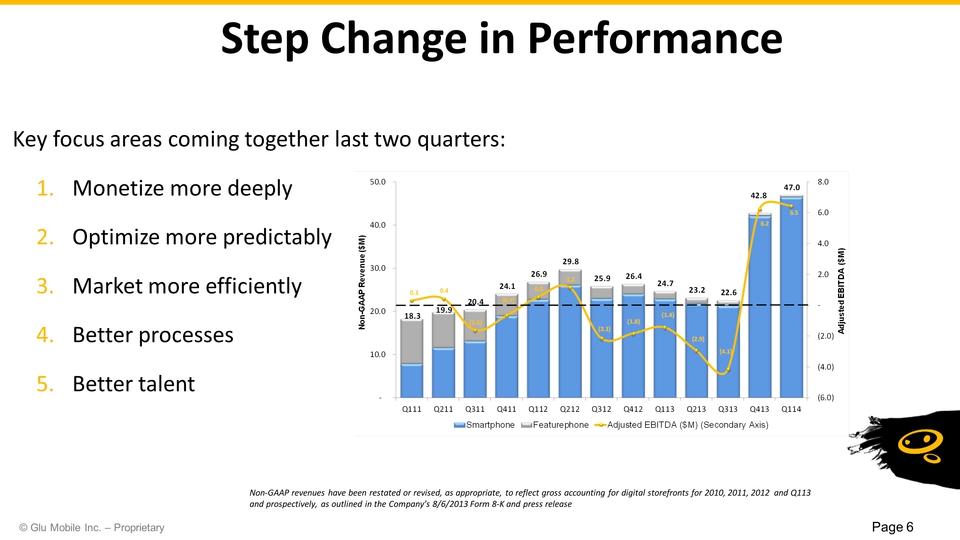
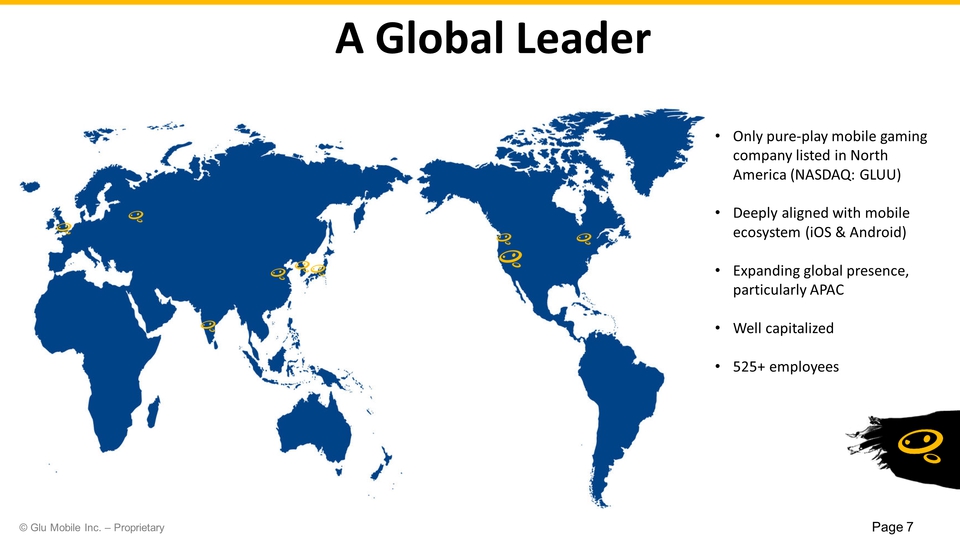
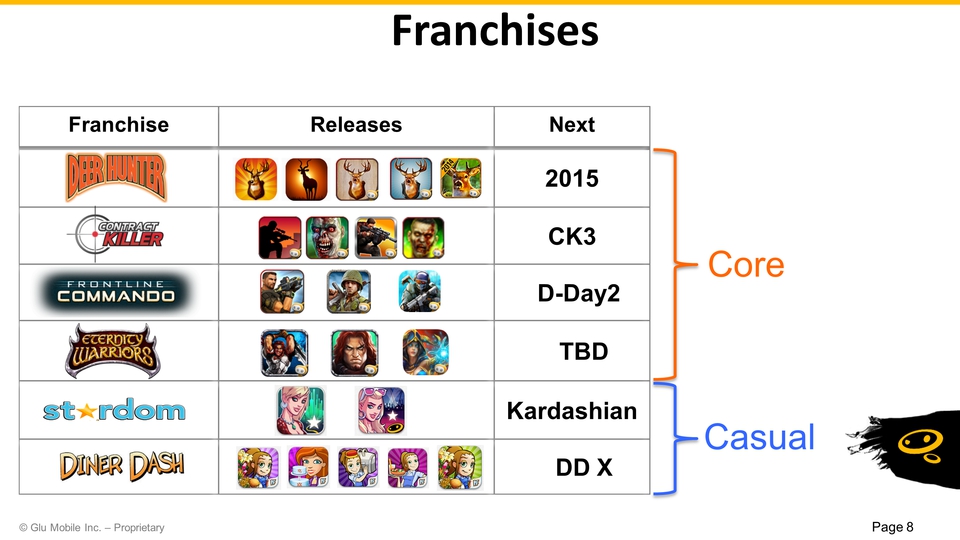
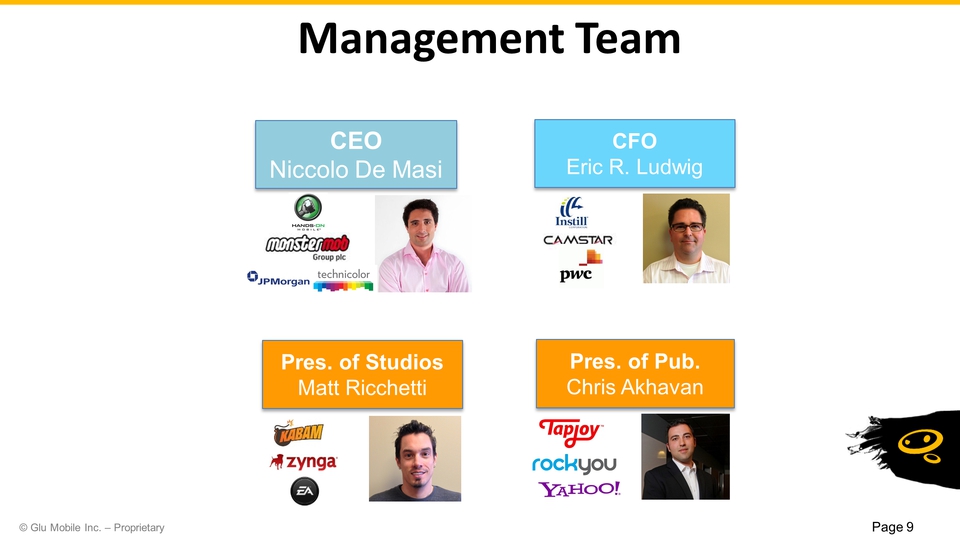
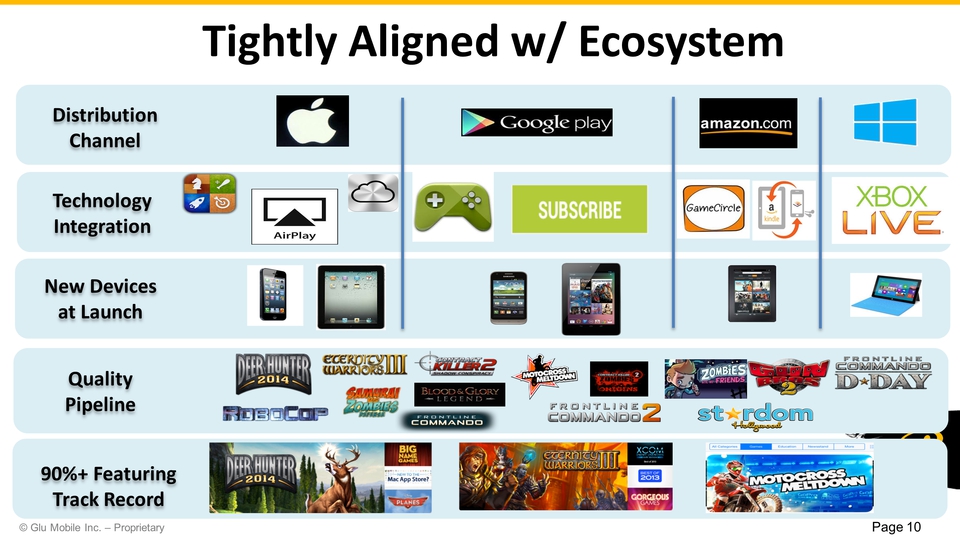

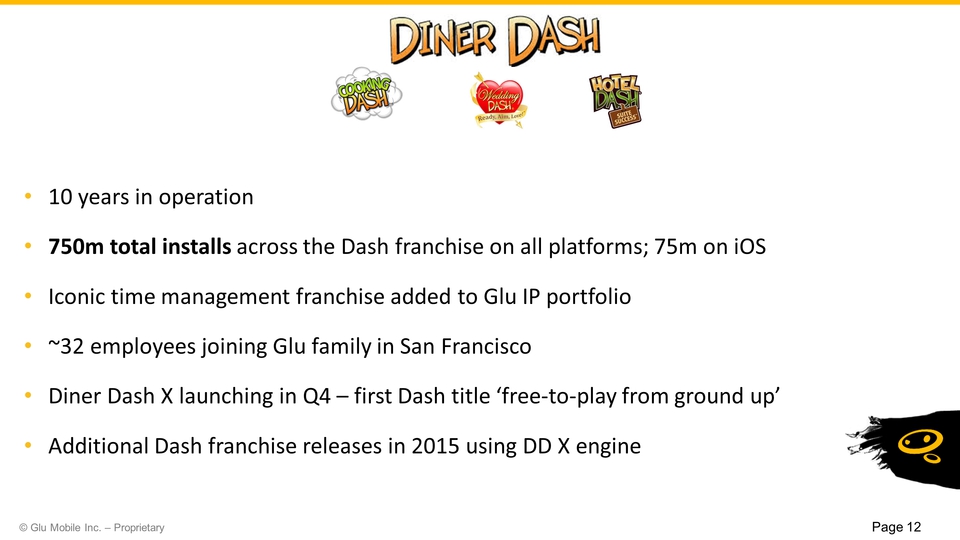
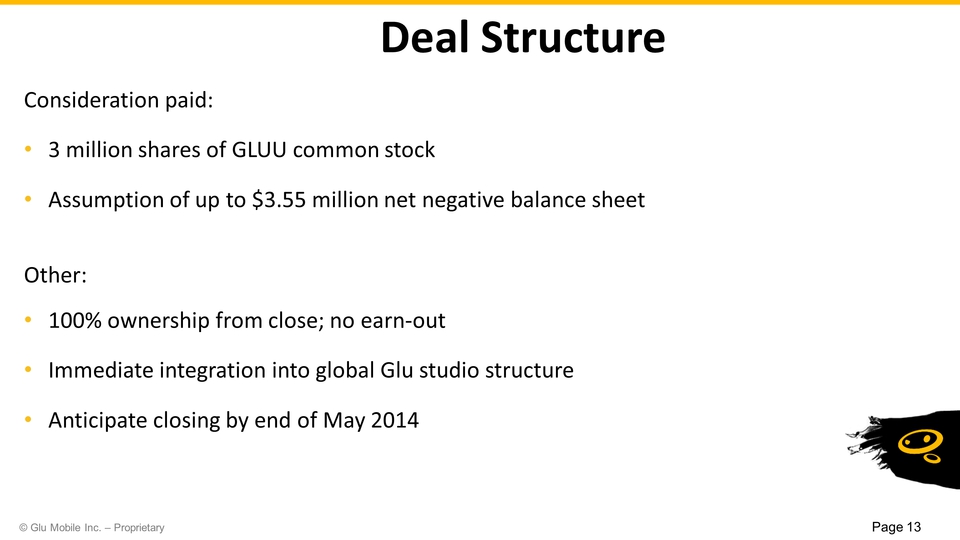
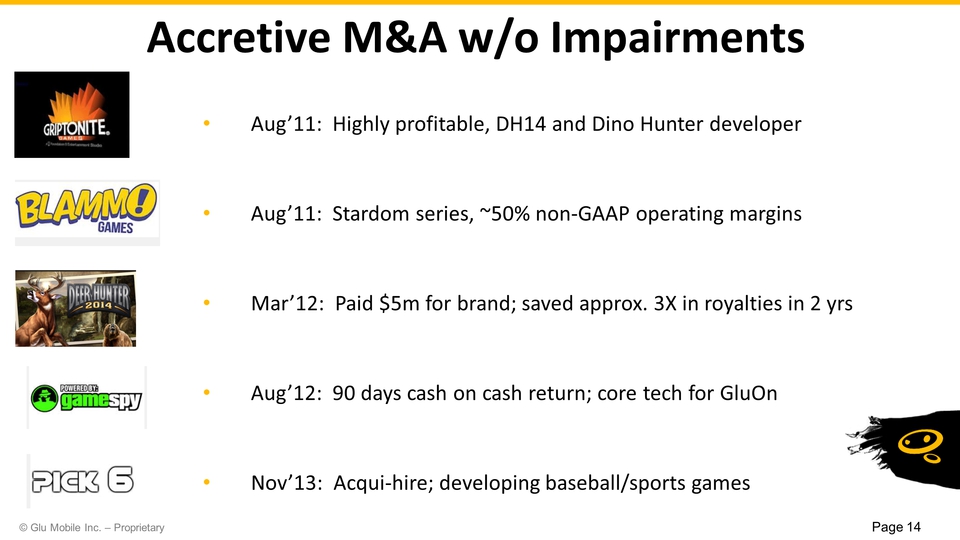

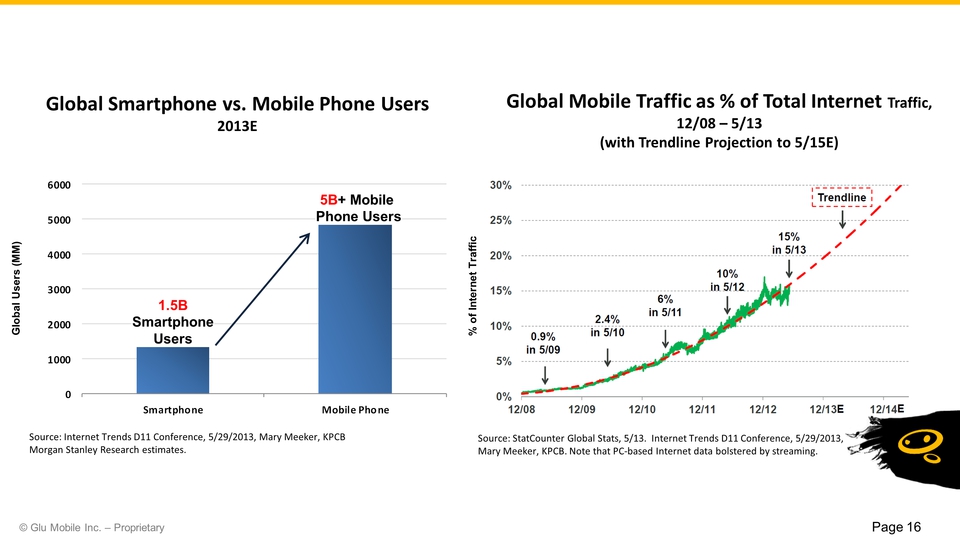
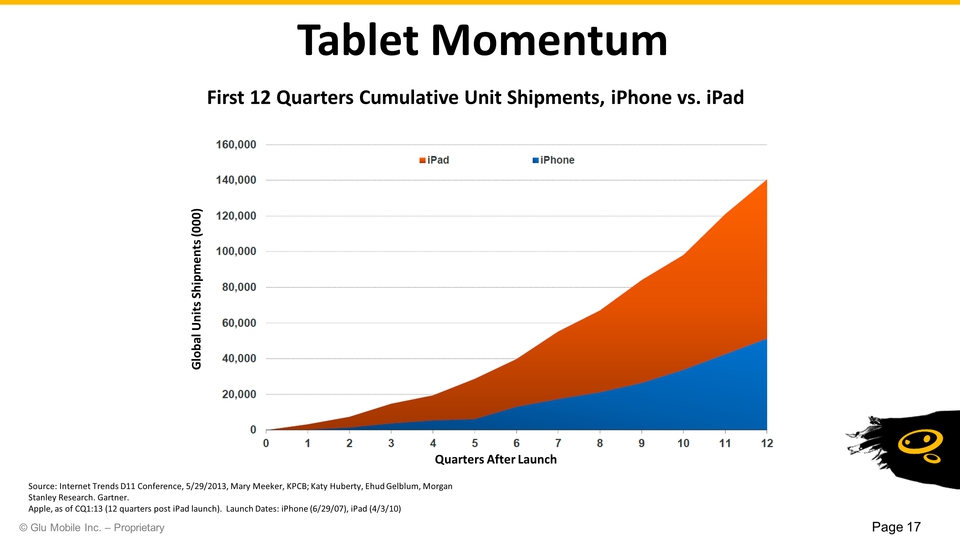
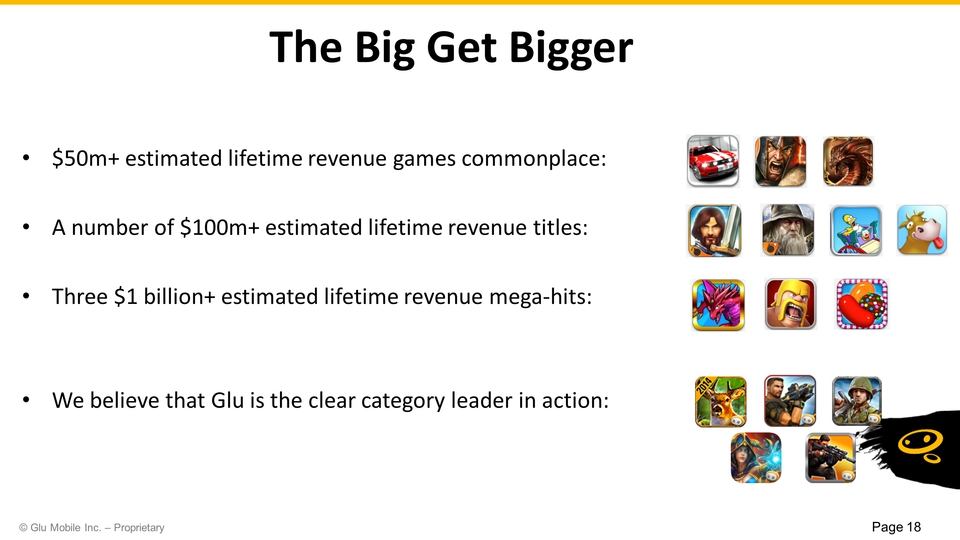
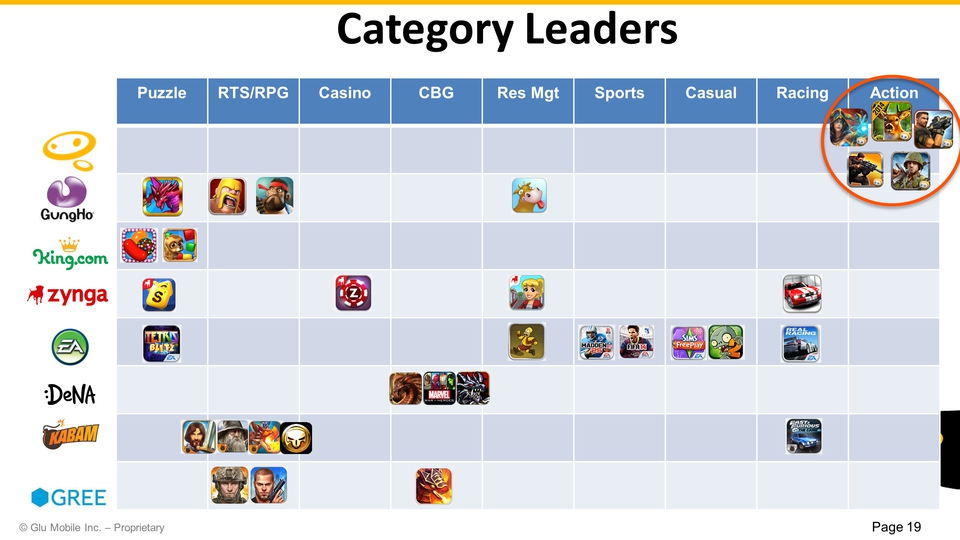


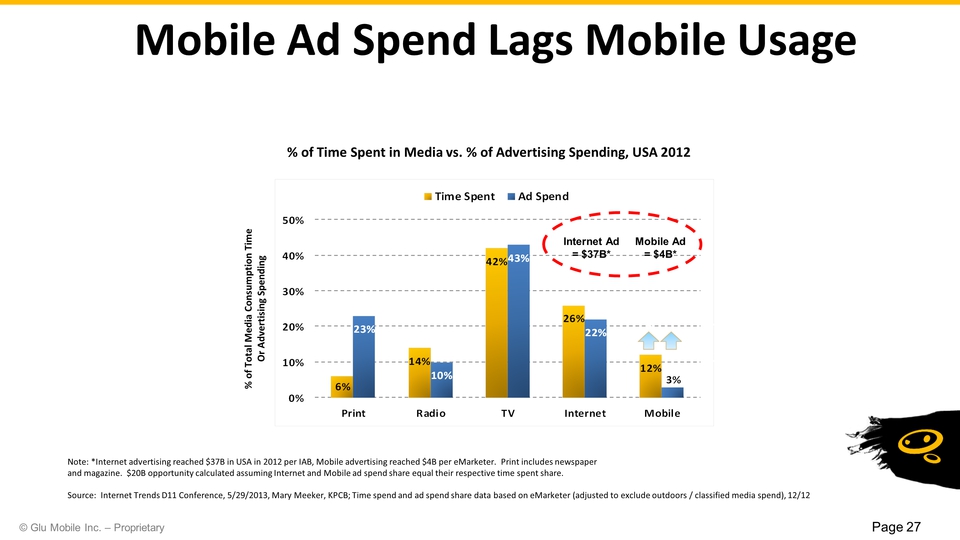
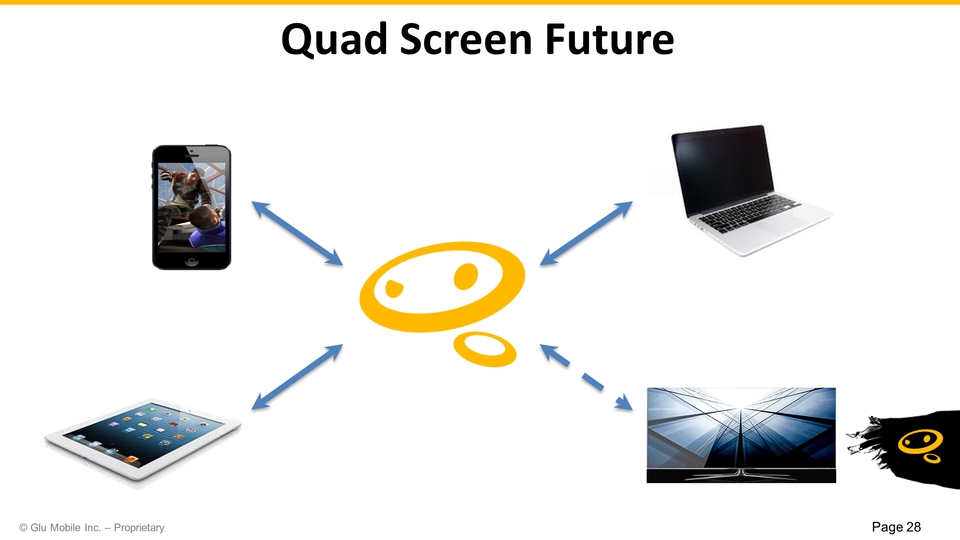
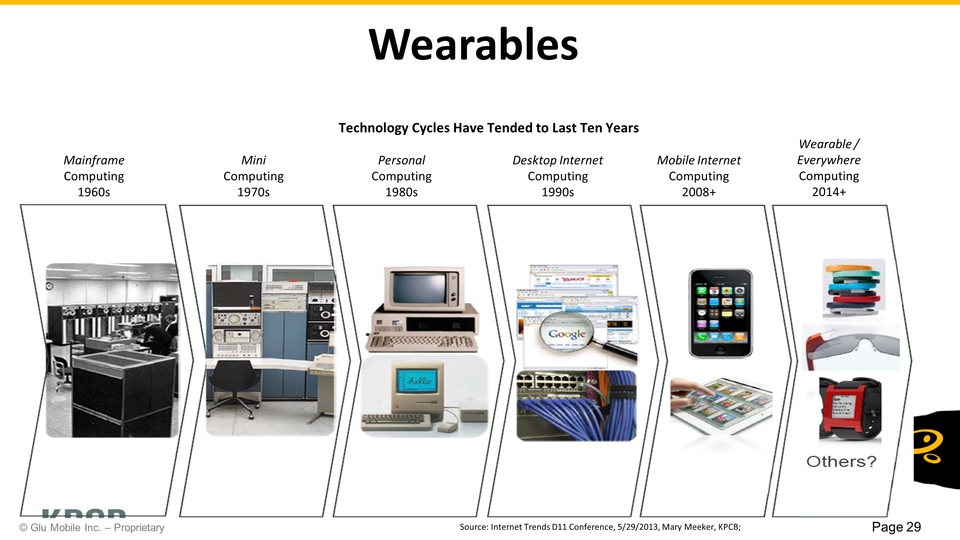

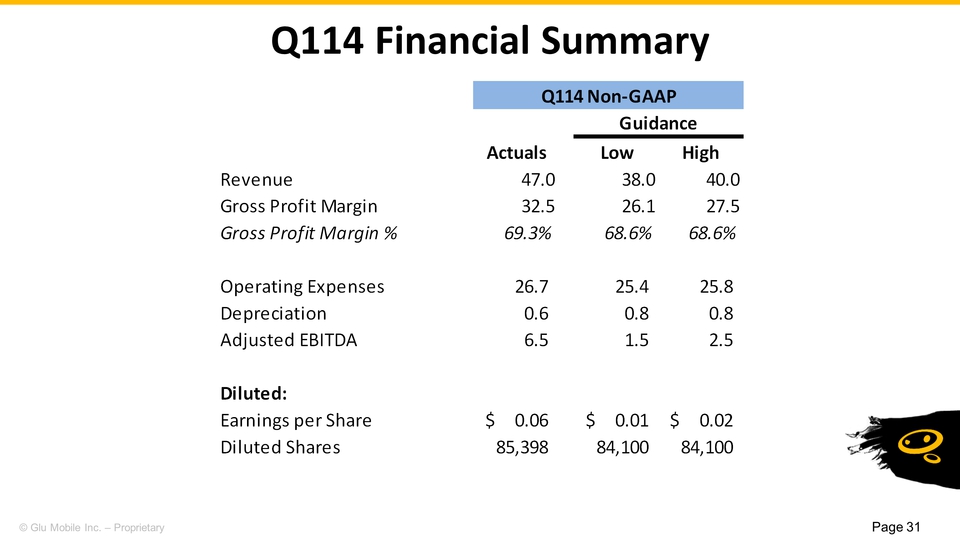
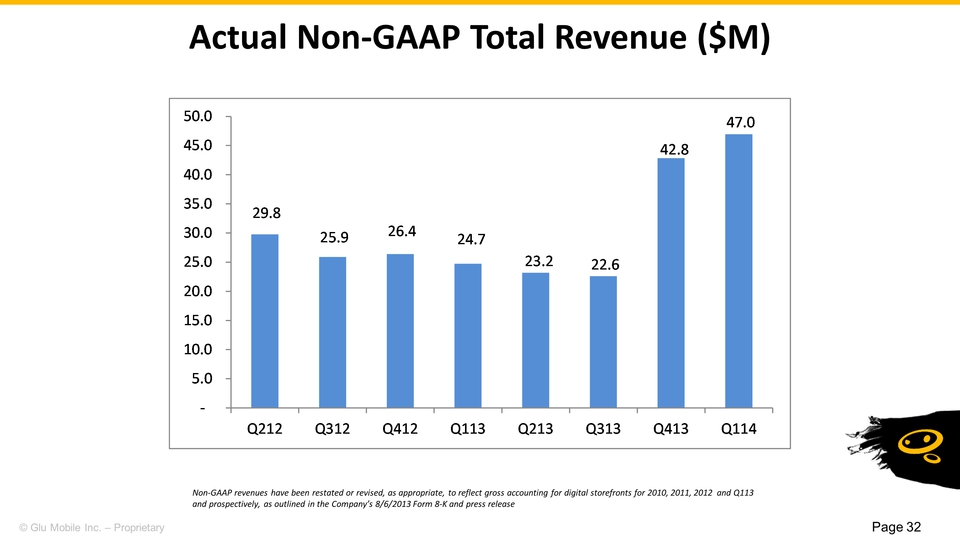
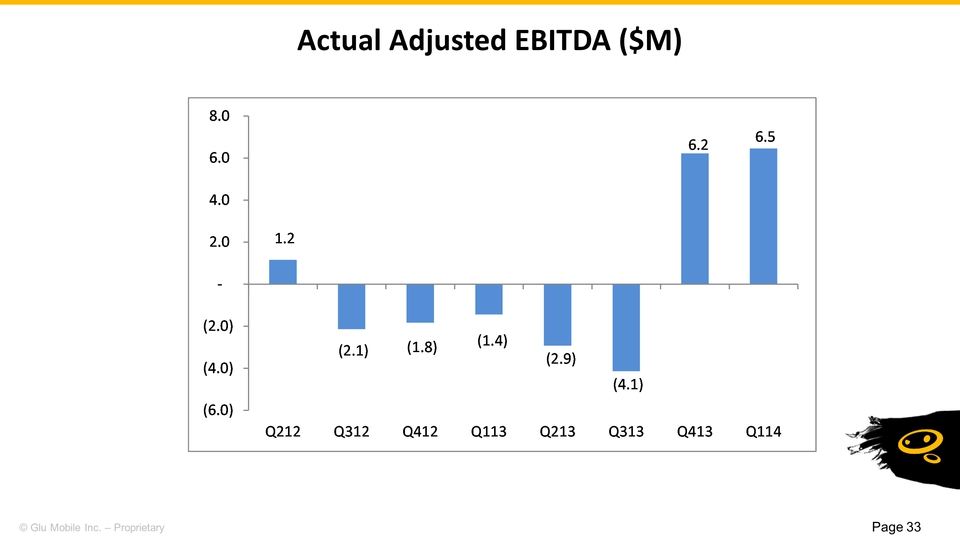
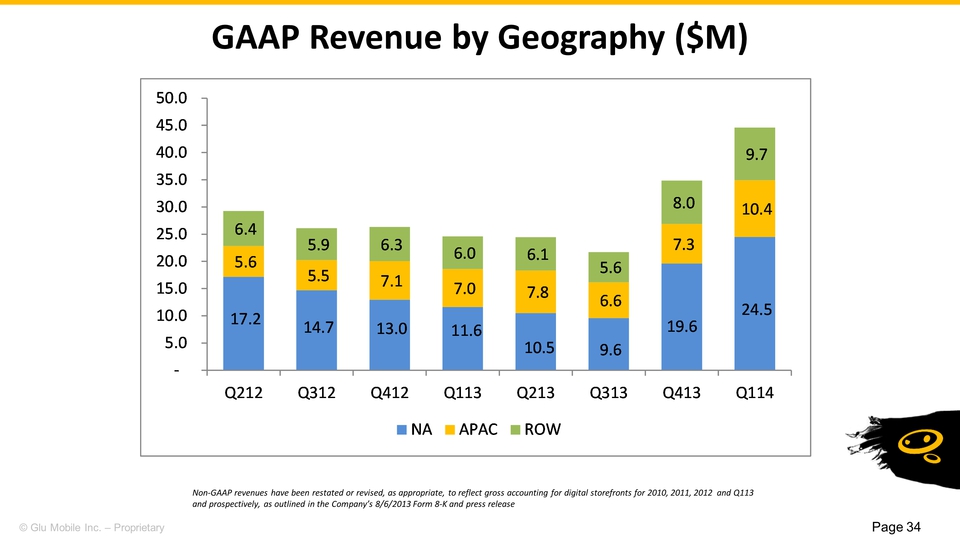
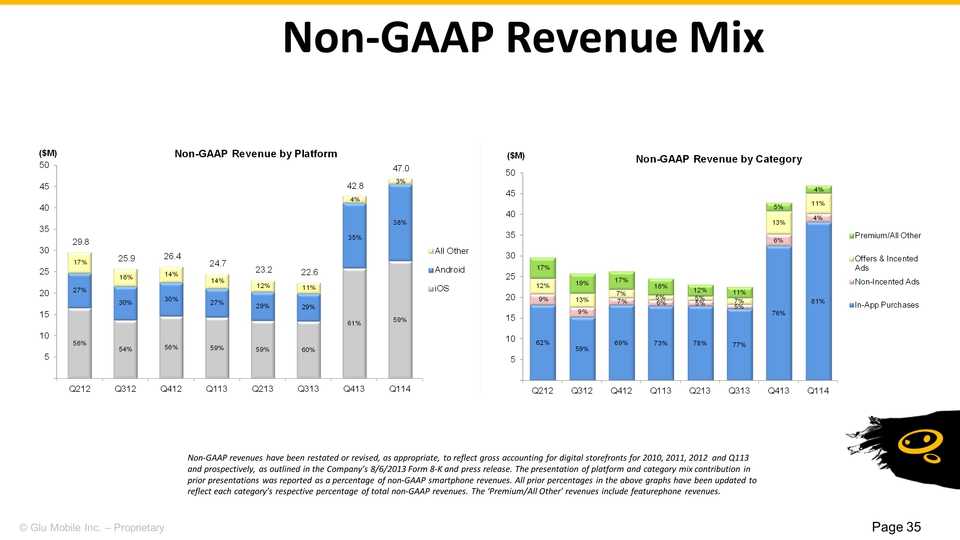
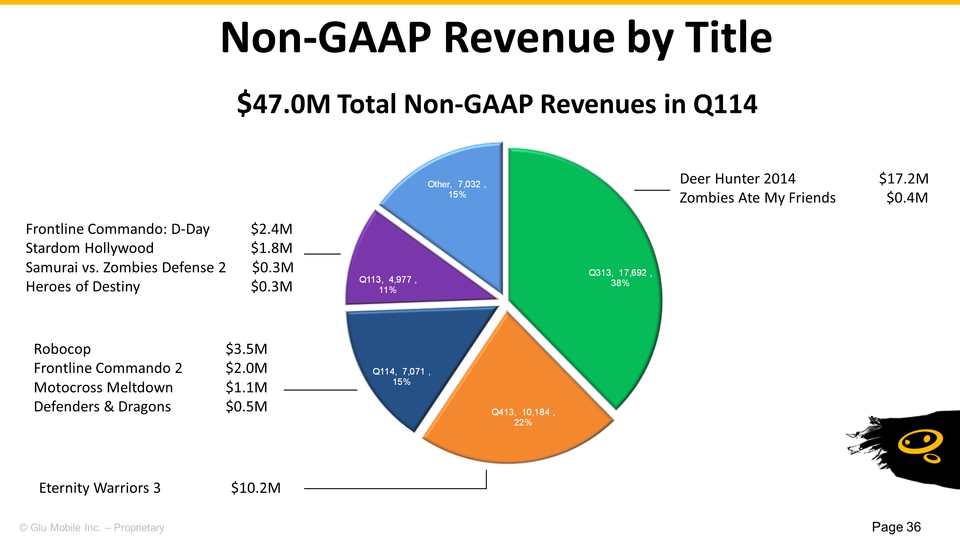
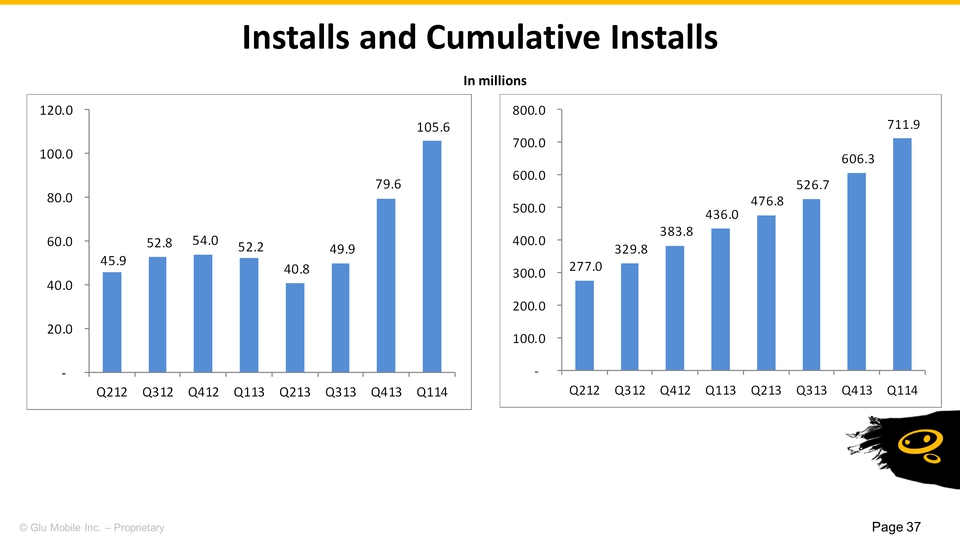
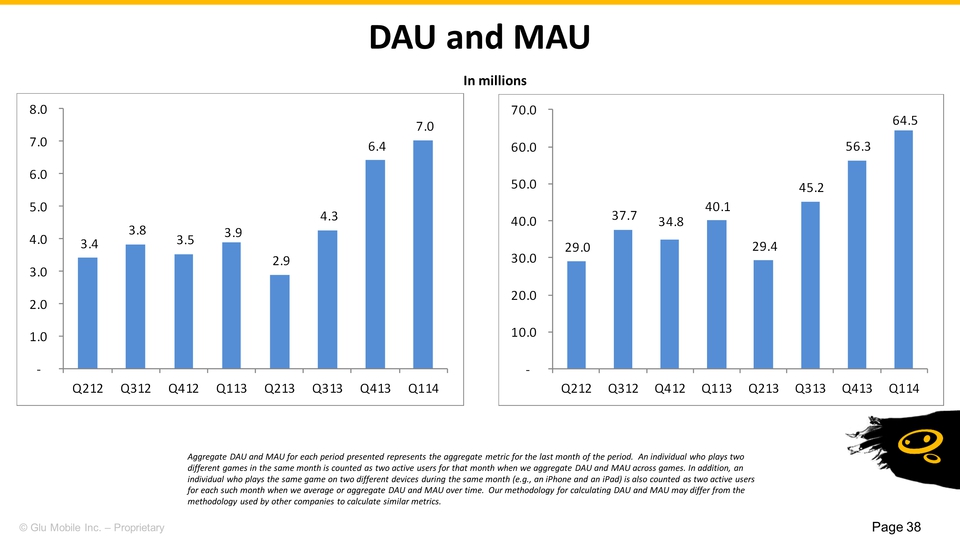
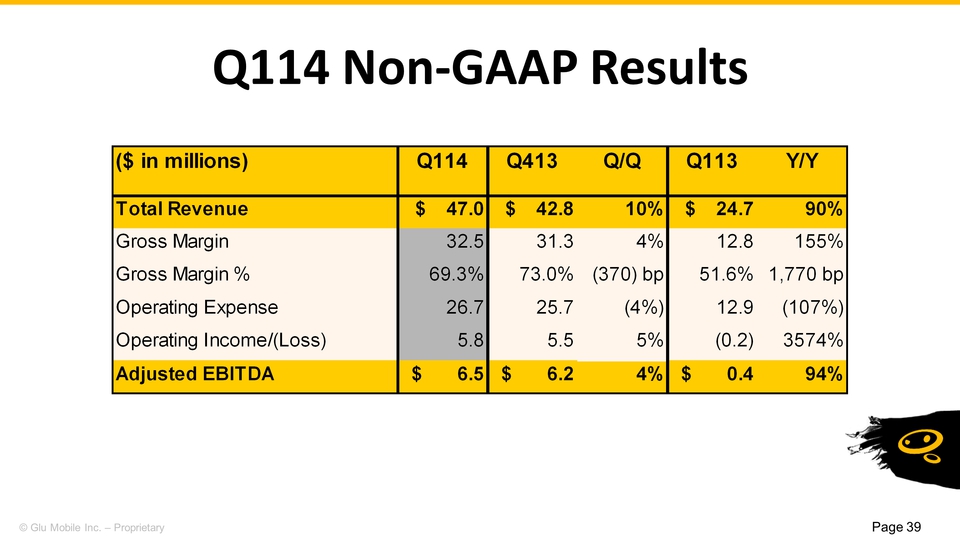
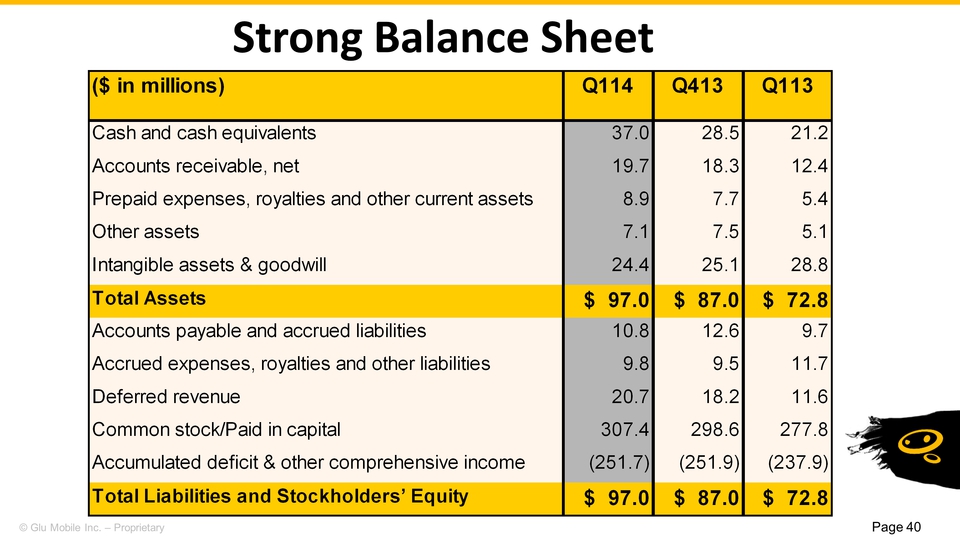

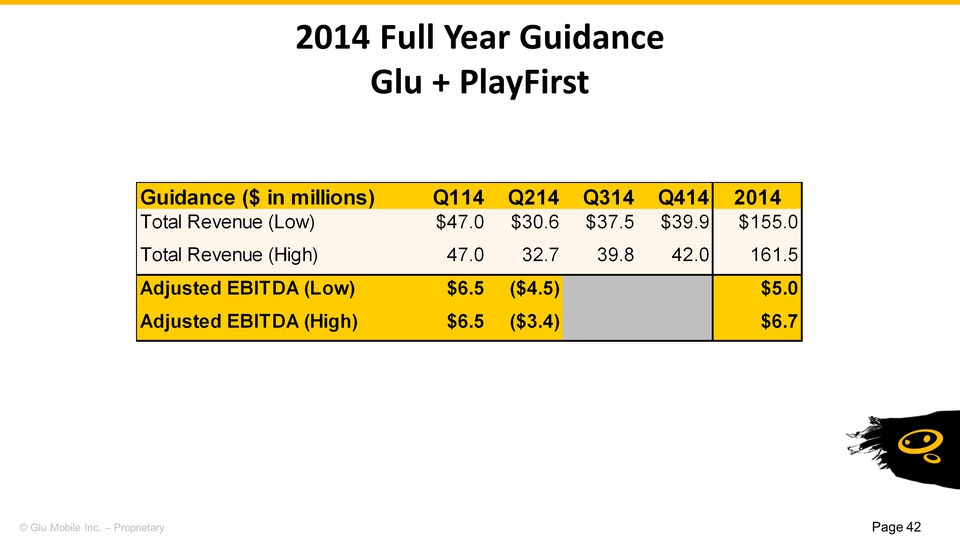
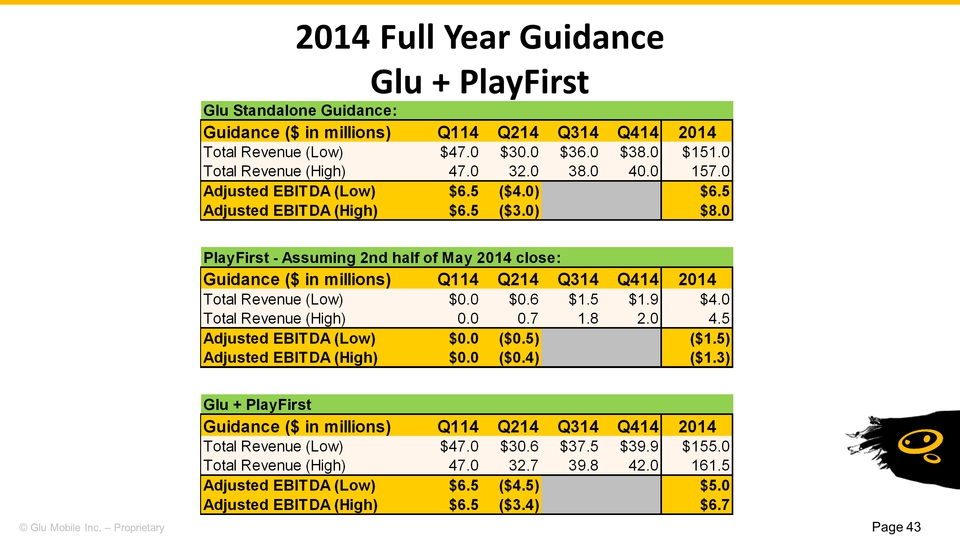
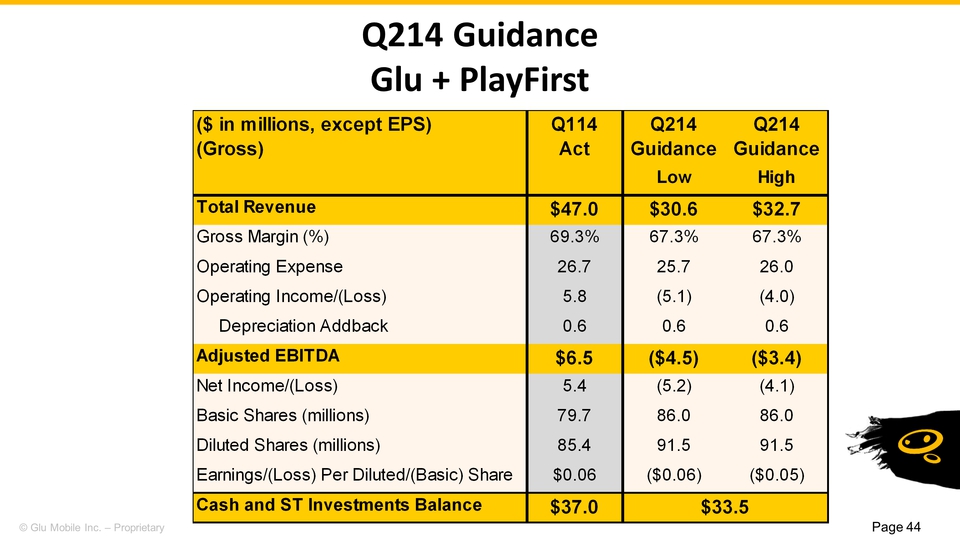
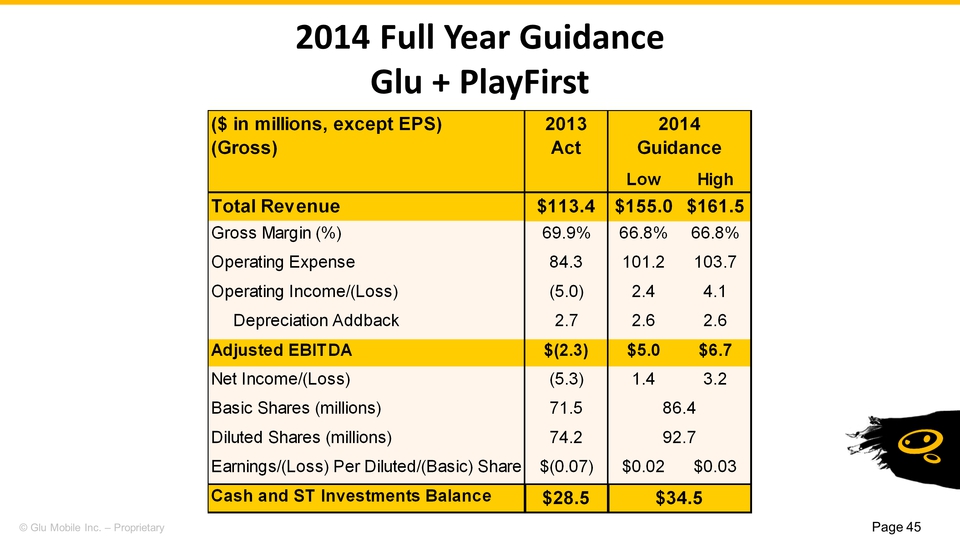
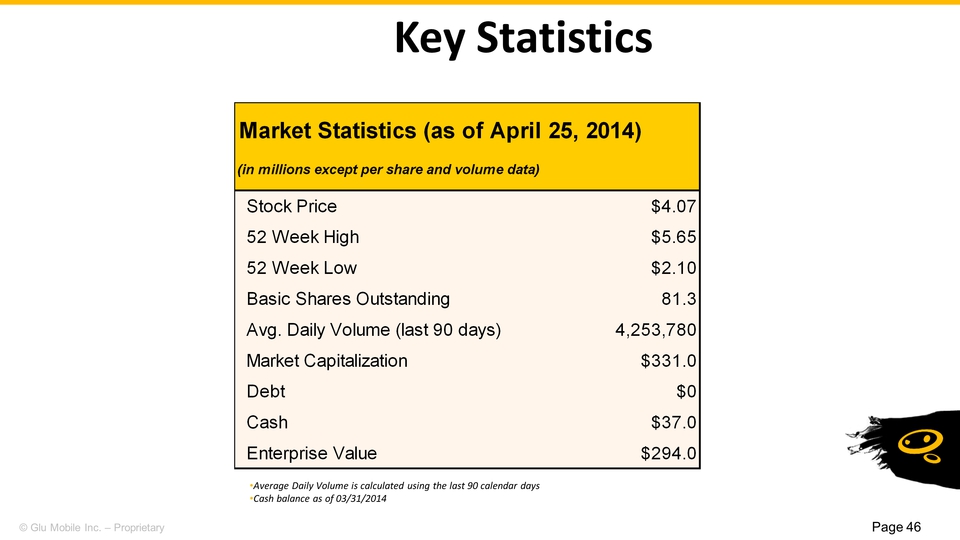
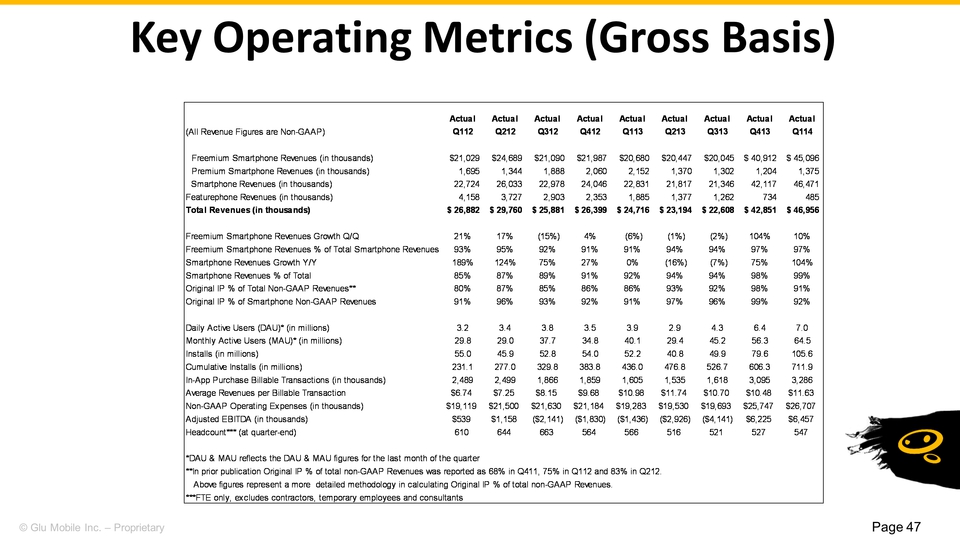
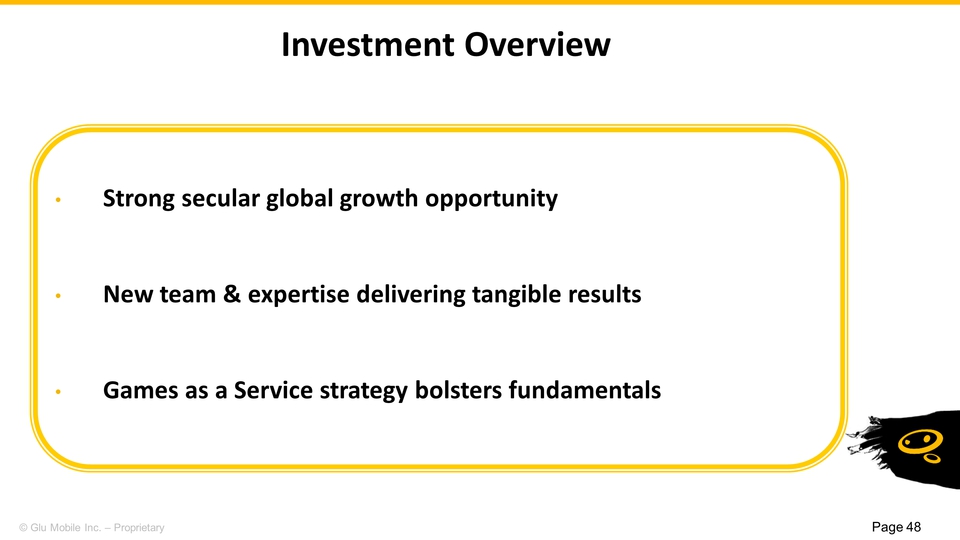

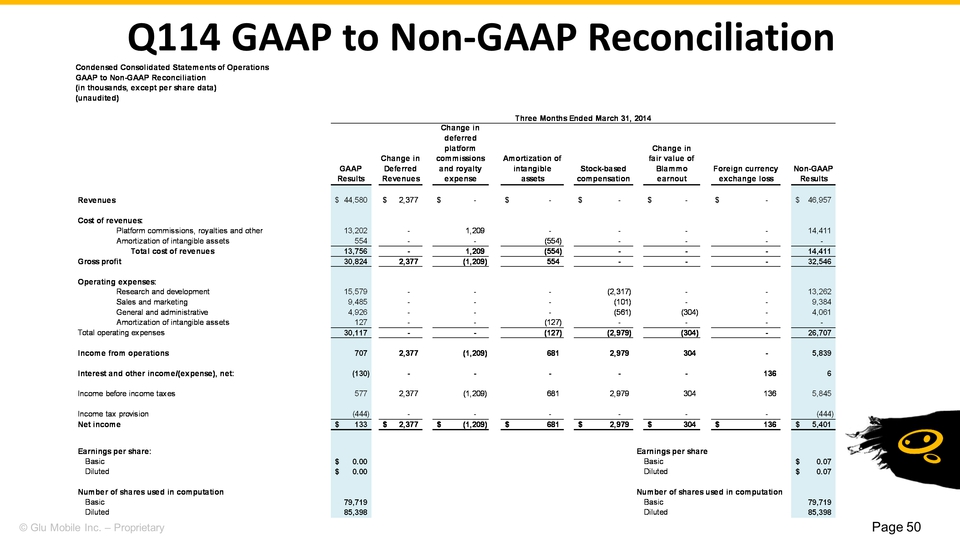
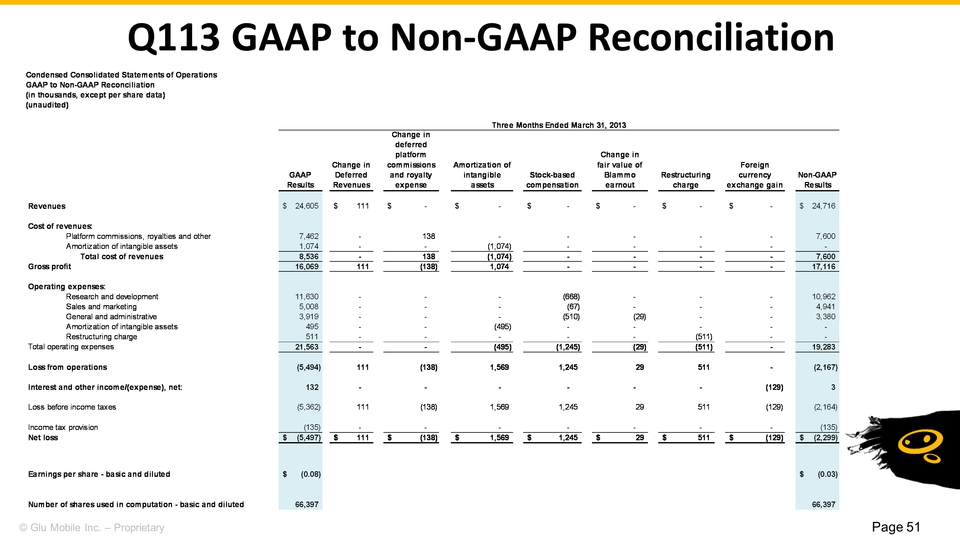
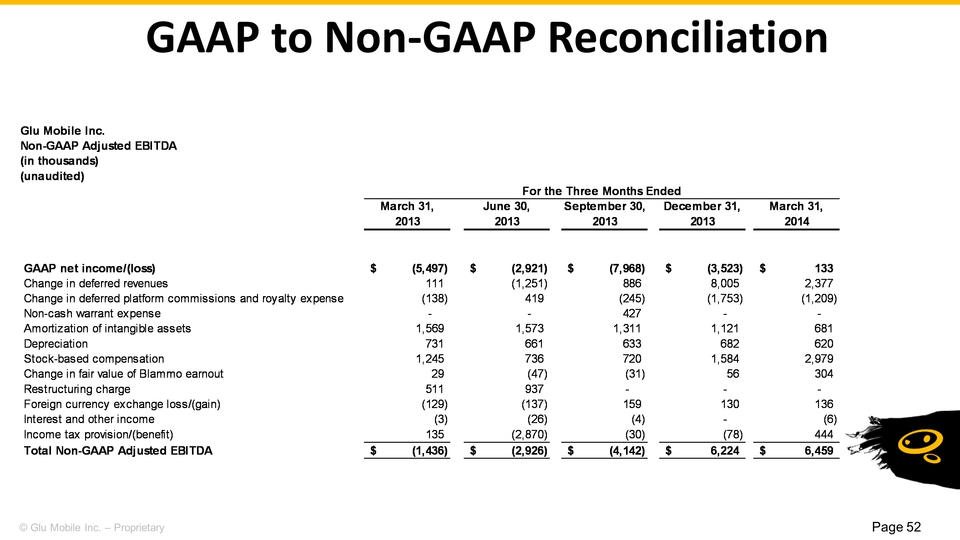
Slide: 1 Title: Glu Mobile Q114 Earnings Call April 30, 2014 Page 1 Slide: 2 Title: Safe Harbor Statement This presentation contains "forward-looking" statements including those regarding: our quarterly and full year guidance for 2014; that we have an expanding global presence, particularly in APAC; our expected next title releases for each of our franchises; the expected timing of launching Diner Dash X and additional Dash franchise releases; the anticipated closing date of the PlayFirst acquisition; estimated growth and expected trends in smartphone users and global mobile traffic; momentum in global tablet growth; our belief that the shooter genre is well positioned for long-term growth in mobile free-to-play from current levels; our expected Q3-2014 title lineup; our belief that there is a significant opportunity for increased mobile ad spending, particularly in the U.S.; our expectation of the quad screen future; expected trends in wearable computing; our 2014 quarterly and full year guidance including PlayFirst; and that Glu has a strong secular growth opportunity. These forward-looking statements are subject to material risks and uncertainties that could cause actual results to differ materially from those in the forward-looking statements. Investors should consider important risk factors, which include: the risk that consumer demand for smartphones, tablets and next-generation platforms does not grow as significantly as we anticipate or that we will be unable to capitalize on any such growth; the risk that we do not realize a sufficient return on our investment with respect to our efforts to develop free-to-play games for smartphones and tablets, the risk that we do not maintain our good relationships with Apple and Google; the risk that our development expenses for games for smartphones are greater than we anticipate; the risk that our recently and newly launched games are less popular than anticipated; the risk that our newly released games will be of a quality less than desired by reviewers and consumers; the risk that the mobile games market, particularly with respect to social, free-to-play gaming, is smaller than anticipated; risks related to the restatement of certain of our historical financial statements and other risks detailed under the caption "Risk Factors" in our Form 10-K filed with the Securities and Exchange Commission on March 14, 2014 and our other SEC filings. You can locate these reports through our website at http://www.glu.com/investors. These "forward-looking" statements are based on estimates and information available to us on April 30, 2014 and we are under no obligation, and expressly disclaim any obligation, to update or alter our forward-looking statements whether as a result of new information, future events or otherwise. Page 2 Slide: 3 Title: Use of Non-GAAP Financial Measures Glu uses in this presentation certain non-GAAP measures of financial performance. The presentation of these non-GAAP financial measures is not intended to be considered in isolation from, as a substitute for, or superior to, the financial information prepared and presented in accordance with GAAP, and may be different from non-GAAP financial measures used by other companies. In addition, these non-GAAP measures have limitations in that they do not reflect all of the amounts associated with Glu's results of operations as determined in accordance with GAAP. The non-GAAP financial measures used by Glu include non-GAAP revenues, non-GAAP smartphone revenues, non-GAAP freemium revenues, non-GAAP cost of revenues, non-GAAP gross profit, non-GAAP gross margin, non-GAAP operating expenses, non-GAAP operating margin, non-GAAP net income/(loss), non-GAAP net income/(loss) per share and Adjusted EBITDA. These non-GAAP financial measures exclude the following items from Glu's unaudited consolidated statements of operations: Change in deferred revenues and deferred cost of revenues;Amortization of intangible assets; Non-cash warrant expense;Stock-based compensation expense; Restructuring charges; Change in fair value of Blammo earnout; Transitional costs; Release of tax liabilities; andForeign currency exchange gains and losses primarily related to the revaluation of assets and liabilities. In addition, Glu has included in this presentation “Adjusted EBITDA” figures which are used to evaluate Glu’s operating performance and is defined as non-GAAP operating income/(loss) excluding depreciation.Glu believes that these non-GAAP financial measures, when taken together with the corresponding GAAP financial measures, provide meaningful supplemental information regarding Glu's performance by excluding certain items that may not be indicative of Glu's core business, operating results or future outlook. Glu's management uses, and believes that investors benefit from referring to, these non-GAAP financial measures in assessing Glu's operating results, as well as when planning, forecasting and analyzing future periods. These non-GAAP financial measures also facilitate comparisons of Glu's performance to prior periods. For a reconciliation of these non-GAAP financial measures to their most directly comparable GAAP financial measures, please refer to the tables attached to Glu’s earnings press release for the quarter ended March 31, 2014, which is available on our website at http://www.glu.com/investors. Page 3 Slide: 4 Page 4 Slide: 5 Title: Upward Step Change Q1 2014 financial performance strongest in Glu’s history:Largest topline - $47m in non-GAAP revenuesMost profitable - $6.5m in Adjusted EBITDA2014 guidance strongest in Glu’s history (including PlayFirst):Expected $155.0m - $161.5m in non-GAAP revenue or 37 - 42% growth Y/YExpected full year Adjusted EBITDA profits of $5.0m - $6.7m Page 5 Slide: 6 Title: Step Change in Performance Page 6 Other Placeholder: Key focus areas coming together last two quarters:Monetize more deeplyOptimize more predictablyMarket more efficientlyBetter processes Better talent Non-GAAP revenues have been restated or revised, as appropriate, to reflect gross accounting for digital storefronts for 2010, 2011, 2012 and Q113 and prospectively, as outlined in the Company’s 8/6/2013 Form 8-K and press release Slide: 7 Title: A Global Leader Page 7 Only pure-play mobile gaming company listed in North America (NASDAQ: GLUU)Deeply aligned with mobile ecosystem (iOS & Android)Expanding global presence, particularly APACWell capitalized525+ employees Slide: 8 Title: Franchises Core Casual Page 8 Slide: 9 Title: Management Team Page 9 Pres. of StudiosMatt Ricchetti Pres. of Pub.Chris Akhavan CFOEric R. Ludwig CEONiccolo De Masi Slide: 10 Title: Tightly Aligned w/ Ecosystem Page 10 DistributionChannel Technology Integration New Devices at Launch Quality Pipeline 90%+ Featuring Track Record Slide: 11 Title: Acquisition Page 11 Slide: 12 10 years in operation750m total installs across the Dash franchise on all platforms; 75m on iOSIconic time management franchise added to Glu IP portfolio~32 employees joining Glu family in San FranciscoDiner Dash X launching in Q4 – first Dash title ‘free-to-play from ground up’Additional Dash franchise releases in 2015 using DD X engine Page 12 Slide: 13 Consideration paid:3 million shares of GLUU common stockAssumption of up to $3.55 million net negative balance sheetOther:100% ownership from close; no earn-outImmediate integration into global Glu studio structureAnticipate closing by end of May 2014 Title: Deal Structure Page 13 Slide: 14 Title: Accretive M&A w/o Impairments Other Placeholder: Aug’11: Highly profitable, DH14 and Dino Hunter developerAug’11: Stardom series, ~50% non-GAAP operating marginsMar’12: Paid $5m for brand; saved approx. 3X in royalties in 2 yrsAug’12: 90 days cash on cash return; core tech for GluOnNov’13: Acqui-hire; developing baseball/sports games Page 14 Slide: 15 Title: Market Page 15 Slide: 16 Page 16 1.5BSmartphoneUsers 5B+ Mobile Phone Users % of Internet Traffic Global Smartphone vs. Mobile Phone Users2013E Global Mobile Traffic as % of Total Internet Traffic, 12/08 – 5/13(with Trendline Projection to 5/15E) Global Users (MM) Source: Internet Trends D11 Conference, 5/29/2013, Mary Meeker, KPCB Morgan Stanley Research estimates. Source: StatCounter Global Stats, 5/13. Internet Trends D11 Conference, 5/29/2013, Mary Meeker, KPCB. Note that PC-based Internet data bolstered by streaming. Slide: 17 Title: Tablet Momentum Page 17 First 12 Quarters Cumulative Unit Shipments, iPhone vs. iPad Global Units Shipments (000) Quarters After Launch Source: Internet Trends D11 Conference, 5/29/2013, Mary Meeker, KPCB; Katy Huberty, Ehud Gelblum, Morgan Stanley Research. Gartner. Apple, as of CQ1:13 (12 quarters post iPad launch). Launch Dates: iPhone (6/29/07), iPad (4/3/10) Slide: 18 Title: The Big Get Bigger Page 18 $50m+ estimated lifetime revenue games commonplace:A number of $100m+ estimated lifetime revenue titles:Three $1 billion+ estimated lifetime revenue mega-hits:We believe that Glu is the clear category leader in action: Slide: 19 Title: Category Leaders Page 19 Slide: 20 Title: Action Leadership Page 20 Other Placeholder: More than 40%* of console revenues from action/shooters:4th year in a row now we have shipped what we believe is the biggest & best free-to-play mobile action game of the year:We believe that the action genre is well positioned for long-term growth in mobile free-to-play from current levels Slide: 21 Title: Momentum Page 21 Slide: 22 Other Placeholder: Page 22 Slide: 23 Other Placeholder: Page 23 Slide: 24 Title: Strong Q3 Lineup Page 24 Other Placeholder: Expected to launch in July ‘14Deer Hunter 2014 engineExpected to launch in July ‘14Stardom engine starring Kim KardashianExpected to launch in late July ‘14Launching with MGM movie release starring Dwayne “The Rock” JohnsonExpected to launch in August ‘14Social sports titleExpected to launch in September ‘14Latest installment in CK franchise; PVP and PVE Slide: 25 Title: APAC Page 25 Fastest growing mobile market globallyIncreasing percentage of Glu revenue Glu is arguably the strongest foreign player in China, and is expanding presence in key markets of Japan and Korea Other Placeholder: Phased global launch between Dec 17 and Jan 10Peak top 10 grossing in Korea on iOSPeak top 25 grossing in China on iOS Slide: 26 Title: Long Term Growth Opportunities Page 26 Slide: 27 Title: Mobile Ad Spend Lags Mobile Usage Page 27 % of Time Spent in Media vs. % of Advertising Spending, USA 2012 % of Total Media Consumption TimeOr Advertising Spending (Gp:) Internet Ad= $37B* (Gp:) Mobile Ad= $4B* Note: *Internet advertising reached $37B in USA in 2012 per IAB, Mobile advertising reached $4B per eMarketer. Print includes newspaperand magazine. $20B opportunity calculated assuming Internet and Mobile ad spend share equal their respective time spent share. Source: Internet Trends D11 Conference, 5/29/2013, Mary Meeker, KPCB; Time spend and ad spend share data based on eMarketer (adjusted to exclude outdoors / classified media spend), 12/12 Slide: 28 Title: Quad Screen Future Page 28 Slide: 29 Title: Wearables Page 29 Source: Internet Trends D11 Conference, 5/29/2013, Mary Meeker, KPCB; xxx Technology Cycles Have Tended to Last Ten Years MiniComputing1970s PersonalComputing1980s Desktop InternetComputing1990s Mobile InternetComputing2008+ Wearable / EverywhereComputing2014+ MainframeComputing1960s Slide: 30 Title: Financial Summary Page 30 Slide: 31 Q114 Financial Summary Page 31 Slide: 32 Actual Non-GAAP Total Revenue ($M) Page 32 Non-GAAP revenues have been restated or revised, as appropriate, to reflect gross accounting for digital storefronts for 2010, 2011, 2012 and Q113 and prospectively, as outlined in the Company’s 8/6/2013 Form 8-K and press release Slide: 33 Actual Adjusted EBITDA ($M) Page 33 Slide: 34 GAAP Revenue by Geography ($M) Page 34 Non-GAAP revenues have been restated or revised, as appropriate, to reflect gross accounting for digital storefronts for 2010, 2011, 2012 and Q113 and prospectively, as outlined in the Company’s 8/6/2013 Form 8-K and press release Slide: 35 Title: Non-GAAP Revenue Mix Non-GAAP revenues have been restated or revised, as appropriate, to reflect gross accounting for digital storefronts for 2010, 2011, 2012 and Q113 and prospectively, as outlined in the Company’s 8/6/2013 Form 8-K and press release Page 35 Slide: 36 Title: Non-GAAP Revenue by Title Deer Hunter 2014 $17.2MZombies Ate My Friends $0.4M $47.0M Total Non-GAAP Revenues in Q114 Frontline Commando: D-Day $2.4MStardom Hollywood $1.8MSamurai vs. Zombies Defense 2 $0.3MHeroes of Destiny $0.3M Robocop $3.5MFrontline Commando 2 $2.0MMotocross Meltdown $1.1MDefenders & Dragons $0.5M Eternity Warriors 3 $10.2M Page 36 Slide: 37 Installs and Cumulative Installs Page 37 In millions Slide: 38 DAU and MAU Page 38 In millions Aggregate DAU and MAU for each period presented represents the aggregate metric for the last month of the period. An individual who plays two different games in the same month is counted as two active users for that month when we aggregate DAU and MAU across games. In addition, an individual who plays the same game on two different devices during the same month (e.g., an iPhone and an iPad) is also counted as two active users for each such month when we average or aggregate DAU and MAU over time. Our methodology for calculating DAU and MAU may differ from the methodology used by other companies to calculate similar metrics. Slide: 39 Title: Q114 Non-GAAP Results Q413 Non-GAAP Results Page 39 Slide: 40 Title: Strong Balance Sheet Page 40 Slide: 41 Title: Guidance Page 41 Slide: 42 2014 Full Year GuidanceGlu + PlayFirst Page 42 Slide: 43 2014 Full Year GuidanceGlu + PlayFirst Page 43 Slide: 44 Q214 GuidanceGlu + PlayFirst Page 44 Slide: 45 2014 Full Year GuidanceGlu + PlayFirst Page 45 Slide: 46 Title: Key Statistics Page 46 Average Daily Volume is calculated using the last 90 calendar daysCash balance as of 03/31/2014 Slide: 47 Title: Key Operating Metrics (Gross Basis) Page 47 Slide: 48 Strong secular global growth opportunityNew team & expertise delivering tangible resultsGames as a Service strategy bolsters fundamentals Other Placeholder: Page 48 Investment Overview Page 48 Slide: 49 Title: GAAP to Non-GAAP Reconciliations Page 49 Slide: 50 Page 50 Q114 GAAP to Non-GAAP Reconciliation Slide: 51 Title: Q113 GAAP to Non-GAAP Reconciliation Page 51 Slide: 52 Title: GAAP to Non-GAAP Reconciliation Page 52