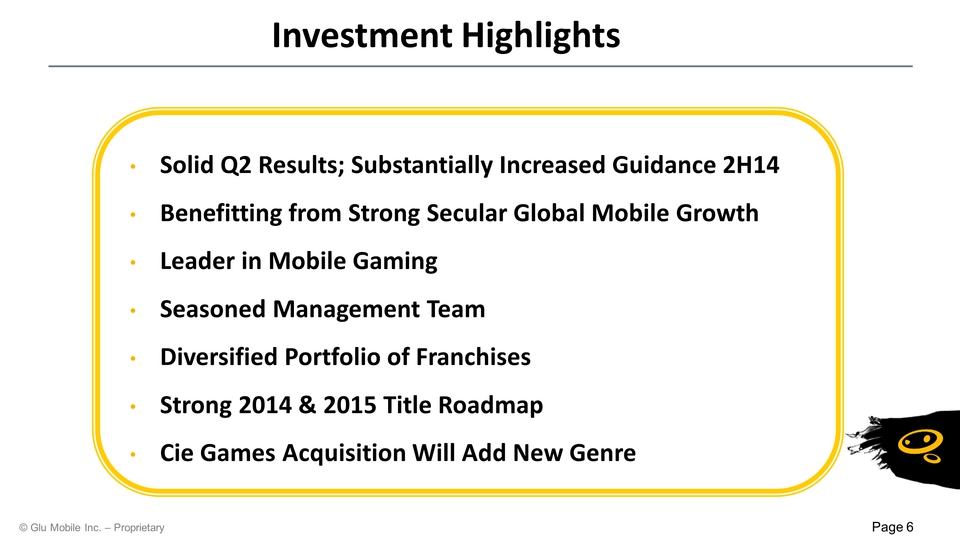
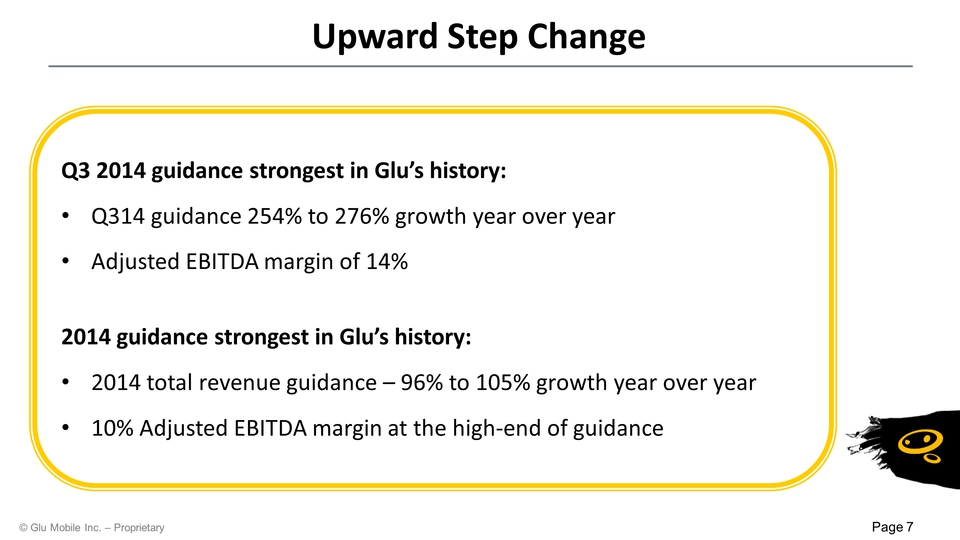
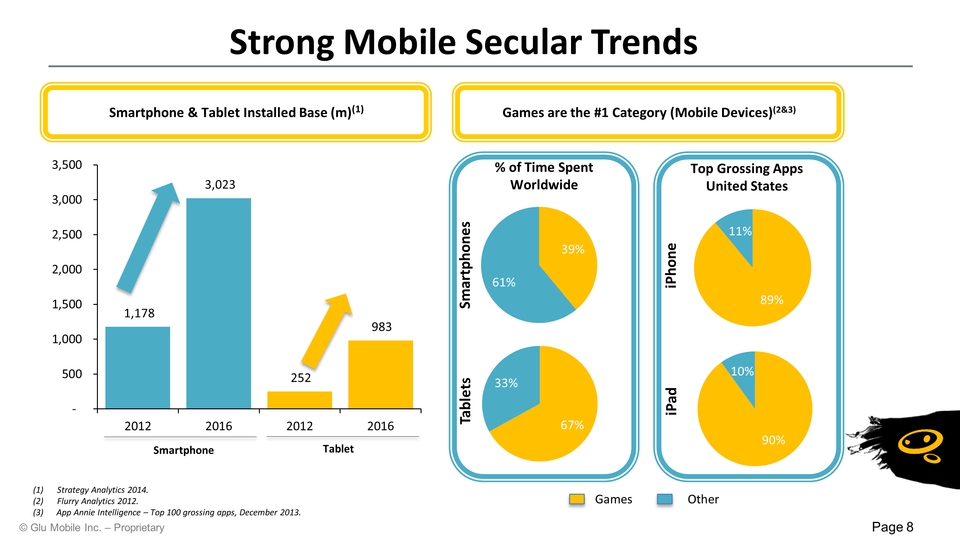
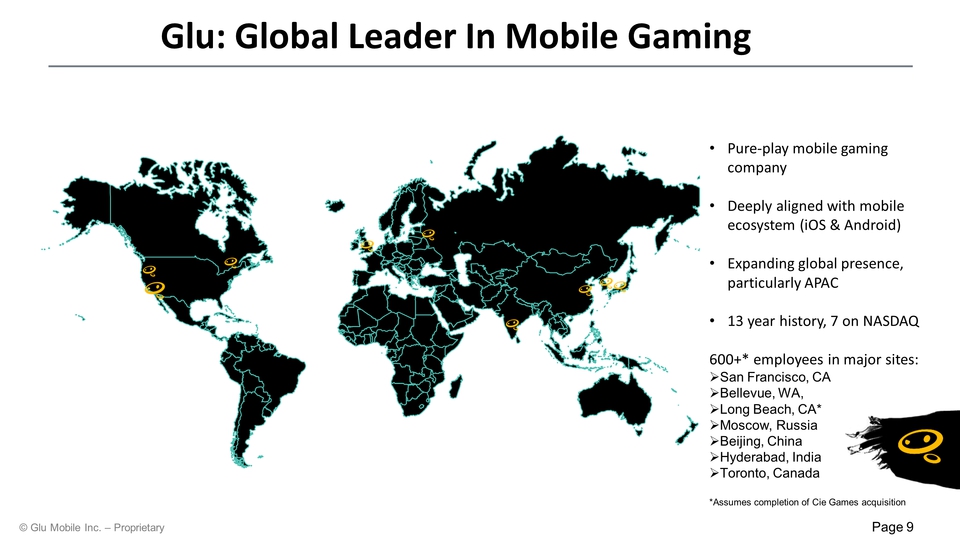
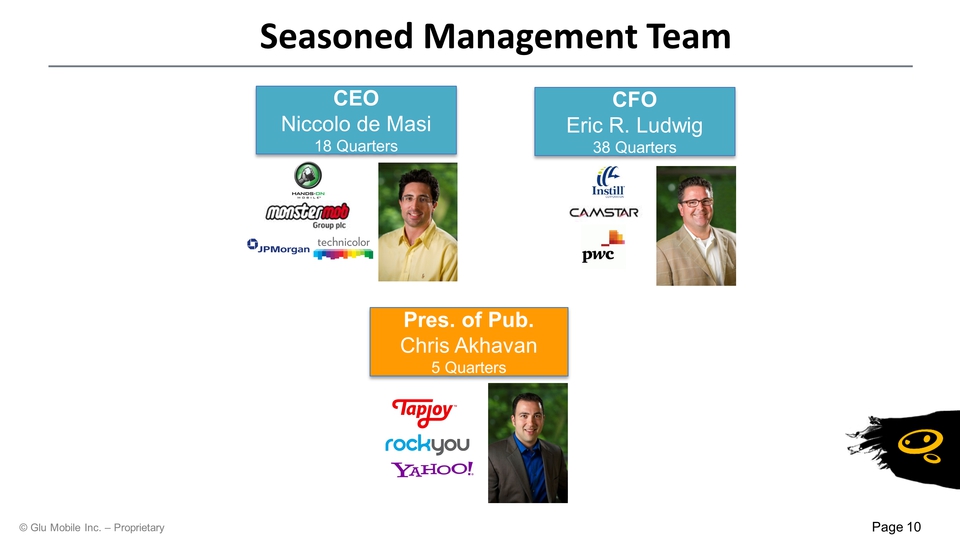
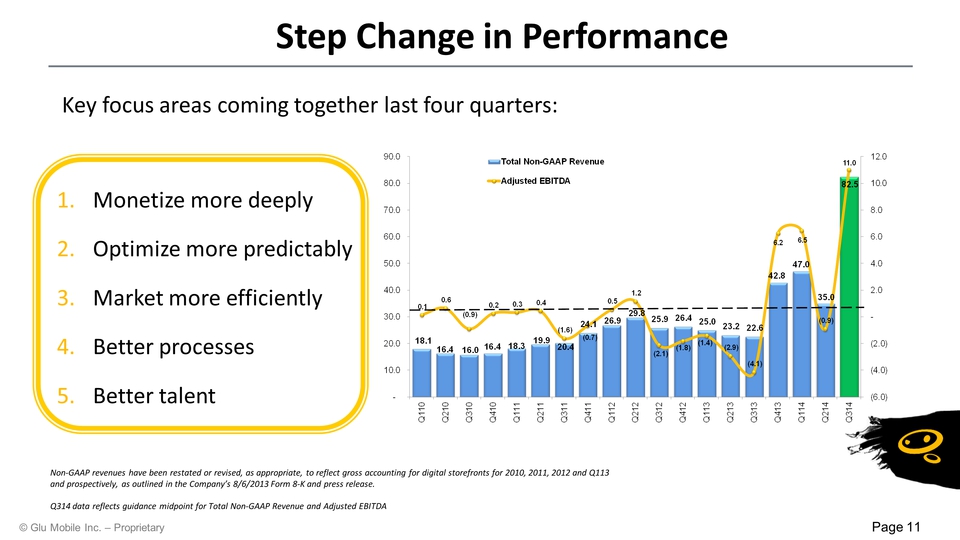
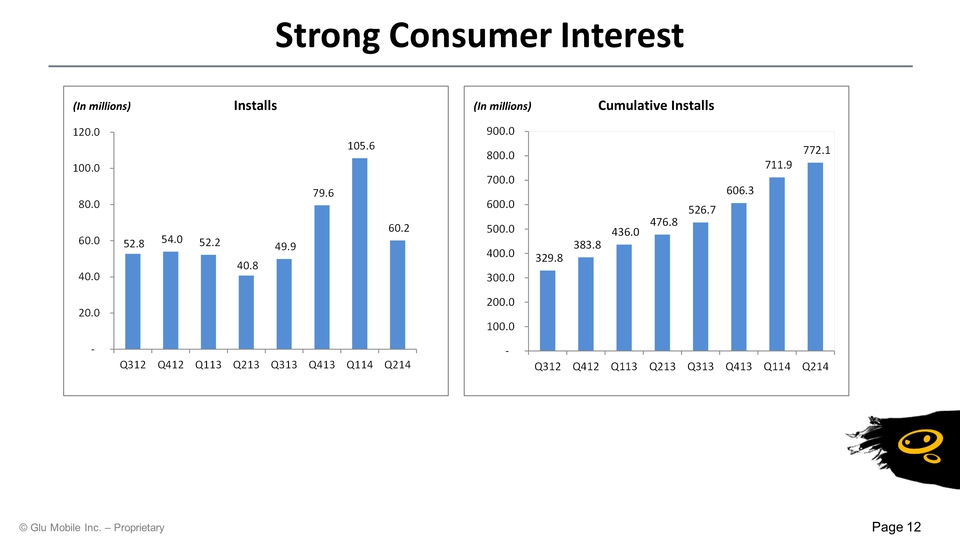
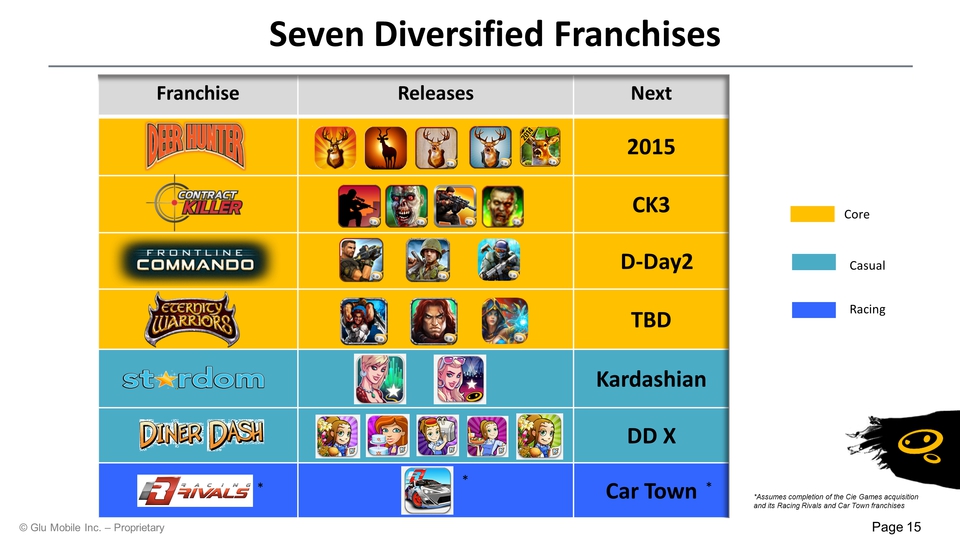
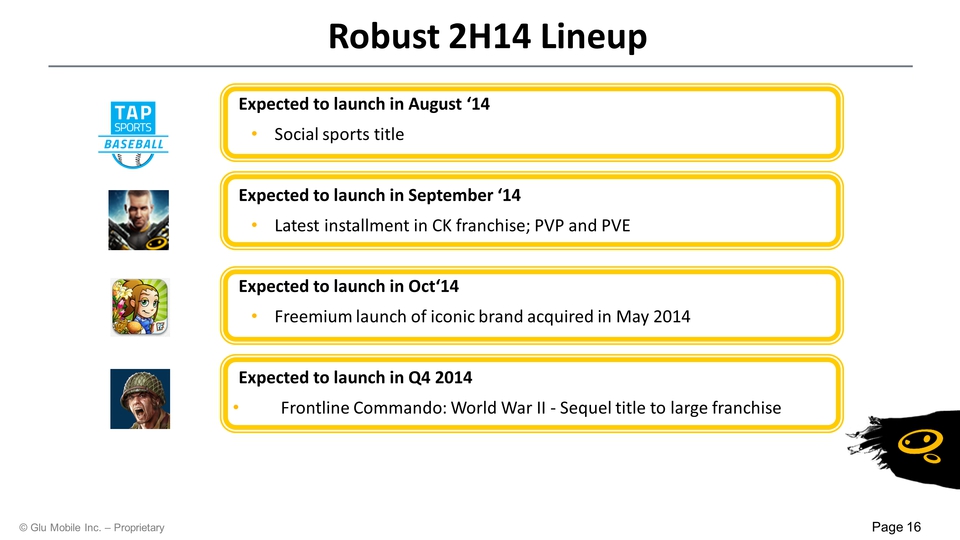
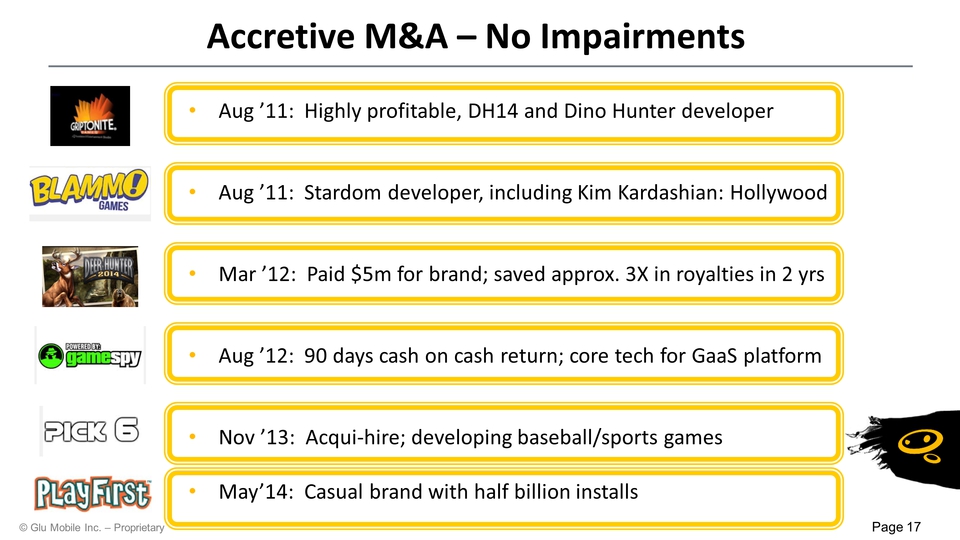
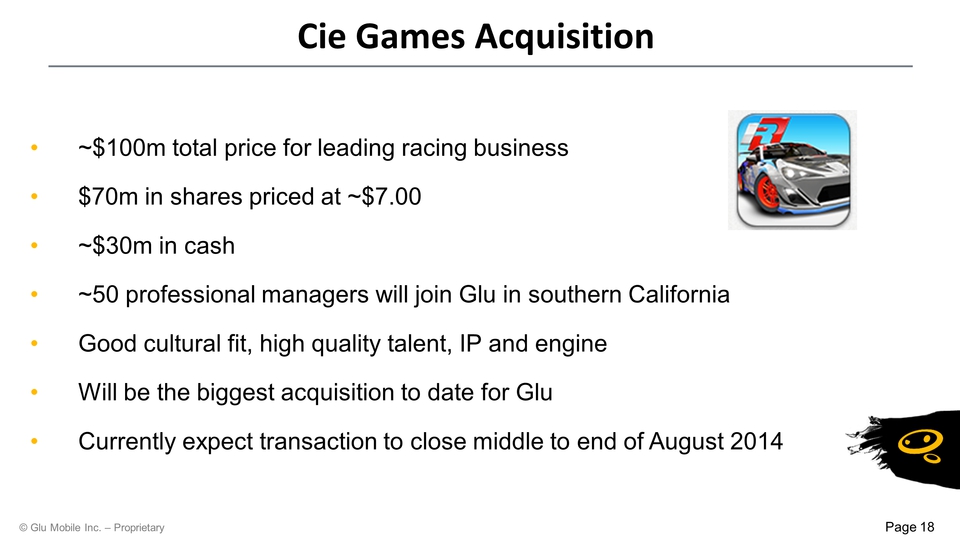
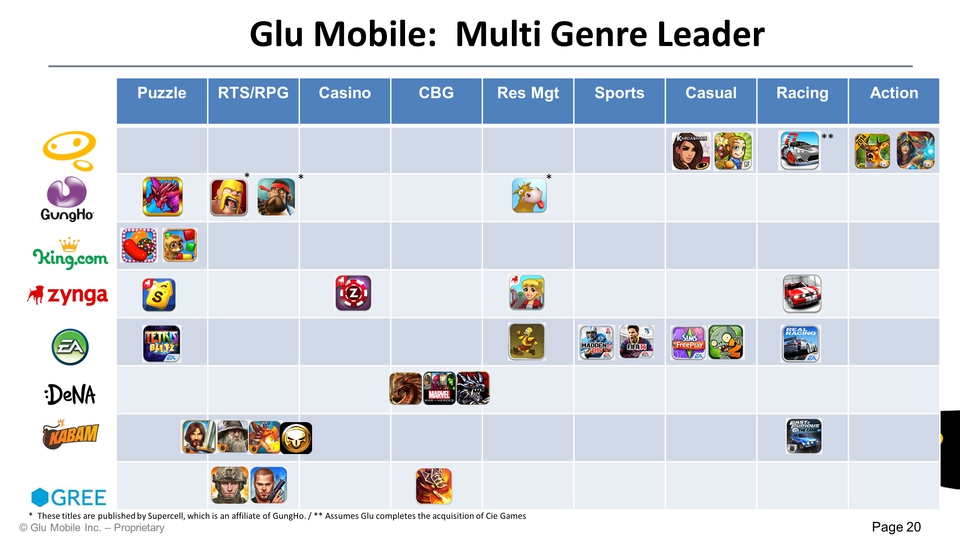
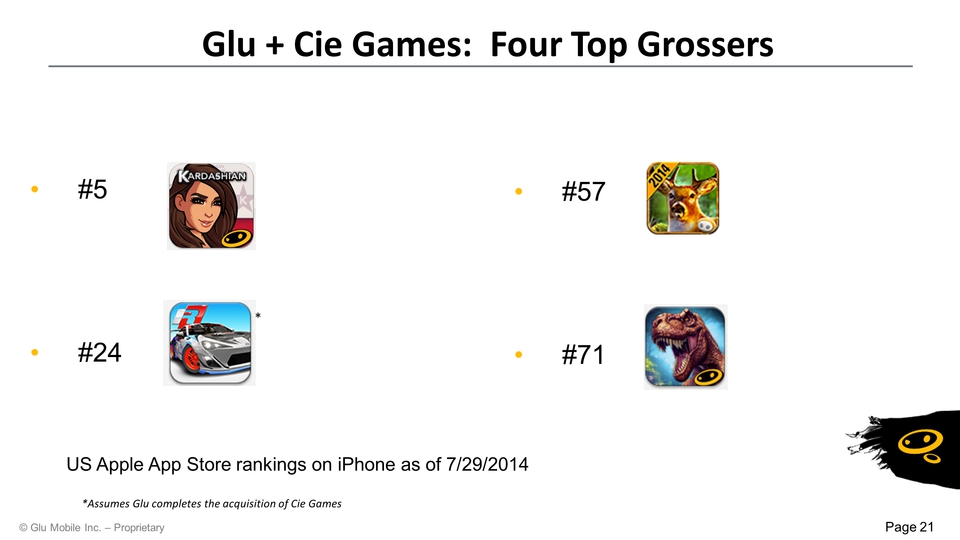
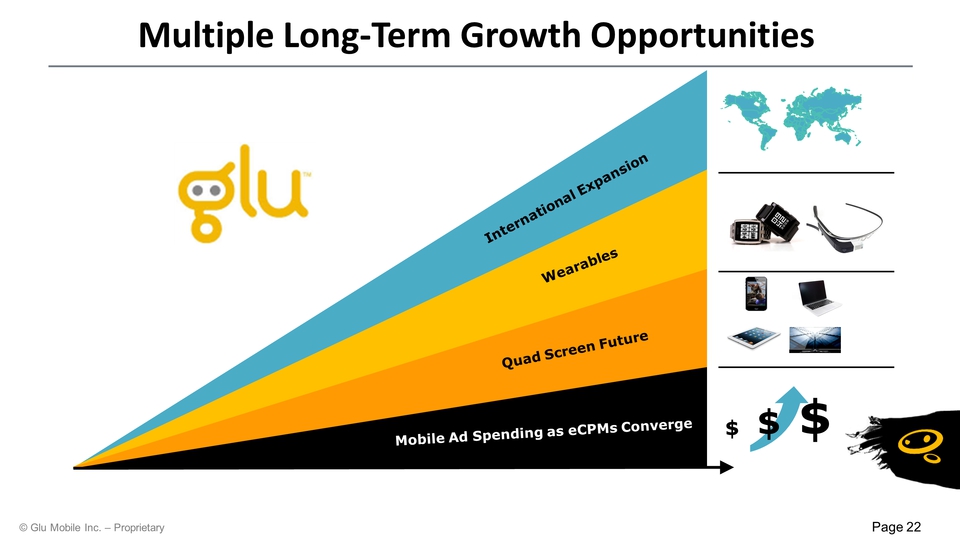
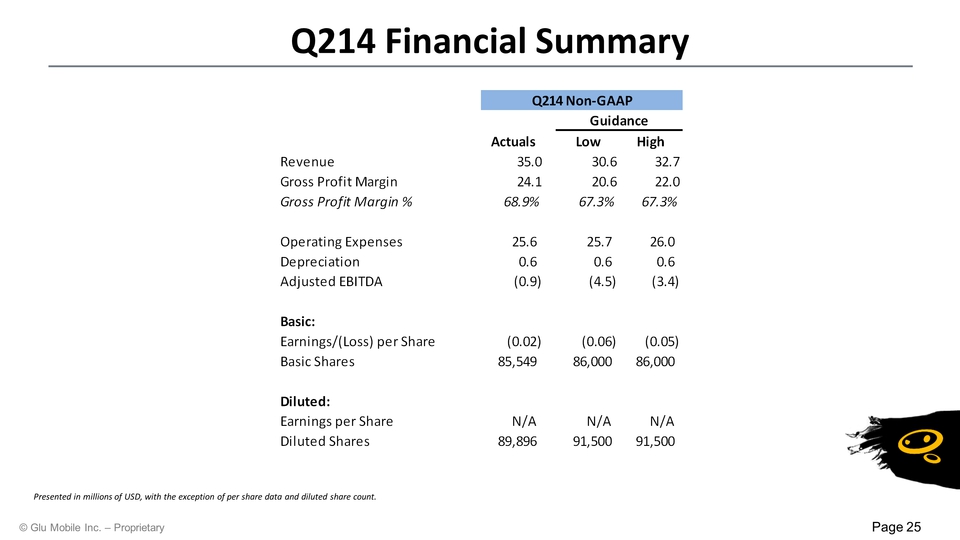
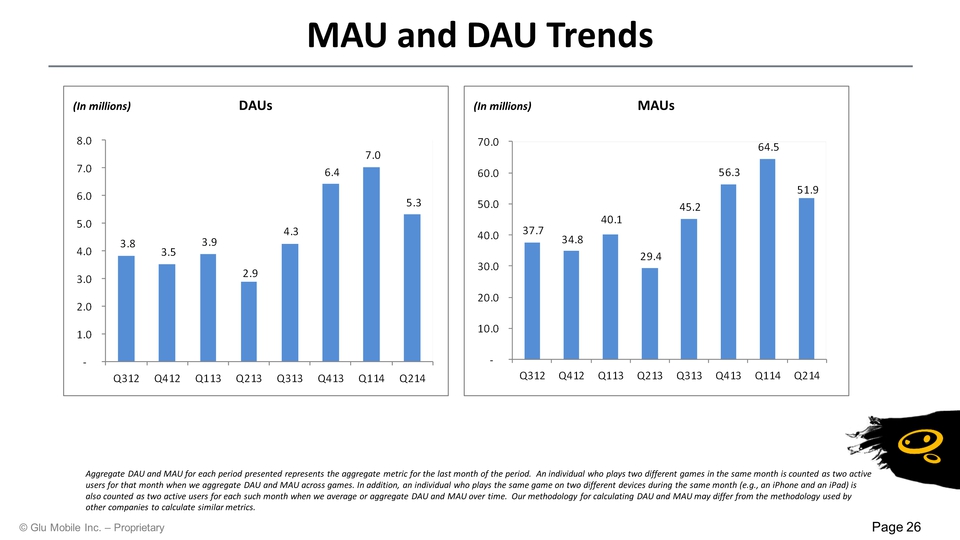
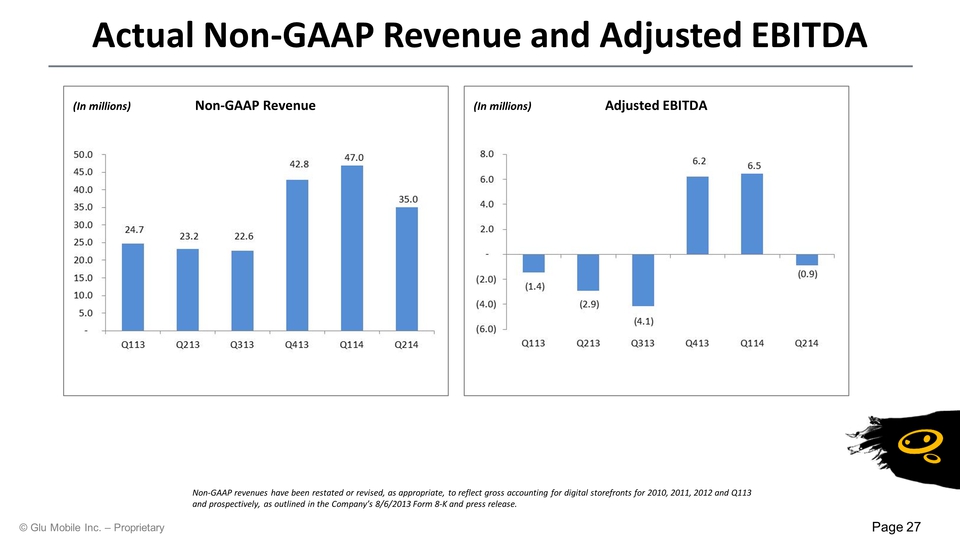
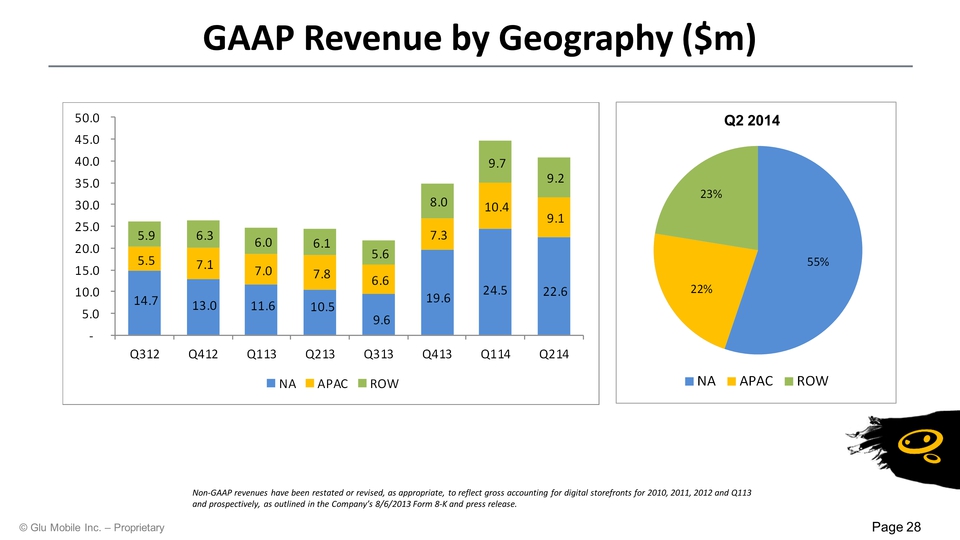
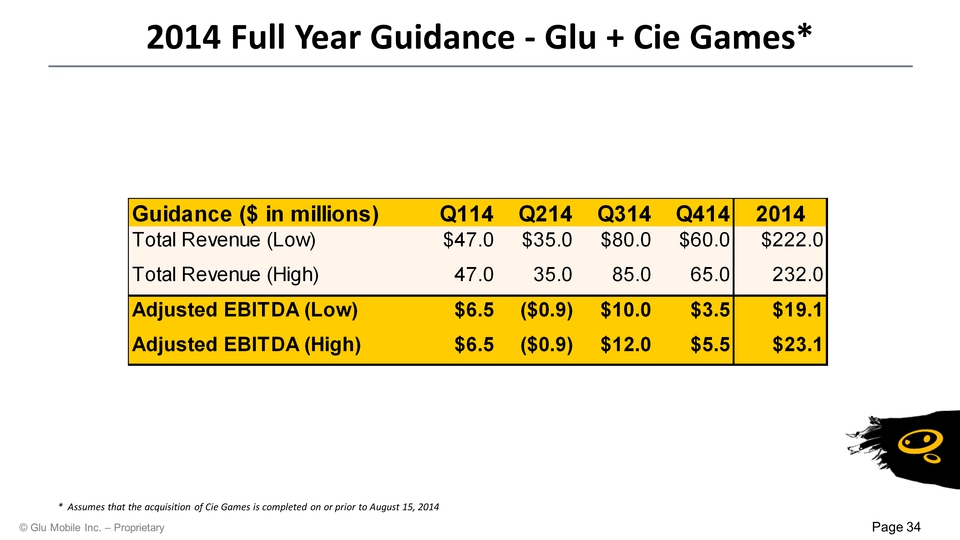
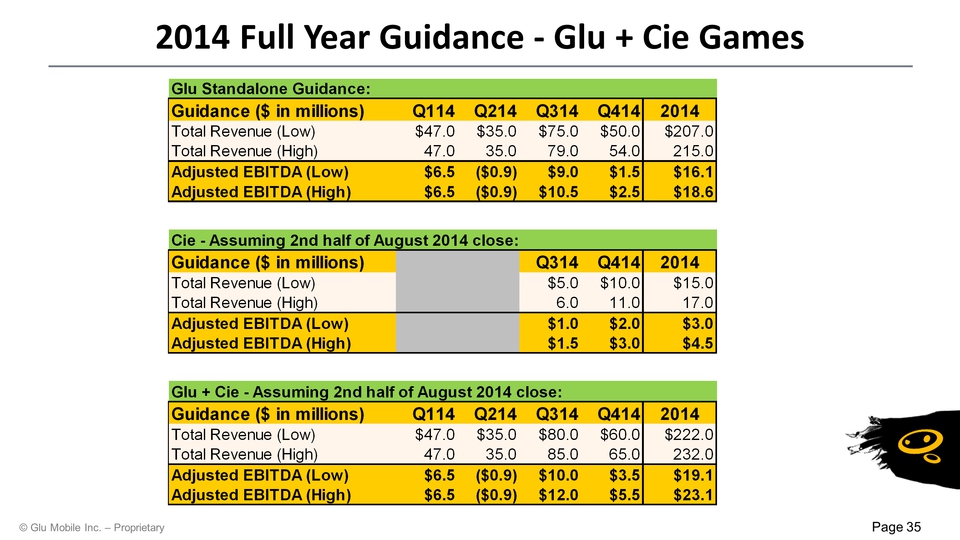
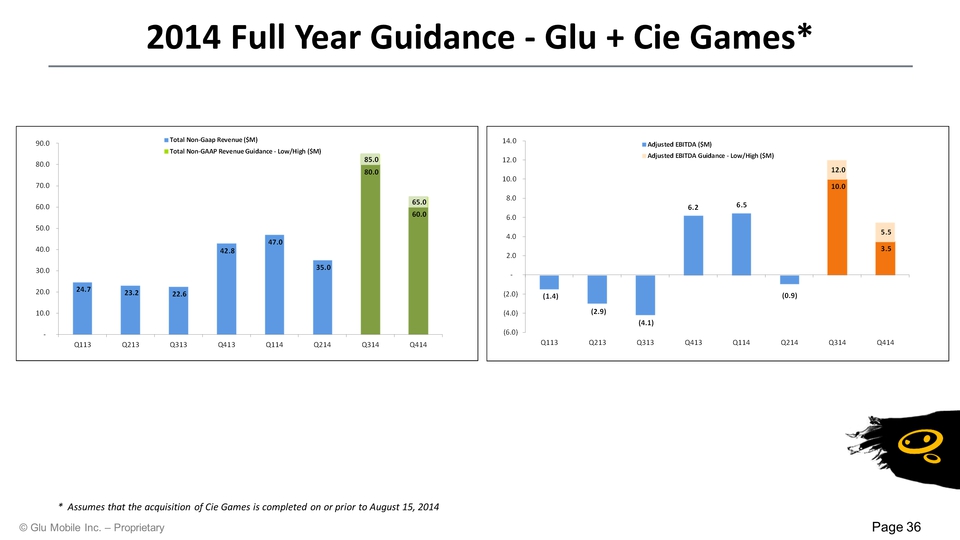
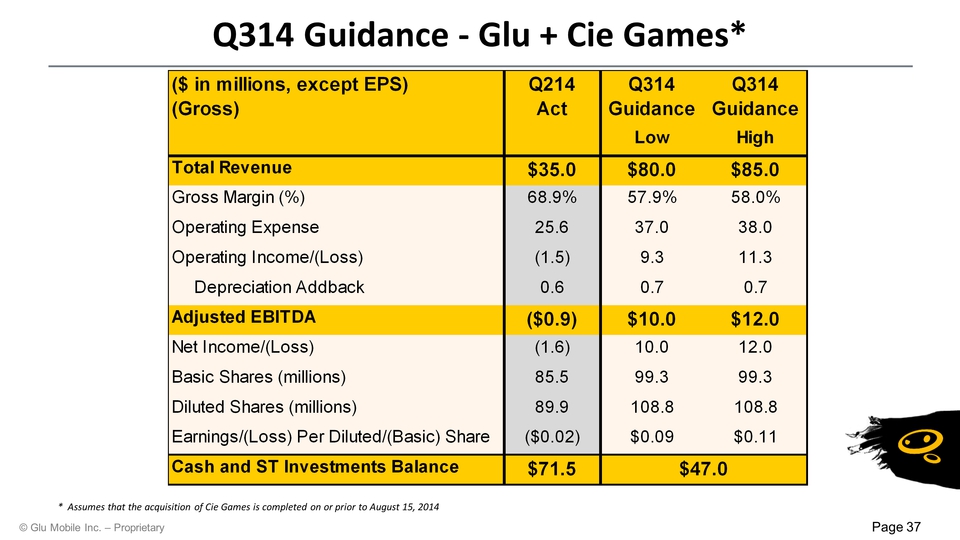
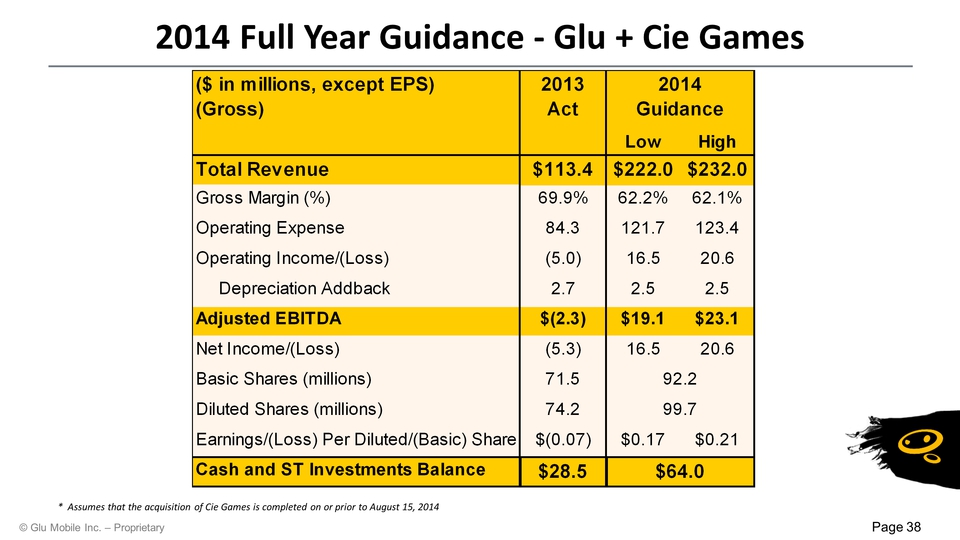
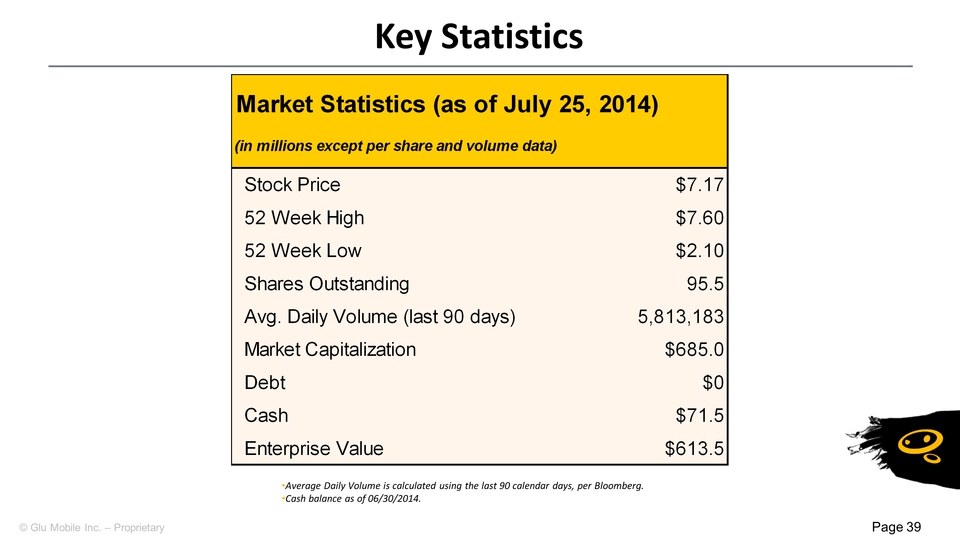
Slide: 1 Title: Glu Mobile Q214 Earnings Call July 30, 2014 Page 1 Slide: 2 Title: Safe Harbor Statement This presentation contains "forward-looking" statements including: Glu is benefitting from strong mobile secular trends in the installed base for smartphones and tablets and the popularity of games among all apps; our expected strong 2014 and 2015 title slate; that Glu has an expanding global presence, particularly in APAC; the expected next title releases for each of our franchises; Glu’s expected second half of 2014 title lineup and the expected launch dates for these titles; the expected launch dates for our James Bond mobile game and the next version of our Deer Hunter franchise; the expected closing date of the Cie Games acquisition; Glu has multiple growth opportunities through international expansion, wearables, the quad screen future and mobile ad spending; and our 2014 quarterly and full year guidance assuming that the acquisition of Cie Games is completed as of August 15, 2014. These forward-looking statements are subject to material risks and uncertainties that could cause actual results to differ materially from those in the forward-looking statements. Investors should consider important risk factors, which include: the risk that Glu will not be able to complete the acquisition of Cie Games; the risk that Glu will be unable to successfully integrate Cie Games and its employees and achieve expected synergies; the risk that Glu will have difficulty retaining key Cie Games employees; consumer demand for smartphones, tablets and next-generation platforms does not grow as significantly as we anticipate or that we will be unable to capitalize on any such growth; the risk that we do not realize a sufficient return on our investment with respect to our efforts to develop free-to-play games for smartphones and tablets, the risk that we do not maintain our good relationships with Apple and Google; the risk that our development expenses for games for smartphones are greater than we anticipate; the risk that our recently and newly launched games are less popular than anticipated; the risk that our newly released games will be of a quality less than desired by reviewers and consumers; the risk that the mobile games market, particularly with respect to social, free-to-play gaming, is smaller than anticipated; risks related to the restatement of certain of our historical financial statements and other risks detailed under the caption "Risk Factors" in our Form 10-Q filed with the Securities and Exchange Commission on May 12, 2014 and our other SEC filings. You can locate these reports through our website at http://www.glu.com/investors. These "forward-looking" statements are based on estimates and information available to us on July 30, 2014 and we are under no obligation, and expressly disclaim any obligation, to update or alter our forward-looking statements whether as a result of new information, future events or otherwise. Page 2 Slide: 3 Title: Use of Non-GAAP Financial Measures Page 3 Glu uses in this presentation certain non-GAAP measures of financial performance. The presentation of these non-GAAP financial measures is not intended to be considered in isolation from, as a substitute for, or superior to, the financial information prepared and presented in accordance with GAAP, and may be different from non-GAAP financial measures used by other companies. In addition, these non-GAAP measures have limitations in that they do not reflect all of the amounts associated with Glu's results of operations as determined in accordance with GAAP. The non-GAAP financial measures used by Glu include non-GAAP revenues, non-GAAP smartphone revenues, non-GAAP freemium revenues, non-GAAP cost of revenues, non-GAAP gross profit, non-GAAP gross margin, non-GAAP operating expenses, non-GAAP operating margin, non-GAAP net income/(loss), non-GAAP net income/(loss) per share and Adjusted EBITDA. These non-GAAP financial measures exclude the following items from Glu's unaudited consolidated statements of operations: Change in deferred revenues and deferred cost of revenues;Amortization of intangible assets; Non-cash warrant expense;Stock-based compensation expense; Restructuring charges; Change in fair value of Blammo earnout; Transitional costs; Release of tax liabilities; andForeign currency exchange gains and losses primarily related to the revaluation of assets and liabilities. In addition, Glu has included in this presentation “Adjusted EBITDA” figures which are used to evaluate Glu’s operating performance and is defined as non-GAAP operating income/(loss) excluding depreciation.Glu believes that these non-GAAP financial measures, when taken together with the corresponding GAAP financial measures, provide meaningful supplemental information regarding Glu's performance by excluding certain items that may not be indicative of Glu's core business, operating results or future outlook. Glu's management uses, and believes that investors benefit from referring to, these non-GAAP financial measures in assessing Glu's operating results, as well as when planning, forecasting and analyzing future periods. These non-GAAP financial measures also facilitate comparisons of Glu's performance to prior periods. For a reconciliation of these non-GAAP financial measures to their most directly comparable GAAP financial measures, please refer to the tables at the end of this presentation. Slide: 4 Title: Executive Summary Page 4 Slide: 5 Title: Great IP + Advanced Monetization Engine + Compelling Gameplay Page 5 Slide: 6 Solid Q2 Results; Substantially Increased Guidance 2H14Benefitting from Strong Secular Global Mobile GrowthLeader in Mobile GamingSeasoned Management TeamDiversified Portfolio of FranchisesStrong 2014 & 2015 Title RoadmapCie Games Acquisition Will Add New Genre Other Placeholder: Page 6 Investment Highlights Page 6 Slide: 7 Title: Upward Step Change Q3 2014 guidance strongest in Glu’s history:Q314 guidance 254% to 276% growth year over yearAdjusted EBITDA margin of 14%2014 guidance strongest in Glu’s history:2014 total revenue guidance – 96% to 105% growth year over year10% Adjusted EBITDA margin at the high-end of guidance Page 7 Slide: 8 Page 8 Strategy Analytics 2014.Flurry Analytics 2012.(3) App Annie Intelligence – Top 100 grossing apps, December 2013. Title: Strong Mobile Secular Trends (Gp:) Smartphone & Tablet Installed Base (m)(1) (Gp:) Games are the #1 Category (Mobile Devices)(2&3) Smartphone Tablet % of Time Spent Worldwide Top Grossing AppsUnited States Smartphones Tablets iPhone iPad Games Other Slide: 9 Title: Glu: Global Leader In Mobile Gaming Page 9 Pure-play mobile gaming companyDeeply aligned with mobile ecosystem (iOS & Android)Expanding global presence, particularly APAC13 year history, 7 on NASDAQ600+* employees in major sites: San Francisco, CABellevue, WA,Long Beach, CA*Moscow, RussiaBeijing, China Hyderabad, IndiaToronto, Canada*Assumes completion of Cie Games acquisition Slide: 10 Title: Seasoned Management Team Page 10 Pres. of Pub.Chris Akhavan5 Quarters CFOEric R. Ludwig38 Quarters CEONiccolo de Masi18 Quarters Slide: 11 Other Placeholder: Key focus areas coming together last four quarters:Monetize more deeplyOptimize more predictablyMarket more efficientlyBetter processes Better talent Title: Step Change in Performance Page 11 Non-GAAP revenues have been restated or revised, as appropriate, to reflect gross accounting for digital storefronts for 2010, 2011, 2012 and Q113 and prospectively, as outlined in the Company’s 8/6/2013 Form 8-K and press release.Q314 data reflects guidance midpoint for Total Non-GAAP Revenue and Adjusted EBITDA Slide: 12 Strong Consumer Interest Page 12 (In millions) Installs (In millions) Cumulative Installs Slide: 13 Title: Placeholder Slide Page 13 Slide: 14 Title: Placeholder Slide Page 14 Slide: 15 Title: Seven Diversified Franchises Page 15 Core Casual Racing *Assumes completion of the Cie Games acquisition and its Racing Rivals and Car Town franchises * * * Slide: 16 Title: Robust 2H14 Lineup Page 16 Other Placeholder: Expected to launch in August ‘14Social sports titleExpected to launch in September ‘14Latest installment in CK franchise; PVP and PVEExpected to launch in Oct‘14Freemium launch of iconic brand acquired in May 2014Expected to launch in Q4 2014Frontline Commando: World War II - Sequel title to large franchise Slide: 17 Title: Accretive M&A – No Impairments Other Placeholder: Aug ’11: Highly profitable, DH14 and Dino Hunter developerAug ’11: Stardom developer, including Kim Kardashian: HollywoodMar ’12: Paid $5m for brand; saved approx. 3X in royalties in 2 yrsAug ’12: 90 days cash on cash return; core tech for GaaS platformNov ’13: Acqui-hire; developing baseball/sports gamesMay’14: Casual brand with half billion installs Page 17 Slide: 18 middle to end of August 2014 Other Placeholder: ~$100m total price for leading racing business$70m in shares priced at ~$7.00~$30m in cash~50 professional managers will join Glu in southern CaliforniaGood cultural fit, high quality talent, IP and engineWill be the biggest acquisition to date for GluCurrently expect transaction to close by middle of August Page 18 Title: Cie Games Acquisition Slide: 19 Other Placeholder: Cie Games acquisition represents ~2.3X non-GAAP revenue run-rate multiple and ~8X Adjusted EBITDA run-rate multipleWe believe that Cie Games will be Adjusted EBITDA accretive in its first quarter of consolidation We believe we are acquiring Cie Games on highly attractive terms, particularly in comparison to other recent deals in the mobile games space Page 19 Title: Cie Games Rationale Slide: 20 Title: Glu Mobile: Multi Genre Leader Page 20 * These titles are published by Supercell, which is an affiliate of GungHo. / ** Assumes Glu completes the acquisition of Cie Games * * * ** Slide: 21 Other Placeholder: #5#24 Page 21 Title: Glu + Cie Games: Four Top Grossers #57#71 US Apple App Store rankings on iPhone as of 7/29/2014 * *Assumes Glu completes the acquisition of Cie Games Slide: 22 Other Placeholder: Page 22 Multiple Long-Term Growth Opportunities Page 22 Mobile Ad Spending as eCPMs Converge Quad Screen Future Wearables International Expansion Opportunity / Revenue / Value Time $ $ $ $ Slide: 23 Title: Financial Overview Page 23 Slide: 24 Growing & Engaged Installed BaseDiversified Library of TitlesCost-Effective Customer AcquisitionLong Tail Games Provide Significant VisibilityStrong Top Line Growth Other Placeholder: Page 24 Financial Investment Highlights Page 24 Slide: 25 Q214 Financial Summary Page 25 Presented in millions of USD, with the exception of per share data and diluted share count. Slide: 26 MAU and DAU Trends Page 26 Aggregate DAU and MAU for each period presented represents the aggregate metric for the last month of the period. An individual who plays two different games in the same month is counted as two active users for that month when we aggregate DAU and MAU across games. In addition, an individual who plays the same game on two different devices during the same month (e.g., an iPhone and an iPad) is also counted as two active users for each such month when we average or aggregate DAU and MAU over time. Our methodology for calculating DAU and MAU may differ from the methodology used by other companies to calculate similar metrics. (In millions) DAUs (In millions) MAUs Slide: 27 Actual Non-GAAP Revenue and Adjusted EBITDA Page 27 Non-GAAP revenues have been restated or revised, as appropriate, to reflect gross accounting for digital storefronts for 2010, 2011, 2012 and Q113 and prospectively, as outlined in the Company’s 8/6/2013 Form 8-K and press release. (In millions) Non-GAAP Revenue (In millions) Adjusted EBITDA Slide: 28 GAAP Revenue by Geography ($m) Page 28 Non-GAAP revenues have been restated or revised, as appropriate, to reflect gross accounting for digital storefronts for 2010, 2011, 2012 and Q113 and prospectively, as outlined in the Company’s 8/6/2013 Form 8-K and press release. Q2 2014 Slide: 29 Title: Non-GAAP Revenue Mix Page 29 Non-GAAP revenues have been restated or revised, as appropriate, to reflect gross accounting for digital storefronts for 2010, 2011, 2012 and Q113 and prospectively, as outlined in the Company’s 8/6/2013 Form 8-K and press release. The presentation of platform and category mix contribution in prior presentations was reported as a percentage of non-GAAP smartphone revenues. All prior percentages in the above graphs have been updated to reflect each category’s respective percentage of total non-GAAP revenues. The ‘Premium/All Other’ revenues include featurephone revenues. Slide: 30 Title: Non-GAAP Revenue by Title Deer Hunter 2014 $14.4MZombies Ate My Friends $0.3M $35.0M Total Non-GAAP Revenues in Q214 Kim Kardashian Hollywood �� $1.6MKnights of Puzzelot $0.3M Frontline Commando 2 $2.0MRobocop $1.7MMotocross Meltdown $0.1MDefenders & Dragons $0.1M Eternity Warriors 3 $4.7M Page 30 Frontline Commando: D-Day $1.6MStardom Hollywood $0.9MSamurais vs. Zombies Defense 2 $0.3MHeroes of Destiny $0.1M Slide: 31 Title: Q214 Non-GAAP Results Page 31 Slide: 32 Title: Strong Balance Sheet Page 32 Slide: 33 Title: Guidance Page 33 Slide: 34 2014 Full Year Guidance - Glu + Cie Games* Page 34 * Assumes that the acquisition of Cie Games is completed on or prior to August 15, 2014 Slide: 35 2014 Full Year Guidance - Glu + Cie Games Page 35 Slide: 36 2014 Full Year Guidance - Glu + Cie Games* Page 36 * Assumes that the acquisition of Cie Games is completed on or prior to August 15, 2014 Slide: 37 Q314 Guidance - Glu + Cie Games* Page 37 * Assumes that the acquisition of Cie Games is completed on or prior to August 15, 2014 Slide: 38 2014 Full Year Guidance - Glu + Cie Games Page 38 * Assumes that the acquisition of Cie Games is completed on or prior to August 15, 2014 Slide: 39 Title: Key Statistics Page 39 Average Daily Volume is calculated using the last 90 calendar days, per Bloomberg.Cash balance as of 06/30/2014. Slide: 40 Benefitting from Strong Secular Global Mobile GrowthLeader in Mobile GamingDiversified Portfolio of FranchisesStrong 2014 & 2015 Title SlateFinancials Benefitting from Significant Investments Other Placeholder: Page 40 Investment Highlights Page 40 Slide: 41 Title: Non-GAAP Reconciliations Page 41 Slide: 42 Page 42 Q214 GAAP to Non-GAAP Reconciliation Slide: 43 Title: Q213 GAAP to Non-GAAP Reconciliation Page 43 Slide: 44 Page 44 YTD 2014 GAAP to Non-GAAP Reconciliation Slide: 45 Title: YTD 2013 GAAP to Non-GAAP Reconciliation Page 45 Slide: 46 Title: GAAP to Non-GAAP Reconciliation Page 46 Slide: 47 Title: Key Operating Metrics (Gross Basis) Page 47 middle to end of August 2014