Exhibit 99.02
Glu Mobile Q414 Earnings Call February 4, 2015
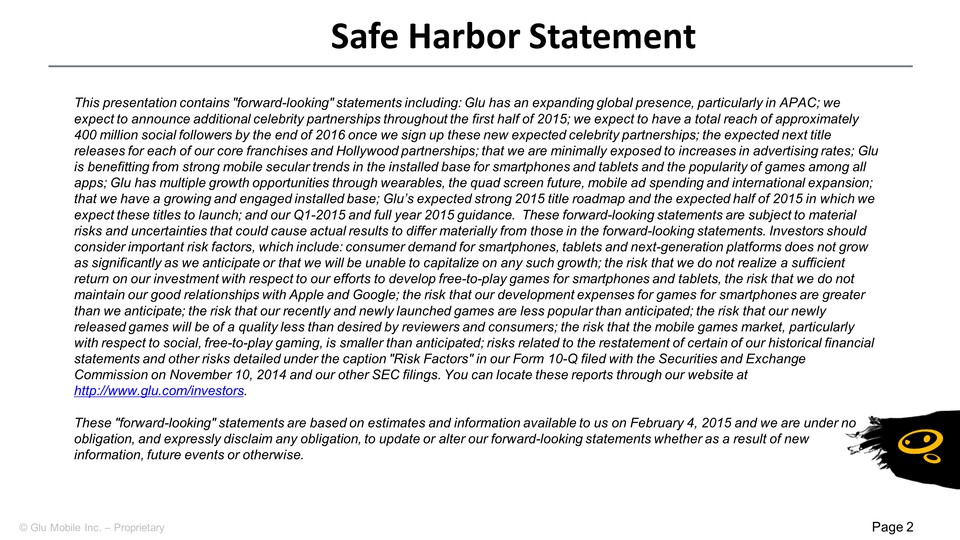
Safe Harbor Statement This presentation contains "forward-looking" statements including: Glu has an expanding global presence, particularly in APAC; we expect to announce additional celebrity partnerships throughout the first half of 2015; we expect to have a total reach of approximately 400 million social followers by the end of 2016 once we sign up these new expected celebrity partnerships; the expected next title releases for each of our core franchises and Hollywood partnerships; that we are minimally exposed to increases in advertising rates; Glu is benefitting from strong mobile secular trends in the installed base for smartphones and tablets and the popularity of games among all apps; Glu has multiple growth opportunities through wearables, the quad screen future, mobile ad spending and international expansion; that we have a growing and engaged installed base; Glu’s expected strong 2015 title roadmap and the expected half of 2015 in which we expect these titles to launch; and our Q1-2015 and full year 2015 guidance. These forward-looking statements are subject to material risks and uncertainties that could cause actual results to differ materially from those in the forward-looking statements. Investors should consider important risk factors, which include: consumer demand for smartphones, tablets and next-generation platforms does not grow as significantly as we anticipate or that we will be unable to capitalize on any such growth; the risk that we do not realize a sufficient return on our investment with respect to our efforts to develop free-to-play games for smartphones and tablets, the risk that we do not maintain our good relationships with Apple and Google; the risk that our development expenses for games for smartphones are greater than we anticipate; the risk that our recently and newly launched games are less popular than anticipated; the risk that our newly released games will be of a quality less than desired by reviewers and consumers; the risk that the mobile games market, particularly with respect to social, free-to-play gaming, is smaller than anticipated; risks related to the restatement of certain of our historical financial statements and other risks detailed under the caption "Risk Factors" in our Form 10-Q filed with the Securities and Exchange Commission on November 10, 2014 and our other SEC filings. You can locate these reports through our website at http://www.glu.com/investors. These "forward-looking" statements are based on estimates and information available to us on February 4, 2015 and we are under no obligation, and expressly disclaim any obligation, to update or alter our forward-looking statements whether as a result of new information, future events or otherwise.
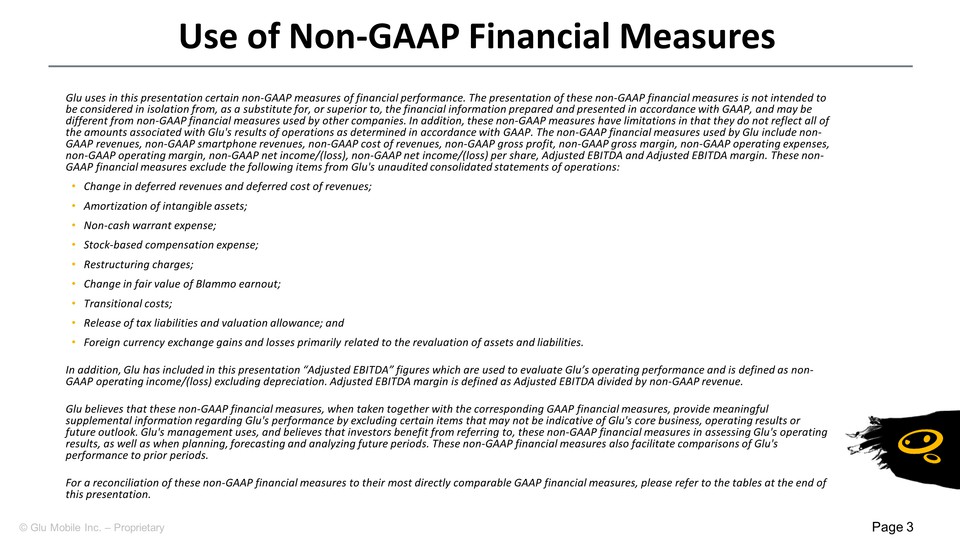
Use of Non-GAAP Financial Measures Glu uses in this presentation certain non-GAAP measures of financial performance. The presentation of these non-GAAP financial measures is not intended to be considered in isolation from, as a substitute for, or superior to, the financial information prepared and presented in accordance with GAAP, and may be different from non-GAAP financial measures used by other companies. In addition, these non-GAAP measures have limitations in that they do not reflect all of the amounts associated with Glu's results of operations as determined in accordance with GAAP. The non-GAAP financial measures used by Glu include non-GAAP revenues, non-GAAP smartphone revenues, non-GAAP cost of revenues, non-GAAP gross profit, non-GAAP gross margin, non-GAAP operating expenses, non-GAAP operating margin, non-GAAP net income/(loss), non-GAAP net income/(loss) per share, Adjusted EBITDA and Adjusted EBITDA margin. These non-GAAP financial measures exclude the following items from Glu's unaudited consolidated statements of operations: Change in deferred revenues and deferred cost of revenues;Amortization of intangible assets; Non-cash warrant expense;Stock-based compensation expense; Restructuring charges; Change in fair value of Blammo earnout; Transitional costs; Release of tax liabilities and valuation allowance; andForeign currency exchange gains and losses primarily related to the revaluation of assets and liabilities. In addition, Glu has included in this presentation “Adjusted EBITDA” figures which are used to evaluate Glu’s operating performance and is defined as non-GAAP operating income/(loss) excluding depreciation. Adjusted EBITDA margin is defined as Adjusted EBITDA divided by non-GAAP revenue.Glu believes that these non-GAAP financial measures, when taken together with the corresponding GAAP financial measures, provide meaningful supplemental information regarding Glu's performance by excluding certain items that may not be indicative of Glu's core business, operating results or future outlook. Glu's management uses, and believes that investors benefit from referring to, these non-GAAP financial measures in assessing Glu's operating results, as well as when planning, forecasting and analyzing future periods. These non-GAAP financial measures also facilitate comparisons of Glu's performance to prior periods. For a reconciliation of these non-GAAP financial measures to their most directly comparable GAAP financial measures, please refer to the tables at the end of this presentation.

Executive Summary

© Glu Mobile Inc. – Proprietary
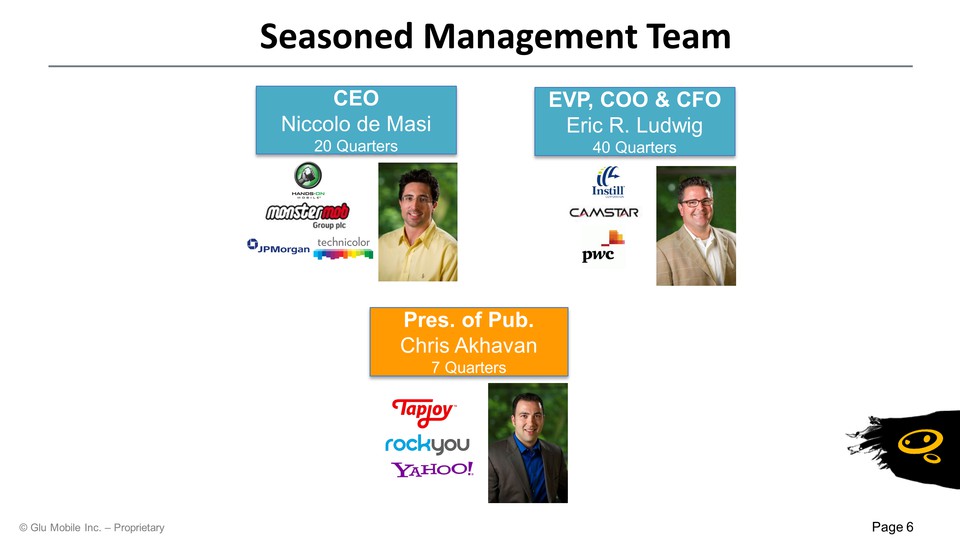
Seasoned Management Team Pres. of Pub.Chris Akhavan7 Quarters EVP, COO & CFOEric R. Ludwig40 Quarters CEONiccolo de Masi20 Quarters
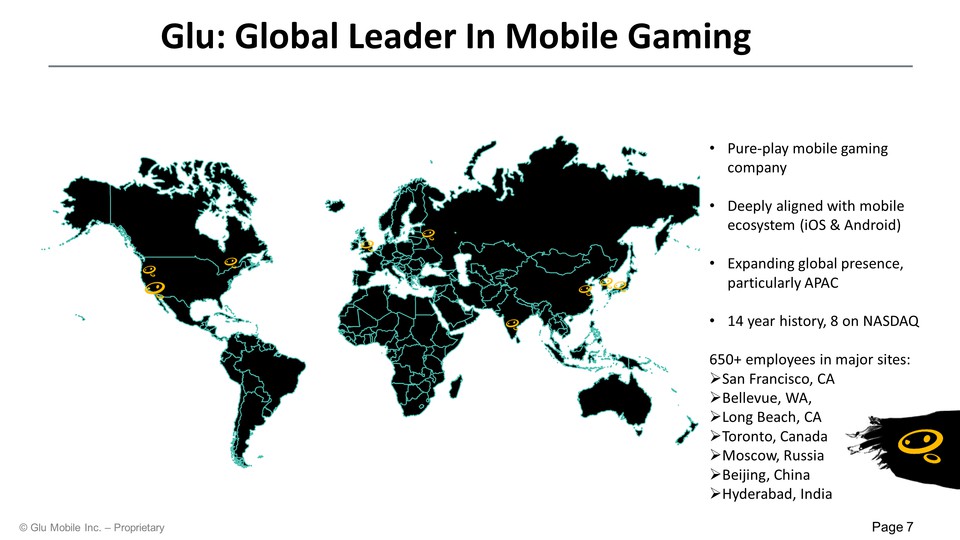
Glu: Global Leader In Mobile Gaming Pure-play mobile gaming companyDeeply aligned with mobile ecosystem (iOS & Android)Expanding global presence, particularly APAC14 year history, 8 on NASDAQ650+ employees in major sites: San Francisco, CABellevue, WA,Long Beach, CAToronto, CanadaMoscow, RussiaBeijing, China Hyderabad, India
Q4 non-GAAP revenues of $76.2 millionQ4 Adjusted EBITDA of $14.1 million; Record Adjusted EBITDA margin of 18.5%. Beat bottom line Adjusted EBITDA midpoint guidance by 214% Record Q4 cash flow from operations of $19.3 million2014 full non-GAAP year revenue represents a four-year compound annual growth rate of 37.9% since 2010Signed five-year, exclusive mobile game partnership with Katy Perry Recent Highlights
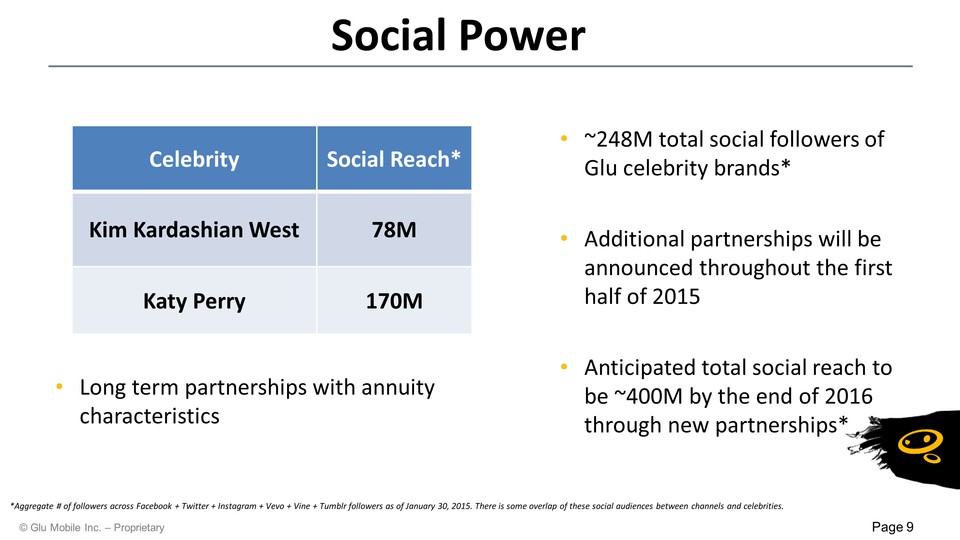
~248M total social followers of Glu celebrity brands*Additional partnerships will be announced throughout the first half of 2015Anticipated total social reach to be ~400M by the end of 2016 through new partnerships* Social Power Long term partnerships with annuity characteristics *Aggregate # of followers across Facebook + Twitter + Instagram + Vevo + Vine + Tumblr followers as of January 30, 2015. There is some overlap of these social audiences between channels and celebrities.
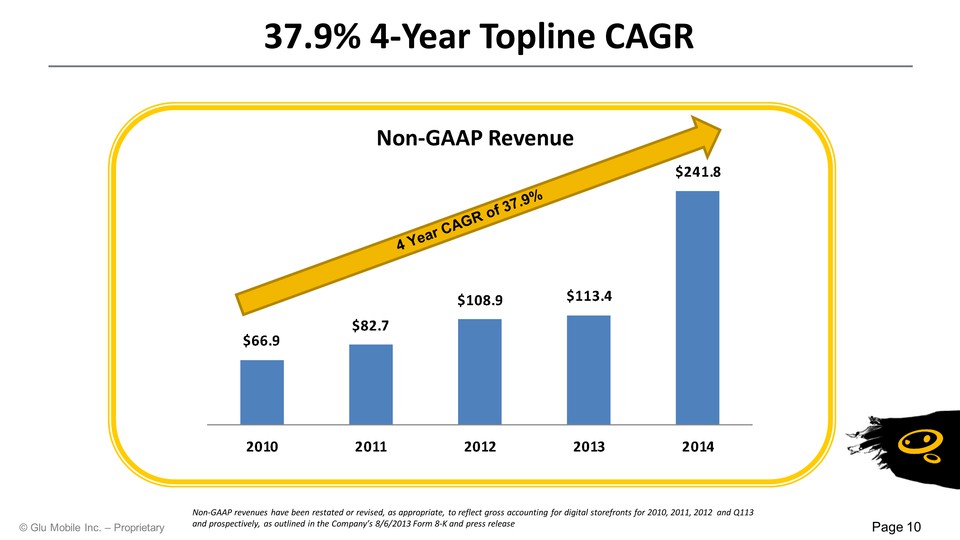
37.9% 4-Year Topline CAGR 4 Year CAGR of 37.9% Non-GAAP revenues have been restated or revised, as appropriate, to reflect gross accounting for digital storefronts for 2010, 2011, 2012 and Q113 and prospectively, as outlined in the Company’s 8/6/2013 Form 8-K and press release Non-GAAP Revenue
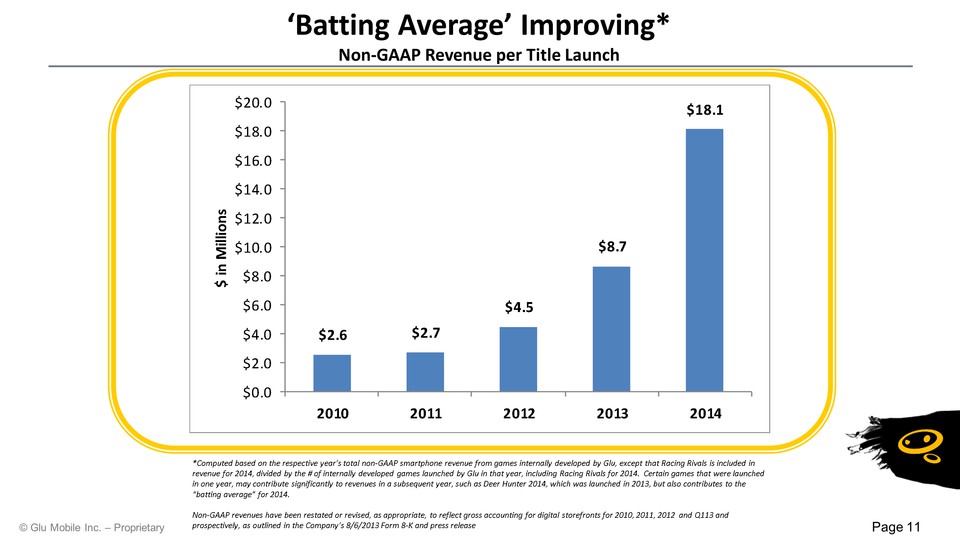
‘Batting Average’ Improving* Non-GAAP Revenue per Title Launch *Computed based on the respective year’s total non-GAAP smartphone revenue from games internally developed by Glu, except that Racing Rivals is included in revenue for 2014, divided by the # of internally developed games launched by Glu in that year, including Racing Rivals for 2014. Certain games that were launched in one year, may contribute significantly to revenues in a subsequent year, such as Deer Hunter 2014, which was launched in 2013, but also contributes to the “batting average” for 2014. Non-GAAP revenues have been restated or revised, as appropriate, to reflect gross accounting for digital storefronts for 2010, 2011, 2012 and Q113 and prospectively, as outlined in the Company’s 8/6/2013 Form 8-K and press release
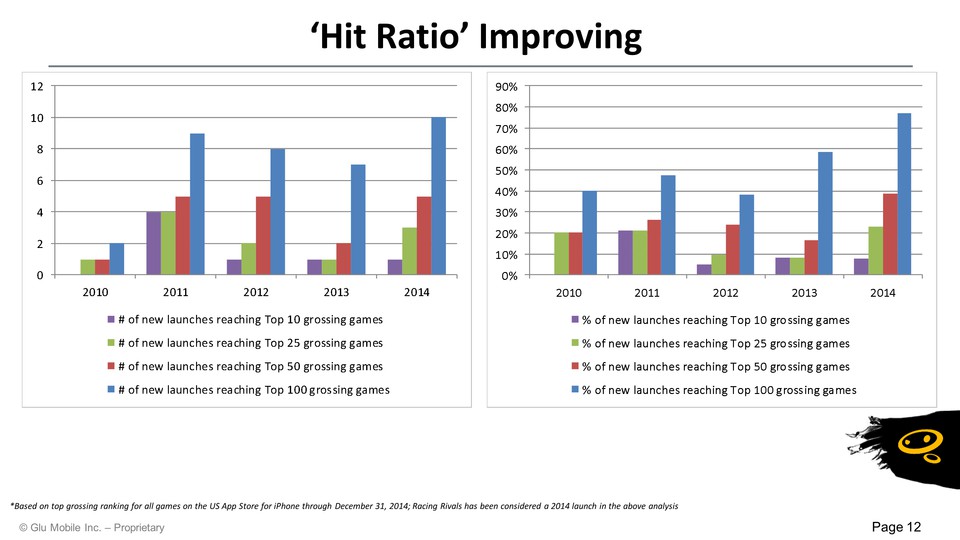
‘Hit Ratio’ Improving *Based on top grossing ranking for all games on the US App Store for iPhone through December 31, 2014; Racing Rivals has been considered a 2014 launch in the above analysis
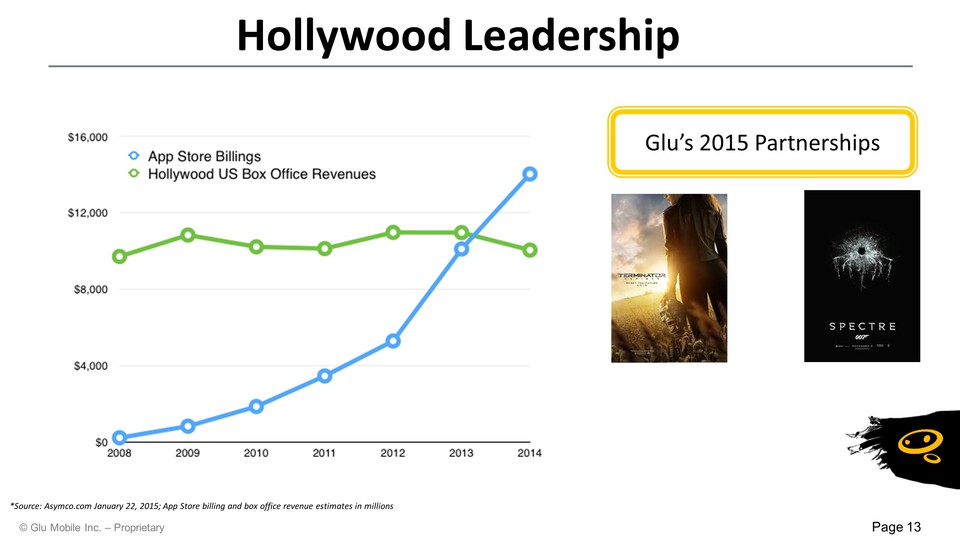
Hollywood Leadership Glu’s 2015 Partnerships *Source: Asymco.com January 22, 2015; App Store billing and box office revenue estimates in millions
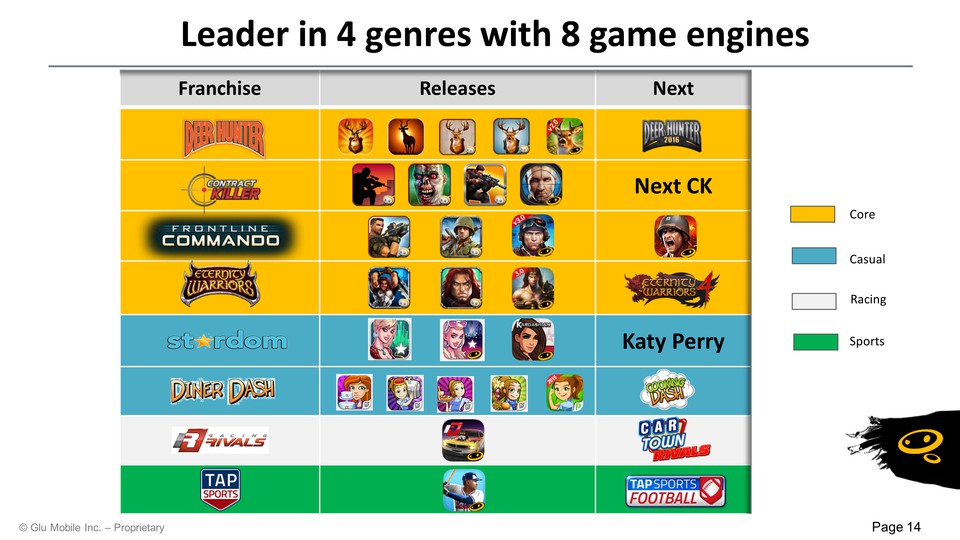
Leader in 4 genres with 8 game engines Core Casual Racing Sports
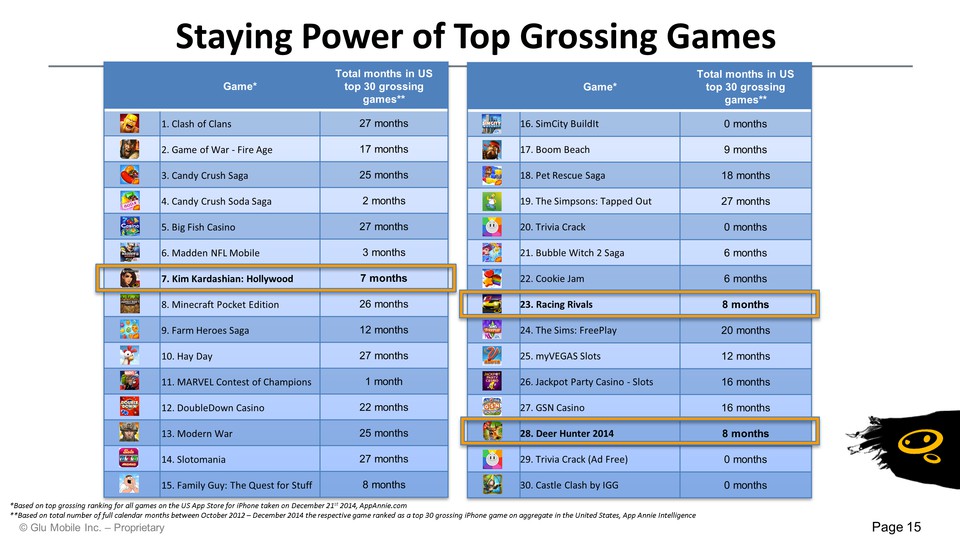
Staying Power of Top Grossing Games *Based on top grossing ranking for all games on the US App Store for iPhone taken on December 21st 2014, AppAnnie.com**Based on total number of full calendar months between October 2012 – December 2014 the respective game ranked as a top 30 grossing iPhone game on aggregate in the United States, App Annie Intelligence
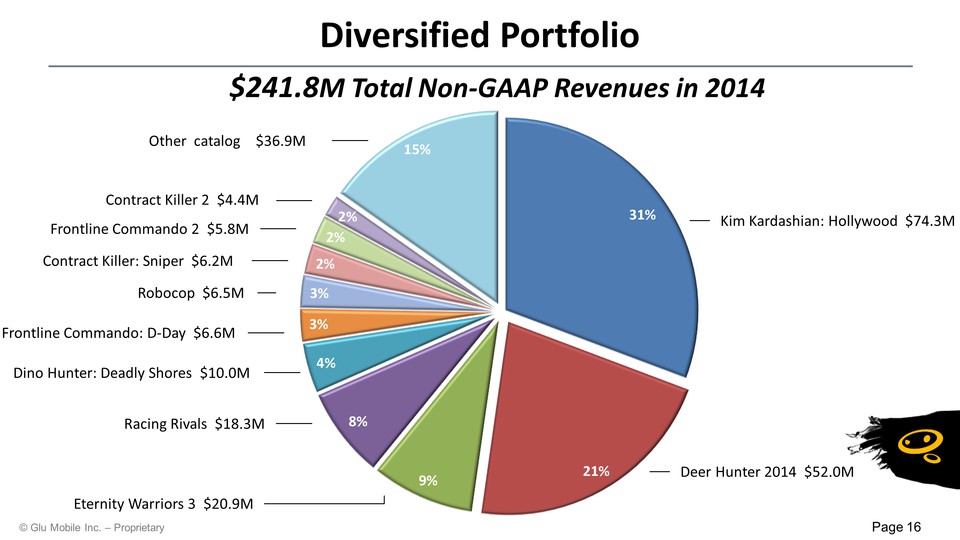
Robocop $6.5M Diversified Portfolio Kim Kardashian: Hollywood $74.3M Deer Hunter 2014 $52.0M Eternity Warriors 3 $20.9M Racing Rivals $18.3M Dino Hunter: Deadly Shores $10.0M Frontline Commando: D-Day $6.6M Contract Killer: Sniper $6.2M Frontline Commando 2 $5.8M Other catalog $36.9M Contract Killer 2 $4.4M $241.8M Total Non-GAAP Revenues in 2014
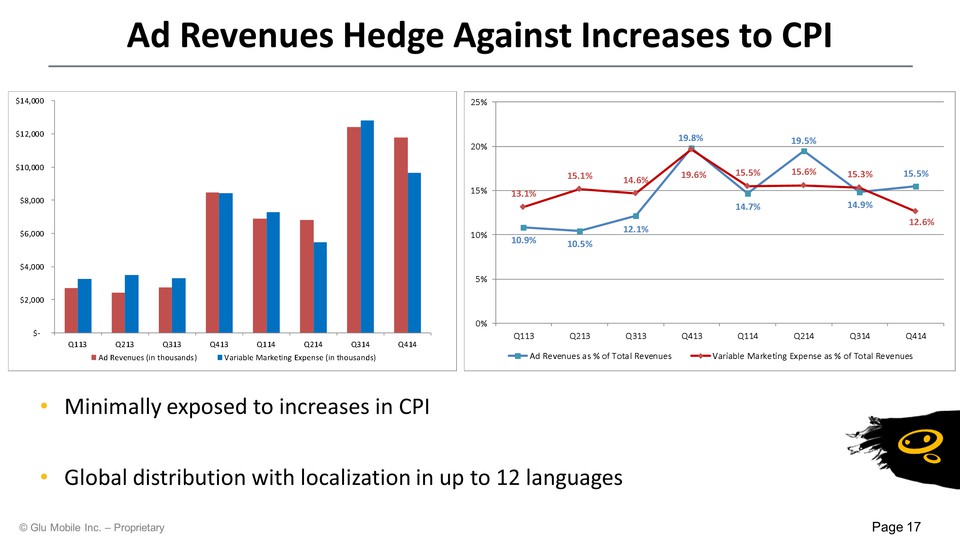
Ad Revenues Hedge Against Increases to CPI Minimally exposed to increases in CPIGlobal distribution with localization in up to 12 languages
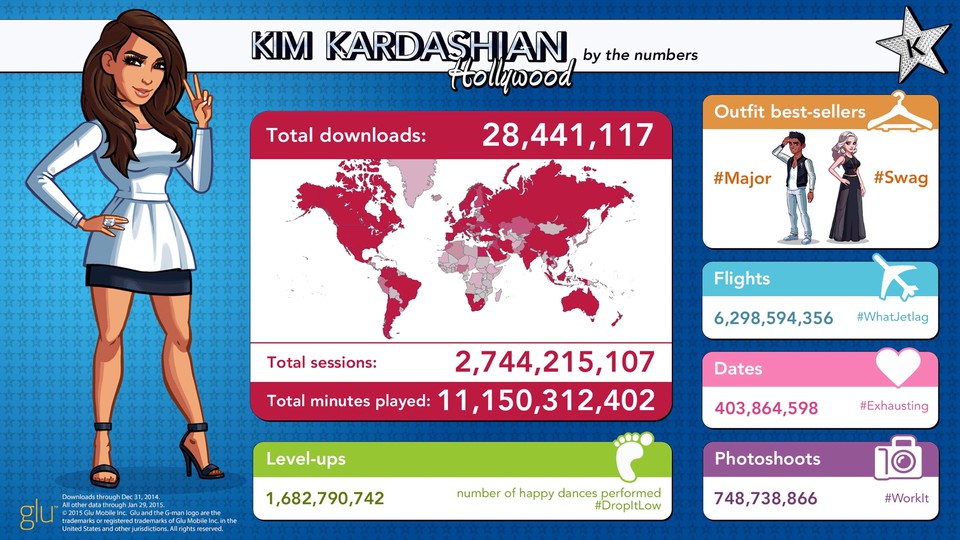
Total downloads: 28,441,117 Total sessions: 2,744,215,107 Total minutes player: 11,150,312,402 Level-ups 1,682,790,742 number of happy dances performed #DropItLow Outfit best-sellers #Major #Swag Flights 6,298,594,356 #WhatJetlag Dates 403,864,598 #Exhausting Photoshoots 748,738,866 #Workit Downloads through Dec 31, 2014. All other data through Jan 29, 2015. Glu Mobile Inc. Glu and the G-man logo are the trademarks or registered trademarks of Glu Mobile Inc. in the United States and other jurisdictions. All rights reserved.
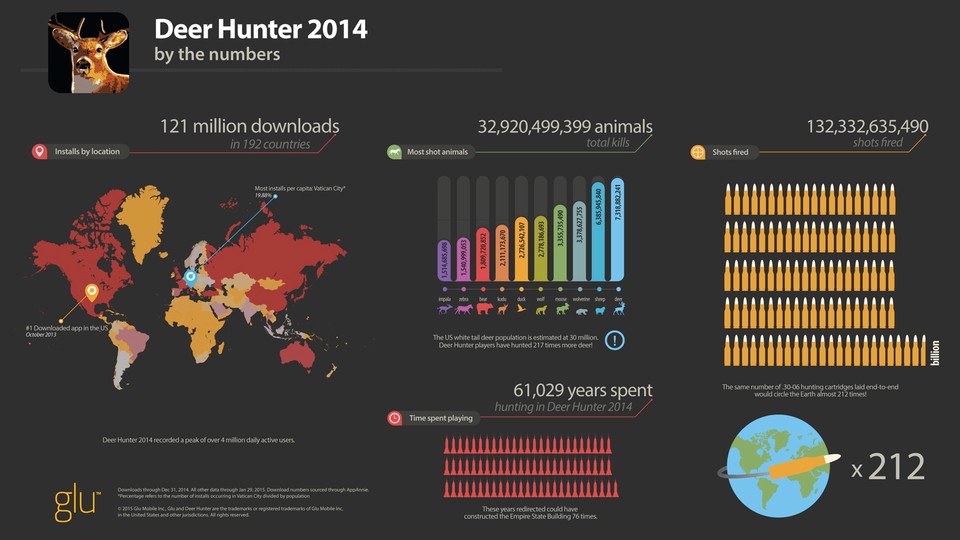
Deer Hunter 2014 by the numbers 121 million downloads in 192 countries 32,920,499,399 animals total kills 132,332,635,490 shots fired 61,029 years spent hunting in Deer Hunter 2014 Deer Hunter 2014 recorded a peak of over 4 million daily active users.
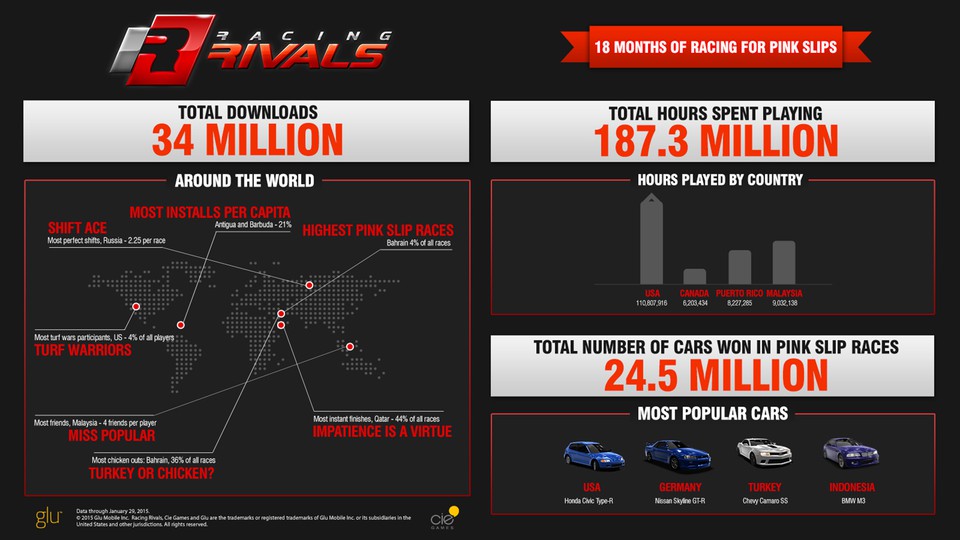
Racing Rivals 18 months of racing for pink slips total downloads 34 million total hours spent playing 187.3 million total number of cars won in pink slip races 24.5 million
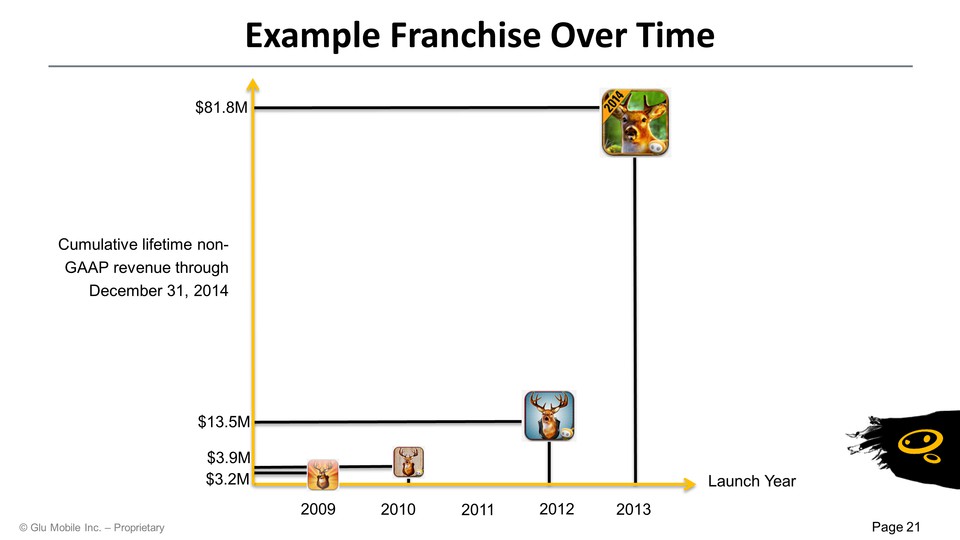
Example Franchise Over Time Launch Year Cumulative lifetime non-GAAP revenue through December 31, 2014 2011 2012 2013 $3.9M $13.5M $81.8M 2010 2009 $3.2M
Glu & Big Data Analytics Glu Analytics Capabilities:Capable of processing 70 million events per secondIngesting 2 billion events per dayAggregating 75 million KPI metrics per day2 trillion event capacity, easily scalableUsage of Analytics:Optimization of user acquisition, retention, paying user conversion & LTVContinually refining game performance through testing and analysis
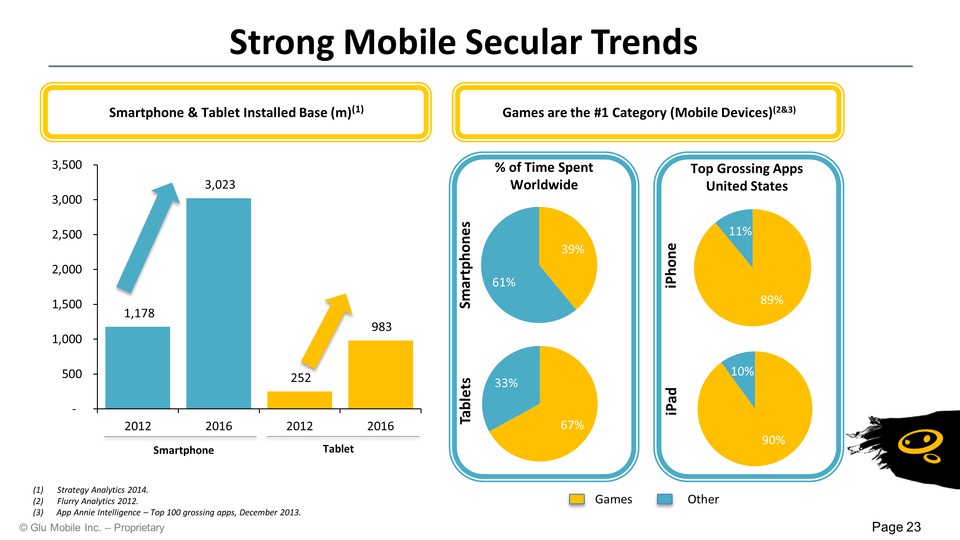
Strategy Analytics 2014.Flurry Analytics 2012.(3) App Annie Intelligence – Top 100 grossing apps, December 2013. Title: Strong Mobile Secular Trends Smartphone & Tablet Installed Base (m)(1) Games are the #1 Category (Mobile Devices)(2&3) Smartphone Tablet % of Time Spent Worldwide Top Grossing AppsUnited States Smartphones Tablets iPhone iPad Games Other
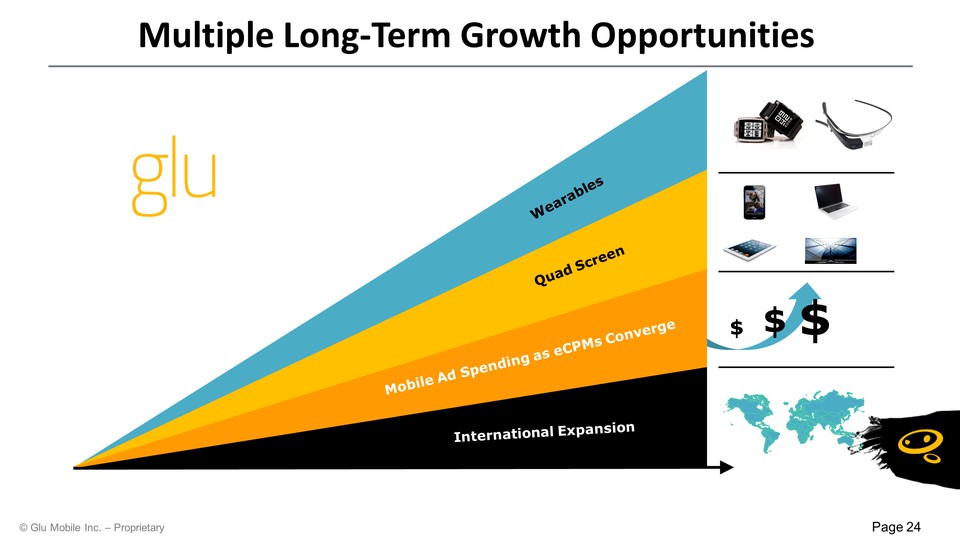
Multiple Long-Term Growth Opportunities International Expansion Mobile Ad Spending as eCPMs Converge Quad Screen Wearables Opportunity / Revenue / Value Time $ $ $

Financial Overview
Strong Top Line GrowthDiversified Portfolio of FranchisesCost-Effective Customer AcquisitionLong Tail Games Provide Significant VisibilityGrowing & Engaged Installed Base Financial Investment Highlights
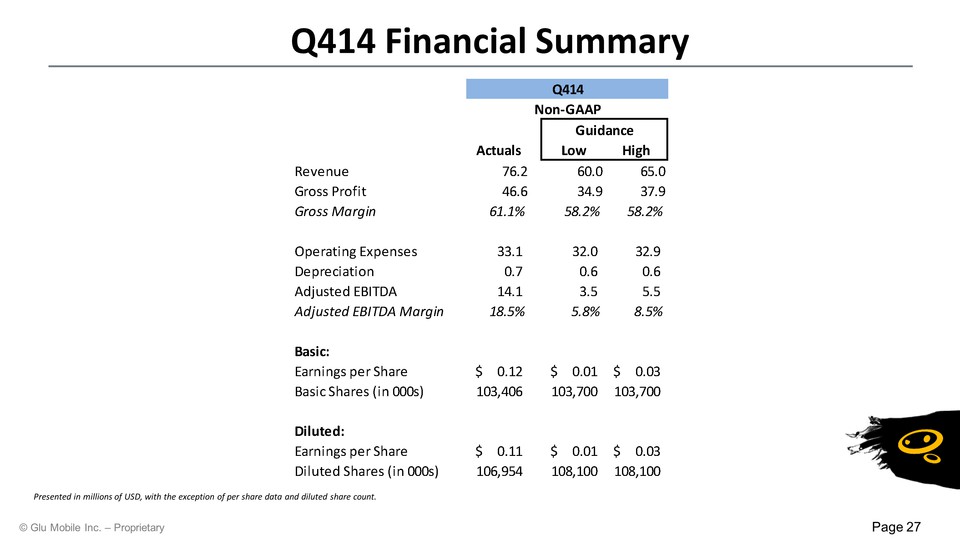
Revenue 76.2 60.0 65.0 Gross Profit 46.6 34.9 37.9 Gross Margin 61.1% 58.2% 58.2% Operating Expenses 33.1 32.0 32.9 Depreciation 0.7 0.6 0.6 Adjusted EBITDA 14.1 3.5 5.5 Adjusted EBITDA Margin 18.5% 5.8% 8.5% Basic: Earnings per Share $0.12 $ 0.01 $ 0.03 Basic Shares (in 000s) 103,406 103,700 103,700 Diluted: Earnings per Share $ 0.11 $0.01 $0.03 Diluted Shares (in 000s) 106,954 108,100 108,100

($ in millions) Q414 Q314 Q/Q Q413 Y/Y Total Revenue $ 76.2 $ 83.6 (9%) $ 42.8 78% Gross Profit 46.6 49.8 (7%) 31.3 49% Gross Margin 61.1% 59.6% 150 bp 73.0% (1, 190) bp Operating Expense 33.1 35.0 6% 25.7 (29%) Operating Income/(Loss) 13.5 14.8 (9%) 5.5 -143% Adjusted EBITDA $ 14.1 $ 15.4 8% $ 6.2 (127%)
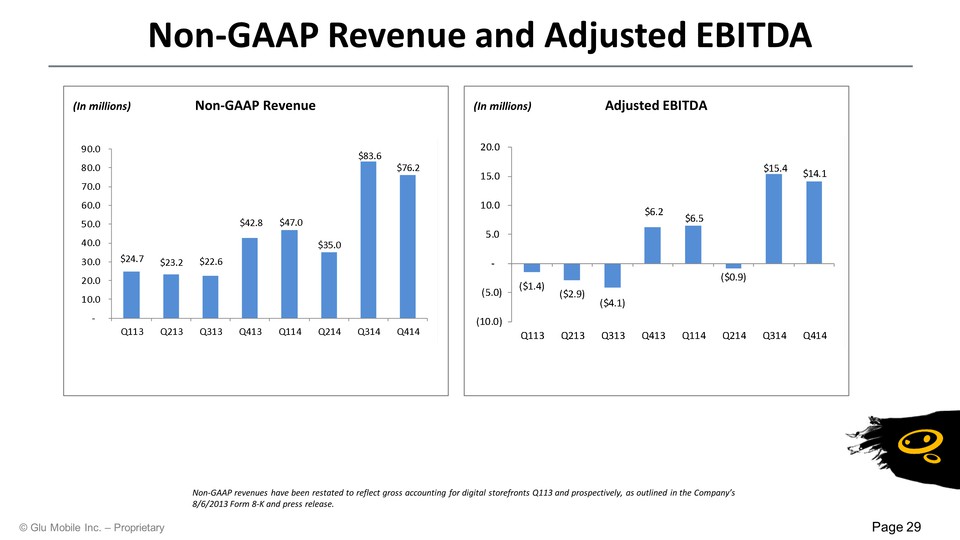
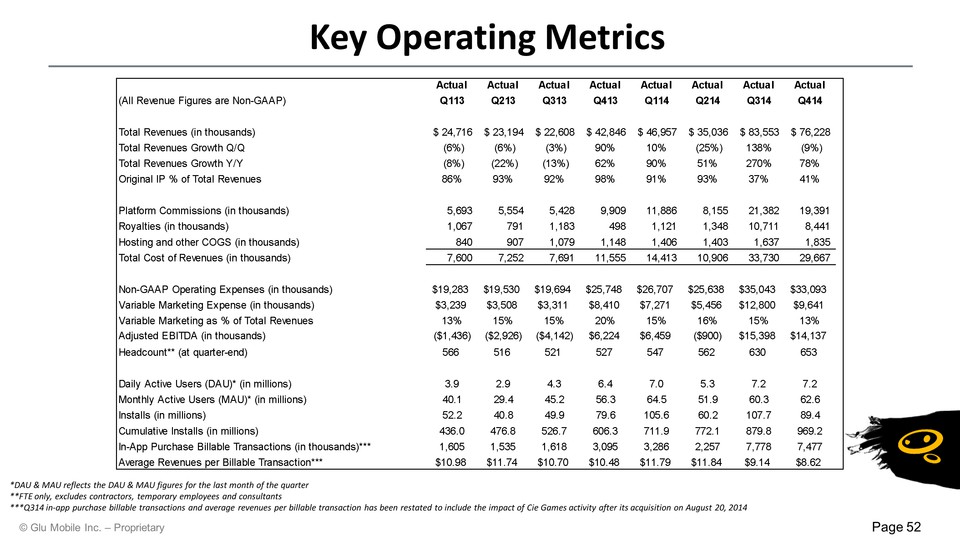
Non-GAAP Revenue and Adjusted EBITDA Non-GAAP revenues have been restated to reflect gross accounting for digital storefronts Q113 and prospectively, as outlined in the Company’s 8/6/2013 Form 8-K and press release. (In millions) Non-GAAP Revenue (In millions) Adjusted EBITDA
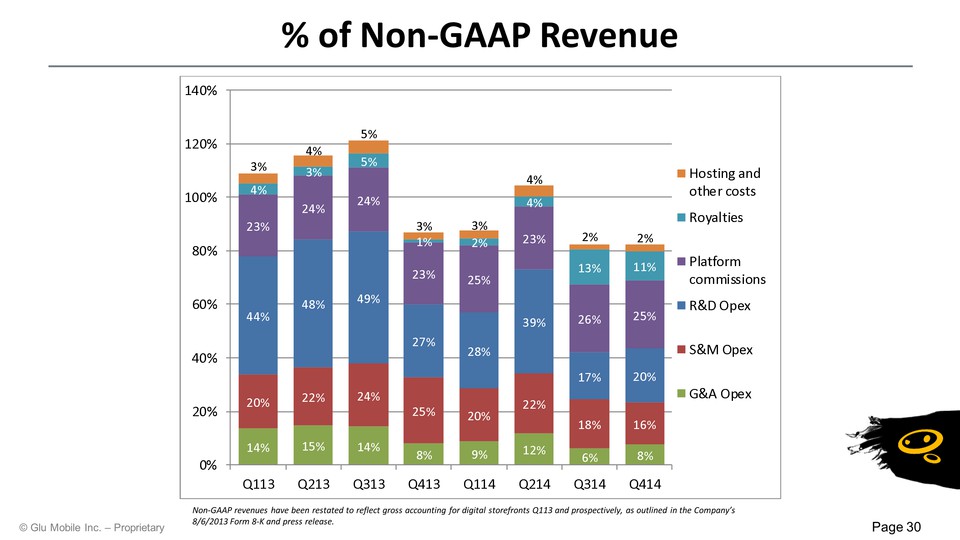
% of Non-GAAP Revenue Non-GAAP revenues have been restated to reflect gross accounting for digital storefronts Q113 and prospectively, as outlined in the Company’s 8/6/2013 Form 8-K and press release.
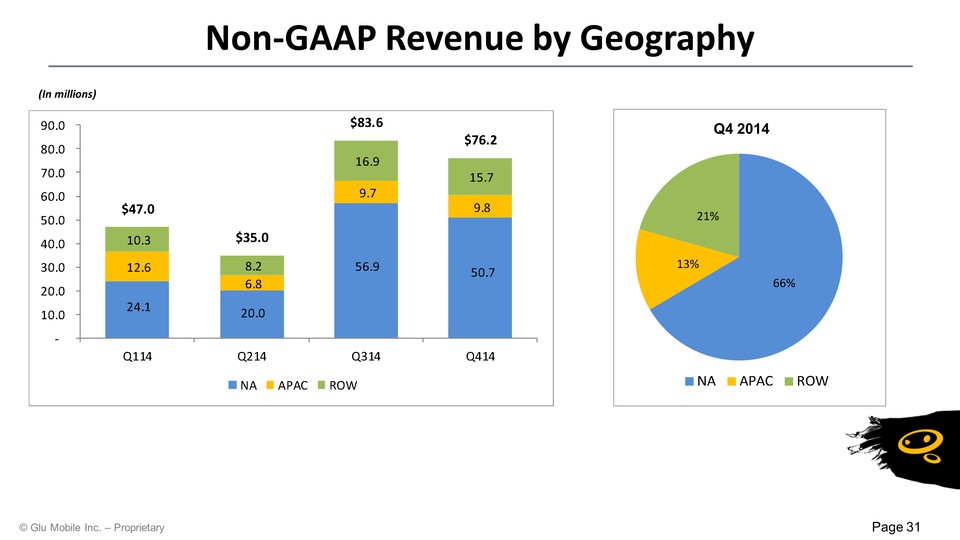
Non-GAAP Revenue by Geography Q4 2014 (In millions)
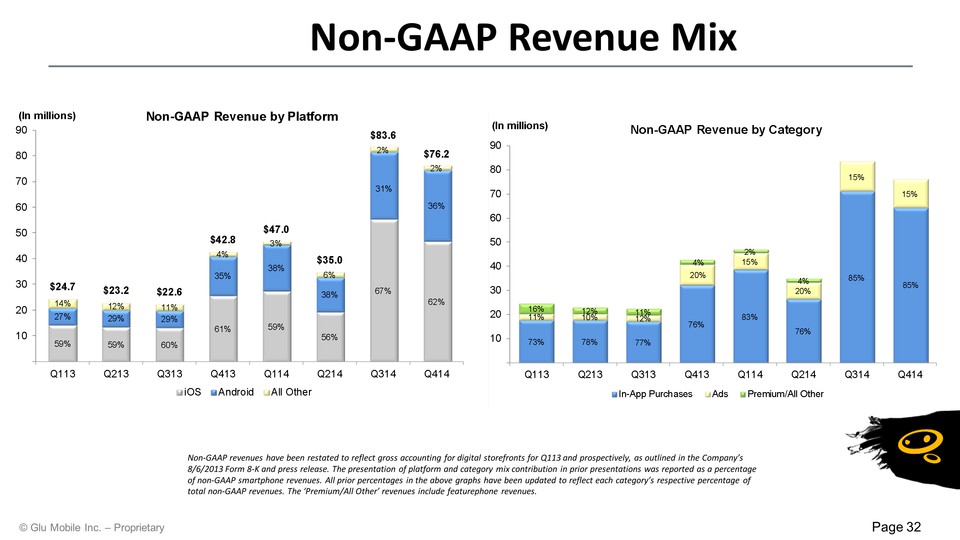
Non-GAAP Revenue Mix Non-GAAP revenues have been restated to reflect gross accounting for digital storefronts for Q113 and prospectively, as outlined in the Company’s 8/6/2013 Form 8-K and press release. The presentation of platform and category mix contribution in prior presentations was reported as a percentage of non-GAAP smartphone revenues. All prior percentages in the above graphs have been updated to reflect each category’s respective percentage of total non-GAAP revenues. The ‘Premium/All Other’ revenues include featurephone revenues.
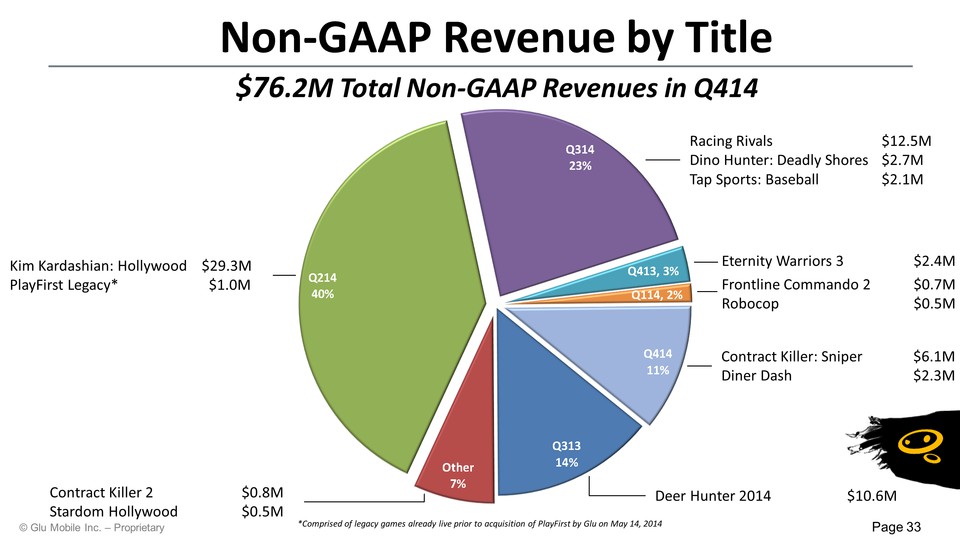
Non-GAAP Revenue by Title Kim Kardashian: Hollywood $29.3M PlayFirst Legacy* $1.0M $76.2M Total Non-GAAP Revenues in Q414 Eternity Warriors 3 $2.4M Contract Killer: Sniper $6.1M Diner Dash $2.3M Contract Killer 2 $0.8M Stardom Hollywood $0.5M Frontline Commando 2 $0.7M Robocop $0.5M Racing Rivals $12.5M Dino Hunter: Deadly Shores $2.7M Tap Sports: Baseball $2.1M Deer Hunter 2014 $10.6M *Comprised of legacy games already live prior to acquisition of PlayFirst by Glu on May 14, 2014
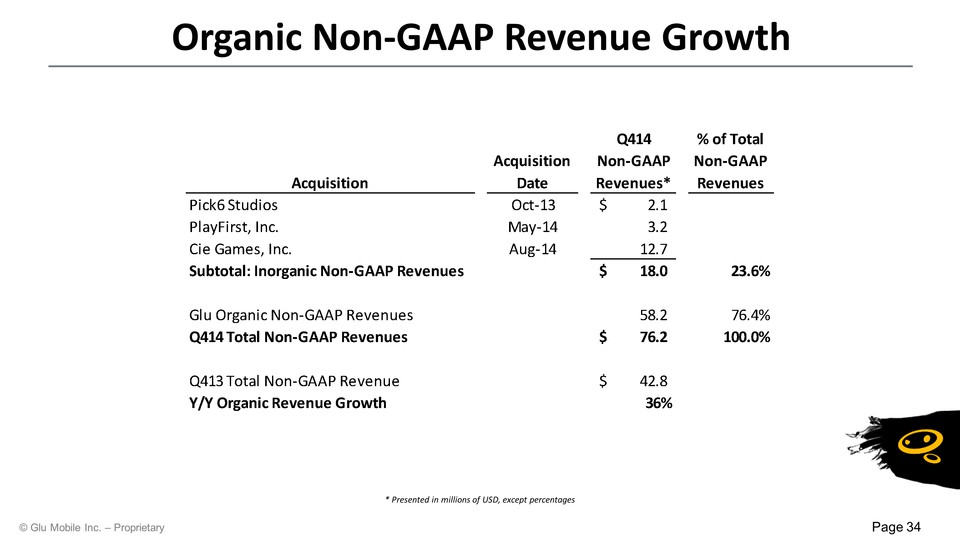
* Presented in millions of USD, except percentages Organic Non-GAAP Revenue Growth Acquisition Acquisition Date Q414 Non-GAAP Revenues* % of Total Non-GAAP Revenues Pick6 Studios PlayFirst, Inc. Cie Games, Inc. Subtotal: Inorganic Non-GAAP Revenues Glu Organic Non-GAAP Revenues Q414 Total Non-GAAP Revenues Q413 Total Non-GAAP Revenues Y/Y Organic Revenue Growth Oct-13 May-14 Aug-14 $ 2.1 3.2 12.7 $ 18.0 23.6% 58.2 $ 76.2 76.4% 100.0% $ 42.8 36%
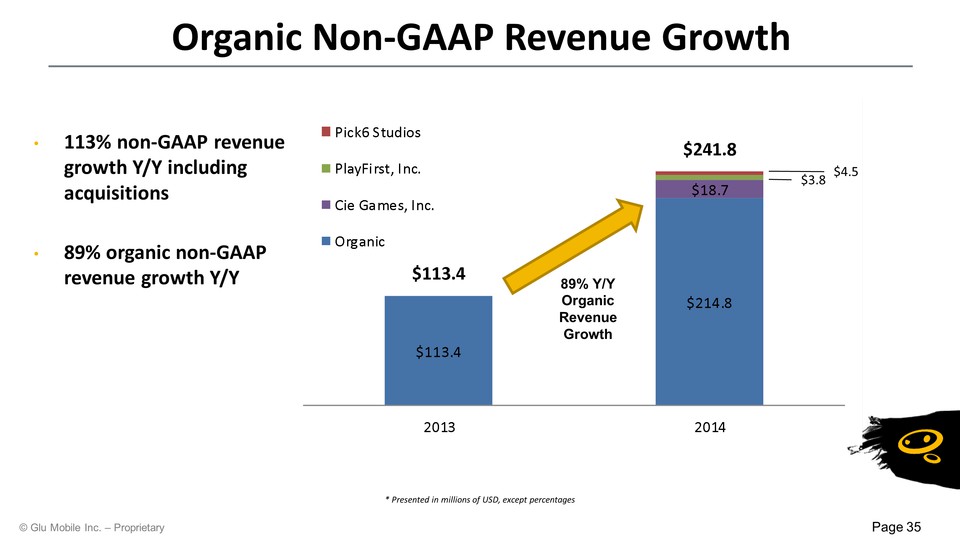
Organic Non-GAAP Revenue Growth * Presented in millions of USD, except percentages 113% non-GAAP revenue growth Y/Y including acquisitions89% organic non-GAAP revenue growth Y/Y 89% Y/Y Organic Revenue Growth $3.8 $4.5
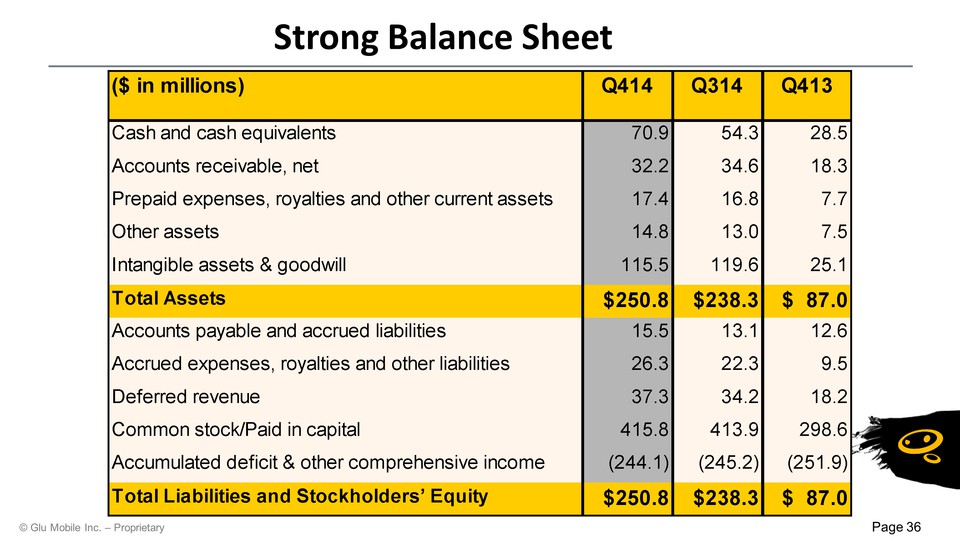
Strong Balance Sheet ($ in millions) Q414 Q314 Q413 Cash and cash equivalents 70.9 54.3 28.5 Accounts receivable, net 32.2 34.6 18.3 Prepaid expenses, royalties and other current assets 17.4 16.8 7.7 Other assets 14.8 13.0 7.5 Intangible assets & goodwill 115.5 119.6 25.1 Total Assets $250.8 $238.3 $ 87.0 Accounts payable and accrued liabilities 15.5 13.1 12.6 Accrued expenses, royalties and other liabilities 26.3 22.3 9.5 Deferred revenue 37.3 34.2 18.2 Common stock/Paid in capital 415.8 413.9 298.6 Accumulated deficit & other comprehensive income (244.1) (245.2) (251.9) Total Liabilities and Stockholders’ Equity $250.8 $238.3 $ 87.0
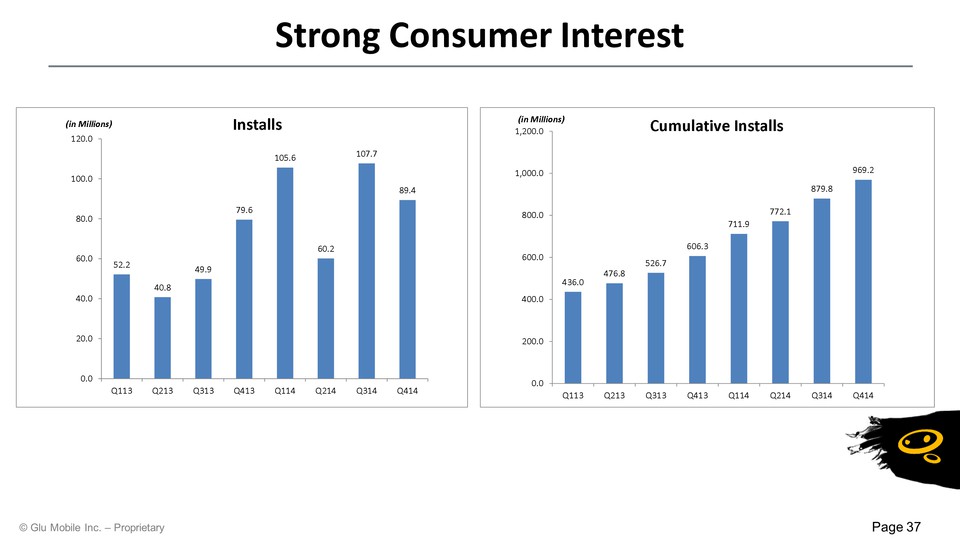
Strong Consumer Interest Installs Cumulative Installs
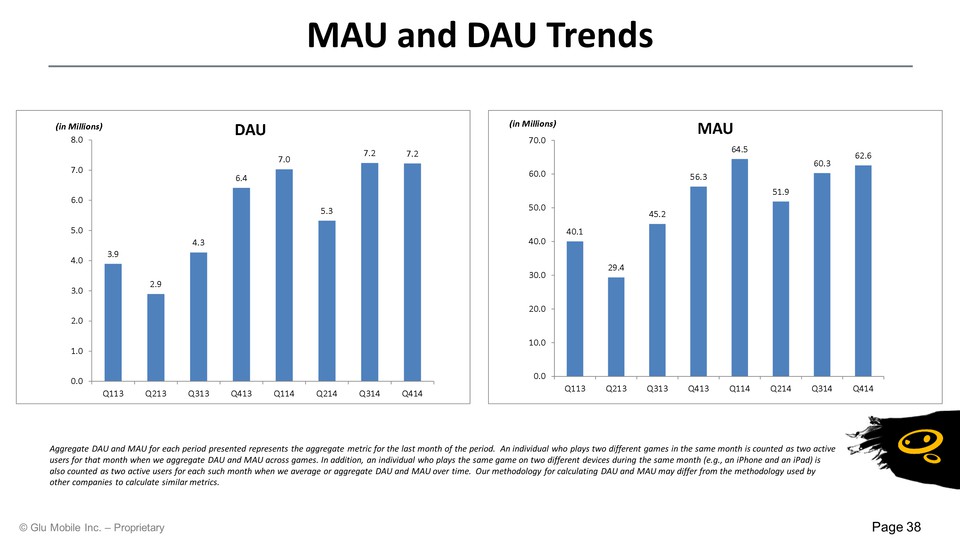
MAU and DAU Trends Aggregate DAU and MAU for each period presented represents the aggregate metric for the last month of the period. An individual who plays two different games in the same month is counted as two active users for that month when we aggregate DAU and MAU across games. In addition, an individual who plays the same game on two different devices during the same month (e.g., an iPhone and an iPad) is also counted as two active users for each such month when we average or aggregate DAU and MAU over time. Our methodology for calculating DAU and MAU may differ from the methodology used by other companies to calculate similar metrics.

Guidance
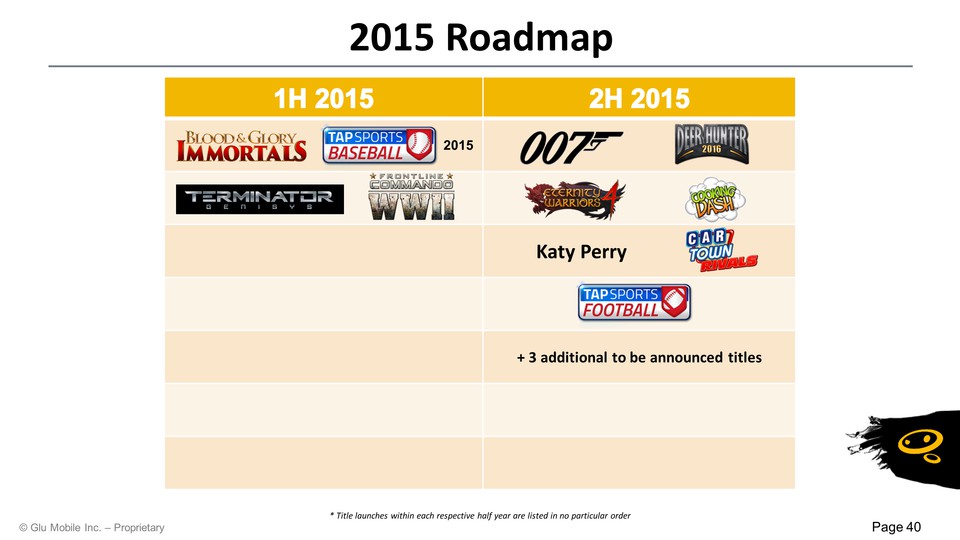
2015 Roadmap * Title launches within each respective half year are listed in no particular order
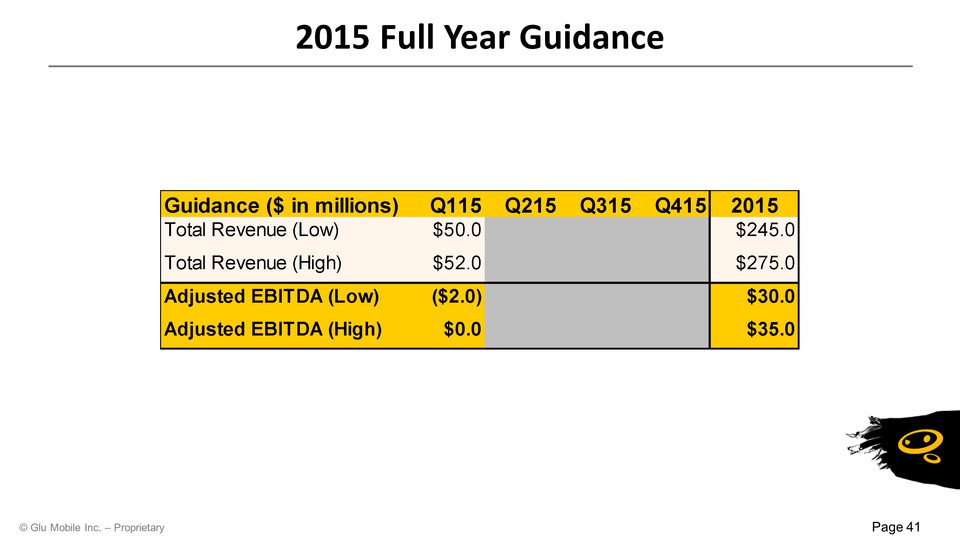
2015 Full Year Guidance Guidance ($ in millions) Q115 Q215 Q315 Q415 2015 Total Revenue (Low) $50.0 $245.0 Total Revenue (High) $52.0 $275.0 Adjusted EBITDA (Low) ($2.0) $30.0 Adjusted EBITDA (High) $0.0 $35.0
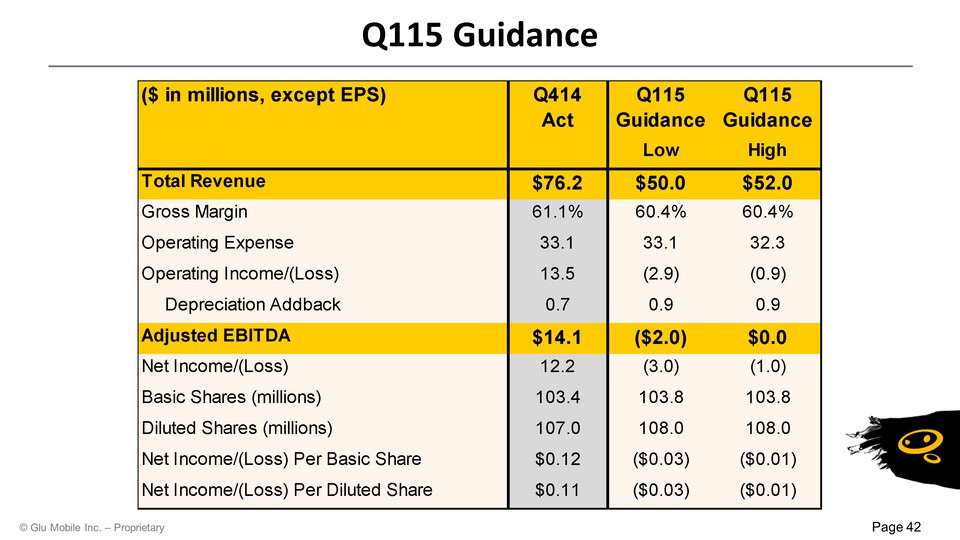
Q115 Guidance ($ in millions, except EPS) Q414 Act Q115 Q115 Guidance Guidance Low High Total Revenue $76.2 $50.0 $52.0 Gross Margin 61.1% 60.4% 60.4% Operating Expense 33.1 33.1 32.3 Operating Income/(Loss) Depreciation Addback 13.5 (2.9) (0.9) 0.7 0.9 0.9 Adjusted EBITDA $14.1 ($2.0) $0.0 Net Income/(Loss) 12.2 (3.0) (1.0) Basic Shares (millions) 103.4 103.8 103.8 Diluted Shares (millions) 107.0 108.0 108.0 Net Income/(Loss) Per Basic Share $0.12 ($0.03) ($0.01) Net Income/(Loss) Per Diluted Share $0.11 ($0.03) ($0.01)
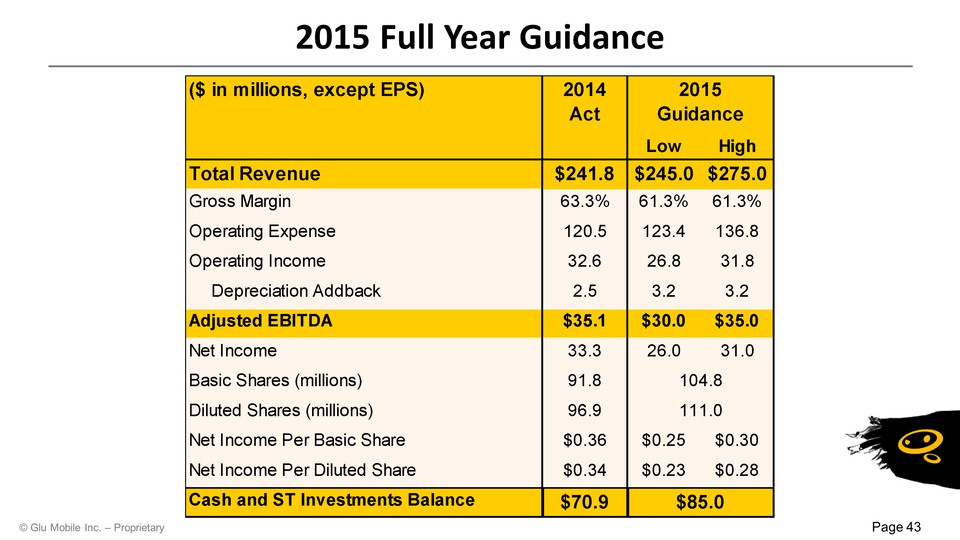
2015 Full Year Guidance ($ in millions, except EPS) 2014 Act 2015 Guidance Low High Total Revenue $241.8 $245.0 $275.0 Gross Margin Operating Expense Operating Income Depreciation Addback 63.3% 61.3% 61.3% 120.5 123.4 136.8 32.6 26.8 31.8 2.5 3.2 3.2 Adjusted EBITDA $35.1 $30.0 $35.0 Net Income 33.3 26.0 31.0 Basic Shares (millions) 91.8 104.8 Diluted Shares (millions) 96.9 111.0 Net Income Per Basic Share $0.36 $0.25 $0.30 Net Income Per Diluted Share $0.34 $0.23 $0.28 Cash and ST Investments Balance $70.9 $85.0
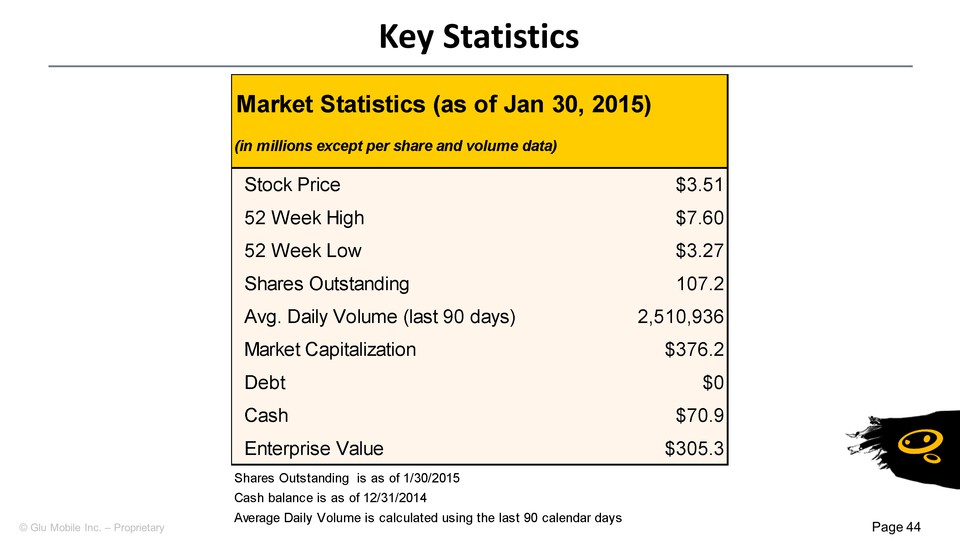
Key Statistics Market Statistics (as of Jan 30, 2015) (in millions except per share and volume data)Stock Price $3.51 52 Week High $7.60 52 Week Low $3.27 Shares Outstanding 107.2 Avg. Daily Volume (last 90 days) 2,510,936 Market Capitalization $376.2 Debt $0 Cash $70.9 Enterprise Value $305.3 Shares Outstanding is as of 1/30/2015 Cash balance is as of 12/31/2014 Average Daily Volume is calculated using the last 90 calendar days
Benefitting from Strong Secular Global Mobile GrowthLeader in Mobile GamingDiversified Portfolio of FranchisesStrong 2015 Title RoadmapFinancials Benefitting from Significant Investments Investment Highlights
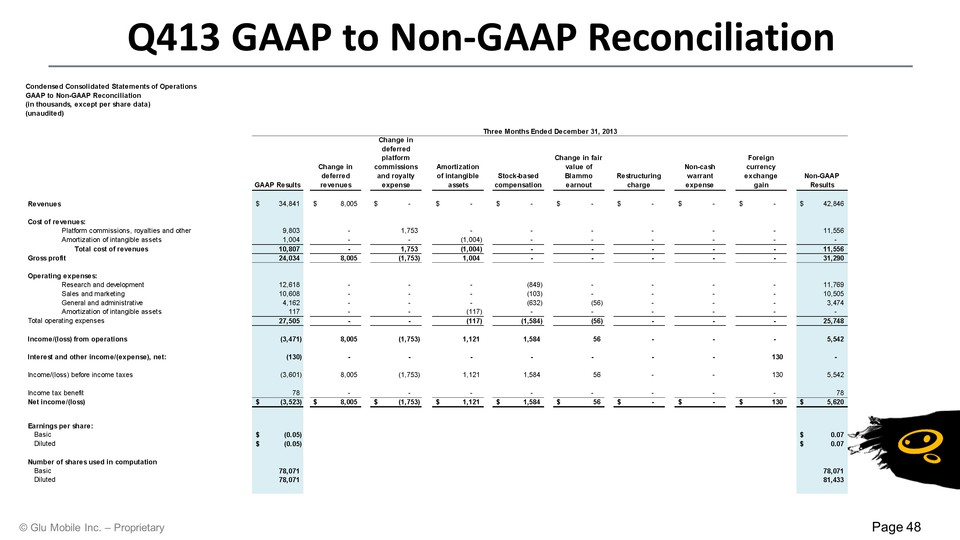
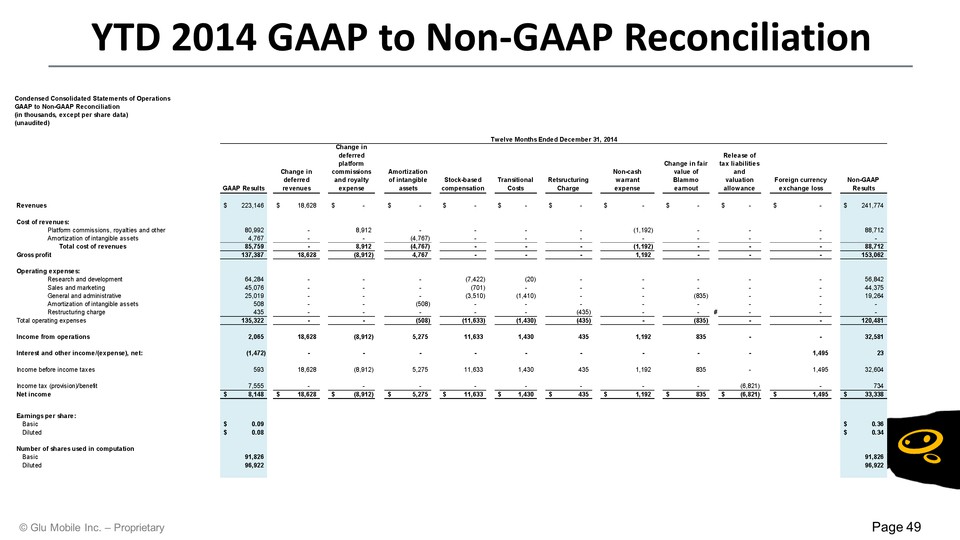
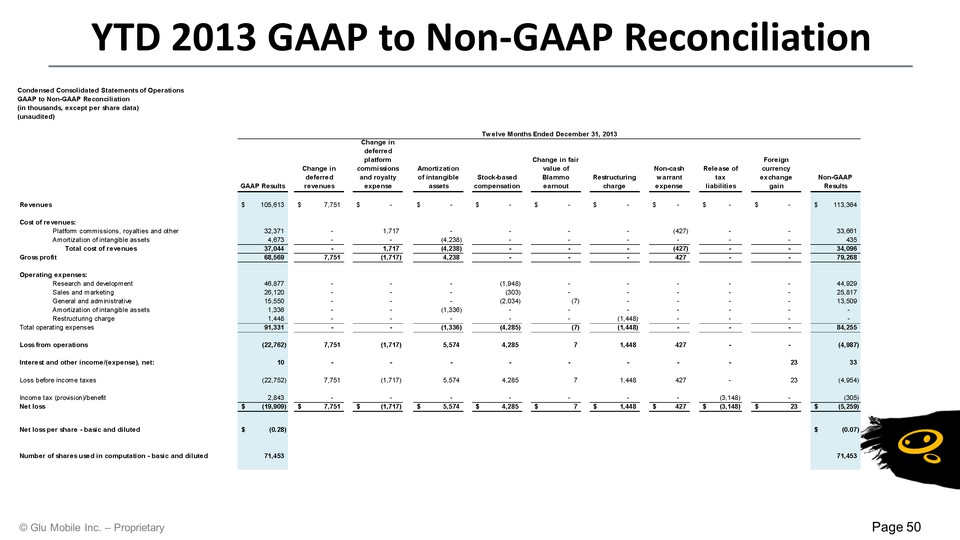
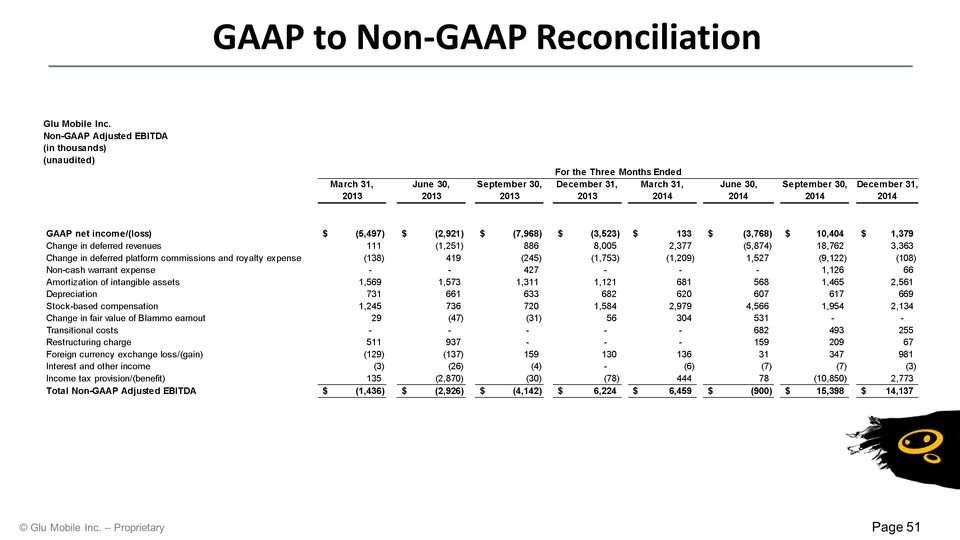
Non-GAAP Reconciliations