Exhibit 99.1
Investor Presentation
May 2014
Copyright 2014 HomeAway, Inc.
Safe harbor statement
This presentation contains “forward-looking” statements, subject to the safe harbor provisions of the Private Securities Litigation Reform Act of 1995, which are based on HomeAway management’s beliefs and assumptions and on information currently available to management. Forward-looking statements include information concerning HomeAway’s expected, possible or assumed future results of operations, growth and business outlook; and HomeAway’s potential future acquisitions.
Forward-looking statements include all statements that are not historical facts and may be identified by terms such as “continues,” “plans,” “believes,” “expects,” “anticipates,” “could,” “look forward to,” or similar expressions and the negatives of those terms. Forward-looking statements involve known and unknown risks, uncertainties and other factors that may cause HomeAway’s actual results, performance or achievements to be materially different from any future results, performance or achievements expressed or implied by the forward-looking statements. Factors that could cause or contribute to such differences include, but are not limited to the following: (a) HomeAway’s inability to continue to attract and maintain a critical mass of property listings and travelers, (b) a decrease in renewal of listings, (c) HomeAway’s inability to effectively manage its growth, (d) HomeAway’s inability to increase sales to existing property owners and managers and attract new ones, (e) the impact of pay-per-booking or other changes in HomeAway’s pricing policies or those of its competitors, (f) HomeAway’s inability to execute its product and services development roadmap, including e-commerce initiatives, (g) the impact of general economic conditions, (h) fluctuations in foreign exchange rates, (i) HomeAway’s inability to introduce successful new products and services; (j) the inability to integrate and grow recent acquisitions, and (k) such other risks and uncertainties described more fully in documents filed with or furnished to the Securities and Exchange Commission (the “SEC”), including HomeAway’s most recent 10-Q, filed on April 30, 2014. All information provided in this presentation is as of the date hereof and, except as required by law, HomeAway assumes no obligation to update this information, even if new information becomes available in the future.
© Copyright 2014 HomeAway, Inc. 2
Our mission
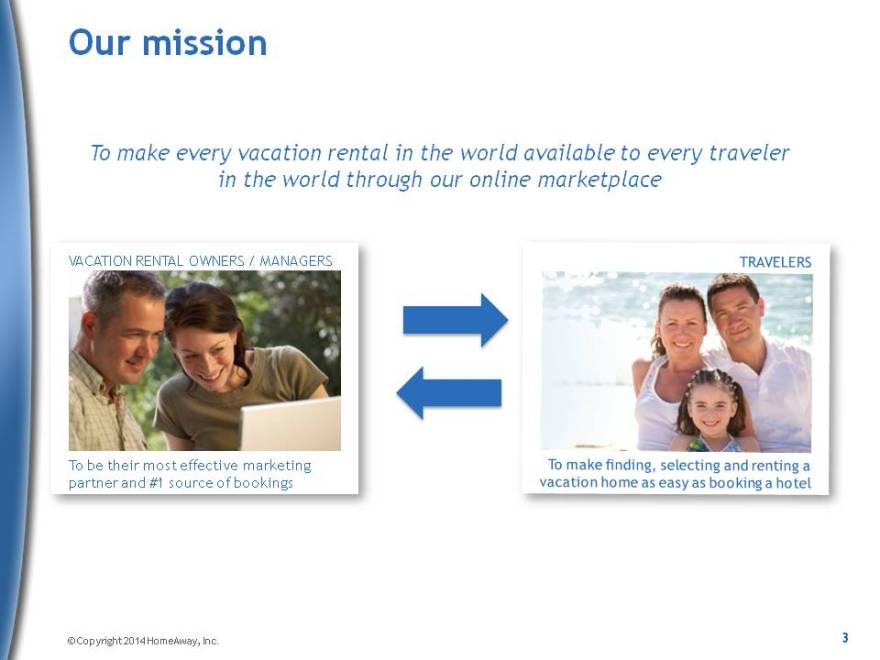
To make every vacation rental in the world available to every traveler in the world through our online marketplace
VACATION RENTAL OWNERS / MANAGERS
TRAVELERS
To make finding, selecting and renting a vacation home as easy as booking a hotel
To be their most effective marketing partner and #1 source of bookings
Copyright 2014 HomeAway, Inc.
3
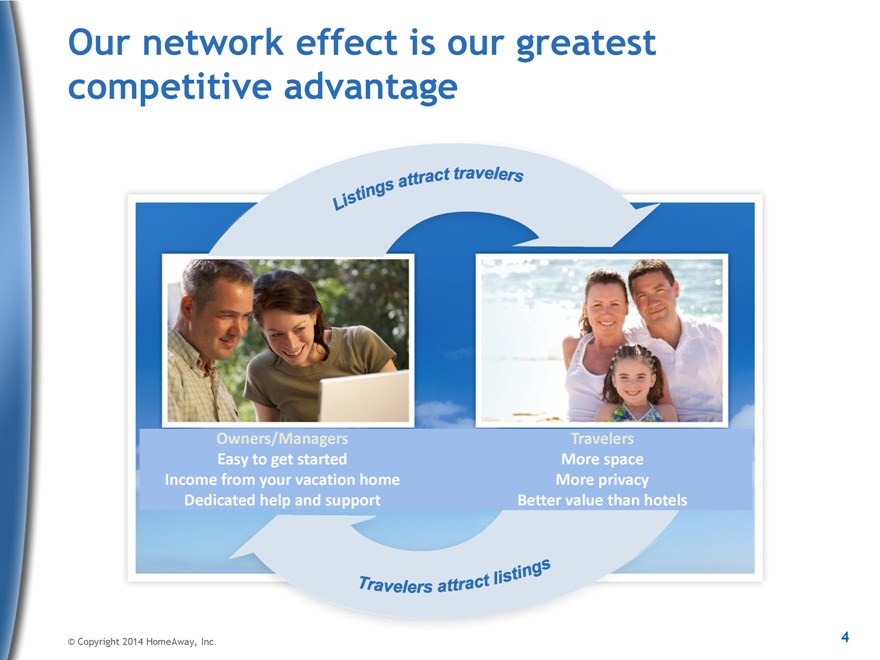
Our network effect is our greatest competitive advantage
Listings attract travelers
Owners/Managers
Easy to get started
Income from your vacation home
Dedicated help and support
Travelers More space More privacy Better value than hotels
Travelers attract listings
Copyright 2014 HomeAway, Inc.
4
World’s largest vacation rental marketplace
Key Facts1
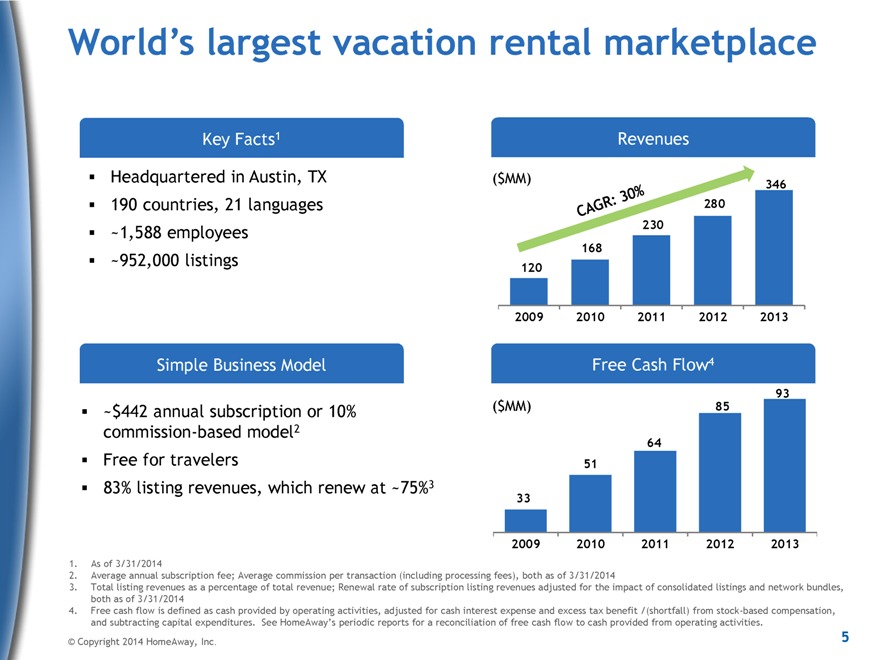
Headquartered in Austin, TX 190 countries, 21 languages ~1,588 employees ~952,000 listings
Revenues
CAGR: 30%
($MM) 346 280 230 168 120
2009 2010 2011 2012 2013
Simple Business Model
~$442 annual subscription or 10% commission-based model2 Free for travelers
83% listing revenues, which renew at ~75%3
Free Cash Flow4
93
($MM) 85
64 51
33
2009 2010 2011 2012 2013
1. As of 3/31/2014
2. Average annual subscription fee; Average commission per transaction (including processing fees), both as of 3/31/2014
3. Total listing revenues as a percentage of total revenue; Renewal rate of subscription listing revenues adjusted for the impact of consolidated listings and network bundles, both as of 3/31/2014
4. Free cash flow is defined as cash provided by operating activities, adjusted for cash interest expense and excess tax benefit /(shortfall) from stock-based compensation, and subtracting capital expenditures. See HomeAway’s periodic reports for a reconciliation of free cash flow to cash provided from operating activities.
© Copyright 2014 HomeAway, Inc. 5
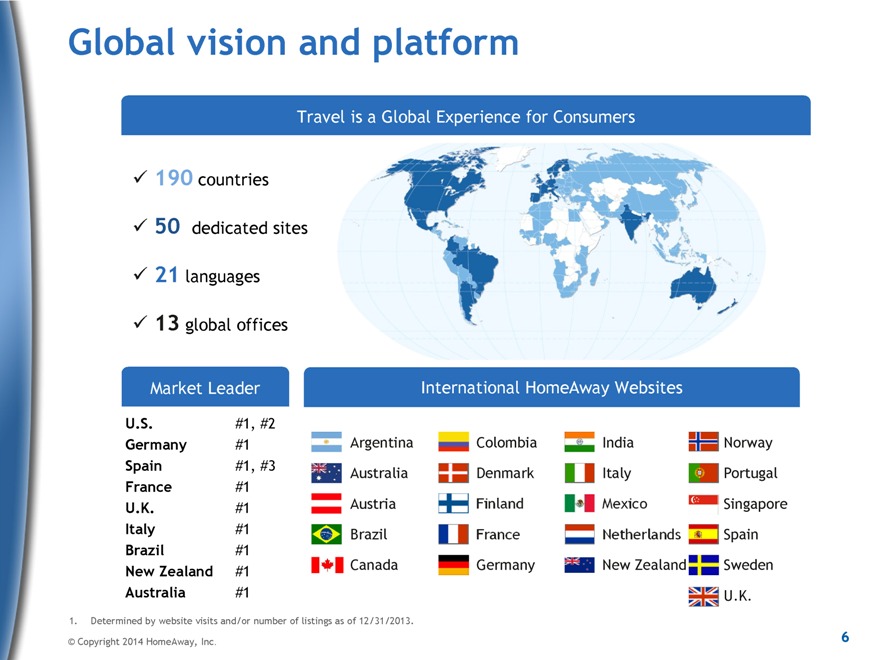
Global vision and platform
Travel is a Global Experience for Consumers
190 countries 50 dedicated sites 21 languages 13 global offices
Market Leader
U.S. #1, #2
Germany #1
Spain #1, #3
France #1 U.K. #1 Italy #1 Brazil #1 New Zealand #1 Australia #1
International HomeAway Websites
Argentina Colombia India Norway
Australia Denmark Italy Portugal
Austria Finland Mexico Singapore
Brazil France Netherlands Spain
Canada Germany New Zealand Sweden
U.K.
1. Determined by website visits and/or number of listings as of 12/31/2013.
© Copyright 2014 HomeAway, Inc.
6
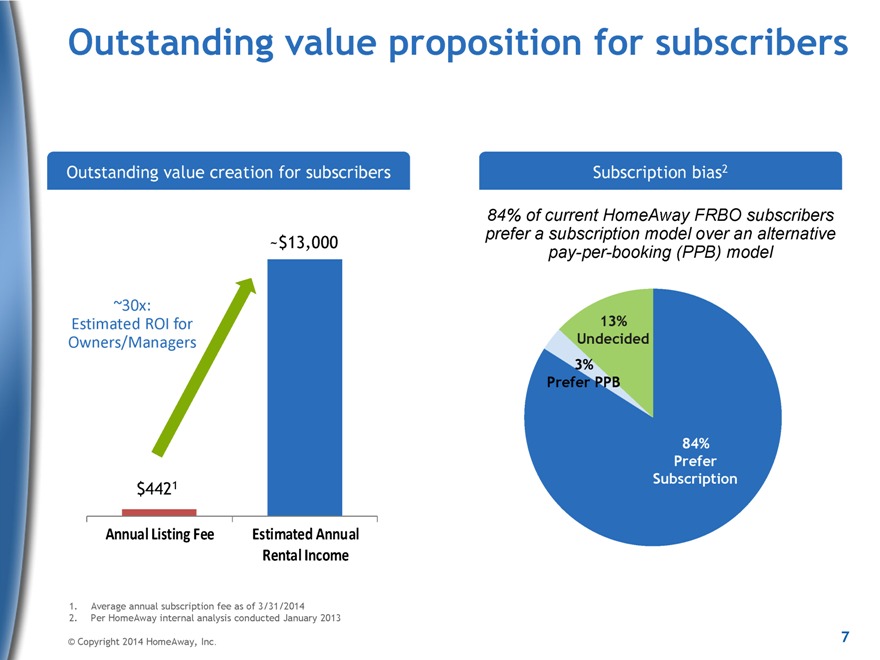
Outstanding value proposition for subscribers
Outstanding value creation for subscribers
~$13,000
~30x: Estimated ROI for Owners/Managers
$4421
Annual Listing Fee Estimated Annual Rental Income
Subscription bias2
84% of current HomeAway FRBO subscribers prefer a subscription model over an alternative pay-per-booking (PPB) model
13% Undecided 3% Prefer PPB
84% Prefer Subscription
1. Average annual subscription fee as of 3/31/2014
2. Per HomeAway internal analysis conducted January 2013
© Copyright 2014 HomeAway, Inc.
7
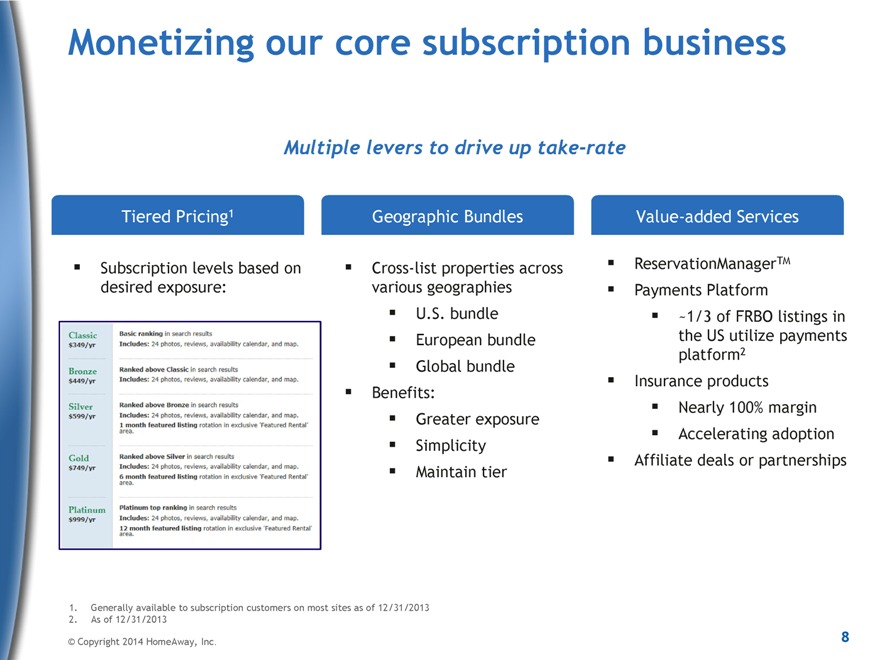
Monetizing our core subscription business
Multiple levers to drive up take-rate
Tiered Pricing1
Subscription levels based on desired exposure:
Geographic Bundles
Cross-list properties across various geographies U.S. bundle European bundle Global bundle Benefits: Greater exposure Simplicity Maintain tier
Value-added Services
ReservationManagerTM Payments Platform
~1/3 of FRBO listings in the US utilize payments platform2 Insurance products Nearly 100% margin Accelerating adoption Affiliate deals or partnerships
1. Generally available to subscription customers on most sites as of 12/31/2013
2. As of 12/31/2013
© Copyright 2014 HomeAway, Inc.
8
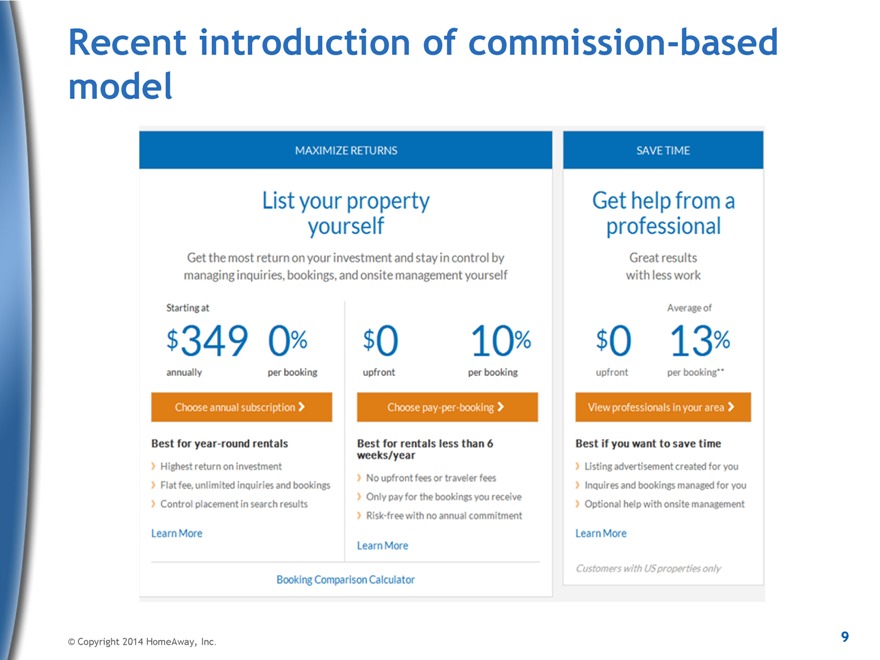
Recent introduction of commission-based model
MAXIMIZE RETURNS SAVE TIME
List your property yourself Get help from a professional
Get the most return on your investment and stay in control by managing inquiries, bookings, and onsite management yourself
Great results with less work
Starting at $349 annually 0% per booking $0 upfront 10% per booking
Average of $0 upfront 13% per booking**
Choose annual subscription Choose pay-per-booking View professionals in your area
Best for year-round rentals
Highest return on investment
Flat fee, unlimited inquiries and bookings
Control placement in search results
Learn More
Best for rentals less than 6 weeks/year
No upfront fees or traveler fees
Only pay for the bookings you receive
Risk-free with no annual commitment
Learn More
Best if you want to save time
Listing advertisement created for you
Inquires and bookings managed for you
Optional help with onsite management
Learn More
Booking Comparison Calculator
Customers with US properties only
© Copyright 2014 HomeAway, Inc.
9
© Copyright 2014 HomeAway, Inc.
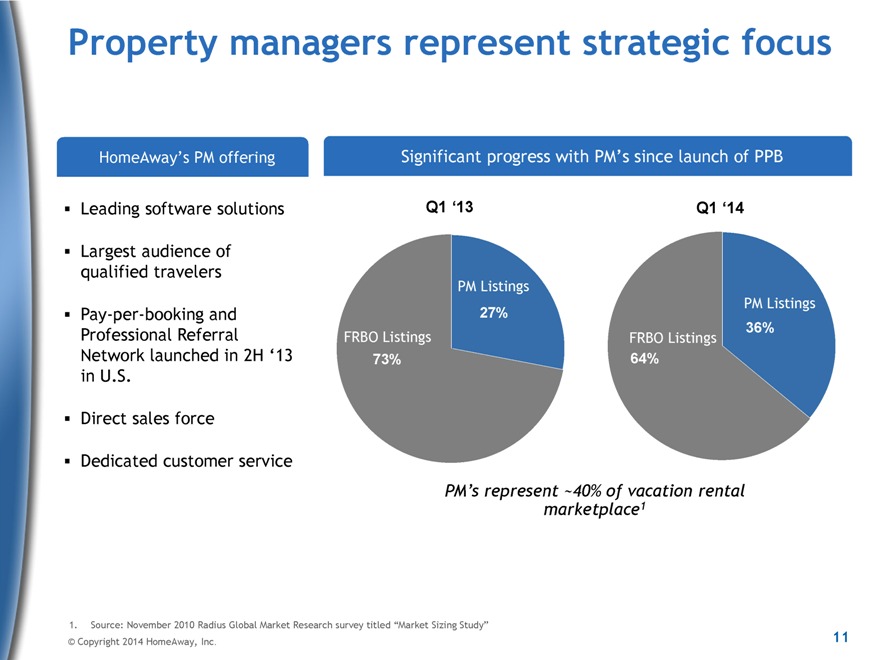
Property managers represent strategic focus
HomeAway’s PM offering
Leading software solutions
Largest audience of qualified travelers
Pay-per-booking and Professional Referral Network launched in 2H ‘13 in U.S.
Direct sales force
Dedicated customer service
Significant progress with PM’s since launch of PPB
Q1 ‘13
PM Listings
27%
FRBO Listings
73%
Q1 ‘14
PM Listings
64% 36%
FRBO Listings
64%
PM’s represent ~40% of vacation rental marketplace1
1. Source: November 2010 Radius Global Market Research survey titled “Market Sizing Study”
© Copyright 2014 HomeAway, Inc.
11
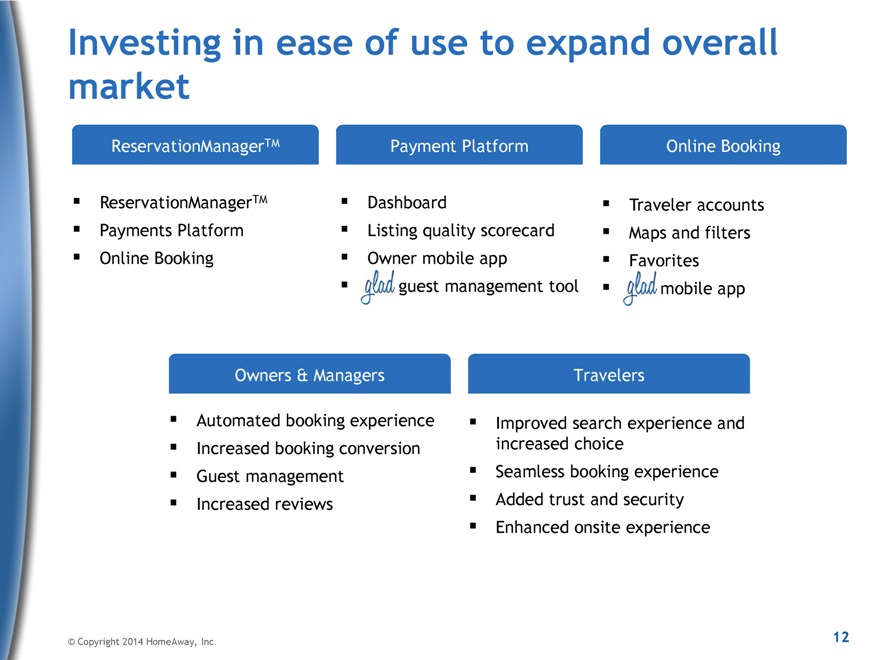
Investing in ease of use to expand overall market
ReservationManagerTM
ReservationManagerTM Payments Platform Online Booking
Payment Platform
Dashboard
Listing quality scorecard Owner mobile app glad guest management tool
Online Booking
Traveler accounts Maps and filters Favorites glad mobile app
Owners & Managers
Automated booking experience Increased booking conversion Guest management Increased reviews
Travelers
Improved search experience and increased choice Seamless booking experience Added trust and security Enhanced onsite experience
© Copyright 2014 HomeAway, Inc. 12
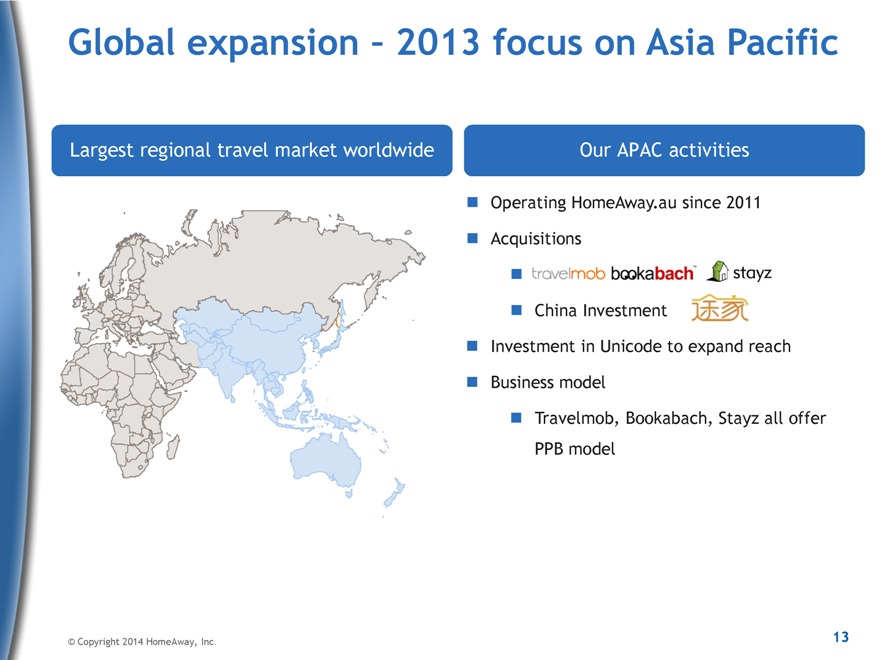
Global expansion – 2013 focus on Asia Pacific
Largest regional travel market worldwide
Our APAC activities
Operating HomeAway.au since 2011 Acquisitions
China Investment
Investment in Unicode to expand reach Business model Travelmob, Bookabach, Stayz all offer PPB model
© Copyright 2014 HomeAway, Inc. 13
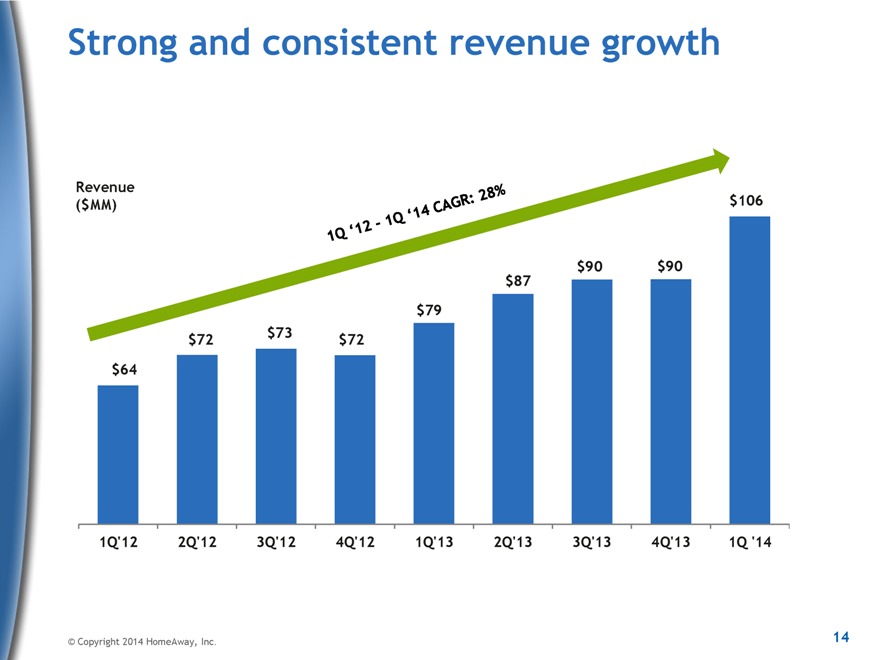
Strong and consistent revenue growth
Revenue $106
($MM)
$90 $90 $87 $79
$72 $73 $72 $64
1Q’12 2Q’12 3Q’12 4Q’12 1Q’13 2Q’13 3Q’13 4Q’13 1Q ‘14
© Copyright 2014 HomeAway, Inc. 14
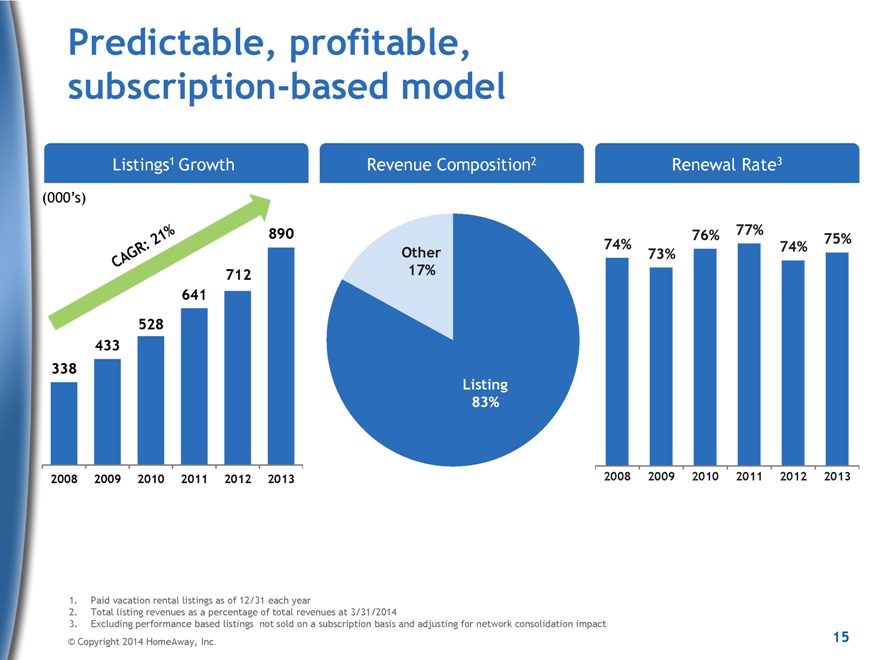
Predictable, profitable, subscription-based model
Listings1 Growth
(000’s)
890
712 641 528 433 338
2008 2009 2010 2011 2012 2013
Revenue Composition2
Other 17%
Listing 83%
Renewal Rate3
76% 77%
74% 75% 74% 73%
2008 2009 2010 2011 2012 2013
1. Paid vacation rental listings as of 12/31 each year
2. Total listing revenues as a percentage of total revenues at 3/31/2014
3. Excluding performance based listings not sold on a subscription basis and adjusting for network consolidation impact
© Copyright 2014 HomeAway, Inc. 15
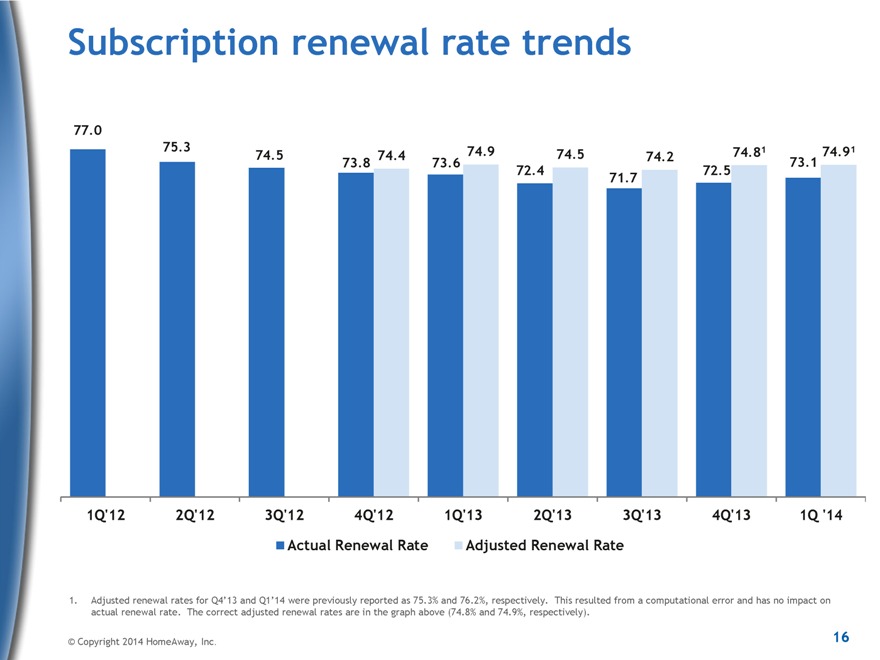
Subscription renewal rate trends
77.0
75.3 74.9 74.81 74.91
74.5 74.4 74.5 74.2
73.8 73.6 73.1
72.4 72.5
71.7
1Q’12 2Q’12 3Q’12 4Q’12 1Q’13 2Q’13 3Q’13 4Q’13 1Q ‘14 Actual Renewal Rate Adjusted Renewal Rate
1. Adjusted renewal rates for Q4’13 and Q1’14 were previously reported as 75.3% and 76.2%, respectively. This resulted from a computational error and has no impact on actual renewal rate. The correct adjusted renewal rates are in the graph above (74.8% and 74.9%, respectively).
© Copyright 2014 HomeAway, Inc. 16
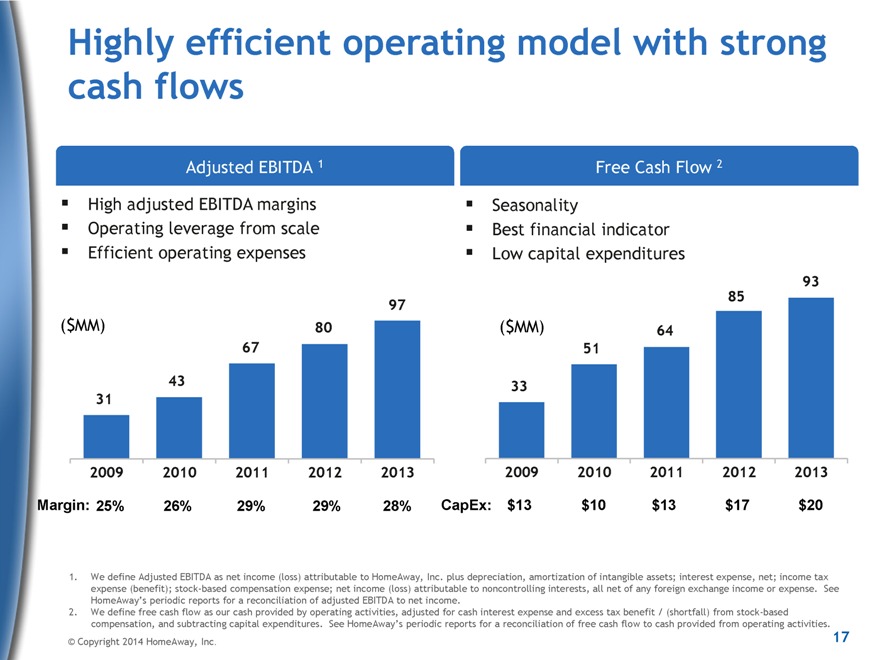
Highly efficient operating model with strong cash flows
Adjusted EBITDA 1 High adjusted EBITDA margins Operating leverage from scale Efficient operating expenses
97
($MM) 80 67
43 31
2009 2010 2011 2012 2013
Margin: 25% 26% 29% 29% 28%
Free Cash Flow 2
Seasonality
Best financial indicator Low capital expenditures
93 85
($MM) 64 51
33
2009 2010 2011 2012 2013
CapEx: $13 $10 $13 $17 $20
1. We define Adjusted EBITDA as net income (loss) attributable to HomeAway, Inc. plus depreciation, amortization of intangible assets; interest expense, net; income tax expense (benefit); stock-based compensation expense; net income (loss) attributable to noncontrolling interests, all net of any foreign exchange income or expense. See HomeAway’s periodic reports for a reconciliation of adjusted EBITDA to net income.
2. We define free cash flow as our cash provided by operating activities, adjusted for cash interest expense and excess tax benefit / (shortfall) from stock-based compensation, and subtracting capital expenditures. See HomeAway’s periodic reports for a reconciliation of free cash flow to cash provided from operating activities.
© Copyright 2014 HomeAway, Inc. 17
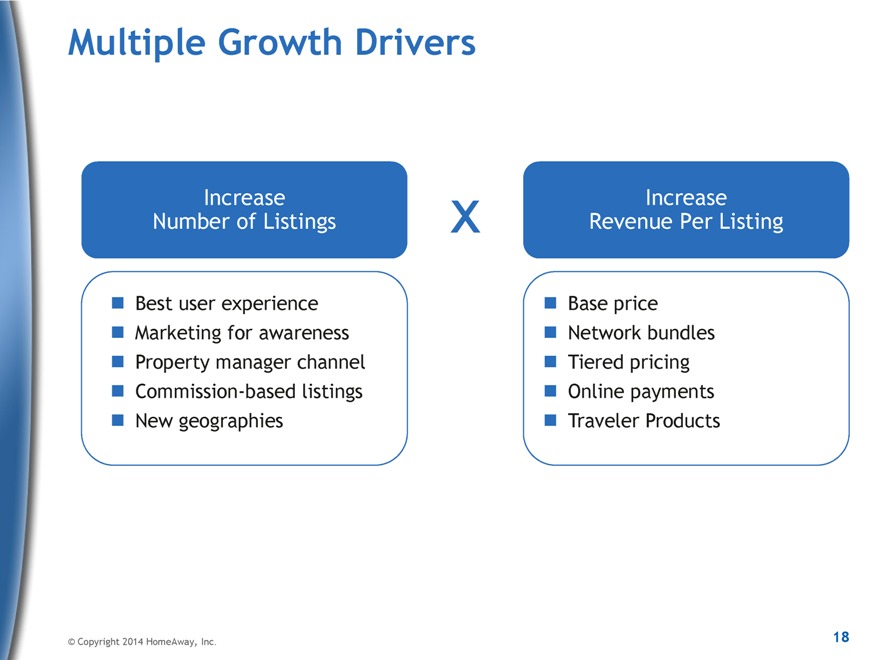
Multiple Growth Drivers
Increase Number of Listings
Best user experience Marketing for awareness Property manager channel Commission-based listings New geographies
Increase Revenue Per Listing
Base price Network bundles Tiered pricing Online payments Traveler Products
© Copyright 2014 HomeAway, Inc. 18
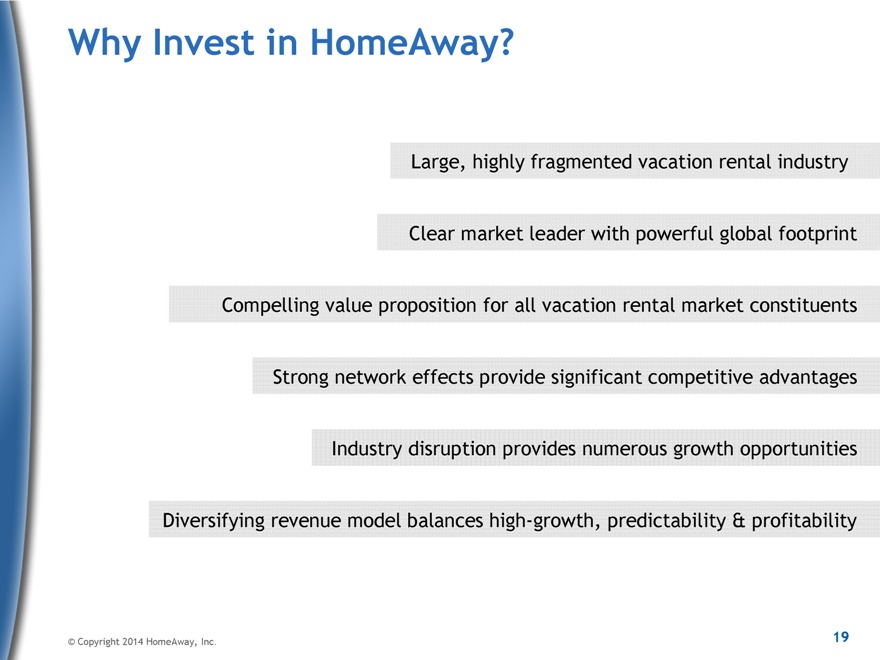
Why Invest in HomeAway?
Large, highly fragmented vacation rental industry Clear market leader with powerful global footprint Compelling value proposition for all vacation rental market constituents Strong network effects provide significant competitive advantages Industry disruption provides numerous growth opportunities Diversifying revenue model balances high-growth, predictability & profitability
© Copyright 2014 HomeAway, Inc. 19