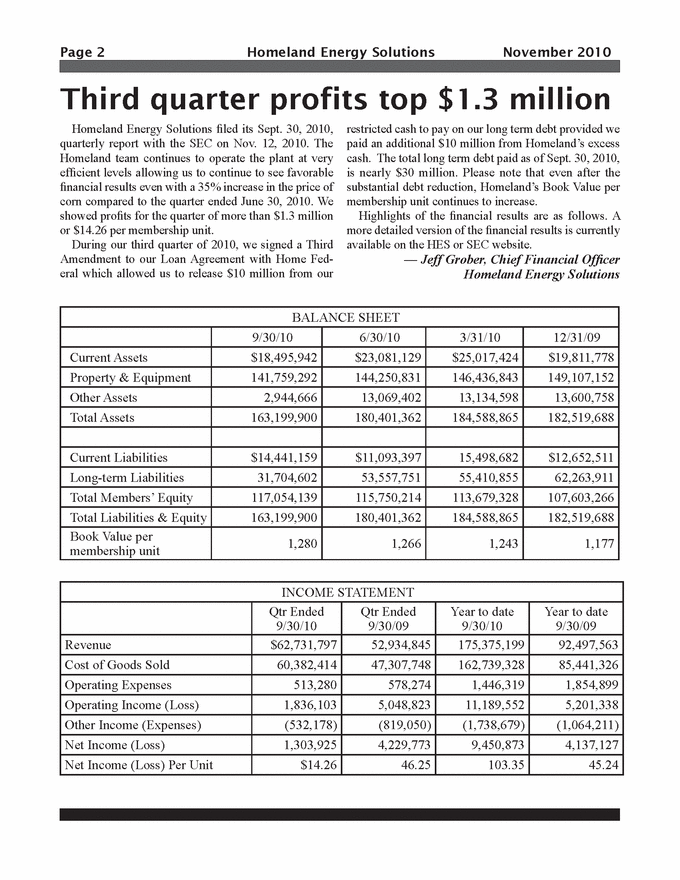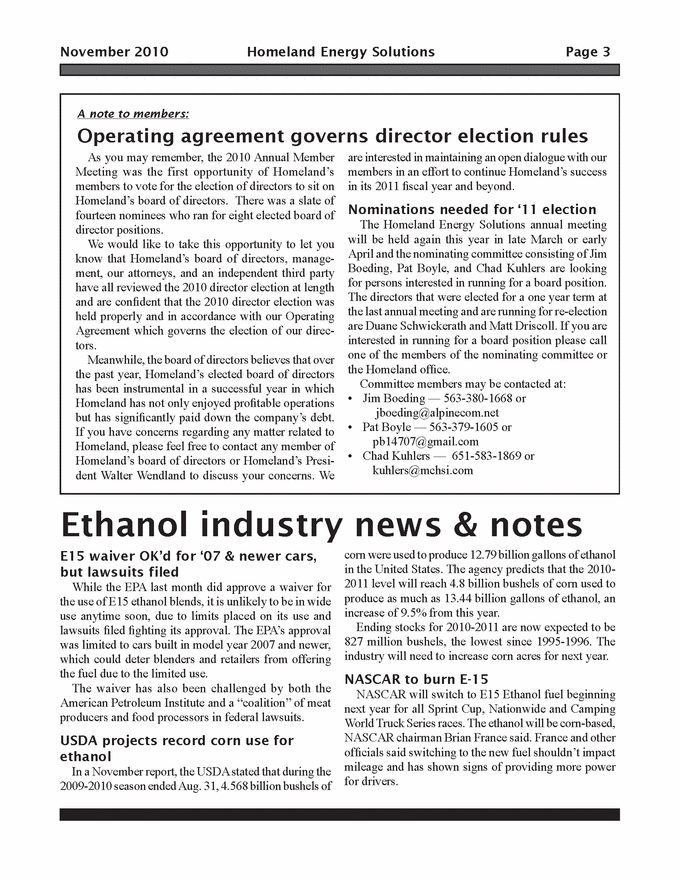
| Third quarter profits top $1.3 million Homeland Energy Solutions filed its Sept. 30, 2010, quarterly report with the SEC on Nov. 12, 2010. The Homeland team continues to operate the plant at very efficient levels allowing us to continue to see favorable financial results even with a 35% increase in the price of corn compared to the quarter ended June 30, 2010. We showed profits for the quarter of more than $1.3 million or $14.26 per membership unit. During our third quarter of 2010, we signed a Third Amendment to our Loan Agreement with Home Federal which allowed us to release $10 million from our restricted cash to pay on our long term debt provided we paid an additional $10 million from Homeland’s excess cash. The total long term debt paid as of Sept. 30, 2010, is nearly $30 million. Please note that even after the substantial debt reduction, Homeland’s Book Value per membership unit continues to increase. Highlights of the financial results are as follows. A more detailed version of the financial results is currently available on the HES or SEC website. — Jeff Grober, Chief Financial Officer Homeland Energy Solutions BALANCE SHEET 9/30/10 6/30/10 3/31/10 12/31/09 Current Assets $ 18,495,942 $ 23,081,129 $ 25,017,424 $ 19,811,778 Property & Equipment 141,759,292 144,250,831 146,436,843 149,107,152 Other Assets 2,944,666 13,069,402 13,134,598 13,600,758 Total Assets 163,199,900 180,401,362 184,588,865 182,519,688 Current Liabilities $ 14,441,159 $ 11,093,397 15,498,682 $ 12,652,511 Long-term Liabilities 31,704,602 53,557,751 55,410,855 62,263,911 Total Members’ Equity 117,054,139 115,750,214 113,679,328 107,603,266 Total Liabilities & Equity 163,199,900 180,401,362 184,588,865 182,519,688 Book Value per membership unit 1,280 1,266 1,243 1,177 INCOME STATEMENT Qtr Ended Qtr Ended Year to date Year to date 9/30/10 9/30/09 9/30/10 9/30/09 Revenue $ 62,731,797 52,934,845 175,375,199 92,497,563 Cost of Goods Sold 60,382,414 47,307,748 162,739,328 85,441,326 Operating Expenses 513,280 578,274 1,446,319 1,854,899 Operating Income (Loss) 1,836,103 5,048,823 11,189,552 5,201,338 Other Income (Expenses) (532,178 ) (819,050 ) (1,738,679 ) (1,064,211 ) Net Income (Loss) 1,303,925 4,229,773 9,450,873 4,137,127 Net Income (Loss) Per Unit $ 14.26 46.25 103.35 45.24 |


