
Earnings Call Presentation 2013 March 10, 2014
Safe Harbor Language This press release contains certain statements that are “forward - looking statements” within the meaning of the Private Securities Litigation Reform Act of 1995 . These forward - looking statements are based on current expectations and assumptions that are subject to risks and uncertainties which may cause actual results to differ materially from the forward - looking statements . Forward - looking statements, such as the statements regarding our expectations with respect to actions by the FCC, future increases in our revenue and profitability and other statements contained in this release regarding matters that are not historical facts, involve predictions . Any forward - looking statements made in this press release are accurate as of the date made and are not guarantees of future performance . Actual results or developments may differ materially from the expectations expressed or implied in the forward - looking statements, and we undertake no obligation to update any such statements . Additional information on factors that could influence our financial results is included in our filings with the Securities and Exchange Commission, including our Annual Report on Form 10 - K, Quarterly Reports on Form 10 - Q and Current Reports on Form 8 - K . 1

2013 Highlights 2 March 2014 2013 represented a successful turnaround year for Globalstar – Company completed constellation restoration, materially improved its balance sheet and made significant progress on the spectrum proceeding March 2013 ● Required COFACE Facility restructuring including principal schedule, covenants and default status ● Successfully exchanged 5.75% Notes in May 2013 ● Approaching $71.8 million 5.75% Notes put date of April 2013 ● Amended and Restated Facility Agreement effective August 2013 – improved financial covenants, repayment profile, default status ● Liquidity uncertainty and unresolved vendor amendment requirements ● $85 million Thermo backstop, material vendor amendments and agreements ● Recent financial performance recovery ● Accelerating financial performance ● Initial Duplex resurgence ● Meaningful revival of Duplex operations and MSS market share improvement ● Successful launch of Second - Generation constellation, however, awaiting full service restoration ● All Second - Generation satellites providing service by August 2013 ● R&D efforts for new product rollout ● Released SPOT Global Phone, SPOT Gen3, SPOT Trace, STX3 and introduced Sat - Fi Liquidity & Balance Sheet Operational ● Uncertain regulatory pathway ● FCC NPRM Released on November 1, 2013 – future process timing defined Spectrum Proceeding
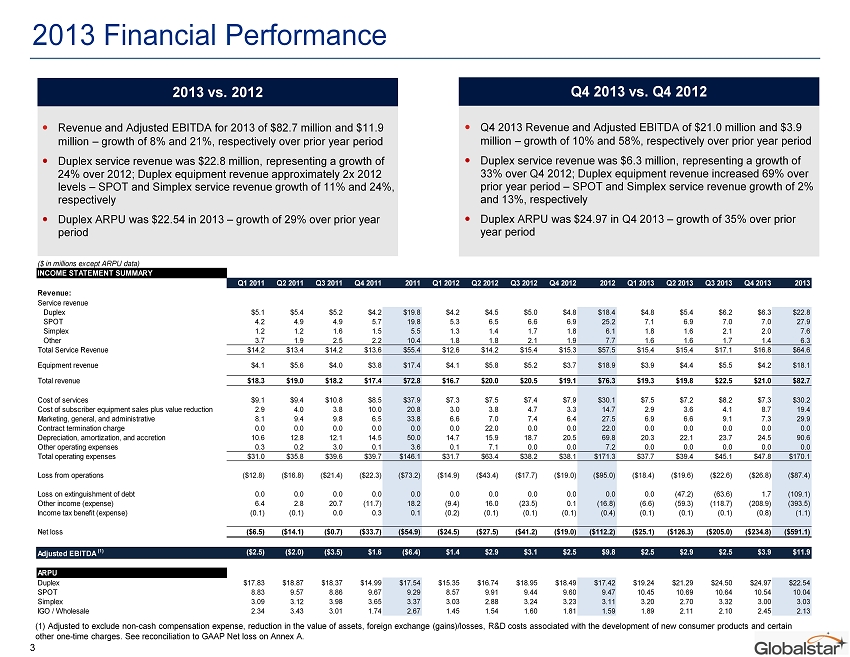
2013 Financial Performance Revenue and Adjusted EBITDA for 2013 of $82.7 million and $11.9 million – growth of 8% and 21%, respectively over prior year period Duplex service revenue was $22.8 million, representing a growth of 24% over 2012; Duplex equipment revenue approximately 2x 2012 levels – SPOT and Simplex service revenue growth of 11% and 24%, respectively Duplex ARPU was $22.54 in 2013 – growth of 29% over prior year period 3 (1) Adjusted to exclude non - cash compensation expense, reduction in the value of assets, foreign exchange (gains)/losses, R&D co sts associated with the development of new consumer products and certain other one - time charges. See reconciliation to GAAP Net loss on Annex A. ($ in millions except ARPU data) INCOME STATEMENT SUMMARY Q1 2011 Q2 2011 Q3 2011 Q4 2011 2011 Q1 2012 Q2 2012 Q3 2012 Q4 2012 2012 Q1 2013 Q2 2013 Q3 2013 Q4 2013 2013 Revenue: Service revenue Duplex $5.1 $5.4 $5.2 $4.2 $19.8 $4.2 $4.5 $5.0 $4.8 $18.4 $4.8 $5.4 $6.2 $6.3 $22.8 SPOT 4.2 4.9 4.9 5.7 19.8 5.3 6.5 6.6 6.9 25.2 7.1 6.9 7.0 7.0 27.9 Simplex 1.2 1.2 1.6 1.5 5.5 1.3 1.4 1.7 1.8 6.1 1.8 1.6 2.1 2.0 7.6 Other 3.7 1.9 2.5 2.2 10.4 1.8 1.8 2.1 1.9 7.7 1.6 1.6 1.7 1.4 6.3 Total Service Revenue $14.2 $13.4 $14.2 $13.6 $55.4 $12.6 $14.2 $15.4 $15.3 $57.5 $15.4 $15.4 $17.1 $16.8 $64.6 Equipment revenue $4.1 $5.6 $4.0 $3.8 $17.4 $4.1 $5.8 $5.2 $3.7 $18.9 $3.9 $4.4 $5.5 $4.2 $18.1 Total revenue $18.3 $19.0 $18.2 $17.4 $72.8 $16.7 $20.0 $20.5 $19.1 $76.3 $19.3 $19.8 $22.5 $21.0 $82.7 Cost of services $9.1 $9.4 $10.8 $8.5 $37.9 $7.3 $7.5 $7.4 $7.9 $30.1 $7.5 $7.2 $8.2 $7.3 $30.2 Cost of subscriber equipment sales plus value reduction 2.9 4.0 3.8 10.0 20.8 3.0 3.8 4.7 3.3 14.7 2.9 3.6 4.1 8.7 19.4 Marketing, general, and administrative 8.1 9.4 9.8 6.5 33.8 6.6 7.0 7.4 6.4 27.5 6.9 6.6 9.1 7.3 29.9 Contract termination charge 0.0 0.0 0.0 0.0 0.0 0.0 22.0 0.0 0.0 22.0 0.0 0.0 0.0 0.0 0.0 Depreciation, amortization, and accretion 10.6 12.8 12.1 14.5 50.0 14.7 15.9 18.7 20.5 69.8 20.3 22.1 23.7 24.5 90.6 Other operating expenses 0.3 0.2 3.0 0.1 3.6 0.1 7.1 0.0 0.0 7.2 0.0 0.0 0.0 0.0 0.0 Total operating expenses $31.0 $35.8 $39.6 $39.7 $146.1 $31.7 $63.4 $38.2 $38.1 $171.3 $37.7 $39.4 $45.1 $47.8 $170.1 Loss from operations ($12.8) ($16.8) ($21.4) ($22.3) ($73.2) ($14.9) ($43.4) ($17.7) ($19.0) ($95.0) ($18.4) ($19.6) ($22.6) ($26.8) ($87.4) Loss on extinguishment of debt 0.0 0.0 0.0 0.0 0.0 0.0 0.0 0.0 0.0 0.0 0.0 (47.2) (63.6) 1.7 (109.1) Other income (expense) 6.4 2.8 20.7 (11.7) 18.2 (9.4) 16.0 (23.5) 0.1 (16.8) (6.6) (59.3) (118.7) (208.9) (393.5) Income tax benefit (expense) (0.1) (0.1) 0.0 0.3 0.1 (0.2) (0.1) (0.1) (0.1) (0.4) (0.1) (0.1) (0.1) (0.8) (1.1) Net loss ($6.5) ($14.1) ($0.7) ($33.7) ($54.9) ($24.5) ($27.5) ($41.2) ($19.0) ($112.2) ($25.1) ($126.3) ($205.0) ($234.8) ($591.1) Adjusted EBITDA (1) ($2.5) ($2.0) ($3.5) $1.6 ($6.4) $1.4 $2.9 $3.1 $2.5 $9.8 $2.5 $2.9 $2.5 $3.9 $11.9 ARPU Duplex $17.83 $18.87 $18.37 $14.99 $17.54 $15.35 $16.74 $18.95 $18.49 $17.42 $19.24 $21.29 $24.50 $24.97 $22.54 SPOT 8.83 9.57 8.86 9.67 9.29 8.57 9.91 9.44 9.60 9.47 10.45 10.69 10.64 10.54 10.04 Simplex 3.09 3.12 3.98 3.65 3.37 3.03 2.88 3.24 3.23 3.11 3.20 2.70 3.32 3.00 3.03 IGO / Wholesale 2.34 3.43 3.01 1.74 2.67 1.45 1.54 1.60 1.81 1.59 1.89 2.11 2.10 2.45 2.13 Q4 2013 Revenue and Adjusted EBITDA of $21.0 million and $3.9 million – growth of 10% and 58%, respectively over prior year period Duplex service revenue was $6.3 million, representing a growth of 33% over Q4 2012; Duplex equipment revenue increased 69% over prior year period – SPOT and Simplex service revenue growth of 2% and 13%, respectively Duplex ARPU was $24.97 in Q4 2013 – growth of 35% over prior year period 2013 vs. 2012 Q4 2013 vs. Q4 2012
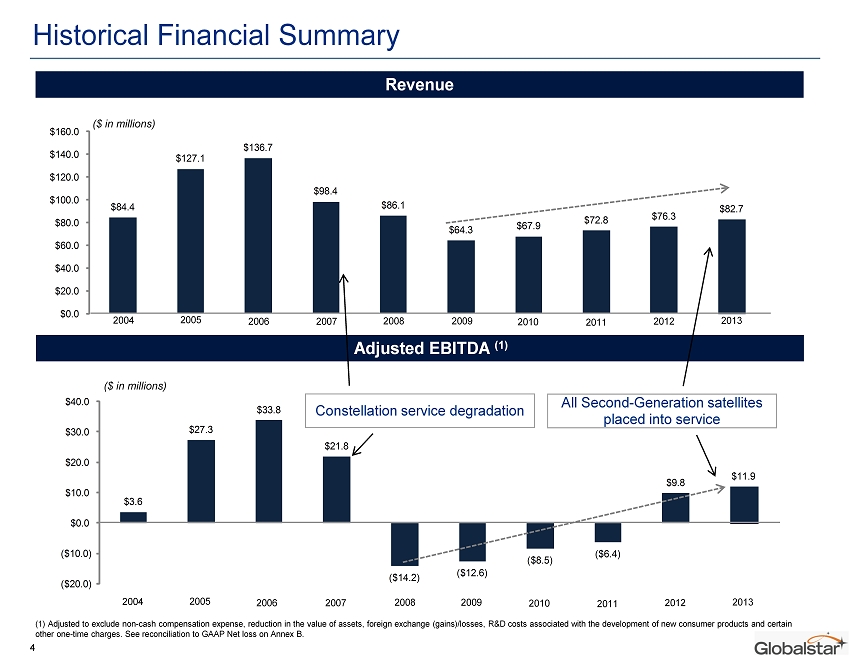
Historical Financial Summary 4 Revenue Adjusted EBITDA (1) $84.4 $127.1 $136.7 $98.4 $86.1 $64.3 $67.9 $72.8 $76.3 $82.7 $0.0 $20.0 $40.0 $60.0 $80.0 $100.0 $120.0 $140.0 $160.0 $3.6 $27.3 $33.8 $21.8 ($14.2) ($12.6) ($8.5) ($6.4) $9.8 $11.9 ($20.0) ($10.0) $0.0 $10.0 $20.0 $30.0 $40.0 ($ in millions) ($ in millions) 2006 2007 2008 2009 2010 2011 2005 2004 2012 2013 2006 2007 2008 2009 2010 2011 2005 2004 2012 2013 Constellation service degradation All Second - Generation satellites placed into service (1) Adjusted to exclude non - cash compensation expense, reduction in the value of assets, foreign exchange (gains)/losses, R&D co sts associated with the development of new consumer products and certain other one - time charges. See reconciliation to GAAP Net loss on Annex B.
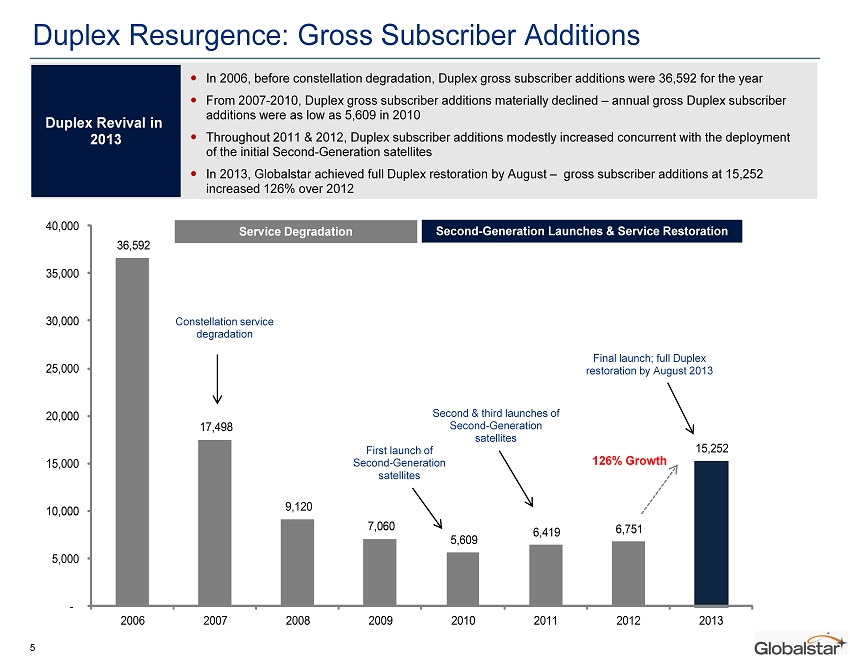
5 Duplex Resurgence: Gross Subscriber Additions 36,592 17,498 9,120 7,060 5,609 6,419 6,751 15,252 - 5,000 10,000 15,000 20,000 25,000 30,000 35,000 40,000 2006 2007 2008 2009 2010 2011 2012 2013 Constellation service degradation Second - Generation Launches & Service Restoration Service Degradation 126% Growth First launch of Second - Generation satellites Second & third launches of Second - Generation satellites Final launch; full Duplex restoration by August 2013 In 2006, before constellation degradation, Duplex gross subscriber additions were 36,592 for the year From 2007 - 2010, Duplex gross subscriber additions materially declined – annual gross Duplex subscriber additions were as low as 5,609 in 2010 Throughout 2011 & 2012, Duplex subscriber additions modestly increased concurrent with the deployment of the initial Second - Generation satellites In 2013, Globalstar achieved full Duplex restoration by August – gross subscriber additions at 15,252 increased 126% over 2012 Duplex Revival in 2013
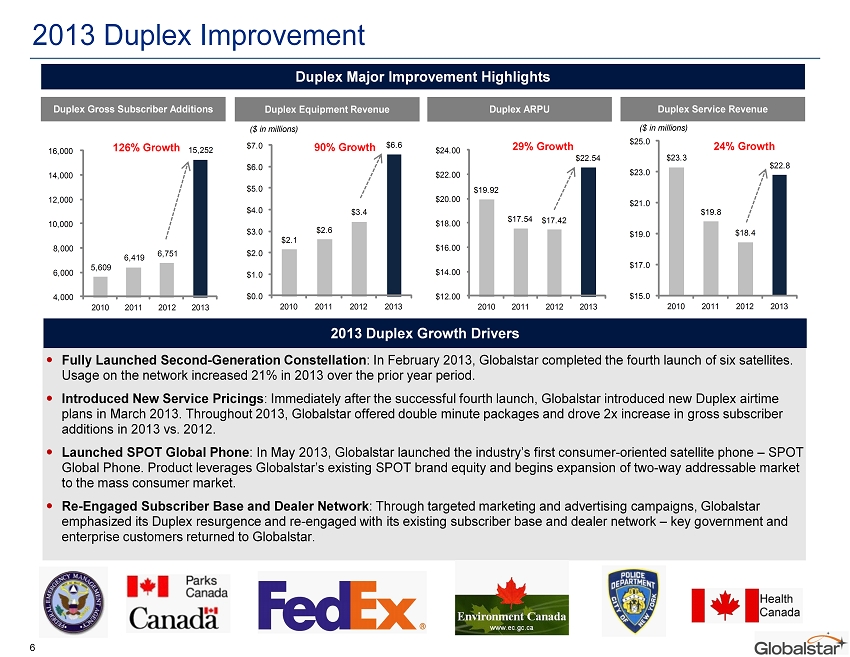
$2.1 $2.6 $3.4 $6.6 $0.0 $1.0 $2.0 $3.0 $4.0 $5.0 $6.0 $7.0 2010 2011 2012 2013 $23.3 $19.8 $18.4 $22.8 $15.0 $17.0 $19.0 $21.0 $23.0 $25.0 2010 2011 2012 2013 2013 Duplex Improvement 6 ($ in millions) 24% Growth 90% Growth Duplex Major Improvement Highlights ($ in millions) $19.92 $17.54 $17.42 $22.54 $12.00 $14.00 $16.00 $18.00 $20.00 $22.00 $24.00 2010 2011 2012 2013 29% Growth 2013 Duplex Growth Drivers Fully Launched Second - Generation Constellation : In February 2013, Globalstar completed the fourth launch of six satellites. Usage on the network increased 21% in 2013 over the prior year period. Introduced New Service Pricings : Immediately after the successful fourth launch, Globalstar introduced new Duplex airtime plans in March 2013. Throughout 2013, Globalstar offered double minute packages and drove 2x increase in gross subscriber additions in 2013 vs. 2012. Launched SPOT Global Phone : In May 2013, Globalstar launched the industry’s first consumer - oriented satellite phone – SPOT Global Phone. Product leverages Globalstar’s existing SPOT brand equity and begins expansion of two - way addressable market to the mass consumer market. Re - Engaged Subscriber Base and Dealer Network : Through targeted marketing and advertising campaigns, Globalstar emphasized its Duplex resurgence and re - engaged with its existing subscriber base and dealer network – key government and enterprise customers returned to Globalstar. 5,609 6,419 6,751 15,252 4,000 6,000 8,000 10,000 12,000 14,000 16,000 2010 2011 2012 2013 126% Growth Duplex Gross Subscriber Additions Duplex Equipment Revenue Duplex ARPU Duplex Service Revenue
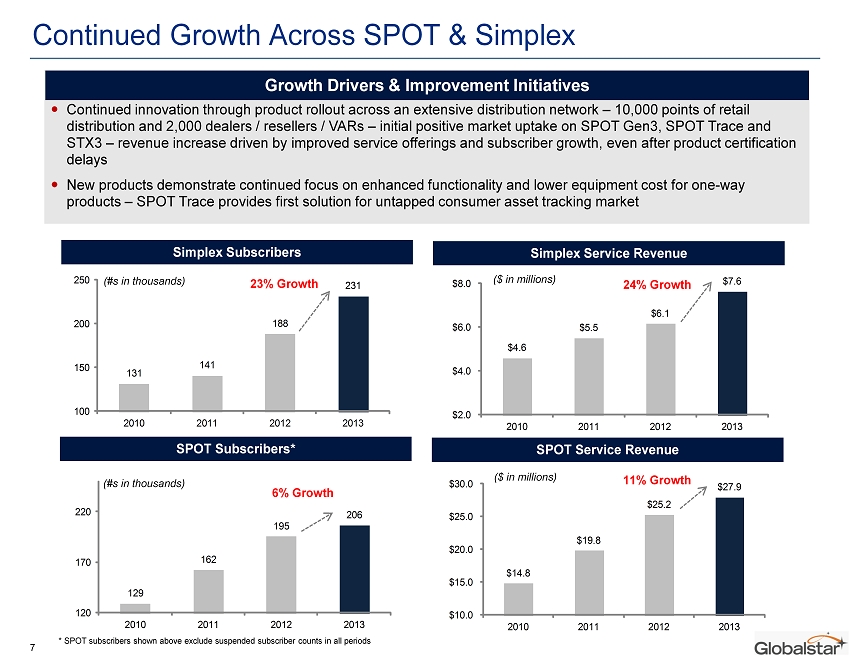
131 141 188 231 100 150 200 250 2010 2011 2012 2013 Continued Growth Across SPOT & Simplex 7 Continued innovation through product rollout across an extensive distribution network – 10,000 points of retail distribution and 2,000 dealers / resellers / VARs – initial positive market uptake on SPOT Gen3, SPOT Trace and STX3 – revenue increase driven by improved service offerings and subscriber growth, even after product certification delays New products demonstrate continued focus on enhanced functionality and lower equipment cost for one - way products – SPOT Trace provides first solution for untapped consumer asset tracking market Growth Drivers & Improvement Initiatives 23% Growth ($ in millions) Simplex Subscribers Simplex Service Revenue SPOT Subscribers* SPOT Service Revenue * SPOT subscribers shown above exclude suspended subscriber counts in all periods 129 162 195 206 120 170 220 2010 2011 2012 2013 $4.6 $5.5 $6.1 $7.6 $2.0 $4.0 $6.0 $8.0 2010 2011 2012 2013 $14.8 $19.8 $25.2 $27.9 $10.0 $15.0 $20.0 $25.0 $30.0 2010 2011 2012 2013 ($ in millions) 24% Growth 6% Growth 11% Growth (#s in thousands) (#s in thousands)
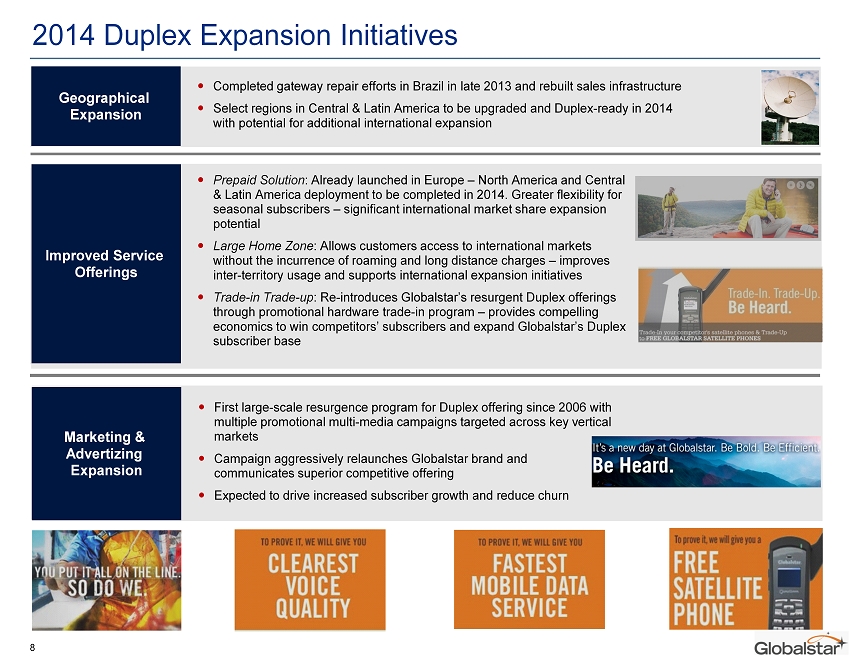
2014 Duplex Expansion Initiatives 8 Geographical Expansion Improved Service Offerings Marketing & Advertizing Expansion Completed gateway repair efforts in Brazil in late 2013 and rebuilt sales infrastructure Select regions in Central & Latin America to be upgraded and Duplex - ready in 2014 with potential for additional international expansion Prepaid Solution : Already launched in Europe – North America and Central & Latin America deployment to be completed in 2014. Greater flexibility for seasonal subscribers – significant international market share expansion potential Large Home Zone : Allows customers access to international markets without the incurrence of roaming and long distance charges – improves inter - territory usage and supports international expansion initiatives Trade - in Trade - up : Re - introduces Globalstar’s resurgent Duplex offerings through promotional hardware trade - in program – provides compelling economics to win competitors’ subscribers and expand Globalstar’s Duplex subscriber base First large - scale resurgence program for Duplex offering since 2006 with multiple promotional multi - media campaigns targeted across key vertical markets Campaign aggressively relaunches Globalstar brand and communicates superior competitive offering Expected to drive increased subscriber growth and reduce churn

Revenue Adjusted EBITDA(1) 8.4% 20.7% (0.2%) (2.3%) Inmarsat (2) (2.2%) (0.5%) Constellation Network Status Architecture Fully launched LEO - Bent Pipe Launches b/w 2015 - 2017 LEO - Cross Links Launches in Progress GEO Most Economical Minutes Service $ per Postpaid Plan Included Fee minute Orbit 200 200 $99.99 $0.50 Monthly 250 250 265.00 1.06 Monhtly 100 100 99.95 1.00 YoY Growth Globalstar’s Competitive Environment 9 Globalstar’s competitive positioning has materially improved – Company poised to expand market share through network improvements and inexpensive service offerings Source: Company filings, press releases, websites including satphonestore.com (1) Adjusted EBITDA growth has been calculated using Globalstar’s Adjusted EBITDA, Inmarsat’s Adjusted EBITDA and Iridium’s Operational EBITDA. (2) Inmarsat’s Revenue and Adjusted EBITDA as displayed above exclude LightSquared contribution; however, including LightSquared , Inmarsat’s Revenue and Adjusted EBITDA declined by 5.7% and 6.6%, respectively, over 2012. (3) The airtime pricing comparison tabulated above excludes overage considerations and only incorporates the minutes bundled wit h the plan. The competitor pricings have been obtained from satphonestore.com. Recent Financial Results ● On a year - over - year basis, Globalstar has experienced growth across its core business vis - à - vis principal competitors – Iridium and Inmarsat ● Globalstar has achieved 20.7% Adjusted EBITDA growth while competitors’ Adjusted EBITDA has declined vs. prior year period Constellation Status & Footprint ● In 2013, Globalstar launched its Second - Generation constellation years ahead of competition – last satellite placed into service in August ● Globalstar enjoys a competitive advantage with a LEO bent pipe architecture providing lowest latency and highest quality delivery service Postpaid Airtime Pricings & Mass Market Distribution ● Globalstar’s postpaid airtime pricings are much more economical than those of either competitors – most economical plans provide 50% or greater discount to competitor plans ● Globalstar is the only satellite service provider to have successfully penetrated the consumer market • Source for competitor pricing: satphonestore.com (3)
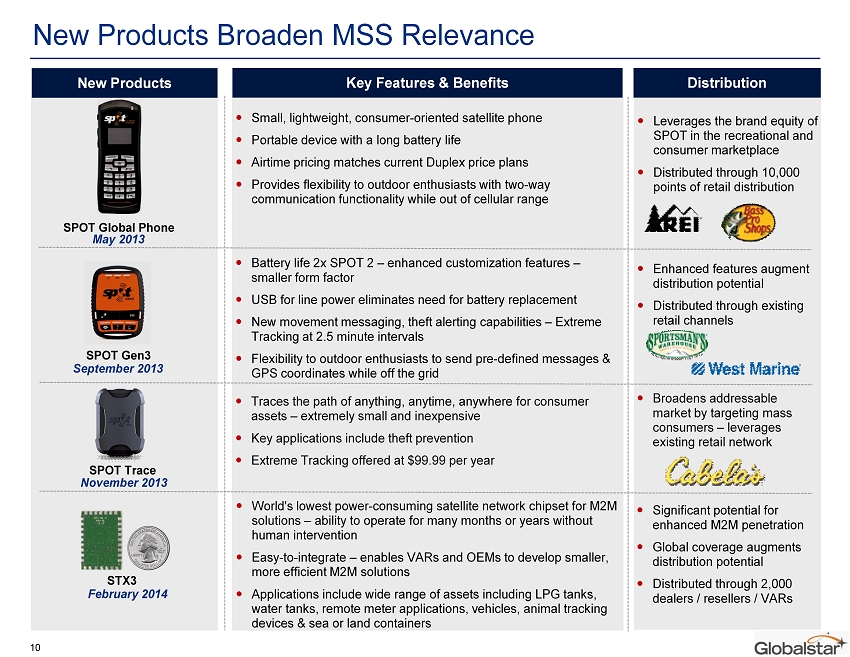
SPOT Gen3 SPOT Global Phone Small, lightweight, consumer - oriented satellite phone Portable device with a long battery life Airtime pricing matches current Duplex price plans Provides flexibility to outdoor enthusiasts with two - way communication functionality while out of cellular range SPOT Trace New Products New Products Broaden MSS Relevance 10 May 2013 September 2013 November 2013 February 2014 STX3 Key Features & Benefits Distribution Battery life 2x SPOT 2 – enhanced customization features – smaller form factor USB for line power eliminates need for battery replacement New movement messaging, theft alerting capabilities – Extreme Tracking at 2.5 minute intervals Flexibility to outdoor enthusiasts to send pre - defined messages & GPS coordinates while off the grid Traces the path of anything, anytime, anywhere for consumer assets – extremely small and inexpensive Key applications include theft prevention Extreme Tracking offered at $99.99 per year World's lowest power - consuming satellite network chipset for M2M solutions – ability to operate for many months or years without human intervention Easy - to - integrate – enables VARs and OEMs to develop smaller, more efficient M2M solutions Applications include wide range of assets including LPG tanks, water tanks, remote meter applications, vehicles, animal tracking devices & sea or land containers Leverages the brand equity of SPOT in the recreational and consumer marketplace Distributed through 10,000 points of retail distribution Enhanced features augment distribution potential Distributed through existing retail channels Broadens addressable market by targeting mass consumers – leverages existing retail network Significant potential for enhanced M2M penetration Global coverage augments distribution potential Distributed through 2,000 dealers / resellers / VARs
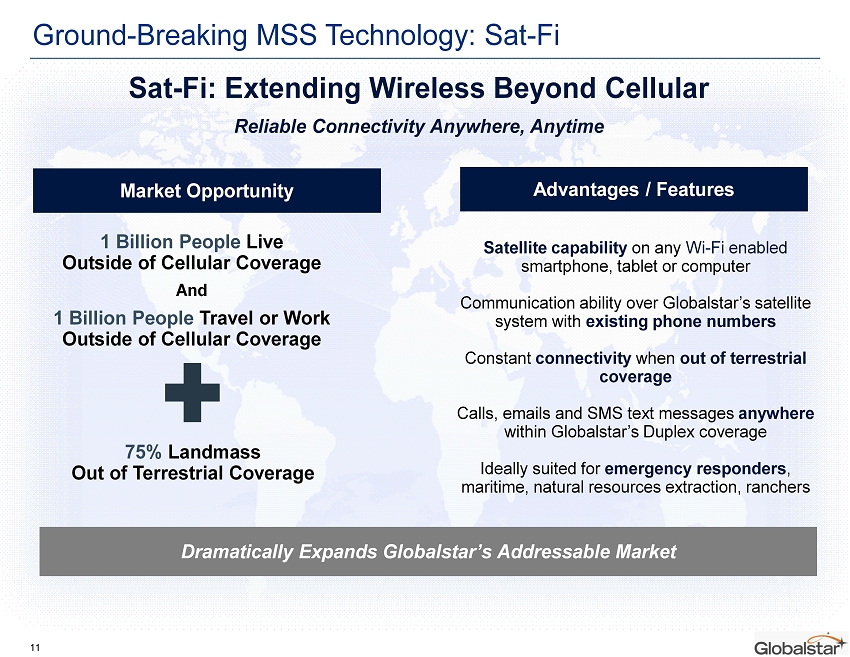
Ground - Breaking MSS Technology: Sat - Fi 11 Sat - Fi : Extending Wireless Beyond Cellular Reliable Connectivity Anywhere, Anytime Satellite capability on any Wi - Fi enabled smartphone , tablet or computer Communication ability over Globalstar’s satellite system with existing phone numbers Constant connectivity when out of terrestrial coverage Calls, emails and SMS text messages anywhere within Globalstar’s Duplex coverage Ideally suited for emergency responders , maritime, natural resources extraction, ranchers 1 Billion People Live Outside of Cellular Coverage And 1 Billion People Travel or Work Outside of Cellular Coverage 75% Landmass Out of Terrestrial Coverage Market Opportunity Advantages / Features Dramatically Expands Globalstar’s Addressable Market
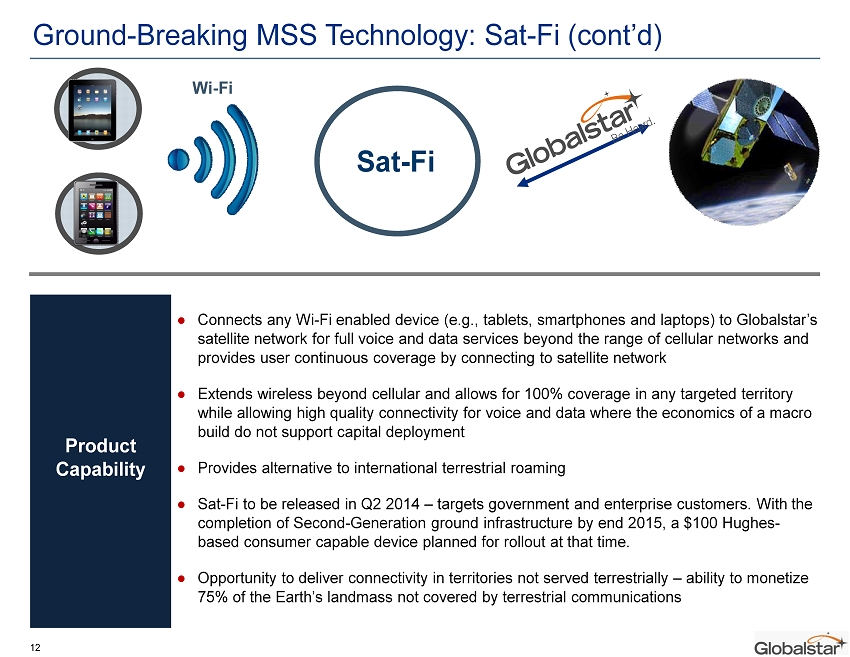
Product Capability ● Connects any Wi - Fi enabled device (e.g., tablets, smartphones and laptops) to Globalstar’s satellite network for full voice and data services beyond the range of cellular networks and provides user continuous coverage by connecting to satellite network ● Extends wireless beyond cellular and allows for 100% coverage in any targeted territory while allowing high quality connectivity for voice and data where the economics of a macro build do not support capital deployment ● Provides alternative to international terrestrial roaming ● Sat - Fi to be released in Q2 2014 – targets government and enterprise customers. With the completion of Second - Generation ground infrastructure by end 2015, a $100 Hughes - based consumer capable device planned for rollout at that time. ● Opportunity to deliver connectivity in territories not served terrestrially – ability to monetize 75% of the Earth’s landmass not covered by terrestrial communications Ground - Breaking MSS Technology: Sat - Fi (cont’d) Sat - Fi Wi - Fi 12
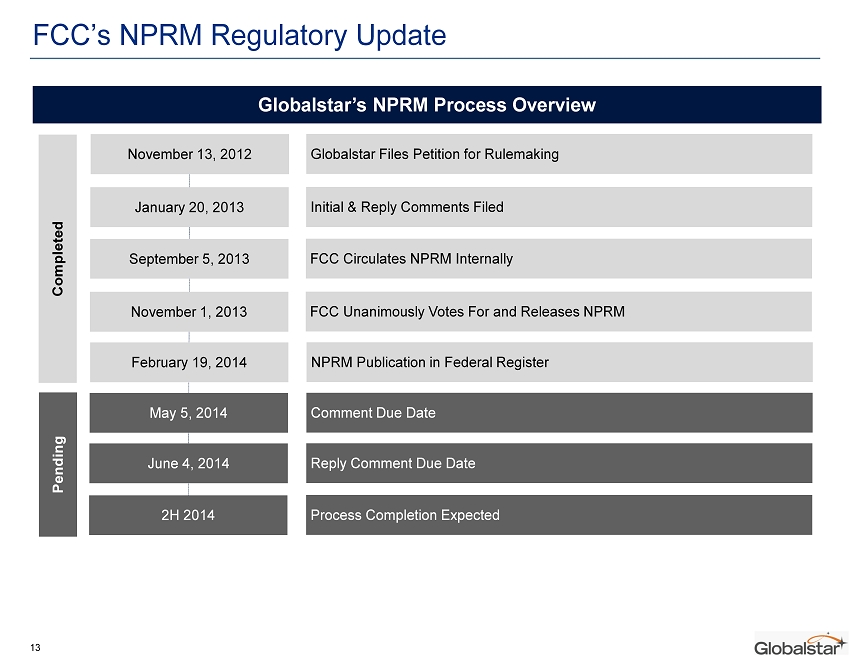
FCC’s NPRM Regulatory Update 13 Globalstar’s NPRM Process Overview November 13, 2012 Globalstar Files Petition for Rulemaking January 20, 2013 Initial & Reply Comments Filed September 5, 2013 FCC Circulates NPRM Internally November 1, 2013 FCC Unanimously Votes For and Releases NPRM February 19, 2014 NPRM Publication in Federal Register May 5, 2014 Comment Due Date June 4, 2014 Reply Comment Due Date 2H 2014 Process Completion Expected Completed Pending
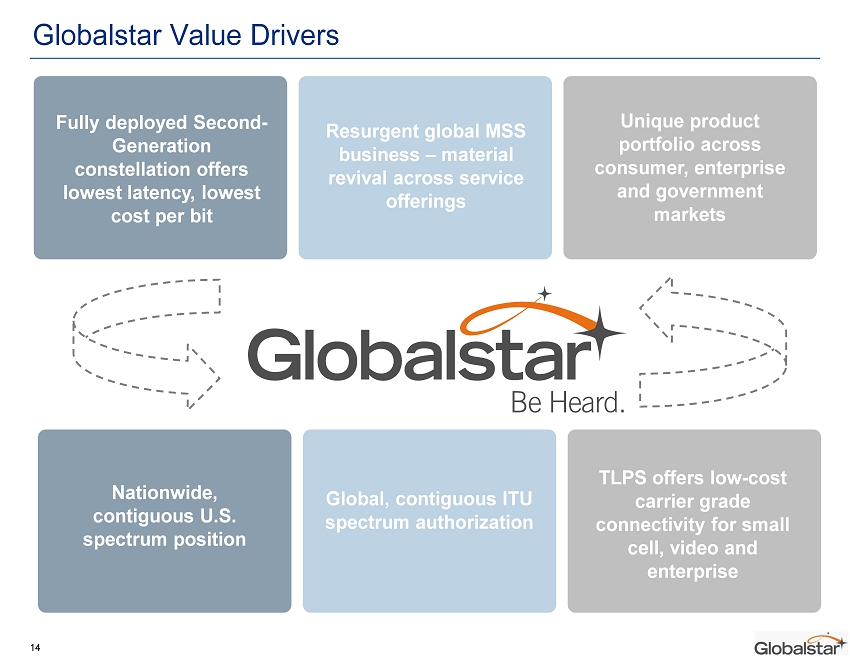
Globalstar Value Drivers Nationwide, contiguous U.S. spectrum position Global, contiguous ITU spectrum authorization TLPS offers low - cost carrier grade connectivity for small cell, video and enterprise Resurgent global MSS business – material revival across service offerings Unique product portfolio across consumer, enterprise and government markets Fully deployed Second - Generation constellation offers lowest latency, lowest cost per bit 14
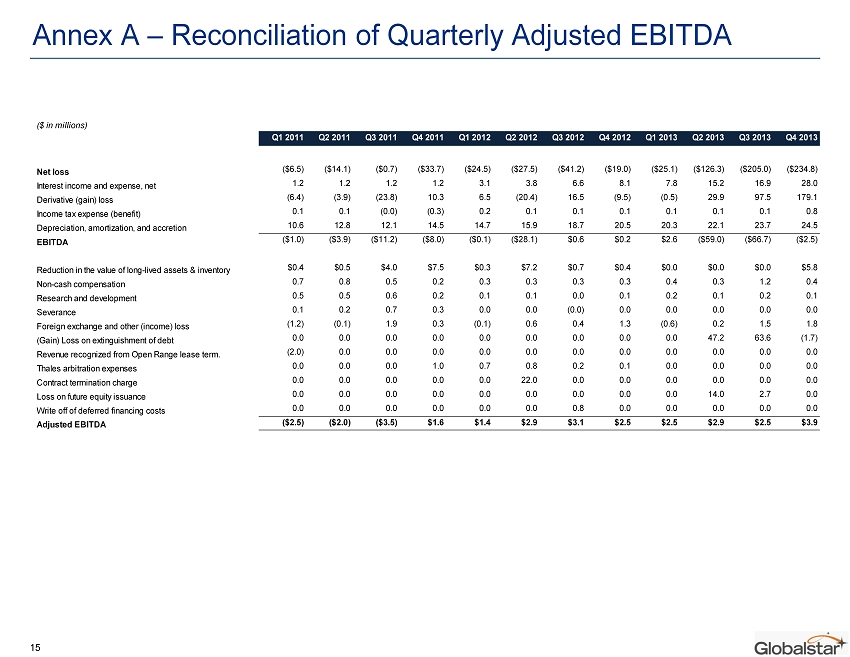
Annex A – Reconciliation of Quarterly Adjusted EBITDA 15 ($ in millions) Q1 2011 Q2 2011 Q3 2011 Q4 2011 Q1 2012 Q2 2012 Q3 2012 Q4 2012 Q1 2013 Q2 2013 Q3 2013 Q4 2013 Net loss ($6.5) ($14.1) ($0.7) ($33.7) ($24.5) ($27.5) ($41.2) ($19.0) ($25.1) ($126.3) ($205.0) ($234.8) Interest income and expense, net 1.2 1.2 1.2 1.2 3.1 3.8 6.6 8.1 7.8 15.2 16.9 28.0 Derivative (gain) loss (6.4) (3.9) (23.8) 10.3 6.5 (20.4) 16.5 (9.5) (0.5) 29.9 97.5 179.1 Income tax expense (benefit) 0.1 0.1 (0.0) (0.3) 0.2 0.1 0.1 0.1 0.1 0.1 0.1 0.8 Depreciation, amortization, and accretion 10.6 12.8 12.1 14.5 14.7 15.9 18.7 20.5 20.3 22.1 23.7 24.5 EBITDA ($1.0) ($3.9) ($11.2) ($8.0) ($0.1) ($28.1) $0.6 $0.2 $2.6 ($59.0) ($66.7) ($2.5) Reduction in the value of long-lived assets & inventory $0.4 $0.5 $4.0 $7.5 $0.3 $7.2 $0.7 $0.4 $0.0 $0.0 $0.0 $5.8 Non-cash compensation 0.7 0.8 0.5 0.2 0.3 0.3 0.3 0.3 0.4 0.3 1.2 0.4 Research and development 0.5 0.5 0.6 0.2 0.1 0.1 0.0 0.1 0.2 0.1 0.2 0.1 Severance 0.1 0.2 0.7 0.3 0.0 0.0 (0.0) 0.0 0.0 0.0 0.0 0.0 Foreign exchange and other (income) loss (1.2) (0.1) 1.9 0.3 (0.1) 0.6 0.4 1.3 (0.6) 0.2 1.5 1.8 (Gain) Loss on extinguishment of debt 0.0 0.0 0.0 0.0 0.0 0.0 0.0 0.0 0.0 47.2 63.6 (1.7) Revenue recognized from Open Range lease term. (2.0) 0.0 0.0 0.0 0.0 0.0 0.0 0.0 0.0 0.0 0.0 0.0 Thales arbitration expenses 0.0 0.0 0.0 1.0 0.7 0.8 0.2 0.1 0.0 0.0 0.0 0.0 Contract termination charge 0.0 0.0 0.0 0.0 0.0 22.0 0.0 0.0 0.0 0.0 0.0 0.0 Loss on future equity issuance 0.0 0.0 0.0 0.0 0.0 0.0 0.0 0.0 0.0 14.0 2.7 0.0 Write off of deferred financing costs 0.0 0.0 0.0 0.0 0.0 0.0 0.8 0.0 0.0 0.0 0.0 0.0 Adjusted EBITDA ($2.5) ($2.0) ($3.5) $1.6 $1.4 $2.9 $3.1 $2.5 $2.5 $2.9 $2.5 $3.9
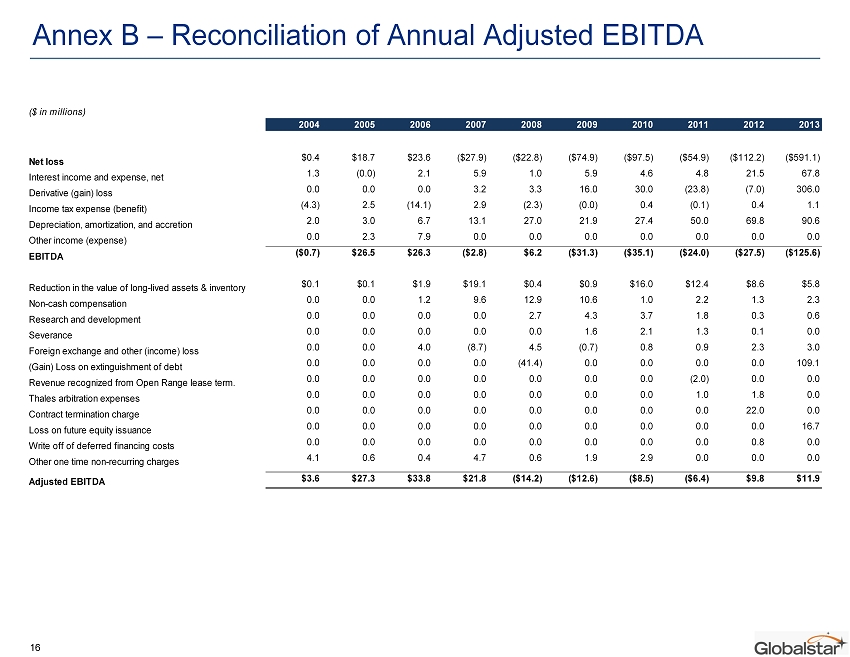
Annex B – Reconciliation of Annual Adjusted EBITDA 16 ($ in millions) 2004 2005 2006 2007 2008 2009 2010 2011 2012 2013 Net loss $0.4 $18.7 $23.6 ($27.9) ($22.8) ($74.9) ($97.5) ($54.9) ($112.2) ($591.1) Interest income and expense, net 1.3 (0.0) 2.1 5.9 1.0 5.9 4.6 4.8 21.5 67.8 Derivative (gain) loss 0.0 0.0 0.0 3.2 3.3 16.0 30.0 (23.8) (7.0) 306.0 Income tax expense (benefit) (4.3) 2.5 (14.1) 2.9 (2.3) (0.0) 0.4 (0.1) 0.4 1.1 Depreciation, amortization, and accretion 2.0 3.0 6.7 13.1 27.0 21.9 27.4 50.0 69.8 90.6 Other income (expense) 0.0 2.3 7.9 0.0 0.0 0.0 0.0 0.0 0.0 0.0 EBITDA ($0.7) $26.5 $26.3 ($2.8) $6.2 ($31.3) ($35.1) ($24.0) ($27.5) ($125.6) Reduction in the value of long-lived assets & inventory $0.1 $0.1 $1.9 $19.1 $0.4 $0.9 $16.0 $12.4 $8.6 $5.8 Non-cash compensation 0.0 0.0 1.2 9.6 12.9 10.6 1.0 2.2 1.3 2.3 Research and development 0.0 0.0 0.0 0.0 2.7 4.3 3.7 1.8 0.3 0.6 Severance 0.0 0.0 0.0 0.0 0.0 1.6 2.1 1.3 0.1 0.0 Foreign exchange and other (income) loss 0.0 0.0 4.0 (8.7) 4.5 (0.7) 0.8 0.9 2.3 3.0 (Gain) Loss on extinguishment of debt 0.0 0.0 0.0 0.0 (41.4) 0.0 0.0 0.0 0.0 109.1 Revenue recognized from Open Range lease term. 0.0 0.0 0.0 0.0 0.0 0.0 0.0 (2.0) 0.0 0.0 Thales arbitration expenses 0.0 0.0 0.0 0.0 0.0 0.0 0.0 1.0 1.8 0.0 Contract termination charge 0.0 0.0 0.0 0.0 0.0 0.0 0.0 0.0 22.0 0.0 Loss on future equity issuance 0.0 0.0 0.0 0.0 0.0 0.0 0.0 0.0 0.0 16.7 Write off of deferred financing costs 0.0 0.0 0.0 0.0 0.0 0.0 0.0 0.0 0.8 0.0 Other one time non-recurring charges 4.1 0.6 0.4 4.7 0.6 1.9 2.9 0.0 0.0 0.0 Adjusted EBITDA $3.6 $27.3 $33.8 $21.8 ($14.2) ($12.6) ($8.5) ($6.4) $9.8 $11.9