Exhibit 99.1
WWW . DAKOTAPLAINS . COM OTCQB: DAKP ANNUAL GENERAL MEETING J UNE 12, 2014
F ORWARD L OOKING S TATEMENTS Statements made by representatives of Dakota Plains Holdings, Inc . (“Dakota Plains” or the “Company”) during the course of this presentation that are not historical facts, are forward - looking statements . These statements are based on certain assumptions and expectations made by the Company which reflect management’s experience, estimates and perception of historical trends, current conditions, anticipated future developments and other factors believed to be appropriate . Such statements are subject to a number of assumptions, risks and uncertainties, many of which are beyond the control of the Company, which may cause actual results to differ materially from those implied or anticipated in the forward - looking statements . These include risks relating to global economics or politics, our ability to obtain additional capital needed to implement our business plan, minimal operating history, loss of key personnel, lack of business diversification, reliance on strategic, third - party relationships, financial performance and results, prices and demand for oil, our ability to make acquisitions on economically acceptable terms, and other factors described from time to time in the Company’s periodic reports filed with the SEC that could cause actual results to differ materially from those anticipated or implied in the forward - looking statements . Dakota Plains undertakes no obligation to publicly update any forward - looking statements, whether as a result of new information or future events . 2
C RAIG M C K ENZIE C HAIRMAN & CEO
T ODAY 4 » M EET THE B OARD » W HERE ARE WE ? » 2013 IN REVIEW » F ORWARD S TRATEGY » I MPACT » O PERATIONS : OIL & FRAC SAND » W RAP U P
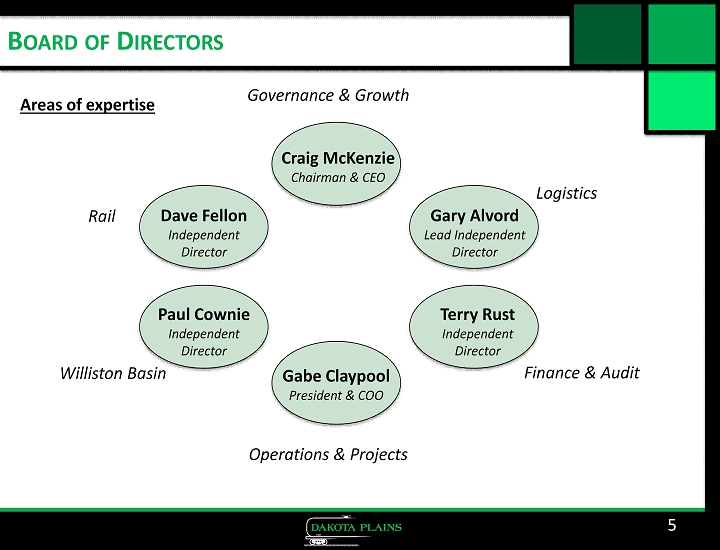
5 Craig McKenzie Chairman & CEO Gary Alvord Lead Independent Director Terry Rust Independent Director Gabe Claypool President & COO Paul Cownie Independent Director Dave Fellon Independent Director Rail Williston Basin Operations & Projects Finance & Audit Logistics Governance & Growth B OARD OF D IRECTORS Areas of expertise
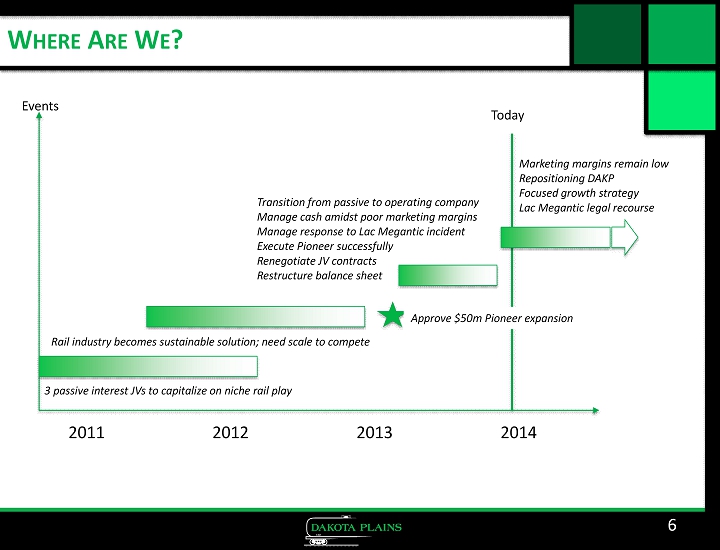
W HERE A RE W E ? 6 2011 2012 2013 2014 3 passive interest JVs to capitalize on niche rail play Rail industry becomes sustainable solution; need scale to compete Approve $50m Pioneer expansion Transition from passive to operating company Manage cash amidst poor marketing margins Manage response to Lac Megantic incident Execute Pioneer successfully Renegotiate JV contracts Restructure balance sheet Marketing margins remain low Repositioning DAKP Focused growth strategy Lac Megantic legal recourse Events Today
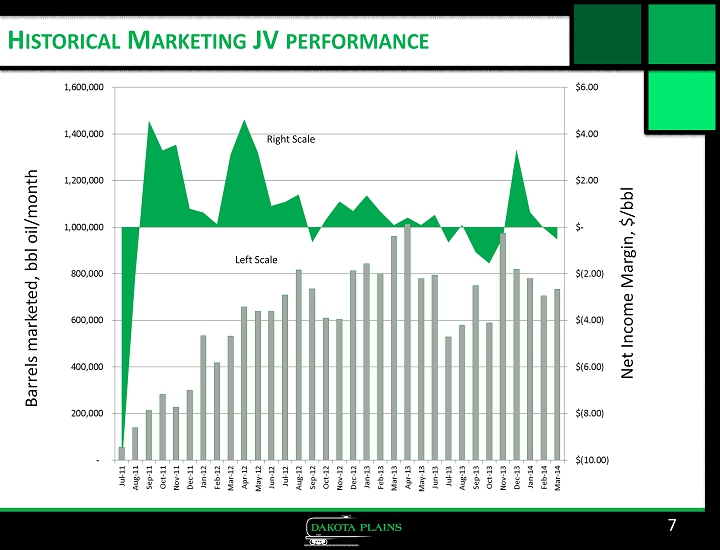
7 H ISTORICAL M ARKETING JV PERFORMANCE Barrels marketed, bbl oil/month Net Income Margin, $/bbl Right Scale Left Scale
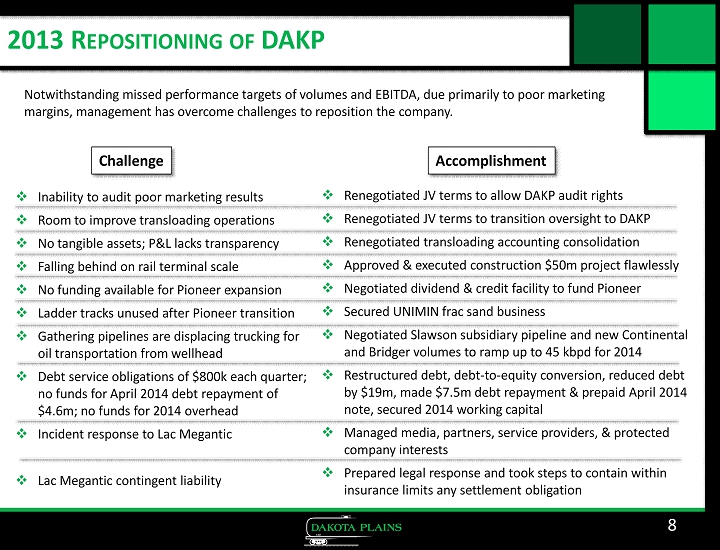
2013 R EPOSITIONING OF DAKP 8 □ Inability to audit poor marketing results □ Room to improve transloading operations □ No tangible assets; P&L lacks transparency □ Falling behind on rail terminal scale □ No funding available for Pioneer expansion □ Ladder tracks unused after Pioneer transition □ Gathering pipelines are displacing trucking for oil transportation from wellhead □ Debt service obligations of $800k each quarter; no funds for April 2014 debt repayment of $4.6m; no funds for 2014 overhead □ Incident response to Lac Megantic □ Lac Megantic contingent liability Challenge Accomplishment □ Renegotiated JV terms to allow DAKP audit rights □ Renegotiated JV terms to transition oversight to DAKP □ Renegotiated transloading accounting consolidation □ Approved & executed construction $50m project flawlessly □ Negotiated dividend & credit facility to fund Pioneer □ Secured UNIMIN frac sand business □ Negotiated Slawson subsidiary pipeline and new Continental and Bridger volumes to ramp up to 45 kbpd for 2014 □ Restructured debt, debt - to - equity conversion, reduced debt by $19m, made $7.5m debt repayment & prepaid April 2014 note, secured 2014 working capital □ Managed media, partners, service providers, & protected company interests □ Prepared legal response and took steps to contain within insurance limits any settlement obligation Notwithstanding missed performance targets of volumes and EBITDA, due primarily to poor marketing margins, management has overcome challenges to reposition the company.
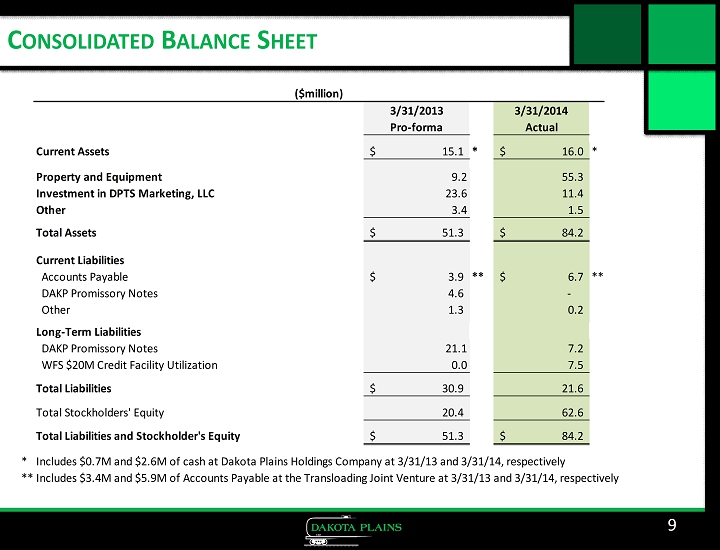
C ONSOLIDATED B ALANCE S HEET 9 3/31/2013 3/31/2014 Pro-forma Actual Current Assets 15.1$ * 16.0$ * Property and Equipment 9.2 55.3 Investment in DPTS Marketing, LLC 23.6 11.4 Other 3.4 1.5 Total Assets 51.3$ 84.2$ Current Liabilities Accounts Payable 3.9$ ** 6.7$ ** DAKP Promissory Notes 4.6 - Other 1.3 0.2 Long-Term Liabilities DAKP Promissory Notes 21.1 7.2 WFS $20M Credit Facility Utilization 0.0 7.5 Total Liabilities 30.9$ 21.6 Total Stockholders' Equity 20.4 62.6 Total Liabilities and Stockholder's Equity 51.3$ 84.2$ * Includes $0.7M and $2.6M of cash at Dakota Plains Holdings Company at 3/31/13 and 3/31/14, respectively **Includes $3.4M and $5.9M of Accounts Payable at the Transloading Joint Venture at 3/31/13 and 3/31/14, respectively ($million)
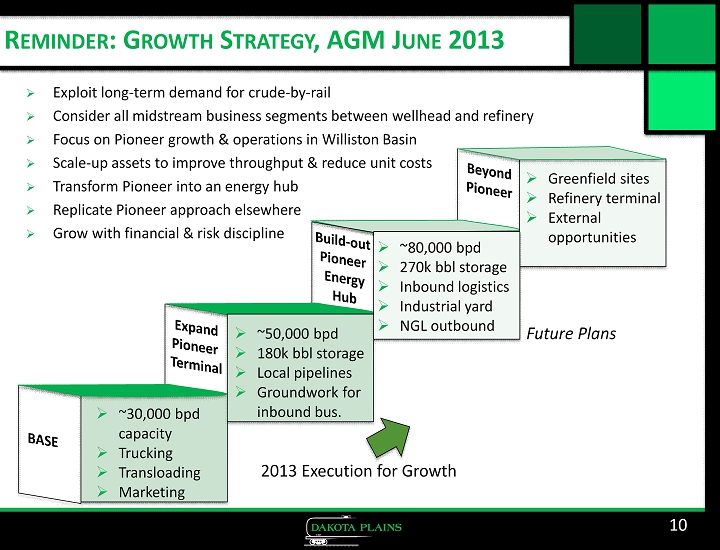
R EMINDER : G ROWTH S TRATEGY , AGM J UNE 2013 » Exploit long - term demand for crude - by - rail » Consider all midstream business segments between wellhead and refinery » Focus on Pioneer growth & operations in Williston Basin » Scale - up assets to improve throughput & reduce unit costs » Transform Pioneer into an energy hub » Replicate Pioneer approach elsewhere » Grow with financial & risk discipline 10 » ~30,000 bpd capacity » Trucking » Transloading » Marketing » ~50,000 bpd » 180k bbl storage » Local pipelines » Groundwork for inbound bus. » Greenfield sites » Refinery terminal » External opportunities » ~80,000 bpd » 270k bbl storage » Inbound logistics » Industrial yard » NGL outbound 2013 Execution for Growth Future Plans

F ORWARD S TRATEGY ( SIMPLIFIED ) 11 » 45 kbpd throughput » Control costs (maintain efficiency) » Approve Tank #3 (deferred by partner) » Work with partners to simplify structure, then grow Pioneer » Lower cost of capital » List stock » Pursue Lac Megantic legal recourse » Consider M&A 1. Grow Pioneer 2. Focus on Transloading as core business 3. Strengthen balance sheet 4. Build - out inbound business beyond UNIMIN 5. Mitigate Lac Megantic contingent liability 6. Convert to MLP when practicable Strategic Objectives 2014 Plan
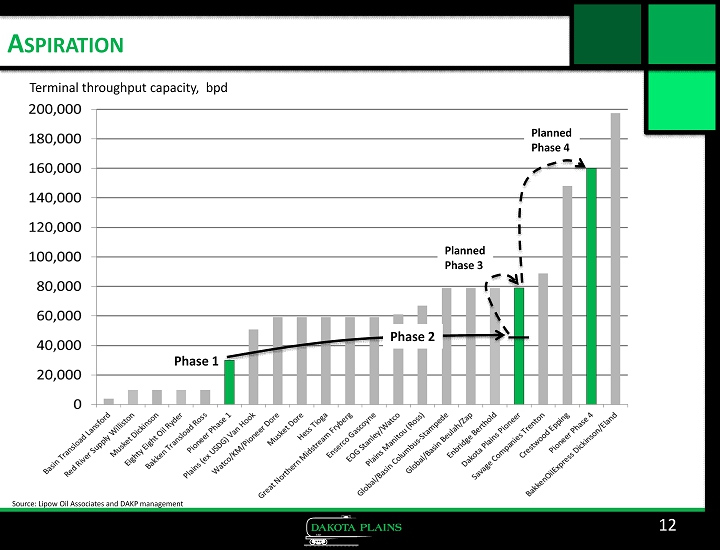
A SPIRATION 12 Source: Lipow Oil Associates and DAKP management Terminal throughput capacity, bpd Planned Phase 3 Planned Phase 4 Phase 1 Phase 2
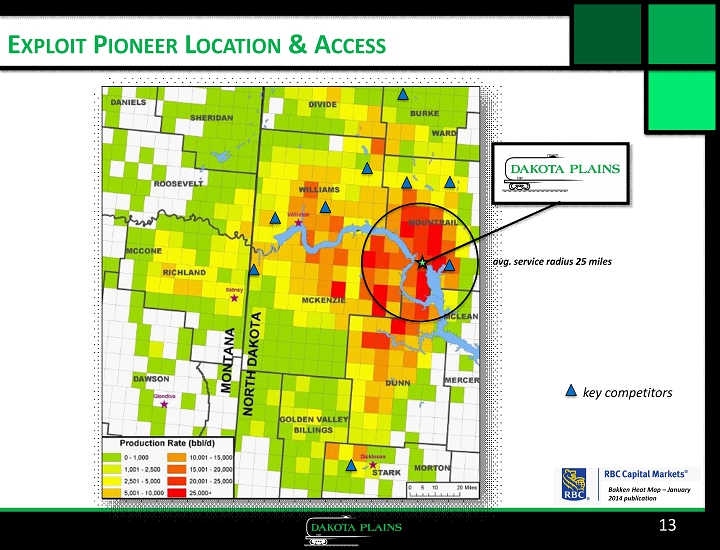
E XPLOIT P IONEER L OCATION & A CCESS 13 Bakken Heat Map – January 2014 publication avg. service radius 25 miles key competitors
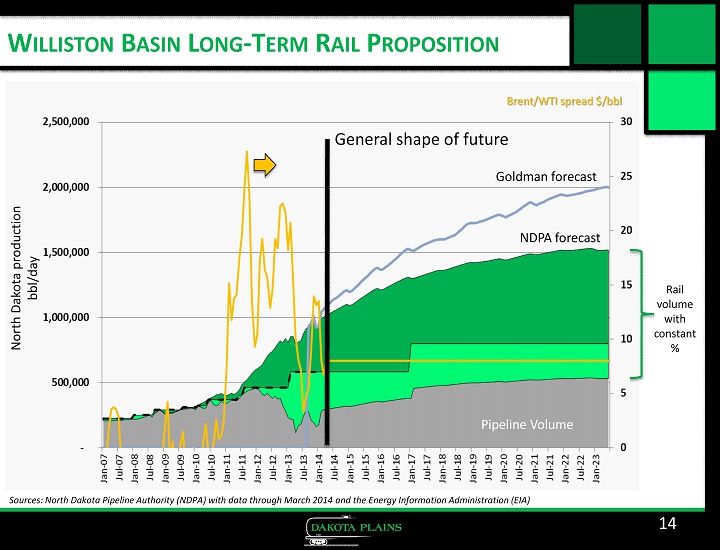
W ILLISTON B ASIN L ONG - T ERM R AIL P ROPOSITION 14 Sources: North Dakota Pipeline Authority (NDPA) with data through March 2014 and the Energy Information Administration (EIA) Brent/WTI spread $/ bbl North Dakota production bbl/day General shape of future NDPA forecast Goldman forecast Rail volume with constant % Pipeline Volume
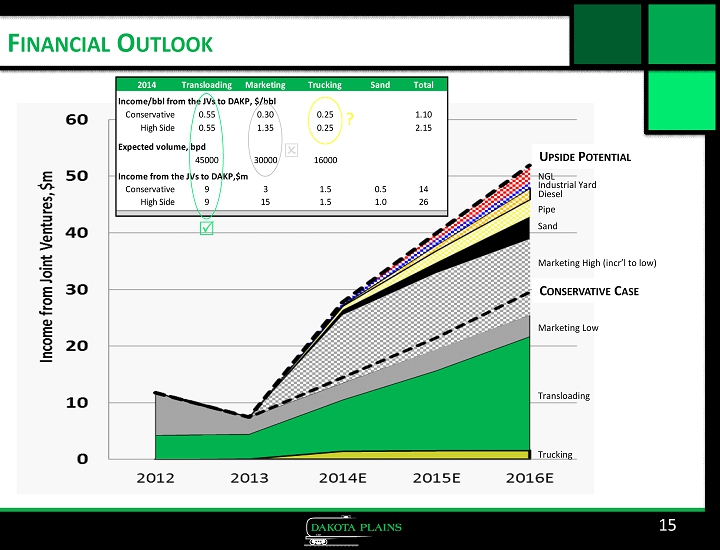
F INANCIAL O UTLOOK 15 C ONSERVATIVE C ASE U PSIDE P OTENTIAL 2014 Transloading Marketing Trucking Sand Total Income/bbl from the JVs to DAKP, $/bbl Conservative 0.55 0.30 0.25 1.10 High Side 0.55 1.35 0.25 2.15 Expected volume, bpd 45000 30000 16000 Income from the JVs to DAKP,$m Conservative 9 3 1.5 0.5 14 High Side 9 15 1.5 1.0 26 Trucking Transloading Marketing Low Marketing High ( incr’l to low) Sand Pipe Diesel Industrial Yard NGL ?
G ABE C LAYPOOL P RESIDENT & COO

17 P IONEER T ERMINAL IN N EW T OWN , ND 10 STATION RAIL LOADING 70 ACRE INDUSTRIAL YARD SPACE D OUBLE LOOP TRACK FOR TWO 120 - UNIT TRAINS F OUR LADDER TRACKS FOR FUTURE INBOUND UNIMIN FRAC SAND T ERMINAL I NBOUND PIPELINES 10 TRUCK OFFLOAD STATIONS 180 K BBLS STORAGE , 270 K PERMITTED
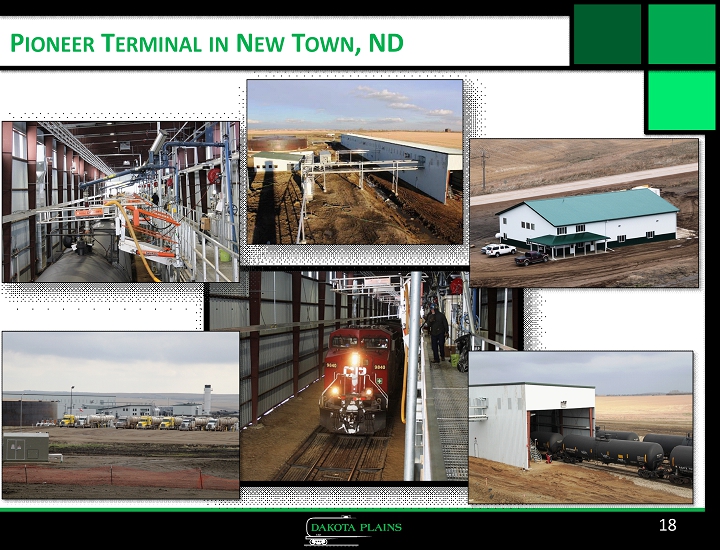
18 P IONEER T ERMINAL IN N EW T OWN , ND
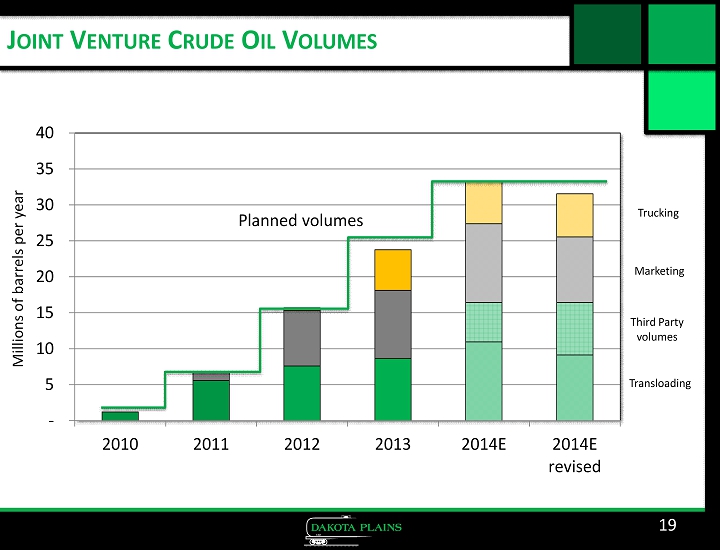
J OINT V ENTURE C RUDE O IL V OLUMES - 5 10 15 20 25 30 35 40 2010 2011 2012 2013 2014E 2014E revised 19 Millions of barrels per year Planned volumes Third Party volumes Transloading Marketing Trucking
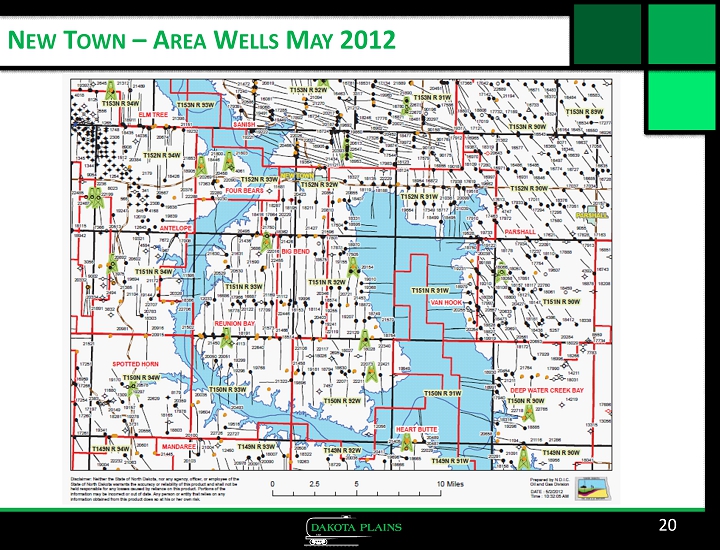
N EW T OWN – A REA W ELLS M AY 2012 20
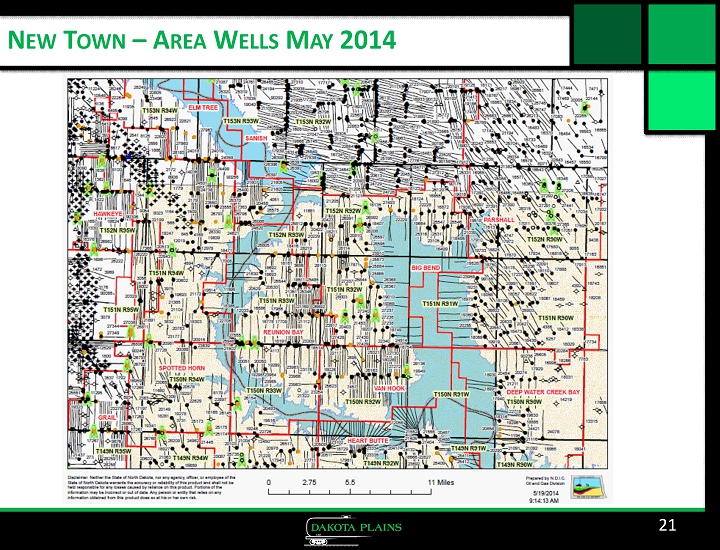
N EW T OWN – A REA W ELLS M AY 2014 21

N ORTH A MERICAN C RUDE O IL P IPELINE I NFRASTRUCTURE 22
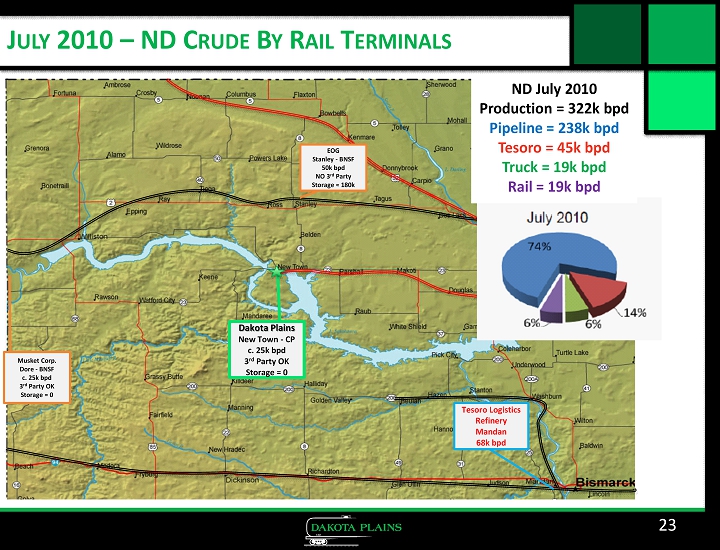
23 J ULY 2010 – ND C RUDE B Y R AIL T ERMINALS Dakota Plains New Town - CP c. 25k bpd 3 rd Party OK Storage = 0 Musket Corp. Dore - BNSF c. 25k bpd 3 rd Party OK Storage = 0 EOG Stanley - BNSF 5 0k bpd NO 3 rd Party Storage ≈ 180k Tesoro Logistics Refinery Mandan 68k bpd ND July 2010 Production = 322k bpd Pipeline = 238k bpd Tesoro = 45k bpd Truck = 19k bpd Rail = 19k bpd
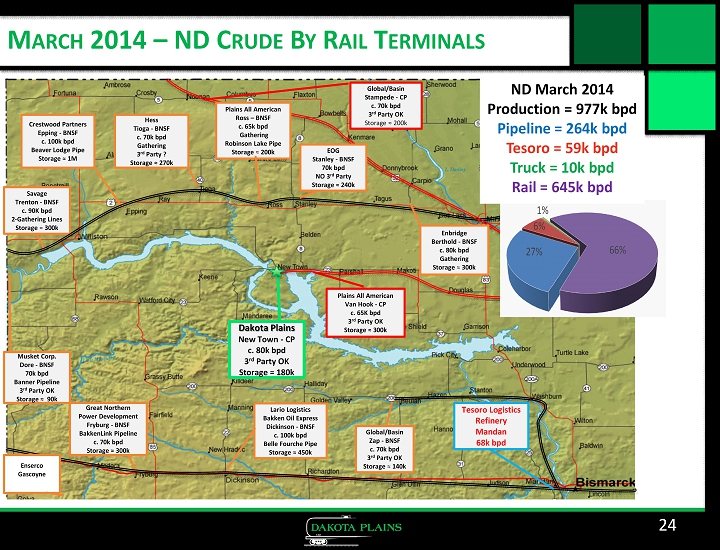
24 M ARCH 2014 – ND C RUDE B Y R AIL T ERMINALS Dakota Plains New Town - CP c. 80k bpd 3 rd Party OK Storage = 180k Lario Logistics Bakken Oil Express Dickinson - BNSF c. 100k bpd Belle Fourche Pipe Storage ≈ 450k Global/Basin Zap - BNSF c. 70k bpd 3 rd Party OK Storage ≈ 140k Savage Trenton - BNSF c. 9 0K bpd 2 - Gathering Lines Storage ≈ 300k Crestwood Partners Epping - BNSF c. 100k bpd Beaver Lodge Pipe Storage ≈ 1M Hess Tioga - BNSF c. 70k bpd Gathering 3 rd Party ? Storage ≈ 270k Global/Basin Stampede - CP c. 70k bpd 3 rd Party OK Storage ≈ 200k Musket Corp. Dore - BNSF 7 0k bpd Banner Pipeline 3 rd Party OK Storage ≈ 90k Great Northern Power Development Fryburg - BNSF BakkenLink Pipeline c. 70k bpd Storage ≈ 300k Plains All American Van Hook - CP c. 65K bpd 3 rd Party OK Storage ≈ 300k Plains All American Ross – BNSF c. 65k bpd Gathering Robinson Lake Pipe Storage ≈ 200k EOG Stanley - BNSF 70k bpd NO 3 rd Party Storage ≈ 240k Enbridge Berthold - BNSF c. 80k bpd Gathering Storage ≈ 300k Tesoro Logistics Refinery Mandan 68k bpd Enserco Gascoyne ND March 2014 Production = 977k bpd Pipeline = 264k bpd Tesoro = 59k bpd Truck = 10k bpd Rail = 645k bpd

C RUDE B Y R AIL G ROWTH 25
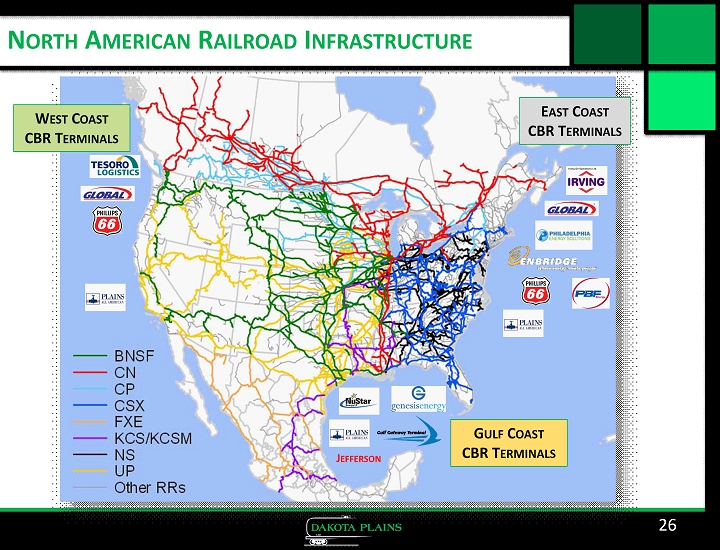
N ORTH A MERICAN R AILROAD I NFRASTRUCTURE 26 J EFFERSON W EST C OAST CBR T ERMINALS E AST C OAST CBR T ERMINALS G ULF C OAST CBR T ERMINALS
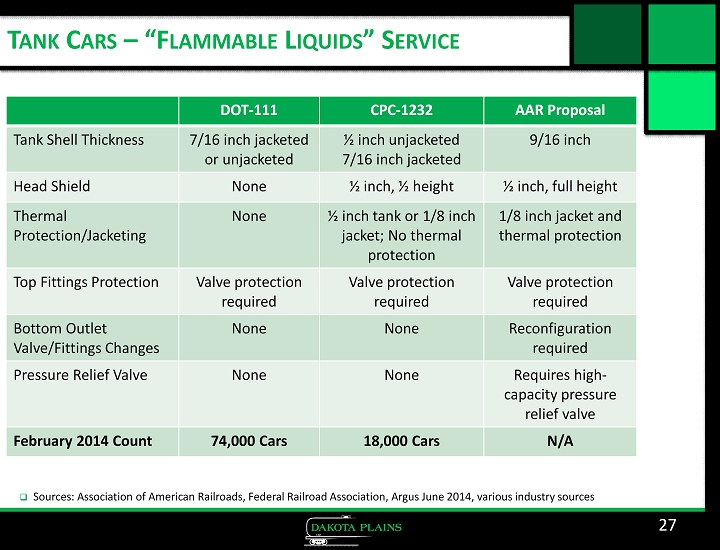
T ANK C ARS – “F LAMMABLE L IQUIDS ” S ERVICE 27 DOT - 111 CPC - 1232 AAR Proposal Tank Shell Thickness 7/16 inch jacketed or unjacketed ½ inch unjacketed 7/16 inch jacketed 9/16 inch Head Shield None ½ inch, ½ height ½ inch, full height Thermal Protection/Jacketing None ½ inch tank or 1/8 inch jacket; No thermal protection 1/8 inch jacket and thermal protection Top Fittings Protection Valve protection required Valve protection required Valve protection required Bottom Outlet Valve/Fittings Changes None None Reconfiguration required Pressure Relief Valve None None Requires high - capacity pressure relief valve February 2014 Count 74,000 Cars 18,000 Cars N/A □ Sources: Association of American Railroads, Federal Railroad Association, Argus June 2014, various industry sources
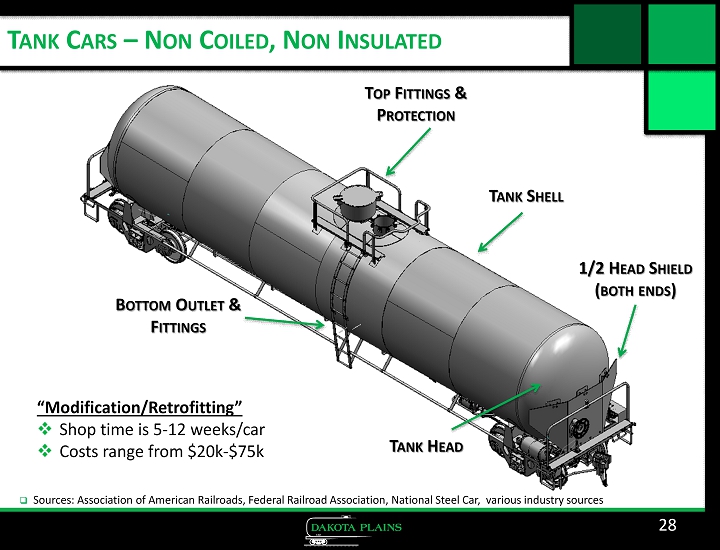
T ANK C ARS – N ON C OILED , N ON I NSULATED 28 1/2 H EAD S HIELD ( BOTH E NDS ) □ Sources: Association of American Railroads, Federal Railroad Association, National Steel Car, various industry sources T ANK S HELL T OP F ITTINGS & P ROTECTION B OTTOM O UTLET & F ITTINGS T ANK H EAD “Modification/Retrofitting” □ Shop time is 5 - 12 weeks/car □ Costs range from $20k - $75k
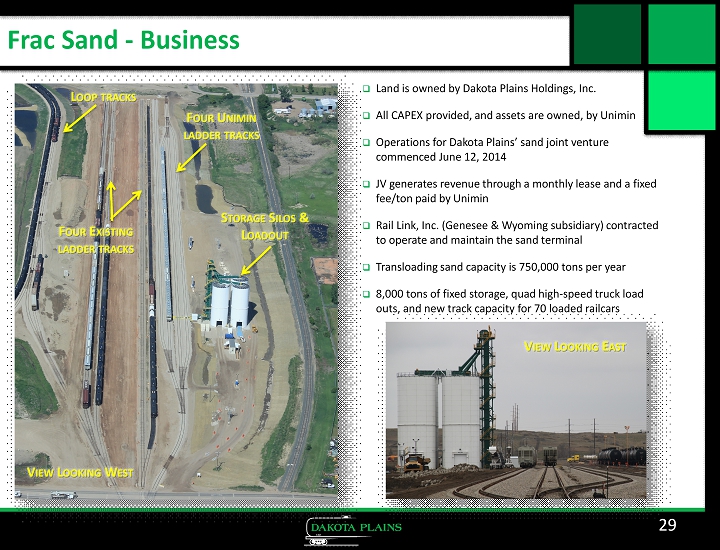
Frac Sand - Business 29 □ Land is owned by Dakota Plains Holdings, Inc. □ All CAPEX provided, and assets are owned, by Unimin □ Operations for Dakota Plains’ sand joint venture commenced June 12, 2014 □ JV generates revenue through a monthly lease and a fixed fee/ton paid by Unimin □ Rail Link, Inc. ( G enesee & Wyoming subsidiary) contracted to operate and maintain the sand terminal □ Transloading sand capacity is 750,000 tons per year □ 8,000 tons of fixed storage, quad high - speed truck load outs, and new track capacity for 70 loaded railcars F OUR U NIMIN LADDER TRACKS F OUR E XISTING LADDER TRACKS L OOP TRACKS S TORAGE S ILOS & L OADOUT V IEW L OOKING W EST V IEW L OOKING E AST
F RAC S AND – M ARKET O VERVIEW 30 □ Sources: PLG Consulting “State of Proppants Market” 03 - 12 - 14, various industry sources □ 80%/10%/10% - Natural Sand/Ceramics/Resin Coated volume allocation □ Everyone has their “secret recipe” that varies by geography □ Ratio continues to shift more toward natural sand □ Natural sand is roughly 10% of ceramic proppant costs □ Demand has fluctuated but strong upward trends □ Demand driven by more wells/rig, more stages and more sand/stage □ 25 to 40 sand cars per well = 100 to 160 sand trucks per well □ Rail logistics are key game changer in reducing overall sand expense

F RAC S AND - G ROWTH 31
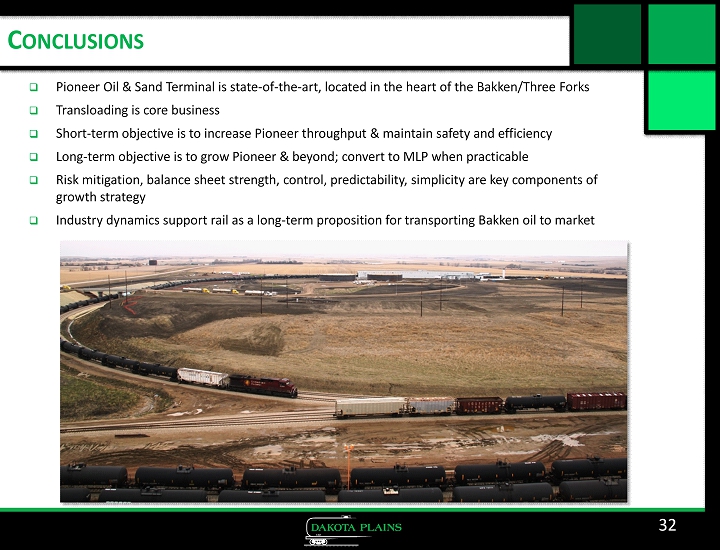
C ONCLUSIONS □ Pioneer Oil & Sand Terminal is state - of - the - art, located in the heart of the Bakken/Three Forks □ Transloading is core business □ Short - term objective is to increase Pioneer throughput & maintain safety and efficiency □ Long - term objective is to grow Pioneer & beyond; convert to MLP when practicable □ Risk mitigation, balance sheet strength, control, predictability, simplicity are key components of growth strategy □ Industry dynamics support rail as a long - term proposition for transporting Bakken oil to market 32
A PPENDIX
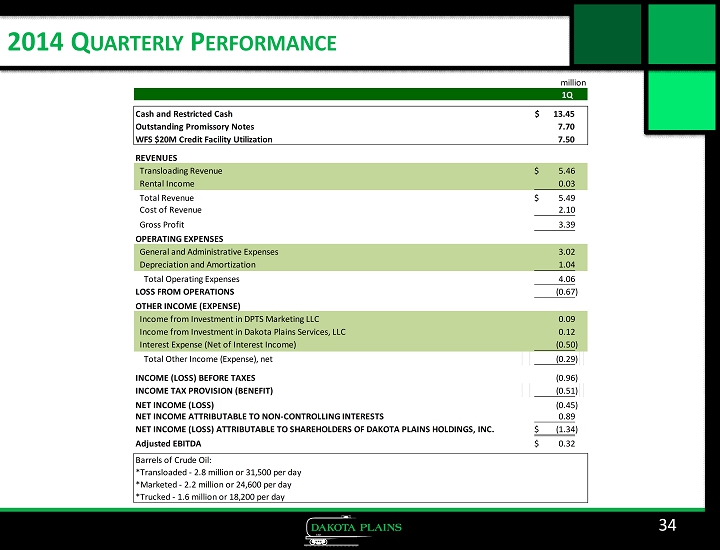
34 2014 Q UARTERLY P ERFORMANCE 1Q Cash and Restricted Cash 13.45$ Outstanding Promissory Notes 7.70 WFS $20M Credit Facility Utilization 7.50 REVENUES Transloading Revenue 5.46$ Rental Income 0.03 Total Revenue 5.49$ Cost of Revenue 2.10 Gross Profit 3.39 OPERATING EXPENSES General and Administrative Expenses 3.02 Depreciation and Amortization 1.04 Total Operating Expenses 4.06 LOSS FROM OPERATIONS (0.67) OTHER INCOME (EXPENSE) Income from Investment in DPTS Marketing LLC 0.09 Income from Investment in Dakota Plains Services, LLC 0.12 Interest Expense (Net of Interest Income) (0.50) Total Other Income (Expense), net (0.29) INCOME (LOSS) BEFORE TAXES (0.96) INCOME TAX PROVISION (BENEFIT) (0.51) NET INCOME (LOSS) (0.45) NET INCOME ATTRIBUTABLE TO NON-CONTROLLING INTERESTS 0.89 NET INCOME (LOSS) ATTRIBUTABLE TO SHAREHOLDERS OF DAKOTA PLAINS HOLDINGS, INC. (1.34)$ Adjusted EBITDA 0.32$ Barrels of Crude Oil: *Transloaded - 2.8 million or 31,500 per day *Marketed - 2.2 million or 24,600 per day *Trucked - 1.6 million or 18,200 per day million
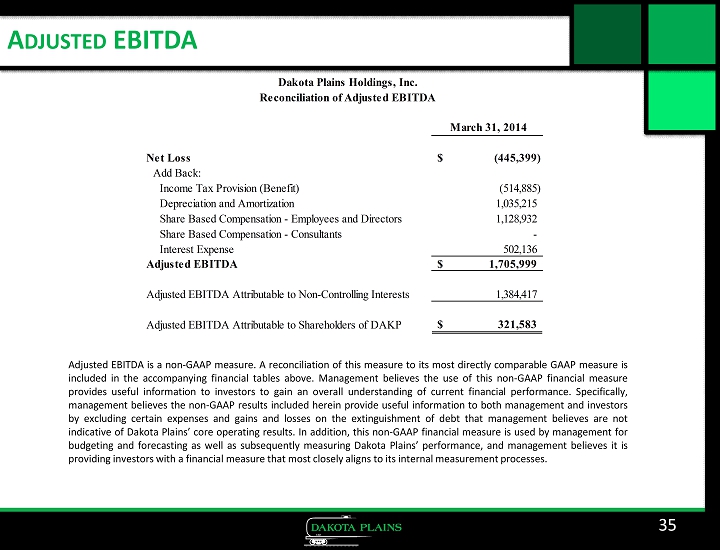
A DJUSTED EBITDA 35 Adjusted EBITDA is a non - GAAP measure . A reconciliation of this measure to its most directly comparable GAAP measure is included in the accompanying financial tables above . Management believes the use of this non - GAAP financial measure provides useful information to investors to gain an overall understanding of current financial performance . Specifically, management believes the non - GAAP results included herein provide useful information to both management and investors by excluding certain expenses and gains and losses on the extinguishment of debt that management believes are not indicative of Dakota Plains’ core operating results . In addition, this non - GAAP financial measure is used by management for budgeting and forecasting as well as subsequently measuring Dakota Plains’ performance, and management believes it is providing investors with a financial measure that most closely aligns to its internal measurement processes . March 31, 2014 Net Loss (445,399)$ Add Back: Income Tax Provision (Benefit) (514,885) Depreciation and Amortization 1,035,215 Share Based Compensation - Employees and Directors 1,128,932 Share Based Compensation - Consultants - Interest Expense 502,136 Adjusted EBITDA 1,705,999$ Adjusted EBITDA Attributable to Non-Controlling Interests 1,384,417 Adjusted EBITDA Attributable to Shareholders of DAKP 321,583$ Dakota Plains Holdings, Inc. Reconciliation of Adjusted EBITDA
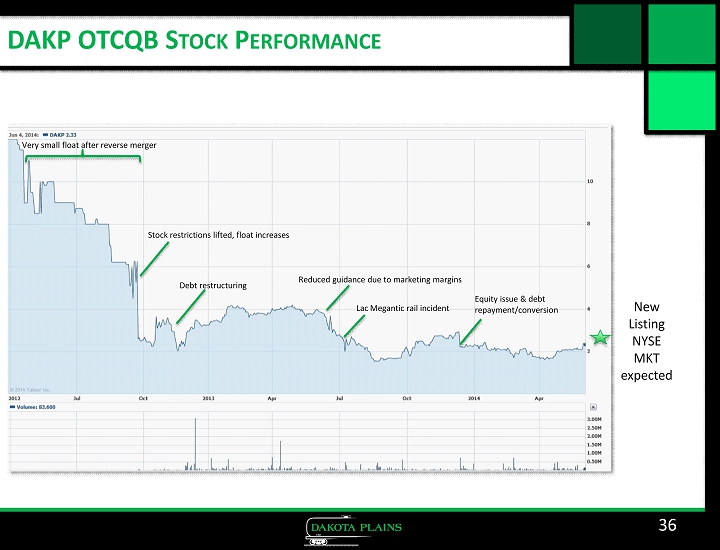
DAKP OTCQB S TOCK P ERFORMANCE 36 Very small float after reverse merger Stock restrictions lifted, float increases Lac Megantic rail incident Reduced guidance due to marketing margins Equity issue & debt repayment/conversion Debt restructuring New Listing NYSE MKT expected