3Q 2022 Financial Results Update November 8, 2022
PROPRIETARY AND CONFIDENTIAL 23Q 2022 Investor Update Introduction Robert G. Burrows Vice President, Investor Relations Officer
This presentation includes forward-looking statements within the meaning of the Private Securities Litigation Reform Act of 1995. All statements, other than statements of historical fact, including statements regarding the future performance of the Company or our business strategy, future operations, future financial position, future revenues and earnings, projected costs, prospects, plans and objectives of management and the ongoing impact of the COVID-19 pandemic, are forward-looking statements. We generally identify forward-looking statements by using words like “anticipate,” “believe,” “continue,” “estimate,” “expect,” “forecast,” “intend,” “may,” “plan,” should,” “will,” and similar expressions or variations thereof, or the negative thereof, but these terms are not the exclusive means of identifying such statements. Forward-looking statements are based on our current intentions, beliefs and expectations regarding future events. We cannot guarantee that any forward-looking statement will be accurate. You should realize that if underlying assumptions prove inaccurate or unknown risks or uncertainties materialize, actual results could differ materially from our expectations. You are, therefore, cautioned not to place undue reliance on any forward-looking statement. Any forward-looking statement speaks only as of the date on which such statement is made, and, except as required by law and the rules of the Securities and exchange Commission (the “SEC”), we do not undertake to update any forward-looking statement to reflect new information, events or circumstances. There are a number of important factors that could cause our actual results to differ materially from those indicated by such forward-looking statements, including, among others, the availability of U.S. Government (“USG”) funding for contracts related to procurement of our medical countermeasures, including AV7909 (Anthrax vaccine adsorbed (AVA), adjuvanted), BioThrax® (Anthrax Vaccine Adsorbed) and ACAM2000®, (Smallpox (Vaccinia) Vaccine, Live), among others, as well as contracts related to development of medical countermeasures; our ability to meet our commitments to quality and compliance in all of our manufacturing operations; the impact of the generic marketplace on NARCAN® (naloxone HCI) Nasal Spray and future NARCAN sales; our ability to perform under our contracts with the USG, including the timing of and specifications relating to deliveries; our ability to provide CDMO services for the development and/or manufacture of product and/or product candidates of our customers at required levels and on required timelines; our ability to obtain and maintain regulatory approvals for our product candidates and the timing of any such approvals; the ability of our contractors and suppliers to maintain compliance with current good manufacturing practices and other regulatory obligations; our ability to negotiate additional USG procurement or follow-on contracts for our Public Health Threat products that have expired or will be expiring; our ability to negotiate new CDMO contracts and the negotiation of further commitments related to the collaboration and deployment of capacity toward future commercial manufacturing under our existing CDMO contracts; our ability to collect reimbursement for raw materials and payment of services fees from Janssen Pharmaceuticals, Inc. or other CDMO customers; the outcomes associated with pending shareholder litigation and government investigations; our ability to comply with the operating and financial covenants required by our senior secured credit facilities and our 3.875% Senior Unsecured Notes due 2028; the procurement of products by USG entities under regulatory exemptions prior to approval by the U.S. Food and Drug Administration and corresponding procurement by government entities outside of the United States under regulatory exemptions prior to approval by the corresponding regulatory authorities in the applicable country; the extent of any ongoing impact of the COVID-19 pandemic on our supply chains and potential future impact thereof on our markets, operations and employees as well as those of our customers and suppliers; the impact on our revenues from and duration of declines in sales of our vaccine products that target travelers due to the reduction of international travel caused by the COVID-19 pandemic; our ability to identify and acquire companies, businesses, products or product candidates that satisfy our selection criteria, contribute to our overall business strategy, and align with our underlying assumptions that formed the basis of acquisition; our ability to commercialize, market and manufacture new product candidates successfully; and the accuracy of our estimates regarding future revenues, expenses, capital requirements and needs for additional financing. The foregoing sets forth many, but not all, of the factors that could cause actual results to differ from our expectations in any forward-looking statement. When evaluating our forward-looking statements, you should consider this cautionary statement along with the risks identified in our reports filed with the SEC. New factors emerge from time to time, and it is not possible for management to predict all such factors, nor can it assess the impact of any such factor on the business or the extent to which any factor, or combination of factors, may cause results to differ materially from those contained in any forward-looking statement. Trademarks Emergent,® BioThrax® (Anthrax Vaccine Adsorbed), RSDL® (Reactive Skin Decontamination Lotion Kit), BAT® (Botulism Antitoxin Heptavalent (A,B,C,D,E,F and G)-(Equine)), Anthrasil® (Anthrax Immune Globulin Intravenous (Human)), VIGIV (Vaccinia Immune Globulin Intravenous (Human)), Trobigard® (atropine sulfate, obidoxime chloride), ACAM2000® (Smallpox (Vaccinia) Vaccine, Live), Vivotif® (Typhoid Vaccine Live Oral Ty21a), Vaxchora® (Cholera Vaccine, Live, Oral), NARCAN® (naloxone HCI) Nasal Spray, TEMBEXA® (brincidofovir) and any and all Emergent BioSolutions Inc. brands, products, services and feature names, logos and slogans are trademarks or registered trademarks of Emergent BioSolutions Inc. or its subsidiaries in the United States or other countries. All other brands, products, services and feature names or trademarks are the property of their respective owners. Safe Harbor Statement/Trademarks 33Q 2022 Investor Update
This presentation contains four financial measures – Adjusted Net Income (Loss), Adjusted Net Income (Loss) Per Diluted Share, Adjusted EBITDA (Earnings Before Interest, Taxes, and Depreciation and Amortization), and Adjusted Gross Margin – all of which are considered “non-GAAP” financial measures under applicable Securities and Exchange Commission rules and regulations. These non-GAAP financial measures should be considered supplemental to and not a substitute for financial information prepared in accordance with generally accepted accounting principles. The Company’s definition of these non-GAAP measures may differ from similarly titled measures used by others. Adjusted Net Income (Loss) reflects net income excluding the impact of certain non-cash, one-time or non-recurring expenses. Adjusted Net Income (Loss) Per Diluted Share is defined as Adjusted Net Income (Loss) divided by diluted shares outstanding. Adjusted EBITDA reflects net income excluding the impact of depreciation, amortization, interest expense and income taxes, excluding specified items that can be highly variable and the non-cash impact of certain accounting adjustments. The Company views these non-GAAP financial measures as a means to facilitate management’s financial and operational decision-making, including evaluation of the Company’s historical operating results and comparison to competitors’ operating results. These non-GAAP financial measures reflect an additional way of viewing aspects of the Company’s operations that, when viewed with GAAP results and the reconciliations to the corresponding GAAP financial measure may provide a more complete understanding of factors and trends affecting the Company’s business. The determination of the amounts that are excluded from these non-GAAP financial measures are a matter of management judgment and depend upon, among other factors, the nature of the underlying expense or income amounts. Because non-GAAP financial measures exclude the effect of items that will increase or decrease the Company’s reported results of operations, management strongly encourages investors to review the Company’s consolidated financial statements and publicly filed reports in their entirety. For additional information on the non-GAAP financial measures noted here, please refer to the reconciliation tables provide in the Appendix to this presentation as well as the associated press release which can be found on the Company’s website at www.emergentbiosolutions.com. Non-GAAP Financial Measures 43Q 2022 Investor Update
Agenda 53Q 2022 Investor Update INTRODUCTION Q&A • Bob Kramer, CEO • Rich Lindahl, CFO • Adam Havey, COO • Atul Saran, Chief Strategy and Development Officer Financial Results: -- 3Q22 vs. 3Q21 • Rich Lindahl, CFO State of the Company: 3Q22 Review • Bob Kramer, CEO Financial Forecast: -- FY2022 • Rich Lindahl, CFO
PROPRIETARY AND CONFIDENTIAL3Q 2022 Investor Update State of the Company Bob Kramer President and Chief Executive Officer 6
Key Themes for Third Quarter 2022 73Q 2022 Investor Update STATE OF THE COMPANY • Core medical countermeasures business remains a cornerstone of our strategy as we continue to work with the USG to deliver MCMs focused public health threats aligned with strategic biodefense goals • Relationship with the US government is strong and growing • Opioid overdose epidemic remains serious public health threat; nasal naloxone franchise continues to deliver and have an impact on patients and customers as we remain committed to increasing awareness, improving affordability and driving access to naloxone • CDMO business re-baselining continues with a focus on stabilizing and enhancing operational excellence while operationalizing investments in capabilities network wide • Making measurable progress on R&D, particularly late-stage programs (AV7909 and CHIKV VLP) • Continue journey to further strengthen culture of quality, harmonize quality management systems and further embed controls in order to ensure meeting all regulatory requirements for our own products and those of our clients across all of our manufacturing sites
Key Priorities for Third Quarter 2022 83Q 2022 Investor Update STATE OF THE COMPANY 1. Continuing to be a dependable partner to all clients, including USG, and deliver on strategic objectives and agreed upon commitments. 2. Stabilizing operations across all sites and investing in facilities, quality systems and people to ensure skills and tools to compete. 3. Actively evaluating opportunities for growth through strategic partnerships and acquisitions (examples: TEMBEXA, Ebanga and candidates addressing chikungunya and Lassa fever). 4. Sharing our experience from +20 years helping to governments prepare for public health threats and advocating for proper funding and improved planning and response. 5. Continuing to be guided by financial discipline as we remain committed to executing our strategy of building leadership positions in select segments of the growing public health threat market.
PROPRIETARY AND CONFIDENTIAL 93Q 2022 Investor Update Financials Richard S. Lindahl Executive Vice President and Chief Financial Officer
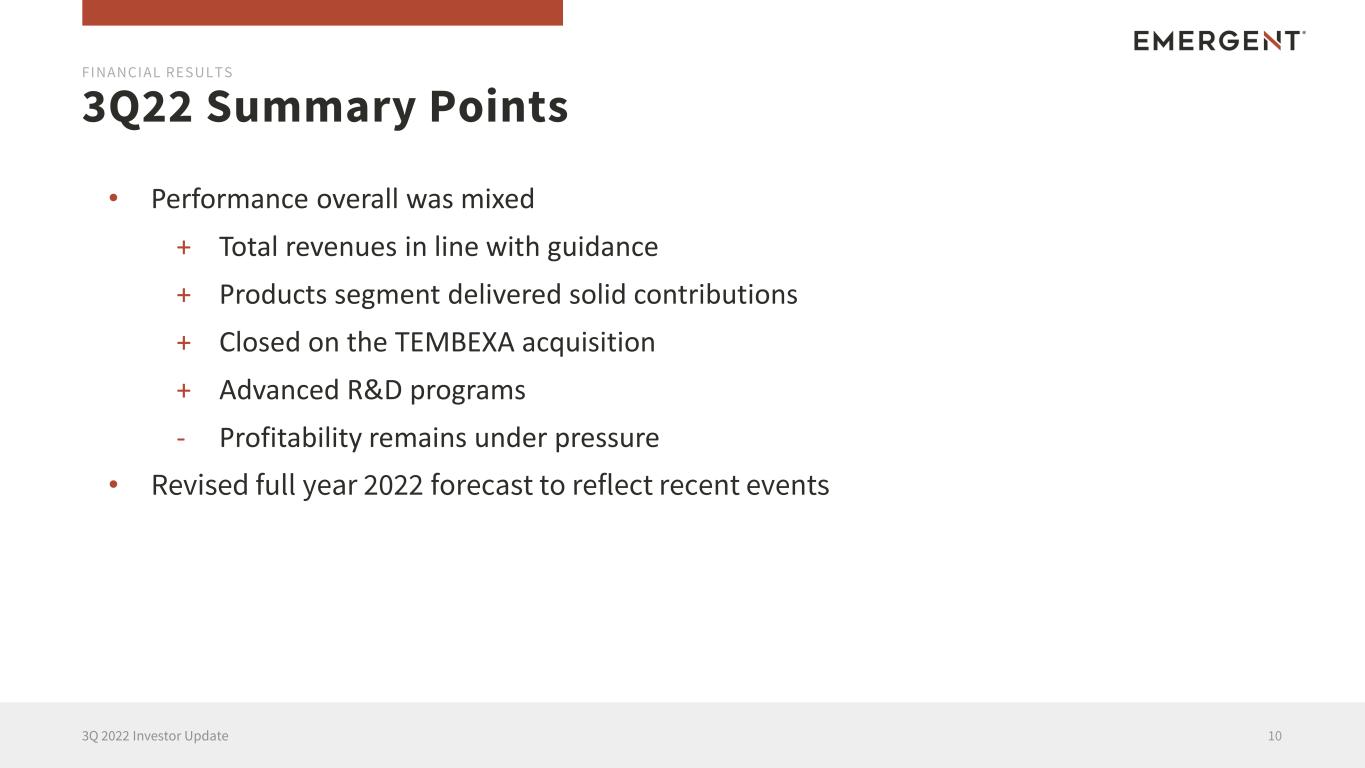
3Q22 Summary Points 103Q 2022 Investor Update FINANCIAL RESULTS • Performance overall was mixed + Total revenues in line with guidance + Products segment delivered solid contributions + Closed on the TEMBEXA acquisition + Advanced R&D programs - Profitability remains under pressure • Revised full year 2022 forecast to reflect recent events

3 Q 2 1 Key Financial Performance Metrics 3Q22 vs. 3Q211 113Q 2022 Investor Update Total Revenues Adjusted EBITDA2 Adjusted Net Loss Per Diluted Share2 Adjusted Net Loss2 1. All financial information incorporated within this presentation is unaudited. 2. See the Appendix for a definition of non-GAAP terms and reconciliation tables. $329.0 $240.0 FINANCIAL RESULTS ( $ I N M I LLI O N S , E XC E PT PE R S H A R E A M O U N T S ) 3 Q 2 2 3Q21 3Q22 3Q21 3Q22 3Q21 3Q22 3Q21 3Q22 $(1.27)$(63.2)$(15.2)$(3.3) $(19.3) $(0.36)
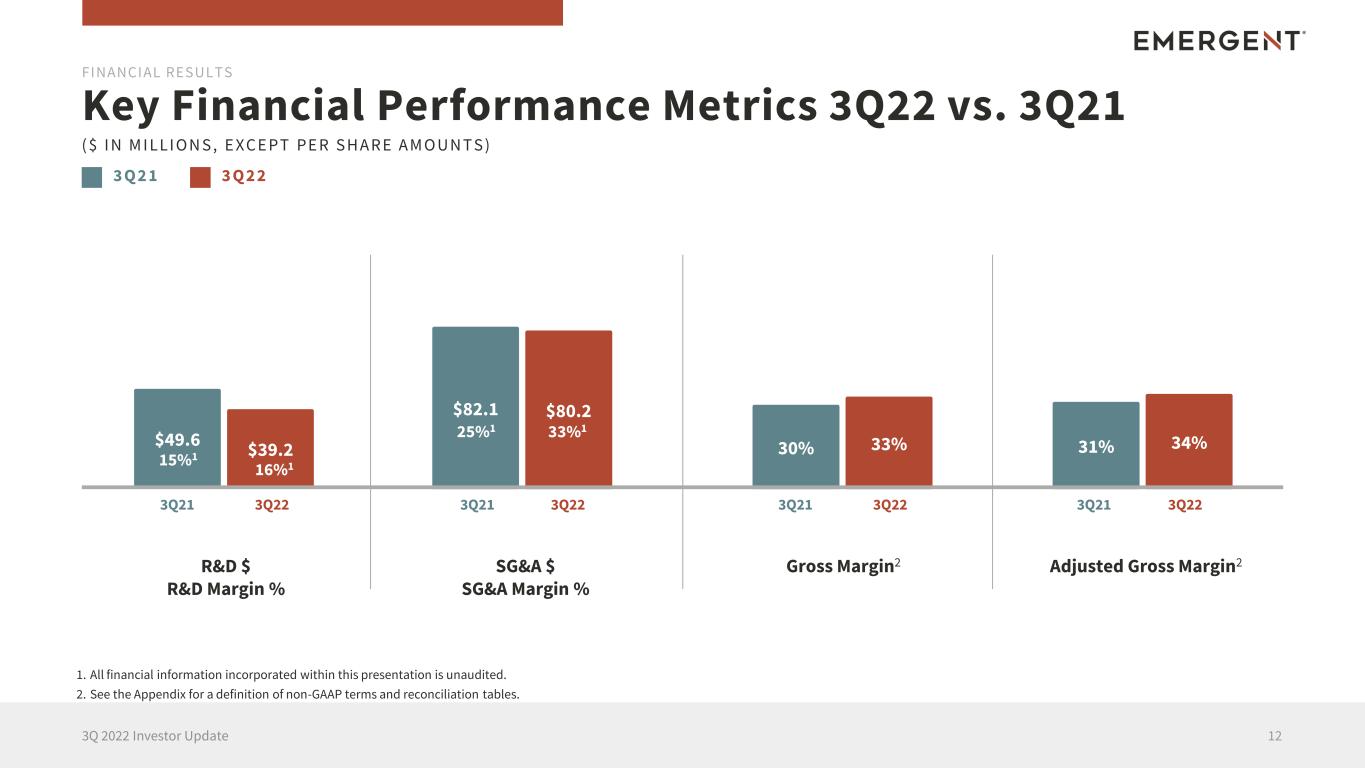
3 Q 2 1 Key Financial Performance Metrics 3Q22 vs. 3Q21 123Q 2022 Investor Update R&D $ R&D Margin % SG&A $ SG&A Margin % Adjusted Gross Margin2Gross Margin2 $49.6 $39.2 FINANCIAL RESULTS $82.1 $80.2 30% 33% ( $ I N M I LLI O N S , E XC E PT PE R S H A R E A M O U N T S ) 3 Q 2 2 31% 34% 3Q21 3Q22 3Q21 3Q22 3Q21 3Q22 3Q21 3Q22 15%1 16%1 25%1 33%1 1. All financial information incorporated within this presentation is unaudited. 2. See the Appendix for a definition of non-GAAP terms and reconciliation tables.
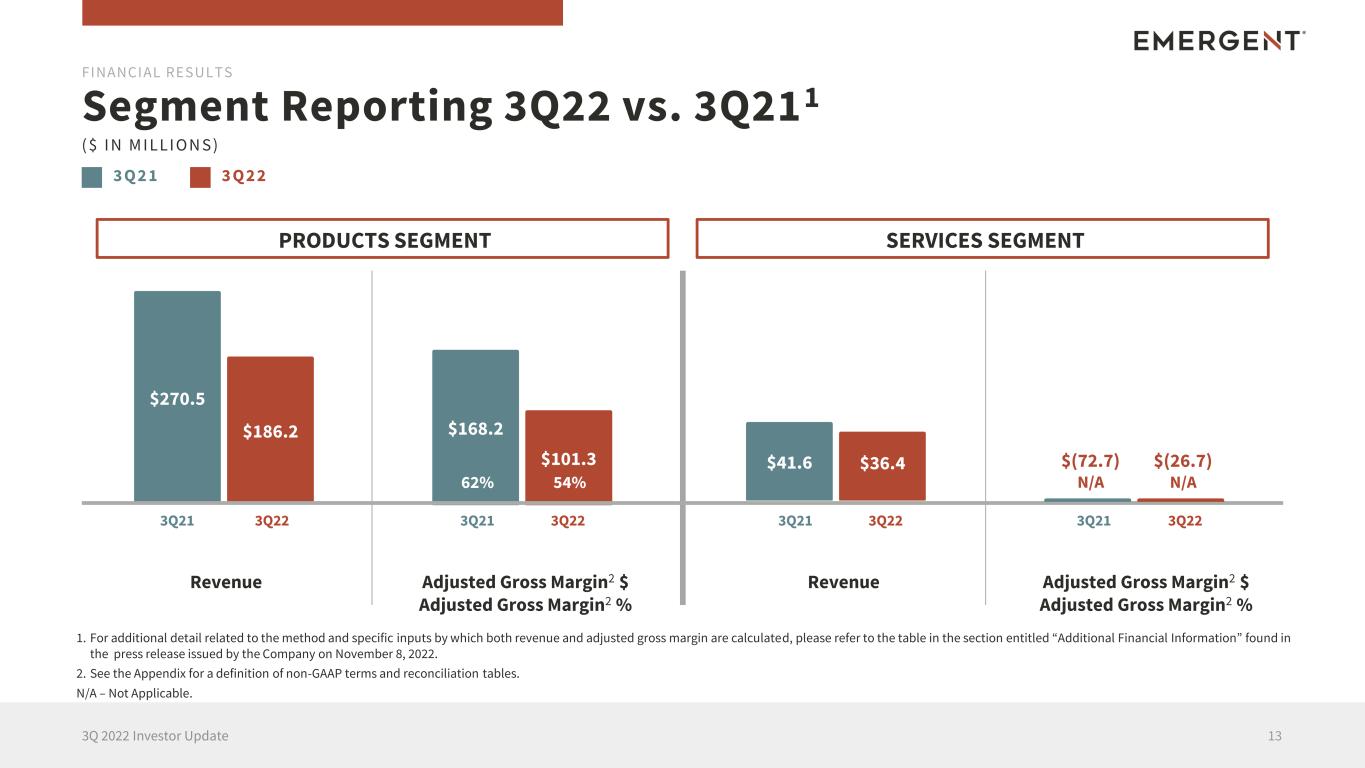
3 Q 2 1 Segment Reporting 3Q22 vs. 3Q211 133Q 2022 Investor Update Revenue Adjusted Gross Margin2 $ Adjusted Gross Margin2 % Adjusted Gross Margin2 $ Adjusted Gross Margin2 % Revenue 1. For additional detail related to the method and specific inputs by which both revenue and adjusted gross margin are calculated, please refer to the table in the section entitled “Additional Financial Information” found in the press release issued by the Company on November 8, 2022. 2. See the Appendix for a definition of non-GAAP terms and reconciliation tables. N/A – Not Applicable. $270.5 $186.2 FINANCIAL RESULTS $168.2 $101.3 ( $ I N M I LLI O N S ) 3 Q 2 2 3Q21 3Q22 3Q21 3Q22 3Q21 3Q22 3Q21 3Q22 PRODUCTS SEGMENT SERVICES SEGMENT 62% 54% $41.6 $36.4 $(26.7) N/A $(72.7) N/A
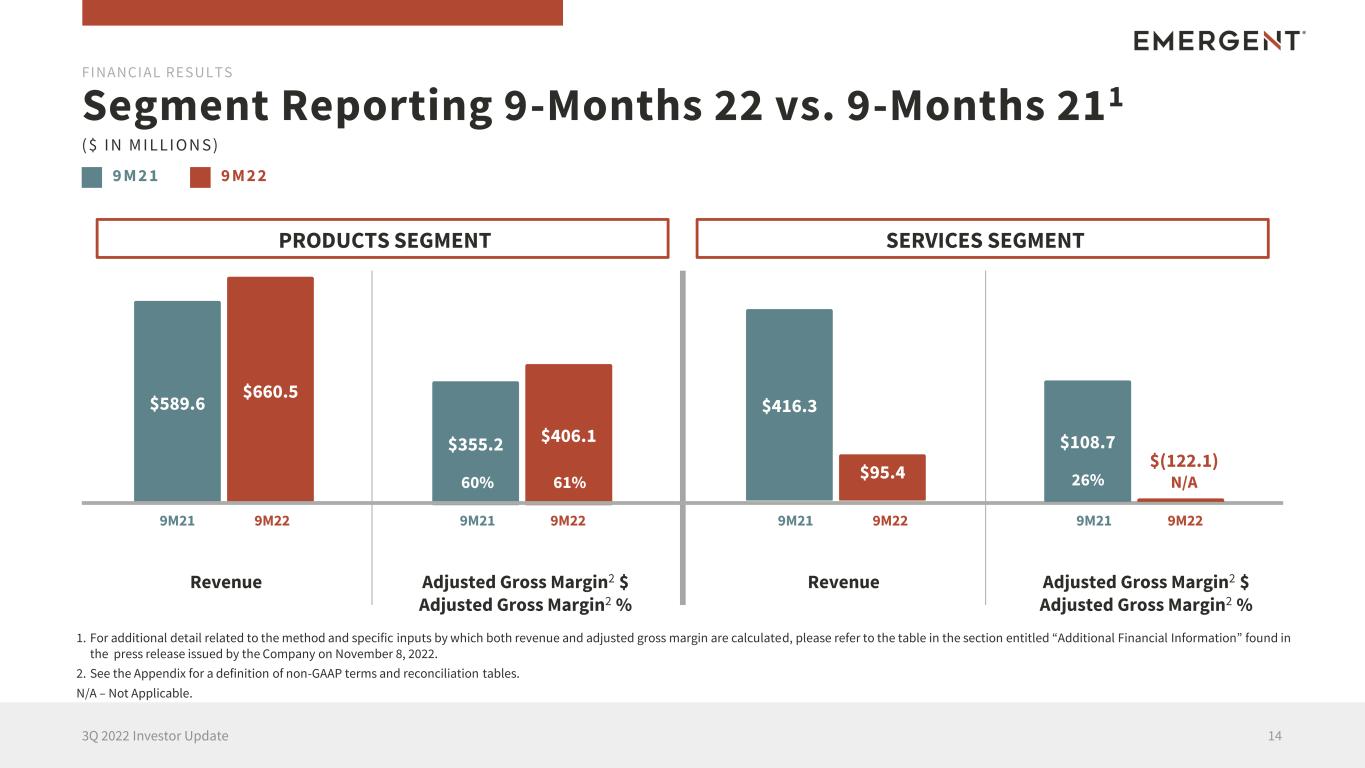
9 M 2 1 Segment Reporting 9-Months 22 vs. 9-Months 211 143Q 2022 Investor Update Revenue Adjusted Gross Margin2 $ Adjusted Gross Margin2 % Adjusted Gross Margin2 $ Adjusted Gross Margin2 % Revenue $589.6 $660.5 FINANCIAL RESULTS $355.2 $406.1 ( $ I N M I LLI O N S ) 9 M 2 2 9M21 9M22 9M21 9M22 9M21 9M22 9M21 9M22 PRODUCTS SEGMENT SERVICES SEGMENT 60% 61% $416.3 $95.4 $108.7 $(122.1) N/A26% 1. For additional detail related to the method and specific inputs by which both revenue and adjusted gross margin are calculated, please refer to the table in the section entitled “Additional Financial Information” found in the press release issued by the Company on November 8, 2022. 2. See the Appendix for a definition of non-GAAP terms and reconciliation tables. N/A – Not Applicable.
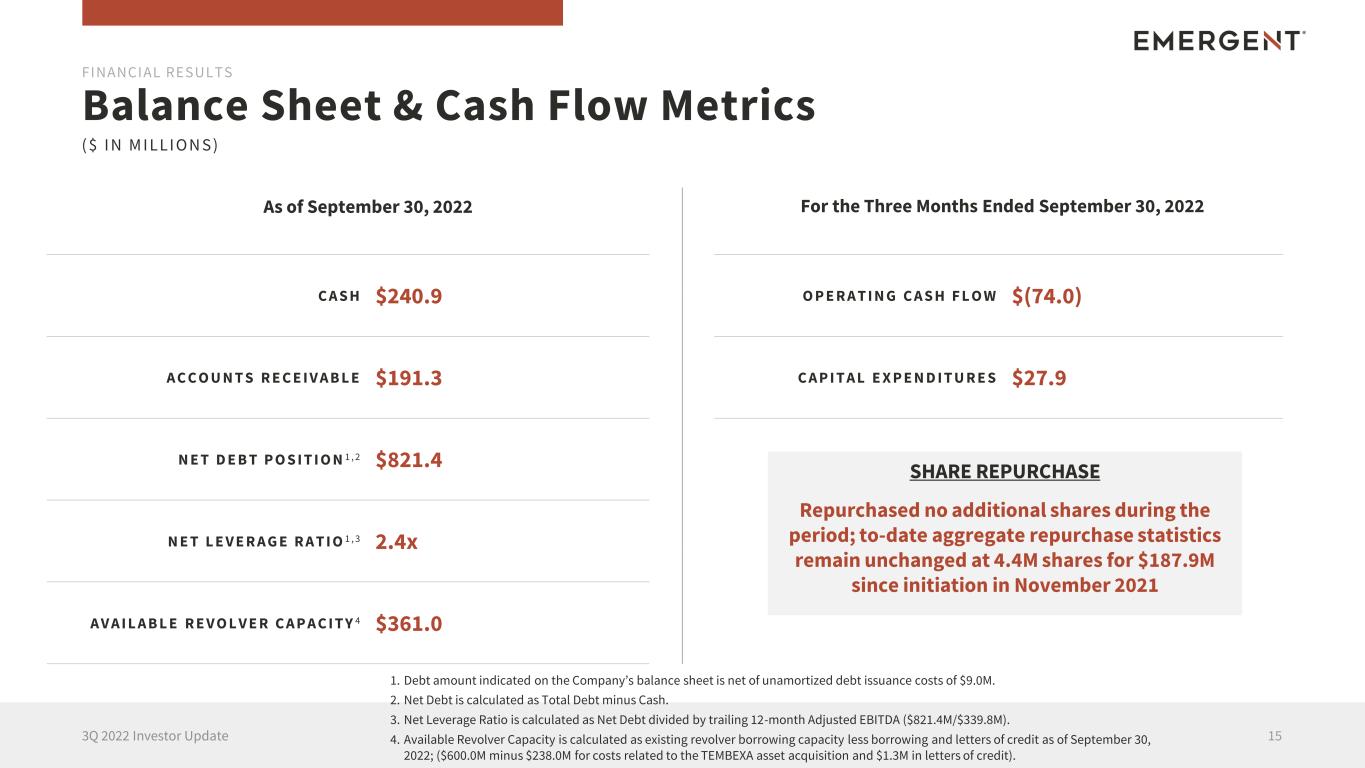
Balance Sheet & Cash Flow Metrics 153Q 2022 Investor Update 1. Debt amount indicated on the Company’s balance sheet is net of unamortized debt issuance costs of $9.0M. 2. Net Debt is calculated as Total Debt minus Cash. 3. Net Leverage Ratio is calculated as Net Debt divided by trailing 12-month Adjusted EBITDA ($821.4M/$339.8M). 4. Available Revolver Capacity is calculated as existing revolver borrowing capacity less borrowing and letters of credit as of September 30, 2022; ($600.0M minus $238.0M for costs related to the TEMBEXA asset acquisition and $1.3M in letters of credit). FINANCIAL RESULTS As of September 30, 2022 For the Three Months Ended September 30, 2022 C A S H $240.9 A C C O U N T S R E C E I V A B L E $191.3 N E T D E B T P O S I T I O N 1 , 2 $821.4 N E T L E V E R A G E R A T I O 1 , 3 2.4x A V A I L A B L E R E V O L V E R C A P A C I T Y 4 $361.0 O P E R A T I N G C A S H F L O W $(74.0) C A P I T A L E X P E N D I T U R E S $27.9 ( $ I N M I LLI O N S ) SHARE REPURCHASE Repurchased no additional shares during the period; to-date aggregate repurchase statistics remain unchanged at 4.4M shares for $187.9M since initiation in November 2021
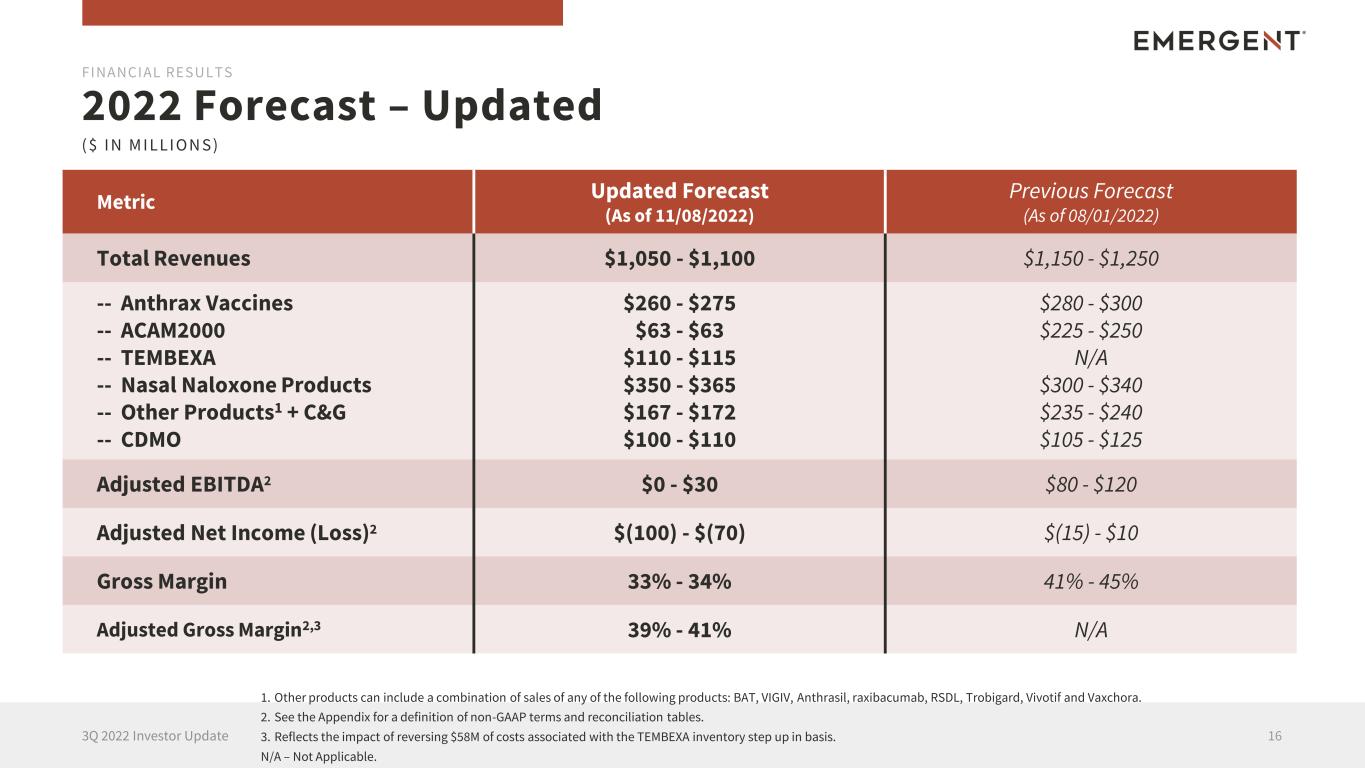
2022 Forecast – Updated 163Q 2022 Investor Update FINANCIAL RESULTS ( $ I N M I LLI O N S ) Metric Updated Forecast (As of 11/08/2022) Previous Forecast (As of 08/01/2022) Total Revenues $1,050 - $1,100 $1,150 - $1,250 -- Anthrax Vaccines -- ACAM2000 -- TEMBEXA -- Nasal Naloxone Products -- Other Products1 + C&G -- CDMO $260 - $275 $63 - $63 $110 - $115 $350 - $365 $167 - $172 $100 - $110 $280 - $300 $225 - $250 N/A $300 - $340 $235 - $240 $105 - $125 Adjusted EBITDA2 $0 - $30 $80 - $120 Adjusted Net Income (Loss)2 $(100) - $(70) $(15) - $10 Gross Margin 33% - 34% 41% - 45% Adjusted Gross Margin2,3 39% - 41% N/A 1. Other products can include a combination of sales of any of the following products: BAT, VIGIV, Anthrasil, raxibacumab, RSDL, Trobigard, Vivotif and Vaxchora. 2. See the Appendix for a definition of non-GAAP terms and reconciliation tables. 3. Reflects the impact of reversing $58M of costs associated with the TEMBEXA inventory step up in basis. N/A – Not Applicable.
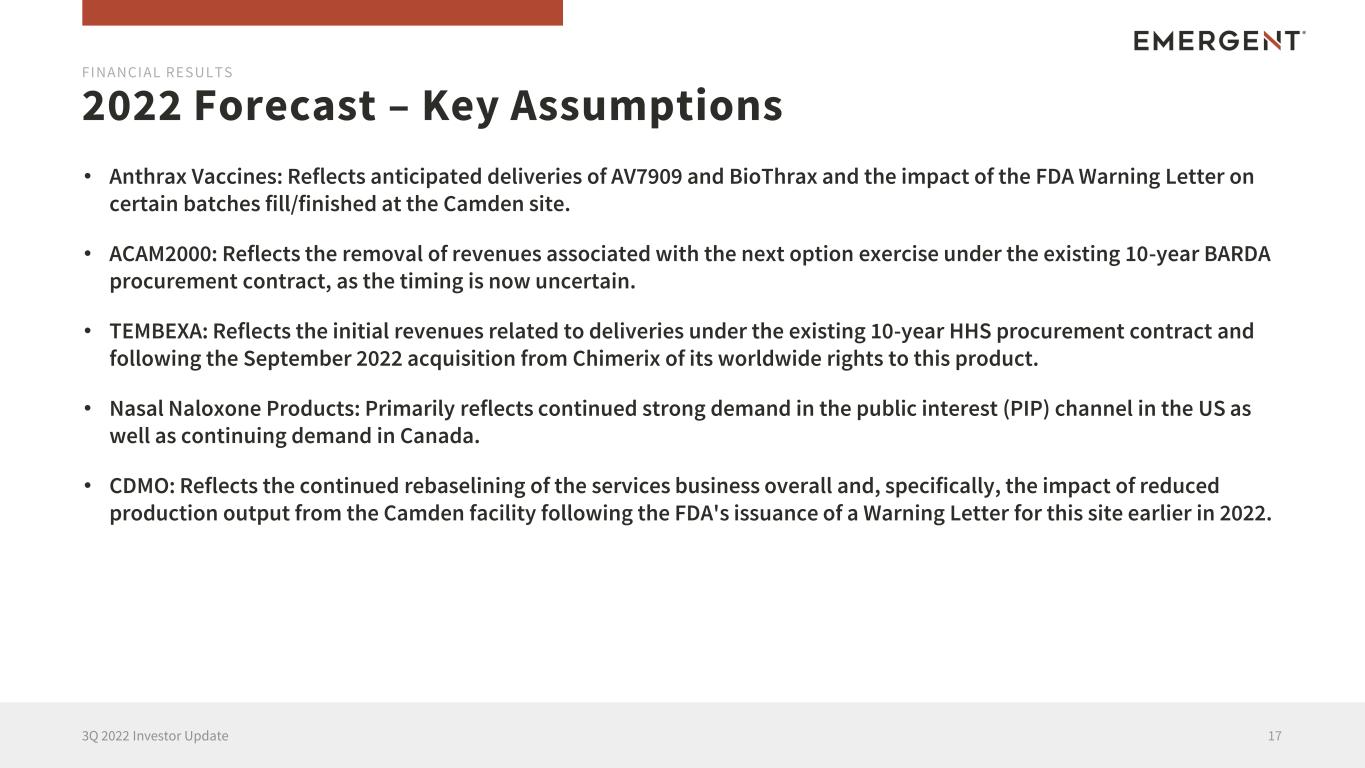
2022 Forecast – Key Assumptions 173Q 2022 Investor Update FINANCIAL RESULTS • Anthrax Vaccines: Reflects anticipated deliveries of AV7909 and BioThrax and the impact of the FDA Warning Letter on certain batches fill/finished at the Camden site. • ACAM2000: Reflects the removal of revenues associated with the next option exercise under the existing 10-year BARDA procurement contract, as the timing is now uncertain. • TEMBEXA: Reflects the initial revenues related to deliveries under the existing 10-year HHS procurement contract and following the September 2022 acquisition from Chimerix of its worldwide rights to this product. • Nasal Naloxone Products: Primarily reflects continued strong demand in the public interest (PIP) channel in the US as well as continuing demand in Canada. • CDMO: Reflects the continued rebaselining of the services business overall and, specifically, the impact of reduced production output from the Camden facility following the FDA's issuance of a Warning Letter for this site earlier in 2022.
Results reflects a mix of strong performance in core products areas offset by ongoing challenges in the services business Key Takeaways 183Q 2022 Investor Update FINANCIAL RESULTS Near-term uncertainty associated with the ACAM contract option exercise Remain confident in the impact we are having on patients and customers focused on health security and pandemic preparedness
PROPRIETARY AND CONFIDENTIAL 193Q 2022 Investor Update Q&A
203Q 2022 Investor Update Appendix
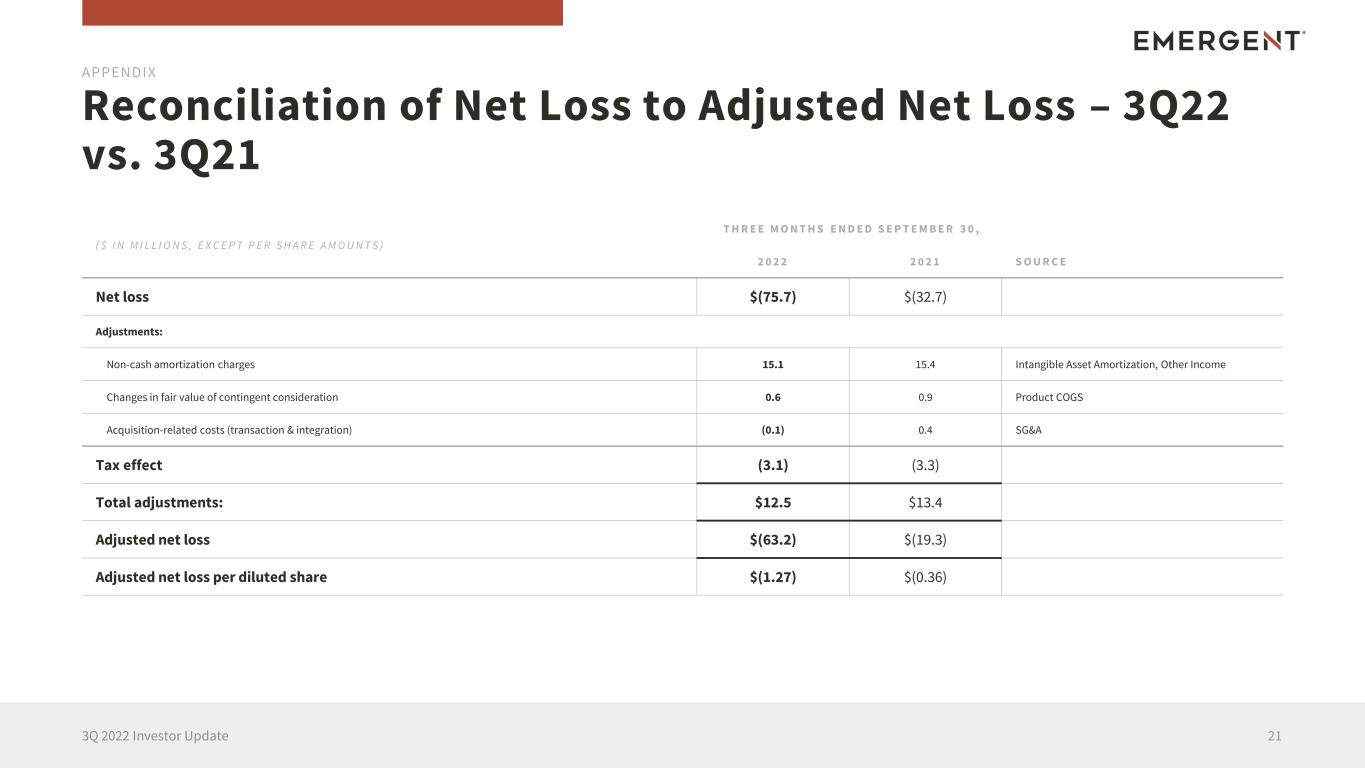
Reconciliation of Net Loss to Adjusted Net Loss – 3Q22 vs. 3Q21 213Q 2022 Investor Update APPENDIX ( $ I N M I L L I O N S , E X C E P T P E R S H A R E A M O U N T S ) T H R E E M O N T H S E N D E D S E P T E M B E R 3 0 , 2 0 2 2 2 0 2 1 S O U R C E Net loss $(75.7) $(32.7) Adjustments: Non-cash amortization charges 15.1 15.4 Intangible Asset Amortization, Other Income Changes in fair value of contingent consideration 0.6 0.9 Product COGS Acquisition-related costs (transaction & integration) (0.1) 0.4 SG&A Tax effect (3.1) (3.3) Total adjustments: $12.5 $13.4 Adjusted net loss $(63.2) $(19.3) Adjusted net loss per diluted share $(1.27) $(0.36)
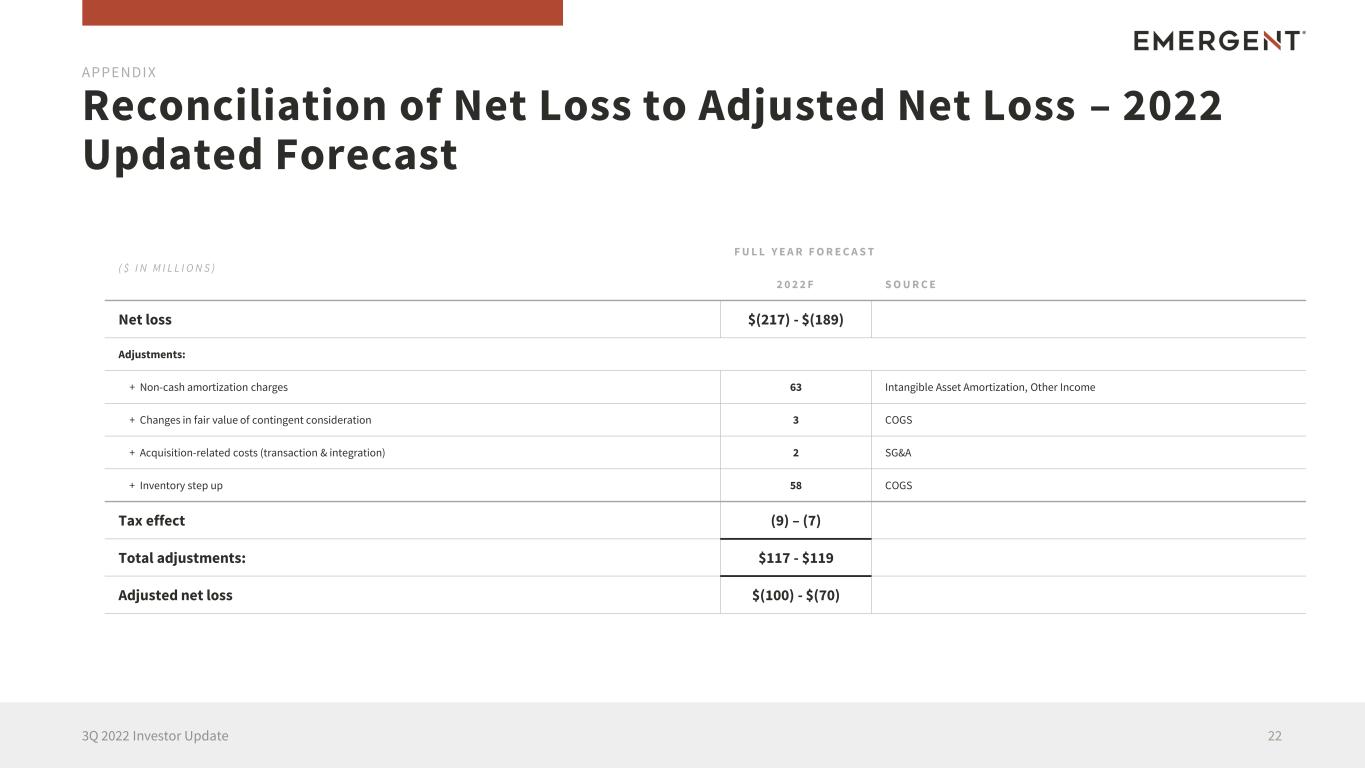
Reconciliation of Net Loss to Adjusted Net Loss – 2022 Updated Forecast 223Q 2022 Investor Update APPENDIX ( $ I N M I L L I O N S ) F U L L Y E A R F O R E C A S T 2 0 2 2 F S O U R C E Net loss $(217) - $(189) Adjustments: + Non-cash amortization charges 63 Intangible Asset Amortization, Other Income + Changes in fair value of contingent consideration 3 COGS + Acquisition-related costs (transaction & integration) 2 SG&A + Inventory step up 58 COGS Tax effect (9) – (7) Total adjustments: $117 - $119 Adjusted net loss $(100) - $(70)
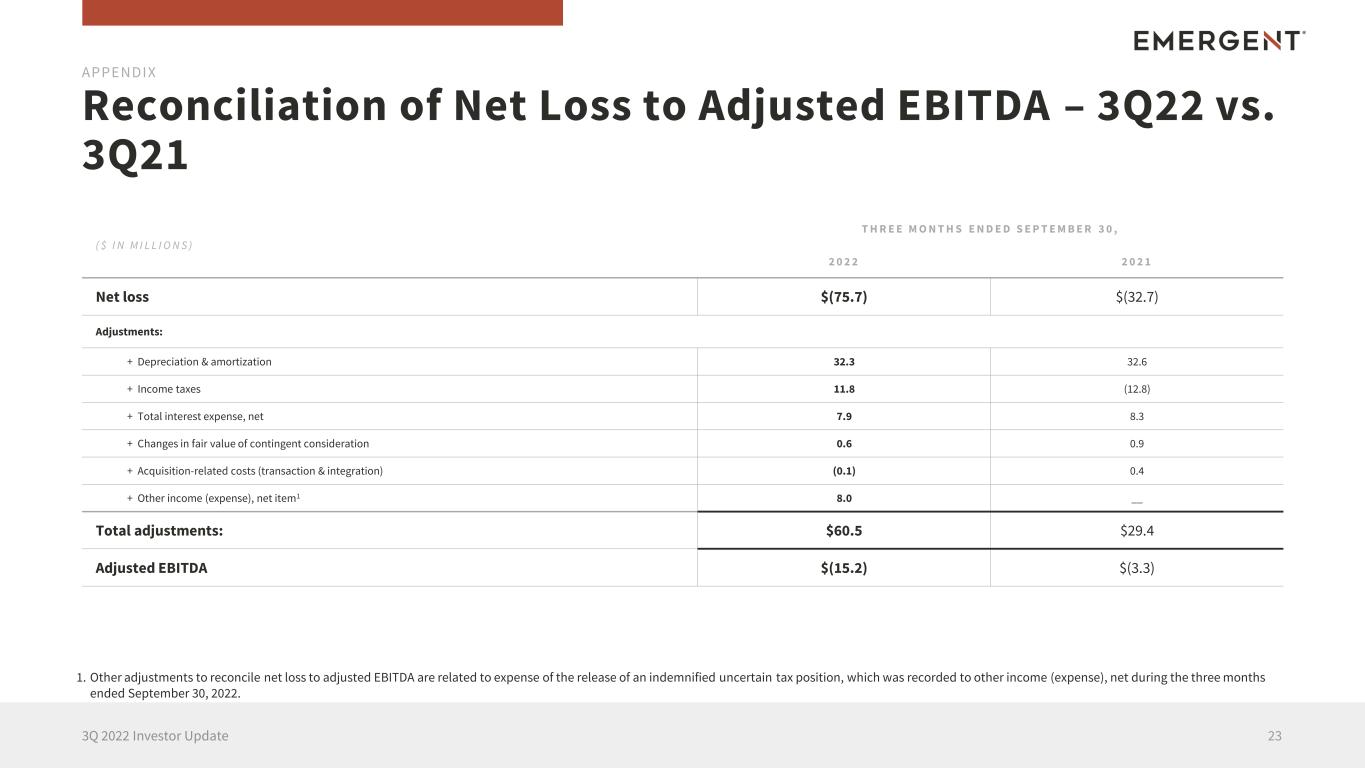
Reconciliation of Net Loss to Adjusted EBITDA – 3Q22 vs. 3Q21 233Q 2022 Investor Update APPENDIX ( $ I N M I L L I O N S ) T H R E E M O N T H S E N D E D S E P T E M B E R 3 0 , 2 0 2 2 2 0 2 1 Net loss $(75.7) $(32.7) Adjustments: + Depreciation & amortization 32.3 32.6 + Income taxes 11.8 (12.8) + Total interest expense, net 7.9 8.3 + Changes in fair value of contingent consideration 0.6 0.9 + Acquisition-related costs (transaction & integration) (0.1) 0.4 + Other income (expense), net item1 8.0 __ Total adjustments: $60.5 $29.4 Adjusted EBITDA $(15.2) $(3.3) 1. Other adjustments to reconcile net loss to adjusted EBITDA are related to expense of the release of an indemnified uncertain tax position, which was recorded to other income (expense), net during the three months ended September 30, 2022.
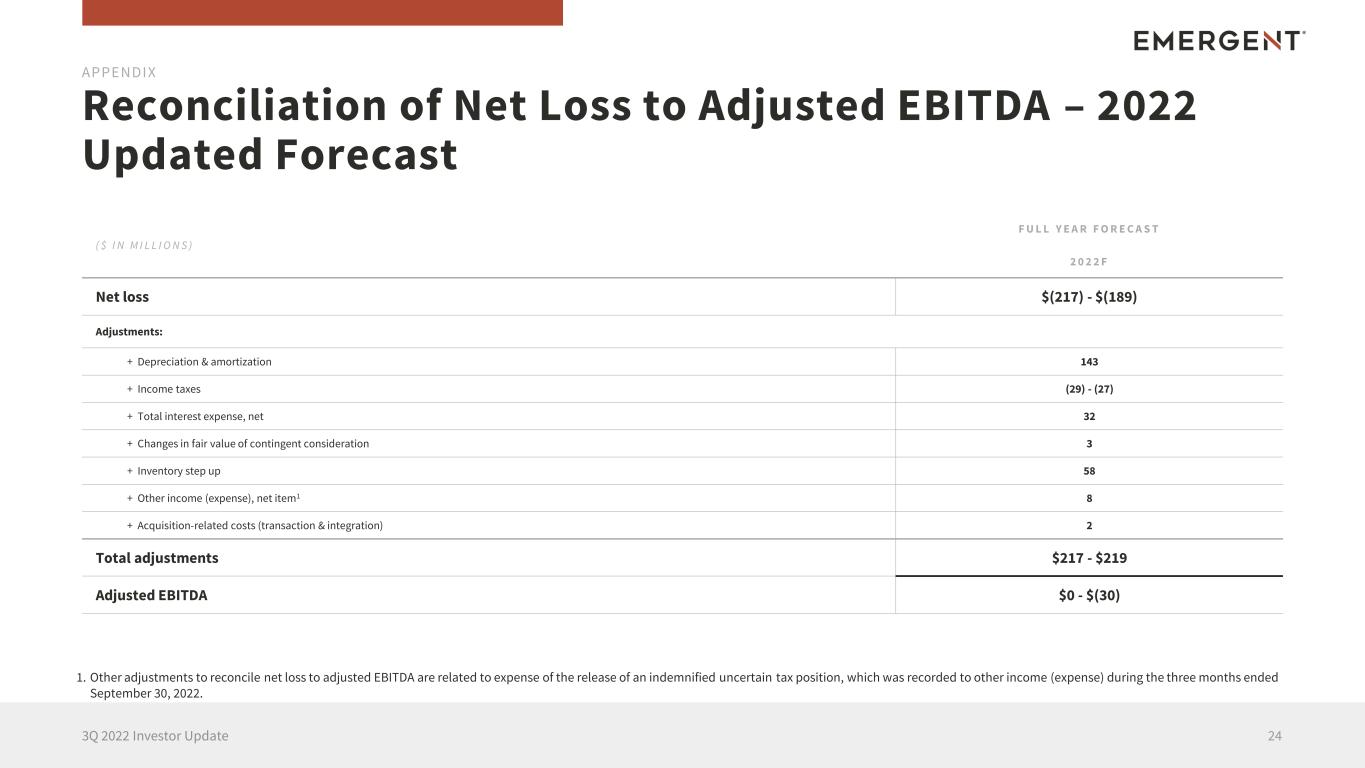
Reconciliation of Net Loss to Adjusted EBITDA – 2022 Updated Forecast 243Q 2022 Investor Update APPENDIX ( $ I N M I L L I O N S ) F U L L Y E A R F O R E C A S T 2 0 2 2 F Net loss $(217) - $(189) Adjustments: + Depreciation & amortization 143 + Income taxes (29) - (27) + Total interest expense, net 32 + Changes in fair value of contingent consideration 3 + Inventory step up 58 + Other income (expense), net item1 8 + Acquisition-related costs (transaction & integration) 2 Total adjustments $217 - $219 Adjusted EBITDA $0 - $(30) 1. Other adjustments to reconcile net loss to adjusted EBITDA are related to expense of the release of an indemnified uncertain tax position, which was recorded to other income (expense) during the three months ended September 30, 2022.
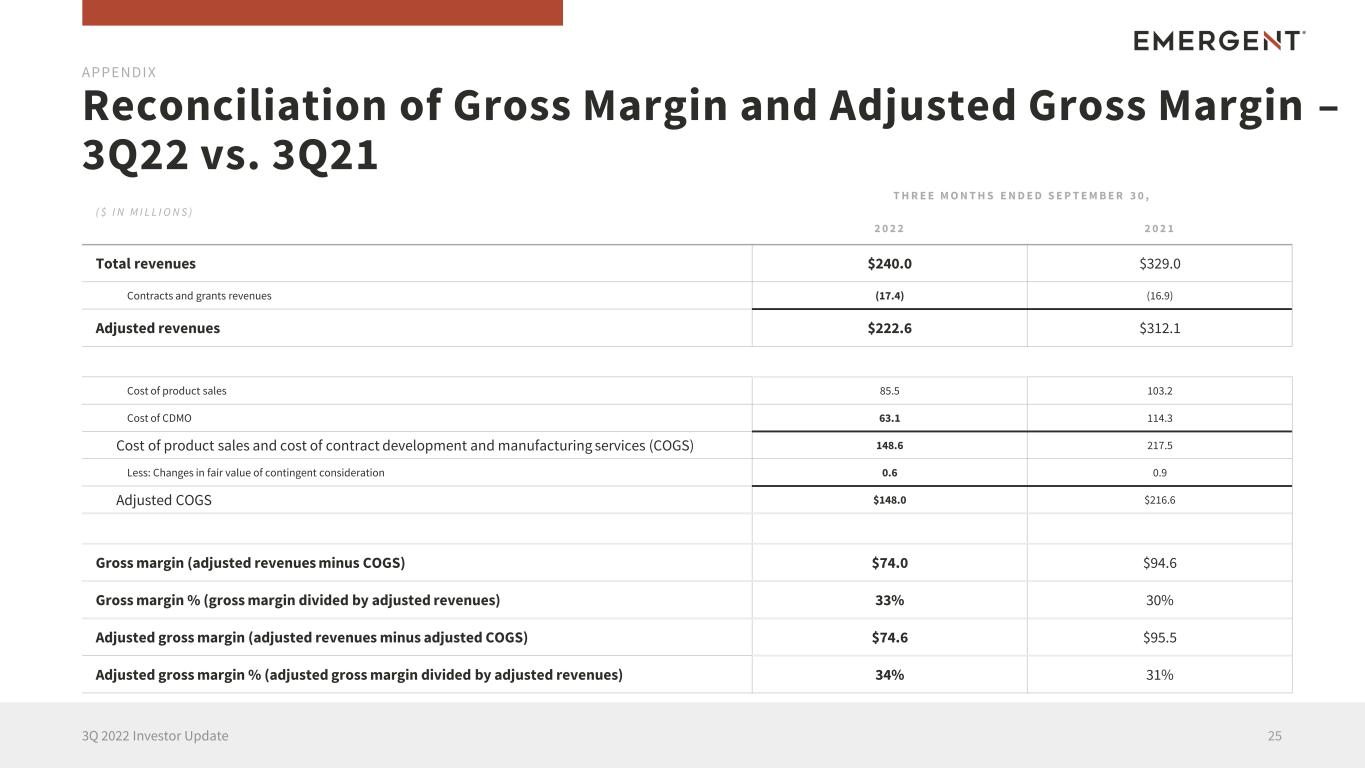
Reconciliation of Gross Margin and Adjusted Gross Margin – 3Q22 vs. 3Q21 253Q 2022 Investor Update APPENDIX ( $ I N M I L L I O N S ) T H R E E M O N T H S E N D E D S E P T E M B E R 3 0 , 2 0 2 2 2 0 2 1 Total revenues $240.0 $329.0 Contracts and grants revenues (17.4) (16.9) Adjusted revenues $222.6 $312.1 Cost of product sales 85.5 103.2 Cost of CDMO 63.1 114.3 Cost of product sales and cost of contract development and manufacturing services (COGS) 148.6 217.5 Less: Changes in fair value of contingent consideration 0.6 0.9 Adjusted COGS $148.0 $216.6 Gross margin (adjusted revenues minus COGS) $74.0 $94.6 Gross margin % (gross margin divided by adjusted revenues) 33% 30% Adjusted gross margin (adjusted revenues minus adjusted COGS) $74.6 $95.5 Adjusted gross margin % (adjusted gross margin divided by adjusted revenues) 34% 31%

www.emergentbiosolutions.com


