Q4FY 2022 Financial Results Update February 27, 2023
PROPRIETARY AND CONFIDENTIAL 2Q4FY 2022 Investor Update Introduction Bob Burrows Vice President, Investor Relations Officer EMERGE NT"
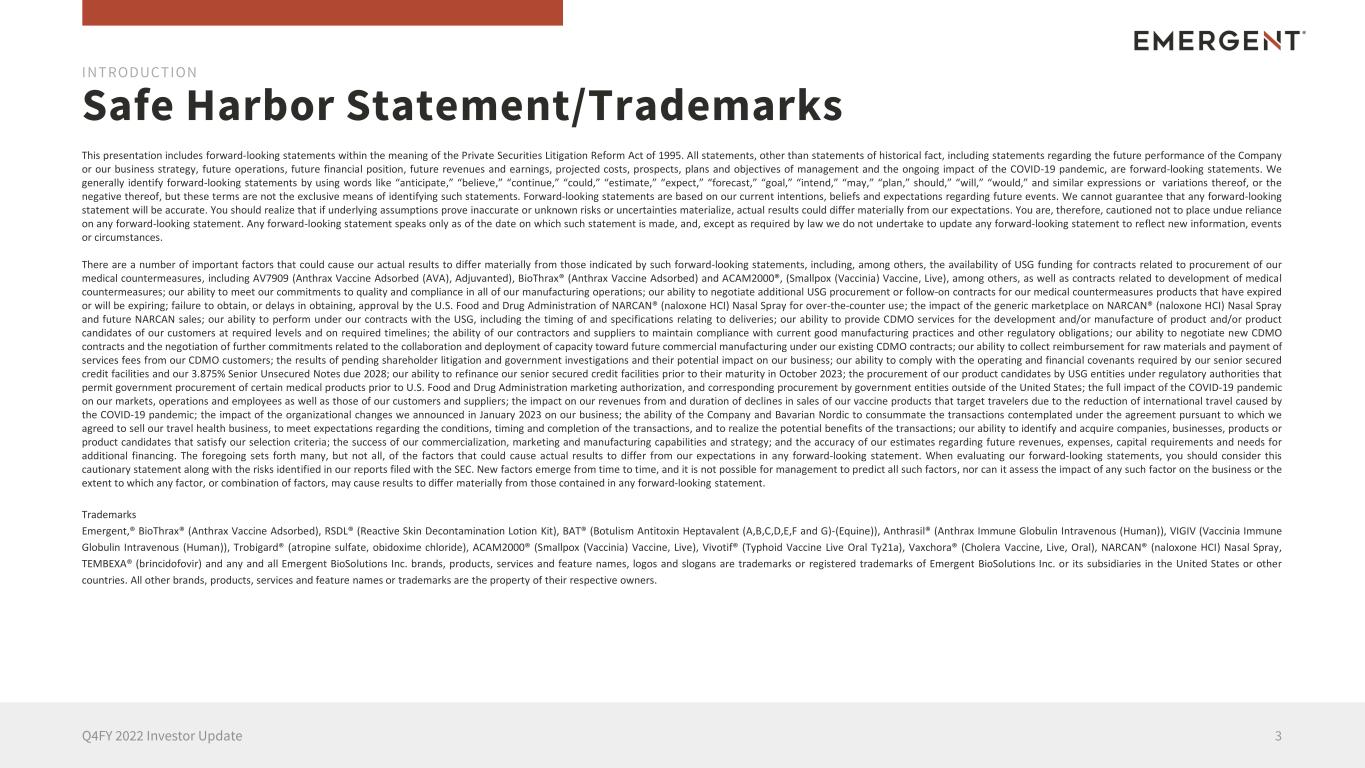
This presentation includes forward-looking statements within the meaning of the Private Securities Litigation Reform Act of 1995. All statements, other than statements of historical fact, including statements regarding the future performance of the Company or our business strategy, future operations, future financial position, future revenues and earnings, projected costs, prospects, plans and objectives of management and the ongoing impact of the COVID-19 pandemic, are forward-looking statements. We generally identify forward-looking statements by using words like “anticipate,” “believe,” “continue,” “could,” “estimate,” “expect,” “forecast,” “goal,” “intend,” “may,” “plan,” should,” “will,” “would,” and similar expressions or variations thereof, or the negative thereof, but these terms are not the exclusive means of identifying such statements. Forward-looking statements are based on our current intentions, beliefs and expectations regarding future events. We cannot guarantee that any forward-looking statement will be accurate. You should realize that if underlying assumptions prove inaccurate or unknown risks or uncertainties materialize, actual results could differ materially from our expectations. You are, therefore, cautioned not to place undue reliance on any forward-looking statement. Any forward-looking statement speaks only as of the date on which such statement is made, and, except as required by law we do not undertake to update any forward-looking statement to reflect new information, events or circumstances. There are a number of important factors that could cause our actual results to differ materially from those indicated by such forward-looking statements, including, among others, the availability of USG funding for contracts related to procurement of our medical countermeasures, including AV7909 (Anthrax Vaccine Adsorbed (AVA), Adjuvanted), BioThrax® (Anthrax Vaccine Adsorbed) and ACAM2000®, (Smallpox (Vaccinia) Vaccine, Live), among others, as well as contracts related to development of medical countermeasures; our ability to meet our commitments to quality and compliance in all of our manufacturing operations; our ability to negotiate additional USG procurement or follow-on contracts for our medical countermeasures products that have expired or will be expiring; failure to obtain, or delays in obtaining, approval by the U.S. Food and Drug Administration of NARCAN® (naloxone HCI) Nasal Spray for over-the-counter use; the impact of the generic marketplace on NARCAN® (naloxone HCI) Nasal Spray and future NARCAN sales; our ability to perform under our contracts with the USG, including the timing of and specifications relating to deliveries; our ability to provide CDMO services for the development and/or manufacture of product and/or product candidates of our customers at required levels and on required timelines; the ability of our contractors and suppliers to maintain compliance with current good manufacturing practices and other regulatory obligations; our ability to negotiate new CDMO contracts and the negotiation of further commitments related to the collaboration and deployment of capacity toward future commercial manufacturing under our existing CDMO contracts; our ability to collect reimbursement for raw materials and payment of services fees from our CDMO customers; the results of pending shareholder litigation and government investigations and their potential impact on our business; our ability to comply with the operating and financial covenants required by our senior secured credit facilities and our 3.875% Senior Unsecured Notes due 2028; our ability to refinance our senior secured credit facilities prior to their maturity in October 2023; the procurement of our product candidates by USG entities under regulatory authorities that permit government procurement of certain medical products prior to U.S. Food and Drug Administration marketing authorization, and corresponding procurement by government entities outside of the United States; the full impact of the COVID-19 pandemic on our markets, operations and employees as well as those of our customers and suppliers; the impact on our revenues from and duration of declines in sales of our vaccine products that target travelers due to the reduction of international travel caused by the COVID-19 pandemic; the impact of the organizational changes we announced in January 2023 on our business; the ability of the Company and Bavarian Nordic to consummate the transactions contemplated under the agreement pursuant to which we agreed to sell our travel health business, to meet expectations regarding the conditions, timing and completion of the transactions, and to realize the potential benefits of the transactions; our ability to identify and acquire companies, businesses, products or product candidates that satisfy our selection criteria; the success of our commercialization, marketing and manufacturing capabilities and strategy; and the accuracy of our estimates regarding future revenues, expenses, capital requirements and needs for additional financing. The foregoing sets forth many, but not all, of the factors that could cause actual results to differ from our expectations in any forward-looking statement. When evaluating our forward-looking statements, you should consider this cautionary statement along with the risks identified in our reports filed with the SEC. New factors emerge from time to time, and it is not possible for management to predict all such factors, nor can it assess the impact of any such factor on the business or the extent to which any factor, or combination of factors, may cause results to differ materially from those contained in any forward-looking statement. Trademarks Emergent,® BioThrax® (Anthrax Vaccine Adsorbed), RSDL® (Reactive Skin Decontamination Lotion Kit), BAT® (Botulism Antitoxin Heptavalent (A,B,C,D,E,F and G)-(Equine)), Anthrasil® (Anthrax Immune Globulin Intravenous (Human)), VIGIV (Vaccinia Immune Globulin Intravenous (Human)), Trobigard® (atropine sulfate, obidoxime chloride), ACAM2000® (Smallpox (Vaccinia) Vaccine, Live), Vivotif® (Typhoid Vaccine Live Oral Ty21a), Vaxchora® (Cholera Vaccine, Live, Oral), NARCAN® (naloxone HCI) Nasal Spray, TEMBEXA® (brincidofovir) and any and all Emergent BioSolutions Inc. brands, products, services and feature names, logos and slogans are trademarks or registered trademarks of Emergent BioSolutions Inc. or its subsidiaries in the United States or other countries. All other brands, products, services and feature names or trademarks are the property of their respective owners. 3Q4FY 2022 Investor Update Safe Harbor Statement/Trademarks INTRODUCTION EMERGE NT"
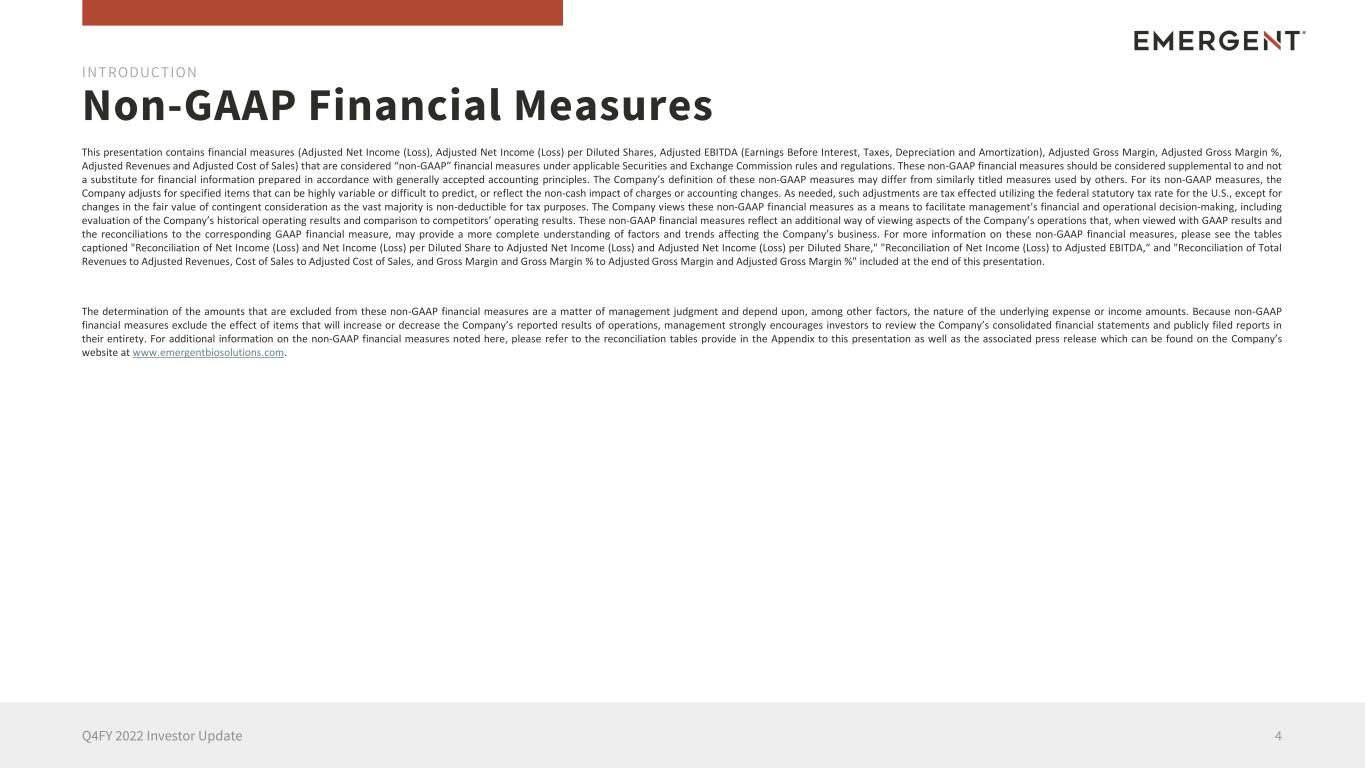
This presentation contains financial measures (Adjusted Net Income (Loss), Adjusted Net Income (Loss) per Diluted Shares, Adjusted EBITDA (Earnings Before Interest, Taxes, Depreciation and Amortization), Adjusted Gross Margin, Adjusted Gross Margin %, Adjusted Revenues and Adjusted Cost of Sales) that are considered “non-GAAP” financial measures under applicable Securities and Exchange Commission rules and regulations. These non-GAAP financial measures should be considered supplemental to and not a substitute for financial information prepared in accordance with generally accepted accounting principles. The Company’s definition of these non-GAAP measures may differ from similarly titled measures used by others. For its non-GAAP measures, the Company adjusts for specified items that can be highly variable or difficult to predict, or reflect the non-cash impact of charges or accounting changes. As needed, such adjustments are tax effected utilizing the federal statutory tax rate for the U.S., except for changes in the fair value of contingent consideration as the vast majority is non-deductible for tax purposes. The Company views these non-GAAP financial measures as a means to facilitate management’s financial and operational decision-making, including evaluation of the Company’s historical operating results and comparison to competitors’ operating results. These non-GAAP financial measures reflect an additional way of viewing aspects of the Company’s operations that, when viewed with GAAP results and the reconciliations to the corresponding GAAP financial measure, may provide a more complete understanding of factors and trends affecting the Company’s business. For more information on these non-GAAP financial measures, please see the tables captioned "Reconciliation of Net Income (Loss) and Net Income (Loss) per Diluted Share to Adjusted Net Income (Loss) and Adjusted Net Income (Loss) per Diluted Share," "Reconciliation of Net Income (Loss) to Adjusted EBITDA,“ and "Reconciliation of Total Revenues to Adjusted Revenues, Cost of Sales to Adjusted Cost of Sales, and Gross Margin and Gross Margin % to Adjusted Gross Margin and Adjusted Gross Margin %" included at the end of this presentation. The determination of the amounts that are excluded from these non-GAAP financial measures are a matter of management judgment and depend upon, among other factors, the nature of the underlying expense or income amounts. Because non-GAAP financial measures exclude the effect of items that will increase or decrease the Company’s reported results of operations, management strongly encourages investors to review the Company’s consolidated financial statements and publicly filed reports in their entirety. For additional information on the non-GAAP financial measures noted here, please refer to the reconciliation tables provide in the Appendix to this presentation as well as the associated press release which can be found on the Company’s website at www.emergentbiosolutions.com. 4Q4FY 2022 Investor Update Non-GAAP Financial Measures INTRODUCTION EMERGE NT"
Agenda 5Q4FY 2022 Investor Update INTRODUCTION Q&A • Bob Kramer, CEO • Rich Lindahl, CFO • Other members of the senior management team, as needed Financial Results: -- Q4 2022 vs. Q4 2021 -- FY 2022 vs. FY 2021 • Rich Lindahl, CFO State of the Company: -- Q4 2022 -- FY 2022 -- Key 2023 Priorities • Bob Kramer, CEO Financial Forecast: -- FY 2023 -- Q1 2023 • Rich Lindahl, CFO EMERGE NT"
PROPRIETARY AND CONFIDENTIALQ4FY 2022 Investor Update State of the Company Bob Kramer President and Chief Executive Officer 6 EMERGE NT"
Overview of Q4 and FY 2022; Focus Areas for FY 2023 7Q4FY 2022 Investor Update STATE OF THE COMPANY • 2022 results and 2023 guidance serve as baseline for growth in line with pre-COVID trends • Update to long-term view, informed by sharpened strategic focus underway, anticipated by YE23 • 2023 Focus Areas 1. Prioritize foundational MCM and NARCAN products 2. Strengthen quality, compliance and manufacturing capabilities 3. Make capital structure and expenditure decisions that build enterprise value 4. Manage our balance sheet and extend debt maturities EMERGE NT"
PROPRIETARY AND CONFIDENTIAL 84QFY 2022 Investor Update Financials Rich Lindahl Executive Vice President and Chief Financial Officer EMERGE NT"
Financial Principles and Implications of Sharpened Strategic Focus 9Q4FY 2022 Investor Update FINANCIAL RESULTS 1. Sustained revenue growth and improved profitability 2. Addressing near term challenges to credit profile EMERGE NT"
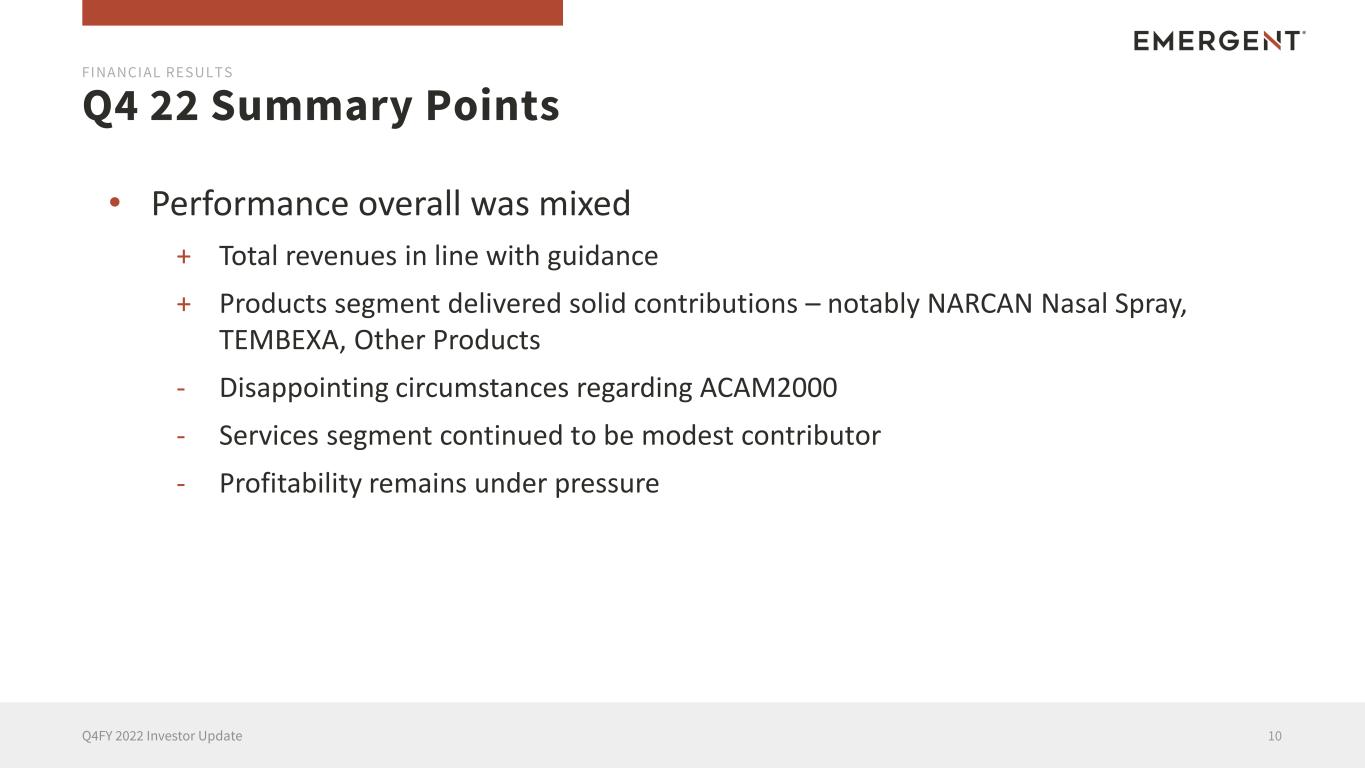
Q4 22 Summary Points 10Q4FY 2022 Investor Update FINANCIAL RESULTS • Performance overall was mixed + Total revenues in line with guidance + Products segment delivered solid contributions – notably NARCAN Nasal Spray, TEMBEXA, Other Products - Disappointing circumstances regarding ACAM2000 - Services segment continued to be modest contributor - Profitability remains under pressure EMERGE NT"
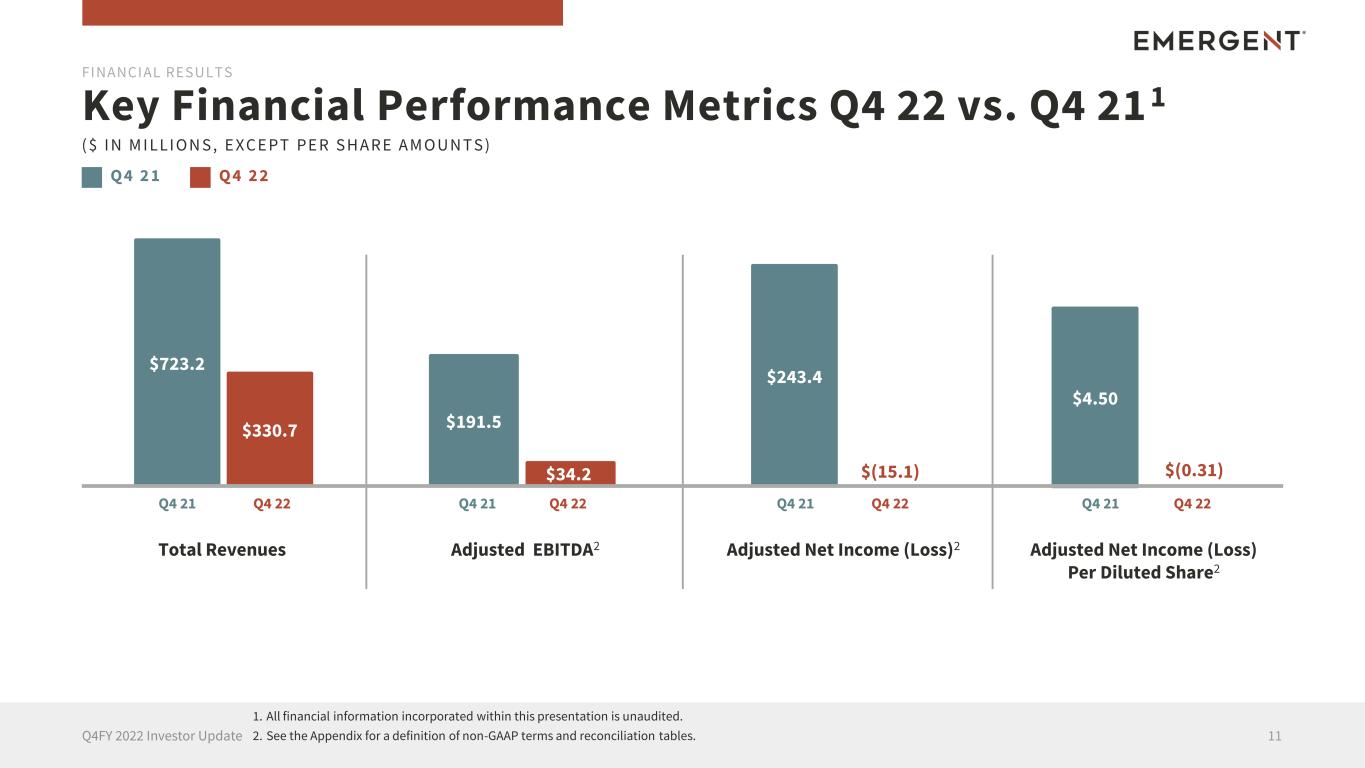
Q 4 2 1 Key Financial Performance Metrics Q4 22 vs. Q4 21 1 11Q4FY 2022 Investor Update Total Revenues Adjusted EBITDA2 Adjusted Net Income (Loss) Per Diluted Share2 Adjusted Net Income (Loss)2 $723.2 $330.7 $4.50 FINANCIAL RESULTS $191.5 $34.2 $243.4 ( $ I N M I LLI O N S , E XC E PT PE R S H A R E A M O U N T S ) Q 4 2 2 Q4 21 Q4 22 Q4 21 Q4 22 Q4 21 Q4 22 Q4 21 Q4 22 1. All financial information incorporated within this presentation is unaudited. 2. See the Appendix for a definition of non-GAAP terms and reconciliation tables. $(0.31)$(15.1) EMERGE NT" ■ ■
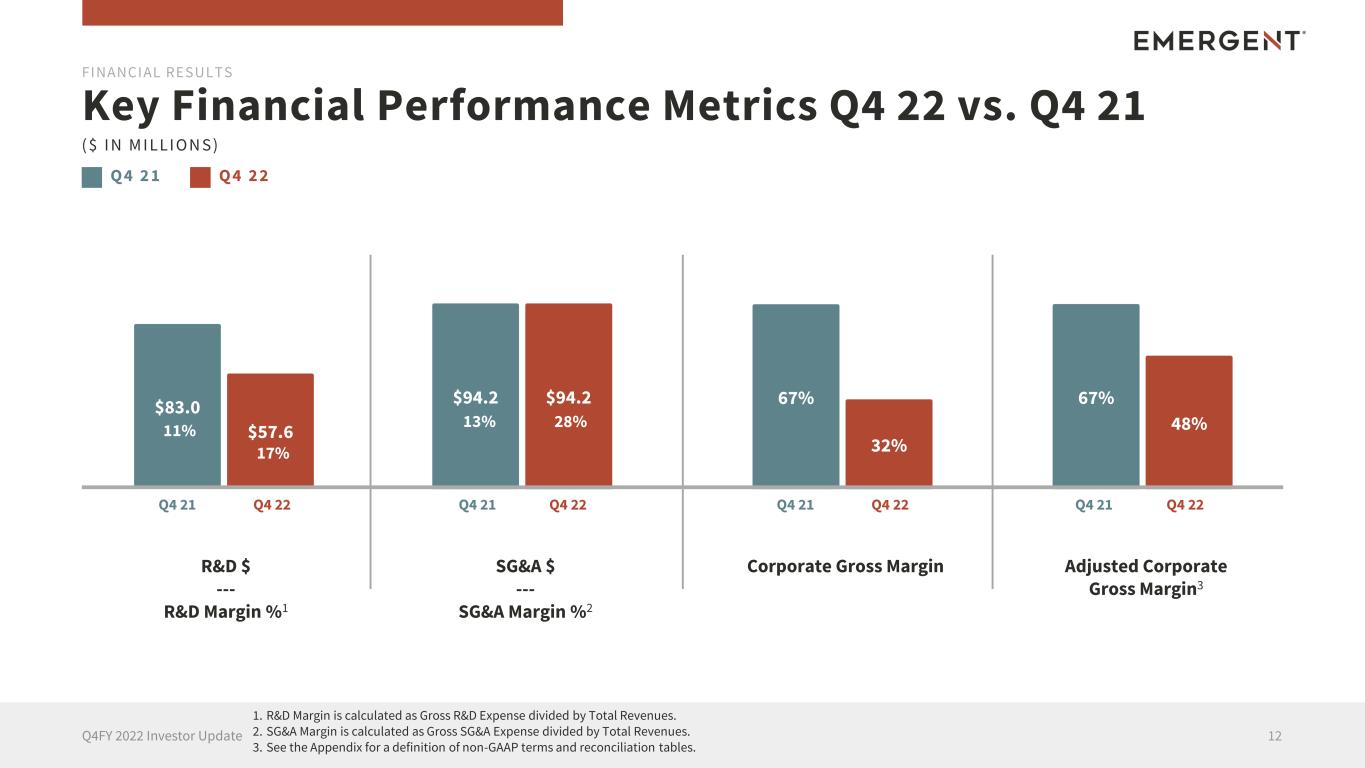
Q 4 2 1 Key Financial Performance Metrics Q4 22 vs. Q4 21 12Q4FY 2022 Investor Update R&D $ --- R&D Margin %1 SG&A $ --- SG&A Margin %2 Adjusted Corporate Gross Margin3 Corporate Gross Margin $83.0 $57.6 FINANCIAL RESULTS $94.2 $94.2 67% 32% ( $ I N M I LLI O N S ) Q 4 2 2 67% 48% Q4 21 Q4 22 Q4 21 Q4 22 Q4 21 Q4 22 Q4 21 Q4 22 11% 17% 13% 28% 1. R&D Margin is calculated as Gross R&D Expense divided by Total Revenues. 2. SG&A Margin is calculated as Gross SG&A Expense divided by Total Revenues. 3. See the Appendix for a definition of non-GAAP terms and reconciliation tables. EMERGE NT" ■ ■
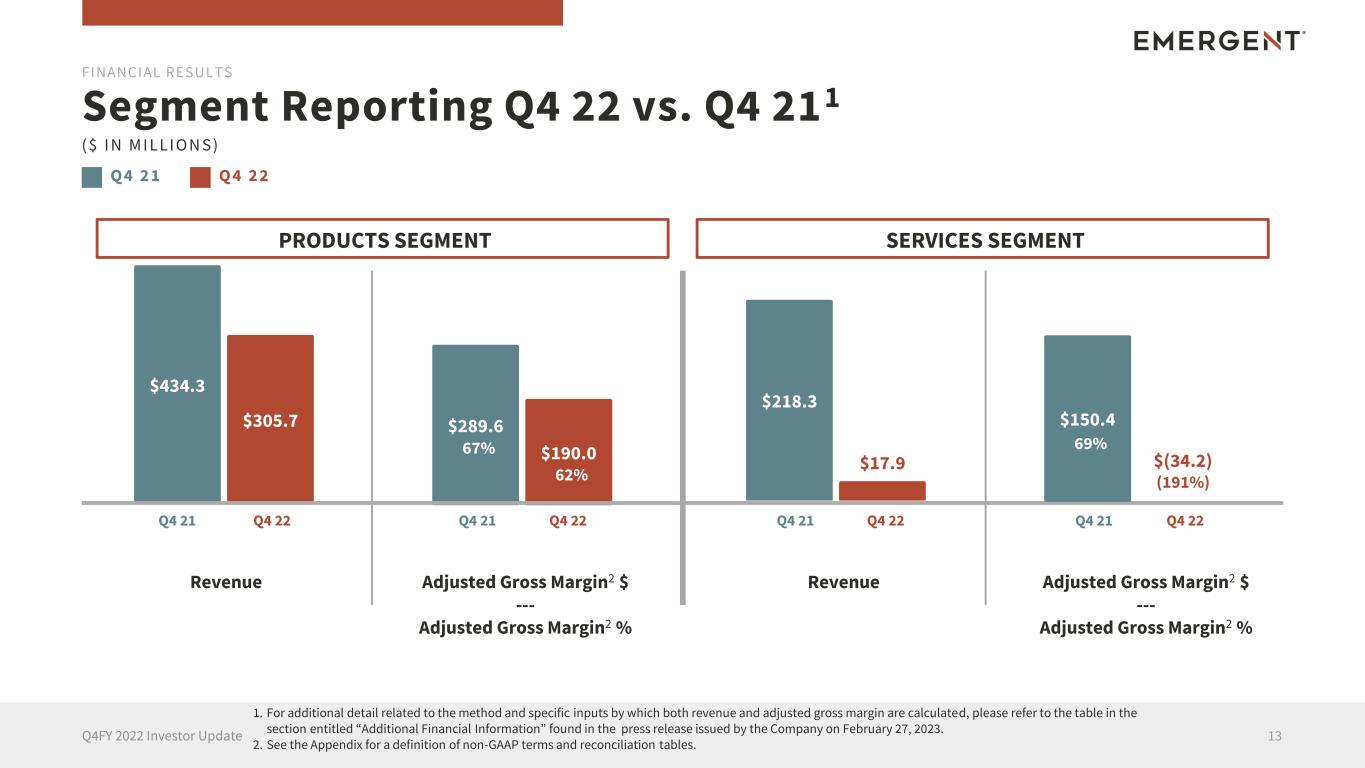
Q 4 2 1 Segment Reporting Q4 22 vs. Q4 211 13Q4FY 2022 Investor Update Revenue Adjusted Gross Margin2 $ --- Adjusted Gross Margin2 % Adjusted Gross Margin2 $ --- Adjusted Gross Margin2 % Revenue $434.3 $305.7 FINANCIAL RESULTS $289.6 $190.0 ( $ I N M I LLI O N S ) Q 4 2 2 Q4 21 Q4 22 Q4 21 Q4 22 Q4 21 Q4 22 Q4 21 Q4 22 PRODUCTS SEGMENT SERVICES SEGMENT 67% 62% $218.3 $17.9 $150.4 $0.0 $(34.2) (191%) 69% 1. For additional detail related to the method and specific inputs by which both revenue and adjusted gross margin are calculated, please refer to the table in the section entitled “Additional Financial Information” found in the press release issued by the Company on February 27, 2023. 2. See the Appendix for a definition of non-GAAP terms and reconciliation tables. EMERGE NT" ■ ■
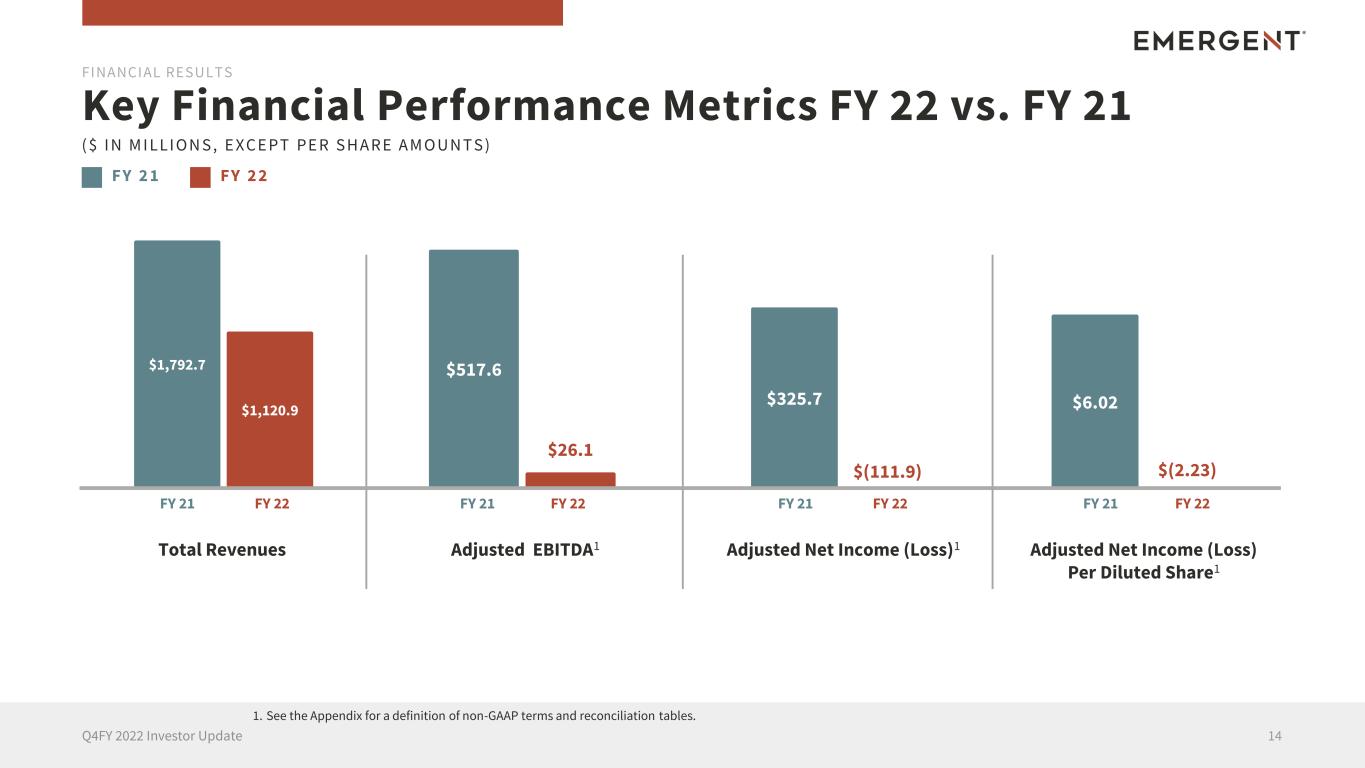
F Y 2 1 Key Financial Performance Metrics FY 22 vs. FY 21 14Q4FY 2022 Investor Update Total Revenues Adjusted EBITDA1 Adjusted Net Income (Loss) Per Diluted Share1 Adjusted Net Income (Loss)1 $1,792.7 $1,120.9 $6.02 FINANCIAL RESULTS $517.6 $26.1 $325.7 ( $ I N M I LLI O N S , E XC E PT PE R S H A R E A M O U N T S ) F Y 2 2 FY 21 FY 22 FY 21 FY 22 FY 21 FY 22 FY 21 FY 22 $(2.23)$(111.9)$(3.3) 1. See the Appendix for a definition of non-GAAP terms and reconciliation tables. EMERGE NT" ■ ■
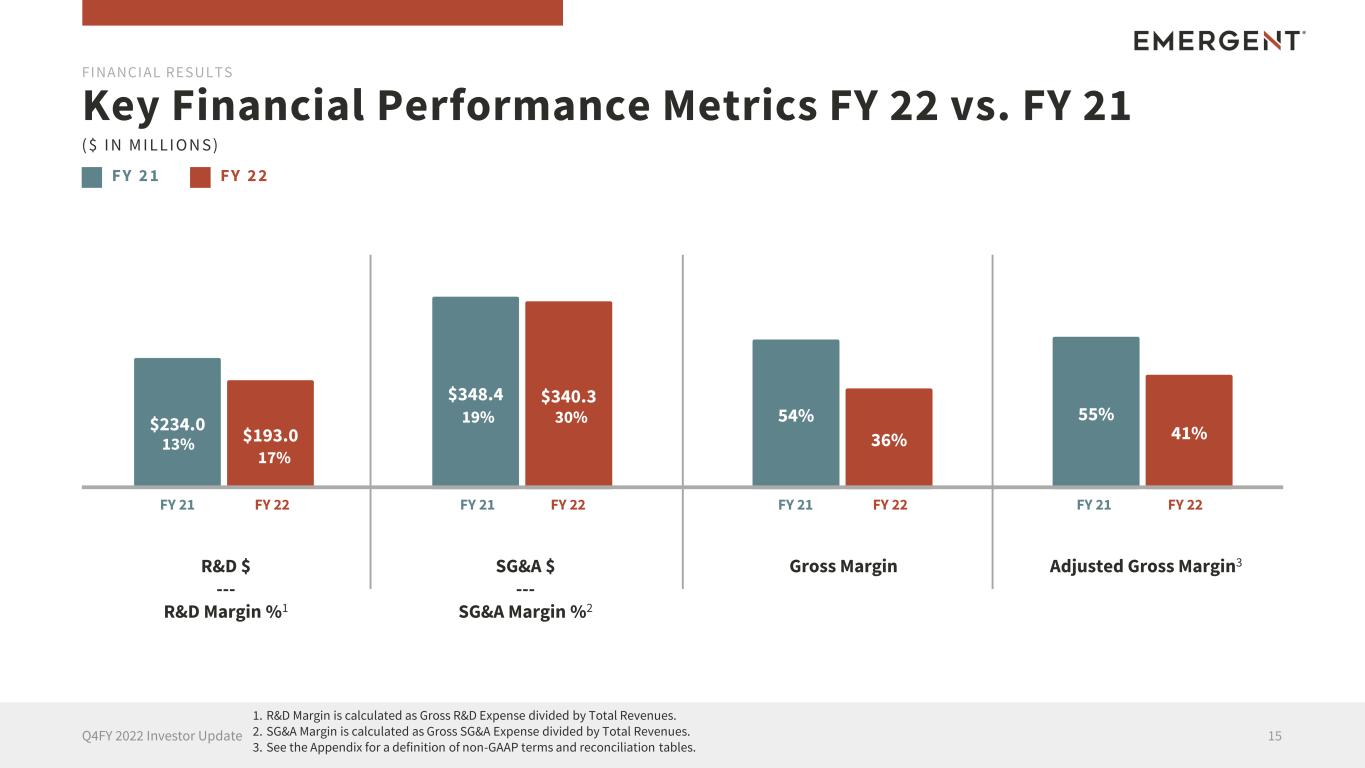
F Y 2 1 Key Financial Performance Metrics FY 22 vs. FY 21 15Q4FY 2022 Investor Update Adjusted Gross Margin3Gross Margin $234.0 $193.0 FINANCIAL RESULTS $348.4 $340.3 54% 36% ( $ I N M I LLI O N S ) F Y 2 2 55% 41% FY 21 FY 22 FY 21 FY 22 FY 21 FY 22 FY 21 FY 22 13% 17% 19% 30% 1. R&D Margin is calculated as Gross R&D Expense divided by Total Revenues. 2. SG&A Margin is calculated as Gross SG&A Expense divided by Total Revenues. 3. See the Appendix for a definition of non-GAAP terms and reconciliation tables. R&D $ --- R&D Margin %1 SG&A $ --- SG&A Margin %2 EMERGE NT" ■ ■
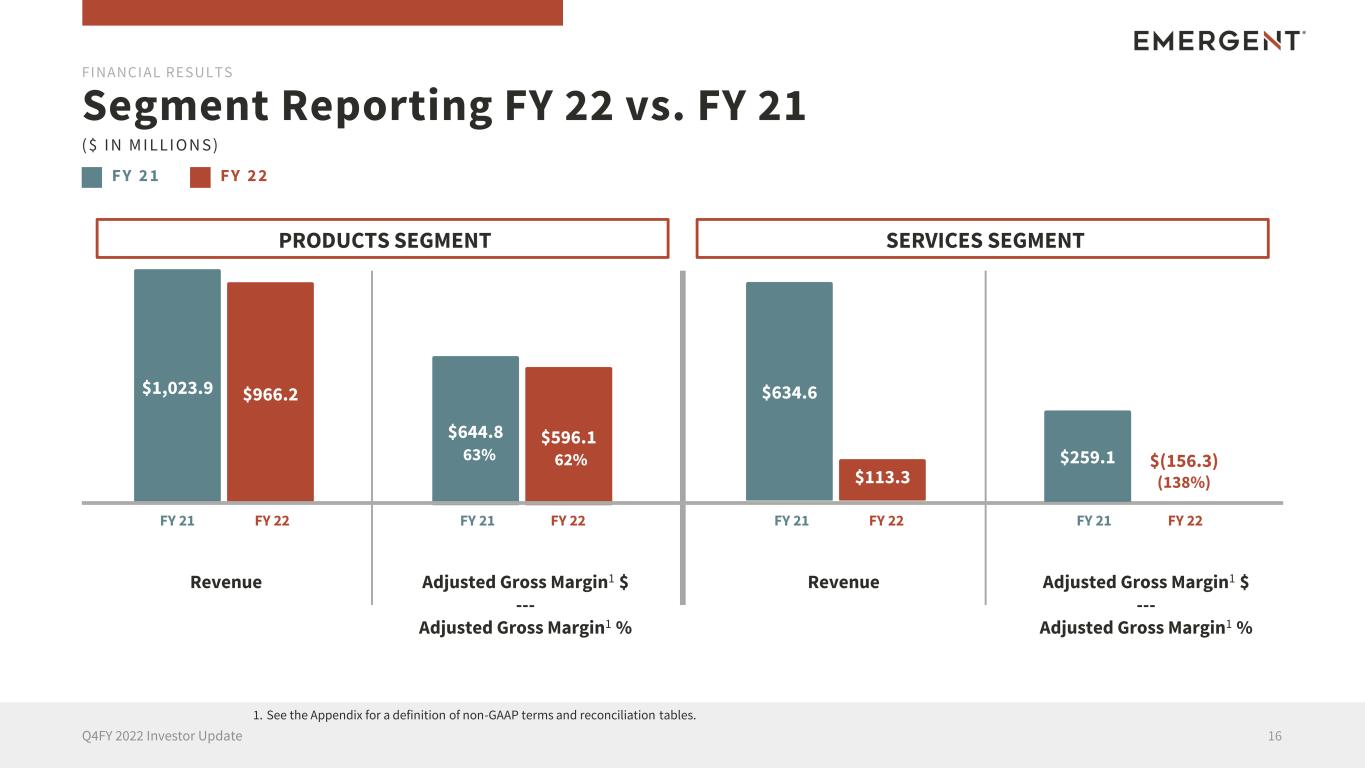
F Y 2 1 Segment Reporting FY 22 vs. FY 21 16Q4FY 2022 Investor Update Revenue Adjusted Gross Margin1 $ --- Adjusted Gross Margin1 % Adjusted Gross Margin1 $ --- Adjusted Gross Margin1 % Revenue $1,023.9 $966.2 FINANCIAL RESULTS $644.8 $596.1 ( $ I N M I LLI O N S ) F Y 2 2 FY 21 FY 22 FY 21 FY 22 FY 21 FY 22 FY 21 FY 22 PRODUCTS SEGMENT SERVICES SEGMENT 63% 62% $634.6 $113.3 $259.1 $0.0 $(156.3) (138%) 41% 1. See the Appendix for a definition of non-GAAP terms and reconciliation tables. EMERGE NT" ■ ■
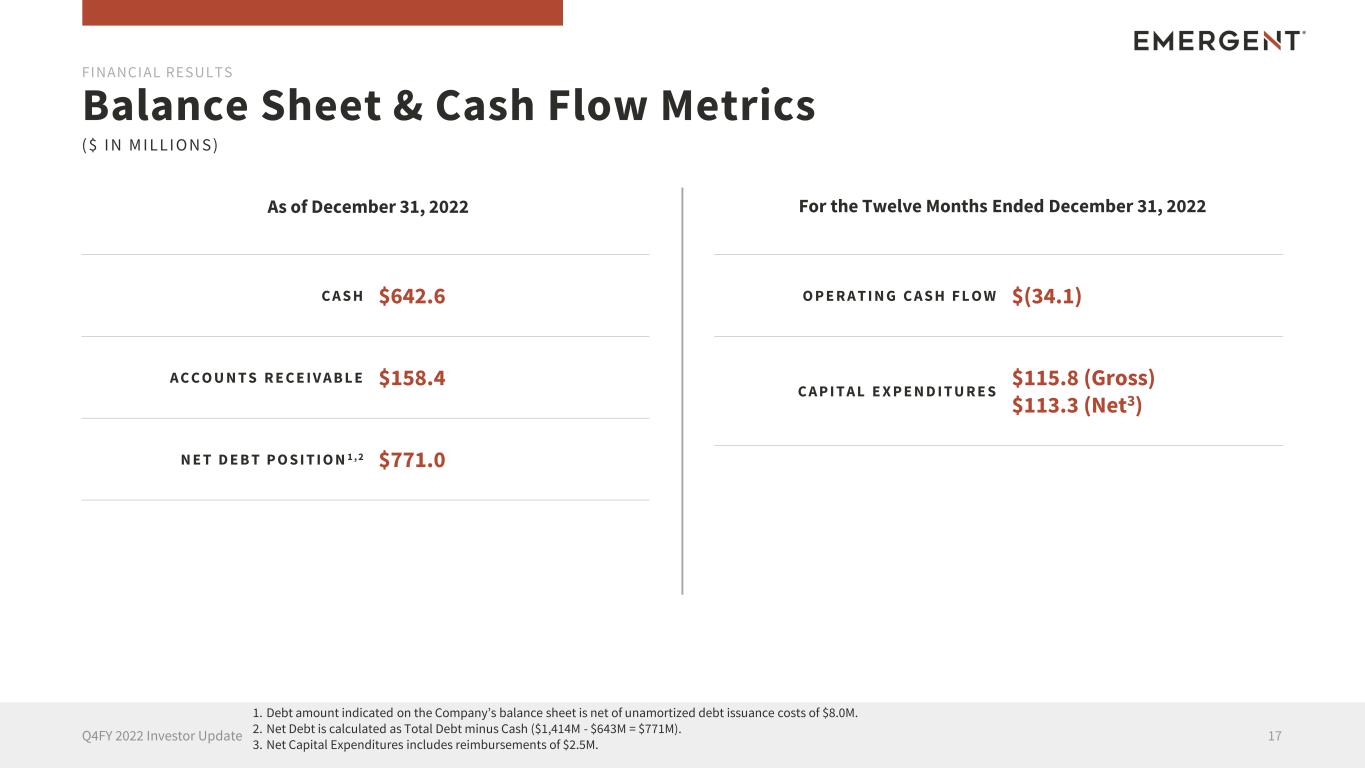
Balance Sheet & Cash Flow Metrics 17Q4FY 2022 Investor Update FINANCIAL RESULTS As of December 31, 2022 For the Twelve Months Ended December 31, 2022 C A S H $642.6 A C C O U N T S R E C E I V A B L E $158.4 N E T D E B T P O S I T I O N 1 , 2 $771.0 O P E R A T I N G C A S H F L O W $(34.1) C A P I T A L E X P E N D I T U R E S $115.8 (Gross) $113.3 (Net3) ( $ I N M I LLI O N S ) 1. Debt amount indicated on the Company’s balance sheet is net of unamortized debt issuance costs of $8.0M. 2. Net Debt is calculated as Total Debt minus Cash ($1,414M - $643M = $771M). 3. Net Capital Expenditures includes reimbursements of $2.5M. EMERGE NT"
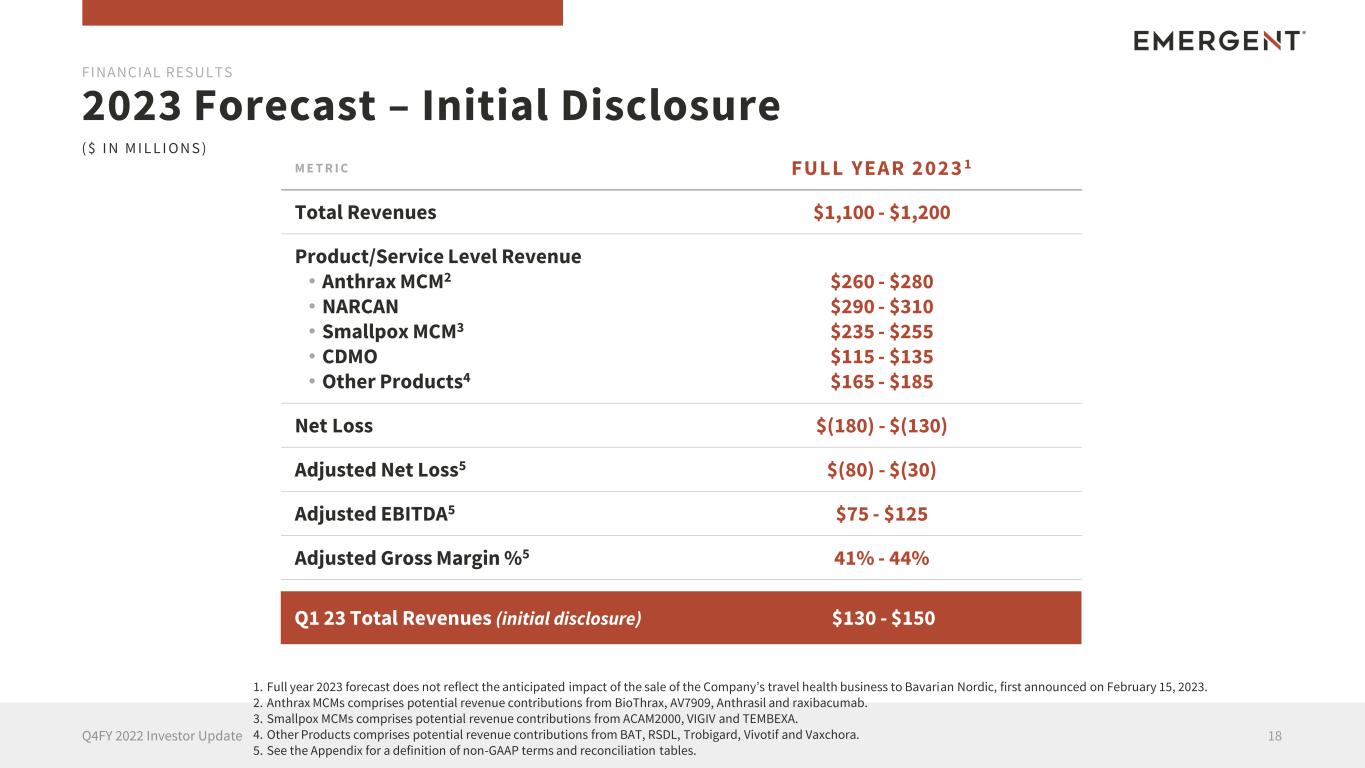
2023 Forecast – Initial Disclosure 18Q4FY 2022 Investor Update FINANCIAL RESULTS ( $ I N M I L L I O N S ) M E T R I C FULL YEAR 2023 1 Total Revenues $1,100 - $1,200 Product/Service Level Revenue • Anthrax MCM2 • NARCAN • Smallpox MCM3 • CDMO • Other Products4 $260 - $280 $290 - $310 $235 - $255 $115 - $135 $165 - $185 Net Loss $(180) - $(130) Adjusted Net Loss5 $(80) - $(30) Adjusted EBITDA5 $75 - $125 Adjusted Gross Margin %5 41% - 44% Q1 23 Total Revenues (initial disclosure) $130 - $150 1. Full year 2023 forecast does not reflect the anticipated impact of the sale of the Company’s travel health business to Bavarian Nordic, first announced on February 15, 2023. 2. Anthrax MCMs comprises potential revenue contributions from BioThrax, AV7909, Anthrasil and raxibacumab. 3. Smallpox MCMs comprises potential revenue contributions from ACAM2000, VIGIV and TEMBEXA. 4. Other Products comprises potential revenue contributions from BAT, RSDL, Trobigard, Vivotif and Vaxchora. 5. See the Appendix for a definition of non-GAAP terms and reconciliation tables. EMERGE NT"
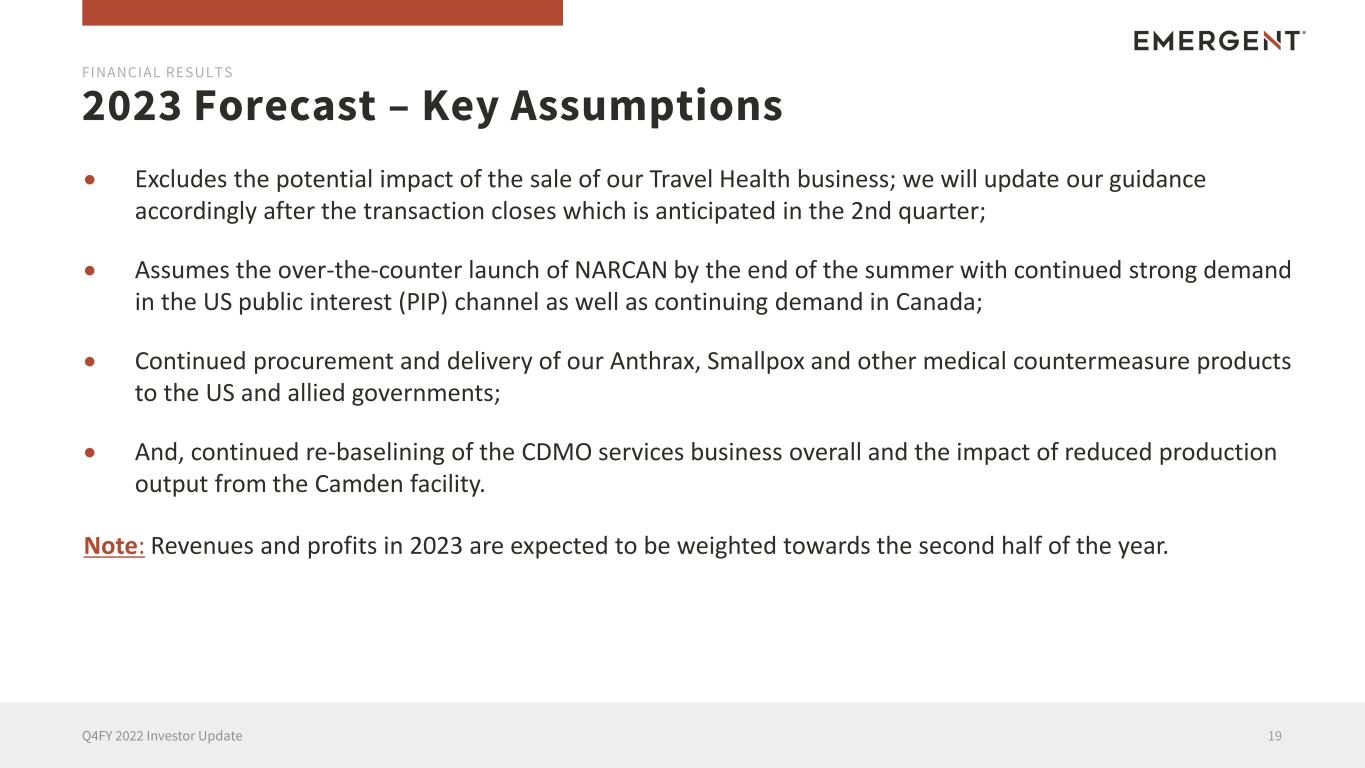
2023 Forecast – Key Assumptions 19Q4FY 2022 Investor Update FINANCIAL RESULTS • Excludes the potential impact of the sale of our Travel Health business; we will update our guidance accordingly after the transaction closes which is anticipated in the 2nd quarter; • Assumes the over-the-counter launch of NARCAN by the end of the summer with continued strong demand in the US public interest (PIP) channel as well as continuing demand in Canada; • Continued procurement and delivery of our Anthrax, Smallpox and other medical countermeasure products to the US and allied governments; • And, continued re-baselining of the CDMO services business overall and the impact of reduced production output from the Camden facility. Note: Revenues and profits in 2023 are expected to be weighted towards the second half of the year. EMERGE NT"
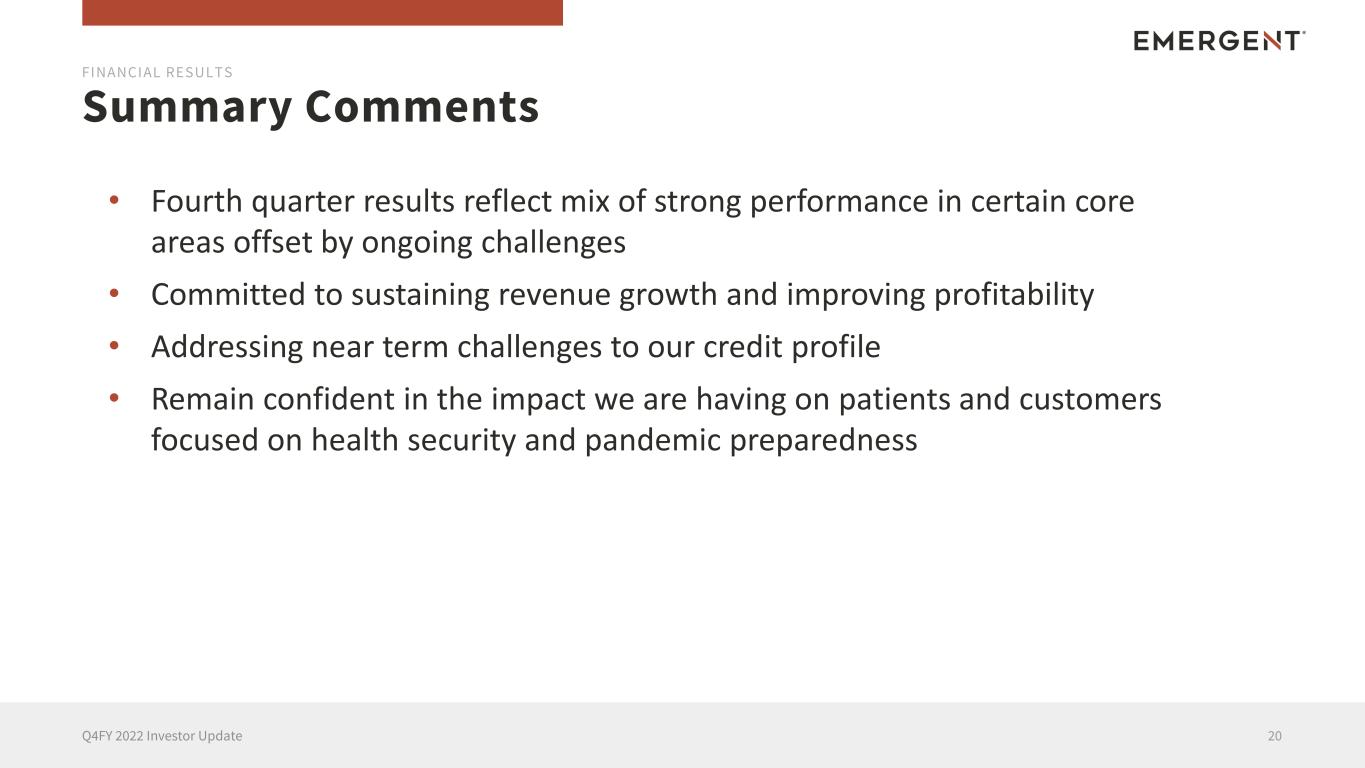
Summary Comments 20Q4FY 2022 Investor Update FINANCIAL RESULTS • Fourth quarter results reflect mix of strong performance in certain core areas offset by ongoing challenges • Committed to sustaining revenue growth and improving profitability • Addressing near term challenges to our credit profile • Remain confident in the impact we are having on patients and customers focused on health security and pandemic preparedness EMERGE NT"

PROPRIETARY AND CONFIDENTIAL 21Q4FY 2022 Investor Update Q&A EMERGE NT"
22Q4FY 2022 Investor Update Appendix
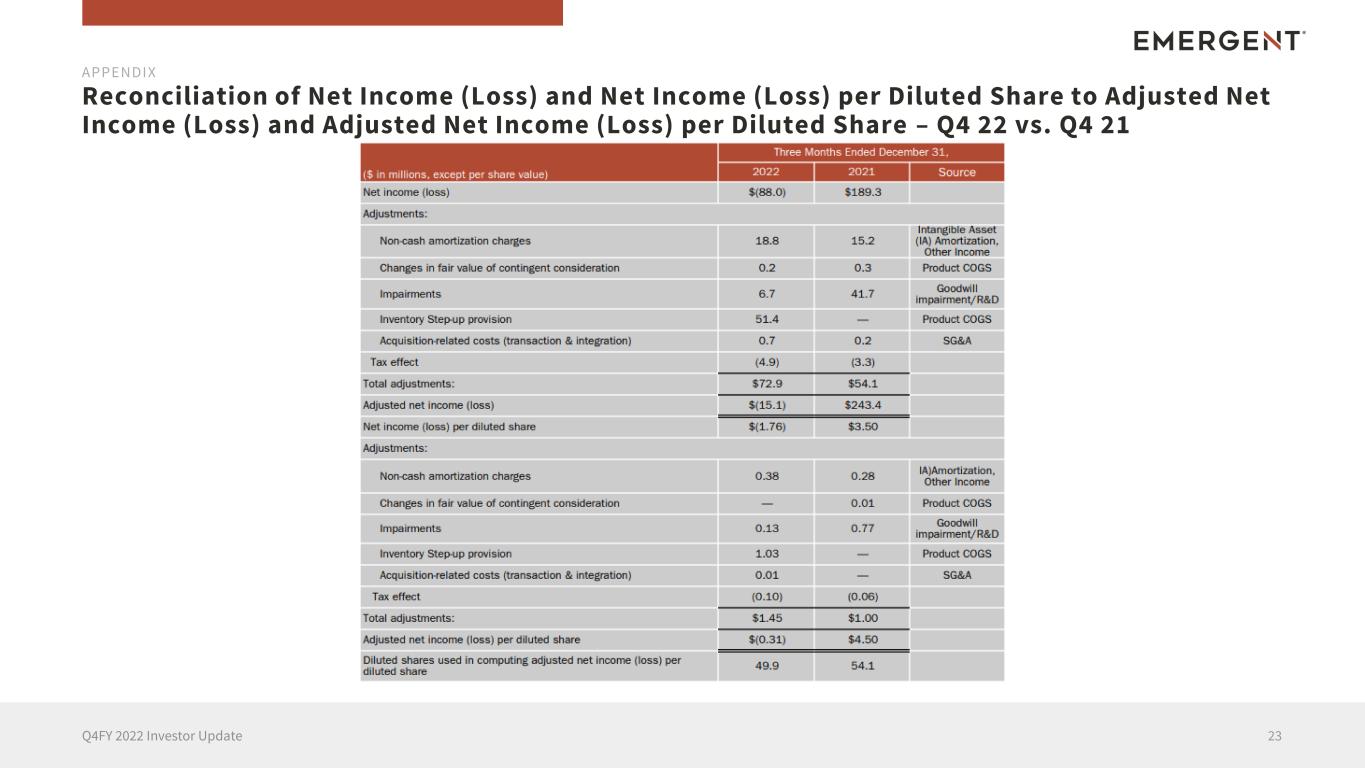
Reconciliation of Net Income (Loss) and Net Income (Loss) per Diluted Share to Adjusted Net Income (Loss) and Adjusted Net Income (Loss) per Diluted Share – Q4 22 vs. Q4 21 23Q4FY 2022 Investor Update APPENDIX ($ in m1ll1ons. except per share value) Net income (loss) AdJustments: Non-cash amortization charges Changes in fair value of contingent consideration Impairments Inventory Step.up provision Acquisition-related costs (transaction & integration) Tax effect Total adjusbnents: AdJusted net income (loss) Net income (loss) per diluted share AdJustments: Non-cash amortization charges Changes in fair value of contingent cons ideration Impairments Inventory Step-up provision Acquisition-related costs (transaction & integration) Tax effect Total ad1usbnents: Adjusted net income (loss) per diluted share Diluted shares used in computing adjusted net income (loss) per diluted share EMERGE NT" Three Months Ended December 3 1 . #•Fi +t1 mm,a- $(88.0) $189.3 Intangible Asset 18.8 15.2 ( IA) Amortization, Other Income 0.2 0.3 Product COGS 6.7 41.7 Goodwill impairment/R&D 51 .4 Product COGS 0.7 0 .2 SG&A {4.9) (3.3) $72.9 $54.1 $(15.1) $243.4 $(1.76) $3.50 0.38 0 .28 IA)Amortization, Other Income 0.01 Product COGS 0.13 0 .77 Goodwill impairment/R&D 1 .03 Product COGS 0 .01 SG&A (0.10 ) (0 .06) $ 1.45 $1.00 $(0.31) $4.50 49.9 54.1
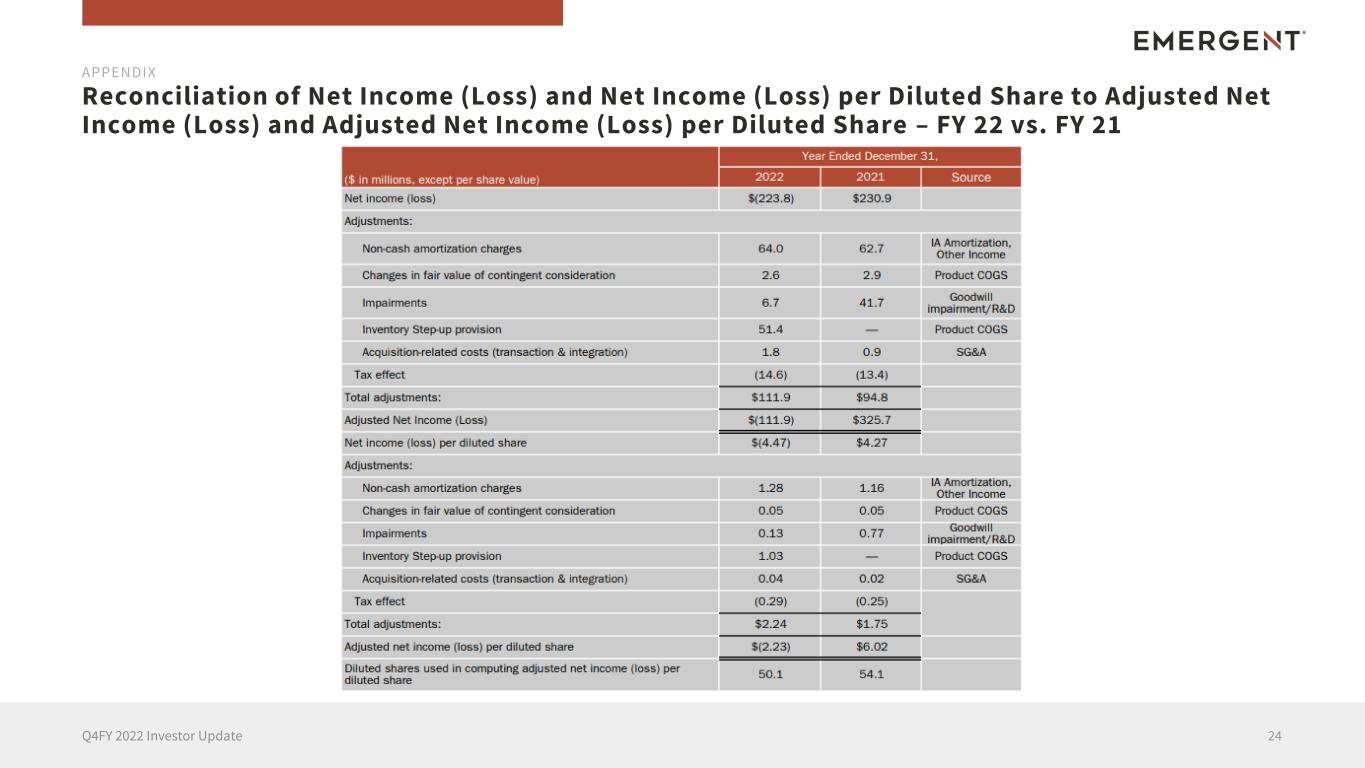
Reconciliation of Net Income (Loss) and Net Income (Loss) per Diluted Share to Adjusted Net Income (Loss) and Adjusted Net Income (Loss) per Diluted Share – FY 22 vs. FY 21 24Q4FY 2022 Investor Update APPENDIX ($ in m1ll1ons. except per share value) Net income (loss) Adjustments: Non-cash amortimtion charges Changes in fair value of contingent consideration Impairments Inventory step-up provision Acquisition-related costs (transaction & integration) Tax effect Total adjustments: Adjusted Net Income (Loss) Net income (loss) per di luted share Adjustments: Non-cash amortimtion charges Changes in fair value of contingent consideration Impairments Inventory step-up provision Acquisition-related costs (transaction & integration) Tax effect Total adjustments: Adjusted net income (loss) per diluted share Diluted shares used in computing adjusted net income (loss) per diluted share llk $(223.8) 64.0 2.6 6.7 51.4 1.8 (14.6) $111 .9 $(111.9) $(4.47) 1.28 0.05 0.13 1.03 0 .04 (0.29) $2.24 $(2.23) 50.1 EMERGE NT" Year Ended December 31, ❖t.i i·l'ii3· $230.9 62.7 IA Amortization, Other Income 2.9 Product COGS 41.7 Goodwi ll impairment;R&D Product COGS 0.9 SG&A (13.4) $94.8 $325.7 $4.27 1 .16 IA Amortization, Other Income 0.05 Product COGS 0.77 Goodwill impairment/R&D Product COGS 0.02 SG&A (0.25) $1.75 $6.02 54.1
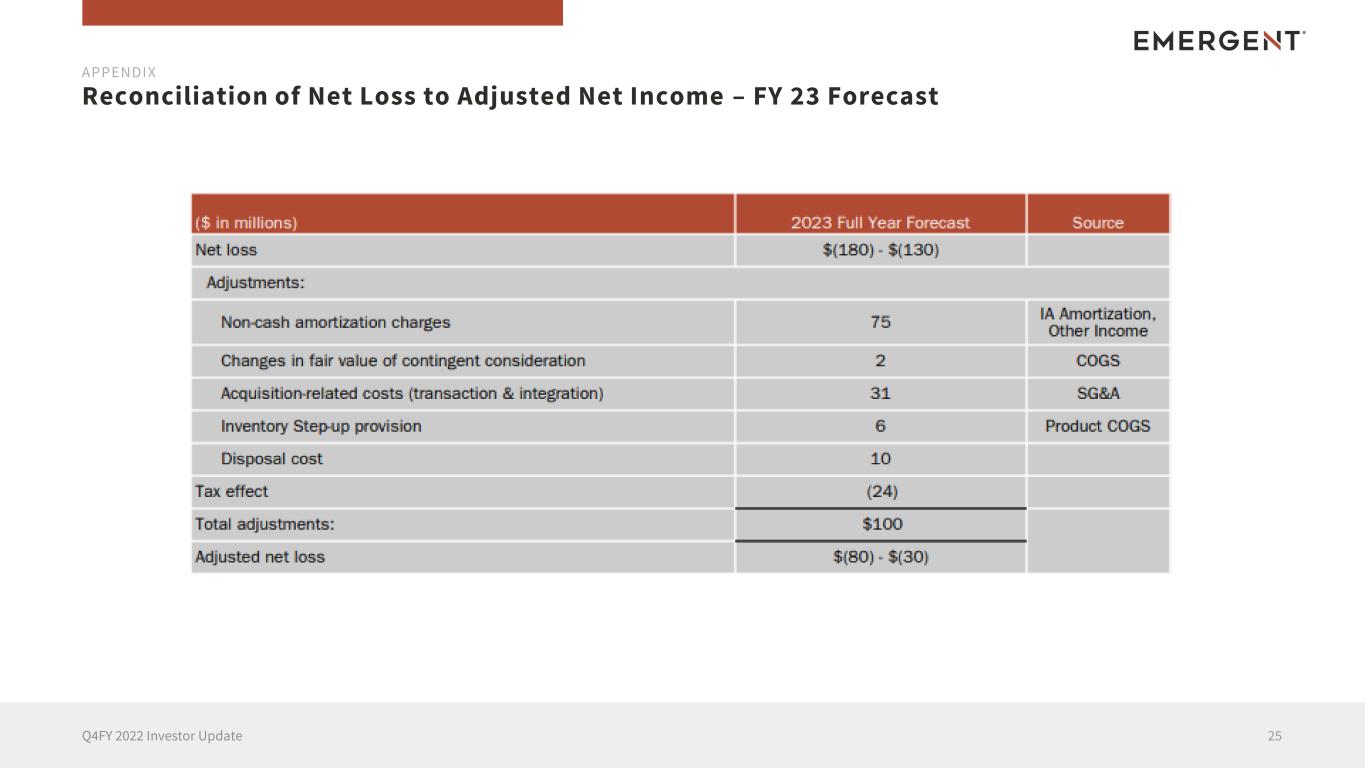
Reconciliation of Net Loss to Adjusted Net Income – FY 23 Forecast 25Q4FY 2022 Investor Update APPENDIX ($ in rni ll 1ons.) Net loss Adjustments : Non-cash a mmtizatio11 chaiges Changes in fair value of corrtingernt consideration Acquis itiorn-related costs (trarnsactiorn & integratiorn) Inventory Step-up provision Disposal cost Tax effect Total adjustmernts: Adjusted net loss 2023 fu ll Year Forecast $(180) • $(130) 75 2 31 6 10 (24) $100 $(80) • $(30) EMERGE NT" Source IA Amortizatiorn , other Income COGS SG&A Product COGS
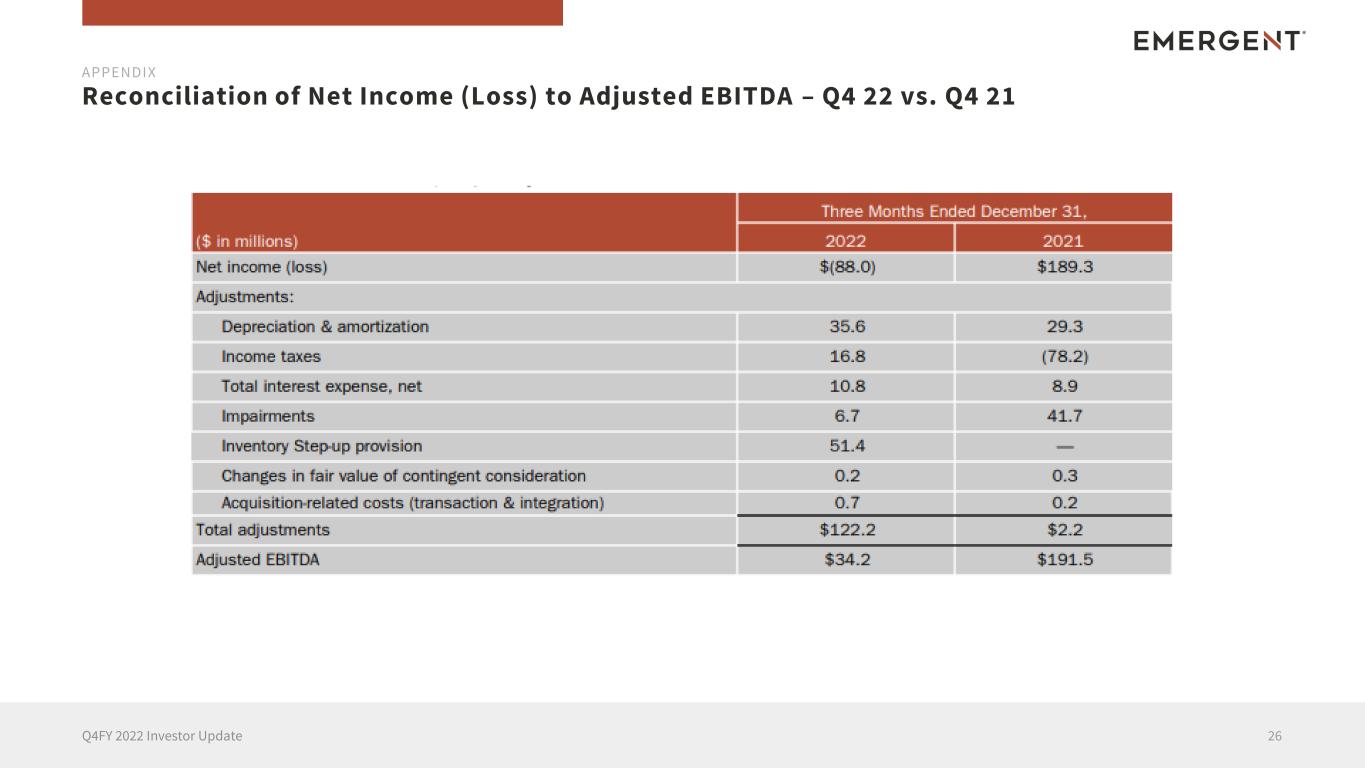
Reconciliation of Net Income (Loss) to Adjusted EBITDA – Q4 22 vs. Q4 21 26Q4FY 2022 Investor Update APPENDIX EMERGE NT" Th ree Months Ended Decembe r 31, ($ m millions) 2022 2021 Net i rncome (loss) $(88.0) $189.3 Adj1Jstmernts :. Depreciation & amortization 35.6 29.3 Income taxes 16.8 (78.2) Total interest expernse, net 10.8 8.9 Impairments 6,7 4 1.7 Inventory step-up provisio rn 51.4 Changes in fair val1Je of contirngent consideration 0.2 0 .3 Acquisitiorn-related costs (transaction & integratiorn) 0 ,7 0.2 Total adj1Jstments $122.2 $2.2 Adj1Jsted EBIIDA $34.2 $191.5
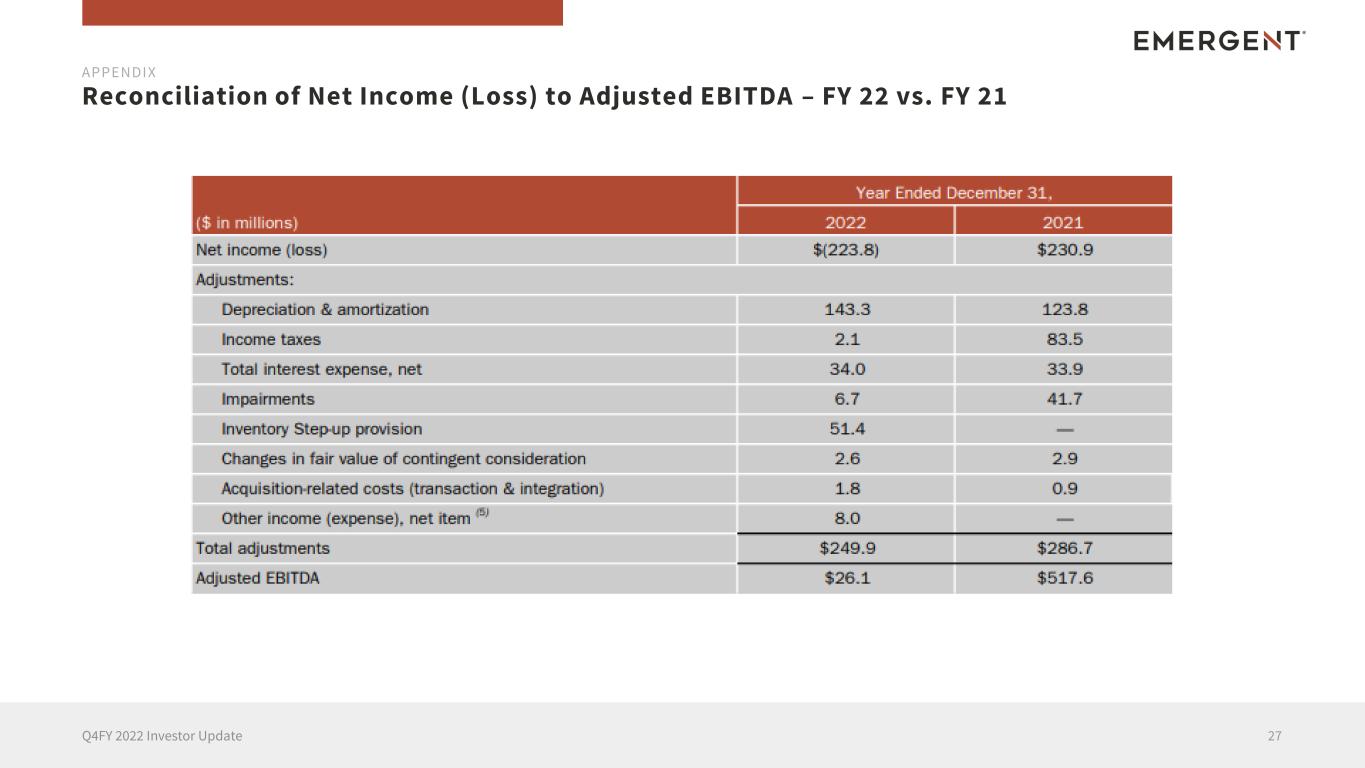
Reconciliation of Net Income (Loss) to Adjusted EBITDA – FY 22 vs. FY 21 27Q4FY 2022 Investor Update APPENDIX ($ m rn1ll1ons) Net i ricome (loss) Adjustmerits : Depreciation & a Income tax.es mortization rise, net provisiori Total interest ex.pe Impairments lnventmy step-up Changes in fair ,., Acquis itiorn related other income (ex Total adjustmernts Adjusted EBITDA alue of corntirigent consideration costs (transaction & integratiori) pense), net item ~J ~ EMERGE NT" Year Ended December 31 . 2022 2021 $(223.8 ) $230.9 --- 1 43.3 1 23.8 2.1 83. 5 34.0 33.9 6 .7 4 1.7 51 .4 - 2 .6 2.9 1..8 0 .9 \ 8 .0 - $249 .9 $286.7 I $26.1. $517.6 _J
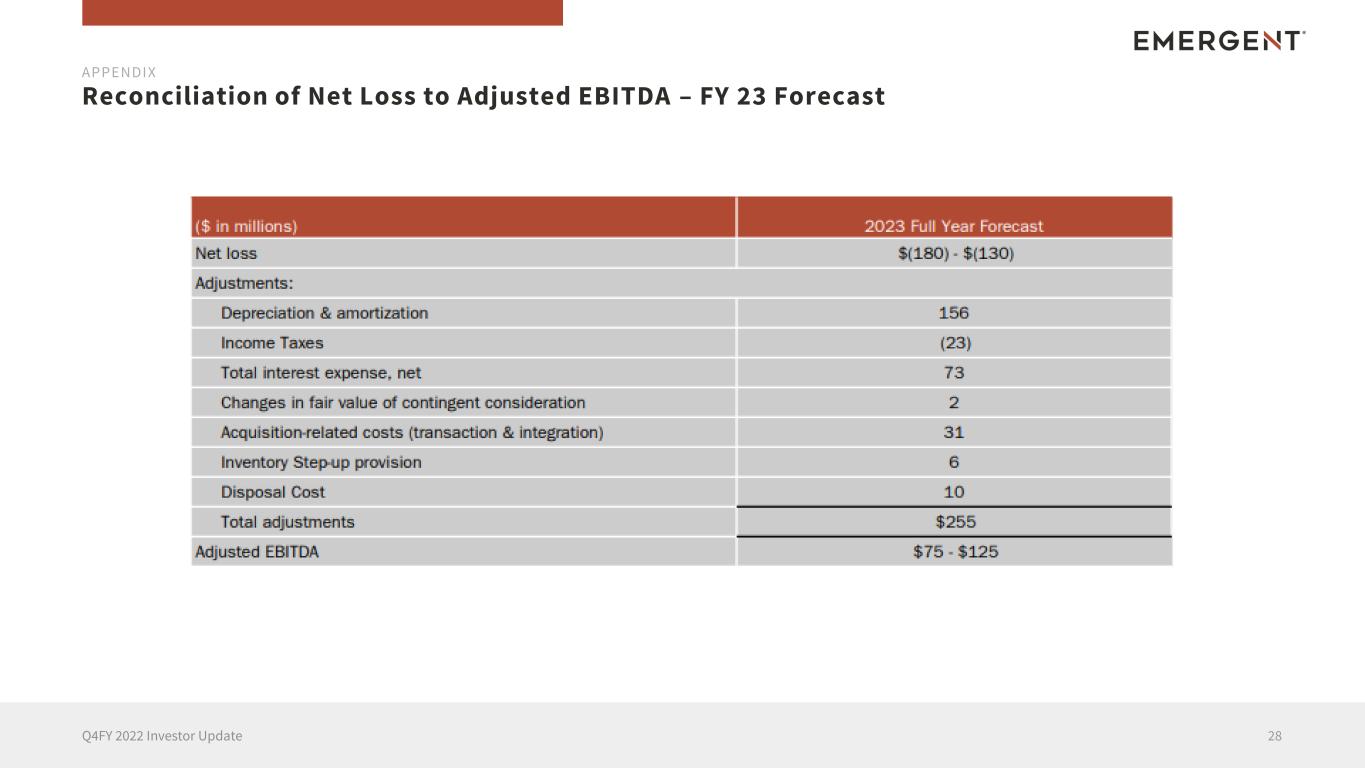
Reconciliation of Net Loss to Adjusted EBITDA – FY 23 Forecast 28Q4FY 2022 Investor Update APPENDIX ($ in m1ll1ons) 2023 Full Year Forecast Net loss Adjustments: Depreciation & amortization Income Taxes Total interest expernse, net Changes in fair value of corntingernt consideration Acquis itiorn related costs (trarnsactiorn & integratiorn) Inventory step-up provision Disposal Cost Total adjustments Adjusted EBlllDA I $( 180) · $(130) 156 (23) 73 2 31 6 10 $255 $75 • $.125 EMERGE NT"
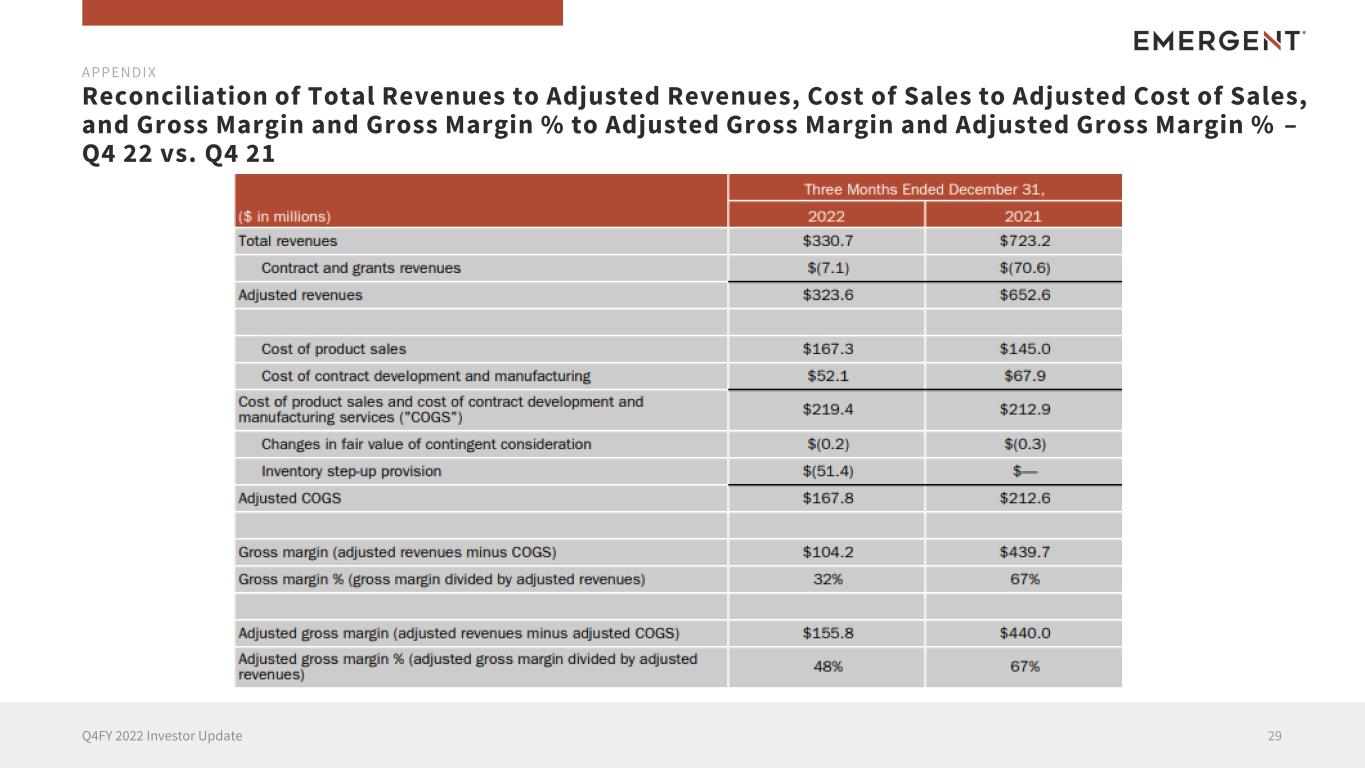
Reconciliation of Total Revenues to Adjusted Revenues, Cost of Sales to Adjusted Cost of Sales, and Gross Margin and Gross Margin % to Adjusted Gross Margin and Adjusted Gross Margin % – Q4 22 vs. Q4 21 29Q4FY 2022 Investor Update APPENDIX EMERGE NT" Three Months Ended December 31. ($ m m1ll1ons) 2022 2021 Total revenues $330.7 $723.2 Contract ancl grants revenues $(7.1) $(70.6) Adjusted revenues $323.6 $652.6 =-_J Cost of product sales $167.3 $145.0 Cost of contract development and manufacturing $52.1 $67 .9 Cost of product sales and cost of contract development and $219.4 $212.9 manufacturing seivices ("COGS") Changes in fair value of contingent consideration $(0.2) $(0.3 ) Inventory step-up provision $(51.4) $- Adjusted COGS $167.8 $212.6 =-_J Gross margin (adjusted revenues minus COGS) $104 . .2 $439.7 Gross margin % {gross margin divided by adjusted revenues) 32% 67% Adjusted gross margin (adj usted revenues minus adjusted COGS) $155.8 $440.0 Adjusted gross margin % (adjusted gross margin divided by adjusted 48% 67% revenues)
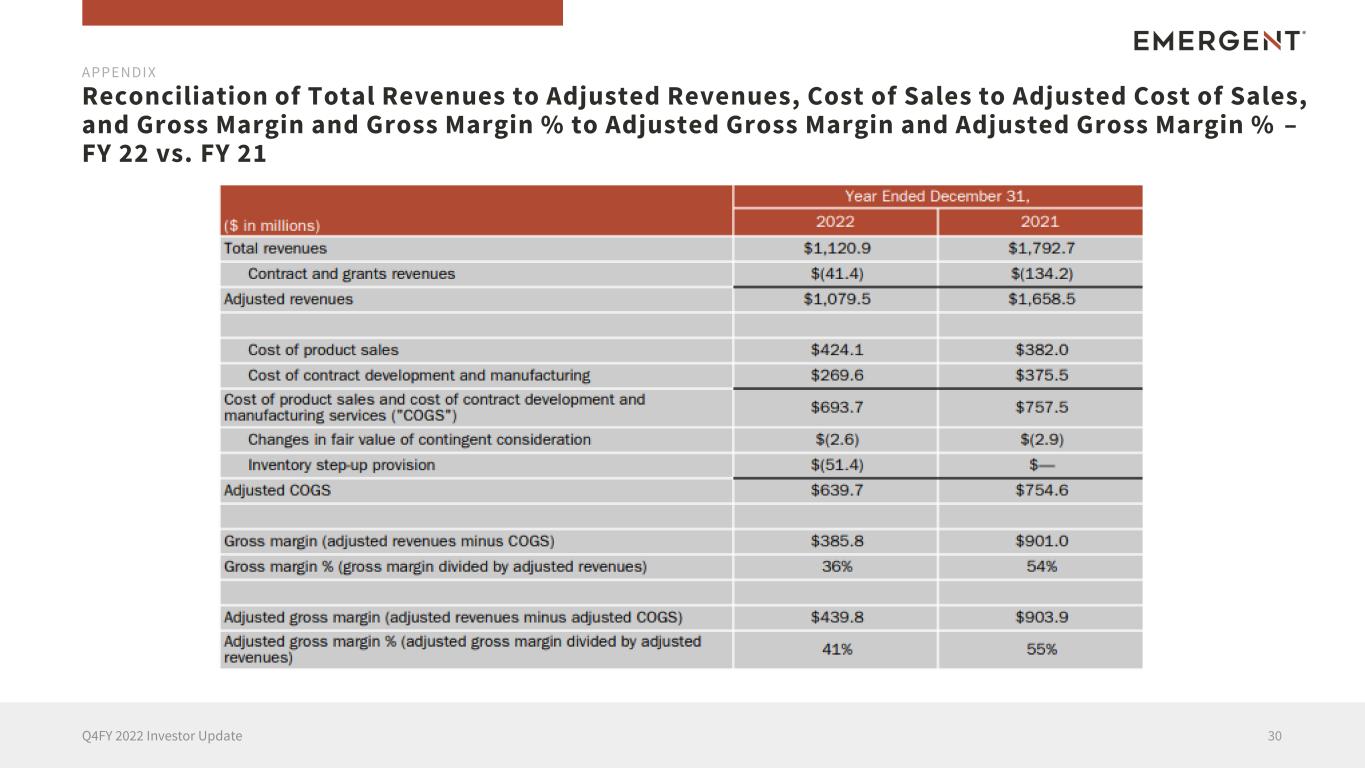
Reconciliation of Total Revenues to Adjusted Revenues, Cost of Sales to Adjusted Cost of Sales, and Gross Margin and Gross Margin % to Adjusted Gross Margin and Adjusted Gross Margin % – FY 22 vs. FY 21 30Q4FY 2022 Investor Update APPENDIX ($ in m1ll1ons) Total revenues Contract and grants revenues Adjusted revenues Cost of product sales Cost of contract development and manufacturing Cost of product sales and cost of contract development and manufacturing seivices ( · coGs ·) Changes in fair value of contingent consideration Inventory step-up provision Adjusted COGS Gross margin (adjusted revenues minus COGS) Gross margin % (gross margin divided by adjusted revenues) Adjusted gross margin (adjusted revenues minus adjusted COGS) Adjusted gross margin% (adjusted gross ma~n divided by a~usted revenues) EMERGE NT" Year Ended December 31. 2022 2021 $1,120.9 $1,792.7 $(41.4) $(134.2) $1,079.5 $1,658.5 $424.1 $382.0 $269.6 $375.5 $693.7 $757.5 $(2.6 ) $(2.9 ) $(51.4) $639.7 $754.6 $385.8 $901 .0 36% 54% $439.8 $903.9 41 % 55%
www.emergentbiosolutions.com EMERGE NT®