Table of Contents
Index to Financial Statements
As filed with the Securities and Exchange Commission on April 17, 2007
Registration No. 333-
SECURITIES AND EXCHANGE COMMISSION
Washington, D.C. 20549
FORM S-1
REGISTRATION STATEMENT
UNDER
THE SECURITIES ACT OF 1933
Stallion Oilfield Services, Inc.
(Exact name of registrant as specified in its charter)
| Delaware | 1389 | 72-1618455 | ||
(State or other jurisdiction of incorporation or organization) | (Primary Standard Industrial Classification Code Number) | (I.R.S. Employer Identification No.) |
410 Roberts Street
Houston, Texas 77003
(713) 528-5544
(Address, including zip code, and telephone number, including area code, of registrant’s principal executive offices)
Craig M. Johnson
Chief Executive Officer
410 Roberts Street
Houston, Texas 77003
(713) 528-5544
(Name, address, including zip code, and telephone number, including area code, of agent for service)
Copies to:
Vinson & Elkins L.L.P. First City Tower, Suite 2300 1001 Fannin Street Houston, Texas 77002 (713) 758-2222 Attn: T. Mark Kelly Attn: Christopher S. Collins | Baker Botts L.L.P. One Shell Plaza 910 Louisiana Street Houston, Texas 77002 (713) 229-1234 Attn: R. Joel Swanson Attn: Felix P. Phillips |
Approximate date of commencement of proposed sale to the public: As soon as practicable after this Registration Statement becomes effective.
If any of the securities being registered on this Form are to be offered on a delayed or continuous basis pursuant to Rule 415 under the Securities Act of 1933, please check the following box. ¨
If this form is filed to register additional securities for an offering pursuant to Rule 462(b) under the Securities Act, please check the following box and list the Securities Act registration statement number of the earlier effective registration statement for the same offering. ¨
If this Form is a post-effective amendment filed pursuant to Rule 462(c) under the Securities Act, check the following box and list the Securities Act registration statement number of the earlier effective registration statement for the same offering. ¨
If this Form is a post-effective amendment filed pursuant to Rule 462(d) under the Securities Act, check the following box and list the Securities Act registration statement number of the earlier effective registration statement for the same offering. ¨
CALCULATION OF REGISTRATION FEE
Title of Each Class of Securities to be Registered | Proposed Maximum Price(1)(2) | Amount of Registration Fee(3) | ||
Common Stock, par value $0.01 | $400,000,000 | $12,280 |
| (1) | Includes common stock issuable upon the exercise of the underwriters’ option to purchase additional shares. |
| (2) | Estimated solely for the purpose of calculating the registration fee in accordance with Rule 457(o) under the Securities Act 1933. |
| (3) | The registrant previously paid registration fees of $30,763 in connection with the Registration Statement on Form S-1 (Registration No. 333-135589) filed on July 3, 2006, with respect to common shares having a proposed maximum aggregate offering price of $287,500,000. The Registration Statement on Form S-1 (Registration No. 333-135589) was withdrawn on November 2, 2006. |
The Registrant hereby amends this Registration Statement on such date or dates as may be necessary to delay its effective date until the Registrant shall file a further amendment which specifically states that this Registration Statement shall thereafter become effective in accordance with Section 8(a) of the Securities Act of 1933 or until the Registration Statement shall become effective on such date as the Commission, acting pursuant to said Section 8(a), may determine.
Table of Contents
Index to Financial Statements
The information in this prospectus is not complete and may be changed. We may not sell these securities until the registration statement filed with the Securities and Exchange Commission is effective. This prospectus is not an offer to sell these securities and it is not soliciting an offer to buy these securities in any state where the offer or sale is not permitted.
Subject to Completion, dated April 17, 2007
PROSPECTUS
Shares

Common Stock
This is the initial public offering of Stallion Oilfield Services, Inc. common stock. We are offering shares of our common stock and the selling stockholders, including members of our senior management, are offering shares of our common stock in this initial public offering. No public market currently exists for our common stock. We will not receive any of the proceeds from the shares of our common stock sold by the selling stockholders.
We have applied for listing of our common stock on The NASDAQ Stock Market LLC under the symbol “SOFS.” We currently estimate that the initial public offering price will be between $ and $ per share.
Investing in our common stock involves risk. See “Risk Factors” beginning on page 10.
| Per Share | Total | |||
Public offering price | $ | $ | ||
Underwriting discounts and commissions | $ | $ | ||
Proceeds to the Company (before expenses) | $ | $ | ||
Proceeds to the selling stockholders (before expenses) | $ | $ | ||
We have granted the underwriters a 30-day option to purchase up to an aggregate of additional shares of common stock on the same terms and conditions set forth above if the underwriters sell more than shares of common stock in this offering.
Neither the Securities and Exchange Commission nor any state securities commission has approved or disapproved of these securities or passed upon the accuracy or adequacy of this prospectus. Any representation to the contrary is a criminal offense.
Lehman Brothers, on behalf of the underwriters, expects to deliver the shares on or about , 2007
| LEHMAN BROTHERS | CREDIT SUISSE | UBS INVESTMENT BANK |
, 2007
Table of Contents
Index to Financial Statements
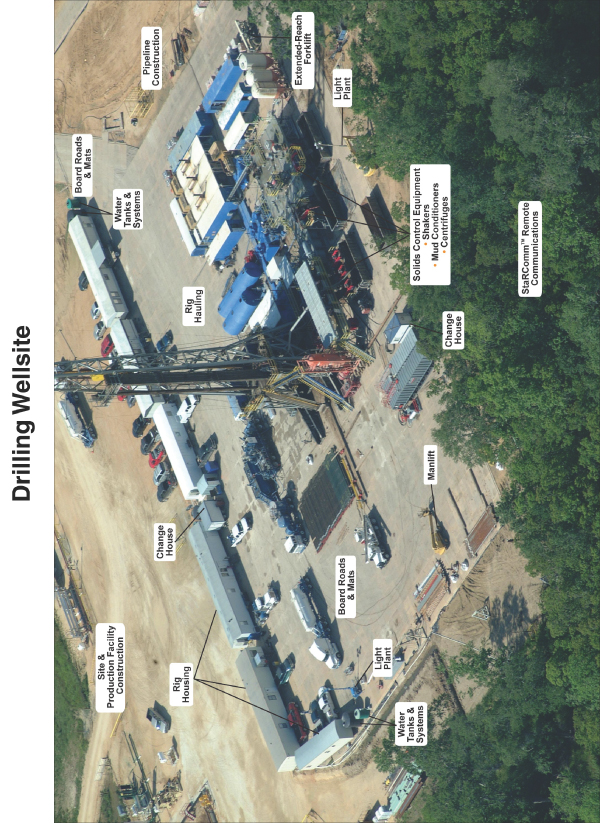
Table of Contents
Index to Financial Statements
| Page | ||
| 1 | ||
| 10 | ||
| 23 | ||
| 23 | ||
| 24 | ||
| 25 | ||
| 27 | ||
| 29 | ||
Management’s Discussion and Analysis of Financial Condition and Results of Operations | 31 | |
| 57 |
| Page | ||
| 72 | ||
| 87 | ||
| 90 | ||
| 91 | ||
| 94 | ||
Certain United States Federal Tax Considerations for Non-United States Holders | 96 | |
| 99 | ||
| 105 | ||
| 105 | ||
| 105 |
Dealer Prospectus Delivery Obligation
Until , 2007, 25 days after the date of this prospectus, all dealers that effect transactions in our common stock, whether or not participating in this offering, may be required to deliver a prospectus. This is in addition to the dealers’ obligation to deliver a prospectus when acting as underwriters and with respect to their unsold allotments or subscriptions.
ABOUT THIS PROSPECTUS
You should rely only on the information contained in this prospectus. We and the selling stockholders have not authorized any other person to provide you with information different from that contained in this prospectus. We and the selling stockholders are only offering to sell, and only seeking offers to buy, the common stock in jurisdictions where offers and sales are permitted.
The information contained in this prospectus is accurate only as of the date of this prospectus, regardless of the time of delivery of this prospectus or of any sale of our common stock. Our business, financial condition, results of operations and prospects may have changed since that date.
This prospectus includes market share and industry data and forecasts that we obtained from internal company surveys, market research, consultant surveys, publicly available information and industry publications and surveys. We believe the information included in this prospectus from market research, consultant surveys and industry publications and surveys is reliable.
Non-GAAP Financial Measures
The body of accounting principles generally accepted in the United States of America is commonly referred to as “GAAP.” A non-GAAP financial measure is generally defined by the Securities and Exchange Commission, or SEC, as one that purports to measure historical or future financial performance, financial position or cash flow, but excludes or includes amounts that would not be so adjusted in the most comparable GAAP measures. In this prospectus, we disclose EBITDA, a non-GAAP financial measure. EBITDA is calculated as net income before interest expense, taxes, depreciation and amortization. EBITDA is not a substitute for GAAP measures of earnings and cash flow. EBITDA is included in this prospectus because our management considers it an important supplemental measure of our performance and believes that it is frequently used by security analysts, investors and other interested parties in the evaluation of companies in our industry, some of which present EBITDA when reporting their results.
Table of Contents
Index to Financial Statements
This summary highlights selected information in this prospectus, but it does not contain all of the information that you should consider before deciding to invest in our common stock. You should read this entire prospectus carefully, including the “Risk Factors” section and our historical financial statements and pro forma financial data, which are included elsewhere in this prospectus.
Unless otherwise indicated or the context otherwise requires, (i) the information contained in this prospectus assumes that the underwriters’ option to purchase additional shares is not exercised, (ii) the information contained in this prospectus relating to us assumes the completion of the Restructuring as described under the caption “The Restructuring” below, and (iii) references in this prospectus to “Stallion,” “we,” “us” and “our” are references to Stallion Oilfield Services, Inc. together with all of its subsidiaries subsequent to the Restructuring and refer to our predecessor entities and their respective subsidiaries prior to the Restructuring.
Our Company
We are a growth-oriented oilfield service company that provides comprehensive wellsite support services and construction and logistics services to exploration and production companies and drilling contractors throughout the United States. Our company slogan,Everything but the RigSM, reflects our business strategy of providing a broad and comprehensive range of critical services to support wellsite operations, including onshore and offshore workforce accommodations, surface equipment rental, solids control, site construction, rig relocation and heavy equipment hauling. Our service offerings are designed to improve living and working conditions at the wellsite, wellsite safety and our customers’ productivity. We currently focus on oil and natural gas regions within North America that we believe have stable oil and gas drilling activity and which provide attractive long-term potential for growth, including South Texas, the Gulf Coast, ArkLaTex, North Texas, the Permian Basin, the Mid-Continent and Rocky Mountain regions. We also supply offshore workforce accommodations and related equipment for use in the Gulf of Mexico and, to a lesser extent, other international offshore regions. We provide services to a diverse group of over 2,000 customers. The Glossary of Terms included as Appendix A to this prospectus contains a description of some of these regions and a map of these regions appears at the end of the appendix.
Our services span the entire life-cycle of the land-based wellsite—wellsite preparation, rig deployment, drilling activities, production activities and decommissioning. We are typically the first service provider on the wellsite, as we assist in the initial preparation of the wellsite and often haul the rig and related heavy equipment onto the site using our fleet of tractors, trailers, trucks and cranes. Throughout the drilling and completion phases of the land-based well, we provide rental equipment and required support services to the wellsite. We also, in some cases, provide continuing support services during the production phase of the well, including construction of production facilities and well connections to existing pipeline infrastructure. We frequently are the last service provider to leave the wellsite as we perform production facility disassembly and site restoration, which are the last phases of the wellsite decommissioning process. In addition, our offshore workforce accommodations business serves our offshore customers during many phases of the offshore drilling and production life-cycle.
Our business is comprised of two segments:
Wellsite Support Services. Through our wellsite support services segment, we offer integral services used by oil and natural gas companies, drilling contractors and other wellsite service providers to support wellsite operations. This segment includes the following primary service lines:
| • | Workforce accommodations. We provide onshore workforce accommodations in the United States with, as of December 31, 2006, over 2,000 transportable units in our inventory. Our fleet of land-based units |
1
Table of Contents
Index to Financial Statements
is designed to accommodate various personnel on wellsite locations before, during and after drilling operations. In addition, we design, manufacture, lease and repair offshore workforce accommodation structures, which include units certified by the U.S. Coast Guard and/or the International Convention for the Safety of Life at Sea, 1974, the paramount international treaty concerning the safety of merchant ships (“SOLAS”). Our workforce accommodation units are specifically configured to provide transportable, comfortable living quarters and functional workspaces. |
| • | Surface equipment rental. We provide a variety of surface rental equipment used in and critical to wellsite activities including forklifts, manlifts, power generators, compressors, loaders and water systems. |
• | Communications services. We provide integrated communications services through ourStaRCommTM/SM satellite system that provides wireless communications via intercoms and telephone, fax and internet/data services throughout the wellsite location. |
| • | Solids control. We provide customized solids control services, closed-loop mud systems and fluid recovery services to help maximize our customers’ operating efficiency at the wellsite. We provide high-quality shakers, mud conditioners, centrifuges and peripheral backside equipment, as well as solids removal and waste handling coordination services. |
Construction and Logistics Services. Through our construction and logistics services segment, we offer services that are critical to establish, maintain and decommission the wellsite and position key equipment prior to, during and after drilling operations. This segment includes the following primary service lines:
| • | Site construction. We provide construction equipment and services to build and reclaim infrastructure at wellsites before, during and after drilling operations. Our services include site clearing, road construction, mat placement, production facility assembly and construction, pipeline installation, pit remediation, production decommissioning and site restoration. We provide services for wellsites in both land and inland marine environments. |
| • | Rig relocation and heavy equipment hauling. We provide a fleet of cranes, tractors, trailers, trucks and loaders used for the hauling and relocation of drilling rigs and related heavy equipment. We maintain a focus on providing reliable, efficient and safe transportation services. |
Wellsite support services and construction and logistics services are critical to establish and operate the land-based wellsite; however, these onshore services have historically been provided primarily by small, regional service providers and have not been the focus of larger oilfield service companies. We believe we have a distinct advantage over these smaller competitors due to our scale, access to capital and our ability to provide a single supply source for many of our customers’ needs. In addition, we provide offshore workforce accommodations to exploration and production companies in the Gulf of Mexico and, to a lesser extent, other international offshore regions. These services have been historically provided by relatively few service providers. We believe we have a competitive advantage over our competitors in this market due to our knowledge of the industry, relationships with customers and the quality of our products.
Recent Industry Trends
In recent years, our industry has experienced higher demand for oil and natural gas and a constrained oil and natural gas supply, resulting in higher commodity prices and increased drilling activity. We believe this trend of increased natural gas prices and drilling activity, as well as other industry trends reflected below, will benefit us and facilitate implementation of our business strategy:
| • | Labor shortages and increasing safety concerns. Due to the increase in the demand for labor in the oilfield and offshore, our customers continue to attempt to improve living and working conditions at the |
2
Table of Contents
Index to Financial Statements
wellsite to help retain employees. Our customers also continue to enhance their safety procedures to help reduce injuries and to help ensure compliance with more stringent regulatory requirements. |
| • | Increasingly complex technologies. The increasing complexity of technology used in the oil and natural gas development process requires a greater number of technicians on location during drilling and, therefore, additional workforce accommodations. |
| • | Geographically dispersed drilling operations. With the shift toward consolidation in the land drilling industry, land crews based in one region may accompany a rig to work on wellsites in geographically dispersed oil and natural gas regions a significant distance away from the home office. This development has resulted in the need for full-time accommodations for multiple shifts of the rig crew. |
| • | Increase in drilling and developing unconventional resources. The decline of conventional North American oil and natural gas reservoirs is leading to a shift toward the drilling and development of onshore unconventional oil and natural gas resources. We believe the increased drilling requirements of these unconventional resources will lead to continued drilling activity. Recently, there has been an increase in the construction of new drilling rigs to meet this demand. |
| • | Environmental sensitivity. In response to increasing regulation and environmental sensitivity, onshore wellsite operators are utilizing closed-loop solids control systems to help reduce onsite discharge of drilling fluids and cuttings in environmentally sensitive areas and when working with oil-based and synthetic drilling fluids. These systems require customized solids control configurations to maximize drilling fluid efficiency. |
| • | Outsourcing ancillary services. Some of the services we provide have been historically handled by drilling contractors themselves. In many instances, these services are only ancillary to the primary activity of drilling and completing wells and represent only a minor portion of the total well drilling cost. Many drilling contractors are increasingly electing to outsource these services to suppliers who can provide high-quality and reliable services. |
| • | Increased deepwater development activity. Deepwater exploration and production activities are typically complex with long durations and require personnel involved in drilling, production and construction. Growth in these deepwater activities has resulted in the need for more workforce accommodations on offshore platforms. |
While we believe that these trends will benefit us, our business may be adversely affected by circumstances that are beyond our control. Any prolonged substantial reduction in oil and natural gas prices would likely affect oil and natural gas drilling and production levels and demand for the services we provide. For more information on this and other risks to our business and our industry, please read “Risk Factors—Risks Related to Our Business and Our Industry.”
Our Business Strategy
We believe we are well positioned to become a leading provider of wellsite support and construction and logistics services. Our business strategy consists of the following core elements:
Broaden the suite of services we provide. We have established strong working relationships with our customers which provide us a stable base of operations. We work closely with our customers to define new service offerings that meet specific customer needs in the onshore markets where we operate and also intend to expand our offshore service offerings. We intend to continue to invest in developing or acquiring new high-quality assets and services which add to the breadth and quality of our service portfolio.
3
Table of Contents
Index to Financial Statements
Establish and maintain a leadership position in our principal operating areas.We intend to continue to build leading market positions in the areas in which we operate by offering a comprehensive and integrated package of services which allows us to provide our customers with wellsite support services required across their drilling locations. We view the incremental steps in achieving this to include:
| • | Deploying our suite of services across existing land-based operating areas. We believe we have developed expertise in specific service lines which can be effectively marketed across the majority of our land-based operating areas. We intend to continue to roll-out our existing services across our current operating areas in an effort to deliver a comprehensive portfolio of services in each region. We believe our established customer base and strong regional relationships will continue to provide a strategic distribution network for our service deployment efforts. |
| • | Continue to develop our offshore service offerings. We believe we are a leading provider of offshore workforce accommodations to exploration and production companies. We intend to expand our manufacturing capabilities and offshore service offerings to meet the growing needs of our customers. |
Extend our operations into new geographic areas.We intend to apply our expertise in wellsite support services and land-based construction and logistics services in markets where we currently do not operate and which provide an attractive platform for future growth. We intend to continue to improve the ease with which our clients can use our services from one wellsite location to the next. We expect to support our customers’ entry into other active drilling regions by introducing our service offerings in those regions.
Expand our services internationally. Our offshore workforce accommodation business predominantly operates in the Gulf of Mexico. We intend to pursue strategic opportunities to expand our service offerings into other international offshore markets by leveraging our custom product design and existing customer base.
Focus on service quality, business performance and safety. Our management team is responsible for assessing our service quality, performance and safety compliance and coordinates with our field offices to help ensure that our quality and performance metrics and safety standards are met at every level of our organization. In addition to our internal safety policies, we adhere to certain external safety regulations, such as certifying certain of our offshore workforce accommodation units with the U.S. Coast Guard and/or SOLAS prior to deployment. We intend to continue to invest in and promote designs, systems and methodologies which improve the reliability, responsiveness, accountability and safety of our operations.
Continue to pursue strategic expansion opportunities.We believe that the markets in which we operate remain fragmented and that there are numerous consolidation opportunities within these markets. We completed 17 acquisitions in 2005 and 2006 and intend to continue pursuing strategic acquisitions which add to the scope and quality of our service portfolio. In evaluating such acquisitions we consider a number of factors, including synergies with existing operations, financial performance and acquisition costs.
Capitalize on regional experience. One component of our acquisition and growth strategy is to acquire assets located in strategic operating areas that include personnel with strong local leadership and regional experience. We believe that by having the administrative functions previously performed at the regional level centralized in and handled by our corporate office, we have enhanced our controls environment and enabled our local management to focus on our customers, our employees and the effective management and deployment of our assets.
The execution of our business strategy depends on our ability to manage the growth that we have experienced and successfully operate on an integrated basis. The failure to manage growth and successfully operate on an integrated basis could result in diminished financial performance, our inability to report financial results or require a disproportionate amount of management’s attention. For more information on this and other risks to our business and our industry, please read “Risk Factors—Risks Related to Our Business and Our Industry.”
4
Table of Contents
Index to Financial Statements
For further information on our business strategy, please read “Business—Our Business Strategy.”
Our Competitive Strengths
We believe our operations benefit from a number of competitive strengths, including the following:
| • | Extensive breadth of service throughout the wellsite life-cycle. We provide a broad array of wellsite services throughout each phase of the land-based drilling and production process. This breadth of service strengthens our relationships with our customers and allows us to identify and cross-sell additional services. By providing comprehensive wellsite services to our customers, we believe we have an advantage over our competitors, who generally offer fewer services. |
| • | Extensive geographic footprint with a strong regional and local presence. Our regional operations are located in some of the most active onshore oil and natural gas drilling regions of the United States, including South Texas, the onshore Gulf Coast, ArkLaTex, North Texas, the Permian Basin, the Mid-Continent and Rocky Mountain regions. Within these regions there were approximately 1,525 active land drilling rigs as of December 31, 2006. In addition, our products are utilized in certain offshore markets, including the Gulf of Mexico, and, to a lesser extent, other international offshore regions. Within the offshore Gulf of Mexico market, there were approximately 81 active offshore drilling rigs as of December 31, 2006. Our regional managers have developed strong relationships with our customers throughout their regions and are largely responsible for the sales, marketing and delivery of our services. |
| • | Large scale of operations. We believe we are one of the largest providers of comprehensive land-based wellsite services in our operating areas. Our scale enables us to deliver a comprehensive range of reliable and high-quality wellsite services to our customers. |
| • | Experienced management team with proven acquisition track record and control environment. Our senior management team has extensive experience in the oil and natural gas industry, with an average of 22 years of experience. We believe this background provides our management team with an in-depth understanding of our customers’ needs and enhances our ability to deliver customer driven solutions. Our management also has substantial experience in identifying, completing and integrating acquisitions and since our inception through March 31, 2007, we have acquired 24 businesses. We have also implemented a standardized control environment that includes accounting, safety, environmental and maintenance processes and controls. |
| • | Leveraged to drilling activity. We believe that favorable supply and demand fundamentals will maintain the current level of drilling for oil and natural gas. Efforts to maintain current levels of production will necessitate continued drilling for the foreseeable future, which will sustain demand for our services. As our package of services typically comprises less than 15% of total drilling expenditures, our business has not historically experienced the pricing volatility experienced by drilling contractors, who represent a much larger portion of total drilling expenditures. |
| • | Leadership position in the offshore workforce accommodation business. We are one of a few providers of U.S. Coast Guard and SOLAS certified offshore workforce accommodation units worldwide. We believe our history, our custom design and the quality of our products and services provide a competitive advantage over our existing competitors and new entrants into this market. |
Recent Developments
9.75% Senior Notes. In a private placement on January 19, 2007, Stallion Oilfield Services Ltd. issued $300 million of 9.75% Senior Notes due February 1, 2015 (the “Senior Notes”). Proceeds from the sale of the
5
Table of Contents
Index to Financial Statements
Senior Notes were used to retire the outstanding balance on Stallion Oilfield Services Ltd.’s $210.0 million Term B Loan and to pay down approximately $44.5 million under our revolving credit facility. For further information on our Senior Notes, please read “Management’s Discussion and Analysis of Financial Condition and Results of Operations—Liquidity and Capital Resources—9.75% Senior Notes.”
Credit Facility. Concurrent with the placement of the Senior Notes, we amended our existing senior secured credit facility to increase our revolving credit line from $70 million to $125 million and reduced the applicable interest rate to LIBOR plus 2.00%. Additionally the revolving credit covenant package was adjusted to provide greater operating flexibility. For further information on our credit facility, please read “Management’s Discussion and Analysis of Financial Condition and Results of Operations—Liquidity and Capital Resources—2006 Credit Facility.”
Risk Factors
You should carefully consider the matters described under “Risk Factors.” These risks could materially and adversely impact our business, financial condition, operating results and cash flows, which could cause the trading price of our common stock to decline and could result in a partial or total loss of your investment.
The Restructuring
We were formed as a Delaware corporation in June 2006. In connection with this offering, we will succeed to the business and operations of Stallion Oilfield Holdings, Ltd. (“Stallion Ltd.”), which are described in this prospectus. Prior to the completion of this offering, Stallion Ltd. will merge with and into Stallion Oilfield Services, Inc., with Stallion Oilfield Services, Inc. being the surviving corporate parent and owning all of the operating subsidiaries of Stallion Ltd. (the “Restructuring”). The majority owners of Stallion Ltd. are C/R Stallion Investment Partnership, L.P. and C/R Energy Coinvestment II, L.P. (together, “Carlyle/Riverstone”) and an affiliate of Craig Johnson, our President, Chief Executive Officer and Chairman of the Board. Since the entities are under common ownership and control, the Restructuring will be accounted for at historical cost. In the Restructuring, assuming an initial public offering price of $ , which is the midpoint of the public offering price range set forth on the cover of this prospectus, the partners of Stallion Ltd. will receive an aggregate of shares of our common stock in exchange for all of the Stallion Ltd. partnership interests held by them. Immediately following completion of the Restructuring and prior to this offering, we will have shares of common stock outstanding, % of which will be owned by Carlyle/Riverstone and % of which will be owned by an affiliate of Craig Johnson.
For additional information about the Restructuring, please read “Certain Relationships and Related Party Transactions—The Restructuring.” Please see “Business—Corporate Structure” for a chart depicting our corporate structure following the Restructuring.
Our Executive Offices
Our principal executive offices are located at 410 Roberts Street, Houston, Texas 77003, and our telephone number is (713) 528-5544. Information contained on or accessible from our website,www.stallionoilfield.com, is not part of this prospectus.
6
Table of Contents
Index to Financial Statements
The Offering
Common stock offered by us | shares or shares if the underwriters exercise in full their option to purchase additional shares of common stock |
Common stock offered by the selling stockholders | shares |
Common stock outstanding after this offering | shares or shares if the underwriters exercise in full their option to purchase additional shares of common stock |
Use of proceeds | We estimate that our net proceeds from this offering, after deducting underwriting discounts and commissions and estimated offering expenses, will be approximately $ million, assuming an initial public offering price of $ , which is the midpoint of the range set forth on the cover page of this prospectus. |
We intend to use the net proceeds we receive from this offering:
| • | to repay $ million of indebtedness under our credit facility; and |
| • | for general corporate purposes, including potential acquisitions and capital expenditures in connection with our anticipated growth. See “Use of Proceeds.” |
Some of the underwriters are lenders under our credit facility and will receive proceeds of the offering in connection with the repayment.
We will not receive any of the proceeds from the sale of shares of our common stock by the selling stockholders. The selling stockholders include members of our senior management. See “Principal and Selling Stockholders.” |
We will use any net proceeds from the exercise of the underwriters’ option to purchase additional shares of common stock for general corporate purposes.
The NASDAQ Stock Market LLC symbol | “SOFS” |
Risk Factors | See “Risk Factors” beginning on page 10 of this prospectus for a discussion of factors that you should carefully consider before deciding to invest in shares of our common stock. |
The number of shares of common stock that will be outstanding after the offering includes as of March 31, 2007, an aggregate of shares of restricted common stock issued to officers and key employees under our 2007 Stock Incentive Plan that are subject to vesting and excludes, as of March 31, 2007, an aggregate of shares of common stock reserved and available for future issuance under our 2007 Stock Incentive Plan.
7
Table of Contents
Index to Financial Statements
Summary Historical Financial Information
The following table sets forth our summary historical consolidated financial and operating data as of the dates and for the periods shown. Our operations are currently conducted by Stallion Oilfield Holdings, Ltd., a limited partnership, and its operating subsidiaries. Immediately prior to the closing of this offering, this limited partnership will merge with and into Stallion Oilfield Services, Inc., and we will operate under a corporate parent structure. Stallion Oilfield Services, Inc., the surviving entity of the Restructuring, will serve as the parent holding company under this new structure. The amounts for each historical annual period presented below were derived from our audited consolidated financial statements. The following information should be read in conjunction with “Capitalization,” “Management’s Discussion and Analysis of Financial Condition and Results of Operations,” our consolidated financial statements and related notes and the unaudited pro forma consolidated financial data included elsewhere in this prospectus. Stallion Oilfield Holdings, Ltd. was formed in 2002 and commenced operations in 2003. As a result, financial results for 2002 are not presented.
Stallion Oilfield Holdings, Ltd. Historical Consolidated | Stallion Oilfield Services, Inc. Pro Forma Consolidated | |||||||||||||||||||
| Year Ended December 31, | ||||||||||||||||||||
| 2003 | 2004 | 2005 | 2006 | Year Ended December 31, 2006 | ||||||||||||||||
| (unaudited) | ||||||||||||||||||||
Statement of Operations Data: | ||||||||||||||||||||
Revenue: | ||||||||||||||||||||
Wellsite support services | $ | 6,769 | $ | 15,452 | $ | 73,126 | $ | 162,661 | $ | 179,743 | ||||||||||
Construction and logistics services | — | — | — | 77,749 | 87,432 | |||||||||||||||
Total revenue | 6,769 | 15,452 | 73,126 | 240,410 | 267,175 | |||||||||||||||
Expenses: | ||||||||||||||||||||
Wellsite support services | 3,108 | 8,695 | 42,281 | 74,200 | 80,992 | |||||||||||||||
Construction and logistics services | — | — | — | 42,319 | 47,792 | |||||||||||||||
Selling, general and administrative | 2,145 | 3,745 | 9,883 | 43,359 | 48,232 | |||||||||||||||
Depreciation and amortization | 836 | 1,924 | 7,798 | 30,068 | 35,695 | |||||||||||||||
Loss on disposal of assets | 86 | 92 | 499 | 920 | 787 | |||||||||||||||
Total expenses | 6,175 | 14,456 | 60,461 | 190,866 | 213,498 | |||||||||||||||
Operating income | 594 | 996 | 12,665 | 49,544 | 53,677 | |||||||||||||||
Interest expense, net | (489 | ) | (917 | ) | (4,565 | ) | (18,919 | ) | (22,187 | ) | ||||||||||
Other income (expense) | — | — | (66 | ) | 71 | 180 | ||||||||||||||
Income before taxes | 105 | 79 | 8,034 | 30,696 | 31,670 | |||||||||||||||
Income tax(1) | — | — | (598 | ) | (4,927 | ) | (12,035 | ) | ||||||||||||
Net income | $ | 105 | $ | 79 | $ | 7,436 | $ | 25,769 | $ | 19,635 | ||||||||||
Pro forma income tax (unaudited)(1) | $ | 40 | $ | 30 | $ | 3,053 | $ | 11,664 | ||||||||||||
Pro forma net income (unaudited) | $ | 65 | $ | 49 | $ | 4,981 | $ | 19,032 | ||||||||||||
Earnings per share: | ||||||||||||||||||||
Basic | ||||||||||||||||||||
Diluted | ||||||||||||||||||||
Weighted average shares: | ||||||||||||||||||||
Basic | ||||||||||||||||||||
Diluted | ||||||||||||||||||||
Other Financial Data: | ||||||||||||||||||||
EBITDA(2) | $ | 1,430 | $ | 2,920 | $ | 20,397 | $ | 79,683 | ||||||||||||
Cash flow provided by operating activities | 144 | 1,734 | 7,087 | 41,124 | ||||||||||||||||
Cash flow used in investing activities | (7,536 | ) | (7,142 | ) | (83,462 | ) | (280,164 | ) | ||||||||||||
Cash flow provided by financing activities | 7,804 | 5,046 | 77,307 | 242,158 | ||||||||||||||||
Capital expenditures: | ||||||||||||||||||||
Acquisitions, net of cash acquired(3) | 5,505 | 1,158 | 47,191 | 178,045 | ||||||||||||||||
Property and equipment | 2,046 | 5,961 | 35,951 | 92,029 | ||||||||||||||||
8
Table of Contents
Index to Financial Statements
Stallion Oilfield Holdings, Ltd. Historical Consolidated | ||||||||||||
| Year Ended December 31, | ||||||||||||
| 2003 | 2004 | 2005 | 2006 | |||||||||
| (in thousands) | ||||||||||||
Balance Sheet Data | ||||||||||||
Cash and cash equivalents | $ | 412 | $ | 50 | $ | 982 | $ | 4,100 | ||||
Net property and equipment | 7,131 | 13,899 | 74,583 | 220,777 | ||||||||
Total assets | 16,252 | 24,713 | 123,136 | 446,907 | ||||||||
Total debt | 11,705 | 18,552 | 67,795 | 257,539 | ||||||||
Total partners’ capital | 3,533 | 3,611 | 43,597 | 153,534 | ||||||||
| (1) | Historically, we were not subject to taxes on a consolidated basis due to our partnership structure; however, certain of our subsidiary companies are taxable corporations and are subject to income tax. Pro forma net income for the year ended December 31, 2006 includes a provision for taxes on our consolidated income before tax. Pro forma income tax expense has been computed at a blended state and federal tax rate of 38% to reflect the pro forma income tax effect on net income for the periods presented assuming that the Restructuring happened on January 1, 2003. |
| (2) | EBITDA consists of net income before interest expense, taxes, depreciation and amortization. EBITDA is used as a supplemental financial measure by our management and by external users of our financial statements, such as investors and commercial banks, to assess: |
| • | the financial performance of our assets without regard to financing methods, capital structure, or historical cost basis; |
| • | the ability of our assets to generate cash sufficient to pay interest on our indebtedness; |
| • | our operating performance and return on invested capital as compared to those of other companies in the oilfield service industry, without regard to financing methods and capital structure; and |
| • | our compliance with certain financial covenants included in our credit facility. |
| EBITDA has limitations as an analytical tool and should not be considered an alternative to net income, operating income, cash flow from operating activities or any other measure of financial performance or liquidity presented in accordance with accounting principles generally accepted in the United States of America (“GAAP”). EBITDA excludes some, but not all, items that affect net income and operating income and these measures may vary among other companies. Limitations to using EBITDA as an analytical tool include: |
| • | EBITDA does not reflect our cash expenditures or future requirements for capital expenditures or capital commitments; |
| • | EBITDA does not reflect changes in, or cash requirements necessary to service interest or principal payments on, our debt; |
| • | although depreciation and amortization are non-cash charges, the assets being depreciated and amortized will often have to be replaced in the future, and EBITDA does not reflect any cash requirements for such replacements; and |
| • | other companies in our industry may calculate EBITDA differently than we do, limiting its usefulness as a comparative measure. |
| The following table presents a reconciliation of the non-GAAP financial measure of EBITDA to the most directly comparable GAAP financial measure on a historical basis for each of the indicated periods. |
| Year Ended December 31, | ||||||||||||
| 2003 | 2004 | 2005 | 2006 | |||||||||
| (in thousands) | ||||||||||||
Reconciliation of EBITDA to Net income: | ||||||||||||
Net income | $ | 105 | $ | 79 | $ | 7,436 | $ | 25,769 | ||||
Income taxes | — | — | 598 | 4,927 | ||||||||
Interest expense | 489 | 917 | 4,565 | 18,919 | ||||||||
Depreciation and amortization | 836 | 1,924 | 7,798 | 30,068 | ||||||||
EBITDA | $ | 1,430 | $ | 2,920 | $ | 20,397 | $ | 79,683 | ||||
| (3) | Acquisitions, net of cash acquired, consists only of the cash component of acquisitions. It does not include equity and/or notes issued for acquisitions. |
9
Table of Contents
Index to Financial Statements
An investment in our common stock involves a high degree of risk. You should carefully consider the following risk factors, together with the other information contained in this prospectus, before deciding to invest in our common stock. Some of the following risks relate principally to the industry in which we operate and to our business. Other risks relate principally to the securities markets and ownership of our common shares. If any of the following risks develop into actual events, our business, financial condition or results of operations could be materially adversely affected, the trading price of your shares could decline, and you may lose all or part of your investment.
Risks Related to Our Business and Our Industry
Our business depends on domestic drilling activity and spending by the oil and natural gas industry in the United States. Our business may be adversely affected by industry conditions that are beyond our control.
We depend on our customers’ willingness to make expenditures to explore for and to develop and produce oil and natural gas in the United States. Our customers’ willingness to undertake these activities depends largely upon prevailing industry conditions that are influenced by numerous factors over which management has no control, such as:
| • | the supply of and demand for oil and natural gas; |
| • | long lead times associated with acquiring equipment and shortages of qualified personnel; |
| • | the level of prices, and expectations about future prices, of oil and natural gas; |
| • | the cost of exploring for, developing, producing and delivering oil and natural gas; |
| • | the expected rates of declining current production; |
| • | the discovery rates of new oil and natural gas reserves; |
| • | available pipeline, storage and other transportation capacity; |
| • | weather conditions, including hurricanes that can affect oil and natural gas operations over a wide area; |
| • | domestic and worldwide economic conditions; |
| • | political instability in oil and natural gas producing countries; |
| • | technical advances affecting energy consumption; |
| • | the price and availability of alternative fuels; |
| • | the ability of oil and natural gas producers to raise equity capital and debt financing; and |
| • | merger and divestiture activity among oil and natural gas producers. |
The level of oil and natural gas exploration and production activity in the United States is volatile. Expected trends in oil and natural gas production activities may not continue and demand for our services may not reflect the level of activity then existing in the industry. Any prolonged substantial reduction in oil and natural gas prices would likely affect oil and natural gas production levels and, therefore, affect demand for the services we provide. A material decline in oil and natural gas prices or drilling activity levels could have a material adverse effect on our business, financial condition, results of operations and cash flow. In addition, a decrease in the development rate of oil and natural gas reserves in our market areas may also have an adverse impact on our business, even in an environment of stronger oil and natural gas prices.
10
Table of Contents
Index to Financial Statements
A decline in or substantial volatility of oil and natural gas prices could adversely affect the demand for our services.
The demand for our services is primarily influenced by current and anticipated oil and natural gas prices and the related level of drilling activity and general production spending in the areas in which we have operations. Volatility or weakness in oil and natural gas prices (or the perception that oil and natural gas prices will decrease) affects the spending patterns of our customers and may result in the drilling of fewer new wells. This, in turn, could result in lower demand for our services. As a result, we may experience lower utilization of, and may be forced to lower our rates for, our services and equipment. A decline in oil and natural gas prices or a reduction in drilling and production activities could have a material adverse affect on the demand for our services and our results of operations.
Prices for oil and natural gas historically have been extremely volatile and are expected to continue to be volatile. For example, over the last three years, the WTI Cushing crude oil spot price has ranged from a low of $25.24 per bbl on April 29, 2003 to a high of $77.03 per bbl on July 14, 2006. As of March 31, 2007, the WTI Cushing crude oil spot price was $65.88 per bbl. The Henry Hub natural gas spot price has ranged from $3.99 per mcf on October 31, 2003 to $15.39 per mcf on December 13, 2005. As of March 31, 2007, the Henry Hub natural gas spot price was $7.50 per mcf. Producers generally react to declining oil and natural gas prices by reducing expenditures. This has in the past had, and may in the future have, an adverse effect on our business. Mild weather in January 2007 caused some declines in the price of oil and natural gas and we experienced some signs of softer demand for our services early in the first quarter of 2007, which appeared to stabilize in the latter part of the quarter. We are unable to predict future oil and natural gas prices or the level of oil and natural gas industry activity. A prolonged low level of activity in the oil and natural gas industry will adversely affect both the demand for our products and services and our financial condition and results of operations.
When land-based rig counts are low, our rig relocation customers may not have a need for our services.
Many of the major United States drilling services contractors have significant capabilities to move their own land-based drilling rigs and related oilfield equipment and to mobilize rigs. When regional rig counts are high, drilling contractors often exceed their own capabilities and contract for additional oilfield equipment hauling and onshore rig mobilization capacity. Our rig relocation business activity is correlated to the onshore rig count; however, the correlation varies over the rig count range. The Baker Hughes onshore rotary rig rate for the weeks ended December 29, 2006 and March 30, 2007 were 1,626 and 1,676, respectively. As rig count declines, some drilling contractors reach a point where all of their oilfield equipment hauling and rig mobilization needs can be met by their own fleets. If one or more of our rig relocation customers decide not to outsource their rig and equipment hauling needs, our revenue attributable to rig relocation may decline much faster than the corresponding rig count. This relationship between our rig relocation business activity and the rig count in the areas where we have rig relocation operations can significantly increase the volatility of our earnings with respect to rig relocation.
We may not be able to manage future growth successfully, to grow successfully through future acquisitions, or to integrate the businesses we do acquire effectively.
Our business strategy has included, and will continue to include, growth through the acquisition of other businesses. In 2006, we acquired 11 businesses for a total purchase consideration of approximately $207 million. We may not be able to continue to identify attractive acquisition opportunities or successfully acquire identified targets on terms favorable to us. Competition for acquisition opportunities is substantial and may escalate, increasing our cost of making future acquisitions or causing us to refrain from making acquisitions. We may be required to incur substantial indebtedness to finance future acquisitions. Such additional debt service requirements may impose a significant burden on our results of operations and financial condition. Our credit agreement and indenture require that we meet certain financial covenants in order to borrow money to fund future acquisitions. In addition, we may not be successful in integrating our current or future acquisitions into our existing operations, which may result in unforeseen operational difficulties, diminished financial performance or
11
Table of Contents
Index to Financial Statements
our inability to report financial results and may require a disproportionate amount of our management’s attention. For example, if we are unable to effectively apply systems and controls to acquired businesses, including internal controls, the availability or timeliness of financial reports could be materially reduced.
Some of the financial statements included in this prospectus were audited by an accounting firm that does not regularly participate in the public securities offering process or prepare financial statements of the type that would be included in a public offering prospectus.
Wright, Moore, DeHart, Dupuis & Hutchinson, L.L.C., the audit firm for the financial statements of BLR Construction Companies, L.L.C. and affiliate and of BLR Construction Co., Inc. and affiliates included in this prospectus, is not registered with PCAOB and does not generally participate in public offerings or prepare financial statements of the type that would be included in a public offering prospectus. There can be no assurances that these financial statements would not be subject to revision if re-audited by UHY or another accounting firm registered with PCAOB and adjustments could be required.
We are vulnerable to the potential difficulties associated with rapid growth and expansion.
We have grown rapidly over the last several years through organic growth and acquisitions of other companies. Since our inception through March 31, 2007, we have acquired 24 businesses. We believe that our future success depends on our ability to manage the rapid growth that we have experienced and the demands from increased responsibility on our management personnel. The following factors could present difficulties to us:
| • | lack of sufficient executive-level personnel; |
| • | increased administrative burden; |
| • | increased organizational challenges common to large, expansive operations; and |
| • | long lead times associated with acquiring equipment. |
Our operating results could be adversely affected if we do not successfully manage these potential difficulties.
Our operating history may not be sufficient for investors to evaluate our business and prospects.
The historical financial information incorporated herein is not necessarily indicative of the results that would have been achieved had we operated on a fully integrated basis or the results of that may be realized in the future. We have a short operating history. In addition, we have grown significantly over the last few years through acquisitions. This may make it more difficult for investors to evaluate our business and prospects and to forecast our future operating results. Our future results will depend on our ability to efficiently manage our integrated operations and execute our business strategy.
We may require additional capital in the future, which may not be available to us.
Our acquisition strategy requires significant capital. In addition, our business is capital intensive, requiring specialized equipment and trained personnel to provide our services. We may need to raise additional funds through public or private debt or equity financings. Adequate funds may not be available when needed or may not be available on favorable terms. If funding is insufficient at any time in the future, we may be unable to service our equipment, fund acquisitions, take advantage of business opportunities or respond to competitive pressures, any of which could harm our business. Our future capital requirements primarily depend on the frequency, timing, size and success of our acquisitions.
12
Table of Contents
Index to Financial Statements
We depend on significant customers.
We derive a significant amount of our revenue from exploration and production companies and drilling contractors who are active in our markets. For the year ended December 31, 2006, our top ten customers accounted for approximately 35.2% of our revenue. Our inability to continue to perform services for a number of our large existing customers could have a material adverse effect on our business and operations.
Our success depends on key members of our management, the loss of any of whom could disrupt our business operations.
We depend to a large extent on the services of some of our executive officers and directors. We may not be able to retain our executive officers and may not be able to enforce the non-compete provisions in their employment agreements. The loss of the services of our executive officers, directors, or other key personnel could disrupt and adversely affect our operations. Please see “Management—Employment Agreements.”
Competition within the oilfield service industry may adversely affect our ability to market our services.
The oilfield service industry is competitive and fragmented and includes numerous small companies capable of competing in our markets on a local basis as well as several large companies that possess substantially greater financial and other resources than us. Our larger competitors’ greater resources could allow them to compete more effectively than us. We believe that the principal competitive factors in the market areas that we serve are quality of product and service, price, availability and technical proficiency. Our operations may be adversely affected if our current competitors or new market entrants introduce new products or services with better features, performance, prices or other characteristics than our products and services. Competitive pressures, excess capacity in our industry or other factors also may result in significant price competition that could have a material adverse effect on our results of operations and financial condition. Finally, competition among oilfield service and equipment providers is also affected by each provider’s reputation for safety and quality. If our safety record or the quality of our service declines, we may not be able to maintain our competitive position.
Our industry has experienced a high rate of employee turnover. Any difficulty we experience replacing or adding personnel could adversely affect our business.
We may not be able to find enough skilled labor to meet our needs, which could limit our growth. The oilfield service business has been cyclical in the past and is heavily influenced by oil and natural gas prices. Our services require skilled workers who can perform physically demanding work. As a result of our industry volatility and the demanding nature of the work, workers may choose to pursue employment in fields that offer a more desirable work environment at wage rates that are competitive with ours. We believe that our success is dependent upon our ability to continue to employ, train and retain skilled personnel. The demand for skilled workers is high, and the supply is limited, particularly in the Rocky Mountain region, which is one of our key regions. It is possible that we will have to raise wage rates to attract workers from other fields and to retain or expand our current work force. If we are not able to increase our service rates sufficiently to compensate for wage rate increases, our operating results may be adversely affected. Our inability to employ, train or retain skilled personnel generally could have a material adverse effect on our results of operations.
Our operations are subject to hazards inherent in the oil and natural gas industry.
Through our wellsite construction services, we operate cranes, forklifts, bulldozers and other heavy equipment. In addition, in connection with providing rig logistics services, we transport land-based drilling rigs and related equipment through the use of our heavy hauler trucks and trailers, cranes and other trucking and relocation assets. The operation of heavy equipment at the wellsite and the transportation of rigs and related assets may result in accidents, which can cause personal injury, loss of life, suspension of operations, damage to facilities and damage to or destruction of property. These and other operational risks inherent in our industry could expose us to substantial liability for personal injury, wrongful death, property damage, loss of oil and
13
Table of Contents
Index to Financial Statements
natural gas production, pollution and other environmental damages. The frequency and severity of such incidents will affect our operating costs, insurability and relationships with customers, employees and regulators. In particular, our customers may elect not to purchase our services if they view our safety record as unacceptable, which could cause us to lose customers and substantial revenue.
We do not have insurance against all foreseeable risks, either because insurance is not available or because of the high premium costs. The occurrence of an event not fully insured against, or the failure of an insurer to meet its insurance obligations, could result in substantial losses. In addition, we may not be able to maintain adequate insurance in the future at rates we consider reasonable, and there can be no assurance that insurance will be available to cover any or all of these risks, or, even if available, that it will be adequate or that insurance premiums or other costs will not rise significantly in the future, so as to make such insurance costs prohibitive. In addition, our insurance is subject to coverage limits and some policies exclude coverage for damages resulting from environmental contamination. See “Business—Operating Risks and Insurance.”
We are subject to federal, state and local regulation regarding issues of health, safety and protection of the environment. Under these regulations, we may become liable for penalties, damages or costs of remediation. Any changes in laws and government regulations could increase our costs of doing business.
Our operations are subject to federal, state and local laws and regulations relating to protection of natural resources and the environment, health and safety, waste management, and transportation of waste and other materials. Liability under these laws and regulations could result in cancellation of landbased wellsite or offshore operations, fines and penalties, expenditures for remediation and liability for property damages and personal injuries. Sanctions for noncompliance with applicable environmental laws and regulations also may include assessment of administrative, civil and criminal penalties, revocation of permits and issuance of corrective action orders. We maintain three tug boats and three barges that are required to be certified by the U.S. Coast Guard before the vessels may be deployed for use. In addition, some of our offshore workforce accommodation units must be certified by the U.S. Coast Guard before we can supply the units to our customers for use offshore. If we are unsuccessful or are delayed in certifying our vessels or certain of our accommodation units with the U.S. Coast Guard, our business, operating results and financial condition could be harmed.
Laws protecting the environment generally have become more stringent over time and are expected to continue to do so, which could lead to material increases in costs for future environmental compliance and remediation. The modification or interpretation of existing laws or regulations, or the adoption of new laws or regulations, could curtail exploratory or developmental drilling for oil and natural gas and could limit wellsite services opportunities. Some environmental laws and regulations may impose strict liability, which means that in some situations we could be exposed to liability as a result of our conduct that was lawful at the time it occurred as a result of conduct or conditions caused by, prior operators or other third parties. Clean-up costs and other damages arising as a result of environmental laws, and costs associated with changes in environmental laws and regulations could be substantial and could have a material adverse effect on our financial condition. We maintain insurance against some risks associated with underground contamination that may occur as a result of wellsite service activities. However, this insurance is limited to activities at the wellsite, and this insurance may not continue to be available or may not be available at premium levels that justify its purchase. The occurrence of a significant event not fully insured or indemnified against could have a materially adverse effect on our financial condition and operations. Please read “Business—Environmental Matters” for more information on the environmental laws and government regulations that are applicable to us.
We have operations located on lands that are regulated by the Bureau of Land Management of the United States Department of Interior and these operations may be subject to long periods of interruption or suspension.
The Bureau of Land Management (the “BLM”) enforces regulations that protect certain animals, such as deer, sage grouse and raptors that inhabit lands in the northern United States, where we have operations. We
14
Table of Contents
Index to Financial Statements
provide services in these locations and our revenue attributable to these services accounted for 22.3% of our total revenue for the year ended December 31, 2006. We are affected by this enforcement through the following ways. The BLM may deny or delay the granting of permits to us or our customers necessary to conduct operations in these lands. In addition, the BLM may restrict access to or seek our relocation from these lands for a period of time. As a result of this enforcement, our operations on these lands have been and may be interrupted or suspended for long periods of time. For example, from mid-November until mid-May, the period during which mule deer roam these lands, certain of our operations cease and go on stand-by. In addition, during April and May of each year, sage grouse nesting occurs and as a result, we are required to relocate our operations for a period of time. If these regulations become more stringent and, as a result, our operations are interrupted or suspended for longer periods of time, we could lose revenue. The loss of revenue that could occur could have a material impact on our financial condition and results of our operation.
Delays in obtaining permits by our customers for their operations could impair our business.
Our customers’ business operations require permits from various governmental agencies, including the BLM. The ease of obtaining the necessary permits depends on the type of operation and the state in which the operation will take place. As with all governmental permit processes, permits may not be issued in a timely fashion, or at all, or in a form consistent with our plan of operations. As a result, our operations may be interrupted or suspended for long periods of time, which could cause us to lose revenue and have a material adverse effect on our results of operation.
Our holding company structure makes us dependent on our subsidiaries to meet our financial obligations.
As a holding company, we have no significant assets other than the equity of our subsidiaries. In order to meet financial obligations, we rely exclusively on the cash flow from our subsidiaries. Our operating subsidiaries may be unable to generate sufficient cash flow for us to meet our financial obligations. Substantially all of our operating subsidiaries have guaranteed our senior notes and the debt under our credit facility.
If we fail to develop or maintain an effective system of internal controls, we may not be able to accurately report our financial results or prevent fraud. As a result, our business and the trading price of our common stock could be affected as potential shareholders lose confidence in our financial reporting.
Effective internal controls are necessary for us to provide reliable financial reports and effectively prevent fraud and to operate successfully as a public company. If we cannot provide reliable financial reports or prevent fraud, our reputation and operating results could be harmed. We cannot be certain that our efforts to develop and maintain our internal controls will be successful or that we will be able to maintain adequate controls over our financial processes and reporting in the future, including compliance with the obligations under Section 404 of the Sarbanes-Oxley Act of 2002. Any failure to develop or maintain effective controls, or difficulties encountered in their implementation or other effective improvement of our internal controls could harm our operating results or cause us to fail to meet our reporting obligations. Ineffective internal controls could also cause investors to lose confidence in our reported financial information, which would likely have a negative effect on the trading price of our common stock.
Our indebtedness could restrict our operations and make us more vulnerable to adverse economic conditions.
We now have, and after this offering will continue to have, a significant amount of indebtedness. As of December 31, 2006, our total debt was $257.5 million, including $253.0 million in aggregate principal amount due under our term loan and credit facilities. Following this offering and giving effect to the use of proceeds therefrom and to our January 19, 2007 issuance of $300 million of 9.75% Senior Notes, on an as adjusted basis our total debt would have been $ million. Holding all other variables constant, if interest rates on our floating rate debt increased or decreased by 1%, interest expense for the year ended December 31, 2006 would have increased or decreased by approximately $0.3 million. We will also have the ability to incur substantially
15
Table of Contents
Index to Financial Statements
more debt. We have a total borrowing capacity of $125.0 million under our credit facility of which $124.1 million was available as of March 31, 2007.
Our current and future indebtedness could have important consequences to you. For example, it could:
| • | impair our ability to make investments and obtain additional financing for working capital, capital expenditures, acquisitions or other general corporate purposes; |
| • | limit our ability to use operating cash flow in other areas of our business because we must dedicate a substantial portion of these funds to make principal and interest payments on our indebtedness; |
| • | limit our ability to borrow funds that may be necessary to operate or expand our business; |
| • | prevent us from paying dividends to our stockholders, entering into transactions with affiliates or entering into sale and leaseback transactions that may be beneficial to us; |
| • | limit our ability to purchase or acquire property or assets, merge or consolidate with other entities or sell all or substantially all of our assets; |
| • | put us at a competitive disadvantage to competitors that have less debt; |
| • | increase our vulnerability to interest rate increases; and |
| • | hinder our ability to adjust to rapidly changing economic and industry conditions. |
Our existing term credit facility requires us to maintain certain financial ratios and to satisfy certain financial conditions. In addition, our credit facility and indenture contain numerous covenants that limit our discretion with respect to business matters, including mergers or acquisitions, paying dividends, repurchasing our common stock, incurring additional debt or disposing of assets. A breach of any of these covenants could result in a default under the agreement. If an event of default were to occur, we and our subsidiary guarantors may not be able to pay our debts or borrow sufficient funds to refinance them. Even if new financing were available, it may not be on terms acceptable to us. As a result of this risk, we could be forced to take actions that we otherwise would not take, or not take actions that that we otherwise might take, in order to comply with the covenants in the credit agreement or the indenture. For example, these restrictions could also limit our ability to obtain future financings, make needed capital expenditures, withstand a downturn in our business or the economy in general, or otherwise conduct necessary corporate activities.
Please read “Management’s Discussion and Analysis of Financial Condition and Results of Operations—Liquidity and Capital Resources—2006 Credit Facility” for a discussion of our credit facility.
A terrorist attack or armed conflict could harm our business.
Terrorist activities, anti-terrorist efforts and other armed conflicts involving the United States or other countries may adversely affect the United States and global economies and could prevent us from meeting our financial and other obligations. If any of these events occur, the resulting political instability and societal disruption could reduce overall demand for oil and natural gas, potentially putting downward pressure on demand for our services and causing a reduction in our revenue. Oil and natural gas related facilities could be direct targets of terrorist attacks, and our operations could be adversely impacted if infrastructure integral to our customers’ operations is destroyed or damaged. Costs for insurance and other security may increase as a result of these threats, and some insurance coverage may become more difficult to obtain, if available at all.
Our operations in the Gulf of Mexico and coastal regions of Louisiana and Texas are adversely impacted by the hurricane season, which generally occurs in the second and third calendar quarters of the year.
Hurricanes and the threat of hurricanes during this period will often result in the shut-down of oil and natural gas operations in the Gulf of Mexico, coastal regions and land operations within the hurricane path. Our
16
Table of Contents
Index to Financial Statements
operations are negatively affected by hurricanes in three ways. First, we may incur significant expenses when we transport our accommodation units and surface and other equipment away from and back to the affected wellsite. Second, during a shut-down period, we are unable to access wellsites and our services are suspended resulting in loss of revenue for this period of time. Third, if we are unsuccessful in transporting our accommodation units and surface equipment away from the storm threatened area, the units and equipment may suffer significant damage resulting in additional expenses incurred to repair or replace the damaged units or equipment. For example, a number of our accommodation units and mats were damaged, displaced or lost during Hurricane Katrina. A period of approximately 60 days passed before we were able to purchase and deploy new accommodation units and mats in this area, resulting in lost revenue during such time. In addition, a significant amount of our offshore workforce accommodation business is conducted in areas susceptible to hurricanes. The occurrence of a hurricane can therefore create unpredictability in activity and utilization rates and lead to the destruction of our property, which can have a material adverse impact on our business, financial condition, results of operations and cash flow.
We have operations in the Gulf of Mexico where we do not maintain business interruption insurance.
Our offshore workforce accommodation business operates in the Gulf of Mexico and, to a lesser extent, other international offshore regions. We are not insured against interruptions of our offshore operations or business activities. If our operations in these areas are disrupted by severe weather conditions such as hurricanes, or otherwise, we will be unable to recoup the lost revenue resulting from these disruptions. If these operations are disrupted frequently and/or for a significant period of time, we could lose substantial revenue.
Our customers may not maintain insurance against damage to or the loss of the offshore products that they lease from us.
In our offshore workforce accommodation business, our customers are contractually obligated to maintain insurance against property damage to or loss of our workforce accommodation units. However, if our customers do not comply with their insurance obligations and our products sustain damage or are lost, then we may be unable to recover the value of the damaged or lost products. For example, certain of our offshore workforce accommodation units were damaged in the hurricanes that occurred in 2004. Some of our customers failed to maintain insurance against the damage to these units. These damaged products were lost or unusable for a substantial period of time. As a result, we incurred additional costs to repair or replace these units and were not able to earn revenue from these units during this time.
Increasing trucking regulations may increase our costs and negatively impact our results of operations.
Through our rig relocation and heavy equipment hauling business, we operate trucks and loaders. As such, we operate as a motor carrier in providing certain of our services and therefore are subject to regulation by the United States Department of Transportation and by various state agencies. These regulatory authorities exercise broad powers governing activities such as the authorization to engage in motor carrier operations and regulatory safety. There are additional regulations specifically relating to the trucking industry, including testing and specifications of equipment and product handling requirements. The trucking industry is subject to possible regulatory and legislative changes that may affect the economics of the industry by requiring changes in operating practices or by changing the demand for common or contract carrier services or the cost of providing truckload services. Some of these possible changes include increasingly stringent environmental regulations, changes in the hours of service regulations which govern the amount of time a driver may drive and/or work in any specific period, onboard black box recorder device requirements or limits on vehicle weight and size.
Interstate motor carrier operations are subject to safety requirements prescribed by the United States Department of Transportation. To a large degree, intrastate motor carrier operations are subject to state safety regulations that mirror federal regulations. Such matters as the weight and dimensions of equipment are also subject to federal and state regulations.
17
Table of Contents
Index to Financial Statements
From time to time, various legislative proposals are introduced, including proposals to increase federal, state, or local taxes, including taxes on motor fuels, which may increase our costs or adversely impact the recruitment of drivers. We cannot predict whether, or in what form, any increase in such taxes applicable to us will be enacted.
The contract period during which we provide services to our customers is relatively short, which exposes us to volatility in prices and equipment utilization levels. This volatility may have a material adverse effect on our business.
A significant portion of our revenue is derived by charging our customers for the actual period of time during which we provide services to them. The period of time for which our customers contract with us is usually relatively short, ranging from a few days to several months. The short term of these arrangements exposes us to the risks of a rapid reduction in market prices and equipment utilization and volatility in our revenue. These reductions and volatility may have a material adverse effect on our business. We do not maintain significant backlog and are generally dependent on replacement contracts to sustain and build revenue as jobs are completed.
An increase in the importation of liquefied natural gas, or LNG, as a substitute for oil and natural gas drilling activities may reduce the level of these drilling activities in North America, which may have a material adverse effect on our business.
The importation of LNG is becoming increasingly important as a supply source in order to meet domestic natural gas demand. If the importation of LNG continues to increase and replaces oil and natural gas production as a source for natural gas, then the level of North American drilling activity related to oil and natural gas may decrease. Our services support drilling for oil and natural gas. Consequently, a substantial reduction in oil or natural gas production levels could have a material adverse effect on our business, even in an environment of stronger oil and natural gas prices.
Risks Related to this Offering
Certain stockholders’ shares are restricted from immediate resale but may be sold into the market in the near future. This could cause the market price of our common stock to drop significantly.
After this offering, we will have outstanding shares of common stock. Of these shares, the shares we and the selling stockholders are selling in this offering, or shares if the underwriters exercise in full their option to purchase additional shares, will be freely tradable without restriction under the Securities Act except for any shares purchased by any of our “affiliates” as defined in Rule 144 under the Securities Act. A total of shares, or shares if the underwriters exercise in full their option to purchase additional shares, will be “restricted securities” (within the meaning of Rule 144 under the Securities Act) or subject to lock-up arrangements. In connection with this offering, we, our officers and directors and substantially all of our existing stockholders (including the selling stockholders) have entered into lock-up agreements under which we and they have agreed not to offer or sell any shares of common stock or securities convertible into or exchangeable or exercisable for shares of common stock for an initial period of 180 days from the date of this prospectus without the prior written consent of Lehman Brothers Inc., Credit Suisse Securities (USA) LLC and UBS Securities LLC. Lehman Brothers Inc., Credit Suisse Securities (USA) LLC and UBS Securities LLC may, at any time and without notice, waive any of the terms of these lock-up agreements. See “Underwriting” for a description of these lock-up agreements.
Following the lock-up period, the holders of shares of our common stock will have rights, subject to some limited conditions, to demand that we include their shares in registration statements that we file on their behalf, on our behalf or on behalf of other stockholders. The filing of a registration statement in respect of these shares, the exercise of these holders’ registration rights and the sale by these holders of a large number of shares could cause the price of our common stock to decline. Furthermore, if we file a registration statement to offer additional shares of our common stock and have to include shares held by those holders, it could impair our ability to raise needed capital by depressing the price at which we could sell our common stock.
18
Table of Contents
Index to Financial Statements
As soon as practicable after this offering, we intend to file one or more registration statements with the SEC on Form S-8 providing for the registration of shares of our common stock issued or reserved for issuance under our stock plans. Subject to the exercise of unexercised options or the expiration or waiver of vesting conditions for restricted stock and the expiration of lock-ups we and certain of our stockholders have entered into, shares registered under these registration statements on Form S-8 will be available for resale immediately in the public market without restriction.
Purchasers of common stock will experience immediate and substantial dilution.
Based on an assumed initial public offering price of $ per share, purchasers of our common stock in this offering will experience an immediate and substantial dilution of $ per share in the net tangible book value per share of common stock from the initial public offering price, and our pro forma net tangible book value as of December 31, 2006 after giving effect to this offering would be $ per share. You will incur further dilution if outstanding options to purchase common stock are exercised. In addition, our certificate of incorporation allows us to issue significant numbers of additional shares. Please read “Dilution” for a complete description of the calculation of net tangible book value.
Our certificate of incorporation, bylaws and Delaware law contain provisions that could discourage acquisition bids or merger proposals, which may adversely affect the market price of our common stock.
Our certificate of incorporation authorizes our board of directors to issue preferred stock without stockholder approval. If our board of directors elects to issue preferred stock, it could be more difficult for a third party to acquire us. In addition, some provisions of our certificate of incorporation, bylaws and Delaware law could make it more difficult for a third party to acquire control of us, even if the change of control would be beneficial to our stockholders, including:
| • | limitations on the removal of directors; |
| • | the prohibition of stockholder action by written consent; and |
| • | limitations on the ability of our stockholders to call special meetings and establish advance notice provisions for stockholder proposals and nominations for elections to the board of directors to be acted upon at meetings of stockholders. |
Delaware law prohibits us from engaging in any business combination with any “interested stockholder,” meaning generally that a stockholder who beneficially owns more than 15% of our common stock cannot acquire us for a period of three years from the date this person became an interested stockholder, unless various conditions are met, such as approval of the transaction by our board of directors. These provisions could limit the price that investors might be willing to pay in the future for shares of our common stock.
Because we have no plans to pay dividends on our common stock, investors must look solely to stock appreciation for a return on their investment in us.
We do not anticipate paying any cash dividends on our common stock in the foreseeable future. We currently intend to retain all future earnings to fund the development and growth of our business. Any payment of future dividends will be at the discretion of our board of directors and will depend on, among other things, our earnings, financial condition, capital requirements, level of indebtedness, statutory and contractual restrictions applying to the payment of dividends and other considerations that the board of directors deems relevant. The terms of our existing credit facility restrict the payment of dividends without the prior written consent of the lenders. Investors must rely on sales of their common stock after price appreciation, which may never occur, as the only way to realize a return on their investment. Investors seeking cash dividends should not purchase our common stock.
19
Table of Contents
Index to Financial Statements
There has been no active trading market for our common stock, and an active trading market may not develop.
Prior to this offering, there has been no public market for our common stock. We intend to apply for listing of our common stock on The NASDAQ Stock Market LLC. We do not know if an active trading market will develop for our common stock or how the common stock will trade in the future, which may make it more difficult for you to sell your shares. Negotiations between the underwriters, the selling stockholders and us will determine the initial public offering price. You may not be able to resell your shares at or above the initial public offering price.
If our stock price declines after the initial offering, you could lose a significant part of your investment.
In recent years, the stock market has experienced extreme price and volume fluctuations. This volatility has had a significant effect on the market price of securities issued by many companies for reasons unrelated to the operating performance of these companies. The market price of our common stock could similarly be subject to wide fluctuations in response to a number of factors, most of which we cannot control, including:
| • | changes in securities analysts’ recommendations and their estimates of our financial performance; |
| • | the public’s reaction to our press releases, announcements and our filings with the Securities and Exchange Commission and those of our competitors; |
| • | fluctuations in broader stock market prices and volumes, particularly among securities of oil and natural gas service companies; |
| • | changes in market valuations of similar companies; |
| • | investor perception of our industry or our prospects; |
| • | additions or departures of key personnel; |
| • | commencement of or involvement in litigation; |
| • | changes in environmental and other governmental regulations; |
| • | announcements by us or our competitors of strategic alliances, significant contracts, new technologies, acquisitions, commercial relationships, joint ventures or capital commitments; |
| • | variations in our quarterly results of operations or cash flow or those of other oil and natural gas service companies; |
| • | revenue and operating results failing to meet the expectations of securities analysts or investors in a particular quarter; |
| • | changes in our pricing policies or pricing policies of our competitors; |
| • | future issuances and sales of our common stock; |
| • | demand for and trading volume of our common stock; |
| • | domestic and worldwide supplies and prices of and demand for oil and natural gas; and |
| • | changes in general conditions in the United States economy, financial markets or the oil and natural gas industry. |
The realization of any of these risks and other factors beyond our control could cause the market price of our common stock to decline significantly.
20
Table of Contents
Index to Financial Statements
Risk Factors Relating to Our Relationship with Carlyle/Riverstone
Carlyle/Riverstone controls the outcome of stockholder voting and may exercise this voting power in a manner adverse to our other stockholders. Carlyle/Riverstone may control the Board of Directors.
Prior to this offering, Carlyle/Riverstone holds approximately % of our outstanding common stock. Following this offering, Carlyle/Riverstone will hold approximately % of our outstanding common stock (or % if the underwriters exercise in full their option to purchase additional shares). Accordingly, Carlyle/ Riverstone is in a position to effectively control the outcome of matters requiring a stockholder vote, including the election of directors, adoption of amendments to our certificate of incorporation or bylaws or approval of transactions involving a change of control. The interests of Carlyle/Riverstone may differ from yours, and Carlyle/Riverstone may vote its common stock in a manner that may adversely affect you.
In addition, we are party to a nominating agreement with Carlyle/Riverstone. Pursuant to this agreement, so long as Carlyle/Riverstone beneficially owns at least 30%, 20% or 10% of our issued and outstanding shares of our common stock, we have agreed to take all corporate action within our power to cause the board of directors at all times to include at least three, two or one member(s), respectively, designated by Carlyle/Riverstone. As discussed below, Carlyle/Riverstone may have interests that differ from your interests. With two or three directors, Carlyle/Riverstone may be able to effect corporate policy that may not be in your best interests.
Two of our directors may have conflicts of interest because they are affiliated with Carlyle/Riverstone.
Two of our directors, John Lancaster and Pierre Lapeyre, are also current directors or officers of Carlyle/Riverstone and its owners. Carlyle/Riverstone also has the right to nominate a third representative to our board of directors. This may create conflicts of interest because these directors have responsibilities to Carlyle/Riverstone and its owners. Their duties as directors or officers of Carlyle/Riverstone and its owners may conflict with their duties as directors of our company. These conflicts may result in these directors not participating in certain decisions regarding business dealings between Carlyle/Riverstone and us and other matters.
Carlyle/Riverstone and its director nominees on our board of directors generally have no obligation to offer us business opportunities.
Affiliates of Carlyle/Riverstone have investments in other oilfield service and energy companies that may compete with us, and Carlyle/Riverstone and its affiliates, other than our company, may invest in other such companies in the future. If an opportunity in the oilfield service industry is presented to a person who is a member of Carlyle/Riverstone or its affiliates, including any of those individuals who also serve as a Carlyle/Riverstone director nominee on our board of directors, no member of Carlyle/Riverstone or any of those individuals has any obligation to communicate or offer the opportunity to us.
The availability of shares of our common stock for future sale could depress our stock price.
Carlyle/Riverstone’s exercise of certain registration rights relating to shares of our common stock and sales of a substantial number of shares of our common stock in the public markets following this offering, or the perception that such sales might occur, could have a material adverse effect on the price of our common stock or could impair our ability to obtain capital through an offering of equity securities.
21
Table of Contents
Index to Financial Statements
FORWARD-LOOKING STATEMENTS
This prospectus contains forward-looking statements. We have based these forward-looking statements largely on our current expectations and projections about future events and financial trends affecting the financial condition of our business. These forward-looking statements are subject to a number of risks, uncertainties and assumptions, including, among other things, the risk factors discussed in this prospectus and other factors, most of which are beyond our control.
The words “believe,” “may,” “will,” “estimate,” “continue,” “anticipate,” “intend,” “plan,” “expect” and similar expressions are intended to identify forward-looking statements. All statements other than statements of current or historical fact contained in this prospectus are forward-looking statements.
Although we believe that the forward-looking statements contained in this prospectus are based upon reasonable assumptions, the forward-looking events and circumstances discussed in this prospectus may not occur and actual results could differ materially from those anticipated or implied in the forward-looking statements.
Important factors that may affect our expectations, estimates or projections include:
| • | a decline in or substantial volatility of oil and natural gas prices, and any related changes in expenditures by our customers; |
| • | a decline in oil and natural gas drilling activity in the markets in which we operate; |
| • | the effects of future acquisitions on our business; |
| • | changes in customer requirements in markets or industries we serve; |
| • | competition within our industry; |
| • | general economic and market conditions; |
| • | our access to current or future financing arrangements; |
| • | our ability to replace or add workers at economical rates; |
| • | the effects of severe weather on our operations; |
| • | our ability to replace or acquire equipment; |
| • | political instability in oil and natural gas producing countries; and |
| • | environmental and other governmental regulations. |
Our forward-looking statements speak only as of the date of this prospectus. Unless otherwise required by law, we undertake no obligation to publicly update or revise any forward-looking statements, whether as a result of new information, future events or otherwise. Please see “Risk Factors.”
22
Table of Contents
Index to Financial Statements
We expect to receive net proceeds from this offering of approximately $ million, assuming an initial public offering price of $ per share and after deducting underwriting discounts and commissions and estimated offering expenses. We will not receive any of the net proceeds from any sale of shares of common stock by any selling stockholders. The selling stockholders include members of our senior management. See “Principal and Selling Stockholders.”
We plan to use our net proceeds from this offering as follows:
| • | $ million to repay indebtedness under our credit facility; and |
| • | the remainder for general corporate purposes, including potential future acquisitions and capital expenditures in connection with our anticipated growth. |
We will use any net proceeds from the exercise of the underwriters’ option to purchase additional shares of common stock for general corporate purposes.
Our credit facility consists of a $125 million revolver. As of March 31, 2007, we had nothing outstanding under our revolving credit facility and $0.9 million outstanding letters of credit, leaving $124.1 million available for additional borrowing under our credit facility. Interest under our credit facility as of March 31, 2007 is the London Interbank Offered Rate (“LIBOR”) plus 2.00%. We used the borrowings under the term loans of our credit facility primarily to fund our acquisitions and pay down previously existing debt during the last year. An affiliate of UBS Securities LLC serves as administrative and collateral agent and affiliates of some of our underwriters are lenders under our credit facility. Accordingly, they will receive some of the proceeds of the offering. See “Underwriting.”
Please read “Management’s Discussion and Analysis of Financial Condition and Results of Operations—Liquidity and Capital Resources—2006 Credit Facility” for a description of our outstanding indebtedness and our credit facility.
A $1.00 increase (decrease) in the assumed initial public offering price of $ per share would increase (decrease) the net proceeds from this offering by approximately $ , assuming no change in the number of shares offered by us as set forth on the cover page of this prospectus and after deducting the estimated underwriting discounts and commissions and estimated offering expenses payable by us.
We have not declared or paid any dividends on our common stock, and we do not currently anticipate paying any dividends on our common stock in the foreseeable future. We currently intend to retain all future earnings to fund the development and growth of our business. Any future determination relating to our dividend policy will be at the discretion of our board of directors and will depend on our results of operations, financial condition, capital requirements and other factors deemed relevant. We are also restricted in our ability to pay dividends under our credit facility and indenture.
23
Table of Contents
Index to Financial Statements
We have provided in the table below our capitalization as of December 31, 2006: (1) on an actual basis; (2) as adjusted to give effect to the offering of the Senior Notes and (3) as further adjusted to give effect to this offering, the application of the estimated net proceeds therefrom and the Restructuring, as if each of the following had occurred on December 31, 2006:
The information was derived from and is qualified by reference to our unaudited historical financial statements included elsewhere in this prospectus. You should read this information in conjunction with these financial statements, “Management’s Discussion and Analysis of Financial Condition and Results of Operations,” “Use of Proceeds” and “Unaudited Pro Forma Consolidated Financial Data.”
| December 31, 2006 | |||||||||
| Actual | As adjusted for the Senior Notes | As further adjusted for this offering | |||||||
| (unaudited) | |||||||||
| (in thousands) | |||||||||
Cash and cash equivalents(1) | $ | 4,100 | $ | 42,560 | $ | ||||
Total long-term debt, including current portion: | |||||||||
Borrowings under our credit facility(2) | $ | 253,040 | $ | — | $ | ||||
9.75% Senior Notes | 300,000 | ||||||||
Other debt and obligations under capital leases | 4,499 | 4,499 | |||||||
Total | 257,539 | 304,499 | |||||||
Partners’ capital/Stockholders’ equity: | |||||||||
Partnership Interests | 153,534 | 153,534 | — | ||||||
Common stock, $.01 par value per share; shares authorized as further adjusted; shares issued and outstanding as further adjusted | |||||||||
Retained earnings | — | — | |||||||
Total Partners’ capital/Stockholders’ equity(1) | 153,534 | 153,534 | |||||||
Total capitalization(1) | $ | 411,073 | $ | 458,033 | $ | ||||
| (1) | A $1.00 increase (decrease) in the assumed initial public offering price of $ per share would increase (decrease) each of cash and cash equivalents, additional paid-in capital, total stockholders’ equity and total capitalization by $ , assuming no change in the number of shares offered by us as set forth on the cover page of this prospectus and after deducting the estimated underwriting discounts and commissions and estimated offering expenses payable by us. |
| (2) | As of December 31, 2006, we had $253 million outstanding under our term loan and revolving credit facility and no outstanding letters of credit, resulting in approximately $25.5 million available for additional borrowing under our credit facility. As of December 31, 2006, our cash and cash equivalents totaled approximately $4.1 million. |
24
Table of Contents
Index to Financial Statements
Purchasers of the common stock in this offering will experience immediate and substantial dilution in the net tangible book value per share of the common stock for accounting purposes. Adjusted net tangible book value per share represents the amount of the total tangible assets less our total liabilities, divided by the number of shares of common stock outstanding. At December 31, 2006, assuming completion of the Restructuring, we had a net tangible book value of $ million or $ per share of common stock. After giving effect to the sale of shares of common stock in this offering at an assumed initial public offering price of $ per share and after the deduction of underwriting discounts and commissions and estimated offering expenses, the as adjusted net tangible book value at December 31, 2006 would have been $ million or $ per share. This represents an immediate increase in such net tangible book value of $ per share to existing stockholders and an immediate and substantial dilution of $ per share to new investors purchasing common stock in this offering. The following table illustrates this per share dilution:
Assumed initial public offering price per share | $ | |||||
Adjusted net tangible book value per share as of December 31, 2006(1) | $ | |||||
Increase attributable to new public investors | ||||||
As adjusted net tangible book value per share after this offering | ||||||
Dilution in as adjusted net tangible book value per share to new investors | $ | |||||
| (1) | Assuming completion of the Restructuring as of such date. |
A $1.00 increase (decrease) in the assumed initial public offering price of $ per share would increase (decrease) our net tangible book value by $ million, the net tangible book value per share, after giving effect to this offering, by $ per share and the dilution in net tangible book value per share to new investors in this offering by $ per share, assuming no change in the number of shares offered by us as set forth on the cover page of this prospectus, and after deducting the estimated underwriting discounts and commissions and estimated offering expenses payable by us.
The following table summarizes, on the as adjusted basis set forth above as of December 31, 2006, the total number of shares of common stock owned by existing stockholders and to be owned by new investors, the total consideration paid, and the average price per share paid by our existing stockholders and to be paid by new investors in this offering at $ , the mid-point of the range of the initial public offering prices set forth on the cover page of this prospectus, calculated before deduction of estimated underwriting discounts and commissions.
| Shares Purchased(1) | Total Consideration | Average Price Per Share | |||||||||||
| Number | % | Amount | % | ||||||||||
Existing stockholders(2) | |||||||||||||
New public investors | |||||||||||||
Total | 100.0 | % | $ | 100.0 | % | ||||||||
| (1) | The number of shares disclosed for the existing stockholders includes shares being sold by the selling stockholders in this offering. The number of shares disclosed for the new investors does not include the shares being purchased by the new investors from the selling stockholders in this offering. |
| (2) | With respect to our executive officers, directors and greater-than-10% stockholders, and assuming the exercise of all outstanding warrants and stock options, the number of shares of common stock purchased from us, the total consideration paid to us, and the average price per share paid by all of those affiliated persons, are as follows: |
| Shares Purchased(1) | Total Consideration | Average Price Per Share | ||||||||
| Number | % | Amount | % | |||||||
Affiliated persons | ||||||||||
25
Table of Contents
Index to Financial Statements
As of , 2007, there were shares of our common stock outstanding, held by stockholders. Sales by the selling stockholders in this offering will reduce the number of shares of common stock held by existing stockholders to or approximately % of the total number of shares of common stock outstanding after this offering and will increase the number of shares of common stock held by new investors to or approximately % of the total number of shares of common stock outstanding after this offering.
26
Table of Contents
Index to Financial Statements
UNAUDITED PRO FORMA CONSOLIDATED FINANCIAL DATA
The following pro forma consolidated financial data are based on our historical financial statements included elsewhere in this prospectus.
The unaudited pro forma consolidated statement of operations for the fiscal year ended December 31, 2006 gives effect to the acquisitions of the BLR Construction Companies, L.L.C. (“BLR”) and Abbeville Offshore Quarters, Inc. (“AOQ”), as if each of those acquisitions had occurred on January 1, 2006.
On March 1, 2006, we acquired 100% of the membership interest of BLR for approximately $48.5 million in total consideration, consisting of $46.5 million in cash and $2.0 million in notes payable to the sellers. BLR is a full-service contractor serving the oil, gas and petro-chemical industry since 1990.
On August 1, 2006, we purchased all of the outstanding capital stock of AOQ. AOQ provides workforce accommodations, sewage treatment units, water tanks, generators and other rental support equipment for use in the offshore Gulf Coast oil and natural gas industry. The purchase price consisted of $46.1 million in cash ($1.5 million of which is held in escrow) and 6,943,000 Class C units representing limited partnership interests of Stallion Holdings for a total consideration of $70.2 million.
On January 1, 2006, we acquired certain of the assets of Trail Blazer Hot Shot, Inc. (“TB”) for total consideration of approximately $14.6 million, which consisted of approximately $13.7 million in cash and a $900,000 note payable to the sellers. TB provides surface equipment rental services for major Oklahoma basins and surrounding areas. The results of operations for TB, are included in the Stallion historical statement of operations for the full year ended December 31, 2006.
The following table summarizes the estimated fair value of the assets acquired and liabilities assumed at the dates of acquisition of TB, BLR and AOQ (in thousands):
| TB | BLR | AOQ | Total | |||||||||
Assets Acquired: | ||||||||||||
Cash | $ | — | $ | 328 | $ | 1,128 | $ | 1,456 | ||||
Accounts receivable, net | — | 15,833 | 11,069 | 26,902 | ||||||||
Other current assets | — | 891 | 616 | 1,507 | ||||||||
Deferred tax assets | — | 164 | — | 164 | ||||||||
Property and equipment | 5,208 | 14,205 | 21,500 | 40,913 | ||||||||
Goodwill and other intangibles | 9,427 | 23,873 | 43,839 | 77,139 | ||||||||
Total assets acquired | 14,635 | 55,294 | 78,152 | 148,081 | ||||||||
Liabilities assumed: | ||||||||||||
Accounts payable | — | 3,776 | 1,769 | 5,545 | ||||||||
Accrued expenses | — | 945 | 911 | 1,856 | ||||||||
Deferred tax liability | — | 2,120 | 5,274 | 7,394 | ||||||||
Total liabilities assumed | — | 6,841 | 7,954 | 14,795 | ||||||||
Net assets acquired | $ | 14,635 | $ | 48,453 | $ | 70,198 | $ | 133,286 | ||||
The unaudited pro forma consolidated statement of operations data presented below do not reflect the impact of acquisitions that we determined were not individually significant under SEC Regulation S-X, 1-02 and 3-05.
The Stallion historical statement of operations for the year ended December 31, 2006 is derived from our audited consolidated financial statements. The Stallion historical statement of operations information includes results of operations of all acquired businesses from their dates of acquisition through December 31, 2006. The historical combined statement of operations of acquired businesses column represents a combined statement of operations of the businesses acquired from January 1, 2006 through the dates on which we began consolidating the financial results of such businesses.
The unaudited pro forma consolidated statement of operations data represent management’s preliminary determination of purchase accounting adjustments and are based on available information and assumptions that
27
Table of Contents
Index to Financial Statements
management considers reasonable under the circumstances. The unaudited pro forma consolidated statement of operations data do not purport to represent what our results would have been had the acquisitions described above been completed on the indicated dates or that may be obtained in the future.
The following information should be read in conjunction with “Capitalization,” “Management’s Discussion and Analysis of Financial Condition and Results of Operations,” and our financial statements included elsewhere in this prospectus.
Unaudited Pro Forma Consolidated Financial Data for the year ended December 31, 2006 | ||||||||||||||||
| Stallion historical statement of operations | Historical combined statement of operations of acquired businesses(1) | Adjustments | Pro forma | |||||||||||||
| (in thousands) | ||||||||||||||||
Statement of Operations: | ||||||||||||||||
Revenue: | ||||||||||||||||
Wellsite support services | $ | 162,661 | $ | 17,082 | $ | — | $ | 179,743 | ||||||||
Construction and logistic services | 77,749 | 9,683 | — | 87,432 | ||||||||||||
Total revenue | 240,410 | 26,765 | — | 267,175 | ||||||||||||
Expenses: | ||||||||||||||||
Wellsite support services | 74,200 | 6,792 | — | 80,992 | ||||||||||||
Construction and logistic services | 42,319 | 5,473 | — | 47,792 | ||||||||||||
Selling, general and administrative | 43,359 | 4,873 | — | 48,232 | ||||||||||||
Depreciation and amortization | 30,068 | 2,323 | 3,304 | (2) | 35,695 | |||||||||||
Loss on disposal of assets | 920 | 1,110 | (1,243 | )(3) | 787 | |||||||||||
Total expenses | 190,866 | 20,571 | 2,061 | 213,498 | ||||||||||||
Operating income | 49,544 | 6,194 | (2,061 | ) | 53,677 | |||||||||||
Interest expense, net | (18,919 | ) | (400 | ) | (2,868 | )(4) | (22,187 | ) | ||||||||
Other income | 71 | 109 | — | 180 | ||||||||||||
Income before income tax | 30,696 | 5,903 | (4,929 | ) | 31,670 | |||||||||||
Income tax expense | (4,927 | ) | — | (7,108 | )(5) | (12,035 | ) | |||||||||
Net income | $ | 25,769 | $ | 5,903 | $ | (12,037 | ) | $ | 19,635 | |||||||
| (1) | Represents historical combined statement of operations data for the BLR and AOQ from January 1, 2006 through the dates on which we began consolidating the financial results of such businesses. The results of operations for TB acquired January 1, 2006, are included in the Stallion historical statement of operations for 2006. |
| (2) | Depreciation and amortization reflects adjusted fixed assets and depreciable intangible assets assuming that the acquisitions occurred January 1, 2006. Asset values were determined based upon third party and internal appraisals. We estimated the remaining useful lives and salvage values of all acquired assets and depreciated those assets over those estimated useful lives using depreciation policies that have been consistently applied by us. Accordingly, we determined that $14.2 million for BLR and $21.5 million for AOQ, respectively, of the purchase price would be assigned to assets having an average eight-year and twelve-year life, respectively, and $12.5 million and $19.2 million, respectively, would be assigned to intangible assets subject to amortization having an average six-year and seven-year life, respectively. |
| (3) | Elimination of loss on transfer of real estate that was not part of the sale to us of BLR. This transaction was not in the ordinary course of business. |
| (4) | Pro forma interest expense, net reflects advances under our existing senior credit agreement totaling $89.5 million at actual rates existing at the acquisition dates ranging from 7.94% to 8.60% plus interest on notes to the sellers of BLR of $2 million at 7.5% assuming that the advances occurred January 1, 2006. |
| (5) | Historically, we were not subject to taxes on a consolidated basis due to our partnership structure; however, certain of our subsidiary companies are taxable corporations and are subject to income tax. Pro forma net income for the year ended December 31, 2006 includes a provision for taxes on our consolidated income before tax that has been computed at a blended state and federal tax rate of 38% to reflect the pro forma income tax effect on net income for the year ended December 31, 2006 assuming that the Restructuring occurred on January 1, 2006. |
28
Table of Contents
Index to Financial Statements
SELECTED CONSOLIDATED FINANCIAL DATA
The following table sets forth our selected historical consolidated financial and operating data as of the dates and for the periods shown. The amounts for each historical annual period presented below were derived from our audited consolidated financial statements. The following information should be read in conjunction with “Capitalization,” “Management’s Discussion and Analysis of Financial Condition and Results of Operations,” “Unaudited Pro Forma Consolidated Financial Data” and our consolidated financial statements and related notes included elsewhere in this prospectus. Stallion Oilfield Holdings, Ltd. was formed in 2002 and commenced operations in 2003. As a result, financial results for 2002 are not presented.
| Year Ended December 31, | ||||||||||||||||
| 2003 | 2004 | 2005 | 2006 | |||||||||||||
Statement of Operations Data: | ||||||||||||||||
Revenue: | ||||||||||||||||
Wellsite support services | $ | 6,769 | $ | 15,452 | $ | 73,126 | $ | 162,661 | ||||||||
Construction and logistics services | — | — | — | 77,749 | ||||||||||||
Total revenue | 6,769 | 15,452 | 73,126 | 240,410 | ||||||||||||
Expenses: | ||||||||||||||||
Wellsite support services | 3,108 | 8,695 | 42,281 | 74,200 | ||||||||||||
Construction and logistics services | — | — | — | 42,319 | ||||||||||||
Selling, general and administrative | 2,145 | 3,745 | 9,883 | 43,359 | ||||||||||||
Depreciation and amortization | 836 | 1,924 | 7,798 | 30,068 | ||||||||||||
Loss on disposal of assets | 86 | 92 | 499 | 920 | ||||||||||||
Total expenses | 6,175 | 14,456 | 60,461 | 190,866 | ||||||||||||
Operating income | 594 | 996 | 12,665 | 49,544 | ||||||||||||
Interest expense, net | (489 | ) | (917 | ) | (4,565 | ) | (18,919 | ) | ||||||||
Other income (expense) | — | — | (66 | ) | 71 | |||||||||||
Income before income taxes | 105 | 79 | 8,034 | 30,696 | ||||||||||||
Income tax expense(1) | — | — | (598 | ) | (4,927 | ) | ||||||||||
Net income | $ | 105 | $ | 79 | $ | 7,436 | $ | 25,769 | ||||||||
Other Financial Data: | ||||||||||||||||
EBITDA(2) | $ | 1,430 | $ | 2,920 | $ | 20,397 | $ | 79,683 | ||||||||
Cash flow provided by operating activities | 144 | 1,734 | 7,087 | 41,124 | ||||||||||||
Cash flow used in investing activities | (7,536 | ) | (7,142 | ) | (83,462 | ) | (280,164 | ) | ||||||||
Cash flow provided by financing activities | 7,804 | 5,046 | 77,307 | 242,158 | ||||||||||||
Capital expenditures: | ||||||||||||||||
Acquisitions, net of cash acquired(3) | 5,505 | 1,158 | 47,191 | 178,045 | ||||||||||||
Property and equipment | 2,046 | 5,961 | 35,951 | 92,029 | ||||||||||||
| As of December 31, | ||||||||||||
| 2003 | 2004 | 2005 | 2006 | |||||||||
| (in thousands) | ||||||||||||
Balance Sheet Data | ||||||||||||
Cash and cash equivalents | $ | 412 | $ | 50 | $ | 982 | $ | 4,100 | ||||
Net property and equipment | 7,131 | 13,899 | 74,583 | 220,777 | ||||||||
Total assets | 16,252 | 24,713 | 123,136 | 446,907 | ||||||||
Total debt | 11,705 | 18,552 | 67,795 | 257,539 | ||||||||
Total partners’ capital | 3,533 | 3,611 | 43,597 | 153,534 | ||||||||
| (1) | Historically, we were not subject to taxes on a consolidated basis due to our partnership structure; however, certain of our subsidiary companies are taxable corporations and are subject to income tax. |
29
Table of Contents
Index to Financial Statements
| (2) | EBITDA consists of net income before interest expense, taxes, depreciation and amortization. EBITDA is used as a supplemental financial measure by our management and by external users of our financial statements, such as investors and commercial banks, to assess: |
| • | period-to-period comparisons of the financial performance of our assets without regard to financing methods, capital structures, tax status or historical cost basis; |
| • | our operating performance and return on invested capital as compared to those of other companies in the oilfield service industry, without regard to financing methods, tax status and capital structure; and |
| • | our compliance with certain financial covenants included in our credit facility and our ability to incur debt under our indenture, which are based in significant part on EBITDA. |
| EBITDA has limitations as an analytical tool and should not be considered an alternative to net income, operating income, cash flow from operating activities or any other measure of financial performance or liquidity presented in accordance with GAAP. EBITDA excludes some, but not all, items that affect net income and operating income and these measures may vary among other companies. Limitations to using EBITDA as an analytical tool include: |
| • | EBITDA does not reflect our cash expenditures or future requirements for capital expenditures or capital commitments; |
| • | EBITDA does not reflect changes in, or cash requirements necessary to service interest or principal payments, on our debt; |
| • | although depreciation and amortization are non-cash charges, the assets being depreciated and amortized will often have to be replaced in the future, and EBITDA does not reflect any cash requirements for such replacements; and |
| • | other companies in our industry may calculate EBITDA differently than we do, limiting its usefulness as a comparative measure. |
| The following table presents a reconciliation of the non-GAAP financial measure of EBITDA to the most directly comparable GAAP financial measure, net income, on a historical basis for each of the periods indicated. |
| Year ended December 31, | ||||||||||||
| 2003 | 2004 | 2005 | 2006 | |||||||||
Reconciliation of Net income to EBITDA: | ||||||||||||
Net income | $ | 105 | $ | 79 | $ | 7,436 | $ | 25,769 | ||||
Income taxes | — | — | 598 | 4,927 | ||||||||
Interest expense | 489 | 917 | 4,565 | 18,919 | ||||||||
Depreciation and amortization | 836 | 1,924 | 7,798 | 30,068 | ||||||||
EBITDA | $ | 1,430 | $ | 2,920 | $ | 20,397 | $ | 79,683 | ||||
| (3) | Acquisitions, net of cash acquired, consist only of the cash component of acquisitions. It does not include equity and/or notes issued for acquisitions. |
30
Table of Contents
Index to Financial Statements
MANAGEMENT’S DISCUSSION AND ANALYSIS
OF FINANCIAL CONDITION AND RESULTS OF OPERATIONS
The following discussion and analysis should be read in conjunction with our historical consolidated financial statements and the related notes included within this prospectus. This discussion contains forward-looking statements based on our current expectations, assumptions, estimates and projections about our business and the oilfield service industry. These forward-looking statements involve risks and uncertainties that may be beyond our control. Our actual results could differ materially from the results indicated in these forward-looking statements. Factors that could cause or contribute to such differences include, but are not limited to: market prices for oil and natural gas, the level of oil and natural gas drilling, economic and competitive conditions, capital expenditures, regulatory changes and other uncertainties, as well as those factors discussed elsewhere in this prospectus, particularly in “Risk Factors” and “Forward-Looking Statements.” In light of these risks, uncertainties and assumptions, the forward-looking events discussed below may not occur. Except to the extent required by law, we undertake no obligation to update publicly any forward-looking statements, even if new information becomes available or other events occur in the future.
Overview
We provide wellsite support services and construction and logistics services to exploration and production companies and drilling contractors that conduct drilling and production activities throughout the United States. Our company slogan, Everything But The Rig, reflects our business strategy of providing a broad and comprehensive range of critical services to support wellsite operations, including onshore and offshore workforce accommodations, surface equipment rental, solids control, site construction, rig relocation and heavy equipment hauling.
We currently focus on oil and natural gas regions within North America that we believe have attractive long-term potential for growth, including South Texas, the Gulf Coast, ArkLaTex, North Texas, the Permian Basin, the Mid-Continent and Rocky Mountain regions. We also supply offshore workforce accommodations and related equipment for use in the Gulf of Mexico and, to a lesser extent, other international offshore regions. We manage our operations from 38 field service offices located throughout our operating regions.
We operate in two business segments:
| • | Wellsite Support Services. As of December 31, 2006, our wellsite support services segment includes: (1) workforce accommodations, with a fleet of over 2,000 transportable accommodation units designed to accommodate various personnel on wellsite locations before, during and after drilling operations, (2) surface equipment rentals used in wellsite activities, including forklifts, manlifts, power generators, compressors, loaders and water systems, (3) our StaRComm satellite system, and (4) solids control, which includes closed-loop mud systems and fluid recovery services. For the year ended December 31, 2006, revenue relating to our wellsite support services segment was $162.7 million. |
| • | Construction and Logistics Services. Our construction and logistics services segment includes: (1) site construction, which includes site clearing, road construction, mat placement, production facility assembly and construction, pipeline installation, pit remediation, production decommissioning, and site restoration and (2) land rig relocation and heavy equipment hauling, through which we operate a fleet of cranes, tractors, trailers, trucks and loaders used for the hauling and relocation of drilling rigs and related heavy equipment. For the year ended December 31, 2006, revenue relating to our construction and logistics services segment was $77.7 million. |
Our customers include exploration and production companies and drilling contractors that conduct drilling and production activities throughout the United States and offshore in the Gulf of Mexico, and, to a lesser extent, in international offshore regions. Please read “Business—Customers” for additional information about our customers. The primary factor influencing demand for our services is the level of drilling and production activity
31
Table of Contents
Index to Financial Statements
of our customers, which in turn, depends on current and anticipated future oil and natural gas prices, production depletion rates and the resultant levels of cash flow generated and allocated by our customers to their drilling and production budgets. As a result, demand for our services and products can be cyclical.
The following tables summarize average United States and International drilling and well service rig activity, as measured by Baker Hughes Incorporated, a large public oilfield services company (“BHI”), and historical commodity prices as provided by Bloomberg L.P. (“Bloomberg”):
AVERAGE RIG COUNTS
| Year Ended December 31, | ||||||||||
| 2002 | 2003 | 2004 | 2005 | 2006 | ||||||
BHI United States Rotary Rig Count: | ||||||||||
United States Land | 717 | 924 | 1,095 | 1,290 | 1,559 | |||||
United States Offshore | 113 | 108 | 97 | 93 | 90 | |||||
Total United States. | 830 | 1,032 | 1,192 | 1,383 | 1,649 | |||||
BHI United States Workover Rig Count: | ||||||||||
United States | 1,010 | 1,129 | 1,235 | 1,354 | 1,572 | |||||
Total United States Rotary and Workover | 1,840 | 2,161 | 2,427 | 2,737 | 3,221 | |||||
BHI International Rotary Rig Count: | ||||||||||
International Land | 506 | 544 | 594 | 643 | 656 | |||||
International Offshore | 225 | 226 | 242 | 265 | 269 | |||||
Total International | 731 | 770 | 836 | 908 | 925 | |||||
Source: Baker Hughes Incorporated | ||||||||||
AVERAGE OIL AND NATURAL GAS PRICES
Period | Average Daily Closing Henry Hub Spot Natural Gas Prices ($/mcf) | Average Daily Closing WTI Cushing Spot Oil Price ($/bbl) | ||||
01/01/02 – 12/31/02 | $ | 3.37 | $ | 26.17 | ||
01/01/03 – 12/31/03 | 5.49 | 31.06 | ||||
01/01/04 – 12/31/04 | 5.90 | 41.51 | ||||
01/01/05 – 12/31/05 | 8.89 | 56.59 | ||||
01/01/06 – 12/31/06 | 6.73 | 66.09 | ||||
01/01/07 – 03/31/07 | 7.19 | 58.09 | ||||
Source: Bloomberg | ||||||
We believe that U.S. drilling rig and workover rig counts are a good indication of spending by our customers in the oil and natural gas industry for exploration and development of new and existing hydrocarbon reserves. We believe the international drilling rig activity is similarly relevant to our offshore workforce accommodation business. Spending levels for these activities are a primary driver of our business, and we believe that our customers tend to invest more in these activities when oil and natural gas prices are at or trending toward higher levels.
How We Generate Our Revenue
Most of our revenue is based upon a charge for the actual period of time the service or rental is provided to our customer, usually a few days, several weeks or a few months. By contracting services on a short-term basis,
32
Table of Contents
Index to Financial Statements
we are exposed to the risks of a rapid reduction in market prices and equipment utilization and volatility in our revenue.
We generate a majority of our revenue from our wellsite support services and construction and logistics services by charging our customers a rig-up charge plus a daily rental rate based on the type of equipment used. The rig-up charge is a flat fee generally payable in connection with the initial set up of workforce accommodation units and connection of these units to water, utilities and sewer systems. The rig-up charges, demobilization charges and daily rates are determined by regional price quotes or, in some cases, a competitive bid process and depend upon the type of service to be performed, the equipment and personnel required for the particular job and the market conditions in the region in which the service is performed. We also charge customers for additional services requested while our equipment is on location, including water delivery, general service calls, repairs and waste disposal. In our construction services business, we install mats at the wellsite where required by the nature of the terrain or requested to help reduce the environmental impact of wellsite activities. In these instances, we generally submit bids based on a 30, 60 or 90 day mat rental period, with an additional daily rental rate if the mats are used beyond this period. In our rig relocation and heavy equipment hauling business, we generally bid a turn key price which may vary by region, type of rig and the distance the rig is transported.
In addition, we generate revenue from the manufacture, sale, lease and repair of workforce accommodation units through our offshore workforce accommodation business.
Our operating costs are comprised primarily of labor, including workers’ compensation and health insurance, repair and maintenance, fuel and insurance. A majority of our employees are paid on an hourly basis. With a reduced pool of workers in the industry, it is possible that we will have to raise wage rates to attract workers from other fields and retain or expand our current work force. We also incur costs to employ personnel to sell and supervise our services and perform maintenance on our fleet. These costs are not directly tied to our level of business activity. Compensation for our administrative personnel in local operating yards and in our corporate office is accounted for as general and administrative expenses. Repair and maintenance is performed by our crews, company maintenance personnel and outside service providers. Insurance is generally a fixed cost regardless of utilization and relates to the number of trucks and other equipment in our fleet, employee payroll and safety record. Selling, general and administrative (“SG&A”) expenses were $43.4 million for the twelve months ended December 31, 2006. As a percentage of revenue, the portion of labor expenses included in our SG&A expenses was 13.5%, 6.6% and 9.1% in 2004, 2005 and 2006, respectively. Our corporate overhead makes up less than half of our SG&A expenses. A significant component of SG&A are expenses related to our field-level office personnel and other overhead, which are necessary for operations.
How We Evaluate Our Operations
Our management utilizes a variety of financial and operational measurements to analyze and monitor the performance of our services. These measurements include the following:
| • | operating income per operating segment (each segment is further analyzed by field office and/or region for trending and to improve overall segment profitability); |
| • | material and labor expenses as a percentage of revenue; |
| • | EBITDA; |
| • | EBIT; |
| • | revenue and EBITDA per employee; |
| • | return on capital employed; and |
| • | safety performance rates. |
33
Table of Contents
Index to Financial Statements
We manage our operations through two operating segments. Each segment is further analyzed across seven operating regions. Our operating regions include one or more field service offices, depending on the level of activity and the size of the region. The data generated in each of our operating regions using the foregoing measurement tools is an important part of our operational analysis. We apply these measurement tools to monitor operations separately for each of our operating regions and to analyze trends to determine our relative performance in each region. By comparing our operations on an operating region basis, we can identify and react to trends in the geographic areas in which we operate to improve productivity and margins. We seek to have strong centralized financial analysis and control to allocate our resources and local decision-making and flexibility in the delivery of services to maximize customer satisfaction.
Trends Impacting Our Business
In recent years, our industry has experienced higher demand for oil and natural gas and a constrained oil and natural gas supply which factors have resulted in higher commodity prices and increased drilling activity. We believe this trend of increased prices and drilling activity, as well as other industry trends reflected below, benefit us and facilitate implementation of our business strategy:
| • | Labor shortages and increasing safety concerns. Due to the increase in rig count and the corresponding increase in demand for labor in the oilfield and offshore, our customers continue to attempt to improve living and working conditions at the wellsite to help retain employees. We believe our workforce accommodations solutions and custom configurations for crew quarters have generally improved living and working conditions at the wellsite resulting in better employee morale and reduced turnover. Our customers also continue to enhance their safety procedures to help reduce injuries and to help ensure compliance with more stringent regulatory requirements. We supply equipment designed to improve onshore wellsite safety and productivity. For example, our extended-reach forklifts eliminate the need to manually roll drill pipe across pipe racks reducing hazards such as pinched fingers or falls. Our manlifts are used to safely place crew members under the rig floor during rig-up and rig-down of wellhead pressure control equipment. Also, our light plants provide safe lighting conditions for night time operations at the wellsite. In addition, offshore workforce accommodations are increasingly required to meet safety standards of the United States Coast Guard and/or the international safety standards of SOLAS. |
| • | Increasingly complex technologies. The development of unconventional oil and natural gas resources is driving the need for complex, new technologies to help increase recovery rates, lower production costs and accelerate field development both onshore and offshore. The increasing complexity of technology used in the oil and natural gas development process requires additional technicians on location during drilling and, therefore, additional workforce accommodations. In particular, the increasing trend of pursuing horizontal and directional wells, as indicated in the chart below, as opposed to vertical wells requires additional expertise on location and, typically, longer drilling times. In some cases, up to six to nine workforce accommodation units are used during a drilling project, an increase over traditional utilization levels. Workforce accommodations are required for the company-man (oil and natural gas operator representative), the rig tool pusher (drilling rig supervisor), the rig crew (which typically includes 12-14 persons), a directional driller, a mud engineer, a safety engineer, solids control service personnel (between one and five persons), and other company and service personnel as necessary. |
34
Table of Contents
Index to Financial Statements
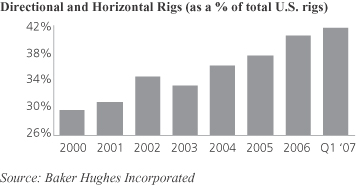
| • | Geographically dispersed drilling operations. Before the consolidation of land-based drilling contractors that began in earnest in the 1990’s, most drilling contractors were regional operators serving an area within a radius of approximately 100 to 200 miles from their home office. Most personnel working at the wellsite would drive to and from the wellsite on a daily basis. With the shift toward industry consolidation, land crews based in one region may now be sent along with a rig to work on wellsites in geographically dispersed oil and natural gas regions significant distances away. This development has resulted in the need for full-time accommodations for multiple shifts of the rig crew. Additionally, the increasing pursuit of unconventional resources has resulted in increasingly remote drilling locations that do not have adequate infrastructure. These remote locations require accommodation units and other equipment and services of the type provided by us. |
| • | Increase in drilling and developing unconventional resources. The decline of conventional North American oil and natural gas reservoirs is leading to a shift toward the drilling and development of onshore unconventional oil and natural gas resources, including tight sands, shales and coalbed methane, that require more wells to be drilled and maintained and are also characterized by high decline rates. We believe the increased drilling requirements of these unconventional resources will lead to continued drilling activity. Consequently, there has been an increase in the construction of new drilling rigs to meet this demand. |
| • | Increased environmental sensitivity. Continued sensitivity to the environmental impact of drilling and production activities has resulted in increasing regulation of the oil and natural gas industry. Normal onshore wellsite operations use an earthen pit to temporarily store drilling fluids and cuttings. When drilling in environmentally sensitive areas such as marshes or when drilling with oil-based or other synthetic drilling fluids, however, wellsite operations must use closed-loop solids control systems, which require zero discharge of drilling fluids and cuttings at the wellsite. In order to help reduce drill cuttings and fluids disposal costs, operators require customized solids control configurations that attempt to maximize drilling fluid efficiency. Additionally, in some areas of the Rocky Mountains, federal regulators have mandated a reduction of long-term environmental impacts at drilling locations. In some cases, this has required the use of mats in place of traditional scraping by earth moving equipment to preserve prairie sage brush recoverability after wellsite operations cease. We believe that continued sensitivity to the environmental impact of wellsite operations will enhance the demand for our solids control and construction services. |
| • | Outsourcing ancillary services. Some of the services we provide have been historically handled by drilling contractors themselves. In many instances, these services are only ancillary to the primary activity of drilling and completing wells and represent only a minor portion of the total well drilling cost. Many drilling contractors are increasingly electing to outsource these services to suppliers who can provide high-quality and reliable services. |
| • | Increased deepwater development activity. Advances in subsea exploration and production technology allow oil and natural gas companies to pursue reserves that have historically been considered too remote |
35
Table of Contents
Index to Financial Statements
or uneconomical to exploit, particularly in deepwater regions. In addition to the growth in offshore drilling activity, these advanced technologies require a greater number of technicians during drilling, production and construction activity. We believe these technological advances are leading to significant growth in offshore drilling and production engineering projects. These advances have resulted in the need for significantly greater offshore workforce accommodations. |
Growth Opportunities
We intend to capitalize on emerging trends in the United States oil and natural gas industry through the execution of a growth strategy focused on internal growth opportunities complemented by strategic acquisitions. We also intend to analyze expansion opportunities in international markets.
| • | Internal Growth Opportunities. We plan to continue to roll-out our existing services across our current operating regions in an effort to deliver a comprehensive service portfolio in each region where we operate. Additionally, we seek to continue to invest in the development of new assets and services based on customer demand to supplement the breadth and quality of our service portfolio. We also intend to continue expanding our operations into new domestic geographic regions to provide our service offerings to existing customers in markets that we have not historically served, as well as to attract new customers in these markets. We believe our established customer base and strong regional relationships will continue to provide a distribution network for deployment of our services. |
| • | Acquisitions. We believe that our segment of the oilfield service industry has historically experienced underinvestment. Consequently, most of our competitors are smaller operators offering a limited set of wellsite support services. As a result of the fragmented nature of our markets, we believe that there are numerous consolidation opportunities within these markets. We intend to continue to leverage our proven capabilities of identifying, executing on and integrating acquisitions to further differentiate our service portfolio and grow our business. |
| • | International Expansion. We recently established a subsidiary in The Netherlands, which will provide a base for us to capitalize on strategic growth opportunities in international offshore markets. |
36
Table of Contents
Index to Financial Statements
Strategic Acquisitions
From inception through February 2007, we have completed 24 acquisitions as part of our acquisition and expansion program as reflected in the table below:
Entity | Acquisition Date | Service Sector | Location | |||
Aero Oilfield Services, Inc. | 12/02 | workforce accommodations | South Texas | |||
Ray’s Mobile Homes, Ltd | 4/03 | workforce accommodations | South Texas | |||
Gator Services, Inc. | 10/03 | workforce accommodations | Ark La Tex | |||
Rebel Testers, Inc. | 2/04 | workforce accommodations | (assets relocated) | |||
Trinity Valley Rental, Inc. | 1/05 | surface equipment rentals | East Texas | |||
Envirotech, Inc. | 1/05 | workforce accommodations | Wyoming | |||
Double-D Enterprises, Inc. | 1/05 | surface equipment rentals | Wyoming | |||
Separation Services, Inc. | 1/05 | solids control | Gulf Coast | |||
Bob’s Equipment Rental, Inc. | 6/05 | workforce accommodations | Wyoming | |||
GL Trucking & Rental, Inc. | 9/05 | workforce accommodations | North Dakota | |||
Trail Blazer Hot Shot, Inc. | 1/06 | surface equipment rentals | Mid-Continent | |||
Pioneer RSC, LP | 2/06 | solids control | Gulf Coast | |||
BLR Construction Companies, L.L.C. | 3/06 | wellsite construction | Gulf Coast | |||
Rental One, LLC | 3/06 | surface equipment rentals | Gulf Coast | |||
Oilfield Heavy Haulers, LLC | 3/06 | rig logistics/trucking | Gulf Coast | |||
R&G Crane & Rigging & Trucking, LLC | 3/06 | rig logistics/trucking | East Texas | |||
Bowie Dozer Service, Inc. | 5/06 | wellsite construction | Fort Worth Basin | |||
Abbeville Offshore Quarters, Inc. | 8/06 | offshore workforce accommodations | Gulf Coast/ International | |||
G&N Rentals | 9/06 | surface equipment rentals | North Dakota | |||
Erlandson Construction Company | 11/06 | wellsite construction | Fort Worth Basin | |||
Norton Transport, Inc. | 12/06 | rig logistics/trucking | East Texas/Fort Worth Basin | |||
Suttee Enterprises | 2/07 | surface equipment rentals | Oklahoma | |||
La Mission Rentals | 2/07 | workforce accommodations | West Texas | |||
The Waterline Company, LLC | 3/07 | wellsite construction | Fort Worth Basin |
These acquisitions greatly expanded our service offerings and our geographic reach. We intend to continue to develop or acquire new high-quality, strategic assets and services which add to the scope and quality of our service portfolio. Since our inception through March 31, 2007, we have invested an aggregate of approximately $292 million in acquisitions.
We evaluate our acquisitions based on a number of factors including: market region, service line, asset quality, customers, management, service and safety quality and financial performance. We base our valuations on several factors including: revenue multiples, EBITDA multiples, asset value, earnings accretion and strategic value.
The following is a description of some of the strategic acquisitions that expanded our service offerings and geographic reach:
Expansion of Service Offerings
Workforce Accommodations and Surface Equipment Rental. In April 2003, we acquired the assets of Ray’s Mobile Homes, Ltd. (“Ray’s Mobile Homes”). Ray’s Mobile Homes was engaged in the business of providing workforce accommodations, sewer and water systems, trash containers and other related equipment to wellsites in South Texas. With this acquisition, we entered the workforce accommodations and surface equipment rental business.
37
Table of Contents
Index to Financial Statements
Solids Control. In January 2005, we acquired Separation Services, Inc. (“SSI”), a Texas company engaged in customized solids control services to oil and natural gas companies and drilling contractors at wellsite locations. With this acquisition, we entered into the solids control business.
Site Construction. In March 2006, we acquired BLR. BLR provides customers with experienced personnel and high-quality equipment, specializing in location construction, pipeline construction, marine services, production facility construction, crew services, heavy equipment and trucking services, remediation services, production decommissioning and vegetation control. BLR also provides inland marine site construction services. With this acquisition, we moved into the wellsite construction business.
Logistics. In March 2006, we acquired the assets of Oilfield Heavy Haulers (“OHH”). OHH provides heavy-duty drilling rig trucking and hauling services to the oilfield. OHH’s assets included a fleet of cranes, rig-hauling trucks, trailers and loaders specifically designed for the oil and natural gas industry. With this acquisition, we entered the rig relocation and heavy equipment hauling business.
Expansion of Geographic Reach
Rocky Mountains Expansion. In January 2005, we acquired the assets of Envirotech, Inc. (“Envirotech”), a company engaged in the rental of workforce accommodations, water systems, sewer systems and other related equipment. This acquisition provided a platform for expansion into the Rocky Mountain region, which is a region currently experiencing high levels of drilling activity.
Williston Basin Expansion. In September 2005, we acquired the assets of GL Trucking & Rental, Inc. (“GL Trucking”). GL Trucking provides integrated drilling support services for the Williston Basin, which is located in parts of North and South Dakota, Montana and Canada and surrounding areas. Its assets included over 100 workforce accommodation units, significant heavy equipment hauling capacity, loaders and equipment setting cranes. This acquisition extended our geographic footprint in the Rocky Mountains and brought our services to the Williston Basin.
North Texas Expansion. In May 2006, we acquired the assets of Bowie Dozer Service, Inc. (“Bowie”). Bowie is an oilfield construction company that provides location construction and heavy equipment services for rig sites in the Fort Worth Basin. The purchased assets included dozers, loaders, graders, backhoes, trackhoes and rollers. This acquisition provided a platform for us to expand into North Texas, an active natural gas producing area.
Gulf of Mexico. In August 2006, we acquired all of the outstanding capital stock of AOQ. AOQ provides offshore workforce accommodations, sewage treatment units, water systems, and other rental support equipment for use in the Gulf of Mexico oil and natural gas industry and, to a lesser extent, other international offshore regions.
Items Impacting Comparability of Our Financial Results
Our historical results of operations for the periods presented may not be comparable to our results of operations in the future for the reasons discussed below.
Changes in Our Legal Structure
We were formed as a Delaware corporation in June 2006. Our operations have historically been conducted by Stallion Oilfield Holdings, Ltd., a Texas limited partnership, and its operating subsidiaries. Pursuant to an agreement and plan of merger, Stallion Oilfield Holdings, Ltd. will be merged with and into Stallion Oilfield Services, Inc. immediately prior to the closing of this offering with Stallion Oilfield Services, Inc. as the surviving parent company. Since the entities are under common ownership and control, the Restructuring will be accounted for at historical cost. Following this offering, we will report our results of operations and financial
38
Table of Contents
Index to Financial Statements
condition as a corporation on a consolidated basis. For more information about the restructuring, please see “Certain Relationships and Related Party Transactions—The Restructuring.”
Historically, we were not subject to federal or state income taxes on a consolidated basis due to our partnership structure; however, certain of our subsidiary companies are taxable corporations and are subject to income tax. Our combined financial statements included in this prospectus include a pro forma adjustment for income taxes calculated at the statutory rate resulting in a pro forma net income adjusted for income taxes. In 2005 and 2006, Stallion Oilfield Holdings, Ltd. made a capital distribution to its partners to fund tax obligations resulting from the partners being taxed on their proportionate share of Stallion Oilfield Holdings, Ltd.’s taxable income. As a result of the Restructuring, we will record deferred tax assets and liabilities to reflect net tax effects of temporary differences between the carrying amounts of assets and liabilities for financial and tax reporting purposes. As of December 31, 2006, we estimate that our noncurrent net deferred tax liability would have been approximately $10.2 million, resulting primarily from accelerated depreciation taken by Stallion Oilfield Holdings, Ltd. and its subsidiaries. Following this offering, we will incur income taxes under our new corporate structure and our consolidated financial statements will reflect the actual impact of income taxes.
Public Company Expenses
We believe that our selling, general and administrative expenses will increase as a result of becoming a public company following this offering. We currently anticipate that our total annual selling, general and administrative expenses following the completion of this offering will increase by approximately $3.0 million to $5.0 million. This increase will be due to the cost of tax return preparations, accounting support services, filing annual and quarterly reports with the SEC, investor relations, directors’ fees, directors’ and officers’ insurance and registrar and transfer agent fees, which we expect to incur after the completion of this offering. Our consolidated financial statements following this offering will reflect the impact of these increased expenses and will affect the comparability of our financial statements with periods prior to the completion of this offering.
Acquisitions
Since our inception through March 31, 2007, we have completed 24 acquisitions as part of our acquisition and expansion program. Following this offering, we intend to continue pursuing strategic acquisitions. Our consolidated financial statements included elsewhere in this prospectus do not reflect the results of operations of businesses we acquired or will acquire following the date of the financial statements.
Critical Accounting Policies and Estimates
Our consolidated financial statements are impacted by the accounting policies used and the estimates and assumptions made by management during their preparation. A complete summary of these policies is included in Note 1 of the notes to our historical consolidated financial statements. The following is a discussion of our critical accounting policies and estimates.
Critical Accounting Policies
We have identified below accounting policies that are of particular importance in the presentation of our financial position, results of operations and cash flow and which require the application of significant judgment by management.
Property and Equipment. Property and equipment, including renewals and betterments, are stated at cost, while maintenance and repairs are expensed as incurred. We review our assets for impairment when events or changes in circumstances indicate that the carrying amount of a long-lived asset may not be recovered over its remaining service life. Provisions for asset impairment are charged to income when the sum of the estimated future cash flow, on an undiscounted basis, is less than the assets’ carrying amount. If impairment is indicated, an impairment charge is recorded based on an estimate of future discounted cash flow.
39
Table of Contents
Index to Financial Statements
Self-Insured Risk Accruals. One of our subsidiary companies is partially self-insured for certain losses relating to workers’ compensation and general liability insurance claims. We maintain accruals to cover the self-insured risks, which are based on third-party data and historical claims history.
Revenue Recognition. Generally, we provide our services over a relatively short period of time pursuant to short-term arrangements at pre-determined service rates or on a project bid basis. Revenue from rental agreements is recognized over the rental period, and revenue from service agreements is recognized when services have been rendered. Certain of our operations recognize revenue related to wellsite construction using the percentage-of-completion method determined by the ratio of costs incurred to total estimated costs at completion. All known or anticipated losses on contracts are recognized in full when such losses become apparent. Our percentage-of-completion contracts typically range from two to six months in duration.
In our wellsite support services segment we charge our customers a rig-up/rig-down charge in connection with the initial set up or takedown of workforce accommodation units and for the connection or disconnection of these units to or from water, power and sewer systems. Revenue related to rig-up/rig-down charges is recognized upon completion of the service. We recognize revenue when it is earned and realized. We consider revenue earned and realized when the services are performed, collection of the relevant receivables is reasonably assured, persuasive evidence of the arrangement exists and the price is fixed and determinable.
Income Taxes. We account for income taxes based upon Statement of Financial Accounting Standards (“SFAS”) No. 109, “Accounting for Income Taxes”. Under SFAS No. 109, deferred tax assets and liabilities are recognized for the future tax consequences attributable to differences between the financial statement carrying amounts of existing assets and liabilities and their respective tax bases. Deferred tax assets and liabilities are measured using statutory tax rates expected to apply to taxable income in years in which those temporary differences are expected to be recovered or settled. The effect on deferred tax assets and liabilities of a change in tax rate is recognized in the period that includes the statutory enactment date. A valuation allowance for deferred tax assets is recognized when it is more likely than not that the benefit of deferred tax assets will not be realized.
Historically, we were not subject to federal or state income taxes on a consolidated basis due to our partnership structure; however, certain of our subsidiary companies are taxable corporations and are subject to income tax. Our income tax expense will be comprised of current and deferred tax expense. These taxes added together provide an indication of an effective rate of income tax.
Critical Accounting Estimates
The preparation of our financial statements in conformity with GAAP requires management to make certain estimates and assumptions. These estimates and assumptions affect the reported amounts of assets and liabilities, the disclosure of contingent assets and liabilities at the balance sheet dates and the amounts of revenue and expenses recognized during the reporting periods. We analyze our estimates based on historical experience and various other assumptions that we believe to be reasonable under the circumstances. However, actual results could differ from such estimates. The following is a discussion of our critical accounting estimates.
Impairment of Long-Lived Assets and Goodwill. Our review for potential impairment of property and equipment requires us to estimate undiscounted future cash flow. Actual impairment charges are recorded using an estimate of discounted future cash flow. The determination of future cash flow requires us to estimate rates and utilization in future periods and such estimates can change based on market conditions, technological advances in industry or changes in regulations governing the industry. In accordance with SFAS No. 144, “Accounting for the Impairment or Disposal of Long-Lived Assets,” long-lived assets, such as property and equipment, are reviewed for impairment whenever events or changes in circumstances indicate that the carrying amount of an asset may not be recoverable. Recoverability of assets to be held and used in operations is measured by a comparison of the carrying amount of an asset to estimated undiscounted cash flow expected to be generated by the asset. If the carrying amount of an asset exceeds its estimated future cash flow, an impairment
40
Table of Contents
Index to Financial Statements
charge is recognized in the amount by which the carrying amount of the asset exceeds the fair value of the asset. Assets to be disposed of would be separately presented in the balance sheet and reported at the lower of carrying amount or the fair value less anticipated cost to sell, and they would no longer be depreciated.
We have adopted SFAS No. 142, “Goodwill and Other Intangible Assets,” which requires us to annually test goodwill and intangible assets with indefinite useful lives recorded in business combinations for potential impairment. This requires us to estimate the fair values of our own assets and liabilities at the reporting unit level. Therefore, considerable judgment, similar to that described above in connection with our estimation of the fair value of an acquired company, is required to assess goodwill and certain other intangible assets for impairment.
Goodwill and Other Intangible Assets. The initial recording of goodwill and other intangibles requires estimation of the fair value of assets and liabilities using fair value measurements, which include quoted market price, present value techniques (estimate of future cash flows), and other valuation techniques. Additionally, SFAS No. 142 requires goodwill and other intangible assets to be reviewed for possible impairment on an annual basis, or if circumstances indicate that an impairment may exist. Determining fair value and implied fair value is subjective and often involves the use of estimates and assumptions. These estimates and assumptions could have a significant impact on the recording of intangible assets, whether or not an impairment charge is recognized and also the magnitude of the impairment charge. Our estimates of fair value are primarily determined using present value techniques of projected cash flows. This approach uses significant assumptions such as multi-year sales projections with associated expenses. We have performed impairment analyses on our goodwill and intangible assets of indefinite life, which indicated as of December 31, 2006 an impairment charge was not appropriate.
Allowance for Doubtful Accounts. We extend credit to our customers based on an evaluation of their financial condition, and generally, we do not require collateral nor do we charge interest on our accounts receivable. We estimate our allowance for doubtful accounts based on an analysis of historical collection activity and specific identification of overdue accounts. Factors that may affect this estimate include (1) changes in the financial position of significant customers and (2) a decline in commodity prices that could affect our entire customer base. If these factors are less favorable than those projected by management or if our historical experience is materially different from our future experience, additional allowances may be required.
Litigation and Other Risk Reserves. We estimate required reserves related to litigation and insurance deductibles based on the facts and circumstances specific to the litigation and insurance claims and our past experience with similar claims. The actual outcome of litigated and insured claims could differ significantly from estimated amounts. Any such accruals are based on certain assumptions developed using third-party and historical data to project future losses. Loss estimates in the calculation of these accruals are adjusted based upon actual settlements.
Depreciation and Amortization. In order to depreciate and amortize our property and equipment and our intangible assets with finite lives, we estimate the useful lives and salvage values of these items. Our estimates may be affected by such factors as changing market conditions, technological advances in industry or changes in regulations governing the industry.
Fair Value of Assets Acquired and Liabilities Assumed. We estimate the value of assets acquired and liabilities assumed in business combinations, which involves the use of various assumptions. These estimates may be affected by such factors as changing market conditions, technological advances in the oil and natural gas industry or changes in regulations governing that industry. The most significant assumptions, and the ones requiring the most judgment, involve the estimated fair value of property and equipment, and the resulting amount of goodwill, if any. To finalize purchase accounting, for significant acquisitions we utilize the services of independent valuation specialists to assist in the determination of the fair value of acquired assets. These estimates are revised during an allocation period as necessary when, and if, information becomes available to further define and quantify the value of the assets acquired and liabilities assumed. To the extent additional
41
Table of Contents
Index to Financial Statements
information to refine the original allocation becomes available during the allocation period, the allocation of the purchase price is adjusted. If information becomes available after the allocation period, those items are reflected in operating results.
Income Taxes. Our income tax expense includes local, state and federal income taxes. We account for tax ramifications using SFAS No. 109 “Accounting for Income Tax.” Under SFAS No. 109, we record deferred income tax assets and liabilities based upon temporary differences between the carrying amount and tax basis of our assets and liabilities and measure tax expense using enacted tax rates and laws that will be in effect when the differences are expected to reverse. The effect of a change in tax rate is recognized in income in the period of the change. Furthermore, SFAS No. 109 requires a valuation allowance for any net deferred income tax assets which we believe are likely to not be used through future operations. If our estimates and assumptions related to our deferred tax position change in the future, we may be required to record additional valuation allowances against our deferred tax assets and our effective tax rate may increase, which could result in a material adverse effect on our financial position, results of operations and cash flow.
Stock-Based Compensation. In December 2004, the FASB issued SFAS No. 123R, “Share-based Payment,” which revises SFAS No. 123 and supersedes APB Opinion No. 25. SFAS No. 123R requires us to measure the cost of employee services received in exchange for an award of equity instruments based on the grant date fair value of the award, with limited exceptions. The fair value of the award must be re-measured at each reporting date through the settlement date, with changes in fair value recognized as compensation expense of the period. SFAS No. 123R requires that we use an option-pricing model, adjusted for the unique characteristics of those instruments, to determine fair value as of the grant date of the stock options. In so doing, we use an option-pricing model (Black-Scholes), which requires various assumptions as to interest rates, volatility, dividend yields and expected lives of stock-based awards.
Cash Flow Estimates. Our estimates of future cash flow are based on the most recent available market and operating data for the applicable asset or reporting unit at the time we made the estimate. Our cash flow estimates are used for asset impairment analyses.
42
Table of Contents
Index to Financial Statements
The following table describes estimates, assumptions and methods regarding critical accounting estimates used to prepare our consolidated financial statements. We consider an estimate to be critical if it is subjective and if changes in the estimate using different assumptions would result in a material impact on our financial position or results of operations:
Description | Estimates/Assumptions Used | Variability in Accounting | Historical Results | |||
Revenue Recognition | We recognize revenue when it is realizable and earned as services are performed. We defer unearned revenue until earned.
| There is a risk that we may not record revenue in the proper period.
| We did not record material adjustments resulting from revenue recognition issues for the years ended December 31, 2006, 2005 and 2004.
| |||
On uncompleted contracts, we estimate the revenue to be recognized using the percentage-of-completion method based on the ratio of costs incurred to total estimated costs at completion.
| There is a risk that management’s estimate of total costs at completion is incorrect, and that the result could materially impact our financial position and results of operations. | With the purchase of AOQ and BLR in 2006, revenue recognition on uncompleted contracts became a significant management estimate. If total estimated costs at completion had increased or decreased by 1% for the year ended December 31, 2006, revenue would be overstated or understated by approximately $3,000.
| ||||
Impairment of Long-lived Assets |
We evaluate the recoverability of assets periodically, but at least annually for goodwill and intangible assets with indefinite lives, by reviewing operational performance and expected cash flows. Our management estimates future cash flows for this purpose and for intangible assets, discounts these cash flows at an applicable rate. |
There is a risk that management’s estimates of future performance may not approximate actual performance or that rates used for discounting cash flows are not consistent with the actual discount rates. Our assets could be overstated if impairment losses are not identified in a timely manner. |
We tested goodwill for impairment for each of the years ended December 31, 2006, 2005 and 2004, and management determined that goodwill was not impaired. A significant decline in expected future cash flow as a result of lower revenue, could result in an impairment charge. For example, an impairment of 10% of goodwill at December 31, 2006, would have resulted in a decrease in operating income of $11.0 million for the year ended December 31, 2006. |
43
Table of Contents
Index to Financial Statements
Description | Estimates/Assumptions Used | Variability in Accounting | Historical Results | |||
Allowance for Doubtful Accounts |
We estimate the recoverability of receivables on an individual basis based upon historical experience and management’s judgment. |
There is a risk that management may not detect uncollectible accounts in the correct accounting period. |
Bad debt expense has been less than 1% of sales for each of the years ended December 31, 2006, 2005 and 2004. If bad debt expense had increased by 1% of sales for the year ended December 31, 2006, net income would have declined by $2.4 million. | |||
Litigation and Self-Insured Risk Reserves |
We estimate our reserves related to litigation and self-insured risk based on facts and circumstances specific to the litigation and self-insured risk claims and our past experiences with similar claims. |
There is a risk that the actual outcome of litigation and/or self insured claims could differ significantly from our estimates. |
Expense related to litigation and self-insured risk has been less than 1% of revenue for each of the years ended December 31, 2006, 2005 and 2004. If this expense had increased by 1% of revenue for the year ended December 31, 2006 net income would have declined by $2.4 million. | |||
Property, Plant and Equipment |
Our management estimates useful lives of depreciable equipment and salvage values. The depreciation method used is generally the straight-line method, except for furniture and office equipment which is depreciated on an accelerated basis. |
GAAP permits various depreciation methods to recognize the use of assets. Use of a different depreciation method or different depreciable lives could result in materially different results. The estimated useful lives are consistent with industry averages. There is a risk that the asset’s useful life used for our depreciation calculation will not approximate the actual useful life of the asset. |
We evaluate property, plant and equipment for impairment when there are indicators of impairment. There have been no impairment charges related to our long-term assets during the years ended December 31, 2006, 2005 and 2004. Depreciation expense for the year ended December 31, 2006 represented 16.0% of the average depreciable asset base for that period. An increase in depreciation relative to the depreciable base of 1%, from 16.0% to 17.0%, would have reduced net income by approximately $1.7 million. | |||
44
Table of Contents
Index to Financial Statements
Description | Estimates/Assumptions Used | Variability in Accounting | Historical Results | |||
Valuation Allowance for Income Taxes |
We apply the provisions of SFAS No. 109 to account for income taxes. Differences between depreciation methods used for financial reporting purposes compared to tax purposes as well as other items, including loss carry forwards and valuation allowances against deferred tax assets require management’s judgment related to the realizability of deferred tax accounts. |
There is a risk that estimates related to the use of loss carry forwards and the realizability of deferred tax accounts may be incorrect, and that the result could materially impact our financial position and results of operations. In addition, future changes in tax laws could result in additional valuation allowances. |
Historically, we have not had to record a valuation allowance to reflect that our deferred tax assets would not be utilized through future operations. Deferred income tax assets totaled $0.2 million at December 31, 2006. We have not recorded a valuation allowance since we believe that the deferred tax asset is realizable. If we were required to record a valuation allowance it would affect our net income on a dollar for dollar basis. | |||
Stock-Based Compensation | We have adopted the provisions of SFAS No. 123R which requires that we measure the cost of employee services received in exchange for an award of equity instruments based on the fair value of those instruments on their grant date. The fair value of these instruments must be re-evaluated at each reporting date through the settlement date with changes in fair value recognized as compensation expense of the period. | GAAP permits the use of various models to determine the fair value of stock options and the variables used for the model are subjective. We have estimated the value of stock grants in accordance with conventional valuation techniques including but not limited to net book value and comparable company multiples of EBITDA as applicable. The use of different assumptions or a different model may have a material impact on our results of operations and related disclosures. | Historically, we granted shares of restricted stock in Stallion Holdings, Ltd. to employees. We have not granted stock options to employees. In the year ended December 31, 2006, compensation expense from stock grants was insignificant based on management’s valuation at the time of grant. | |||
45
Table of Contents
Index to Financial Statements
Results of Operations
Prior to 2003, we did not have significant operations. We began our strategic acquisition and expansion program early in 2003 and operated in one business segment, wellsite support services, which at that time consisted only of our workforce accommodations and surface equipment rental business. In 2005, with our acquisition of SSI, we established our solids control service line, which is part of our wellsite support services operating segment. In March 2006, we established our second operating segment, construction and logistics services, when we acquired OHH and BLR. In August 2006, we substantially augmented our wellsite support services segment and entered the offshore workforce accommodation business by acquiring AOQ.
The following table sets forth our results of operations for the periods indicated. Our results of operations between the periods presented vary significantly primarily due to the number of acquisitions made during the presented periods and the relative timing of the acquisitions during those periods. See the notes to our historical consolidated financial statements for more detail.
Year ended December 31, | Variance 2003 to 2004 | Variance 2004 to 2005 | Variance 2005 to 2006 | |||||||||||||||||||||||||||||||||
| 2003 | 2004 | 2005 | 2006 | $ | % | $ | % | $ | % | |||||||||||||||||||||||||||
| (dollars in thousands) | ||||||||||||||||||||||||||||||||||||
Statement of Operations | ||||||||||||||||||||||||||||||||||||
Revenue: | ||||||||||||||||||||||||||||||||||||
Wellsite support services | $ | 6,769 | $ | 15,452 | $ | 73,126 | $ | 162,661 | $ | 8,683 | 128.3 | % | $ | 57,674 | 373.2 | % | $ | 89,535 | 122.4 | % | ||||||||||||||||
Construction and logistics services | 77,749 | 77,749 | ||||||||||||||||||||||||||||||||||
Total revenue | 6,769 | 15,452 | 73,126 | 240,410 | 8,683 | 128.3 | % | 57,674 | 373.2 | % | 167,284 | 228.8 | % | |||||||||||||||||||||||
Expenses: | ||||||||||||||||||||||||||||||||||||
Wellsite support services | 3,108 | 8,695 | 42,281 | 74,200 | 5,587 | 179.8 | % | 33,586 | 386.3 | % | 31,919 | 75.5 | % | |||||||||||||||||||||||
Construction and logistics services | 42,319 | 42,319 | ||||||||||||||||||||||||||||||||||
Selling, general and administrative | 2,145 | 3,745 | 9,883 | 43,359 | 1,600 | 74.6 | % | 6,138 | 163.9 | % | 33,476 | 338.7 | % | |||||||||||||||||||||||
Depreciation and amortization | 836 | 1,924 | 7,798 | 30,068 | 1,088 | 130.1 | % | 5,874 | 305.3 | % | 22,270 | 285.6 | % | |||||||||||||||||||||||
Loss on disposal of assets | 86 | 92 | 499 | 920 | 6 | 7.0 | % | 407 | 442.4 | % | 421 | NM | ||||||||||||||||||||||||
Total expenses | 6,175 | 14,456 | 60,461 | 190,866 | 8,281 | 134.1 | % | 46,005 | 318.2 | % | 130,405 | 215.7 | % | |||||||||||||||||||||||
Operating income | 594 | 996 | 12,665 | 49,544 | 402 | 67.7 | % | 11,669 | NM | 36,879 | 291.2 | % | ||||||||||||||||||||||||
Interest expense, net | (489 | ) | (917 | ) | (4,565 | ) | (18,919 | ) | 428 | 87.5 | % | 3,648 | 397.8 | % | 14,354 | 314.4 | % | |||||||||||||||||||
Other income (expenses) | — | — | (66 | ) | 71 | — | NM | 66 | NM | (137 | ) | NM | ||||||||||||||||||||||||
Income before income tax | 105 | 79 | 8,034 | 30,696 | (26 | ) | (24.8 | )% | 7,955 | NM | 22,662 | 282.1 | % | |||||||||||||||||||||||
Income tax income (expense) | — | — | (598 | ) | (4,927 | ) | — | NM | 598 | NM | 4,329 | NM | ||||||||||||||||||||||||
Net income | $ | 105 | $ | 79 | $ | 7,436 | $ | 25,769 | $ | (26 | ) | (24.8 | )% | $ | 7,357 | NM | $ | 18,333 | 246.5 | % | ||||||||||||||||
NM—Denotes not meaningful
Year Ended December 31, 2006 Compared to Year Ended December 31, 2005
Revenue.
Our revenue for the year ended December 31, 2006 increased $167.3 million or 228.8%. The increase by operating segment was as follows:
Wellsite Support Services—Segment revenue increased $89.5 million or 122.4% to $162.7 million for the year ended December 31, 2006. The increase in segment revenue resulted principally from acquisitions made subsequent to January 1, 2006 combined with organic growth as a result of our capital expenditures program. In addition, we have seen modest improvement in our pricing.
Construction and Logistics Services—Our acquisition of Oilfield Heavy Haulers, LLC and the BLR Construction Companies, L.L.C. in March 2006 marked the establishment of our construction and logistics services operating segment. Segment revenue increased $77.7 million for the year ended December 31, 2006 from none in the similar period of 2005 due to adding the additional segment operations in 2006.
46
Table of Contents
Index to Financial Statements
Operating Expense.
Our operating expense for the year ended December 31, 2006 increased $130.4 million or 215.7%.
Expenses directly related to the operation of each of our operating segments include labor costs associated with the execution and support of our services, materials used in the performance of those services and other costs directly related to the support and maintenance of our equipment. These expenses increased 175.6% or $74.2 million. The increase in these costs by operating segment was as follows:
Wellsite Support Services—Direct segment operating cost increased $31.9 million or 75.5% for the twelve month period ended December 31, 2006 compared to the same period in 2005 as a result of acquisitions made during the period. Direct operating expenses as a percentage of segment revenue decreased from 57.8% for the year ended December 31, 2005 to 45.6% for the year ended December 31, 2006. The decrease in these costs as a percentage of revenue resulted principally from improved pricing and a more favorable mix of higher margin services.
Construction and Logistics Services—Our acquisition of Oilfield Heavy Haulers LLC and the BLR Construction Companies, L.L.C. in March 2006 marked the establishment of our construction and logistics services operating segment. Direct segment operating costs increased $42.3 million for the year ended December 31, 2006 from none in the similar period of 2005 due to adding segment operations in 2006. As a percentage of segment revenue direct segment operating costs were 54.4% for the year ended December 31, 2006.
Selling, General and Administrative Expense.
Selling, general and administrative expense consists primarily of salaries and other related expenses for our sales, marketing, administrative, finance, information technology and human resources functions. Selling, general and administrative expenses increased $33.5 million, or 338.7%. This increase was primarily due to (i) the acquisitions that we made during 2005 and 2006, which added 37 personnel providing support to field offices who are accounted for in selling, general and administrative expenses and (ii) the write off of approximately $0.9 million of deferred offering expenses associated with our cancelled 2006 IPO. Additionally, we increased our corporate headcount by 41 during the same period. Additional costs were incurred for outside consulting services for accounting, tax and information technology in connection with integration of acquired companies into our business network. As a percentage of revenue, selling, general and administrative expenses increased from 13.5% for the year ended December 31, 2005 to 18.0% for the year ended December 31, 2006.
Depreciation and Amortization Expense.
Depreciation and amortization expense increased 285.6%, or $22.3 million. The increase in depreciation and amortization expense was the result of additional equipment and intangible assets acquired through capital expenditures and acquisitions. As a percentage of revenue, depreciation and amortization expense was 12.5% for the year ended December 31, 2006 compared to 10.7% for the similar period of 2005.
Interest Expense.
Interest expense was $18.9 million for the year ended December 31, 2006 compared to $4.6 million for the similar period ended December 31, 2005. Interest expense for the year ended December 31, 2006 includes $1.2 million of expense related to the write off of certain debt issuance cost associated with our 2005 credit facility. We replaced that credit facility with a new credit facility during the first quarter of 2006. See “—Liquidity and Capital Resources—2006 Credit Facility.” Additionally, the increase in interest expense was attributable to an increase in the average amount of debt outstanding as a result of acquisitions completed and capital expenditures incurred in 2005 and 2006. The weighted average interest rate on our outstanding debt increased from 6.75% at
47
Table of Contents
Index to Financial Statements
December 31, 2005 to 7.84% at December 31, 2006. The increase in our weighted average interest rate is related to borrowings under our variable interest rate facilities combined with a general increase in the prime rate of interest during that same time period. As a consequence of the increased level of debt and charges in debt structure resulting from the issuance of the notes in January 2007 and the amendment and restatement of our existing secured credit facility, we expect interest expense to increase. Our actual interest expense will depend in part on our revolving credit balances, which in turn will depend on our available cash flow from operations.
Income Tax Expense.
We are not subject to federal or state income taxes on a consolidated basis due to our partnership structure; however, certain of our subsidiary companies are taxable corporations and are subject to income tax. Our income tax expense is comprised of current and deferred tax expense. These taxes added together provide an indication of an effective rate of income tax. Our tax expense was $0.6 million and $4.9 million for the years ended December 31, 2005 and 2006, respectively. This increase was due primarily to our acquisition of certain entities which were taxable and increased operations in certain of our taxable subsidiaries. Following this offering we will be subject to income taxes.
Year Ended December 31, 2005 Compared to Year Ended December 31, 2004
In 2005 and 2004 we operated only in the wellsite support services operating segment.
Revenue.
Our revenue for the year ended December 31, 2005 increased $57.7 million, or 373.2%. Our increased revenue resulted from a combination of the acquisitions that we made during 2005 and from additional capital investment in rental equipment as well as improved market conditions, including favorable pricing for our services and products.
Operating Expense.
Our operating expense for the year ended December 31, 2005 increased $46.0 million or 318.2% principally as a result of acquisitions made in the last quarter of 2005 and the first nine months of 2006.
Expenses directly related to our operations include labor costs associated with the execution and support of our services, materials used in the performance of those services and other costs directly related to the support and maintenance of our equipment. These expenses increased 386.3% or $33.6 million from $8.7 million for the year ended December 31, 2004 to $42.3 million for the twelve months ended December 31, 2005.
Direct operating expense as a percentage of revenue increased from 56.3% in 2004 to 57.8% in 2005. The slight increase in direct operating expense as a percentage of revenue was primarily attributable to a temporary decrease in our margins as we integrated our recent acquisitions into our business.
Selling, General and Administrative Expense.
Selling, general and administrative expense consists primarily of salaries and other related expenses for our sales, marketing, administrative, finance, information technology and human resources functions. Selling, general and administrative expenses increased $6.1 million, or 163.9%. This increase was primarily due to the acquisitions that we made during 2005, which provided additional headcount and general expenses. Additional costs were incurred in 2005 for outside consulting services for accounting, tax and information technology. As a percentage of revenue, selling, general and administrative expenses decreased from 24.2% in 2004 to 13.5% in 2005, as these expenses were spread over a larger revenue base.
48
Table of Contents
Index to Financial Statements
Depreciation and Amortization Expense.
Depreciation and amortization expense increased 305.3%, or $5.9 million. The increase in depreciation and amortization expense was the result of equipment and intangible assets acquired through capital expenditures and purchase acquisitions. As a percentage of revenue, depreciation and amortization expense decreased from 12.5% in 2004 to 10.7% in 2005, as these expenses were spread over a larger revenue base.
Interest Expense.
Interest expense was $4.6 million for the twelve months ended December 31, 2005 compared to $0.9 million for the similar period ended December 31, 2004. The increase in interest expense was attributable to an increase in the average amount of debt outstanding as a result of acquisitions and capital expenditures completed in 2004 and 2005. The weighted average interest rate on our outstanding debt increased from 5.09% at December 31, 2004 to 6.75% at December 31, 2005. This increase related to borrowings under variable interest rate facilities and a general increase in the prime rate of interest during that same time period.
Income Tax Expense.
We are not subject to federal or state income taxes on a consolidated basis due to our partnership structure; however, certain of our subsidiary companies are taxable corporations and are subject to income tax. Our income tax expense is comprised of current and deferred tax expense. Together these taxes provide an indication of an effective rate of income tax. Our tax expense was $0.6 million for the year ended December 31, 2005. We had no tax expense for the year ended December 31, 2004. This increase was due primarily to our acquisition of certain entities which were taxable and increased operations in certain of our taxable subsidiaries.
Year Ended December 31, 2004 Compared to Year Ended December 31, 2003
In 2004 and 2003, we operated only in the wellsite support services operating segment.
Revenue.
Our revenue for the year ended December 31, 2004 increased $8.7 million, or 128.3%. The increased revenue resulted principally from our capital investment in new rental equipment and improved market conditions. During 2004, we invested $6.0 million in new rental equipment and $1.2 million for the acquisition of Rebel Testers, Inc., which did not have a significant impact on our 2004 operating results.
Operating Expense.
Our operating expense for the year ended December 31, 2004 increased $8.3 million, or 134.1%. Expenses directly related to the operation of our wellsite support services operating segment includes labor costs associated with the execution and support of our services, materials used in the performance of those services and other costs directly related to the support and maintenance of our equipment. These expenses increased 179.8%, or $5.6 million. Direct operating expenses as a percentage of revenue increased from 45.9% for the year ended December 31, 2003 to 56.3% for the year ended December 31, 2004.
Selling, General and Administrative Expense.
Selling, general and administrative expense consists primarily of salaries and other related expenses for our sales, marketing, administrative, finance, information technology and human resources functions. Selling, general and administrative expenses for the year ended December 31, 2004 increased $1.6 million, or 74.6%. As a percentage of revenue, selling, general and administrative expenses decreased from 31.7% in 2003 to 24.2% in 2004, as these expenses were spread over a much larger revenue base.
49
Table of Contents
Index to Financial Statements
Depreciation and Amortization Expense.
Depreciation and amortization expense increased 130.1% or $1.1 million. The increase in depreciation and amortization expense was principally the result of capital expenditures made to expand our inventory of rental equipment. As a percentage of revenue, depreciation and amortization expense was 12.4% for the year ended December 31, 2003 and 12.5% for the year ended December 31, 2004.
Interest Expense.
Interest expense was $0.9 million for the twelve months ended December 31, 2004 compared to $0.5 million for the similar period ended December 31, 2003. The increase in interest expense was attributable to an increase in the average amount of debt outstanding principally as a result of our capital expenditures completed in 2003 and 2004. The weighted average interest rate on our outstanding debt decreased slightly from 5.2% at December 31, 2003 to 5.09% at December 31, 2004.
Income Tax Expense.
Historically, we were not subject to federal or state income taxes on a consolidated basis due to our partnership structure; however, certain of our subsidiary companies are taxable corporations and are subject to income tax. As such, our income tax expense will be comprised of current and deferred tax expense. Together these taxes provide an indication of an effective rate of income tax. We had no income tax expense for the years ended December 31, 2004 and 2003.
Liquidity and Capital Resources
Our primary liquidity needs are to fund acquisitions and capital expenditures, such as acquiring new rental equipment and funding our general working capital requirements. Our primary capital resources are net cash flow from our operations and borrowings under our $125.0 million revolving credit facility, of which approximately $124.1 million was available at March 31, 2007.
On January 19, 2007, Stallion issued $300.0 million of 9.75% Senior Notes due February 1, 2015 in a private placement. Proceeds from the sale of the Senior Notes were used to retire the outstanding balance on the $210.0 million Term B Loan and to pay down approximately $44.5 million under our revolving credit facility. Concurrent with the placement of the Senior Notes we amended our existing senior secured credit facility to increase the revolving line from $70.0 million to $125.0 million and reduced the applicable interest rate to LIBOR plus 2.00%. Additionally the revolving credit covenant package was adjusted to provide greater operating flexibility.
We anticipate that we will rely on cash generated from operations and borrowings under our amended and restated revolving credit facility to satisfy our liquidity needs. We believe that funds from these sources will be sufficient to meet our working capital requirements for at least the next 12 months. Our ability to fund future capital expenditures and to make strategic acquisitions will depend upon our future operating performance and, more broadly, on the availability of equity and debt financing, which will be affected by prevailing economic conditions in our industry, and general financial, business and other factors, some of which are beyond our control.
Operating Activities
Our cash flow provided by operating activities for the year ended December 31, 2006 increased $34.0 million compared to the year ended December 31, 2005. Our gross receipts increased during 2006 as demand for our services continued to grow, resulting in more billable days and more favorable billing rates, while we expanded our current business and entered new markets through acquisitions and capital investments. The
50
Table of Contents
Index to Financial Statements
increase in cash flow provided by operations was primarily related to our increased revenue resulting from our 2005 and 2006 capital expenditures for equipment and the acquisition of businesses.
Cash flow provided by operating activities was $7.1 million in 2005 as compared to $1.7 million in 2004. The increase in operating cash flow in 2005 over 2004 was primarily due to an increase in our gross receipts as a result of increased revenue. Our gross receipts increased during 2005 as demand for our services grew while we expanded our existing business and entered new markets through acquisitions and capital investments. The 2004 operating cash flow, as compared to 2003, also increased as a result of our improved operating results which were directly related to improved demand for our services, better billing rates and our entry into new markets.
Investing Activities
Cash flow used in investing activities was $280.2 million for the year ended December 31, 2006 as compared to $83.5 million for the same period of 2005. During 2006, we made property and equipment capital expenditures of $92.0 million compared to $36.0 million in the same period of 2005. Additionally in 2006, we paid total consideration of $206.6 million for the acquisition of eleven businesses. During 2005, we made six acquisitions totaling $51.4 million. Those acquisitions used cash of $178.0 million and $47.2 million for the year ended December 31, 2006 and 2005, respectively. In addition, we used cash of $1.4 million and $0.4 million for related acquisition costs in the years ended December 31, 2006 and 2005, respectively.
Cash flow used in investing activities was $83.5 million for the twelve months ended December 31, 2005 as compared to $7.1 million in 2004 and $7.5 million in 2003. The increase in cash flow used in investing activities in 2005 over 2004 was primarily due to our acquisition of six businesses during 2005 for a total consideration of $51.4 million and property and equipment capital expenditures we made to expand our fleet of rental and service equipment totaling $36.0 million. In 2005, we used cash of $47.2 million compared to $1.2 million in 2004 for the acquisition of businesses. In addition, we used cash of $0.4 million and $0.1 million for related acquisition costs in the years ended December 31, 2005 and 2004, respectively. In 2004, we spent $0.4 million less on investing activities than we did in 2003. We acquired one business in 2004 as compared to three businesses in 2003. Our cash used for acquisitions in 2003 was $5.5 million. The lower spending in 2004 on acquisitions was offset however as our capital expenditures for property and equipment increased $3.9 million in 2004 as compared to 2003.
Capital Expenditures
Capital expenditures for the purchase of property and equipment and acquisitions of companies are the main component of our investing activities. We made total capital expenditures for property and equipment for our existing business of $92.0 million during the year ended December 31, 2006. In 2006, we significantly expanded our wellsite support services segment with capital expenditures of $60.9 million to acquire additional equipment and $98.1 million to acquire five businesses that operate in the workforce accommodations and surface equipment rental service line. Additionally, we expanded our construction and logistics segment with capital expenditures of $29.2 million in 2006.
In addition to making investments in property and equipment capital expenditures, we will continue to evaluate acquisitions of complementary companies. We currently expect to spend approximately $95.4 million in 2007 for investment in property and equipment capital expenditures, including approximately $18.0 million for maintenance capital expenditures. In 2006, we made capital expenditures of $178.0 million to acquire 11 businesses.
Financing Activities
We also generated cash from our financing activities in 2006 totaling $242.2 million. Approximately $62.8 million of this amount resulted from contributions of capital, net of distributions, made by the partners. The remaining amount was attributable to new notes payable and long-term debt of $209.5 million net of issuance costs that were offset by payments on the notes and long-term debt totaling $74.2 million.
51
Table of Contents
Index to Financial Statements
Cash flow provided by financing activities was $77.3 million for the year ended December 31, 2005 as compared to $5.0 million in 2004 and $7.8 million in 2003. The increase in cash flow provided by financing activities in 2005 over 2004 was primarily due to capital contributions made by our partners totaling $32.4 million, increased borrowings under our credit agreement and through seller financing of a portion of certain of our 2005 acquisitions. These increases were partially offset by payments on our long-term debt totaling $21.5 million. The decline in 2004 cash flow provided by financing activities, as compared to 2003 was principally related to our use of operating cash flow to fund certain of our capital expenditures of approximately $6.0 million and to payments on our long-term debt of $5.2 million.
Credit Facility
On March 28, 2006, we amended and restated our then existing credit facility (as amended and restated, the “Credit Agreement”) with UBS AG Stamford Branch, as Issuing Bank, Administrative Agent and Collateral Agent (“UBS AG”), and certain other financial institutions. The Credit Agreement provided for a $165 million term loan and a $50 million revolving credit facility.
The Credit Agreement was further amended on July 31, 2006 to increase the Term Loan Facility by $45 million and the Revolving Credit Facility by $20 million.
As of December 31, 2006, $25.5 million was available to be drawn under the Revolving Credit Facility. For the years ended December 31, 2006, 2005 and 2004, our weighted average interest rate on outstanding borrowings were approximately 7.84%, 6.75%, and 5.09%, respectively.
Concurrent with the placement of the Senior Notes described below, we amended and restated the Credit Agreement, as amended, to increase the revolving line from $70 million to $125 million and reduced the applicable interest rate to LIBOR plus 2.00% (the “2007 Credit Agreement”).
The 2007 Credit Agreement contains certain covenants that limit our ability and our restricted subsidiaries’ ability to, among other things: incur additional debt, incur layered debt, consolidate or merge with or into other companies, comply with limitations on asset sales, limitations on restricted payments, limitations on dividends and other restrictions, limitations on transactions with affiliates, and additional note guarantees. Additionally the 2007 Credit Agreement requires that we maintain a secured leverage ratio that is less than 2.5 to 1.0 and a minimum interest coverage ratio of at least 2.5 to 1.0.
9.75% Senior Notes
In a private placement on January 19, 2007, Stallion Oilfield Services Ltd. issued $300.0 million of 9.75% Senior Notes due February 1, 2015. Proceeds from the sale of the Senior Notes were used to retire the outstanding balance on the $210.0 million Term B Loan and to pay down approximately $44.5 million under the revolving credit facility. Concurrent with the placement of the Senior Notes we amended our existing senior secured credit facility to increase the revolving line from $70 million to $125 million and reduced the applicable interest rate to LIBOR plus 2.00%. Additionally the revolving credit covenant package was adjusted to provide greater operating flexibility.
Interest payments on the Senior Notes are due semi-annually, on February 1 and August 1, commencing on August 1, 2007. The Senior Notes are non-convertible, unsecured and guaranteed by all the subsidiaries of the Partnership. In connection with the retirement of the Term B Loan on January 19, 2007, we expensed the remaining unamortized deferred debt issuance costs which amounted to approximately $4.8 million in the first quarter of 2007.
The Senior Notes are redeemable at the option of Stallion Oilfield Services Ltd. on or after February 1, 2011 at the specified redemption price as described in the Indenture. The Senior Notes will be redeemable by Stallion
52
Table of Contents
Index to Financial Statements
Oilfield Services Ltd., in whole or in part, at any time prior to February 1, 2011 at a discount rate of the U.S. Treasury rate plus 50 basis points. Prior to February 1, 2010 Stallion may redeem up to 35% of the Senior Notes with the proceeds of certain equity offerings at a redemption price equal to 109.75% of the principal amount of the Senior Notes, plus accrued and unpaid interest and liquidated damages, if any, to the date of redemption. This redemption must occur less than 90 days after the date of the closing of any such qualified equity offering.
Following a change of control, as defined in the Indenture, Stallion Oilfield Services Ltd. will be required to make an offer to repurchase all or any portion of the Senior Notes at a purchase price of 101% of the principal amount, plus accrued and unpaid interest and liquidated damages, if any, to the date of repurchase.
The Senior Notes contain certain covenants that limit the ability of Stallion Oilfield Services Ltd. and its restricted subsidiaries to, among other things: incur additional debt, incur layered debt, consolidate or merge with or into other companies. The Senior Notes also have limitations on asset sales, limitations on restricted payments, limitations on dividends and other restrictions, limitations on transactions with affiliates, and limitations on additional note guarantees. The restrictive covenants are subject to a number of important exemptions and qualifications set forth in the Indenture.
As part of the issuance of the Senior Notes, Stallion Oilfield Services Ltd. incurred debt issuance costs of approximately $8.5 million, which are being amortized to interest expense using the straight line method, which approximates the effective interest method over the term of the Senior Notes.
Other Debt
We have a variety of other capital leases and notes payable outstanding that are customary in our industry. None of these debt instruments are significant individually.
Outstanding Debt and Operating Lease Commitments
We have significant contractual obligations in the future that will require capital resources. Our primary contractual cash obligations are (1) our debt, (2) our capital lease obligations and (3) our operating leases.
The following table summarizes our known contractual obligations as of December 31, 2006 (in thousands):
Payments Due by Period
Contractual Obligations | Total | 2007 | 2008-2009 | 2010-2011 | Thereafter | ||||||||||
Long-term debt | $ | 257,229 | $ | 1,913 | $ | 2,157 | $ | 119 | $ | 253,040 | |||||
Capital lease obligations | 310 | 127 | 183 | — | — | ||||||||||
Operating lease obligations | 3,851 | 1,549 | 1,666 | 636 | — | ||||||||||
Total contractual obligations | $ | 261,390 | $ | 3,589 | $ | 4,006 | $ | 755 | $ | 253,040 | |||||
The following table summarizes our known contractual obligations as of December 31, 2006 giving effect to the issuance of the senior notes and the application of $210 million of the net proceeds to pay down our term loan facility (in thousands):
Contractual Obligations | Total | 2007 | 2008-2009 | 2010-2011 | Thereafter | ||||||||||
Long-term debt | $ | 304,189 | $ | 1,913 | $ | 2,157 | $ | 119 | $ | 300,000 | |||||
Capital lease obligations | 310 | 127 | 183 | — | — | ||||||||||
Operating lease obligations | 3,851 | 1,549 | 1,666 | 636 | — | ||||||||||
Total contractual obligations | $ | 308,350 | $ | 3,589 | $ | 4,006 | $ | 755 | $ | 300,000 | |||||
53
Table of Contents
Index to Financial Statements
Subsequent to December 31, 2006, we entered into a 99-month operating lease for approximately 60,000 square feet of office space with an annual rent expense of approximately $1.4 million beginning in August 2007.
Off-Balance Sheet Arrangements
We have entered into operating lease arrangements for certain of our specialized equipment and for our office and field operating locations in the normal course of business. The terms of our facility leases range from monthly to five years. The terms of the specialized equipment leases range from one to five years. Annual payments pursuant to these leases are included in the above table under “Operating lease obligations.”
Quantitative and Qualitative Disclosures about Market Risk
The demand, pricing and terms for oil and natural gas services that we provide are largely dependent upon the level of activity in the U.S. oil and natural gas industry. Industry conditions are influenced by numerous factors over which we have little or no control, including, but not limited to: the supply of and demand for oil and natural gas; the level of prices and expectations about future prices of oil and natural gas; the expected rates of declining current production; the discovery rate of new oil and natural gas reserves; available pipeline and other transportation capacity; weather conditions; domestic and worldwide economic conditions; political instability in oil-producing countries; technical advances affecting energy consumption; the price and availability of alternative fuels; the ability of oil and natural gas producers to raise equity capital and debt financing; and merger and divesture activity among oil and natural gas producers.
The level of activity in the oil and natural gas exploration and production industry is volatile. Expected trends in oil and natural gas production activities may not continue and demand for our services may not reflect the level of activity in the industry. Any prolonged substantial reduction in oil and natural gas prices that would likely affect drilling activity levels could have a material adverse effect on our business, financial condition, results of operations and cash flow.
In addition, as of December 31, 2006, we had interest rate caps on LIBOR at 6.15% with notional amounts of approximately $82.5 million. The cost of the caps of approximately $183,000 is amortized as interest expense over the life of the contract, which approximates the interest method. These interest rate caps were settled and terminated in February 2007.
We are exposed to changes in interest rates as a result of our credit facility which has a floating rate. We had a total of $253.0 million of indebtedness outstanding under our credit facility at December 31, 2006. The impact of a 1% increase in interest rates on this amount of debt would result in an annual increase in interest expense, and a corresponding decrease in net income, of approximately $2.5 million.
Recent Accounting Pronouncements
In February 2006, the FASB issued Statement of Financial Accounting Standards No. 155, “Accounting for Certain Hybrid Financial Instruments,” (“SFAS No. 155”). SFAS No. 155 provides entities with relief from having to separately determine the fair value of an embedded derivative that would otherwise be required to be bifurcated from its host contract in accordance with SFAS No. 133, Accounting for Derivative Instruments and Hedging Activities. SFAS No. 155 allows an entity to make an irrevocable election to measure such a hybrid financial instrument at fair value in its entirety, with changes in fair value recognized in earnings. SFAS No. 155 is effective for all financial instruments acquired, issued or subject to re-measurement event occurring after the beginning of an entity’s first fiscal year that begins after September 15, 2006. We believe that the adoption of SFAS No. 155 will not have a material impact on our financial position, results of operations or cash flows.
In March 2006, the FASB issued Statement of Financial Accounting Standards No. 156, “Accounting for Servicing of Financial Assets—An Amendment to FASB Statement No. 140,” (“SFAS No. 156”). SFAS No. 156
54
Table of Contents
Index to Financial Statements
requires entities to recognize a servicing asset or liability each time they undertake an obligation to service a financial asset by entering into a servicing contract in certain situations. This statement also requires all separately recognized servicing assets and servicing liabilities to be initially measured at fair value and permits a choice of either the amortization or fair value measurement method for subsequent measurement. The effective date of this statement is for annual periods beginning after September 15, 2006, with earlier adoption permitted as of the beginning of an entity’s fiscal year provided the entity has not issued any financial statements for that year. We do not plan to adopt SFAS No. 156 early, and we are currently assessing the impact on our Consolidated Financial Statements.
In July 2006, the FASB issued an interpretation entitled “Accounting for Uncertainty in Income Taxes—an interpretation of FASB No. 109,” referred to as “FIN 48.” FIN 48 clarifies the accounting for uncertain tax provisions that may have been taken by an entity. Specifically, FIN 48 prescribes a more-likely-than-not recognition threshold to measure a tax position taken or expected to be taken in a tax return through a two-step process: (1) determining whether it is more likely than not that a tax position will be sustained upon examination by taxing authorities, after all appeals, based upon the technical merits of the position; and (2) measuring to determine the amount of benefit/expense to recognize in the financial statements, assuming taxing authorities have all relevant information concerning the issue. That tax position is measured at the largest amount of benefit/expense that is greater than 50 percent likely of being realized upon ultimate settlement. This pronouncement also specifies how to present a liability for unrecognized tax benefits in a classified balance sheet, but does not change the classification requirements for deferred taxes. Under FIN 48, if a tax position previously failed the more-likely-than-not recognition threshold, it should be recognized in the first subsequent financial reporting period in which the threshold is met. Similarly, a position that no longer meets this recognition threshold should be derecognized in the first financial reporting period that the threshold is no longer met. FIN 48 becomes effective for fiscal years beginning after December 15, 2006, with earlier adoption encouraged. We are currently evaluating the impact this statement may have on our financial position, results of operations and cash flow.
In September 2006, the FASB issued SFAS No. 157, “Fair Value Measurements,” a pronouncement which provides additional guidance for using fair value to measure assets and liabilities. The pronouncement states that fair value should be based upon assumptions market participants would use to price an asset or liability, and establish a hierarchy that prioritizes the information used to determine fair value, whereby quoted marked prices in active markets would be given highest priority with lowest priority given to data provided by the reporting entity based on unobservable facts. This standard requires disclosure of fair value measurements by level within this hierarchy. SFAS No. 157 becomes effective in the first interim reporting period for the fiscal years beginning after November 15, 2006, with early adoption permitted. We are currently evaluating the impact this statement may have on our financial position, results of operations and cash flow.
In September 2006, the Securities and Exchange Commission staff issued Staff Accounting Bulletin (“SAB”) No. 108, incorporated into the SEC Rules and Regulations as Section N to Topic 1, “Financial Statements,” which provides guidance concerning the effects of prior year misstatements in quantifying current year misstatements for the purpose of materiality assessments. Specifically, entities must consider the effects of prior year unadjusted misstatements when determining whether a current year misstatement will be considered material to the financial statements at the current reporting period and record the adjustment, if deemed material. SAB No. 108 provides a dual approach in order to quantify errors under the following methods: (1) a roll-over method which quantifies the amount by which the current year income statement is misstated, and (2) the “iron curtain” method which quantifies a cumulative error by which the current year balance sheet is misstated. Entities may be required to record errors that occurred in prior years even if those errors were insignificant to the financial statements during the year in which the errors arose. SAB No. 108 became effective as of the beginning of the fiscal year ending after November 15, 2006. Upon adoption, entities may either restate the financial statements for each period presented or record the cumulative effect of the error correction as an adjustment to the opening balance of retained earnings at the beginning of the period of adoption, and provide disclosure of each individual error being corrected within the cumulative adjustment, stating when and how each error arose
55
Table of Contents
Index to Financial Statements
and the fact that the error was previously considered immaterial. This authoritative guidance had no impact on our financial position, results of operations and cash flows.
In February 2007, the FASB issued Statement of Financial Accounting Standards No. 159, “The Fair Value Option for Financial Assets and Financial Liabilities—Including an Amendment of FASB Statement No. 115,” (“SFAS No. 159”). This pronouncement permits entities to use the fair value method to measure certain financial assets and liabilities by electing an irrevocable option to use the fair value method at specified election dates. After election of the option, subsequent changes in fair value would result in the recognition of unrealized gains or losses as period costs during the period the change occurred. SFAS No. 159 becomes effective as of the beginning of the first fiscal year that begins after November 15, 2007, with early adoption permitted. However, entities may not retroactively apply the provisions of SFAS No. 159 to fiscal years preceding the date of adoption. We are currently evaluating the impact that SFAS No. 159 may have on our financial position, results of operations and cash flows.
56
Table of Contents
Index to Financial Statements
General
We provide wellsite support services and construction and logistics services to exploration and production companies and drilling contractors throughout the United States. Our company slogan, Everything But The Rig, reflects our business strategy of providing a broad and comprehensive range of critical services to support wellsite operations, including onshore and offshore workforce accommodations, surface equipment rental, solids control, site construction, rig relocation and heavy equipment hauling. We seek to differentiate ourselves by offering a broad array of wellsite services with a focus on quality and reliability. Our service offerings are designed to improve living and working conditions at the wellsite, wellsite safety and our customers’ productivity.
Our services span the entire life-cycle of the land-based wellsite—wellsite preparation, rig deployment, drilling activities, production activities and decommissioning. We are typically the first service provider on the wellsite, as we assist in the initial preparation of the wellsite and often haul the rig and related heavy equipment onto the site using our fleet of tractors, trailers, trucks and cranes. Throughout the drilling and completion phases of the land-based well, we provide rental equipment and required support services to the wellsite. We also, in some cases, provide continuing support services during the production phase of the well, including construction of production facilities and well connections to existing pipeline infrastructure. We frequently are the last service provider to leave the wellsite as we perform production facility disassembly and site restoration, which are the last phases of the wellsite decommissioning process. In addition, our offshore workforce accommodations business serves our offshore customers during many phases of the offshore drilling and production life-cycle.
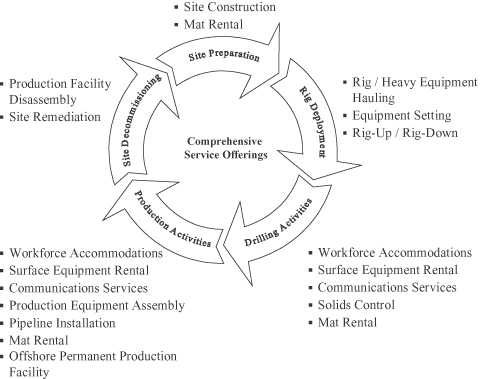
We currently focus on oil and natural gas regions within North America that we believe have attractive long-term potential for growth, including South Texas, the Gulf Coast, ArkLaTex, North Texas, the Permian Basin, the Mid-Continent and Rocky Mountain regions. We also supply offshore workforce accommodations and related equipment for use in the Gulf of Mexico and, to a lesser extent, other international offshore regions. We manage our operations from field service offices located throughout our operating areas.
57
Table of Contents
Index to Financial Statements
We conduct our operations through the following two business segments:
Wellsite Support Services. Through our wellsite support services segment, we offer integral services used by oil and natural gas companies, drilling contractors and other wellsite service providers to support wellsite operations. This segment includes the following primary service lines:
| • | Workforce accommodations. We provide onshore workforce accommodations in the United States with, as of December 31, 2006, over 2,000 transportable units in our inventory. Our fleet of land-based units is designed to accommodate various personnel on wellsite locations before, during and after drilling operations. Certain trends in the oil and natural gas exploration and production industry, including increased drilling complexity and a tight supply of labor, have resulted in wellsite personnel spending more time at the wellsite. These trends have contributed to an increase in demand for high-quality, reliable workforce accommodations. In addition, we design, manufacture, lease and repair offshore workforce accommodation structures, which include U.S. Coast Guard certified and/or SOLAS certified units. Our onshore and offshore workforce accommodation units are specifically configured to provide transportable, comfortable living quarters and functional workspaces. |
| • | Surface equipment rental. We provide a variety of surface rental equipment used in and critical to wellsite activities including forklifts, manlifts, power generators, compressors, loaders and water systems. |
| • | Communications services.We provide integrated communications services through our StaRComm satellite system that provides wireless communications via intercoms and telephone, fax and internet/data services throughout the wellsite location. |
| • | Solids control. We provide customized solids control services, closed-loop mud systems and fluid recovery services to help maximize our customers’ operating efficiency at the wellsite. We provide high-quality shakers, mud conditioners, centrifuges and peripheral backside equipment, as well as solids removal and waste handling coordination services. |
Construction and Logistics Services. Through our construction and logistics services segment, we offer services that are critical to establish, maintain and decommission the wellsite and position key equipment prior to, during and after drilling operations. This segment includes the following primary service lines:
| • | Site construction. We provide construction equipment and services to build and reclaim infrastructure at wellsites before, during and after drilling operations. Our services include site clearing, road construction, mat placement, production facility assembly and construction, pipeline installation, pit remediation, production decommissioning and site restoration. We provide services for wellsites in both land and inland marine environments. |
| • | Rig relocation and heavy equipment hauling. We provide a fleet of cranes, tractors, trailers, trucks and loaders used for the hauling and relocation of drilling rigs and related heavy equipment. We maintain a focus on providing reliable, efficient and safe transportation services. |
Wellsite support services and construction and logistics services are critical to establish and operate the land-based wellsite; however, these onshore services have historically been provided primarily by small, regional service providers and have not been the focus of larger oilfield service companies. We believe we have a distinct advantage over these smaller competitors due to our scale, our access to capital and our ability to provide a single supply source for many of our customers’ needs. We believe we differentiate ourselves and thus are able to achieve growth by offering our customers high-quality, professional and reliable equipment and services on a large scale. In addition, we provide offshore workforce accommodations to exploration and production companies in the Gulf of Mexico and, to a lesser extent, other international offshore regions. These services have been historically provided by relatively few service providers. We believe we have a competitive advantage over our competitors in this market due to our knowledge of the industry, relationships with customers and the quality of our products.
58
Table of Contents
Index to Financial Statements
Corporate Structure
The chart below illustrates our corporate structure following the Restructuring.
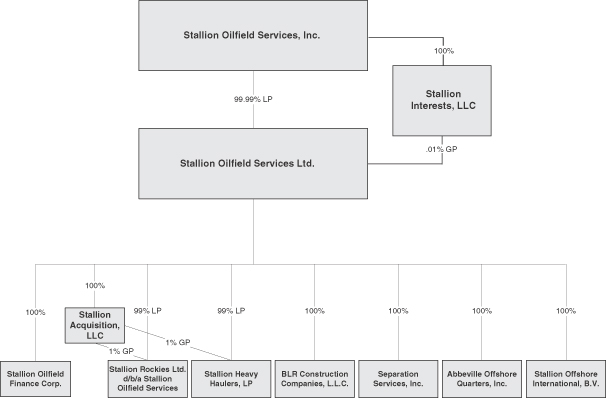
Industry
Our business depends on the level of exploration, development and production expenditures made by our customers. These expenditures are driven by the current and expected future prices for oil and natural gas, and the perceived stability and sustainability of those prices. Our services comprise a relatively small portion of the total cost of drilling the well and, accordingly, our revenue does not tend to vary significantly with changing drilling rig rates. Our business is primarily driven by natural gas and oil drilling and production activities in North America. We believe the following three principal economic factors will positively affect our industry in the coming years:
| • | Higher demand for natural gas in North America. We believe that natural gas will be in high demand in North America over the next several years because of its growing popularity as a cleaner burning fuel. According to the International Energy Agency’s 2006 World Energy Outlook, natural gas demand in North America (United States, Canada and Mexico) is projected to grow by approximately 29% from 2004 to 2030. |
| • | Constrained North American gas supply. Although the demand for natural gas is projected to increase, supply is likely to be constrained as North American natural gas basins are becoming more mature and experiencing increased decline rates. Even though the number of wells drilled in North America has increased significantly in recent years, a corresponding increase in domestic production has not occurred. As a result, producers are required to increase drilling to maintain existing levels of production. This is coupled with the recent development of reserve plays characterized by multiple wells having smaller average reserves per well. To supply the growing demand for natural gas, certain of the alternatives are to increase drilling and enhance recovery rates on domestic production. |
59
Table of Contents
Index to Financial Statements
| • | Increased oil drilling activity and sustained higher oil prices. We believe that historical data and industry forecasts suggest an increasing demand for oil coupled with a flat or declining production curve. The average West Texas Intermediate oil price has increased 153% from an average price of $26.17 for 2002 to an average price of $66.09 for 2006. According to BHI, the average number of drilling rigs in the United States dedicated to drilling for crude oil has increased 100% from an average of 137 for 2002 to an average of 274 in 2006. We believe that this increasing demand for crude oil is reflected in the sharp increase in crude oil prices and utilization of oil drilling rigs. According to the U.S. Department of Energy, the average daily oil production in the United States has decreased 12.0%, from 5,822 MBbl per day in 2000 to 5,121 MBbl per day in 2005. We believe that sustained domestic drilling activity for crude oil will continue as exploration and production companies contend with constrained supply and increased demand. |
As a result of the above factors, we expect that there will continue to be a tight supply of, and high demand for, natural gas and oil in North America in the near future. We believe these trends will continue to support high levels of drilling activity.
Our Business Strategy
We believe we are well positioned to become a leading provider of wellsite support and construction and logistics services. Our business strategy consists of the following core elements:
Broaden the suite of services we provide.We have established strong working relationships with our customers which provide us a stable base of operations. We work closely with our customers to define new service offerings that meet specific customer needs in the onshore markets where we operate and also intend to expand our offshore service offerings. For example, our StaRComm system was first deployed in December 2005 after a series of customer driven studies and trials. We have 227 StaRComm systems deployed at December 31, 2006. Also in 2006, we completed a number of acquisitions which provided us the capability in certain operating areas to provide more extensive rig relocation and heavy equipment hauling services. These acquisitions not only enhanced our revenue generating capacity but also provided us the opportunity to be the first service supplier at the wellsite and tocross-sell other services. We intend to continue to invest in developing or acquiring new high-quality assets and services which add to the equipment breadth and quality of our service portfolio.
60
Table of Contents
Index to Financial Statements
Establish and maintain a leadership position in our principal operating areas.We intend to continue to build leading market positions in the areas in which we operate by offering a comprehensive and integrated package of services which allows us to provide our customers with wellsite support services required across their drilling locations. We view the incremental steps in achieving this to include:
| • | Deploying our suite of services across existing land-based operating areas. We believe we have developed expertise in specific service lines which can be effectively marketed across the majority of our land-based operating areas. We intend to continue to roll-out our existing services across our current operating areas in an effort to deliver a comprehensive portfolio of services in each region. We believe our established customer base and strong regional relationships will continue to provide a strategic distribution network for our service deployment efforts. |
| • | Continue to develop our offshore service offerings. We believe we are a leading provider of offshore workforce accommodations to exploration and production companies. We intend to expand our manufacturing capabilities and offshore service offerings to meet the growing needs of these customers. |
Extend our operations into new geographic areas.We intend to apply our expertise in wellsite support services and land-based construction and logistics services in markets where we currently do not operate and which provide an attractive platform for future growth. We believe our customers will continue to find value in our ability to provide services across multiple operating regions. We intend to continue to improve the ease with which our clients can use our services from one wellsite location to the next. We expect to support our customers’ entry into other active drilling regions by introducing our service offerings in those regions. In addition, we will also seek opportunities for expanding into new geographic areas where market conditions are favorable in order to attract new customers.
Expand our services internationally. Our offshore workforce accommodation business predominantly operates in the Gulf of Mexico. We intend to pursue strategic opportunities to expand our service offerings into other international offshore markets by leveraging our custom product design and existing customer base.
Focus on service quality, business performance and safety. Our management team is responsible for assessing our service quality, performance and safety compliance and coordinates with our field offices to help ensure that our quality and performance metrics and safety standards are met at every level of our organization. In addition to our internal safety policies, we adhere to certain external safety regulations, such as certifying certain of our offshore workforce accommodation units with the U.S. Coast Guard and/or SOLAS prior to deployment. We believe that our pursuit of a reliable, comprehensive and professional service solution differentiates us from smaller regional competitors. We intend to continue to invest in and promote designs, systems and methodologies which improve the reliability, responsiveness, accountability and safety of our operations.
Continue to pursue strategic expansion opportunities.We believe that the markets in which we operate remain fragmented and that there are numerous consolidation opportunities within these markets. We completed 17 acquisitions in 2005 and 2006 and intend to continue pursuing strategic acquisitions which add to the scope and quality of our service portfolio. In evaluating such acquisitions we consider a number of factors, including synergies with existing operations, financial performance and acquisition costs.
Capitalize on regional experience. One component of our acquisition and growth strategy is to acquire assets located in strategic operating areas that include personnel with strong local leadership and regional experience. We believe that by having the administrative functions previously performed at the regional level centralized in and handled by our corporate office, we have enhanced our controls environment and enabled our local management to focus on our customers, our employees and the effective management and deployment of our assets.
61
Table of Contents
Index to Financial Statements
Our Competitive Strengths
We believe our operations benefit from a number of competitive strengths, including the following:
| • | Extensive breadth of service throughout the wellsite life-cycle. We provide a broad array of wellsite services throughout each phase of the land-based drilling and production process. This breadth of service strengthens our relationships with our customers and allows us to identify and cross-sell additional services. By providing comprehensive wellsite services to our customers, we believe we have an advantage over our competitors, who generally offer fewer services. |
| • | Extensive geographic footprint with a strong regional and local presence. Our regional operations are located in some of the most active onshore oil and natural gas drilling regions of the United States, including South Texas, the onshore Gulf Coast, ArkLaTex, North Texas, the Permian Basin, the Mid-Continent and Rocky Mountain regions. Within these regions there were approximately 1,525 active land drilling rigs as of December 31, 2006. In addition, our products are utilized in certain offshore markets, including the Gulf of Mexico and, to a lesser extent, other international offshore regions. Within the offshore Gulf of Mexico market, there were approximately 81 active offshore drilling rigs as of December 31, 2006. Our regional managers have developed strong relationships with our customers throughout their regions and are largely responsible for the sales, marketing and delivery of our services. Our broad geographic and multi-basin footprint decreases regional and specific play risk which could impact region-focused competitors. |
| • | Large scale of operations. We believe we are one of the largest providers of comprehensive land-based wellsite services in our operating areas. Our scale enables us to deliver a comprehensive range of reliable and high-quality wellsite services to our customers. Our size also provides us with increased access to capital resources and reduces our administrative burden as a percentage of sales. |
| • | Experienced management team with proven acquisition track record and control environment. Our senior management team has extensive experience in the oil and natural gas industry, with an average of 22 years of experience. We believe that this background provides our management team with an in-depth understanding of our customers’ needs and enhances our ability to deliver customer driven solutions. Our management also has substantial experience in identifying, completing and integrating acquisitions and since our inception through March 31, 2007, we have acquired 24 businesses. We have also implemented a standardized control environment that includes accounting, safety, environmental and maintenance processes and controls. Our integrated systems allow us to monitor operating performance, maintain financial, accounting and asset management controls, integrate acquisitions, prepare timely financial reports and manage contractual risk. In addition, our control environment provides transparency for our management team to track regional and project level performance and reliability and frees our local personnel to focus on customer service and performance. |
| • | Leveraged to drilling activity. We believe that favorable supply and demand fundamentals will maintain the current level of drilling for oil and natural gas. Efforts to maintain current levels of production will, in turn, necessitate continued drilling for the foreseeable future, which will sustain demand for our services. As our package of services typically comprises less than 15% of total drilling expenditures, our business has not historically experienced the pricing volatility experienced by drilling contractors, who represent a much larger portion of total drilling expenditures. |
| • | Leadership position in the offshore workforce accommodation business. We are one of a few providers of U.S. Coast Guard and SOLAS certified offshore workforce accommodations units worldwide. We believe our history, our custom design and the quality of our products and services provide a competitive advantage over our existing competitors and new entrants into these markets. |
Overview of Our Segments
We manage our business through two segments: wellsite support services and construction and logistics services. Through these segments, we offer services that are essential to the successful set-up, drilling and
62
Table of Contents
Index to Financial Statements
completion of a land-based wellsite. Our ability to provide timely and reliable service, our extensive inventory of readily-available equipment, and our reputation for high-quality are important to drilling contractors looking to stay on schedule and attract the best crews. We also believe that larger exploration and production companies often prefer to work with service providers who offer regional and even national supply options, which many smaller vendors cannot provide. Unlike some of our competitors, we offer a comprehensive suite of wellsite support services and are well positioned to be the preferred provider of these services to our customers. In addition, through our entry into the offshore workforce accommodation business, which is part of our wellsite support service segment, we provide products and services that are critical to offshore exploration and production activities.
We have the ability to provide a broad array of wellsite support services through our extensive inventory of equipment and services and network of regional offices. Our diverse and integrated product offerings enhance the value of our services to our customers, while reducing our reliance on a single product line. Our core business involves offering integrated services which provides us opportunities to cross-sell our other services. For example, our construction services operations are the first service provider to begin work on a new land-based wellsite. By delivering this service, we are strategically positioned to market our workforce accommodations and surface equipment services to the wellsite operator. Further, by staying in contact with the customer throughout the drilling phase, we are also well positioned to win business from the same customer for post drilling work, such as assembly of production facilities and pipelines, site remediation and other services. Finally, by providing land-based rig hauling and relocation services, we transition with the client to the next wellsite location. In addition to diversifying our revenue streams, we believe we can obtain a competitive advantage by supporting our customers before, during and after their drilling activities. Maintaining an ongoing dialogue with our customers also provides us with real-time information that ultimately helps us anticipate and support our customers’ needs.
Our products and services represent only a fraction of the overall costs of a well, providing an opportunity for pricing leverage as demand for higher quality workforce accommodations, surface equipment and other services increases.
We currently provide the following types of services for our customers to support their operations before, during and after wellsite operations:
Service Line | South Texas | Gulf Coast | ArkLaTex | North Texas | Permian Basin | Mid- Continent | Rocky Mountains | Offshore | ||||||||
Wellsite Support Services | ||||||||||||||||
Workforce Accommodations | ü | ü | ü | ü | ü | ü | ü | ü | ||||||||
Surface Equipment Rental | ü | ü | ü | ü | ü | ü | ü | |||||||||
Communications Services | ü | ü | ü | �� | ü | ü | ü | |||||||||
Solids Control | ü | ü | ü | ü | ü | |||||||||||
Construction and Logistics Services | ||||||||||||||||
Site Construction | ü | ü | ||||||||||||||
Mat Rental | ü | |||||||||||||||
Production Equipment Assembly and Installation | ü | |||||||||||||||
Pipeline Installation | ü | |||||||||||||||
Production Facility Disassembly | ü | |||||||||||||||
Site Remediation | ü | ü | ||||||||||||||
Rig Relocation and Heavy Equipment Hauling | ü | ü | ü | |||||||||||||
63
Table of Contents
Index to Financial Statements
Wellsite Support Services
Through our wellsite support services segment, integral services are delivered to oil and natural gas companies, drilling contractors and other wellsite service providers that are required to support wellsite operations. This segment includes onshore and offshore workforce accommodations, surface equipment rental, communications services and solids control services.
Workforce Accommodations
We provide basic living accommodations and rental services, primarily through equipment rental at the onshore wellsite location. As of December 31, 2006, we owned and operated approximately 1,745 transportable units. These onshore accommodation services include mobile and skid-mounted units, portable bathrooms, change houses and crew quarters; water, sewer, and other specialized vehicles; and on-site water and sewer systems. We provide wellsite accommodation services in all of the regions in which we operate. In addition, we design, manufacture, lease and repair offshore workforce accommodation structures, which include U.S. Coast Guard board certified and/or SOLAS-certified units. We provide basic living accommodations and related equipment to exploration and production companies conducting operations offshore. Each of our accommodation units is manufactured to our custom specifications for use in the oilfield environment and includes the equipment we believe is necessary to provide comfortable living quarters and functional workspaces.
In 1997, we built our first U.S. Coast Guard approved building for lease to meet customers’ deepwater needs in the Gulf of Mexico. We continue to design and manufacture customized U.S. Coast Guard certified offshore workforce accommodation units. In addition, we maintain a rental fleet of over 330 buildings, which includes sleeping quarters, galleys, offices and laundry buildings. We also provide repair services, including offshore refurbishment, maintenance and rig repair, to our customers in the offshore workforce accommodation business. We have a team of experienced craftsmen that may be deployed at the wellsite to provide these repair services to our customers. We have successfully completed many platform, workforce accommodation and vessel renovation and repair projects.
Our primary competition in most of our operating regions for our onshore workforce accommodations includes a fragmented group of smaller, independent service providers. Contracts for these workforce accommodations are awarded based on the quality of accommodations and services and pricing is determined by regional supply and demand. Our revenue relating to our onshore workforce accommodations for the year ended December 31, 2006 was $92.3 million.
Our primary competition in the offshore workforce accommodation market includes two domestic oilfield service companies and two service providers in the United Kingdom that focus on the workforce accommodation business. Contracts for offshore workforce accommodations are awarded based on the quality of accommodations and service and pricing is determined by market conditions and availability. Our revenue relating to our offshore workforce accommodation business for the year ended December 31, 2006 was $11.1 million.
Surface Equipment Rental
We also offer a wide range of surface equipment for every phase of a client’s operations at the land-based wellsite. As of December 31, 2006, we owned and operated a fleet of over 470 forklifts and loaders, including standard forklifts, extended-reach forklifts and articulating loaders. In addition, we have a number of manlifts, backhoes, generators, air compressors, light plants and trash containers as well as air, diesel and gasoline powered trash pumps, all of which can be coordinated and dispatched according to a customer’s needs.
Our primary competition in surface equipment rental includes various small service providers as well as large equipment rental companies. Contracts for our surface equipment are awarded based on the quality of
64
Table of Contents
Index to Financial Statements
equipment and service reliability and pricing is determined by regional supply and demand. Our revenue relating to surface equipment rental for the year ended December 31, 2006 was $31.0 million. Our workforce accommodations and surface equipment rental business operates in all of our operating regions.
Communications Services
We also offer our onshore customers StaRComm, a comprehensive technology solution with intercoms, television, integrated telephone, fax and internet communications delivered via satellite. Communications services are critical to the productivity and reporting at the wellsite. StaRComm provides a means of delivering these communications services in remote locations where land-based communications services are not available. Our revenue relating to communications services for the year ended December 31, 2006 was $6.1 million.
Solids Control
Through our solids control business, we offer customized solids control and fluid management services to the land-based wellsite, including the designing and planning of waste control systems and the installation, operation and management of solids control equipment. These services help to reduce waste, maximize fluid recovery and lower costs for our customers. To assist us in providing innovative and effective solids control solutions to our customers, we maintain an inventory of customized solids control equipment. As of December 31, 2006, we owned over 700 various pieces of solids control equipment, including centrifuges, mud conditioners, flow line shakers, drying shakers and peripheral backside equipment. This equipment is delivered and configured at the wellsite and operated by our trained technicians to maximize our customers’ fluids recovery and efficiency and to help reduce the environmental impact of fluids and solids generated during drilling and production activities at the wellsite. Our solids control business provides packaged and ad-hoc rental services. Packaged services include closed-loop and de-watering systems.
| • | Closed-Loop Systems.We are a leader in providing closed-loop mud systems which provide our customers with economic and environmental advantages over traditional earthen pit disposal at the wellsite. Drilling rigs have some solids control equipment, typically shakers and mud conditioning equipment. However, this equipment often is not properly maintained and provides only basic solids control capability, which limits drilling efficiency. Closed-loop systems are used to help reduce solids disposal, fluids disposal and the environmental impact at the wellsite while enhancing drilling efficiency. Closed-loop systems are required in environmentally sensitive areas including wellsites in or around coastal waters as well as in close proximity to residential communities. Closed-loop systems include a combination of flowline shakers, drying shakers, mud conditioners (desanders and desilters), centrifuges, pumps, tanks and other equipment in a customized configuration for a specific drilling rig. |
| • | Solids Control Coordination. We also provide coordination and management services, as needed, for all of our solids control system installations. For a particular project, we will engineer custom comprehensive solids control solutions which includes equipment rental, equipment monitoring services and waste handling coordination services in a turnkey solution package. |
Our solids control business also rents individual pieces of equipment on an ad-hoc basis. As part of our solids control services, we also provide remediation services to our customers including land farm location maintenance, slurry treatment, fluid treatment, de-watering services and pit closures.
Our primary competition in solids control includes nationally focused oilfield service companies. Contracts for our solids control services are generally awarded based on a bid basis and pricing is determined by availability of equipment and ability to meet the customer’s deadlines. Our revenue relating to solids control for the year ended December 31, 2006 was $22.6 million. Our solids control business operates in Texas, Louisiana, New Mexico and Oklahoma.
65
Table of Contents
Index to Financial Statements
Construction and Logistics Services
Through our construction and logistics services segment, we offer services that are critical to establish, maintain and decommission the onshore wellsite and position key equipment prior to, during and after land-based drilling operations. This segment includes site construction, rig relocation and heavy equipment hauling. We established this operating segment in March 2006 when we acquired BLR and OHH.
Site Construction
Through our site construction business, we offer equipment and services to build and reclaim infrastructure at wellsites before, during and after drilling operations. We build roads, dig pits, clear land, move earth and provide a number of construction services to oil and natural gas producers. Site construction requires the use of heavy equipment used in road construction. As of December 31, 2006, we owned and operated approximately 155 pieces of heavy construction equipment, including bulldozers, excavators, backhoes, compactors, road graders, dump trucks and cranes, and approximately 56,000 mats.
We also provide oilfield construction services for inland marine environments in bays and marshes of the Gulf Coast. Our inland marine construction services utilize tug boats, barges, crew boats, marsh hoes and cranes. Construction of production facilities in the coastal areas requires driving up to 100 to 200 pilings deep into the seafloor in order to provide an adequate foundation from which to construct and assemble production equipment above sea level.
Mat Rental
In areas near coastal wetlands or areas that receive significant rainfall, mats are used to stabilize locations and roads. Mats are made of hardwood and/or composite materials and are layered on roads and the wellsite to stabilize the location and prepare it for heavy equipment including the drilling rig. In some cases, pilings must be driven into the soil using hammer systems on cranes to provide strongback foundations to support the drilling rig. Mats are then layered across the location to provide a stable and dry area for wellsite operations. In areas with more stable foundations and soil conditions, mats are not required and crushed rock is brought in and graded to level and stabilize the wellsite pad.
Production Equipment Assembly and Installation
After the well is drilled, we also prepare the wellsite for production operations. Construction of wellsite production facilities includes the assembly and installation of tank batteries, containment barriers, condensers, heaters, compressors, flow lines and other specified production equipment.
Pipeline Installation
For natural gas wellsites, pipelines must be constructed to connect the new well to the nearest natural gas gathering system. We construct pipelines from the production site to the nearest gathering system or marketing line where the product may go to market.
Production Facility Disassembly and Site Remediation
After a well is plugged and abandoned, we provide decommissioning services including the disassembly of production equipment, removal of stabilization material or pad rock and re-seeding of native grasses to return the location to its original condition. This final process ends the life-cycle of the wellsite.
Our primary competition in wellsite construction services includes various small service providers as well as large, integrated oilfield service companies. Contracts for our wellsite construction services are awarded based on
availability of equipment and the ability to meet the customer’s deadlines and pricing is determined by regional
66
Table of Contents
Index to Financial Statements
supply and demand. Our construction business operates in Louisiana and Texas, and our services are offered for wellsites in both land and inland marine environments.
Rig Relocation and Heavy Equipment Hauling
We move land-based drilling rigs and related equipment to and from the wellsite. We own and operate a fleet of cranes, tractors, trailers and loaders used for these relocation services. Our capabilities allow us to move some of the largest rigs in the United States. Our land-based rig relocation and heavy equipment hauling operations are located in regions where a high concentration of the land drilling rigs in the United States are located. We maintain a focus on providing reliable, efficient and safe transportation services and believe our skilled personnel position us as one of the leading rig moving companies in the industry.
Our primary competition in rig relocation and heavy equipment hauling includes regionally based oilfield service companies. In addition, most drilling contractors also maintain some dedicated rig hauling capacity. Contracts for our rig and heavy equipment hauling services are awarded based on availability of equipment and the ability to meet the customer’s deadlines and pricing is determined by regional supply and demand.
Properties
Our principal executive offices are currently located at 410 Roberts Street, Houston, Texas 77003. We plan to relocate our principal executive offices to 950 Corbindale Road, Suite 300, Houston, Texas 77024 in the third quarter of 2007. As of December 31, 2006, we conducted our business from 38 field offices, three of which we own and 35 of which we lease. Each field office typically includes a yard, administrative office and maintenance facility. Our 38 field offices are located in Texas, Louisiana, Oklahoma, Colorado, Wyoming, North Dakota and New Mexico. We believe that our leased and owned properties are adequate for our current needs.
Sales and Marketing
Our sales and marketing activities are generally performed through our local operations in each geographic region. We believe our local field sales personnel understand basin-specific issues and customer operating procedures and, therefore, can effectively target marketing activities. We also have a corporate sales team located in our Houston headquarters that supplements our field sales efforts and focuses on large accounts and selling our complementary services.
Customers
In our onshore business, we serve numerous major and independent oil and natural gas companies, operators and drilling contractors that are active in our core areas of operations. For the twelve months ended December 31, 2006, we provided services to several hundred customers, with our top 10 customers comprising 35.2% of our revenue. The majority of our onshore business is with major and independent oil and natural gas companies. For 2006, our top customers in our onshore business included Devon Energy Corp., Grey Wolf Drilling Company, Questar Exploration, Encana Oil & Gas and EOG Resources. Our area managers and supervisors maintain relationships with customers whose operating decisions are generally made in the field. We serve numerous major and independent oil and natural gas companies conducting drilling operations offshore. For 2006, our top customers in our offshore business included C&M Group, LTD, Devon Energy Corp., EOG Resources, Trinidad Limited, Total E&P USA, Inc. and Chevron/Texaco, Inc.
Operating Risks and Insurance
Our operations are subject to hazards inherent in the oil and natural gas industry, such as accidents, blowouts, explosions, craterings, fires and oil spills that can cause:
| • | personal injury or loss of life; |
67
Table of Contents
Index to Financial Statements
| • | damage or destruction of property, equipment, the environment and marine life; and |
| • | suspension of operations. |
In addition, claims for loss of oil and natural gas production and damage to formations can occur in the well services business. If a serious accident were to occur at a location where our equipment and services were being used, it could result in our being named as a defendant in lawsuits asserting substantial claims.
Because our business involves the transportation of heavy equipment and materials, we may also experience traffic accidents which could result in spills, property damage and personal injury.
Despite our efforts to maintain high safety standards, we from time to time have suffered accidents and anticipate that we will experience accidents in the future. In addition to the property and personal losses from these accidents, the frequency and severity of these incidents affect our operating costs and insurability, and our relationships with our customers, employees and regulatory agencies. Any significant increase in the frequency or severity of these incidents or the general level of compensation awards could adversely affect the cost of, or our ability to obtain, workers’ compensation and other forms of insurance and could have other material adverse effects on our financial condition and results of operations.
Although we maintain insurance coverage of types and amounts that we believe to be customary in the industry, we are not fully insured against all risks, either because insurance is not available or because of the high premium costs. We do maintain employer’s liability, pollution, cargo, umbrella, comprehensive commercial general liability, workers’ compensation and limited physical damage insurance. There can be no assurance, however, that any insurance obtained by us will be adequate to cover any losses or liabilities, or that this insurance will continue to be available or available on terms which are acceptable to us. Liabilities for which we are not insured, or which exceed the policy limits of our applicable insurance, could have a material adverse effect on us.
In our offshore workforce accommodation business, our customers are contractually obligated to maintain insurance against property damage to or loss of our workforce accommodation units. However, if our customers do not comply with their insurance obligations and our products sustain damage or are lost, then we may be unable to recover the value of the damaged or lost products.
Competition
We operate in competitive markets. To compete successfully in those markets, a company must provide high-quality, reliable services that meet the specific needs of oil and natural gas exploration companies and drilling contractors at competitive prices. In our core land-based market areas, we compete against different companies in each of our business segments. Our competition includes many private “mom & pop” shops, as well as larger public companies including Superior Energy Services, Inc. (with respect to workforce accommodations), Newpark Resources, Inc. (with respect to site construction), National Oilwell Varco Inc. (with respect to solids control), Complete Production Services, Inc. (with respect to rig and heavy equipment hauling), Hertz Equipment Rental Corporation (with respect to surface equipment rental) and RSC Equipment Rental (with respect to surface equipment rental). In our onshore workforce accommodation business, we compete primarily with smaller, independent service providers and in our offshore workforce accommodation business, we compete against U.S. based oilfield service companies and certain international workforce accommodation providers. Our competition in this market includes Superior Energy Services, Inc., Oil States International, Inc. and Ferguson Modulars.
We believe that the principal competitive factors in the market areas that we serve are quality of service, reputation for safety and technical expertise, availability and price. While we must be price competitive, we believe that our customers select our services based primarily on our professional, reliable and comprehensive provision of services in each of our service areas and the experience of our service professionals who deliver those services.
68
Table of Contents
Index to Financial Statements
Safety Program
In the wellsite support services industry, an important competitive factor in establishing and maintaining long-term customer relationships is having an experienced and skilled work force. In recent years, many of our larger customers have placed an emphasis not only on pricing, but also on safety records and quality management systems of contractors. We believe that these factors will gain further importance in the future. We have directed substantial resources toward employee safety and quality management training programs as well as our employee review process. Many of our competitors, particularly small contractors, have not undertaken similar training programs for their employees or managers.
Environmental Matters
Extensive federal, state and local laws regulating the discharge of materials into the environment or otherwise relating to health and safety or the protection of the environment affect our business. Numerous governmental departments issue regulations to implement and enforce these laws, which are often difficult and costly to comply with. Failure to comply with these laws and regulations often carries substantial administrative, civil and even criminal penalties. Some laws and regulations relating to protection of the environment may, in some circumstances, impose strict liability for environmental contamination, rendering a person liable for environmental damages and cleanup costs without regard to negligence or fault on the part of that person. Compliance with these regulatory requirements increases our cost of doing business and consequently affects our profitability. We believe that, except as noted below, we are in substantial compliance with current applicable environmental laws and regulations and that continued compliance with existing requirements will not have a material adverse impact on our operations. However, environmental laws and regulations have been subject to frequent changes over the years, and the imposition of more stringent requirements could have a materially adverse effect upon our capital expenditures, earnings or our competitive position.
In November 2006, we were notified by a local agency that a discharge of wash water from equipment cleaning activities at our Houston, Texas solids controls facility into a drainage swale adjacent to the facility was not authorized. We stopped the discharge of equipment wash water immediately, and promptly remediated areas of impacted soil next to the equipment wash pad and in the adjacent drainage area. Although no proceeding has been commenced, it is possible that an enforcement action could be brought against us with respect to this discharge. Under the Texas Water Code, unauthorized discharges of wastewater may be subject to either civil or criminal fines and penalties. We are unable to predict whether the apparently unauthorized discharge will result in any enforcement action, but we do not expect this matter to have a material adverse effect on our operations or financial condition.
We generate non-hazardous and hazardous solid wastes that are subject to the requirements of the federal Solid Waste Disposal Act, as amended by the Resource Conservation and Recovery Act of 1976, referred to as “RCRA” in this prospectus, and comparable state statutes. Our operations generate minimal quantities of hazardous wastes because RCRA currently excludes drilling fluids, produced waters and other wastes associated with the exploration, development or production of oil and natural gas from regulation as hazardous waste. Disposal of wastes from oil and natural gas exploration, development and production that are non-hazardous wastes is usually regulated under state law. Other wastes handled at exploration and production sites or used in the course of providing well services may not fall within this exclusion from RCRA and may be regulated as hazardous waste. In addition, stricter standards for waste handling and disposal may be imposed on the oil and natural gas industry in the future. For instance, from time to time legislation has been proposed in Congress that would revoke or alter the current exclusion of exploration, development and production wastes from the RCRA definition of “hazardous wastes,” potentially subjecting these wastes to more stringent handling, disposal and cleanup requirements. If this legislation were enacted it could have a significant adverse impact on our operating costs, as well as the oil and natural gas industry and well servicing industry in general.
The Comprehensive Environmental Response, Compensation and Liability Act, referred to as “CERCLA” in this prospectus, and comparable state laws impose liability, without regard to fault on some classes of persons
69
Table of Contents
Index to Financial Statements
that are considered to be responsible for the release of a hazardous substance into the environment. These persons include the current or former owner or operator of the disposal site or sites where the release occurred and companies that disposed or arranged for the disposal of hazardous substances. Under CERCLA, these persons may be subject to joint and several liability for the costs of investigating and cleaning up hazardous substances that have been released into the environment, for damages to natural resources and for the costs of some health studies. In addition, companies that incur liability frequently confront additional claims because it is not uncommon for neighboring landowners and other third parties to file claims for personal injury and property damage allegedly caused by hazardous substances or other pollutants released into the environment from a polluted site. We generally conduct site assessments prior to acquiring new property and have taken measures to protect ourselves from liability for hazardous substance releases. Accordingly, we believe that we do not have any material liability for remediation of site contamination or related damages. However, because we may not have identified all instances of existing site contamination and because hazardous substance releases could occur in the future, we cannot assure you that we will not incur such liabilities in the future or that such liabilities will not be material.
Our operations are also subject to the federal Clean Water Act and analogous state laws. Under the Clean Water Act, the Environmental Protection Agency has adopted regulations concerning discharges of storm water runoff. This program requires covered facilities to obtain individual permits, participate in a group permit or seek coverage under an Environmental Protection Agency general permit. Some of our properties may require permits for discharges of storm water runoff and as part of our overall evaluation of our current operations. We are applying for storm water discharge permit coverage and updating storm water discharge management practices at some of our facilities. We believe that, where necessary, we will be able to obtain, or be included under, these permits and make minor modifications to existing facilities and operations that would not have a material effect on us.
The federal Clean Water Act and the federal Oil Pollution Act of 1990, which contains numerous requirements relating to the prevention of and response to oil spills into waters of the United States, require some owners or operators of facilities that store or otherwise handle oil to prepare and implement spill prevention, control, countermeasure and response plans relating to the possible discharge of oil into surface waters. We believe we are in substantial compliance with these regulations.
We maintain insurance against some risks associated with underground contamination that may occur as a result of wellsite service activities. However, this insurance is limited to activities at the wellsite, and this insurance may not continue to be available or may not be available at premium levels that justify its purchase. The occurrence of a significant event not fully insured or indemnified against could have a materially adverse effect on our financial condition and operations.
Government Regulation
We operate under the jurisdiction of a number of regulatory bodies that regulate worker safety standards, the hauling of hazardous materials, the transportation of explosives, the protection of the environment and driving standards of operation. Regulations concerning equipment certifications create an ongoing need for regular maintenance which is incorporated into our daily operating procedures.
Among the services that we provide, we operate as a motor carrier and therefore we are subject to regulation by the U.S. Department of Transportation (the “DOT”) and by various state agencies. These regulatory authorities exercise broad powers, governing activities such as the authorization to engage in motor carrier operations, and regulatory safety, financial reporting and certain mergers, consolidations and acquisitions. There are additional regulations specifically related to the trucking industry, including testing and specification of equipment and product handling requirements. The trucking industry is subject to possible regulatory and legislative changes that may affect the economics of the industry by requiring changes in operating practices or by changing the demand for common or contract carrier services or the cost of providing truckload services.
70
Table of Contents
Index to Financial Statements
Some of the possible changes include increasingly stringent environmental regulations; changes in hours of service regulations which govern the amount of time a driver may drive or work in any specific time period, onboard black box recorder devices or limits on vehicle weight and size.
Interstate motor carrier operations are also subject to safety requirements prescribed by the DOT. To a large extent, interstate motor carrier operations are subject to safety regulations that mirror federal regulations. Such matters as weight and dimension of equipment are also subject to federal and state regulations. DOT regulations also mandate regular drug testing of drivers.
In addition, through our construction and logistic service business we operate a fleet of barges that are subject to the safety requirements of the United States Coast Guard. Also, in our offshore workforce accommodation business, the units we design and manufacture are subject to the safety requirements of the U.S. Coast Guard.
From time to time, various legislative proposals are introduced, including proposals to increase federal, state, or local taxes, including taxes on motor fuels, which may increase our costs or adversely impact the recruitment of drivers. We cannot predict whether, or in what form, any increase in such taxes applicable to us will be enacted.
We are also subject to the requirements of the federal Occupational Safety and Health Act (“OSHA”) and comparable state statutes that regulate the protection of the health and safety of workers. In addition, the OSHA hazard communication standard requires that information be maintained about hazardous materials used or produced in operations and that this information be provided to employees, state and local government authorities and citizens. We believe that our operations are in substantial compliance with the OSHA requirements, including general industry standards, record keeping requirements, and monitoring of occupational exposure to regulated substances.
Employees
As of December 31, 2006, we employed approximately 1,344 people, 78 of which were administrative employees located in our Houston headquarters, and 1,266 of which were field workers and others employed in regional operations. Approximately 74.5% of our employees are employed on an hourly basis. Our future success will depend in part on our ability to attract, retain and motivate qualified personnel. We are not a party to any collective bargaining agreements, and we consider our relations with our employees to be satisfactory.
Legal Proceedings
From time to time, we are a party to litigation or other legal proceedings that we consider to be a part of the ordinary course of our business. We are not currently involved in any legal proceedings that could reasonably be expected to have a material adverse affect on our financial condition or results of operations.
On January 11, 2007, Enrique Mayoral, et al. (including various family members and estates) filed a suit against Stallion Ltd. in the 79th Judicial District of Jim Wells County, Texas, Case # 07-01-45395-CV, alleging three wrongful deaths and three personal injuries caused by an auto accident involving the driver of a vehicle owned by Stallion Ltd. Plaintiffs are seeking damages in an unspecified amount at this time. We believe that plaintiffs’ allegations are without merit, and we intend to defend the action vigorously. Stallion Ltd. believes it has sufficient insurance coverage available to it to conclude the matter.
71
Table of Contents
Index to Financial Statements
Directors and Executive Officers
Our directors and executive officers and their ages and positions, as of March 31, 2007, are as follows:
Name | Age | Position | ||
Craig M. Johnson | 44 | President, Chief Executive Officer and Chairman of the Board | ||
David S. Schorlemer | 40 | Vice President, Chief Financial Officer and Director | ||
Hill Dishman | 47 | Vice President and Chief Operating Officer | ||
Jennifer Guidry | 32 | Chief Accounting Officer, Treasurer and Assistant Secretary | ||
N. John Lancaster, Jr. | 38 | Director | ||
Pierre F. Lapeyre, Jr. | 44 | Director |
Set forth below is a description of the backgrounds of our directors and executive officers.
Craig M. Johnson. Mr. Johnson has over 20 years of experience in the oilfield service industry. Mr. Johnson has served as our Chief Executive Officer, President and Chairman of our board of directors since our formation in June 2006. Prior to our formation, he established Stallion Oilfield Holdings, Ltd., our predecessor, and served as the Chief Executive Officer, President and Chairman of its general partner, Stallion Oilfield Holdings GP, LLC, since December 2002. From September 2002 until December 2002, Mr. Johnson surveyed various investment and employment opportunities. Prior to September 2002, Mr. Johnson managed the rental and fishing tools division at Key Energy Services, Inc, a publicly traded well servicing and workover company. Mr. Johnson joined Key in July 2002 in connection with Key’s purchase of Q Services, Inc., a private production services company. From 1997 through July 2002, Mr. Johnson served as President and Chief Operating Officer of Q Services, Inc. Mr. Johnson earned his Bachelor of Arts degree from the University of Mississippi. Mr. Johnson served on the board of Remote Knowledge, Inc. between September 2004 and August 2005.
David S. Schorlemer. Mr. Schorlemer serves as our Chief Financial Officer, Vice President and director. Prior to our formation, he served in the same positions with Stallion Oilfield Holdings GP, LLC, the general partner of our predecessor, since September 2004. From July 2002 until September 2004, Mr. Schorlemer served as the Vice President of Marketing and Strategic Planning at Key Energy Services, Inc. From 1997 until July 2002, Mr. Schorlemer served as the Chief Financial Officer of Q Services, Inc. Prior to that, Mr. Schorlemer was with Andersen Consulting (now Accenture) where he worked on a variety of projects for numerous oil and natural gas companies, including Shell Oil Company, Conoco, PEMEX and Tenneco. Mr. Schorlemer earned his BBA at the University of Texas at Austin and his MBA at Texas A&M University.
Hill Dishman. Mr. Dishman serves as our Chief Operating Officer and Vice President. Prior to our formation, he served in the same positions with Stallion Oilfield Holdings GP, LLC, the general partner of our predecessor, since December 2002. From 1997 until December 2002, Mr. Dishman served as Vice President of Texas Operations for SOLOCO Texas, LP, an operating unit of Newpark Resources, Inc., an NYSE-listed oilfield service company. Mr. Dishman earned his Bachelor of Arts degree from Lamar University.
Jennifer Guidry. Ms. Guidry serves as our Chief Accounting Officer, Treasurer and Assistant Secretary. Prior to our formation, she served as Controller, Treasurer and Assistant Secretary with Stallion Oilfield Holdings GP, LLC, the general partner of our predecessor, since August 2003. From September 2002 to August 2003, Ms. Guidry served as Financial Reporting Manager for 3TEC Energy Services, Inc., a publicly traded company. From April 2002 to September 2002, Ms. Guidry served as Director of Financial Reporting of Q Services, Inc., which was acquired by Key Energy Services, Inc. in July 2002. From September 1996 through April 2002, Ms. Guidry was with Arthur Andersen where she worked on a variety of audits for numerous oil and gas companies. Ms. Guidry is a CPA and earned her Bachelor of Science (Accounting) degree from Louisiana Tech University.
72
Table of Contents
Index to Financial Statements
N. John Lancaster, Jr. Mr. Lancaster has served as one of our directors since our formation in June 2006. Prior to our formation, he served as a director of Stallion Oilfield Holdings GP, LLC, the general partner of our predecessor, since January 2005. Mr. Lancaster is a Managing Director of Riverstone Holdings, LLC (“Riverstone”), an affiliate of Carlyle/Riverstone. Prior to joining Riverstone in 2000, Mr. Lancaster was a Director with The Beacon Group, LLC, a privately held firm specializing in principal investing and strategic advisory services in the energy and other industries. Prior to Beacon, Mr. Lancaster was a Vice President with Credit Suisse First Boston’s Natural Resources Group. Mr. Lancaster received his BBA from the University of Texas at Austin and his MBA from Harvard Business School. Mr. Lancaster serves on the boards of directors (or equivalent governing bodies) of Frontier Drilling ASA, International Logging, Inc., Red Technology Alliance, LLC, Moreno Group Holdings, LLC, Titan Specialties, Ltd. and 4Gas International. Mr. Lancaster was nominated pursuant to the Nominating Agreement.
Pierre F. Lapeyre, Jr. Mr. Lapeyre has served as one of our directors since our formation in June 2006. Prior to our formation, he served as a director of Stallion Oilfield Holdings GP, LLC, the general partner of our predecessor, since January 2005. Mr. Lapeyre is a founder and Senior Managing Director of Riverstone. Prior to founding Riverstone in 2000, Mr. Lapeyre was a Managing Director of Goldman, Sachs & Co. in its Global Energy & Power Group. While at Goldman, Sachs, Mr. Lapeyre’s responsibilities included client coverage and leading the execution of a wide variety of M&A, IPO, strategic advisory and capital markets financings for clients across all sectors of the industry, and he was involved extensively in the origination and execution of energy private equity investments on behalf of the firm. Mr. Lapeyre received his BS in finance/economics from the University of Kentucky and his MBA from the University of North Carolina at Chapel Hill. Mr. Lapeyre serves on the boards of directors (or equivalent governing bodies) of SemGroup, L.P., Legend Natural Gas, LP, Legend Natural Gas II, LP, Legend Natural Gas III, LP, CDM Resource Management, Ltd., Topaz Power Group, LLC, Cobalt International Energy, L.P., Phoenix Exploration Company LP, Frontier Drilling ASA, 4Gas International, Targe Energy LLC, Coastal Carolina Clean Power, LLC, Moreno Group Holdings, LLC, Titan Specialties, Ltd., Niska GS Holdings I, L.P. and Niska GS Holdings II, L.P. Mr. Lapeyre was nominated pursuant to the Nominating Agreement.
Board of Directors
Our board of directors currently consists of four members. In compliance with the requirements of the Sarbanes-Oxley Act of 2002, the rules of The Nasdaq Stock Market LLC and SEC rules and regulations, a majority of the directors on our corporate governance and nominating and compensation committees will be independent within 90 days of quotation on The NASDAQ Stock Market LLC and, within one year, these committees will be fully independent and a majority of our board will be independent. A majority of the directors on our audit committee will be independent within 90 days of the effectiveness of the registration statement and, within one year, the committee will be fully independent.
Committees
Audit Committee
We will have an audit committee comprised of three independent directors, as defined under and required by the federal securities laws and the rules of The Nasdaq Stock Market LLC. One member of the audit committee will be designated as the audit committee financial expert, as defined by Item 401(h) of Regulation S-K of the Securities Exchange Act of 1934, as amended. The audit committee will be responsible for reviewing our external financial reporting, engaging our independent auditors and reviewing procedures for internal auditing and the adequacy of our internal accounting controls.
Our board of directors will adopt a written charter for the audit committee which will be available on our website.
73
Table of Contents
Index to Financial Statements
Corporate Governance and Nominating Committee
We will establish a corporate governance and nominating committee consisting of independent directors after the closing of this offering. The principal duties of the corporate governance and nominating committee will be as follows:
| • | to recommend to the board of directors proposed nominees for election to the board of directors by the stockholders at annual meetings, including an annual review as to the renominations of incumbents and proposed nominees for election by the board of directors to fill vacancies that occur between stockholder meetings; and |
| • | to make recommendations to the board of directors regarding corporate governance matters and practices. |
Our board of directors will adopt a written charter for the corporate governance and nominating committee which will be available on our website.
We are a party to the Nominating Agreement. Please read “Certain Relationships and Related Party Transactions—Nominating Agreement” for additional information about the Nominating Agreement.
Compensation Committee
Following the completion of this offering, we will establish a compensation committee comprised of independent directors. The compensation committee will administer our stock plans and incentive compensation plans, including our 2007 Stock Incentive Plan, and in this capacity will make all option grants or awards to our non-independent directors and employees under such plans. In addition, the compensation committee will be responsible for making recommendations to the board of directors with respect to the compensation of our chief executive officer and our other executive officers and for establishing compensation and employee benefit policies.
Our board of directors will adopt a written charter for the compensation committee which will be available on our website.
Compensation Committee Interlocks and Insider Participation
None of our executive officers serve as a member of the board of directors or compensation committee of any entity that has one or more of its executive officers serving as a member of our board of directors or compensation committee.
Compensation Discussion and Analysis
We were formed as a Delaware corporation in June 2006 and will commence business operations upon completion of the Restructuring. Consequently, our executive officers were not specifically compensated for time expended with respect to our business during 2006. In connection with this offering, we will succeed to the business and operations of Stallion Ltd. The executive officers of Stallion Ltd. are also serving as our executive officers and will continue to serve as our executive officers following the Restructuring. For 2006, the Compensation Committee (the “Committee”) of Stallion Oilfield Holdings GP, LLC (“Holdings GP”), the general partner of Stallion Ltd., approved compensation for Stallion Ltd.’s executive officers. The following analysis discusses the compensation objectives and decisions of the Committee with respect to compensation paid to Stallion Ltd.’s executive officers in 2006. Following this offering, the Compensation Committee of our Board of Directors will determine the objectives, philosophy and procedures for our compensation program, which we expect will be similar to the objectives and philosophy instituted by the Committee, except that we expect our compensation program will have a greater focus on long-term incentives through equity awards.
The following analysis contains statements regarding future individual and company performance targets and goals. These targets and goals are disclosed in the limited context of Stallion Ltd.’s executive compensation
74
Table of Contents
Index to Financial Statements
program and should not be understood to be statements of management’s expectations or estimates of results or other guidance. We specifically caution investors not to apply these statements to other contexts.
Overview of Executive Compensation Program
Stallion Ltd.’s success is contingent on its ability to recruit, develop, motivate and retain top executive talent with the requisite skills and experience to develop, expand and execute its business strategy. As a result, Stallion Ltd. seeks to deliver fair and competitive compensation for its executive officers by structuring its executive compensation program principally around two goals. First, it targets compensation at competitive market levels. Second, it believes its executive officers should be rewarded for executing goals designed to generate returns for its unitholders but not for poor performance. As a result, it ties selected elements of its executive compensation program to individual and company performance goals.
The Chief Executive Officer (“CEO”) annually reviews the performance of the Chief Financial Officer (“CFO”) and Chief Operating Officer (“COO”). The Committee evaluates the performance of all executive officers including the CEO, CFO and COO. The information and recommendations based on the CEO’s review, including base salary adjustments and annual cash incentive award amounts, are presented to the Committee. The Committee can exercise its discretion in modifying any recommended adjustments or awards prior to presenting to the full Board for approval.
Throughout this Compensation Discussion and Analysis and related tables, the individuals who served as Stallion’s Ltd.’s CEO and CFO during the fiscal year ended December 31, 2006, as well as the other individuals included in the Summary Compensation Table, are referred to as “Named Executive Officers.”
Objectives of Our Executive Compensation Program
Holdings GP has developed an executive compensation program that is designed to (1) recruit, develop and retain key executive officers responsible for Stallion Ltd.’s success and (2) motivate management to enhance long-term unitholder value. To that end, the Committee bases its executive compensation decisions on the following objectives:
| • | Compensation should reflect the value of the officer’s job in the marketplace. To recruit, develop and retain a highly skilled work force, Stallion Ltd. must remain competitive with the pay of other employers who compete with it for talent. |
| • | Compensation should be based on the level of job responsibility as well as individual and company performance. As employees progress to higher levels in Stallion Ltd.’s organization, an increasing proportion of their pay should be linked to company performance and unitholder returns, rather than individual performance, because they are in a position to have greater influence on company results. |
| • | Compensation should reward performance. Stallion Ltd.’s programs should deliver higher compensation given top-tier individual and company performance; likewise, where individual performance falls short of expectations and/or Stallion Ltd.’s performance lags the industry, its executive compensation program should deliver lower compensation. In addition, the objectives of pay-for-performance and retention must be balanced. Even in periods of temporary downturns in company performance, the executive compensation program should continue to ensure that successful, high-achieving employees will remain motivated and committed to Stallion Ltd. |
The Committee has established a number of processes to assist it in ensuring that Stallion Ltd.’s executive compensation program is achieving these objectives. Among those are:
| • | Competitive Benchmarking.The Committee reviews information provided in an annual internal analysis conducted by David S. Schorlemer, Stallion Ltd.’s CFO, regarding relevant market data for compensation of its executive officers. Mr. Schorlemer’s analysis provides insight into base pay levels, |
75
Table of Contents
Index to Financial Statements
cash and non-cash bonus payments, the scope of duties for individuals by pay level and compensation levels by company size, performance and strategy. This analysis allows the Committee to track and benchmark its executive compensation program with a group of peer companies (“Peer Companies”) in the oilfield services sector of the oil and gas industry. The Peer Companies were selected based on the following characteristics: (i) compensation information for the company is publicly, or otherwise, available for review, (ii) the company has grown through acquisitions, (iii) the company employs a strategy similar to that of Stallion Ltd. and/or (iv) the company operates in service lines similar to those in which Stallion Ltd. operates. |
In 2006, Stallion Ltd.’s group of Peer Companies included: Superior Energy Services, Inc.; W. H. Energy Services Inc.; Oil States International, Inc.; Tetra Technologies Inc.; and Complete Production Services, Inc.
Generally, the Committee uses the data on the Peer Companies primarily to ensure that its executive compensation program as a whole is competitive, meaning generally within the range of pay offered by the Peer Companies, when Stallion Ltd. achieves the targeted performance levels.
| • | Assessment of Individual and Company Performance. The Committee has established specific company performance measures that determine the size of incentive payouts for Stallion Ltd.’s executive officers. In addition, a portion of the incentive bonuses are based on informal evaluations of individual performance. These performance measures are discussed in more detail below. |
| • | Total Compensation Review. Each December, the Committee reviews each executive officer’s base pay and annual cash incentives. In addition to these primary compensation elements, the Committee periodically reviews perquisites and other compensation, as well as post-termination payments that would be required under the Company’s employment agreements. Following the 2006 review, the Committee determined that these elements of compensation were reasonable in the aggregate. |
Elements of Our Executive Compensation Program
The Committee evaluates both performance and compensation to ensure that Stallion Ltd. maintains its ability to attract and retain superior employees in key positions and that compensation provided to its key employees remains competitive relative to the compensation paid to similarly situated executive officers of Stallion Ltd.’s Peer Companies. In furtherance of these goals, the executive compensation program consists of three basic components:
| • | base salary; |
| • | annual cash incentive; and |
| • | termination benefits. |
Base Salaries
Stallion Ltd. provides its executive officers and other employees with an annual base salary to compensate them for services rendered during the year. Its goal is to set base salaries for its executive officers at levels that are competitive with comparable companies for the skills and requirements of similar positions. To achieve this goal, the Committee uses benchmarking as previously discussed. In addition, the Committee considers the officer’s responsibilities, experience, leadership, potential future contribution and demonstrated individual performance as well as Stallion Ltd.’s cash flows, earning levels and progress in implementing its business strategy in establishing increases in base salaries for Stallion Ltd.’s executive officers.
Annual Cash Incentive Awards
At the core of Stallion Ltd.’s executive compensation philosophy is a belief that pay should be linked directly to performance. Accordingly, it has adopted a set of performance measurements that are designed to
76
Table of Contents
Index to Financial Statements
provide specific goal-oriented incentives to its executive officers and to tie the annual cash incentive compensation of those officers to individual and company performance guidelines. In adopting the performance measures, the Committee and Stallion Ltd.’s Board determined that such measures should be based on a subjective and discretionary formula to recognize the company’s strategy of rapid growth, the achievement of which may not result in short-term improvements conducive to an objective or formula-driven plan. The subjective measures considered by the Committee are the executive officer’s overall duties, responsibilities and expertise as well as the officer’s role in accomplishing Stallion Ltd.’s non-financial goals, including capital deployment, capital efficiency, capital structure management, growth, acquisition integration, financial controls, reporting efficiency, safety performance and employee retention. The subjective measures are aimed at recognizing performance and achievements that are difficult to quantify, such as the successful supervision of major corporate projects, demonstrated leadership ability and contributions to the industry and community development. Company performance metrics are based on metrics the Committee believes would be used by management of a public company to evaluate performance. Payment amounts and recommendations for Stallion Ltd.’s executive officers are presented to the Committee by the CEO along with the performance measures and results. Cash awards for all executive officers are determined by the Committee and presented to the Board for approval. The Committee and Stallion Ltd.’s Board informally reviews each executive officer, including the CEO, throughout the year. Based on these informal reviews, the Committee recommends performance payouts for the executive officers.
Each component of the performance guidelines is measured by its relative importance and a percentage of the executive officer’s salary has been targeted based on the possible grades in each category. Possible results are Entry, Expected and Exceed, with specific performance targets identified for each grade. Annual performance with results below “Entry” for each performance component yields no annual cash incentive for the executive officer. Results of “Exceed” for all components would yield an annual cash incentive award equal to 125% of base salary.
The performance components chosen for the fiscal year ended December 31, 2006, and the corresponding payout level as a percentage of the available payout amount, are set forth in the table below.
Performance Achieved | Earnings (25%) | Return on Equity (30%) | Individual Performance (45%) | ||||||
Exceed | 125 | % | 125 | % | 125 | % | |||
Expected | 85 | % | 85 | % | 85 | % | |||
Entry | 50 | % | 50 | % | 50 | % |
With respect to the Earnings and Return on Equity components, Stallion Ltd. achieved “Exceed” performance for 2005 and achieved “Expected” performance for 2006. With respect to the Individual Performance component, our CEO, CFO and COO each achieved “Expected” performance for 2005 and each achieved “Exceed” performance for 2006.
We appointed Jennifer Guidry as our Chief Accounting Officer (“CAO”) in February 2007. For 2006, only Entry and Expected bonus grades were applicable for Ms. Guidry, with a potential bonus of 30% of base salary for the Entry category and 60% of base salary for the Expected category. The bonus components for Ms. Guidry were Earnings, Financial Reporting Efficiency and Individual Performance weighted 25%, 50% and 25%, respectively. Ms. Guidry achieved Expected performance for the Earnings, Financial Reporting Efficiency and Individual Performance components for 2006.
The performance measures are annually reviewed and updated and amended as the Committee deems necessary. The Committee also determines whether the performance measures and standards are appropriate for Stallion Ltd.and whether the full range of possible payouts makes sense relative to each applicable performance measure, as well as total compensation. Also, the Committee reviews potential results of the subjective
77
Table of Contents
Index to Financial Statements
performance measures and determines whether or not the guidelines being tied to an individual’s annual salary are appropriate.
TerminationBenefits
Please see “Executive Compensation—Potential Payments Upon Termination or Change in Control” for a discussion of termination benefits payable to the Names Executive Officers pursuant to their employment agreements with Stallion Ltd.
Other Benefits
In addition to base pay, annual cash incentives and termination benefits, Stallion Ltd. provides the following forms of compensation:
| • | 401(k) Savings Plan Matching.Stallion Ltd. has a defined contribution profit sharing plan designed to assist eligible officers and employees in providing for their retirement. Stallion Ltd. matches the contributions of all of its employees to the plan in cash, up to a maximum of 3% of eligible deferral. Employees become 100% vested in company contributions upon completion of three years of service. |
| • | Health and Welfare Benefits. Stallion Ltd.’s executive officers are eligible to participate in medical, dental, vision, disability insurance and life insurance to meet their health and welfare needs. These benefits are provided so as to assure that Stallion Ltd. is able to maintain a competitive position in terms of attracting and retaining officers and other employees. This is a fixed component of compensation and the benefits are provided on a non-discriminatory basis to all employees. |
| • | Perquisites.Stallion Ltd. doesnot provide significant perquisites or personal benefits to its executive officers. To the extent perquisites or other personal benefits are provided, they are determined on an individual basis as appropriate in light of competitive standards and the performance of the executive officers. |
Other Matters
Long-Term Equity-Based Incentives
Stallion Ltd. does not grant options or restricted units to its employees and did not grant options or restricted units to its Named Executive Officers in 2006. Stallion Ltd. has not adopted an equity-based incentive plan and during 2006 Stallion Ltd. did not make any equity grants to its executive officers.
Unit Ownership Guidelines and Hedging Prohibition
Unit ownership guidelines have not been implemented by the Committee for Stallion Ltd.’s executive officers. In addition, Stallion Ltd. does not have a policy that restricts its executive officers from limiting their economic exposure to the price of its units. Stallion Ltd. periodically reviews best practices and re-evaluates its position with respect to unit ownership guidelines and hedging prohibitions.
Tax Treatment of Executive Compensation Decisions
Holdings GP’s Board has not adopted a policy with respect to the limitation under Section 162(m) of the Internal Revenue Code, which generally limits a company’s ability to deduct compensation in excess of $1,000,000 to a particular executive officer in any year. The American Jobs Creation Act of 2004 changed the tax rules applicable to nonqualified deferred compensation arrangements. The Committee evaluates the potential impact of new rules impacting compensation.
78
Table of Contents
Index to Financial Statements
COMPENSATION COMMITTEE REPORT
The Board of Directors of Stallion Oilfield Services, Inc. has reviewed and discussed the disclosure set forth above under the heading “Compensation Discussion and Analysis” with our management and, based on the review and discussions, it has recommended that the “Compensation Discussion and Analysis” be included in this prospectus.
Respectfully submitted by the Board of Directors,
Craig M. Johnson
David S. Schorlemer
N. John Lancaster, Jr.
Pierre F. Lapeyre, Jr.
79
Table of Contents
Index to Financial Statements
EXECUTIVE COMPENSATION
Summary Compensation
The following table summarizes, with respect to the Named Executive Officers, information relating to the compensation earned for services rendered in all capacities to Stallion Ltd. The Named Executive Officers consist of Stallion Ltd.’s four current executive officers, including its Chief Executive Officer and Chief Financial Officer.
Summary Compensation for Year Ended December 31, 2006
Name and Principal Position | Year | Salary | Non-Equity | All Other Compensation(1) | Total | |||||
| ($) | ($) | ($) | ($) | |||||||
Craig M. Johnson | 2006 | 250,000 | 271,250 | 13,289 | 534,539 | |||||
David S. Schorlemer | 2006 | 225,000 | 244,125 | 15,733 | 484,858 | |||||
Hill Dishman | 2006 | 185,385 | 205,600 | 10,530 | 401,515 | |||||
Jennifer Guidry | 2006 | 114,831 | 62,000 | 13,613 | 190,444 | |||||
| (1) | For 2006 “All Other Compensation” includes the aggregate value of matching contributions to our 401(k) plan, the dollar value of life insurance coverage, health insurance, disability insurance, automobile benefits and all perquisites valued in the aggregate of $10,000 or more. |
Name | 401(k) Plan | Dollar Value of Life Insurance | Health Insurance | Disability Insurance | Automobile Benefits | Total | ||||||||||||
Craig M. Johnson | $ | 4,904 | $ | 650 | $ | 3,069 | $ | 830 | $ | 3,836 | $ | 13,289 | ||||||
David S. Schorlemer | 6,750 | 696 | 3,069 | 780 | 4,438 | 15,733 | ||||||||||||
Hill Dishman | 5,562 | 624 | 2,813 | 968 | 563 | 10,530 | ||||||||||||
Jennifer Guidry | 2,503 | 327 | 3,069 | 714 | 7,000 | 13,613 | ||||||||||||
Narrative Disclosure to Summary Compensation Table
The following is a discussion of material factors necessary to an understanding of the information disclosed in the Summary Compensation Table.
Appointment of Jennifer Guidry. On February 21, 2007, the Board of Directors of Holdings GP appointed Jennifer Guidry as Chief Accounting Officer. Ms. Guidry’s annual base salary is $135,000 and she is eligible to receive an annual bonus of up to 60% of her base salary.
Employment agreements. Stallion Ltd. has entered into a separate employment agreement with each of Messrs. Johnson, Schorlemer and Dishman (together the “Employees” and each an “Employee”), the initial term of which terminates on January 31, 2008 (together, the “Employment Agreements,” and each an “Employment
80
Table of Contents
Index to Financial Statements
Agreement”). Unless either party to an Employment Agreement gives notice of its intention not to renew prior to November 2, 2007, the term of such agreement will be automatically extended for successive one-year periods until notice is given by either party prior to November 2nd of any subsequent year that the term of employment will expire on January 31 of the following year. The Employment Agreements provide for an annual base salary of $250,000, $225,000 and $180,000 for each of Messrs. Johnson, Schorlemer and Dishman, respectively, subject to increase from time to time. Messrs. Johnson, Schorlemer and Dishman are also eligible to receive an annual discretionary performance bonus with respect to each calendar year during the term of their Employment Agreement to the extent such bonuses are declared by the Board of Holdings GP. Each Employee is also entitled to participate in all employee benefit plans and programs that we may provide from time to time.
In connection with Messrs. Johnson’s and Schorlemer’s employment agreements, each of Mr. Johnson and Mr. Schorlemer indirectly received 600,000 Class E Units representing limited partnership interests of our predecessor. In addition, Mr. Johnson indirectly received 7,653,061 Class F Units representing limited partnership interests of our predecessor.
In connection with Mr. Dishman’s employment agreement, Mr. Dishman indirectly received 300,000 Class E Units representing limited partnership interests of our predecessor.
The Class E Units were granted directly to Stallion Value, L.P, in which Messrs. Johnson, Schorlemer and Dishman and certain of our other employees own interests.
Stallion Value, L.P. Stallion Value, L.P. (“Stallion Value”) owns all the E Units of Stallion Ltd. The partnership interests in Stallion Value are divided into two classes: E-1 and E-2 Units. Class E-1 and Class E-2 Units have the same rights and preferences, except that Class E-1 Units are entitled to receive a preferential distribution prior to any distributions to Class E-2 Units. The Class E-1 Units are held by Messrs. Johnson, Schorlemer and Dishman and other partners in Stallion Value that received units in Stallion Value early in Stallion Ltd.’s formation. The preferential distribution will be an amount of cash or property with a value of $1/Class E-1 Unit. The preferential distribution will be made to each Class E-1 unitholder in the proportion of his or her Class E-1 Units over the aggregate number of Class E-1 Units held by all Class E-1 unitholders. Further distributions from Stallion Ltd. to its partners after the preferential distribution has been made to the Class E-1 unitholders will be made to all of the unitholders of Stallion Value in the ratio of each such unitholder’s Class E-1 and Class E-2 Units divided by the aggregate number of Class E-1 and Class E-2 Units held by all unitholders. At or prior to this initial public offering, the Class E-1 unitholders will contribute their rights in and to Class E-1 Units to us in exchange for shares of our common stock which will have a value (based on the offering price to the public) equal to the preferential distribution.
2007 Stock Incentive Plan
We currently anticipate that, prior to the consummation of this offering, the Company’s board of directors and stockholders will adopt the 2007 Stock Incentive Plan (the “Plan”). The principal purpose of the Plan will be to promote our success, enhance our value, and attract, retain and motivate selected employees, consultants and directors through the granting of stock-based compensation awards. The Plan will provide for a variety of such incentive awards, including nonstatutory stock options, incentive stock options (within the meaning of Section 422 of the Internal Revenue Code, or the “Code”), stock appreciation rights, restricted stock awards, restricted stock unit awards, performance-based awards, and other stock-based awards. We currently anticipate that shares of the Company’s common stock will be reserved for issuance under the Plan.
Administration
Prior to the consummation of this offering, the Plan will be administered by the committee appointed by the Company’s board of directors. Upon and following the consummation of this offering, the Plan will be administered by a compensation committee of the board of directors. The board of directors, or the compensation
81
Table of Contents
Index to Financial Statements
committee if so empowered, has the authority to interpret the Plan and to adopt such rules for the administration, interpretation and application of the Plan according to its terms. However, the board of directors may not delegate, to the compensation committee or otherwise, the power to grant awards to independent directors.
Grant of Awards
Certain employees, consultants and directors will be eligible to be granted awards under the Plan. The Company’s board of directors, or the compensation committee if so empowered, will determine:
| • | which employees, consultants and directors are to be granted awards; |
| • | the type of award that is granted (only employees can be granted incentive stock options under Code Section 422); |
| • | the number of shares subject to the awards; and |
| • | terms and conditions of each award, as consistent with the Plan. |
Under the Plan, performance-based awards are intended to comply with the requirements of Code Section 162(m), in order to allow those awards, when payable, to be fully tax deductible by the Company.
Expiration of Stock Options
The term of an option will be set by the Company’s board of directors, or the compensation committee if so empowered, subject to the following conditions: (1) no option term will be longer than ten years from the date of grant; and (2) the option term for an incentive stock option granted to an employee owning more than 10% of the total combined voting power of all classes of the Company’s capital stock will not exceed five years from the date of grant. Upon termination of an outstanding option holder’s services, the holder may exercise his or her options within the time period specified in the option grant, to the extent that the options were vested as of the termination date.
Adjustments of Awards
If the Company shall effect any stock dividend, stock split, subdivision, consolidation, recapitalization, or other capital readjustment, without receiving compensation therefor, then the number of outstanding shares under the Plan and the option price or fair market value of awards shall be proportionately adjusted.
The board of directors, or the compensation committee if so empowered, shall take such action as it deems appropriate in order that the value of each outstanding award shall not be adversely affected by any of these events.
Amendment or Termination
The board of directors may generally amend or terminate the Plan at any time; however, the board must generally obtain approval of the shareholders: (i) to increase the number of shares of common stock that may be issued under the Plan; (ii) to amend the group of employees eligible for awards under the Plan; (iii) to extend the term of the Plan; (iv) to increase the per person limits on awards intended to qualify for the performance-based exception; or (v) to the extent otherwise required by applicable law, rule or regulation.
Potential Payments Upon Termination or Change in Control
Under the Employment Agreements, if an Employee’s employment is terminated (other than during any 12-month period following any Change of Control (as such term is defined in the Employee’s Employment Agreement)) (1) by the Employee for Good Reason (as defined in the Employee’s Employment Agreement), (2)
82
Table of Contents
Index to Financial Statements
by us for any reason other than for Cause (as such term is defined in the Employee’s Employment Agreement) or (3) because we do not extend the Employee’s term (and with respect to a non-extension of the Employee’s term, the Employee complies with the provisions relating to non-competition, non-disclosure of proprietary information, and inventions), the Employee will be entitled to receive the following benefits, subject to the non-compete, confidentiality and inventions provisions, and provided that the Employee executes a general waiver and release:
(A) an amount equal to the Employee’s annual base salary accrued through the date of termination and not previously paid plus any reimbursable expenses paid by and owed to the Employee plus any accrued vacation pay owed to the Employee and any accrued vested benefits under our employee benefit plans, programs and arrangements (which shall be payable in accordance with the terms and conditions of such employee benefit plans, programs or arrangements);
(B) an amount equal to the Employee’s annual base salary that the Employee would have received if he had continued his employment under his Employment Agreement for a period equal to the greater of 24 months following the date of termination and the remainder of the Employee’s term under his Employment Agreement; and
(C) an amount equal to any earned portion of the Employee’s annual bonus for the completed year preceding the date of termination that remains unpaid.
Under the Employment Agreements, if during the 12-month period immediately following a Change of Control, an Employee’s employment is terminated by the Employee for Good Reason or by us for any reason other than for Cause, the Employee will be entitled to receive the following benefits, subject to the non-compete and confidentiality provisions, and provided that the Employee executes a general waiver and release:
(A) an amount equal to the Employee’s annual base salary accrued through the date of termination and not previously paid plus any reimbursable expenses paid by and owed to the Employee plus any accrued vacation pay owed to the Employee and any accrued vested benefits under our employee benefit plans, programs and arrangements (which shall be payable in accordance with the terms and conditions of such employee benefit plans, programs or arrangements);
(B) an amount equal to three times his annual base salary;
(C) an amount equal to any earned portion of the Employee’s annual bonus for the completed year preceding the date of termination that remains unpaid; and
(D) continued coverage for the Employee and his dependents under our health benefit plans until the earlier date of the Employee’s coverage under another employee benefit plan or 18 months after the date of termination.
The disclosure that follows delineates the amount of compensation and other benefits due to Messrs. Johnson, Schorlemer and Dishman in the event of their termination of employment, including, but not limited to, in connection with a Change in Control of the Company. The amounts shown assume that such termination was effective as of December 31, 2006, and thus includes amounts earned through such time and are estimates of the amounts which would be paid out to the executives upon their respective termination. In addition, in the case of a qualifying termination within 12 months after a Change of Control, the amounts shown assume continued coverage under our health benefit plans for 18 months after the date of termination. The actual amounts to be paid out can only be determined at the time of such executive’s separation from the Company.
A summary of the potential payments and benefits upon a qualifying termination (other than a termination during the 12-month period immediately following a Change of Control) is as follows:
1. Craig M. Johnson: $505,479 in cash.
2. David S. Schorlemer: $454,932 in cash.
3. Hill Dishman: $404,384 in cash.
83
Table of Contents
Index to Financial Statements
A summary of the potential payments and benefits upon a qualifying termination during the 12-month period immediately following a Change of Control is as follows:
1. Craig M. Johnson: $755,479 in cash; $3,069 in health benefit plan continuation coverage.
2. David S. Schorlemer: $679,932 in cash; $3,069 in health benefit plan continuation coverage.
3. Hill Dishman: $604,384 in cash; $2,813 in health benefit plan continuation coverage.
Under the terms of the Employment Agreements, subject to certain exceptions, during their employment and for 24 months following the termination of their employment, the Employees may not compete in the markets in which we and our affiliates engage in business or planned to engage in business as of the date of termination.
DIRECTOR COMPENSATION
Compensation of Directors of Holdings GP
The directors of Holdings GP did not receive compensation for their services as directors of Holdings GP during 2006. In connection with this offering, our Compensation Committee will approve the cash retainer fees, meeting fees and equity awards that will be provided to our directors, which compensation is described below. We expect that directors who are our full-time employees will receive no compensation for serving as directors.
Compensation of Directors of the Company
Directors who are our employees do not receive a retainer or fees for service on the board or any committees. Following this offering, we expect to pay non-employee members of the board for their service as directors. Directors who are not employees are expected to receive a fee of $ for each board meeting attended in person, and a fee of $ for attendance at a meeting held telephonically. In addition, each non-employee director is expected to receive, upon election to the board, a stock option to purchase shares of our common stock at the market price on the date of grant that vests ratably over three years. Directors are reimbursed for reasonable out-of-pocket expenses incurred in attending meetings of the board or committees and for other reasonable expenses related to the performance of their duties as directors.
Employment Agreements
We have entered into a separate employment agreement with each of Messrs. Johnson, Schorlemer and Dishman (together the “Employees,” and each an “Employee”), the initial term of which terminates on January 31, 2008 (together, the “Employment Agreements,” and each an “Employment Agreement”). Unless either party to an Employment Agreement gives notice of its intention not to renew prior to November 2, 2007, the term of such agreement will be automatically extended for successive one-year periods until notice is given by either party prior to November 2 of any subsequent year that the term of employment will expire on January 31 of the following year. Messrs. Johnson’s, Schorlemer’s and Dishman’s annual base salaries are $250,000, $225,000 and $180,000, respectively, subject to increase at the discretion of our board of directors, and they will be eligible to receive an annual bonus, if any, as determined by our board of directors, taking into account our profitability and each Employee’s performance during that calendar year. Each Employee is also entitled to participate in all employee benefit plans and programs that we may provide from time to time.
In connection with Messrs. Johnson’s and Schorlemer’s employment agreements, each of Mr. Johnson and Mr. Schorlemer indirectly received 600,000 Class E Units representing limited partnership interests of our predecessor. In addition, Mr. Johnson indirectly received 7,653,061 Class F Units representing limited partnership interests of our predecessor.
In connection with Mr. Dishman’s employment agreement, Mr. Dishman indirectly received 300,000 Class E Units representing limited partnership interests of our predecessor.
The Class E Units were granted directly to Stallion Value, L.P, in which Messrs. Johnson, Schorlemer and Dishman and certain of our other employees own interests.
84
Table of Contents
Index to Financial Statements
Upon the closing of the Restructuring, the Class E Units and the Class F Units will be converted into shares of our common stock. Upon this conversion, Messrs. Johnson, Schorlemer and Dishman will receive , and shares of our common stock, respectively. In connection with the closing of this offering, these shares will no longer be subject to the forfeiture restrictions that previously encumbered the Class E Units and the Class F Units.
Under the Employment Agreements, if an Employee’s employment is terminated (other than during any 12 month period following any Change of Control (as such term is defined in the Employee’s Employment Agreement)) (1) by the Employee for Good Reason (as defined in the Employee’s Employment Agreement), (2) by us for any reason other than for Cause (as such term is defined in the Employee’s Employment Agreement) or (3) because we do not extend the Employee’s term (and with respect to a non-extension of the Employee’s term, the Employee complies with the provisions relating to non-competition, non-disclosure of proprietary information, and inventions), the Employee will be entitled to receive the following benefits, subject to the non-compete, confidentiality and inventions provisions, and provided that the Employee executes a general waiver and release:
(A) an amount equal to the Employee’s annual base salary accrued through the date of termination and not previously paid plus any reimbursable expenses paid by and owed to the Employee plus any accrued vacation pay owed to the Employee and any accrued vested benefits under our employee benefit plans, programs and arrangements (which shall be payable in accordance with the terms and conditions of such employee benefit plans, programs or arrangements),
(B) an amount equal to the Employee’s annual base salary that the Employee would have received if he had continued his employment under his Employment Agreement for a period equal to the greater of 24 months following the date of termination and the remainder of the Employee’s term under his Employment Agreement,
(C) an amount equal to any earned portion of the Employee’s annual bonus for the completed year preceding the date of termination that remains unpaid, and
(D) certain unvested Class E and/or Class F Units will become fully vested.
Under the Employment Agreements, if during the 12-month period immediately following a Change of Control, an Employee’s employment is terminated by the Employee for Good Reason or by us for any reason other than for Cause, the Employee will be entitled to receive the following benefits, subject to the non-compete and confidentiality provisions, and provided that the Employee executes a general waiver and release:
(A) an amount equal to the Employee’s annual base salary accrued through the date of termination and not previously paid plus any reimbursable expenses paid by and owed to the Employee plus any accrued vacation pay owed to the Employee and any accrued vested benefits under our employee benefit plans, programs and arrangements (which shall be payable in accordance with the terms and conditions of such employee benefit plans, programs or arrangements),
(B) an amount equal to three times his annual base salary,
(C) an amount equal to any earned portion of the Employee’s annual bonus for the completed year preceding the date of termination that remains unpaid,
(D) continued coverage for the Employee and his dependents under our health benefit plans until the earlier date of the Employee’s coverage under another employee benefit plan or 18 months after the date of termination, and
(E) certain unvested Class E and/or Class F Units will become fully vested.
85
Table of Contents
Index to Financial Statements
Under the terms of the Employment Agreements, subject to certain exceptions, during their employment and for 24 months following the termination of their employment, the Employees may not compete in the markets in which we and our affiliates engage in business or planned to engage in business as of the date of termination of each Employee’s respective employment.
Indemnification Agreements
We have entered into indemnification agreements with all of our directors and some of our officers under which we indemnify such persons against expenses (including attorneys’ fees), judgments, fines and amounts paid in settlement incurred as a result of the fact that such person, in his or her capacity as a director or officer, is made or threatened to be made a party to any suit or proceeding. These persons are indemnified to the fullest extent now or hereafter permitted by the General Corporation Law of the State of Delaware. The indemnification agreements also provide for the advancement of expenses to these directors and officers in connection with any suit or proceeding.
86
Table of Contents
Index to Financial Statements
CERTAIN RELATIONSHIPS AND RELATED PARTY TRANSACTIONS
The descriptions set forth below are qualified in their entirety by reference to the applicable agreements.
Offering By Selling Stockholders
We are paying the expenses of this offering by the selling stockholders, other than underwriting discounts, commissions and transfer taxes with respect to shares of our common stock sold by the selling stockholders. We have agreed to indemnify the selling stockholders against liabilities under the Securities Act, or contribute to payments that the selling stockholders may be required to make in that respect.
Registration Rights Agreement
Stallion and Carlyle/Riverstone are parties to a registration rights agreement (the “Registration Rights Agreement”).
Demand Registration Rights
Under the Registration Rights Agreement, at any time after 180 days following this offering, Carlyle/Riverstone has the right, subject to certain limitations, to demand on six occasions that we register all or any portion of their registrable securities so long as the registrable securities proposed to be sold on an individual registration statement have an aggregate gross offering price of at least $20.0 million. After such time as we become eligible to use Form S-3 (or comparable form) for the registration under the Securities Act of any securities, Carlyle/Riverstone may request that securities be registered on a delayed or continuous basis pursuant to Rule 415 under the Securities Act, provided that any such registration will be treated as two demand registrations.
Piggyback Registration Rights
If we propose to file a registration statement under the Securities Act relating to an offering of our common stock, upon the written request of Carlyle/Riverstone, we will include in such registration, and any related underwriting, all of the registrable securities included in such requests, subject to customary cutback provisions.
Registration Procedures and Expenses
The Registration Rights Agreement contains customary procedures relating to underwritten offerings and the filing of registration statements. We have agreed to pay all registration expenses incurred in connection with any registration, up to a total of six registrations, including all registration, qualification and filing fees, printing expenses, reasonable fees of one counsel to Carlyle/Riverstone, blue sky fees and expenses and the expense of any special audits incident to or required by any such registration. All underwriting discounts and selling commissions and stock transfer taxes applicable to securities registered by holders and fees of counsel to any such holder (other than as described above) will be payable by holders of registrable securities.
Nominating Agreement
We are party to a nominating agreement (the “Nominating Agreement”) with C/R Stallion Investment Partnership, L.P. (“Investment Partnership”). Pursuant to the Nominating Agreement, as long as Investment Partnership beneficially owns at least 30%, 20% or 10% of our issued and outstanding shares of common stock, we have agreed to take all corporate action within our power required to cause the board of directors at all times to include at least three, two or one member(s), respectively, designated by Investment Partnership. In addition, as long as Investment Partnership beneficially owns at least a majority of the aggregate amount of shares of common stock it held immediately following the Restructuring, we have agreed to take all corporate action
87
Table of Contents
Index to Financial Statements
within our power required to cause the board of directors at all times to include at least one member designated by Investment Partnership. In the event that such designees are not elected to our board of directors, Investment Partnership will have the right to appoint observers to our board of directors.
The Restructuring
We were formed as a Delaware corporation in June 2006. In connection with this offering, we will succeed to the business and operations of Stallion Ltd, which are described in this prospectus. Prior to the completion of this offering, Stallion Ltd will merge with and into Stallion Oilfield Services, Inc., with Stallion Oilfield Services, Inc. being the surviving corporate parent and owning all of the operating subsidiaries of Stallion Ltd. The majority owners of Stallion Ltd are Carlyle/Riverstone and an affiliate of Craig Johnson, our President, Chief Executive Officer and Chairman of the Board. Since the entities are under common ownership and control, the Restructuring will be accounted for at historical cost. In the Restructuring, assuming an initial public offering price of $ , which is the midpoint of the range set forth on the cover of this prospectus, the partners of Stallion Ltd will receive an aggregate of shares of our common stock in exchange for all of the Stallion Ltd partnership interests held by them. Immediately following completion of the Restructuring and prior to this offering, we will have shares of common stock outstanding, % of which will be owned by Carlyle/Riverstone and % of which will be owned by an affiliate of Craig Johnson.
Transactions with Our Significant Stockholder
The partnership agreement governing our predecessor required our predecessor to pay Carlyle/Riverstone an annual fee equal to 1% of our predecessor’s consolidated pro forma EBITDA for the provision of support services. Our obligation to pay this fee terminates upon the closing of our initial public offering.
In December 2006, Carlyle/Riverstone entered into a Contribution Agreement pursuant to which Carlyle/Riverstone agreed to acquire Class A partnership units in Stallion Oilfield Holdings, Ltd., our predecessor, for an aggregate investment of $125 million. Purchasers of units under the Contribution Agreement are subject to various conditions including approval of the board of the general partner of Stallion Oilfield Holdings, Ltd. As of December 31, 2006, $45 million has been funded under the Contribution Agreement. This investment arrangement will terminate upon completion of our initial public offering.
Transactions with Officers and Directors
Two of our directors, Mr. John Lancaster and Mr. Pierre Lapeyre, are affiliated with Riverstone, an affiliate of Carlyle/Riverstone.
Mr. Craig Johnson, our President, Chief Executive Officer and Chairman of the Board, was party to a promissory note with us pursuant to which we borrowed $7.3 million at an annual interest rate of 6% from Mr. Johnson. We repaid Mr. Johnson in full on January 31, 2005.
On November 30, 2006, we made certain loans aggregating $10 million to certain of our executive officers (Mr. Johnson—$6 million, Mr. Schorlemer—$2 million and Mr. Dishman—$2 million). These notes had a ten-year maturity but could be accelerated by us upon certain acceleration events including an initial public offering. The notes bore interest at a rate of 4.97% per year. The full principal amounts of these loans were repaid by Messrs Johnson, Schorlemer and Dishman along with related interest accrued since November 30, 2006 of $108,659, $36,220 and $36,220, respectively.
We lease an industrial facility in Alice, Texas from Q2 Rentals, L.L.C. for approximately $90,000 per year. Pursuant to an informal arrangement, we lease a houseboat and certain other recreational boats in coastal Louisiana on a month-to-month basis from Q2 Rentals in exchange for paying the operating expenses of the facilities which were approximately $160,000 for the year ended December 31, 2006. Q2 Rentals is operated by
88
Table of Contents
Index to Financial Statements
Mr. David M. Johnson, Mr. Craig Johnson’s father, and owned equally by Mr. Craig Johnson, Mr. Clayton D. Johnson, Mr. Craig Johnson’s brother, and Mr. David M. Johnson.
In addition, we lease a King-Air airplane from Permian Mud Service, Inc. and have entered into an operating agreement to operate the aircraft with ChampAir, L.L.C. We share in the operating expenses and pay direct expenses of approximately $600,000 annually. ChampAir is owned and operated by Permian Mud Service, Inc., of which Mr. David Johnson and our Chief Executive Officer, President and Chairman of the Board are minority shareholders. Our executive officers reimburse us for operating expenses associated with the personal use of the aircraft. The term of our lease for this plane expired on December 31, 2006, but is continuing on a month-to-month basis.
Prior to February 2007, we utilized a Pilatus single-engine airplane from Rivers Aviation, L.L.C. in connection with our solids control business. We had an arrangement to use this plane on a month-to-month basis which was cancellable by either party with 30 days notice. Under this agreement, we shared in the operating expenses and paid Rivers Aviation approximately $20,000 per month for the use of this aircraft. Rivers Aviation is owned by Fred Lausen, who was previously division manager of our solids control business. This agreement was terminated in February 2007.
It is customary for us to lease real property from the former owners of businesses that we acquire. It is typical for many of these former owners to be employed by us. Thus, we and certain of our employees may be parties to leases relating to real property.
All loans made to our executive officers have been repaid to us and we will not make loans to executive officers in the future. We believe that our other related party transactions were either on terms at least as favorable to us as could have been obtained through arm’s-length negotiations with unaffiliated third parties or were negotiated in connection with acquisitions, the overall terms of which were as favorable to us as could have been obtained through arm’s-length negotiations with unaffiliated third parties. We intend to address future material transactions with our affiliates by having the transactions approved by a committee of disinterested directors.
89
Table of Contents
Index to Financial Statements
PRINCIPAL AND SELLING STOCKHOLDERS
The following table sets forth information with respect to the beneficial ownership of our common stock as of December 31, 2006, assuming the Restructuring had taken place prior to such date, by:
| • | each person who is known by us to own beneficially 5% or more of our outstanding common stock; |
| • | our named executive officers; |
| • | our directors; and |
| • | all of our executive officers and directors as a group. |
Except as otherwise indicated, the person or entities listed below have sole voting and investment power with respect to all shares of our common stock beneficially owned by them, except to the extent this power may be shared with a spouse. Unless otherwise indicated, the address of each stockholder listed below is 410 Roberts Street, Houston, Texas 77003.
| Shares Beneficially Owned Prior to this Offering | Number of Shares Offered | Shares Beneficially Owned After this Offering | ||||||||
Name of Beneficial Owner | Number | % | Number | % | ||||||
C/R Stallion Investment Partnership, L.P.(1) | % | % | ||||||||
C/R Energy Coinvestment II, L.P.(1) | ||||||||||
Cardigan Holdings, Inc.(2) | ||||||||||
Craig M. Johnson | ||||||||||
David S. Schorlemer | ||||||||||
Hill Dishman | ||||||||||
Jennifer Guidry | ||||||||||
John Lancaster(1)(3) | ||||||||||
Pierre Lapeyre(1)(4) | ||||||||||
Directors and Executive Officers as a Group (6 persons)(2)(3)(4) | ||||||||||
| * | Less than 1%. |
| (1) | The address of this stockholder is c/o The Carlyle Group, 1001 Pennsylvania Avenue, N.W., Suite 200, Washington, D.C. 20004. |
| (2) | Craig M. Johnson is the natural person who has voting and investment control over the securities owned by Cardigan Holdings, Inc. Mr. Johnson serves as Chief Executive Officer and the sole stockholder of Cardigan Holdings, Inc. |
| (3) | Mr. Lancaster serves as a Managing Director of Riverstone, an affiliate of Carlyle/Riverstone. As such, Mr. Lancaster may be deemed to have voting and dispositive power over the shares beneficially owned by Carlyle/Riverstone. Mr. Lancaster disclaims beneficial ownership of the shares owned by Carlyle/Riverstone. |
| (4) | Mr. Lapeyre serves as a Senior Managing Director of Riverstone, an affiliate of Carlyle/Riverstone. As such, Mr. Lapeyre may be deemed to have voting and dispositive power over the shares beneficially owned by Carlyle/Riverstone. Mr. Lapeyre disclaims beneficial ownership of the shares owned by Carlyle/Riverstone. |
90
Table of Contents
Index to Financial Statements
Upon the completion of this offering, our authorized capital stock will consist of:
| • | shares of common stock, $0.01 par value; and |
| • | shares of preferred stock, $0.01 par value, none of which are currently designated. |
Upon the completion of this offering, shares of common stock and no shares of preferred stock will be outstanding.
The following summarizes the material provisions of our capital stock and important provisions of our certificate of incorporation and bylaws. This summary is qualified by our certificate of incorporation and bylaws, copies of which have been filed as exhibits to the registration statement of which this prospectus is a part and by the provisions of applicable law.
Common Stock
Holders of common stock are entitled to one vote per share on all matters to be voted upon by the stockholders. Because holders of common stock do not have cumulative voting rights, the holders of a majority of the shares of common stock can elect all of the members of the board of directors standing for election. The holders of common stock are entitled to receive dividends as may be declared by the board of directors. Upon our liquidation, dissolution or winding up, and subject to any prior rights of outstanding preferred stock, the holders of our common stock will be entitled to share pro rata in the distribution of all of our assets available for distribution to our stockholders after satisfaction of all of our liabilities and the payment of the liquidation preference of any preferred stock that may be outstanding. There are no redemption or sinking fund provisions applicable to the common stock. All outstanding shares of common stock are fully paid and non-assessable. The holders of our common stock will have no preemptive or other subscription rights to purchase our common stock.
Preferred Stock
Subject to the provisions of the certificate of incorporation and limitations prescribed by law, the board of directors will have the authority to issue up to shares of preferred stock in one or more series and to fix the rights, preferences, privileges and restrictions of the preferred stock, including dividend rights, dividend rates, conversion rates, voting rights, terms of redemption, redemption prices, liquidation preferences and the number of shares constituting any series or the designation of the series, which may be superior to those of the common stock, without further vote or action by the stockholders. We have no present plans to issue any shares of preferred stock.
One of the effects of undesignated preferred stock may be to enable the board of directors to render more difficult or to discourage an attempt to obtain control of us by means of a tender offer, proxy contest, merger or otherwise, and, as a result, protect the continuity of our management. The issuance of shares of the preferred stock under the board of directors’ authority described above may adversely affect the rights of the holders of common stock. For example, preferred stock issued by us may rank prior to the common stock as to dividend rights, liquidation preference or both, may have full or limited voting rights and may be convertible into shares of common stock. Accordingly, the issuance of shares of preferred stock may discourage bids for the common stock or may otherwise adversely affect the market price of the common stock.
Provisions of Our Certificate of Incorporation and Bylaws
Written Consent of Stockholders
Our certificate of incorporation and bylaws provide that any action required or permitted to be taken by our stockholders must be taken at a duly called meeting of stockholders and not by written consent.
91
Table of Contents
Index to Financial Statements
Amendment of the Bylaws
Under Delaware law, the power to adopt, amend or repeal bylaws is conferred upon the stockholders. A corporation may, however, in its certificate of incorporation also confer upon the board of directors the power to adopt, amend or repeal its bylaws. Our charter and bylaws grant our board the power to adopt, amend and repeal our bylaws on the affirmative vote of a majority of the directors then in office. Our stockholders may adopt, amend or repeal our bylaws but only at any regular or special meeting of stockholders by the holders of not less than of the voting power of all outstanding voting stock.
Special Meetings of Stockholders
Our bylaws preclude the ability of our stockholders to call special meetings of stockholders.
Other Limitations on Stockholder Actions
��
Advance notice is required for stockholders to nominate directors or to submit proposals for consideration at meetings of stockholders. In addition, the ability of our stockholders to remove directors without cause is precluded.
Limitation of Liability of Officers and Directors
Our certificate of incorporation provides that no director shall be personally liable to us or our stockholders for monetary damages for breach of fiduciary duty as a director, except for liability as follows:
| • | for any breach of the director’s duty of loyalty to us or our stockholders; |
| • | for acts or omissions not in good faith or which involve intentional misconduct or a knowing violation of laws; |
| • | for unlawful payment of a dividend or unlawful stock purchase or stock redemption; and |
| • | for any transaction from which the director derived an improper personal benefit. |
The effect of these provisions is to eliminate our rights and our stockholders’ rights, through stockholders’ derivative suits on our behalf, to recover monetary damages against a director for a breach of fiduciary duty as a director, including breaches resulting from grossly negligent behavior, except in the situations described above.
Business Combination Under Delaware Law
We are subject to the provisions of Section 203 of the Delaware General Corporation Law. In general, Section 203 prohibits a publicly held Delaware corporation from engaging in a “business combination” with an “interested stockholder” for a period of three years after the date of the transaction in which the person became an interested stockholder, unless the business combination is approved in a prescribed manner.
Section 203 defines a “business combination” as a merger, asset sale or other transaction resulting in a financial benefit to the interested stockholders. Section 203 defines an “interested stockholder” as a person who, together with affiliates and associates, owns, or, in some cases, within three years prior, did own, 15% or more of the corporation’s voting stock. Under Section 203, a business combination between us and an interested stockholder is prohibited unless:
| • | our board of directors approved either the business combination or the transaction that resulted in the stockholders becoming an interested stockholder prior to the date the person attained the status; |
| • | upon consummation of the transaction that resulted in the stockholder becoming an interested stockholder, the interested stockholder owned at least 85% of our voting stock outstanding at the time |
92
Table of Contents
Index to Financial Statements
the transaction commenced, excluding, for purposes of determining the number of shares outstanding, shares owned by persons who are directors and also officers and issued under employee stock plans, under which employee participants do not have the right to determine confidentially whether shares held under the plan will be tendered in a tender or exchange offer; or |
• | the business combination is approved by our board of directors on or subsequent to the date the person became an interested stockholder and authorized at an annual or special meeting of the stockholders by the affirmative vote of the holders of at least 66 2/3% of the outstanding voting stock that is not owned by the interested stockholder. |
This provision has an anti-takeover effect with respect to transactions not approved in advance by our board of directors, including discouraging takeover attempts that might result in a premium over the market price for the shares of our common stock. With approval of our stockholders, we could amend our certificate of incorporation in the future to elect not to be governed by the anti-takeover law. This election would be effective 12 months after the adoption of the amendment and would not apply to any business combination between us and any person who became an interested stockholder on or before the adoption of the amendment.
Transfer Agent and Registrar
The transfer agent and registrar for the common stock is .
Quotation of Common Stock
We have applied to include our shares of common stock for quotation on The NASDAQ Stock Market LLC under the symbol “SOFS.”
93
Table of Contents
Index to Financial Statements
SHARES ELIGIBLE FOR FUTURE SALE
Prior to this offering, there has been no public market for our common stock. The market price of our common stock could drop due to sales of a large number of shares of our common stock or the perception that these sales could occur. These factors also could make it more difficult to raise funds through future offerings of common stock.
After this offering, shares of common stock will be outstanding, or shares if the underwriters exercise in full their option to purchase additional shares. Of these shares, the shares sold in this offering, or shares if the underwriters exercise in full their option to purchase additional shares, will be freely tradable without restriction under the Securities Act, except for any shares purchased by one of our “affiliates” as defined in Rule 144 under the Securities Act. A total of shares will be “restricted securities” within the meaning of Rule 144 under the Securities Act or subject to lock-up arrangements.
The restricted securities generally may not be sold unless they are registered under the Securities Act or are sold under an exemption from registration, such as the exemption provided by Rule 144 under the Securities Act. After this offering, the holders of shares of our common stock will have rights, subject to some limited conditions, to demand that we include their shares in registration statements that we file on their behalf, on our behalf or on behalf of other stockholders. By exercising their registration rights and selling a large number of shares, these holders could cause the price of our common stock to decline. Furthermore, if we file a registration statement to offer additional shares of our common stock and have to include shares held by those holders, it could impair our ability to raise needed capital by depressing the price at which we could sell our common stock.
Our officers and directors and substantially all of our stockholders have entered into lock-up agreements described in “Underwriting.” Approximately shares, representing approximately %, of our common stock will not be subject to any lock-up arrangements. These shares may be freely tradable upon the consummation of this offering.
As restrictions on resale end, the market price of our common stock could drop significantly if the holders of these restricted shares sell them, or are perceived by the market as intending to sell them.
As soon as practicable after this offering, we intend to file one or more registration statements with the SEC on Form S-8 providing for the registration of shares of our common stock issued or reserved for issuance under our stock option plans. Subject to the exercise of unexercised options or the expiration or waiver of vesting conditions for restricted stock and the expiration of lock-ups we and our stockholders have entered into, shares registered under these registration statements on Form S-8 will be available for resale immediately in the public market without restriction.
Rule 144
In general, under Rule 144 as currently in effect, any person (or persons whose shares are aggregated), including an affiliate, who has beneficially owned shares for a period of at least one year is entitled to sell, within any three-month period, a number of shares that does not exceed the greater of:
| • | 1% of the then outstanding shares of common stock; and |
| • | the average weekly trading volume of the common stock on The NASDAQ Stock Market LLC during the four calendar weeks immediately proceeding the date on which the notice of the sale on Form 144 is filed with the Securities Exchange Commission. |
Sales under Rule 144 are also subject to other provisions relating to notice and manner of sale and the availability of current public information about us.
94
Table of Contents
Index to Financial Statements
Rule 144(k)
Under Rule 144(k), a person who is not deemed to have been one of our affiliates at any time during the 90 days preceding a sale, and who has beneficially owned the shares proposed to be sold for at least two years, including the holding period of any prior owner other than an “affiliate,” is entitled to sell the shares without complying with the manner of sale, public information, volume limitation or notice provisions of Rule 144.
95
Table of Contents
Index to Financial Statements
CERTAIN UNITED STATES FEDERAL TAX CONSIDERATIONS
FOR NON-UNITED STATES HOLDERS
The following is a general discussion of the principal United States federal income and estate tax consequences of the ownership and disposition of our common stock by a non-U.S. holder. As used in this discussion, the term “non-U.S. holder” means a beneficial owner of our common stock that is not, for U.S. federal income tax purposes:
| • | an individual who is a citizen or resident of the United States; |
| • | a corporation or partnership (including any entity treated as a corporation or partnership for U.S. federal income tax purposes) created or organized in or under the laws of the United States, or of any political subdivision of the United States; |
| • | an estate whose income is subject to U.S. federal income taxation regardless of its source; or |
| • | a trust, in general, if a U.S. court is able to exercise primary supervision over the administration of the trust and one or more U.S. persons have authority to control all substantial decisions of the trust, or if it has a valid election in effect under applicable U.S. Treasury Regulations to be treated as a U.S. person. |
An individual may be treated as a resident of the United States in any calendar year for U.S. federal income tax purposes, instead of a nonresident, by, among other ways, being present in the United States for at least 31 days in that calendar year and for an aggregate of at least 183 days during a three-year period ending in the current calendar year. For purposes of this calculation, you would count all of the days present in the current year, one-third of the days present in the immediately preceding year and one-sixth of the days present in the second preceding year. Residents are taxed for U.S. federal income tax purposes as if they were U.S. citizens. This discussion does not consider:
| • | U.S. state or local or non-U.S. tax consequences; |
| • | all aspects of U.S. federal income and estate taxes or specific facts and circumstances that may be relevant to a particular non-U.S. holder’s tax position, including the fact that in the case of a non-U.S. holder that is an entity treated as a partnership for U.S. federal income tax purposes, the U.S. tax consequences of holding and disposing of our common stock may be affected by certain determinations made at the partner level; |
| • | the tax consequences for the stockholders, partners or beneficiaries of a non-U.S. holder; |
| • | special tax rules that may apply to particular non-U.S. holders, such as financial institutions, insurance companies, tax-exempt organizations, U.S. expatriates, broker-dealers, and traders in securities; or |
| • | special tax rules that may apply to a non-U.S. holder that holds our common stock as part of a “straddle,” “hedge,” “conversion transaction,” “synthetic security” or other integrated investment. |
The following discussion is based on provisions of the U.S. Internal Revenue Code of 1986, as amended, existing and proposed Treasury regulations and administrative and judicial interpretations, all as of the date of this prospectus, and all of which are subject to change, retroactively or prospectively. The following summary assumes that a non-U.S. holder holds our common stock as a capital asset.Each non-U.S. holder should consult a tax advisor regarding the U.S. Federal, state, local and non-U.S. income and other tax consequences of acquiring, holding and disposing of shares of our common stock.
Distributions on Common Stock
In the event that we make cash distributions on our common stock, these distributions generally will constitute dividends for U.S. federal income tax purposes to the extent paid from our current or accumulated earnings and profits, as determined under U.S. federal income tax principles. Dividends paid to non-U.S. holders
96
Table of Contents
Index to Financial Statements
of our common stock that are not effectively connected with the non-U.S. holder’s conduct of a U.S. trade or business will be subject to U.S. withholding tax at a 30% rate, or if a tax treaty applies, a lower rate specified by the treaty. Non-U.S. holders should consult their tax advisors regarding their entitlement to benefits under a relevant income tax treaty.
Dividends that are effectively connected with a non-U.S. holder’s conduct of a trade or business in the United States and, if an income tax treaty applies, are attributable to a permanent establishment in the United States, are taxed on a net income basis at the regular graduated rates and in the manner applicable to U.S. persons. In that case, we will not have to withhold U.S. federal withholding tax if the non-U.S. holder complies with applicable certification and disclosure requirements. In addition, a “branch profits tax” may be imposed at a 30% rate, or a lower rate under an applicable income tax treaty, on dividends received by a foreign corporation that are effectively connected with the conduct of a trade or business in the United States.
A non-U.S. holder who claims the benefit of an applicable income tax treaty generally will be required to satisfy applicable certification and other requirements. However,
| • | in the case of common stock held by a foreign partnership, the certification requirement will generally be applied to the partners of the partnership and the partnership will be required to provide certain information; |
| • | in the case of common stock held by a foreign trust, the certification requirement will generally be applied to the trust or the beneficial owners of the trust depending on whether the trust is a “foreign complex trust,” “foreign simple trust” or “foreign grantor trust” as defined in the U.S. Treasury regulations; and |
| • | look-through rules will apply for tiered partnerships, foreign simple trusts and foreign grantor trusts. |
A non-U.S. holder that is a foreign partnership or a foreign trust is urged to consult its own tax advisor regarding its status under these U.S. Treasury regulations and the certification requirements applicable to it.
A non-U.S. holder that is eligible for a reduced rate of U.S. federal withholding tax under an income tax treaty may obtain a refund or credit of any excess amounts withheld by filing an appropriate claim for a refund with the U.S. Internal Revenue Service.
Gain on Disposition of Common Stock
A non-U.S. holder generally will not be subject to U.S. federal income tax on gain recognized on a disposition of our common stock unless:
| • | the gain is effectively connected with the non-U.S. holder’s conduct of a trade or business in the United States and, if an income tax treaty applies, is attributable to a permanent establishment maintained by the non-U.S. holder in the United States; in these cases, the gain will be taxed on a net income basis at the regular graduated rates and in the manner applicable to U.S. persons and, if the non-U.S. holder is a foreign corporation, the “branch profits tax” described above may also apply; |
| • | the non-U.S. holder is an individual who is present in the United States for 183 days or more in the taxable year of the disposition and meets other requirements; or |
| • | we are or have been a “United States real property holding corporation” for U.S. federal income tax purposes at any time during the shorter of the five-year period ending on the date of disposition or the period that the non-U.S. holder held our common stock. |
Generally, a corporation is a “United States real property holding corporation” if the fair market value of its “United States real property interests” equals or exceeds 50% of the sum of the fair market value of its worldwide real property interests plus its other assets used or held for use in a trade or business. The tax relating
97
Table of Contents
Index to Financial Statements
to stock in a “United States real property holding corporation” generally will not apply to a non-U.S. holder whose holdings, direct and indirect, at all times during the applicable period, constituted 5% or less of our common stock, provided that our common stock was regularly traded on an established securities market. We believe that we are not currently, and we do not anticipate becoming in the future, a “United States real property holding corporation” for U.S. federal income tax purposes.
U.S. Federal Estate Tax
Common stock owned or treated as owned by an individual who is not a citizen or resident of the United States (as defined for U.S. federal estate tax purposes) at the time of death will be included in the individual’s gross estate for U.S. federal estate tax purposes, unless an applicable estate tax or other treaty provides otherwise and, therefore, may be subject to U.S. federal estate tax.
Information Reporting and Backup Withholding Tax
Dividends paid to you may be subject to information reporting and U.S. backup withholding. If you are a non-U.S. holder you will be exempt from this backup withholding tax if you properly provide a Form W-8BEN certifying that you are a non-U.S. holder or you otherwise meet documentary evidence requirements for establishing that you are a non-U.S. holder or otherwise establish an exemption.
The gross proceeds from the disposition of our common stock may be subject to information reporting and backup withholding. If you sell your common stock outside the United States through a non-U.S. office of a non-U.S. broker and the sales proceeds are paid to you outside the United States, then the U.S. backup withholding and information reporting requirements generally will not apply to that payment. However, U.S. information reporting, but not backup withholding, will generally apply to a payment of sales proceeds, even if that payment is made outside the United States, if you sell your common stock through a non-U.S. office of a broker that:
| • | is a U.S. person; |
| • | derives 50% or more of its gross income in specific periods from the conduct of a trade or business in the United States; |
| • | is a “controlled foreign corporation” for U.S. tax purposes; or |
| • | is a foreign partnership, if at any time during its tax year: |
| i. | one or more of its partners are U.S. persons who in the aggregate hold more than 50% of the income or capital interest in the partnership; or |
| ii. | the foreign partnership is engaged in a U.S. trade or business, |
unless the broker has documentary evidence in its files that you are a non-U.S. person and certain other conditions are met or you otherwise establish an exemption.
If you receive payments of the proceeds of a sale of our common stock to or through a U.S. office of a broker, the payment is subject to both U.S. backup withholding and information reporting unless you properly provide a Form W-8BEN certifying that you are a non-U.S. person or you otherwise establish an exemption.
You generally may obtain a refund of any amounts withheld under the backup withholding rules that exceed your U.S. federal income tax liability by timely filing a properly completed refund claim with the U.S. Internal Revenue Service.
98
Table of Contents
Index to Financial Statements
Lehman Brothers Inc., Credit Suisse Securities (USA) LLC and UBS Securities LLC are acting as joint book-running managers and representatives of the underwriters of this offering. Under the terms of an underwriting agreement, which will be filed as an exhibit to the registration statement, each of the underwriters named below has severally agreed to purchase from us and the selling shareholders the respective number of common stock shown opposite its name below:
Underwriters | Number of Shares | |
Lehman Brothers Inc. | ||
Credit Suisse Securities (USA) LLC | ||
UBS Securities LLC | ||
Total | ||
The underwriting agreement provides that the underwriters’ obligation to purchase shares of common stock depends on the satisfaction of the conditions contained in the underwriting agreement including:
| • | the obligation to purchase all of the shares of common stock offered hereby (other than those shares of common stock covered by their option to purchase additional shares as described below), if any of the shares are purchased; |
| • | the representations and warranties made by us and the selling stockholders to the underwriters are true; |
| • | there is no material adverse change in our business or the financial markets; and |
| • | we deliver customary closing documents to the underwriters. |
Commissions and Expenses
The following table summarizes the underwriting discounts and commissions we and the selling stockholders will pay to the underwriters. These amounts are shown assuming both no exercise and full exercise of the underwriters’ option to purchase additional shares. The underwriting fee is the difference between the initial price to the public and the amount the underwriters pay to us and the selling stockholders for the shares.
| Per Share | Total | |||||||
| No Exercise | Full Exercise | No Exercise | Full Exercise | |||||
Paid by us | $ | $ | $ | $ | ||||
Paid by selling stockholders | $ | $ | $ | $ | ||||
The representatives of the underwriters have advised us that the underwriters propose to offer the shares of common stock directly to the public initially at the public offering price on the cover of this prospectus and to selected dealers, which may include the underwriters, at such offering price less a selling concession not in excess of $ per share. After the initial offering, the representatives may change the offering price and other selling terms.
The expenses of the offering that are payable by us and the selling stockholders are estimated to be $ (excluding underwriting discounts and commissions). We have agreed to pay expenses incurred by the selling stockholders in connection with the offering, other than the underwriting discounts and commission.
Option to Purchase Additional Shares
We have granted the underwriters an option exercisable for 30 days after the date of this prospectus, to purchase, from time to time, in whole or in part, up to an aggregate of shares at the public offering price
99
Table of Contents
Index to Financial Statements
less underwriting discounts and commissions. This option may be exercised if the underwriters sell more than shares in connection with this offering. To the extent that this option is exercised, each underwriter will be obligated, subject to certain conditions, to purchase its pro rata portion of these additional shares based on the underwriter’s underwriting commitment in the offering as indicated in the table at the beginning of this underwriting section.
Lock-Up Agreements
We, all of our directors and executive officers and the selling stockholders have agreed that, subject to certain exceptions, without the prior written consent of each of Lehman Brothers Inc., Credit Suisse Securities (USA) LLC and UBS Securities LLC, we and they will not directly or indirectly, (1) offer for sale, sell, pledge, or otherwise dispose of (or enter into any transaction or device that is designed to, or could be expected to, result in the disposition by any person at any time in the future of) any shares of common stock (including, without limitation, shares of common stock that may be deemed to be beneficially owned by us or them in accordance with the rules and regulations of the Securities and Exchange Commission and shares of common stock that may be issued upon exercise of any options or warrants) or securities convertible into or exercisable or exchangeable for common stock, (2) enter into any swap or other derivatives transaction that transfers to another, in whole or in part, any of the economic consequences of ownership of the common stock, (3) make any demand for or exercise any right or file or cause to be filed a registration statement, including any amendments thereto, with respect to the registration of any shares of common stock or securities convertible, exercisable or exchangeable into common stock or any of our other securities, or (4) publicly disclose the intention to do any of the foregoing for a period of 180 days after the date of this prospectus.
The 180-day restricted period described in the preceding paragraph will be extended if:
| • | during the last 17 days of the 180-day restricted period we issue an earnings release or material news or announce a material event relating to us; or |
| • | prior to the expiration of the 180-day restricted period, we announce that we will release earnings results during the 16-day period beginning on the last day of the 180-day period, |
in which case the restrictions described in the preceding paragraph will continue to apply until the expiration of the 18-day period beginning on the issuance of the earnings release or the announcement of the material news or material event.
Lehman Brothers Inc., Credit Suisse Securities (USA) LLC and UBS Securities LLC in their sole discretion, may release the common stock and other securities subject to the lock-up agreements described above in whole or in part at any time with or without notice. When determining whether or not to release common stock and other securities from lock-up agreements, Lehman Brothers Inc., Credit Suisse Securities (USA) LLC and UBS Securities LLC will consider, among other factors, the holder’s reasons for requesting the release, the number of shares of common stock and other securities for which the release is being requested and market conditions at the time. The underwriters have no present intent, agreements or understandings to release any of the lock-up agreements early.
Offering Price Determination
Prior to this offering, there has been no public market for our common stock. The initial public offering price will be negotiated between the representatives and us. In determining the initial public offering price of our common stock, the representatives will consider:
| • | the history and prospects for the industry in which we compete; |
| • | our financial information; |
| • | the ability of our management and our business potential and earning prospects; |
100
Table of Contents
Index to Financial Statements
| • | the prevailing securities markets at the time of this offering; and |
| • | the recent market prices of, and the demand for, publicly traded shares of generally comparable companies. |
Indemnification
We and the selling stockholders have agreed to indemnify the underwriters against certain liabilities, including liabilities under the Securities Act, and to contribute to payments that the underwriters may be required to make for these liabilities.
Directed Share Program
At our request, the underwriters have reserved for sale at the initial public offering price up to % of the total shares of our common stock offered hereby (excluding any shares to be sold pursuant to the over-allotment option) for employees, directors and other persons associated with us who have expressed an interest in purchasing common stock in the offering. The number of shares available for sale to the general public in the offering will be reduced to the extent these persons purchase the reserved shares. Any reserved shares not so purchased will be offered by the underwriters to the general public on the same terms as the other shares offered hereby. The purchasers under the directed share program will be subject to lock-up provisions identical to those described above.
Stabilization, Short Positions and Penalty Bids
The representatives may engage in stabilizing transactions, short sales and purchases to cover positions created by short sales, and penalty bids or purchases for the purpose of pegging, fixing or maintaining the price of the common stock, in accordance with Regulation M under the Securities Exchange Act of 1934:
| • | Stabilizing transactions permit bids to purchase the underlying security so long as the stabilizing bids do not exceed a specified maximum. |
| • | A short position involves a sale by the underwriters of shares in excess of the number of shares the underwriters are obligated to purchase in the offering, which creates the syndicate short position. This short position may be either a covered short position or a naked short position. In a covered short position, the number of shares involved in the sales made by the underwriters in excess of the number of shares they are obligated to purchase is not greater than the number of shares that they may purchase by exercising their option to purchase additional shares. In a naked short position, the number of shares involved is greater than the number of shares in their option to purchase additional shares. The underwriters may close out any short position by either exercising their option to purchase additional shares and/or purchasing shares in the open market. In determining the source of shares to close out the short position, the underwriters will consider, among other things, the price of shares available for purchase in the open market as compared to the price at which they may purchase shares through their option to purchase additional shares. A naked short position is more likely to be created if the underwriters are concerned that there could be downward pressure on the price of the shares in the open market after pricing that could adversely affect investors who purchase in the offering. |
| • | Syndicate covering transactions involve purchases of the common stock in the open market after the distribution has been completed in order to cover syndicate short positions. |
| • | Penalty bids permit the representatives to reclaim a selling concession from a syndicate member when the common stock originally sold by the syndicate member is purchased in a stabilizing or syndicate covering transaction to cover syndicate short positions. |
These stabilizing transactions, syndicate covering transactions and penalty bids may have the effect of raising or maintaining the market price of our common stock or preventing or retarding a decline in the market
101
Table of Contents
Index to Financial Statements
price of the common stock. As a result, the price of the common stock may be higher than the price that might otherwise exist in the open market. These transactions may be effected on The NASDAQ Stock Market LLC or otherwise and, if commenced, may be discontinued at any time.
Neither we nor any of the underwriters make any representation or prediction as to the direction or magnitude of any effect that the transactions described above may have on the price of the common stock. In addition, neither we nor any of the underwriters make representations that the representatives will engage in these stabilizing transactions or that any transaction, once commenced, will not be discontinued without notice.
Electronic Distribution
A prospectus in electronic format may be made available on the Internet sites or through other online services maintained by one or more of the underwriters and/or selling group members participating in this offering, or by their affiliates. In those cases, prospective investors may view offering terms online and, depending upon the particular underwriter or selling group member, prospective investors may be allowed to place orders online. The underwriters may agree with us to allocate a specific number of shares for sale to online brokerage account holders. Any such allocation for online distributions will be made by the representatives on the same basis as other allocations.
Other than the prospectus in electronic format, the information on any underwriter’s or selling group member’s web site and any information contained in any other web site maintained by an underwriter or selling group member is not part of the prospectus or the registration statement of which this prospectus forms a part, has not been approved and/or endorsed by us or any underwriter or selling group member in its capacity as underwriter or selling group member and should not be relied upon by investors.
Listing
We have applied to list our shares of common stock for quotation on The NASDAQ Stock Market LLC under the symbol “SOFS.”
Discretionary Sales
The underwriters have informed us that they do not intend to confirm sales to discretionary accounts that exceed 5% of the total number of shares offered by them.
Stamp Taxes
If you purchase shares of common stock offered in this prospectus, you may be required to pay stamp taxes and other charges under the laws and practices of the country of purchase, in addition to the offering price listed on the cover page of this prospectus.
Other Relationships
Some of the underwriters and their affiliates have engaged in transactions with, and performed commercial and investment banking financial advisor or lending services for, us and our affiliates from time to time, for which they have received customary compensation and may do so in the future. Affiliates of UBS Securities LLC are arrangers and agents under our credit facility and receive fees customary for performing these services and interest on such. In addition, a portion of the net proceeds from this offering may be used to repay a portion of our revolving credit facility and term loan facility, in which case lenders under such facilities, including affiliates of some of the underwriters, will receive their proportionate share of the net proceeds (consisting of less than 10% of such proceeds) used to repay such debt.
102
Table of Contents
Index to Financial Statements
Foreign Selling Restrictions
United Kingdom
This document is only being distributed to and is only directed at (i) persons who are outside the United Kingdom or (ii) to investment professionals falling within Article 19(5) of the Financial Services and Markets Act 2000 (Financial Promotion) Order 2005 (the “Order”) or (iii) high net worth entities, and other persons to whom it may lawfully be communicated, falling within Article 49(2)(a) to (e) of the Order (all such persons together being referred to as “relevant persons”). The shares of common stock are only available to, and any invitation, offer or agreement to subscribe, purchase or otherwise acquire such common stock will be engaged in only with, relevant persons. Any person who is not a relevant person should not act or rely on this document or any of its contents.
Each of the underwriters has represented and agreed that:
(a) it has only communicated or caused to be communicated and will only communicate or cause to be communicated an invitation or inducement to engage in investment activity (within the meaning of Section 21 of the Financial Services and Markets Act 2000 or FSMA) received by it in connection with the issue or sale of the shares in circumstances in which Section 21(1) of the FSMA does not apply to us, and
(b) it has complied with, and will comply with all applicable provisions of the FSMA with respect to anything done by it in relation to the shares in, from or otherwise involving the United Kingdom.
European Economic Area
To the extent that the offer of the common stock is made in any Member State of the European Economic Area that has implemented the Prospectus Directive before the date of publication of a prospectus in relation to the common stock which has been approved by the competent authority in the Member State in accordance with the Prospectus Directive (or, where appropriate, published in accordance with the Prospectus Directive and notified to the competent authority in the Member State in accordance with the Prospectus Directive), the offer (including any offer pursuant to this document) is only addressed to qualified investors in that Member State within the meaning of the Prospectus Directive or has been or will be made otherwise in circumstances that do not require us to publish a prospectus pursuant to the Prospectus Directive.
In relation to each Member State of the European Economic Area which has implemented the Prospectus Directive (each, a “Relevant Member State”), each underwriter has represented and agreed that with effect from and including the date on which the Prospectus Directive is implemented in that Relevant Member State (the “Relevant Implementation Date”) it has not made and will not make an offer of shares to the public in that Relevant Member State prior to the publication of a prospectus in relation to the shares which has been approved by the competent authority in that Relevant Member State or, where appropriate, approved in another Relevant Member State and notified to the competent authority in that Relevant Member State, all in accordance with the Prospectus Directive, except that it may, with effect from and including the Relevant Implementation Date, make an offer of shares to the public in that Relevant Member State at any time:
(a) to legal entities which are authorized or regulated to operate in the financial markets or, if not so authorized or regulated, whose corporate purpose is solely to invest in securities,
(b) to any legal entity which has two or more of (1) an average of at least 250 employees during the last financial year; (2) a total balance sheet of more than €43,000,000 and (3) an annual net turnover of more than €50,000,000, as shown in its last annual or consolidated accounts, or
(c) in any other circumstances which do not require the publication by us of a prospectus pursuant to Article 3 of the Prospectus Directive.
103
Table of Contents
Index to Financial Statements
For the purposes of this provision, the expression an “offer of shares to the public” in relation to any shares in any Relevant Member State means the communication in any form and by any means of sufficient information on the terms of the offer and the shares to be offered so as to enable an investor to decide to purchase or subscribe the shares, as the same may be varied in that Member State by any measure implementing the Prospectus Directive in that Member State and the expression “Prospectus Directive” means Directive 2003/71/ EC and includes any relevant implementing measure in each Relevant Member State.
104
Table of Contents
Index to Financial Statements
The validity of the shares of common stock offered by this prospectus and certain other legal matters in connection with this offering will be passed upon for us by Vinson & Elkins L.L.P., Houston, Texas. Certain legal matters in connection with this offering will be passed on for certain of the selling stockholders by Latham & Watkins LLP, Washington, D.C. Certain legal matters in connection with this offering will be passed upon for the underwriters by Baker Botts L.L.P., Houston, Texas.
The audited financial statements included in this prospectus, except as they relate to BLR Construction Companies, L.L.C. and affiliate, BLR Construction Co., Inc. and affiliates, Abbeville Offshore Quarters, Inc. (report dated August 25, 2006), Trail Blazer Hot Shot, Inc., GL Trucking & Rental, Inc., Separation Services, Inc., Stallion Rentals, LP dba Trinity Valley Rentals, Envirotech, Inc., and Double-D Enterprises, Inc., have been audited by UHY LLP, independent registered public accountants as indicated in their reports with respect thereto, and, insofar as they relate to BLR Construction Companies, L.L.C. and affiliate and BLR Construction Co., Inc. and affiliates, by Wright, Moore, DeHart, Dupuis & Hutchinson, LLC, independent public accountants as indicated in their reports with respect thereto, and insofar as they relate to Abbeville Offshore Quarters, Inc. (report dated August 25, 2006), Trail Blazer Hot Shot, Inc., GL Trucking & Rental, Inc., Separation Services, Inc., Stallion Rentals, LP dba Trinity Valley Rentals, Envirotech, Inc., and Double-D Enterprises, Inc., by UHY Mann Frankfort Stein & Lipp CPAs, LLP, independent public accountants as indicated in their reports with respect thereto, whose reports thereon appear herein. Such financial statements have been so included in reliance on the reports of such independent accountants given on the authority of such firms as experts in auditing and accounting.
WHERE YOU CAN FIND MORE INFORMATION
We have filed with the SEC a registration statement on Form S-1 regarding the common stock. This prospectus does not contain all of the information found in the registration statement. For further information regarding us and the common stock offered in this prospectus, you may desire to review the full registration statement, including its exhibits. The registration statement, including the exhibits, may be inspected and copied at the public reference facilities maintained by the SEC at 100 F Street, N.E., Washington, D.C. 20549. Copies of this material can also be obtained upon written request from the Public Reference Section of the SEC at 100 F Street, N.E., Washington, D.C. 20549, at prescribed rates or from the SEC’s website on the Internet athttp://www.sec.gov. Please call the SEC at 1-800-SEC-0330 for further information on its public reference room. In addition, our future public filings can also be inspected and copied at the offices of The NASDAQ Stock Market LLC, Reports Section, 1735 K Street, N.W., Washington, D.C. 2006.
You should rely only on the information contained in this prospectus. We have not, and the underwriters have not, authorized any other person to provide you with different information. If anyone provides you with different or inconsistent information, you should not rely on it. We are not, and the underwriters are not, making an offer to sell these securities in any jurisdiction where an offer or sale is not permitted. You should assume that the information appearing in this prospectus is accurate as of the date on the front cover of this prospectus only. Our business, financial condition, results of operations and prospects may have changed since that date.
Following the completion of this offering, we will file with or furnish to the SEC periodic reports and other information. These reports and other information may be inspected and copied at the public reference facilities maintained by the SEC or obtained from the SEC’s website as provided above. Our website on the Internet is located athttp://www.stallionoilfield.com, and we expect to make our periodic reports and other information filed with or furnished to the SEC available, free of charge, through our website, as soon as reasonably practicable after those reports and other information are electronically filed with or furnished to the SEC. Information on our website or any other website is not incorporated by reference into this prospectus and does not constitute a part of this
105
Table of Contents
Index to Financial Statements
prospectus. You may also request a copy of these filings at no cost, by writing or telephoning us at the following address: 410 Roberts Street, Houston, Texas 77003, Attention: Chief Financial Officer, (713) 528-5544.
We intend to furnish or make available to our stockholders annual reports containing our audited financial statements prepared in accordance with GAAP. We also intend to furnish or make available to our stockholders quarterly reports containing our unaudited interim financial information, including the information required by Form 10-Q, for the first three fiscal quarters of each fiscal year.
106
Table of Contents
Index to Financial Statements
F-1
Table of Contents
Index to Financial Statements
F-2
Table of Contents
Index to Financial Statements
F-3
Table of Contents
Index to Financial Statements
REPORT OF INDEPENDENT REGISTERED PUBLIC ACCOUNTING FIRM
To the Board of Directors
Stallion Oilfield Services, Inc.
We have audited the accompanying balance sheet of Stallion Oilfield Services, Inc. (“Stallion”) as of April 12, 2007. This financial statement is the responsibility of Stallion’s management. Our responsibility is to express an opinion on this financial statement based on our audit.
We conducted our audit in accordance with the standards of the Public Company Accounting Oversight Board (United States). Those standards require that we plan and perform the audit to obtain reasonable assurance about whether the financial statement is free of material misstatement. An audit includes examining, on a test basis, evidence supporting the amounts and disclosures in the financial statement. An audit also includes assessing the accounting principles used and significant estimates made by management, as well as evaluating the overall financial statement presentation. We believe that our audit provides a reasonable basis for our opinion.
In our opinion, the financial statement referred to above presents fairly, in all material respects, the financial position of Stallion as of April 12, 2007 in conformity with accounting principles generally accepted in the United States of America.
| /s/ UHY LLP |
| UHY LLP |
Houston, Texas
April 17, 2007
F-4
Table of Contents
Index to Financial Statements
STALLION OILFIELD SERVICES, INC.
| April 12, 2007 | |||
| (in thousands) | |||
| ASSETS | |||
Current Assets: | |||
Cash and cash equivalents | $ | 1 | |
Total current assets | 1 | ||
Total assets | $ | 1 | |
| LIABILITIES AND STOCKHOLDERS’ EQUITY | |||
Liabilities | $ | — | |
Commitments and Contingencies | — | ||
Stockholders’ Equity: | |||
Common stock, voting, par value $.01 per share, 1,000 shares authorized, 1,000 shares issued | — | ||
Additional paid-in capital | 1 | ||
Retained earnings | — | ||
Total stockholders’ equity | 1 | ||
Total liabilities and stockholders’ equity | $ | 1 | |
The accompanying notes are an integral part of this balance sheet
F-5
Table of Contents
Index to Financial Statements
STALLION OILFIELD SERVICES, INC.
1. Organization
Stallion Oilfield Services, Inc. (“Stallion”) was formed as a Delaware corporation on June 27, 2006. The corporation was formed for the purpose of becoming a holding company for Stallion Oilfield Services Ltd. (“Stallion Oilfield”) in connection with a proposed initial public offering of Stallion’s common stock. Stallion and the partners of Stallion Oilfield have entered into a contribution agreement which, if consummated, would result in the partners of Stallion Oilfield contributing their respective partnership interests to Stallion in exchange for shares of common stock of Stallion.
Stallion Oilfield provides a wide range of wellsite support services and construction and logistics services to drilling contractors and oil and gas exploration and production companies, including workforce accommodation units, surface equipment rental, logistics services, solids control services and equipment, communications infrastructure and rig relocation and oilfield heavy hauling services in the drilling regions in the United States, including the Gulf Coast, South Texas, ArkLaTex, North Texas, the Mid-Continent, Permian Basin, Rocky Mountain Regions, offshore Texas and Louisiana Gulf Coast and in international waters. Stallion Oilfield is headquartered in Houston, Texas.
2. Summary of Significant Accounting Policies
Basis of Presentation
The balance sheet is prepared in accordance with accounting principles generally accepted in the United States of America (GAAP).
Cash and Cash Equivalents
All cash equivalents are stated at cost, which approximates market. The company considers all highly liquid investments purchased with a maturity of three months or less to be cash equivalents.
F-6
Table of Contents
Index to Financial Statements
REPORT OF INDEPENDENT REGISTERED PUBLIC ACCOUNTING FIRM
To the Board of Directors and Partners of Stallion Oilfield Services Ltd. and subsidiaries:
We have audited the accompanying consolidated balance sheets of Stallion Oilfield Services Ltd. and subsidiaries as of December 31, 2006 and 2005, and the related consolidated statements of operations, changes in partners’ capital and cash flows for each of the three years ended December 31, 2006. These consolidated financial statements are the responsibility of the Partnership’s management. Our responsibility is to express an opinion on these consolidated financial statements based on our audits.
We conducted our audits in accordance with the standards of the Public Company Accounting Oversight Board (United States). Those standards require that we plan and perform the audits to obtain reasonable assurance about whether the consolidated financial statements are free of material misstatement. An audit includes examining, on a test basis, evidence supporting the amounts and disclosures in the consolidated financial statements. An audit also includes assessing the accounting principles used and significant estimates made by management, as well as evaluating the overall consolidated financial statement presentation. We believe that our audits provide a reasonable basis for our opinion.
In our opinion, the consolidated financial statements referred to above present fairly, in all material respects, the consolidated financial position of Stallion Oilfield Services Ltd. and subsidiaries as of December 31, 2006 and 2005, and the consolidated results of their operations and their cash flows for each of the three years ended December 31, 2006, in conformity with accounting principles generally accepted in the United States of America.
| /s/ UHY LLP |
| UHY LLP |
Houston, Texas
March 30, 2007
F-7
Table of Contents
Index to Financial Statements
STALLION OILFIELD SERVICES LTD. AND SUBSIDIARIES
CONSOLIDATED BALANCE SHEETS
| December 31, | ||||||
| 2006 | 2005 | |||||
| (in thousands) | ||||||
ASSETS | ||||||
CURRENT ASSETS | ||||||
Cash and cash equivalents | $ | 4,100 | $ | 982 | ||
Accounts receivable, net | 67,777 | 22,348 | ||||
Costs and estimated earnings in excess of billings on uncompleted contracts | 1,741 | — | ||||
Prepaid expenses | 7,437 | 430 | ||||
Deferred tax assets, net | 29 | 259 | ||||
TOTAL CURRENT ASSETS | 81,084 | 24,019 | ||||
PROPERTY AND EQUIPMENT, net | 220,777 | 74,583 | ||||
NOTES RECEIVABLE—OFFICERS | 10,000 | — | ||||
GOODWILL | 110,410 | 19,125 | ||||
INTANGIBLE AND OTHER ASSETS, net | 24,636 | 5,409 | ||||
TOTAL ASSETS | $ | 446,907 | $ | 123,136 | ||
LIABILITIES AND PARTNERS’ CAPITAL | ||||||
CURRENT LIABILITIES | ||||||
Accounts payable—trade | $ | 12,462 | $ | 4,244 | ||
Distribution payable | 1,800 | 786 | ||||
Accrued expenses | 11,342 | 5,425 | ||||
Current portion of long-term debt and notes payable | 1,913 | 11,933 | ||||
Current portion of capital leases | 127 | 393 | ||||
TOTAL CURRENT LIABILITIES | 27,644 | 22,781 | ||||
LONG-TERM DEBT AND NOTES PAYABLE, net of current portion | 255,316 | 55,101 | ||||
OBLIGATIONS UNDER CAPITAL LEASES, net of current portion | 183 | 368 | ||||
DEFERRED INCOME TAX LIABILITIES | 10,230 | 1,289 | ||||
TOTAL LIABILITIES | 293,373 | 79,539 | ||||
COMMITMENTS AND CONTINGENCIES | — | — | ||||
PARTNERS’ CAPITAL | 153,534 | 43,597 | ||||
TOTAL LIABILITIES AND PARTNERS’ CAPITAL | $ | 446,907 | $ | 123,136 | ||
See notes to consolidated financial statements.
F-8
Table of Contents
Index to Financial Statements
STALLION OILFIELD SERVICES LTD. AND SUBSIDIARIES
CONSOLIDATED STATEMENTS OF OPERATIONS
| Years Ended December 31, | ||||||||||||
| 2006 | 2005 | 2004 | ||||||||||
| (in thousands) | ||||||||||||
SERVICE REVENUE | $ | 240,410 | $ | 73,126 | $ | 15,452 | ||||||
OPERATING EXPENSES: | ||||||||||||
Cost of services | 116,519 | 42,281 | 8,695 | |||||||||
Selling, general and administrative expenses | 43,359 | 9,883 | 3,745 | |||||||||
Depreciation and amortization | 30,068 | 7,798 | 1,924 | |||||||||
Loss on disposal of property and equipment | 920 | 499 | 92 | |||||||||
TOTAL OPERATING EXPENSES | 190,866 | 60,461 | 14,456 | |||||||||
INCOME FROM OPERATIONS | 49,544 | 12,665 | 996 | |||||||||
OTHER INCOME (expense): | ||||||||||||
Interest expense | (18,919 | ) | (4,565 | ) | (917 | ) | ||||||
Other | 71 | (66 | ) | — | ||||||||
TOTAL OTHER INCOME (expense) | (18,848 | ) | (4,631 | ) | (917 | ) | ||||||
INCOME BEFORE INCOME TAXES | 30,696 | 8,034 | 79 | |||||||||
PROVISION FOR INCOME TAXES | 4,927 | 598 | — | |||||||||
NET INCOME | $ | 25,769 | $ | 7,436 | $ | 79 | ||||||
See notes to consolidated financial statements.
F-9
Table of Contents
Index to Financial Statements
STALLION OILFIELD SERVICES LTD. AND SUBSIDIARIES
CONSOLIDATED STATEMENTS OF CHANGES IN PARTNERS’ CAPITAL
| General Partner | Limited Partner | Total | |||||||||
Balances as of January 1, 2004 | $ | 34 | $ | 3,498 | $ | 3,532 | |||||
Net income | — | 79 | 79 | ||||||||
Balances as of December 31, 2004 | 34 | 3,577 | 3,611 | ||||||||
Contributions, net of issuance costs | — | 32,406 | 32,406 | ||||||||
Distributions | — | (786 | ) | (786 | ) | ||||||
Conversion of notes payable into limited partner interest | — | 500 | 500 | ||||||||
Limited partner interest issued in connection with note payable | — | 430 | 430 | ||||||||
Net income | 1 | 7,435 | 7,436 | ||||||||
Balances as of December 31, 2005 | 35 | 43,562 | 43,597 | ||||||||
Contributions, net of issuance costs | — | 63,282 | 63,282 | ||||||||
Conversion of notes payable into limited partner interest | — | 250 | 250 | ||||||||
Limited partner interest issued in connection with acquisition | — | 22,950 | 22,950 | ||||||||
Distributions | — | (2,314 | ) | (2,314 | ) | ||||||
Net income | 3 | 25,766 | 25,769 | ||||||||
Balances as of December 31, 2006 | $ | 38 | $ | 153,496 | $ | 153,534 | |||||
See notes to consolidated financial statements.
F-10
Table of Contents
Index to Financial Statements
STALLION OILFIELD SERVICES LTD. AND SUBSIDIARIES
CONSOLIDATED STATEMENTS OF CASH FLOWS
| Years Ended December 31, | ||||||||||||
| 2006 | 2005 | 2004 | ||||||||||
| (in thousands) | ||||||||||||
CASH FLOWS FROM OPERATING ACTIVITIES | ||||||||||||
Net income | $ | 25,769 | $ | 7,436 | $ | 79 | ||||||
Adjustments to reconcile net income to net cash provided by operating activities: | ||||||||||||
Depreciation and amortization | 30,068 | 7,798 | 1,924 | |||||||||
Amortization of debt issuance costs | 2,069 | 423 | — | |||||||||
Amortization of discount | 358 | 72 | — | |||||||||
Loss on disposal of property and equipment | 920 | 499 | 92 | |||||||||
Deferred tax expense (benefit) | 1,776 | (73 | ) | — | ||||||||
Bad debt expense | 683 | 465 | 70 | |||||||||
Other | 19 | — | — | |||||||||
Changes in operating assets and liabilities, net of acquired assets and liabilities: | ||||||||||||
Accounts receivable | (22,825 | ) | (13,709 | ) | (1,947 | ) | ||||||
Costs and estimated earnings in excess of billings on uncompleted contracts | 2,015 | — | — | |||||||||
Other assets | (5,498 | ) | (209 | ) | (17 | ) | ||||||
Accounts payable | 2,673 | 1,368 | 1,079 | |||||||||
Accrued expenses | 3,097 | 3,017 | 454 | |||||||||
NET CASH PROVIDED BY OPERATING ACTIVITIES | 41,124 | 7,087 | 1,734 | |||||||||
CASH FLOWS FROM INVESTING ACTIVITIES | ||||||||||||
Cash paid for acquisitions, net of cash received | (178,045 | ) | (47,191 | ) | (1,158 | ) | ||||||
Cash paid for acquisition costs | (1,399 | ) | (433 | ) | (118 | ) | ||||||
Cash paid for property and equipment | (92,029 | ) | (35,951 | ) | (5,961 | ) | ||||||
Proceeds received from disposal of property and equipment | 1,309 | 113 | 95 | |||||||||
Notes receivable – officers | (10,000 | ) | — | — | ||||||||
NET CASH USED IN INVESTING ACTIVITIES | (280,164 | ) | (83,462 | ) | (7,142 | ) | ||||||
CASH FLOWS FROM FINANCING ACTIVITIES | ||||||||||||
Partners’ capital contributions, net | 63,282 | 32,406 | — | |||||||||
Distribution to partners | (514 | ) | — | — | ||||||||
Proceeds from partner note | — | — | 3,975 | |||||||||
Proceeds from long-term debt | 216,000 | 64,133 | 5,500 | |||||||||
Payments of long-term debt | (68,095 | ) | (21,454 | ) | (5,198 | ) | ||||||
Proceeds from line of credit | 44,500 | 23,200 | 1,900 | |||||||||
Payments on line of credit | (6,100 | ) | (19,000 | ) | (785 | ) | ||||||
Payments for debt issuance costs | (6,464 | ) | (1,545 | ) | (96 | ) | ||||||
Payments for capital leases | (451 | ) | (433 | ) | (250 | ) | ||||||
NET CASH PROVIDED BY FINANCING ACTIVITIES | 242,158 | 77,307 | 5,046 | |||||||||
NET INCREASE (DECREASE) IN CASH | 3,118 | 932 | (362 | ) | ||||||||
CASH AT BEGINNING OF YEAR | 982 | 50 | 412 | |||||||||
CASH AT END OF YEAR | $ | 4,100 | $ | 982 | $ | 50 | ||||||
See notes to consolidated financial statements.
F-11
Table of Contents
Index to Financial Statements
STALLION OILFIELD SERVICES LTD. AND SUBSIDIARIES
NOTES TO CONSOLIDATED FINANCIAL STATEMENTS
DECEMBER 31, 2006 AND 2005
1. SIGNIFICANT ACCOUNTING POLICIES
Nature of Business: Stallion Oilfield Services Ltd. and subsidiaries (collectively the “Partnership”, “Stallion” or “We”) provide a wide range of wellsite support services and construction and logistics services to drilling contractors and oil and gas exploration and production companies, including workforce accommodation units, surface equipment rental, logistics services, solids control services and equipment, communications infrastructure and rig relocation and oilfield heavy hauling services in the drilling regions in the United States, including the Gulf Coast, South Texas, ArkLaTex, North Texas, the Mid-Continent, Permian Basin, Rocky Mountain Regions, offshore Texas and Louisiana Gulf Coast and in international waters. Stallion is headquartered in Houston, Texas. Stallion is a limited partnership with Stallion Oilfield Holdings, Ltd. as the 99.99 percent limited partner and Stallion Interests, LLC as the .01 percent general partner of the Partnership.
Principles of Consolidation: The consolidated financial statements include the financial statements of Stallion Oilfield Services Ltd. and its wholly owned subsidiaries. Stallion has no interest in any other organization, entity, partnership, or contract that could require any evaluation under FASB Interpretation No. 46 or Accounting Research Bulletin No. 51. All significant inter-company balances and transactions have been eliminated in consolidation.
Cash and Cash Equivalents: The Partnership considers all investments with original maturities of three months or less when purchased to be cash equivalents.
Fair Value of Financial Instruments: The carrying value amount of cash, accounts receivable, accounts payable and accrued liabilities approximate fair value due to the short maturity of these instruments. The carrying amount of all debt approximates fair value because Stallion’s current borrowing rate is based on a variable market rate of interest. The Partnership has interest rate caps on LIBOR at 6.15 percent with notional amounts of approximately $82.5 million. The cost of the caps of approximately $183,000 is amortized as interest expense over the life of the contract, which approximates the interest method.
Accounts Receivable: The Partnership extends credit to its customers based on an evaluation of the customer’s financial condition and generally collateral is not required nor is interest charged on outstanding balances. Outstanding accounts receivable are routinely evaluated and an allowance is set up when accounts are deemed uncollectible. The allowance for doubtful accounts is based on an analysis of historical collection activity and specific identification of overdue accounts. Factors that may affect this estimate include (1) changes in the financial position of significant customers and (2) a decline in oil and natural gas prices that could affect the entire customer base.
Unbilled Accounts Receivable: Unbilled receivables represent revenue earned for rental agreements and certain construction contracts in the current period but not yet billed to the customer.
Property and Equipment: Property and equipment are stated at cost. Depreciation is provided on the straight line method over the estimated useful lives of the related assets. All expenditures for major renewals and betterments are capitalized. Expenditures for maintenance and repairs are charged to expense as incurred. Leasehold improvements are amortized over the shorter of the life of the lease or the life of the improvement.
Deferred Debt Costs: Certain costs such as, lender’s fees and related attorney’s fees incurred in connection with obtaining financing are capitalized. These costs are amortized to interest expense using the straight line method, which approximates the effective interest method over the terms of the related debt.
Intangible Assets: For financial statement purposes, identifiable intangible assets with a defined life are being amortized using the straight-line method over the useful lives of the assets. Identifiable intangible assets with an indefinite life are not amortized in accordance with Statement of Financial Accounting Standards
F-12
Table of Contents
Index to Financial Statements
STALLION OILFIELD SERVICES LTD. AND SUBSIDIARIES
NOTES TO CONSOLIDATED FINANCIAL STATEMENTS—(Continued)
DECEMBER 31, 2006 AND 2005
No. 142, “Goodwill and Other Intangible Assets.” These assets are required to be tested at least annually for impairment.
Goodwill: Goodwill represents the excess of costs over the fair value of net assets of acquired businesses. Goodwill acquired in a business combination is not amortized, but instead tested for impairment at least annually in the fourth quarter. Under this goodwill impairment test, if the fair value of a reporting unit does not exceed its carrying value, the excess of fair value of the reporting unit over the fair value of its net assets is considered to be the implied fair value of goodwill. If the carrying value of goodwill exceeds its implied fair value, the difference is recognized as an impairment loss. Goodwill was evaluated for impairment as of December 31, 2006 and 2005. The Partnership determined that goodwill was not impaired, and thus no impairment charge has been recorded related to goodwill for the years ended December 31, 2006 and 2005.
Impairment: In accordance with Statement of Financial Accounting Standards No. 144, “Accounting for the Impairment or Disposal of Long-Lived Assets”, long-lived assets, such as property, plant and equipment, and purchased intangibles subject to amortization, are reviewed for impairment whenever events or changes in circumstances indicate that the carrying amount of an asset may not be recoverable. Recoverability of assets to be held and used in operations is measured by a comparison of the carrying amount of an asset to estimated undiscounted cash flows expected to be generated by the asset. If the carrying amount of an asset exceeds its estimated future cash flows, an impairment charge is recognized in the amount by which the carrying amount of the asset exceeds the fair value of the asset. Assets to be disposed of would be separately presented in the balance sheet and reported at the lower of their carrying amount or their fair value less anticipated cost to sell, and they would no longer be depreciated. No impairment losses have been recorded through December 31, 2006.
Self-Insured Risk Accruals: The Partnership is partially self-insured for certain losses relating to workers’ compensation and general liability insurance claims. The Partnership maintains accruals to cover the self-insured risks, which are based on third-party data and historical claims history.
Federal Income Taxes: The Partnership is not subject to federal or state income taxes on a consolidated basis due to its partnership structure; however, certain of its subsidiary companies are taxable corporations and are subject to income tax. The Partnership accounts for income taxes based upon Statement of Financial Accounting Standards No. 109, “Accounting for Income Taxes” (“SFAS No. 109”) for its subsidiaries which are subject to income taxes. Under SFAS 109, deferred tax assets and liabilities are recognized for the future tax consequences attributable to differences between the financial statement carrying amounts of existing assets and liabilities and their respective tax bases. Deferred tax assets and liabilities are measured using statutory rates expected to apply to taxable income in the years in which those temporary differences are expected to be recovered or settled. A valuation allowance for deferred tax assets is recognized when it is more likely than not that the benefit of deferred tax assets will not be realized.
Revenue Recognition: The Partnership’s revenue recognition policies are as follows:
Rental and Service Revenue
The Partnership recognizes revenue when it is realized and earned. The Partnership considers revenue to be realized and earned when services have been provided to the customer, the product has been delivered, the sales price has been fixed or determinable and collection is reasonably assured. Revenue from rental agreements is recognized over the rental period and revenue from service agreements is recognized when services have been rendered. Generally services are provided over a relatively short time.
Construction Revenue
Certain of our operations recognize revenue related to wellsite construction and offshore workforce accommodations unit construction using the percentage-of-completion method determined by the ratio of costs
F-13
Table of Contents
Index to Financial Statements
STALLION OILFIELD SERVICES LTD. AND SUBSIDIARIES
NOTES TO CONSOLIDATED FINANCIAL STATEMENTS—(Continued)
DECEMBER 31, 2006 AND 2005
incurred to total estimated costs at completion. All known or anticipated losses on contracts are recognized in full when such losses become apparent. Contracts typically range from two to six months in duration.
Mobilization and Demobilization Revenue
In the Partnership’s wellsite support services segment, the Partnership charges its customers a rig-up/rig-down charge in connection with the initial setup or takedown of workforce accommodation units and for the connection or disconnection of these units to or from water, utilities, and sewer systems. Revenue related to rig-up/rig-down charges is recognized upon completion of the service.
Concentration of Risk: During 2006 and 2005, the Partnership had cash in excess of federally insured limits deposited in a bank. The Partnership monitors the financial condition of the bank and has experienced no losses associated with its accounts.
The Partnership’s customer base consists primarily of oil and natural gas exploration and production companies and drilling contractors. The Partnership performs ongoing evaluations of its customers but generally does not require collateral on its trade receivables. During the year ended December 31, 2006, one customer accounted for 10.5 percent of total sales. The balance due from this customer as of December 31, 2006 was approximately $6.6 million. In 2005, no customer accounted for more than 10 percent of total sales. During the year ended December 31, 2004, sales to one customer accounted for approximately 15 percent of total sales.
Partnership Allocations: Income or loss is allocated to the partners in accordance with the Partnership Agreement. In December 2006, Stallion Oilfield Holdings, our parent, entered into a Contribution Agreement with Carlyle/Riverstone wherein Carlyle/Riverstone agreed to invest up to $125 million in Class A partnership units. This investment arrangement continues for a two year period and purchases of Class A units are subject to various conditions including approval of the board of the general partner of Stallion Oilfield Holdings. As of December 31, 2006, Carlyle/Riverstone has funded $45 million under the Contribution Agreement.
Stock-based Compensation: We have adopted the provisions of SFAS No. 123R which requires that we measure the cost of employee services received in exchange for an award of equity instruments based on the fair value of those instruments on their grant date. The fair value of these instruments must be re-evaluated at each reporting date through the settlement date with changes in fair value recognized as compensation expense of the period. GAAP permits the use of various models to determine the fair value of stock options and the variables used for the model are subjective. We have estimated the value of stock grants in accordance with conventional valuation techniques including but not limited to net book value and comparable company multiples of EBITDA as applicable. The use of different assumptions or a different model may have a material impact on our results of operations and related disclosures. Historically, we granted shares of restricted stock in Stallion Oilfield Holdings, Ltd. to employees. We have not granted stock options to employees. In the year ended December 31, 2006, compensation expense from stock grants was insignificant based on management’s valuation at the time of grant.
Use of Estimates: The preparation of consolidated financial statements in conformity with accounting principles generally accepted in the United States of America (“GAAP”) requires management to make certain estimates and assumptions. These estimates and assumptions affect the reported amounts of assets and liabilities, the disclosure of contingent assets and liabilities at the balance sheet date and the amounts of revenue and expenses recognized during the reporting period. Areas where critical accounting estimates are made by management include:
| • | Depreciation and amortization of property and equipment and intangible assets, |
| • | Impairment of property and equipment and goodwill, |
F-14
Table of Contents
Index to Financial Statements
STALLION OILFIELD SERVICES LTD. AND SUBSIDIARIES
NOTES TO CONSOLIDATED FINANCIAL STATEMENTS—(Continued)
DECEMBER 31, 2006 AND 2005
| • | Allowance for doubtful accounts, |
| • | Revenue recognition on uncompleted contracts, |
| • | Litigation and self-insured risk reserves, |
| • | Fair value of assets acquired and liabilities assumed, and |
| • | Income taxes. |
The Partnership analyzes its estimates based on historical experience and various other assumptions that it believes to be reasonable under the circumstances. Under different assumptions or conditions, the actual results could differ, possibly materially from those previously estimated. Many of the conditions impacting these assumptions are outside of Stallion’s control.
Reclassifications: Certain reclassifications have been made to the prior years’ financial statements to conform to the current year presentation. These reclassifications had no effect on previously reported results of operations or partners’ capital.
2. ACQUISITIONS
The Partnership began a strategic acquisition and expansion program early in 2003. Each of its acquisitions has been included in the results of operations from their respective dates of acquisition.
In 2006, 2005, and 2004, Stallion acquired either substantially all of the assets or all of the outstanding capital stock of the following businesses, each of which was accounted for using the purchase method of accounting (in thousands):
| Closing Date | Total Cash Paid (net of cash acquired) | ||||
Rebel Testers, Inc. | February 1, 2004 | $ | 1,158 | ||
Total 2004 | $ | 1,158 | |||
Stallion Rentals, L.P. | January 31, 2005 | $ | 2,925 | ||
Double-D Enterprises, Inc. | January 31, 2005 | 4,686 | |||
Envirotech, Inc. | January 31, 2005 | 11,208 | |||
Separation Services, Inc. | January 31, 2005 | 7,356 | |||
Bob’s Equipment Rental, Inc. | June 30, 2005 | 9,312 | |||
GL Trucking & Rental, Inc. | September 12, 2005 | 11,704 | |||
Total 2005 | $ | 47,191 | |||
Trail Blazer Hot Shot, Inc | January 1, 2006 | $ | 13,735 | ||
Pioneer RSC, LP | February 15, 2006 | 2,817 | |||
BLR Construction Companies, L.L.C | March 1, 2006 | 46,124 | |||
Oilfield Heavy Haulers, LLC | March 20, 2006 | 10,710 | |||
Rental One, LLC | March 1, 2006 | 3,781 | |||
Bowie Dozer Services, Inc | May 19, 2006 | 10,952 | |||
R&G Crane & Rigging & Trucking, LLC | July 21, 2006 | 5,032 | |||
Abbeville Offshore Quarters, Inc | August 1, 2006 | 46,118 | |||
G&N Rentals | September 26, 2006 | 6,400 | |||
Erlandson Construction Company | November 1, 2006 | 5,482 | |||
Norton Transport, Inc | December 15, 2006 | 26,894 | |||
Total 2006 | $ | 178,045 | |||
F-15
Table of Contents
Index to Financial Statements
STALLION OILFIELD SERVICES LTD. AND SUBSIDIARIES
NOTES TO CONSOLIDATED FINANCIAL STATEMENTS—(Continued)
DECEMBER 31, 2006 AND 2005
The following table summarizes the estimated fair value of the assets acquired and liabilities assumed at the dates of acquisition of the businesses acquired in 2006, 2005 and 2004 (in thousands):
| 2006 | 2005 | 2004 | Total | |||||||||
Assets Acquired: | ||||||||||||
Cash | $ | 1,456 | $ | 568 | $ | — | $ | 2,024 | ||||
Accounts receivable, net | 26,901 | 5,222 | — | 32,123 | ||||||||
Other current assets | 1,506 | 478 | — | 1,984 | ||||||||
Deferred tax assets | 164 | — | — | 164 | ||||||||
Property and equipment | 82,811 | 32,139 | 1,132 | 116,082 | ||||||||
Goodwill and other intangibles | 108,554 | 16,720 | 26 | 125,300 | ||||||||
Total assets acquired | 221,392 | 55,127 | 1,158 | 277,677 | ||||||||
Liabilities Assumed: | ||||||||||||
Accounts payable | 5,545 | 1,306 | — | 6,851 | ||||||||
Accrued expenses | 1,856 | 768 | — | 2,624 | ||||||||
Deferred tax liability | 7,394 | 1,489 | — | 8,883 | ||||||||
Notes payable | — | 169 | — | 169 | ||||||||
Total liabilities assumed | 14,795 | 3,732 | — | 18,527 | ||||||||
Net assets acquired | $ | 206,597 | $ | 51,395 | $ | 1,158 | $ | 259,150 | ||||
2006 Acquisitions
In January 2006, the Partnership acquired certain of the assets of Trail Blazer Hot Shot, Inc. (“TB”) for total consideration of approximately $14.6 million, which consisted of approximately $13.7 million in cash and $900,000 in a note payable to the seller. TB is a provider of surface equipment rental services for the major Oklahoma basins and surrounding areas. Assets include over 120 forklifts and man lifts, 38 generators, and a variety of other surface rental equipment such as pumps and heavy-duty service trucks.
On February 15, 2006, the Partnership acquired Pioneer RSC, LP (“Pioneer”) for approximately $2.8 million in cash consideration. Headquartered in Rayne, Louisiana, Pioneer provides oilfield and industrial services such as removal of drilling waste, water treatment and solids control rentals, including “closed loop” systems. Pioneer owns a fleet of 201 units of equipment including centrifuges, shale shakers, desilters, desanders, injection systems, dozers, backhoes and excavators, as well as automobiles and pickup trucks.
In March 2006, the Partnership acquired 100 percent of the membership interest of the BLR Construction Companies, L.L.C. (“BLR”) for approximately $48.5 million in total consideration, consisting of $46.5 million in cash and $2.0 million in notes payable to the sellers. BLR is a full-service contractor serving the oil, gas and petro-chemical industry since 1990. BLR provides customers with experienced personnel and equipment, specializing in location construction, pipeline construction, marine services, production facility construction, crew services, heavy equipment and trucking services, solids control, remediation services, plugging and abandonment, and weed and vegetation control, through its inventory of bulldozers, mats, tools and other construction-related equipment. BLR also provides inland marine wellsite construction services through a fleet of crew boats, tugboats and barges.
Also in March 2006, the Partnership acquired the assets of Oilfield Heavy Haulers, LLC (“OHH”) for total consideration of approximately $11.2 million consisting of $10.7 million in cash and a note payable to seller of
F-16
Table of Contents
Index to Financial Statements
STALLION OILFIELD SERVICES LTD. AND SUBSIDIARIES
NOTES TO CONSOLIDATED FINANCIAL STATEMENTS—(Continued)
DECEMBER 31, 2006 AND 2005
$500,000. OHH provides heavy-duty drilling rig trucking and hauling services to the oilfield. OHH’s assets include a fleet of cranes, rig-hauling trucks, trailers and loaders specifically designed for the oil and gas industry.
The Partnership acquired the assets of Rental One, LLC (“RO”) in March 2006 for a total purchase of $4.0 million, consisting of $3.8 million in cash and $240,000 in a note payable to seller. RO provides traditional surface equipment rental through a fleet of 15 rig housing units, 26 water systems/tanks, four generators, 15 pumps and 19 units of other types of surface and heavy equipment for rent.
On May 19, 2006 BLR acquired the assets of Bowie Dozer Services, Inc. (“Bowie”) located in Bowie, Texas for a purchase price of $11.5 million. The purchase price consisted of $11.0 million in cash and $500,000 in a note payable. The Bowie acquisition expanded our wellsite construction service capacity in the Fort Worth Basin.
On July 21, 2006, Stallion Heavy Haulers, LP (“SHH”) acquired the assets of R&G Crane & Rigging & Trucking, LLC (“R&G”) expanding our rig trucking and hauling services capacity in East Texas. R&G provides heavy-duty drilling rig trucking and hauling services to the oilfield. R&G’s assets include a fleet of cranes, rig-hauling trucks, trailers and loaders specifically designed for the oil & gas industry.
On August 1, 2006, the Partnership purchased all of the outstanding capital stock of Abbeville Offshore Quarters, Inc., a Louisiana corporation (“AOQ”). AOQ provides workforce accommodations, sewage treatment units, water tanks, generators and other rental support equipment for use in the offshore Gulf Coast oil and natural gas industry. The purchase price consisted of $46.1 million in cash ($1.5 million of which is held in escrow) and 6,943,000 Class C units representing limited partnership interests of Stallion Holdings for a total consideration of $70.2 million. The acquisition of AOQ augments the Partnership’s workforce accommodations and surface equipment rental service lines.
On September 26, 2006, Stallion Rockies, Ltd. (SR”) acquired the assets of G&N Rentals (“G&N”). G&N provides workforce accommodations, sewage treatment units, water tanks, generators and other rental support equipment. The acquisition of G&N expanded our workforce accommodations and surface equipment rental service line in the Rocky Mountain region.
On November 1, 2006, BLR completed the acquisition of the assets of Erlandson Construction Company (“Erlandson”) located in Gainesville, Texas for a purchase price of $5.5 million subject to adjustments in accordance with the purchase agreement. This acquisition expanded our wellsite construction service capacity in the Fort Worth Basin. Erlandson also operates a rock quarry in Gainesville, TX.
On December 15, 2006 Stallion Heavy Haulers, LP acquired substantially all of the operating assets of Norton Transport, Inc. (“Norton”), a Texas corporation, for approximately $26.9 million. Norton provides heavy-duty drilling rig trucking and hauling services to the oilfield. Norton’s assets include a fleet of rig-hauling trucks trailer and loaders specifically designed for the oil and gas industry.
F-17
Table of Contents
Index to Financial Statements
STALLION OILFIELD SERVICES LTD. AND SUBSIDIARIES
NOTES TO CONSOLIDATED FINANCIAL STATEMENTS—(Continued)
DECEMBER 31, 2006 AND 2005
The following tables summarize the estimated fair value of the assets acquired and liabilities assumed at the dates of acquisition of the businesses acquired in 2006 by segment (in thousands):
| TB | Pioneer | RO | AOQ | G&N | Total Wellsite Support Services Segment | |||||||||||||
Assets Acquired: | ||||||||||||||||||
Cash | $ | — | $ | — | $ | — | $ | 1,128 | $ | — | $ | 1,128 | ||||||
Accounts receivable, net | — | — | — | 11,069 | — | 11,069 | ||||||||||||
Other current assets | — | — | — | 616 | — | 616 | ||||||||||||
Property and equipment | 5,208 | 2,621 | 1,427 | 21,500 | 5,396 | 36,152 | ||||||||||||
Goodwill and other intangibles | 9,427 | 196 | 2,595 | 43,839 | 1,004 | 57,061 | ||||||||||||
Total assets acquired | 14,635 | 2,817 | 4,022 | 78,152 | 6,400 | 106,026 | ||||||||||||
Liabilities Assumed: | ||||||||||||||||||
Accounts payable | — | — | — | 1,769 | — | 1,769 | ||||||||||||
Accrued expenses | — | — | — | 911 | — | 911 | ||||||||||||
Deferred tax liability | — | — | — | 5,274 | — | 5,274 | ||||||||||||
Total liabilities assumed | — | — | — | 7,954 | — | 7,954 | ||||||||||||
Net assets acquired | $ | 14,635 | $ | 2,817 | $ | 4,022 | $ | 70,198 | $ | 6,400 | $ | 98,072 | ||||||
| BLR | OHH | Erlandson | Norton | R&G | Bowie | Total Construction and Logistics Services Segment | |||||||||||||||
Assets Acquired: | |||||||||||||||||||||
Cash | $ | 328 | $ | — | $ | — | $ | — | $ | — | $ | — | $ | 328 | |||||||
Accounts receivable, net | 15,833 | — | — | — | — | — | 15,833 | ||||||||||||||
Other current assets | 891 | — | — | — | — | — | 891 | ||||||||||||||
Deferred tax assets | 164 | — | — | — | — | — | 164 | ||||||||||||||
Property and equipment | 14,205 | 7,907 | 3,545 | 9,579 | 4,269 | 7,153 | 46,658 | ||||||||||||||
Goodwill and other intangibles | 23,873 | 3,303 | 1,938 | 17,316 | 763 | 4,299 | 51,492 | ||||||||||||||
Total assets acquired | 55,294 | 11,210 | 5,483 | 26,895 | 5,032 | 11,452 | 115,366 | ||||||||||||||
Liabilities Assumed: | — | ||||||||||||||||||||
Accounts payable | 3,776 | — | — | — | — | — | 3,776 | ||||||||||||||
Accrued expenses | 945 | — | — | — | — | — | 945 | ||||||||||||||
Deferred tax liability | 2,120 | — | — | — | — | — | 2,120 | ||||||||||||||
Total liabilities assumed | 6,841 | — | — | — | — | — | 6,841 | ||||||||||||||
Net assets acquired | $ | 48,453 | $ | 11,210 | $ | 5,483 | $ | 26,895 | $ | 5,032 | $ | 11,452 | $ | 108,525 | |||||||
F-18
Table of Contents
Index to Financial Statements
STALLION OILFIELD SERVICES LTD. AND SUBSIDIARIES
NOTES TO CONSOLIDATED FINANCIAL STATEMENTS—(Continued)
DECEMBER 31, 2006 AND 2005
2005 Acquisitions
In January 2005, the Partnership acquired the net assets of Stallion Rentals, L.P. formerly known as Trinity Valley Rentals, Inc. (“Stallion Rentals”), which was engaged in the rental of forklifts, manlifts, generators, light towers and other surface equipment to the drilling industry. Stallion Rentals was acquired for a total purchase price of $3.4 million, consisting of $2.9 million in cash and $500,000 in convertible notes payable to seller. The seller notes are convertible into Class C units of Stallion Holdings. In April 2005, the convertible notes payable to seller were converted into 500,000 Class C units of Stallion Holdings.
In January 2005, the Partnership acquired the net assets of Double-D Enterprises, Inc. (“Double-D”) a company engaged in the rental of loaders, manlifts, mud vacs and other related equipment to the drilling industry, specifically located in the Rocky Mountain region. Double-D was acquired for a total purchase price of $5.1 million, consisting of $4.7 million in cash and $450,000 in a convertible note payable to seller. The convertible note payable to seller was paid in full in January 2006.
In January 2005, the Partnership acquired the net assets of Envirotech, Inc. (“Envirotech”), a company engaged in the rental of workforce accommodations, water systems, sewer systems and other related equipment to the drilling industry, specifically in the Rocky Mountain region. Envirotech was acquired for a total purchase price of $11.7 million, consisting of $11.2 million in cash and $525,000 in convertible notes payable to seller. This note was paid in full in January 2006.
In January 2005, the Partnership purchased the stock of Separation Services, Inc. (“SSI”), a company engaged in the rental of solids control equipment to oil and gas companies and operators at drilling locations in order to separate drill cuttings from the drilling fluids. SSI was acquired for a total purchase price of $9.1 million, consisting of $7.4 million in cash net of cash acquired of approximately $568,000, $660,000 in deferred compensation, approximately 352,000 Class D units of Stallion Holdings and a $500,000 convertible note payable to seller.
In June 2005, the Partnership acquired the assets of Bob’s Equipment Rentals, Inc. (“Bob’s”) a company engaged in the rental of workforce accommodations, water systems, sewer systems and other related equipment to the drilling industry, specifically in the Rocky Mountain region for total cash consideration of $9.3 million.
In September 2005, the Partnership acquired the assets of GL Trucking & Rental, Inc. (“GL”), located in Williston, North Dakota, for total consideration of $12.7 million, consisting of $11.7 million in cash and a $1.0 million note payable to seller. GL is a leading provider of integrated drilling support services for the Williston Basin and surrounding areas. GL assets included over 100 workforce accommodation units, significant oilfield equipment hauling capacity, loaders and equipment setting cranes.
F-19
Table of Contents
Index to Financial Statements
STALLION OILFIELD SERVICES LTD. AND SUBSIDIARIES
NOTES TO CONSOLIDATED FINANCIAL STATEMENTS—(Continued)
DECEMBER 31, 2006 AND 2005
The following table summarizes the estimated fair value of the assets acquired and liabilities assumed at the dates of acquisition of the businesses acquired all of which were included in our wellsite support services segment in 2005 (in thousands):
| Double-D and Envirotech | SSI | Bob’s | GL | Stallion Rentals | Total 2005 | |||||||||||||
Assets Acquired: | ||||||||||||||||||
Cash | $ | — | $ | 568 | $ | — | $ | — | $ | — | $ | 568 | ||||||
Accounts receivable, net | 1,559 | 2,644 | — | — | 1,019 | 5,222 | ||||||||||||
Other current assets | — | 424 | — | — | 54 | 478 | ||||||||||||
Property and equipment | 9,347 | 2,075 | 9,312 | 8,824 | 2,581 | 32,139 | ||||||||||||
Goodwill and other intangibles | 6,103 | 6,225 | — | 3,880 | 512 | 16,720 | ||||||||||||
Total assets acquired | 17,009 | 11,936 | 9,312 | 12,704 | 4,166 | 55,127 | ||||||||||||
Liabilities Assumed: | ||||||||||||||||||
Accounts payable | — | 684 | — | — | 622 | 1,306 | ||||||||||||
Accrued expenses | — | 650 | — | — | 118 | 768 | ||||||||||||
Deferred tax liability | — | 1,489 | — | — | — | 1,489 | ||||||||||||
Notes payable | 140 | 29 | — | — | — | 169 | ||||||||||||
Total liabilities assumed | 140 | 2,852 | — | — | 740 | 3,732 | ||||||||||||
Net assets acquired | $ | 16,869 | $ | 9,084 | $ | 9,312 | $ | 12,704 | $ | 3,426 | $ | 51,395 | ||||||
2004 Acquisitions
In 2004, the Partnership acquired certain equipment from Rebel Testers, Inc. (“Rebel”) for total cash consideration of $1.2 million. Rebel was engaged in the business of providing workforce accommodations, sewer and water systems, trash containers and other related equipment to the drilling industry primarily in Brookhaven, Mississippi. The Partnership acquired Rebel to increase wellsite support services operations in Texas by redeploying the acquired assets.
Pro Forma Effect of 2006 Acquisitions on Operations
The following table provides pro forma information related to the acquisitions of TB, BLR, and AOQ assuming each acquisition occurred January 1, 2005 (in thousands):
| Years Ended December 31, | ||||||
| 2006 | 2005 | |||||
| (Unaudited) | ||||||
Revenue | $ | 267,175 | $ | 143,157 | ||
Net income | 26,743 | 7,677 | ||||
To calculate the pro forma amounts for the years ended December 31, 2006 and 2005, the Partnership used the internal financial statements of TB, BLR and AOQ for the periods prior to acquisition. TB was acquired on January 1, 2006 therefore it is included in the Partnership’s historical results of operations for the full year ended December 31, 2006. Stallion does not believe the pro forma effect of the other acquisitions is material.
F-20
Table of Contents
Index to Financial Statements
STALLION OILFIELD SERVICES LTD. AND SUBSIDIARIES
NOTES TO CONSOLIDATED FINANCIAL STATEMENTS—(Continued)
DECEMBER 31, 2006 AND 2005
The combined results of operations of the acquired businesses have been adjusted to reflect additional depreciation of fixed assets and amortization of intangible assets subject to amortization. The Partnership estimated the remaining useful lives and salvage values of all acquired assets and depreciated those assets over those useful lives using policies that were consistently applied.
Pro forma interest expense was calculated on notes payable to the sellers of acquired businesses and draws on the Partnership’s available line of credit at rates ranging from 6.25 percent to 8.60 percent, assuming that the businesses were acquired on January 1, 2005.
Although we believe the accounting policies and procedures we used to prepare the pro forma results are reasonable, these pro forma results do not purport to be indicative of the actual results which would have been achieved had the acquisitions been consummated on January 1, of the respective year, and are not intended to be a projection of future results.
3. PROPERTY AND EQUIPMENT
Major classifications and estimated depreciable lives of property and equipment are as follows (in thousands):
Estimated | December 31, | |||||||||
| 2006 | 2005 | |||||||||
Rental equipment | 3-20 years | $ | 211,051 | $ | 67,381 | |||||
Auto and trucks | 1-5 years | 29,052 | 11,537 | |||||||
Machinery and equipment | 5 years | 587 | — | |||||||
Office buildings | 4-15 years | 1,844 | 279 | |||||||
Computer equipment and software | 3-4 years | 1,785 | 915 | |||||||
Furniture and fixtures | 4 years | 939 | 614 | |||||||
Leasehold improvements | 3-5 years | 1,458 | 419 | |||||||
Office equipment and furniture | 3-5 years | 475 | 150 | |||||||
| 247,191 | 81,295 | |||||||||
Less: accumulated depreciation | (34,728 | ) | (9,494 | ) | ||||||
| 212,463 | 71,801 | |||||||||
Construction in progress | 2,394 | — | ||||||||
Assets not yet placed in service | 5,077 | 2,782 | ||||||||
Land | 843 | — | ||||||||
| $ | 220,777 | $ | 74,583 | |||||||
Depreciation expense for the years ended December 30, 2006, 2005 and 2004 was approximately $26.2 million, $7.2 million and $1.8 million, respectively.
F-21
Table of Contents
Index to Financial Statements
STALLION OILFIELD SERVICES LTD. AND SUBSIDIARIES
NOTES TO CONSOLIDATED FINANCIAL STATEMENTS—(Continued)
DECEMBER 31, 2006 AND 2005
4. INTANGIBLE AND OTHER ASSETS
Intangible and other assets are summarized as follows (in thousands):
| December 31, | ||||||||
| 2006 | 2005 | |||||||
Intangible and other assets subject to amortization: | ||||||||
Customer lists | $ | 20,151 | $ | 3,200 | ||||
Non-compete agreements | 3,373 | 1,596 | ||||||
Debt issuance costs | 7,753 | 1,545 | ||||||
Consulting agreement | 96 | 96 | ||||||
| 31,373 | 6,437 | |||||||
Less: accumulated amortization | (6,737 | ) | (1,028 | ) | ||||
Total intangible and other assets | $ | 24,636 | $ | 5,409 | ||||
Amortization expense was approximately $3.8 million, $0.6 million and $0.1 million for the years ended December 31, 2006, 2005 and 2004, respectively. The estimated amortization expense for intangibles subject to amortization is projected to be $3.5 million for 2007, $2.7 million for 2008, $2.2 million for 2009, $1.8 million for 2010, $1.8 million for 2011, and $7.6 million thereafter. Amortization expense for debt issuance costs, which will be charged to interest expense, is projected to be $5.0 million for 2007.
The Partnership performed its annual impairment analysis of intangible assets not subject to amortization as of December 31, 2006 and 2005 and concluded that an impairment charge was not required.
5. DETAIL OF CERTAIN BALANCE SHEET ACCOUNTS
Accounts receivable consisted of the following (in thousands):
| December 31, | ||||||||
| 2006 | 2005 | |||||||
Billed accounts receivable | $ | 64,338 | $ | 21,454 | ||||
Unbilled receivables | 4,073 | 1,122 | ||||||
Other receivables | 353 | 45 | ||||||
| 68,764 | 22,621 | |||||||
Less: allowance for doubtful accounts | (987 | ) | (273 | ) | ||||
Net trade receivables | $ | 67,777 | $ | 22,348 | ||||
F-22
Table of Contents
Index to Financial Statements
STALLION OILFIELD SERVICES LTD. AND SUBSIDIARIES
NOTES TO CONSOLIDATED FINANCIAL STATEMENTS—(Continued)
DECEMBER 31, 2006 AND 2005
Accrued liabilities consisted of the following (in thousands):
| December 31, | ||||||
| 2006 | 2005 | |||||
Accrued payroll and payroll taxes | $ | 3,322 | 750 | |||
Accrued other taxes | 1,758 | 877 | ||||
Accrued bonuses | 1,363 | 798 | ||||
Accrued interest | 949 | 403 | ||||
Accrued federal and state income taxes | 617 | 795 | ||||
Accrued insurance | 617 | 544 | ||||
Other accrued expenses | 2,716 | 1,258 | ||||
Total accrued expenses | $ | 11,342 | $ | 5,425 | ||
6. LONG-TERM DEBT AND NOTES PAYABLE
On March 28, 2006 the Partnership amended and restated its existing secured credit facility (as amended and restated, the “Credit Agreement”) with UBS AG, Stamford Branch as Issuing Bank, Administrative Agent and Collateral Agent (“UBS AG”) and certain other financial institutions. The Credit Agreement provides for a $165 million term loan (the “Term Loan Facility”) that will mature on March 1, 2012, and up to $50 million in borrowing capacity under a revolving credit facility (the “Revolving Credit Facility”) that will mature on March 1, 2011. The Credit Agreement also provides up to $20 million for the issuance of letters of credit. Any outstanding letters of credit reduce borrowing capacity under the Revolving Credit Facility.
In conjunction with our acquisition of AOQ we further amended and restated our Credit Agreement on July 31, 2006 to provide for a Term Loan of $210 million and a Revolving Credit Facility of $70 million. All other significant terms and conditions were unchanged.
Subject to certain limitations, the Partnership has the ability to elect how interest under the Credit Agreement will be computed. Interest under the Credit Agreement may be determined by reference to (1) the London Interbank Offered Rate (“LIBOR”) plus an applicable margin between 2.75 percent and 3.25 percent depending on the credit rating of commitments under the Credit Agreement, or (2) the greater of (a) the base rate charged by UBS AG and (b) the Federal Funds Rate, plus 0.5 percent, plus an applicable margin between 1.75 percent and 2.25 percent depending on the credit rating of commitments under the Credit Agreement. If an event of default exists under the Credit Agreement, advances will bear interest at the then applicable rate plus 2 percent. Interest is payable quarterly in arrears for base rate loans and at the end of the applicable interest periods for LIBOR loans.
All of the Partnership’s obligations under the Credit Agreement are secured by first priority security interests on substantially all assets of the Partnership. Additionally, all of the Partnership’s subsidiaries have guaranteed our obligations under the Credit Agreement.
The Credit Agreement contains various standard covenants that place limits on the operation of the Partnership. Some of these covenants require the Partnership and its subsidiaries, on a consolidated basis, to maintain specific ratios or conditions (with such ratios tested at the end of each fiscal quarter).
Under the Credit Agreement, the Partnership is permitted to prepay certain borrowings. In addition, the Credit Agreement requires the Partnership to make prepayments in certain situations.
F-23
Table of Contents
Index to Financial Statements
STALLION OILFIELD SERVICES LTD. AND SUBSIDIARIES
NOTES TO CONSOLIDATED FINANCIAL STATEMENTS—(Continued)
DECEMBER 31, 2006 AND 2005
If an event of default exists under the Credit Agreement, the lenders may accelerate the maturity of the obligations outstanding under the Credit Agreement and they may exercise other rights and remedies. While an event of default is continuing, advances will bear interest at the then applicable rate plus 2 percent. As of December 31, 2006, the Partnership was in compliance with all of its debt covenants.
For the years ended December 31, 2006, 2005 and 2004, our weighted average interest rate on outstanding borrowings was approximately 7.84 percent, 6.75 percent and 5.09 percent, respectively.
Long-term debt and notes payable consists of the following (in thousands):
| December 31, | ||||||||
| 2006 | 2005 | |||||||
Term Loan and Revolving Credit pursuant to Credit Agreement | $ | 253,040 | $ | 52,316 | ||||
Note payable to a partner | — | 9,642 | ||||||
Notes payable to sellers of acquired businesses | 4,189 | 3,509 | ||||||
Other notes payable | — | 1,567 | ||||||
| 257,229 | 67,034 | |||||||
Less: current maturities | (1,913 | ) | (11,933 | ) | ||||
| $ | 255,316 | $ | 55,101 | |||||
As of December 31, 2006 notes payable to sellers of acquired businesses had a principal balance outstanding of approximately $4.2 million. The notes are due in monthly installments totaling approximately $134,000 plus interest at rates ranging from 7 percent to the prime rate. One note is due in quarterly installments of $75,000 plus interest at 5 percent. All of the notes are subordinated to the Partnership’s bank debt.
As of December 31, 2005 notes payable to the sellers of acquired businesses included two unsecured subordinated convertible notes payable to the sellers of acquired businesses of approximately $975,000 bearing interest at 7 percent as of December 31, 2005. The notes and related interest were payable in monthly installments of approximately $16,250 maturing January 2009. Under the terms of the note agreements, 50 percent of the unpaid principal balances and any accrued interest thereon became convertible into Class C units of Stallion Holdings at the option of the note holder. This conversion option was scheduled to expire on January 31, 2007. All amounts outstanding were paid in full in January 2006.
As part of the reorganization of the Partnership in January 2005, the Partnership issued a subordinated note payable to a partner bearing interest of 12 percent, maturing in July of 2010. The note had a face amount of $10.0 million and was issued with 430,133 C units of Stallion Holdings. The note balance as of December 31, 2005 was $9.61 million net of unamortized discount of approximately $358,000. This note was paid in full and the remaining discount was charged to interest expense in March 2006.
In January 2007, we completed a private offering for $300.0 million aggregate principal amount of 9.75 percent Senior Notes due February 1, 2015. The net proceeds from the offering were used to retire the then outstanding Term B Loan balance and to repay current borrowings under the revolving credit facility. Future
F-24
Table of Contents
Index to Financial Statements
STALLION OILFIELD SERVICES LTD. AND SUBSIDIARIES
NOTES TO CONSOLIDATED FINANCIAL STATEMENTS—(Continued)
DECEMBER 31, 2006 AND 2005
maturities of long-term debt, updated for the 9.75 percent Senior Notes offering and the concurrent restructuring of the Revolving Credit Agreement (see Note 15), are as follows (in thousands):
Year Ending December 31, | |||
2007 | $ | 1,913 | |
2008 | 1,480 | ||
2009 | 677 | ||
2010 | 119 | ||
2011 | — | ||
Thereafter | 253,040 | ||
| $ | 257,229 | ||
7. CAPITAL LEASE OBLIGATIONS
The Partnership leases certain equipment which has been classified as capital leases. The aggregate cost and accumulated depreciation of assets under capital leases are as follows (in thousands):
| December 31, | ||||||||
| 2006 | 2005 | |||||||
Workforce accommodation units | $ | 768 | $ | 768 | ||||
Vehicles | 514 | 577 | ||||||
Forklifts | 171 | 171 | ||||||
Trash containers | 87 | 87 | ||||||
| 1,540 | 1,603 | |||||||
Less: accumulated depreciation | (855 | ) | (684 | ) | ||||
| $ | 685 | $ | 919 | |||||
Depreciation for such assets is included in depreciation expense.
8. LEASE COMMITMENTS
The Partnership leases equipment and office space from a related party (see Note 10) and various unrelated parties in various locations under non-cancelable operating leases. Aggregate rent expense under these operating leases and other vehicle leases charged to income was approximately $1.7 million, $1.6 million and $0.6 million for the twelve months ended December 31, 2006, 2005 and 2004, respectively.
The minimum future lease payments required under current non-cancelable operating lease agreements as of December 31, 2006, having remaining terms in excess of one year as of December 31, 2006 for each of the next five years and in the aggregate, are as follows (in thousands):
Years Ending December 31, | |||
2007 | $ | 1,549 | |
2008 | 1,021 | ||
2009 | 645 | ||
2010 | 504 | ||
2011 | 132 | ||
| $ | 3,851 | ||
F-25
Table of Contents
Index to Financial Statements
STALLION OILFIELD SERVICES LTD. AND SUBSIDIARIES
NOTES TO CONSOLIDATED FINANCIAL STATEMENTS—(Continued)
DECEMBER 31, 2006 AND 2005
9. INCOME TAXES
Certain subsidiaries of the Partnership are ‘C’ corporations and are subject to federal and state income taxes. Those subsidiaries account for income taxes in accordance with the asset and liability approach prescribed by SFAS No. 109. Deferred income tax assets and liabilities are determined based upon differences between financial reporting and tax bases of assets and liabilities and are measured using the enacted tax rates and laws that will be in effect when the differences are expected to reverse.
Prior to January 2005 the Partnership did not have any subsidiaries that were ‘C’ Corporations. The Partnership’s income tax (benefit) provision attributable to income before income tax consisted of the following (in thousands):
Years Ended December 31, | |||||||
| 2006 | 2005 | ||||||
Current: | |||||||
U.S. federal | $ | 2,651 | $ | 561 | |||
State | 500 | 110 | |||||
Total current | 3,151 | 671 | |||||
Deferred: | |||||||
U.S. federal | 1,465 | (73 | ) | ||||
State | 311 | — | |||||
Total deferred | 1,776 | (73 | ) | ||||
| $ | 4,927 | $ | 598 | ||||
The difference between the tax provision at the statutory federal income tax rate and the tax provision attributable to income before income tax for the years ended December 31, 2006, and 2005 is analyzed below (in thousands):
| Years Ended December 31, | ||||||||||||||
| 2006 | % | 2005 | % | |||||||||||
Statutory federal income tax rate | $ | 10,744 | 35.00 | % | $ | 2,809 | 35.00 | % | ||||||
Effect of state income tax, net | 529 | 1.72 | 71 | 0.89 | ||||||||||
Partnership income tax attributable to partners | (6,504 | ) | (21.19 | ) | (2,312 | ) | (28.80 | ) | ||||||
Effect of nondeductible expenses | 127 | .42 | 37 | 0.46 | ||||||||||
Other | 31 | .10 | (7 | ) | (0.10 | ) | ||||||||
| $ | 4,927 | 16.05 | % | $ | 598 | 7.45 | % | |||||||
In accordance with SFAS No. 109, deferred tax assets and liabilities are recognized for future tax effects of temporary differences between the tax basis of an asset or liability and its reported amount in the financial statements. The measurement of deferred tax assets and liabilities is based on enacted tax laws and rates currently in effect in each of the taxing jurisdictions in which the Partnership has operations (U.S. federal and states only).
F-26
Table of Contents
Index to Financial Statements
STALLION OILFIELD SERVICES LTD. AND SUBSIDIARIES
NOTES TO CONSOLIDATED FINANCIAL STATEMENTS—(Continued)
DECEMBER 31, 2006 AND 2005
Deferred tax assets and liabilities are classified as current or non-current according to the classification of the related asset or liability for financial reporting purposes. The components of the net deferred tax assets (liabilities) were as follows (in thousands):
| December 31, | |||||||
| 2006 | 2005 | ||||||
Deferred tax assets (liabilities)—current: | |||||||
Deferred compensation | $ | 44 | $ | 232 | |||
Bad debt allowances | 110 | 27 | |||||
Accrued bonuses | 143 | — | |||||
Prepaid insurance and other | (125 | ) | — | ||||
Inventory | (98 | ) | — | ||||
Other | (45 | ) | — | ||||
Deferred tax assets—current, net | $ | 29 | $ | 259 | |||
Deferred tax liabilities—noncurrent: | |||||||
Property, plant and equipment | $ | 9,391 | $ | 584 | |||
Intangibles | 705 | 705 | |||||
Other | 134 | — | |||||
Deferred tax liabilities—noncurrent | $ | 10,230 | $ | 1,289 | |||
10. RELATED PARTY TRANSACTIONS
In December 2006 we made certain loans aggregating approximately $10 million to certain of our executive officers. These notes have a ten year maturity and bear interest at the “Annually Compounded Short Term Applicable Federal Rate” as published monthly by the Internal Revenue Service under Section 1274(d) of the Internal Revenue Code. The notes can be accelerated by us upon certain acceleration events including an initial public offering.
The Partnership leases office space and vehicles from a number of related parties. Rent expense under these non-cancelable operating leases charged to income was approximately $593,000, $378,000 and $130,000 for the years ended December 31, 2006, 2005 and 2004, respectively.
Sales commissions are payable to a company owned by an employee of the Partnership for sales originating from this entity. These commissions were charged to income and amounted to approximately $205,000, $325,000 and $206,000 for the years ended December 31, 2006, 2005 and 2004, respectively.
In addition, the Partnership leases certain chartered aircraft from Permian Mud Service and Champ Air. Stallion shares in the operating expenses and pays direct expenses of approximately $600,000 annually. Permian Mud Service and Champ Air are also owned and operated by the father of Stallion’s Chief Executive Officer, President and Chairman of the board of directors. Stallion paid $636,000 to Permian Mud Service and Champ Air during 2006. During 2005, the Partnership did not incur any expense related to Permian Mud or Champ Air. The term of the lease for this plane will expire on December 31, 2006, but will continue on a month-to-month basis thereafter.
During 2006, Stallion also leased an aircraft from Rivers Aviation in connection with the performance of the duties of the division manager of the solids control service line. Rivers Aviation is owned by the former division
F-27
Table of Contents
Index to Financial Statements
STALLION OILFIELD SERVICES LTD. AND SUBSIDIARIES
NOTES TO CONSOLIDATED FINANCIAL STATEMENTS—(Continued)
DECEMBER 31, 2006 AND 2005
manager of the solids control service line. For the year ended December 31, 2006, the Partnership paid $234,000 to Rivers Aviation. During 2005, the Partnership did not incur any expense related to Rivers Aviation. The lease was subsequently cancelled in February of 2007.
We lease an industrial facility in Alice, Texas from Q2 Rentals, L.L.C. for approximately $90,000 per year. Pursuant to an informal arrangement, we lease a houseboat and certain other recreational boats in coastal Louisiana on a month-to-month basis from Q2 Rentals in exchange for paying the operating expenses of the facilities which were approximately $160,000 for the year ended December 31, 2006. Q2 Rentals is operated by Mr. David M. Johnson, Mr. Craig Johnson’s father, and owned equally by Mr. Craig Johnson, Mr. Clayton D. Johnson, Mr. Craig Johnson’s brother, and Mr. David M. Johnson.
It is customary for the Partnership to lease real property from the former owners of acquired businesses. It is typical for many of these former owners to also be employed by the Partnership. Thus, Stallion and certain of its employees may be parties to leases relating to real property.
We believe that all of these related party transactions were either on terms at least as favorable to us as could have been obtained through arm’s-length negotiations with unaffiliated third parties or were negotiated in connection with acquisitions, the overall terms of which were as favorable to us as could have been obtained through arm’s-length negotiations with unaffiliated third parties.
11. SUPPLEMENTAL INFORMATION FOR STATEMENTS OF CASH FLOWS
| Years Ended December 31, | |||||||||
| 2006 | 2005 | 2004 | |||||||
Interest paid | $ | 16,185 | $ | 3,596 | $ | 768 | |||
Non-cash investing and financing activities: | |||||||||
Accounts receivable and property and equipment purchases financed with debt and capital leases | $ | — | $ | 511 | $ | 1,707 | |||
Conversion of notes payable into limited partner interest | $ | 250 | $ | 500 | $ | — | |||
Limited partner interest issued in connection with note payable | $ | — | $ | 430 | $ | — | |||
Distribution payable | $ | 1,800 | $ | 786 | $ | — | |||
Limited partner interest issued in connection with acquisition | $ | 22,950 | $ | — | $ | — | |||
12. BUSINESS SEGMENT INFORMATION
Statement of Financial Accounting Standards No. 131 “Disclosure about Segments of an Enterprise and Related Information” establishes standards for the reporting of information about operating segments, products and services, geographic area and major customers. The method of determining what information to report is based on the way management organizes the operating segments within the Partnership for making operational decisions and assessments of financial performance.
F-28
Table of Contents
Index to Financial Statements
STALLION OILFIELD SERVICES LTD. AND SUBSIDIARIES
NOTES TO CONSOLIDATED FINANCIAL STATEMENTS—(Continued)
DECEMBER 31, 2006 AND 2005
During December 31, 2006, the Partnership provided its services through two operating segments to customers to support its operations before, during and after drilling operations. Prior to the acquisition of BLR in March 2006, the Partnership operated in only one segment. The following is a description of operating segments as of December 31, 2006:
Wellsite Support Services. The Partnership offers two types of wellsite support services: workforce accommodation and solids control. Workforce accommodation services include workforce accommodation and related services, which are designed to house various personnel on location before, during and after drilling operations. In addition to workforce accommodation services, the Partnership also provides surface rental equipment including forklifts, manlifts, light plants, generators, compressors, loaders, trash containers and water systems. Integrated communications services are provided with the StaRComm service offering. The StaRComm system includes a satellite communication system that provides wireless intercoms integrated with telephone, fax and internet/data services throughout the drilling location.
Construction and Logistics Services. Through the construction and logistics services segment the Partnership offers two types of services: rig hauling and wellsite construction. Rig hauling services involve the moving and rig-up/rig-down of drilling rigs and related equipment. Heavy haul trucks, trailers and cranes provide the capability of rigging-down, transporting to the next drilling location and rigging-up of the drilling rig. The Partnership provides construction services as the initial step of any new well project on land and inland marine environments. Location construction is the first step to occur after the well stake is placed marking the location for the well. In marshy areas and areas subject to greater rainfall and flooding, drilling locations require mats to maintain stability of the soil and drilling site. In addition, it also performs wellsite configuration and setup of production equipment, pipeline construction and tie-in, and location decommissioning.
Corporate expenses include general corporate expenses associated with managing all reportable operating segments. Corporate assets consist principally of working capital and debt financing costs.
F-29
Table of Contents
Index to Financial Statements
STALLION OILFIELD SERVICES LTD. AND SUBSIDIARIES
NOTES TO CONSOLIDATED FINANCIAL STATEMENTS—(Continued)
DECEMBER 31, 2006 AND 2005
The following table sets forth certain financial information with respect to reportable segments for the years ended December 31, 2006, 2005 and 2004 (in thousands):
| Wellsite Support Services | Construction and Logistics | Corporate and Eliminations | Total | ||||||||||
2006: | |||||||||||||
Revenue | $ | 162,661 | $ | 77,749 | $ | — | $ | 240,410 | |||||
Cost of services | 74,200 | 42,319 | — | 116,519 | |||||||||
Segment operating profit | 70,722 | 21,166 | (11,357 | ) | 80,531 | ||||||||
Depreciation and amortization | 19,214 | 9,162 | 1,692 | 30,068 | |||||||||
Capital expenditures(1) | 60,887 | 29,182 | 1,960 | 92,029 | |||||||||
Identifiable assets | 284,098 | 146,750 | 16,059 | 446,907 | |||||||||
2005: | |||||||||||||
Revenue | $ | 73,126 | $ | — | $ | — | $ | 73,126 | |||||
Cost of services | 42,281 | — | — | 42,281 | |||||||||
Segment operating profit | 24,765 | — | (3,803 | ) | 20,962 | ||||||||
Depreciation and amortization | 7,461 | — | 337 | 7,798 | |||||||||
Capital expenditures(1) | 35,361 | — | 590 | 35,951 | |||||||||
Identifiable assets | 118,744 | — | 4,392 | 123,136 | |||||||||
2004: | |||||||||||||
Revenue | $ | 15,452 | $ | — | $ | — | $ | 15,452 | |||||
Cost of services | 8,695 | — | — | 8,695 | |||||||||
Segment operating profit | 6,023 | — | (3,011 | ) | 3,012 | ||||||||
Depreciation and amortization | 1,847 | — | 77 | 1,924 | |||||||||
Capital expenditures(1) | 5,901 | — | 60 | 5,961 | |||||||||
Identifiable assets | 24,220 | — | 493 | 24,713 | |||||||||
| (1) | Excludes acquisitions |
The following table summarizes the changes in the carrying amount of goodwill by segment for the three years ended December 31, 2006 (in thousands):
| Wellsite Support Services | Construction and Logistics | Total | |||||||
Balance as of January 1, 2004 | $ | 6,196 | $ | — | $ | 6,196 | |||
2004 acquisitions | 248 | — | 248 | ||||||
Balance as of December 31, 2004 | 6,444 | — | 6,444 | ||||||
2005 acquisitions | 12,681 | — | 12,681 | ||||||
Balance as of December 31, 2005 | 19,125 | — | 19,125 | ||||||
2006 acquisitions | 53,109 | 38,176 | 91,285 | ||||||
Balance as of December 31, 2006 | $ | 72,234 | $ | 38,176 | $ | 110,410 | |||
F-30
Table of Contents
Index to Financial Statements
STALLION OILFIELD SERVICES LTD. AND SUBSIDIARIES
NOTES TO CONSOLIDATED FINANCIAL STATEMENTS—(Continued)
DECEMBER 31, 2006 AND 2005
13. LEGAL MATTERS AND CONTINGENCIES
In the normal course of our business, we are party to various pending or threatened claims, lawsuits and administrative proceedings seeking damages or other remedies concerning our commercial operations, employees and other matters. Many of the claims against us relate to motor vehicle accidents which can result in loss of life or serious bodily injury. Although we cannot know the outcome of pending legal proceedings and the effect such outcomes may have on us, we believe that any liability resulting from the outcome of such proceedings, to the extent not otherwise provided for or covered by insurance, will not have a material adverse effect on our financial position, results of operations or liquidity.
14. RECENT ACCOUNTING PRONOUNCEMENTS
In February 2006, the FASB issued Statement of Financial Accounting Standards No. 155, “Accounting for Certain Hybrid Financial Instruments.” (“SFAS No. 155”). SFAS No. 155 provides entities with relief from having to separately determine the fair value of an embedded derivative that would otherwise be require to be bifurcated from its host contract in accordance with SFAS No. 133, Accounting for Derivative Instruments and Hedging Activities. SFAS No. 155 allows an entity to make an irrevocable election to measure such a hybrid financial investment at fair value in its entirety, with changes in fair value recognized in earning. SFAS No. 155 is effective for all financial instruments acquired, issued or subject to a re-measurement event occurring after the beginning of an entity’s first fiscal year that begins after September 15, 2006. We believe that the adoption of SFAS No. 155 will not have a material impact on our financial position, results of operations or cash flows.
In March 2006, the FASB issued Statement of Financial Accounting Standards No. 156 “Accounting for Servicing of Financial Assets – An Amendment to FASB Statement No. 140.” (SFAS No. 156”). SFAS No. 156 require entities to recognize a servicing asset or liability each time they undertake an obligation to service a financial asset by entering into a servicing contract in certain situations. This statement also requires all separately recognized servicing assets and servicing liabilities to be initially measured at fair value and permits a choice of either the amortization or fair value measurement method for subsequent measurement. The effective date of this statement is for annual periods beginning after September 15, 2006, with earlier adoption permitted as of the beginning of an entity’s fiscal year provided the entity has not issued any financial statements for that year. We do not plan to adopt SFAS No. 156 early, and we are currently assessing the impact on our Consolidated Financial Statements.
In July 2006, the FASB issued an interpretation entitled “Accounting for Uncertainty in Income Taxes—an interpretation of FASB No. 109,” (“FIN 48”). FIN 48 clarifies the accounting for uncertain tax provisions that may have been taken by an entity. Specifically, FIN 48 prescribes a more-likely-than-not recognition threshold to measure a tax position taken or expected to be taken in a tax return through a two-step process: (1) determining whether it is more likely than not that a tax position will be sustained upon examination by taxing authorities, after all appeals, based upon the technical merits of the position; and, (2) measuring to determine the amount of benefit/expense to recognize in the financial statements, assuming taxing authorities have all relevant information concerning the issue. That tax position is measured at the largest amount of benefit/expense that is greater than 50 percent likely of being realized upon ultimate settlement. This pronouncement also specifies how to present a liability for unrecognized tax benefits in a classified balance sheet, but does not change the classification requirements for deferred taxes. Under FIN 48, if a tax position previously failed the more-likely-than-not recognition threshold, it should be recognized in the first subsequent financial reporting period in which the threshold is met. Similarly, a position that no longer meets this recognition threshold should be derecognized in the first financial reporting period that the threshold is no longer met. FIN 48 becomes effective for fiscal years
F-31
Table of Contents
Index to Financial Statements
STALLION OILFIELD SERVICES LTD. AND SUBSIDIARIES
NOTES TO CONSOLIDATED FINANCIAL STATEMENTS—(Continued)
DECEMBER 31, 2006 AND 2005
beginning after December 15, 2006, with earlier adoption encouraged. We are currently evaluating the impact this statement may have on our financial position, results of operations and cash flow.
In September 2006, the Securities and Exchange Commission staff issued Staff Accounting Bulletin (“SAB”) No. 108, incorporated into the SEC Rules and Regulations as Section N to Topic 1, “Financial Statements,” which provided guidance concerning the effects of prior year misstatements in quantifying current year misstatements for the purpose of materiality assessments. Specifically, entities must consider the effects of prior year unadjusted misstatements when determining whether a current year misstatement will be considered immaterial to the financial statements at the current reporting period and record the adjustment, if deemed material. SAB No. 108 provides a dual approach in order to quantify errors under the following methods: (1) a roll-over method which quantifies the amount by which the current year income statement is misstated, and (2) the “iron curtain” method which quantifies a cumulative error by which the current year balance sheet is misstated. Entities may be required to record errors that occurred in prior years even if those errors were insignificant to the financial statements during the year in which the errors arose. SAB No. 108 became effective as of the beginning of the fiscal year ending after November 15, 2006. Upon adoption, entities may either restate the financial statements for each period presented or record the cumulative effect of the error correction as an adjustment to the opening balance of retained earnings at the beginning of the period of adoption, and provide disclosure of each individual error being corrected within the cumulative adjustment, stating when and how each error arose and the fact that the error was previously consider immaterial. The authoritative guidance has no impact on our financial position, results of operations and cash flows,
In September 2006, the FASB issued Statement of Financial Accounting Standards No. 157, “Fair Value Measurements,” (“SFAS No. 157”) a pronouncement which provides additional guidance for using fair value to measure assets and liabilities. The pronouncement states that fair value should be based upon assumptions market participants would use to price an asset or liability, and establishes a hierarchy that prioritizes the information used to determine fair value, whereby quoted marked prices in active markets would be given highest priority with lowest priority given to data provided by the reporting entity based on unobservable facts. This standard requires disclosure of fair value measurements by level within this hierarchy. SFAS No. 157 becomes effective in the first interim reporting period for the fiscal years beginning after November 15, 2006, with early adoption permitted. We are currently evaluating the impact this statement may have on our financial position, results of operations and cash flow.
In September 2006, the FASB issued FASB Staff Position No. AUG AIR-1 “Accounting for Planned Major Maintenance Activities” (“FSP No. AUG AIR-1”) FSP No. AUGAIR-1 prohibits the use of accrued-in-advance method for accounting for major maintenance activities and confirms the acceptable methods for planned major maintenance activities. FSP No. AUG AIR-1 is effective the first fiscal year beginning after December 15, 2006. We believe the adoption of FSP No. AUG AIR-1 will not have a material impact on our financial position, results of operations or cash flows.
In February 2007, the FASB issued Statement of Financial Accounting Standards No. 159, “The Fair Value Option for Financial Assets and Financial Liabilities — Including an Amendment of FASB Statement No. 115,” (“SFAS No. 159”). This pronouncement permits entities to use the fair value method to measure certain financial assets and liabilities by electing an irrevocable option to use the fair value method at specified election dates. After election of the option, subsequent changes in fair value would result in the recognition of unrealized gains or losses as period costs during the period the change occurred. SFAS No. 159 becomes effective as of the beginning of the first fiscal year that begins after November 15, 2007, with early adoption permitted. However, entities may not retroactively apply the provisions of SFAS No. 159 to fiscal years preceding the date of
F-32
Table of Contents
Index to Financial Statements
STALLION OILFIELD SERVICES LTD. AND SUBSIDIARIES
NOTES TO CONSOLIDATED FINANCIAL STATEMENTS—(Continued)
DECEMBER 31, 2006 AND 2005
adoption. We are currently evaluating the impact that SFAS No. 159 may have on our financial position, results of operations and cash flows.
15. SUBSEQUENT EVENTS
Senior Notes
In a private placement on January 19, 2007, Stallion issued $300.0 million of 9.75 percent Senior Notes due February 1, 2015 (“Senior Notes”). Proceeds from the sale of the Senior Notes were used to retire the outstanding balance on the $210.0 million Term B Loan and to pay down approximately $44.5 million under the revolving credit facility. Concurrent with the placement of the Senior Notes, we amended our existing senior secured credit facility to increase the revolving line from $70.0 million to $125.0 million and reduced the applicable interest rate to LIBOR plus 2.00 percent. The revolving credit covenant package was also amended to provide greater operating flexibility.
Interest payments on the Senior Notes are due semi-annually, on February 1 and August 1, commencing on August 1, 2007. The Senior Notes are non-convertible, unsecured and guaranteed by all the subsidiaries of the Partnership. In connection with the retirement of the Term B Loan on January 19, 2007, we will expense the remaining unamortized deferred debt issuance costs which amounted to approximately $4.8 million.
The Senior Notes are redeemable at the option of the Partnership on or after February 1, 2011 at the specified redemption price as described in the Indenture. The Senior Notes will be redeemable by the Partnership, in whole or in part, at any time prior to February 1, 2011 at a discount rate of the U.S. Treasury Rate for a specified period of time plus 50 basis points. Prior to February 1, 2010 Stallion may redeem up to 35 percent of the Senior Notes with the proceeds of certain equity offerings at a redemption price equal to 109.75 percent of the principal amount of the Senior Notes, plus accrued and unpaid interest and liquidated damages, if any, to the date of redemption. This redemption must occur less than 90 days after the date of the closing of any such qualified equity offering.
Following a change of control, as defined in the indenture, the Partnership will be required to make an offer to repurchase all or any portion of the 9.75 percent Senior Notes at a purchase price of 101 percent of the principal amount, plus accrued and unpaid interest and liquidated damages, if any, to the date of repurchase.
The Senior Notes contain certain covenants that limit the ability of the Partnership and its restricted subsidiaries to, among other things: incur additional debt, incur layered debt, consolidate or merge with or into other companies, comply with limitations on asset sales, limitations on restricted payments, limitations on dividends and other restrictions, limitations on transactions with affiliates, and additional note guarantees. The restrictive covenants are subject to a number of important exemptions and qualifications set forth in the Indenture.
As part of the issuance of the above-mentioned Senior Notes, the Partnership incurred debt issuance costs of approximately $8.5 million, which will be amortized to interest expense using the straight line method, which approximates the effective interest method over the term of the Senior Notes.
F-33
Table of Contents
Index to Financial Statements
To the Board of Directors
Abbeville Offshore Quarters, Inc.
Abbeville, Louisiana
We have audited the accompanying balance sheet of Abbeville Offshore Quarters, Inc. (an S Corporation) as of July 31, 2006, and the related statements of operations, stockholders’ equity and cash flows for the seven month period ended July 31, 2006. The financial statements are the responsibility of the Company’s management. Our responsibility is to express an opinion on these financial statements based on our audit.
We conducted our audit in accordance with auditing standards generally accepted in the United States of America. Those standards require that we plan and perform the audit to obtain reasonable assurance about whether the financial statements are free of material misstatement. An audit includes examining, on a test basis, evidence supporting the amounts and disclosures in the financial statements. An audit also includes assessing the accounting principles used and significant estimates made by management, as well as evaluating the overall financial statement presentation. We believe that our audit provides a reasonable basis for our opinion.
In our opinion, the financial statements referred to above present fairly, in all material respects, the financial position of Abbeville Offshore Quarters, Inc. as of July 31, 2006, and the results of its operations and its cash flows for the seven month period then ended, in conformity with accounting principles generally accepted in the United States of America.
Our audit was conducted for the purpose of forming an opinion on the basic financial statements taken as a whole. The supplemental schedule on page F-45 is presented for the purposes of additional analysis and is not required as part of the basic financial statements. Such information has been subjected to the auditing procedures applied in the audit of the basic financial statements and, in our opinion, is fairly stated in all material respects in relation to the basic financial statements taken as a whole.
| /s/ UHY LLP |
| UHY LLP |
Houston, Texas
April 11, 2007
F-34
Table of Contents
Index to Financial Statements
ABBEVILLE OFFSHORE QUARTERS, INC.
JULY 31, 2006
ASSETS | |||
CURRENT ASSETS | |||
Cash and cash equivalents | $ | 1,128,374 | |
Accounts receivable—trade, net | 9,984,444 | ||
Accounts receivable—other | 62,422 | ||
Due from stockholders | 47,409 | ||
Costs and estimated earnings in excess of billings on uncompleted contracts | 323,194 | ||
Inventory | 199,404 | ||
Prepaid expenses and other current assets | 426,233 | ||
TOTAL CURRENT ASSETS | 12,171,480 | ||
PROPERTY AND EQUIPMENT, net | 18,017,317 | ||
TOTAL ASSETS | $ | 30,188,797 | |
LIABILITIES AND STOCKHOLDERS’ EQUITY | |||
CURRENT LIABILITIES | |||
Accounts payable and accrued expenses | $ | 2,185,325 | |
Billings in excess of costs and estimated earnings on uncompleted contracts | 1,577 | ||
Deferred revenue | 31,860 | ||
Notes payable—related party | 454,018 | ||
Current maturities of long-term debt | 1,676,935 | ||
TOTAL CURRENT LIABILITIES | 4,349,715 | ||
LONG-TERM LIABILITIES | |||
Long-term debt, net of current maturities | 2,511,348 | ||
TOTAL LONG-TERM LIABILITIES | 2,511,348 | ||
TOTAL LIABILITIES | 6,861,063 | ||
STOCKHOLDERS’ EQUITY | 23,327,734 | ||
TOTAL LIABILITIES AND STOCKHOLDERS’ EQUITY | $ | 30,188,797 | |
See notes to financial statements.
F-35
Table of Contents
Index to Financial Statements
ABBEVILLE OFFSHORE QUARTERS, INC.
SEVEN MONTHS ENDED JULY 31, 2006
REVENUE | $ | 17,082,386 | ||
COST OF REVENUE | 8,085,837 | |||
GROSS PROFIT | 8,996,549 | |||
OPERATING EXPENSES | 2,397,685 | |||
OPERATING INCOME | 6,598,864 | |||
OTHER INCOME (EXPENSE) | ||||
Interest income | 1,278 | |||
Interest expense | (223,954 | ) | ||
Other income | 107,941 | |||
TOTAL OTHER INCOME (EXPENSE) | (114,735 | ) | ||
NET INCOME | $ | 6,484,129 | ||
See notes to financial statements.
F-36
Table of Contents
Index to Financial Statements
ABBEVILLE OFFSHORE QUARTERS, INC.
STATEMENT OF STOCKHOLDERS’ EQUITY
SEVEN MONTHS ENDED JULY 31, 2006
| Additional Paid-in Capital | Retained Earnings | Total Stockholders’ Equity | |||||||||
Balance as of January 1, 2006 | $ | 215,421 | $ | 16,670,184 | $ | 16,885,605 | |||||
Distributions | — | (42,000 | ) | (42,000 | ) | ||||||
Net income | — | 6,484,129 | 6,484,129 | ||||||||
Balance as of July 31, 2006 | $ | 215,421 | $ | 23,112,313 | $ | 23,327,734 | |||||
See notes to financial statements.
F-37
Table of Contents
Index to Financial Statements
ABBEVILLE OFFSHORE QUARTERS, INC.
SEVEN MONTHS ENDED JULY 31, 2006
CASH FLOWS FROM OPERATING ACTIVITIES | ||||
Net income | $ | 6,484,129 | ||
Adjustments to reconcile net income to net cash provided by operating activities: | ||||
Depreciation | 1,483,420 | |||
Bad-debt expense | 660,866 | |||
Gain on sale of property and equipment | (407,454 | ) | ||
Change in operating assets and liabilities: | ||||
Accounts receivable—trade | (3,930,316 | ) | ||
Accounts receivable—other | 899,694 | |||
Costs and estimated earnings in excess of billings on uncompleted contracts | 727,694 | |||
Prepaid expenses and other current assets | (194,771 | ) | ||
Inventory | (3,537 | ) | ||
Accounts payable and accrued expenses | 283,311 | |||
Deferred revenue | 31,860 | |||
Billings in excess of costs and estimated earnings on uncompleted contracts | (275,994 | ) | ||
NET CASH PROVIDED BY OPERATING ACTIVITIES | 5,758,902 | |||
CASH FLOWS FROM INVESTING ACTIVITIES | ||||
Purchase of fixed assets | (4,526,797 | ) | ||
Proceeds received from disposal of property and equipment | 566,946 | |||
Change in other noncurrent assets | 15,155 | |||
NET CASH USED IN INVESTING ACTIVITIES | (3,944,696 | ) | ||
CASH FLOWS FROM FINANCING ACTIVITIES | ||||
Proceeds from issuance of long-term debt | 408,186 | |||
Repayment of long-term debt | (1,188,776 | ) | ||
Net borrowings on notes payable—related party | 99,906 | |||
Distributions | (42,000 | ) | ||
Net decrease on due from stockholders | (105,772 | ) | ||
NET CASH USED IN FINANCING ACTIVITIES | (828,456 | ) | ||
NET INCREASE IN CASH AND CASH EQUIVALENTS | 985,750 | |||
CASH AND CASH EQUIVALENTS, beginning of year | 142,624 | |||
CASH AND CASH EQUIVALENTS, end of year | $ | 1,128,374 | ||
SUPPLEMENTAL DISCLOSURES OF CASH FLOWS INFORMATION | ||||
Cash paid for interest | $ | 248,405 | ||
See notes to financial statements.
F-38
Table of Contents
Index to Financial Statements
ABBEVILLE OFFSHORE QUARTERS, INC.
JULY 31, 2006
NOTE A—ACCOUNTING POLICIES
Nature of Business: Abbeville Offshore Quarters, Inc. (the “Company”), designs, manufactures and leases building units to be used offshore. The Company has two manufacturing facilities located in Abbeville and the Port of Vermilion, Louisiana. The Company also specializes in offshore refurbishment and maintenance, as well as offering a complete camp setup service including water tanks, pressure sets, sewage treatment units, lights, generators, and linens.
The Company has one class of common stock, no par value, 900 shares authorized. As of July 31, 2006, 900 shares were issued and outstanding.
Cash and Cash Equivalents: For purposes of the statement of cash flows, the Company considers all highly liquid debt instruments purchased with a maturity of three months or less to be cash equivalents. There were no cash equivalents as of July 31, 2006.
Accounts Receivable: The Company extends credit to its customers based on informal discussions with the management and generally collateral is not required. Outstanding accounts receivable are assessed routinely and an allowance is set up when accounts are deemed uncollectible. Accounts receivable are net of allowance for doubtful account of approximately $673,000 as of July 31, 2006.
Inventory: Inventories are valued at the lower of cost or market with cost being determined using the First-in First-out (“FIFO”) method. Market is considered as the lower of either estimated replacement cost or estimated realizable value.
Property and Equipment: Property and equipment are stated at cost. Depreciation is provided by the straight-line method over the estimated useful lives of the related assets. All expenditures for major renewals and betterments are capitalized. Amortization of leasehold improvements is computed using the straight-line method over the shorter of the remaining lease term or the estimated useful lives of the improvements. Expenditures for maintenance and repairs are charged to expense as incurred.
Impairment of Long-lived Assets: The Company evaluates an asset for impairment when events or circumstances indicate that a long-lived asset’s carrying value may not be recovered. These events include market declines, changes in the manner in which the Company intends to use an asset, decisions to sell an asset and adverse changes in the legal or business environment.
If events or circumstances indicated that a long-lived asset’s carrying value may not be recoverable, the Company estimates the future undiscounted cash flows from the asset for which the lowest level of separate cash flows can be measured, to determine if the asset is impaired. If the total undiscounted future cash flows are less than the carrying amount for the asset, the Company estimates the fair value of the asset either through reference to sales data for similar assets, or by using a discounted cash flow approach. The asset’s carrying value is then adjusted downward to the fair value. These cash flow estimates require the Company to make estimates and assumptions for many years into the future for pricing demand, competition, operating costs, legal, regulatory and other factors and these estimates or assumptions could change significantly either positively or negatively.
Revenue and Cost Recognition: Revenue from construction contracts are recognized under the percentage-of-completion method of accounting determined by the ratio of costs incurred to total estimated costs at completion. All known or anticipated losses on contracts are recognized in full when such losses become apparent. Contracts typically range from two to six months in duration. Revenue for contracts based on time and materials are recognized as labor and material costs are incurred. Revenue from other services is recognized as the service is performed.
F-39
Table of Contents
Index to Financial Statements
ABBEVILLE OFFSHORE QUARTERS, INC.
NOTES TO FINANCIAL STATEMENTS—(Continued)
JULY 31, 2006
Income Taxes: The Company has elected to be taxed under the provisions of Subchapter S of the Internal Revenue Code. Under those provisions, the Company does not pay federal corporate income taxes on its taxable income, and is not allowed a net operating loss carryover or carryback as a deduction. Instead, the stockholders are liable for individual federal and state income taxes on their respective shares of the Company’s taxable income.
Advertising Costs: Advertising costs are expensed as incurred. Advertising expense for the seven months ended July 31, 2006 was approximately $78,000.
Concentration of Risk: The Company provides services to a diversified group of customers in the petroleum industry, including major oil companies, located primarily in the Southern United States. Credit is extended based on an evaluation of each customer’s financial condition. Credit losses, upon occurrence, are provided for within the financial statements.
The Company maintains its cash in bank deposit accounts at high credit quality financial institutions. The balances, at times, may exceed federally insured limits. However, these funds are secured by repurchase agreements in the Company’s name.
The customer base for the Company is primarily concentrated in the oil and gas industry. The revenue earned from each customer varies from year to year based on the contracts awarded. During the seven months ended July 31, 2006, the Company had sales to one customer totaling 25% of total revenue with accounts receivable as of July 31, 2006 of approximately $4,797,000.
Use of Estimates: The preparation of financial statements in conformity with accounting principles generally accepted in the United States of America, requires management to make estimates and assumptions that affect the reported amounts of assets and liabilities at the date of the financial statements and the reported amounts of revenues and expenses during the reporting period. Actual results could differ from those estimates.
F-40
Table of Contents
Index to Financial Statements
ABBEVILLE OFFSHORE QUARTERS, INC.
NOTES TO FINANCIAL STATEMENTS—(Continued)
JULY 31, 2006
NOTE B—COSTS AND ESTIMATED EARNINGS ON UNCOMPLETED CONTRACTS
The asset, “Costs and estimated earnings in excess of billings on uncompleted contracts,” represents revenue recognized in excess of amounts billed. The liability, “Billings in excess of costs and estimated earnings on uncompleted contracts,” represents billings in excess of revenue recognized.
Amounts billed and costs and earnings recognized on contracts in progress were:
| July 31, 2006 | ||||
| Costs incurred on uncompleted contracts | $ | 318,841 | ||
| Estimated earnings | 147,151 | |||
Total costs and estimated earnings | 465,992 | |||
Less: billings to date | (144,375 | ) | ||
| $ | 321,617 | |||
Included in the accompanying balance sheet under the following captions:
| July 31, 2006 | ||||
Costs and estimated earnings in excess of billings on uncompleted contracts | $ | 323,194 | ||
Billings in excess of costs and estimated earnings on uncompleted contracts | (1,577 | ) | ||
| $ | 321,617 | |||
NOTE C—PROPERTY AND EQUIPMENT
Major classifications of property and equipment and estimated depreciable lives are as follows:
| Estimated Life | July 31, 2006 | |||||
United States Coast Guard modular rental units | 7 years | $ | 12,413,715 | |||
Modular rental units | 5 years | 4,893,424 | ||||
Machinery and equipment | Various | 1,140,065 | ||||
Rental equipment | 3 years | 1,156,800 | ||||
Buildings and leasehold improvements | 5-39 years | 924,133 | ||||
Autos and trucks | 3-7 years | 557,194 | ||||
Furniture and fixtures | 5-7 years | 144,307 | ||||
| 21,229,638 | ||||||
Construction in progress | 5,196,810 | |||||
| 26,426,448 | ||||||
Less: accumulated depreciation | (8,409,131 | ) | ||||
| $ | 18,017,317 | |||||
F-41
Table of Contents
Index to Financial Statements
ABBEVILLE OFFSHORE QUARTERS, INC.
NOTES TO FINANCIAL STATEMENTS—(Continued)
JULY 31, 2006
NOTE D—NOTES PAYABLE—RELATED PARTY
Notes payable—related party consists of four unsecured notes payable to Abbeville Lumber Company, bearing interest at prime, due on demand, with principal balances totaling approximately $454,000 as of July 31, 2006. Interest expense incurred for the seven months ended July 31, 2006 was approximately $52,000.
NOTE E—LONG-TERM DEBT
Long-term debt consists of the following:
| July 31, 2006 | |||
Notes payable to a bank, in the original amount of $4,250,000, payable in 35 monthly installments of $71,096, with a final payment of $2,396,334 in January 2008, bearing interest at 6.25% per annum, collateralized by equipment, inventory and movable buildings. | $ | 3,343,416 | |
Notes payable to a bank in original amounts ranging from $34,160 to $1,146,060, payable in monthly installments from $782 to $34,029, bearing interest at rates from 4.0% to 6.5% per annum, collateralized by a commercial security agreement. Notes mature from August 2007 to February 2009. | 340,719 | ||
Notes payable to a bank, in original amounts ranging from $190,954 to $691,030, payable in monthly installments from $3,670 to $20,404, bearing interest at rates from 4.0% to 5.75% per annum, collateralized by equipment, inventory, and movable buildings. Notes mature from August 2006 to August 2007. | 161,384 | ||
Note payable to an insurance financing company in the original amount of $309,794, payable in monthly installments, bearing interest at 3.2% per annum, collateralized by insurance policies. | 309,794 | ||
Note payable to a financing company in the original amount of $21,698, payable in 36 monthly installments from $410 to $684, bearing interest at 6.74% per annum, collateralized by a vehicle. Notes mature from October 2007 to December 2008. | 32,970 | ||
Total long-term debt | 4,188,283 | ||
Less: current maturities | 1,676,935 | ||
| $ | 2,511,348 | ||
The Company is required to meet certain financial covenants on a monthly reporting basis. Among other restrictions, such covenants include the maintenance of minimum tangible net worth requirements, as well as the maintenance of sufficient levels of earnings to meet the Company’s required debt servicing obligations. As of July 31, 2006, the Company was in compliance with these covenants.
Maturities of long-term debt are as follows:
Seven Months Ended July 31, | |||
2007 | $ | 1,676,935 | |
2008 | 2,506,462 | ||
2009 | 4,886 | ||
| $ | 4,188,283 | ||
F-42
Table of Contents
Index to Financial Statements
ABBEVILLE OFFSHORE QUARTERS, INC.
NOTES TO FINANCIAL STATEMENTS—(Continued)
JULY 31, 2006
NOTE F—OPERATING LEASES
The Company leases certain equipment and buildings under noncancelable operating leases. Rent expense for all operating leases during the seven months ended July 31, 2006 totaled approximately $73,000.
As of July 31, 2006, estimated future minimum lease payments required under the operating leases are as follows:
Seven Months Ended July 31, | |||
2007 | $ | 51,000 | |
2008 | 51,000 | ||
2009 | 31,000 | ||
2011 | 26,000 | ||
2010 | 20,000 | ||
| $ | 179,000 | ||
NOTE G—RELATED PARTY TRANSACTIONS
The Company leases its office space on a month-to-month basis from the Putnam family, including George and Emmet Putnam, stockholders. Total related party rent expense for the seven months ended July 31, 2006 was approximately $7,000. The Company also began leasing additional building space from George and Emmet Putnam beginning in May 2005. Total rent expense associated with this lease was approximately $35,000 for the seven months ended July 31, 2006.
NOTE H—STOCK RESTRICTION
The Articles of Incorporation do not allow any stock of the Company to be transferred by any stockholder unless the stock is first offered for sale to the Company. If the Company fails or refuses to accept the offer, then such offer may be accepted by the other stockholders.
The Company and/or remaining stockholders shall have an option to purchase the stock to be transferred at the same price and on the same terms and conditions as the offer or shall have been offered by a third person in an arm’s length transaction, acting in good faith. The offer shall be in writing and open for a period of 60 days. After the offer period has expired, the stockholder may complete the transfer to a third party under the same terms and conditions of the offer to the Company.
NOTE I—RETIREMENT PLANS
The Company has established a 401(k) type pension plan for all eligible employees. Employees who have attained the age of eighteen are eligible to participate in the plan if they have been employed by the Company for one year and work at least 1,000 hours per year. Generally, employees can defer up to 15% of their gross salary into the plan, not to exceed $15,000 for 2006. The Company can make a matching discretionary contribution for the employees. Employer contributions for the seven months ended July 31, 2006 were approximately $9,200.
NOTE J—SUBSEQUENT EVENT
On August 1, 2006, the Company was purchased in a stock transaction by Stallion Oilfield Services Ltd., headquartered in Houston, Texas.
F-43
Table of Contents
Index to Financial Statements
F-44
Table of Contents
Index to Financial Statements
ABBEVILLE OFFSHORE QUARTERS, INC.
SCHEDULE OF COST OF REVENUE AND OPERATING EXPENSES
SEVEN MONTHS ENDED JULY 31, 2006
COST OF REVENUE | ||||
Rentals | $ | 765,520 | ||
Materials | 2,555,781 | |||
Labor | 1,835,174 | |||
Depreciation | 1,294,155 | |||
Repairs and maintenance | 379,271 | |||
Insurance | 368,880 | |||
Payroll taxes | 241,140 | |||
Workers’ compensation | 244,852 | |||
Freight | 56,515 | |||
Auto and truck maintenance | 142,660 | |||
Port expenses | 107,874 | |||
Travel | 72,952 | |||
Tools | 21,063 | |||
TOTAL COST OF REVENUE | $ | 8,085,837 | ||
OPERATING EXPENSES | ||||
Salaries, taxes and fringe benefits | $ | 1,150,668 | ||
Bad debt | 660,866 | |||
Gain on sale of fixed assets | (407,454 | ) | ||
Depreciation | 189,265 | |||
Advertisement | 77,577 | |||
Utilities | 66,367 | |||
Travel and entertainment | 75,435 | |||
Supplies | 95,453 | |||
Rent | 73,530 | |||
Legal and accounting | 172,695 | |||
Taxes and licenses | 27,364 | |||
Telephone | 57,040 | |||
Education | 47,559 | |||
Medical | 33,475 | |||
Office expense | 55,310 | |||
Miscellaneous | 22,535 | |||
TOTAL OPERATING EXPENSES | $ | 2,397,685 | ||
F-45
Table of Contents
Index to Financial Statements
To the Board of Directors
Abbeville Offshore Quarters, Inc.
Abbeville, Louisiana
We have audited the accompanying balance sheets of Abbeville Offshore Quarters, Inc. (an S Corporation) as of December 31, 2005 and 2004, and the related statements of operations, stockholders’ equity and cash flows for each of the three years ended December 31, 2005. The financial statements are the responsibility of the Company’s management. Our responsibility is to express an opinion on these financial statements based on our audits.
We conducted our audits in accordance with auditing standards generally accepted in the United States of America. Those standards require that we plan and perform the audits to obtain reasonable assurance about whether the financial statements are free of material misstatement. An audit includes examining, on a test basis, evidence supporting the amounts and disclosures in the financial statements. An audit also includes assessing the accounting principles used and significant estimates made by management, as well as evaluating the overall financial statement presentation. We believe that our audits provide a reasonable basis for our opinion.
In our opinion, the financial statements referred to above present fairly, in all material respects, the financial position of Abbeville Offshore Quarters, Inc. as of December 31, 2005 and 2004, and the results of its operations and its cash flows for each of the three years ended December 31, 2005, in conformity with accounting principles generally accepted in the United States of America.
Our audits were conducted for the purpose of forming an opinion on the basic financial statements taken as a whole. The supplemental schedule on page F-57 is presented for the purposes of additional analysis and are not required as part of the basic financial statements. Such information has been subjected to the auditing procedures applied in the audits of the basic financial statements and, in our opinion, is fairly stated in all material respects in relation to the basic financial statements taken as a whole.
| /S/ UHY MANN FRANKFORT STEIN & LIPP CPAS, LLP |
| UHY Mann Frankfort Stein & Lipp CPAs, LLP |
Houston, Texas
August 25, 2006
F-46
Table of Contents
Index to Financial Statements
ABBEVILLE OFFSHORE QUARTERS, INC.
| December 31, | ||||||
| 2005 | 2004 | |||||
| ASSETS | ||||||
Current assets | ||||||
Cash and cash equivalents | $ | 142,624 | $ | 399,611 | ||
Accounts receivable—trade, net | 6,714,994 | 2,429,146 | ||||
Accounts receivable—other | 962,116 | 492,924 | ||||
Costs and estimated earnings in excess of billings on uncompleted contracts | 1,050,888 | 1,364,550 | ||||
Inventory | 195,867 | 152,994 | ||||
Prepaid expenses and other current assets | 231,462 | 210,676 | ||||
Total current assets | 9,297,951 | 5,049,901 | ||||
Property and equipment | 15,133,432 | 11,380,520 | ||||
Other assets | 15,155 | 11,395 | ||||
Total assets | $ | 24,446,538 | $ | 16,441,816 | ||
| LIABILITIES AND STOCKHOLDERS’ EQUITY | ||||||
Current liabilities | ||||||
Accounts payable and accrued expenses | $ | 1,902,014 | $ | 3,848,368 | ||
Billings in excess of costs and estimated earnings on uncompleted contracts | 277,571 | — | ||||
Deferred revenue | — | 369,460 | ||||
Notes payable—related party | 354,112 | 422,505 | ||||
Current maturities of long-term debt | 1,698,856 | 2,350,631 | ||||
Due to stockholders | 58,363 | 200,053 | ||||
Total current liabilities | 4,290,916 | 7,191,017 | ||||
Long-term liabilities | ||||||
Long-term debt, net of current maturities | 3,270,017 | 1,086,480 | ||||
Total liabilities | 7,560,933 | 8,277,497 | ||||
Stockholders’ equity | 16,885,605 | 8,164,319 | ||||
Total liabilities and stockholders’ equity | $ | 24,446,538 | $ | 16,441,816 | ||
See notes to financial statements.
F-47
Table of Contents
Index to Financial Statements
ABBEVILLE OFFSHORE QUARTERS, INC.
| Year Ended December 31, | ||||||||||||
| 2005 | 2004 | 2003 | ||||||||||
Revenue | $ | 22,369,582 | $ | 13,397,496 | $ | 8,438,252 | ||||||
Cost of revenue | 11,225,371 | 7,666,220 | 5,002,969 | |||||||||
Gross profit | 11,144,211 | 5,731,276 | 3,435,283 | |||||||||
Operating expenses | 2,077,337 | 1,814,130 | 957,839 | |||||||||
Operating income | 9,066,874 | 3,917,146 | 2,477,444 | |||||||||
Other income (expense) | ||||||||||||
Interest income | 5,956 | 14,643 | 23,172 | |||||||||
Interest expense | (327,770 | ) | (145,858 | ) | (136,011 | ) | ||||||
Other income | 8,376 | 2,157 | 8,194 | |||||||||
Total other income (expense) | (313,438 | ) | (129,058 | ) | (104,645 | ) | ||||||
Net income | $ | 8,753,436 | $ | 3,788,088 | $ | 2,372,799 | ||||||
See notes to financial statements.
F-48
Table of Contents
Index to Financial Statements
ABBEVILLE OFFSHORE QUARTERS, INC.
STATEMENTS OF STOCKHOLDERS’ EQUITY
YEARS ENDED DECEMBER 31, 2005 AND 2004
| Additional Paid-in Capital | Retained Earnings | Total Stockholder’s Equity | |||||||||
Balance as of January 1, 2003 | $ | 215,421 | $ | 3,005,759 | $ | 3,221,180 | |||||
Net distributions | — | (737,275 | ) | (737,275 | ) | ||||||
Net income | — | 2,372,799 | 2,372,799 | ||||||||
Balance as of December 31, 2003 | 215,421 | 4,641,283 | 4,856,704 | ||||||||
Net distributions | — | (480,473 | ) | (480,473 | ) | ||||||
Net income | — | 3,788,088 | 3,788,088 | ||||||||
Balance as of December 31, 2004 | 215,421 | 7,948,898 | 8,164,319 | ||||||||
Net distributions | — | (32,150 | ) | (32,150 | ) | ||||||
Net income | — | 8,753,436 | 8,753,436 | ||||||||
Balance as of December 31, 2005 | $ | 215,421 | $ | 16,670,184 | $ | 16,885,605 | |||||
See notes to financial statements.
F-49
Table of Contents
Index to Financial Statements
ABBEVILLE OFFSHORE QUARTERS, INC.
| Year Ended December 31, | ||||||||||||
| 2005 | 2004 | 2003 | ||||||||||
Cash flows from operating activities | ||||||||||||
Net income | $ | 8,753,436 | $ | 3,788,088 | $ | 2,372,799 | ||||||
Adjustments to reconcile net income to net cash provided by operating activities: | ||||||||||||
Depreciation | 2,177,293 | 1,283,463 | 855,886 | |||||||||
Bad-debt expense | 90,462 | 6,263 | 5,238 | |||||||||
Gain on sale of fixed assets | (502,347 | ) | (43,793 | ) | (594,629 | ) | ||||||
Change in operating assets and liabilities: | ||||||||||||
Accounts receivable—trade | (4,376,310 | ) | (1,027,094 | ) | (265,016 | ) | ||||||
Accounts receivable—other | (469,192 | ) | (99,937 | ) | (260,484 | ) | ||||||
Costs and estimated earnings in excess of billings on uncompleted contracts | 313,662 | (1,317,767 | ) | 134,780 | ||||||||
Prepaid expenses and other current assets | (24,546 | ) | 126,464 | (56,751 | ) | |||||||
Inventory | (42,873 | ) | (76,569 | ) | (3,362 | ) | ||||||
Accounts payable and accrued expenses | (1,909,978 | ) | 2,960,295 | 310,532 | ||||||||
Deferred revenue | (369,460 | ) | 369,460 | — | ||||||||
Billings in excess of costs and estimated earnings on uncompleted contracts | 277,571 | (102,736 | ) | 102,736 | ||||||||
Net cash provided by operating activities | 3,917,718 | 5,866,137 | 2,601,729 | |||||||||
Cash flows from investing activities | ||||||||||||
Purchase of fixed assets | (6,190,073 | ) | (6,211,789 | ) | (3,205,666 | ) | ||||||
Proceeds from sale of assets | 762,215 | 94,900 | 780,801 | |||||||||
Net cash used in investing activities | (5,427,858 | ) | (6,116,889 | ) | (2,424,865 | ) | ||||||
Cash flows from financing activities | ||||||||||||
Proceeds from issuance of long-term debt | 4,526,587 | 1,902,114 | 1,826,201 | |||||||||
Repayment of long-term debt | (3,031,201 | ) | (1,609,481 | ) | (676,287 | ) | ||||||
Net payments on notes payable—related party | (68,393 | ) | 3,985 | 78,520 | ||||||||
Net distributions | (32,150 | ) | (480,473 | ) | (737,275 | ) | ||||||
Net (decrease) increase due to stockholders | (141,690 | ) | (90,043 | ) | 257 | |||||||
Net cash provided by (used in) financing activities | 1,253,153 | (273,898 | ) | 491,416 | ||||||||
Net increase (decrease) in cash and cash equivalents | (256,987 | ) | (524,650 | ) | 668,280 | |||||||
Cash and cash equivalents, beginning of year | 399,611 | 924,261 | 255,981 | |||||||||
Cash and cash equivalents, end of year | $ | 142,624 | $ | 399,611 | $ | 924,261 | ||||||
Supplemental disclosures of cash flows information | ||||||||||||
Cash paid for interest | $ | 327,770 | $ | 145,858 | $ | 136,011 | ||||||
See notes to financial statements.
F-50
Table of Contents
Index to Financial Statements
ABBEVILLE OFFSHORE QUARTERS, INC.
DECEMBER 31, 2005 AND 2004
NOTE A—Accounting Policies
Nature of Business: Abbeville Offshore Quarters, Inc. (the “Company”), designs, manufactures and leases building units to be used offshore. The Company has two manufacturing facilities located in Abbeville and the Port of Vermilion, Louisiana. The Company also specializes in offshore refurbishment and maintenance, as well as offering a complete camp setup service including water tanks, pressure sets, sewage treatment units, lights, generators, and linens.
The Company has one class of common stock, no par value, 900 shares authorized. As of December 31, 2005 and 2004, 900 shares were issued and outstanding.
Cash and Cash Equivalents: For purposes of the statement of cash flows, the Company considers all highly liquid debt instruments purchased with a maturity of three months or less to be cash equivalents. There were no cash equivalents as of December 31, 2005 and 2004.
Accounts Receivable: The Company extends credit to its customers based on informal discussions with the management and generally collateral is not required. Outstanding accounts receivable are assessed routinely and an allowance is set up when accounts are deemed uncollectible. Accounts receivable are net of allowance for doubtful account of approximately $116,000 and $25,000 as of December 31, 2005 and 2004, respectively.
Inventory: Inventories are valued at the lower of cost or market with cost being determined using the First-in First-out (FIFO) method. Market is considered as the lower of either estimated replacement cost or estimated realizable value.
Property and Equipment: Property and equipment are stated at cost. Depreciation is provided by the straight-line method over the estimated useful lives of the related assets. All expenditures for major renewals and betterments are capitalized. Amortization of leasehold improvements is computed using the straight-line method over the shorter of the remaining lease term or the estimated useful lives of the improvements. Expenditures for maintenance and repairs are charged to expense as incurred.
Impairment of Long-lived Assets: The Company evaluates an asset for impairment when events or circumstances indicate that a long-lived asset’s carrying value may not be recovered. These events include market declines, changes in the manner in which the Company intends to use an asset, decisions to sell an asset and adverse changes in the legal or business environment.
If events or circumstances indicated that a long-lived asset’s carrying value may not be recoverable, the Company estimates the future undiscounted cash flows from the asset for which the lowest level of separate cash flows can be measured, to determine if the asset is impaired. If the total undiscounted future cash flows are less than the carrying amount for the asset, the Company estimates the fair value of the asset either through reference to sales data for similar assets, or by using a discounted cash flow approach. The asset’s carrying value is then adjusted downward to the fair value. These cash flow estimates require the Company to make estimates and assumptions for many years into the future for pricing demand, competition, operating costs, legal, regulatory and other factors and these estimates or assumptions could change significantly either positively or negatively.
Revenue and Cost Recognition: Revenue from construction contracts are recognized under the percentage-of-completion method of accounting determined by the ratio of costs incurred to total estimated costs at completion. All known or anticipated losses on contracts are recognized in full when such losses become apparent. Contracts typically range from two to six months in duration. Revenue for contracts based on time and materials are recognized as labor and material costs are incurred. Revenue from other services is recognized as the service is performed.
F-51
Table of Contents
Index to Financial Statements
ABBEVILLE OFFSHORE QUARTERS, INC.
NOTES TO FINANCIAL STATEMENTS—(Continued)
DECEMBER 31, 2005 AND 2004
Income Taxes: The Company has elected to be taxed under the provisions of Subchapter S of the Internal Revenue Code. Under those provisions, the Company does not pay federal corporate income taxes on its taxable income, and is not allowed a net operating loss carryover or carryback as a deduction. Instead, the stockholders are liable for individual federal and state income taxes on their respective shares of the Company’s taxable income.
Advertising Costs: Advertising costs are expensed as incurred. Advertising expense for the years ended December 31, 2005, 2004 and 2003 was approximately $129,000, $44,000 and $28,000, respectively.
Concentration of Risk: The Company provides services to a diversified group of customers in the petroleum industry, including major oil companies, located primarily in the Southern United States. Credit is extended based on an evaluation of each customer’s financial condition. Credit losses, upon occurrence, are provided for within the financial statements.
The Company maintains its cash in bank deposit accounts at high credit quality financial institutions. The balances, at times, may exceed federally insured limits. However, these funds are secured by repurchase agreements in the Company’s name.
The customer base for the Company is primarily concentrated in the oil and gas industry. The revenue earned from each customer varies from year to year based on the contracts awarded. During the year ended December 31, 2005, the Company had sales to two customers totaling 38% and 14% of total revenue with accounts receivable at year-end of approximately $2,030,000 and $951,000, respectively. During the year ended December 31, 2004, the Company had sales to one customer totaling 13% of total revenue, with an accounts receivable balance of approximately $95,000 at year-end. During the year ended December 31, 2003, the Company had sales to three customers totaling 13%, 12%, and 12% of total revenue, respectively, with accounts receivable balances of approximately $43,000, $12,000 and $83,000, respectively.
Use of Estimates: The preparation of financial statements in conformity with accounting principles generally accepted in the United States of America, requires management to make estimates and assumptions that affect the reported amounts of assets and liabilities at the date of the financial statements and the reported amounts of revenue and expenses during the reporting period. Actual results could differ from those estimates.
NOTE B—Costs and Estimated Earnings on Uncompleted Contracts
The asset, “Costs and estimated earnings in excess of billings on uncompleted contracts,” represents revenue recognized in excess of amounts billed. The liability, “Billings in excess of costs and estimated earnings on uncompleted contracts,” represents billings in excess of revenue recognized.
F-52
Table of Contents
Index to Financial Statements
ABBEVILLE OFFSHORE QUARTERS, INC.
NOTES TO FINANCIAL STATEMENTS—(Continued)
DECEMBER 31, 2005 AND 2004
Amounts billed and costs and earnings recognized on contracts in progress were:
| December 31, | ||||||||
| 2005 | 2004 | |||||||
Costs incurred on uncompleted contracts | $ | 2,448,409 | $ | 2,756,967 | ||||
Estimated earnings | 753,652 | 382,804 | ||||||
Total costs and estimated earnings | 3,202,061 | 3,139,771 | ||||||
Less: billings to date | (2,428,744 | ) | (1,775,221 | ) | ||||
| $ | 773,317 | $ | 1,364,550 | |||||
Included in the accompanying balance sheets under the following captions:
| 2005 | 2004 | ||||||
Costs and estimated earnings in excess of billings on uncompleted contracts | $ | 1,050,888 | $ | 1,364,550 | |||
Billings in excess of costs and estimated earnings on uncompleted contracts | (277,571 | ) | — | ||||
| $ | 773,317 | $ | 1,364,550 | ||||
NOTE C—Property and Equipment
Major classifications of property and equipment and estimated depreciable lives are as follows:
| December 31, | ||||||||||
| Estimated Life | 2005 | 2004 | ||||||||
United States Coast Guard modular rental units | 7 years | $ | 12,063,025 | $ | 9,527,075 | |||||
Modular rental units | 5 years | 4,108,499 | 3,701,558 | |||||||
Machinery and equipment | Various | 1,118,835 | 920,231 | |||||||
Rental equipment | 3 years | 974,764 | 651,316 | |||||||
Buildings and leasehold improvements | 5-39 years | 883,638 | 796,630 | |||||||
Autos and trucks | 3-7 years | 520,528 | 375,804 | |||||||
Furniture and fixtures | 5-7 years | 103,910 | 78,185 | |||||||
| 19,773,199 | 16,050,799 | |||||||||
Construction in progress | 2,459,514 | 590,480 | ||||||||
| 22,232,713 | 16,641,279 | |||||||||
Less: accumulated depreciation | (7,099,281 | ) | (5,260,759 | ) | ||||||
| $ | 15,133,432 | $ | 11,380,520 | |||||||
NOTE D—Notes Payable—Related Party
Notes payable—related party consists of four unsecured notes payable to Abbeville Lumber Company, bearing interest at prime, due on demand, with principal balances outstanding of $354,112 and $422,505 as of December 31, 2005 and 2004, respectively. Interest expense incurred for the years ended December 31, 2005, 2004 and 2003 was approximately $26,000, $26,000 and $10,000, respectively.
F-53
Table of Contents
Index to Financial Statements
ABBEVILLE OFFSHORE QUARTERS, INC.
NOTES TO FINANCIAL STATEMENTS—(Continued)
DECEMBER 31, 2005 AND 2004
NOTE E—Long-term Debt
Long-term debt consists of the following:
| December 31, | ||||||||
| 2005 | 2004 | |||||||
Notes payable to a bank, in the original amount of $4,250,000, payable in 35 monthly installments of $71,096, with a final payment of $2,396,334 in January 2008, bearing interest at 6.25% per annum, collateralized by equipment, inventory and movable buildings. | $ | 3,697,579 | $ | — | ||||
Notes payable to a bank in original amounts ranging from $24,934 to $1,146,060 in monthly installments from $765 to $34,029, bearing interest at rates from 4.0% to 6.5% per annum, collateralized by a commercial security agreement. | 746,058 | 1,538,508 | ||||||
Notes payable to a bank, in original amounts ranging from $190,954 to $691,030, payable in monthly installments from $3,670 to $20,404, bearing interest at rates from 4.0% to 5.75% per annum, collateralized by equipment, inventory, and movable buildings. Notes mature from August 2006 to August 2007. | 387,932 | 796,380 | ||||||
Notes payable to an insurance financing company in the original amounts of $222,607 and $154,744 payable in monthly installments, bearing interest at 0% and 4.95% per annum, respectively, collateralized by insurance policies. | 89,043 | 52,223 | ||||||
Notes payable to a financing company in original amounts ranging from $13,293 to $20,463, payable in 36 monthly installments from $410 to $631, bearing interest at 6.74% per annum, collateralized by a vehicle. Notes mature from October 2007 to December 2008. | 48,261 | — | ||||||
Notes payable to a bank in original amounts from $ 200,000, to $500,000 payable in one payment from January to May 2005 bearing interest from 5% to 5.25%, collateralized by a commercial security agreement. | — | 1,050,000 | ||||||
Total long-term debt | 4,968,873 | 3,437,111 | ||||||
Less: current maturities | (1,698,856 | ) | (2,350,631 | ) | ||||
| $ | 3,270,017 | $ | 1,086,480 | |||||
The Company is required to meet certain financial covenants on a monthly reporting basis. Among other restrictions, such covenants include the maintenance of minimum tangible net worth requirements, as well as the maintenance of sufficient levels of earnings to meet the Company’s required debt servicing obligations. As of December 31, 2005, the Company was in compliance with these covenants.
Maturities of long-term debt are as follows:
Year ending December 31, | |||
2006 | $ | 1,698,856 | |
2007 | 878,576 | ||
2008 | 2,391,441 | ||
| $ | 4,968,873 | ||
F-54
Table of Contents
Index to Financial Statements
ABBEVILLE OFFSHORE QUARTERS, INC.
NOTES TO FINANCIAL STATEMENTS—(Continued)
DECEMBER 31, 2005 AND 2004
NOTE F—Operating Leases
The Company leases certain equipment and buildings under noncancelable operating leases. Rent expense for all operating leases during 2005, 2004, and 2003 totaled approximately $78,000, $44,100 and $41,600, respectively.
As of December 31, 2005, estimated future minimum lease payments required under the operating leases are as follows:
Year ending December 31, | |||
2006 | $ | 24,000 | |
2007 | 24,000 | ||
2008 | 4,000 | ||
| $ | 52,000 | ||
NOTE G—Related Party Transactions
The Company leases its office space on a month-to-month basis from the Putnam family, including George and Emmet Putnam, stockholders. Total annual related party rent expense for the years ended December 31, 2005, 2004, and 2003 was $12,600 during each year. The Company also began leasing additional building space from George and Emmet Putnam beginning in May 2005. Total annual rent expense associated with this lease was $35,000 for the year ended December 31, 2005.
NOTE H—Stock Restriction
The Articles of Incorporation do not allow any stock of the Company to be transferred by any stockholder unless the stock is first offered for sale to the Company. If the Company fails or refuses to accept the offer, then such offer may be accepted by the other stockholders.
The Company and/or remaining stockholders shall have an option to purchase the stock to be transferred at the same price and on the same terms and conditions as the offer or shall have been offered by a third person in an arm’s length transaction, acting in good faith. The offer shall be in writing and open for a period of 60 days. After the offer period has expired, the stockholder may complete the transfer to a third party under the same terms and conditions of the offer to the Company.
NOTE I—Retirement Plans
The Company has established a 401(k) type pension plan for all eligible employees. Employees who have attained the age of eighteen are eligible to participate in the plan if they have been employed by the Company for one year and work at least 1,000 hours per year. Generally, employees can defer up to 15% of their gross salary into the plan, not to exceed $14,000 for 2005, $13,000 for 2004, and $12,000 for 2003. The Company can make a matching discretionary contribution for the employees. Employer contributions for 2005, 2004, and 2003 were approximately $12,000, $9,000, and $9,000, respectively.
NOTE J—Subsequent Event
On August 1, 2006, the Company was purchased in a stock transaction by Stallion Oilfield Services Ltd., headquartered in Houston, Texas.
F-55
Table of Contents
Index to Financial Statements
F-56
Table of Contents
Index to Financial Statements
ABBEVILLE OFFSHORE QUARTERS, INC.
SCHEDULE OF COST OF REVENUE AND OPERATING EXPENSES
| Year Ended December 31, | ||||||||||||
| 2005 | 2004 | 2003 | ||||||||||
Cost of revenue | ||||||||||||
Rentals | $ | 2,279,926 | $ | 1,137,484 | $ | 331,749 | ||||||
Materials | 2,165,922 | 2,884,967 | 1,379,023 | |||||||||
Labor | 2,034,245 | 803,718 | 1,111,660 | |||||||||
Depreciation | 1,912,715 | 1,057,159 | 641,655 | |||||||||
Repairs and maintenance | 891,642 | 331,556 | 253,168 | |||||||||
Insurance | 539,948 | 383,558 | 357,912 | |||||||||
Payroll taxes | 290,511 | 187,766 | 181,023 | |||||||||
Workers’ compensation | 259,604 | 168,979 | 165,618 | |||||||||
Commissions | 233,708 | — | — | |||||||||
Freight | 177,081 | 340,967 | 74,583 | |||||||||
Auto and truck maintenance | 153,102 | 106,782 | 107,132 | |||||||||
Port expenses | 149,723 | 77,171 | 65,596 | |||||||||
Travel | 76,583 | 92,114 | 27,620 | |||||||||
Tools | 42,753 | 39,268 | 47,299 | |||||||||
Miscellaneous services | 17,908 | 54,731 | 258,931 | |||||||||
Total cost of revenue | $ | 11,225,371 | $ | 7,666,220 | $ | 5,002,969 | ||||||
Operating expenses | ||||||||||||
Salaries, taxes and fringe benefits | $ | 1,401,006 | $ | 1,100,309 | $ | 883,093 | ||||||
Gain on sale of fixed assets | (502,347 | ) | (43,793 | ) | (594,629 | ) | ||||||
Depreciation | 264,578 | 226,304 | 214,231 | |||||||||
Advertisement | 128,539 | 43,714 | 28,015 | |||||||||
Utilities | 93,256 | 65,846 | 36,101 | |||||||||
Bad debt | 90,462 | 6,263 | 5,238 | |||||||||
Meals and entertainment | 87,518 | 56,265 | 58,943 | |||||||||
Supplies | 78,156 | 35,041 | 31,421 | |||||||||
Rent | 78,051 | 44,100 | 41,568 | |||||||||
Legal and accounting | 75,736 | 82,626 | 79,979 | |||||||||
Telephone | 74,841 | 58,412 | 42,097 | |||||||||
Education | 44,117 | 30,657 | 20,022 | |||||||||
Medical | 42,178 | 12,676 | 13,941 | |||||||||
Office expense | 39,345 | 27,277 | 31,146 | |||||||||
Miscellaneous | 81,901 | 68,433 | 66,673 | |||||||||
Total operating expenses | $ | 2,077,337 | $ | 1,814,130 | $ | 957,839 | ||||||
See independent auditors’ report on additional information.
F-57
Table of Contents
Index to Financial Statements
WRIGHT, MOORE, DEHART, DUPUIS & HUTCHINSON,L.L.C.
| Certified Public Accountants | ||||
| 100 Petroleum Drive, 70508 | ||||
JOHN W. WRIGHT, CPA* | P. O. Box 80569 • Lafayette, Louisiana 70598-0569 | |||
JAMES H. DUPUIS, CPA, CFP* | (337) 232-3637 • FAX (337) 235-8557 | CHRISTINE R. DUNN, CPA | ||
JOE D. HUTCHINSON, CPA* | www.wmddh.com | ANDRE D. BROUSSARD, CPA | ||
JAN H. COWEN, CPA* | MARY PATRICIA KEELEY, CPA | |||
LANCE E. CRAPPELL, CPA* | KRISTIE C. BOUDREAUX, CPA | |||
PAT BAHAM DOUGHT, CPA* | BRIDGET B. TILLEY, CPA, MT | |||
MICAH R. VIDRINE, CPA* | DAMIAN H. SPIESS, CPA, CFP | |||
TRAVIS M. BRINSKO, CPA* | TASHA A. RALEY, CPA | |||
RICK STUTES, CPA, CVA | PATRICK WAGUESPACK, CPA | |||
| CHIP CANTRELL, CPA | ||||
* A PROFESSIONAL CORPORATION | DANE P. FALGOUT, CPA | |||
| ROBIN G. STOCKTON, CPA | ||||
RETIRED | ||||
M. TROY MOORE, CPA* | ||||
MICHAEL G. DeHART, CPA, CVA, MBA* | ||||
INDEPENDENT AUDITORS’ REPORT
To the Board of Directors
BLR Construction Companies, L.L.C.
Duson, Louisiana
We have audited the accompanying combined balance sheet of BLR Construction Companies, L.L.C. as of December 31, 2005, and the related combined statements of income, members’ equity and cash flows for the year then ended. These financial statements are the responsibility of the Company’s management. Our responsibility is to express an opinion on these financial statements based on our audit.
We conducted our audit in accordance with auditing standards generally accepted in the United States of America. Those standards require that we plan and perform the audit to obtain reasonable assurance about whether the financial statements are free of material misstatement. An audit includes examining, on a test basis, evidence supporting the amounts and disclosures in the financial statements. An audit also includes assessing the accounting principles used and significant estimates made by management, as well as evaluating the overall financial statement presentation. We believe that our audit provides a reasonable basis for our opinion.
In our opinion, the financial statements referred to above present fairly, in all material respects, the financial position of BLR Construction Companies, L.L.C. as of December 31, 2005, and the results of its operations and its cash flows for the year then ended in conformity with accounting principles generally accepted in the United States of America.
CERTIFIED PUBLIC ACCOUNTANTS
March 17, 2006
F-58
Table of Contents
Index to Financial Statements
BLR CONSTRUCTION COMPANIES, L.L.C. AND AFFILIATE
DECEMBER 31, 2005
ASSETS | |||
| Current assets | |||
Cash | $ | 184,048 | |
Cash—restricted | 623,008 | ||
Accounts receivable | |||
Trade (net of allowance for doubtful accounts of $210,000) | 11,202,726 | ||
Other | 4,446,779 | ||
Interest receivable | 126,703 | ||
Prepaid expenses | 234,857 | ||
Due from members | 1,186,667 | ||
Due from affiliates | 325,093 | ||
Total current assets | 18,329,881 | ||
Property and equipment | |||
Vehicles | 1,537,202 | ||
Buildings and improvements | 1,232,403 | ||
Machinery and equipment | 6,332,109 | ||
Furniture and fixtures | 155,303 | ||
Mats | 12,262,559 | ||
Land | 49,987 | ||
Total | 21,569,563 | ||
Less: Accumulated depreciation | 7,127,688 | ||
Property and equipment—net | 14,441,875 | ||
Other assets | |||
Deposits | 1,234 | ||
Total assets | $ | 32,772,990 | |
LIABILITIES AND MEMBERS’ EQUITY | |||
| Current liabilities | |||
Accounts payable | $ | 5,683,712 | |
Notes payable | 6,757,139 | ||
Current maturities of long-term debt | 3,269,529 | ||
Current maturities of capital lease obligation | 7,216 | ||
Interest payable | 36,302 | ||
Accrued expenses and other current liabilities | 2,507,715 | ||
Total current liabilities | 18,261,613 | ||
Long-term liabilities | |||
Long-term debt, less current maturities | 3,446,834 | ||
Capital lease obligation, less current maturities | 32,649 | ||
Total long-term liabilities | 3,479,483 | ||
Members’ equity | 11,031,894 | ||
Total liabilities and members’ equity | $ | 32,772,990 | |
The accompanying notes are an integral part of these financial statements.
F-59
Table of Contents
Index to Financial Statements
BLR CONSTRUCTION COMPANIES, L.L.C. AND AFFILIATE
FOR THE YEAR ENDED DECEMBER 31, 2005
Revenue | $ | 39,630,002 | ||
Cost of revenue | ||||
Depreciation | 4,556,234 | |||
Labor and related costs | 7,261,103 | |||
Materials and supplies | 5,006,038 | |||
Rent | 8,405,047 | |||
Other costs | 3,680,723 | |||
Total cost of revenue | 28,909,145 | |||
Gross profit | 10,720,857 | |||
Operating expenses | ||||
General and administrative expenses | 6,327,842 | |||
Depreciation | 39,332 | |||
Total operating expenses | 6,367,174 | |||
Operating income | 4,353,683 | |||
Other income (expense) | ||||
Gain on sale of assets | 245,403 | |||
Interest income | 105,659 | |||
Interest expense | (672,358 | ) | ||
Loss on investment | (30,000 | ) | ||
Miscellaneous | 18,908 | |||
Total other income (expense) | (332,388 | ) | ||
Income before income taxes | 4,021,295 | |||
Income tax benefit | ||||
Deferred | 909,343 | |||
Net income | $ | 4,930,638 | ||
The accompanying notes are an integral part of these financial statements.
F-60
Table of Contents
Index to Financial Statements
BLR CONSTRUCTION COMPANIES, L.L.C. AND AFFILIATE
COMBINED STATEMENT OF CHANGES IN MEMBERS’ EQUITY
FOR THE YEAR ENDED DECEMBER 31, 2005
Members’ equity at December 31, 2004 | $ | 4,601,256 | |
Additions (deductions) | |||
Net income | 4,930,638 | ||
Contributions | 1,500,000 | ||
Members’ equity at December 31, 2005 | $ | 11,031,894 | |
The accompanying notes are an integral part of these financial statements.
F-61
Table of Contents
Index to Financial Statements
BLR CONSTRUCTION COMPANIES, L.L.C. AND AFFILIATE
COMBINED STATEMENT OF CASH FLOWS
FOR THE YEAR ENDED DECEMBER 31, 2005
Cash flows from operating activities | ||||
Net income | $ | 4,930,638 | ||
Adjustments to reconcile net income to net cash provided by operating activities: | ||||
Depreciation | 4,595,566 | |||
Gain on sale of assets | (245,403 | ) | ||
Loss on investment | 30,000 | |||
Deferred income taxes | (909,343 | ) | ||
Changes in assets and liabilities: | ||||
Accounts receivable | (8,614,555 | ) | ||
Income tax refund receivable | 7,167 | |||
Due from affiliates | (13,157 | ) | ||
Prepaid expenses | (24,258 | ) | ||
Accounts payable | 3,543,308 | |||
Income taxes payable | (28,847 | ) | ||
Interest payable | 17,970 | |||
Accrued expenses and other current liabilities | 1,278,968 | |||
Net cash provided by operating activities | 4,568,054 | |||
Cash flows from investing activities | ||||
Proceeds from sale of property and equipment | 627,025 | |||
Purchases of property and equipment | (3,074,774 | ) | ||
Interest receivable | (126,703 | ) | ||
Due from members | (259,988 | ) | ||
Deposits | (934 | ) | ||
Net cash used in investing activities | (2,835,374 | ) | ||
Cash flows from financing activities | ||||
Proceeds from issuance of debt | 155,119 | |||
Net borrowing on lines of credit | 1,636,543 | |||
Repayment of debt and capital lease obligation | (3,060,793 | ) | ||
Net cash used in financing activities | (1,269,131 | ) | ||
Net increase in cash | $ | 463,549 | ||
Cash at beginning of year | 343,507 | |||
Cash at end of year | $ | 807,056 | ||
Additional cash flow disclosures | ||||
Cash paid during the year for: | ||||
Interest | $ | 653,699 | ||
Income taxes | $ | 28,847 | ||
Non cash investing and financing activities | ||||
Equipment purchased under installment note obligations and capital leases | $ | 6,514,772 | ||
Capital contribution financed through due from member | $ | 1,500,000 | ||
The accompanying notes are an integral part of these financial statements.
F-62
Table of Contents
Index to Financial Statements
BLR CONSTRUCTION COMPANIES, L.L.C. AND AFFILIATE
NOTES TO COMBINED FINANCIAL STATEMENTS
Note 1: Organization
Effective January 1, 2005, BLR Construction Company, Inc., BLR Crewboats, Inc., BLR Marine Services, Inc., BLR Roustabout, Inc., and Louisiana Pipeline and Construction Co., Inc. merged to form BLR Construction Companies, L.L.C. The newly formed company was organized in the state of Louisiana on January 1, 2005. The Company is engaged in various enterprises including oilfield construction, pipeline construction, crewboat and tugboat rentals, and contract labor. The Company operates in the Southern United States.
Note 2: Summary of Significant Accounting Policies
Principles of Combination: The accompanying financial statements for the year ended December 31, 2005 include the combined accounts of BLR Construction Companies, L.L.C. and its affiliate, LPCC, Inc., collectively referred to as “the Company”. All material intercompany balances and transactions have been eliminated in the combination.
Property and Equipment: Property and equipment are stated at cost. Expenditures for property and equipment and items which substantially increase the useful lives of existing assets are capitalized at cost and depreciated. Routine expenditures for repairs and maintenance are expensed as incurred. The cost and related accumulated depreciation of property and equipment disposed of are eliminated from the accounts, and any resulting gain or loss is recognized.
Depreciation is provided utilizing the straight-line method. Depreciation expense amounts to $4,595,566 for the year ended December 31, 2005.
Use of Estimates: The preparation of financial statements requires management to make estimates and assumptions that affect certain reported amounts and disclosures. Accordingly, actual results could differ from those estimates.
Cash Flows: For purposes of the statements of cash flows, the Company considers all highly liquid investments with an original maturity of three months or less to be cash equivalents.
Accounts Receivable: Trade accounts receivable are carried at their estimated collectible amounts. Trade credit is generally extended on a short-term basis; thus receivables do not bear interest, although a finance charge may be applied to amounts past due. The Company generally does not require collateral, and the majority of its trade receivables are unsecured. Trade accounts receivable are periodically evaluated for collectibility based on past credit history with customers and their current financial condition, and are charged against allowance for doubtful accounts when they are deemed uncollectible.
Advertising: Advertising costs, except for costs associated with direct-response advertising, are charged to operations when incurred. The costs of direct-response advertising are capitalized and amortized over the period during which future benefits are expected to be received. Advertising expense was $73,284 for the year ended December 31, 2005.
Credit Risk: Financial instruments which potentially subject the Company to concentrations of credit risk include cash and receivables. Concentration of credit risk with respect to receivables is limited due to the Company’s large number of customers. However, at December 31, 2005, a customer comprised approximately 11% of total receivables. The Company maintains cash accounts at several institutions. The balances are insured by the Federal Deposit Insurance Corporation up to $100,000 per institution. At December 31, 2005, the Company exceeded the insured limit by $67,052.
F-63
Table of Contents
Index to Financial Statements
BLR CONSTRUCTION COMPANIES, L.L.C. AND AFFILIATE
NOTES TO COMBINED FINANCIAL STATEMENTS—(Continued)
Note 3: Notes Payable—Short Term
Notes payable at December 31, 2005 consist of the following:
Regions Bank, $4,000,000 line of credit, due March 23, 2006, interest rate LIBOR + 3.00%, currently at 7.37%, secured by accounts receivable, equipment, real estate and personal guarantees of stockholders | $ | 3,902,619 | |
Regions Bank, $1,500,000 line of credit, due March 23, 2006, interest rate LIBOR + 3.00%, currently at 7.37%, secured by accounts receivable, equipment, real estate and personal guarantees of stockholders | 920,654 | ||
Regions Bank, $740,000 line of credit, due April 12, 2006, interest rate LIBOR + 3.50%, currently at 7.87%, secured by accounts receivable, equipment, real estate, and guaranty of stockholders | 740,000 | ||
Regions Bank, $1,000,000 line of credit, due October 12, 2006, interest rate LIBOR + 3.50%, currently at 7.87%, secured by accounts receivable, equipment, real estate, and guaranty of stockholders | 17,600 | ||
AICCO, Inc., $149,119 note dated April 29, 2005, due January 1, 2006, interest rate 7.25%, payable in monthly installments of $15,412, secured by insurance policy | 15,319 | ||
AICCO, Inc., $6,000 note dated July 27, 2005, due January 1, 2006, interest rate 7.25%, payable in monthly installments of $1,229, secured by insurance policy | 1,219 | ||
Duphil, $636,000 note dated February 16, 2005, due February 16, 2006, interest rate 6.00%, payable in monthly installments of $54,738, unsecured | 162,586 | ||
Duphil, $158,710 note dated November 11, 2005, due January 29, 2006, no interest, payable in monthly installments of $52,903, unsecured | 105,807 | ||
Duphil, $513,960 note dated October 31, 2005, due October 30, 2006, interest rate 6.00%, payable in monthly installments of $44,235, unsecured | 472,295 | ||
Duphil, $419,040 note dated December 9, 2005, due December 9, 2006, interest rate 8.00%, payable in monthly installments of $29,161, unsecured | 419,040 | ||
Total | $ | 6,757,139 | |
F-64
Table of Contents
Index to Financial Statements
BLR CONSTRUCTION COMPANIES, L.L.C. AND AFFILIATE
NOTES TO COMBINED FINANCIAL STATEMENTS—(Continued)
Note 4: Long-Term Debt
Notes payable at December 31, 2005 consist of the following:
CNH Credit, notes dated November 30, 2000 to December 1, 2005, for various amounts, due January 1, 2006 to December 1, 2010, payable in monthly installments of $989 to $2,817, interest rate 4.90% to 8.10%, secured by equipment | $ | 522,005 | |
Caterpillar Finance, notes dated August 6, 2004 to July 25, 2005, for various amounts, due July 28, 2009 to August 6, 2009, payable in monthly installments of $3,371 to $3,901, interest rate 5.98% to 6.76%, secured by equipment | 282,094 | ||
Chase, notes dated May 9, 2005 to October 31, 2005, for various amounts, due May 9, 2008 to November 5, 2008, payable in monthly installments of $567 to $1,180, interest rate 6.39% to 7.99%, secured by vehicles | 121,469 | ||
CIT, $93,487 note, dated January 11, 2005, due February 14, 2010, payable in monthly installments of $1,717, interest rate 3.90%, secured by equipment | 77,682 | ||
Duphil, notes dated December 1, 2004 to December 22, 2005, for various amounts, due May 1, 2006 to June 22, 2007, payable in monthly installments of $29,783 to $87,348, interest rate 6.00% to 8.00%, unsecured | 1,144,535 | ||
Ford Motor Credit, notes dated October 6, 2003 to August 9, 2005, for various amounts, due October 20, 2006 to April 14, 2010, payable in monthly installments of $486 to $940, interest rate 3.90% to 7.99%, secured by vehicles | 211,218 | ||
GMAC, notes dated August 25, 2004 to August 26, 2004, for various amounts, due August 25, 2007, payable in monthly installments of $669 to $880, interest rate 8.74%, secured by vehicles | 44,759 | ||
Gulf Coast Bank, $28,233 note dated October 31, 2005, due November 5, 2008, payable in monthly installments of $876, interest rate 7.25%, secured by vehicles | 27,529 | ||
Iberia Bank, notes dated January 11, 2005 to August 12, 2005, for various amounts, due January 10, 2008 to August 12, 2008, payable in monthly installments of $670 to $779, interest rate 5.85% to 6.59%, secured by vehicles | 92,504 | ||
Kubota Credit, notes dated August 29, 2005 to September 20, 2005, for various amounts, due August 29, 2008 to September 20, 2008, payable in monthly installments of $1,341 to $1,760, no interest, secured by equipment | 100,583 | ||
Midsouth National Bank, notes dated August 22, 2003, for various amounts, due August 25, 2006, payable in monthly installments of $553 to $833, interest rate 5.75%, secured by vehicles | 10,777 | ||
US Bank, notes dated December 7, 2005 to December 21, 2005, for various amounts, due December 7, 2009 to December 21, 2009, payable in monthly installments of $1,009 to $1,020, interest rate 7.65%, secured by vehicles | 125,305 | ||
Regions Bank, notes dated October 6, 2003 to October 12, 2005, for various amounts, due December 5, 2006 to October 12, 2012, payable in monthly installments of $569 to $46,217, interest rate LIBOR + 3.00% to 6.05%, secured by accounts receivable, equipment, real estate, guaranty of stockholders, trailer, and vehicles | 3,955,903 | ||
| 6,716,363 | |||
Less: Current portion | 3,269,529 | ||
Long-Term portion | $ | 3,446,834 | |
F-65
Table of Contents
Index to Financial Statements
BLR CONSTRUCTION COMPANIES, L.L.C. AND AFFILIATE
NOTES TO COMBINED FINANCIAL STATEMENTS—(Continued)
Annual maturities of long-term debt during each year ended December 31 are as follows:
2006 | $ | 3,269,529 | |
2007 | 1,592,795 | ||
2008 | 910,295 | ||
2009 | 545,207 | ||
2010 | 152,566 | ||
Later | 245,971 | ||
Total | $ | 6,716,363 | |
At December 31, 2005, the Company has available approximately $1,659,127 of unused lines of credit with Regions Bank to be drawn upon. The interest rates on the lines of credit range from LIBOR + 3.00% to LIBOR + 3.50%.
On January 10, 2006, the $4,000,000 line of credit with Regions Bank was increased to $7,000,000.
Note 5: Major Customer
Sales to customers for the year ended December 31, 2005, which amounted to 10% or more of the Company’s revenue is as follows:
| Total Amount | % of Total Revenue | |||||
Customer A | $ | 4,532,780 | 11.50 | % | ||
Note 6: 401(k) Plan
The Company contributes to a 401(k) plan that is a qualified plan under the Employees Retirement Income Security Act of 1974. All employees who are at least 21 years old and have at least three months of service at the end of each calendar quarter are eligible to participate in the plan. The Company matches one-half of employee contributions up to 3% of compensation. For the year ended December 31, 2005, the Company made matching contributions of $35,163 to the plan.
Note 7: Related Party Transactions
The Company engaged in transactions during the year with members and the following related companies:
Rental One, L.L.C.
NJM Technology, L.L.C.
Flow Chem Technologies, L.L.C.
Oilfield Heavy Haulers, L.L.C.
F-66
Table of Contents
Index to Financial Statements
BLR CONSTRUCTION COMPANIES, L.L.C. AND AFFILIATE
NOTES TO COMBINED FINANCIAL STATEMENTS—(Continued)
These transactions resulted in the following amounts that are included in the financial statements for the year ended December 31, 2005.
Accounts receivable | $ | 14,529 | |
Interest receivable | 126,703 | ||
Due from members | 1,186,667 | ||
Due from affiliates | 325,093 | ||
Accounts payable | 838,595 | ||
Revenue | 44,555 | ||
Cost of revenue | 1,222,896 | ||
Interest expense | 21,717 | ||
Rent expense | 36,000 |
Note 8: Investment
At December 31, 2004, the Company’s investment consisted of a six percent working interest in an oil well. During 2005, the investment became totally impaired and has been written down to its estimated realizable value. The amount of the write-down of $30,000 has been charged to loss on investment, which is shown in other income on the income statement.
Note 9: Rentals Under Operating Leases
The Company leases vehicles and equipment under operating leases expiring in various years through 2010. Future minimum lease payments under noncancelable operating leases having remaining terms in excess of one year as of December 31, 2005 are:
Year Ending December 31, | Amount | ||
2006 | $ | 294,103 | |
2007 | 219,840 | ||
2008 | 138,005 | ||
2009 | 123,800 | ||
2010 | 115,799 | ||
| $ | 891,547 | ||
Rent expense relating to these leases was $203,156 for the year ended December 31, 2005.
Note 10: Capital Lease
The Company became the lessee of a telephone system under a capital lease expiring on June 1, 2010. The asset and liability is recorded at the lower of the present value of the minimum lease payments or the fair value of the asset. The asset is depreciated over the lower of the related lease term or its estimated productive life. Depreciation of the asset under capital lease amounts to $2,161 and is included in depreciation expense for the year ended December 31, 2005.
F-67
Table of Contents
Index to Financial Statements
BLR CONSTRUCTION COMPANIES, L.L.C. AND AFFILIATE
NOTES TO COMBINED FINANCIAL STATEMENTS—(Continued)
Following is a summary of property held under capital lease:
Furniture and fixtures | $ | 43,225 | ||
Less: Accumulated depreciation | (2,161 | ) | ||
| $ | 41,064 | |||
Minimum future lease payments under capital leases as of December 31, 2005 are as follows:
2006 | $ | 11,345 | ||
2007 | 11,345 | |||
2008 | 11,345 | |||
2009 | 11,345 | |||
2010 | 5,673 | |||
Less: Amounts representing interest | (11,188 | ) | ||
Present value of minimum lease payments | $ | 39,865 | ||
Note 11: Income Taxes
Prior to the merger and reorganization effective January 1, 2005, the Companies operated as C corporations. Effective January 1, 2005, the Company reorganized as a limited liability company and, with the consent of its members, has elected under the Internal Revenue Code to be taxed as an S Corporation. As an S Corporation, the members are taxed on their proportionate share of the Company’s taxable income. Therefore, no provision or liability for federal income taxes has been included in the financial statements. Certain specific deductions and credits flow through the Company to its members.
As a result of this election, the Company will not incur any additional income tax obligations, and future financial statements will not include a provision for income taxes. Prior to the change to S Corporation status, income taxes currently payable and deferred income taxes were recorded in the Company’s financial statements.
The provision for income taxes consists of the following:
Deferred | $ | 909,343 | |
All of the deferred income tax provisions in 2005 relate to the elimination of the deferred tax liability of $909,343 at the date the election for the change to Subchapter S Status was filed.
Note 12: Commitments and Contingencies
Insurance Program: The Company self-insures for business automobile liability, commercial general liability and worker’s compensation. Under the self-insured plan, the Company is liable for the first $50,000 of claims per occurrence. Claims in excess of $50,000 are covered by an excess liability policy. The plan provides for aggregate protection by establishing an aggregate loss fund based on incurred payroll. The aggregate loss fund totalled $623,008 at December 31, 2005 and is shown as restricted cash on the balance sheet. A self-insurance reserve for claims payable totalled $198,162 at December 31, 2005 and is shown as accrued expenses and other current liabilities on the balance sheet.
F-68
Table of Contents
Index to Financial Statements
BLR CONSTRUCTION COMPANIES, L.L.C. AND AFFILIATE
NOTES TO COMBINED FINANCIAL STATEMENTS—(Continued)
Litigation: The Company is subject to various claims and legal proceedings covering matters that arise in the ordinary course of its business activities. Management believes that any liability that may ultimately result from the resolution of these matters will not have a material adverse effect on the financial condition or results of operations of the Company.
Note 13: Subsequent Event
On February 7, 2006, the owners of BLR Construction Companies, L.L.C. entered into an agreement with Stallion Oilfield Services, LTD to sell their membership interests in the Company. On February 28, 2006, the change in ownership became effective. LPCC, Inc., an affiliate of BLR Construction Companies, L.L.C., was excluded from the transaction.
The Company entered into a three year employment agreement with its CEO on January 1, 2005, which provides for certain compensation upon the sale of the Company. At February 28, 2006, the Company’s commitment as a result of the sale amounts to $380,769.
F-69
Table of Contents
Index to Financial Statements
WRIGHT, MOORE, DEHART, DUPUIS & HUTCHINSON,L.L.C.
| Certified Public Accountants | ||||
| 100 Petroleum Drive, 70508 | ||||
JOHN W. WRIGHT, CPA* | P. O. Box 80569 • Lafayette, Louisiana 70598-0569 | CHRISTINE R. DUNN, CPA | ||
JAMES H. DUPUIS, CPA, CFP* | (337) 232-3637 • FAX (337) 235-8557 | ANDRE D. BROUSSARD, CPA | ||
JOE D. HUTCHINSON, CPA* | www.wmddh.com | MARY PATRICIA KEELEY, CPA | ||
JAN H. COWEN, CPA* | KRISTIE C. BOUDREAUX, CPA | |||
LANCE E. CRAPPELL, CPA* | BRIDGET B. TILLEY, CPA, MT | |||
PAT BAHAM DOUGHT, CPA* | DAMIAN H. SPIESS, CPA, CFP | |||
MICAH R. VIDRINE, CPA* | TASHA A. RALEY, CPA | |||
TRAVIS M. BRINSKO, CPA* | PATRICK WAGUESPACK, CPA | |||
RICK STUTES, CPA, CVA | CHIP CANTRELL, CPA | |||
| DANE P. FALGOUT, CPA | ||||
* A PROFESSIONAL CORPORATION | ROBIN G. STOCKTON, CPA | |||
RETIRED | ||||
M. TROY MOORE, CPA* | ||||
MICHAEL G. DeHART, CPA. CVA, MBA* | ||||
Independent Auditors’ Report on Supplementary Information
To the Board of Directors
BLR Construction Companies. L.L.C.
Duson, Louisiana
Our audit of the basic financial statements for the year ended December 31, 2005 was made primarily to form an opinion on such financial statements taken as a whole. The supplementary information is presented for purposes of additional analysis and is not a required part of the basic financial statements. The supplementary information has been subjected to the audit procedures applied in the examination of the basic financial statements and is, in our opinion, fairly presented in all material respects in relation to the basic financial statements taken as a whole.
CERTIFIED PUBLIC ACCOUNTANTS
March 17, 2006
F-70
Table of Contents
Index to Financial Statements
BLR CONSTRUCTION CO., INC. AND AFFILIATES
COMBINED SCHEDULE OF GENERAL AND ADMINISTRATIVE EXPENSES
FOR THE YEAR ENDED DECEMBER 31, 2005
Advertising | $ | 73,284 | |
Auto and truck expense | 566,865 | ||
Bad debt | 144,225 | ||
Bank charges | 4,286 | ||
Contract labor | 21,483 | ||
Contributions | 12,736 | ||
Customer relations | 22,707 | ||
Drug testing | 5,455 | ||
Dues and subscriptions | 4,327 | ||
Employee benefits | 2,442 | ||
Fuel | 97,677 | ||
Insurance | 785,320 | ||
Janitorial | 1,040 | ||
Legal and professional | 310,134 | ||
Medical | 22,865 | ||
Office expense | 71,164 | ||
Penalties | 8,146 | ||
Rent expense | 59,930 | ||
Repairs and maintenance | 35,889 | ||
Retirement | 35,163 | ||
Safety | 95,751 | ||
Salaries and wages | 2,742,966 | ||
Supplies | 245,014 | ||
Taxes and licenses | 312,352 | ||
Travel and entertainment | 474,101 | ||
Uniforms | 24,573 | ||
Utilities | 147,947 | ||
Total general and administrative expenses | $ | 6,327,842 | |
See Independent Auditors’ Report on Supplementary Information.
F-71
Table of Contents
Index to Financial Statements
WRIGHT, MOORE, DEHART, DUPUIS & HUTCHINSON,L.L.C.
Certified Public Accountants 100 Petroleum Drive, 70508 | ||||
JOHN W. WRIGHT, CPA* JAMES H. DUPUIS, CPA, CFP* JOE D. HUTCHINSON, CPA* JAN H. COWEN, CPA* LANCE E. CRAPPELL, CPA* PAT BAHAM DOUGHT, CPA* MICAH R. VIDRINE, CPA* TRAVIS M. BRINSKO, CPA* * A PROFESSIONAL CORPORATION
RETIRED M. TROY MOORE, CPA* MICHAEL G. DeHART, CPA, CVA, MBA* | P.O. Box 80569 Ÿ Lafayette, Louisiana 70598-0569 (337) 232-3637Ÿ FAX (337) 235-8557 www.wmddh.com | CHRISTINE R. DUNN, CPA RICK STUTES, CPA, CVA ANDRE D. BROUSSARD, CPA MARY PATRICIA KEELEY, CPA KRISTIE C. BOUDREAUX, CPA BRIDGET B. TILLEY, CPA, MT DAMIAN H. SPIESS, CPA, CFP TASHA A. RALEY, CPA PATRICK WAGUESPACK, CPA CHIP CANTRELL, CPA DANE P. FALGOUT, CPA
|
To the Board of Directors
BLR Construction Co., Inc. and Affiliates
Duson, Louisiana
We have audited the accompanying Combined Balance Sheet of BLR Construction Co., Inc. and Affiliates as of December 31, 2004 and the related Combined Statements of Income, Retained Earnings and Cash Flows for the year then ended. These financial statements are the responsibility of the Company’s management. Our responsibility is to express an opinion on these financial statements based on our audit.
We conducted our audit in accordance with auditing standards generally accepted in the United States of America. Those standards require that we plan and perform the audit to obtain reasonable assurance about whether the financial statements are free of material misstatement. An audit includes examining, on a test basis, evidence supporting the amounts and disclosures in the financial statements. An audit also includes assessing the accounting principles used and significant estimates made by management, as well as evaluating the overall financial statement presentation. We believe that our audits provide a reasonable basis for our opinion.
In our opinion, the financial statements referred to above present fairly, in all material respects, the financial position of BLR Construction Co., Inc. and Affiliates as of December 31, 2004 and the results of its operations and cash flows for the year then ended in conformity with accounting principles generally accepted in the United States of America.
|
WRIGHT, MOORE, DEHART, DUPUIS & HUTCHINSON, L.L.C. CERTIFIED PUBLIC ACCOUNTANTS |
May 27, 2005
F-72
Table of Contents
Index to Financial Statements
BLR CONSTRUCTION CO., INC. AND AFFILIATES
DECEMBER 31, 2004
ASSETS | ||||
Current assets | ||||
Cash | $ | 74,803 | ||
Cash—restricted | 268,704 | |||
Accounts receivable | ||||
Trade (net of allowance for doubtful accounts of $95,000) | 3,829,500 | |||
Other | 3,205,450 | |||
Income tax refund receivable | 7,167 | |||
Due from affiliates | 311,936 | |||
Prepaid expenses | 210,599 | |||
Total current assets | 7,908,159 | |||
Property and equipment | ||||
Vehicles | 1,079,723 | |||
Buildings and improvements | 583,701 | |||
Machinery and equipment | 2,395,630 | |||
Furniture and fixtures | 589,494 | |||
Mats | 9,000,918 | |||
Land | 49,987 | |||
Total | 13,699,453 | |||
Less: Accumulated depreciation | 3,869,836 | |||
Property and equipment—net | 9,829,617 | |||
Other assets | ||||
Investment, at cost | 30,000 | |||
Deposits | 300 | |||
Total other assets | 30,300 | |||
Total assets | $ | 17,768,076 | ||
LIABILITIES AND STOCKHOLDERS’ EQUITY | ||||
Current liabilities | ||||
Accounts payable | $ | 2,140,404 | ||
Notes payable | 4,434,467 | |||
Current maturities of long-term debt | 1,703,036 | |||
Income taxes payable | 28,847 | |||
Interest payable | 18,332 | |||
Accrued expenses and other current liabilities | 1,228,747 | |||
Total current liabilities | 9,553,833 | |||
Long-term liabilities | ||||
Notes payable, less current portion | 2,130,223 | |||
Deferred income taxes | 909,343 | |||
Due to stockholders | 573,321 | |||
Total long-term liabilities | 3,612,887 | |||
Stockholders’ equity | ||||
Common stock | 25,600 | |||
Additional paid in capital | 275,948 | |||
Retained earnings | 4,549,808 | |||
Less: 100 shares of treasury stock, at cost | (250,000 | ) | ||
Total stockholders’ equity | 4,601,356 | |||
Total liabilities and stockholders’ equity | $ | 17,768,076 | ||
The accompanying notes are an integral part of these financial statements.
F-73
Table of Contents
Index to Financial Statements
BLR CONSTRUCTION CO., INC. AND AFFILIATES
FOR THE YEAR ENDED DECEMBER 31, 2004
Revenue | $ | 23,953,441 | ||
Cost of revenue | ||||
Depreciation | 1,824,146 | |||
Labor and related costs | 5,727,106 | |||
Materials and supplies | 3,371,246 | |||
Rent | 2,288,127 | |||
Other costs | 2,385,172 | |||
Total cost of revenue | 15,595,797 | |||
Gross profit | 8,357,644 | |||
Operating expenses | ||||
General and administrative expenses | 3,927,607 | |||
Depreciation | 26,994 | |||
Total operating expenses | 3,954,601 | |||
Operating income | 4,403,043 | |||
Other income (expense) | ||||
Interest expense | (468,010 | ) | ||
Loss on sale of assets | (216,487 | ) | ||
Miscellaneous | 152,066 | |||
Interest income | 26,123 | |||
Total other expense | (506,308 | ) | ||
Income before income taxes | 3,896,735 | |||
Income taxes | ||||
Current | 21,306 | |||
Deferred | 579,856 | |||
Total income taxes | 601,162 | |||
Net income | $ | 3,295,573 | ||
The accompanying notes are an integral part of these financial statements.
F-74
Table of Contents
Index to Financial Statements
BLR CONSTRUCTION CO., INC. AND AFFILIATES
COMBINED STATEMENT OF RETAINED EARNINGS
FOR THE YEAR ENDED DECEMBER 31, 2004
Balance at beginning of year as previously reported | $ | 1,785,563 | ||
Prior period adjustments—see Note 15 | (531,328 | ) | ||
Balance at beginning of year as restated | 1,254,235 | |||
Additions | ||||
Net income | 3,295,573 | |||
Balance at end of year | $ | 4,549,808 | ||
The accompanying notes are an integral part of these financial statements.
F-75
Table of Contents
Index to Financial Statements
BLR CONSTRUCTION CO., INC. AND AFFILIATES
COMBINED STATEMENT OF CASH FLOWS
FOR THE YEAR ENDED DECEMBER 31, 2004
Cash flows from operating activities | ||||
Net income | $ | 3,295,573 | ||
Adjustments to reconcile net income to net cash provided by operating activities: | ||||
Depreciation | 1,851,140 | |||
Loss on sale of assets | 216,487 | |||
Deferred income taxes | 579,856 | |||
Changes in assets and liabilities: | ||||
Accounts receivable | (3,059,274 | ) | ||
Inventories | 2,213 | |||
Income tax refund receivable | 12,685 | |||
Prepaid expenses | 118,691 | |||
Accounts payable | 722,019 | |||
Income taxes payable | 8,031 | |||
Interest payable | 18,332 | |||
Accrued expenses and other current liabilities | 951,595 | |||
Net cash provided by operating activities | 4,717,348 | |||
Cash flows from investing activities | ||||
Proceeds from sale of property and equipment | 349,755 | |||
Purchases of property and equipment | (4,557,278 | ) | ||
Loans to affiliates | (311,936 | ) | ||
Purchases of investments | (30,000 | ) | ||
Net cash used in investing activities | (4,549,459 | ) | ||
Cash flows from financing activities | ||||
Decrease in due to stockholders | (224,590 | ) | ||
Proceeds from issuance of debt | 500,000 | |||
Net borrowing on lines of credit | 1,804,794 | |||
Repayment of debt | (2,164,538 | ) | ||
Net cash used in financing activities | (84,334 | ) | ||
Net increase in cash | $ | 83,555 | ||
Cash at beginning of year | 259,952 | |||
Cash at end of year | $ | 343,507 | ||
The accompanying notes are an integral part of these financial statements.
F-76
Table of Contents
Index to Financial Statements
BLR CONSTRUCTION CO., INC. AND AFFILIATES
NOTES TO COMBINED FINANCIAL STATEMENTS
Note 1: Organization
BLR Construction Co., Inc. was incorporated in the state of Louisiana on December 15, 1994. The affiliated group of companies is engaged in various enterprises including oilfield construction, pipeline construction, crewboat and tugboat rentals, and contract labor. The affiliated group of companies operates in the Southern United States.
Note 2: Summary of Significant Accounting Policies
Principles of Combination: The accompanying financial statements for the year ended December 31, 2004 include the combined accounts of BLR Construction Co., Inc. and its affiliates, BLR Crewboats, Inc., BLR Marine Services, Inc., BLR Roustabout, Inc., Louisiana Pipeline and Construction Co., Inc. (an S-corporation), and LPCC, Inc., collectively referred to as “the Company”. All material intercompany balances and transactions have been eliminated in the combination.
Property and Equipment: Property and equipment are stated at cost. Expenditures for property and equipment and items which substantially increase the useful lives of existing assets are capitalized at cost and depreciated. Routine expenditures for repairs and maintenance are expensed as incurred. The cost and related accumulated depreciation of property and equipment disposed of are eliminated from the accounts, and any resulting gain or loss is recognized.
Depreciation is provided utilizing the straight-line method. Depreciation expense amounts to $1,851,140 for the year ended December 31, 2004.
Use of Estimates: The preparation of financial statements requires management to make estimates and assumptions that affect certain reported amounts and disclosures. Accordingly, actual results could differ from those estimates.
Cash Flows: For purposes of the statements of cash flows, the Company considers all highly liquid investments with an original maturity of three months or less to be cash equivalents.
Advertising: Advertising costs, except for costs associated with direct-response advertising, are charged to operations when incurred. The costs of direct-response advertising are capitalized and amortized over the period during which future benefits are expected to be received. Advertising expense was $17,710 for the year ended December 31, 2004.
Accounts Receivable: Trade accounts receivable are carried at their estimated collectible amounts. Trade credit is generally extended on a short-term basis; thus receivables do not bear interest, although a finance charge may be applied to amounts past due. The Company generally does not require collateral, and the majority of its trade receivables are unsecured. Trade accounts receivable are periodically evaluated for collectibility based on past credit history with customers and their current financial condition, and are charged against allowance for doubtful accounts when they are deemed uncollectible.
Credit Risk: Financial instruments which potentially subject the Company to concentrations of credit risk include cash and receivables. Concentration of credit risk with respect to receivables is limited due to the Company’s large number of customers. However, at December 31, 2004, three customers comprised approximately 59% of total receivables. The Company maintains cash accounts at several institutions. The balances are insured by the Federal Deposit Insurance Corporation up to $100,000 per institution. At December 31, 2004, the Company did not exceed the insured limit.
F-77
Table of Contents
Index to Financial Statements
BLR CONSTRUCTION CO., INC. AND AFFILIATES
NOTES TO COMBINED FINANCIAL STATEMENTS—(Continued)
Note 3: Notes Payable—Short Term
Notes payable at December 31, 2004 consist of the following:
Regions Bank, $4,000,000 line of credit dated November 20, 2004, due “November 20, 2005, interest rate LIBOR + 3.00%, secured by accounts receivable, equipment, real estate and personal guarantees of stockholders | $ | 1,399,243 | |
Regions Bank, $1,750,000 line of credit dated May 17, 2004, due May 17, 2005, interest rate LIBOR + 3.50%, secured by accounts receivable, equipment, real estate and guaranty of stockholders | 1,750,000 | ||
Regions Bank, $1,000,000 line of credit dated May 17, 2004, due May 17, 2005, interest rate LIBOR + 3.50%, secured by accounts receivable, equipment, real estate and guaranty of stockholders | 220,523 | ||
Duphil, $998,360 note dated May 1, 2004, due April 1, 2005, interest rate 6.00%, payable in monthly installments or $85,925, unsecured | 423,256 | ||
Duphil, $396,325 note dated June 4, 2004, due November 4, 2004, interest rate 6.00%, payable in monthly installments of $67,215, unsecured, note paid off on January 13, 2005 | 66,881 | ||
Regions Bank, $1,500,000 line of credit dated September 23, 2004, due September 23, 2005, interest rate LIBOR + 3.00%, secured by accounts receivable, equipment, real estate and personal guarantees of stockholders | 574,564 | ||
Total | $ | 4,434,467 | |
F-78
Table of Contents
Index to Financial Statements
BLR CONSTRUCTION CO., INC. AND AFFILIATES
NOTES TO COMBINED FINANCIAL STATEMENTS—(Continued)
Note 4: Notes Payable
Notes payable at December 31, 2004 consist of the following:
Regions Bank, $1,206,963 note dated November 20, 2003, due December 5, 2006, payable in monthly installments of $23,153 and one final payment estimated to be $417,815, interest rate 5.50%, secured by accounts receivable, equipment, real estate and personal guarantees of stockholders | $ | 880,416 | |
Regions Bank, $32,000 note dated October 6, 2003, due October 20, 2008, interest rate LIBOR + 3.50%, payable in monthly installments of $600, secured by equipment | 24,694 | ||
Regions Bank, $36,000 note dated January 22, 2004, due January 23, 2008, interest rate LIBOR + 3.50%, payable in monthly installments of $824, secured by vehicle | 28,430 | ||
Regions Bank, $24,800 note dated January 9, 2004, due January 23, 2008, interest rate LIBOR + 3.50%, payable in monthly installments of $569, secured by trailer | 19,022 | ||
Regions Bank, $500,000 note dated May 17, 2004, due May 17, 2007, interest rate LIBOR + 3.50%, payable in monthly installments of $14,923, secured by accounts receivable and equipment | 409,437 | ||
Regions Bank, $34,000 note dated March 3, 2004, due March 17, 2009, interest rate 6.05%, payable in monthly installments of $661, secured by vehicle | 29,615 | ||
Midsouth National Bank, $27,423 note dated August 22, 2003, due August 25, 2006, interest rate 5.75%, payable in monthly installments of $883, secured by vehicle | 15,805 | ||
Case Credit, notes dated November 30, 2000 to December 31, 2004, for various amounts, due December 1, 2005 to January 15, 2010, payable in monthly installments of $989 to $1,860, interest rate 4.90% to 6.25%, secured by equipment | 213,948 | ||
Ford Motor Credit, notes dated July 8, 2004 to July 23, 2004, for various amounts, due July 21, 2007 to August 5, 2008, payable in monthly installments of $668 to $812, interest rate 5.99% to 6.49%, secured by vehicles | 69,825 | ||
GMAC, $21,129 note dated August 26, 2004, due August 25, 2007, interest rate 8.74%, payable in monthly installments of $669, secured by vehicle | 19,042 | ||
Caterpillar, $174,490 note dated August 6, 2004, due August 6, 2009, interest rate 5.98%, payable in monthly installments of $3,371, secured by vehicle | 165,097 | ||
Duphil, $1,500,000 note dated December 1, 2004, due May 1, 2006, interest rate 6.00%, payable in monthly installments of $87,348, unsecured | 1,420,152 | ||
Regions Bank, $444,833 note dated November 20, 2003, due December 5, 2006, payable in monthly installments of $8,533 and one final payment estimated to be $200,076, interest rate 5.50%, secured by accounts receivable, equipment, real estate and personal guarantees of stockholders | 290,151 | ||
Midsouth National Bank, $18,202 note dated August 22, 2003, due August 25, 2006, payable in monthly installments of $553, interest rate 5.75%, secured by vehicle | 10,210 | ||
GMAC, $27,768 note dated August 25, 2004, due August 25, 2007, interest rate 8.74%, payable in monthly installments of $880, secured by vehicle | 25,028 | ||
GMAC, $27,280 note dated August 25, 2004, due August 25, 2007, interest rate 8.74%, payable in monthly installments of $864, secured by vehicle | 24,588 | ||
Case Credit, $81,648 note dated July 25, 2002, due July 25, 2007, payable in monthly installments of $1,537, interest rate 4.90%, secured by equipment | 44,671 | ||
Case Credit, $110,750 note dated June 21, 2004, due June 21, 2009, payable in monthly installments of $2,136, interest rate 5.91%, secured by equipment | 101,118 | ||
Ford Motor Credit, notes dated November 19, 2002 to October 6, 2003, for various amounts, due November 19, 2005 to October 20, 2006, payable in monthly installments of $790 to $805, interest rate 0.00% to 5.00%, secured by vehicles | 42,010 | ||
| 3,833,259 | |||
Less: Current portion | 1,703,036 | ||
Long-Term portion | $ | 2,130,223 | |
F-79
Table of Contents
Index to Financial Statements
BLR CONSTRUCTION CO., INC. AND AFFILIATES
NOTES TO COMBINED FINANCIAL STATEMENTS—(Continued)
Annual maturities of long-term debt during each year ended December 31 are as follows:
2006 | $ | 1,659,770 | |
2007 | 257,224 | ||
2008 | 125,199 | ||
2009 | 86,050 | ||
Later | 1,980 | ||
Total | $ | 2,130,223 | |
At December 31, 2004, the Company has available approximately $3,067,382 of unused lines of credit with Regions Bank to be drawn upon. The interest rates on the lines of credit are LIBOR + 3.00% and 3.50%.
Note 5: Major Customers
Sales to customers for the year ended December 31, 2004, which amounted to 10% or more of the Company’s revenue is as follows:
| Total Amount | % of Total Revenue | |||||
Customer A | $ | 3,572,041 | 14.91 | % | ||
Customer B | 3,186,949 | 13.30 | % | |||
Note 6: 401(k) Plan
The Company contributes to a 401(k) plan that is a qualified plan under the Employees Retirement Income Security Act of 1974. All employees who are at least 21 years old and have at least three months of service at the end of each calendar quarter are eligible to participate in the plan. The Company matches one-half of employee contributions up to 3% of compensation. For the year ended December 31, 2004, the Company made matching contributions of $25,631 to the plan.
Note 7: Related Party Transactions
The Company engaged in transactions during the year with stockholders and the following related companies:
Rental One, L.L.C.
NJM Technology, L.L.C.
Flow Chem Technologies, L.L.C.
Oilfield Heavy Haulers, L.L.C.
F-80
Table of Contents
Index to Financial Statements
BLR CONSTRUCTION CO., INC. AND AFFILIATES
NOTES TO COMBINED FINANCIAL STATEMENTS—(Continued)
These transactions resulted in the following amounts that are included in the financial statements for the year ended December 31, 2004.
Accounts receivable | $ | 26,392 | |
Due from affiliates | 311,936 | ||
Accounts payable | 35,783 | ||
Due to stockholders | 573,321 | ||
Accrued interest | 5,134 | ||
Revenue | 211,073 | ||
Rent expense | 37,500 | ||
Interest expense | 67,075 | ||
Interest income | 26,055 | ||
Miscellaneous income | 23,900 |
Due to stockholders consists of various advances to the Company that are due on demand at an interest rate of 6.00%. However, since it is not the intent of the stockholders to call these amounts in the near future, the balance is included in the Long-Term Liabilities section on the balance sheet.
Note 8: Income Taxes (Benefit)
The Company has provided for income tax as follows:
Currently payable (receivable): | ||||
Federal tax | ($475 | ) | ||
State tax | 21,781 | |||
Deferred | 579,856 | |||
Total Provision for Income Taxes | $ | 601,162 | ||
The Company’s effective income tax rate varies from what would be expected if the statutory rate were applied to income before income taxes primarily because of certain expenses deductible for financial reporting purposes that are not deductible for tax purposes and tax exempt income.
Deferred income taxes reflect the net tax effects of temporary differences between the carrying amounts of assets and liabilities for financial reporting purposes and the amounts used for income tax purposes. The major temporary differences that give rise to the deferred tax assets and liabilities are allowance for doubtful accounts and depreciation.
The balance in deferred tax asset (liability) as of December 31, 2004 is as follows:
Deferred tax asset | $ | 25,241 | ||
Deferred tax liability | (934,584 | ) | ||
Deferred tax asset (liability) before valuation allowance | (909,343 | ) | ||
Less: valuation allowance | — | |||
Net deferred tax liability | ($ | 909,343 | ) | |
F-81
Table of Contents
Index to Financial Statements
BLR CONSTRUCTION CO., INC. AND AFFILIATES
NOTES TO COMBINED FINANCIAL STATEMENTS—(Continued)
Note 9: Additional Cash Flow Disclosures
Cash paid during the year for: | |||
Interest | $ | 484,367 | |
Income taxes | $ | 12,758 | |
Non cash investing and financing activities: | |||
Equipment purchased under installment note obligations | $ | 3,630,972 | |
Note 10: Rentals Under Operating Leases
The Company leases vehicles and equipment under operating leases expiring in various years through 2008. Future minimum lease payments under noncancelable operating leases having remaining terms in excess of one year as of December 31, 2004 are:
Year Ending December 31, | Amount | ||
2005 | $ | 187,573 | |
2006 | 154,278 | ||
2007 | 90,985 | ||
2008 | 14,205 | ||
2009 | — | ||
| $ | 447,041 | ||
Rent expense relating to these leases was $187,573 for the year ended December 31, 2004.
Note 11: Common Stock
Common stock at December 31, 2004 is as follows:
BLR Construction Co., Inc. | |||
Common stock, no par value, 1,000 shares authorized, 888 shares issued and outstanding | $ | 6,000 | |
BLR Crewboats, Inc. | |||
Common stock, no par value, 1,000 shares authorized, 501 shares issued and outstanding | 10,000 | ||
BLR Marine Services, Inc. | |||
Common stock, no par value, 1,000 shares authorized, 502 shares issued and outstanding | 5,000 | ||
BLR Roustabout, Inc. | |||
Common stock, no par value, 1,000 shares authorized, 660 shares issued and outstanding | 3,500 | ||
Louisiana Pipeline and Construction Co., Inc. | |||
Common stock, no par value, 10,000 shares authorized, 200 shares issued, 100 shares outstanding | 1,000 | ||
LPCC, Inc. | |||
Common stock, no par value, 1,000 shares authorized, 200 shares issued and outstanding | 100 | ||
Total Common Stock | $ | 25,600 | |
Note 12: Investment
The Company’s investment consists of a six percent working interest in an oil well. The investment is stated at cost, which does not exceed estimated net realizable value.
F-82
Table of Contents
Index to Financial Statements
BLR CONSTRUCTION CO., INC. AND AFFILIATES
NOTES TO COMBINED FINANCIAL STATEMENTS—(Continued)
Note 13: Commitments and Contingencies
Insurance Program: The Company self-insures for business automobile liability, commercial general liability and worker’s compensation. Under the self-insured plan, the Company is liable for the first $50,000 of claims per occurrence. Claims in excess of $50,000 are covered by an excess liability policy. The plan provides for aggregate protection by establishing an aggregate loss fund based on incurred payroll. The aggregate loss fund totaled $268,704 at December 31, 2004 and is shown as restricted cash on the balance sheet.
Litigation: The Company is subject to various claims and legal proceedings covering matters that arise in the ordinary course of its business activities. Management believes that any liability that may ultimately result from the resolution of these matters will not have a material adverse effect on the financial condition or results of operations of the Company.
Note 14: Subsequent Event
Effective January 1, 2005, the group of affiliated companies referred to in Note 2 merged to form BLR Construction Company, L.L.C. The newly formed company is a limited liability company that will be regarded as a S-corporation for income tax purposes. Accordingly, the deferred tax liability as of December 31, 2004 will be eliminated on January 1, 2005.
Note 15: Prior Period Adjustment
Retained earnings as of December 31, 2003 has been adjusted to dispose of mats that should have been disposed of in previous years. Had the error not been made, combined net income for 2003, 2002 and 2001 would have been decreased by $644,657. | ($644,657 | ) | ||
Retained earnings as of December 31, 2003 has also been adjusted to record revenue that should have recorded in 2003. Had the error not been made, net income for 2003 would have increased by 113,329. | 113,329 | |||
Total | $ | (531,328 | ) | |
F-83
Table of Contents
Index to Financial Statements
WRIGHT, MOORE, DEHART, DUPUIS & HUTCHINSON,L.L.C.
Certified Public Accountants 100 Petroleum Drive, 70508 | ||||
JOHN W. WRIGHT, CPA* JAMES H. DUPUIS, CPA, CFP* JOE D. HUTCHINSON, CPA* JAN H. COWEN, CPA* LANCE E. CRAPPELL, CPA* PAT BAHAM DOUGHT, CPA* MICAH R. VIDRINE, CPA* TRAVIS M. BRINSKO, CPA* * A PROFESSIONAL CORPORATION
RETIRED M. TROY MOORE, CPA* MICHAEL G. DeHART, CPA, CVA, MBA* | P.O. Box 80569· Lafayette, Louisiana 70598-0569 (337) 232-3637· FAX (337) 235-8557 www.wmddh.com | CHRISTINE R. DUNN, CPA RICK STUTES, CPA, CVA ANDRE D. BROUSSARD, CPA MARY PATRICIA KEELEY, CPA KRISTIE C. BOUDREAUX, CPA BRIDGET B. TILLEY, CPA, MT DAMIAN H. SPIESS, CPA, CFP TASHA A. RALEY, CPA PATRICK WAGUESPACK, CPA CHIP CANTRELL, CPA DANE P. FALGOUT, CPA
|
INDEPENDENT AUDITORS’ REPORT ON SUPPLEMENTARY INFORMATION
To the Board of Directors
BLR Construction Co., Inc. and Affiliates
Duson, Louisiana
Our report on our audit of the basic financial statements of BLR Construction Co., Inc. and Affiliates for December 31, 2004 appears on page two. That audit was conducted for the purpose of forming an opinion on the basic financial statements taken as a whole. The Combined Schedule of General and Administrative Expenses is presented for purposes of additional analysis and is not a required part of the basic financial statements. Such information has been subjected to the auditing procedures applied in the audit of the basic financial statements and, in our opinion, is fairly stated in all material respects in relation to the basic financial statements taken as a whole.
|
WRIGHT, MOORE, DEHART, DUPUIS & HUTCHINSON, L.L.C. CERTIFIED PUBLIC ACCOUNTANTS |
May 27, 2005
F-84
Table of Contents
Index to Financial Statements
BLR CONSTRUCTION CO., INC. AND AFFILIATES
COMBINED SCHEDULE OF GENERAL AND ADMINISTRATIVE EXPENSES
FOR THE YEAR ENDED DECEMBER 31, 2004
Advertising | $ | 17,710 | |
Auto and truck expense | 301,897 | ||
Bad debt | 465,702 | ||
Bank charges | 3,738 | ||
Contract labor | 84,177 | ||
Contributions | 11,533 | ||
Customer relations | 30,566 | ||
Drug testing | 9,443 | ||
Dues and subscriptions | 13,343 | ||
Employee benefits | 1,300 | ||
Fuel | 97,156 | ||
Insurance | 645,224 | ||
Legal and professional | 262,246 | ||
Medical | 18,764 | ||
Office expense | 49,131 | ||
Penalties | 1,830 | ||
Rent expense | 49,201 | ||
Repairs and maintenance | 329,896 | ||
Retirement expense | 25,631 | ||
Safety | 47,200 | ||
Salaries and wages | 817,951 | ||
Supplies | 40,902 | ||
Taxes and licenses | 122,027 | ||
Travel and entertainment | 324,282 | ||
Uniforms | 35,241 | ||
Utilities | 121,516 | ||
Total general and administrative expenses | $ | 3,927,607 | |
F-85
Table of Contents
Index to Financial Statements
WRIGHT, MOORE, DEHART, DUPUIS & HUTCHINSON,L.L.C.
Certified Public Accountants 100 Petroleum Drive, 70508 | ||||
JOHN W. WRIGHT, CPA* JAMES H. DUPUIS, CPA, CFP* JOE D. HUTCHINSON, CPA* JAN H. COWEN, CPA* LANCE E. CRAPPELL, CPA* PAT BAHAM DOUGHT, CPA* MICAH R. VIDRINE, CPA* TRAVIS M. BRINSKO, CPA* RICK STUTES CPA, CVA * A PROFESSIONAL CORPORATION
RETIRED M. TROY MOORE, CPA* MICHAEL G. DeHART, CPA, CVA, MBA* | P.O. Box 80569· Lafayette, Louisiana 70598-0569 (337) 232-3637· FAX (337) 235-8557 www.wmddh.com | CHRISTINE R. DUNN, CPA ANDRE D. BROUSSARD, CPA MARY PATRICIA KEELEY, CPA KRISTIE C. BOUDREAUX, CPA BRIDGET B. TILLEY, CPA, MT DAMIAN H. SPIESS, CPA, CFP TASHA A. RALEY, CPA PATRICK WAGUESPACK, CPA CHIP CANTRELL, CPA DANE P. FALGOUT, CPA ROBIN G. STOCKTON. CPA
|
INDEPENDENT AUDITORS’ REPORT
To the Board of Directors
BLR Construction Co. Inc. and Affiliates
Duson. Louisiana
We have audited the accompanying combined balance sheet of BLR Construction Co. Inc. and Affiliates as of December 31, 2003, and the related combined statements of income, retained earnings and cash flows for the year then ended. These financial statements are the responsibility of the Company’s management. Our responsibility is to express an opinion on these financial statements based on our audit.
We conducted our audit in accordance with auditing standards generally accepted in the United States of America. Those standards require that we plan and perform the audit to obtain reasonable assurance about whether the financial statements are free of material misstatement. An audit includes examining, on a test basis, evidence supporting the amounts and disclosures in the financial statements. An audit also includes assessing the accounting principles used and significant estimates made by management, as well as evaluating the overall financial statement presentation. We believe that our audit provides a reasonable basis for our opinion.
In our opinion, the financial statements referred to above present fairly, in all material respects, the financial position of BLR Construction Co. Inc. and Affiliates as of December 31, 2003, and the results of its operations and its cash flows for the year then ended in conformity with accounting principles generally accepted in the United States of America.
|
WRIGHT, MOORE, DEHART, DUPUIS & HUTCHINSON, L.L.C. CERTIFIED PUBLIC ACCOUNTANTS |
March 27, 2006
F-86
Table of Contents
Index to Financial Statements
BLR CONSTRUCTION CO., INC. AND AFFILIATES
DECEMBER 31, 2003
ASSETS | ||||
Current assets | ||||
Cash | $ | 266,422 | ||
Accounts receivable | ||||
Trade | 3,117,283 | |||
Other | 857,997 | |||
Inventories | 2,213 | |||
Income tax refund receivable | 19,852 | |||
Prepaid expenses | 329,290 | |||
Deferred income taxes | 36,053 | |||
Total current assets | 4,629,110 | |||
Property and equipment | ||||
Vehicles | 1,435,364 | |||
Buildings and improvements | 400,146 | |||
Machinery and equipment | 1,713,475 | |||
Furniture and fixtures | 718,701 | |||
Mats | 3,422,087 | |||
Property held under capital lease | 21,721 | |||
Land | 23,454 | |||
Total | 7,734,948 | |||
Less: Accumulated depreciation | 3,676,199 | |||
Property and Equipment—Net | 4,058,749 | |||
Other assets | ||||
Deposits | 300 | |||
Total other assets | 300 | |||
Total assets | $ | 8,688,159 | ||
LIABILITIES AND STOCKHOLDERS’ EQUITY | ||||
Current liabilities | ||||
Accounts payable | $ | 1,418,385 | ||
Notes payable | 2,387,016 | |||
Current maturities of long-term debt | 483,273 | |||
Current maturities of capital lease obligation | 4,268 | |||
Income taxes payable | 20,816 | |||
Interest payable | 34,689 | |||
Accrued expenses and other current liabilities | 248,537 | |||
Total current liabilities | 4,596,984 | |||
Long-term liabilities | ||||
Long-term debt, less current maturities | 1,611,988 | |||
Capital lease obligation, less current maturities | 9,953 | |||
Deferred income taxes | 365,540 | |||
Due to stockholders | 797,911 | |||
Total long-term liabilities | 2,785,392 | |||
Stockholders’ equity | ||||
Common stock | 25,600 | |||
Additional paid in capital | 275,948 | |||
Retained earnings | 1,254,235 | |||
Less: 100 shares of treasury stock, at cost | (250,000 | ) | ||
Total stockholders’ equity | 1,305,783 | |||
Total liabilities and stockholders’ equity | $ | 8,688,159 | ||
The accompanying notes are an integral part of these financial statements.
F-87
Table of Contents
Index to Financial Statements
BLR CONSTRUCTION CO., INC. AND AFFILIATES
FOR THE YEAR ENDED DECEMBER 31, 2003
Revenue | $ | 13,727,096 | ||
Cost of revenue | ||||
Depreciation | 1,133,214 | |||
Labor and related costs | 4,066,514 | |||
Materials and supplies | 1,849,804 | |||
Rent | 1,459,143 | |||
Other costs | 2,190,515 | |||
Total cost of revenue | 10,699,190 | |||
Gross profit | 3,027,906 | |||
Operating expenses | ||||
General and administrative expenses | 2,252,785 | |||
Depreciation | 19,388 | |||
Total operating expenses | 2,272,173 | |||
Operating income | 755,733 | |||
Other income (expense) | ||||
Interest expense | (338,871 | ) | ||
Loss on sale of assets | (138,429 | ) | ||
Miscellaneous | 34,981 | |||
Interest income | 141 | |||
Total other income (expense) | (442,178 | ) | ||
Income before income taxes | 313,555 | |||
Income taxes | ||||
Current | 7,371 | |||
Deferred | 16,377 | |||
Total income taxes | 23,748 | |||
Net income | $ | 289,807 | ||
The accompanying notes are an integral part of these financial statements.
F-88
Table of Contents
Index to Financial Statements
BLR CONSTRUCTION CO., INC. AND AFFILIATES
COMBINED STATEMENT OF RETAINED EARNINGS
FOR THE YEAR ENDED DECEMBER 31, 2003
Balance at beginning of year as previously reported | $ | 1,630,615 | ||
Prior period adjustments—see note 15 | (666,187 | ) | ||
Balance at beginning of year as restated | 964,428 | |||
Additions | ||||
Net income | 289,807 | |||
Balance at end of year | $ | 1,254,235 | ||
The accompanying notes are an integral part of these financial statements.
F-89
Table of Contents
Index to Financial Statements
BLR CONSTRUCTION CO., INC. AND AFFILIATES
COMBINED STATEMENT OF CASH FLOWS
FOR THE YEAR ENDED DECEMBER 31, 2003
Cash flows from operating activities | ||||
Net income | $ | 289,807 | ||
Adjustments to reconcile net income to net cash provided by operating activities: | ||||
Depreciation | 1,152,602 | |||
Loss on sale of assets | 138,429 | |||
Deferred income taxes | 16,377 | |||
Changes in assets and liabilities: | ||||
Accounts receivable | (871,801 | ) | ||
Income tax refund receivable | (19,852 | ) | ||
Prepaid expenses | (157,979 | ) | ||
Accounts payable | (63,909 | ) | ||
Income taxes payable | (9,802 | ) | ||
Accrued expenses and other current liabilities | 211,431 | |||
Net cash provided by operating activities | 685,303 | |||
Cash flows from investing activities | ||||
Proceeds from sale of property and equipment | 93,779 | |||
Purchases of property and equipment | (1,227,840 | ) | ||
Net cash used in investing activities | (1,134,061 | ) | ||
Cash flows from financing activities | ||||
Increase in due to stockholders | 63,605 | |||
Proceeds from issuance of debt | 2,147,917 | |||
Net borrowings on lines of credit | 1,037,573 | |||
Repayment of debt and capital lease obligations | (2,553,651 | ) | ||
Net cash provided by financing activities | 695,444 | |||
Net increase in cash | 246,686 | |||
Cash at beginning of year | 19,736 | |||
Cash at end of year | $ | 266,422 | ||
The accompanying notes are an integral part of these financial statements.
F-90
Table of Contents
Index to Financial Statements
BLR CONSTRUCTION CO., INC. AND AFFILIATES
NOTES TO COMBINED FINANCIAL STATEMENTS
Note 1: Organization
BLR Construction Co., Inc. was incorporated in the state of Louisiana on December 15, 1994. The affiliated group of companies is engaged in various enterprises including oilfield construction, pipeline construction, crewboat and tugboat rentals, and contract labor. The affiliated group of companies operates in the states of Louisiana and Texas.
Note 2: Summary of Significant Accounting Policies
Principles of Combination: The accompanying financial statements for the year ended December 31, 2003 include the combined accounts of BLR Construction Co., Inc. and its affiliates, BLR Crewboats, Inc., BLR Marine Services, Inc. BLR Roustabout, Inc., Louisiana Pipeline and Construction Co., Inc. (an S-corporation) and LPCC, Inc., collectively referred to as “the Company”. All material intercompany balances and transactions have been eliminated in the combination.
Inventories: Inventories are carried at the lower of cost (first-in, first-out method) or market.
Property and Equipment: Property and equipment are stated at cost. Expenditures for property and equipment and items which substantially increase the useful lives of existing assets are capitalized at cost and depreciated. Routine expenditures for repairs and maintenance are expensed as incurred. The cost and related accumulated depreciation of property and equipment disposed of are eliminated from the accounts, and any resulting gain or loss is recognized.
Depreciation is provided utilizing the straight-line method. Depreciation expense amounts to $1,152,602 for the year ended December 31, 2003.
Use of Estimates: The preparation of financial statements requires management to make estimates and assumptions that affect certain reported amounts and disclosures. Accordingly, actual results could differ from those estimates.
Cash Flows: For purposes of the statements of cash flows, the Company considers all highly liquid investments with an original maturity of three months or less to be cash equivalents.
Advertising: Advertising costs, except for costs associated with direct-response advertising, are charged to operations when incurred. The costs of direct-response advertising are capitalized and amortized over the period during which future benefits are expected to be received. Advertising expense was $15,256 for the year ended December 31, 2003.
Accounts Receivable: Trade accounts receivable are carried at their estimated collectible amounts. Trade credit is generally extended on a short-term basis; thus receivables do not bear interest, although a finance charge may be applied to amounts past due. The Company generally does not require collateral, and the majority of its trade receivables are unsecured. Trade accounts receivable are periodically evaluated for collectibility based on past credit history with customers and their current financial condition, and are charged against bad debt expense when they are deemed uncollectible. Use of this method does not result in a material difference from the valuation method required by generally accepted accounting principles.
Credit Risk: Financial instruments which potentially subject the Company to concentrations of credit risk include temporary cash investments and receivables. Concentration of credit risk with respect to receivables is limited due to the Company’s large number of customers. However, at December 31, 2003, two customers
F-91
Table of Contents
Index to Financial Statements
BLR CONSTRUCTION CO., INC. AND AFFILIATES
NOTES TO COMBINED FINANCIAL STATEMENTS—(Continued)
comprised approximately 28% of accounts receivable. The Company maintains cash accounts at several institutions. The balances are insured by the Federal Deposit Insurance Corporation up to 5100,000 per institution. At December 31, 2003, the Company exceeded the insured limit by $88,147.
Note 3: Notes Payable—Short Term
Notes payable at December 31, 2003 consists of the following:
Regions Bank, $2,050,000 line of credit dated November 20, 2003, due November 20, 2004, interest rate LIBOR + 3.00%, currently at 4.12%, secured by accounts receivable, equipment, real estate and personal guarantees of stockholders | $ | 1,544,277 | |
A-l Credit, notes dated July 22, 2003 to August 22, 2003, due May 22, 2004, for various amounts, interest rate 5.83%, payable in monthly installments from $7,389 to $34,146, unsecured | 166,467 | ||
Regions Bank, $700,000 line of credit dated November 20, 2003. due November 20, 2004, interest rate LIBOR + 3.00%, currently at 4.12%, secured by accounts receivable, equipment, real estate and personal guarantees of stockholders | 595,259 | ||
A-l Credit, note dated July 22, 2003, due May 22, 2004, payable in monthly installments of $14,876, interest rate 5.83%, unsecured | 81,013 | ||
Total | $ | 2,387,016 | |
At December 31, 2003, the Company has available approximately $610,464 of unused lines of credit with Regions Bank to be drawn upon as needed. The interest rate on the lines of credit is LIBOR + 3.00%.
F-92
Table of Contents
Index to Financial Statements
BLR CONSTRUCTION CO., INC. AND AFFILIATES
NOTES TO COMBINED FINANCIAL STATEMENTS—(Continued)
Note 4: Long-Term Debt
Notes payable at December 31, 2003 consists of the following:
Regions Bank, $1,206,963 note dated November 20, 2003, due December 5, 2006, payable in monthly installments of $23,153 and one final payment estimated to be $545,353, interest rate 5.50%, secured by accounts receivable, equipment, real estate and personal guarantees of stockholders | $ | 1,206,963 | |
Regions Bank, $32,000 note dated October 6, 2003, due October 20, 2008, interest rate LIBOR + 3.50%, currently at 4.62%, payable in monthly installments of $600, secured by equipment | 31,106 | ||
Midsouth National Bank, $27,423 note dated August 22, 2003, due August 25, 2006, interest rate 5.75%, payable in monthly installments of $883, secured by vehicle | 24,611 | ||
Case Credit, notes dated November 15, 1999 to July 25, 2002, for various amounts, due October 18, 2004 to July 25, 2007, payable in monthly installments of $1,068 to $1,950, interest rate 4.90% to 5.90%, secured by equipment | 128,154 | ||
Ford Motor Credit, notes dated May 11, 2001 to October 2, 2001, for various amounts, due May 11, 2004 to October 17, 2004, payable in monthly installments of $471 to $528, interest rate 0.00% to 3.90%, secured by vehicles | 9,473 | ||
Regions Bank, $444,833 note dated November 20, 2003, due December 5, 2006, payable in monthly installments of $8,538 and one final payment estimated to be $200,993, interest rate 5.50%, secured by accounts receivable, equipment, real estate and personal guarantees of stockholders | 444,833 | ||
Midsouth National Bank, $18,202 note dated August 22, 2003, due August 25, 2006, payable in monthly installments of $553, interest rate 5.75%, secured by vehicle | 16,335 | ||
GMAC, $49,011 note dated October 6, 2003, due October 6, 2008, payable in monthly installments of $817, interest rate 0.00%, secured by vehicle | 47,377 | ||
Ford Motor Credit, two notes dated October 6, 2003, due October 20, 2006, payable in monthly installments of $790 each, interest rate 5.00%, secured by vehicles | 50,006 | ||
Case Credit, $81,648 note dated July 25, 2002, due July 25, 2007, payable in monthly installments of $1,537, interest rate 4.90%, secured by equipment | 60,503 | ||
Ford Motor Credit, notes dated August 10, 2001 to November 19, 2002, for various amounts, due November 12, 2004 to November 19, 2005, payable in monthly installments of $690 to $995, interest rate 0.00% to 0.90%, secured by vehicles | 69,472 | ||
Midsouth National Bank, $29,751 note dated November 3, 1999, due November 3, 2004, payable in monthly installments of $607, interest rate 8.25%, secured by equipment | 6,428 | ||
| 2,095,261 | |||
Less: Current portion | 483,273 | ||
Long-Term portion | $ | 1,611,988 | |
F-93
Table of Contents
Index to Financial Statements
BLR CONSTRUCTION CO., INC. AND AFFILIATES
NOTES TO COMBINED FINANCIAL STATEMENTS—(Continued)
Annual maturities of long-term debt during each year ended December 31 are as follows:
2004 | 483,273 | ||
2005 | 429,781 | ||
2006 | 1,127,740 | ||
2007 | 40,481 | ||
2008 | 13,986 | ||
Later | — | ||
Total | $ | 2,095,261 | |
Note 5: 401(k) Plan
The Company contributes to a 401(k) plan that is a qualified plan under the Employees Retirement Income Security Act of 1974. All employees who are at least 21 years old and have at least three months of service at the end of each calendar quarter are eligible to participate in the plan. The Company matches one-half of employee contributions up to 3% of compensation. For the year ended December 31, 2003, the Company made matching contributions of $18,306 to the plan.
Note 6: Income Taxes
The Company has provided for income tax as follows:
Currently payable (receivable): | ||||
Federal tax | $ | 11,059 | ||
State tax | (3,688 | ) | ||
Deferred | 16,377 | |||
Total Provision for Income Taxes | $ | 23,748 | ||
The Company’s effective income tax rate varies from what would be expected if the statutory rate were applied to income before income taxes primarily because of certain expenses deductible for financial reporting purposes that are not deductible for tax purposes and tax exempt income.
Deferred income taxes reflect the net tax effects of temporary differences between the carrying amounts of assets and liabilities for financial reporting purposes and the amounts used for income tax purposes. The major temporary differences that give rise to the deferred tax assets and liabilities are as follows: inventory capitalization, allowance for doubtful accounts, depreciation, net operating loss carryforwards, and tax credit carryforwards.
As of December 31, 2003, the Company has available $205,557 of unused federal operating loss carryforwards. $104,310 of unused state operating loss carryforwards and $5,171 of unused charitable contribution carryforwards that may be applied against future taxable income and that expire in various years from 2004 to 2023.
F-94
Table of Contents
Index to Financial Statements
BLR CONSTRUCTION CO., INC. AND AFFILIATES
NOTES TO COMBINED FINANCIAL STATEMENTS—(Continued)
The balance in deferred tax asset (liability) as of December 31, 2003 is as follows:
Deferred tax asset | $ | 36,053 | ||
Deferred tax liability | (365,540 | ) | ||
Deferred tax asset (liability) before valuation allowance | (329,487 | ) | ||
Less: valuation allowance | — | |||
Net deferred tax liability | ($ | 329,487 | ) | |
The Company did not record a valuation allowance as of December 31, 2003 because amounts recorded as deferred tax assets are currently expected to be realized.
Note 7: Related Party Transactions
The Company engaged in transactions during the year with the stockholders of the affiliated group of companies. These transactions resulted in the following amounts that are included in the financial statements for the year ended December 31, 2003.
Due to stockholders | $ | 797,911 | |
Interest payable | 18,267 | ||
Rent expense | 45,000 | ||
Interest expense | 68,193 |
Due to stockholders consists of various advances to the Company that are due on demand at an interest rate of 6.00%. However, since it is not the intent of the stockholders to call these amounts in the near future, the balance is included in the Long-Term Liabilities section on the balance sheet.
Note 8: Major Customers
Sales to customers for the year ended December 31, 2003 which amounted to 10% or more of the Company’s revenue are as follows:
| Amount | % of Total Revenue | |||||
Customer A | $ | 1,491,477 | 10.87 | % | ||
Customer B | 1,657,104 | 12.07 | % | |||
F-95
Table of Contents
Index to Financial Statements
BLR CONSTRUCTION CO., INC. AND AFFILIATES
NOTES TO COMBINED FINANCIAL STATEMENTS—(Continued)
Note 9: Rentals Under Operating Leases
The Company leases vehicles and equipment under operating leases expiring in various years through 2008. Future minimum lease payments under noncancelable operating leases have remaining terms in excess of one year as of December 31, 2003 are:
Year Ending December 31, | Amount | ||
2004 | $ | 181,657 | |
2005 | 181,657 | ||
2006 | 154,278 | ||
2007 | 95,455 | ||
2008 | 16,005 | ||
Thereafter | — | ||
| $ | 629,052 | ||
Rent expense relating to these leases was $138,826 for the year ended December 31, 2003.
Note 10: Capital Lease
The Company leases equipment under a capital lease expiring in 2006. The assets and liabilities are recorded at the lower of the present value of the minimum lease payments or the fair value of the asset. The asset is depreciated over the lower of the related lease term or its estimated productive life. Depreciation of assets under capital lease is included in depreciation expense for 2003. The cost of the machine is $21,721 and accumulated depreciation at December 31, 2003 is $9,050.
Minimum future lease payments under capital leases as of December 31, 2003 for each of the next five years and is the aggregate are:
2004 | $ | 5,916 | |
2005 | 5,916 | ||
2006 | 5,423 | ||
Total | 17,255 | ||
Less: amount representing interest | 3,034 | ||
Present value of minimum lease payments | $ | 14,221 | |
Note 11: Additional Cash Flow Disclosures
Cash paid during the year for: | |||
Interest | $ | 304,182 | |
Income taxes | $ | 17,280 | |
Non cash investing and financing activities: | |||
Equipment purchased under installment note obligations | $ | 179,268 | |
F-96
Table of Contents
Index to Financial Statements
BLR CONSTRUCTION CO., INC. AND AFFILIATES
NOTES TO COMBINED FINANCIAL STATEMENTS—(Continued)
Note 12: Common Stock
Common stock at December 31, 2003 is as follows:
| Amount | |||
BLR Construction Co., Inc. Common stock, no par value, 1,000 shares authorized, 888 shares issued and outstanding | $ | 6,000 | |
BLR Crewboats, Inc. Common stock, no par value, 1,000 shares authorized, 501 shares issued and outstanding | 10,000 | ||
BLR Marine Services, Inc. Common stock, no par value, 1,000 shares authorized, 502 shares issued and outstanding | 5,000 | ||
BLR Roustabout, Inc. Common stock, no par value, 1,000 shares authorized, 660 shares issued and outstanding | 3,500 | ||
LPCC, Inc. Common stock, no par value, 1,000 shares authorized, 200 shares issued and outstanding | 100 | ||
Louisiana Pipeline and Construction Co., Inc. Common stock, no par value, 10,000 shares authorized, 200 shares issued, 100 shares outstanding | 1,000 | ||
Total Common Stock | $ | 25,600 | |
Note 13: Subsequent Events
On February 17, 2004, the Company purchased excess coverage and became subject to a specific and aggregate self-insured retention with respect to workers” compensation, automobile liability, general liability and excess umbrella insurance coverage. The primary policies provide statutory limits for workers’ compensation, employer liability, automobile and general liability policies and are subject to retention amounts of $50,000 per occurrence and an aggregated loss fund of approximately $425,000 subject to incurred payroll. Under this plan, the Company will establish an escrowed loss fund and letter of credit with the insurance carrier.
Effective January 1, 2005, the group of affiliated companies referred to in Note 2, except for LPCC, Inc., merged to form BLR Construction Company, L.L.C. The newly formed company is a limited liability company that will be regarded as a S-corporation for income tax purposes. Accordingly, deferred taxes will be eliminated on January 1, 2005.
On February 7, 2006. the owners of BLR Construction Companies. L.L.C. entered into an agreement with Stallion Oilfield Services, LTD to sell their membership interests in the Company. On February 28. 2006, the change in ownership became effective. LPCC, Inc., an affiliate of BLR Construction Companies. L.L.C. was excluded from the transaction.
The Company entered into a three year employment agreement with its CEO on January 1, 2005. which provides for certain compensation upon the sale of the Company. At February 28, 2006. the Company’s commitment as a result of the sale amounts to $380,769.
F-97
Table of Contents
Index to Financial Statements
BLR CONSTRUCTION CO., INC. AND AFFILIATES
NOTES TO COMBINED FINANCIAL STATEMENTS—(Continued)
Note 14: Commitments and Contingencies
Insurance Program: Under the Company’s insurance program, coverage is obtained for catastrophic exposure under a self-insured retention program. It is the policy of the Company to retain a significant portion of certain expected losses related to general liability insurance. A provision for losses expected under the program is recorded based upon the Company’s estimates of the aggregate liability for claims incurred.
Under the general liability plan, the Company is liable for the first $200,000 of claims per occurrence. The co-insurer reimburses claims in excess of $200,000. The Company had no claims outstanding and no claims to be reimbursed by the co-insurer at December 31, 2003.
Litigation: The Company is subject to various claims and legal proceedings covering matters that arise in the ordinary course of its business activities. Management believes that any liability that may ultimately result from the resolution of these matters will not have a material adverse effect on the financial condition or results of operations of the Company.
Note 15: Prior Period Adjustments
Retained earnings as of December 31, 2002 has been adjusted to dispose of mats that should have been disposed of in previous years. Had the error not been made, combined net income for 2002 and 2001 would have been decreased by $791,560 | ($ | 791,560 | ) | |
Retained earnings as of December 31, 2002 has also been adjusted to reflect write-offs of accounts receivable. Had the error not been made, net income for 2002 would have decreased by $132,234 | (132,234 | ) | ||
Retained earnings as of December 31, 2002 has also been adjusted to record accounts receivable that should have been recorded in 2002. Had the error not been made, net income for 2002 would have increased by $257,607 | 257,607 | |||
Total | ($ | 666,187 | ) | |
F-98
Table of Contents
Index to Financial Statements
WRIGHT, MOORE, DEHART, DUPUIS & HUTCHINSON,L.L.C.
Certified Public Accountants 100 Petroleum Drive, 70508 | ||||
JOHN W. WRIGHT, CPA* JAMES H. DUPUIS, CPA, CFP* JOE D. HUTCHINSON, CPA* JAN H. COWEN, CPA* LANCE E. CRAPPELL, CPA* PAT BAHAM DOUGHT, CPA* MICAH R. VIDRINE, CPA* TRAVIS M. BRINSKO, CPA* RICK STUTES, CPA, CVA * A PROFESSIONAL CORPORATION
RETIRED M. TROY MOORE, CPA* MICHAEL G. DeHART, CPA, CVA, MBA* | P.O. Box 80569· Lafayette, Louisiana 70598-0569 (337) 232-3637· FAX (337) 235-8557 www.wmddh.com | CHRISTINE R. DUNN, CPA ANDRE D. BROUSSARD, CPA MARY PATRICIA KEELEY, CPA KRISTIE C. BOUDREAUX, CPA BRIDGET B. TILLEY, CPA, MT DAMIAN H. SPIESS, CPA, CFP TASHA A. RALEY, CPA PATRICK WAGUESPACK, CPA CHIP CANTRELL, CPA DANE P. FALGOUT, CPA ROBIN G. STOCKTON, CPA
|
INDEPENDENT AUDITORS’ REPORT ON SUPPLEMENTARY INFORMATION
To the Board of Directors
BLR Construction Co., Inc. and Affiliates
Duson. Louisiana
Our report on our audit of the basic financial statements of BLR Construction Co., Inc. and Affiliates appears on page two. That audit was conducted for the purpose of forming an opinion on the basic financial statements taken as a whole. The combined schedule of general and administrative expenses is presented for purposes of additional analysis and is not a required part of the basic financial statements. Such information has been subjected to the audit procedures applied in the examination of the basic financial statements and is in, our opinion, fairly presented in all material respects in relation to the basic financial statements taken as a whole.
|
WRIGHT, MOORE, DEHART, DUPUIS & HUTCHINSON, L.L.C. CERTIFIED PUBLIC ACCOUNTANTS |
March 27, 2006
F-99
Table of Contents
Index to Financial Statements
BLR CONSTRUCTION CO., INC. AND AFFILIATES
COMBINED SCHEDULE OF GENERAL AND ADMINISTRATIVE EXPENSES
For the year ended December 31, 2003
Advertising | $ | 15,296 | |
Auto and truck expense | 121,020 | ||
Bad debt | 80,554 | ||
Bank charges | 4,520 | ||
Contract labor | 9,276 | ||
Contributions | 7,214 | ||
Customer relations | 35,872 | ||
Drug testing | 31,204 | ||
Dues and subscriptions | 6,693 | ||
Employee benefits | 8,470 | ||
Fuel | 23,807 | ||
Insurance | 231,350 | ||
Janitorial | 500 | ||
Legal and professional | 172,707 | ||
Medical | 36,710 | ||
Office expense | 32,105 | ||
Penalties | 30,624 | ||
Rent expense | 60,974 | ||
Repairs and maintenance | 194,583 | ||
Retirement | 18,306 | ||
Safety | 6,029 | ||
Salaries and wages | 637,272 | ||
Supplies | 15,293 | ||
Taxes and licenses | 120,210 | ||
Travel and entertainment | 206,861 | ||
Uniforms | 24,562 | ||
Utilities | 120,773 | ||
Total general and administrative expenses | $ | 2,252,785 | |
See independent auditors’ report on supplementary information.
F-100
Table of Contents
Index to Financial Statements
To the Stockholder
Trail Blazer Hot Shot, Inc.
Elk City, Oklahoma
We have audited the accompanying balance sheets of Trail Blazer Hot Shot, Inc. as of December 31, 2005 and 2004, and related statements of operations, stockholder’s equity and cash flows for the years then ended. These financial statements are the responsibility of the Company’s management. Our responsibility is to express an opinion on these financial statements based on our audits.
We conducted our audits in accordance with auditing standards generally accepted in the United States of America. Those standards require that we plan and perform the audits to obtain reasonable assurance about whether the financial statements are free of material misstatement. An audit includes examining, on a test basis, evidence supporting the amounts and disclosures in the financial statements. An audit also includes assessing the accounting principles used and significant estimates made by management, as well as evaluating the overall financial statement presentation. We believe that our audits provide a reasonable basis for our opinion.
In our opinion, the financial statements referred to above present fairly, in all material respects, the financial position of Trail Blazer Hot Shot, Inc. as of December 31, 2005 and 2004, and the results of its operations and its cash flows for the years then ended, in conformity with accounting principles generally accepted in the United States of America.
Our audits were conducted for the purpose of forming an opinion on the basic financial statements taken as a whole. The supplemental schedule on page F-110 is presented for purposes of additional analysis and is not required as part of the basic financial statements. Such information has been subjected to the auditing procedures applied in the audits of the basic financial statements, and, in our opinion, is fairly stated in all material respects in relation to the basic financial statements taken as a whole.
| /S/ UHY MANN FRANKFORT STEIN & LIPP CPAS, LLP |
| UHY Mann Frankfort Stein & Lipp CPAs, LLP |
Houston, Texas
June 9, 2006
F-101
Table of Contents
Index to Financial Statements
TRAIL BLAZER HOT SHOT, INC.
| December 31, | ||||||
| 2005 | 2004 | |||||
ASSETS | ||||||
Current assets | ||||||
Cash and cash equivalents | $ | 1,595,882 | $ | 670,772 | ||
Accounts receivable—trade | 1,573,104 | 1,274,093 | ||||
Prepaid expenses and other current assets | 100,051 | 83,669 | ||||
Total current assets | 3,269,037 | 2,028,534 | ||||
Property and equipment, net | 3,216,408 | 3,328,066 | ||||
Total assets | $ | 6,485,445 | $ | 5,356,600 | ||
LIABILITIES AND STOCKHOLDER’S EQUITY | ||||||
Current liabilities | ||||||
Accounts payable | $ | 72,122 | $ | 142,445 | ||
Accrued expenses | 76,725 | 108,251 | ||||
Current portion of long-term debt | — | 43,695 | ||||
Total current liabilities | 148,847 | 294,391 | ||||
Long-term debt, less current portion | — | 2,347 | ||||
Total liabilities | 148,847 | 296,738 | ||||
Commitments and contingencies | — | — | ||||
Stockholder’s equity | 6,336,598 | 5,059,862 | ||||
Total liabilities and stockholder’s equity | $ | 6,485,445 | $ | 5,356,600 | ||
See notes to financial statements.
F-102
Table of Contents
Index to Financial Statements
TRAIL BLAZER HOT SHOT, INC.
| Year Ended December 31, | ||||||
| 2005 | 2004 | |||||
Service revenue | $ | 8,098,513 | $ | 5,875,919 | ||
Operating expenses: | ||||||
Cost of services | 3,369,813 | 2,524,276 | ||||
Selling, general and administrative | 502,813 | 443,925 | ||||
Depreciation and amortization | 722,220 | 681,235 | ||||
Total operating expenses | 4,594,846 | 3,649,436 | ||||
Operating income | 3,503,667 | 2,226,483 | ||||
Other income | ||||||
Interest income | 4,876 | 1,765 | ||||
Other income | 18,673 | 35,933 | ||||
Total other income | 23,549 | 37,698 | ||||
Net income | $ | 3,527,216 | $ | 2,264,181 | ||
See notes to financial statements.
F-103
Table of Contents
Index to Financial Statements
TRAIL BLAZER HOT SHOT, INC.
STATEMENTS OF CHANGES IN STOCKHOLDER’S EQUITY
YEARS ENDED DECEMBER 31, 2005 AND 2004
Common Stock | Retained Earnings | Total | |||||||||
Balances, January 1, 2004 | $ | 1,000 | $ | 3,165,272 | $ | 3,166,272 | |||||
Net income | — | 2,264,181 | 2,264,181 | ||||||||
Distributions | — | (370,591 | ) | (370,591 | ) | ||||||
Balances, December 31, 2004 | 1,000 | 5,058,862 | 5,059,862 | ||||||||
Net income | — | 3,527,216 | 3,527,216 | ||||||||
Distributions | — | (2,250,480 | ) | (2,250,480 | ) | ||||||
Balances, December 31, 2005 | $ | 1,000 | $ | 6,335,598 | $ | 6,336,598 | |||||
See notes to financial statements.
F-104
Table of Contents
Index to Financial Statements
TRAIL BLAZER HOT SHOT, INC.
| Year Ended December 31, | ||||||||
| 2005 | 2004 | |||||||
Cash flows from operating activities | ||||||||
Net income | $ | 3,527,216 | $ | 2,264,181 | ||||
Adjustments to reconcile net income to net cash provided by operating activities: | ||||||||
Depreciation | 722,220 | 681,235 | ||||||
Changes in operating assets and liabilities: | ||||||||
Accounts receivable | (299,011 | ) | (495,876 | ) | ||||
Prepaid expenses and other current assets | (16,382 | ) | (27,047 | ) | ||||
Accounts payable | (70,323 | ) | 36,115 | |||||
Accrued expenses | (31,526 | ) | 29,016 | |||||
Net cash provided by operating activities | 3,832,194 | 2,487,624 | ||||||
Cash flows from investing activities | ||||||||
Cash paid for property and equipment | (639,793 | ) | (1,610,521 | ) | ||||
Proceeds received from disposal of property and equipment | 29,231 | (50,016 | ) | |||||
Net cash used in investing activities | (610,562 | ) | (1,660,537 | ) | ||||
Cash flows from financing activities | ||||||||
Payments on notes payable long-term debt | (46,042 | ) | 46,042 | |||||
Distributions paid | (2,250,480 | ) | (370,591 | ) | ||||
Net cash used in financing activities | (2,296,522 | ) | (324,549 | ) | ||||
Increase in cash | 925,110 | 502,538 | ||||||
Cash at beginning of period | 670,772 | 168,234 | ||||||
Cash at end of period | $ | 1,595,882 | $ | 670,772 | ||||
See notes to financial statements.
F-105
Table of Contents
Index to Financial Statements
TRAIL BLAZER HOT SHOT, INC.
DECEMBER 31, 2005 AND 2004
1. Significant Accounting Policies
Nature of Business: Trail Blazer Hot Shot, Inc. (the “Company”) is engaged in the rental of forklifts, manlifts, backhoes, generators, trucks and other related equipment to oil and gas companies, operators and service companies. The Company’s equipment and housing is manufactured for the tough environments of the drilling industry. The Company’s primary market area is Oklahoma, and the Company operates from Elk City, Oklahoma.
The Company was incorporated in Oklahoma in 1982. There are 3,000 shares of $10 par value common stock authorized. The Company elected S corporation status on December 31, 1982. The Company is 100% owned by one individual.
Cash and Cash Equivalents: For purposes of the statements of cash flows, cash equivalents include time deposits, certificates of deposit and all highly liquid debt instruments with original maturities of three months or less.
Accounts Receivable: The Company extends credit to its customers based on an evaluation of the customer’s financial condition and generally collateral is not required. Outstanding accounts receivable are assessed routinely and an allowance is set up when accounts are deemed uncollectible. The allowance for doubtful accounts was zero as of December 31, 2005 and 2004.
Property and Equipment: Property and equipment are stated at cost. Depreciation is provided on the straight-line method over the estimated useful lives of the related assets. All expenditures for major renewals and betterments are capitalized. Expenditures for maintenance and repairs are charged to expense as incurred.
Impairment of Long-lived Assets: The Company evaluates an asset for impairment when events or circumstances indicate that a long-lived asset’s carrying value may not be recovered. These events include market declines, changes in the manner in which the Company intends to use an asset, decisions to sell an asset and adverse changes in the legal or business environment.
If events or circumstances indicate that a long-lived asset’s carrying value may not be recoverable, the Company estimates the future undiscounted cash flows from the asset for which the lowest level of separate cash flows can be measured, to determine if the asset is impaired. If the total undiscounted future cash flows are less than the carrying amount for the asset, the Company estimates the fair value of the asset either through reference to sales data for similar assets, or by using a discounted cash flow approach. The asset’s carrying value is then adjusted downward to the fair value. These cash flow estimates require the Company to make estimates and assumptions for many years into the future for pricing demand, competition, operating costs, legal, regulatory and other factors and these estimates or assumptions could change significantly either positively or negatively.
Federal Income Taxes: The Company, with the consent of its stockholder, has elected under the Internal Revenue Code to be taxed as an S corporation. The stockholder’s of an S corporation are taxed on their proportionate share of the Company’s taxable income. Therefore, no provision or liability for federal income taxes has been included in the financial statements. Certain specific deductions and credits flow through the Company to its stockholder.
Revenue Recognition: Revenue from rental agreements are recognized over the rental period.
Advertising: The Company’s policy is to expense advertising costs as incurred. Advertising costs amounted to approximately $10,000 for each of the years ended December 31, 2005 and 2004, respectively.
F-106
Table of Contents
Index to Financial Statements
TRAIL BLAZER HOT SHOT, INC.
NOTES TO FINANCIAL STATEMENTS—(Continued)
DECEMBER 31, 2005 AND 2004
Concentration of Risk: During 2005 and 2004, the Company had cash deposited in a bank which was in excess of federally insured limits. The Company monitors the financial condition of the bank and has experienced no losses associated with its account.
The Company’s customer base consists primarily of independent oil and natural gas producers. The Company performs ongoing evaluations of its customers but generally does not require collateral on its trade receivables. Sales to Apache Corporation, Cimarex Energy Co., and H & P Drilling account for 17%, 17% and 12%, respectively, during 2005 and 17%, 20% and 11%, respectively, during 2004. Accounts receivable due from these customers were approximately $195,900, $133,100 and $114,300 as of December 31, 2005 and $99,400, $156,000 and $86,000 as of December 31, 2004.
Use of Estimates: The preparation of financial statements in conformity with accounting principles generally accepted in the United States of America requires management to make estimates and assumptions that affect certain reported amounts of assets and liabilities and disclosure of contingent assets and liabilities at the date of the financial statements and the reported amounts of revenue and expenses during the reporting period. Actual results could differ from those estimates.
Reclassifications: Certain reclassifications have been made to the prior years’ financial statements to conform to the current year presentation. These reclassifications had no effect on previously reported results of operations or retained earnings.
2. Property and Equipment
Major classifications of property and equipment and their estimated depreciable lives as of December 31, 2005 and 2004, are as follows:
Estimated Life | December 31, | |||||||
| 2005 | 2004 | |||||||
Rental equipment and vehicles | 5-7 years | $ | 5,817,493 | $ | 5,350,237 | |||
Trash trailers | 5-7 years | 283,587 | 281,087 | |||||
Polypipe | 5 years | 190,628 | 83,776 | |||||
Pumps | 5-7 years | 119,736 | 85,782 | |||||
Tanks | 5 years | 3,180 | 3,180 | |||||
| 6,414,624 | 5,804,062 | |||||||
Less: accumulated depreciation | 3,198,216 | 2,475,996 | ||||||
| $ | 3,216,408 | $ | 3,328,066 | |||||
3. Notes Payable and Long-Term Debt
As of December 31, 2004, the Company had two notes payable to financing companies which are payable in monthly installments of $4,228 and $352, respectively, bearing interest at 5.39%. The notes matured in September 2005 and August 2006. Both notes are secured by equipment. These notes were paid in full during 2005.
F-107
Table of Contents
Index to Financial Statements
TRAIL BLAZER HOT SHOT, INC.
NOTES TO FINANCIAL STATEMENTS—(Continued)
DECEMBER 31, 2005 AND 2004
4. Lease Commitments
The Company leases office space from an unrelated party under a one year lease dated April 20, 2005. Rent expense under this operating lease was approximately $4,500 and $0 for the year ended December 31, 2005 and 2004, respectively. As of December 31, 2005, future lease expense is $2,220 due in April 2006.
The Company also rents equipment under informal rental agreements. Equipment rental expense was approximately $31,685 and $18,153 for the years ended December 31, 2005 and 2004, respectively.
5. Subsequent Events
In January 2006, certain assets of the Company were purchased by Stallion Oilfield Services Ltd., headquartered in Houston, Texas.
F-108
Table of Contents
Index to Financial Statements
F-109
Table of Contents
Index to Financial Statements
TRAIL BLAZER HOT SHOT, INC.
SCHEDULE OF OPERATING EXPENSES
| Year Ended December 31, | ||||||
| 2005 | 2004 | |||||
Cost of services | ||||||
Salaries and wages | $ | 987,544 | $ | 917,541 | ||
Outside services | 732,164 | 307,083 | ||||
Repairs and maintenance | 703,077 | 509,614 | ||||
Taxes | 293,479 | 222,902 | ||||
Fuel | 217,008 | 168,195 | ||||
Insurance | 200,930 | 151,604 | ||||
Auto | 110,118 | 111,113 | ||||
Disposal | 57,528 | 55,500 | ||||
Other | 67,965 | 80,724 | ||||
Total cost of services | $ | 3,369,813 | $ | 2,524,276 | ||
Selling, general and administrative | ||||||
Salaries and wages | $ | 364,000 | $ | 328,700 | ||
Office expenses | 23,296 | 19,461 | ||||
Taxes | 18,844 | 10,539 | ||||
Travel and entertainment | 17,481 | 26,893 | ||||
Professional fees | 12,348 | 6,036 | ||||
Advertising | 10,389 | 9,577 | ||||
Employee contribution cost | — | 5,922 | ||||
Other | 56,455 | 36,797 | ||||
Total selling, general and administrative | $ | 502,813 | $ | 443,925 | ||
F-110
Table of Contents
Index to Financial Statements
To the Stockholders
GL Trucking and Rental, Inc.
Williston, ND
We have audited the accompanying balance sheets of GL Trucking and Rental, Inc. as of September 12, 2005 and December 31, 2004, and related statements of operations, stockholders’ equity and cash flows for the period January 1, 2005 through September 12, 2005 and the year ended December 31, 2004. These financial statements are the responsibility of the Company’s management. Our responsibility is to express an opinion on these financial statements based on our audits.
We conducted our audits in accordance with auditing standards generally accepted in the United States of America. Those standards require that we plan and perform the audits to obtain reasonable assurance about whether the financial statements are free of material misstatement. An audit includes examining, on a test basis, evidence supporting the amounts and disclosures in the financial statements. An audit also includes assessing the accounting principles used and significant estimates made by management, as well as evaluating the overall financial statement presentation. We believe that our audits provide a reasonable basis for our opinion.
In our opinion, the financial statements referred to above present fairly, in all material respects, the financial position of GL Trucking and Rental, Inc. as of September 12, 2005 and December 31, 2004, and the results of its operations and its cash flows for the January 1, 2005 through September 12, 2005 and the year ended December 31, 2004, in conformity with accounting principles generally accepted in the United States of America.
Our audits were conducted for the purpose of forming an opinion on the basic financial statements taken as a whole. The supplemental schedule on page F-121 is presented for purposes of additional analysis and is not required as part of the basic financial statements. Such information has been subjected to the auditing procedures applied in the audits of the basic financial statements, and, in our opinion, is fairly stated in all material respects in relation to the basic financial statements taken as a whole.
| /S/ UHY MANN FRANKFORT STEIN & LIPP CPAS, LLP |
| UHY Mann Frankfort Stein & Lipp CPAs, LLP |
Houston, Texas
April 20, 2006
F-111
Table of Contents
Index to Financial Statements
BALANCE SHEETS
| September 12, 2005 | December 31, 2004 | |||||
ASSETS | ||||||
Current assets | ||||||
Cash and cash equivalents | $ | 1,836,201 | $ | 209,866 | ||
Accounts receivable—trade, less allowance for doubtful accounts of $78,063 and $77,032, respectively | 2,454,615 | 1,607,147 | ||||
Prepaid expenses and other current assets | 30,857 | 134,075 | ||||
Available-for-sale securities | 33,342 | 36,843 | ||||
Federal income tax receivable | — | 21,743 | ||||
Total current assets | 4,355,015 | 2,009,674 | ||||
Property and equipment, net | 4,264,223 | 3,158,761 | ||||
Other receivable | 31,045 | 31,045 | ||||
Total assets | $ | 8,650,283 | $ | 5,199,480 | ||
LIABILITIES AND STOCKHOLDERS’ EQUITY | ||||||
Current liabilities | ||||||
Accounts payable—trade | $ | 285,186 | $ | 94,377 | ||
Accrued expenses | 63,106 | 105,539 | ||||
Profit sharing plan payable | — | 400,000 | ||||
Current portion of long-term debt | 186,900 | 139,719 | ||||
Deferred tax liability | 27,946 | — | ||||
Federal income tax payable | 869,162 | — | ||||
State income tax payable | 216,378 | — | ||||
Other current liabilities | 34,707 | — | ||||
Total current liabilities | 1,683,385 | 739,635 | ||||
Long-term debt, less current portion | 483,128 | 136,068 | ||||
Deferred tax liability | 580,818 | 573,975 | ||||
Total liabilities | 2,747,331 | 1,449,678 | ||||
Commitments and contingencies | — | — | ||||
Stockholders’ equity | 5,902,952 | 3,749,802 | ||||
Total liabilities and stockholders’ equity | $ | 8,650,283 | $ | 5,199,480 | ||
See notes to financial statements.
F-112
Table of Contents
Index to Financial Statements
STATEMENTS OF OPERATIONS
January 1, 2005 through September 12, 2005 | Year Ended December 31, 2004 | |||||||
Service revenue | $ | 7,811,003 | $ | 7,626,606 | ||||
Operating expenses: | ||||||||
Cost of services | 2,500,808 | 3,394,046 | ||||||
Selling, general and administrative | 1,121,745 | 1,668,685 | ||||||
Depreciation and amortization | 741,533 | 727,926 | ||||||
Total operating expenses | 4,364,086 | 5,790,657 | ||||||
Operating income | 3,446,917 | 1,835,949 | ||||||
Other income (expense) | ||||||||
Interest income | — | 1,530 | ||||||
Other income | 104,989 | 20,364 | ||||||
Interest expense | (28,243 | ) | (15,699 | ) | ||||
Total other income | 76,746 | 6,195 | ||||||
Income before income taxes | 3,523,663 | 1,842,144 | ||||||
Provision for income taxes | ||||||||
Federal: | ||||||||
Current | 1,091,961 | 342,874 | ||||||
Deferred | 34,789 | 244,286 | ||||||
State income tax | 240,262 | 75,887 | ||||||
Total provision for income taxes | 1,367,012 | 663,047 | ||||||
Net income | $ | 2,156,651 | $ | 1,179,097 | ||||
See notes to financial statements.
F-113
Table of Contents
Index to Financial Statements
STATEMENTS OF CHANGES IN STOCKHOLDERS’ EQUITY
JANUARY 1, 2005 THROUGH SEPTEMBER 12, 2005 AND YEAR ENDED DECEMBER 31, 2004
Common Stock | Retained Earnings | Accumulated Other Comprehensive Loss | Total | ||||||||||||
Balances, January 1, 2004 | $ | 21,000 | $ | 2,592,805 | $ | (19,206 | ) | $ | 2,594,599 | ||||||
Dividends | — | (21,000 | ) | — | (21,000 | ) | |||||||||
Unrealized loss on investments | — | — | (2,894 | ) | (2,894 | ) | |||||||||
Net income | — | 1,179,097 | — | 1,179,097 | |||||||||||
Total comprehensive income | 1,176,203 | ||||||||||||||
Balances, December 31, 2004 | 21,000 | 3,750,902 | (22,100 | ) | 3,749,802 | ||||||||||
Unrealized loss on investments | — | (3,501 | ) | (3,501 | ) | ||||||||||
Net income | — | 2,156,651 | — | 2,156,651 | |||||||||||
Total comprehensive income | 2,153,150 | ||||||||||||||
Balances, September 12, 2005 | $ | 21,000 | $ | 5,907,553 | $ | (25,601 | ) | $ | 5,902,952 | ||||||
See notes to financial statements.
F-114
Table of Contents
Index to Financial Statements
STATEMENTS OF CASH FLOWS
January 1, 2005 through September 12, 2005 | Year Ended December 31, 2004 | |||||||
Cash flows from operating activities | ||||||||
Net income | $ | 2,156,651 | $ | 1,179,097 | ||||
Adjustments to reconcile net income to net cash provided by operating activities: | ||||||||
Depreciation and amortization | 741,533 | 727,926 | ||||||
Bad debt expense | — | 8,512 | ||||||
Deferred tax expense | 34,789 | 244,286 | ||||||
Gain on sale of assets | — | (13,760 | ) | |||||
Changes in operating assets and liabilities: | ||||||||
Accounts receivable—trade | (847,468 | ) | (477,079 | ) | ||||
Prepaid expenses and other current assets | 103,218 | (11,970 | ) | |||||
Other receivable | — | (4,179 | ) | |||||
Accounts payable—trade | 190,809 | 78,423 | ||||||
Accrued expenses | (42,433 | ) | (54,811 | ) | ||||
Profit sharing plan payable | (400,000 | ) | 71,846 | |||||
Income taxes payable and other current liabilities | 1,141,990 | (91,409 | ) | |||||
Net cash provided by operating activities | 3,079,089 | 1,656,882 | ||||||
Cash flows from investing activities | ||||||||
Cash paid for property and equipment | (1,046,995 | ) | (1,731,470 | ) | ||||
Proceeds received from disposal of property and equipment | — | 20,000 | ||||||
Proceeds received from sale of investments | — | 1,057 | ||||||
Net cash used in investing activities | (1,046,995 | ) | (1,710,413 | ) | ||||
Cash flows from financing activities | ||||||||
Repayment of long-term debt | (405,759 | ) | (124,213 | ) | ||||
Dividends paid | — | (21,000 | ) | |||||
Net cash used in financing activities | (405,759 | ) | (145,213 | ) | ||||
Net increase (decrease) in cash and cash equivalents | 1,626,335 | (198,744 | ) | |||||
Cash and cash equivalents at beginning of period | 209,866 | 408,610 | ||||||
Cash and cash equivalents at end of period | $ | 1,836,201 | $ | 209,866 | ||||
Supplemental cash flow information | ||||||||
Interest paid | $ | 12,570 | $ | 15,442 | ||||
Non-cash transactions | ||||||||
Property and equipment financed with notes payable | $ | 800,000 | $ | 200,000 | ||||
See notes to financial statements.
F-115
Table of Contents
Index to Financial Statements
NOTES TO FINANCIAL STATEMENTS
JANUARY 1, 2005 THROUGH SEPTEMBER 12, 2005 AND YEAR ENDED DECEMBER 31, 2004
1. Significant Accounting Policies
Nature of Business: GL Trucking and Rental, Inc. (the “Company”) is engaged in the rental of cranes, trailers, skid houses, and other related equipment to oil and gas companies, operators, and service companies. The Company’s equipment and housing is manufactured for the tough environments of the drilling industry. The Company’s primary market area is North Dakota, and the Company operates from locations in Williston and Fairfield, ND.
The Company was incorporated in North Dakota in 1979. There are 3,000 shares of $10 par value common stock authorized. As of September 12, 2005 and December 31, 2004, there were 2,100 shares issued and outstanding.
Cash and Cash Equivalents: For purposes of the statements of cash flows, cash equivalents include time deposits, certificates of deposit and all highly liquid debt instruments with original maturities of three months or less.
Accounts Receivable: The Company extends credit to its customers based on an evaluation of the customer’s financial condition and generally collateral is not required. Outstanding accounts receivable are assessed routinely and an allowance is set up when accounts are deemed uncollectible.
Investments: The Company determines the appropriate classification of its investments in debt and equity securities at the time of purchase and reevaluates such determinations at each balance sheet date. Debt securities are classified as held-to-maturity when the Company has the positive intent and ability to hold the securities to maturity. Debt securities for which the Company does not have the intent or ability to hold to maturity are classified as available-for-sale. Held-to-maturity securities are recorded as either short term or long term on the balance sheet based on contractual maturity date and are stated at amortized cost. Marketable securities that are bought and held principally for the purpose of selling them in the near term are classified as trading securities and are reported at fair value, with unrealized gains and losses recognized in earnings. Debt and marketable equity securities not classified as held-to-maturity or as trading, are classified as available-for-sale, and are carried at fair market value, with the unrealized gains and losses, net of tax, included in the determination of comprehensive income and reported in stockholders’ equity.
Property and Equipment: Property and equipment are stated at cost. Depreciation is provided on the straight line method over the estimated useful lives of the related assets. All expenditures for major renewals and betterments are capitalized. Expenditures for maintenance and repairs are charged to expense as incurred.
Impairment of Long-lived Assets: The Company evaluates an asset for impairment when events or circumstances indicate that a long-lived asset’s carrying value may not be recovered. These events include market declines, changes in the manner in which the Company intends to use an asset, decisions to sell an asset and adverse changes in the legal or business environment.
If events or circumstances indicate that a long-lived asset’s carrying value may not be recoverable, the Company estimates the future undiscounted cash flows from the asset for which the lowest level of separate cash flows can be measured, to determine if the asset is impaired. If the total undiscounted future cash flows are less than the carrying amount for the asset, the Company estimates the fair value of the asset either through reference to sales data for similar assets, or by using a discounted cash flow approach. The asset’s carrying value is then adjusted downward to the fair value. These cash flow estimates require the Company to make estimates and
F-116
Table of Contents
Index to Financial Statements
GL TRUCKING AND RENTAL, INC.
NOTES TO FINANCIAL STATEMENTS—(Continued)
JANUARY 1, 2005 THROUGH SEPTEMBER 12, 2005 AND YEAR ENDED DECEMBER 31, 2004
assumptions for many years into the future for pricing, demand, competition, operating costs, legal, regulatory and other factors, and these estimates or assumptions could change significantly either positively or negatively.
Federal Income Taxes: The Company accounts for income taxes under FASB Statement No. 109, “Accounting for Income Taxes.” Deferred income tax assets and liabilities are determined based upon differences between financial reporting and tax bases of assets, and liabilities and are measured using the enacted tax rates and laws that will be in effect when the differences are expected to reverse. Deferred taxes result primarily from property and equipment.
Revenue Recognition: Revenue from rental agreements is recognized over the rental period.
Advertising: The Company’s policy is to expense advertising costs as incurred. Advertising costs amounted to approximately $33,000 in 2005 and $12,000 in 2004.
Concentration of Risk: During 2005 and 2004, the Company had cash deposited in a bank which was in excess of federally insured limits. The Company monitors the financial condition of the bank and has experienced no losses associated with its account.
The Company’s customer base consists primarily of independent oil and natural gas producers. The Company performs ongoing evaluations of its customers, but generally does not require collateral on its trade receivables. During the period ended September 12, 2005, no customer comprised 10% of total sales. During the year ended December 31, 2004, sales to one customer accounted for 12% of total sales and the balance due from this customer was $202,000 as of December 31, 2004.
During the period ended September 12, 2005, the Company purchased a significant amount of goods from two vendors which totaled 23% and 12%, respectively, of cost of revenue. Amounts payable to these vendors as of September 12, 2005 totaled approximately $94,000. During the year ended December 31, 2004, the Company purchased a significant amount of goods and services from one vendor. Amounts payable to this vendor as of December 31, 2004 were approximately $56,000.
Use of Estimates: The preparation of financial statements in conformity with accounting principles generally accepted in the United States of America requires management to make estimates and assumptions that affect certain reported amounts of assets and liabilities and disclosure of contingent assets and liabilities at the date of the financial statements and the reported amounts of revenue and expenses during the reporting period. Actual results could differ from those estimates.
Reclassifications: Certain reclassifications have been made to the prior years’ financial statements to conform to the current year presentation. These reclassifications had no effect on previously reported results of operations or retained earnings.
F-117
Table of Contents
Index to Financial Statements
GL TRUCKING AND RENTAL, INC.
NOTES TO FINANCIAL STATEMENTS—(Continued)
JANUARY 1, 2005 THROUGH SEPTEMBER 12, 2005 AND YEAR ENDED DECEMBER 31, 2004
2. Property and Equipment
Major classifications of property and equipment and estimated depreciable lives are as follows:
| Estimated Life | September 12, 2005 | December 31, 2004 | ||||||
Tanks and skid houses | 5-7 years | $ | 5,211,043 | $ | 3,485,649 | |||
Autos and trucks | 5 years | 2,902,142 | 2,853,697 | |||||
Trailers | 5 years | 752,548 | 695,069 | |||||
Other rental equipment | 5-7 years | 491,795 | 479,315 | |||||
Office Equipment | 5-7 years | 207,529 | 285,309 | |||||
Buildings | 39 years | 332,867 | 251,890 | |||||
| 9,897,924 | 8,050,929 | |||||||
Less: accumulated depreciation | 5,633,701 | 4,892,168 | ||||||
| $ | 4,264,223 | $ | 3,158,761 | |||||
3. Available for Sale Securities
Available for sale securities as of September 12, 2005 and December 31, 2004 included equity securities at an estimated fair value of $33,342 and $36,843, respectively, resulting in an overall unrealized loss of $25,601 and $22,100, respectively.
4. Notes Payable and Long-term Debt
As of December 31, 2004, the Company had a note payable to a bank for $102,503 dated December 19, 2003, payable in monthly installments of $8,776 bearing interest at 5.0%. The note was secured by equipment and paid off on May 17, 2005.
As of December 31, 2004, the Company had a note payable to a bank for $173,284 dated March 31, 2004, payable in monthly installments of $3,818 bearing interest at 5.5%. The note was secured by equipment and paid off on July 19, 2005.
In April 2005, the Company entered into a multiple advance agreement with a bank to purchase skid houses. The Company received advances of $400,000 in April 2005 and $400,000 in May 2005. Principal payments are due in installments of $15,575 plus interest at a variable rate. The interest rate is 6.25% through August 1, 2005, then variable at 0.5% above the Bank of North Dakota base rate. The loan matures in April 2010 and is secured by skid houses. As of September 12, 2005, the balance on the note was $670,028, which was paid in full on September 13, 2005 with proceeds from sale of certain assets (See Note 6).
Future maturities of the note payable is as follows:
Year Ending September 12, | |||
2006 | $ | 186,900 | |
2007 | 186,900 | ||
2008 | 186,900 | ||
2009 | 109,328 | ||
| $ | 670,028 | ||
F-118
Table of Contents
Index to Financial Statements
GL TRUCKING AND RENTAL, INC.
NOTES TO FINANCIAL STATEMENTS—(Continued)
JANUARY 1, 2005 THROUGH SEPTEMBER 12, 2005 AND YEAR ENDED DECEMBER 31, 2004
5. Lease Commitments
The Company leases office space from a related party under a month-to-month lease. Rent expense under this operating lease and was approximately $53,000 for the period ended September 12, 2005 and $70,000 for the year ended December 31, 2004.
6. Subsequent Events
On September 13, 2005, certain assets of the Company were purchased by Stallion Oilfield Services Ltd., headquartered in Houston, Texas.
F-119
Table of Contents
Index to Financial Statements
F-120
Table of Contents
Index to Financial Statements
SCHEDULE OF OPERATING EXPENSES
January 1, 2005 through September 12, 2005 | Year Ended December 31, 2004 | |||||
Cost of services | ||||||
Salaries and wages | $ | 937,754 | $ | 1,337,041 | ||
Truck expenses | 451,833 | 491,630 | ||||
Skid house expenses | 238,890 | 288,705 | ||||
Profit sharing expense | — | 244,000 | ||||
Payroll taxes | 79,865 | 102,694 | ||||
Trailer expenses | 70,386 | 89,510 | ||||
Travel and entertainment | 31,896 | 54,130 | ||||
Other | 690,184 | 786,336 | ||||
Total cost of services | $ | 2,500,808 | $ | 3,394,046 | ||
Selling, general and administrative | ||||||
Salaries | $ | 599,548 | $ | 854,829 | ||
Insurance | 178,805 | 226,472 | ||||
Profit sharing expense | — | 156,000 | ||||
Rent—office space | 52,625 | 70,300 | ||||
Payroll taxes | 51,062 | 65,656 | ||||
Vehicle | 167,464 | 51,178 | ||||
Telecommunications | 25,128 | 32,290 | ||||
Office expenses | 15,548 | 19,409 | ||||
Other | 31,565 | 192,551 | ||||
Total selling, general and administrative | $ | 1,121,745 | $ | 1,668,685 | ||
See independent auditors’ report.
F-121
Table of Contents
Index to Financial Statements
To the Stockholder
Separation Services, Inc.
Houston, Texas
We have audited the accompanying balance sheet of Separation Services, Inc. (the “Company”) as of December 31, 2004 and related statements of operations, stockholder’s equity and cash flows for the year then ended. These financial statements are the responsibility of the Company’s management. Our responsibility is to express an opinion on these financial statements based on our audit.
We conducted our audit in accordance with auditing standards generally accepted in the United States of America. Those standards require that we plan and perform the audit to obtain reasonable assurance about whether the financial statements are free of material misstatement. An audit includes examining, on a test basis, evidence supporting the amounts and disclosures in the financial statements. An audit also includes assessing the accounting principles used and significant estimates made by management, as well as evaluating the overall financial statement presentation. We believe that our audit provides a reasonable basis for our opinion.
In our opinion, the financial statements referred to above present fairly, in all material respects, the financial position of Separation Services, Inc. as of December 31, 2004 and the results of its operations and its cash flows for the year then ended, in conformity with accounting principles generally accepted in the United States of America.
Our audit was conducted for the purpose of forming an opinion on the basic financial statements taken as a whole. The supplemental schedule on page F-131 is presented for purposes of additional analysis and is not required as part of the basic financial statements. Such information has been subjected to the auditing procedures applied in the audits of the basic financial statements and, in our opinion, is fairly stated in all material respects in relation to the basic financial statements taken as a whole.
| /S/ UHY MANN FRANKFORT STEIN & LIPP CPAS, LLP |
| UHY Mann Frankfort Stein & Lipp CPAs, LLP |
Houston, Texas
December 20, 2005
F-122
Table of Contents
Index to Financial Statements
SEPARATION SERVICES, INC.
DECEMBER 31, 2004
ASSETS | |||
Current assets | |||
Cash and cash equivalents | $ | 915,000 | |
Accounts receivable—trade, less allowance for doubtful accounts of $102,008 | 2,411,767 | ||
Accounts receivable—affiliate and other | 3,752 | ||
Prepaid expenses and other current assets | �� | 40,215 | |
Total current assets | 3,370,734 | ||
Property and equipment, net | 1,093,799 | ||
Total assets | $ | 4,464,533 | |
LIABILITIES AND STOCKHOLDER’S EQUITY | |||
Current liabilities | |||
Accounts payable—trade | $ | 642,320 | |
Sales tax refunds payable | 149,828 | ||
Sales tax payable | 52,988 | ||
State income tax payable | 75,411 | ||
Federal income tax payable | 234,498 | ||
Current maturities of long-term debt | 6,521 | ||
Total current liabilities | 1,161,566 | ||
Long-term debt, less current portion | 23,944 | ||
Deferred tax liability | 220,581 | ||
Total liabilities | 1,406,091 | ||
Commitments and contingencies | — | ||
Stockholder’s equity | 3,058,442 | ||
Total liabilities and stockholder’s equity | $ | 4,464,533 | |
See notes to financial statements.
F-123
Table of Contents
Index to Financial Statements
SEPARATION SERVICES, INC.
YEAR ENDED DECEMBER 31, 2004
Service revenue | $ | 9,494,511 | ||
Operating expenses: | ||||
Cost of services | 5,017,254 | |||
Selling, general and administrative | 1,818,251 | |||
Depreciation and amortization | 431,520 | |||
Total operating expenses | 7,267,025 | |||
Income from operations | 2,227,486 | |||
Other expense income (expense) | ||||
Interest income | 1,632 | |||
Interest expense | (2,949 | ) | ||
Total other income (expense) | (1,317 | ) | ||
Income before provision for income taxes | 2,226,169 | |||
Provision for income taxes | ||||
Federal—current | 666,998 | |||
Federal—deferred | 54,612 | |||
State | 78,240 | |||
| 799,850 | ||||
Net income | $ | 1,426,319 | ||
See notes to financial statements.
F-124
Table of Contents
Index to Financial Statements
SEPARATION SERVICES, INC.
STATEMENT OF CHANGES IN STOCKHOLDER’S EQUITY
YEAR ENDED DECEMBER 31, 2004
Common Stock | Retained Earnings | Total | |||||||||
Balances, December 31, 2003 | $ | 1,000 | $ | 1,784,089 | $ | 1,785,089 | |||||
Dividends in lieu of loan repayment | — | (152,966 | ) | (152,966 | ) | ||||||
Net income | — | 1,426,319 | 1,426,319 | ||||||||
Balances, December 31, 2004 | $ | 1,000 | $ | 3,057,442 | $ | 3,058,442 | |||||
See notes to financial statements.
F-125
Table of Contents
Index to Financial Statements
SEPARATION SERVICES, INC.
YEAR ENDED DECEMBER 31, 2004
| Cash flows from operating activities | ||||
Net income | $ | 1,426,319 | ||
Adjustments to reconcile net income to net cash provided by operating activities: | ||||
Depreciation | 431,520 | |||
Bad debt expense | 55,401 | |||
Deferred tax expense | 54,612 | |||
Changes in operating assets and liabilities: | ||||
Accounts receivable | (1,629,990 | ) | ||
Loan from stockholder | (122,033 | ) | ||
Prepaid expenses and other current assets | 241 | |||
Accounts payable | 353,193 | |||
Taxes payable | 370,774 | |||
Net cash provided by operating activities | 940,037 | |||
Cash flows from investing activities | ||||
Cash paid for property and equipment | (385,665 | ) | ||
Net cash used in investing activities | (385,665 | ) | ||
Cash flows from financing activities | ||||
Payments on long-term debt | (50,465 | ) | ||
Net cash used in financing activities | (50,465 | ) | ||
Increase in cash | 503,907 | |||
Cash at beginning of period | 411,093 | |||
Cash at end of period | $ | 915,000 | ||
Supplemental cash flow information | ||||
Cash paid for: | ||||
Interest | $ | 1,973 | ||
Taxes | 432,500 | |||
| $ | 434,473 | |||
Non-cash transactions | ||||
Property and equipment purchased financed with notes payable | $ | 35,000 | ||
Dividend issued to stockholder in lieu of loan repayment | $ | 152,966 | ||
See notes to financial statements.
F-126
Table of Contents
Index to Financial Statements
SEPARATION SERVICES, INC.
DECEMBER 31, 2004
1. Significant Accounting Policies
Nature of Business: Separation Services, Inc. (the “Company”) is engaged in the rental of equipment to oil and gas companies and operators at drilling locations in order to separate the waste disposal from the well into solid and liquid forms. The process separates the solid waste from the liquid material into a dry solid form so that liquids can be recycled back into the well. This allows the customers to reduce the amount of waste produced in the drilling operations. The Company contracts with a third party for labor for operations at the wellsite, as well as various third parties for trucking services to haul equipment and waste. The Company’s primary market area is the Gulf Coast region of Texas. The Company operates from Houston, Texas.
The Company was incorporated in Texas on May 1, 1999, and is authorized to issue 100,000 shares of Class A common stock (par value $0.01) and 100,000 shares of Class B common stock (par value $0.01). As of December 31, 2004, there are 100,000 shares issued and outstanding.
Cash and Cash Equivalents: For purposes of the statement of cash flows, cash equivalents include time deposits, certificates of deposit and all highly liquid debt instruments with original maturities of three months or less.
Accounts Receivable: The Company extends credit to its customers based on informal discussions with the management of potential customers. Outstanding accounts receivable are assessed routinely and an allowance is set up when accounts are deemed uncollectible.
Property and Equipment: Property and equipment are stated at cost. Depreciation is provided on the straight line method over the estimated useful lives of the related assets. All expenditures for major renewals and betterments are capitalized. Expenditures for maintenance and repairs are charged to expense as incurred.
Impairment of Long-lived Assets: The Company evaluates an asset for impairment when events or circumstances indicate that a long-lived asset’s carrying value may not be recovered. These events include market declines, changes in the manner in which the Company intends to use an asset, decisions to sell an asset and adverse changes in the legal or business environment.
If events or circumstances indicate that a long-lived asset’s carrying value may not be recoverable, the Company estimates the future undiscounted cash flows from the asset for which the lowest level of separate cash flows can be measured, to determine if the asset is impaired. If the total undiscounted future cash flows are less than the carrying amount for the asset, the Company estimates the fair value of the asset either through reference to sales data for similar assets, or by using a discounted cash flow approach. The asset’s carrying value is then adjusted downward to the fair value. These cash flow estimates require the Company to make estimates and assumptions for many years into the future for pricing demand, competition, operating costs, legal, regulatory and other factors and these estimates or assumptions could change significantly either positively or negatively.
Federal Income Taxes: The Company accounts for income taxes under FASB Statement No. 109, “Accounting for Income Taxes.” Deferred income tax assets and liabilities are determined based upon differences between financial reporting and tax basis of assets and liabilities and are measured using the enacted tax rates and laws that will be in effect when the differences are expected to reverse. Deferred taxes result primarily from property and equipment.
F-127
Table of Contents
Index to Financial Statements
SEPARATION SERVICES, INC.
NOTES TO FINANCIAL STATEMENTS—(Continued)
DECEMBER 31, 2004
Revenue Recognition: Revenue from rental agreements are recognized over the rental period and revenue from service agreements are recognized when services have been rendered.
Advertising: The Company’s policy is to expense advertising costs as incurred. Advertising costs amounted to approximately $14,000 for the year ended December 31, 2004.
Concentration of Risk: During 2004, the Company had cash deposited in a bank which was in excess of federally insured limits. The Company monitors the financial condition of the bank and has experienced no losses associated with its account.
The Company’s customer base consists primarily of independent oil and natural gas producers. The Company performs ongoing evaluations of its customers but generally does not require collateral on its trade receivables. During the year ended December 31, 2004, sales to two customers accounted for approximately 18% and 11% of total sales, respectively, and approximately $370,000 and $0 are due from customers as of December 31, 2004, respectively.
Use of Estimates: The preparation of financial statements in conformity with accounting principles generally accepted in the United States of America requires management to make estimates and assumptions that affect certain reported amounts of assets and liabilities and disclosure of contingent assets and liabilities at the date of the financial statements and the reported amounts of revenue and expenses during the reporting period. Actual results could differ from those estimates.
Reclassifications: Certain reclassifications have been made to the prior years’ financial statements to conform to the current year presentation. These reclassifications had no effect on previously reported results of operations or retained earnings.
2. Property and Equipment
Major classifications of property and equipment and estimated depreciable lives as of December 31, 2004 are as follows:
| Estimated Life | |||||
Rental Equipment | 5-10 years | $ | 2,556,806 | ||
Vehicles | 3-5 years | 170,954 | |||
Office Equipment | 3-5 years | 82,259 | |||
Leasehold Improvements | Various | 29,244 | |||
| 2,839,263 | |||||
Less: accumulated depreciation | 1,745,464 | ||||
| $ | 1,093,799 | ||||
3. Notes Payable and Long-term Debt
As of December 31, 2004, the Company has a term note payable to a bank for $30,465. The note is dated June 24, 2004 and is payable in monthly installments of $653 including interest at 4.59%, through September 15, 2004. The monthly payments increased to $1,000 including interest effective September 15, 2004. The note matures in June 2009 and is secured by an automobile.
F-128
Table of Contents
Index to Financial Statements
SEPARATION SERVICES, INC.
NOTES TO FINANCIAL STATEMENTS—(Continued)
DECEMBER 31, 2004
Future maturities of long-term debt are as follows:
Year Ending December 31, | |||
2005 | $ | 6,521 | |
2006 | 6,827 | ||
2007 | 7,147 | ||
2008 | 7,482 | ||
2009 | 2,488 | ||
| $ | 30,465 | ||
4. Lease Commitments
The Company leases office space from a related party with no formal rental agreement in place as of December 31, 2004. Rent expense incurred for this office space was approximately $79,000 for the year ended December 31, 2004.
The Company also leases equipment on a day-to-day basis from several vendors. The rental expense incurred for this amounted to approximately $446,000 for the year ended December 31, 2004 and is included in cost of revenue in the statement of income. Amounts re-billed to the customer are included in revenue. There are no formal rental agreements in place for rental of equipment.
The minimum future lease payments required under current non-cancelable operating lease agreements as of December 31, 2004, including operating leases executed subsequent to December 31, 2004, as described in Note 6, having remaining terms in excess of one year as of December 31, 2004 for each of the next five years and in the aggregate, are as follows:
Year Ending December 31, | |||
2005 | $ | 90,000 | |
2006 | 90,000 | ||
2007 | 90,000 | ||
| $ | 270,000 | ||
5. Related Party Transactions
During the year ended December 31, 2004, the Company rented equipment from an entity owned by a member of the Company’s management. Total rentals from this company totaled approximately $51,000 and are included in cost of sales in the Statement of Income. The Company had related accounts payable of $1,200 as of December 31, 2004. See additional related party disclosures in Note 6—Subsequent Events.
6. Subsequent Events
In January, 2005, the Company entered into a lease agreement with a related party for the office space located in Houston, Texas. The lease agreement specifies $90,000 in annual rent expiring in December 2007.
In January 2005, the Company’s owner formed a company to provide consulting services to the Company at a monthly rate of $13,000 plus $1,000 for expenses. The consulting agreement was terminated in December 2005, and the Company paid an additional $224,000 to terminate the contract.
On January 31, 2005, the Company was purchased by Stallion Oilfield Services Ltd., headquartered in Houston, Texas.
F-129
Table of Contents
Index to Financial Statements
F-130
Table of Contents
Index to Financial Statements
SEPARATION SERVICES, INC.
SCHEDULE OF OPERATING EXPENSES
YEAR ENDED DECEMBER 31, 2004
Cost of services | |||
Trash and sewer disposal | $ | 1,642,927 | |
Wages | 1,311,695 | ||
Supplies expense | 701,402 | ||
Leased equipment costs | 446,215 | ||
Transportation cost | 195,587 | ||
Repairs & maintenance | 186,766 | ||
Payroll taxes | 150,003 | ||
Insurance | 29,670 | ||
Other | 352,989 | ||
Total cost of services | $ | 5,017,254 | |
Selling, general and administrative | |||
Salaries | 905,887 | ||
Insurance | 147,510 | ||
Travel and entertainment | 139,974 | ||
Telecommunications | 104,805 | ||
Rent—office space | 79,275 | ||
Property and other taxes | 75,435 | ||
Bad debts | 55,401 | ||
Office expenses | 39,711 | ||
Vehicle | 38,958 | ||
Legal and professional | 20,673 | ||
Payroll taxes | 20,659 | ||
Other | 189,963 | ||
Total selling, general and administrative | $ | 1,818,251 | |
See independent auditors’ report.
F-131
Table of Contents
Index to Financial Statements
To the Partners
Stallion Rentals, L.P.
Liberty, Texas
We have audited the accompanying balance sheet of Stallion Rentals (the “Partnership”), L.P. dba Trinity Valley Rentals, as of December 31, 2004, and related combined statements of operations, changes in partners’ deficit and cash flows for the six month periods ended June 30, 2004 and December 31, 2004 of Trinity Valley Rentals, Inc. and Stallion Rentals, L.P., respectively. These financial statements are the responsibility of the Partnership’s management. Our responsibility is to express an opinion on these financial statements based on our audit.
We conducted our audit in accordance with auditing standards generally accepted in the United States of America. Those standards require that we plan and perform the audit to obtain reasonable assurance about whether the financial statements are free of material misstatement. An audit includes examining, on a test basis, evidence supporting the amounts and disclosures in the financial statements. An audit also includes assessing the accounting principles used and significant estimates made by management, as well as evaluating the overall financial statement presentation. We believe that our audit provides a reasonable basis for our opinion.
In our opinion, the financial statements referred to above present fairly, in all material respects, the financial position of Stallion Rentals, L.P. dba Trinity Valley Rentals, as of December 31, 2004, and the combined results of their operations and their cash flows for the six months periods ended June 30, 2004 and December 31, 2004 of Trinity Valley Rentals, Inc. and Stallion Rentals, L.P., respectively, in conformity with accounting principles generally accepted in the United States of America.
Our audit was conducted for the purpose of forming an opinion on the basic financial statements taken as a whole. The supplemental schedule on page F-143 is presented for the purposes of additional analysis and is not required as part of the basic financial statements. Such information has been subjected to the auditing procedures applied in the audit of the basic financial statements and, in our opinion, is fairly stated in all material respects in relation to the basic financial statements taken as a whole.
| /S/ UHY MANN FRANKFORT STEIN & LIPP CPAS, LLP |
| UHY Mann Frankfort Stein & Lipp CPAs, LLP |
Houston, Texas
January 19, 2006
F-132
Table of Contents
Index to Financial Statements
TRINITY VALLEY RENTALS
DECEMBER 31, 2004
| ASSETS | ||||
Current assets | ||||
Cash and cash equivalents | $ | 67,401 | ||
Accounts receivable—less allowance for doubtful accounts of $95,086 | 957,934 | |||
Prepaid expense and other current assets | 72,240 | |||
Total current assets | 1,097,575 | |||
Property and equipment, net | 1,958,701 | |||
Total assets | $ | 3,056,276 | ||
| LIABILITIES AND PARTNERS’ DEFICIT | ||||
Current liabilities | ||||
Accounts payable—trade | $ | 648,676 | ||
Accounts payable—related party | 23,993 | |||
Accrued expenses | 63,638 | |||
Sales tax payable | 75,358 | |||
Current portion of long-term debt | 819,341 | |||
Current portion of notes payable—related party | 190,160 | |||
Current portion of capital lease obligations | 30,112 | |||
Total current liabilities | 1,851,278 | |||
Long-term debt, less current portion | 1,252,440 | |||
Notes payable—related party, less current portion | 231,407 | |||
Long-term capital lease obligations, less current portion | 37,931 | |||
Total liabilities | 3,373,056 | |||
Commitments and contingencies | — | |||
Partners’ deficit | (316,780 | ) | ||
Total liabilities and partners’ deficit | $ | 3,056,276 | ||
See notes to combined financial statements.
F-133
Table of Contents
Index to Financial Statements
TRINITY VALLEY RENTALS
COMBINED STATEMENT OF OPERATIONS
YEAR ENDED DECEMBER 31, 2004
Service revenue | $ | 3,893,380 | ||
Operating expenses: | ||||
Cost of services | 2,286,188 | |||
Selling, general and administrative | 1,366,968 | |||
Depreciation and amortization | 584,262 | |||
Total operating expenses | 4,237,418 | |||
Operating loss | (344,038 | ) | ||
Interest expense | (94,598 | ) | ||
Net loss | $ | (438,636 | ) | |
See notes to combined financial statements.
F-134
Table of Contents
Index to Financial Statements
TRINITY VALLEY RENTALS
COMBINED STATEMENT OF CHANGES IN PARTNERS’ DEFICIT
YEAR ENDED DECEMBER 31, 2004
Balance as of December 31, 2003 | $ | (278,144 | ) | |
Contributions | 400,000 | |||
Net loss | (438,636 | ) | ||
Balance as of December 31, 2004 | $ | (316,780 | ) | |
See notes to combined financial statements.
F-135
Table of Contents
Index to Financial Statements
TRINITY VALLEY RENTALS
COMBINED STATEMENT OF CASH FLOWS
YEAR ENDED DECEMBER 31, 2004
Cash flows from operating activities | ||||
Net loss | $ | (438,636 | ) | |
Adjustments to reconcile net income to net cash used in operating activities: | ||||
Depreciation | 584,262 | |||
Bad debt expense | 81,054 | |||
Changes in operating assets and liabilities: | ||||
Accounts receivable | (316,685 | ) | ||
Prepaid expenses and other current assets | (41,919 | ) | ||
Accounts payable | 156,512 | |||
Accounts payable—related party | 23,993 | |||
Accrued expenses | 8,738 | |||
Sales tax payable | 18,336 | |||
Net cash provided by operating activities | 75,655 | |||
Cash flows from investing activities | ||||
Cash paid for property and equipment | (150,266 | ) | ||
Proceeds received from disposal of property and equipment | 2,500 | |||
Net cash used in investing activities | (147,766 | ) | ||
Cash flows from financing activities | ||||
Proceeds from long-term debt | 950,751 | |||
Payments on long-term debt | (1,360,816 | ) | ||
Proceeds from line of credit | 427,289 | |||
Payments on capital leases | (25,356 | ) | ||
Capital contributions by partners of Stallion Rentals, LP | 360,000 | |||
Payment of note payable to Trinity Valley Rental stockholders | (213,927 | ) | ||
Net cash provided by financing activities | 137,941 | |||
Increase in cash | 65,830 | |||
Cash at beginning of period | 1,571 | |||
Cash at end of period | $ | 67,401 | ||
Supplemental cash flow information | ||||
Interest paid | $ | 94,598 | ||
Non-cash transactions | ||||
Property and equipment financed with long-term debt | $ | 239,577 | ||
Property and equipment financed with proceeds from line of credit | $ | 787,711 | ||
Property and Equipment financed with stockholder note payable | $ | 192,635 | ||
Contribution of stockholder loan receivable | $ | 40,000 | ||
See notes to combined financial statements.
F-136
Table of Contents
Index to Financial Statements
TRINITY VALLEY RENTALS
NOTES TO COMBINED FINANCIAL STATEMENTS
DECEMBER 31, 2004
1. Significant accounting policies
Nature of Business: Stallion Rentals, LP, dba Trinity Valley Rentals (the “Partnership”) is engaged in the rental of forklifts, manlifts, light towers, generators and other surface equipment to the drilling industry. The Partnership’s equipment is manufactured for the tough environments of the drilling industry and provides its customers with living and work spaces. The Partnership’s primary market area is the Gulf Coast region of Texas and it operates from Liberty, TX.
The Partnership is the successor entity of Trinity Valley Rentals, Inc. (the “Predecessor Company”). On July 1, 2004, the Partnership acquired 100% of the stock of the Predecessor Company. For financial reporting purposes, the combined financial statements of the Predecessor Company and the Partnership have been presented at historical cost and do not reflect the effects of any purchase price adjustments as the change in control at July 1, 2004 was a step transaction in connection with the ownership change described in Note 8.
Cash and Cash Equivalents: For purposes of the statement of cash flows, cash equivalents include time deposits, certificates of deposit and all highly liquid debt instruments with original maturities of three months or less.
Accounts Receivable: The Partnership extends credit to its customers based on informal discussions with the management and generally collateral is not required. Outstanding accounts receivable are assessed routinely and an allowance is set up when accounts are deemed uncollectible.
Property and Equipment: Property and equipment are stated at cost. Depreciation is provided on the straight-line method over the estimated useful lives of the related assets. All expenditures for major renewals and betterments are capitalized. Expenditures for maintenance and repairs are charged to expense as incurred.
Impairment of Long-lived Assets: The Partnership evaluates an asset for impairment when events or circumstances indicate that a long-lived asset’s carrying value may not be recovered. These events include market declines, changes in the manner in which the Partnership intends to use an asset, decisions to sell an asset and adverse changes in the legal or business environment.
If events or circumstances indicate that a long-lived asset’s carrying value may not be recoverable, the Partnership estimates the future undiscounted cash flows from the asset for which the lowest level of separate cash flows can be measured, to determine if the asset is impaired. If the total undiscounted future cash flows are less than the carrying amount for the asset, the Partnership estimates the fair value of the asset either through reference to sales data for similar assets, or by using a discounted cash flow approach. The asset’s carrying value is then adjusted downward to the fair value. These cash flow estimates require the Partnership to make estimates and assumptions for many years into the future for pricing demand, competition, operating costs, legal, regulatory and other factors and these estimates or assumptions could change significantly either positively or negatively.
Federal Income Taxes: The Predecessor Company elected S Corporation status on July 1, 2001. Generally, an S Corporation is not subject to tax as its income/loss is reported by the corporation’s shareholders on their individual returns.
Under Internal Revenue Code Section 1374, an S Corporation may be subject to corporate level tax if it has any built-in gain as of the date of the S Corporation election and that gain is realized within a ten year period from the date of the election. The prior owners of the company have represented that no built-in gain exists as of
F-137
Table of Contents
Index to Financial Statements
TRINITY VALLEY RENTALS
NOTES TO COMBINED FINANCIAL STATEMENTS—(Continued)
DECEMBER 31, 2004
the date of the S corporation election. Accordingly, no provision for potential corporate level built-in gain tax has been provided in relation to the operations of the Predecessor Company.
While the Predecessor Company was an S Corporation, Stallion Rentals, L.P. is treated as a partnership for federal income tax purposes; accordingly, a provision for income taxes has not been recorded in the accompanying financial statements. Partnership income or losses are reflected in the partners’ individual or corporate income tax returns in accordance with their ownership percentages.
Revenue Recognition: Revenue from rental agreements are recognized over the rental period.
Advertising: The Partnership’s policy is to expense advertising costs as incurred. Advertising costs amounted to approximately $16,000 for the year ended December 31, 2004.
Partnership Allocations: The income or loss is allocated to the partners in accordance with the Partnership agreement.
Concentration of Risk: During 2004, the Partnership had cash deposited in a bank which was in excess of federally insured limits. The Partnership monitors the financial condition of the bank and has experienced no losses associated with its account.
The Partnership’s customer base consists primarily of independent oil and natural gas producers. The Partnership performs ongoing evaluations of its customers but generally does not require collateral on its trade receivables. During the year ended December 31, 2004, sales to one customer accounted for approximately 17% of total sales. The balance due from this customer as of December 31, 2004 was approximately $202,000. During the year ended December 31, 2004, the Partnership purchased approximately 10% of all goods and services from one vendor. The balance due to this vendor was approximately $95,000 as of December 31, 2004.
Use of Estimates: The preparation of financial statements in conformity with accounting principles generally accepted in the United States of America requires management to make estimates and assumptions that affect certain reported amounts of assets and liabilities and disclosure of contingent assets and liabilities at the date of the financial statements and the reported amounts of revenue and expenses during the reporting period. Actual results could differ from those estimates.
Reclassifications: Certain reclassifications have been made to the prior years’ financial statements to conform to the current year presentation. These reclassifications had no effect on previously reported results of operations or partners’ capital.
F-138
Table of Contents
Index to Financial Statements
TRINITY VALLEY RENTALS
NOTES TO COMBINED FINANCIAL STATEMENTS—(Continued)
DECEMBER 31, 2004
2. Property and equipment
Major classifications of property and equipment and estimated depreciable lives as of December 31, 2004 are as follows:
| Estimated Life | |||||
Rental equipment | 5 years | $ | 2,857,459 | ||
Autos and trucks | 5 years | 705,318 | |||
Furniture and fixtures | 7 years | 31,911 | |||
Leasehold improvements | Various | 14,925 | |||
Software | 3 years | 1,962 | |||
| 3,611,575 | |||||
Less: accumulated depreciation | 1,652,874 | ||||
| $ | 1,958,701 | ||||
3. Notes payable—related parties
Notes payable—related party as of December 31, 2004 consists of the following:
Note payable to owners of the Predecessor Company dated June 30, 2004. Interest only payments are due until June, 2005 thereafter, principal monthly payments of $6,254 plus interest at 5%, maturing in January, 2009. The note is secured by the assets of the Partnership | $ | 268,932 | |
Note payable to partner, dated December 31, 2004, no stated maturity date or interest rate. This note is classified as a current liability. | 152,635 | ||
| 421,567 | |||
Less: current maturities | 190,160 | ||
| $ | 231,407 | ||
F-139
Table of Contents
Index to Financial Statements
TRINITY VALLEY RENTALS
NOTES TO COMBINED FINANCIAL STATEMENTS—(Continued)
DECEMBER 31, 2004
4. Notes payable and long-term debt
Notes payable and long-term debt as of December 31, 2004 consists of the following:
Line of credit with maximum borrowing of $1,000,000, dated June 30, 2004. Principal payments of 1/60 of the outstanding balance are payable monthly bearing interest at 6%, maturing December 2009 and secured by equipment | $ | 1,000,000 | |
Notes payable to a bank, payable in monthly installments aggregating $30,731 including interest, maturing through October 2007, secured by equipment | 628,047 | ||
Line of credit with maximum borrowing of $500,000. Interest only payments calculated as prime plus 0.5% are payable until maturity in June 2005, secured by equipment. | 215,000 | ||
Notes payable to financing companies, payable in monthly installments from $630 to $1,570 and bearing interest at rates ranging from 4.9% to 7.99%, maturing at various dates through November 2009. The notes are secured by vehicles and equipment. | 188,488 | ||
Note payable to a bank payable in monthly installments of $768 including interest at 4.69%, maturing in July 2007 and secured by a vehicle. | 22,328 | ||
Note payable to a bank payable in monthly installments of $530 including interest at 6.39%, maturing in July 2007 and secured by a vehicle. | 17,918 | ||
| 2,071,781 | |||
Less: current maturities | 819,341 | ||
| $ | 1,252,440 | ||
The Partnership is required to meet certain financial covenants on a monthly reporting basis. Among other restrictions, such covenants include the maintenance of minimum tangible net worth requirements, as well as the maintenance of sufficient levels of earnings to meet the Partnership’s required debt servicing obligations. As of December 31, 2004, the Partnership was not in compliance with these covenants.
The following are future maturities of the long-term debt and long-term debt related party:
Year Ending December 31, | Related Party | Non-Related Party | Total | ||||||
2005 | $ | 190,160 | $ | 819,341 | $ | 1,009,501 | |||
2006 | 75,051 | 590,508 | 665,559 | ||||||
2007 | 75,051 | 250,053 | 325,104 | ||||||
2008 | 75,051 | 206,039 | 281,090 | ||||||
2009 | 6,254 | 205,840 | 212,094 | ||||||
| $ | 421,567 | $ | 2,071,781 | $ | 2,493,348 | ||||
F-140
Table of Contents
Index to Financial Statements
TRINITY VALLEY RENTALS
NOTES TO COMBINED FINANCIAL STATEMENTS—(Continued)
DECEMBER 31, 2004
5. Capital lease obligations
The Partnership leases certain equipment which has been classified as capital leases. As of December 31, 2004, the aggregate cost and accumulated depreciation of assets under capital leases are as follows:
Cost | $ | 155,830 | |
Accumulated depreciation | 122,000 | ||
| $ | 33,830 | ||
Depreciation for such assets is included in depreciation expense.
The following are the future minimum lease payments under capital leases:
Year Ending December 31, | |||
2005 | $ | 35,484 | |
2006 | 28,159 | ||
2007 | 12,070 | ||
Total future minimum lease payments | 75,713 | ||
Less: amount representing interest | 7,670 | ||
Present value of future minimum lease payments | $ | 68,043 | |
6. Lease commitments
The Partnership leases land under an informal month-to-month agreement. They also lease office space under a non-cancelable operating lease which expires March 2005. Rent expense under these operating leases and other vehicle leases charged to income was approximately $35,000 for the year ended December 31, 2004. The Partnership is obligated to pay $4,050 in 2005.
The Partnership subleases and leases rental equipment for use in the revenue process under informal lease agreements. Total sublease and lease expense was approximately $1,370,000 and $109,000, respectively.
7. Related party transactions
The Partnership has related party payables of approximately $24,000 as of December 31, 2004. The partnership also has notes payable to related parties as described in Note 3.
8. Subsequent events
On January 31, 2005, certain assets and working capital of the Partnership were purchased by Stallion Oilfield Services Ltd., headquartered in Houston, Texas.
F-141
Table of Contents
Index to Financial Statements
F-142
Table of Contents
Index to Financial Statements
TRINITY VALLEY RENTALS
SCHEDULE OF COMBINED OPERATING EXPENSES
YEAR ENDED DECEMBER 31, 2004
Cost of services | |||
Subleased equipment | $ | 1,371,086 | |
Salaries and wages | 306,058 | ||
Repairs and maintenance | 264,464 | ||
Leased equipment | 108,974 | ||
Vehicles | 71,868 | ||
Tools and supplies | 44,492 | ||
Freight | 26,858 | ||
Fuel | 28,875 | ||
Other | 63,513 | ||
Total cost of services | $ | 2,286,188 | |
Selling, general and administrative | |||
Salaries | 467,875 | ||
Insurance | 162,098 | ||
Vehicle | 138,399 | ||
Travel and entertainment | 107,366 | ||
Bad debts | 81,054 | ||
Payroll taxes | 68,665 | ||
Legal and professional | 65,090 | ||
Telecommunications | 49,379 | ||
Repairs and maintenance | 38,382 | ||
Rent—office space | 34,739 | ||
Property taxes | 32,812 | ||
Office expenses | 17,942 | ||
Advertising | 16,118 | ||
Other | 87,049 | ||
Total selling, general and administrative | $ | 1,366,968 | |
See independent auditors’ report.
F-143
Table of Contents
Index to Financial Statements
To the Stockholders
Envirotech, Inc.
Riverton, WY
We have audited the accompanying balance sheet of Envirotech, Inc. as of December 31, 2004, and related statements of operations, changes in stockholders’ equity and cash flows for the year then ended. These financial statements are the responsibility of the Company’s management. Our responsibility is to express an opinion on these financial statements based on our audit.
We conducted our audit in accordance with auditing standards generally accepted in the United States of America. Those standards require that we plan and perform the audit to obtain reasonable assurance about whether the financial statements are free of material misstatement. An audit includes examining, on a test basis, evidence supporting the amounts and disclosures in the financial statements. An audit also includes assessing the accounting principles used and significant estimates made by management, as well as evaluating the overall financial statement presentation. We believe that our audit provides a reasonable basis for our opinion.
In our opinion, the financial statements referred to above present fairly, in all material respects, the financial position of Envirotech, Inc. as of December 31, 2004, and the results of its operations and its cash flows for the year then ended, in conformity with accounting principles generally accepted in the United States of America.
Our audit was conducted for the purpose of forming an opinion on the basic financial statements taken as a whole. The supplemental schedule on page F-154 is presented for purposes of additional analysis and is not required as part of the basic financial statements. Such information has been subjected to the auditing procedures applied in the audit of the basic financial statements and, in our opinion, is fairly stated in all material respects in relation to the basic financial statements taken as a whole.
| /S/ UHY MANN FRANKFORT STEIN & LIPP CPAS, LLP |
| UHY Mann Frankfort Stein & Lipp CPAs, LLP |
Houston, Texas
January 9, 2006
F-144
Table of Contents
Index to Financial Statements
ENVIROTECH, INC.
DECEMBER 31, 2004
ASSETS | |||
Current assets | |||
Accounts receivable—trade, less allowance for doubtful accounts of $18,985 | 1,151,066 | ||
Loan to stockholder | 11,445 | ||
Total current assets | 1,162,511 | ||
Property and equipment, net | 1,865,985 | ||
Total assets | $ | 3,028,496 | |
LIABILITIES AND STOCKHOLDERS’ EQUITY | |||
Current liabilities | |||
Bank overdraft | $ | 133,541 | |
Accounts payable—trade | 502,166 | ||
Accounts payable—related party | 28,526 | ||
Current portion of long-term debt | 291,239 | ||
Note payable—related party | 75,000 | ||
Line of credit | 340,000 | ||
Total current liabilities | 1,370,472 | ||
Long-term debt, less current portion | 464,378 | ||
Total liabilities | 1,834,850 | ||
Commitments and contingencies | — | ||
Stockholders’ equity | 1,193,646 | ||
Total liabilities and stockholders’ equity | $ | 3,028,496 | |
See notes to financial statements.
F-145
Table of Contents
Index to Financial Statements
ENVIROTECH, INC.
YEAR ENDED DECEMBER 31, 2004
Service revenue | $ | 5,555,377 | ||
Operating expenses: | ||||
Cost of services | 3,867,462 | |||
Selling, general and administrative | 695,134 | |||
Depreciation and amortization | 482,674 | |||
Total operating expenses | 5,045,270 | |||
Operating income | 510,107 | |||
Other income (expense) | ||||
Interest expense | (62,932 | ) | ||
Other income | 20,850 | |||
Other expense | (28,138 | ) | ||
Total other income (expense) | (70,220 | ) | ||
Net income | $ | 439,887 | ||
See notes to financial statements.
F-146
Table of Contents
Index to Financial Statements
ENVIROTECH, INC.
STATEMENT OF CHANGES IN STOCKHOLDERS’ EQUITY
YEAR ENDED DECEMBER 31, 2004
Common Stock | Retained Earnings | Total | |||||||||
Balances, January 1, 2004 | $ | 18,000 | $ | 955,759 | $ | 973,759 | |||||
Dividends | — | (220,000 | ) | (220,000 | ) | ||||||
Net income | — | 439,887 | 439,887 | ||||||||
Balances, December 31, 2004 | $ | 18,000 | $ | 1,175,646 | $ | 1,193,646 | |||||
See notes to financial statements.
F-147
Table of Contents
Index to Financial Statements
ENVIROTECH, INC.
YEAR ENDED DECEMBER 31, 2004
Cash flows from operating activities | ||||
Net income | $ | 439,887 | ||
Adjustments to reconcile net income to net cash provided by operating activities: | ||||
Depreciation | 482,674 | |||
Bad debt expense | 22,457 | |||
Loss on disposal of assets | 42,000 | |||
Changes in operating assets and liabilities: | ||||
Accounts receivable | (321,818 | ) | ||
Loan to shareholder | (5,188 | ) | ||
Accounts payable | 381,484 | |||
Accounts payable—related party | 84,854 | |||
Net cash provided by operating activities | 1,126,350 | |||
Cash flows from investing activities | ||||
Cash paid for property and equipment | (128,057 | ) | ||
Net cash used in investing activities | (128,057 | ) | ||
Cash flows from financing activities | ||||
Payments on notes payable | (386,090 | ) | ||
Payments on line of credit | (285,000 | ) | ||
Dividends paid | (220,000 | ) | ||
Proceeds from notes payable—related party | 175,000 | |||
Payment on notes payable—related party | (150,000 | ) | ||
Bank overdraft | (133,541 | ) | ||
Net cash used in financing activities | (999,631 | ) | ||
Increase in cash | (1,338 | ) | ||
Cash at beginning of period | 1,338 | |||
Cash at end of period | $ | — | ||
Supplemental cash flow information | ||||
Interest paid | $ | 62,932 | ||
Non-cash | ||||
Property and equipment financed with notes payable and line of credit | $ | 640,000 | ||
See notes to financial statements.
F-148
Table of Contents
Index to Financial Statements
ENVIROTECH, INC.
DECEMBER 31, 2004
1. Significant Accounting Policies
Nature of Business: Envirotech, Inc. (the “Company”) is engaged in the rental of temporary housing, water systems, sewer systems and other related equipment to the drilling industry. The Company’s housing is manufactured for the tough environments of the drilling industry and provides its customers with comfortable and functional living and work spaces. The Company’s primary market is the Rocky Mountain area and it operates from Riverton, WY.
Envirotech, Inc. was incorporated as an S Corporation in Wyoming in 1996. The Company is equally co-owned by two individuals. The Company is authorized to issue 50,000 shares of no-par value common stock. As of December 31, 2004, 1,000 shares are issued and outstanding.
Cash and Cash Equivalents: For purposes of the statement of cash flows, cash equivalents include time deposits, certificates of deposit and all highly liquid debt instruments with original maturities of three months or less.
Accounts Receivable: The Company extends credit to its customers based on an evaluation of the customer’s financial condition and generally collateral is not required. Outstanding accounts receivable are assessed routinely and an allowance is set up when accounts are deemed uncollectible.
Property and Equipment: Property and equipment are stated at cost. Depreciation is provided on the straight-line method over the estimated useful lives of the related assets. All expenditures for major renewals and betterments are capitalized. Expenditures for maintenance and repairs are charged to expense as incurred.
Impairment of Long-lived Assets: The Company evaluates an asset for impairment when events or circumstances indicate that a long-lived asset’s carrying value may not be recovered. These events include market declines, changes in the manner in which the Company intends to use an asset, decisions to sell an asset and adverse changes in the legal or business environment.
If events or circumstances indicate that a long-lived asset’s carrying value may not be recoverable, the Company estimates the future undiscounted cash flows from the asset for which the lowest level of separate cash flows can be measured, to determine if the asset is impaired. If the total undiscounted future cash flows are less than the carrying amount for the asset, the Company estimates the fair value of the asset either through reference to sales data for similar assets, or by using a discounted cash flow approach. The asset’s carrying value is then adjusted downward to the fair value. These cash flow estimates require the Company to make estimates and assumptions for many years into the future for pricing demand, competition, operating costs, legal, regulatory and other factors and these estimates or assumptions could change significantly either positively or negatively.
Federal Income Taxes: The Company, with the consent of its stockholders, has elected under the Internal Revenue Code to be taxed as an S Corporation. The stockholders of an S Corporation are taxed on their proportionate share of the Company’s taxable income. Therefore, no provision or liability for federal income taxes has been included in the financial statements.
Revenue Recognition: Revenue from rental agreements are recognized over the rental period.
Advertising: The Company’s policy is to expense advertising costs as incurred. Advertising costs amounted to approximately $8,000 for the year ended December 31, 2004.
F-149
Table of Contents
Index to Financial Statements
ENVIROTECH, INC.
NOTES TO FINANCIAL STATEMENTS—(Continued)
DECEMBER 31, 2004
Concentration of Risk: During 2004, the Company had cash deposited in a bank which was in excess of federally insured limits. The Company monitors the financial condition of the bank and has experienced no losses associated with its account.
The Company’s customer base consists primarily of independent oil and natural gas producers. The Company performs ongoing evaluations of its customers but generally does not require collateral on its trade receivables. During the year ended December 31, 2004, sales to three customers accounted for approximately 21%, 18% and 14% of total sales. Receivables from these customers as of December 31, 2004 totaled approximately $222,000, $337,000 and $158,000, respectively. During 2004, the Company purchased approximately 19% of all goods and services from one vendor. The accounts payable balance due to this vendor as of December 31, 2004 was approximately $200,000.
Use of Estimates: The preparation of financial statements in conformity with accounting principles generally accepted in the United States of America requires management to make estimates and assumptions that affect certain reported amounts of assets and liabilities and disclosure of contingent assets and liabilities at the date of the financial statements and the reported amounts of revenue and expenses during the reporting period. Actual results could differ from those estimates.
Reclassifications: Certain reclassifications have been made to the prior years’ financial statements to conform to the current year presentation. These reclassifications had no effect on previously reported results of operations or retained earnings.
2. Property and Equipment
Major classifications of property and equipment and estimated depreciable lives as of December 31, 2004 are as follows:
| Estimated Life | |||||
Rental equipment | 5-7 years | $ | 3,167,729 | ||
Autos and trucks | 5 years | 274,179 | |||
Other depreciable property | 5-7 years | 156,151 | |||
Leasehold improvements | Various | 4,412 | |||
| 3,602,471 | |||||
Less: accumulated depreciation | 1,736,486 | ||||
| $ | 1,865,985 | ||||
3. Notes Payable—Related Party
The Company has a note payable to a related party dated December 2003. Interest accrues at 6.5% and will increase based on prime rate, which was 5.25% as of December 31, 2004. The note has no stated maturity date and the principal balance of $75,000 is classified as a current liability.
F-150
Table of Contents
Index to Financial Statements
ENVIROTECH, INC.
NOTES TO FINANCIAL STATEMENTS—(Continued)
DECEMBER 31, 2004
4. Notes Payable and Long-term Debt
Notes payable and long-term debt as of December 31, 2004 consists of the following:
Line of credit to a bank dated April 2004; maximum borrowing of $350,000. Interest payable monthly at the higher of prime (prime rate as of December 31, 2004 was 5.25%) or 4.75%. Line of credit matures in May 2005. | $ | 340,000 | |
Note payable to a bank dated April 2004; original principal amount of $300,000. Payable in monthly installments of $5,628 including interest at the higher of prime rate or 4.75%. Note matures April 2009 and is secured by stock and assets of the Company along with personal guarantees of the owners. | 263,158 | ||
Note payable to a bank dated October 2003; original principle of $250,000. Payable in monthly installments of $4,661 which includes interest at the higher of the prime rate or 4.5%. Note matures October 2006 and is secured by the stock and assets of the Company along with the personal guarantees of the owners. | 196,551 | ||
Note payable to a bank dated November 2000; original principal amount of $850,000. Payable in monthly installments of $17,749 which includes interest at prime rate less 0.75% with a maximum of 10% and a minimum of 6.75%. Note matures March 2006 and is secured by stock and assets of the Company along with the personal guarantees of the owners. | 185,497 | ||
Note payable to a bank dated March 2001; original principal amount of $350,000. Payable in monthly installments of $7,055 including interest at the higher of prime less 0.5% or 8%. Note matures June 15, 2006 and is secured by stock and assets of the Company along with personal guarantees of the owners. | 95,321 | ||
Note payable to a financing company dated December 2003; original principal amount of $21,629. Payable in monthly installments of $503 with no interest. Note matures April 2009 and is secured by equipment | 15,090 | ||
| 1,095,617 | |||
Less: current maturities | 631,239 | ||
| $ | 464,378 | ||
The Company is required to meet certain financial covenants on a monthly reporting basis. Among other restrictions, such covenants include the maintenance of minimum tangible net worth requirements, as well as the maintenance of sufficient levels of earnings to meet the Company’s required debt servicing obligations. As of December 31, 2004, the Company was in compliance with all of the related notes payable and covenants.
F-151
Table of Contents
Index to Financial Statements
ENVIROTECH, INC.
NOTES TO FINANCIAL STATEMENTS—(Continued)
DECEMBER 31, 2004
Future maturities of long-term debt are as follows:
Year Ending December 31, | Related party | Non-related party | Total | ||||||
2005 | $ | 75,000 | $ | 631,239 | $ | 706,239 | |||
2006 | — | 232,966 | 232,966 | ||||||
2007 | — | 121,694 | 121,694 | ||||||
2008 | — | 69,970 | 69,970 | ||||||
2009 | — | 39,748 | 39,748 | ||||||
| $ | 75,000 | $ | 1,095,617 | $ | 1,170,617 | ||||
5. Lease Commitments
The Company leases office space from a related party under an informal month-to-month operating lease. Rent expense for office space was approximately $70,000 for the year ended December 31, 2004.
The Company rents equipment for use in the revenue process, and re-bills this cost to customers. Re-billed rental expense totaled approximately $1,560,000 during 2004 and is included in cost of revenue in the statement of income.
Totaled amounts re-billed to the customer are included in revenue.
Equipment is primarily rented under short-term rental arrangements and a non-cancelable operating lease expiring in October 2007. Total rental expense under this non-cancelable lease was approximately $420,000 during the year ended December 31, 2004.
The approximate future minimum rental payments under the non-cancelable operating lease are as follows:
Year Ending December 31, | |||
2005 | $ | 1,927,000 | |
2006 | 1,927,000 | ||
2007 | 1,441,000 | ||
| $ | 5,295,000 | ||
6. Related Party Transactions
The Company had related party payables of approximately $28,000 as of December 31, 2004. Related party payables are due to shareholders, as well as entities under common control. The Company also has related party notes as described in Note 3 and leases office space from a related party as described in Note 5.
7. Subsequent Events
On January 31, 2005, certain assets and working capital of the Company were purchased by Stallion Oilfield Services Ltd., headquartered in Houston, Texas.
F-152
Table of Contents
Index to Financial Statements
F-153
Table of Contents
Index to Financial Statements
ENVIROTECH, INC.
SCHEDULE OF OPERATING EXPENSES
YEAR ENDED DECEMBER 31, 2004
COST OF SERVICES | |||
Re-billed equipment rental | $ | 1,555,772 | |
Repairs and maintenance | 428,025 | ||
Purchases/materials | 412,346 | ||
Autos and trucks | 144,878 | ||
Labor | 963,867 | ||
Employee benefits | 95,029 | ||
Travel and entertainment | 94,190 | ||
Payroll taxes | 84,723 | ||
Insurance | 75,186 | ||
Other | 13,446 | ||
Total cost of services | $ | 3,867,462 | |
SELLING, GENERAL AND ADMINISTRATIVE | |||
Vehicle | $ | 219,877 | |
Salaries | 141,940 | ||
Rent-office space | 70,024 | ||
Legal and professional | 52,712 | ||
Loss on disposal of assets | 42,000 | ||
Telecommunications | 33,246 | ||
Bad debts | 22,457 | ||
Insurance | 21,083 | ||
Employee benefits | 20,860 | ||
Payroll taxes | 18,498 | ||
Utilities | 17,156 | ||
Travel and entertainment | 10,465 | ||
Advertising | 8,089 | ||
Other | 16,727 | ||
Total selling, general and administrative | $ | 695,134 | |
See independent auditors’ report.
F-154
Table of Contents
Index to Financial Statements
To the Stockholder
Double-D Enterprises, Inc.
Riverton, WY
We have audited the accompanying balance sheet of Double-D Enterprises, Inc. as of December 31, 2004, and related statements of operations, stockholders’ equity and cash flows for the year then ended. These financial statements are the responsibility of the Company’s management. Our responsibility is to express an opinion on these financial statements based on our audit.
We conducted our audit in accordance with auditing standards generally accepted in the United States of America. Those standards require that we plan and perform the audit to obtain reasonable assurance about whether the financial statements are free of material misstatement. An audit includes examining, on a test basis, evidence supporting the amounts and disclosures in the financial statements. An audit also includes assessing the accounting principles used and significant estimates made by management, as well as evaluating the overall financial statement presentation. We believe that our audit provides a reasonable basis for our opinion.
In our opinion, the financial statements referred to above present fairly, in all material respects, the financial position of Double-D Enterprises, Inc. as of December 31, 2004, and the results of its operations and its cash flows for the year then ended, in conformity with accounting principles generally accepted in the United States of America.
Our audit was conducted for the purpose of forming an opinion on the basic financial statements taken as a whole. The supplemental schedule on page F-165 is presented for purposes of additional analysis and is not required as part of the basic financial statements. Such information has been subjected to the auditing procedures applied in the audit of the basic financial statements and, in our opinion, is fairly stated in all material respects in relation to the basic financial statements taken as a whole.
| /S/ UHY MANN FRANKFORT STEIN & LIPP CPAS, LLP |
| UHY Mann Frankfort Stein & Lipp CPAs, LLP |
Houston, Texas
January 9, 2006
F-155
Table of Contents
Index to Financial Statements
DOUBLE-D ENTERPRISES, INC.
DECEMBER 31, 2004
ASSETS | |||
Current assets | |||
Cash and cash equivalents | $ | 216,982 | |
Accounts receivable—trade, less allowance for doubtful accounts of $83,898 | 387,484 | ||
Accounts receivable—related party | 189,108 | ||
Available-for-sale securities | 314,331 | ||
Prepaid expenses and other current assets | 16,500 | ||
Total current assets | 1,124,405 | ||
Property and equipment, net | 1,084,935 | ||
Held to maturity investments | 90,466 | ||
Total assets | $ | 2,299,806 | |
LIABILITIES AND STOCKHOLDER’S EQUITY | |||
Current liabilities | |||
Accounts payable—trade | $ | 104,107 | |
Line of credit | 444,900 | ||
Total current liabilities | 549,007 | ||
Total liabilities | 549,007 | ||
Commitments and contingencies | — | ||
Stockholder’s equity | 1,750,799 | ||
Total liabilities and stockholder’s equity | $ | 2,299,806 | |
See notes to financial statements.
F-156
Table of Contents
Index to Financial Statements
DOUBLE-D ENTERPRISES, INC.
YEAR ENDED DECEMBER 31, 2004
Service revenue | $ | 2,283,791 | ||
Operating expenses: | ||||
Cost of services | 989,154 | |||
Selling, general and administrative | 384,902 | |||
Depreciation and amortization | 171,579 | |||
Total operating expenses | 1,545,635 | |||
Income from operations | 738,156 | |||
Other income (expense) | ||||
Interest income | 5,440 | |||
Interest expense | (41,990 | ) | ||
Other income | 4,273 | |||
Other expense | (25,416 | ) | ||
Total other income (expense) | (57,693 | ) | ||
Net income | $ | 680,463 | ||
See notes to financial statements.
F-157
Table of Contents
Index to Financial Statements
DOUBLE-D ENTERPRISES, INC.
STATEMENT OF CHANGES IN STOCKHOLDER’S EQUITY
YEAR ENDED DECEMBER 31, 2004
Common Stock | Retained Earnings | Accumulated Other Comprehensive Income/(Loss) | Total | |||||||||||
Balances, December 31, 2003 | $ | 10,000 | $ | 1,017,508 | $ | 61,409 | $ | 1,088,917 | ||||||
Unrealized gain on available— for-sale securities | — | — | 41,919 | 41,919 | ||||||||||
Net income | — | 680,463 | — | 680,463 | ||||||||||
Total comprehensive income | 722,382 | |||||||||||||
Dividends | — | (60,500 | ) | — | (60,500 | ) | ||||||||
Balances, December 31, 2004 | $ | 10,000 | $ | 1,637,471 | $ | 103,328 | $ | 1,750,799 | ||||||
See notes to financial statements.
F-158
Table of Contents
Index to Financial Statements
DOUBLE-D ENTERPRISES, INC.
YEAR ENDED DECEMBER 31, 2004
Cash flows from operating activities | ||||
Net income | $ | 680,463 | ||
Adjustments to reconcile net income to net cash provided by operating activities: | ||||
Depreciation | 171,579 | |||
Bad debt expense | 77,619 | |||
Changes in operating assets and liabilities: | ||||
Accounts receivable—trade | (275,357 | ) | ||
Accounts receivable—related party | (77,707 | ) | ||
Prepaid expenses and other current assets | (6,114 | ) | ||
Accounts payable—trade | 10,898 | |||
Net cash provided by operating activities | 581,381 | |||
Cash flows from investing activities | ||||
Cash paid for property and equipment | (366,276 | ) | ||
Proceeds received from sale of investment | 4,211 | |||
Purchase of available-for-sale securities | (46,564 | ) | ||
Net cash used in investing activities | (408,629 | ) | ||
Cash flows from financing activities | ||||
Dividends paid | (60,500 | ) | ||
Repayment of line of credit | (2,176 | ) | ||
Repayments on capital leases | (17,612 | ) | ||
Net cash used in financing activities | (80,288 | ) | ||
Increase in cash | 92,464 | |||
Cash at beginning of period | 124,518 | |||
Cash at end of period | $ | 216,982 | ||
Supplemental cash flow information | ||||
Interest paid | $ | 41,990 | ||
Non-cash transactions | ||||
Property and equipment financed with line of credit | $ | 447,076 | ||
See notes to financial statements.
F-159
Table of Contents
Index to Financial Statements
DOUBLE-D ENTERPRISES, INC.
DECEMBER 31, 2004
1. Significant Accounting Policies
Nature of Business: Double-D Enterprises, Inc. (the “Company”) is engaged in the rental of loaders, manlifts, mud vacs, and other related equipment to the drilling industry. The Company’s primary market is Wyoming, and the Company operates from locations in Riverton and Shoshoni, WY.
Double-D Enterprises, Inc., an S Corporation, was incorporated in Wyoming in June, 1980. The Company is authorized to issue 50,000 shares of no-par value common stock.
Cash and Cash Equivalents: For purposes of the statement of cash flows, cash equivalents include time deposits, certificates of deposit and all highly liquid debt instruments with original maturities of three months or less.
Accounts Receivable: The Company extends credit to its customers based on an evaluation of their financial condition and generally collateral is not required. Outstanding accounts receivable are assessed routinely and an allowance is set up when accounts are deemed uncollectible.
Investments: The Company determines the appropriate classification of its investments in debt and equity securities at the time of purchase and reevaluates such determinations at each balance sheet date. Debt securities are classified as held-to-maturity when the Company has the positive intent and ability to hold the securities to maturity. Debt securities for which the Company does not have the intent or ability to hold to maturity are classified as available-for-sale. Held-to-maturity securities are recorded as either short -term or long-term on the balance sheet based on contractual maturity date and are stated at amortized cost. Marketable securities that are bought and held principally for the purpose of selling them in the near term are classified as trading securities and are reported at fair value, with unrealized gains and losses recognized in earnings. Debt and marketable equity securities not classified as held-to-maturity or as trading, are classified as available-for-sale, and are carried at fair market value, with the unrealized gains and losses, included in the determination of comprehensive income and reported in stockholder’s equity.
Property and Equipment: Property and equipment are stated at cost. Depreciation is provided on the straight-line method over the estimated useful lives of the related assets. All expenditures for major renewals and betterments are capitalized. Expenditures for maintenance and repairs are charged to expense as incurred.
Impairment of Long-lived Assets: The Company evaluates an asset for impairment when events or circumstances indicate that a long-lived asset’s carrying value may not be recovered. These events include market declines, changes in the manner in which the Company intends to use an asset, decisions to sell an asset and adverse changes in the legal or business environment.
If events or circumstances indicate that a long-lived asset’s carrying value may not be recoverable, the Company estimates the future undiscounted cash flows from the asset for which the lowest level of separate cash flows can be measured, to determine if the asset is impaired. If the total undiscounted future cash flows are less than the carrying amount for the asset, the Company estimates the fair value of the asset either through reference to sales data for similar assets, or by using a discounted cash flow approach. The asset’s carrying value is then adjusted downward to the fair value. These cash flow estimates require the Company to make estimates and assumptions for many years into the future for pricing demand, competition, operating costs, legal, regulatory and other factors and these estimates or assumptions could change significantly either positively or negatively.
F-160
Table of Contents
Index to Financial Statements
DOUBLE-D ENTERPRISES, INC.
NOTES TO FINANCIAL STATEMENTS—(Continued)
DECEMBER 31, 2004
Federal Income Taxes: The Company, with the consent of its stockholder, has elected under the Internal Revenue Code to be taxed as an S Corporation. The stockholders of an S Corporation are taxed on their proportionate share of the Company’s taxable income. Therefore, no provision or liability for federal income taxes has been included in the financial statements.
Revenue Recognition: Revenue from rental agreements are recognized over the rental period.
Advertising: The Company’s policy is to expense advertising costs as incurred. Advertising costs amounted to approximately $5,000 for the year ended December 31, 2004.
Concentration of Risk: During 2004, the Company had cash deposited in a bank which was in excess of federally insured limits. The Company monitors the financial condition of the bank and has experienced no losses associated with its account.
The Company’s customer base consists primarily of independent oil and natural gas producers. The Company performs ongoing evaluations of its customers but generally does not require collateral on its trade receivables. During the year ended December 31, 2004, sales to four customers accounted for approximately 25%, 18%, 14% and 12% of total sales, respectively. Amounts due from these customers as of December 31, 2004 were approximately $87,000, $100,000, $87,000 and $44,000, respectively.
The Company purchased 14% of all goods and services from one vendor during the year ended December 31, 2004. Accounts payable to this vendor as of December 31, 2004 was approximately $14,000. In addition, the Company purchased approximately 19% of all goods and services from a related party.
Use of Estimates: The preparation of financial statements in conformity with accounting principles generally accepted in the United States of America requires management to make estimates and assumptions that affect certain reported amounts of assets and liabilities and disclosure of contingent assets and liabilities at the date of the financial statements and the reported amounts of revenue and expenses during the reporting period. Actual results could differ from those estimates.
Reclassifications: Certain reclassifications have been made to the prior years’ financial statements to conform to the current year presentation. These reclassifications had no effect on previously reported results of operations or retained earnings.
2. Investments
Available-for-sale securities as of December 31, 2004 included equity securities at an estimated fair value of $314,331 resulting in an unrealized gain of $103,328.
As of December 31, 2004, the Company held investments in marketable securities that were classified as held-to-maturity. These securities are from states and municipalities with an estimated fair value of $93,934. The securities are carried on the balance sheet at cost of $90,466, with an unrecognized holding gain of $3,468.
F-161
Table of Contents
Index to Financial Statements
DOUBLE-D ENTERPRISES, INC.
NOTES TO FINANCIAL STATEMENTS—(Continued)
DECEMBER 31, 2004
3. Property and Equipment
Major classifications of property and equipment and estimated depreciable lives as of December 31, 2004 are as follows:
| Estimated Life | |||||
Equipment | 5-7 years | $ | 1,320,866 | ||
Other depreciable property | 3-5 years | 233,267 | |||
Autos and trucks | 5 years | 178,590 | |||
Leasehold improvement | Various | 81,422 | |||
| 1,814,145 | |||||
Less: accumulated depreciation | 729,210 | ||||
| $ | 1,084,935 | ||||
4. Line of Credit
Line of credit with a maximum borrowing base of $550,000 of which $444,900 was outstanding as of December 31, 2004, interest payable monthly at an initial rate of 4.75% and variable at prime plus 0.25%, maturing August 12, 2005. The prime rate was 5.25% as of December 31, 2004. The line of credit is secured by stock and assets of a related party and the personal guarantee of the stockholder.
The Company is required to meet certain financial covenants on a monthly reporting basis. Among other restrictions, such covenants include the maintenance of minimum tangible net worth requirements, as well as the maintenance of sufficient levels of earnings to meet the Company’s required debt servicing obligations. As of December 31, 2004, the Company was in compliance with all of the related amended covenants.
5. Lease Commitments
The Company leases office space from a third party under an informal agreement. Rent expense for the year ended December 31, 2004 was approximately $9,000. The Company has no future commitments related to this month-to-month agreement.
The Company rents equipment for various terms under long-term, non-cancelable operating lease agreements. The agreements expire at various dates through February 2008. Total rental expense for equipment was approximately $253,000 for the year ended December 31, 2004.
The approximate future minimum rental payments under non-cancelable operating leases are as follows:
Year Ending December 31, | |||
2005 | $ | 320,000 | |
2006 | 245,000 | ||
2007 | 181,000 | ||
2008 | 7,000 | ||
| $ | 753,000 | ||
F-162
Table of Contents
Index to Financial Statements
DOUBLE-D ENTERPRISES, INC.
NOTES TO FINANCIAL STATEMENTS—(Continued)
DECEMBER 31, 2004
6. Related Party Transactions
The Company had current related party receivables of approximately $189,000. Related party receivables are due from the stockholder and entities under common control.
7. Subsequent Events
On January 31, 2005, certain assets and working capital of the Company were purchased by Stallion Oilfield Services Ltd., headquartered in Houston, Texas.
F-163
Table of Contents
Index to Financial Statements
F-164
Table of Contents
Index to Financial Statements
DOUBLE-D ENTERPRISES, INC.
SCHEDULE OF OPERATING EXPENSES
YEAR ENDED DECEMBER 31, 2004
Cost of services | |||
Purchases or materials | $ | 362,386 | |
Equipment rental | 253,456 | ||
Repairs and maintenance | 128,950 | ||
Salaries and wages | 103,512 | ||
Vehicles | 89,105 | ||
Insurance | 29,191 | ||
Payroll taxes | 13,664 | ||
Other | 8,890 | ||
Total cost of services | $ | 989,154 | |
Selling, general and administrative | |||
Salaries | 141,331 | ||
Bad debts | 77,619 | ||
Legal and professional | 32,894 | ||
Insurance | 29,190 | ||
Payroll taxes | 20,496 | ||
Telecommunications | 14,306 | ||
Property taxes | 12,624 | ||
Travel and entertainment | 12,347 | ||
Vehicle | 9,742 | ||
Rent | 8,535 | ||
Advertising | 4,617 | ||
Other | 21,201 | ||
Total selling, general and administrative | $ | 384,902 | |
See independent auditors’ report.
F-165
Table of Contents
Index to Financial Statements
Appendix A
Glossary of Terms
ArkLaTex. The region, centered in Northwest Louisiana, is where Arkansas, Louisiana, Texas and Oklahoma intersect.
Articulating loader. A heavy duty four-wheeled loading equipment with a knuckle-jointed body to maximize maneuverability on construction locations. The loader usually is used with forks or loading bucket for loading and moving dirt.
Backhoe. An excavator whose shovel bucket is attached to a hinged boom and is drawn backward to move earth.
Barge. A floating vessel used for carrying heavy equipment or conducting operations in inland waters; usually pushed or pulled by a tug boat to and from a location.
Centrifuge. An item of solids-removal equipment that removes fine and ultra fine solids. It consists of a conical drum that rotates at 2000 to 4000 rpm and is useful for processing weighted drilling fluids and can remove finer solids than can shaker screens.
Closed-loop system. A solids control system including tanks which contains all of the drilling fluids and cuttings on location instead of an earthen reserve pit.
Compressor. A device that raises the pressure of a compressible fluid such as air or gas. Compressors create a pressure differential to move or compress a vapor or a gas.
Crew quarter. A skid-mounted accommodation which houses the drilling rig crew.
Cuttings. The fragments of rock dislodged by the bit and brought to the surface in the drilling fluids/mud. Washed and dried cuttings samples are analyzed by geologists to obtain information about the formations drilled.
Drill cuttings. See “Cuttings.”
Drilling efficiency. The efficiency at which the drill cuttings and other solids are removed from the drilling fluids stream; greater efficiency leads to greater rates-of-penetration of the drill bit, which reduces drilling time.
Drilling fluids. Any of a number of liquid and gaseous fluids and mixtures of fluids and solids (as solid suspensions, mixtures and emulsions of liquids, gases and solids) used in operations to drill boreholes into the earth. Synonymous with “drilling mud” in general usage.
Hydrocarbon. A naturally occurring organic compound comprising hydrogen and carbon. Hydrocarbons can be as simple as methane, but many are highly complex molecules, and can occur as gases, liquids or solids. Petroleum is a complex mixture of hydrocarbons. The most common hydrocarbons are natural gas, oil and coal.
Light plant. A generator with light extensions used to illuminate areas during night-time operations.
Manlift. Usually a 40’ or 60’ machine which has a boom and basket to lift personnel safely to various heights.
Mid-Continent region. The oil and gas producing area contained in Oklahoma, Arkansas, Kansas, Missouri, Nebraska, Iowa, North Dakota, South Dakota and Minnesota.
A-1
Table of Contents
Index to Financial Statements
Permian Basin. The oil and natural gas producing area largely contained in the western part of Texas extending westward into the southeastern part of new Mexico.
Pit closure. The backfill of an existing reserve pit.
Pit remediation. The restoration of the area where a reserve pit was located to pre-existing state.
Pit. Originally, an open hole dug in the ground to hold drilling fluid or waste materials discarded after the treatment of drilling mud/fluid. For some wellsite operations, pits are used for suction to the mud pumps, settling of mud sediments, and storage of reserve mud. Steel tanks are much more commonly used for these purposes now, but they are still usually referred to as pits.
Production facilities. Facilities constructed after the drilling of a successful well to handle the oil and gas that is produced; typically, these facilities consist of tank batteries for oil, condensate or residential saltwater production, firewall containment barriers, condensers, heaters, flow lines, pump jacks and other equipment as designed by production engineers to facilitate production of the particular well.
Rocky Mountain region. The region encompassing the states of Colorado, Utah, Wyoming, New Mexico and part of South Dakota.
Sewer systems. Temporary tanks and pumps used to store sewage from houses on the drill site.
Shale. A fine-grained, fissile, sedimentary rock formed by consolidation of clay- and silt-sized particles into thin, relatively impermeable layers.
Tight sands. A type of unconventional tight reservoir. Tight reservoirs are those which have low permeability, often quantified as less than 0.1 millidarcies.
A-2
Table of Contents
Index to Financial Statements
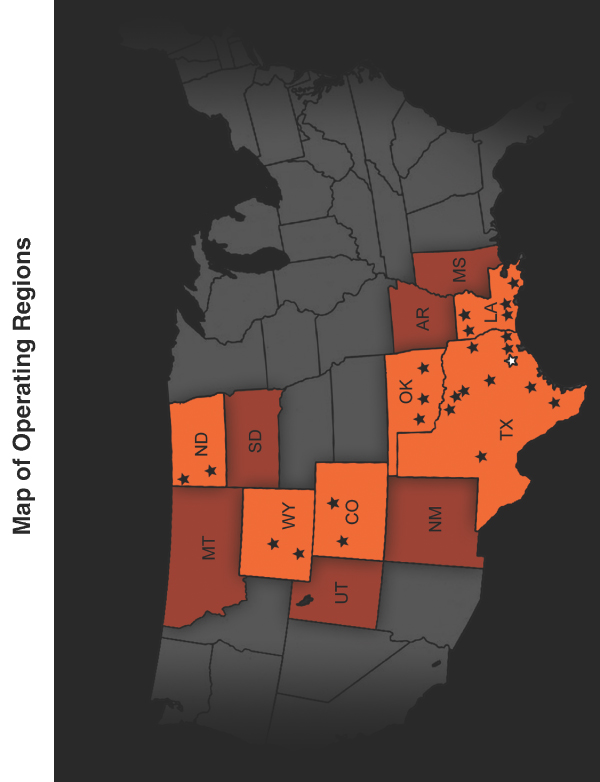
Table of Contents
Index to Financial Statements

Table of Contents
Index to Financial Statements
PART II
INFORMATION NOT REQUIRED IN PROSPECTUS
ITEM 13. Other Expenses of Issuance and Distribution
Set forth below are the expenses (other than underwriting discounts and commissions) expected to be incurred in connection with the issuance and distribution of the securities registered hereby. With the exception of the Securities and Exchange Commission registration fee, the NASD filing fee and The NASDAQ Stock Market LLC listing fee, the amounts set forth below are estimates:
Securities and Exchange Commission registration fee | $ | 12,280 | |
NASD filing fee | 40,500 | ||
The NASDAQ Stock Market LLC listing fee | |||
Printing and engraving expenses | |||
Legal fees and expenses | |||
Accounting fees and expenses | |||
Transfer agent and registrar fees | |||
Miscellaneous | |||
TOTAL | $ | ||
ITEM 14. Indemnification of Directors and Officers
Section 145 of the Delaware General Corporation Law (“DGCL”) provides that a corporation may indemnify any person who was or is a party or is threatened to be made a party to any threatened, pending or completed action, suit or proceeding whether civil, criminal, administrative or investigative (other than an action by or in the right of the corporation) by reason of the fact that he is or was a director, officer, employee or agent of the corporation, or is or was serving at the request of the corporation as a director, officer, employee or agent of another corporation, partnership, joint venture, trust or other enterprise, against expenses (including attorneys’ fees), judgments, fines and amounts paid in settlement actually and reasonably incurred by him in connection with such action, suit or proceeding if he acted in good faith and in a manner he reasonably believed to be in or not opposed to the best interests of the corporation, and, with respect to any criminal action or proceeding, had no reasonable cause to believe his conduct was unlawful. Section 145 further provides that a corporation similarly may indemnify any such person serving in any such capacity who was or is a party or is threatened to be made a party to any threatened, pending or completed action or suit by or in the right of the corporation to procure a judgment in its favor by reason of the fact that he is or was a director, officer, employee or agent of the corporation or is or was serving at the request of the corporation as a director, officer, employee or agent of another corporation, partnership, joint venture, trust or other enterprise, against expenses (including attorneys’ fees) actually and reasonably incurred in connection with the defense or settlement of such action or suit if he acted in good faith and in a manner he reasonably believed to be in or not opposed to the best interests of the corporation and except that no indemnification shall be made in respect of any claim, issue or matter as to which such person shall have been adjudged to be liable to the corporation unless and only to the extent that the Delaware Court of Chancery or such other court in which such action or suit was brought shall determine upon application that, despite the adjudication of liability but in view of all of the circumstances of the case, such person is fairly and reasonably entitled to indemnity for such expenses which the Delaware Court of Chancery or such other court shall deem proper. The Company’s certificate of incorporation and bylaws provide that indemnification shall be to the fullest extent permitted by the DGCL for all current or former directors or officers of the Company. As permitted by the DGCL, the certificate of incorporation provides that directors of the Company shall have no personal liability to the Company or its stockholders for monetary damages for breach of fiduciary duty as a director, except (1) for any breach of the director’s duty of loyalty to the Company or its stockholders, (2) for acts or omissions not in good faith or which involve intentional misconduct or knowing violation of law, (3) under Section 174 of the DGCL or (4) for any transaction from which a director derived an improper personal benefit.
II-1
Table of Contents
Index to Financial Statements
ITEM 15. Recent Sales of Unregistered Securities
The following is a description of all securities that the registrant has sold within the past three years without registering the securities under the Securities Act:
The transactions contemplated by the agreement and plan of merger will be completed immediately prior to the closing of this offering. In these transactions, holders of the limited partnership interests of our predecessor will receive an aggregate of shares of our common stock in exchange for their respective partnership interests. The registrant will rely on the provisions of Section 4(2) of the Securities Act in claiming exemption for the offering, sale and delivery of such securities from registration under the Securities Act.
ITEM 16. Exhibits and Financial Statement Schedules
a. Exhibits:
| 1.1+ | — | Form of Underwriting Agreement | ||
| 2.1* | — | Agreement and Plan of Merger of Stallion Oilfield Holding, Ltd. with and into Stallion Oilfield Services Inc. | ||
| 3.1+ | — | Restated Certificate of Incorporation | ||
| 3.2+ | — | Amended and Restated Bylaws | ||
| 4.1+ | — | Specimen Stock Certificate representing of common stock | ||
| 5.1+ | — | Opinion of Vinson & Elkins L.L.P. | ||
| 10.1+ | — | Registration Rights Agreement among Stallion Oilfield Holdings, Ltd., C/R Stallion Investment Partnership, L.P. and C/R Energy Coinvestment II, L.P. | ||
| 10.2+ | — | Nominating Agreement between Stallion Oilfield Holdings, Ltd. and C/R Stallion Investment Partnership, L.P. | ||
| 10.3+ | — | Form of Indemnification Agreement | ||
| 10.4+ | — | Stallion Oilfield Services 2007 Stock Incentive Plan | ||
| 10.5+ | — | Employment Agreement dated as of January 31, 2005 with Craig M. Johnson | ||
| 10.6+ | — | Employment Agreement dated as of January 31, 2005 with David S. Schorlemer | ||
| 10.7+ | — | Employment Agreement dated as of January 31, 2005 with Hill M. Dishman | ||
| 10.8+ | — | Second Amended and Restated Credit Agreement, dated as of January 24, 2007, among Stallion Oilfield Services Ltd., as borrower, Stallion Oilfield Holdings, Ltd., Stallion Interests, LLC and the other persons party thereto as guarantors, the lenders party thereto, UBS Securities LLC and Banc of America Securities LLC, as joint lead arrangers and joint bookmanagers, UBS AG, Stamford Brach, as issuing bank, administrative agent and collateral agent, UBS Loan Finance LLC, as swingline lender, Amegy Bank National Association, as syndication agent and Natexis Banques Populaires, as documentation agent. | ||
| 21.1+ | — | Subsidiaries of Stallion Oilfield Services, Inc. | ||
| 23.1* | — | Consent of UHY LLP | ||
| 23.2* | — | Consent of UHY Mann Frankfort Stein & Lipp CPAs, LLP | ||
| 23.3* | — | Consent of Wright, Moore, DeHart, Dupuis & Hutchinson, L.L.C. | ||
| 23.4+ | — | Consent of Vinson & Elkins L.L.P. (Contained in Exhibit 5.1) | ||
| 24.1 | — | Power of Attorney (included on signature page) |
| * | Filed herewith |
| + | To be filed by amendment. |
b. Financial Statement Schedules
ITEM 17. Undertakings
The undersigned Registrant hereby undertakes:
(a) Insofar as indemnification for liabilities arising under the Securities Act of 1933 may be permitted to directors, officers and controlling persons of the Registrant pursuant to the provisions described in Item 14, or otherwise, the Registrant has been advised that in the opinion of the Securities and Exchange Commission such
II-2
Table of Contents
Index to Financial Statements
indemnification is against public policy as expressed in the Act and is, therefore, unenforceable. In the event that a claim for indemnification against such liabilities (other than the payment by the Registrant of expenses incurred or paid by a director, officer or controlling person of the Registrant in the successful defense of any action, suit or proceeding) is asserted by such director, officer or controlling person in connection with the securities being registered, the Registrant will, unless in the opinion of its counsel the matter has been settled by controlling precedent, submit to a court of appropriate jurisdiction the question whether such indemnification by it is against public policy as expressed in the Act and will be governed by the final adjudication of such issue.
(b) To provide to the underwriter(s) at the closing specified in the underwriting agreements, certificates in such denominations and registered in such names as required by the underwriter(s) to permit prompt delivery to each purchaser.
(c) For purpose of determining any liability under the Securities Act of 1933, the information omitted from the form of prospectus filed as part of this Registration Statement in reliance upon Rule 430A and contained in the form of prospectus filed by the Registrant pursuant to Rule 424(b)(1) or (4) or 497(h) under the Securities Act shall be deemed to be part of this Registration Statement as of the time it was declared effective.
(d) For the purpose of determining any liability under the Securities Act of 1933, each post-effective amendment that contains a form of prospectus shall be deemed to be a new registration statement relating to the securities offered therein, and the offering of such securities at that time shall be deemed to be the initial bona fide offering thereof.
II-3
Table of Contents
Index to Financial Statements
SIGNATURES
Pursuant to the requirements of the Securities Act of 1933, as amended, the Registrant has duly caused this Registration Statement to be signed on its behalf by the undersigned, thereunto duly authorized, in the City of Houston, in the State of Texas on April 17, 2007.
| STALLION OILFIELD SERVICES, INC. | ||
| By: | /S/ CRAIG M. JOHNSON | |
| Craig M. Johnson | ||
| Chief Executive Officer | ||
KNOW ALL MEN BY THESE PRESENTS, that each person whose signature appears below constitutes and appoints Craig M. Johnson and David S. Schorlemer, and each of them severally, his true and lawful attorney or attorneys-in-fact and agents, with full power to act with or without the others and with full power of substitution and resubstitution, to execute in his name, place and stead, in any and all capacities, any or all amendments (including pre-effective and post-effective amendments) to this Registration Statement and any registration statement for the same offering filed pursuant to Rule 462 under the Securities Act of 1933, as amended, and to file the same, with all exhibits thereto, and other documents in connection therewith, with the Securities and Exchange Commission, granting unto said attorneys-in-fact and agents and each of them, full power and authority to do and perform in the name of and on behalf of the undersigned, in any and all capacities, each and every act and thing necessary or desirable to be done in and about the premises, to all intents and purposes and as fully as they might or could do in person, hereby ratifying, approving and confirming all that said attorneys-in-fact and agents or their substitutes may lawfully do or cause to be done by virtue hereof.
Pursuant to the requirements of the Securities Act of 1933, as amended, this registration statement has been signed below by the following persons in the capacities and on the dates indicated below.
Signature | Title | Date | ||
/S/ CRAIG M. JOHNSON Craig M. Johnson | President, Chief Executive Officer and Chairman of the Board (Principal Executive Officer) | April 17, 2007 | ||
/S/ DAVID S. SCHORLEMER David S. Schorlemer | Vice President, Chief Financial Officer and Director (Principal Financial Officer) | April 17, 2007 | ||
/S/ N. JOHN LANCASTER, JR. N. John Lancaster, Jr. | Director | April 17, 2007 | ||
/S/ PIERRE F. LAPEYRE, JR. Pierre F. Lapeyre, Jr. | Director | April 17, 2007 | ||
/S/ JENNIFER F. GUIDRY Jennifer F. Guidry | Chief Accounting Officer, Treasurer and Assistant Secretary (Principal Accounting Officer) | April 17, 2007 | ||
II-4
Table of Contents
Index to Financial Statements
EXHIBIT INDEX
| 1.1+ | — | Form of Underwriting Agreement | ||
| 2.1* | — | Agreement and Plan of Merger of Stallion Oilfield Holding, Ltd. with and into Stallion Oilfield Services, Inc. | ||
| 3.1+ | — | Restated Certificate of Incorporation | ||
| 3.2+ | — | Amended and Restated Bylaws | ||
| 4.1+ | — | Specimen Stock Certificate representing of common stock | ||
| 5.1+ | — | Opinion of Vinson & Elkins L.L.P. | ||
| 10.1+ | — | Registration Rights Agreement among Stallion Oilfield Holdings, Ltd., C/R Stallion Investment Partnership, L.P. and C/R Energy Coinvestment II, L.P. | ||
| 10.2+ | — | Nominating Agreement between Stallion Oilfield Holdings, Ltd. and C/R Stallion Investment Partnership, L.P. | ||
| 10.3+ | — | Form of Indemnification Agreement | ||
| 10.4+ | — | Stallion Oilfield Services 2007 Stock Incentive Plan | ||
| 10.5+ | — | Employment Agreement dated as of January 31, 2005 with Craig M. Johnson | ||
| 10.6+ | — | Employment Agreement dated as of January 31, 2005 with David S. Schorlemer | ||
| 10.7+ | — | Employment Agreement dated as of January 31, 2005 with Hill M. Dishman | ||
| 10.8+ | — | Second Amended and Restated Credit Agreement, dated as of January 24, 2007, among Stallion Oilfield Services Ltd., as borrower, Stallion Oilfield Holdings, Ltd., Stallion Interests, LLC and the other persons party thereto as guarantors, the lenders party thereto, UBS Securities LLC and Banc of America Securities LLC, as joint lead arrangers and joint bookmanagers, UBS AG, Stamford Brach, as issuing bank, administrative agent and collateral agent, UBS Loan Finance LLC, as swingline lender, Amegy Bank National Association, as syndication agent and Natexis Banques Populaires, as documentation agent. | ||
| 21.1+ | — | Subsidiaries of Stallion Oilfield Services | ||
| 23.1* | — | Consent of UHY LLP | ||
| 23.2* | — | Consent of UHY Mann Frankfort Stein & Lipp CPAs, LLP | ||
| 23.3* | — | Consent of Wright, Moore, DeHart, Dupuis & Hutchinson, L.L.C. | ||
| 23.4+ | — | Consent of Vinson & Elkins L.L.P. (Contained in Exhibit 5.1) | ||
| 24.1 | — | Power of Attorney (included on signature page) |
| * | Filed herewith |
| + | To be filed by amendment. |
II-5