
Annual Meeting March 24, 2016 Exhibit 99.1
Cautionary Note Regarding Forward Looking Statements This presentation includes forward-looking statements about the financial condition, results of operations and business of Citizens Community Bancorp, Inc. and its wholly owned subsidiary, Citizens Community Federal N.A. Forward-looking statements can be identified by the fact that they do not relate strictly to historical or current facts. These statements may be identified by the use of forward-looking words or phrases such as “anticipate,” “believe,” “could,” “expect,” “intend,” “may,” “planned,” “potential,” “should,” “will,” “would” or the negative of those terms or other words of similar meaning. These forward- looking statements are intended to be covered by the safe-harbor provisions of the Private Securities Litigation Reform Act of 1995. Such forward-looking statements in this presentation are inherently subject to many uncertainties in our operations and business environment. These uncertainties include general economic conditions, in particular, relating to consumer demand for our products and services; our ability to maintain current deposit and loan levels at current interest rates; deteriorating credit quality, including changes in the interest-rate environment reducing interest margins; prepayment speeds, loan origination and sale volumes, charge-offs and loan loss provisions; and other matters described in the Company's SEC filings, including under the section "Risk Factors" in Item 1A of the Company's Form 10-K Report for the fiscal year ending September 30, 2015. Shareholders, potential investors and other readers are urged to consider these factors carefully in evaluating the forward- looking statements and are cautioned not to place undue reliance on such forward-looking statements. The forward-looking statements made herein are only made as of the date of this presentation and we undertake no obligation to publicly update such forward-looking statements to reflect subsequent events or circumstances occurring after the date of this presentation.
Overview • Based in Eau Claire County, Wisconsin, Citizens Community Federal N.A. serves more than 50,000 customers in Wisconsin, Minnesota and Michigan. • 16 branches, including 8 locations in Walmart supercenters. • Key markets include: • Eau Claire/Rice Lake, Wisconsin MSA • Fox Valley, Wisconsin MSA • Mankato, Minnesota MSA • Minneapolis/St. Paul, Metro MSA • Oakland County, Michigan MSA • Full-service retail and commercial banking.
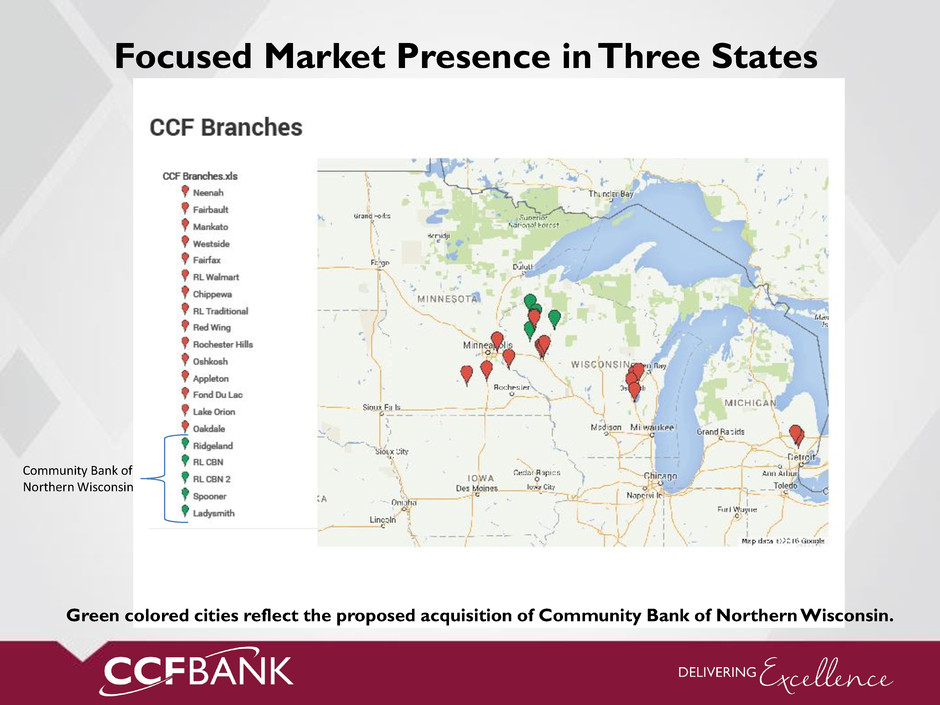
Focused Market Presence in Three States Green colored cities reflect the proposed acquisition of Community Bank of Northern Wisconsin. Community Bank of Northern Wisconsin
Aligning Our Company for Growth • Building our core business through product enhancement and efficiency improvements: • Treasury Management • Government Lending and Deposit Products • Mobile Banking Products • Enhanced On-Line Banking Products • Trim unproductive assets, “rightsizing” our branch network: • Six Walmart locations
Aligning Our Company for Growth • Maintain balance sheet strength through high quality credit and underwriting standards. • Expand our presence in attractive growth markets: • Mankato • Chippewa Falls • Central Bank branch acquisition – Rice Lake/Barron • Pending Acquisition of Community Bank of Northern Wisconsin – • Rice Lake and Surrounding Communities
Improving Financial Trends • Net income • Interest income • Non-interest income • Loan and deposit expansion • Credit quality • Capital strength
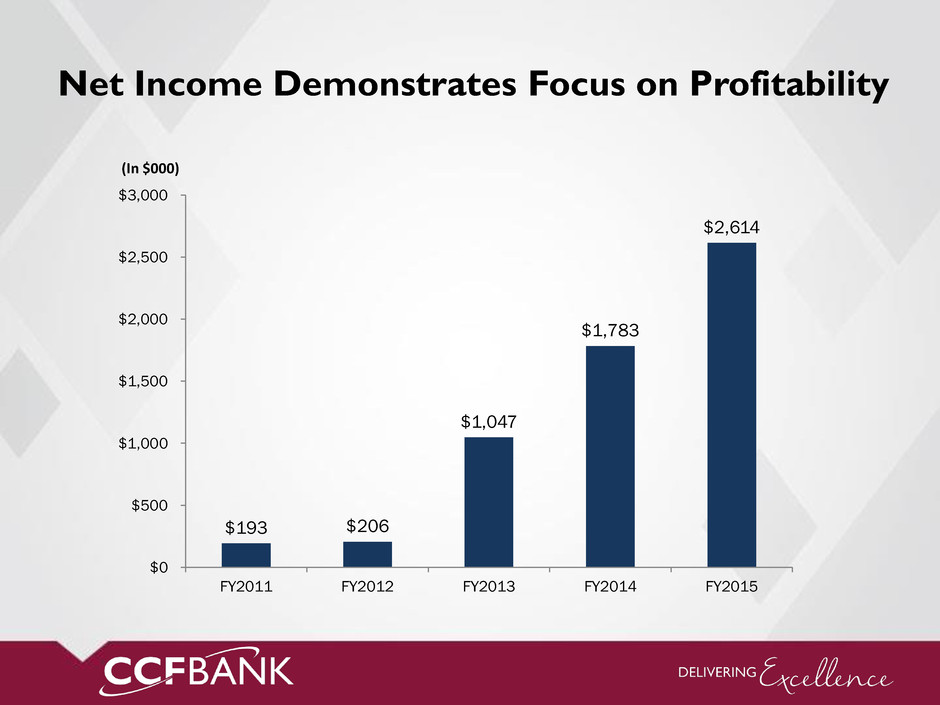
Net Income Demonstrates Focus on Profitability $193 $206 $1,047 $1,783 $2,614 $0 $500 $1,000 $1,500 $2,000 $2,500 $3,000 FY2011 FY2012 FY2013 FY2014 FY2015 (In $000)

$14,987 $16,054 $16,120 $17,848 $17,910 $13,000 $14,000 $15,000 $16,000 $17,000 $18,000 FY2011 FY2012 FY2013 FY2014 FY2015 (In $000) Net Interest Income After Provision
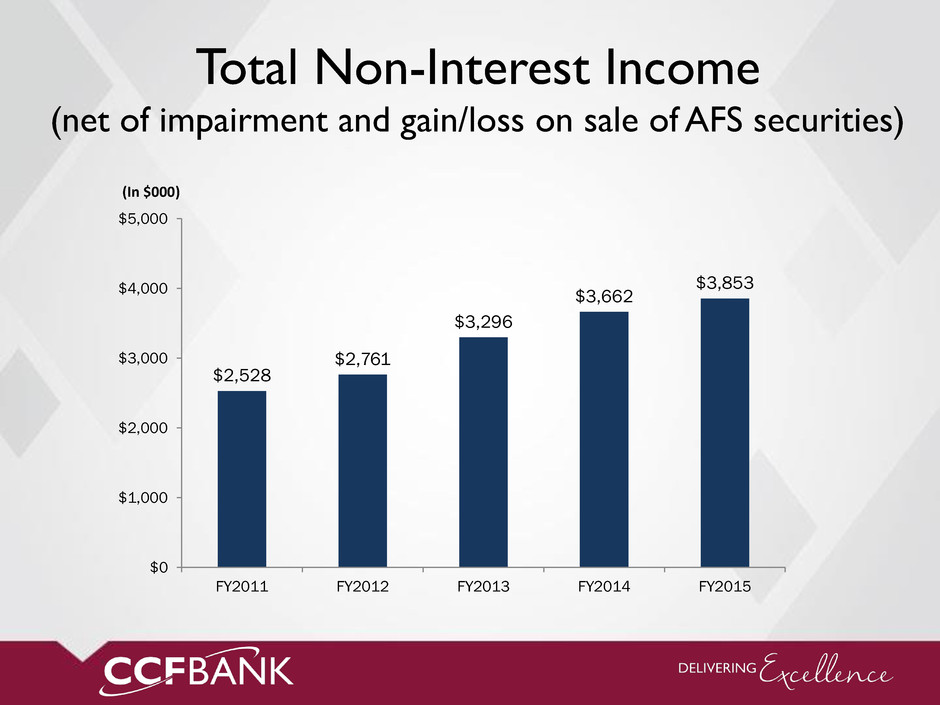
Total Non-Interest Income (net of impairment and gain/loss on sale of AFS securities) $2,528 $2,761 $3,296 $3,662 $3,853 $0 $1,000 $2,000 $3,000 $4,000 $5,000 FY2011 FY2012 FY2013 FY2014 FY2015 (In $000)

Cost of Funds / Net Interest Margin 3.77% 3.94% 3.62% 3.61% 3.36% 1.72% 1.39% 1.10% 0.85% 0.91% 0.50% 1.50% 2.50% 3.50% 4.50% FY2011 FY2012 FY2013 FY2014 FY2015 Net Interest Margin Cost of Funds
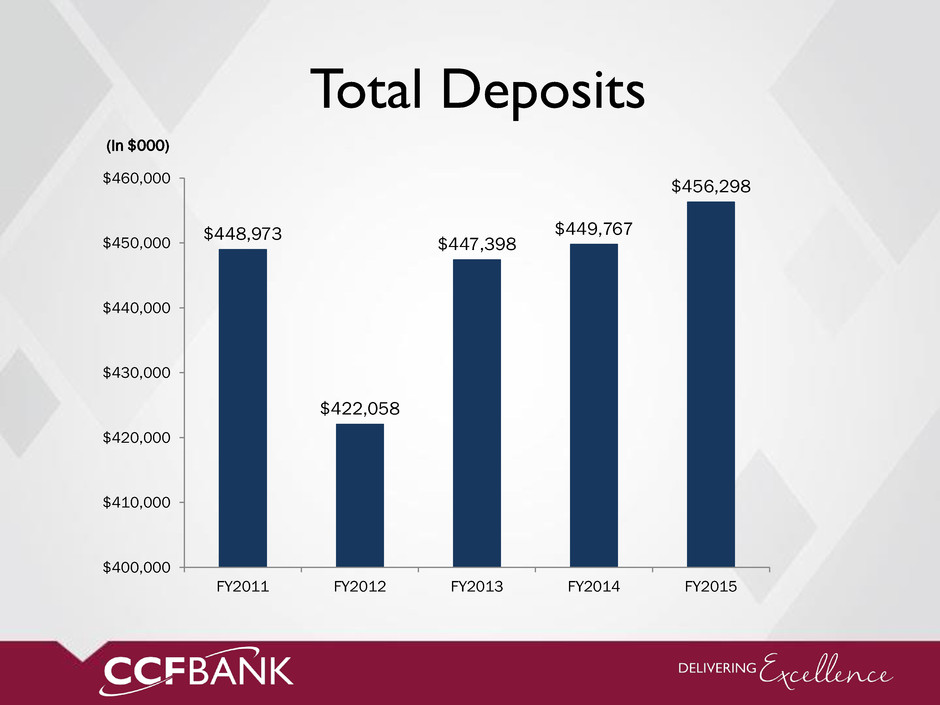
Total Deposits $448,973 $422,058 $447,398 $449,767 $456,298 $400,000 $410,000 $420,000 $430,000 $440,000 $450,000 $460,000 FY2011 FY2012 FY2013 FY2014 FY2015 (In $000)
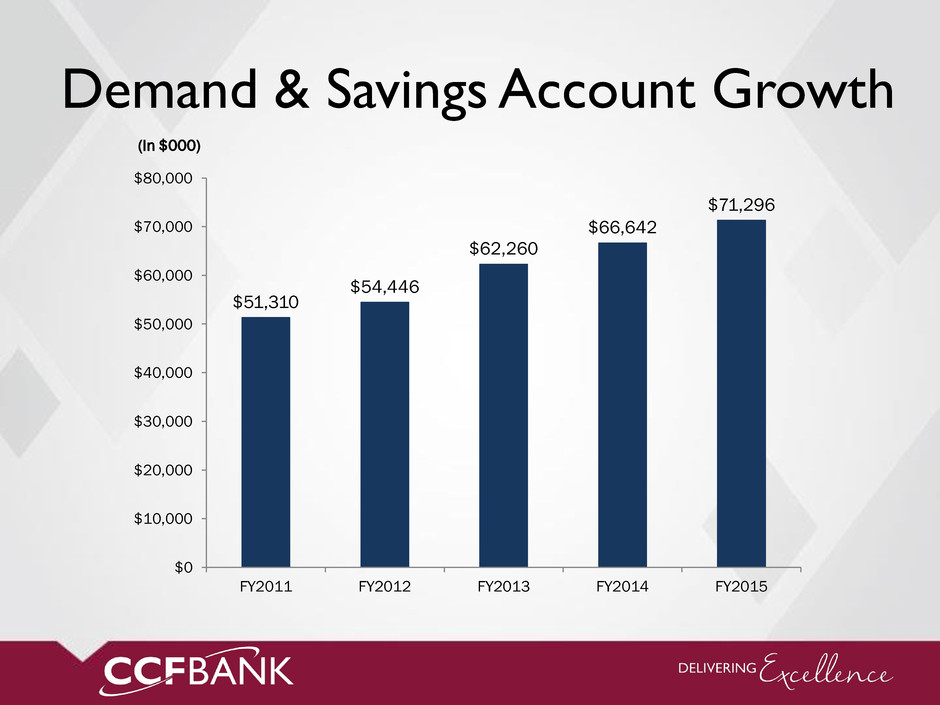
Demand & Savings Account Growth $51,310 $54,446 $62,260 $66,642 $71,296 $0 $10,000 $20,000 $30,000 $40,000 $50,000 $60,000 $70,000 $80,000 FY2011 FY2012 FY2013 FY2014 FY2015 (In $000)
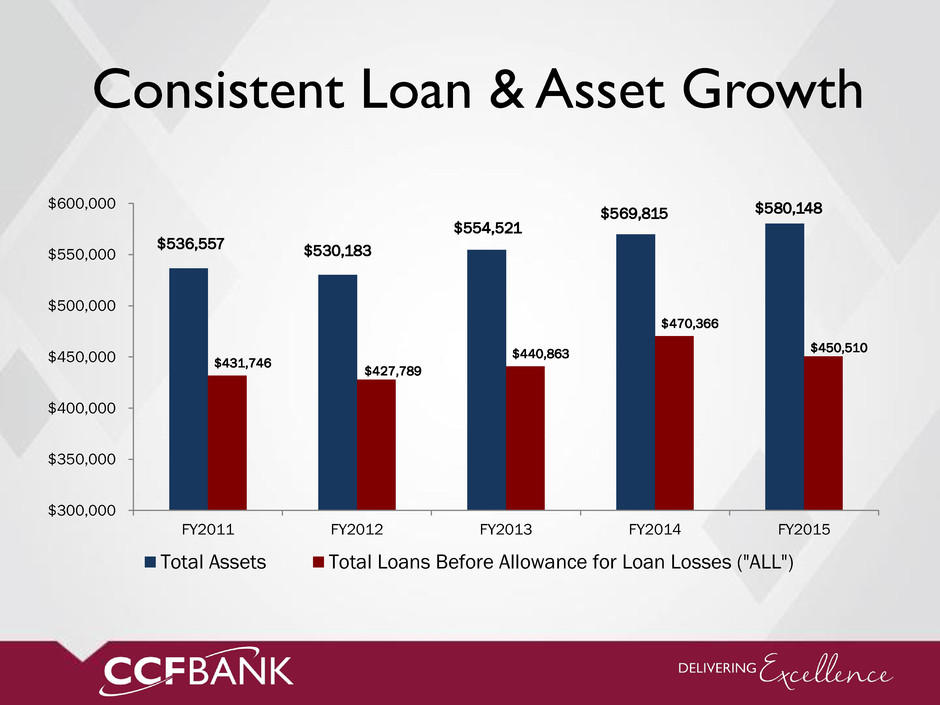
Consistent Loan & Asset Growth $536,557 $530,183 $554,521 $569,815 $580,148 $431,746 $427,789 $440,863 $470,366 $450,510 $300,000 $350,000 $400,000 $450,000 $500,000 $550,000 $600,000 FY2011 FY2012 FY2013 FY2014 FY2015 Total Assets Total Loans Before Allowance for Loan Losses ("ALL")
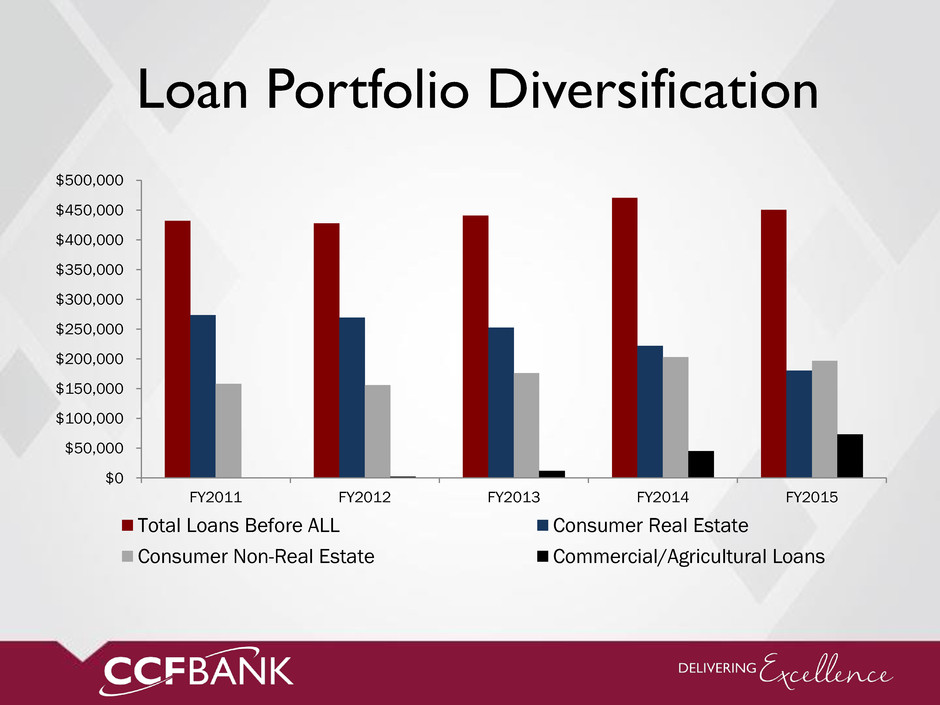
Loan Portfolio Diversification $0 $50,000 $100,000 $150,000 $200,000 $250,000 $300,000 $350,000 $400,000 $450,000 $500,000 FY2011 FY2012 FY2013 FY2014 FY2015 Total Loans Before ALL Consumer Real Estate Consumer Non-Real Estate Commercial/Agricultural Loans
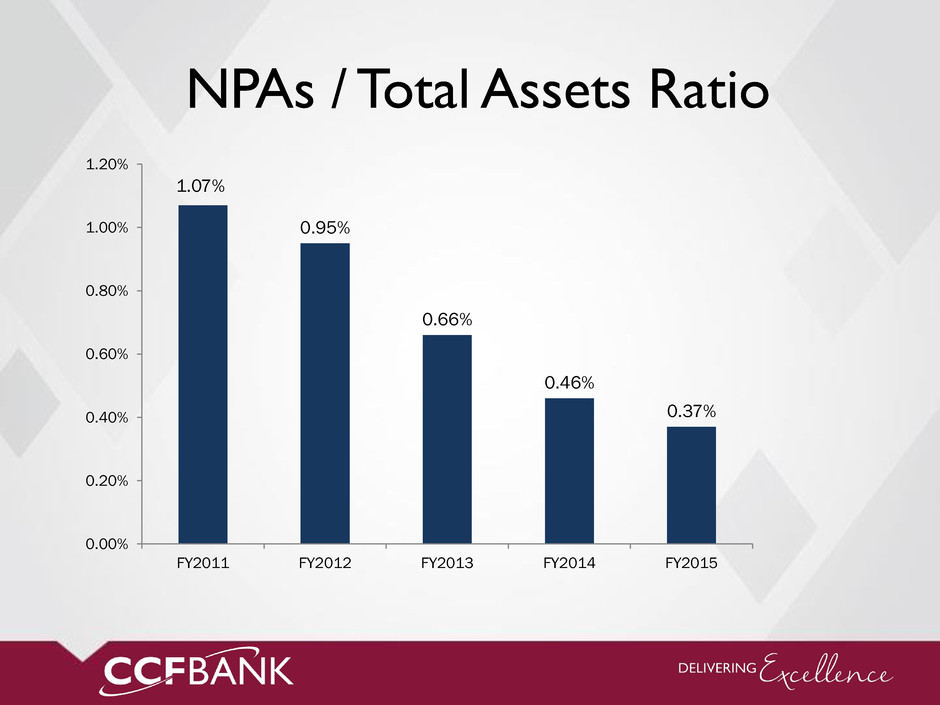
NPAs / Total Assets Ratio 1.07% 0.95% 0.66% 0.46% 0.37% 0.00% 0.20% 0.40% 0.60% 0.80% 1.00% 1.20% FY2011 FY2012 FY2013 FY2014 FY2015
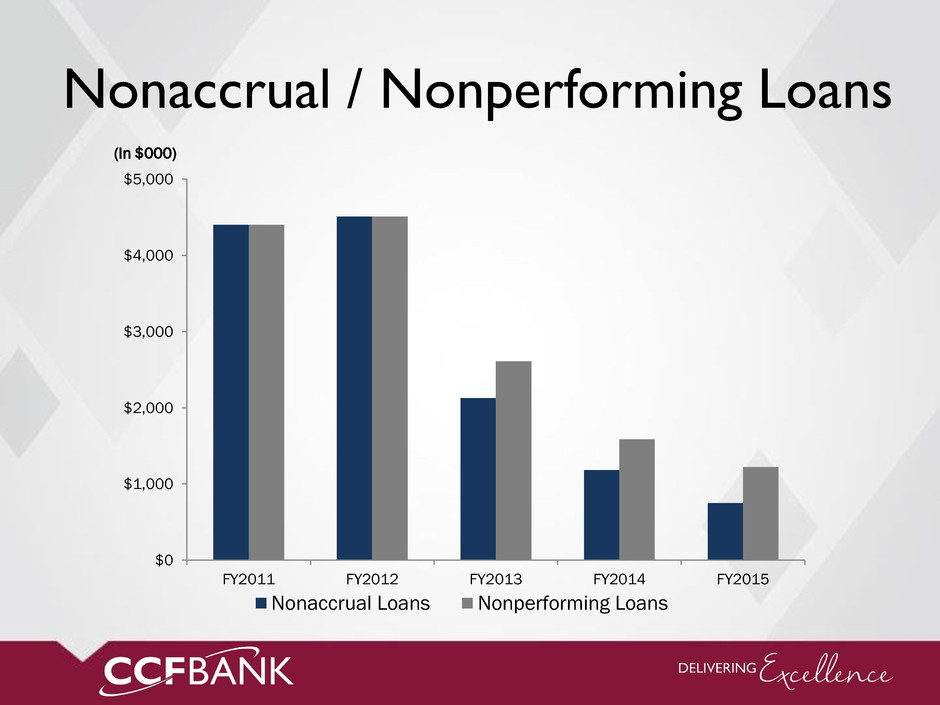
Nonaccrual / Nonperforming Loans $0 $1,000 $2,000 $3,000 $4,000 $5,000 FY2011 FY2012 FY2013 FY2014 FY2015 (In $000) Nonaccrual Loans Nonperforming Loans
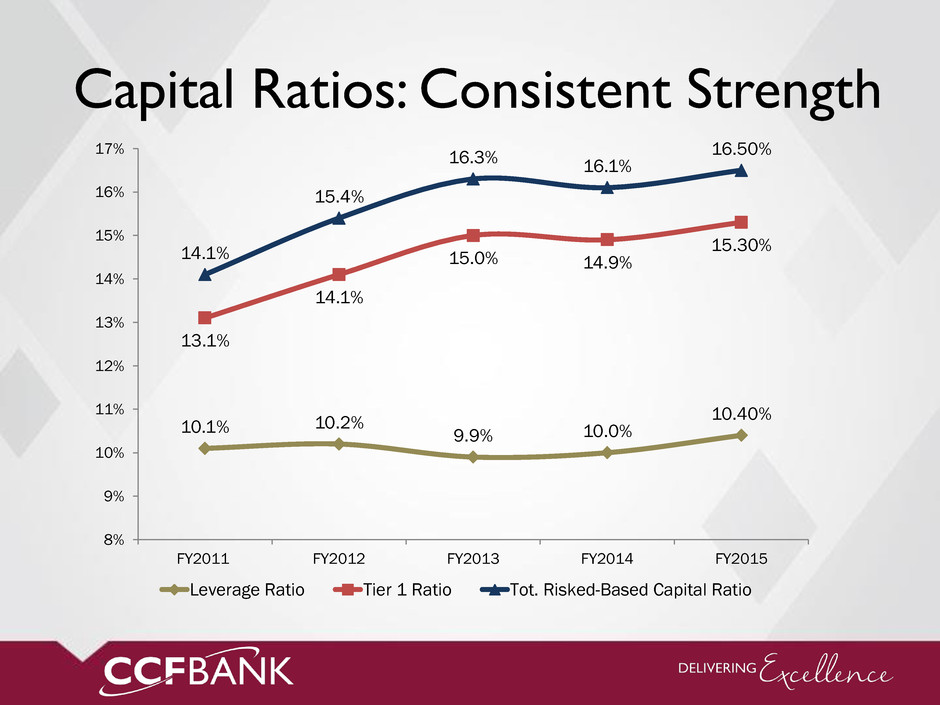
Capital Ratios: Consistent Strength 10.1% 10.2% 9.9% 10.0% 10.40% 13.1% 14.1% 15.0% 14.9% 15.30% 14.1% 15.4% 16.3% 16.1% 16.50% 8% 9% 10% 11% 12% 13% 14% 15% 16% 17% FY2011 FY2012 FY2013 FY2014 FY2015 Leverage Ratio Tier 1 Ratio Tot. Risked-Based Capital Ratio
Delivering and Building Shareholder Value • Consistent tangible book value • Stock price closing the gap • Market and investor recognition • Investment appeals • Looking ahead: growth opportunities
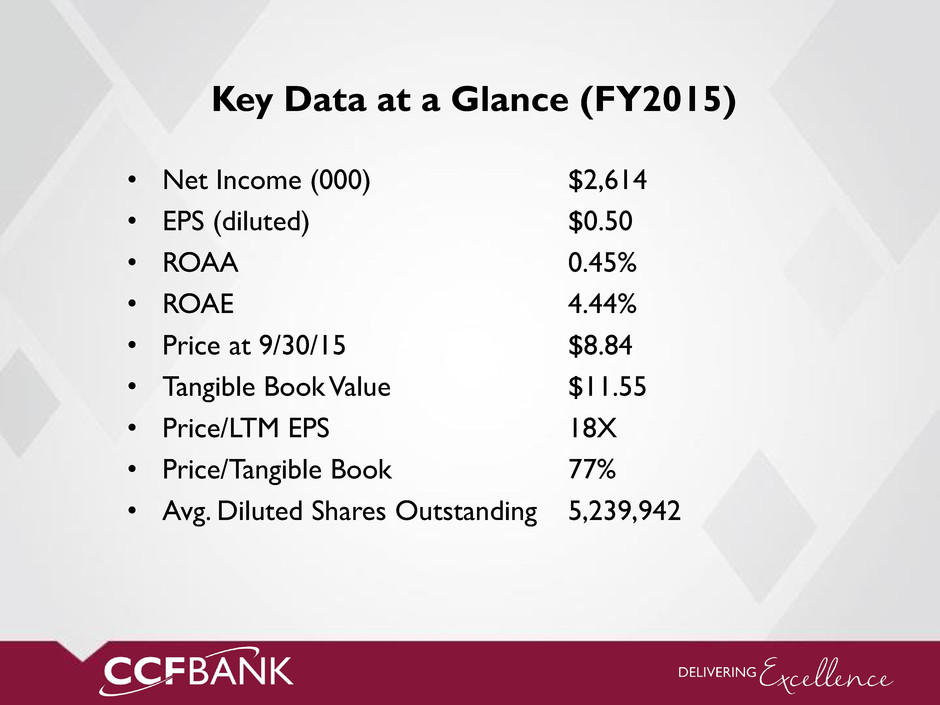
Key Data at a Glance (FY2015) • Net Income (000) $2,614 • EPS (diluted) $0.50 • ROAA 0.45% • ROAE 4.44% • Price at 9/30/15 $8.84 • Tangible Book Value $11.55 • Price/LTM EPS 18X • Price/Tangible Book 77% • Avg. Diluted Shares Outstanding 5,239,942

Below-Book Value Investing Opportunity Remains; Stock Price Closing the Gap to Tangible Book Value $4.43 $5.00 $5.90 $7.25 $8.85 $8.84 $9.75 $10.30 $10.73 $10.51 $11.09 $11.55 $0.00 $3.00 $6.00 $9.00 $12.00 FY2010 FY2011 FY2012 FY2013 FY2014 FY2015 Year End Price Reported Tangible Book Value/Share Price/ TBV 48.5% Price/ TBV 55.0% Price/ TBV 69.0% Price/ TBV 76.5% Price/ TBV 79.8% Price/ TBV 45.4%
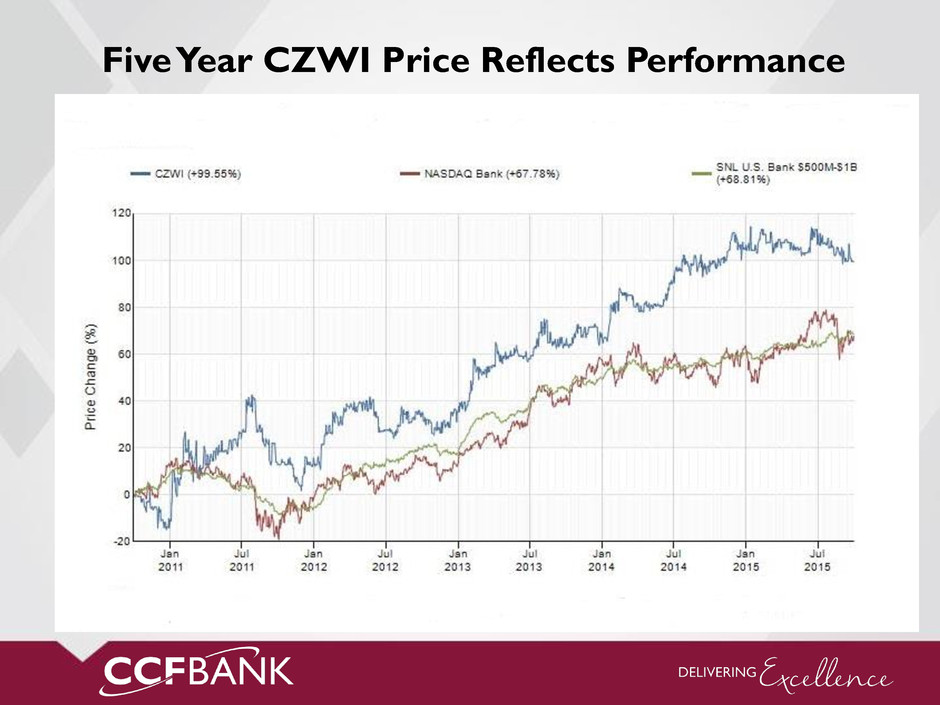
Five Year CZWI Price Reflects Performance
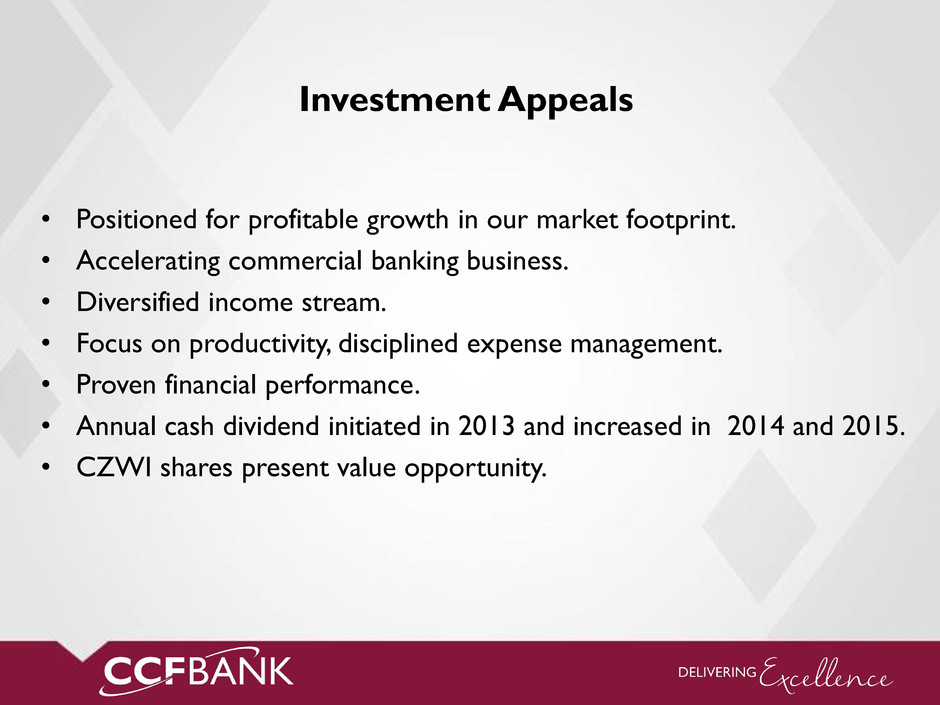
Investment Appeals • Positioned for profitable growth in our market footprint. • Accelerating commercial banking business. • Diversified income stream. • Focus on productivity, disciplined expense management. • Proven financial performance. • Annual cash dividend initiated in 2013 and increased in 2014 and 2015. • CZWI shares present value opportunity.
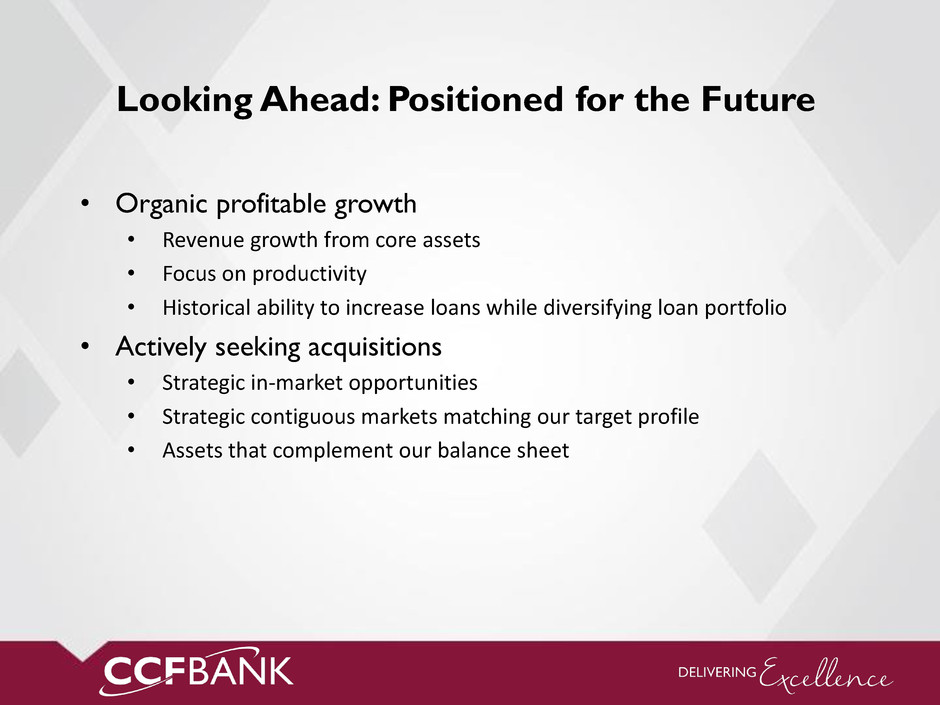
Looking Ahead: Positioned for the Future • Organic profitable growth • Revenue growth from core assets • Focus on productivity • Historical ability to increase loans while diversifying loan portfolio • Actively seeking acquisitions • Strategic in-market opportunities • Strategic contiguous markets matching our target profile • Assets that complement our balance sheet
Community Bank of Northern Wisconsin Pending Acquisition HIGHLIGHTS • Meets goals of Strategic Plan of in-market and contiguous market acquisitions. • Expands our commercial / agriculture business as well as our residential and consumer banking businesses. • Expands our depository footprint in northwestern Wisconsin. • Improves the Bank’s interest rate risk profile.
Community Bank of Northern Wisconsin FINANCIAL HIGHLIGHTS • No book dilution, with a 3.5 year payback. • Projected Internal Rate of Return (IRR) of 11.46%. • Cost of funds decrease from 86 bps to 83 bps. • Estimated earnings per share growth of 25 cents, a 50% increase from fiscal 2015. • Interest rate risk improves with economic value of equity (EVE): • In an up 100+ point scenario, improves from 12% to 11%. • In an up 200+ point scenario, improves from 30% to 26%. • In an up 300+ point scenario, improves from 53% to 46%.

Questions ?


