UNITED STATES
SECURITIES AND EXCHANGE COMMISSION
WASHINGTON, D.C. 20549
FORM 20-F
| ¨ | REGISTRATION STATEMENT PURSUANT TO SECTION 12(b) or (g) OF THE SECURITIES EXCHANGE ACT OF 1934 |
OR
| x | ANNUAL REPORT PURSUANT TO SECTION 13 OR 15(d) OF THE SECURITIES EXCHANGE ACT OF 1934 |
For the fiscal year ended: 31 December 2014
OR
| ¨ | TRANSITION REPORT PURSUANT TO SECTION 13 OR 15(d) OF THE SECURITIES EXCHANGE ACT OF 1934 |
OR
| ¨ | SHELL COMPANY REPORT PURSUANT TO SECTION 13 OR 15(d) OF THE SECURITIES EXCHANGE ACT OF 1934 |
Date of event requiring this shell company report
For the transition period from to
Commission file number 001-35265
CSR plc
(Exact name of Registrant as specified in its charter)
ENGLAND
(Jurisdiction of incorporation or organization)
Churchill House, Cambridge Business Park, Cowley Road, Cambridge, CB4 0WZ, England,
Tel: +44 (0) 1223 692 000
(Address of principal executive offices)
Adam R. Dolinko, General Counsel – Tel: +44 (0) 1223 692 000, Fax: +44 (0) 1223 692 001
Churchill House, Cambridge Business Park, Cowley Road, Cambridge CB4 0WZ, England
(Name, Telephone, E-mail and/or Facsimile number and Address of Company Contact Person)
Securities registered or to be registered pursuant to Section 12(b) of the Act:
| | |
Title of Each Class | | Name of Each Exchange on which Registered |
| Ordinary shares, par value £0.001 per share | | NASDAQ Global Select Market* |
* Listed, not for trading, but only in connection with the registration of the American Depositary Shares, each representing four (4) ordinary shares.
Securities registered or to be registered pursuant to Section 12(g) of the Act:None
Securities for which there is a reporting obligation pursuant to Section 15(d) of the Act:None
Indicate the number of outstanding shares of each of the issuer’s classes of capital or common stock as of the close of the period covered by the annual report.
| | |
| Ordinary Shares, par value £0.001 | | 187,494,513 |
Indicate by check mark if the registrant is a well-known seasoned issuer, as defined in Rule 405 of the Securities Act. Yesx No¨
If this report is an annual or transition report, indicate by check mark if the registrant is not required to file reports pursuant to Section 13 or 15(d) of the Securities Exchange Act of 1934. Yes ¨ Nox
Indicate by check mark whether the Registrant (1) has filed all reports required to be filed by Section 13 or 15(d) of the Securities Exchange Act of 1934 during the preceding 12 months (or for such shorter period that the Registrant was required to file such reports), and (2) has been subject to such filing requirements for the past 90 days. Yesx No¨
Indicate by check mark whether the registrant has submitted electronically and posted on its corporate Web site, if any, every Interactive Data File required to be submitted and posted pursuant to Rule 405 of Regulation S-T (§232.405 of this chapter) during the preceding 12 months (or for such shorter period that the registrant was required to submit and post such files). Yes¨ No¨
Indicate by check mark whether the registrant is a large accelerated filer, an accelerated filer, or a non-accelerated filer. See definition of “accelerated filer and large accelerated filer” in Rule 12b-2 of the Exchange Act. (Check one):
| | | | |
| Large accelerated filer x | | Accelerated filer ¨ | | Non-accelerated filer ¨ |
Indicate by check mark which basis of accounting the registrant has used to prepare the financial statements included in this filing:
| | | | |
| U.S. GAAP ¨ | | International Financial Reporting Standards as issued by the International Accounting Standards Board x | | Other ¨ |
If “Other” has been checked in response to the previous question, indicate by check mark which financial statement item the registrant has elected to follow. Item 17¨ Item 18 ¨
If this is an annual report, indicate by check mark whether the registrant is a shell company (as defined in Rule 12b-2 of the Exchange Act). Yes¨ Nox
(APPLICABLE ONLY TO ISSUERS INVOLVED IN BANKRUPTCY PROCEEDINGS DURING THE PAST FIVE YEARS.)
Indicate by check mark whether the registrant has filed all documents and reports required to be filed by Sections 12, 13 or 15(d) of the Securities Exchange Act of 1934 subsequent to the distribution of securities under a plan confirmed by a court. Yes¨ No¨

CSR annual report
| | | | |
| | who we are | | |
| | | We are a leading provider of multifunction semiconductor platforms and technologies for the Auto, Consumer and Voice & Music markets. | | |
| | what we do Page 2 | | |
| | | Our business structure and key facts for 2014 | | |
| | how we’re doing Page4 | | |
| | | Our performance for the year | | |
| | where we operate Page5 | | |
| | | Our office locations worldwide | | |
| | our five strategic areas of focus Page9 | | |
| | | Our strategy to focus on five end markets with our platforms | | |
| | our platform positions Page11 | | |
| | | Our aim is to develop higher margin platforms | | |
| | our technologies Page13 | | |
| | | Our aim is to use our technologies to deliver integrated and differentiated platforms | | |
| | our performancePage 14 | | |
| | | Our progress in our platforms during 2014 | | |
CSR at a glance
| | | | |
what we do | | | | Auto |
CSR has two business groups: Core comprises Auto, Consumer and Voice & Music, and is the area of the business to which we commit research & development resources. In recent years, as part of our strategic transformation towards platforms, non-Core business from discontinued home entertainment and handset business lines has formed our Legacy business. | | | | 
|
| | | Auto comprises: Automotive Infotainment and Portable Navigation Devices (‘PND’). 2014 saw revenue in Auto decrease to $201.0 million from $228.8 million in 2013. We saw increasing demand from Tier One customers for our factory-fit connectivity products and systems-on-a-chip (‘SoC’), while we saw weakness in our PND and aftermarket business. |
| | | | |
| | | | Key facts |
| | | | — Good growth in autograde Wi-Fi®. |
| | | | — Our aptX® audio codec adopted by Alps and Clarion for deployment in automobiles. |
| | | | — Continued revenue growth in Auto factory-fit business and good interest in new generation Auto SoC. — The majority of our revenue is now derived from factory-fit customers. |
| | | | |
| | | | | | |
| | | | | | | $201.0m Revenue |
For more on our products visit: www.csr.com/products | | | | | |
| | | | | |
| | | | | | |
To find out more from our CEO: See page 8 | | | | | | 26% of revenue |
| | | | | |
To see our Strategic report: See page 8 | | | | | |
| | |
| 2 | | CSR plc Annual Report and Financial Statements 2014 |
| | | | | | | | |
Consumer | | | | Voice & Music | | | | Legacy |
 | | | |  | | | |  |
Consumer comprises: Bluetooth Smart, Cameras, Document Imaging, Gaming, Indoor Location and Other Consumer. The year has seen a decline in Consumer revenue from $181.5 million in 2013 to $155.4 million in 2014. We have continued to see weakness in Cameras as people switch to next generation technologies of alternative suppliers. Gaming revenue has remained under pressure due to weakness in some areas of the console market and declining revenues from a single customer. We have seen strong growth in Bluetooth Smart, albeit from a small base. | | | | Voice & Music comprises: Mono headsets and stereo products for wireless audio streaming. We saw revenue in Voice & Music increase to $346.6 million from $312.0 million in 2013. We continue to see growth for streaming audio via Bluetooth, with a strong pipeline of product releases for devices such as wireless headphones, soundboxes and soundbars. Our aptX audio codec had a good year for signing new licences. The proliferation of applications for our leading audio solutions continues, for example with Wi-Fi wireless connectivity for home-based entertainment systems. | | | | Digital television, set-top box, tuners and digital video disk product lines which were acquired at the time of the acquisition of Zoran Corporation, a provider of image and video technology in 2011, in addition to the handset connectivity and handset location business lines we retained following the transaction with Samsung Electronics Co., Ltd. (‘Samsung’) which completed in 2012. |
| | | | | | | | |
| Key facts | | | | Key facts | | | | Key facts |
— In February 2014 we introduced CSRmesh®, which enables almost unlimited Bluetooth Smart devices to be networked together. — Our Bluetooth® and Bluetooth Smart solutions are gaining traction in the home entertainment ecosystem. — We are making good progress with the commercial development of our indoor location platform. | | | | — Our VibeHub™ platform, which allows device manufacturers to deliver multi-room audio over Wi-Fi, generated its first revenue in 2014. — aptX added more than 80 licensees and was featured in around 180 new products during 2014. — CSR acquired capabilities in internet radio services enabling multi-streaming to internet enabled devices. | | | | — We expect Legacy revenue in 2015 to be minimal as products reach end-of-life. |
| | | | | | | | |
$155.4m | | | | $346.6m | | | | $71.8m |
Revenue | | | | Revenue | | | | Revenue |
20% | | | | 45% | | | | 9% |
of revenue | | | | of revenue | | | | of revenue |
CSR at a glance
| | | | |
| | our performance for the year | | |
| | Our goal is to deliver growing shareholder returns by generating revenue growth and increasing profitability. We seek to do this by focusing our investment on markets that are fast growing and where we aim to deliver differentiated platforms with a leading market position. | | |
| | | | | | | | | | | | | | | | | | |
| | | | | | | | | | | | | | | | | | |
| | Revenue | | | | | | Gross margin | | | | | | Underlying gross margin | | | | |
| | 2014 | | | | | | 2014 | | | | | | 2014 | | | | |
| | $774.8m | | | | | | 58.1% | | | | | | 58.5% | | | | |
| | 2013 | | | | | | 2013 | | | | | | 2013 | | | | |
| | $960.7m | | | | | | 51.6% | | | | | | 52.4% | | | | |
| | | | | | | | | | | | | | | | | | |
| | Core revenue | | | | | | Operating profit (loss) | | | | | | Underlying operating profit | | | | |
| | 2014 | | | | | | 2014 | | | | | | 2014 | | | | |
| | $703.0m | | | | | | $97.0m | | | | | | $109.9m | | | | |
| | 2013 | | | | | | 2013 | | | | | | 2013 | | | | |
| | $722.3m | | | | | | $(48.4)m | | | | | | $104.3m | | | | |
| | | | | | | | | | | | | | | | | | |
| | Cash, cash equivalents and treasury deposits | | | | | | Diluted earnings (loss) per share | | | | | | Underlying diluted earnings per share | | | | |
| | 2014 | | | | | | 2014 | | | | | | 2014 | | | | |
| | $283.2m | | | | | | $0.55 | | | | | | $0.51 | | | | |
| | 2013 | | | | | | 2013 | | | | | | 2013 | | | | |
| | $306.2m | | | | | | $(0.28) | | | | | | $0.46 | | | | |
| | | | | | | | | | | | | | | | | | |
| | | | | | | | | | | | | | | | | | |
| | | | | | | | | | | | | | | | | | |
| | | | | | | | | | | | | | | | | | |
| | | | | | | | | | | | | | | | | | |
| | | | | | | | | | | | | | | | | | |
| | | | | | | | | | | | | | | | | | |
| | |
| 4 | | CSR plc Annual Report and Financial Statements 2014 |
| | | | |
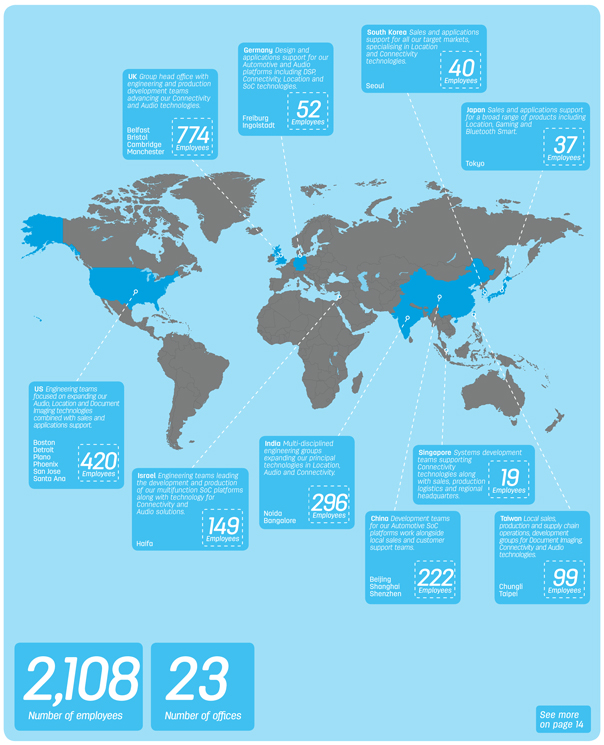
| | where we operate | | |
| | We have offices in 10 countries worldwide in order to support our global business. | | |
| | | | |
Chairman’s statement
| | | | |
 | | Our goal is to deliver growing shareholder returns by generating revenue growth and increasing profitability. Ron Mackintosh,Chairman | | |
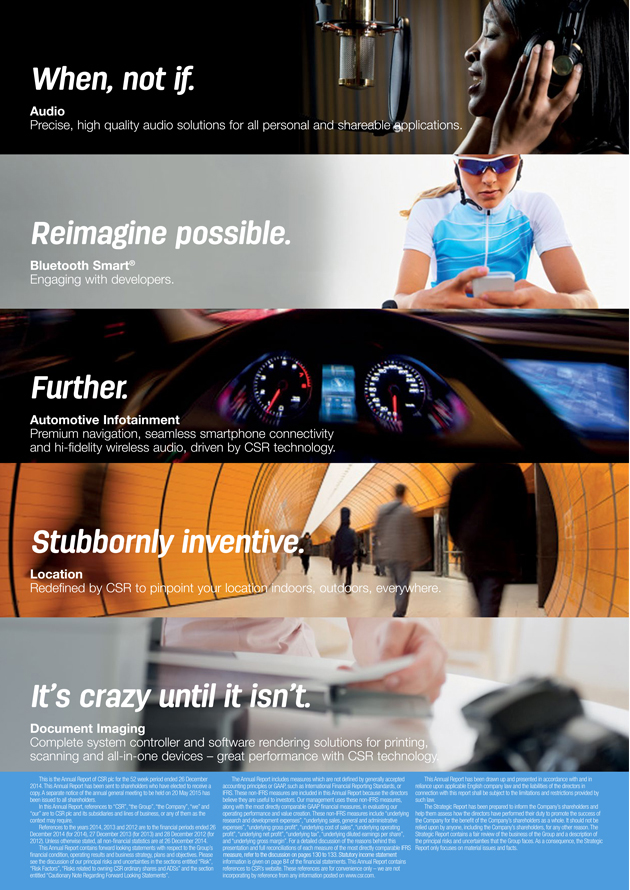
CSR is an innovator in the development of multifunction semiconductor platforms across five strategic areas: Auto, Voice & Music, Document Imaging, Bluetooth Smart and the nascent market of Indoor Location. Our platforms are adopted by many of the world’s leading technology companies in a wide range of consumer devices and automobiles. Together, these five strategic areas represent our areas of focus and we believe that they position us to deliver growth and sustainable returns in the medium and longer term.
Summary of 2014
The most significant event of 2014 was the proposed acquisition of your Company by Qualcomm Incorporated (‘Qualcomm’). On 15 October 2014, we announced that the Board of directors had reached agreement with Qualcomm regarding the terms of a recommended cash offer for CSR by Qualcomm Global Trading Pte. Ltd. (‘QGT’), an indirect wholly owned subsidiary of Qualcomm, by way of a scheme of arrangement (the ‘Qualcomm Transaction’).
The Qualcomm Transaction, which was recommended by the Board, followed an intense period beginning with the announcement on 28 August 2014 that your Board had rejected an offer from Microchip Technology Incorporated to acquire the Company.
The Qualcomm Transaction (900 pence per ordinary share) values CSR at £1,560 million and as we stated at the time of announcing the terms of the offer, the Board believes that the Qualcomm Transaction provides CSR shareholders with an immediate and certain value which is highly attractive. The decision to recommend the transaction was reached after taking into account the advice of the Board’s advisers.
On 4 December 2014, shareholders approved the scheme of arrangement and certain related matters in connection with the Qualcomm Transaction. Subject to the receipt of certain antitrust clearances, the acquisition is expected to become effective by late summer 2015.
I should like to state the appreciation of the Board for the dedication, professionalism and strength of our people and use this opportunity to express that directly to them. Without their commitment and capabilities, their inventiveness and capacity to create new ideas, CSR would not have achieved the success that it has experienced.
Strategy and financial objectives
During 2014, we continued to extend our platform strategy on which Joep van Beurden, the CEO, will comment in more detail in his report. We have focused on building and maintaining leading positions in our target markets and technologies, while also showing continued financial progress.
Underlying diluted earnings per ordinary share showed good growth on the prior year from $0.46 in 2013 to $0.51 in 2014. Although Core revenue fell 3% from $722.3 million in 2013 to $703.0 million in 2014, the Group underlying gross margin has continued to improve, rising to 58.5% for 2014, from 52.4% in 2013, as Core becomes a higher proportion of the Group revenue.
Our IFRS diluted profit per ordinary share was $0.55 compared with diluted loss per ordinary share of $0.28 in 2013. This swing mainly reflects the profitability movement between 2014 and 2013, including the gain arising from the sale of certain Imaging IP and the connected impairment reversal during 2014, and the non-cash impairment charge on our Cameras business in 2013. All these factors are explained in more detail in the financial report on pages 18 to 31.
| | |
| 6 | | CSR plc Annual Report and Financial Statements 2014 |
Returns to shareholders
CSR’s performance enables us to continue investing in new products and technologies, which underpins our strategy, and to sustain the return of capital to our shareholders. During 2014, we returned $61.9 million to shareholders through the buyback of shares, paid an interim dividend of $0.052 per ordinary share and the Employee Benefit Trust purchased shares of $7.6 million.
In view of the Qualcomm Transaction, the Board does not intend to pay or recommend for payment any further dividends at this time. The Board also does not intend to undertake any further share buybacks prior to the completion of the Qualcomm Transaction.
Our markets
The markets in which CSR operates continue to provide good prospects for growth. We recognise that in maintaining our objective of having market-leading positions in our target markets, we are up against strong competitors, as well as a rapidly changing landscape for consumer electronics. Your Board is mindful of these challenges and accordingly we continue to evaluate the potential risks that could impact the Group as pertaining to the continued conduct of its business. We address these matters in more detail on pages 32 to 35 and pages 43 to 51.
CSR is a ‘fabless’ semiconductor company and we rely on the support of our supply chain partners in providing the necessary resources and capacity that enables us to manufacture, test and supply our products to our customers. I would like to express our thanks in particular to both TSMC, whom we have worked with from our first chip to the present day, and ASE, who provide us with testing, packaging and logistics services.
Board changes
In December 2014, Anthony (Tony) Carlisle stood down from the Board, as previously announced. Tony had been on the Board since July 2005, acted as the Senior Independent Director and was a member of each of our Audit, Remuneration and Nomination Committees. His experience and abilities have been of enormous value to the Board and the committees on which he has served. I would like to thank him on behalf of the Board and wish him well.
Our people
2014 was a year of significant change for the Company. I would like to once again thank our people, who have shown great professionalism throughout this time.
Ron Mackintosh
Chairman
4 March 2015
| | | | | | |
| | how we’re doing | | |
| | | | |
| | — | | We saw strong revenue growth in our Voice & Music business, supported by growth in our stereo audio products and licencees for our aptX technology. | | |
| | — | | In Auto, we have a good pipeline of design wins and saw growth in the automotive factory-fit markets, while we saw weakness in automotive PND and the aftermarket in China. | | |
| | — | | We saw weakness in Cameras as customers switched to next generation technologies of alternative suppliers. | | |
| | — | | The potential for Bluetooth Smart remains strong as we see increasing demand in areas such as Human Interface Devices, remote controls and wearables. | | |
Chief Executive’s review
| | | | |
 | | We are well positioned to capitalise on opportunities to seamlessly connect people, devices and information, as well as benefitting from the growing interest in the Internet of Things. Joep van Beurden,Chief Executive Officer | | |
Financial review of the year
2014 saw CSR continue to make progress in line with our Business Model, which is summarised in this report. Overall though, our Core revenue was $703.0m (2013: $722.3m). This decline against the prior year reflected lower revenues from the automotive aftermarket and PND sectors in our Auto business, weaker performance in Consumer (primarily Gaming and Cameras segments), and specific non-recurring demand from customers in China for the Voice & Music segments mono-headset technology, which we experienced in the first half of 2013 and which did not recur in 2014. However, Voice & Music business achieved year on year growth in revenue when compared with 2013 as a result of the increasing demand for our leading-edge technologies in this segment. We also saw growth in the proportion of our Auto revenues derived from the supply of our products to the factory-fit market. Each of these is discussed in more detail on the following pages.
As a result, we saw good year on year growth in Core revenue for the second half of 2014. For the whole of 2014, we also saw
increased overall profitability and underlying earnings per ordinary share compared to 2013.
Driven by the growth in stereo wireless audio devices such as soundbars, headphones and remote speakers,Voice & Music achieved revenue of $346.6 million, an increase of 11% against 2013.
We saw a decline inAuto, with revenue of $201.0 million, a decrease of 12% against 2013. Within Auto, we experienced growth in the Auto factory-fit market. Factory-fit now represents the majority of our Auto business and we consider this market offers good future growth opportunities. This is due primarily to the increased adoption of connectivity and infotainment solutions by automotive OEMs in their new vehicles. We continue to work with some of the largest companies in the automotive market to develop a broadening range of solutions that support consumer demands for in-dash GPS functionality, audio and connectivity products.
| | | | | | | | | | | | | | | | |
| | STRATEGIC REPORT – OUR BUSINESS MODEL | | |
| | Business Model Our goal is to deliver growing shareholder returns by generating revenue growth and increasing profitability. We seek to do this by focusing our investment on markets that are fast growing and where we can deliver differentiated platforms with a leading market position. We aim to build a strong portfolio of innovative multifunction platforms using our connectivity, location, audio and document imaging technologies for the market segments as described on pages 14 and 15. The delivery of this strategy has been supported by a combination of acquisitions and organic growth, which has allowed us to broaden the technologies we have under development. It has also widened our market presence and customer base. As a result, we have moved beyond the design and supply of single technology semiconductor products and related software solutions (predominantly using the Bluetooth standard for the mobile handset) that characterised our focus following our IPO in 2004. | | | | Fabless We are a ‘fabless’ semiconductor company. We design and develop semiconductor integrated circuits and software, and subcontract the manufacture (wafer fabrication, packaging and test) of our products to independent third parties. Our manufacturing is mostly subcontracted to TSMC, a world-class foundry, and ASE, a leading provider of semiconductor manufacturing services, and is predominantly undertaken in Taiwan (other locations include South Korea, China and Singapore). Our solutions increasingly include software, both on our chips and as part of broader system solutions. We sell directly to the producers of consumer electronic equipment, as well as to original design manufacturers and distributors, and therefore our technologies and their lifecycles are impacted by the product cycle of many consumer end-products. | | | | Five markets We focus on our chosen end markets, and aim to use our integrated and differentiated technology platforms, with the goal of achieving sustainable growth with higher margins and returns. We currently develop enhanced and connected platforms in our Voice & Music, Auto and Consumer business areas, where we believe we can achieve a strong position. We focus on five strategic end markets in our Core business group – Automotive Infotainment, Bluetooth Smart, Document Imaging, Voice & Music and the nascent market of Indoor Location – which we believe will enable us to generate sustainable revenue growth with good margins over the medium and longer term. Our objective is to develop higher margin platforms in markets that we expect will outgrow the overall semiconductor market. We expect our total serviceable addressable market to grow from approximately $4.0 billion in 2014 to $6.6 billion in 2019, (excluding revenue from the yet to be commercially introduced market of Indoor Location), representing a compound annual growth rate of 11%. | | | | R&D In order to be at the forefront of our chosen markets, we make significant investment in research and development (‘R&D’). During 2014, we spent $240.9 million on R&D. The majority of our products under design are to be manufactured on the 40nm node, as moving to a smaller lithography can enable a lower bill-of-materials cost to the customer. We continue to have dedicated processes which underpin the evaluation of new ideas from their conception through their development to market launch. We also remain focused on maintaining control of our underlying operating expenses, which include underlying R&D costs. | | |
| | | | | | | | | | | | | | | | |
| | |
| 8 | | CSR plc Annual Report and Financial Statements 2014 |
CSR at a glance
| | | | |
| | our five strategic areas of focus | | |
| | Following the transfer of handset connectivity and handset location development operations to Samsung in 2012, our platform strategy has accelerated and we have focused our energies on five markets which we believe provide growth potential. | | |
| | | | | | | | | | | | |
| | | | | | | | | | | | |
| | Our strategy focuses on targeting our chosen end markets with our integrated and differentiated technology platforms, with a goal to achieve sustainable growth with higher margins and returns. | | | | We are developing enhanced and connected platforms in five end markets, including Automotive Infotainment, Bluetooth Smart, Document Imaging, Voice & Music and the nascent market of Indoor Location. We also develop a range of products for other markets including gaming and PC. | | | | We take a disciplined approach to capital allocation, investing in higher margin platforms and markets where we see the best prospects for profitable revenue growth. | | |
| | | | | | |
| | | | | | | | | | | | |

|
Chief Executive’s reviewcontinued
The growth in factory-fit was offset, however, by revenue declines in PND and the automotive aftermarket, predominantly in China, due to competitive pressures as well as an overall decline in demand from end customers for these products.
OurConsumer segment revenue declined 14% to $155.4 million, primarily due to declining revenue in Cameras and Gaming.
During 2014, the digital still camera marketplace continued to experience a sharp drop in demand with the move by consumers away from digital cameras, towards smartphones and tablets with video and still shot capabilities.
Our revenue inCameras was lower in 2014, due to customers switching to next generation products offered by competitors, following our decision in 2013 to cease investment in our COACH® platform. Revenue from ourGaming business was also lower as a result of weakness in some areas of the console market and declining revenues from a single customer. See page 21 for more information.
We continue to invest in emerging technologies and markets which we believe offer potential for significant growth. Particular focus has been given toBluetooth Smart, driven by the general interest in the Internet of Things, and we are making good progress with ourIndoor Location technology. In each of these, we believe we have differentiating technologies that position us well to compete. Revenues from these technologies are recorded within Consumer, and, as expected, did not contribute meaningful revenue in 2014.
Revenue in ourLegacy business, which comprises the discontinued home entertainment, handset connectivity and handset location businesses, was $71.8 million, a decline of 70% on the prior year. Performance in this area was in line with our expectations, and we continue to believe Legacy revenue in 2015 will be minimal.
As we have previously reported, we continue to see competition in our markets from existing and new entrants and we see increasing investment by these companies in emerging, as well as more established, markets.
We prepare our financial statements in accordance with IFRS, but also report ‘underlying measures’, which are non-GAAP measures. Underlying measures are supplemental measures that management uses in assessing the financial performance of the Group (see pages 130 to 133).
Underlying gross margin increased from 52.4% in 2013 to 58.5% in 2014, as we increased the proportion of revenue derived from our higher margin Core business. Importantly, we saw Core underlying gross margin increase to 60.8%, compared to 59.7% in 2013, which we believe reflects well on our strategy of moving towards differentiated, higher margin platforms.
|
| TRENDS IN OUR MARKETPLACE |
We operate in a fast moving marketplace. The results of our operations during 2012-2014 were materially affected by the following trends within the semiconductor industry in which we operate, several of which are likely to continue and which we expect are likely to affect our performance in 2015.
These include:
| | — | | consumer taste for electronic devices, which can show rapid change and so impact on the size of the markets to which we supply our products and technologies; | |
| | — | | changes in the semiconductor industry, which can affect the availability of sufficient capacity to meet our demands for integrated circuits; | |
| | — | | economic uncertainty, (particularly in China), which affects the level of demand for consumer-related products; | |
| | — | | intense competition from third parties, particularly from Asia, including for example, alternative features offered in competing products, pricing strategies to attract customers and release of new products by competitors; | |
| | — | | the recognised and ongoing trend in the semiconductor industry for declining average selling prices of integrated circuits through the period of their market lifecycle; | |
| | — | | customers ordering products with short lead times between the date of the order and required delivery, creating uncertainty in both our future revenues and whether our suppliers are able to meet our requirements; | |
| | — | | cyclical trends in the semiconductor industry generally; | |
| | — | | the reduction in the lithographic dimensions of semiconductors which can now be measured almost in individual atoms and which continue to reduce, allowing improved throughput and functionality, but increasing our development costs; | |
| | — | | unexpected changes in consumer demand for particular applications, for example, the integration of standalone functions into devices like smartphones, such as taking photographs; | |
| | — | | fluctuations in currency exchange rates which can affect our costs in light of the global nature of our business; and | |
| | — | | litigation associated with alleged infringement of proprietary rights, which is commonplace in the industry. | |
In addition, the majority of the technologies which we supply to our customers are installed into devices that are sold to consumer markets. Demand for consumer products, and therefore for our own products, is subject to seasonal variation. This in turn affects our results, which typically are stronger in the second and third quarters of a financial year, as our customers order in anticipation of demand for their own products.
We rely on our suppliers to provide the volumes of integrated circuits sufficient to meet the demands for our products from our customers. Our largest suppliers have continued to expand their capacities in the face of increasing demand. In most instances the strength of CSR’s relationship with its primary suppliers has enabled us to respond to the needs of our customers. We work to maintain a strong relationship with our suppliers and the Company has benefited from the commitment of a number of key partners who have supported our business.
| | |
| 10 | | CSR plc Annual Report and Financial Statements 2014 |
CSR at a glance
| | | | |
| | our platform positions | | |
| | Our aim is to develop higher margin platforms in markets that we expect will outgrow the overall semiconductor market. We expect our total serviceable addressable market (‘SAM’) to grow from approximately $4.0 billion in 2014 to $6.6 billion in 2019 (excluding revenue from the yet to be commercially introduced market of Indoor Location), representing a compound annual growth rate of 11%. | | |
| | | | | | | | | | | | |
| | | | | | Why is it important? | | | | What are we doing? | | |
| | | | | | |
| | | | | | | | | | | | |
| | | |
| | | | | | |
| |  | | | | The adoption of integrated information and entertainment systems in vehicles continues to grow, whether it is GPS to guide the journey, video and music systems for passengers’ entertainment, or diagnostic systems which are used to maintain and repair the vehicles we drive. We work with many of the world’s leading automotive manufacturers, providing integrated solutions that combine our existing strengths in audio, connectivity, and location. | | | | The SiRFprimaII™ integrates an ARM Cortex A9 CPU core, up to 1GHz and targets mid-end and high-range products while the SiRFatlasVI™ integrates an ARM Cortex 9 CPU core, up to 1GHz and targets low-end and mid-range products. The CSR1010™ auto is a fully Bluetooth v4.0 qualified embedded device for automotive applications. We have increased our volume production for our auto infotainment system-on-a-chip (‘SoC’) with previously reported design wins with Tier One factory-fit OEMs. We continue to see good interest from Tier One factory-fit OEMs in our upcoming new generation automotive SoC. | | |
| | | | |
| | | | | | | | |
| | | | | | |
| | | | | | | | | | | | |
| | | | |
| | | | | | | | |
| |  | | | | Enterprise workforces are becoming increasingly mobile and reliant on smartphones and tablets. Mobile workers want to take attachments and other documents that are too complex to read on a small screen and conveniently print them on a nearby printer. We call this ‘walk-up printing’. CSR enables this with a complete printer controller platform that includes the system processor, wireless connectivity and document imaging software. | | | | Our Quatro system processors are highly integrated system processors that cover a broad product range including single-function printers, multi-function printers and scanners, from entry level to high performance. CSR’s DirectOffice® Mobile Print software application directly renders Microsoft documents into high-fidelity output without the need for a PC. | | |
| | | | |
| | | | | | | | |
| | | | | | |
| | | | | | | | | | | | |
| | | | |
| | | | | | | | |
| |  | | | | This market has experienced significant growth, driven by the demand from consumers to carry their music in digital form on their smartphone, tablet, or other mobile digital music players and stream their music to stereo headsets, soundbars or speaker docks. We continue to expect long-term growth for streaming audio via Bluetooth as the proliferation of Bluetooth-enabled wireless audio devices increases. An example of where such growth is anticipated is in the soundbar market, which enhances the audio quality for flat-panel TVs. | | | | In 2014, we received our first revenue for our VibeHub networked solution. VibeHub delivers powerful versatility for sourcing audio from home networked PCs, Bluetooth enabled devices, and even cloud-based sources, routing audio throughout the home to one or many speakers. As the opportunities within this market expand, the level of competition continues to intensify, in particular in China, for low cost entry level audio products. | | |
| | | | |
| | | | | | | | |
| | | | | | |
| | | | | | | | | | | | |
| | | | |
| | | | | | | | |
| |  | | | | Bluetooth Smart is an evolution of the Bluetooth standard which uses significantly lower power levels compared to ‘classic’ Bluetooth. It enables wireless connectivity between a broad range of devices including the latest smartphones, TVs and tablets. We have seen increased interest in Bluetooth Smart, with a growing pipeline of design wins. This has been driven, in part, by the use of Bluetooth Smart Ready smartphones, or tablets, as a gateway to the Internet of Things. | | | | We expect that there will be an increasing demand in the wireless home entertainment ecosystem for products utilising Bluetooth, Bluetooth Smart and Wi-Fi, combined with our technologies such as aptX and aptX Low Latency, DDFA® power amplification, MAPX™ audio DSP and the Reciva® internet radio service. In 2014, we announced CSRmesh, a disruptive Bluetooth Smart technology designed to place the smartphone at the centre of the Internet of Things (‘IoT’). | | |
| | | | |
| | | | | | | | |
| | | | | | |
| | | | | | | | | | | | |
| | | | |
| | | | | | | | |
| |  | | | | Building on the success of GPS for location and navigation, there is a growing interest among consumers and business for similar capabilities within heavily built-up areas, in places like shopping malls and even in subways and train stations. | | | | The SiRFusion™ Software Development Kit enables indoor positioning for Android developers looking to create next-generation apps. Developers can now leverage the SiRFusion library to rapidly integrate new location-based capabilities and services such as indoor location tagging and analytics for social networking applications, indoor navigation, lone worker efficiency and safety capabilities, as well as indoor asset tracking. | | |
| | | | |
| | | | | | | | |
| | | | | | | | | | | | |
Chief Executive’s reviewcontinued
IFRS gross margin mirrored the performance of underlying gross margin and increased to 58.1% in 2014, from 51.6% in the prior year.
Underlying operating profit increased to $109.9 million from $104.3 million in 2013, reflecting the increase in both underlying gross margin, and our focus on reducing our cost base. The IFRS operating profit for the year was $97.0 million, compared with a loss of $48.4 million in 2013. The swing mainly reflects the profitability movement between 2014 and 2013, including the gain arising from the sale of certain Imaging IP and the connected impairment reversal during 2014 and the non-cash impairment charge on our cameras business in 2013. All these factors are explained in more detail in the financial report on pages 18 to 31.
Our operating costs for the year were in line with our expectations at $391.1 million and were lower than our 2013 costs of $466.8 million.
Diluted underlying earnings per ordinary share increased to $0.51 from $0.46 in 2013. Our IFRS diluted profit per ordinary share was $0.55, versus a diluted loss per ordinary share of $0.28 in 2013.
Capital allocation
We take a disciplined approach to capital allocation, investing in higher margin platforms and markets where we see the best prospects for profitable revenue growth.
We continue to retain a strong and healthy cash balance with cash, cash equivalents and treasury deposits of $283.2 million, at the end of 2014. This gives us the necessary flexibility when assessing whether to acquire additional technological capabilities.
As part of executing on our strategy, we regularly evaluate the most effective means by which to enhance our capabilities, including the development and delivery of new products and technologies. Where appropriate, we enhance our in-house capabilities with targeted acquisitions.
Our most recent acquisition, which we completed in 2014, was that of people and assets from Reciva Limited, a private company based in Cambridge, UK. This acquisition provides capabilities enabling us to aggregate internet radio and streaming music services in the cloud and provide a common interface which can stream multiple services to internet connected audio products.
Overall, we expect that there will be an increasing demand in the wireless home entertainment ecosystem for products utilising technologies such as Bluetooth, Bluetooth Smart and Wi-Fi, combined with our technologies such as aptX and aptX Low Latency, DDFA power amplification, MAPX audio DSP and the internet radio service capabilities from the Reciva transaction. Some of our initiatives in this market are reported on page 14.
Technical innovation
We continue to develop and deepen our range of technical capabilities. In May, we announced that our SiRFstarV™ architecture had established a position fix using Galileo satellites. Galileo support is required to implement the European Commission’s recently mandated eCall emergency response system for light vehicles, which will automatically send emergency notification messages from these vehicles when they are involved in an accident.
Looking ahead
Our products are used in a wide variety of consumer devices and, as a result, we are heavily exposed to consumer sentiment. The macro-economic environment has a significant impact on consumer sentiment, and in 2014, we saw somewhat improved economic conditions, especially in the US, but ongoing caution as a result of economic uncertainty in regions such as Asia. Overall therefore, the global outlook for 2015 remains unclear.
In Auto, we are experiencing strong design win momentum for our automotive factory-fit infotainment SoC platforms and we continue to see good growth in Voice & Music. As I have mentioned, we have a strong presence in each of these markets, with established products, as well as a track record for delivering innovative and leading ideas which are attractive to both our customers and end-users. At the same time, we are experiencing declines in our PND, Auto aftermarket, Cameras and Gaming business lines.
Pending satisfaction of certain conditions and the scheme of arrangement associated with the Qualcomm Transaction becoming effective, our focus remains on supporting our customers by the continued delivery of our products and services, while maintaining our current operating cost structures. We expect that demand for our products and services will be driven by wider market and economic conditions in both developed and emerging markets, as well as changes in the requirements and the implementation plans of our customers.
Qualcomm
Finally, I wish to mention the Qualcomm Transaction to acquire CSR which was approved by shareholders in December 2014 and which is a major landmark for the Company. I would like to echo our Chairman and say that the transaction is testimony to the value created by the work and dedication of CSR people.
Joep van Beurden
Chief Executive Officer
| | |
| 12 | | CSR plc Annual Report and Financial Statements 2014 |
CSR at a glance
| | | | | | |
| | | | | | |
| | our technologies | | See more on page 14 | | |
| | | | | |
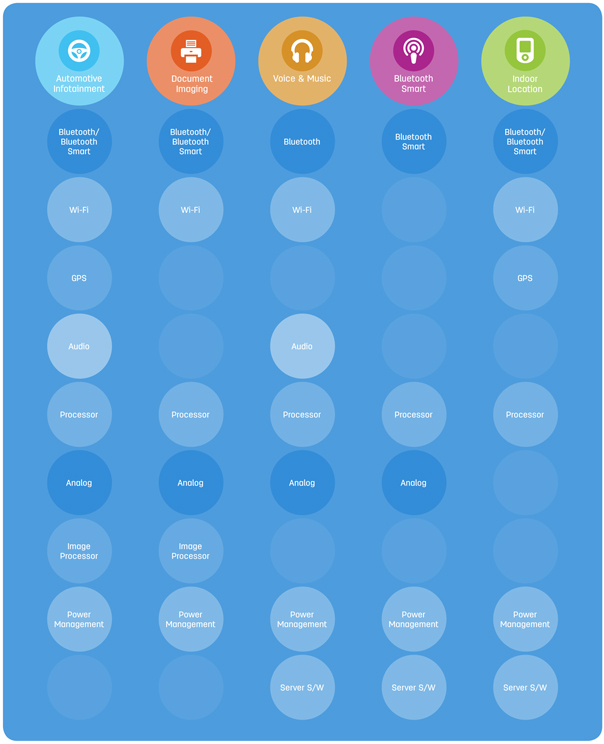
| | We aim to use our range of technologies – including connectivity (such as Bluetooth and Wi-Fi), audio, document imaging and location – to deliver integrated and differentiated technology platforms in order to achieve sustainable growth with higher margins and returns. | | |
| | Below we show the key technologies that go to make up our platforms in our five strategic areas of focus. | | |
| | | | | | |
Chief Executive’s reviewcontinued
| | | | |
| | our performance in platforms | | |
| | We continued our market leadership in the area of Bluetooth stereo audio, within Voice & Music. In Auto, we are seeing growth in factory-fit, but continued weakness in PND and aftermarket. Consumer had a challenging year due to lower sales in Cameras and Gaming. | | |
| | | | | | |
STRATEGIC REPORT – PROGRESS IN PLATFORMS DURING 2014 |
| | | | | | |
| | | | | | | | | | |
Looking at our product areas in more detail, we continued our market leadership in the area of Bluetooth stereo audio, which forms part of ourVoice & Music segment. This market is growing rapidly, as more and more people carry their music in digital form on their smartphone, or other mobile digital music players, and want to wirelessly stream their music to listen on stereo headsets, soundbars or speaker docks. At the same time as this growth in demand, consumers are also seeking a high quality audio experience which emulates the sound quality available from traditional wired music systems. CSR has proven strengths in delivering high performance wireless audio. As a result of these capabilities, we continued to experience good customer traction with customers including Beats, BOSE, Sony, Vizio and Xiaomi releasing new audio products based on our solutions during 2014. Our aptX audio codec technology, which we acquired in 2010, is an important contributor to our success in this area. At the end of 2014 we had 320 licencees, a strong increase from 236 at the end of 2013. aptX is a good example of an incremental acquisition which complements our platform technologies, enabling us to further extend our competitive advantage. During 2014, there were around 180 products launched which featured aptX from companies such as Sony, Asus, Samsung, LG and HTC along with Vizio and Denon. We are making good progress with our Wi-Fi audio product, VibeHub. CSR’s multi-user networked audio platform for the home is specifically designed to allow original design manufacturers (‘ODMs’) to quickly develop and easily | | | | integrate networked audio capabilities into their products. Audio speaker designer and manufacturer BRAVEN also announced the first portable Bluetooth and Wi-Fi distributed audio system based on our VibeHub product in Q3 2014. InAuto, we are seeing the increasing use of wireless connectivity and infotainment in new build cars. While audio and navigation systems are now well established, the use of video and Wi-Fi is becoming more widespread, resulting in increasing demand for our Automotive Infotainment products and platforms, including SiRFprimaII and SiRFatlasVI. We also saw increasing demand from Tier One customers for our connectivity products, with our autograde Wi-Fi ramping into volume production with a number of customers. During 2014, the proportion of our Auto revenues derived from business with Tier One customers grew significantly as a result of the adoption of our new technologies. We believe we are well placed to continue to grow our business in this area. At the same time, we have experienced increasing competition in the automotive aftermarket, primarily in China. This sector is based on the sale to consumers of automotive infotainment systems that are installed after the purchase of a vehicle from an auto dealer. As a result of this increased competition, our revenue in this area has declined. We also saw a continued decline in the market for standalone personal navigation devices (‘PND’). During 2014, our aptX codec was adopted in automobiles for the first time by Alps for | | | | their automotive connectivity modules. This enables OEM customers to offer CD-like audio quality for Bluetooth stereo streaming in automobiles to the head unit, or to rear-seat entertainment applications for watching movies or gaming. In Q2 2014, together with Abalta Technologies, we announced a partnership to integrate Abalta’s connected car solution, WEBLINK, with our SiRFprimaII In-Vehicle Infotainment (‘IVI’) location, connectivity and multimedia system-on-a-chip. In Q4 2014, we announced the channel availability of the CSR1010 auto, a Grade 2 AEC-Q100 Bluetooth Smart chip for | | automotive applications qualified for mass production. The solution equips automotive manufacturers with the tools they need to add exciting new features to existing infotainment systems and to design innovative future Bluetooth Smart applications for both inside and outside the car. Consumer experienced a challenging year with a decline in revenues in both Cameras and Gaming. Cameras declined during 2014 in light of our decision in 2013 to cease investment in technologies for this market, (with the result that customers have switched to alternative suppliers able to offer next |
| | | | 
|
| | | | | | | | | | | |
| | |
| 14 | | CSR plc Annual Report and Financial Statements 2014 |
| | | | | | |
|
generation technologies), in addition to the move by consumers away from digital cameras towards smartphones and tablets with video and still shot capabilities. Within Gaming, we continue to see weakness in some areas of the console market and declining revenues from a single customer. We continue to believe that our capabilities in indoor location offer opportunities for growth and we made encouraging progress during 2014. In April 2014, CSR and OriginGPS announced a series of high-performance GNSS modules using our SiRFstarIV™ and SiRFstarV™ product lines. The new modules are smaller than current solutions and deliver a reduction in Time-To-First-Fix (‘TTFF’), providing benefits for applications such as health and fitness trackers, sports watches, medical devices, wearable action cameras and digital still cameras. During the fourth quarter, we also announced software releases for the SiRFstarV 5ea automotive-grade quad-GNSS location platform, whereby support was added for concurrent use of GPS and BeiDou (‘BDS’) satellite constellations. Each of these end applications were a focus of much attention at the Consumer Electronics Show in Las Vegas which was held in January 2015. In Q3 2014, we launched a new series of dual mode Bluetooth 4.1 compliant platforms, designed to give greater fiexibility to developers looking to create low latency and low-power wireless gaming controllers. The CSRB5341® and the CSRB5342® provide developers with turnkey solutions for wireless gaming controllers and HID applications from a single device. We see good growth and are experiencing increased engagement with customers for | | our capabilities in the area of Bluetooth Smart, which is a low power connectivity technology. We believe there are multiple potential use cases for Bluetooth Smart in devices which are either handheld or worn by the user and which will be able to function using significantly lower power. While revenue in 2014 from Bluetooth Smart was small compared to our overall revenue, we continue to see the potential for strong medium and long-term growth in this market. Our pipeline of design wins for Bluetooth Smart continues to grow. For example, during 2014, we collaborated with Universal Electronics Inc. to add Infra-Red (‘IR’) setup and control functionality to remote controls based on our CSR µEnergy® Bluetooth Smart platforms, which will enable both IR and Bluetooth Smart capability on a single device. We believe that the application of our Bluetooth Smart in such devices, combined with our position in the Voice & Music market, will enable us to extend our presence in the developing wireless home entertainment ecosystem. This ecosystem comprises wirelessly connected products such as Smart TVs, set-top boxes, remote controls, soundbars, sub-woofers, 3D glasses, stereo headsets, game controllers and keyboards. In 2014, we saw increasing customer traction for our CSR1010 and CSR1011™ Bluetooth Smart products. Design wins for our CSR1010 during 2014 included Lenovo for its new S9 and S52 Smart TVs, which have fully featured Bluetooth Smart remote controls, Incipio with its offGRID Smart Portable Backup Batteries, and Tanita with its new smart weight scales. Our Bluetooth Smart remote platform has also been integrated into Philips’ uWand | | reference design, a complete firmware and hardware solution for developing pointing and gesture-based remote controls. The CSR Smart remote platform is an end-to-end solution utilising CSR1010 and the CSR8510™, enabling seamless data transfer between a remote control and TV or set-top box. In February 2014, we announced CSRmesh, a disruptive Bluetooth Smart technology designed to place the smartphone at the centre of the Internet of Things (‘IoT’). CSRmesh enables an almost unlimited number of Bluetooth Smart enabled devices to be networked together and controlled directly from a single smartphone, tablet or PC. We are experiencing a high level of interest for this technology from a wide range of manufacturers including those in the area of IoT. We have secured wins for CSRmesh for consumer lighting and see increasing customer interest for a range of IoT applications. During 2013 and 2014, we saw increased interest in using Bluetooth Smart for wireless beacons to enable positioning fixes to be taken using mobile devices within buildings. We expect this infrastructure based model will combine well with our own Indoor Location technology. Our Indoor Location solution utilises infrastructure such as Wi-Fi and/or Bluetooth Smart to determine a user’s location indoors, in addition to motion and pressure sensors, to build up a picture of a person’s positioning within a building such as a shopping mall. We believe that such developments and the ease of use by consumers on devices such as a tablet or smartphone will encourage the development of indoor maps, plus apps based on indoor location, to locate people or places of interest when indoors. | | In addition to adoption by consumers of our Location technologies for their leisure time, we believe that, while there is still work to be done to refine our solution for commercial use, there is good potential for our technology in areas such as asset tracking and support for logistics companies for just in time delivery and scheduling. We continue to make progress toward a commercial deployment. We are making good progress with the commercial development of our Indoor Location platform. This solution utilises existing infrastructure such as Wi-Fi as well as utilising motion and pressure sensors in the device. The solution is currently in customer trials in multiple geographies around the world. The ongoing investment into the creation of indoor maps will continue to fuel the requirement for more accurate indoor location technology to better utilise this development. In Q4 2014, we launched the SiRFusion Software Development Kit (‘SDK’) for Android application developers. The solution enables indoor positioning for Android developers looking to create next-generation apps. Developers can now leverage the SiRFusion library to rapidly integrate new location-based capabilities and services such as indoor location tagging and analytics for social networking applications, indoor navigation, lone worker efficiency and safety capabilities, as well as indoor asset tracking and targeted e-commerce services. Although we see Bluetooth Smart and indoor location as key areas of our future growth potential, we do not expect them to be a significant contributor to our revenue in 2015. |
| | |
Key performance indicators
| | | | | | | | | | | | | | | | |
| | Measuring our performance | | |
| | Our strategy is to deliver growing shareholder returns by generating revenue growth and increasing profitability. We do this by focusing our investment on markets that are fast growing and where we can deliver differentiated platforms with a leading market position. We use the following KPIs to monitor performance against this strategy. | | |
| | | | | | | | | | | | | | | | | |
| | | | | | | | | | | | | | | | |
| | Increased profitability | | |
| | | | | | | | | | | | | | | | | |
| | | | | | | | | | | | | | | | |
| | | Underlying Operating Margin | | |
| | | We deliver increasing | | | | | 2014 | | | | 2013 | | | Target | | |
| | | profit margins | | | | | 14.2% | | | | 10.9% | | | We target underlying operating margins in the mid-teens | | |
| | | | | | | | | | | | | | | | | |
| | | | | | | | | | | | | | | | | |
| | | | | | | | | | | | | | | | | |
| | | | | | | | | | | | | | | | |
| | | Headcount | | |
| | | We match our workforce to the | | | | | 2014 | | | | 2013 | | | Target | | |
| | | locations of our customer and supply base | | Europe | | | 39% | | | | 34% | | | We aim to have 40% or more of our workforce in Asia | | |
| | | | USA | | | 20% | | | | 21% | | | | | |
| | | | | Asia | | | 41% | | | | 45% | | | | | |
| | | | | | | | | | | | | | | | | |
| | | | | | | | | | | | | | | | | |
| | | | | | | | | | | | | | | | |
| | Target fast growing markets | | |
| | | | | | | | | | | | | | | | | |
| | | | | | | | | | | | | | | | |
| | | Movements in revenue | | |
| | | We focus on growing our | | | | | 2014 | | | | 2013 | | | Target | | |
| | | strategic business | | Total Revenue | | | -19% | | | | -6% | | | We target continued growth in Core revenue, and in 2014 expected our Legacy revenue to fall by 70% | | |
| | | | | Core Revenue | | | -3% | | | | 9% | | | | |
| | | | | Legacy Revenue | | | -70% | | | | -35% | | | | | |
| | | | | | | | | | | | | | | | | |
| | | | | | | | | | | | | | | | | |
| | | | | | | | | | | | | | | | |
| | Delivery of platforms | | |
| | | | | | | | | | | | | | | | | |
| | | | | | | | | | | | | | | | |
| | | Gross Margin | | |
| | | Our platform products | | | | | 2014 | | | | 2013 | | | Target | | |
| | | generate higher gross margins | | IFRS | | | 58.1% | | | | 51.6% | | | We target both IFRS and underlying gross margins at 55-60% | | |
| | | | Underlying | | | 58.5% | | | | 52.4% | | | | |
| | | | | | | | | | | | | | | | | |
| | | | | | | | | | | | | | | | | |
| | | | | | | | | | | | | | | | |
| | | Investment in R&D | | |
| | | We invest strongly to deliver | | | | | 2014 | | | | 2013 | | | Target | | |
| | | new products | | | | | 31% | | | | 28% | | | We aim to invest at least 25% of revenue in product development and technology research | | |
| | | | | | | | | | | | | | | | |
| | | | | | | | | | | | | | | | | |
| | | | | | | | | | | | | | | | | |
| | | | | | | | | | | | | | | | |
| | Grow shareholder returns | | | | | | | | | | | | | | |
| | | | | | | | | | | | | | | | | |
| | | | | | | | | | | | | | | | |
| | | Underlying EPS growth | | |
| | | We show growth in returns | | | | | 2014 | | | | 2013 | | | Target | | |
| | | | | | | | 11% | | | | 70% | | | We target year on year growth in underlying EPS | | |
| | | | | | | | | | | | | | | | | |
| | | | | | | | | | | | | | | | | |
| | | | | | | | | | | | | | | | |
| | | Working Capital days | | |
| | | We maximise funds available | | | | | 2014 | | | | 2013 | | | Target | | |
| | | for distribution | | | | | 58 | | | | 59 | | | We aim to hold working capital for less than 65 days | | |
| | | | | | | | | | | | | | | | | |
| | | | | | | | | | | | | | | | | |
| | |
| 16 | | CSR plc Annual Report and Financial Statements 2014 |
Using KPIs to measure our performance
We use the KPIs shown on the preceding page to track business performance over time and to consider whether we are meeting our strategic objectives. We review these annually and adapt them, in response to how our business structure and strategy evolves. For 2014 we include a KPI showing investment in R&D activity to support our strategic objective to deliver differentiated platforms to delivering platform products.
Underlying Operating Margin
We review underlying operating profit as a proportion of revenue (underlying operating margin), so we can measure and compare year on year profitability trends. The full calculation of this measure is described on page 131. In 2014 we achieved our target for underlying operating margin in the mid-teens, due to the combination of increased operating profit, which is discussed on page 23, and lower revenue, discussed on pages 21 and 22. For the purposes of executive remuneration we measure the underlying operating profit against the budgeted value as described on page 71.
Headcount
The majority of our operational expenses arise from the number and location of our employees. We monitor the profile of our employees by region to ensure we have an appropriate presence to support our business, suppliers and customers and we aim to maintain over 40% of our workforce in Asia where many of our key growth markets are located.
In 2014, the percentage of employees based in Asia declined as we continued to withdraw from Legacy and Camera markets, both of which had a high Asian customer and development base. UK-based resource increased over the same period as we recruited specialists in Bluetooth low energy.
Movements in Revenue
We monitor movements in revenue to see whether we are targeting fast moving markets. We pay particular attention to movements in our Core business, being an aggregate of our Voice & Music, Auto, and Consumer segments, as this represents the businesses in which we continue to invest. We target year on year Core revenue growth.
In 2014, total revenue fell as expected due to declining volumes of the discontinued product lines in our Legacy segment. Core revenue also fell year on year, mostly due to lower volumes in our Cameras and Gaming business, but also due to the impact of a non-recurring increase in revenue in the first half of 2013 from the enforcement of hands-free driving legislation in China. However when we compare revenue from the second half of 2014, to the same period in 2013 we see an 8% year on year growth since 2013 comparative reflected business as usual activity. Further information on our revenue movements can be found on pages 20 to 22.
Gross Margin
We track movements in our gross margin (gross profit as a proportion of revenue) to see whether we are increasing the proportion of business derived from platforms and whether our strategy to increase business in this area is successful. We review both IFRS and underlying gross margin, the latter being defined on page 131.
In 2014, we achieved our targets due to a shift in mix towards our higher margin Voice and Music business because of reduced volumes from our Legacy products. More information on the drivers of gross profit and gross margin can be found on page 22.
Investment in R&D
We consistently invest in R&D to ensure we continue to develop and deliver differentiated platforms. See page 22 to understand movements in R&D expenses during the year.
Underlying Earnings per Share ‘EPS’
We monitor underlying profit after tax divided by our dilutive shares because we believe it best represents the ongoing performance and profitability of the Group. Underlying profit after tax and underlying EPS are defined on page 131.
In 2014, our volume of dilutive shares was largely unchanged and so we met our target due to the increased profitability of the Group, as described on pages 23 and 24.
Working capital days
We monitor how the business generates and utilises cash by reviewing working capital days. This represents the aggregate of: a) the number of days it takes to collect cash from customers (debtor days), b) the number of days we hold finished goods and raw materials as inventory (inventory days), and c) the credit terms we have arranged with our suppliers (creditor days). We target working capital days of 65 days or less.
In 2014, we met our target and our total working capital days remaining broadly consistent with 2013. Inventory days increased due to products held in stock for a longer period than usual under special customer arrangements but this was offset by an increase in creditor days caused by the timing of our year-end date.
| | | | | | | | | | | | | | | | | | |
| | | Introduction | | | | Review of 2014 | | | | Review of 2013 | | |
| | Overview | | | | 20 | | Segmental performance | | | | 26 | | Segmental performance | | |
| | | | | 21 | | Income statement | | | | 27 | | Income statement | | |
| | | | | | | | | |
| | 18 | | Highlights of 2014 | | | | 24 | | Balance sheet | | | | 30 | | Cash flow | | |
| | | | | | | | | |
| | 19 | | Highlights of 2013 | | | | 25 | | Cash flow | | | | | | | | |
| | | | | | | | | | | | | | 31 Finance policies | | |
| | | | | | | | | |
| | | | | | | | | | | | | | | | | | |
Introduction
This section is a discussion and analysis of our results for the 52 week period ended 26 December 2014 and the 52 week period ended 27 December 2013. It also provides information on our finance policies, including tax and treasury, and should be read in conjunction with our financial statements that begin on page 84. References in this report and elsewhere to ‘2012’, ‘2013’ and ‘2014’ are to the 52 week periods ended 28 December 2012, 27 December 2013 and 26 December 2014, respectively. References to note numbers are to the notes to the consolidated financial statements on pages 88 to 128.
|
Non-IFRS measures Although we prepare our financial statements in accordance with IFRS, we also report and discuss additional measures that we call ‘underlying’. These underlying measures are not IFRS measures. Management believes that these underlying measures provide investors with useful information regarding our ongoing performance by excluding certain amounts that are included in the comparable IFRS numbers. You can find a description of these underlying measures and their limitations, an explanation of why management believes they are useful to investors and a reconciliation to the most directly comparable IFRS measure on pages 130 to 133. |
|
|
|
Overview
Highlights of 2014
| | | | | | | | |
| | | IFRS | | Underlying |
| | | | |
| | | 2014 | | 2013 | | 2014 | | 2013 |
|
| | | | |
Revenue | | $774.8m | | $960.7m | | $774.8m | | $960.7m |
| | | | |
Gross margin | | 58.1% | | 51.6% | | 58.5% | | 52.4% |
| | | | |
Non-current asset impairment reversal (charge) | | $23.3m | | ($76.9m) | | – | | – |
| | | | |
Gain on disposal of Imaging IP | | $14.9m | | – | | – | | – |
| | | | |
Operating profit (loss) | | $97.0m | | ($48.4m) | | $109.9m | | $104.3m |
| | | | |
Profit (loss) for the period | | $96.8m | | ($46.4m) | | $90.0m | | $81.1m |
| | | | |
Diluted earnings (loss) per share | | $0.55 | | ($0.28) | | $0.51 | | $0.46 |
| | | | |
Net cash from operating activities | | $69.1m | | $82.3m | | $69.1m | | $82.3m |
| | | | |
Treasury deposits, cash and cash equivalents | | $283.2m | | $306.2m | | $283.2m | | $306.2m |
|
Trading Summary
We summarise below our performance in 2014 in comparison to 2013. For a more detailed explanation, please see the analysis on pages 20 to 27.
Revenue fell 19% in 2014 to $774.8 million from $960.7 million in 2013. This was mainly due to a 70% reduction in revenue from our Legacy segment, in line with our expectations as these discontinued products progressed to the end of their product life cycle; a reduction in volumes from our aftermarket business within our Auto segment; lower sales in cameras following our decision, announced in December 2013, to cease development of next generation camera-on-a chip (‘COACH’) products and a decline in Gaming chip volumes. These decreases were partially offset by an 11% increase in revenue from the Voice & Music segment, reflecting growth in high-end stereo speakers and headsets.
In 2014, our IFRS gross margins increased to 58.1% (2013: 51.6%) primarily due to a shift in product mix from our lower margin Legacy segment to the higher margin Voice & Music business. These factors also accounted for the increase in 2014 of underlying gross margin to 58.5% (2013: 52.4%). The increases in gross margin percentages were not enough to offset the effect of declining revenues and, so in absolute terms gross profit decreased to $449.9 million in 2014 (2013: $495.3 million) whilst underlying gross profit decreased to $453.2 million in 2014 (2013: $503.4 million) for the same reasons.
Total operational costs, which comprise Research & Development (R&D) expenses and Sales, General and Administration (SG&A) expenses, decreased 16% to $391.1 million in 2014 (2013: $466.8 million). This decrease was primarily driven by reduced variable employee expenses, lower restructuring costs and litigation activity and a reduction in external development costs.
Underlying operational costs decreased by 14% to $343.3 million in 2014 (2013: $399.1 million). This was mainly due to the combined effect of a reduction in variable employee benefit costs and external development costs as well as lower costs due to reduced litigation activity.
| | |
| 18 | | CSR plc Annual Report and Financial Statements 2014 |
Operating profit for 2014 was $97.0 million (2013: Operating loss $48.4 million). Underlying operating profit increased to $109.9 million in 2014 (2013: $104.3 million) as the lower revenue was more than offset by the strong underlying gross margin and lower operational costs.
Qualcomm Transaction
On 15 October 2014, the boards of CSR and Qualcomm Incorporated (‘Qualcomm’) announced that agreement had been reached regarding the terms of a recommended cash offer for the Company, whereby Qualcomm Global Trading Pte. Ltd. (‘QGT’), an indirect wholly owned subsidiary of Qualcomm, will acquire the entire issued and to be issued share capital of CSR (the ‘Qualcomm Transaction’). More details of this transaction can be found on page 134.
In connection with the Qualcomm Transaction, we incurred $12.0 million of costs during 2014 as described on page 23.
Sale of Imaging Intellectual Property (‘IP’) Assets & Impairment Reversal
In December 2013, we announced our decision to discontinue further investment in the development of next generation COACH platform products. This decision lead to an impairment of assets associated with the COACH business and the redundancy of 152 employees as explained in the ‘Cameras’ section on page 20.
In early June 2014, due to the progress of negotiations to sell certain Imaging IP associated with the COACH business, we determined that the IP previously impaired had a market value and we therefore re-assessed the carrying value of these assets. This lead to a reversal of some of the impairment charges made against these assets in 2013, resulting in a credit to operating profit of $23.3 million in 2014.
On 8 June 2014, we completed the sale of this Imaging IP associated with the COACH business, together with the transfer of 28 employees allocated to the COACH business, for a total consideration of $44.0 million. The gain on disposal of Imaging IP was $14.9 million. No assets or employees remain allocated to the COACH business.
Returns to Shareholders
During 2014, we bought back 6.4 million of our own ordinary shares in the open market for an aggregate of $61.9 million, the details of which are disclosed on pages 78 and 79. In addition, during 2014 the CSR Employee Benefit Trust (‘EBT’) purchased 0.8 million of CSR ordinary shares in the open market for an aggregate of $7.6 million.
On 5 September 2014, the Company paid an interim dividend of $0.052 per ordinary share. In view of the proposed Qualcomm Transaction, the Board does not intend to recommend a final dividend in respect of the 2014 financial year.
Highlights of 2013
| | | | | | | | |
| | | IFRS | | Underlying |
| | | | |
| | | 2013 | | 2012 | | 2013 | | 2012 |
|
| | | | |
Revenue | | $960.7m | | $1,025.4m | | $960.7m | | $1,025.4m |
| | | | |
Gross margin | | 51.6% | | 49.6% | | 52.4% | | 50.8% |
| | | | |
Goodwill and non-current asset impairment | | ($76.9m) | | – | | – | | – |
| | | | |
Profit on disposal of development operations | | – | | $127.2m | | – | | – |
| | | | |
Operating (loss) profit | | ($48.4m) | | $107.9m | | $104.3m | | $74.0m |
| | | | |
(Loss) profit for the period | | ($46.4m) | | $51.2m | | $81.1m | | $55.4m |
| | | | |
Diluted (loss) earnings per share | | ($0.28) | | $0.25 | | $0.46 | | $0.27 |
| | | | |
Net cash from operating activities | | $82.3m | | $73.9m | | $82.3m | | $73.9m |
| | | | |
Treasury deposits, cash and cash equivalents | | $306.2m | | $333.3m | | $306.2m | | $333.3m |
|
Trading Summary
We summarise below our performance in 2013 in comparison to 2012. For a more detailed explanation, please see analysis on pages 26 to 30.
Revenue fell 6% in 2013 to $960.7 million from $1,025.4 million in 2012. This was mainly due to an expected fall in sales of Legacy products, particularly the revenue from handset connectivity and handset location products after these transferred to Samsung in Q4 2012. We also saw a significant decline in digital still camera products within our Consumer segment reflecting the shift in the market towards smartphones and tablets. These decreases were partially offset by higher volumes of higher priced products in the Voice & Music and Auto segments.
Our IFRS gross margins increased to 51.6% in 2013 (2012: 49.6%) primarily due to a shift in product mix away from lower margin handset products, combined with the strong growth in the higher margin Voice & Music business. Underlying gross margin increased to 52.4% for the same reasons (2012: 50.8%).
Total operational costs decreased by 12% to $466.8 million in 2013 (2012: $528.4 million). This reduction in costs was primarily driven by a reduction in underlying operational costs, a $10.9 million reduction in litigation costs and the release of a $9.8 million litigation provision. This was offset by a $10.4 million increase in share based payment costs driven by the increase in share price and the higher volume of shares issued to employees.
Underlying operational costs fell by 11% to $399.1 million in 2013 (2012: $446.4 million). This was mainly due to the full year benefit of lower headcount following restructuring programmes which completed in 2012 and included the transfer of 311 employees as part of the transaction with Samsung Electronics Co., Ltd for the disposal of our handset connectivity and handset location development operations (the ‘Samsung Transaction’) that completed in 2012.
|
Financial reportcontinued |
The operating loss for 2013 was $48.4 million after the impact of the non-cash $76.9 million impairment charge in connection with the discontinuation of development of COACH products, and other non-underlying items. Underlying operating profit grew to $104.3 million in 2013 (2012: $74.0 million) due to the strong underlying gross margin and lower operational costs, as mentioned above.
Cameras
On 10 December 2013, we announced our decision to discontinue development of next generation COACH platform products, in order to focus investment on higher growth markets. This decision resulted in a non-cash impairment to goodwill, intangible assets and tangible assets allocated to the Cameras cash generating unit (‘CGU’) of $76.9 million. This charge comprised $50.5 million impairment on goodwill, $26.2 million on intangible assets and $0.2 million on tangible assets.
In connection with this action, we incurred restructuring costs of $6.5 million which were mainly due to the redundancies of 152 employees in the Camera business who were not redeployed within the Group, and which completed during 2014.
Returns to Shareholders
During 2013, we bought back 8.45 million of our own ordinary shares in the open market for an aggregate of $67.8 million. In addition during 2013, the Employee Benefit Trust purchased 0.5 million CSR ordinary shares in the open market for an aggregate of $4.8 million.
We paid a dividend of $0.136 per ordinary share, of which $0.091 was paid as a final dividend in May 2014, and $0.045 was paid as an interim dividend in September 2013.
Litigation
During 2013 we paid $12.0 million to settle outstanding lawsuits of which $7.5 million had been accrued in 2012. In March 2013, the US Supreme Court dismissed the case brought by the US Securities and Exchange Commission against two former officers of Microtune, Inc. in respect of which CSR assumed certain indemnification obligations as a result of the acquisition of Zoran Corporation in 2011. As a consequence of the court’s decision, we released a litigation provision of $9.8 million.
Review of 2014
2014 Segmental Performance
We divide our operations into four reporting segments, Voice & Music, Auto, and Consumer which form our “Core business”, and Legacy. These segments are described on pages 2 and 3.
Results for the four segments are regularly reviewed by senior management (including the CEO who is the Chief Operating Decision Maker), to understand how each area has impacted the results of our Group and inform decisions on resource allocation. Therefore, we report the results of these business areas as operational and reporting segments as defined by IFRS 8. There were no changes to these segments during 2014.
The table below shows our segmental performance in 2014 and 2013.
| | | | | | | | | | |
| | | 2014 | | 2014 | | 2013 | | 2013 | | 2014 vs 2013 |
Revenue | | $ million | | % Revenue | | $ million | | % Revenue | | % change |
| | | | | |
Auto segment | | 201.0 | | 25.9 | | 228.8 | | 23.8 | | (12) |
| | | | | |
Consumer segment | | 155.4 | | 20.1 | | 181.5 | | 18.9 | | (14) |
| | | | | |
Voice & Music segment | | 346.6 | | 44.7 | | 312.0 | | 32.5 | | 11 |
| | | | | |
Core business group | | 703.0 | | 90.7 | | 722.3 | | 75.2 | | (3) |
| | | | | |
Legacy segment | | 71.8 | | 9.3 | | 238.4 | | 24.8 | | (70) |
| | | | | |
Total | | 774.8 | | 100.0 | | 960.7 | | 100.0 | | (19) |
| | | | | |
Underlying operating result* | | | | | | | | | | |
| | | | | |
Auto segment | | (20.2) | | – | | (7.4) | | – | | (173) |
| | | | | |
Consumer segment | | (18.1) | | – | | (70.4) | | – | | 74 |
| | | | | |
Voice & Music segment | | 124.5 | | – | | 123.1 | | – | | 1 |
| | | | | |
Core business group | | 86.2 | | – | | 45.3 | | – | | 90 |
| | | | | |
Legacy segment | | 23.7 | | – | | 59.0 | | – | | (60) |
| | | | | |
Total | | 109.9 | | – | | 104.3 | | – | | 5 |
* Operating result means the underlying operating profit or (loss) in the year
Auto
In 2014, revenue from our Auto segment decreased 12% to $201.0 million, from $228.8 million in 2013.
During 2014, we saw increased sales volumes from the higher margin factory-fit market due to the increasing adoption of Bluetooth, location products and Wi-Fi technologies in cars. This is part of the general trend by Tier One manufacturers to incorporate connectivity and location features in their vehicles and we expect this to continue as car manufacturers seek to provide drivers and passengers with enhanced in-car information and entertainment. As the adoption of such features increases, we are seeing a decline in sales volume of our lower margin aftermarket products that provide technology for installing into older car models.
| | |
| 20 | | CSR plc Annual Report and Financial Statements 2014 |
The underlying operating loss in 2014 for the Auto segment was $20.2 million compared to an underlying operating loss of $7.4 million in 2013 which reflected, in addition to the decreased revenue, higher R&D costs. During 2014, we increased R&D investment in this segment as part of our strategy to develop the next generation of automotive infotainment connectivity and location devices. Looking forward, we expect to sustain investment in this area in order to support our strategy to grow our capabilities in this segment.
Consumer
In 2014, revenue from our Consumer segment decreased 14% to $155.4 million from $181.5 million in 2013.
Volumes decreased by 4%, primarily driven by Cameras customers switching to alternative suppliers offering next generation solutions following our 2013 decision to cease further development of our COACH platform, as well as reduced demand for gaming products due to changes in customer market share and the impact of consumers switching to a next generation console which does not contain our Bluetooth solution. Revenues from our Document Imaging business lines remained stable compared to 2013 and we have seen growth in our Bluetooth Smart products, although this represents a small proportion of our total revenues in 2014.
The underlying operating loss for Consumer in 2014 was $18.1 million (2013: $70.4 million). This loss mainly decreased due to ceasing our investment in COACH products (see page 20 for further details). We continued to incur R&D cost through the development of the Bluetooth Smart and Indoor Location technologies, and expect this to continue in the future.
Voice & Music
In 2014, revenue from our Voice & Music segment increased 11% to $346.6 million, from $312.0 million in 2013.
The continued strong growth in Voice & Music during 2014 was driven by increasing consumer demand to play digital content wirelessly using products such as remote speakers, speaker docks and wireless stereo headphones. The full extent of the year on year growth was moderated by the one-off revenue in the first half of 2013, arising from the enforcement of handsfree driving legislation in China which did not recur in 2014.
Underlying operating profit for Voice & Music in 2014 grew to $124.5 million (2013: $123.1 million) due to increased volumes of higher margin stereo products offset by costs to develop the next generation audio products.
Legacy
Legacy consists of home entertainment, handset connectivity and handset location business lines for which we are no longer developing new products or adopting new technologies. During 2014, revenue derived from this segment decreased in line with our previously stated expectations to $71.8 million from $238.4 million in 2013 as customers switch to new generations of these products from other suppliers. The Legacy segment remains profitable to the Group as no R&D expense is incurred on these product lines.
Our Income Statement – 2014 compared to 2013
| | | | | | | | | | | | | | | | | | | | | | | | |
| | | 2014 | | | 2013 | | | | | | | |
| | | | | | | | | | | | | | | Increase | | | | |
| | | Amount | | | | | | Amount | | | | | | (decrease) | | | | |
| | | $ million | | | % of Revenue | | | $ million | | | % of Revenue | | | $ million | | | % change | |
| | | | | | |
Revenue | | | 774.8 | | | | 100.0 | | | | 960.7 | | | | 100.0 | | | | (185.9) | | | | (19) | |
| | | | | | |
Cost of sales | | | (324.9) | | | | (41.9) | | | | (465.4) | | | | (48.4) | | | | 140.5 | | | | 30 | |
| | | | | | |
Underlying cost of sales | | | (321.6) | | | | (41.5) | | | | (457.3) | | | | (47.6) | | | | 135.7 | | | | 30 | |
| | | | | | |
Gross profit | | | 449.9 | | | | 58.1 | | | | 495.3 | | | | 51.6 | | | | (45.4) | | | | (9) | |
| | | | | | |
Underlying gross profit | | | 453.2 | | | | 58.5 | | | | 503.4 | | | | 52.4 | | | | (50.2) | | | | (10) | |
| | | | | | |
R&D expenses | | | (240.9) | | | | (31.1) | | | | (273.1) | | | | (28.4) | | | | 32.2 | | | | 12 | |
| | | | | | |
Underlying R&D expenses | | | (223.6) | | | | (28.9) | | | | (248.4) | | | | (25.9) | | | | 24.8 | | | | 10 | |
| | | | | | |
SG&A expenses | | | (150.2) | | | | (19.4) | | | | (193.7) | | | | (20.2) | | | | 43.5 | | | | 22 | |
| | | | | | |
Underlying SG&A expenses | | | (119.7) | | | | (15.4) | | | | (150.7) | | | | (15.7) | | | | 31.0 | | | | 21 | |
| | | | | | |
Non-current asset impairment reversal (charge) | | | 23.3 | | | | 3.0 | | | | (76.9) | | | | (8.0) | | | | 100.2 | | | | n/a | |
| | | | | | |
Gain on disposal of Imaging IP | | | 14.9 | | | | 1.9 | | | | – | | | | – | | | | 14.9 | | | | n/a | |
| | | | | | |
Operating profit (loss) | | | 97.0 | | | | 12.5 | | | | (48.4) | | | | (5.0) | | | | 145.4 | | | | n/a | |
| | | | | | |
Underlying operating profit | | | 109.9 | | | | 14.2 | | | | 104.3 | | | | 10.9 | | | | 5.6 | | | | 5 | |
| |
Revenue
Our revenue is generated principally from the sale of products to producers of consumer electronic equipment, original design manufacturers and distributors.
In 2014, our revenue decreased $185.9 million to $774.8 million from $960.7 million in 2013. This decrease was primarily due to the expected decline in our Legacy segment, reduced volumes of Auto aftermarket and Gaming products and our withdrawal from the Cameras market following our decision to discontinue development of future COACH products. This decrease was partially offset by growth in the Voice & Music and Auto factory-fit businesses. These factors are explained in more detail in the segmental review above.
Volume weighted average selling prices increased by approximately 23% during 2014. This increase was primarily due to a change in mix as lower priced Legacy products became a smaller proportion of our total business and revenue. There is an established industry trend for individual products to see declining average selling prices as they mature and we seek to mitigate this by investing in the development of new technologies and products that can command higher prices for innovative features that may be attractive to our customers.
Financial reportcontinued
Analysis of Revenue
We operate in three principal geographic areas: Asia, the Americas and Europe. We consistently derive the significant majority of our revenue from business with customers whose manufacturing locations are based in Asia.
In 2014, our top ten customers provided 37% of total revenue (2013: 39%, 2012: 40%). Further information about our geographic reach and our major customers can be found in note 5 to the consolidated financial statements.
Gross margin and gross profit
In 2014, our gross margin increased to 58.1% (2013: 51.6%) primarily due to a change in product mix with more of our revenue being generated from our higher margin Voice & Music and Auto segments because our lower margin Legacy and Cameras products saw expected reductions in volume.
The increase in gross margin was not enough to offset the overall decline in revenue and therefore, gross profit decreased to $449.9 million in 2014 from $495.3 million in 2013. Gross profit includes $3.3 million of amortisation of intangible assets arising from historical acquisitions (2013: $8.1 million). Excluding these charges, the underlying gross profit for 2014 was $453.2 million, which resulted in an underlying gross margin of 58.5%. (2013: $503.4 million, 52.4%).
Research and Development (R&D) expenses
We analyse R&D expenses between underlying and other R&D expenses. The table below sets forth the main components of the total R&D expense, and highlights the differences between these two measures.
| | | | | | | | | | | | | | | | | | | | | | | | |
| | | 2014 | | | 2013 | | | 2014 vs 2013 | |
| | | Amount
$ million | | | % of
Revenue | | | Amount
$ million | | | % of
Revenue | | | Decrease
$ million | | | % change | |
| |
Research and Development | | | | | | | | | | | | | | | | | | | | | | | | |
| | | | | | |
Underlying R&D expenses | | | 223.6 | | | | 29.0 | | | | 248.4 | | | | 25.9 | | | | (24.8 | ) | | | 10 | |
| | | | | | |
Share-based payment charges | | | 16.4 | | | | 2.0 | | | | 22.9 | | | | 2.4 | | | | (6.5 | ) | | | 28 | |
| | | | | | |
Amortisation of acquired intangible assets | | | 0.9 | | | | 0.1 | | | | 1.8 | | | | 0.2 | | | | (0.9 | ) | | | 50 | |
| |
Total | | | 240.9 | | | | 31.1 | | | | 273.1 | | | | 28.4 | | | | (32.2 | ) | | | (12) | |
| |
Underlying R&D expenses decreased 10% to $223.6 million in 2014 which was mainly due to a decrease in variable employee expenses and the result of ceasing further investment into COACH product development. Share-based payment charges decreased by $6.5 million between 2014 and 2013. The reduced cost was due to a decrease in the number of share options and awards granted in 2014, and there was a one-off charge in 2013 relating to the vesting of one year retention awards issued in 2012. Amortisation of acquired intangibles decreased in 2014 as assets acquired in historic acquisitions reached the end of their useful economic life. Sales, General and Administration (SG&A) expenses We analyse total SG&A expenses between underlying SG&A and other costs. The table below sets forth the main components of the total SG&A expense, and highlights the differences between the underlying and total SG&A measures: | |
| | | 2014 | | | | | | 2013 | | | 2014 vs 2013 | |
| | | Amount
$ million | | | % of
Revenue | | | Amount
$ million | | | % of
Revenue | | | (Decrease)
increase
$ million | | | % change | |
| |
Sales, general and administrative | | | | | | | | | | | | | | | | | | | | | | | | |
| | | | | | |
Underlying SG&A expenses | | | 119.7 | | | | 15.5 | | | | 150.7 | | | | 15.7 | | | | (31.0 | ) | | | 21 | |
| | | | | | |
Amortisation of acquired intangible assets | | | 4.4 | | | | 0.6 | | | | 6.8 | | | | 0.7 | | | | (2.4 | ) | | | 35 | |
| | | | | | |
Share-based payment charges | | | 13.4 | | | | 1.7 | | | | 15.4 | | | | 1.6 | | | | (2.0 | ) | | | 13 | |
| | | | | | |
Integration and restructuring costs | | | 2.0 | | | | 0.3 | | | | 24.7 | | | | 2.6 | | | | (22.7 | ) | | | 92 | |
| | | | | | |
Transaction costs | | | 12.0 | | | | 1.5 | | | | – | | | | – | | | | 12.0 | | | | n/a | |
| | | | | | |
Patent & litigation settlement | | | – | | | | – | | | | 4.7 | | | | 0.5 | | | | (4.7 | ) | | | n/a | |
| | | | | | |
Release of litigation provision | | | – | | | | – | | | | (9.8 | ) | | | (1.0 | ) | | | 9.8 | | | | n/a | |
| | | | | | |
Fair value of contractual milestones | | | – | | | | – | | | | 5.0 | | | | 0.5 | | | | (5.0 | ) | | | n/a | |
| | | | | | |
Other operating income | | | (1.3 | ) | | | (0.2 | ) | | | (3.8 | ) | | | (0.4 | ) | | | 2.5 | | | | (66) | |
| |
Total | | | 150.2 | | | | 19.4 | | | | 193.7 | | | | 20.2 | | | | (43.5 | ) | | | (22) | |
| |
| | |
| 22 | | CSR plc Annual Report and Financial Statements 2014 |
Overall SG&A costs decreased 22% to $150.2 million in 2014 from $193.7 million in 2013, which was due to:
| — | | Lower underlying SG&A expenses driven by lower variable employee expenses, reduced litigation activity and a reduction in average SG&A headcount from 659 in 2013, to 611 in 2014; |
| — | | Reduced amortisation of acquired intangibles as assets recognised in historic acquisitions become fully amortised; |
| — | | A decrease in share based payment charges due to the lower volume of share options and awards granted during the year, as well as a relatively high charge in 2013 arising from the release of retention awards with a one year vesting period; |
| — | | Reduced litigation settlement costs compared to 2013 when we settled outstanding litigation for $4.7 million (see page 20 for further information); |
| — | | Significantly reduced integration and restructuring costs due to less activity in these areas during 2014. An explanation of these costs can be found in note 28 to the consolidated financial statements; and |
| — | | The one-off cost of $5.0 million booked in 2013 for a provision against possible adjustments in consideration from the Samsung Transaction based on the timing of certain deliverables that CSR and Samsung agreed to deliver together. This liability was fully settled in 2014. |
This decrease in SG&A expenses was partially offset by:
| — | | The one-off release of a $9.8 million litigation provision in 2013 relating to historical litigation as explained on page 112; |
| — | | A decline in the operating income we earned as part of the agreed terms of the Samsung Transaction due to a reduction in the level of support provided. This activity ceased in October 2014 and we do not expect any further recurring income or costs arising from the transaction; and |
| — | | Transaction costs of $12.0 million arising from the proposed Qualcomm Transaction, including $5.6 million on assignment of contracts and $5.0 million on legal fees. |
Other items
In 2014, we recognised an impairment reversal of $23.3 million, and gain on disposal of Imaging IP associated with the COACH business of $14.9 million both of which are explained on page 19.
In 2013, following the announcement that we were no longer investing in further development of certain camera products, we impaired goodwill and fixed assets allocated to the Cameras cash generating unit (‘CGU’) by $76.9 million. For further details see page 20.
Operating result
Our IFRS operating profit for 2014 was $97.0 million. This primarily reflected a combination of underlying operating profit of $109.9 million, an impairment reversal and gain on disposal of Imaging IP associated with the Cameras business, and $29.8 million of share option charges. All of these items are fully explained in the paragraphs above. The IFRS operating margin was 12.5% for 2014, compared to a loss of 5.0% in 2013.
Underlying operating margin was 14.2% in 2014 compared to 10.9% in 2013, the increase was mainly driven by lower in R&D and SG&A expenses and higher gross margin on lower revenues. These factors are discussed in more detail in the paragraphs above. In 2014 underlying operating profit was $109.9 million, compared to $104.3 million in 2013.
Investment income and finance costs
Investment income primarily represents the interest earned on our cash, cash equivalents and treasury deposits. During 2014 these averaged $262.8 million (2013 $302.4 million). The 2014 average was lower due to the timing of cash outflows arising from the return of capital to shareholders in 2013 and 2014, offset by the net cash injection of $30.4 million following the sale of Imaging IP assets as explained on page 19.
A breakdown of finance costs can be found in note 9 to the consolidated financial statements.
Taxation
The tax credit for 2014 was $3.0 million, compared to a credit of $6.1 million in 2013. This results in an effective tax rate of -3.2% for the year (2013: 11.6%).
The rate is lower than the average UK statutory rate of 21.5% mainly due to the offset of tax losses for which no deferred tax asset had been recognised, together with the recognition of a deferred tax asset with respect to temporary differences relating to our Israeli subsidiary, following stabilisation of its business model subsequent to sale of our Imaging IP. The lower tax rate for 2013 was due primarily to the non-deductibility for tax purposes of the Cameras impairment, although this was offset in part by the release of historical provisions relating to the former Zoran operations.
The underlying effective tax rate for 2013 was 16.6%, which differed from the rate of 21.5% due mainly to reductions from the UK Patent Box and the offset of tax losses for which no deferred tax asset had been recognised.
The underlying effective tax rate excludes the tax impacts of items not included within our underlying profit before tax measure. It also excludes the impact of tax rate changes on our deferred tax assets and liabilities, and changes to deferred tax assets due to additional loss (or other temporary difference) recognition or de-recognition.
Profit (loss) for the period
We recorded a profit for the period of $96.8 million, compared to a loss of $46.4 million in 2013, which was mainly due to the increase in operating result in the year and taxation movements, as explained in earlier paragraphs.
We recorded an underlying profit for the period of $90.0 million, compared to $81.1 million in 2013, reflecting the improvement in underlying operating profit and reduction in taxation costs as explained above.
Financial reportcontinued
Earnings per share
Basic and diluted earnings per ordinary share were $0.59 and $0.55 respectively in 2014, compared to basic and diluted loss per ordinary share of $0.28 and $0.28 in 2013. Underlying diluted earnings per ordinary share was $0.51 in 2014 and $0.46 in 2013.
The main factors leading to these movements were the change in profitability for the period, as described on page 23. The weighted average diluted number of shares for 2014 of 175.6 million was broadly consistent with 2013 (175.4 million), as the ordinary shares bought back and cancelled during the period were offset by the exercise of share options and awards and improvements in the share price, increasing the dilutive effect of outstanding options.
Balance Sheet
| | | | | | | | |
| | | 26 December 2014 $ million | | | 27 December 2013 $ million | |
| |
Non-current assets | | | | | | | | |
| | |
Goodwill | | | 133.3 | | | | 131.3 | |
| | |
Other intangible assets | | | 65.0 | | | | 72.3 | |
| | |
Property, plant and equipment | | | 43.9 | | | | 36.4 | |
| | |
Investments | | | 3.5 | | | | 2.5 | |
| | |
Deferred tax asset | | | 129.3 | | | | 109.2 | |
| | |
Long-term asset | | | – | | | | 31.0 | |
| |
| | |
| | | 375.0 | | | | 382.7 | |
| | |
Current assets | | | | | | | | |
| | |
Inventories | | | 56.4 | | | | 73.9 | |
| | |
Derivative financial instruments | | | – | | | | 6.2 | |
| | |
Trade and other receivables | | | 154.6 | | | | 114.2 | |
| | |
Treasury deposits | | | 75.4 | | | | 78.8 | |
| | |
Cash and cash equivalents | | | 207.8 | | | | 227.4 | |
| |
| | | 494.2 | | | | 500.5 | |
| |
Total assets | | | 869.2 | | | | 883.2 | |
| |
| | |
Current liabilities | | | (183.7 | ) | | | (218.2) | |
| | |
Non-current liabilities | | | (21.5 | ) | | | (35.4) | |
| |
Total liabilities | | | (205.2 | ) | | | (253.6) | |
| |
| | |
| | | | | | | | |
| |
Net assets | | | 664.0 | | | | 629.6 | |
| |
Goodwill
Goodwill at 26 December 2014 was $133.3 million, including $2.0 million arising in 2014 from the acquisition of the trade and assets of Reciva Ltd, (see note 34 to the consolidated financial statements).
Note 13 to the consolidated financial statements explains how we test goodwill for impairment and the assumptions we use in this test.
Intangible assets and property, plant and equipment (PPE)
During 2014, we invested $29.2 million in our PPE and intangible assets, the majority being in new leasehold offices and IT infrastructure following office moves in India, the UK and the US.
Intangible assets of $3.1 million were acquired during the year as part of our acquisition of the trade and assets of Reciva Ltd which is explained in note 34 to the consolidated financial statements.
An impairment of $26.2 million booked in 2013 related to the Imaging IP associated with the COACH business, of which $23.3 million was reversed during 2014 after we became aware of a fair value on disposal for this IP. These assets were later sold generating a profit of $14.9 million. For further details see note 33 to the consolidated financial statements.
Deferred tax
The increase in the deferred tax asset to $129.3 million at 26 December 2014 from $109.2 million at 27 December 2013 is mainly due to the increase in future tax deductions with respect to share options resulting from the increase in CSR plc’s share price during 2014, together with the recognition of an asset with respect to Israeli tax losses as mentioned on page 23. The deferred tax liability of $3.9 million relates to tax payable in future periods with respect to the Samsung Transaction and withholding tax on accrued but unpaid interest on intercompany balances.
Long-term asset
Amounts previously presented as long term assets that arose in connection with the Samsung Transaction in 2012, became due in less than one year during 2014 and are therefore disclosed in Trade and other receivables.
| | |
| 24 | | CSR plc Annual Report and Financial Statements 2014 |
Inventory
Within Inventory, we report silicon wafers owned by us but consigned to an assembly company as raw materials. These become work-in-progress while they are being assembled, and finished goods once they are fully assembled chips. We aim to maintain sufficient inventory to enable us to meet our customer lead times, which are often short to meet the end customer patterns of demand. We seek to balance this with our awareness and assessment of the pace of change in consumer end markets and the need to minimise working capital to earn returns for shareholders.
Inventory was $56.4 million compared to $73.9 million in 2013. This 24% decrease reflected the reduction in the number of different products offered by CSR as our Legacy and COACH products reach the end of their life cycle.
Trade & other receivables
Trade receivables represent 38 debtors days compared to 37 days in 2013. Other receivables include $31.0 million due within 12 months but which was previously disclosed as a long-term asset. This represents cash held in escrow to meet specific types of warranty claims arising from the IP transferred in the Samsung Transaction of 2012.
Liabilities
We had total liabilities of $208.2 million as at 26 December 2014, compared to $253.6 million as at 27 December 2013.
Accruals decreased by $54.6 million during 2014 primarily due to lower variable employee benefits and the payments made in respect of historic litigation settlements with deferred payment terms. Provisions for restructuring of $7.7 million were utilised during 2014.
Contractual obligations
As shown in the table below, as at 26 December 2014, our principal contractual obligations consisted of amounts payable under operating leases, trade and other payables and outstanding purchase obligations. The Group did not have any off balance sheet arrangements other than the operating leases shown in the table below.
The Group has a defined benefit severance plan in its Israeli subsidiary. For more details see note 30 to the consolidated financial statements.
| | | | | | | | | | | | | | | | | | | | |
| | | Total
$ million | | | Less than 1 year
$ million | | | 1 to 3 years
$ million | | | 3 to 5 years
$ million | | | More than 5 years
$ million | |
| |
Operating leases | | | 101.2 | | | | 34.6 | | | | 29.2 | | | | 11.8 | | | | 25.6 | |
| | | | | |
Trade and other payables1 | | | 183.6 | | | | 175.4 | | | | 8.2 | | | | – | | | | – | |
| | | | | |
Purchase obligations2 | | | 84.0 | | | | 83.8 | | | | 0.2 | | | | – | | | | – | |
| |
1 Trade and other payables includes a litigation settlement of $15.6 million, payable over 1.25 years.
2 Purchase obligations represent non-cancellable purchase orders.
Our Cash flows
| | | | | | | | |
| | | 52 weeks ended
26 December 2014
$ million | | | 52 weeks ended
27 December 2013
$ million | |
| |
Cash, Cash Equivalents & Treasury Deposits | | | | | | | | |
| | |
As at 27 December 2013 | | | 306.2 | | | | | |
| | |
As at 28 December 2012 | | | | | | | 333.3 | |
| | |
Operating cash flows before movements in working capital | | | 106.0 | | | | 90.3 | |
| | |
Working capital | | | (34.1) | | | | (5.1) | |
| | |
Taxation | | | (2.5) | | | | (2.5) | |
| | |
Interest paid | | | (0.3) | | | | (0.4) | |
| | |
Net cash from operating activities | | | 69.1 | | | | 82.3 | |
| | |
Acquisition of Reciva business | | | (5.1) | | | | – | |
| | |
Disposal of Imaging IP | | | 30.4 | | | | – | |
| | |
Capital expenditure (purchase of intangible assets and property, plant and equipment) | | | (35.8) | | | | (41.0) | |
| | |
Proceeds from issue of shares | | | 15.1 | | | | 24.2 | |
| | |
Other financing and investing activities and the effect of foreign exchange rates | | | (2.8) | | | | (0.6) | |
| | |
Purchases of own shares | | | (70.3) | | | | (71.6) | |
| | |
Payment of dividends | | | (23.6) | | | | (20.4) | |
| |
Net decrease in cash, cash equivalents and treasury deposits | | | (23.0) | | | | (27.1) | |
| | |
As at 26 December 2014 | | | 283.2 | | | | | |
| | |
As at 27 December 2013 | | | | | | | 306.2 | |
| |
|
Financial reportcontinued |
Cash, cash equivalents and treasury deposits decreased to $283.2 million as at 26 December 2014, compared to $306.2 million at 27 December 2013.
We hold cash funds with differing rates of liquidity. Funds that are immediately available or held on short term deposit are called “cash and cash equivalents”, whilst funds placed on deposit for more than 90 days are called treasury deposits and these are disclosed separately on the face of our balance sheet. We use treasury deposits in order to access higher financing returns as we deem that this cash is not needed for immediate business operations. During 2014 we kept 27% of cash as treasury deposits (2013: 26%).
We primarily generate cash from day to day operating activities and therefore we do not rely on any third party financing. We invest in tangible and intangible assets required to continue to develop new products and to ensure our staff work in an effective environment. In 2014 we spent $35.8 million on capital additions including items capitalised in prior years. We do not have significant cashflows relating to tax or investing. In 2014, we paid cash dividends of $23.6 million (2013: $20.4 million), and spent $70.3 million (2013: $71.6 million) on share buybacks as described on pages 78 and 79.
During 2014, we paid $5.1 million for the trade and assets of Reciva Ltd and received $36.5 million from the sale of Imaging IP assets, whilst incurring $6.1 million of directly attributable costs. See notes 33 and 34 to the consolidated financial statements for further explanation.
We use cash remaining after capital expenditure, taxation and investing to support our strategic objectives to increase profitability and grow shareholder returns. During 2014 we made distributions to shareholders in the form of dividends and through buybacks of ordinary shares.
Cash purchases of our own shares in 2014 include $62.7 million from buyback programmes and $7.6 million through the EBT (see page 80 for further information). These values include trades that were made in 2013 but were cash settled in 2014.
Proceeds from issues of shares of $15.1 million were recieved during 2014, a decrease from $24.2 million in 2013, due to a lower number of share options and awards being exercised by employees and a lower weighted average exercise price.
A full breakdown of cashflows can be found in the consolidated financial statements on pages 87 and 115, whilst details of our capital management and liquidity policies can be found on page 31.
Review of 2013
Segmental performance 2013
| | | | | | | | | | | | | | | | | | | | |
| | | 2013 | | | 2013 | | | 2012 | | | 2012 | | | 2013 vs 2012 | |
| Revenue | | $ million | | | % Revenue | | | $ million | | | % Revenue | | | % change | |
| |
Auto segment | | | 228.8 | | | | 23.8 | | | | 212.2 | | | | 20.8 | | | | 8 | |
| | | | | |
Consumer segment | | | 181.5 | | | | 18.9 | | | | 258.7 | | | | 25.2 | | | | (30) | |
| | | | | |
Voice & Music segment | | | 312.0 | | | | 32.5 | | | | 190.2 | | | | 18.5 | | | | 64 | |
| |
Core business group | | | 722.3 | | | | 75.2 | | | | 661.1 | | | | 64.5 | | | | 9 | |
| | | | | |
Legacy segment | | | 238.4 | | | | 24.8 | | | | 364.3 | | | | 35.5 | | | | (35) | |
| |
Total | | | 960.7 | | | | 100.0 | | | | 1,025.4 | | | | 100.0 | | | | (6) | |
| |
Underlying operating result* | | | | | | | | | | | | | | | | | | | | |
| | | | | |
Auto segment | | | (7.4 | ) | | | – | | | | 3.2 | | | | – | | | | (331) | |
| | | | | |
Consumer segment | | | (70.4 | ) | | | – | | | | (15.6 | ) | | | – | | | | (351) | |
| | | | | |
Voice & Music segment | | | 123.1 | | | | – | | | | 75.1 | | | | – | | | | 64 | |
| |
Core business group | | | 45.3 | | | | – | | | | 62.7 | | | | – | | | | (28) | |
| | | | | |
Legacy segment | | | 59.0 | | | | – | | | | 11.3 | | | | – | | | | 422 | |
| |
Total | | | 104.3 | | | | – | | | | 74.0 | | | | – | | | | 41 | |
| |
* Operating result means the underlying operating profit or (loss) in the year
Auto
In 2013, revenue from our Auto segment increased 8% to $228.8 million, from $212.2 million in 2012.
During 2013, we saw higher volumes from the continued growth in adoption rates of Bluetooth, location products and Wi-Fi technologies in cars in line with the general trend by Tier One manufacturers to adopt connectivity and location features in their vehicles.
The underlying operating loss in 2013 for the Auto segment was $7.4 million compared to a profit of $3.2 million in 2012 reflecting our increase in R&D investment in this segment during 2013.
| | |
| 26 | | CSR plc Annual Report and Financial Statements 2014 |
Consumer
In 2013, revenue from our Consumer segment decreased 30% to $181.5 million from $258.7 million in 2012. This decrease was primarily driven by a 58% fall in revenue from our Cameras business line, reflecting the decline in the digital-still camera market as consumers continued to switch to photo technology embedded in smartphones.
The underlying operating loss for Consumer in 2013 was $70.4 million (2012: $15.6 million). While gross margin percentages in Consumer business lines remained strong, the operating loss increased compared to 2012, as a result of the lower sales volumes in Cameras. In addition, profitability declined further as we continued to invest in R&D for the nascent Bluetooth Smart and Indoor Location technologies.
Voice & Music
In 2013, revenue from our Voice & Music segment increased 64% to $312.0 million, from $190.2 million in 2012.
During 2013, we continued to see strong growth in Voice & Music driven by the increased consumer demand for playing digital content wirelessly on remote speakers, speaker docks and wireless stereo headphones. In the first half of 2013, we saw significant additional revenue for our mono audio headset products due to demand driven by enforcement of hands-free driving legislation in China, which, as expected, did not continue into the second half of the year.
Underlying operating profit for Voice & Music in 2013 grew to $123.1 million (2012: $75.1 million), due to volume growth in higher margin stereo products, as well as the impact of the above mentioned increased volume of mono headset sales in China.
Legacy
In 2013, revenue derived from our Legacy segment decreased 35% to $238.4 million from $364.3 million in 2012. Performance was better than we expected primarily because of unanticipated continued demand for Legacy handset products.
Our Income Statement – 2013 compared to 2012
| | | | | | | | | | | | | | | | | | | | | | | | |
| | | 2013 | | | 2012 | | | | |
| | | Amount $ million | | | % of Revenue | | | Amount
million | | | % of Revenue | | | Increase
(decrease) $ million | | | % change | |
| |
Revenue | | | 960.7 | | | | 100.0 | | | | 1,025.4 | | | | 100.0 | | | | (64.7 | ) | | | (6) | |
| | | | | | |
Cost of sales | | | (465.4) | | | | (48.4) | | | | (516.3 | ) | | | (50.4 | ) | | | 50.9 | | | | 10 | |
| | | | | | |
Underlying cost of sales | | | (457.3) | | | | (47.6) | | | | (505.0 | ) | | | (49.2 | ) | | | 47.7 | | | | 9 | |
| | | | | | |
Gross profit | | | 495.3 | | | | 51.6 | | | | 509.1 | | | | 49.6 | | | | (13.8 | ) | | | (3) | |
| | | | | | |
Underlying gross profit | | | 503.4 | | | | 52.4 | | | | 520.4 | | | | 50.8 | | | | (17.0 | ) | | | (3) | |
| | | | | | |
R&D expenses | | | (273.1) | | | | (28.4) | | | | (290.4 | ) | | | (28.3 | ) | | | 17.3 | | | | 6 | |
| | | | | | |
Underlying R&D expenses | | | (248.4) | | | | (25.9) | | | | (272.3 | ) | | | (26.6 | ) | | | 23.9 | | | | 9 | |
| | | | | | |
SG&A expenses | | | (193.7) | | | | (20.2) | | | | (238.0 | ) | | | (23.2 | ) | | | 44.3 | | | | 19 | |
| | | | | | |
Underlying SG&A expenses | | | (150.7) | | | | (15.7) | | | | (174.1 | ) | | | (17.0 | ) | | | 23.4 | | | | 13 | |
| | | | | | |
Goodwill and non-current asset impairment charges | | | (76.9) | | | | (8.0) | | | | 0.0 | | | | 0.0 | | | | (76.9 | ) | | | n/a | |
| | | | | | |
Profit on disposal | | | 0.0 | | | | 0.0 | | | | 127.2 | | | | 12.4 | | | | (127.2 | ) | | | n/a | |
| | | | | | |
Operating (loss) profit | | | (48.4) | | | | (5.0) | | | | 107.9 | | | | 10.5 | | | | (156.3 | ) | | | (145) | |
| | | | | | |
Underlying operating profit | | | 104.3 | | | | 10.9 | | | | 74.0 | | | | 7.2 | | | | 30.3 | | | | 41 | |
| |
| |
Revenue
In 2013, our revenue decreased by $64.7 million to $960.7 million (2012: $1,025.4 million) primarily due to handset customers switching to alternative suppliers for next-generation chips following the disposal of our handset connectivity and handset location development operations to Samsung in 2012 and declining demand for the Group’s camera technologies. This decrease was partially offset by growth in the Auto and the Voice & Music segments. These factors are explained in more detail in the segmental review above.
Volume weighted average selling prices decreased by approximately 5% during 2013. This decline was caused by usual product life cycle trends offset by a change in product mix, as lower priced handset chips became a smaller proportion of our business.
Geographic analysis of revenue
Information on our geographical splits of revenue can be found in note 5 to the consolidated financial statements.
Major customers
In 2013, our top ten customers provided 39% of total revenue (2012: 40%; 2011: 46%). Further information about our major customers can be found in note 5 to the consolidated financial statements.
|
Financial reportcontinued |
Gross profit
In 2013, our gross profit margin increased to 51.6% (2012: 49.6%) primarily due to a change in product mix where falling sales volumes of Legacy handset products were partially replaced by higher margin products from our Voice & Music and Auto segments.
The increase in gross margin was not enough to offset the effect of declining revenues and therefore gross profit decreased to $495.3 million in 2013, from $509.1 million in 2012. Gross profit includes $8.1 million of amortisation of intangible assets arising from historical acquisitions (2012: $11.3 million). Excluding these charges, the underlying gross profit for 2013 was $503.4 million, producing an underlying gross margin of 52.4%. (2012: $520.4 million, 50.8%).
R&D expenses
We analyse R&D expenses between underlying and other R&D expenses. The table below sets forth the main components of the total R&D expense, and highlights the differences between these two measures.
| | | | | | | | | | | | | | | | | | | | | | | | |
| | | 2013 | | | 2012 | | | 2013 vs 2012 | |
| | | Amount
$ million | | | % of
Revenue | | | Amount
$ million | | | % of Revenue | | | Increase
(decrease)
$ million | | | % change | |
| |
Research and development | | | | | | | | | | | | | | | | | | | | | | | | |
| | | | | | |
Underlying R&D expenses | | | 248.4 | | | | 25.8 | | | | 272.3 | | | | 26.5 | | | | (23.9) | | | | (9) | |
| | | | | | |
Share-based payment charges | | | 22.9 | | | | 2.4 | | | | 15.0 | | | | 1.5 | | | | 7.9 | | | | 53 | |
| | | | | | |
Amortisation of acquired intangible assets | | | 1.8 | | | | 0.2 | | | | 3.1 | | | | 0.3 | | | | (1.3) | | | | (42) | |
| |
Total | | | 273.1 | | | | 28.4 | | | | 290.4 | | | | 28.3 | | | | (17.3) | | | | (6) | |
| |
Underlying R&D costs decreased 9% to $248.4 million in 2013, mainly due to the inclusion of $6.2 million of UK R&D tax credits, and a reduction in R&D headcount following the transfer of 288 engineers to Samsung as part of the Samsung Transaction in 2012. Primarily because of this transaction, we saw the average R&D headcount fall from 1,654 in 2012, to 1,458 in 2013. Share-based payment charges increased by $7.9 million from 2012 to 2013 due to the increase in the our share price, which increased both the fair value of share options and awards issued in 2013 and the accrued cost of cash settled shares and associated taxes. Amortisation of acquired intangibles fell in 2013 because assets recognised as part of our 2009 acquisition of the SiRF group became fully amortised in the year. SG&A expenses SG&A expenses decreased 19% to $193.7 million in 2013 (2012: $238.0 million). We analyse total SG&A expenses between underlying SG&A and other costs. The table below sets forth the main components of the total SG&A expenses, and highlights the differences between the underlying and total SG&A measures: | |
| | | 2013 | | | 2012 | | | 2013 vs 2011 | |
| | | Amount
$ million | | | % of
Revenue | | | Amount
$ million | | | % of
Revenue | | | Increase
(decrease)
$ million | | | % change | |
| |
Sales, general and administrative | | | | | | | | | | | | | | | | | | | | | | | | |
| | | | | | |
Underlying SG&A expenses | | | 150.7 | | | | 15.7 | | | | 174.1 | | | | 17.0 | | | | (23.4) | | | | (13) | |
| | | | | | |
Amortisation of acquired intangible assets | | | 6.8 | | | | 0.7 | | | | 8.3 | | | | 0.8 | | | | (1.5) | | | | (18) | |
| | | | | | |
Share-based payment charges | | | 15.4 | | | | 1.6 | | | | 12.8 | | | | 1.2 | | | | 2.6 | | | | 20 | |
| | | | | | |
Integration and restructuring costs | | | 24.7 | | | | 2.6 | | | | 27.5 | | | | 2.7 | | | | (2.8) | | | | (10) | |
| | | | | | |
Patent & litigation settlement | | | 4.7 | | | | 0.5 | | | | 15.5 | | | | 1.5 | | | | (10.8) | | | | (70) | |
| | | | | | |
Release of litigation provision | | | (9.8) | | | | (1.0) | | | | – | | | | – | | | | (9.8) | | | | n/a | |
| | | | | | |
Fair value of contractual milestones | | | 5.0 | | | | 0.5 | | | | – | | | | – | | | | 5.0 | | | | n/a | |
| | | | | | |
Other operating income | | | (3.8) | | | | (0.4) | | | | (0.2) | | | | – | | | | (3.6) | | | | n/a | |
| |
Total | | | 193.7 | | | | 20.2 | | | | 238.0 | | | | 23.2 | | | | (44.3) | | | | (19) | |
| |
| | |
| 28 | | CSR plc Annual Report and Financial Statements 2014 |
SG&A expenses decreased 19% to $193.7 million in 2013 from $238.0 million in 2012, which was due to:
| — | | Lower underlying SG&A costs driven by a reduction in average headcount from 820 to 659 due to the full year impact of restructuring activities in 2012, including the transfer of 23 SG&A employees as part of the Samsung Transaction; |
| — | | A decrease in amortisation of acquired intangibles in 2013 as assets recognised as part of our 2009 acquisition of the SiRF group became fully amortised during the year; |
| — | | A decrease in integration and restructuring costs as restructuring activity arising from the Zoran and Samsung transactions ceased but was offset by $6.5 million of costs due to our decision to withdraw from future COACH product investment. Integration and restructuring costs during 2012 were significantly higher than 2013 and consisted of the final restructuring and integration programme costs following the 2011 Zoran acquisition, and costs arising following the Samsung Transaction. A breakdown of integration and restructuring costs can be found in note 28 to the consolidated financial accounts; |
| — | | The release of a provision of $9.8 million relating to historical litigation. See page 112 for further information; and |
| — | | Operating income arising from the R&D support we provided to Samsung as part of the Samsung Transaction increased as it covered a full year of activity. Costs associated with this support are reported within restructuring and integration costs. |
The decrease in SG&A expenses was partially offset by:
| — | | An increase in share based payment charges due to the increase in our share price, which increased both the fair value of share options and awards issued in the year and the accrued cost of cash settled shares and associated taxes; |
| — | | A provision made for possible adjustment of up to $5.0 million in consideration (which was dependent on the timing of certain deliverables) under the terms of the Samsung Transaction. As at 27 December 2013, we estimated the fair value at $5.0 million. This was fully settled during 2014; and |
| — | | The settlement of outstanding litigation for $4.7 million. |
Other items
In 2013, following the announcement that we were no longer investing in further development of future COACH products, we impaired $76.9 million in respect of goodwill and fixed assets allocated to the Camera CGU. For further details see page 20.
In 2012, we recognised a $127.2 million gain on the disposal of development operations in the Samsung Transaction.
Operating result
Our IFRS operating loss for 2013 was $48.4 million, compared to an operating profit of $107.9 million 2012. This decrease was mainly due to a non-cash impairment charge of $76.9 million relating to the Cameras CGU, a one-off profit of $127.2 million in 2012 arising from the Samsung Transaction, and lower legacy revenue following the same transaction which reduced gross profit by $13.8 million. These factors were offset by a $61.6 million reduction in operating costs primarily due to lower headcount as well as savings on litigation and restructuring costs. All of these items are more fully explained in the paragraphs above. The IFRS operating margin for 2013 was a loss of 5.0% compared to a profit of 10.5% in 2012.
Underlying operating profit was $104.3 million, compared to $74.0 million in 2012. This increase was mostly driven by the reduction in underlying R&D and SG&A costs discussed in the preceding paragraphs. Underlying operating margin was 10.9% in 2013 compared to 7.2% in 2012.
Taxation
The tax credit for 2013 was $6.1 million, compared to a charge of $50.7 million in 2012. This resulted in an effective tax rate of 11.6% for the year (2012: 49.8%).
The rate is lower than the average UK statutory rate of 23.25% due primarily to the non-deductibility for tax purposes of the Cameras impairment, although this was offset in part by the release of historical provisions relating to the former Zoran operations. The higher tax rate for 2012 was driven by a high tax rate on the disposal of our handset connectivity and handset location business to Samsung due primarily to the non-deductibility of the goodwill written off on disposal.
The underlying effective tax rate for 2013 was 20.3%, which differed from the rate of 23.25% mainly due to reductions from US R&D tax credits and the UK Patent Box, combined with the release of provisions following the successful conclusion of audits by various tax authorities, counterbalanced by the impact of non-recognition of trading tax losses in Israel.
The underlying effective tax rate excludes the tax impacts of items not included within our underlying profit before tax measure. It also excludes the impact of tax rate changes on our deferred tax assets and liabilities, and changes to deferred tax assets due to additional loss (or other temporary difference) recognition or de-recognition.
Result for the period
In 2013, we recorded a loss for the period of $46.4 million, compared to a profit of $51.2 million in 2012. This reduction in profitability is mainly due to the reduction in operating profit in the year, and taxation movements, as explained above.
We recorded an underlying profit in 2013 of $81.1 million, compared to $55.4 million in 2012, reflecting the improvement in underlying operating profit and reduction in taxation costs.
Earnings per Share
Basic and diluted losses per ordinary share were $0.28 and $0.28 respectively in 2013, compared to basic and diluted earnings per ordinary share of $0.26 and $0.25 in 2012. Underlying diluted earnings per ordinary share was $0.46 in 2013 and $0.27 in 2012.
The main factors leading to these movements were the change in profitability for the period and the reduction in the number of outstanding ordinary shares following the share buybacks undertaken in 2013 which are explained on pages 78 and 79.
|
Financial reportcontinued |
Our Cash flows in 2013 compared to 2012
| | | | | | | | |
| | | 52 weeks ended
27 December 2013
$ million | | | 52 weeks ended
28 December 2012
$ million | |
| |
Cash, cash equivalents and treasury deposits | | | | | | | | |
| | |
As at 28 December 2012 | | | 333.3 | | | | | |
| | |
As at 30 December 2011 | | | | | | | 277.8 | |
| | |
Operating cash flows before movements in working capital | | | 90.3 | | | | 41.8 | |
| | |
Working capital | | | (5.1 | ) | | | 36.1 | |
| | |
Taxation | | | (2.5 | ) | | | (0.9) | |
| | |
Interest paid | | | (0.4 | ) | | | (3.1) | |
| | |
Net cash from operating activities | | | 82.3 | | | | 73.9 | |
| | |
Disposal of business | | | – | | | | 271.3 | |
| | |
Capital expenditure (purchase of intangible assets and property, plant and equipment) | | | (41.0 | ) | | | (25.6) | |
| | |
Proceeds from issue of shares | | | 24.2 | | | | 53.1 | |
| | |
Other financing and investing activities and the effect of foreign exchange rates | | | (0.6 | ) | | | (2.1) | |
| | |
Purchases of own shares | | | (71.6 | ) | | | (293.8) | |
| | |
Payment of dividends | | | (20.4 | ) | | | (21.3) | |
| | |
Net (decrease) increase in cash, cash equivalents and treasury deposits | | | (27.1 | ) | | | 55.5 | |
| | |
As at 27 December 2013 | | | 306.2 | | | | | |
| | |
As at 28 December 2012 | | | | | | | 333.3 | |
| |
Cash, cash equivalents and treasury deposits decreased by $27.1 million to $306.2 million as at 27 December 2013. A breakdown of this movement is shown in the table above.
In 2013 we generated $82.3 million cash from day-to-day operating activities (2012: $73.9 million) and continued to pay minimal cash tax due to utilisation of tax losses. We also generated cash of $24.2 million from the proceeds of share issues, compared to $53.1 million in 2012 which included a $34.4 million new share issue as part of the 2012 Samsung Transaction. During 2013, we spent $41.0 million on capital expenditure which included $14.0 million on intangible assets which were capitalised in 2012.
We use the cash remaining within the Group after capital expenditure to support our strategic objectives to increase profitability and grow shareholder returns. During 2013, we spent $92.0 million returning cash to shareholders through purchases of our shares and payment of dividends. In 2012, we returned $315.1 million to shareholders of which $284.3 million was returned by way of a Tender Offer with the remainder through share buybacks and dividends. The disposal of development operations in the Samsung Transaction gave a cash inflow to CSR of $271.3 million.
During 2013, we increased longer term cash holdings and held 26% of our total cash balance as treasury deposits (2012: 6%).
| | |
| 30 | | CSR plc Annual Report and Financial Statements 2014 |
Our Finance Policies
Our finance policies are reviewed annually, and changed where necessary to reflect current industry and macro-economic factors. There were no significant changes in our policies during 2014.
Hedging
We operate using a functional currency of USD, which is the currency underlying substantially all of the revenue and cost of sales during the year. Operational expenditure arises in a number of local currencies, with approximately 37% denominated in GBP during 2014.
In order to reduce the volatility of our earnings due to foreign exchange rate fluctuations, we enter into forward contracts to fix an exchange rate for our future GBP denominated expenditure. These contracts are accounted for as cash flow hedges and do not affect the profit and loss until the period in which the related transaction is recorded.
Occasionally, after discussions with our Treasury committee we may choose to hedge against specific transactions in other currencies, if we believe these may cause volatility to the Group results.
See note 3 to our consolidated financial statements for the accounting policies on foreign currencies, derivative financial instruments and hedge accounting. Note 19 sets out details of the fair values of the derivative instruments used for hedging purposes. Note 31 includes a foreign currency sensitivity analysis.
Liquidity
Our primary source of liquidity is the cash inflow from our operations. At present we do not rely on third-party financing and therefore we do not consider liquidity risk to be significant. We manage this risk by maintaining adequate cash reserves and by continuously monitoring forecast and actual cashflows, and matching the maturity of financial assets and liabilities.
Neither CSR nor any of its subsidiaries is subject to any externally imposed capital requirements. There are no material restrictions on the use of any of our cash, cash equivalents or treasury deposits. We hold all our liquid investments in accordance with the counterparty and settlement risk limits in the treasury policy approved by the Board of Directors namely that:
| — | | at any one time cash is placed with at least three banking counterparties; |
| — | | authorised banking counterparties require a credit rating of A3 or above; |
| — | | no more than 30% of money market deposits will have over 90 days maturity and no deposit will have over 12 months duration; and |
| — | | no counterparty can hold more than $75 million of funds, or 25% of aggregate gross cash balances, whichever is higher. |
Capital management
Our policy is to maintain a strong capital base and substantial cash balances so as to maintain customer, creditor, investor and market confidence, as well as to sustain future development of the business. We regularly consider returning funds to shareholders whether through dividends or as part of share buy backs, and we monitor our distributable reserves to ensure we have capacity to do this.
As explained on page 19 during 2014, we bought back 6,360,728 ordinary shares for an aggregate of $61.9 million.
Our issued share capital at 26 December 2014 was 185,955,224 ordinary shares of 0.1 pence each, including 19,855,906 ordinary shares held in Treasury.
Dividend policy
In view of the proposed Qualcomm Transaction, the Board does not intend to pay or recommend for payment any further dividends at this time.
CSR Employee Benefit Trust (‘EBT’)
From time to time, the EBT purchases CSR ordinary shares in the open market. These shares are intended to be used for satisfying obligations to deliver shares under our employee share incentive plans.
The timing of any such transactions is subject to compliance with UK listing regulations, agreement between CSR and the trustees of the EBT, and prevailing market prices. In 2014, the EBT purchased 776,228 ordinary shares for an aggregate of $7.6 million.
Tax policy
The key principles that constitute CSR’s Tax Policy, which is approved by the Board of Directors, are as follows:
| — | | We are compliant with tax laws and regulations in all territories in which we operate and pay tax in accordance with these laws and regulations; |
| — | | We develop and sustain good and transparent working relationships with tax authorities, government bodies and other relevant third parties; and |
| — | | We actively manage our tax affairs, as in all aspects of our business, in such a way as to maximise shareholder value, taking into account not just the immediate fiscal effects, but also longer term considerations including corporate reputation. |
Financial control
We regularly review the internal control environment, and assess our performance against this with a rolling programme of internal audits, the results of which are shared with the audit committee. More details about our control environment can be found in the audit committee report on pages 59 and 60.
Principal risks and uncertainties
Risk – Governance
The Board is responsible for setting the risk appetite of the Group. In so doing, it recognises that in seeking to execute on its strategy and objectives, events will arise that can adversely affect the Group. However, the Board also seeks to ensure that the potential impact of such events on the business are understood and, where possible, appropriate and proportionate measures are adopted that seek to avoid or mitigate the impact of those events. The systems and processes established by the Board are therefore designed to manage, rather than eliminate, the risk of failure to achieve business objectives and provide reasonable, not absolute, assurance against misstatement or loss. The Board has delegated responsibility for the review of practices and procedures to the Audit Committee. The Company’s senior management, assisted by external advisers, are responsible for undertaking periodic reviews of the suitability of current systems on which they report to the Audit Committee.
The Audit Committee considers the findings from such reviews to ensure the effectiveness and efficiency of the processes implemented by senior management. This includes discussions with senior management of the Group and consideration of reports that have been submitted. These findings are in turn considered by the full Board.
At the management level, there is an ongoing process to identify and evaluate risks which might adversely affect the Group and impact the achievement of its objectives. These include matters directly under the influence and control of the Group, such as strategic, operational and financial issues, as well as broader risks which require ongoing assessment and for which the Group may need to adapt, such as compliance with laws and regulations, macroeconomic and political risks. Management conducts regular meetings and engages with external consultants where, in its opinion, it is appropriate to do so.
The assessment of prioritised risks is refreshed on a regular basis to reflect changes to the business and any observations or proposals arising from events since the last review. A schedule of the prioritised risks is developed and reviewed by management each quarter to ensure that possible mitigation measures are considered and plans for action agreed. Responsibility is assigned within the Group for carrying out proposed actions which are also reviewed and updated by management.
As part of its annual review, during the autumn of 2014, the Group engaged outside consultants, Marsh Risk Consulting, to support management in the identification and prioritisation of risks to the Group. Interviews were conducted with personnel across a range of business functions and locations to identify the potential risks which might impact the Group. The results from this assessment were considered by management in supporting the formulation of appropriate mitigation measures and in cascading across the organisation engagement in the awareness and attention to risk management. Findings from the annual review are reported to the Board together with recommended actions for managing the risks and a timetable for implementation of appropriate mitigation. On page 64 in the Corporate Governance Report, we report further on the process for identifying and managing risk.
For each material risk, potential mitigation measures are identified for which a member of management is assigned lead responsibility. These measures are tracked on a regular basis. Management also evaluates whether there are any significant changes to the risks which have the potential to affect the business conducted by the Group. The Board is informed of material changes to risks through reports which it receives and considers at its meetings. This may be as part of regular reports which feature at most meetings, for example the report from the Chief Executive Officer, or specific reports prepared in response to matters that might be raised by members of the Board or initiatives from management. For example, the Board is regularly advised within the CEO report on the performance of each of our business segments. This includes analysis of the impact of the activities of current and emerging competitors and the measures being taken by the Group in order to respond to events such as the introduction of competing technologies or changes in pricing strategies. The reports submitted to the Board also consider circumstances which, whilst recognised as being beyond the direct control and influence of the Group, nonetheless require consideration as to how the strategy of the Group might be affected, or should be adapted to take account of external factors. For example, the Board is kept informed of wider emerging macro-economic and market trends and will consider, for each segment in which the Group operates, how management should address such matters. This might have an impact on the Group’s strategy for future products and technologies. As an example, in 2014 the Company disposed of certain Imaging intellectual property (‘IP’), formerly part of the Group’s Camera business which was no longer part of the Group’s core strategy and in which further investment had ceased. Also, updates are from time to time provided to the Board by members of the management team on specific areas of their responsibility. During 2014, updates were received on work undertaken by members of the Technology Platform Engineering group to implement new measures to improve the development of highly complex software which the Group incorporates into its products.
Responsibilities – framework for identification and management of risk
The Board has overall responsibility for the Group’s risk management process explained above. The Audit Committee reviews the effectiveness of this process through reports it receives from management and, where necessary, external consultants are engaged to support the identification and progress in implementing mitigation measures. Areas considered by the Audit Committee are mentioned in its report on pages 60 to 65. Day-to-day oversight of risk is delegated, initially through the members of the management team who are responsible for the implementation and management of risk mitigation activities. The Board recognises that the Group operates in a dynamic environment and over time the risks which have the potential to most significantly affect the Group are likely to change. Accordingly, during the course of any period, those risks which receive the most attention will reflect these dynamics.
Board consideration of principal risks and uncertainties
The following paragraphs describe the areas of risk and uncertainties faced by the Group on which the Board and the Audit Committee have focused during 2014 and which are expected to be included as areas of focus in 2015. These are therefore regarded as the principal risks and uncertainties faced by the Group. The Group faces a range of risks which are described in the section headed ‘Risk Factors’ on pages 43 to 51.
| | |
| 32 | | CSR plc Annual Report and Financial Statements 2014 |
Risk: failing to provide technological innovation for new products
The success of the Group is dependent upon technological innovation – the creation and implementation of new ideas that represent improvements over the capabilities and features of existing products in the markets where we operate. Success can also depend upon whether we are able to provide solutions that allow our products to function in a way which had not previously been thought possible. Sustaining an environment that promotes creative thinking as well as capturing and evaluating new ideas is an important part of technological innovation. The Group has established various forums within which employees evaluate ideas and consider the potential commercial application, the findings from which are considered by management. In 2014, the Board considered measures to enhance sharing of ideas by our engineers, which were intended to improve how we develop the complex software which forms part of our platform solutions.
We invest significantly in research and development to identify such new ideas and technologies which might be attractive to our customers and which we believe may enable us to differentiate ourselves from our competitors. This includes, for example, the development of new technologies for nascent or recently emerging markets, such as Bluetooth Smart and Indoor Location, as well as the development of new products that incorporate enhanced features or improved performance for more established markets in which the Group operates. One example of such innovation introduced by CSR is CSRmesh. For more information on this product, see page 15.
The Board takes a disciplined approach to the allocation of capital to our research and development activities. As part of making informed investment decisions, we evaluate how the financial and human resources available should be assigned to our R&D activities. The Board receives and considers reports on new ideas which are under evaluation and on how these progress over time. The Board also considers the priorities for the Group in allocating its resources in support of its strategic objectives as well as assessing the capabilities of the organisation to support these objectives.
The process of technological innovation is highly complex and brings many challenges, some of which can be unknown at the outset of a project. These challenges have the potential to arise during the development of new products and can disrupt the fulfillment of objectives. In seeking to mitigate such risks, management keeps under review how ongoing investment compares to the original business case. This includes updates on critical phases during research and development and feedback from engagement with customers on their interest in adopting our technology and solutions. These are kept under review as part of the execution of the project and are reported to management and the Board.
Risk: failing to achieve target timelines for delivery and successful launch of new products
Meeting our strategic objectives and growing our business is dependent on our ability to develop, on a timely basis, innovative and differentiated semiconductor and platform solutions for existing and new markets. In our industry, being early to market is increasingly significant for sustaining a leadership position and being able to set appropriate selling prices, which in turn impacts our profitability.
The technology industry is characterised by rapid change. Companies that are successful are typically those who are consistently at the forefront in the timely transition of innovative ideas into finished products and the successful launch of those products into the market. Executing on targets for the delivery of new technologies or products on a timely basis to our chosen markets is important if the Group is to secure revenues, maintain strong working relationships with our customers and create and sustain leading market positions. Developing new technologies is highly complex.
Management and the Board monitor the progress of projects against pre-determined milestones, including project timelines and costs incurred. Programme management resources conduct reviews in order to assess variance from the project plan in fulfilling these objectives and to propose corrective action if necessary.
During 2014, the Board received and discussed reports provided by management on the processes which support execution of product development through to market launch. The Board also considered ongoing measures to improve our processes that support the development of new products and technologies.
Launching our products successfully involves not only offering products and technologies that meet our customers’ requirements and market expectations on a timely basis, but also promoting and marketing such products effectively so that our customers have good visibility of the products and technologies we offer.
Risk: failing to anticipate the requirements of our customers and compete effectively in a highly competitive market
It is important that we understand and accurately anticipate what future products, features or technologies our customers want. In the highly competitive and fast moving environment of technical innovation in which the Group operates, we face the possibility that our own technologies and solutions are superseded by alternatives offered by our competitors that are adopted by our customers. Understanding the trends in the markets in which the Company operates, the requirements of our customers and the emerging demands of end users is important if we are to remain competitive. One example of this is the emerging market of the Internet of Things (‘IoT’). This new and dynamic market is attracting significant investment by companies seeking to adapt advances in methods for the capture and communication of data to assist people in their everyday lives. Applications range from how people manage the energy they use for heating and lighting in homes, to monitoring a person’s temperature, heart rate and blood pressure or allowing cars to share data that gives instant traffic updates, to enable drivers to change their route. CSR is actively competing with other companies to secure new business in the many diverse applications, potential markets and with customers that might use connected technologies. The companies with which CSR is competing are not only traditional competitors, but also those parties whose own industries and markets now recognise how IoT may play a part in improving their own products or services such as is security companies who are seeking to provide solutions that provide instant access to monitor and secure homes and offices.
Principal risks and uncertaintiescontinued
An important part of understanding customer requirements is through effective engagement with them. The Group seeks to work with current and potential future customers to understand their product plans and to identify the innovative features of existing and new technologies that could be attractive. However in new emerging and dynamic markets there are an increasing number of potential customers with diverse requirements. We recognise that the traditional methods of engagement with customers using our own sales teams and those of partner sales distributors needs to be adapted, including greater utilisation of what are commonly referred to as ‘low touch’ methods, for example deploying greater use of web-based tools to more readily respond to requirements for information, as well as products and services.
During 2014, management initiated a review to assess alternative methods required for supporting customers and investment has been made, in identifying and appointing additional third parties to support our sales and distribution infrastructure as well as enhancing our website and business systems.
The Board receives regular reports on such matters, for example from our VP of Worldwide Sales and our Chief Technical Officer. As part of those discussions, the Board has also been kept informed about current and anticipated trends in the adoption of new technologies (for example, how competing alternative technologies compare to those in which the Group is investing). During 2014, the Board considered the challenges faced by the Group arising from competitors seeking to gain traction in our established markets, such as Voice & Music and Auto, predominantly in China, by introducing products at significantly lower prices. As part of its review, the Board has considered how the Group might most appropriately respond to such challenges, which has included the continuing focus on providing highly differentiated products that offer superior features and capabilities as well as understanding how our portfolio of more mature products might be used to support customers seeking lower cost alternatives.
Risk: the markets in which we operate may be subject to significant change which could adversely affect our business performance
The products and solutions which we develop are adopted by our customers into their own end-products primarily for end-consumer based markets. Changes in demand from consumers for the products in which our technologies feature can affect the success of our business. The Board receives regular reports on each of the business areas that comprise the Group’s reportable segments, to assess performance generally and relative to strategic objectives and annual targets, as well as to understand wider market trends.
Actions that the Board considers appropriate are initiated, taking into consideration the long-term interests of all stakeholders. For example, as announced in December 2013 and also considered within our annual report for the 52 week financial period ended 27 December 2013, the Board determined to cease development of future camera-on-a-chip (‘COACH’) platform products which had been acquired as part of Zoran Corporation in 2011. In June 2014, we completed the sale of certain Imaging IP assets associated with the camera business, together with the team devoted to their development, for a total consideration of $44 million.
Because a significant proportion of our business is dependent on consumer demand which is directly impacted by economic conditions, the Board also seeks to understand wider economic forecasts and trends. As part of routine reports, the Board is given information on expectations for future quarters for our own products which is based on the assessment of managers and employees, the feedback from our customers on their demand, as well as industry reports.
Risk: our automated information systems may not develop in line with our business requirements, may experience interruption or be subject to malicious attack
We rely on our IT systems to support our operations globally. These hold information and related data management tools which are important for our day-to-day business. Reflecting this, the Group has established forums for discussing the IT requirements of the business and for ensuring that the strategic needs and priorities of the Group give due consideration to how our business systems need to evolve in response.
Much of the information maintained by our systems is confidential and commercially sensitive either to us or other stakeholders, for example, information about our customers and employees. We recognise our obligations to safeguard this information and as well as having our own resources, we engage with third parties, including advisers and our customers in relation to developing IT and related data management systems. The Board is mindful of the growing profile of cyber-related threats faced by companies and governments and the challenges arising from increasingly sophisticated attempts by individuals and groups to cause disruption using cyber-based techniques. In 2014, we identified incidents where attempts were made to gain access to our systems and data. With the aid of third-party experts in evaluating the threats posed and the measures taken by the Company, we believe the data that we hold and systems were not compromised. However, we may be subject in the future to attempts to gain access to our data and those attempts could be successful. Whilst we continue to invest in measures intended to safeguard our systems and data, these measures may not be effective against certain methods used by third parties. During 2014, further work was undertaken into procedures concerned with access, use and distribution of data, supported by external consultants. The review considered the prevailing practices and actions being taken by the Group in seeking to respond to threats to data security, including malicious attack (so-called ‘hacking’), which could result, for example, in loss of data or disruption to our business.
The findings from this review were considered by the Board and Audit Committee and they have been kept appraised of management’s responses in addressing those findings. This will remain an area of focus in 2015.
| | |
| 34 | | CSR plc Annual Report and Financial Statements 2014 |
Risk: failing to protect proprietary information
Protecting our proprietary technology is an important part of being able to compete successfully and in support of our business with customers. We rely on a combination of patent, trade secret, copyright and trademark laws, non-disclosure and other contractual agreements and technical measures to protect our proprietary rights. The Board and management recognise the importance of implementing a considered strategy in respect of intellectual property matters, including protecting the Group’s proprietary technology. The Board, or within its delegated responsibilities, the Audit Committee, receives periodic reports from management on initiatives and workstreams connected with the development of the Group’s portfolio of patents and trademarks which includes a cross-functional team of senior managers under a rolling programme supporting the Group’s strategy of extending protection of the Group’s intellectual property.
Risk: the need to defend the Group against claims associated with alleged breaches of intellectual property rights
We are, and expect to be on an ongoing basis, involved in litigation, including that associated with intellectual property. It is recognised that intellectual property litigation is commonplace in our industry and poses risks and uncertainties that may materially and adversely affect or disrupt our business, customer relationships, expenses or results of operations. From time to time in the ordinary course of our business, we have received, and may continue to receive, communications from customers, competitors and others threatening litigation in respect of claims that we have breached rights or obligations belonging or owed to them concerning patent and other intellectual property rights (‘IPR’).
The Audit Committee receives reports on actual or potential litigation involving the Group and monitors the developments and potential impact of such litigation on the Group’s business and financial condition.
Risk: continuity of supply and capacity constraints
We do not own or operate a fabrication facility and, therefore, rely on third parties, in particular TSMC and ASE, to manufacture, package and test our products on time and on budget. Because of this reliance on third parties, we face the risk that our suppliers are unable or unwilling to satisfy the orders placed by our customers at all or on a timely basis. During 2013, the Company experienced significant growth in demand in China for our products used in mono headsets as a result of stricter enforcement of legislation regarding hands-free driving. This unexpected development meant we required greater than expected volumes of our products from suppliers on shortened delivery schedules. Through the actions taken by management and the support of our supply chain partners, we were able to satisfy the requirements of our customers and benefit from the increased revenues. As part of the CEO report, the Board receives regular updates on matters concerned continuing engagement with key suppliers.
|
Corporate Social Responsibility |
Social responsibility
CSR recognises the importance of social, environmental and ethical (‘SEE’) matters and during 2014 we continued our work on complying with the ABI disclosure guidelines on social responsibility. SEE matters are integral to the philosophy of the Group and progress is periodically considered by the Board and its committees. We consider that our work is part of a continuous process to develop standards and working practices designed to deliver tangible improvements in how we do business and to contribute to the wider community and stakeholders. We demonstrate our commitment through initiatives supported by our various offices around the world and the efforts of many individual employees who participate in their communities as ambassadors for CSR. At the wider Group level, this includes assessing the impact of our operations on the environment and on the safety and wellbeing of our employees and end-users of our products. Furthermore, we assess those involved in the development and manufacture of our products through our suppliers, distributors and customers. Activities in these areas are discussed in more detail on pages 39 to 42.
CSR has over 20 offices across the US, Europe and Asia-Pacific. In the following section, we summarise some of the activities which have been undertaken by our employees in support of our corporate social responsibility. We are proud to be able to share details which demonstrate the dedication shown by our staff, their families and friends. The initiatives for these activities come either directly from individual employees or the social responsibility committee associated with a particular office.
The Company supports approved individual and team proposals by allowing time out of the working week (one day each year in the case of our UK-based employees, equivalent to 774 days for 2014) which is used for participation in charity events and community activities. In the UK the Company also offers additional incentive to each initiative by offering matched funding of up to £1,000 that is provided to the chosen charities.
We are eager to give back to the community in a variety of ways and this includes using the expertise and capabilities which our employees possess to encourage the next generation to enjoy, learn and get involved in science, technology, engineering and mathematics (‘STEM’). For example, CSR has provided sponsorship and the support of its employees to the UK Electronics Skills Foundation (‘UKESF’) since its inception in 2010. Seeking to inspire young people to pursue careers in the electronics industry, UKESF has partnered with the Engineering Development Trust to create an electronics-based project called Go4SET.
Each year, employees in many of our offices are invited to nominate their Charity of the Year through an office wide voting process. Other office locations regularly provide help to charities through the more direct involvement of our employees.
Employee involvement
The following pages present a series of examples of our social responsibility initiatives across Europe, the US and Asia-Pacific. We regularly share updates on our activities via social media and on our website www.csr.com.
China: Supporting the arts
CSR Shanghai volunteers attended the Hands On Shanghai Benefit Concert at the Shanghai Conservatory of Music, where a group of people with learning difficulties performed alongside famous Chinese musicians. These special performers spent a great deal of time and effort practising before having the courage to stand on the stage. CSR were pleased and privileged to have contributed to support their involvement. At the end of the concert, the children of CSR volunteers went on stage to present flowers to the performers.
UK: Supporting children with learning difficulties
CSR’s Manchester office elected Elms Bank Specialist Art College as its 2014 Charity of the Year. Elms Bank is a secondary special school for pupils aged between 11 and 19 who have complex learning difficulties, physical disabilities and those on the Autistic Spectrum Continuum. The school is committed to providing all its students with high-quality learning opportunities which help to develop a sense of confidence and high aspiration. As part of this endeavour, CSR donated £1,000 towards the funding of a new interactive music room incorporating an OmniMusic technology suite located within Elms Bank’s new IT unit. OmniMusic makes it possible for disabled students to be fully involved in writing, producing and performing music. In addition to this, CSR also donated a number of sport bags for the school which are proudly used by the students.
Japan: Bringing technology to the community
CSR Japan took an active part in the annual campus festival of Akita Prefectural University, a community outreach event. CSR demonstrated a variety of exciting new Bluetooth Smart enabled wearables and so-called ‘appcessories’ to students and people from the local community. Advances in digital audio technology were also demonstrated. To further engage festival visitors, CSR handed out prizes for correctly answering questions on technology. Additionally, a group of students from the university demonstrated how a CSR Bluetooth Smart starter development kit which CSR offers could be configured to monitor blood pressure and predict the risk of stroke.
USA: Supporting women in engineering
2014 marked the fourth year CSR’s Athellina Athsani has been participating in the STEM programme known as TechWomen. TechWomen empowers, connects, and supports the next generation of women leaders in science, technology, engineering and mathematics from Africa and the Middle East by pairing them with female technologists and entrepreneurs from Silicon Valley in California. Athellina, Director of Strategic Planning, who is based in the CSR San Jose office, is matched as a cultural mentor with Sherin Abdel Hamid from Egypt. Sherin is a PhD candidate at Queen’s University, Ontario, Canada conducting research focused on intelligent transportation systems. She is also an Assistant Lecturer at Ain Shams University, Cairo, Egypt.
Launched in 2011, TechWomen is an initiative of the US Department of State’s Bureau of Educational and Cultural Affairs. TechWomen supports the rights and advancement of women and girls around the world by enabling them to reach their full potential in the tech industry. Through mentorship and exchange, TechWomen works to strengthen participants’ professional capacity, increases mutual understanding between key networks of professionals, and expands interest in STEM careers by introducing them to female role models.
UK: Building interest in STEM skills in young people
There has been much talk of the skills shortage that is going to face companies that require graduates with skills in STEM subjects. CSR is working with STEMNET, a UK organisation that creates links between employers and educators with the aim of tackling the STEM skills shortage. STEMNET believe that by enthusing young people about STEM, employers can help to develop the creativity, problem-solving and employability skills of young people and widen the understanding and awareness of STEM careers with the next generation of UK employees. CSR Cambridge is planning to attend a large STEM Fair organised by STEM Team East at the former RAF base at Duxford, Cambridgeshire in 2015 and run a workshop which will involve writing software code on a Raspberry Pi to interact with CSR’s SiRFstarV GNSS chip. Work has started to build the hardware required to run this workshop and a first draft of the workshop has been completed. CSR invited a number of graduates to contribute to the project, developing the required code and testing the solution they collaborated to create.
| | |
| 36 | | CSR plc Annual Report and Financial Statements 2014 |
|
| USA: Running for cancer research |
Employee Frank McSorley (CSR Burlington) joined this year’s Susan G. Komen 3-Day Philadelphia event held over 12-14 September 2014, one of a number of 60-mile sponsored walks around the USA. Frank also walked 40 miles in Boston in aid of the same breast cancer research charity. Frank raised $4,860 over both these walks; and CSR donated $1,000 towards his endeavours. Thanks to sponsors, more people are being tested earlier, critical to early identification of breast cancers.
|
| UK: Computers for disabled veterans |
The Veterans Charity in the UK was founded in 2008 and focuses on providing fast, direct support to veterans living in the UK of all generations who may be facing hardship.
Veterans can find the transition between leaving the forces and resuming civilian life difficult. There are many factors that can influence such difficulties including physical and/or mental injury. Support in re-adjustment, including the provision of items that many of us regard as everyday essentials to our daily lives, can make a difference during the transition and have been found to work positively in enabling veterans improve their health and wellbeing. The Veterans Charity is focused on providing basic assistance, such as shopping and equipment, such as mobile phones to help stay in touch with colleagues to assist the veterans in the journey to self-sufficiency. CSR supplied a number of reconditioned laptops for the Veterans Charity and loaded them with a suite of software.
|
| USA: Biking for pediatric care |
Team CSR rode in the 35th annual Pan-Mass Challenge bike-a-thon to support adult and pediatric cancer care at the Dana Farber Cancer Institute. CSR Burlington’s Mary Alice McParlane (four-time rider) and Art Weeks (three-time rider) joined over 5,500 other riders and 3,000 volunteers in a long-term goal of raising $40 million. Thanks to the generosity of many sponsors they were able to raise nearly $10,000.
|
| China: Cleaning up local beaches |
Every year, hundreds of thousands of people clean up beaches worldwide to protect the marine environment. During 2014, volunteers from CSR’s Shanghai office played their part, and together with over one thousand other volunteers, they cleaned five miles of Dishui Lake beach.
Fourteen CSR colleagues and their family members volunteered to join the ‘Beach Clean-up’ activity at Nan Hui, Shanghai. This project aims to mobilise volunteers to clean up local beaches in Shanghai, raise awareness for water resources protection, and ultimately reduce pollution to the water environment.
|
| Israel: Maths tutoring for high school students |
In Haifa, Israel, we continue to participate in Think Positive, which is a tutoring programme partnering volunteers with junior high school students to help improve maths capabilities. Weekly one to one lessons take place at the CSR Haifa office.
In addition to these lessons, we also give presentations on our technology, demonstrating how the ideas the students are learning about have real world application. The programme is led and driven by the Haifa Coalition for Social Responsibility partnered with CSR, Intel, IBM, Phillips, Taro, Qualcomm and the regional Ministry of Haifa. Think Positive has shown proven success in improving students’ maths grades and more than half of the students that have been through the experience have chosen to pursue studies in technology.
|
| Taiwan: Raising funds for disabled children and delivering food |
The Children Are Us Foundation (‘CAUF’) is a non-profit private organisation that provides long term care and job training to people with intellectual and developmental disabilities. CAUF’s goal is to inspire and promote the potential talent of its people. CAUF works to change people’s general perceptions, educating the wider public in order to understand and respect its workers. CAUF is famous in Taiwan for operating bakeries and restaurants. The first CAUF bakery opened in Kaohsiung City in 1997, and CAUF has since expanded, opening other branches in Taipei City and Hsinchu City.
CSR Taiwan are closely involved with this project and in 2014 helped deliver products from the bakery to children in remote districts in addition to raising funds to support the bakery and its workers.
|
| UK: Arts and crafts therapy |
Rowan, an arts and crafts therapy charity based in Cambridge, was the recent recipient of a donation of £5,000 as one of CSR’s three UK Charity of the Year selections.
Rowan was started in 1984 to improve the lives of people with learning difficulties through the provision of services and meaningful activities. As a result of the donation from CSR, Rowan have been able to fund the cost of vital transport for the year as part of these activities that support their work.
|
| Japan: Running for orphans of earthquake |
The Tokyo Marathon is held in February each year. In 2014, four employees from CSR’s Tokyo office, Hiroshi Honda, Tomohiko Kato, David Fukada, and Yasuhiro Shinozaki, ran the full marathon distance as part of the company’s Social Responsibility efforts. All finished the 42.195 km course in times between 4 hours and 5.5 hours. Through their endeavours $3,000 was raised, which was donated to a charity which helps cover the school fees of children who lost parents in the Tohoku earthquake disaster of 2011.
|
| India: Outfitting a rural school |
Our CEO, Joep van Beurden, and CSR India General Manager, Prabhu Shastry, joined colleagues from the CSR Bangalore office who made a return visit to Shishu Mandir school to provide new classroom furniture including desks, tables and chairs plus much-needed stationery and a printer. The visit began with a communal lunch, where CSR staff joined 200 children and teachers, and was followed by a tour of the premises and facilities, including the school’s busy computer lab. Afterwards, Joep announced CSR’s backing of an annual award for scholarship providing sponsorship for the top student of the 10th grade during the subsequent 11th and 12th grade years. Shishu Mandir is a school run for local village children, around 70% girls and 30% boys, from challenging family backgrounds.
Corporate Social Responsibilitycontinued
Learning and Development
At CSR we recognise that our people are a very important part of what has made our Company a success to date and we recognise the importance of building on that success for the future. The execution of our strategic objectives is significantly dependent on the capabilities, knowledge, experience and skills of our people. We continue to invest in training and career progression in order to sustain and further develop these capabilities and to support our employees in achieving personal development and career ambitions. This not only helps to motivate our people and encourage them to build rewarding careers, it also helps us in our drive to continually enhance the quality of service to our customers and supports our objective to deliver innovative solutions into the marketplace.
As we continue to extend our markets and technologies, we require a more diverse range of skills to support the business and our strategic objectives. We are a member of The Learning Collaboration in the UK which enables us to provide a range of development opportunities. In the US, we work with the American Management Association offering a range of skills training, as well as with boutique consultancies to support specific relevant learning interventions. During 2014, we have continued to invest in worldwide learning and development to support this, offering training in areas such as manager and senior leader development, interpersonal and technical skills. This included developing a wide range of learning programmes in R&D and in Marketing.
Reflecting how CSR evolves in order to respond to the needs of our customers and changes in the markets we serve, we seek to enhance our learning and development resources and engage directly with line managers in the proactive development and continuous improvement of their teams. Each year we undertake a detailed learning needs assessment to identify the areas where we can focus our learning resources to maximise their impact on people and the business. This is an important part of supporting our business strategy to be a leading technology company that is first to innovate and capture emerging areas of opportunity. Through this engagement with our people, we are developing courses and online resources that help us to reinforce winning behaviours that serve our organisation well. In the UK, for example, we are enhancing our learning and development for senior leaders and managers by introducing various short courses, cross-functional peer learning and master classes targeted at personal development.
During 2014, we supported a number of ‘Tech Talks’ which covered a wide range of topics, from technical (such as a better understanding of how a specific CSR core technology works), to how to use a particular process or simply sharing knowledge of what we do at CSR (for example, a demonstration day of products containing CSR chips). Talks have also been provided during the year on softer skills topics, such as effective staff management and leadership.
During 2014, our Oracle-based Learning Management and Performance Management system enabled us to provide an improved interface to learning materials. This is an important communication tool in assisting with the capture and cascade of our organisational goals, connected with the performance objectives of people across our Group. Our intention is to use these tools to enable our employees to better understand their personal contribution to delivering business performance and supporting the fulfilment of our strategy.
We have an extensive library of material in the iLearn element of Oracle, and continue to develop global access to online learning by improving both the content and the system. Online training in areas such as project management, performance evaluation, compliance training in health and safety and the UK Bribery Act are examples of the resources provided. Our training programmes also reflect specific initiatives which are carried out by functions in our group. For example, recognising the importance of our own people to the security of our systems and the data belonging to our group and customers, we have implemented group-wide training in IT security, raising awareness of potential threats and of good practice.
Such learning resources are not only used for self-learning but also in support of coaching and traditional face-to-face learning, allowing a more blended approach to personal development. Increasingly, employees will be able to manage the planning and delivery of their own development. We believe that this provides empowerment and encourages people to reflect on where they would most benefit from additional training, within a framework which enables their HR managers to provide guidance and offer feedback linked to performance evaluations.
Diversity
CSR is a multicultural global organisation and we are committed to providing equal opportunities for training, career development and promotion to all employees, regardless of any physical disability, gender, religion, race or nationality. Our recruitment, training and development programmes reflect this philosophy. Within the management team that reports to the CEO, women comprise 14% (or 1 out of 7 personnel) and at board level 13% (or 1 of 8). In the Group as a whole, women comprise 17% of our total employees (or 366 out of a total of 2,108). The CSR Group comprises a number of subsidiary entities which have boards of directors. For these entities there are 106 individual appointments, of which 97 are men and 9 (or 8%) are women.
Applications for vacancies are considered based on capabilities and reflecting the requirements of the role, and resources for development and training are made available to all employees. For example, our online lessons have audio tracks and also text captions that follow the sound in order specifically to assist the hard-of-hearing. The user can choose whatever suits them best. In the event of members of staff becoming disabled, every effort is made to ensure that their employment with the CSR Group continues and that appropriate training is arranged. In addition, CSR provides various learning opportunities in local languages to accommodate different language skills.
Mutual respect, acknowledging and accepting diversity, and safeguarding the fundamental rights of individuals should be the foundations not only of a socially responsible company but also of our wider global society. CSR is committed to these principles and the respect for human rights of all people inside and outside our organisation and this is reflected within our ethics policy which is promulgated across our Group.
Pensions are available to all employees, either through participation in the state pension schemes in the country in which the employee is resident or by provision of a defined contribution pension scheme. Such schemes are maintained in accordance with legislative requirements, custom, practice and Group policy as appropriate.
| | |
| 38 | | CSR plc Annual Report and Financial Statements 2014 |
Inclusion
We promote an open and honest working environment where employee views are sought, listened to and acted upon.
During 2014, we continued to provide our employees with regular updates on business goals and progress. A range of channels provide regular communications to CSR employees globally. In addition to e-mail updates from our CEO and executive team, we provided a weekly update via e-mail, in the form of our global newsletter, ‘What’s New @ CSR’. This weekly e-newsletter is supplemented with regular posts on CSR’s social media channels (Twitter, Facebook, and LinkedIn) about staff activities, business highlights, charitable events and tradeshow coverage. Our intranet portal provides employees with access to a variety of tools to help them in the performance of their work and to view benefits, performance and other information.
Recognising and rewarding exceptional performance is key at CSR and managers have a number of tools available to support this. CSR’s global recognition programme, ‘Further’, allows employees to nominate colleagues they believe have made exceptional contributions, for a cash award and global recognition. Colleagues can also use e-cards to send personal ‘thank you’ messages at any time, building a culture of appreciation and teamwork. Employees have the opportunity to participate in the Company’s share incentive schemes, thereby benefitting from the success of the business. This includes tax-efficient share purchase schemes, allowing staff to save money to purchase shares in CSR at a discount. CSR also operates global bonus plans, which reward employees as a percentage of their salary, maintaining a team ethos. Participation in the bonus schemes operated by the CSR Group is open to all employees. Our quarterly results announcements give employees context to understand the impact of their contributions during the course of the year.
We have continued our popular Lunch & Learn programme, which we first launched five years ago. This enables employees to learn about CSR technologies during their lunch breaks. Increasingly, we are publishing the presentations as videos and making them available via iLearn to those who have not been able to attend the original presentation. This has helped to support global interaction, allowing a greater number of people to benefit from the topics which are covered as well as encouraging discussion and sharing of ideas by employees.
We encourage employees to share their ideas which might be adopted into new technologies and products. To provide a simple mechanism for employees to provide their feedback, we enhanced our online suggestions tool, ‘Innovation Portal’. Employee ideas for innovation and improvements across the business are subject to an evaluation process, which includes, where appropriate, commercial evaluation. The Group also supports an innovation award for the best invention.
| | | | | | | | | | | | |
| Employees by function: | | 2014 | | | 2013 | | | 2012 | |
R&D | | | 1,515 | | | | 1,352 | | | | 1,430 | |
SG&A | | | 593 | | | | 794 | | | | 687 | |
Total | | | 2,108 | | | | 2,146 | | | | 2,117 | |
| | | |
| Employees by region: | | 2014 | | | 2013 | | | 2012 | |
Europe | | | 826 | | | | 716 | | | | 609 | |
Asia | | | 862 | | | | 962 | | | | 1,045 | |
USA | | | 420 | | | | 468 | | | | 463 | |
Total | | | 2,108 | | | | 2,146 | | | | 2,117 | |
Health, safety and environmental management
CSR expects the highest of ethical standards of all its employees and its policies and procedures support its stated aim of acting with integrity in all aspects of its operations.
The Board director responsible for health and safety matters is Will Gardiner, Chief Financial Officer. During 2014, Mr. Gardiner met with those who manage the Company’s health and safety issues including the Senior Manager for Health, Safety and Environmental (‘HSE’). Reports are presented to the Board twice each year covering health and safety matters, which include statistics on accidents and incidents and progress in fulfilling targets linked to continuous improvement and promoting wider awareness of HSE matters.
In the UK, we have an HSE Committee which meets regularly and is chaired by the Senior Manager, HSE. Our HSE policies are available to all employees on our intranet site, as are the minutes of the HSE Committee and details of current HSE initiatives. Examples of such initiatives are explained below.
During 2014, work continued in promulgating HSE best practices across the CSR Group, deploying measures developed in Cambridge as a baseline for globally applicable and acceptable policies, procedures and guidance. Country leaders and their deputies continue to act as champions at their office locations to support various training programmes and initiatives to raise awareness about health and safety. In February 2014 and July 2014, the Audit Committee received reports on progress against the targets for such matters as part of its routine business at its meetings.
We have developed a health and safety training programme for our offices. Through this programme, we now have representatives in each region who have obtained or are in the process of obtaining the UK National Examination Board in Occupational Safety and Health. In 2015, training will be extended to cover further skills and competencies such as waste management, fire safety and the control of substances hazardous to health. Within the Facilities, Health, Safety and Environmental function, we have identified specific training to assist team members in the performance of their roles and responsibilities which will be implemented in the coming year. The objective of this approach is to support our employees by providing knowledge, appreciation of the objectives of the Group and a shared sense of responsibility.
In support of these objectives, we completed the deployment of an online HSE compliance tool globally which is designed to give Facilities and HSE staff direct access to information and guidance on meeting the local legislation relevant to their operations. In addition to the data resource which has been created, we will be exploiting the features of an online system to allow our HSE managers to track and monitor, in real time, tasks which they are required to fulfill in order to comply with local laws and regulations. This will be rolled out in phases with the UK targeted for Q1 2015. This online resource is a key tool in our ongoing compliance with ISO 14001 and OHSAS 18001.
Corporate Social Responsibilitycontinued
In January 2014, we commenced a health, safety and environmental awareness and training programme for all our staff worldwide. On a quarterly basis this covered such topics as serious and imminent danger, first aid and responding to the spillage of hazardous materials in the working environment. This programme will continue to be run throughout 2015. The aim is to help support, encourage and empower staff at a local level with awareness of HSE compliance requirements and help develop good practices.
The executive director with responsibility for the Group’s Environmental Management System (‘EMS’) throughout 2014 was Mr. Chris Ladas, Operations Director. Since CSR is a fabless semiconductor company and therefore does not have its own manufacturing facilities, our EMS, which has the support of the Board, has been developed to reflect that all our employees work in office based environments which results in a low eco-footprint. We do however seek to establish and maintain high environmental management standards across all aspects of our operations, consistent with the environmental standard ISO 14001. Certification requires that we have an EMS which defines the environmental policy of the Group and sets objectives intended to drive continuous improvements in environmental awareness and practices.
The ongoing management of EMS is overseen by a team incorporating managers responsible for HSE, Facilities, Business Management Systems and Quality Assurance.
The team establishes a programme of action for each year and tracks progress against targets. Progress is monitored by the Company’s internal Quality Assurance department, which reports regularly to the Internal Auditor and to the Audit Committee.
At the date of this report, the Company has received two surveillance visits, in June 2014 and January 2015, for both ISO 14001 and OHSAS 18001 which were completed by Lloyds Register Quality Assurance Limited, an internationally recognised independent assessor. The visits confirmed that the Company’s Management System continued to satisfy the requirements of ISO 14001:2004 and BS OHSAS 18001:2007, and continued certification to these standards was awarded. Recertification against these two standards will take place in May 2015.
Environment
Our environmental policy includes commitments to:
| — | | employee consultation and training; |
| — | | assessment of our activities and product-related environmental impacts to identify targets for continuous improvement; and |
| — | | legal compliance and due consideration of other stakeholder environmental requirements. |
We believe that we are taking appropriate steps to contribute to sound environmental practices, covering not only the manufacture and supply of our products but also positive measures to establish and build on good working practices within our various office locations. We have developed a global five-year environmental improvement programme, which addresses three major areas: energy efficiencies and reduction in consumption, recycling and waste management, water consumption reduction and efficiencies. Some of the specific objectives for 2015 include reducing the amount of waste going to landfill in the USA and India to less than 10% of the total waste produced and reducing by 5% our energy consumption in our offices in China.
We are registered with the Environment Agency pursuant to the requirements of the Climate Change Act 2008, which forms a key component of the commitment by the UK government and businesses in response to the Kyoto Protocol on climate change.
CSR has implemented procedures in order to be able to record and report on energy consumption for our UK premises. The UK government introduced the first phase of payments in respect of carbon usage in 2012. The UK government has set a threshold for consumption of electricity per annum above which business are required to register and pay a levy in respect of the 2014 year, which ran for the period 1 July – 30 June 2014. CSR expected to exceed the threshold set by the UK Government and we therefore registered for Carbon Reduction Commitment (‘CRC’) Phase 2. CSR submitted its return in July 2014, in connection with which we were subsequently required to purchase an allowance for the equivalent of 4,475 tonnes of carbon, at a cost of £53,688. With the leasing of an additional property in the UK in 2014, we expect our submission in 2015 to be in the region of £60,000.
For the 52 week financial period ended 26 December 2014, CSR is required to disclose details of Global Greenhouse Gas (‘GHG’) emissions in our annual report and financial statements pursuant to the Companies Act 2006 (Strategic Report and Directors’ Report) Regulations 2013 (the ‘Regulations’). The UK government has a stated intention through the CRC Energy Efficiency Scheme, and the Regulations, that by tracking and reporting quantities of GHG’s that they produce, companies will also become more aware of their carbon footprint. The Regulations are also intended to encourage companies to identify areas where reductions in emissions can be made and explore opportunities to implement money-saving energy efficiency measures, which in turn will be better for the environment.
The classes of emissions on which CSR is required to report are identified in the ‘Greenhouse Protocol, A Corporate Accounting and Reporting Standard (Revised Edition, 2004)’ reflecting UK government Environmental Reporting Guidelines.
These comprise:
Scope 1: Direct GHG emissions
Direct GHG emissions occur from sources that are owned or where CSR has operational control, for example, emissions from combustion in owned or operationally controlled boilers, furnaces and vehicles, or emissions from chemical production in owned or operationally controlled process equipment.
Scope 2: Electricity indirect GHG emissions
Scope 2 accounts for GHG emissions from the generation of purchased electricity consumed by the Company. Purchased electricity is defined as electricity that is purchased or otherwise brought into the organisational boundary of the user. Scope 2 emissions physically occur at the facility where electricity is generated.
CSR’s GHG reporting regime covers Scope 1 emissions (fuel combustion and the operation of CSR’s facilities) and Scope 2 emissions (from purchased electricity, heat, steam or cooling). CSR has recorded information about emissions for the 12 months from 1 October 2013 to 30 September 2014. We have followed the Greenhouse Gas Protocol (revised edition 2004) and the operational control consolidation approach to determine what is included and excluded. Therefore all entities and facilities either
| | |
| 40 | | CSR plc Annual Report and Financial Statements 2014 |
owned or under the operational control of the Company worldwide have been included. Lease-based properties under operational control were also included. The data has been sourced from utility bills and company car log books. As permitted under the Regulations, air travel and other emission sources not under our control have been excluded.
By following the operational control consolidation approach, disclosures include leased assets that are not included in the consolidated financial statements. The intensity ratios for indicating performance for emissions are to express carbon output in terms of an appropriate metric for the organisation concerned. For an essentially office-based business such as CSR, we have determined that floor space (based on a measure assessed as the gross internal area) correlates more closely with the greenhouse gas emissions of the Company, as for CRC reporting.
| | | | | | | | | | | | |
| | | Scope 1 | | | Scope 2 | | | | |
| | | (tonnes of
CO2e) | | | (tonnes of
CO2e) | | | Total | |
Totals | | | 271 | | | | 9083 | | | | 9354 | |
Emissions intensity (tonnes of CO2e per m2)1 | | | 0.004 | | | | 0.146 | | | | 0.15 | |
| 1 | Total office floor area is 62,162.63 square metres reflecting our gross internal area across all properties occupied during the stated period by the Group worldwide |
The Energy Savings Opportunity Scheme (‘ESOS’) also comes into force in 2015. It is a mandatory energy assessment scheme for organisations in the UK that meet the qualification criteria. Corporate groups qualify if at least one UK group member meets the ESOS definition of a large undertaking, i.e. it employs at least 250 people, which is the case with CSR. Because CSR is not fully covered by ISO 50001, we will be carrying out an ESOS assessment. The resulting production of Display Energy Certificates is considered compliant with the requirements of ESOS. These must be carried out and be in place by 5 December 2015 in order for us to meet the requirements of the scheme.
We remain committed to continuous improvement in the recycling of spent materials in the UK and employees are actively encouraged to support such initiatives. Waste bins are segregated into categories of recyclable materials and suitable waste bins have been located in communal areas. In 2014, through the use of alternative waste disposal methods of mechanical biological treatment and incineration, and based on returns from our contractor, we have reduced the amount of waste going to landfill by approximately 90%. The total amount of all waste types recycled within our UK operations for the 12 month period ended December 2014 was approximately 173,000 kg.
CSR has long been committed to optimising the use of ‘greener’ materials in our end-products. We continue to work with customers and suppliers as well as our own in-house teams in developing and supplying products which meet the highest standards as regards minimising the use of hazardous substances.
CSR’s products are manufactured and packaged in a variety of forms. All new products released by CSR in recent years are manufactured according to CSR’s own ‘green’ standards. The green standards have been developed by CSR as part of ongoing engagement with leading global companies who are customers of CSR and also with the support of our suppliers. CSR’s green standards therefore reflect not only internationally recognised guidelines but also the feedback of our customers, whose requirements frequently exceed the minimum conditions set by governments and regulators.
We have dedicated staff who assist in the development of all new products and the review of existing product lines targeting the use of greener materials. Part of their role is to monitor established and pending legislation and standards published by national and supranational governments and agencies and to ensure that we are proactive in going beyond the minimum requirements in our compliance with the types and quantities of materials used.
In this respect we work closely with both customers and suppliers in developing products to reduce the use of hazardous materials, and through testing and certification, ensuring ongoing compliance. Our standard integrated circuits are fully compliant with all existing European legislation, including Restrictions of the Use of Certain Hazardous Substances in Electrical and Electronic Equipment Regulations (RoHS) and Registration, Evaluation, Authorisation and Registration of Chemicals regulations (REACH), as well as in other territories where equivalent legislation has been introduced.
In addition to procedures that establish and monitor compliance, we have processes in place to make sure that customers are supported with up-to-date materials, information and laboratory analysis to validate the environmental compliance of our products.
CSR is a fabless semiconductor company. We design and sell semiconductor products and we subcontract to third parties the processes for the manufacture, packaging and testing of our products. We recognise the importance of ensuring that our key suppliers have appropriate policies and practices on social, environmental and ethical matters. Key manufacturing partners are selected and assessed based on certification to appropriate globally recognised standards such as ISO 14001, OHSAS 18001 and SA 8000. We are proud to continue to work alongside TSMC, which is reputed to be the ‘greenest’ semiconductor fabricator company in the world. By reducing emissions, recycling water and consuming less water, TSMC is already recognised as a champion of good environmental policies and standards.
We periodically undertake audits of the operations of our key supply partners to provide assurance that appropriate standards are being maintained in these areas and to determine whether internationally recognised certification exists to the standards mentioned above.
During 2014, reviews of product environmental compliance were conducted by our Supplier Audit Team at suppliers in Taiwan. Through these reviews, we obtained assurances on certain practices and supporting certifications.
Based on the extent of our ongoing engagement described above, the Board believes that steps are being taken to mitigate against the risks relating to health, safety and environmental responsibilities and there is no present expectation that prevailing practices would materially affect our strategic objectives.
Conflict Minerals
Pursuant to Section 1502 of the Dodd-Frank Wall Street Reform and Consumer Protection Act, (the ‘Dodd-Frank Act’), in August 2012, the SEC adopted disclosure requirements for SEC reporting companies on the utilisation of certain so-called ‘conflict minerals’ (tantalum, tin, tungsten and gold ) mined from the Democratic Republic of Congo (‘DRC’) and adjoining countries in their products. CSR is registered with the SEC and our products contain one or a combination of tantalum, tin, tungsten and gold which is intentionally added and necessary to product functionality. The majority of these supplies do not come from scrap or recycled sources. Whilst we are not a direct buyer of the conflict minerals from source, we recognise that we need to report on our supply chain and the extent to which such conflict minerals may be used in our products. For this purpose, we have implemented measures for gathering information from our suppliers.
Corporate Social Responsibilitycontinued
We have generated and approved an internal management system to determine an approach in addressing the requirements of the Dodd-Frank Act. The management system reflects the guidelines defined by the Organisation for Economic Co-operation and Development. Day-to-day activity is undertaken by our product compliance team.
All manufacturing of CSR’s semiconductor products is performed by our supplier partners. As such, we are a downstream company. We have no direct business relationship with smelters or refiners. We also believe that our suppliers have no direct business relationship with smelters or refiners.
We have responded to the more rigorous requirements in line with the updated Conflict-Free Sourcing Initiative. By the end of 2014 we had received updated responses from all of our main suppliers and our actions in achieving this position is explained below.
During 2014, we conducted a good faith Reasonable Country of Origin Inquiry (‘RCOI’) that was intended to identify whether any of the necessary conflict minerals in our products either originated in the DRC (or an adjoining country), or were from recycled or scrap sources. Based on our RCOI, we identified that some of the necessary conflict minerals used in our products originated in the DRC or an adjoining country (and may not have been from recycled or scrap sources). Following the conduct of our due diligence, we have determined that, of those suppliers who sourced materials from the DRC or adjoining countries, all the processing facilities had been validated as being in compliance with the Conflict Free Smelter Program.
CSR’s principal suppliers are TSMC and ASE. TSMC and ASE fulfil a significant proportion of our requirement for the manufacture, assembly, test and packaging of our integrated circuits which we supply to our customers. Both ASE and TSMC have completed their supply chain review. As a result, both TSMC and ASE are able to confirm that their supply chain to CSR are DRC conflict free where ‘DRC conflict free’ means that they ‘do not contain minerals that directly or indirectly finance or benefit armed groups in the Covered Countries’. A small portion of our requirement for the manufacture, assembly, test and packaging of our integrated circuits which we supply to our customers are supported by alternative suppliers who are working towards DRC conflict free status. In 2015 we will continue to work towards DRC conflict free status with these remaining suppliers. As a result of this work, in May 2015 we will report that we are ‘DRC conflict undeterminable’, during the continuing transition period of 2015.
We will continue to make reasonable enquiries with our suppliers on their progress in meeting the requirements of the Dodd-Frank Act.
The Strategic Report has been approved by the Board of Directors on 4 March 2015.
Signed by Order of the Board for and on behalf of the Board of Directors
Brett Gladden
Company Secretary
4 March 2015
| | |
| 42 | | CSR plc Annual Report and Financial Statements 2014 |
Risk factors
The following section sets out the risks that we believe could have a material adverse effect on, among other things, the execution of our strategy, our market share, competitive position, business performance, results of operations or financial condition. It includes the risks that we have identified as a result of the review process undertaken by our executive management and Board, which is explained in more detail on pages 64 and 65 of our Corporate Governance report.
The management of risk and the ways in which we seek to mitigate the impact of risks forms part of our day to day operations and of each function. In the Strategic Report, on pages 32 to 35, we describe the subject matter of the reviews undertaken by management and the Board during 2014.
Risks associated with ownership of our ordinary shares and American Depositary Shares (ADS’s) can be found on pages 148 to 149 of the Directors’ report – Corporate and Share Information.
We may fail to understand our customers’ needs, anticipate technology trends, or create products for which there is no market.
We may not understand or accurately anticipate what future products, features or technologies our customers want. While we invest significantly in research and development to identify potential new ideas and technologies, (in 2014 we invested $240.9 million on Research and Development), we may invest in the wrong areas, develop products which fail to meet our customers’ needs, or fail to pursue product development opportunities that our competitors successfully undertake and bring to market.
The risk is also compounded because of the lengthy product design and development cycle of our products and technologies, which can take 36 months and, in some cases, even longer. Therefore, ideas for new products, features or technologies that we consider to be in line with our customers’ expectations may, due to the timeline for design and development, become obsolete and be replaced by more compelling products, features and technologies offered by competitors.
In addition, we may not have access to the appropriate technology or the resources needed to translate the ideas under development into products that our customers and the market require, or those that we have may be replaced by superior technologies developed by competitors.
If we fail to correctly anticipate technology trends, we may create products or technologies for which there is either a smaller than expected market or no market at all. If we fail to identify the needs of either our customers or the market, (on a timely basis or at all), or we fail to develop the right products or technologies, we may lose market share to our competitors if they are able to offer customers the products and features which customers want. If our products do not have the features or capabilities which our customers want, we may not achieve the expected demand for those products or be able to achieve the desired selling price. This may result in us achieving margins and returns on our investment which are lower than anticipated. Further, if we need to make changes to our products, to meet customer requirements, we may incur additional research and development expenses and delay the delivery of the re-designed products. Any of the foregoing could materially adversely affect our business, results of operations or financial condition.
We may fail to develop new products on a timely basis or implement our product development roadmaps effectively.
In our industry, being early to market is increasingly significant for sustaining a leadership position and being able to set high selling prices, which in turn impacts profitability. Meeting our strategic objectives and growing our business is dependent on our ability, on a timely basis, to convert the ideas in which we invest our research and development resources into innovative and differentiated semiconductor and platform solutions for existing and new markets. Various factors could result in us not obtaining an “early mover” advantage and missing windows of opportunity for introducing new products and technologies. Executing on product and technology innovation is highly complex. In addition, product design and development can take 36 months and, in some cases, even longer. During this time, we may not allocate sufficient resources to projects or may fail to plan or monitor the conduct of the project adequately. These factors can mean that during the course of development we may encounter unforeseen technical challenges or be unable to fulfill the objectives as expected, which may result in delays and impact our delivery schedules.
Moreover, we may be required to meet industry defined standards, or make changes to reflect the requirements of our customers. We may also fail to understand market requirements during the planning phase, which may require us to make changes during the development phase.
In addition, in the event of an unplanned business continuity event, such as denial of access or loss of any of our business locations, at a critical point in the lifecycle, we may be unable to execute to plan.
Each of these issues could delay the development of products or technologies, which could impact their launch and delivery, thereby causing us to miss market opportunities. Such delays could also lead to existing or potential new customers seeking alternative solutions and placing their business with competitors, which could have a material adverse effect on our market share and results of operations.
We may fail to effectively launch new products to the market, or fail to successfully engage with the right customers due to misunderstanding technology trends, customers or markets.
Our success depends on the adoption by our customers of the technologies we offer, as well as the development and subsequent growth of the markets to which our products are targeted. Launching our products successfully involves not only offering products and technologies that meet our customers’ requirements and market expectations on a timely basis, but also promoting and marketing such products effectively so that our customers are able to understand the products and technologies we offer.
Effective engagement with our customers is important. We may launch products and technologies at a time which is in accordance with our own plans and intentions, but such launches may not be successful if we are not able to demonstrate to our customers the capabilities or differentiated features of our products. We may not provide the necessary support to ensure our customers are able to integrate their products with our own, because we do not allocate sufficient or the right sales, marketing or technical resources. In addition, our customers may change their requirements, they may wish to adopt similar or equivalent technologies at a stage in their own development cycle which we are unable to satisfy, or decide
that the technologies or products we have been developing are no longer suitable or may determine that the products we supply will not fulfill their particular requirements. Our technologies may, as a result, decline in importance or be replaced entirely as the prevailing technology, particularly if customers consider that superior technologies are being offered by competitors.
Furthermore, our success depends upon the success of our customers’ products in the marketplace. Even if customers do adopt our solutions, in the event that their own products are unsuccessful, or expected adoption of new ideas fails to occur, on a timely basis or at all, our business may also be materially adversely affected. Moreover, our customers may not have or be able to maintain market leading positions in their product segments, may suffer delays in the introduction of the end-product in the market, may not have the required marketing and distribution capabilities, or may fail to anticipate demand for their product. Any of the foregoing could have an adverse impact on the success of the end-product and, therefore, on our business and results of operations.
Our Information Technology (‘IT’) and automated systems may not develop in line with the requirements of our business, could suffer an interruption or chronic failure or be subject to hacking by third parties, all of which could disrupt the conduct of our business and/ or result in unauthorised disclosure of sensitive information.
We rely on IT and automated systems to support our operations globally. Our IT systems are important in supporting effective decision making including the conduct of research, development and introduction of new products, and also for the planning as well as for day to day management of our strategy and business activities, such as scheduling deliveries, invoicing and recording costs. Our systems also store commercially sensitive and highly confidential information (which includes the intellectual property and proprietary information owned by us, our suppliers and our customers), as well as personally identifiable data of our employees and individuals with whom we conduct our business.
As we grow and evolve our business, we need to ensure that our IT infrastructure is able to handle the larger and potentially broader scope of our business and that we implement and maintain suitable data security procedures to protect and safeguard the data and information we use in accordance with our requirements and the expectations of our customers. This could require the expenditure of significant funds and management resources, which could adversely impact our business and results of operations. If our IT systems fail to evolve along with the needs of our business, due to our lack of investment, failure to predict future business needs or otherwise, our ability to develop new products, maintain adequate operating systems to support ourday-to-day activities or grow our business could also be adversely affected.
Our IT systems could also suffer an interruption or a chronic failure, which may occur, for example because of power shortages, natural or man-made disasters, or failure of a service supplier. This could affect our day-to-day business activities including our development work, for example by disrupting the performance of projects, causing errors to occur in the complex hardware and software we develop for our products, or preventing us from launching new products on time.
Despite our data security measures, third parties may attempt to obtain, use, copy, disclose, distribute, offer for sale or make our products, services or technology without authorisation, including through hacking our systems to misappropriate our proprietary information and technology or interrupt our business. Because the techniques used by computer hackers and others to access or sabotage networks change frequently and generally are not recognised until launched against a target, we may be unable to anticipate, counter or ameliorate these techniques. In addition, our procedures and protocols for protecting our systems and regulating the appropriate access to our data by our employees may not be sufficiently robust, and our information technology and infrastructure may be breached due to employee error, malfeasance or other disruptions. The incidences of such attacks upon businesses and governments have increased significantly in the past few years. In 2014, we identified incidents where attempts were made to gain access to our systems and data. With support from third parties in the evaluation of the threats posed and the measures taken by the Company, we believe the data that we hold and systems were not compromised. However, we may be subject in the future to attempts to gain access to our data and those attempts could be successful. Whilst we continue to invest in measures intended to safeguard our systems and data, these measures may not be effective against certain methods used by third parties. For additional information see page 34.
Interruption of our IT systems or loss of data could also disrupt or cause delays in the performance of our day to day business, in decision-making, recording and satisfying customer orders, or result in errors in ordering products from our suppliers.
An inappropriate exposure, disclosure, loss or misappropriation of confidential information, including IP, could result in us breaching the intellectual rights of third parties or undertakings we have given to safeguard third-party information, and could result in legal claims or proceedings, liability under laws that protect the privacy of personal information, regulatory penalties, disruption of our operations, a loss of confidence in our products and damage our relationships with third parties and wider business reputation, which could have a material adverse effect on our business and results of operations and financial condition.
Any of the foregoing could have a material adverse effect on our business, reputation, results of operations and financial condition.
Intellectual Property Rights may provide insufficient protection.
Protecting our proprietary technology is an important part of being able to compete successfully. We rely on a combination of patent, trade secret, copyright and trademark laws, nondisclosure and other contractual agreements and technical measures to protect our proprietary rights.
These measures and the scope of rights may not be sufficient to protect our technology from third-party infringement, invalidation, challenge, circumvention, or to protect it from the claims of others. If our intellectual property rights do not adequately protect our technology, our competitors may be able to offer products similar to ours. Also, the laws of some countries, such as China, in which we operate and/or from which we derive significant amounts of revenue (54% in 2014), may not protect intellectual property to the same extent as, for example, the laws of the United States and Western Europe, and our products may be at risk of misappropriation by third parties.
| | |
| 44 | | CSR plc Annual Report and Financial Statements 2014 |
Our patent applications may not provide sufficient protection for all competitive aspects of our technology or may not result in issued patents. Issued patents may also not provide us competitive advantages. If competitors are able to use our technology, our ability to compete effectively would be affected. Moreover, while we hold, or have applied for, patents relating to the technology used in our products, some of the products are based in part on standards, for which we do not hold patents or other intellectual property rights. Even where we have an issued patent, we may choose not to pursue all instances of patent infringement. Competitors may also independently develop technologies that are substantially equivalent or superior to our technology and may obtain patents that restrict our business.
Our failure or inability to obtain sufficient intellectual property rights protection could increase our expenses and harm our competitive position and/or result in increased litigation.
When expanding or evolving the technologies in which we choose to invest or the regions where we conduct our business, we may not properly understand the regulatory environment applying to those technologies or regions.
In order to remain a leader in our chosen markets, CSR must innovate and develop new ideas, technologies and products that are attractive to customers and end-users. When working on these ideas we may identify applications for our technologies or products in end markets with which we or our customers have limited experience. These applications may be in markets which are subject to extensive regulation, for example in areas concerned with public health or safety where products may have to satisfy specific standards, undergo testing or registration.
We conduct our business in multiple territories, each of which has their own laws and regulations that apply to us and that are subject to change from time to time. These include, for example, business registration, periodic reporting, filing of returns, laws and regulations concerning our corporate activities or with the conduct of our business, including for example securing business with customers and suppliers, employment, or health and safety. While we seek to ensure that we comply with the laws and regulations which apply to us, there may be circumstances or occasions where we are not in compliance, for example in the storage, use or tracking functions which can form part of the capabilities provided by our products. In addition, new laws or regulations may be introduced which impose immediate compliance or require us to adapt our practices or procedures in order to comply. We may find that we do not implement the required changes on a timely basis. This may result in actions being brought against us and we may incur fines, penalties or disruption to our business as a result of our non-compliance, which could have a material effect on our reputation, results of operations or financial condition.
We may not possess a detailed understanding of these regulations (for example, due to inadequate assessment of the regulatory requirements) or they may change during the time in which our products or technologies are under development which may mean that our products and the way in which those products are used, do not comply with some or all of the regulations. This may cause us to have to cancel a project altogether, or undertake additional work in order to meet the required regulations. In such circumstances, we may incur significant extra costs, have to write off research and development, or incur delays in the launch of our products or technologies.
We may also incur fines or penalties, which may be imposed by regulators or arise from a claim brought by a customer, (because for example, we did not fulfill the requirements of contracts we have with them). Any of the foregoing could have a material effect on our reputation, results of operations and financial condition.
We are regularly, and may continue to be, subject to lawsuits, including lawsuits alleging claims that we infringe third party intellectual property rights (‘IPR’), and may also be subject to indemnification claims each of which may be costly, time consuming to contest and may result in loss of IPR.
From time to time, in the ordinary course of our business, we have received, and expect to continue to receive, communications from customers, competitors and others threatening litigation, alleging that we have breached rights or obligations belonging or owed to them concerning patent and other IPR. Additionally, we have in the past received, and may in the future receive, notices that challenge the validity of our patents. These claims may involve technology and patents that apply to a wide range of our products and know how. Furthermore, in some circumstances we agree to indemnify some customers for costs and damages arising from claims of infringement of IPR brought against those customers, and we have received, and expect to continue to receive, indemnification claims from customers that are involved in intellectual property litigation implicating, directly or indirectly, our products. These claims have in the past been, and may in the future be, material, and as we grow and expand our business, there is an increased likelihood of IPR claims against us and/or our customers.
Companies in the semiconductor industry can be expected to aggressively protect and pursue their IPR. In addition, it is common in our industry to find third parties focused solely on bringing IPR claims. IPR litigation typically involves allegations of infringement and seeks unspecified damages, a permanent injunction against further infringement, a finding of willful infringement, and attorneys’ fees and costs. IPR claims may also involve the filing of complaints with United States courts or administrative bodies, such as the United States International Trade Commission (ITC), urging it to investigate the import and sale of allegedly infringing products. In these cases, plaintiffs typically seek an exclusion order against future import of the infringing integrated circuits, chipsets and products, including a cease and desist order in relation to marketing, advertising, demonstrating, warehousing for distribution, offering for sale, selling, distributing, licensing or using the infringing products in the United States or transferring them outside the United States.
We may not prevail in any particular litigation and we may, among other things, be required, whether as a result of litigation against us or because of indemnification obligations, to:
| — | | pay damages, royalties, lost profits, exemplary damages, thethird-party’s attorneys’ fees and costs, court costs, licensing and/or settlement costs, any of which may be material, including payment of attorneys’ fees for both our attorneys and our customers’ attorney(s) in instances where we have indemnified our customers; |
| — | | cease the development, manufacture, use, marketing and/or sale of products that use the intellectual property in question in light of a court-imposed order or injunction or in light of an administrative order (including an ITC order); |
| — | | cease the importation of products into the United States or other countries in light of a court-imposed order or injunction or in light of an administrative order (including an ITC order); |
| — | | expend significant resources to modify or redesign our products, manufacturing processes or other technology so that we do not infringe others’ IPR, or to develop or acquire non-infringing technology, which may not be successful or solve the underlying legal claim; |
| — | | obtain licenses to disputed rights, which could require the payment of substantial upfront fees and future royalty payments and may not be available to us on acceptable terms, if at all, and potentially be at a competitive disadvantage relative to competitors who are able to obtain such licenses; |
| — | | cease marketing the challenged products; or |
| — | | pay for alternatives for a customer if an injunction is issued against the customer, which alternatives may or may not be available, and pay customer’s losses resulting from the injunction. |
Any of the foregoing could have a material adverse effect on our results of operations, financial condition or cash flows.
Furthermore, certain of our products are designed for use in devices used by significant numbers of consumers, such as, for example, automobiles, including in-dash navigation units, personal navigation units, mobile telephones, headsets, sound systems and gaming devices. Our server software is placed on servers providing wireless network services to end-users. Because of the widespread consumer uses of devices incorporating our products, we could be subject to considerable exposure should an infringement claim against us or our customers occur, which, if successful, could have a material adverse effect on our results of operations.
Regardless of the outcome, litigation brought against or involving us, may require the expenditure of significant funds and resources, including significant attorneys’ fees, and time to litigate, defend or settle such claims. It can also divert the attention of our management or other key employees. Litigation can take months or years to resolve, even if ultimately settled. While a claim is pending against us, our customers may be reluctant to include our products as part of their future product design, including if they believe that our products might ultimately be subject to an injunction or other legal remedy preventing their sale, import or use. To the extent we dispute a customer’s right to indemnification, such dispute may harm our goodwill and reputation with the customer and may harm the possibility of future business from that customer. In some instances, a customer may seek discounts or refuse to pay outstanding invoices in light of pending demands for indemnification. Even if we ultimately are successful, negative publicity could harm our reputation and have a material adverse effect on our business, in addition to the expense, time, delay and burden on management of the litigation itself, each of which could have a material adverse impact on our business, results of operations and financial condition.
Design errors could go undetected during the development or validation phases of our products or technologies, which could result in errors or inadequate performance, which may lead to product recall or customer dissatisfaction.
The products that we supply to our customers are required to operate in accordance with very precise specifications. In addition, as we innovate in the development of new products and technologies, there is a risk that we lack the necessary level of understanding and technical capabilities, particularly with the growing complexity of software related features which are required
in our products and solutions. We may not be able to detect errors or defects during the research and development of the hardware and software that are used in our products or in their manufacture, or we may fail to identify bugs or susceptibility to compatibility issues before the products are supplied to customers or installed in the customers’ own finished products. This may occur due to inadequate design of the product or manufacturing testing schemes, or insufficient or inadequate and suitably trained resources capable of identifying potential problems.
Errors, defects, bugs or viruses that may be present in our products could result in our customers’ devices being faulty, which would result in returns from customers. If failures occur in such faulty devices which are considered to be attributable to our products, we may face claims for losses or damages, incur costs for rectifying the defects or replacing the product, and experience order cancellations, any of which would adversely affect our business reputation and results of operations. In addition, if any of our products failed to comply with customer specifications (including, for example, compliance with certain environmental requirements), customers could have a right to reject or return products to us. The risk of returns from customers could increase in the event we participate in new or evolving markets for our technology, for example health-related applications for developing technologies, such as Bluetooth Smart.
Certain customers have a more stringent policy regarding defects or errors. For example in the automotive industry, a market in which CSR is a supplier, if errors allegedly arise and such errors are our responsibility, the expenses in responding to such alleged defects and any claims brought by our customers for rectification could have a materially adverse impact on our financial condition and results.
We have agreements with customers that provide warranty protection or indemnities. Some of these agreements have no limitations on liability and for those that do, the limitations may not be enforceable. Product defects could have longer term harmful effects on our reputation or our relationships with our customers or the market acceptance or sales of our products.
We rely on a limited number of third party foundries and subcontractors (in some cases sole suppliers) to support product development, supply materials, manufacture, package and test integrated circuit products who may be unable to meet the requirements of our business.
We do not own or operate a fabrication facility and, therefore, rely on third parties, in particular TSMC and ASE, to supply materials, manufacture, package and test our products on a timely basis and to agreed specifications. In 2014, TSMC was responsible for the manufacture of a significant proportion of our integrated circuits or silicon chips and ASE provided a significant proportion of the testing and packaging support for our products. For the manufacture of our products, critical components are purchased from a small number of suppliers, and for certain raw materials a single supplier, in supporting the manufacture of our products.
| | |
| 46 | | CSR plc Annual Report and Financial Statements 2014 |
Furthermore, during the research and development phases, we may from time to time use third parties to support us in the execution of our projects to assist in creating products and technologies, in circumstances where we lack the required resources or specialist capabilities.
We have no long-term supply contracts and, therefore, our suppliers are generally not contractually obligated to perform services or supply products to us for any specific period, in any specific quantities, except as may be provided in a particular purchase order.
Our reliance on suppliers exposes us to a variety of risks associated with their operations, including:
| — | | changes to the terms on which they are able or willing to supply products and services to us, including adverse changes to pricing, inadequate capacity made available to us for the manufacture or testing of our products or to support the delivery of finished products, for example by providing that capacity to other customers in preference to us; |
| — | | natural disasters, including earthquakes and tsunamis, pandemics or geopolitical instability or events causing disruption within the suppliers own supply chain, interruptions or disruption to the conduct of normal business including research, manufacturing or testing conducted at the supplier sites, plant shut-downs, closures or cessation of business altogether, resulting in our suppliers being unable to meet their obligations, including sourcing the raw materials they need in order to satisfy particular orders; |
| — | | disruption to the suppliers’ manufacturing process due to government imposed restrictions on use, or lack of availability, of natural resources; |
| — | | changes in senior management personnel with whom we deal most closely; |
| — | | undetected errors caused by our suppliers during the performance of their work on our behalf resulting in the products or service supplied not meeting our requirements or those of our customers; |
| — | | financial difficulties that may result in our suppliers being unable to obtain raw materials or services to satisfy particular orders, to maintain their operation at the level necessary to meet our needs or to remain in business altogether; |
| — | | failure or interruption of IT systems resulting in an inability to provide the required goods or services, which in turn affects our ability to supply our customers; |
| — | | quality problems at manufacturing sites, resulting in lower yields, product failures and product returns; |
| — | | limited control over delivery schedules, quality assurance and control and production costs; |
| — | | enforcement by regulatory bodies for alleged or actual failure to comply with laws or regulations in the operation of the suppliers business (including those for the protection of the environment or that regulate working conditions); and |
| — | | other developments that cause suppliers to modify their operations in a manner that has the affect of adversely impacting their ability to meet our needs. |
We have experienced some of the foregoing in the past and similar disruptions could occur in the future and could materially adversely affect our business and results of operations.
Any of the risks listed above could require us to find alternative suppliers, which we may be unable to do on a timely and cost efficient basis. Failure to find alternative suppliers on a timely and cost efficient basis, in turn, could result in delays in the manufacture and shipment of products and increased costs. We could as a result suffer strained relations with one or more of our customers and impaired margins. These consequences could undermine perceptions of our reliability, result in lost business and ultimately could adversely affect our results of operations. Even if we were able to find alternative suppliers (which may prove difficult), processes necessary to qualify a supplier including satisfying preliminary quality assurance clearances could take several months to complete and we, or our customers, may still experience problems arising from the use of new supply partners.
In addition, we are subject to price volatility in the marketplace of the raw materials required to manufacture our products, for example we have seen in the past, and may expect to see in the future, volatility in the price of the metals such as gold and copper which are used in the integrated circuits which are contained on our chips. This volatility makes it difficult for us to predict our cost of sales and may cause our results of operations to fluctuate significantly. If the cost of raw materials increases, our profit margins may decrease substantially.
The average selling prices of our products have historically declined over their life and this is likely to continue.
In the highly competitive markets in which we operate, the pricing of products which we supply can have a material bearing on a customer’s decision to award contracts, particularly (though not exclusively) for products where technical or feature differentiation is limited or which have been superseded by subsequent generations of new products.
In addition, competitors may adopt much lower prices as part of a strategy either to disrupt the position of incumbents (particularly in an attempt to undermine market leaders who possess significant market share), or where they are seeking to establish a significant share in a new or emerging market, with the intention of attracting the business of existing or potential customers of CSR. Such measures may mean that our existing customers or potential new customers decide to place their business with third parties, rather than CSR. We recognise this risk, particularly in markets where CSR has high market share, such as Voice & Music, in markets which have experienced a proliferation of the adoption of wireless connectivity, communication and information systems, such as Automotive and in rapidly emerging markets in which CSR is competing for market share, such as the Internet of Things. Competitors taking such steps may include those who are larger than CSR or whose business is predominantly conducted in regions that have a lower cost base (for example in Asia) and who are better placed to withstand the effects of lower prices and therefore lower operating margins.
We have in the past reduced, and we expect in the future to reduce, the average selling prices of our products in response to competitive pricing pressures, or new product introductions by our competitors. However, we may not respond on a timely basis to actions taken by our competitors, resulting in customers placing their business with our competitors. Even in instances where we do reduce our prices, we may fail to effectively offset the impact of reduced prices by increasing our sales volumes, reducing costs or successfully introducing new products at higher prices. Any of the foregoing could adversely affect our profitability, and financial condition.
We may fail to operate an effective sales and distribution infrastructure to be successful in new and developing markets.
We have traditionally operated in markets where a significant proportion of the potential customers are large global companies with established protocols and methods of doing business. As a result, the conduct of business with these customers has been supported through well-established direct and indirect sales and third party distribution channels.
In the recent past this has changed. This has in part been affected by our strategic transition away from the mobile handset business, towards the development of emerging technologies and products and the adoption of technologies such as Bluetooth Smart and Indoor Location. In addition, certain potential end markets for these products and technologies, such as the Internet of Things, are new and therefore the possible demand from users and areas of greatest growth are unpredictable. There have also been changes in the business and strategy of our customers, as well as a broadening in the number of potential customers, (with different requirements) due to the proliferation and increasing investment in recent years in smaller companies looking to develop niche products or technologies for potential high growth markets such as the Internet of Things. We believe that the unpredictable nature of how they will develop, including which customers are best positioned to succeed and how their requirements can most effectively be supported, create considerable uncertainties as to our strategy and how we should most effectively engage with customers in order to position the Group to grow. In addition, markets in regions such as China and India have seen a greater number of companies being established with diverse demands and product requirements. We therefore anticipate an increasing need to adapt our approach to engaging with a greater and more diverse group of customers, including smaller and emerging customers, who are new to the markets which are expected to utilise these technologies.
We may fail to invest sufficiently in the business systems and infrastructure that may be required for us to support a broader and more diverse customer base in an effective and timely manner. We may also be unable to establish the right sales team for the given markets, or to adapt our systems or establish business relationships with third parties, (including distributors), for the wider and more diverse customer base and end markets. We may, as a result, not be able to promote our products to the right customers or support the right customers effectively. We may also use our
resources to work with customers who ultimately are not successful in developing or launching their own products. As a result, we may not be successful in potential markets and fail to secure new business opportunities, which would have a material adverse effect on our business prospects, results of operations and financial condition.
We may not hire, retain or develop people with the essential skills needed to support our business objectives.
We depend on the specialist skills and capabilities of our employees to develop new technologies and products to compete effectively and secure new business. In some cases these skills are rare and the demand from businesses in acquiring the people with such skills is intensely competitive. Key personnel may leave our Group without us being able to replace them with new suitably qualified and experienced personnel.
Our people have experienced significant changes, arising from transactions in recent years including the acquisition of Zoran in 2011 and the disposal of the handset connectivity and handset location development operations in 2012, as a result of which more than 300 employees were transferred out of the Group. More recently, on 15 October 2014, we announced the terms of a recommended offer of an all cash acquisition of the Company by Qualcomm Global Trading Pte. Ltd. (‘QGT’), an indirect wholly owned subsidiary of Qualcomm Incorporated (‘Qualcomm’), to be effected by a scheme of arrangement under the Companies Act 2006 (the ‘Scheme’). The court meeting and general meeting held on 4 December 2014, resulted in the approval of the Scheme by the Company’s shareholders and the passing of a special resolution to approve certain matters relating to the Scheme and the transaction. The transaction is subject to a number of regulatory and other conditions, which are set out in full in the Scheme document and which include clearance by competition authorities in China, Germany, Japan, South Korea, Taiwan and the USA. Subject to these conditions being satisfied, the Scheme is expected to become effective by late summer 2015.
It is recognised that such matters, including the expected future closing of the transaction can be unsettling and disruptive, which could affect the retention of key people.
Whilst CSR continues to invest in its personnel, including supporting them in the development of their capabilities (including technical capabilities), we may be unable to identify, acquire and retain skilled resources, which in turn could affect our ability to execute on our strategy. The failure to recruit people or to provide adequate training or development may result in our employees not having the required knowledge and skills for us to pursue our strategy. This could adversely affect our business.
| | |
| 48 | | CSR plc Annual Report and Financial Statements 2014 |
We do not have long-term contracts with our customers.
In keeping with wider industry practice, we do not generally enter into long-term purchase contracts with our customers, and we cannot predict whether our current customers will continue to place orders or whether existing orders or contracts will be cancelled.
Customers generally purchase our products subject toshort-term purchase orders, which, in some cases, the customer may revise or cancel altogether (for example, due to slowing demand, economic conditions, change in end-consumer purchasing preference or other events beyond the control of the customer, including natural disasters). If our customers stop placing orders for our products or cancel or modify existing orders or contracts, our results of operations and financial condition could be materially adversely affected.
Macro-economic conditions may continue to adversely affect demand for our products and hence our financial performance.
We are a global company, with operations and business conducted in many parts of the world. Depressed economic conditions have persisted to varying degrees through 2014 in different parts of the world and these macro-economic variations, and the general uncertainty as to the potential for economic recovery, linked in part to concerns about the persisting high levels of personal, corporate and government debt are expected to continue in 2015.
Our products predominantly are, and will continue to be, supplied for incorporation into devices intended for the consumer market. If economic conditions worsen and sales of such consumer devices decline, demand for our customers’ products, and, therefore, for our own products, is also likely to decline. Any difficulties experienced by our customers and suppliers in accessing sources of liquidity could also seriously disrupt their businesses, which could lead to a significant reduction in future orders of our products or difficulty on their part to meet their payment obligations to us or the inability of suppliers to meet their obligations to us in supplying products or continuing to support our business needs.
Any of the outcomes above may materially and adversely affect our business.
We could be adversely affected as a result of financial difficulties of or failure by, our distributors.
We supply a significant proportion of our products to end customers through third party distributors. Our largest distributor accounted for approximately 29% of our revenue in 2014, compared to 21% of our revenue in 2013 and 16% of our revenue in 2012. The distributors are independent third parties who support our own direct marketing and sales. Distributors will continue to play an important role for CSR in delivering on our strategy, as we evolve our business model, supporting us in winning new business as we broaden the number of customers to whom we expect to supply our products and services. Continuing economic uncertainty in addition to changes in the Company’s customer base presents significant challenges for our distributors, including:
| — | | uncertain demand patterns, which could result in distributors ordering more products than they require to satisfy our end customers, resulting in them holding excessive inventory; |
| — | | restrictions on credit terms, which could result in distributors experiencing difficulty in selling products because end customers do not have the cash flow to enable them to buy from the distributors; and |
| — | | fluctuating order patterns, which could result in end customers amending existing orders or ceasing the purchase of products because of insufficient demand, each of which could affect our distributors’ ability to continue in business. |
Our business would be disrupted if end customers were unable to obtain our products from the distributors on a timely basis. In the event a distributor fails, we may be unable to collect amounts owed to us, for products that we have supplied or recover those products in default of non-payment.
We are exposed to the political, economic and regulatory conditions in the countries in which we and our customers operate, which may adversely affect our operating results.
We derive nearly all our revenue from sales outside the UK. For example, our sales in China, where we maintain three offices and approximately 200 employees, accounted for 54%, 59% and 55% of our revenue in 2014, 2013 and 2012, respectively. Further, one of the factories that manufacture our products has operations located in China. During 2014, there has been heightened unrest which has affected a number of the world’s established and emerging economies. Examples include the widespread demonstrations in Hong Kong, geopolitical tensions, such as those resulting in the introduction of trade embargoes involving Russia and Western governments and an increase in terrorist attacks in various parts of the world. We recognise that because of our global business activities in regions spreading from China, through India to the US, we are subject to economic climate, political environment, government policy and other risks that affect these countries in which we and our customers operate, including regions, where the political, legal and economic climate, both nationally and regionally, can be volatile and unpredictable.
We may face difficulties in complying with business practices or managing cultural differences, difficulties in working with local infrastructure and transportation networks, as well as difficulties in complying with local regulatory requirements in the design of products in each of the countries in which we and our customers operate. In particular, we are exposed to the evolving legal and regulatory environment and enforcement in China, which is subject to inherent uncertainties. Examples of economic and political developments that could adversely affect us include government control over capital investments, increased taxation, restrictions on imports, import duties or currency revaluations. In addition, protection of intellectual property rights and confidentiality in China may not be as effective as in the United States or other countries or regions. We may also incur costs in complying with new laws and regulations (for example, labour laws and regulations have been recently enacted in China).
Moreover, we and our customers are subject to various import and export laws and regulations. Government export regulations apply to the encryption or other features contained in some of our products. As a result, we and our customers may face restrictions on imports and exports or incur costs or operational limitations in obtaining and complying with the required permits. For example, the Chinese government imposes controls on technology import. If we fail to continue to receive licenses or otherwise comply with these regulations, we may be unable to manufacture the affected products at foreign foundries or ship these products to certain customers, or we may incur penalties or fines.
Our product or manufacturing standards could also be impacted by new or revised environmental rules and regulations or other social initiatives. For example, in August 2012, the US Securities and Exchange Commission (the ‘SEC’) adopted annual disclosure and reporting requirements for companies that use ‘conflict’ minerals (tantalum, tin, tungsten and gold) mined from the Democratic Republic of Congo and adjoining countries in their products. Because our products contain one or a combination of tantalum, tin, tungsten and gold to improve their functionality, we have since May 2014 filed and are required going forward to file with the SEC Form SD, a specialised disclosure report. Such future requirements could involve additional costs, including those related to the due diligence process of determining the source of minerals used in our products, as well as the costs of possible changes to products, processes or sources of supply as a result of such verification activities. Moreover, these requirements could affect the sourcing and availability of minerals used in our manufacturing processes, as a result of which we may not be able to obtain products at competitive prices. Some of our customers may also elect to disqualify us as a supplier if we are unable to verify that all of our products are ‘conflict-free’.
If we or our customers fail, or are unable, to manage these risks in the various markets in which we operate, our business may be materially adversely affected.
We may fail to compete successfully in a very competitive market.
The markets for our products are highly competitive and rapidly evolving. Competition has been intensifying and is expected to continue to intensify in the future due to the emergence of new companies as competitors in our markets or new markets where we choose to operate, or due to consolidation of market participants.
We compete in different markets to varying degrees on price, technical performance, product features, product system compatibility, product design and technology, timely introduction of new products, product availability, and sales and technical support. We are seeing increased competition throughout the markets in which we operate. The increased competition could result in more pronounced price reductions, reduced margins and/or loss of market share.
Within the markets in which we operate, we face competition from public and private companies, as well as the in-house design efforts of our customers. In addition, we have seen increasing competition from a number of companies who have exited markets in which they were established and become new entrants in markets where we operate. A number of our competitors have significantly greater financial, technical, research and development, marketing, sales, manufacturing and other resources than us. Some of our competitors bundle their connectivity and location products with baseband processors, and we may lose those customers that prefer to use platform suppliers for the full suite of connectivity and baseband modem solutions. Other competitors conduct business in regions that have a cost base lower than we do (for example in Asia), which allows them to withstand the effects of lower prices and lower operating margins. If we fail to compete successfully, our results of operations and prospects would be adversely affected. Competitors taking such steps may include those who are larger than CSR or whose business is predominantly conducted in regions that have a lower cost base.
We may fail to manage the transition to smaller geometry process technologies.
To remain competitive and sustain our prospects for growth, we need to provide products and solutions which incorporate increasingly complex features, whilst at the same time meeting increasingly exacting requirements on size, power and cost. This requires us to progressively transition our semiconductor and system-on-chip products to increasingly smaller line width geometries (meaning chips of a smaller size whilst incorporating faster processing time using less power) which helps support customer demands for smaller, more powerful and cost effective solutions. This transition requires modifications to design and manufacturing processes, and achieving these modifications could result in delays in product deliveries, increased expenses or reduced manufacturing yields.
Failure to transition to smaller geometries, on a timely basis (or at all), particularly in the development of system-on-chip solutions, could materially and adversely affect our competitive position.
We may be unable to obtain or fail to procure sufficient insurance to protect our business.
We are engaged in business activities which are technically complex, and involve us in developing new and innovative solutions that are adopted by our customers. Because of the complex nature of our business, we have in the past, and expect to continue to face, difficulties in obtaining insurance, for example where we might face claims for breach of third party intellectual property or claims associated with errors or defects in our products. Moreover, our insurance may not be sufficient or effective under all circumstances and against all hazards or liabilities to which we may be subject, including cyber security attacks which have materially increased in recent years. Even where we have obtained insurance, it may not be sufficient to cover one or more large claims, or such cover may not be available on acceptable terms. The insurer may also deny coverage as to any future claim. The successful assertion of one or more claims against us that exceeds available insurance coverage, or the occurrence of changes in our insurance policies, including premium increases or the imposition of large deductible or co-insurance requirements, could have a material adverse effect on our business, reputation, results of operations and financial condition.
| | |
| 50 | | CSR plc Annual Report and Financial Statements 2014 |
We may fail to manage inventory levels and those affected by end of life manufacturing cycles.
The lead time to manufacture and test our products for delivery from our suppliers ready for shipment to our customers can take 12 weeks and in some cases even longer. To ensure we have sufficient product to meet our customers’ future demand, we have to make assumptions about order levels, relying on customer projections as well as our own judgment and experience.
Due to general economic conditions and the volatile nature of the consumer electronics markets, actual demand can differ significantly from our assumptions. Such fluctuations in demand tend to be more extreme during the initial launch of a new product and also towards the end of a product’s economic life, when demand can vary substantially from expectations.
Such fluctuations can result in us ordering too little product, in which case we cannot meet our customers’ requirements (which could affect our reputation with our existing or future customers), or too much, in which case we hold excess inventory. Holding excessive inventory could cause us to charge lower prices to be able to sell such products (which could have an adverse effect on our profitability), or write off inventory (which could result in us incurring material costs).
We have in the past, and may in the future, be affected by decisions of our customers to cease the supply of products or particular models that have experienced sharper than expected decline in demand (for example, this may occur where the product is superseded by an updated model or by competing products that offer more attractive features). In addition, some markets for particular products can experience unexpected changes in demand patterns (such as we experienced in China during 2013 for our mono headsets in response to enforcement of driving legislation on use of mobile phones).
From time to time, circumstances may arise which require us to order greater quantities of products in order to meet expected demand over the longer term, albeit this is greater than the levels forecasted by customer order schedules. For example, during 2012, we were informed of the decision by a supplier to cease manufacture of a product. This required us to place orders at higher volumes in the short term, in order to allow us to support customer demand in the period after manufacturing by our suppliers ceased. Insufficient or excessive inventory may result in us either having to charge lower prices in order to sell the products or being unable to sell the products, write off the inventory, resulting in the Company incurring further material costs. We believe this risk is enhanced in less mature markets and when engaging with a broader and more diverse customer base, such as the Bluetooth Smart and Indoor Location markets.
The proposed transaction with Qualcomm may disrupt our business and, if the transaction does not occur, the price of our ordinary shares and ADSs may decline.
In October 2014, CSR and Qualcomm announced that agreement had been reached on the terms of a recommended cash offer through which our entire issued and to be issued ordinary share capital will be acquired by Qualcomm under a scheme of arrangement pursuant to the Companies Act 2006, subject to the satisfaction of certain closing conditions. The scheme of arrangement was approved by shareholders in December 2014,
and the parties expect that it will become effective by late summer 2015. The proposed transaction, whether or not consummated, may disrupt our operations and business and may divert management’s attention and our resources from ongoing business and operations. Moreover, we may incur unexpected costs, charges or expenses resulting from the proposed transaction, some of which are payable by us whether or not the proposed transaction is consummated. Any of the foregoing could have a material adverse effect on our business, results of operations and financial condition.
The proposed transaction is subject to closing conditions, such as the satisfaction of certain regulatory conditions, including antitrust clearances in China, Germany, Japan, South Korea, Taiwan and the United States. Although pursuant to the Cooperation Agreement, Qualcomm has agreed to use reasonable endeavours to implement the acquisition and satisfy the conditions that relate to antitrust clearances, the closing conditions may ultimately not be satisfied on time or at all. If the proposed transaction is not completed, the share price of our ordinary shares and ADSs may change to the extent that the current market price of our securities reflects an assumption that the transaction will be completed, and it may decline significantly.
Board of Directors
| | | | | | | | |
| | 
| | | | | | 
|
| | Ron Mackintoshnl | | | | | | Joep van Beurden |
| | Chairman | | | | | | Chief Executive Officer |
| | Mr. Mackintosh (age 66), Chairman, has served as a non-executive director since May 2004 and was appointed Chairman with effect from 2 May 2007. Mr. Mackintosh is a non-executive director of software company Fidessa Group plc and non-executive chairman of Nomad Digital Ltd. Mr. Mackintosh has held a number of senior executive positions in European technology companies. Between 1992 and 2000, Mr. Mackintosh was Chief Executive of Computer Sciences Corporation’s (‘CSC’) European business, which had revenues of $2.5 billion. He is also a former director of Gemplus SA, and the former chairman of each of Smartstream Technologies Ltd, Northgate Information Solutions plc and also of Differentis, a privately owned IT consultancy which he co-founded in July 2000. Mr. Mackintosh is Chairman of the Nomination Committee and a member of the Remuneration Committee. | | | | | | Mr. van Beurden (age 54), Chief Executive Officer, was appointed Chief Executive Officer in 2007 and has led global technology companies in the US and Europe for more than 20 years. Prior to CSR, Mr. van Beurden was Chief Executive of NexWave Inc., a provider of embedded software solutions for the consumer electronics market. He held senior positions at Canesta Inc., a fabless semiconductor company and Philips Components, in California. Before this, Mr. van Beurden worked for McKinsey & Company and Shell and lectured in Physics and Electronics at the University of Zambia. Active in the local community and in industry, he has served as a director of the Global Semiconductor Alliance since 2009, serving as Chairman from 2011 to 2013, after serving as a Vice Chairman from 2009 to 2011. |
| | | | | | | | |
| | | | | | | | |
| | 
| | | | | | 
|
| | Walker Boydnlp | | | | | | Levy Gerzberg |
| | Non-executive director | | | | | | Non-executive director |
| | Mr. Boyd (age 62), a non-executive director and CSR’s Senior Independent Director, was appointed a non-executive director of CSR on 6 December 2013. On 1 January 2014, Mr. Boyd assumed the role of chairman of the Audit Committee and on 1 January 2015 he was appointed as Senior Independent Director. Mr. Boyd is also a member of the Remuneration and Nomination Committees. Mr. Boyd is a chartered accountant, with extensive experience of working in listed companies in the UK and US. Until June 2010, when he retired, Mr. Boyd served as Group Finance Director of Signet Jewelers Limited (formerly Signet Group plc), (‘Signet’), a position he held from 1995. Dual listed on the London and New York stock exchanges, at the time he stood down from the Board, Signet had global revenues of $3.3bn, was the largest US specialty jeweller and incorporated a number of recognised UK brands including H Samuel and Ernest Jones. Between September 2010 and August 2013, Mr. Boyd was non-executive chairman of WH Smith PLC. He is currently non-executive chairman of Spirit Pub Company plc, a role he has held since the de-merger of Spirit from Punch Taverns in August 2011. | | | | | | Dr. Gerzberg (age 69), a non-executive director, joined the Board of CSR as a non-executive director on 31 August 2011 following the acquisition by CSR of Zoran Corporation which he co-founded and was its President, CEO and Director. Dr. Gerzberg has over 30 years’ experience in the high technology industry in areas related to semiconductors, software and systems utilising digital signal processing and System-On-a-Chip (‘SoC’) platforms in consumer electronics, communications, PCs, military and medical electronics markets. Prior to co-founding Zoran, Dr. Gerzberg was Associate Director of Stanford University’s Electronics Laboratory, where he managed, conducted research and taught. Dr. Gerzberg served as a director on the Consumers Electronics Association’s Board of Industry Leaders for two terms, from 2006 to 2008 and from 2011 to 2013. In 2014, Dr. Gerzberg was recognised by the Consumer Electronics Association as one of the leaders in the industry when he was inducted into the CE Hall of Fame. He was named Northern California’s 2003 Ernst & Young Entrepreneur of the Year in the Semiconductor category, and in 2004 he was the recipient of the California Israel Chamber of Commerce International Partnership award. Dr. Gerzberg holds a PhD in Electrical Engineering from Stanford University in California and an Msc in Medical Electronics and a BSc in Electrical Engineering from the Technion-Israel Institute of Technology in Haifa, Israel. |
| | |
| 52 | | CSR plc Annual Report and Financial Statements 2014 |
| | | | | | | | | | |
| | 
| | | | | | 
| | |
| | Will Gardiner | | | | | | Christopher Ladas | | |
| | Chief Financial Officer | | | | | | Operations Director | | |
| | Mr. Gardiner (age 50), Chief Financial Officer, joined CSR as Chief Financial Officer in June 2008. Prior to joining CSR, Mr. Gardiner was Finance Director for Technology and Enterprise at BSkyB plc (‘BskyB’). Before its acquisition by BSkyB in 2006, Mr. Gardiner had since 2001 been CFO of Easynet Group plc, a pan-European broadband telecoms company. Between 1991 and 2001, Mr. Gardiner held a number of senior roles within JPMorgan’s investment banking division, specialising in the telecoms and technology sectors. Mr. Gardiner has a BA from Harvard College and an MA from Johns Hopkins University. | | | | | | Mr. Ladas (age 69), Operations Director, was appointed a director of CSR on 1 January 2008. He joined the Company in May 2000 serving as CSR’s Vice President, Operations. He has been instrumental in establishing CSR’s supply chain partnership with TSMC, world leader in wafer foundry operations and ASE, the largest assembly and test subcontractor in the industry. Mr. Ladas currently serves as Executive Vice President Operations. Between January 1996 and May 2000, Mr. Ladas served as the vice president of operations at Micro Linear Corporation. Prior to 1996, Mr. Ladas held several managerial and technical positions at National Semiconductor, Fairchild, Harris, Sperry, Motorola and Signetics. Mr. Ladas holds a BS in Chemistry from Arizona State University, USA. He is also a member of the Institute of Electrical and Electronics Engineers and a member of the Europe, Middle East and Africa Leadership Council of the Global Semiconductor Alliance. | | |
| | | | | | | | | | |
| | | | | | | | | | |
| | 
| | | | | | 
| | |
| | Chris Stonenp | | | | | | Teresa Vegap | | |
| | Non-executive director | | | | | | Non-executive director | | |
| | Mr. Stone (age 52), a non-executive director, joined the Board of CSR as a non-executive director on 16 July 2012 and is also Chairman of the Remuneration Committee and a member of the Audit Committee. Mr. Stone is Chief Executive Officer of Radius, a private company, with operations in the UK, India and the USA, which is a leading provider of specialist technical and administrative support services for companies which are looking to expand into international markets. Prior to taking on this role, in 2012, Mr. Stone served as Chief Executive of Fitness First, one of the world’s leading health and fitness groups, as it went through a financial restructuring. From October 1999 until December 2011, Mr. Stone served as Chief Executive Officer of Northgate Information Solutions plc (‘Northgate’), and was responsible for creating a market leader in providing specialist software, outsourcing and information technology services to the human resources, local government, education and public safety markets across five continents with revenues of over £850 million and employing over 10,000 people. Following the acquisition of Northgate in 2007 by private equity firm KKR for £1 billion, when Northgate de-listed, Mr. Stone remained as CEO until December 2011. Prior to his role at Northgate, Mr. Stone held senior positions with Accenture, Digital Equipment Corporation UK and EDS. | | | | | | Ms. Vega (age 60), a non-executive director, joined CSR as a non-executive director on 27 October 2010 and is also a member of our Audit Committee. Ms. Vega has over 35 years’ experience gained working in the technology and telecommunications industries for leading global companies, including Motorola Inc., where she served as Senior Vice President between June 2005 and July 2007, leading their global CDMA handset business, and Lucent Technologies Inc., where she served as Chief Operating Officer of the wireless infrastructure unit. In each of these organisations, Ms. Vega led and built multi-billion dollar divisions and spearheaded major product launches. Between 2002 and 2005, Ms. Vega also served as Group President, Wireless Cable and Emerging Markets at Telecordia Technologies Inc., a leading global provider of telecommunications software and services for network operators. Ms. Vega is currently non-executive chairman of Cambridge Broadband Networks Limited and ip. access Limited, both of which are based in Cambridge, UK. | | |
p Audit Committee n Remuneration Committee l Nomination Committee
Corporate Governance
Chairman’s introduction
CSR is committed to developing innovative and advanced technologies and solutions within an environment which enables the development and advancement of our people, builds and maintains strong and effective partnerships with our suppliers, supports our customers in the delivery of world-class products and enhances shareholder value. Your Board believes that in setting and pursuing the successful delivery of the strategic objectives, it is also important to do so within a culture which promotes fairness, ethical behaviour, sound judgment and importantly, personal accountability.
In the conduct of its business and that of its Committees during 2014, your Board has played an active role in ensuring that in pursuing the fulfilment of CSR’s strategic objectives such endeavour is conducted within a framework that properly reflects the interests of all our stakeholders.
Throughout the year, your Board and Committees have received reports on all aspects of the Group’s business, including areas directly related to good governance. Examples of the type of subjects include continued enhancement of the Group policies and practices concerned with health, safety and environmental management (including training to empower local management and staff to take personal ownership of such matters), changes to working practices associated with compliance with the US Sarbanes-Oxley Act of 2002 (‘Sarbanes-Oxley Act’), and the implementation of initiatives designed to further enhance existing processes concerned with the Group’s Information Systems (‘IS’) and, linked to that, cyber security measures, which have been ongoing throughout 2014.
As a unitary Board, your directors also have a shared responsibility for the success of the Group. This is performed through the formulation and execution of the Group’s strategy, making enquiries of management, assessing performance, demonstrating independence, knowledge and experience and holding management to account. We consider the Board is sufficiently diverse, conforming to the provisions of the UK Corporate Governance Code (the ‘Code’) on diversity, with the appropriate balance of skills, experience and background. This balance and diversity is periodically evaluated and, when considering new appointments to the Board, attention is given to sustaining the appropriate balance, with due regard for the evolution of the Group.
The following report, which includes on pages 59 to 65 the report of the Audit Committee, and the separate report of the Remuneration Committee on pages 68 to 77, explains how the Board operates, the roles of the Board members and how the Board and its Committees function to ensure compliance with the principles of good corporate governance. In this report and the Strategic Report on pages 38 to 42, we also explain how we encourage our employees across the Group to accept their individual accountability for ensuring that the Group as a whole operates to high standards of governance.
Ron Mackintosh
Chairman
Statement of compliance
The Company’s shares are listed on the premium segment of the Official List maintained by the UK Listing Authority. Therefore, under the Listing Rules of the Financial Conduct Authority, the Board must report on compliance with the Main Principles set out in the UK Corporate Governance Code published by the Financial Reporting Council (the ‘FRC’).
The September 2012 edition of the Code was effective for the Company’s reporting period commencing on or after 28 December 2013. The Board has considered the provisions of the September 2012 Code in determining the extent of compliance and is satisfied that it has complied with the Code throughout the 52 week period to 26 December 2014, except for provision B.6.2. of the Code, which requires the annual evaluation of the Board’s performance to be externally facilitated every three years. As described on page 58, the 2014 evaluation was due to be externally facilitated in accordance with this provision. However, in light of the Qualcomm Transaction described on page 134, which is expected to become effective by late summer 2015, the Board agreed to conduct an informal performance evaluation instead.
On 31 December 2014, as separately announced, Mr. Anthony Carlisle stood down as a non-executive director, an appointment which he had held since 2005. As separately explained on page 56 of this report, the Board considers that in the performance of his duties, Dr. Levy Gerzberg, a non-executive director, who joined the Board in 2011 on completion of the acquisition of Zoran, acts in a manner which is independent of management and the Company. The Board recognises that Dr. Gerzberg does not satisfy the requirements under the Code as an independent non-executive director, based on his previous role within Zoran. As at 1 January 2015, the Board comprises the Chairman, three independent non-executive directors, one non-executive director and three executive directors. This Board composition does not comply with the Code’s requirement in provision B.1.1 for at least half of the Board, excluding the Chairman, to be independent. The balance of the Board has been considered and under the prevailing circumstances, and taking into account the Qualcomm Transaction (described on page 134), the balance has been determined to be appropriate. Mr. Carlisle was also a member of the Remuneration Committee. As at 1 January 2015 therefore, the Remuneration Committee comprised two independent non-executive directors and the Chairman. This composition does not meet the requirements of D.2.1 of the Code, which requires the Committee to comprise of at least three independent non-executive directors. Given the prevailing circumstances and the Qualcomm Transaction, the composition of the Committee was considered appropriate.
The Board has had regard for the amended provisions of the Code, which were published in September 2014 and which will be effective for companies with a financial year commencing on or after 1 October 2014. The Board believes that in regard to the revised Code, actions are already being taken which position the Group for future compliance. For example, there is a process in place for the Board to assess and monitor the Company’s risk management framework in identification and mitigation of risks, whilst the Remuneration Committee, in the conduct of its business, already takes into account the potential for conflicts of interests in regards to information it receives in connection with considerations around executive remuneration.
The September 2012 and September 2014 editions of the Code are issued by the Financial Reporting Council and are available for review on the Financial Reporting Council’s website: www.frc.org.uk.
The Company’s American depositary receipts are listed on the NASDAQ Stock Market LLC (‘NASDAQ’) and the Company is therefore also subject to the rules of the NASDAQ and US Securities laws and the rules of the US Securities and Exchange Commission (the ‘SEC’) applicable to foreign private issuers.
| | |
| 54 | | CSR plc Annual Report and Financial Statements 2014 |
Succession planning and organisational development
The Board recognises the importance that organisational development plays in supporting not only the successful delivery of the Group’s current strategy but also in being able to adapt to changes affecting its business model which are a feature of the rapidly evolving markets in which the Group operates. The Board considers that effective development combines initiatives at both the wider strategic level as well as being focused on the personal development of its employees.
Since 2009, successive corporate transactions have been undertaken by the Group, including the acquisition of SiRF Technology Holdings, Inc. (2009) and Zoran Corporation (2011) and the disposal of the handset connectivity business to Samsung Electronics Co., Ltd. (2012). As a result, significant attention has been given by the Board to the effective management of organisational change as the Group has altered its strategy and evolved its capabilities to being able to provide increasingly complex multifunction connectivity platforms and associated leading technologies. An important aspect of managing this evolution of the Group has been the oversight of associated changes in the management and function of the business, and the resulting impact on our employees. As part of its routine business, the Board received reports on the planning and implementation of such changes and on employee-related matters and organisational changes more generally, with due consideration of the impact on attainment of the Group’s strategic objectives as well as on the appropriate support and effective development of our people in enabling them to adapt and drive such activities.
As the Group has matured in the period since these transactions and been able to embed these changes, additional focus has been given to the personal development of our employees within an established organisational structure. The Group has appointed personnel and allocated resources specifically intended for the provision of training and development covering areas such as technical, professional, managerial and personal development. These efforts continued during 2014, when for example, training was provided for current and potential future leaders below executive level consistent with the Group’s policy of encouraging winning behaviours and as part of career development. The training, which is expected to continue during 2015, included subjects such as change management, delegation and employee empowerment. These sessions have been facilitated, where appropriate, by external specialists.
Senior management below board level attend and present to the Board on specific business items within their areas of responsibility, including as part of discussions on strategy, when considering the annual plan each year or where specific projects are being undertaken which are significant to the Group. For example, during the year, senior management presented to the Board on the implementation of an initiative intended to further enhance the oversight of key development projects and associated financial metrics. The Board considers that such engagement provides valuable insight on the business as well as supporting better understanding of the capabilities of senior personnel.
During 2014, a meeting of the Nomination Committee considered succession planning for senior roles within the organisation during which the strength of internal resources were reviewed. The Committee also considered how these resources might be further enhanced through mentoring and development. The review also assessed where it might be appropriate to consider appointments from outside the Group to senior roles within the business and how this might be planned, by introducing potential candidates into roles from which it might be possible for them to advance into more senior positions.
Ethics policy
All employees of the Group, including the directors and senior officers, are expected to comply with the Group’s Ethics Policy, which was first adopted in 2009 following registration of our ordinary shares with the SEC. In addition, the Group has adopted an Executive Ethics Policy that applies to Board members, senior officers and other specified employees and is intended to meet the ‘code of ethics’ requirements of Section 406 of the Sarbanes-Oxley Act. A copy of the Executive Ethics Policy may be found at www. csr.com/ethicspolicy. Information on the Company’s website is not incorporated by reference into the Annual Report filed with the SEC on the Form 20-F.
The following statements describe how the Board operates and the respective roles of the Chairman, non-executive and executive directors.
The Board
As at 26 December 2014, the Board comprised nine members, being the Chairman, Mr. Ron Mackintosh, three executive directors and five non-executive directors. Of those in post as at 26 December 2014, all nine directors including Mr. Mackintosh had served throughout the year.
| | | | | | | | | | |
| | | Role | | | | In post
28 Dec 2013 | | In post
26 Dec 2014 | | |
| | |
| | | | | |
Served during 2014 | | | | | | | | | | |
Non-Executive Directors | | | | | | | | | | |
| | | | | |
R W Mackintosh | | Chairman | | | | Yes | | Yes | | |
W G Boyd1 | | Senior Independent Director and Chairman of the Audit Committee | | | | Yes | | Yes | | |
L Gerzberg | | Non-Executive Director | | | | Yes | | Yes | | |
C M R Stone | | Chairman of Remuneration Committee | | | | Yes | | Yes | | |
T M Vega | | Non-Executive Director | | | | Yes | | Yes | | |
| | |
| | | | | |
Left after 2014 | | | | | | | | | | |
| | | | | |
A E C G Carlisle² | | Senior Independent Director | | | | Yes | | Yes | | |
| | |
| | | | | |
| | | | | | 6 | | 6 | | |
| | | | | | |
Served in 2014 | | | | | | | | | | |
Executive Directors | | | | | | | | | | |
| | | | | |
J A J van Beurden | | Chief Executive Officer | | | | Yes | | Yes | | |
D D W Gardiner | | Chief Financial Officer | | | | Yes | | Yes | | |
C A Ladas | | Operations Director | | | | Yes | | Yes | | |
| | |
| | | | | |
| | | | | | 3 | | 3 | | |
| | | | | | |
| | | | | |
| | | | | | | | | | |
| | | | | | | | | | |
| | | | | | |
| | | | | |
Total | | | | | | 9 | | 9 | | |
| | |
1 Appointed Chairman of the Audit Committee on 1 January 2014. Appointed as Senior Independent Director on 1 January 2015.
2 Stood down as a non-executive director and as Senior Independent Director on 31 December 2014 following completion of nine years as director.
Corporate Governancecontinued
Mr. Ron Mackintosh has served as Chairman of the Board since May 2007 and as a non-executive director of the Company since May 2004. In the opinion of the Board, on each of his appointments as a non-executive director and as Chairman, Mr. Mackintosh was independent of management. The Board is satisfied that Mr. Mackintosh is able to devote the necessary time commitment to the role of Chairman of the Board.
Mr. Anthony Carlisle was throughout the year the Senior Independent Director, a post he had held since May 2009. As previously announced, Mr. Carlisle stood down from the Board with effect from 31 December 2014 on completion of a period of nine years as a non-executive director. Mr. Walker Boyd assumed the role of Senior Independent Director on 1 January 2015. Mr. Walker Boyd, a Chartered Accountant, served throughout the year as Chairman of the Audit Committee, having held that post since 1 January 2014. Mr. Boyd is considered independent of management and possesses recent and relevant financial experience. Mr. Will Gardiner is the director responsible for health and safety. Mr. Brett Gladden served as Company Secretary throughout the year.
The Board each year considers the independence of the non-executive directors. The Board recognises that Dr. Levy Gerzberg does not satisfy the requirements under the Code as an independent non-executive director, based on his previous executive role within Zoran, of which he was a co-founder and, at the time of its acquisition by CSR, was a director on the company’s board and held the offices of President and Chief Executive Officer. Since the acquisition of Zoran, the CSR Group has undergone significant change. This has included the disposal of the handset business in 2012 and of certain Imaging intellectual property (‘IP’) and associated personnel in 2014. The latter formed part of the business which had been acquired with Zoran and its disposal was due to the evolution of the Group’s strategy. The Board has taken due account of the fact that, in the performance of his duties, Dr. Gerzberg acts in a manner which is independent of management and the Company. The Board also considers that Dr. Gerzberg’s experience and considerable knowledge of the semiconductor industry and those markets in which the Group operates has and will continue to contribute significantly to the understanding of the Board. All other non-executive directors were independent of management and the Company at the time of their appointment. The Board remains satisfied that an appropriate balance of skills and experience has been in place to enable the Board to perform its responsibilities effectively. An overview of the balance of skills and experience on the Board is given below.
Information on the holdings of directors in the Company’s ordinary shares and American Depositary Shares can be found on page 80 of the Director’s Report – Other Statutory Information. Information on the appointment of directors is on page 58, and on directors’ powers and procedures for amendments to the Company’s articles can be found on page 142 of the Directors’ Report – Corporate and Share Information.
Board balance and diversity
Innovation and creativity are critical to the success of the Group and stem directly from the diverse range of skills and capabilities of our people. This is true at all levels of the Group, including at Board level. The Board supports diversity across the organisation as a whole in meeting the Group’s strategy. CSR is present in ten countries across Europe, North America and Asia, reflecting the Group’s evolution through a combination of organic growth and acquisitions.
The Board believes that it has an appropriate balance of diverse skills and experience which enables it to perform effectively, helping the Group to meet its business objectives. The Board includes executive and non-executive directors with extensive knowledge of the background and development of the Group. The Board also
believes that the directors have in-depth understanding and skills in industries relevant to those in which the Group operates. Their experience encompasses the cycle of product research, development, sales and marketing, customer knowledge, and wider corporate development, including financial management and experience in mergers and acquisitions. The Board believes that it is important to consider board diversity within the context of ensuring those appointed to it are able to contribute effectively, using their relevant skills and knowledge.
The Board acknowledges continuing wider engagement in promoting broader diversity on the boards of companies that reflect the gender, ethnicity and cultural backgrounds that make up our society. The Board is supportive of such matters and is satisfied that in its consideration of the composition of the Board and in executive management, the Company reflects this principle. Within the Group as a whole, women comprise 17% of our total employees (or 366 out of a total of 2,108). Within the executive management team that reports to the CEO, (and which reflects those with direct responsibility for planning, directing and controlling the activities of the Group), women comprise 14% (or 1 out of 7 personnel) and at board level 13% (or 1 of 8). In the appointment of personnel to roles in the Company, including those at board level, the Company demonstrates a commitment to promulgate diversity where this is also consistent with ensuring those appointed possess the necessary talent and experience to support the Company and Board in its activities.
Reflecting the global market within which the Group operates, the Board comprises directors from four different nationalities with experience of managing businesses in each of the continents in which the Group is present. A detailed biography for each member of the Board in office at the date of this report is given on pages 52 and 53.
The conduct of the business of the Board
The Board and its Committees meet regularly during the year as well as on an ad hoc basis as required by time critical business needs.
The Board is responsible for the overall conduct of the Group’s business and is accountable to shareholders for the effective and proper management and control of the Company and Group and has a formal schedule of matters reserved for its decisions. These include the review and approval of the CSR Group’s:
| — | | strategy and long-term plans; |
| — | | annual budget and plan; |
| — | | acquisitions and disposals and requests for major capital expenditure; |
| — | | financial structure, including tax and treasury; and |
| — | | annual and quarterly financial results and other significant financial matters. |
The process of review and approval of the foregoing matters is undertaken following discussions, in conjunction with senior executive management, who in turn are responsible for the conduct of the Group’s operations and for reporting to the Board on the progress being made in meeting the Group’s objectives. The schedule of matters reserved for the Board was reviewed in December 2014, and no changes were made.
The Chairman’s role is to ensure that the Board functions effectively, overseeing the timely and effective provision of information to the Board and that the business of the Board is properly conducted. Briefing papers and a meeting agenda are provided to each director in advance of each meeting. Decisions are taken by the Board, taking into account, where appropriate, the recommendations of its Committees and advice from external consultants and executive management.
| | |
| 56 | | CSR plc Annual Report and Financial Statements 2014 |
The Board regularly reviews strategy as part of its normal business. This includes holding at least one off-site meeting during each year, the agenda for which covers a broad range of financial, commercial and technical aspects concerning the strategic objectives for the Group. In 2014, the off-site meeting was held in the summer, with members of the management team attending and participating in presentations and discussions. As part of the process for reviewing strategy both within its normal business and the off-site review, the Board considers the prevailing and potential challenges associated with the execution of the objectives. The Board also considers the risks to the Group in delivering the strategy, assessing management’s mitigation of identified risks and also to what extent risks should be accepted in the execution of the Group’s objectives. More information on how the Board considers risk and monitors proposed mitigation is set out on pages 64 to 65.
The Board has overall responsibility for the preparation and approval of the annual report and financial statements. During the process for the preparation of the annual report and financial statements for 2014, each member of the Board was provided with working drafts of the constituent parts of the report, for review and comment. The Board also received reports from the Audit Committee and the Company Secretary on the work performed in connection with the drafting, review and verification of the annual report and financial statements during the meeting at which the Board formally approved them. In the course of its review, the Board also gives specific consideration as to whether the annual report and financial statements, when taken as a whole, are fair, balanced and understandable.
The non-executive directors of the Board have diverse business, financial and technical experience, details of which are summarised on pages 52 to 53. Each non-executive director plays a full role in contributing to the determination of agenda items and the consideration of matters brought before the Board. This includes:
| — | | considering, approving, scrutinising and monitoring performance against strategic objectives through detailed reviews conducted at Board level; |
| — | | providing entrepreneurial leadership within a framework of prudent and effective controls, which were created to enable risks to be assessed and managed; and |
| — | | setting the Group’s values and standards and ensuring that its obligations to shareholders and other stakeholders are understood and met. |
Non-executive directors are expected to constructively challenge and contribute to the development of the Group’s strategy, scrutinise the performance of management in meeting agreed goals and objectives and monitor the reporting on performance by management.
Non-executive directors from time to time attend meetings with management outside the normal cycle of formal meetings, either to receive updates in areas of specific interest or to discuss the planning and execution of tasks connected with specific matters.
As part of their routine business the directors receive information in the form of papers and presentations pertinent to supporting them in the development of their existing skills and capabilities necessary for the performance of their duties and reflecting the business and obligations of the Group. During 2014, the Board received information on the Group’s response to a government backed programme to promote wider awareness on cyber related risks, which included details on initiatives being undertaken within the Group. The Board also received a report on the provisions of the Code and the extent to which the Company was in compliance, which included identification of changes to the Code during the next financial year requiring attention within the next reporting cycle. The Board also received a paper prepared in conjunction with the Company’s US counsel reviewing the continuing disclosure and reporting obligations of foreign private issuers and recent developments including those areas of focus of the SEC.
Independence of non-executive directors and segregation of duties
In accordance with the provisions of the Code, consideration has been given to the independence of all the non-executive directors. The Board considers all the non-executive directors to be independent of management and free from any business or other relationship that could materially interfere with the exercise of independent judgment. As discussed above, the Board considers that Dr. Gerzberg, formerly Chief Executive Officer and co-founder of Zoran Corporation, acts in a manner which is independent of management and the Company.
The division of responsibilities between the non-executive Chairman and Mr. van Beurden, Chief Executive Officer (‘CEO’), is sufficiently clear and established in the opinion of the Board that it is not required that it be formally documented. The Chairman is responsible for the running and leadership of the Board. The CEO is responsible for leading and managing the business within the authorities delegated by the Board and to promote the interests of the Company and the Group as a whole.
| | |
Division of responsibilities |
Chairman | | CEO |
— Run the Board and set its agenda, taking into account concerns of all Board members. | | — Devote substantially the whole of his time and his attention and skill to the duties of his office. |
— Ensure that the Board members receive accurate, timely and clear information to enable the Board to carry out its duties effectively. | | — Develop strategy proposals for recommendation to the Board and ensure that agreed strategies and associated plans are reflected in the business. |
— Enable constructive debate and effective decision making, ensuring sufficient time is allowed for discussion of complex or contentious issues. | | — Be responsible to the Board for the performance of the business consistent with the agreed strategy, plans and policies. |
— Ensure that Board decisions are effectively implemented. | | — At all times keep the Board and the Chairman promptly and fully informed of his conduct of the business and affairs of the Company and of the Group as a whole and provide such explanations as the Board or the Chairman may require in connection therewith. |
— Promote the highest standards of corporate governance and business ethics throughout the Group. | |
— Ensure effective communication with shareholders. | | — Faithfully and diligently perform such duties and exercise such powers, consistent with the office to which he is appointed, as is from time to time assigned or vested in him by the Board. |
Corporate Governancecontinued
The CEO has day-to-day responsibility for the Group. The executive management, who are responsible for the performance of discrete commercial and operational activities of the Group, report to the CEO. The executive management have responsibility within their area of expertise for the implementation of objectives and assessing performance of particular functions against those objectives. Representatives from their respective teams attend and report to an executive leadership forum, which includes each of the executive directors and members of the executive management. The CEO also meets regularly with the managers and leaders in various established forums that fit with the operational cycles of the Group.
The CEO reports at each meeting of the Board on salient matters arising from the execution of his responsibilities.
The Board receives reports within its normal business on the activities across the Group, including strategic, financial, commercial, human resources and risk management. Periodically, members of the executive management that report into the CEO attend meetings of the Board and report on areas of their responsibility. At these meetings, the Board will receive status reports on progress against specific targets, for example in performance against project milestones, or assessments of the launch of new products. This will include considering any potential risks associated with these activities and possible mitigation measures.
As a global business, the Board considers it important to receive information on the business of the offices across the world. Accordingly, reports are provided by the executive management on the results of their visits to the Group’s offices, as well as meetings with customers and suppliers.
In addition to eight scheduled Board meetings, there were, during the course of 2014, a number of other meetings to deal with specific matters. The attendance of each of the directors at the Board and Committee meetings is shown on page 67.
Meetings of duly appointed committees to the Board met a further 6 times, enacting elements of business specifically delegated, and which were attended by at least one non-executive director and two executive directors.
Evaluation of the performance of the Board
Since 2006, the Board has undertaken an annual evaluation of the performance of the Board and its Committees on which it has reported. The most recent evaluation supported by an external agent, was conducted in the autumn of 2011.
As part of the 2013 internal review process, the Board recognised the importance of identifying and tracking key risks which had the potential to impact the fulfilment of the Group’s strategy, including the ability of the Group to compete effectively in emerging markets. During 2014, these matters were considered by the executive management as part of the Quarterly Business Reviews and the findings reported to the Board by the CEO. This incorporated enhancements which were made during the year to the way in which the business tracked metrics for monitoring progress in the execution of projects which were discussed at meetings of the Board.
The Code requires that performance evaluations are externally facilitated at least every three years. The Board considered this requirement at its meeting in November and agreed that, under the prevailing circumstances and taking into account the Qualcomm Transaction which, subject to fulfilling certain closing conditions, is expected to complete by late summer 2015, the 2014 evaluation would not be externally facilitated and instead members of the Board would speak directly with the Chairman on an informal basis, and in the event of material matters arising, these would be considered by the Board at a subsequent meeting. Through this direct engagement led by the Chairman, no material issues were identified that required formal consideration by the Board.
Policy on appointment and re-appointment
In accordance with the provisions of the Code, all directors serving on the Board stand for re-election annually. The terms of appointment of directors are available for inspection at the Company’s registered office and are made available for the period up to fifteen minutes prior to holding the Annual General Meeting.
Further information on each of the directors standing for re-election is set forth in the Notice of the Annual General Meeting, which is a separate document issued to all shareholders, and available on the Companys website.
On appointment, all directors are asked to confirm they have sufficient time to devote to their duties which are confirmed in their letter of appointment. They are also advised that they have access to the advice and services of the Company Secretary and, in addition, that they are entitled to seek independent professional advice in the furtherance of their duties, if necessary, at the Company’s expense. As part of their induction, the directors are provided with information explaining their role and responsibilities, background information on the Company and Group, as well as the recent deliberations of the Board and its Committees by way of papers and reports, for example those from the auditors in respect of the most recent full financial year. Directors are also provided with information and assistance in the event of any change in their role.
Indemnities to directors
In accordance with the Company’s Articles of Association, directors are granted an indemnity from the Company to the extent permitted by law in respect of liabilities incurred as a result of the performance of their duties in their capacity as directors of the Company.
The indemnity would not provide any coverage to the extent that a director is proven to have acted fraudulently or dishonestly. The Company has also arranged insurance coverage in respect of legal action against the directors and officers.
Communications with shareholders
The Board makes considerable efforts to maintain good relationships with shareholders. Principally via the executive directors, the Company seeks to build on a mutual understanding of objectives with its major shareholders. The Board believes engagement with all shareholders, including smaller investors, is important and welcomes the attendance of shareholders at the Company’s Annual General Meeting, which in 2015 will be held in London.
The Senior Independent Director, Mr. Walker Boyd, is available to meet institutional shareholders should there be unresolved matters they wish to bring to his attention. The Board is also apprised of discussions with major shareholders to ensure that executive and non-executive directors consider any matters which might be raised by those shareholders and to enable all directors to understand shareholders’ views. This includes feedback from the meetings attended by executive directors and the Chairman, in addition to reports from the Company’s advisers on their engagement with shareholders on behalf of the Company.
Non-executive directors attend the Annual General Meetings and will also make themselves available to meet with shareholders on other occasions where requested. Corporate information is available on the Company’s website, www.csr.com. Information on the website is not incorporated by reference into the Annual Report filed with the SEC on Form 20-F.
Committees of the Board
The Board has three Committees, Remuneration, Audit and Nomination. Throughout the year, each of Mr. Boyd and Mr. Carlisle were members of the Remuneration, Audit and Nomination Committees. Mr. Boyd was appointed the Chairman of the Audit Committee on 1 January 2014. Ms. Vega was a member of the
| | |
| 58 | | CSR plc Annual Report and Financial Statements 2014 |
| | | | |
Audit Committee throughout the year. Mr. Stone served throughout the year as Chairman of the Remuneration Committee. On 1 January 2015, Mr. Stone became a member of the Audit Committee following Mr. Carlisle standing down as a non-executive director with effect from 31 December 2014. Mr. Mackintosh chairs the Nomination Committee, is a member of the Remuneration Committee and attends meetings of the Audit Committee by invitation. In accordance with the Code, the duties of the Committees are set out in formal terms of reference. These are available from the Company Secretary and can be found on the Company’s website, www.csr.com. Membership of the Committees is shown on pages 52 and 53. Information on the Company’s website is not incorporated by reference into the Annual Report filed with the SEC on Form 20-F. The Company Secretary acts as secretary to each of the Committees. Each Committee undertakes an annual review of its terms of reference and makes recommendations to the Board for changes where appropriate. The Board considers that the terms of reference of these Committees are generally responsive to the relevant NASDAQ rules but may not address all aspects of these rules, (see ‘US Listing Requirements’ on pages 66 to 67). Remuneration Committee Mr. Chris Stone is the Chairman of the Remuneration Committee, a position he has held since May 2013. The other members of the Committee at 26 December 2014 were Messrs. Boyd, Carlisle and Mackintosh. Mr Carlisle ceased to be a member of the Committee on his standing down as a non-executive director on 31 December 2014. The principal function of the Remuneration Committee is to establish and review the terms and conditions for the executive directors, the form and balance of their remuneration, with due regard for an appropriate balance of elements which include those over the long term, incorporating suitably stretching performance targets, and the overall policy framework for the remuneration of the executive directors, other senior executives and the Group as a whole. The Remuneration Policy published within the annual report for the 52 week financial period ended 27 December 2013 was formally adopted by shareholders at the Annual General Meeting held on 21 May 2014. The Remuneration Committee met 3 times during the year and the attendance of its members is shown in the table on page 67. The report to shareholders on the role of the Remuneration Committee and how directors are remunerated, together with details of individual directors’ remuneration are set out on pages 68 to 77. Nomination Committee Mr. Ron Mackintosh is the Chairman of the Nomination Committee, a position he has held since May 2007. The other members of the Nomination Committee at 26 December 2014 were Messrs. Boyd and Carlisle. The qualifications of the directors can be found in the biographies of board members on pages 52 and 53. Mr. Carlisle ceased to be a member of the Committee on his standing down as a non-executive director on 31 December 2014. The role of the Nomination Committee is to consider appointments to the Board and succession planning at senior levels within the Company. The Nomination Committee reviews the composition of the Board, particularly in relation to the diversity of skills, experience and terms of office and seeks to ensure that both executive and non-executive directors have the necessary skills and attributes for the future success of the Group. | | | | The Nomination Committee retains external search consultants as appropriate to assist the Committee in identifying candidates for appointments to the Board. During 2014, the Nomination Committee met on one occasion to consider wider succession planning within the organisation. Audit Committee Mr. Walker Boyd is the Chairman of the Audit Committee, a position he has held since 1 January 2014. The Board is satisfied that Mr. Boyd, a Chartered Accountant, possesses ‘recent and relevant financial experience’ for the purposes of the Code and is an ‘audit committee financial expert’ for the purposes of US securities laws. The Board has further determined that for the purposes of US securities laws, Mr. Boyd is independent in accordance with the definition of independence in Rule 5605(a)(2) of the listing rules of the NASDAQ. The other members of the Audit Committee through to 26 December 2014 were Mr. Carlisle and Ms. Vega. Mr. Mackintosh, Chairman of the Board, attends meetings of the Audit Committee by invitation. Mr. Carlisle stood down from the Committee coinciding with the timing of his standing down as a non-executive director on 31 December 2014. Mr. Stone, a non-executive director, was appointed to the Audit Committee in his place with effect from 1 January 2015. The experience and expertise of the members of the Audit Committee are summarised on pages 52 and 53. The attendance of each of the Committee members at the meetings held during 2014 is shown in the table on page 67. Each member of the Committee is financially literate, having the necessary ability and experience to understand financial statements. The Audit Committee encourages continuous improvement and supports management in identifying targets and objectives that contribute to this aim. Areas in which the Committee worked with management in this regard are considered in more detail below. Introduction from the Chairman of the Audit Committee Your Audit Committee is integral to the scrutiny which is given by the Board to the performance of management and the standing of the Group as a whole. The Committee regularly assesses the Group’s financial integrity while also ensuring that management establishes and maintains systems of controls, including those concerned with financial reporting and risk management, that are balanced and appropriate, and which evolve in a measured manner to reflect changes in the Group across its various operations. Through quarterly meetings which were held during 2014, the Committee has applied these principles to a range of topics that are part of an established schedule of business, as well as to specific matters as they might arise. At each of its meetings during 2014, the Committee considered the financial standing of the business with due regard to both the annual plan approved by the Board at the end of 2013 and overall wider expectations of the financial results. As part of this review, the Committee assessed achievement against key metrics for overall performance of the business (such as underlying gross margin). On a quarterly basis, the Committee receives reports from the Chief Financial Officer which include a profile of costs incurred, performance against budgeted figures and areas identified for attention, for example, variation of costs from budget in areas such as underlying R&D expenditure. |
Corporate Governancecontinued
In December 2013, CSR announced its decision to discontinue development of the Camera-on-a-chip (‘COACH’) platform. In the period leading up to and following this announcement, the Committee received reports on the appropriate accounting judgments and determinations associated with this decision, with due regard for the Group’s accounting policies and relevant accounting practices. In the summer of 2014, in considering and making the decision to sell certain Imaging IP assets associated with the Company’s Cameras business, together with the team devoted to their development, the Committee also received reports on the valuation of the business being sold and on the accounting treatment and reporting of the disposal.
The Committee also reviews how the Group seeks to ensure continuing compliance with non-accounting regulations and standards, for example the requirements of the Sarbanes-Oxley Act in the context of internal control over financial reporting. The Committee receives regular reports on how the Group manages both the development and implementation of controls. This includes the results of reviews conducted by the Internal Auditor, and the tracking of management’s response to any recommendations for improvement made by the Internal Auditor.
During 2014, the Committee considered proposed changes in the oversight of certain internal controls. The changes were considered appropriate with due regard for the evolution of the Group since the initial implementation of relevant controls intended to meet the requirements of the Sarbanes-Oxley Act. This included a detailed review of the internal controls over financial reporting and the control consequences of adopting the Committee of Sponsoring Organisations of the Treadway Commission (‘COSO’) as a methodology for reviewing the Group’s System of Internal Controls. The project was led by the Deputy Chief Financial Officer with oversight provided by the Internal Auditor and support from external advisers.
The Committee received reports throughout the project. These reports included feedback from the Internal Auditor and Deloitte at key milestones in the project. The reports covered the scope, efficacy and implementation of proposed changes.
An important aspect of the Group’s overall assurance framework is the work performed by the internal audit function. On page 61, we explain how the Committee determines the key areas of focus and receives quarterly reports from the Internal Auditor, as part of monitoring the activities and standards applied in effective management of the business.
The Board and management are aware of the increased incidence of reported cyber-attacks such as phishing and hacking which have affected a large number of organisations and of the continued challenges faced in safeguarding data and systems against breach, misappropriation and corruption. It is recognised that such incidences have the potential to cause significant disruption and damage to companies including CSR. For a description of the potential risks as assessed by the Company, please see pages 43 to 51. During 2014, the Committee continued to receive regular reports on how the Group has responded to such threats through the implementation of changes and enhancements to the Group IS infrastructure and cyber related security. This has included support from external advisers in benchmarking the measures being taken by the Group against wider practices by companies and other institutions. As well as changes to infrastructure, steps have been taken to provide training programmes to increase awareness amongst employees of the important part they have in supporting effective management of the Group’s data and systems. In addition, during 2014, the Group completed the search for a senior manager to provide specific experience in management of cyber threats and security which has enhanced the existing capabilities within the IS team.
On 28 August 2014, the Company announced that it had received an approach from Microchip Technology Incorporated with a proposal for a possible takeover, which had been rejected by the Board. On 15 October 2014, the boards of CSR plc and Qualcomm Incorporated (‘Qualcomm’) announced that an agreement had been reached regarding the terms of a recommended cash offer for the Company, as described on page 134. On 12 November 2014, the Company published the document setting out the terms of the scheme of arrangement to be used to implement the Qualcomm Transaction (the ‘Scheme Document’) which provided additional information on the proposed transaction and sought approval from shareholders for the transaction to proceed. The Scheme Document included a report from the Board confirming the validity, at the date of the Scheme Document, of certain statements made previously by the Company. Collectively, these statements constituted a profit forecast under the Takeover Code. The Audit Committee provided oversight and considered work undertaken by management and Deloitte which enabled the Board to affirm the statements, the findings from which were discussed at a meeting of the Board held to consider and approve the Scheme Document for publication.
In support of the work performed by management and the Board in considering the annual report and financial statements, the Committee has also reviewed the various sections that comprise the report and the financial statements in order to assess and then advise the Board on fulfilling the requirement that they be fair, balanced and understandable.
As part of its terms of reference, the Committee receives reports on the identification, mitigation and management of risk within the Group. On pages 64 and 65 of this report, as well as in the sections in the Strategic Report on pages 32 to 35 and the Risk section on pages 43 to 51, we explain in more detail how risk management is conducted for CSR.
Deloitte have acted as auditors to the Group since July 2002. The present Audit Partner is Mrs. Kate Houldsworth. Mrs. Houldsworth has held the post of audit partner for CSR since October 2013. We discuss our approach to the review of the effectiveness of the external auditors on pages 62 and 63.
Walker Boyd
Chairman, Audit Committee
| | |
| 60 | | CSR plc Annual Report and Financial Statements 2014 |
Role of the Audit Committee
The Audit Committee assists the Board in carrying out its responsibilities in relation to financial reporting requirements, risk management and the assessment of internal controls. In conjunction with these activities, the Committee is responsible for the development, implementation and monitoring of the Company’s policy on external audit and for overseeing the objectivity and effectiveness of the external auditors. The Audit Committee monitors the conduct of the audits of the consolidated reports and financial statements of the Group and its subsidiaries. This includes consideration of the areas of focus of the audits in conjunction with the external auditors and assessment of their findings and recommendations, where relevant. The Audit Committee also reviews and considers representation letters which are provided to the independent auditors, where they are required for the independent auditors to release their final reports.
The Audit Committee recommends the appointment and re-appointment of the Group’s external auditors, having considered the effectiveness of the external audit process through meetings led by the Chairman of the Audit Committee. The Audit Committee also considers the audit approach including the planning, scope and risk identification, the audit execution, communication and formal reporting by the audit partner and her team, the independence and objectivity of the auditor and their fees.
The Audit Committee monitors the effectiveness of the Group’s internal control systems, accounting policies and practices, risk management procedures and compliance controls, and also reviews the statement on internal controls before it is agreed by the Board for each year’s annual report.
A detailed agenda of matters for discussion at the meeting, together with supporting papers, is provided in advance of each meeting of the Audit Committee. The agenda incorporates a range of standard business items considered at each meeting. Routine business items include reports from the Chief Financial Officer and Internal Auditor as well as a draft form of the announcement on the Group’s financial results for each quarter. In addition, the Audit Committee addresses a number of other items as part of its schedule of business through the course of a year, such as risk management, business continuity planning, treasury policy and procedures, tax planning and the Group’s policy manual as well as such ad hoc matters as are deemed appropriate. The schedule of agenda items for the calendar year was last reviewed and approved by the Audit Committee in July 2014 and was considered to remain appropriate for the remainder of 2014 and into 2015.
The Audit Committee invites the Chief Executive Officer, the Chief Financial Officer, the Deputy Chief Financial Officer, the Internal Auditor and senior representatives of the external auditors to attend meetings as appropriate to the business being considered. In addition, the Audit Committee has the right to invite any other employees to attend meetings where this is considered to be appropriate. During 2014, this included representatives from the Group’s IS function to report on the implementation of changes within the department and progress in addressing matters such as cyber security.
The conduct of the business of the Audit Committee
The Audit Committee met four times in 2014 in the execution of its responsibilities. The more material matters considered and any proposals for action were reported by the Chairman of the Audit Committee to the subsequent meeting of the full Board.
The Audit Committee reviews all proposed announcements to be made by the Group to the extent they contain financial information. During 2014, this included certain information concerning the trading performance of the Group which was provided in the Scheme Document in relation to the Qualcomm Transaction issued to shareholders on 12 November 2014.
In the preparation of financial statements, the Audit Committee considers the level of disclosure and the extent to which these comply with prevailing accounting standards, as well as good practice.
At the meeting which considers the annual report and financial statements, the Audit Committee receives a report from the Company Secretary as chairman of the Disclosure Committee on the work which the Disclosure Committee has undertaken to review and comment on the constituent parts that comprise the annual report and financial statements.
From time to time, the Audit Committee has instigated reviews of the approach taken by management on specific items with due regard to prevailing interpretation and practice. For example, during 2014, the Committee considered revenue recognition and the Group’s practice and those of peers within the industry, taking into account the Group’s business model and the prevailing level of orders placed through third party distributors as indirect suppliers to customers of the Group’s products. During the year, the Audit Committee also reviewed policies on the definition of underlying and non-underlying items.
Each quarter, as part of its routine business, the Audit Committee receives a detailed report from the Chief Financial Officer on the performance of the Group. In addition to a summary of the balance sheet and income statement, the report incorporates detailed analysis on a range of key metrics which track the performance of the Group and its operating segments. This information forms part of the discussions of the Audit Committee to ensure that material matters are properly considered and discussed with management and, where appropriate, with the external auditors. The information and the discussions support the understanding of the Audit Committee and the Board on the nature of disclosures which should be made in the Group’s financial results. Reflecting both the evolution of the Group and wider developments in best practice, the Audit Committee has considered areas for possible enhancement in internal reporting, which serve to aid understanding in business performance and in the management of significant risks, for example in relation to the introduction of new products and technologies.
The Audit Committee monitors the effectiveness of the internal audit function, considering and approving the scope of the annual internal audit plan, and thereafter reviewing reports on the results of internal audit work which has been conducted during the year. In setting the internal audit plan, the Committee considers the findings and status of implementing improvement measures arising from previous audits, including those from external auditors, the development of the business of the Group, the geographic locations in which the Group has its operations and considerations arising from the Risk Management processes, with due regard also to evolving laws and regulations which deal with compliance and good practice. The Internal Audit Plan and visit schedule is designed to include controls over the Group’s main risks including financial, operational and compliance risks, using a combination of internal and external resources. The Internal Auditor periodically considers the overall philosophy and approach to the planning and conduct of audits, taking into account best practice. This was most recently completed in the autumn of 2014 in setting the proposed plan for 2015, which was considered by the Committee at its meeting held in November 2014. The Audit Committee receives reports from the Internal Auditor on a quarterly basis setting out the findings from the reviews performed, in addition to the progress made in addressing any outstanding recommendations arising from earlier audits which have been conducted. The plan provides for a rolling schedule of visits to all offices within the Group, as well as the review of various functions and activities, both financial and non-financial.
Corporate Governancecontinued
Since the Company became subject to the reporting requirements of the US Securities Exchange Act of 1934 (the ‘Exchange Act’), the Audit Committee has received reports from management regarding the Company’s compliance with requirements under the Exchange Act (including those rules and regulations that apply under the Sarbanes-Oxley Act) that relate to financial reporting and other disclosure matters. These requirements relate, among other things, to disclosure controls and procedures and internal control over financial reporting (which applied from the end of the 2011 financial year). The Internal Auditor reports on various aspects of ensuring compliance with the Sarbanes-Oxley Act each quarter based on the approved internal audit plan.
As part of the adoption of the internal audit plan, the Audit Committee also considers and approves the utilisation of external resources to assist in timely execution and reporting, where required.
At 26 December 2014, the Group had cash resources of $283.2 million, a decrease from $306.2 million held at the end of the prior year. The net outflow arises from the day-to-day operations of the Group and the return of capital to shareholders resulting from share buybacks and the payments of dividends during the year. These are discussed in the Strategic Report on pages 25 and 26. The Audit Committee monitors the Group’s Treasury function on a regular basis, including where appropriate periodic external audits of the Treasury function’s policies, procedures and working practices. The Group’s Treasury Policy was most recently reviewed in November 2014 and the findings reported for consideration by the Audit Committee at its meeting held in November 2014. The review included amendments to the segregation of duties reflecting the recommendations of the internal audit review and supported by the Director of Tax and Treasury. The Treasury Policy was approved by the Audit Committee and subsequently adopted by the Board.
As appropriate, the Audit Committee and Board are kept appraised of litigation affecting the Group, any material developments and the assessment of the potential to affect the financial position of the Group. This review is also supported as appropriate by a sub-committee of the Board led by the Chairman of the Board, the purpose of which is to consider matters connected with material litigation. Both the Audit Committee and the litigation sub-committee have access to the advice and support of the Group’s executive management and outside counsel where considered appropriate. The results of these meetings are reported to the Board as appropriate.
The Committee continues to receive reports each quarter on progress in raising awareness within the organisation across functions and territories on appropriate processes and engagements with third parties in response to the UK Bribery Act. During 2013, external advisers supported additional targeted face-to-face training to augment the online training and to review prevailing policies with regard to the changes in the Group and developing practices and interpretation of how best to respond to the principles of the UK Bribery Act. The findings from that review continued to inform the Group’s approach to addressing these matters in 2014.
Within its terms of reference, the Audit Committee periodically considers the scope of services provided by external advisers within specific areas of the Group’s activities. During 2014, the Audit Committee received a report on the review of the Group’s insurance programme and the assessment performed by management on alternative service providers, which culminated in the appointment of Marsh Ltd as broker. The report also included recommendations for changes to the insurance policies for the Group’s global insurance programme.
Interaction with the external Auditors
During 2014, as part of its formal business, the Audit Committee met on four occasions with the external auditors. On two occasions
the Audit Committee also held separate meetings with the external auditors at which no executive director or employee of the Company was present.
In relation to the appointment of external auditors and in order to safeguard auditor independence and objectivity, the Audit Committee has a policy of permitted services which details the services that can be provided by the Group’s auditors and those services which require specific advance approval by the Audit Committee. The policy also details services that the Group’s auditors are not permitted to provide. The objective is that the auditors should not be employed to provide services where either the nature of the work or extent of the services and fee payable might impair the auditors’ independence or objectivity.
The external auditors are permitted to undertake some non-audit services, providing this has been awarded after due consideration of their skills, competence and integrity to carry out the work in the best interests of the Group, on for example, advisory services and due diligence activities associated with potential acquisitions. For permitted services, the Audit Committee has delegated the determination of fees to the Chief Financial Officer, provided the fee does not exceed $100,000. No services can be provided in excess of $100,000 without the prior approval of the Audit Committee. The policy, which was reviewed in October 2013, was complied with throughout the year. The Audit Committee is aware of and has approved the audit and non-audit services which have been provided during 2014 by the Company’s external auditors, Deloitte LLP (‘Deloitte’). Those non-audit services concerned advice on a range of matters which were considered to be appropriate, given their in-depth knowledge of the affairs and financial practices in the Group and work associated with the review of the Group’s response to potential cyber related risks.
| | | | | | |
| | | 2014 $’000 | | 2013 $’000 | | 2012 $’000 |
Audit fees | | 892 | | 851 | | 883 |
Audit-related services | | 110 | | 105 | | 110 |
Taxation services | | 167 | | 261 | | 672 |
Other services | | 563 | | 34 | | 350 |
Total | | 1,732 | | 1,251 | | 2,015 |
The Audit Committee is satisfied that Deloitte has retained objectivity and independence during the year.
The table above shows the fees paid by the Company to the external auditors as approved by the Audit Committee.
Approval for permitted non-audit services is sought as required under the Committee’s policy. During 2014, total non-audit related fees were $840,000 (2013: $400,000). The most significant element stated above in ‘Other Services’ for the work in 2014 related to the review associated with updating the profit forecast statements which formed part of the Scheme Document that was sent to shareholders in November 2014 in connection with the Qualcomm Transaction where the appointment of Deloitte was approved by the Audit Committee (for 2013, the most significant element related to IT security consulting). The Audit Committee considered that performance of the relevant non-audit services by Deloitte was the most cost-effective way of conducting the requisite work and therefore in the best interest of the Group having due regard to the competence and knowledge possessed by Deloitte. The Committee was also satisfied that no conflicts of interest existed or would arise in the conduct of the work on behalf of the Group. During the year a total of $2.1 million (2013: $2.91 million) was paid to other accounting firms for non-audit work, including $0.9 million for work in relation to tax advice to the Group provided by PricewaterhouseCoopers LLP and Ernst & Young. Audit-related fees were less than $0.1 million and consisted of the performance of overseas statutory audits.
| | |
| 62 | | CSR plc Annual Report and Financial Statements 2014 |
Deloitte has been the Company’s auditors since July 2002, (which precedes the Company’s listing on the London Stock Exchange in March 2004) and the cost, scope and the effectiveness of the external audit process are reviewed regularly. The most recent full review, including release of tenders to other possible audit firms was conducted in 2005 and Deloitte was re-appointed at that time. The present Audit Partner is Mrs. Kate Houldsworth. Mrs. Houldsworth has held the post of audit partner for CSR since October 2013. Based on the provisions of the Code, a formal tendering process would be required at the latest by the last year of Mrs. Houldsworth’s tenure, which will be during 2017.
During 2014, led by the Chairman of the Audit Committee, a review of the independence and effectiveness of the external audit was undertaken. The review incorporated completion of questionnaires by personnel engaged both directly and indirectly in the full year audit for the 2013 financial period in addition to others with periodic engagement with the external auditors at other times during the course of the preceding year and face to face interviews attended by the Chairman of the Committee. As part of the discussions, the respondents and the Chairman reflected on how, in the conduct of the audit, the auditors had provided balanced and appropriate scrutiny and challenge to management on matters which had been the subject of review, how such matters had been concluded and where appropriate reported for consideration by the Audit Committee. The conclusion from the review which was discussed by the full Board, was that the external audit had been conducted appropriately and that the auditors were effective in the performance of their role, combining appropriate level of independence and scrutiny with suitable guidance and engagement with management and the Committee in the conduct of their responsibilities. Following the review, the findings of were discussed with Deloitte.
The review for 2015 will be undertaken by the Audit Committee and the findings arising from that review shall be reported to the Board in summer 2015. The review shall be led by the Chairman of the Audit Committee and include engagement with executive management and members of the Audit Committee.
The Chairman of the Audit Committee attends the Company’s Annual General Meeting to respond to any shareholder questions that might be raised concerning the Audit Committee’s activities.
Items Considered by the Audit Committee
In the preparation and approval of the 2014 financial statements, there are certain areas of critical judgment that are reported to and reviewed by the Audit Committee. The areas described below are the primary areas where judgment has been exercised in the preparation of the 2014 financial statements as found on pages 84 to 129. These reflect matters which the Audit Committee and Board considered to be significant risks to the business and the Group and may relate to disclosures on risk which appear on pages 32 to 35 of the report.
Impairment Testing for Goodwill and Intangible Assets
At the year-end date the Group held $133.3 million of goodwill arising from historic acquisitions, and intangible assets of $65.0 million, that represented investments in technology, systems and intellectual property to support the development of customer products.
The Group is required to test goodwill for potential impairment at least once a year, by calculating the recoverable value for the cash generating units under review.
Following the offer culminating in the Qualcomm Transaction, for 2014 management were able to estimate recoverable value based upon our assessment of the fair value less costs of disposal for the Group. The Committee reviewed the estimate and supporting judgments by considering reports prepared by management outlining the basis of assumptions used.
In addition, with specific regard to the impairment reversal prior to the sale of certain Imaging IP, the Committee reviewed papers explaining how the reversal was calculated and the impact of this on the Group accounts. This area has been an area of audit focus, and accordingly Deloitte has provided additional reporting to the Committee.
Taxation
Provisioning for potential current tax liabilities and the level of deferred tax asset recognition are underpinned by a range of management judgments. During 2014, the Committee received reports from management on the potential current and future tax liabilities for the Group, and considered the appropriateness of positions taken alongside external professional advice where necessary and discussed these with Deloitte during the year.
This was considered an area of higher audit risk and so the Committee also received additional reporting from Deloitte on these matters including detailed involvement in the scope of the tax audit.
Litigation Provisioning
Contingent assets or liabilities may arise from legal proceedings affecting the Group, the valuation of which is an area requiring judgment from management. It is recognised that this is an area of considerable uncertainty with potential outcomes which are not always capable of being predicted. The Committee receives detailed updates on litigation affecting the Group and briefings on the overall litigation environment from management, supported by external advice. In addition, management provides the Committee with reports detailing the basis of valuation for any litigation provisions carried at the end of each financial period. The Committee discusses the work which has been conducted and conclusions arising from that work with management, and, if necessary, advisers and Deloitte, as part of preparing and finalising the financial statements.
Inventory Valuation
The Group maintains inventory based on its forecast assessment of future orders for its products. The level of inventory provisioning is sensitive to changes in this forecast demand which is based upon assumptions which include an assessment of the macro-economic environment, as well as management’s interpretation of the specific needs and circumstances of our customers.
The Group’s policy on provisioning for inventory has been reviewed and approved by the Committee. The carrying value of inventory is reported to the Audit Committee, and the level of provisioning discussed at its meetings with management.
Development Expenditure
CSR does not capitalise the majority of its development costs since the commercial and/or technical viability of the products being designed is not typically confirmed until the very end of the development process.
During 2014, the Committee received reports from management explaining the fact pattern and assumptions behind this accounting treatment, and concluded that such treatment was appropriate. In addition, the Committee reviewed expenditure against budget and received regular updates on new product development.
Corporate Governancecontinued
Share-Based payments
The Group grants share options and share awards to employees, so as to both incentivise and retain employees. Each time a new grant of share options or share awards is made, a charge is recognised in the Group IFRS income statement over the vesting period, with a corresponding adjustment to equity.
The charge recognised is calculated based on management’s assumptions about the number of shares that will become exercisable, including its assessment of the macro-economic environment, forecast share price, behavioural considerations and expected employee turnover. As these factors may be volatile and are outside the direct control of CSR, the Group chooses to exclude any share-based payment charge from underlying results, as further explained on pages 130 to 133.
During 2014, the Audit Committee and Remuneration Committee have reviewed the purpose and impact of CSR’s share-based reward and incentive schemes.
Internal control
Philosophy and policy
The objective of the directors and senior management is to safeguard the value of the business and assets of the Group. Part of this objective requires the development of relevant policies and appropriate internal controls to ensure proper management of the Company’s resources and the identification of risks that may serve to undermine them.
The Board is ultimately responsible for the Group’s system of internal control and for reviewing its effectiveness. The systems and processes established by the Board are designed to manage, rather than eliminate, the risk of failure to achieve business objectives and provide reasonable, not absolute, assurance against misstatement or loss. The Board has delegated to the Audit Committee oversight of certain practices and procedures associated with the identification and management of risks which have the potential to impact the Group. The Company’s senior management, in conjunction with external advisers, are responsible for undertaking periodic reviews of the suitability of current systems, on which they report to the Audit Committee where appropriate.
The Audit Committee considers the findings from such reviews to ensure the effectiveness and efficiency of the processes implemented by senior management. This includes discussions with senior management of the Group and consideration of reports that have been submitted. These findings are in turn regularly reviewed and discussed by the full Board. In addition, as part of its regular business, the Board receives reports on actions being taken to address the principal risks as part of its routine business.
An ongoing risk evaluation process has been in place throughout 2014 and was in place up to the date of approval of this Annual Report and the financial statements. The risk evaluation process has been the subject of review by the Audit Committee during 2014. This ongoing review included updates on the progress in addressing the disclosure and management of key risks affecting the Group. In October 2014, the Company decided to engage Marsh Risk Consulting in advance of the development and execution of the annual detailed risk review. The engagement of Marsh Risk Consulting supported management in the planning and conduct of a robust assessment, and provided insight into evolving practices in risk management as well as assurance on the suitability of the approach being taken in the conduct of the review.
The detailed review included the identification, scoring, ranking and measures for mitigating risk across all aspects of the Group’s activities through engagement with management across multiple functions and locations within the business.
The executive leadership have reviewed the results of this assessment and the ranking of risks. In their review, the executive leadership considered how the risks might impact upon the achievement of the Group’s strategic objectives and the overall performance of the business. Where a risk was considered to be material, a member of the executive leadership has been made responsible for developing a plan intended to mitigate against the risk actually occurring or to respond in the event the risk were to occur.
During 2015, the mitigation plans will be considered by the executive at each Quarterly Business Review and the findings presented to and the subject of review by the Audit Committee.
This approach is consistent with a process which has been used by the Company in previous years, including during 2014. The Board is satisfied that this process accords with the internal control guidance for directors set out in the Turnbull Report ‘Internal Control: the Revised Guidance for Directors on the Combined Code’ and that through its engagement with management, the Board is aware of the major risks facing the Group and the steps taken by the Group to mitigate such risks, so far as is possible.
Managing risks
The Board discusses with management the actions it considers necessary to remedy any failings and weaknesses which have been determined to be significant from its review of the system of internal control. This has involved considering the matters reported to it and developing plans and programmes that it considers are reasonable in the circumstances.
A summary of the structures and processes in place to identify and manage risks across the Group are set out below.
Risk profiling
As referenced above, there is an ongoing process to identify and evaluate risks faced by the Group, through the conduct of regular meetings by the Group’s senior management, and engagement of external consultants where, in the opinion of the Group’s senior management, this is considered appropriate. Whilst a detailed review is undertaken each year, management have systems in place providing for the ongoing assessment of existing and developing risks and how these might impact the fulfilment of strategic objectives as part of routine business. The assessment of prioritised risks is therefore refreshed on a regular basis to reflect changes to the business and any observations or proposals arising from events since the last full review.
In the event of material changes or developments, the findings are reported to the Board or the Audit Committee as appropriate, together with recommended actions for managing such risks and a timetable for implementation of appropriate mitigation. Responsibility is assigned within the Group for carrying out proposed actions which are also reviewed and updated by management.
Controlling risk
The Group has policies which address a range of key business risks, including financial, treasury, health and safety and the protection of intellectual property. The policies are made available to relevant employees through an intranet site and also via employee briefings on specific topics.
Periodically, reviews are performed in order to verify that ongoing practices within relevant parts of the Group comply with current policies. In addition, policies are reviewed against best practice and to take appropriate account of developments both within or external to the Group’s business operations. As part of a process of continuous improvement, steps are ongoing to embed internal control and risk management further into the operations of the Group and to deal with areas of improvement which come to management’s and to the Board’s attention.
| | |
| 64 | | CSR plc Annual Report and Financial Statements 2014 |
As explained in the Strategic Report on page 31 (Liquidity), the Group has a Treasury Policy for the placement of cash deposits with financial institutions. As part of its schedule of matters, and reflecting management recommendations, the Audit Committee considered a revised Treasury Policy in November 2014. This was subsequently submitted to and formally adopted by the Board.
As one aspect of ensuring a culture of integrity and encouraging high standards throughout the organisation, the Group has a formal whistle-blowing policy. The policy provides information on the process to follow in the event that any employee feels it appropriate to make a disclosure where they believe there has been improper conduct or actions which could cause the Group’s good standing to be called into question. The policy was most recently updated in 2014 (and considered respectively by the Audit Committee and the Board in March 2015) to refresh the policy to reflect evolving best practice. The policy is published on the Group’s intranet site. From time to time employees are reminded of the existence of the policy and its purpose. In addition, all new employees worldwide are provided with information on the policy during the induction process. The policy is translated into other languages where it was felt the English language version may inhibit a detailed understanding of its terms.
Monitoring and managing the status of residual risk
The actions arising from external and internal assessments of risks are consolidated and during 2014, the results were reported to the Audit Committee.
The Audit Committee assesses the findings and proposed actions for addressing residual risks and also advises on areas for further attention.
Internal financial controls
The Group has a comprehensive system for regular monitoring and reporting of financial performance and assessing the adequacy of the Group’s systems of internal controls. Risk assessment and evaluation is an integral part of the annual planning cycle. This includes assessment of the Group’s strategic direction, objectives and financial returns and the potential risks that might affect achieving them.
As part of the planning cycle, a detailed budget is prepared by management and thereafter is reviewed and formally adopted by the Board. The budget and other targets are regularly updated via a rolling forecasting process and regular business review meetings are also held involving senior management worldwide, at which the Group’s overall performance is assessed. The results of these reviews are reported to and discussed by the Audit Committee and the Board at each meeting. A summary of the key financial and non-financial risks inherent in the Group’s business is given on pages 43 to 51.
These processes are supported by discrete reviews conducted by the Internal Auditor and external advisers, as determined by the Audit Committee, in addition to the routine audits.
The Board confirms that it has reviewed the effectiveness of the system of internal controls which were in place throughout the financial year and up to the date of signing the financial statements for the 52 week period ended 26 December 2014.
Controls and procedures under the Sarbanes-Oxley Act
The Group is subject to the provisions of the Sarbanes-Oxley Act. In particular, Section 404 of the Sarbanes-Oxley Act requires a report of management on the effectiveness of the Group’s internal control over financial reporting. As part of its internal audit process, the Group has a programme for the review of its internal control over financial reporting to ensure compliance with the requirements of Section 404 of the Sarbanes-Oxley Act. The Company’s management is responsible for establishing and maintaining
adequate internal control over financial reporting and the Company’s Chief Executive Officer and Chief Financial Officer have issued their report attesting to the Group’s compliance with Section 404 of the Sarbanes-Oxley Act as at 26 December 2014. Management’s certification and the independent auditors’ opinion on internal control over financial reporting are reported as required in the Company’s Form 20-F filed with the SEC.
During the 52 week period ended 26 December 2014, there have not been any changes in the Group’s internal control over financial reporting that have materially affected, or are reasonably likely to materially affect, the Group’s internal control over financial reporting.
The executive management, with the participation of the Chief Executive Officer and Chief Financial Officer, evaluated the effectiveness of the Group’s disclosure controls and procedures (as defined in Rules 13a-15(e) and 15d-15(e) under the US Securities Exchange Act of 1934, as amended, or the Exchange Act) as at 26 December 2014. Based on such evaluation the Chief Executive Officer and Chief Financial Officer concluded that, as at 26 December 2014, the Group’s disclosure controls and procedures were effective in ensuring that the information which the Group is required to disclose in the reports that are filed or submitted under the Exchange Act is recorded, processed, summarised and reported within the time periods specified in the SEC’s rules and forms and that such information is accumulated and communicated to management, including the Chief Executive Officer and Chief Financial Officer, as the principal executive and financial officers, respectively, as appropriate to allow timely decisions regarding required disclosures.
Based on that evaluation, the Chief Executive Officer and Chief Financial Officer concluded that the Group’s disclosure controls and procedures were effective as of the end of the period covered by this report.
Management’s report on internal control over financial reporting
The management of CSR plc is responsible for establishing and maintaining adequate internal control over financial reporting, as such term is defined in Rule 13a-15(f) of the Securities Exchange Act of 1934, for CSR plc. Under the supervision and with the participation of our management, including our Chief Executive Officer and Chief Financial Officer, we conducted an evaluation of the effectiveness of our internal control over financial reporting based principally on the framework and criteria established in Internal Control – Integrated Framework (1992) issued by the Committee of Sponsoring Organisations of the Treadway Commission (basing the review of the 2014 control environment on the COSO 2013 revision) as at 26 December 2014. Based on that evaluation, our management has concluded that our internal control over financial reporting was effective as at 26 December 2014. Deloitte LLP, an independent registered public accounting firm, has audited the consolidated financial statements included in the Form 20-F and, as part of the audit, has issued a report, included herein, on the effectiveness of our internal control over financial reporting.
Report of independent registered public accounting firm
To the Board of Directors and Shareholders of CSR plc
We have audited the internal control over financial reporting of CSR plc and subsidiaries (the “Company”) as at 26 December 2014, based on criteria established in Internal Control – Integrated Framework (2013) issued by the Committee of Sponsoring Organizations of the Treadway Commission. The Company’s management is responsible for maintaining effective internal control over financial reporting and for its assessment of the effectiveness of internal control over financial reporting, included in the accompanying Management’s Report on Internal Control Over Financial Reporting. Our responsibility is to express an opinion on the Company’s internal control over financial reporting based on our audit.
Corporate Governancecontinued
We conducted our audit in accordance with the standards of the Public Company Accounting Oversight Board (United States). Those standards require that we plan and perform the audit to obtain reasonable assurance about whether effective internal control over financial reporting was maintained in all material respects. Our audit included obtaining an understanding of internal control over financial reporting, assessing the risk that a material weakness exists, testing and evaluating the design and operating effectiveness of internal control based on the assessed risk, and performing such other procedures as we considered necessary in the circumstances. We believe that our audit provides a reasonable basis for our opinion.
A company’s internal control over financial reporting is a process designed by, or under the supervision of, the company’s principal executive and principal financial officers, or persons performing similar functions, and effected by the company’s board of directors, management, and other personnel to provide reasonable assurance regarding the reliability of financial reporting and the preparation of financial statements for external purposes in accordance with generally accepted accounting principles. A company’s internal control over financial reporting includes those policies and procedures that (1) pertain to the maintenance of records that, in reasonable detail, accurately and fairly reflect the transactions and dispositions of the assets of the company; (2) provide reasonable assurance that transactions are recorded as necessary to permit preparation of financial statements in accordance with generally accepted accounting principles, and that receipts and expenditures of the company are being made only in accordance with authorizations of management and directors of the company; and (3) provide reasonable assurance regarding prevention or timely detection of unauthorized acquisition, use, or disposition of the company’s assets that could have a material effect on the financial statements.
Because of the inherent limitations of internal control over financial reporting, including the possibility of collusion or improper management override of controls, material misstatements due to error or fraud may not be prevented or detected on a timely basis. Also, projections of any evaluation of the effectiveness of the internal control over financial reporting to future periods are subject to the risk that the controls may become inadequate because of changes in conditions, or that the degree of compliance with the policies or procedures may deteriorate.
In our opinion, the Company maintained, in all material respects, effective internal control over financial reporting as at 26 December 2014, based on the criteria established in Internal Control—Integrated Framework (2013) issued by the Committee of Sponsoring Organizations of the Treadway Commission.
We have also audited, in accordance with the standards of the Public Company Accounting Oversight Board (United States), the consolidated financial statements as at and for the 52 week period ended 26 December 2014 of the Company and our report dated 4 March 2015 expressed an unqualified opinion on those financial statements.
Deloitte LLP
London, United Kingdom
4 March 2015
US listing requirements
The Company’s American depositary shares are listed on NASDAQ and the Company is, therefore, subject to the rules of NASDAQ, US securities laws and the rules of the SEC applicable to foreign private issuers. NASDAQ requires US companies listed on the exchange to comply with NASDAQ’s corporate governance rules. Foreign private issuers, such as the Company, have certain accommodations in light of their compliance with the rules and practices of their country of domicile and therefore are exempt from most of the requirements promulgated by NASDAQ. As a company listed in the UK, the
Company is subject to the Code, accordingly, pursuant to NASDAQ Listing Rule 5615, the Company is required to disclose a summary of any material ways in which the corporate governance practices of the Company differ from those required by NASDAQ for US companies. The material differences are as follows:
Independence
The NASDAQ rules require that a majority of the Board be comprised of independent directors and the rules include detailed definitions that US companies must use for determining independence.
The Code requires that at least half the Board excluding the Chairman should comprise independent non-executive directors.
The Company’s Board currently comprises three executive directors, four non-executive directors and the Chairman. In accordance with the Code, the Chairman of the Board of Directors and Dr. Gerzberg are not considered independent.
While the Board does not explicitly take into consideration NASDAQ’s detailed definitions of independence, it has carried out an assessment based on the requirements of the Code and NASDAQ rules and has determined in its judgment that, with the exception of Dr. Gerzberg, the non-executive directors are independent within those requirements.
Nomination of Directors
NASDAQ rules require that nominees to a company’s board of directors be selected, or recommended for the board’s selection, either by a majority of the company’s independent directors or by a nomination committee comprised solely of independent directors.
The Nomination Committee leads the process for Board appointments and makes recommendations to the Board in relation to new appointments of executive and non-executive directors and on succession planning, board composition and balance. It is chaired by the Chairman of the Board, and its other members are non-executive directors. Under NASDAQ rules, the Chairman of the Board is not considered independent; therefore the Nomination Committee does not meet the requirements of the NASDAQ rules.
Committees
NASDAQ rules require US companies to have a nominations committee, an audit committee and a compensation committee, each composed entirely of independent directors, with the nominations committee and the audit committee required to have a written charter that addresses the committee’s purpose and responsibilities.
Both CSR’s Nomination and Remuneration Committees have terms of reference and compositions that comply with the Code’s requirements.
The Nomination Committee is chaired by the Chairman of the Board and its other member is a non-executive director of the Company.
The Remuneration Committee is chaired by a non-executive director who is considered independent of management and the Board, and additional members are two other non-executive directors including the Chairman of the Board. Under NASDAQ rules, the Chairman of the Board is not considered independent; therefore the Remuneration Committee does not meet the requirements of the NASDAQ rules.
In addition, NASDAQ rules require the compensation committee to have the authority, in its sole discretion, to retain or obtain the advice of a compensation adviser, and be directly responsible for the appointment, compensation, and oversight of the work of a compensation adviser retained by the committee. The rules also require the issuer to provide appropriate funding, as determined by the compensation committee, for the payment of reasonable compensation to a compensation adviser. Moreover, the
| | |
| 66 | | CSR plc Annual Report and Financial Statements 2014 |
compensation committee may select, or receive advice from, a compensation consultant, legal counsel or other adviser to the compensation committee only after taking into consideration the factors set forth in the NASDAQ Rule.
CSR’s Remuneration Committee conducts its business in accordance with terms of reference which reflect the delegated authority of the Remuneration Committee. These terms of reference include making recommendations on CSR’s framework for executive remuneration and determining the individual remuneration packages for each executive director.
In connection with its duties, CSR’s Remuneration Committee is authorised by the Board, at the Company’s expense, to obtain outside legal or other independent professional advice including the advice of independent remuneration consultants and to secure the attendance of external professional advisers at its meetings if it considers this necessary. Page 76 of the report of the Remuneration Committee explains the advisers presently retained by the Committee for such purposes. Although CSR’s Remuneration Committee can seek the advice and assistance of any of CSR’s executives, it needs to ensure that this role is clearly separated from their role within the business. The terms of reference of CSR’s Remuneration Committee are consistent with the requirements of the Code.
The Audit Committee is composed entirely of non-executive directors whom the Board has determined to be independent and who meet the requirements of Rule 10A-3 under the Exchange Act.
We consider that the terms of reference of these committees, which are available on our website (www.csr.com/ir/corporate-governance-responsibility/corporate-governance) are generally responsive to the relevant NASDAQ rules but may not address all aspects of these rules.
Code of conduct
Under NASDAQ rules US listed companies must adopt a code of conduct applicable to all directors, officers and employees. The Group has adopted a Group Ethics policy, which applies to all its employees, including directors and officers. It sets out what conduct is expected of employees as they adhere to our business principles and draws their attention to the Group’s policies. In addition, the Company has adopted an Executive Ethics Policy that applies to executive directors, senior officers and other specified employees and is intended to meet the ‘code of ethics’ requirements of Section 406 of the Sarbanes-Oxley Act.
Quorum
Under NASDAQ rules, US listed companies are required to have a minimum quorum of 33.33% of the shareholders of ordinary shares for shareholder meetings. However, the Company’s Articles of Association provide for a quorum for general meetings of shareholders of two shareholders regardless of the level of their aggregate share ownership.
Related party transactions
The NASDAQ rules require US listed companies to conduct appropriate reviews of related party transactions and potential conflicts of interest via the company’s audit committee or other independent body of the board of directors.
We are subject to extensive provisions under the Listing Rules issued by the Financial Conduct Authority in the UK (the ‘Listing Rules’) governing transactions with related parties, as defined therein, and the Companies Act 2006 also restricts the extent to which companies incorporated in England and Wales may enter into related party transactions.
The Company’s Articles of Association contain provisions regarding disclosure of interests by directors and restrictions on their voting in circumstances involving conflicts of interest.
The concept of a related party for the purposes of NASDAQ’s listing rules differs in certain respects from the definition of a transaction with a related party under the Listing Rules.
Shareholder approval
Stock option plans
NASDAQ rules require US listed companies to obtain shareholder approval before a stock option or purchase plan is established or materially amended or other equity compensation arrangement is made pursuant to which stock may be acquired by officers, directors, employees or consultants of the company, subject to certain exceptions. The Company’s directors or Remuneration Committee may amend the schemes and plans of the Company, except that any amendment relating to the identity of option holders, the limitations on their benefits, the basis for determining an option holder’s entitlement to shares (other than provided for in accordance with the rules) or the adjustment of rights for option holders in the event of a variation in share capital may not be made to the advantage of option holders without prior approval of the shareholders of the Company in general meeting, except for minor amendments relating to tax and administrative matters. Amendments to the CSR plc SAYE Scheme, the CSR plc Share Option Plan and the CSR plc 2013 Long-Term Incentive Plan are subject to the prior approval of HM Revenue and Customs in the UK in order to retain their UK tax approved status.
Attendance at meetings
The table below shows the attendance of each of the directors at the regular meetings of the Board and its Committees held during the 52 week period ended 26 December 2014.
| | | | | | | | | | | | | | | | |
No. of Meetings | | Board | | | Audit | | | Remuneration | | | Nomination | |
J A J van Beurden | | | 8 | | | | – | | | | – | | | | – | |
| | | | |
W G Boyd¹ | | | 8 | | | | 4 | | | | 3 | | | | 1 | |
| | | | |
A E C G Carlisle² | | | 8 | | | | 4 | | | | 3 | | | | 1 | |
| | | | |
D D W Gardiner | | | 8 | | | | – | | | | – | | | | – | |
| | | | |
L Gerzberg | | | 8 | | | | – | | | | – | | | | – | |
| | | | |
C A Ladas | | | 7 | | | | – | | | | – | | | | – | |
| | | | |
R W Mackintosh3 | | | 8 | | | | – | | | | 3 | | | | 1 | |
| | | | |
C M R Stone | | | 8 | | | | – | | | | 3 | | | | – | |
| | | | |
T M Vega | | | 8 | | | | 4 | | | | – | | | | – | |
| 1 | Appointed as Senior Independent Director on 1 January 2015. |
| 2 | Stood down from the Board, Remuneration, Nomination and Audit Committees and as Senior Independent Director on 31 December 2014. |
| 3 | Although Mr. Mackintosh is not a member of the Audit Committee, he attended all Audit Committee meetings by invitation. |
During 2014, additional meetings were held outside the regular scheduled meetings on seven occasions, at which all members of the Board were present.
Annual General Meeting resolutions
The resolutions to be proposed at the Annual General Meeting to be held on 20 May 2015, together with explanatory notes, appear in the separate Notice of the Annual General Meeting, which has been sent to all registered shareholders.
The Directors’ Report comprising the information on pages 2 to 7 and on pages 43 to 82 and pages 129 to 158 has been approved by the Board of Directors on 4 March 2015.
By Order of the Board for and on behalf of the Board of Directors
Brett Gladden,
Company Secretary
4 March 2015
Annual Statement from the Remuneration Committee Chairman
Dear shareholder
On behalf of the Board, I am pleased to present the Committee’s report on remuneration for 2014. I hope you find the report helpful and informative.
Company strategy and remuneration philosophy
In recent years, CSR’s goal has been to deliver growing shareholder returns by generating revenue growth and increasing profitability. CSR has undertaken this by focusing investment on markets that are growing and where CSR can deliver differentiated platforms with leading market positions. CSR has pursued a strategy designed to build its portfolio of technologies and has focused on five strategic end markets: Voice & Music, Automotive Infotainment, Document Imaging, Bluetooth Smart and the nascent market of Indoor Location. This strategy has diversified the products, market presence and customer base of CSR, whilst improving our relative market share. Please see page 8 for further information on the strategy.
The Committee’s remuneration philosophy supports this strategy by providing for a substantial proportion of remuneration earned by executive directors to be performance related. The fixed parts of the directors’ remuneration (salary, benefits and pension) are generally set at median level and the variable elements, such as bonus (paid under the Executive Incentive Plan) and share options, deliver significant value only where this is justified by performance. The link between the performance conditions for the variable elements of remuneration and the Company’s KPIs is shown in the ‘At a glance’ summary on page 69.
The philosophy also seeks to ensure consistency of approach to remuneration at all levels, for example, by taking account of pay increases throughout the Group when reviewing the directors’ salaries. The Committee has oversight of the remuneration for employees throughout the Group to ensure that the philosophy is being applied in practice and that its decisions on executive pay are made in the appropriate context.
Our remuneration philosophy is reflected in the Directors’ Remuneration Policy (‘Policy’) described in our 2013 Remuneration Report (incorporating the statement on our website in relation to the use of discretion) and we were pleased that 93.71% of votes cast at the AGM on 21 May 2014 were in favour of the Policy.
As our Chairman has noted, on 15 October 2014, we announced that the Board had reached agreement with Qualcomm, regarding the terms of a recommended cash offer for CSR. The offer from Qualcomm of 900 pence per Ordinary Share values CSR at £1,560 million and, as we stated at the time of announcing the terms of the offer, your Board believes that the offer from Qualcomm provides CSR shareholders with an immediate and certain value which is highly attractive.
UK Corporate Governance Code – remuneration changes
The Committee has considered the recent changes to the UK Corporate Governance Code relating to malus and clawback and minimum holding periods for shares which take effect for companies with a reporting year commencing on or after 1 October 2014.
Since 2011 CSR has operated the Executive Incentive Plan. This arrangement contains performance based forfeiture provisions which the Committee considers are much stronger than market practice malus provisions. The Committee therefore believes that it is not appropriate or necessary to introduce additional malus and clawback provisions at this point, particularly given the likelihood that CSR will not be a listed entity by the end of its 2015 financial year. If for any reason CSR continues as a listed company, the Committee may reconsider its position.
The Committee is also satisfied that there are sufficient minimum shareholding requirements and holding periods for the executive directors. It is the Committee’s opinion that the satisfaction of the substantial shareholding requirements set by the Committee of 400% of salary for the CEO, 200% of salary for the CFO and 100% of salary for the Operations Director, make it unnecessary to impose further holding requirements on shares acquired from any of the incentive arrangements.
Outcomes and operation of the remuneration policy
For ease of reference, I have summarised the Policy, the outcomes for 2014 and how the Policy will be operated in 2015 in the following ‘At a glance’ summary.
The Committee is mindful of the potential reputational damage that inappropriate pay can cause a company. In assessing the total remuneration and reward, the Committee has satisfied itself that the payments and outcomes for 2014 are justified by the performance of the business and are equitable to all stakeholders in the Company.
The Committee works to ensure transparent reporting and open dialogue with the Company’s shareholders on remuneration. Please do not hesitate to contact me through the Company Secretary if you have any questions on the Policy or its implementation.
Chris Stone
Chairman, Remuneration Committee
4 March 2015
| | |
| 68 | | CSR plc Annual Report and Financial Statements 2014 |
At a glance
| | |
| Our principles of remuneration are: |
| |
| Competitive | | Market competitive reward packages to recruit and retain in an international market. Fixed elements are at market level with an entrepreneurial incentive package to reward outperformance. |
|
Flexible | | Sufficiently flexible reward package to enable it to adapt to business challenges. |
|
Shareholder Alignment | | The majority of the overall remuneration package capable of being earned is provided in shares; with substantial minimum shareholding requirements for the executive directors to ensure a material locked-in shareholding. |
|
The following table summarises the link between Company strategy for 2014 and performance-based remuneration:
| | | | | | | | |
| | | Revenue growth | | Profit growth | | Product development
and market penetration | | Shareholder Value |
|
| Annual bonus metrics | | ü | | ü | | ü | | ü |
| | | | | | Contained in personal | | Sustained delivery of Revenue |
| | | | | | objectives. | | and Profit growth should drive |
| | | | | | | | shareholder value1. |
|
Long-term incentive metrics | | ü | | | | | | ü |
| | 50% of EIP Element B awards are subject to forfeiture if Revenue threshold is not satisfied. | | | | | | Share options are market priced so no benefit is obtained unless share price appreciation is above the absolute growth targets set. |
|
The following table shows performance for 2014 against some of the Company’s key strategic objectives:
| | | | | | | | | | |
| | | Threshold | | Target | | Maximum | | Actual | | Level of satisfaction of |
| | | | | | | | | Performance | | Performance Measure |
|
Bonus | | | | | | | | | | |
|
Revenue | | $698m | | $776m | | $854m | | $703m | | Between threshold and target |
|
Profit | | $99m | | $124m | | $149m | | $112m | | Between threshold and target |
|
Long-term incentive | | | | | | | | | | |
|
Absolute TSR (2011 options) | | 7.5% | | – | | 10.5% | | 123.6% | | Maximum |
|
1 Revenue and Profit are defined on page 71.
Remuneration reportcontinued
Directors’ shareholdings
The following table shows:
| — | | the shareholding requirement; |
| — | | the number of shares held; |
| — | | the number of EIP share awards; |
| — | | the number of unvested share options; and |
| — | | the number of vested and unexercised share options |
for each director at 26 December 2014.
| | | | | | | | | | | | | | | | | | |
| | | Shareholding Requirement | | | | Vested Share Options | | | | |
| Director | | % of Salary | | Value of Shares
Held as a % of Salary | | Unconditional
Shares
Number of
Shares Held | | Deferred &
Conditional
Shares (EIP
Element B)
Number of Share
Awards Held | | Unvested
Share Options
Number
of Options Held | | Number
of Options Held | | Exercised
During
Financial
Year | | Unvested
SAYE Options
Number of
Options Held | | Total Conditional
& Unconditional
Shares Number |
Executive | | | | | | | | | | | | | | | | | | |
J A J van Beurden | | 400 | | 581 | | 324,173 | | 225,034 | | 638,306 | | 485,981 | | – | | 6,550 | | 1,680,044 |
D D W Gardiner2 | | 200 | | 747 | | 292,702 | | 165,192 | | 476,602 | | 366,434 | | – | | 6,550 | | 1,307,480 |
C A Ladas | | 100 | | 319 | | 82,341 | | 105,907 | | 308,176 | | 232,056 | | – | | – | | 728,480 |
Non–executive | | | | | | | | | | | | | | | | | | |
R W Mackintosh | | – | | – | | 106,000 | | – | | – | | – | | – | | – | | 106,000 |
A E C G Carlisle | | – | | – | | 19,000 | | – | | – | | – | | – | | – | | 19,000 |
L Gerzberg1 | | – | | – | | 31,840 | | – | | 84,668 | | 548,100 | | 760,592 | | – | | 664,608 |
C M R Stone | | – | | – | | 12,286 | | – | | – | | – | | – | | – | | 12,286 |
T M Vega1 | | – | | – | | 3,000 | | – | | – | | – | | – | | – | | 3,000 |
W G Boyd | | – | | – | | 7,000 | | – | | – | | – | | – | | – | | 7,000 |
| 1 | Dr. Gerzberg’s shares and options and Ms. Vega’s shares are held as CSR ADSs. Each ADS represents 4 ordinary shares in CSR plc. The numbers shown above are the ordinary shares equivalent of the ADSs. |
| | In 2014, Dr. Gerzberg exercised options in respect of 190,148 ADSs (equivalent to 760,592 ordinary shares) with an average exercise price of $19.47 per share making an aggregate gain of $3,486,467. These were options which he held and which were granted to him when he served as CEO of Zoran Corporation prior to the acquisition by CSR in August 2011. |
| 2 | A total of 23,580 ordinary shares were pledged by Mr. Gardiner as announced on 19 December 2014, although he retains the beneficial interest in those ordinary shares. |
Notes:
| 1. | The closing share price on 26 December 2014 of £8.49 was used to calculate the value of shares held as a percentage of salary. All directors have satisfied the shareholding requirements shown above. |
| 2. | EIP Element B share awards for 2014 which will be granted in 2015 are not reflected in the table. |
Subsisting share grants held by directors
The following table shows the subsisting share grants and the level of potential vesting at 26 December 2014 if this was assumed to be the end of the relevant performance period:
| | | | | | | | | | | | | | | | | | | | | | | | | | | | |
| | | | | | 2012 Share Option Grant | | | | | 2013 Share Option Grant | | | | 2014 Share Option Grant |
| | | Number of | | | Current | | | | | | Number | | | Current | | | | | | Number | | Current | | | | |
| | | Shares | | | Level of | | End of | | Type of | | of Shares | | | Level of | | End of | | Type of | | of Shares | | Level of | | End of | | Type of |
| | | subject to | | | Potential | | Performance | | Performance | | subject | | | Potential | | Performance | | Performance | | subject | | Potential | | Performance | | Performance |
Director | | Option | | | Vesting | | Period | | Condition | | to Option | | | Vesting | | Period | | Condition | | to Option | | Vesting | | Period | | Condition |
J A J van Beurden | | | 420,202 | | | 100% | | 21/03/15 | | Note 1 | | | 127,685 | | | 100% | | 26/03/16 | | Note 1 | | 90,419 | | 100% | | 14/08/17 | | Note 1 |
D D W Gardiner | | | 316,836 | | | 100% | | 21/03/15 | | Note 1 | | | 96,276 | | | 100% | | 26/03/16 | | Note 1 | | 63,490 | | 100% | | 14/08/17 | | Note 1 |
C A Ladas | | | 204,244 | | | 100% | | 21/03/15 | | Note 1 | | | 64,961 | | | 100% | | 26/03/16 | | Note 1 | | 38,971 | | 100% | | 14/08/17 | | Note 1 |
| | | | | | 2013 EIP Element B (granted in relation to 2012) | | | | 2014 EIP Element B (granted in relation to 2013) |
| | | | | | Current | | | | | | | | | | | | | | |
| | | Number | | | Level | | End of | | Type of | | Number | | Current | | End of | | Type of |
| | | of Share | | | of Potential | | Forfeiture | | Performance | | of Share | | Level of Potential | | Forfeiture | | Performance |
Director | | Awards | | | Vesting | | Period | | Condition | | Awards | | Vesting | | Period | | Condition |
J A J van Beurden | | | 138,485 | | | 100% | | 26/12/14 | | | Note 2 | | 86,549 | | 100% | | 01/01/16 | | Note 2 |
D D W Gardiner | | | 104,419 | | | 100% | | 26/12/14 | | | Note 2 | | 60,773 | | 100% | | 01/01/16 | | Note 2 |
C A Ladas | | | 68,140 | | | 100% | | 26/12/14 | | | Note 2 | | 37,767 | | 100% | | 01/01/16 | | Note 2 |
| | |
| 70 | | CSR plc Annual Report and Financial Statements 2014 |
Notes:
| | | | | | | | |
Condition | | Description | | | | | | |
| 1 | | | | Threshold | | Maximum | | |
| | Absolute total shareholder return growth: | | 7.50% | | 10.50% | | |
| | | % of option vesting | | 25% | | 100% | | |
| 2 | | A minimum level of Revenue performance below which 50% of earned Element B share awards will be forfeited. |
The level of vesting for minimum performance is 25% for share options and 25% for EIP Element B. There was no forfeiture event in 2014 for the outstanding EIP Element B awards and, therefore, no reduction in the potential level of vesting. The 2014 EIP Element B share awards are subject to a further forfeiture risk in respect of 2015.
Summary of Policy
The following table sets out the key elements of the Policy, how the Policy has been operated in 2014 and the proposed operation for 2015. The Policy is available in its entirety in the Investor Centre section of our website www.csr.com/ir/remuneration-policy. The Policy was approved on 21 May 2014 for a three-year period. There have been no changes made to the Policy approved by shareholders.
| | | | | | | | | | | | |
Element of Remuneration | | Summary of Policy | | Summary of 2014 outcomes | | Operation of Policy for 2015 |
|
Salary | | Salary is set at the median level relative to the current comparator group of companies1. | | The directors’ salaries were increased by 3% from 1 April 2014 to: | | The directors’ salaries were reviewed in March 2015 with the decision taken to increase these by 3%. |
| | | | J A J van Beurden D D W Gardiner C A Ladas | | | | £473,800
£332,690 $340,930 | | | | |
| | Increases in the directors’ salaries will not typically exceed the increase for employees. | | | | | | The salaries for the directors from 1 April 2015 will be: |
| | | | | | |
| | | The typical increase for UK and US employees was 3%. | | | | J A J van Beurden | | £488,014 |
| | | | | | | D D W Gardiner | | £342,671 |
| | | | | | | | | | C A Ladas | | $351,158 |
|
Executive Incentive Plan (‘EIP’) | | Annual participation in the EIP is set at a maximum of 250% of salary. Payments are made under the EIP subject to the satisfaction of Core revenue (‘Revenue’); underlying profit excluding litigation expense (‘Profit’) targets and personal objectives. | | 2014 Performance See page 69 for a summary of the performance conditions and their level of satisfaction (full details are on page 73). This resulted in the following payments (one half of which are deferred as described in the Policy summary): | | No change. Maximum potential remains at 250% of salary. |
| | One half of any amounts earned are subject to mandatory deferral in shares, one half of which is subject to the risk of forfeiture during each of the subsequent two financial years, based on meeting financial performance. | | J A J van Beurden D D W Gardiner C A Ladas | | | | £352,668 £274,634 £163,195 | | | | |
| | | | | | | | | | |
| | | | | | | | | | |
| | | | Vested EIP Element B share awards | | | | |
| | | | Share awards granted in 2012 representing the deferred payment for the 2011 financial year vested in full in 2014, as follows: | | | | | | | | |
| | | | | | Number | | Value £ | | | | |
| | | | | | |
| | | | J A J van Beurden | | 62,696 | | 446,474 | | | | |
| | | | D D W Gardiner | | 47,274 | | 336,650 | | | | |
| | | | C A Ladas | | 24,216 | | 172,448 | | | | |
| | | | | The share price on the vesting date was £7.1212. | | | | |
1. No changes have been made to the comparator companies listed in the 2013 Remuneration Report.
Remuneration reportcontinued
| | | | | | | | | | |
Element of
Remuneration | | Summary of Policy | | Summary of 2014 outcomes | | Operation of Policy for 2015 |
Market value share options granted under the Long-Term Incentive Plan (‘LTIP’) | | Maximum grant value is set at 300% of salary p.a. Options vest at the end of a three year period subject to satisfaction of the performance condition and continued employment. | | Market value options were granted with a value equal to 100% of salary. These vest on the third anniversary of the grant date subject to satisfaction of an absolute shareholder return target and continued employment. The options granted to the directors in September 2011 vested in full in September 2014, as follows: | | On the basis that the transaction with Qualcomm completes by late summer 2015, the Committee does not anticipate granting share options to the directors in 2015. |
| | | | | | | Number | | Gain* £ | | |
| | | | |
| | J A J | | | | | |
| | van Beurden | | 485,981 | | 2,602,428 | |
| | | | |
| | D D W | | | | | |
| | Gardiner | | 366,434 | | 1,962,254 | |
| | | | |
| | C A | | | | | |
| | Ladas | | 232,056 | | 1,242,660 | |
| | | | |
| | *The share price on the vesting date was £7.495 and the exercise price is £2.14 per share. | |
| | See page 69 for a summary of the performance conditions and their level of satisfaction. | |
Benefits | | The directors are provided with private medical insurance, life assurance of four times basic salary, and personal accident insurance and, in the case of Mr. Ladas, reimbursement of accommodation, travel and subsistence in relation to the performance of UK duties and UK taxes paid by CSR on Mr. Ladas’ earnings relating to UK duties in accordance with the Company’s tax equalisation arrangements. | | The value of the benefits provided in 2014 were as follows: | | No change to policy operated in 2014. |
| | | | |
| | J A J van Beurden | | £3,448 | |
| | | | |
| | D D W Gardiner | | £7,980 | |
| | | | | |
| | | C A Ladas | | £145,764 | | |
| | | | | | |
| | | | | | |
Pension | | Maximum employer retirement funding set at 20% of salary. | | Employer retirement funding as a % of salary was: | | Maximum employer retirement funding will be 14% of salary. |
| | | | | | |
| | | | J A J van Beurden | | 14% | | |
| | | | | | |
| | | | D D W Gardiner | | 14% | | |
| | | | | | |
| | | | C A Ladas | | 8% | | |
| | | | | | |
| | | | | | | | | | | |
All Employee Share Purchase Plan | | The Company operates a UK SAYE Scheme in which the directors are eligible to participate. | | The following grants were made in 2014: | | |
| | | | | |
| | J A J van Beurden | | 2,068 options | | |
| | | | | |
| | D D W Gardiner | | 2,068 options | | |
| | | | | |
| | | | Exercise price | | £4.352 | | |
| | | | | | |
| | | | | | | | | | |
NED fees | | Fees are set at broadly the median level of the comparator group. | | The fees paid to the NEDs from 1 April 2014 were: | | The NED fees were reviewed in February 2015 with the decision taken to make no changes. |
| | | | | | |
| | Any increase in fees will take account of any change of responsibility and the typical salary increase across the UK workforce. | | Base fee | | £48,200 | | |
| | | | | |
| | | Fee for Committee membership | | £2,000 | | |
| | | | | |
| | | Fee Audit Chair | | £11,800 | | |
| | | | | |
| | | Fee Remuneration Chair | | £10,900 | | |
| | | | | |
| | | Senior Independent Director fee | | £10,700 | | |
| | | | | |
| | | | Chairman’s fee | | £192,800 | | |
| | | | | | |
| | | | | | | | | | |
| | |
| 72 | | CSR plc Annual Report and Financial Statements 2014 |
2014 Annual Report on Remuneration
This section of the Remuneration Report summarises the operation of the directors’ remuneration policy for 2014.
The information provided in parts a) to c) of this section is subject to audit.
a) Single figure of total remuneration received by each of the directors
The table below shows the total remuneration received by each of the directors for the year completed.
The notes following the table provide information on the calculation of bonus and share awards.
| | | | | | | | | | | | | | | | | | | | | | | | | | | | | | | | | | | | | | | | | | | | | | | | | | | | | | | | |
Director | | Salary/Fees | | | Taxable Benefits | | | Bonus | | | Share Awards/
Options | | | Pension | | | Other Payments
in nature of
Remuneration | | | | | | Total | |
Year | | 2014 | | | 2013 | | | 2014 | | | 2013 | | | 2014 | | | 2013 | | | 2014 | | | 2013 | | | 2014 | | | 2013 | | | 2014 | | | 2013 | | | 2014 | | | 2013 | |
| | | $ | | | $ | | | $ | | | $ | | | $ | | | $ | | | $ | | | $ | | | $ | | | $ | | | $ | | | $ | | | $ | | | $ | |
Executive | | | | | | | | | | | | | | | | | | | | | | | | | | | | | | | | | | | | | | | | | | | | | | | | | | | | | | | | |
J A J van Beurden | | | 740,369 | | | | 706,697 | | | | 5,516 | | | | 5,525 | | | | 274,164 | | | | 766,618 | | | | 5,800,570 | | | | 736,191 | | | | 103,655 | | | | 80,592 | | | | – | | | | – | | | | 6,924,274 | | | | 2,295,623 | |
D D W Gardiner | | | 519,868 | | | | 504,638 | | | | 12,317 | | | | 14,113 | �� | | | 192,508 | | | | 538,299 | | | | 4,365,561 | | | | 555,102 | | | | 72,782 | | | | 70,648 | | | | – | | | | – | | | | 5,163,036 | | | | 1,682,800 | |
C A Ladas | | | 338,448 | | | | 328,590 | | | | 229,430 | | | | 192,390 | | | | 126,872 | | | | 334,525 | | | | 2,795,532 | | | | 284,350 | | | | 27,076 | | | | 26,287 | | | | – | | | | – | | | | 3,517,358 | | | | 1,166,142 | |
| | | | | | | | | | | | | | |
Non-Executive | | | | | | | | | | | | | | | | | | | | | | | | | | | | | | | | | | | | | | | | | | | | | | | | | | | | | | | | |
R W Mackintosh | | | 301,279 | | | | 291,773 | | | | – | | | | – | | | | – | | | | – | | | | – | | | | – | | | | – | | | | – | | | | – | | | | – | | | | 301,279 | | | | 291,773 | |
A J Allner* | | | – | | | | 87,578 | | | | – | | | | – | | | | – | | | | – | | | | – | | | | – | | | | – | | | | – | | | | – | | | | – | | | | – | | | | 87,578 | |
A E C G Carlisle | | | 91,459 | | | | 86,792 | | | | – | | | | – | | | | – | | | | – | | | | – | | | | – | | | | – | | | | – | | | | – | | | | – | | | | 91,459 | | | | 86,792 | |
L Gerzberg | | | 78,867 | | | | 72,681 | | | | – | | | | – | | | | – | | | | – | | | | – | | | | – | | | | – | | | | – | | | | – | | | | – | | | | 78,867 | | | | 72,681 | |
C M R Stone | | | 91,775 | | | | 81,701 | | | | – | | | | – | | | | – | | | | – | | | | – | | | | – | | | | – | | | | – | | | | – | | | | – | | | | 91,775 | | | | 81,701 | |
T M Vega | | | 77,686 | | | | 72,944 | | | | – | | | | – | | | | – | | | | – | | | | – | | | | – | | | | – | | | | – | | | | – | | | | – | | | | 77,686 | | | | 72,944 | |
W G Boyd | | | 97,588 | | | | 6,732 | | | | – | | | | – | | | | – | | | | – | | | | – | | | | – | | | | – | | | | – | | | | – | | | | – | | | | 97,588 | | | | 6,732 | |
| *Mr. | | Allner stood down as a director on 31 December 2013. |
Note 1
No amounts were subject to recovery or forfeiture.
Note 2
Bonus (paid under EIP)
The tables below show the performance measures for 2014, their level of satisfaction and the corresponding level of bonus earned by the directors:
Performance measures and targets
| | | | | | | | | | | | | | | | |
| | | Bonus | | Forfeiture | | | | | | | | Actual | | Level of Satisfaction of Performance | | |
| Performance | | Weighting | | Threshold | | Threshold | | Target | | Maximum | | Performance | | Measure (Bonus Weighted) | | |
Measure | | (a) | | $m | | $m | | $m | | $m | | $m | | (b) | | |
Profit | | 50% | | – | | 99 | | 124 | | 149 | | 112 | | 29.21% | | |
Revenue | | 25% | | <621 | | 698 | | 776 | | 854 | | 703 | | 10.68% | | |
Personal Objectives | | 25% | | – | | – | | – | | – | | – | | 50% | | |
| | | | | | | | | | | | |
Director | | Maximum Annual
Participation for 2014 (c) | | EIP Award Based on
Profit (% of Salary) a x b x c | | EIP Award Based on
Revenue (% of Salary) a x b x c | | EIP Award Based on
Personal Objectives (% of Salary) a x b x c | | Total EIP Award for 2014 (% of Salary) | | Total EIP Award
for 2014 (Value) £ |
J A J van Beurden | | 250% | | 36.51 | | 6.67 | | 31.25 | | 74.43 | | 352,668 |
D D W Gardiner | | 250% | | 36.51 | | 6.67 | | 31.25 | | 74.43 | | 247,634 |
C A Ladas | | 250% | | 36.51 | | 6.67 | | 31.25 | | 74.43 | | 163,195 |
Notes:
| 1. | Revenue and Underlying Profit (excluding litigation expense) are defined as the Company’s revenue and profit for the purpose of the EIP’s performance targets. The Committee may adjust the profit measure for exceptional items. |
| 2. | Personal objectives are set each year. These relate to areas which the Committee considers are important to the medium and long term success of the Company and which ultimately will contribute to qualitative or quantative improvements. For the 2014 financial year, the personal objectives included the introduction of new products, progress in the development of new technologies and engagement with customers. The Committee determined that these objectives had been partially satisfied, resulting in the level of award shown in the table above. |
Awards earned under the EIP
| | | | | | | | | | |
| | | | | Element A | | | | | | |
Director | | Value £ | | | | Form of Payment | | Value of Element B Award (Shares)
£ | | Total Value of Award £ |
J A J van Beurden | | 176,334 | | | | shares | | 176,334 | | 352,668 |
D D W Gardiner | | 123,815 | | | | shares | | 123,819 | | 247,634 |
C A Ladas | | 81,600 | | | | shares | | 81,595 | | 163,195 |
Notes:
| 1. | Element A is paid following the year end and the sign-off of the level of satisfaction of the performance conditions (in March 2015). |
| 2. | Element B is awarded in the form of a share award with a risk of performance-based forfeiture over a two-year period of deferral and therefore is not included in the bonus total. |
Remuneration reportcontinued
Note 3
2013 share awards reconciliation
This disclosure relates to EIP Element B awards granted to the directors on 21 March 2012 (awarded in relation to performance in the 2011 financial year), which vested on 21 March 2014. These awards were reported as 2013 share awards in the 2013 single figure of remuneration on the basis that the last forfeiture threshold applying to these awards ended at the end of the 2013 financial year. In 2013, the value reported for these awards was calculated using the average price of a share in CSR for the final quarter of 2013 (£5.335). The awards vested on 21 March 2014 when the share price was £7.1212. The table below shows the values reported in the 2013 single figure table and the actual values of the shares received at vesting. The value of 2013 share awards has been updated accordingly in the 2014 single figure table.
| | | | |
| | | Value reported in 2013 single figure | | Value on vesting date |
| Director | | £ | | £ |
J A J van Beurden | | 334,483 | | 446,474 |
D D W Gardiner | | 252,207 | | 336,650 |
C A Ladas | | 129,192 | | 172,448 |
Note 4
2014 share awards
This disclosure relates to EIP Element B awards granted to the directors on 26 March 2013 (awarded in relation to performance in the 2012 financial year), which are due to vest on 26 March 2015 subject to continued employment on that date. The last forfeiture threshold applying to these Element B awards relates to the 2014 financial year.
| | | | | | |
| Forfeiture Condition | | Forfeiture Threshold | | Actual | | Level of |
| $m | | $m | | Forfeiture |
2013 Revenue | | <722 | | 961 | | 0% |
2014 Revenue | | <621 | | 703 | | 0% |
| | | | | | | | |
| | | Number of Shares subject to Element B Award | | Level of Forfeiture | | Average Market Value of a Share over Q4 2014 (£) | | Value of Shares (£) |
| Director | | (a) | | (b) | | (c) | | a x c |
J A J van Beurden | | 138,485 | | 0 | | 8.15 | | 1,128,653 |
D D W Gardiner | | 104,419 | | 0 | | 8.15 | | 851,015 |
C A Ladas | | 68,140 | | 0 | | 8.15 | | 555,341 |
2011 share options
This disclosure relates to the share options granted to the directors on 6 September 2011. The absolute total shareholder return performance target applying to these options was fully satisfied resulting in full vesting of these options in 2014 (see page 69 for targets and level of performance).
| | | | | | | | |
| Director | | Number of Shares subject to option (a) | | Share price on vesting date £ (b) | | Exercise price per Share £ (c) | | Value of Shares £ a x (b-c) |
J A J van Beurden | | 485,981 | | 7.49 | | 2.14 | | 2,602,428 |
D D W Gardiner | | 366,434 | | 7.49 | | 2.14 | | 1,962,254 |
C A Ladas | | 232,056 | | 7.49 | | 2.14 | | 1,242,660 |
Note 5
The Company has agreed to make a contribution to Mr. Ladas’ pension when he retires which will be in addition to the usual Company pension contributions for the year of retirement. The level of contribution will reflect the extent to which Mr. Ladas’ US state benefits are reduced when he retires as a result of him being employed in the UK since 2008 and contributing to the UK social security system. In November 2012, it was estimated that the total amount payable would be less than £30,000.
Note 6
The benefits provided to the directors are described on page 72.
b) Incentives granted to the directors during the year
| | | | | | | | | | | | | | | | |
| Director | | Plan | | % of Salary
Awarded | | Nature of Interest | | Exercise Price
per Share £ | | Number of Shares
subject to
Option/Award | | Face Value of
Options/Award
£ | | Performance
Conditions
(see notes) | | Date of Grant/ Award |
J A J van Beurden | | Share Option Plan | | 100 | | Share option | | 5.24 | | 90,419 | | 473,796 | | Condition 1 | | 14/08/2014 |
| | | EIP | | 101.06 | | Contingent share award | | 0.001 | | 86,549 | | 464,898 | | Condition 2 | | 08/05/2014 |
D D W Gardiner | | Share Option Plan | | 100 | | Share option | | 5.24 | | 63,490 | | 332,688 | | Condition 1 | | 14/08/2014 |
| | | EIP | | 101.06 | | Contingent share award | | 0.001 | | 60,773 | | 326,442 | | Condition 2 | | 08/05/2014 |
C A Ladas | | Share Option Plan | | 100 | | Share option | | 5.24 | | 38,971 | | 204,208 | | Condition 1 | | 14/08/2014 |
| | | EIP | | 101.06 | | Contingent share award | | 0.001 | | 37,767 | | 202,865 | | Condition 2 | | 08/05/2014 |
Notes:
| 1. | | The share price on the date of grant of the share options was £5.24 and this value has been used to calculate the face value. |
| 2. | | The average share price used to calculate EIP Element B awards was based on the 30-day average finishing on 27 December 2013; which was £5.3715 and this has been used to calculate the face value. |
| 3. | | The performance period for the share options finishes on the third anniversary of the grant date and the forfeiture period for the EIP awards finishes at the end of the 2015 financial year. |
| 4. | | Condition 1 refers to the Absolute TSR condition and Condition 2 refers to the risk of forfeiture both of which are described on page 69. |
| 5. | | The level of vesting for minimum performance is 25% for share options and 25% for EIP Element B. |
| | |
| 74 | | CSR plc Annual Report and Financial Statements 2014 |
c) Payments for loss of office and payments to past directors
No such payments were made in respect of the 2014 financial year.
d) Performance graph and table of CEO remuneration
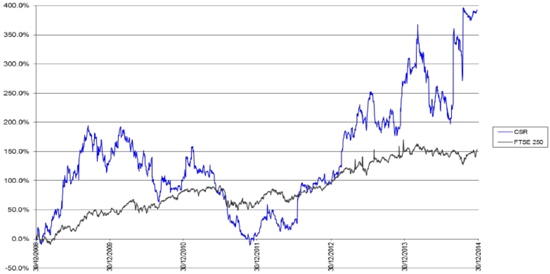
The Company has selected the FTSE 250 Index as the broad equity market index against which to compare the Company’s total shareholder return performance as throughout the measurement period the Company has spent the majority of this period as a constituent of this Index.
CEO Remuneration
| | | | | | | | | | | | |
Element | | 2009 | | 2010 | | 2011 | | 2012 | | 2013 | | 2014 |
| | | | | | |
Total remuneration (single figure for the year) | | £795,410 | | £1,217,893 | | £583,875 | | £1,712,878 | | £1,415,046 | | £4,446,731 |
| | | | | | |
Annual bonus (% of maximum opportunity) | | 92.70% | | 79.43% | | 21.58% | | 91.55% | | 80.85% | | 29.77% |
| | | | | | |
| Long-term incentives (% of maximum number of shares capable of vesting) | | 0 | | 0 | | 0 | | 49.78% | | 100% | | 100% |
e) Percentage change in CEO remuneration
The table below shows the percentage change in the CEO’s remuneration between financial years compared to the percentage change in remuneration for UK employees who were employed at the start of the 2013 financial year through to the end of the 2014 financial year. The UK group has been chosen because CSR is headquartered, and employs around one-third of its employees, in the UK. Typical salary inflation in some other CSR locations is materially higher than the UK, which would distort the comparison.
Remuneration for these purposes includes the following elements:
| — | | annual bonus (EIP Element A for the CEO). |
| | | | |
Element | | Percentage Change from 2013 Financial Year to 2014 Financial Year |
| | | CEO | | Employee average |
Salary | | 4.76% | | 4.19% |
Taxable Benefits | | -0.72% | | 0.38% |
Annual Bonus | | -62.07% | | -65.15% |
Remuneration reportcontinued
f) Relative importance of spend on pay
The table below shows:
| — | | total remuneration (salary, bonus, benefits, employer pension contributions and share-based payment charges incurred by the Company) paid to or receivable by all employees of the Company; and |
| — | | total distributions to shareholders by way of dividend and share buy back. |
| | | | | | |
| | | 2013 | | | | 2014 |
Remuneration paid to employees | | $276,139,000 | | | | $231,115,000 |
Distributions to shareholders | | $90,339,000 | | | | $70,282,000 |
g) The Committee and its advisors
The Committee members in 2014 were Chris Stone, Anthony Carlisle, Walker Boyd and Ron Mackintosh, all of whom are independent non-executive directors within the definition of the UK Corporate Governance Code published by the Financial Reporting Council (the ‘Code’). Anthony Carlisle stood down as a director on 31 December 2014. Representatives of PricewaterhouseCoopers LLP (PwC) attend meetings of the Committee by invitation as do members of the executive management team where this is pertinent to matters under consideration. The Company Secretary acts as secretary to the Committee.
For the purposes of the Code, none of the members of the Committee has any personal financial interest (other than as shareholders), conflicts of interests arising from other directorships or day-to-day involvement in running the business of the Company.
The Board determines the remuneration of the non-executive directors. No director plays a part in any decision about their own remuneration.
The Committee’s agreed terms of reference are available on the Company’s website (www.csr.com) and on request from the Company Secretary.
External advice
The Committee received external advice in 2014 from PwC and Slaughter and May. The Committee appointed and agreed the fees for the advice provided to it in relation to executive remuneration. The main advisor to the Committee is currently PwC; who were appointed during 2011, following a competitive tender. Terms of engagement are available from the Company Secretary.
The advice provided is summarised below:
| | | | | | |
| Advisor | | Advice | | 2014 Fees £ | | |
PwC | | Provided advice to the Committee on : | | 80,000 | | |
| | — levels and satisfaction of performance conditions for the incentive arrangements; | | | | |
| | — corporate governance; | | | | |
| | — dilution and funding of share plans; | | | | |
| | — preparation of the Remuneration Report; and | | | | |
| | — benchmarking of total remuneration in respect of the Company and its comparator group | | | | |
| | | |
| | The Committee has satisfied itself that the advice received from PwC was objective and independent. While PwC provides advice to the Company on unrelated matters, the team providing executive remuneration advice to the Committee works from a different office and has no involvement with the other work carried out by PwC. In addition, PwC is a signatory to and follows the provision of the Remuneration Consultants Code. | | | | |
| | | |
| | PwC worked with the Company to implement the Committee’s policies. | | | | |
| | | |
| | | PwC provided various other services to the Company including tax compliance services, international tax advice and consulting services. | | | | |
| Slaughter and May | | Provided advice to the Committee on compliance with the legislation, regulations and guidance relating to the format and content of the Remuneration Report. | | | | |
| | | Slaughter and May act as legal advisors to the Company and advise on a range of matters affecting the Company’s business. | | | | |
h) Statement of voting at 2014 AGM
The table below shows the voting outcome at the May 2014 AGM for the approval of the Directors’ Remuneration Policy and the 2013 annual report on remuneration.
| | | | | | |
| | | For (as % of votes cast) | | Against (as % of votes cast) | | Number of votes withheld |
To approve the Directors’ Remuneration Policy | | 93.71 | | 6.29 | | 399,645 |
To approve the 2013 annual report on remuneration | | 94.75 | | 5.25 | | 1,974,498 |
| | |
| 76 | | CSR plc Annual Report and Financial Statements 2014 |
Notice periods
The table below shows the contract dates together with notice periods for the directors, and dates of letters of appointment in the case of the non-executive directors:
| | | | | | |
Director | | Date of Service Contract | | Notice Period in Months from Company | | Notice Period in Months to Company |
Executive | | | | | | |
J A J van Beurden | | 29 September 2007 | | 12 | | 6 |
D D W Gardiner | | 27 February 2008 | | 12 | | 6 |
C A Ladas | | 12 December 2007 | | 12 | | 6 |
Non-Executive | | Date of letter of appointment | | | | |
R W Mackintosh | | 2 May 2007 | | 6 | | 6 |
A E C G Carlisle* | | 1 July 2005 | | 3 | | 3 |
L Gerzberg | | 31 August 2011 | | 1 | | 1 |
C M R Stone | | 16 July 2012 | | 3 | | 3 |
T M Vega | | 27 October 2010 | | 3 | | 3 |
W G Boyd | | 6 December 2013 | | 3 | | 3 |
* Mr. Carlisle stood down as a director on 31 December 2014
Payment for loss of office
The service agreement for Mr. van Beurden was entered into prior to his formal appointment in 2007. The service agreement contains a provision concerning payment on loss of office. If CSR terminates Mr. van Beurden’s employment (other than for a reason justifying immediate dismissal), then, as part of the payments owing on termination, a sum equal to the bonus as reported in the most recently preceding annual report of CSR will be paid.
If any executive director’s contract is terminated, the Committee will determine such mitigation as it considers fair and reasonable in each case. There are no agreements between CSR and the directors which provide for compensation for loss of office or employment that occurs because of a takeover bid.
This report was approved by the Board of Directors and signed on its behalf by:
Chris Stone
Chairman, Remuneration Committee
4 March 2015

Other statutory information
The directors submit this Annual Report and the audited consolidated financial statements of the Company and its subsidiaries for the 52 week period ended 26 December 2014.
Activities and business review
CSR designs and develops semiconductor integrated circuits, including platforms, and software focused on the five areas in our Core business group – Automotive Infotainment, Voice & Music, Document Imaging, Bluetooth Smart and the nascent market of Indoor Location. We focus on our chosen end markets, and aim to use our range of technologies to deliver integrated and differentiated technology platforms, in order to achieve sustainable growth with higher margins and returns.
More detailed information on the principal activities of CSR plc and its subsidiaries, together with a review of the businesses along with other information that fulfils the requirements of the Strategic Report are set out on pages 8 to 35, including a description of the principal risks and uncertainties facing the Group which are set out on pages 32 to 35 and risk factors on pages 43 to 51. The use of financial instruments is covered within the Strategic Report on page 31 and in notes 19 and 31 to the consolidated financial statements. Details of the subsidiaries of the Company are set out in note 41 to the consolidated financial statements. The Group also operates through branches outside of the UK.
Financial results
For a discussion of our financial results, please refer to the Strategic Report on pages 18 to 31.
Qualcomm Transaction
On 15 October 2014, the boards of CSR plc and Qualcomm Incorporated (‘Qualcomm’) announced that an agreement had been reached regarding the terms of a recommended cash offer for the Company, whereby Qualcomm Global Trading Pte. Ltd. (‘QGT’), an indirect, wholly owned subsidiary of Qualcomm, will acquire the entire issued and to be issued share capital of CSR (the ‘Qualcomm Transaction’). As announced, the Qualcomm Transaction will be implemented by way of a court-sanctioned scheme of arrangement under Part 26 of the Companies Act 2006 (the ‘Scheme’), pursuant to which the Scheme Shares (as defined in the Scheme Document, which is defined below) will be cancelled and extinguished by way of a reduction in the capital of CSR plc, and QGT (and/or its nominee(s)) will acquire newly issued shares paid up out of the reserve arising as a result of the cancellation of the Scheme Shares. On 12 November 2014, the Company published the Scheme document (the ‘Scheme Document’) which set out the detailed terms of the Scheme.
The court meeting and general meeting held on 4 December 2014, resulted in the approval of the Scheme and the passing of a special resolution to approve certain matters relating to the Scheme and the Qualcomm Transaction, including: the amendment of the Company’s Articles of Association, with effect from the date of the meetings, and the re-registration of the Company as a private company, the reduction of the share capital of CSR by cancelling the Scheme Shares (as defined in the Scheme Document) and the issue of new shares to QGT and/or its nominees, which will take effect on the dates indicated in the Scheme Document.
Under the terms of the Qualcomm Transaction, the Scheme Shareholders (as defined in the Scheme Document) on the Company’s register of members at 6.00 p.m. on the day before the Effective Date (as defined in the Scheme Document) will be entitled to receive 900 pence in cash for each CSR ordinary share held by them at that time.
The Qualcomm Transaction is subject to a number of regulatory and other conditions, which are set out in full in Part Three of the Scheme Document, and which include obtaining clearance from the relevant competition authorities in China, Germany, Japan, South Korea, Taiwan and the United States. Clearance has been obtained in respect of the United States, as announced on 15 December 2014, and Germany, as announced on 2 February 2015.It is expected that the Scheme will become effective by the late summer 2015.
As previously advised, the Board does not intend to pay, or to recommend for payment, any further dividends at this time.
Environmental information
The Strategic Report on pages 8 to 42 includes the greenhouse gas emissions disclosures required by the Companies Act 2006 (Strategic Report and Directors’ Report) Regulations 2013. Please refer to page 42 of the Strategic Report for a description of the measures the Company has been implementing in connection with Rule 13p-1 adopted by the SEC under the Securities and Exchange Act of 1934 (the ‘Exchange Act’), which requires companies registered under the Exchange Act to publicly disclose their use of conflict minerals that originate in the Democratic Republic of the Congo or an adjoining country.
Future development
Our objective is to develop higher margin platforms in markets that are fast growing, which we believe will enable us to generate sustainable revenue growth and increasing profitability. For a further discussion of the Board’s strategy, please refer to pages 8 to 15.
Share capital
The Company’s authorised and issued share capital comprises a single class of share which is ordinary shares with a nominal value of 0.1 pence per share. Details of the authorised and issued share capital can be found in note 23 to the consolidated financial statements. The Company’s ordinary shares are listed on the premium segment of the Official List maintained by the UK Listing Authority. Following the acquisition of Zoran Corporation in 2011, CSR also has an American Depositary Receipt programme, with American Depositary Shares (‘ADSs’) listed on the NASDAQ. The rights and obligations attaching to the Company’s ordinary shares are set out in the Company’s Articles of Association, copies of which can be obtained from Companies House in the UK or by writing to the Company Secretary and are available from the US Securities and Exchange Commission website at www.sec.gov. A summary of certain provisions of the Company’s Memorandum and Articles of Association, as adopted on 4 December 2014, are set out on pages 140 to 143 in Corporate and Share Information.
The Board is committed to maximising shareholder value and regularly reviews the efficiency of its balance sheet and the expected ongoing cash requirements of the business. In light of this, at the time of announcing its annual results for the financial year 2013, the Company confirmed its intention to undertake a buyback of its ordinary shares of up to $50 million. The Board believed that the proposed share buyback would result in an increase in earnings per share and would be in the best interests of shareholders generally.
Pursuant to the general authorities obtained from shareholders at the Annual General Meetings held on 22 May 2013 and 21 May 2014, in the period from 1 May 2014 to 30 June 2014, the Company completed the purchase of 5,118,026 ordinary shares in the open market, all of which were cancelled. As at the close of the share buyback on 30 June 2014, the full $50 million had been expended.
| | |
| 78 | | CSR plc Annual Report and Financial Statements 2014 |
For the buyback that commenced in May 2014, the Company entered into arrangements with J.P. Morgan Securities plc such that the Company purchased shares from J.P. Morgan Securities plc who had itself, acting as principal, first made market purchases of such shares. J.P. Morgan Securities plc acted as an independent third party, which allowed the buyback to continue to be implemented following the end of the second financial quarter for the 2014 financial year, during what would otherwise have been a prohibited period of the Company.
In June 2014, the Board authorised a further share buyback of up to $20 million, due to the Board’s continued focus on maximising shareholder value. As with the previous 2014 share buyback, the Board believed that this $20 million share buyback would result in an increase in earnings per share and would be in the best interests of shareholders generally. Purchases were made in the open market between 15 July 2014 and 27 August 2014 under a general authority provided by shareholders at the 2014 Annual General Meeting. A total of approximately $11.5 million, excluding commission, was expended and as at 27 August 2014, being the last day on which shares were acquired under the authority, 1,242,702 ordinary shares had been repurchased, all of which were cancelled. After this date, the buyback was suspended, due to the announcement on 28 August 2014 of the approach to the Company by Microchip Technology Inc. with regards to a possible offer for CSR. On 15 October 2014, as mentioned above, the offer from Qualcomm was announced, and in view of this and as previously advised, the Board does not intend to undertake any further share buybacks prior to the completion of the Qualcomm Transaction.
As at 26 December 2014, 6,360,728 ordinary shares of 0.1 pence had been repurchased by the Company during the 52 week period ended 26 December 2014 at an average price of 574 pence per ordinary share. This represented 3.83% of the Company’s issued share capital (excluding treasury shares) as at close on 26 December 2014.
During 2014, a total of 1,068,022 ordinary shares were transferred out of treasury to satisfy the allotment of ordinary shares on the exercise of options under the Company’s various share plans. As at 26 December 2014, the Company held 19,855,906 ordinary shares in treasury. The issued share capital as at 16 March 2015 was 166,331,652 ordinary shares and 19,808,940 ordinary shares were held in treasury.
The general authority under which CSR purchases its ordinary shares in the open market is usually renewed on an annual basis at the Annual General Meeting. It remains the Board’s intention to seek approval for renewal of the general authority at the forthcoming Annual General Meeting, being held on 20 May 2015.
For information on the capital structure of the Company, please refer to Corporate and Share Information on page 134.
There are no restrictions on the voting rights attaching to the Company’s ordinary shares. No person holds securities in the Company carrying special rights with regard to control of the Company. The Company is not aware of any agreements between holders of securities that may result in restrictions on the transfer of securities or on voting rights. For information on certain restrictions on the transfer of the Company’s ordinary shares pursuant to the Articles of Association, please refer to page 141. Unless expressly stated to the contrary in the Articles of Association of the Company, the Company’s Articles of Association may be amended by special resolution of the Company’s shareholders. A summary of the Company’s Articles of Association are set out on pages 140 to 143.
During the 52 week period ended 26 December 2014, options were exercised pursuant to the Company’s share schemes. The number of shares allotted and the consideration received in respect of such allotments are detailed in note 23 of the consolidated financial statements.
ABI Guidelines relating to directors’ power to allot share capital and disapply pre-emption rights are reflected in Resolution 14 (the ‘Section 551 Authority’) and Resolution 15 respectively, in the Notice of Meeting.
The directors propose (Paragraph (A) of Resolution 14 in the Notice of Meeting) to renew the authority granted at the 2014 Annual General Meeting to authorise the directors to allot equity or grant rights in respect of equity shares up to an aggregate nominal value of £55,443 (representing approximately one-third of the ordinary shares issued as at the latest practicable date).
In accordance with ABI Guidelines, the directors also propose (Paragraph (B) of Resolution 14 in the Notice of Meeting) to renew the authority granted at the 2014 Annual General Meeting to authorise the directors to allot or grant rights in respect of equity shares representing two-thirds of the Company’s issued share capital as at the latest practicable date (as reduced by the nominal amount of any allotment or grant made under paragraph (A) of Resolution 14 in the case of a compensatory rights issue).
This authority, if renewed, will represent in total an aggregate nominal value of £110,886. This Section 551 Authority, if approved, will expire at the conclusion of the Annual General Meeting to be held in 2016 or 20 August 2016, whichever is the earlier.
The limited power granted to the directors at the 2014 Annual General Meeting to allot equity shares for cash other than pro-rata to existing shareholders expires on the conclusion of this year’s Annual General Meeting to be held on 20 May 2015. Subject to renewal of the Section 551 Authority, the directors recommend (Resolution 15 in the Notice of Meeting) that this authority also be renewed so as to give the directors the ability (until the earlier of 20 August 2016, or the conclusion of the Annual General Meeting to be held in 2016) to issue equity shares for cash other than pro-rata to existing shareholders, in connection with a rights issue or up to a limit of 5% of the ordinary shares issued at 16 March 2015. The directors have no present intention to issue equity shares for cash other than pursuant to the Company’s employee share plans.
The directors recommend that shareholders vote in favour of Resolutions 14 and 15 to maintain the Company’s flexibility in relation to future share issues, including any issues to finance business opportunities should appropriate circumstances arise.
A Special Resolution will be proposed (Resolution 16 in the Notice of Meeting) to renew the directors’ limited authority to repurchase ordinary shares in the market. This authority will be limited to a maximum of 16,633,100 ordinary shares (representing 10% of the Company’s issued share capital as at the latest practicable date) and also sets the minimum and maximum prices which may be paid.
The authority contained in the Special Resolution will expire at the earlier of 20 August 2016, or the conclusion of the Annual General Meeting to be held in 2016. It is the current intention of the directors to renew this authority annually.
The directors believe it is advantageous for the Company to continue to have the flexibility to make market purchases of its own shares. As at 26 December 2014, the Company had 19,855,906 ordinary shares held in treasury. As at 16 March 2015, the Company had 19,808,940 ordinary shares held in treasury. In the event that additional shares are purchased, they would either be cancelled (and the number in issue would be reduced accordingly) or, subject to the legislation referred to below, retained as treasury shares. The directors will only make purchases after consideration of the possible effect on earnings per share, the long-term benefits to shareholders and in consultation with advisers. As previously advised, and as mentioned above, the Board does not intend to undertake any further share buybacks prior to the completion of the Qualcomm Transaction.
Other statutory informationcontinued
The Companies (Acquisition of Own Shares) (Treasury Shares) Regulations 2003 allow shares repurchased by the Company to be held as treasury shares that may be cancelled, sold for cash or used for the purpose of employee share schemes.
Notice required for shareholder meetings
The Shareholders Rights Directive was implemented in the UK by the Companies (Shareholders’ Rights) Regulations 2009 on 3 August 2009. The Regulations implementing this Directive increase the notice period for general meetings of the Company to 21 days, unless shareholders agree to a shorter notice period. On the basis of a resolution passed at the 2014 Annual General Meeting, the Company is currently able to call general meetings (other than an Annual General Meeting) on 14 days’ notice. The Company would like to preserve this ability and Resolution 17 seeks such approval. The approval will be effective until the Company’s next Annual General Meeting, when it is intended that a similar resolution will be proposed. In accordance with the Directive, the Company will offer an electronic voting facility for a general meeting called on 14 days’ notice.
Employee Benefit Trust
The CSR Employee Benefit Trust (the ‘EBT’) was established in 2007 to provide a mechanism for employee share incentives to be satisfied using shares purchased by the EBT in the open market.
During 2014, 776,228 ordinary shares in CSR plc were acquired by the EBT at an average price per ordinary share of 578 pence and for a total consideration of approximately $7.6 million. As at 26 December 2014, the EBT held a total of 3,552,217 ordinary shares in CSR plc representing 2.14% of the issued share capital (excluding treasury shares) at the date of this report. As at 27 December 2013, the EBT held 2,775,989 ordinary shares.
As participants in the employee share incentive plans, the executive directors of the Company are potential beneficiaries of the shares held by the EBT and are therefore regarded for the purposes of the Companies Act as being interested in ordinary shares held by the EBT.
Employee share incentive plans
For information on the Company’s share incentive plans please see note 29 to the consolidated financial statements.
Change of control
All of the Company’s employee share plans contain provisions relating to a change of control of the Company following a takeover. Outstanding options and awards would, subject to satisfaction of applicable performance conditions and certain rules of the particular schemes, normally vest and become exercisable on a change of control (subject to a consideration as to whether a pro-rata adjustment should be made for the time elapsed since the grant was made, to be determined at the discretion of the Remuneration Committee). The information on how the employee share plans will be treated under the Qualcomm Transaction is set out in the Scheme Document.
Directors
Details of the directors who served during the year are contained on page 55 of the Directors’ Report – Governance. Biographies of the directors in office at 26 December 2014, other than Anthony Carlisle, who stood down on 31 December 2014, are on pages 52 and 53. The directors are empowered to exercise all the powers of the Company subject to any restrictions in the Articles of Association, any special resolution and the Companies Act 2006.
The Company’s Articles of Association state that directors shall retire from office and may offer themselves for re-appointment when they have been appointed since the last Annual General Meeting, held office in the preceding two Annual General Meetings and did not retire at either of them or have been in office for a continuous period of nine years or more at the date of the meeting.
The UK Corporate Governance Code requires all directors of FTSE 350 companies to be subject to annual election by shareholders. Accordingly, all the directors will be retiring at the Annual General Meeting and offering themselves for re-election. This is further explained in the Notice of Meeting which is a separate document issued to shareholders.
In respect of the Qualcomm Transaction and as mentioned in the Scheme Document, the directors will resign on the Effective Date (as defined in the Scheme Document).
Directors’ interests in shares
The directors in office at 26 December 2014 and their connected persons had the interests in the shares of the Company shown in the table below.
The interests of the directors in the options of the Company are detailed in the Remuneration Report on page 70.
The holdings shown below do not include the ordinary shares held by the EBT in which the executive directors are potential beneficiaries, as disclosed earlier.
| | | | | | | | | | | | | | | | |
| | | 26 December 2014 | | | 27 December 2013 | |
| Directors’ interests in shares | | Ordinary shares | | | ADSs1 | | | Ordinary shares | | | ADSs1 | |
| | | | |
W G Boyd | | | 7,000 | | | | | | | | 7,000 | | | | | |
| | | | |
A E C G Carlisle2 | | | 19,000 | | | | | | | | 19,000 | | | | | |
| | | | |
D D W Gardiner3 | | | 292,702 | | | | | | | | 235,591 | | | | | |
| | | | |
L Gerzberg | | | | | | | 7,960 | | | | | | | | 7,960 | |
| | | | |
C A Ladas | | | 82,341 | | | | | | | | 43,117 | | | | | |
| | | | |
R W Mackintosh | | | 106,000 | | | | | | | | 112,115 | | | | | |
| | | | |
C M R Stone | | | 12,286 | | | | | | | | 12,286 | | | | | |
| | | | |
J A J van Beurden | | | 324,173 | | | | | | | | 245,290 | | | | | |
| | | | |
T M Vega | | | | | | | 750 | | | | | | | | 750 | |
| 1 | Each ADS represents four ordinary shares in CSR plc. |
| 2 | Mr. Carlisle stood down from the Board on 31 December 2014. |
| 3 | On 19 December 2014, Mr. Gardiner pledged 23,580 ordinary shares in the Company. Following the pledge, Mr. Gardiner’s holding in the Company remained unchanged at 292,702 ordinary shares. |
| | |
| 80 | | CSR plc Annual Report and Financial Statements 2014 |
There were no changes in the directors’ shareholdings between 26 December 2014 and 16 March 2015.
Conflicts of interests
The Company has procedures in place to deal with conflicts of interests and believes that procedures are operated efficiently.
Substantial shareholdings
As at 26 December 2014, the Company had received the notifications shown in the table below of substantial interests in the total voting rights of the Company, disclosable to the Company under the Disclosure and Transparency Rules. No changes in the interests disclosed to the Company have been notified between 26 December 2014 and 16 March 2015 other than as provided below.
| | | | | | | | |
| Shareholder3 | | Disclosed holding | | | % of issued Ordinary share capital | |
| | |
Schroders plc and its subsidiaries1 | | | 13,870,832 | | | | 8.35 | |
| | |
Old Mutual Plc | | | 9,377,508 | | | | 5.65 | |
| | |
Majedie Asset Management Limited | | | 9,305,617 | | | | 5.60 | |
| | |
Norges Bank2 | | | 8,778,971 | | | | 5.29 | |
| 1 | On 17 February 2015, the Company received a notification from Schroders plc, pursuant to the FCA’s Disclosure and Transparency Rules, advising that their interests in the total voting rights of the Company were 8,235,079 ordinary shares, being 4.95% of the issued share capital (excluding treasury shares) at the date of the notification. |
| 2 | On 13 March 2015, the Company received a notification from Norges Bank, pursuant to the FCA’s Disclosure and Transparency Rules, advising that their interests in the total voting rights of the Company were 8,136,021 ordinary shares, being 4.89% of the issued share capital (excluding treasury shares) at the date of the notification |
| 3 | On 3 March 2015, the Company received a notification from Morgan Stanley (Institutional Securities Group and Global Wealth Management), pursuant to the FCA’s Disclosure and Transparency Rules, advising that their interests in the total voting rights of the Company were 13,436,904 ordinary shares, being 8.08% of the issued share capital (excluding treasury shares) at the date of the notification. |
Disclosures required under UK Listing Rule 9.8.4
In conjunction with the release on 24 July 2014 of CSR’s second quarter results for the 13 week financial period and half year results for the 26 week financial period ended 27 June 2014, the Company made certain public statements. Collectively, these statements, shown below, constitute a profit forecast in respect of the second half of the 52 week financial period ending 26 December 2014. These statements were reproduced and discussed in the Scheme Document published on 12 November 2014, in accordance with the City Code on Takeovers and Mergers.
The statements were:
| — | | “…we expect Core to return to year-on-year growth during H2 2014 and 2015”; |
| — | | “…we expect 2014 Legacy revenue to decline by around 70% compared to the 2013 financial year”; and |
| — | | “…we expect our underlying operating profit margin to be within the previously stated target of mid-teens during H2 2014”. |
In the Group’s final results for the 52 week financial period ended 26 December 2014 the actual results were:
| — | | Core revenue was $374.9 million for the 26 week financial period ended 26 December 2014 compared to $347.3 million for the 26 week financial period ended 27 December 2013, a year-on-year increase of $27.5 million; |
| — | | Legacy revenue was $71.8 million for the 2014 financial year and $238.4 million for the 2013 financial year, a decline of 70% from 2013 to 2014; and |
| — | | Underlying operating profit margin was for H2 2014 was 17.2%. |
Going concern
The consolidated financial statements have been prepared on the going concern basis. The directors have considered future revenue and cash forecasts in their consideration of going concern. The issues surrounding going concern are discussed regularly by the Board and were evaluated as part of the Group’s longer-term plans.
Note 31 of the consolidated financial statements include the Group’s objectives, policies and processes for managing its capital; its financial risk management objectives; details of the financial instruments and hedging activities; and its exposure to credit risk. Management is currently of the opinion that the Group has adequate financial resources and a robust policy towards treasury risk and cash flow management. The Group had $283.2 million of cash, cash equivalents and treasury deposits as at 26 December 2014 and no debt liabilities.
The directors believe that the Group is adequately placed to manage its business risks successfully despite the current uncertain economic outlook and challenging macro economic conditions.
After considering the above factors, the directors have a reasonable expectation that the Company and the Group have adequate resources to continue in operational existence for the foreseeable future. Accordingly, they continue to adopt the going concern basis in preparing the financial statements.
Other statutory informationcontinued
Directors’ responsibility statement
Company law requires the directors to prepare financial statements for each financial year. Under that law the directors are required to prepare the group financial statements in accordance with International Financial Reporting Standards (IFRSs) as adopted by the European Union and Article 4 of the IAS Regulation and have also chosen to prepare the parent company financial statements under IFRSs as adopted by the European Union. The Group financial statements are also prepared in accordance with the IFRSs as issued by the International Accounting Standards Board. Under company law, the directors must not approve the financial statements unless they are satisfied that they give a true and fair view of the state of affairs of the Company and of the profit or loss of the Company for that period. In preparing these financial statements, International Accounting Standard 1 requires that directors:
| — | | properly select and apply accounting policies; |
| — | | present information, including accounting policies, in a manner that provides relevant, reliable, comparable and understandable information; |
| — | | provide additional disclosures when compliance with the specific requirements in IFRSs are insufficient to enable users to understand the impact of particular transactions, other events and conditions on the entity’s financial position and financial performance; and |
| — | | make an assessment of the company’s ability to continue as a going concern. |
The directors are responsible for keeping adequate accounting records that are sufficient to show and explain the Company’s transactions and disclose with reasonable accuracy at any time the financial position of the Company and enable them to ensure that the financial statements comply with the Companies Act 2006. They are also responsible for safeguarding the assets of the Company and hence for taking reasonable steps for the prevention and detection of fraud and other irregularities.
The directors are responsible for the maintenance and integrity of the corporate and financial information included on the Company’s website. Legislation in the United Kingdom governing the preparation and dissemination of financial statements may differ from legislation in other jurisdictions.
Responsibility statement
We confirm that to the best of our knowledge:
| — | | the financial statements, prepared in accordance with International Financial Reporting Standards as adopted by the European Union, give a true and fair view of the assets, liabilities, financial position and profit or loss of the Company and the undertakings included in the consolidation taken as a whole; |
| — | | the Strategic Report includes a fair review of the development and performance of the business and the position of the Company and the undertakings included in the consolidation taken as a whole, together with a description of the principal risks and uncertainties that they face; and |
| — | | the annual report and financial statements, taken as a whole, are fair, balanced and understandable and provide the information necessary for shareholders to assess the Company’s performance, business model and strategy. |
Auditors
Deloitte LLP are the Company’s auditors and have expressed their willingness to continue in the office of auditors and therefore, in accordance with Section 489 of the Companies Act 2006, a resolution for their reappointment will be proposed at the forthcoming Annual General Meeting.
By Order of the Board
Brett Gladden
Company Secretary
4 March 20151
| 1 | Certain share and share capital information has been updated within this report to 16 March 2015 to reflect changes, arising between signing and the latest practicable date prior to publication. |
| | |
| 82 | | CSR plc Annual Report and Financial Statements 2014 |
Report of independent registered public accounting firm
To the Board of Directors and Shareholders of CSR plc
We have audited the accompanying consolidated balance sheets of CSR plc and subsidiaries (the “Company”) as at 26 December 2014 and 27 December 2013 and the related consolidated income statements, consolidated statements of comprehensive income, consolidated statements of changes in equity and consolidated cash flow statements for each of the 52 week periods ended 26 December 2014, 27 December 2013 and 28 December 2012. These consolidated financial statements are the responsibility of the Company’s management. Our responsibility is to express an opinion on these financial statements based on our audits.
We conducted our audits in accordance with standards of the Public Company Accounting Oversight Board (United States). Those standards require that we plan and perform the audit to obtain reasonable assurance about whether the financial statements are free of material misstatement. An audit includes examining, on a test basis, evidence supporting the amounts and disclosures in the financial statements. An audit also includes assessing the accounting principles used and significant estimates made by management, as well as evaluating the overall financial statement presentation. We believe that our audits provide a reasonable basis for our opinion.
In our opinion, such consolidated financial statements present fairly, in all material respects, the financial position of CSR plc and subsidiaries as at
26 December 2014 and 27 December 2013 and the results of their operations and their cash flows for each of the 52 week periods ended
26 December 2014, 27 December 2013 and 28 December 2012, in conformity with International Financial Reporting Standards (“IFRS”) as issued by the International Accounting Standards Board (“IASB”).
We have also audited, in accordance with the standards of the Public Company Accounting Oversight Board (United States), the Company’s internal control over financial reporting as at 27 December 2013, based on the criteria established in Internal Control – Integrated Framework (2013) issued by the Committee of Sponsoring Organizations of the Treadway Commission and our report dated 4 March 2015 expressed an unqualified opinion on the Company’s internal control over financial reporting.
Deloitte LLP
London, United Kingdom
4 March 2015
Consolidated Income Statement
| | | | | | | | | | | | | | | | |
| | | | | | 52 weeks ended | | | 52 weeks ended | | | 52 weeks ended | |
| | | | | | 26 December 2014 | | | 27 December 2013 | | | 28 December 2012 | |
| | | Notes | | | $’000 | | | $’000 | | | $’000 | |
| | | | |
Revenue | | | 5 | | | | 774,773 | | | | 960,710 | | | | 1,025,356 | |
| | | | |
Cost of sales | | | | | | | (324,875 | ) | | | (465,443 | ) | | | (516,279 | ) |
| | | | |
Gross profit | | | | | | | 449,898 | | | | 495,267 | | | | 509,077 | |
| | | | |
Research and development (‘R&D’) expenses | | | | | | | (240,921 | ) | | | (273,026 | ) | | | (290,346 | ) |
| | | | |
Sales, general and administrative (‘SG&A’) expenses | | | | | | | (150,208 | ) | | | (193,731 | ) | | | (237,996 | ) |
| | | | |
Non-current asset impairment reversal (charges) | | | 13, 14, 15, 33 | | | | 23,267 | | | | (76,896 | ) | | | – | |
| | | | |
Gain on disposal of Imaging IP | | | 33 | | | | 14,931 | | | | – | | | | – | |
| | | | |
Gain on disposal of development operations | | | 35 | | | | – | | | | – | | | | 127,178 | |
| | | | |
Operating profit (loss) | | | | | | | 96,967 | | | | (48,386 | ) | | | 107,913 | |
| | | | |
Investment income | | | | | | | 731 | | | | 920 | | | | 1,175 | |
| | | | |
Exchange losses | | | | | | | (1,665 | ) | | | (625 | ) | | | (395 | ) |
| | | | |
Finance costs | | | 9 | | | | (2,200 | ) | | | (4,368 | ) | | | (6,711 | ) |
| | | | |
Profit (loss) before tax | | | | | | | 93,833 | | | | (52,459 | ) | | | 101,982 | |
| | | | |
Tax | | | 11 | | | | 2,993 | | | | 6,130 | | | | (50,749 | ) |
| | | | |
Profit (loss) for the period | | | 6 | | | | 96,826 | | | | (46,329 | ) | | | 51,233 | |
| | | | |
Earnings (loss) per share | | | | | | | | | | | | | | | | |
| | | | |
Basic and diluted earnings (loss) | | | | | | | 96,826 | | | | (46,329 | ) | | | 51,233 | |
| | | | |
Number of shares (thousands) | | | | | | | | | | | | | | | | |
| | | | |
Basic weighted average number of shares | | | | | | | 165,146 | | | | 164,182 | | | | 197,239 | |
| | | | |
Effect of dilutive potential ordinary shares – employee share options | | | | | | | 10,434 | | | | – | | | | 5,993 | |
| | | | |
Diluted weighted average number of shares | | | | | | | 175,580 | | | | 164,182 | | | | 203,232 | |
| | | | |
| | | | | | | $ | | | | $ | | | | $ | |
| | | | |
Basic earnings (loss) per share | | | 12 | | | | 0.59 | | | | (0.28 | ) | | | 0.26 | |
| | | | |
Diluted earnings (loss) per share | | | 12 | | | | 0.55 | | | | (0.28 | ) | | | 0.25 | |
|
| The results are all derived from continuing operations. The profit for the period and the loss and profit for the prior periods are wholly attributable to equity holders of the parent company, CSR plc. | |
| | | | |
| Consolidated Statement of Comprehensive Income | | | | | | | | | | | | | | | | |
| | | | |
| | | | | | 52 weeks ended | | | 52 weeks ended | | | 52 weeks ended | |
| | | | | | 26 December 2014 | | | 27 December 2013 | | | 28 December 2012 | |
| | | Notes | | | $’000 | | | $’000 | | | $’000 | |
| | | | |
Profit (loss) for the period | | | | | | | 96,826 | | | | (46,329 | ) | | | 51,233 | |
| | | | |
Items that may be reclassified subsequently to the income statement | | | | | | | | | | | | | | | | |
| | | | |
(Loss) gain on cash flow hedges | | | | | | | (7,391 | ) | | | 2,947 | | | | 4,935 | |
| | | | |
Net tax on cash flow hedges in statement of comprehensive income | | | | | | | 1,452 | | | | (686 | ) | | | (1,210 | ) |
| | | | |
Transferred to income statement in respect of cash flow hedges | | | | | | | (6,030 | ) | | | 570 | | | | (1,040 | ) |
| | | | |
Tax on items transferred from statement of comprehensive income | | | | | | | 1,341 | | | | (131 | ) | | | 253 | |
| | | | |
| | | | | | | | (10,628 | ) | | | 2,700 | | | | 2,938 | |
| | | | |
Items that will not be reclassified subsequently to the income statement | | | | | | | | | | | | | | | | |
| | | | |
Actuarial gains (losses) in defined benefit plans | | | 30 | | | | 155 | | | | 9 | | | | (919 | ) |
| | | | |
Pension scheme assets above the threshold | | | 30 | | | | (154 | ) | | | (424 | ) | | | (656 | ) |
| | | | |
| | | | | | | | 1 | | | | (415 | ) | | | (1,575 | ) |
| | | | |
Other comprehensive (loss) income for the period | | | | | | | (10,627 | ) | | | 2,285 | | | | 1,363 | |
| | | | |
Total comprehensive income (loss) for the period | | | | | | | 86,199 | | | | (44,044 | ) | | | 52,596 | |
The total comprehensive income (loss) for all periods is wholly attributable to equity holders of the parent company, CSR plc.
| | |
| 84 | | CSR plc Annual Report and Financial Statements 2014 |
Consolidated Balance Sheet
| | | | | | | | | | | | |
| | | | | | 26 December 2014 | | | 27 December 2013 | |
| | | Notes | | | $’000 | | | $’000 | |
| | | |
Non-current assets | | | | | | | | | | | | |
| | | |
Goodwill | | | 13 | | | | 133,331 | | | | 131,340 | |
| | | |
Other intangible assets | | | 14 | | | | 65,018 | | | | 72,286 | |
| | | |
Property, plant and equipment | | | 15 | | | | 43,921 | | | | 36,424 | |
| | | |
Investments | | | 31 | | | | 3,500 | | | | 2,500 | |
| | | |
Deferred tax asset | | | 11 | | | | 129,296 | | | | 109,181 | |
| | | |
Long-term asset | | | 16 | | | | – | | | | 31,006 | |
| | | |
| | | | | | | | 375,066 | | | | 382,737 | |
| | | |
Current assets | | | | | | | | | | | | |
| | | |
Inventories | | | 17 | | | | 56,420 | | | | 73,914 | |
| | | |
Derivative financial instruments | | | 19 | | | | – | | | | 6,171 | |
| | | |
Trade and other receivables | | | 18 | | | | 153,517 | | | | 111,146 | |
| | | |
Corporation tax debtor | | | | | | | 1,003 | | | | 3,031 | |
| | | |
Treasury deposits | | | 18 | | | | 75,357 | | | | 78,776 | |
| | | |
Cash and cash equivalents | | | 18 | | | | 207,843 | | | | 227,468 | |
| | | |
| | | | | | | | 494,140 | | | | 500,506 | |
| | | |
Total assets | | | | | | | 869,206 | | | | 883,243 | |
| | | |
Current liabilities | | | | | | | | | | | | |
| | | |
Trade and other payables | | | 20 | | | | 164,691 | | | | 199,079 | |
| | | |
Current tax liabilities | | | | | | | 6,953 | | | | 9,071 | |
| | | |
Derivative financial instruments | | | 19 | | | | 7,635 | | | | – | |
| | | |
Provisions | | | 22 | | | | 4,407 | | | | 10,064 | |
| | | |
| | | | | | | | 183,686 | | | | 218,214 | |
| | | |
Net current assets | | | | | | | 310,454 | | | | 282,292 | |
| | | |
Non-current liabilities | | | | | | | | | | | | |
| | | |
Trade and other payables | | | 20 | | | | 16,837 | | | | 27,997 | |
| | | |
Deferred tax liability | | | 11 | | | | 3,910 | | | | 4,948 | |
| | | |
Long-term provisions | | | 22 | | | | 817 | | | | 2,522 | |
| | | |
| | | | | | | | 21,564 | | | | 35,467 | |
| | | |
Total liabilities | | | | | | | 205,250 | | | | 253,681 | |
| | | |
Net assets | | | | | | | 663,956 | | | | 629,562 | |
| | | |
Equity | | | | | | | | | | | | |
| | | |
Share capital | | | 23 | | | | 326 | | | | 326 | |
| | | |
Share premium account | | | | | | | 558,616 | | | | 547,685 | |
| | | |
Capital redemption reserve | | | | | | | 1,043 | | | | 1,032 | |
| | | |
Merger reserve | | | | | | | 61,574 | | | | 61,574 | |
| | | |
Employee benefit trust reserve | | | | | | | (31,605 | ) | | | (23,974 | ) |
| | | |
Hedging reserve | | | | | | | (7,409 | ) | | | 6,012 | |
| | | |
Share-based payment reserve | | | | | | | 163,126 | | | | 142,327 | |
| | | |
Treasury shares | | | | | | | (122,322 | ) | | | (131,123 | ) |
| | | |
Retained earnings | | | | | | | 40,607 | | | | 25,703 | |
| | | |
Total equity | | | | | | | 663,956 | | | | 629,562 | |
The consolidated financial statements of CSR plc were approved by the Board of Directors and authorised for issue on 4 March 2015.
They were signed on its behalf by:
| | | | |
| Will Gardiner | | Ron Mackintosh | | |
Consolidated Statement of Changes in Equity
| | | | | | | | | | | | | | | | | | | | | | | | | | | | | | | | | | | | | | | | |
| | | Called-up
share
capital
$’000 | | | Share
premium
account
$’000 | | | Capital
redemption
reserve
$’000 | | | Merger
reserve
$’000 | | | Employee
Benefit
Trust
reserve
$’000 | | | Hedging
reserve
$’000 | | | Share-
based
payment
reserve
$’000 | | | Treasury
shares $’000 | | | Retained
earnings
$’000 | | | Total $’000 | |
| | | | | | | | | | |
At 31 December 2011 | | | 372 | | | | 473,462 | | | | 950 | | | | 61,574 | | | | (33,971 | ) | | | (1,400 | ) | | | 88,197 | | | | (84,660 | ) | | | 373,383 | | | | 877,907 | |
| | | | | | | | | | |
| Profit for the period | | | – | | | | – | | | | – | | | | – | | | | – | | | | – | | | | – | | | | – | | | | 51,233 | | | | 51,233 | |
| | | | | | | | | | |
Other comprehensive income for the period | | | – | | | | – | | | | – | | | | – | | | | – | | | | 3,895 | | | | – | | | | – | | | | (2,532 | ) | | | 1,363 | |
| | | | | | | | | | | |
| Total comprehensive income (loss) for the period | | | – | | | | – | | | | – | | | | – | | | | – | | | | 3,895 | | | | – | | | | – | | | | 48,701 | | | | 52,596 | |
| | | | | | | | | | |
| Share issues (net of share issue costs) | | | 24 | | | | 50,192 | | | | – | | | | – | | | | 14,808 | | | | – | | | | – | | | | 7,203 | | | | (18,265 | ) | | | 53,962 | |
| | | | | | | | | | |
| Repurchase of ordinary shares | | | (79 | ) | | | – | | | | 79 | | | | – | | | | – | | | | – | | | | – | | | | (9,472 | ) | | | (284,278 | ) | | | (293,750 | ) |
| | | | | | | | | | |
| Credit to equity for equity-settled share-based payments | | | – | | | | – | | | | – | | | | – | | | | – | | | | – | | | | 24,480 | | | | – | | | | – | | | | 24,480 | |
| | | | | | | | | | |
| Effective rate adjustment | | | – | | | | – | | | | – | | | | – | | | | – | | | | – | | | | – | | | | – | | | | (5 | ) | | | (5 | ) |
| | | | | | | | | | |
| Credit to equity on recognition of losses | | | – | | | | – | | | | – | | | | – | | | | – | | | | – | | | | – | | | | – | | | | 436 | | | | 436 | |
| | | | | | | | | | |
| Deferred tax on share-based payment transactions | | | – | | | | – | | | | – | | | | – | | | | – | | | | – | | | | – | | | | – | | | | 573 | | | | 573 | |
| | | | | | | | | | |
Equity dividends issued to shareholders | | | – | | | | – | | | | – | | | | – | | | | – | | | | – | | | | – | �� | | | – | | | | (21,265 | ) | | | (21,265 | ) |
| | | | | | | | | | | |
At 30 December 2012 | | | 317 | | | | 523,654 | | | | 1,029 | | | | 61,574 | | | | (19,163 | ) | | | 2,495 | | | | 112,677 | | | | (86,929 | ) | | | 99,280 | | | | 694,934 | |
| | | | | | | | | | |
| Loss for the period | | | – | | | | – | | | | – | | | | – | | | | – | | | | – | | | | – | | | | – | | | | (46,329 | ) | | | (46,329 | ) |
| | | | | | | | | | |
Other comprehensive income (loss) for the period | | | – | | | | – | | | | – | | | | – | | | | – | | | | 3,517 | | | | – | | | | – | | | | (1,232 | ) | | | 2,285 | |
| | | | | | | | | | | |
| Total comprehensive income (loss) for the period | | | – | | | | – | | | | – | | | | – | | | | – | | | | 3,517 | | | | – | | | | – | | | | (47,561 | ) | | | (44,044 | ) |
| | | | | | | | | | |
| Share issues (net of share issue costs) | | | 12 | | | | 24,031 | | | | – | | | | – | | | | – | | | | – | | | | – | | | | 5,690 | | | | (1,237 | ) | | | 28,496 | |
| | | | | | | | | | |
| Repurchase of ordinary shares | | | (3 | ) | | | – | | | | 3 | | | | – | | | | (4,811 | ) | | | – | | | | – | | | | (49,884 | ) | | | (18,721 | ) | | | (73,416 | ) |
| | | | | | | | | | |
| Credit to equity for equity-settled share-based payments | | | – | | | | – | | | | – | | | | – | | | | – | | | | – | | | | 29,650 | | | | – | | | | – | | | | 29,650 | |
| | | | | | | | | | |
| Effective rate adjustment | | | – | | | | – | | | | – | | | | – | | | | – | | | | – | | | | – | | | | – | | | | (361 | ) | | | (361 | ) |
| | | | | | | | | | |
| Deferred tax on share-based payment transactions | | | – | | | | – | | | | – | | | | – | | | | – | | | | – | | | | – | | | | – | | | | 11,459 | | | | 11,459 | |
| | | | | | | | | | |
| Credit to equity on recognition of losses | | | – | | | | – | | | | – | | | | – | | | | – | | | | – | | | | – | | | | – | | | | 3,202 | | | | 3,202 | |
| | | | | | | | | | |
| Equity dividends issued to shareholders | | | – | | | | – | | | | – | | | | – | | | | – | | | | – | | | | – | | | | – | | | | (20,358 | ) | | | (20,358 | ) |
| | | | | | | | | | | |
At 27 December 2013 | | | 326 | | | | 547,685 | | | | 1,032 | | | | 61,574 | | | | (23,974 | ) | | | 6,012 | | | | 142,327 | | | | (131,123 | ) | | | 25,703 | | | | 629,562 | |
| | | | | | | | | | |
| Profit for the period | | | – | | | | – | | | | – | | | | – | | | | – | | | | – | | | | – | | | | – | | | | 96,826 | | | | 96,826 | |
| | | | | | | | | | |
Other comprehensive (loss) income for the period | | | – | | | | – | | | | – | | | | – | | | | – | | | | (13,421 | ) | | | – | | | | – | | | | 2,794 | | | | (10,627 | ) |
| | | | | | | | | | | |
| Total comprehensive (loss) income for the period | | | – | | | | – | | | | – | | | | – | | | | – | | | | (13,421 | ) | | | – | | | | – | | | | 99,620 | | | | 86,199 | |
| | | | | | | | | | |
| Share issues (net of share issue costs) | | | 11 | | | | 10,931 | | | | – | | | | – | | | | – | | | | – | | | | – | | | | 8,801 | | | | (1,876 | ) | | | 17,867 | |
| | | | | | | | | | |
| Repurchase of ordinary shares | | | (11 | ) | | | – | | | | 11 | | | | – | | | | (7,631 | ) | | | – | | | | – | | | | – | | | | (61,877 | ) | | | (69,508 | ) |
| | | | | | | | | | |
| Share buyback liability | | | – | | | | – | | | | – | | | | – | | | | – | | | | – | | | | – | | | | – | | | | (8,434 | ) | | | (8,434 | ) |
| | | | | | | | | | |
| Credit to equity for equity-settled share-based payments | | | – | | | | – | | | | – | | | | – | | | | – | | | | – | | | | 22,612 | | | | – | | | | – | | | | 22,612 | |
| | | | | | | | | | |
| Modification of equity-settled share-based payments | | | – | | | | – | | | | – | | | | – | | | | – | | | | – | | | | (1,813 | ) | | | – | | | | – | | | | (1,813 | ) |
| | | | | | | | | | |
| Effective rate adjustment | | | – | | | | – | | | | – | | | | – | | | | – | | | | – | | | | – | | | | – | | | | 541 | | | | 541 | |
| | | | | | | | | | |
| Deferred tax on share-based payment transactions | | | – | | | | – | | | | – | | | | – | | | | – | | | | – | | | | – | | | | – | | | | 5,613 | | | | 5,613 | |
| | | | | | | | | | |
| Credit to equity on recognition of losses | | | – | | | | – | | | | – | | | | – | | | | – | | | | – | | | | – | | | | – | | | | 4,902 | | | | 4,902 | |
| | | | | | | | | | |
Equity dividends issued to shareholders | | | – | | | | – | | | | – | | | | – | | | | – | | | | – | | | | – | | | | – | | | | (23,585 | ) | | | (23,585 | ) |
| | | | | | | | | | | |
At 26 December 2014 | | | 326 | | | | 558,616 | | | | 1,043 | | | | 61,574 | | | | (31,605 | ) | | | (7,409 | ) | | | 163,126 | | | | (122,322 | ) | | | 40,607 | | | | 663,956 | |
| | |
| 86 | | CSR plc Annual Report and Financial Statements 2014 |
Consolidated Cash Flow Statement
| | | | | | | | | | | | | | | | |
| | | | | | 52 weeks ended
26 December 2014 | | | 52 weeks ended
27 December 2013 | | | 52 weeks ended
28 December 2012 | |
| | | Notes | | | $’000 | | | $’000 | | | $’000 | |
Net cash from operating activities | | | 25 | | | | 69,075 | | | | 82,308 | | | | 73,928 | |
| | | | |
Investing activities | | | | | | | | | | | | | | | | |
| | | | |
Interest received | | | | | | | 526 | | | | 521 | | | | 1,163 | |
| | | | |
Proceeds on disposal of property, plant and equipment | | | | | | | 16 | | | | 411 | | | | 73 | |
| | | | |
Purchase of treasury deposits | | | | | | | (162,364 | ) | | | (109,861 | ) | | | (111,629 | ) |
| | | | |
Sales of treasury deposits | | | | | | | 165,783 | | | | 49,576 | | | | 159,076 | |
| | | | |
Purchases of intangible assets | | | | | | | (14,632 | ) | | | (18,197 | ) | | | (13,610 | ) |
| | | | |
Purchases of property, plant and equipment | | | | | | | (21,160 | ) | | | (22,771 | ) | | | (12,019 | ) |
| | | | |
Disposal of Imaging IP | | | 33 | | | | 30,439 | | | | – | | | | – | |
| | | | |
Disposal of development operations | | | 35 | | | | – | | | | – | | | | 271,323 | |
| | | | |
Acquisition of UK-based capabilities in DDFA | | | | | | | – | | | | – | | | | (2,667 | ) |
| | | | |
Stamp duty | | | | | | | – | | | | – | | | | 126 | |
| | | | |
Acquisition of Reciva business | | | 34 | | | | (5,085 | ) | | | – | | | | – | |
| | | | |
Purchase of investment | | | 31 | | | | (1,000 | ) | | | – | | | | (109 | ) |
| | | | | |
Net cash (used in) from investing activities | | | | | | | (7,477 | ) | | | (100,321 | ) | | | 291,727 | |
| | | | |
Financing activities | | | | | | | | | | | | | | | | |
| | | | |
Repayments of obligations under finance leases | | | | | | | (696 | ) | | | (823 | ) | | | (540 | ) |
| | | | |
Purchase of shares by Employee Benefit Trust | | | | | | | (7,631 | ) | | | (4,811 | ) | | | – | |
| | | | |
Purchase of own shares | | | | | | | (62,748 | ) | | | (66,832 | ) | | | (293,750 | ) |
| | | | |
Equity dividends paid to shareholders | | | | | | | (23,585 | ) | | | (20,358 | ) | | | (21,265 | ) |
| | | | |
Proceeds on issue of share capital | | | | | | | 15,102 | | | | 24,170 | | | | 53,148 | |
| | | | | |
Net cash used in financing activities | | | | | | | (79,558 | ) | | | (68,654 | ) | | | (262,407 | ) |
| | | | |
Net (decrease) increase in cash and cash equivalents | | | | | | | (17,960 | ) | | | (86,667 | ) | | | 103,248 | |
| | | | |
Cash and cash equivalents at beginning of period | | | | | | | 227,468 | | | | 314,760 | | | | 211,907 | |
| | | | |
Effect of foreign exchange rate changes | | | | | | | (1,665 | ) | | | (625 | ) | | | (395 | ) |
| | | | | |
Cash and cash equivalents at end of period | | | | | | | 207,843 | | | | 227,468 | | | | 314,760 | |

Notes to the Consolidated Financial Statements
1 General Information
CSR plc is a company incorporated in England and Wales under the Companies Act 2006. The address of the registered office is Churchill House, Cambridge Business Park, Cowley Road, Cambridge, CB4 0WZ, United Kingdom. CSR is a provider of multifunction semiconductor platforms for the consumer electronics market.
The consolidated financial statements incorporate the financial statements of CSR plc (the Company) and entities controlled by the Company (its subsidiaries, together the Group) drawn up to the dates indicated in the primary financial statements and are presented in US dollars because that is the currency of the primary economic environment in which the Group operates. Foreign operations are included in accordance with the policies set out in note 3.
Going concern
The consolidated financial statements have been prepared on the going concern basis. The directors have considered future cash forecasts and revenue projections, based on prudent market data, in their consideration of going concern. The issues surrounding going concern are discussed regularly by the Board and were evaluated as part of the Group’s budget for the next financial year and the Group’s longer term plans.
Note 31 includes the Group’s objectives, policies and processes for managing its capital; its financial risk management objectives; details of the financial instruments and hedging activities; and its exposure to credit risk. Management is currently of the opinion that the Group has adequate financial resources and a robust policy towards treasury risk and cash flow management. The Group has $283.2 million of cash, cash equivalents and treasury deposits as at 26 December 2014 and no debt liabilities.
After considering the above factors, the directors have a reasonable expectation that the Company and the Group have adequate resources to continue in operational existence for the foreseeable future. Accordingly, they continue to adopt the going concern basis in preparing the consolidated financial statements.
2 Adoption of New and Revised Standards
Standards not affecting the reported results nor the balance sheet:
The following new and revised Standards and Interpretations have been adopted in the current period. Their adoption has not had any significant impact on the amounts reported in these consolidated financial statements but may impact the accounting for future transactions and arrangements.
| | |
IFRS 10 | | Consolidated financial statements |
IFRS 11 | | Joint Arrangements |
IFRS 12 | | Disclosure of interest in other entities |
IFRS 13 | | Fair Value Measurement |
IFRS 7 (amended) | | Amendment related to the offsetting of assets and liabilities |
IAS 19 (amended) | | Amended standard resulting from the post-employment benefits and termination benefits projects |
IAS 27 (amended) | | Separate financial statements |
IAS 28 (amended) | | Investments in associates and joint ventures |
Improvements to IFRSs (May 2012) | | |
At the date of authorisation of these consolidated financial statements, the following Standards and Interpretations which have not yet been applied in these consolidated financial statements were in issue but not yet effective (and in some cases, had not yet been adopted by the EU):
| | |
IFRS 9 | | Financial Instruments |
IFRS 14 | | Regulatory Deferral Accounts |
IFRS 15 | | Revenue from Contracts with Customers |
IAS 16 (amended) | | Amendments regarding the clarification of acceptable methods of depreciation and amortisation |
IAS 16 (amended) | | Amendments bringing bearer plants into the scope of IAS 16 |
IAS 19 (amended) | | Amended to clarify the requirements that relate to how contributions from employees or third parties that are linked to service should be attributed to periods of service |
IAS 27 (amended) | | Amendments for investment entities |
IAS 28 (amended) | | Amendments regarding the sale or contribution of assets between an investor and its associate or joint venture |
IAS 36 (amended) | | Amendments arising from Recoverable Amount Disclosures for Non-Financial Assets |
IAS 38 (amended) | | Amendments regarding the clarification of acceptable methods of depreciation and amortisation |
IAS 39 (amended) | | Amendments for novations of derivatives |
IAS 41 (amended) | | Amendments bringing bearer plants into the scope of IAS 16 |
IFRS 10 (amended) | | Amendments regarding the sale or contribution of assets between an investor and its associate or joint venture |
IFRS 11 (amended) | | Amendments regarding the accounting for acquisitions of an interest in a joint operation |
| | |
| 88 | | CSR plc Annual Report and Financial Statements 2014 |
| | |
|
IFRS 12 (amended) | | Amendments for investment entities |
|
Improvements to IFRSs (December 2013) | | |
|
Improvements to IFRSs (September 2014) | | |
|
The adoption of both IFRS 9 and IFRS 15 will impact both the measurements and disclosures of financial instruments and revenue recognition respectively. Beyond the information above, it is not practicable to provide a reasonable estimate of the effect of IFRS 15 until a detailed review has been completed.
The directors anticipate that the adoption of the other Standards and Interpretations listed above in future periods will have no material impact on the financial statements of the Group.
3 Accounting Policies
Basis of Accounting
The consolidated financial statements have been prepared in accordance with International Financial Reporting Standards (IFRSs) as issued by the International Accounting Standards Board (IASB) and as adopted by the European Union (EU).
The consolidated financial statements have been prepared on the historical cost basis, except for the revaluation of financial instruments and financial instruments that have been measured at fair value. Historical cost is generally based on the fair value given in exchange for goods and services. Fair value is the price that would be received to sell an asset or paid to transfer a liability in an orderly transaction between market participants at the measurement date, regardless of whether that price is directly observable or estimated using another valuation technique.
The principal accounting policies adopted are set out below. The consolidated financial statements cover the 52 week period from 28 December 2013 to 26 December 2014; the comparatives are presented for the 52 week period from 29 December 2012 to 27 December 2013 and income statement comparatives for the 52 week period from 31 December 2011 to 28 December 2012. The consolidated financial statements are reported on a 52 or 53 week basis to be consistent with the Group’s internal reporting.
Basis of Consolidation
The consolidated financial statements incorporate the financial statements of CSR plc (the Company) and entities controlled by the Company (its subsidiaries, together the Group) drawn up to the dates indicated in the primary financial statements. Control is achieved where the Company has power over the investee, is exposed and has right to, the variable returns from its involvement with the investee and had the ability to use its power to affect its return from that entity.
Where necessary, adjustments are made to the financial statements of subsidiaries to bring the accounting policies used into line with those used by the Group.
Business Combinations
Acquisitions of subsidiaries and businesses are accounted for using the acquisition method. The consideration for each acquisition is measured at the aggregate of the fair values (at the date of exchange) of assets given, liabilities incurred or assumed, and equity instruments issued by the Group in exchange for the control of the acquiree. Acquisition-related costs are recognised in sales, general and administrative expenses as incurred.
Where applicable, the consideration for the acquisition includes any asset or liability resulting from a contingent consideration arrangement, measured at its acquisition-date fair value. Subsequent changes in such fair values are adjusted against cost of acquisition where they qualify as measurement period adjustments (see below). All other subsequent changes in the fair value of contingent consideration classified as an asset or liability are accounted for in accordance with relevant IFRSs. Changes in the fair value of contingent consideration classified in equity are not recognised.
If the initial accounting for a business combination is incomplete by the end of the reporting period in which the combination occurs, the Group reports provisional amounts for the items for which the accounting is incomplete. Those provisional amounts are adjusted during the measurement period (see below), or additional assets or liabilities are recognised to reflect new information obtained about facts and circumstances that existed as at the acquisition date that, if known, would have affected the amounts recognised as of that date. The measurement period is the period from the date of acquisition to the date the Group obtains complete information about facts and circumstances that existed as of the acquisition date – and is subject to a maximum of one year.
Goodwill
Goodwill arising in a business combination is recognised as an asset at the date that control is acquired (the acquisition date). Goodwill is measured as the excess of the sum of the consideration transferred, the amount of any non-controlling interest in the acquiree and the fair value of the Group’s previously held equity interest (if any) in the entity over the net of the acquisition date amounts of identifiable assets acquired and the liabilities assumed.
Revenue Recognition
Revenue is recognised when it is probable that economic benefits will flow to the Group and delivery has occurred or the service has been provided, the sales price is fixed or determinable, and collectability is reasonably assured. These criteria are generally met at the time the product is shipped and delivered to the customer and, depending on the delivery conditions, title and risk have passed to the customer and acceptance of the product, when contractually required, has been obtained, or, in cases where such acceptance is not contractually required, when management has established that all aforementioned conditions for revenue recognition have been met and no further post-shipment obligations exist other than obligations under warranty. Revenues are recorded net of sales taxes, customer discounts, rebates and similar charges. For products for which a right of return exists during a defined period, revenue recognition is determined based on the historical pattern of actual returns, or in cases where such information is lacking, revenue recognition is postponed until the return period
Notes to the Consolidated Financial Statementscontinued
has lapsed. Revenue is shown net of estimated provision for credit notes and returns. A provision for product warranty is made at the time of revenue recognition and reflects the estimated costs of replacement and free of charge services that will be incurred by the Company with respect to the sold products.
Royalty income, which is generally earned based upon a percentage of sales or a fixed amount per royalty earning product, is recognised upon shipment by the licencee as long as recovery is reasonably assured.
When a transaction requires the delivery of more than one product or service (multiple components), the revenue recognition criteria are applied to the separately identifiable components. A component is considered to be separately identifiable if the product or service delivered has stand-alone value to that customer and the fair value associated with the product or service can be measured reliably. The amount recognised as revenue for each component is the fair value of the element in relation to the fair value of the arrangement as a whole.
We determine the fair value of our maintenance obligations with reference to substantive renewal rates within the agreement or objective evidence of fair value. In instances where we are unable to determine the fair value of our maintenance obligations, revenue for the entire arrangement is recognised ratably over the term of the arrangement. We recognise maintenance and support revenue ratably over the term of the arrangement.
Software license revenue is recognised fully upon delivery, where there is no obligation to provide ongoing technical support or software upgrades or enhancements. If technical support, software upgrades and enhancements are sold with the software license, revenue will be recognised for each identified component based on the relative fair value of the delivered component for which consideration is received or receivable. With regards to technical support, the revenue would be recognised ratably over the term of the arrangement.
Leasing
Leases are classified as finance leases whenever the terms of the lease transfer substantially all the risks and rewards of ownership to the lessee. All other leases are classified as operating leases.
Assets held under finance leases are recognised as assets of the Group at their fair value or, if lower, at the present value of the minimum lease payments, each determined at the inception of the lease. The corresponding liability to the lessor is included in the balance sheet as a finance lease obligation.
Rentals payable and receivable under operating leases are charged to the income statement on a straight-line basis over the term of the relevant lease. Benefits received and receivable as an incentive to enter into an operating lease are also spread on a straight line basis over the lease term.
Foreign Currencies
The functional currency of all entities in the Group is the US dollar and this is also the presentation currency for the consolidated financial statements. Transactions in currencies other than US dollars are recorded at the rates of exchange prevailing on the dates of the transactions. At each balance sheet date, monetary assets and liabilities that are denominated in foreign currencies are retranslated at the rates prevailing on the balance sheet date. Non-monetary assets and liabilities carried at fair value that are denominated in foreign currencies are translated at the rates prevailing at the date when the fair value was determined. Gains and losses arising on retranslation are included in the net profit or loss for the period except for exchange differences on transactions entered into to hedge certain foreign currency risks (see policy on Hedge Accounting).
In order to hedge its exposure to certain foreign exchange risks, the Group enters into forward contracts (see Financial Instruments policy for details of the Group’s accounting policies in respect of such derivative financial instruments).
R&D Tax Credits
Following the changes made to the claiming of R&D tax credits in the 2013 Finance Act, UK R&D tax credits, for qualifying R&D expenditure incurred subsequent to 1 April 2013, have been accounted for under IAS 20 Government Grants and Disclosure and recognised within operating profit (loss).
The expected R&D tax credit is accrued as qualifying R&D expenditure is incurred and has been offset against Research & Development expenditure within the income statement.
Operating Result
Operating profit (loss) is stated before investment income, exchange losses, finance costs and tax.
Retirement Benefit Costs
The Group has both a defined contribution retirement scheme and a defined benefit plan.
Payments to defined contribution retirement benefit schemes are charged as an expense as they fall due.
The defined benefit plan represents severance payments required under Israeli law to employees who joined the Israeli subsidiary prior to 2007 who leave the Group involuntarily. These severance payments are funded by investment funds held in the name of each employee, with the Company liable for meeting any shortfall, and meet the definition of a post-employment defined benefit plan under IAS 19.
A liability is recognised in the balance sheet in relation to the defined benefit scheme, as the present value of the defined benefit obligation, less the fair value of plan assets at the balance sheet date. The financing cost, service cost and expected returns on plan assets are recognised within the Income statement in the period in which they arise.
| | |
| 90 | | CSR plc Annual Report and Financial Statements 2014 |
Actuarial gains and losses are recognised in full in the statement of comprehensive income in the period in which they arise.
Where the carrying amount of scheme assets exceed the present value of the future benefits that are expected to flow to the scheme from those assets (the ‘asset ceiling’), the surplus is recognised in full in the statement of comprehensive income in the period in which this arises.
Taxation
The current tax expense represents the sum of the current tax expense and the deferred tax expense for the period.
The tax charge is based on taxable profit for the period. Taxable profit differs from profit (loss) before tax as reported in the income statement because it excludes items of income and expense that are taxable or deductible in other periods and it further excludes items that are never taxable or deductible. The Group’s liability for current tax is calculated using tax rates that have been enacted or substantively enacted by the balance sheet date.
Deferred tax is the tax expected to be payable or recoverable on differences between the carrying amounts of assets and liabilities in the consolidated financial statements and the corresponding tax bases used in the computation of taxable profit, and is accounted for using the balance sheet liability method. Deferred tax liabilities are generally recognised for all taxable temporary differences and deferred tax assets are recognised to the extent that it is probable that taxable profits will be available against which deductible temporary differences, unused carried forward tax losses and unused carried forward tax credits can be utilised. However, such assets and liabilities are not recognised if the temporary differences arise from:
| — | | the initial recognition of goodwill; |
| — | | the initial recognition (other than in a business combination) of other assets and liabilities in a transaction that affects neither the taxable profit nor the accounting profit; or |
| — | | investments in subsidiaries and associates, and interests in joint ventures, where the Group is able to control the reversal of the temporary difference and it is probable that the temporary difference will not reverse in the foreseeable future. |
The carrying amount of deferred tax assets is reviewed at each balance sheet date and reduced to the extent that it is no longer probable that sufficient taxable profits will be available to allow all or part of the asset to be recovered.
Deferred tax is calculated at the tax rates that are expected to apply in the period when the liability is settled or the asset is realised. Deferred tax is charged or credited in the income statement, except when it relates to items charged or credited in other comprehensive income or directly to equity, in which case deferred tax is also dealt with in other comprehensive income or equity.
Deferred tax assets and liabilities are offset when there is a legally enforceable right to set off current tax assets against current tax liabilities and when they relate to income taxes levied by the same taxation authority and the Group intends to settle its current tax assets and liabilities on a net basis.
Judgement is required when determining the provision for taxes as the tax treatment of some transactions cannot be finally determined until a formal resolution has been reached with the tax authorities. Tax benefits are not recognised unless it is probable that the benefit will be obtained. Tax provisions are made if it is probable that a liability will arise and the liability can be reliably measured. The Group reviews each significant tax liability or benefit to assess the appropriate accounting treatment.
Property, Plant and Equipment
Property, plant and equipment are stated at cost less accumulated depreciation and any recognised impairment loss.
Depreciation is charged so as to write off the cost of the assets, less estimated residual value, over their estimated useful lives, using the straight line method, on the following basis:
| | |
|
Computer equipment | | 2 to 3 years |
|
Test equipment | | 2 to 5 years |
|
Office equipment | | 3 years |
|
Furniture and fittings | | 5 years |
|
Leasehold improvements | | Shorter of useful life or minimum lease period |
|
In general residual values are zero or negligible, due to the technical and specialised nature of assets held. Residual values are reviewed annually.
The gain or loss arising on the disposal or retirement of an asset is determined as the difference between the sales proceeds and the carrying amount of the asset and is recognised in the income statement.
Notes to the Consolidated Financial Statementscontinued
Other Intangible Assets
Other intangible fixed assets are stated at cost or fair value for items acquired in business combinations, net of amortisation and any provision for impairment. No amortisation is provided on assets in the course of construction. On other intangible fixed assets, amortisation is provided at rates calculated to write off the cost or fair value, less estimated residual value, of each asset on a straight line basis over its expected useful life as follows:
| | |
Software licences and intellectual property | | Licence term or 3 to 5 years where a perpetual licence |
|
Customer contracts and relationships | | 3 to 4 years |
|
Purchased IPR&D | | 4 to 10 years |
|
Internally developed technology | | 3 years |
|
Purchased developed technology | | 3 to 4 years |
|
Trade names | | 2 years |
|
In general, residual values are zero or negligible, due to the technical and specialised nature of assets held. Residual values are reviewed annually.
The gain or loss arising on the disposal or retirement of an asset is determined as the difference between the sales proceeds and the carrying amount of the asset and is recognised in the income statement.
Assets in the course of construction are carried at cost net of any provision for impairment. Costs included are those that directly relate to the construction or production of the asset.
Research and Development Expenditure
Expenditure on research activities is recognised as an expense in the period in which it is incurred.
An internally generated intangible asset arising from the Group’s product development is recognised only if all of the following conditions are met:
| — | | an asset is created that can be identified (such as a new device or software); |
| — | | the project from which the asset arises meets the Group’s criteria for assessing technical feasibility; |
| — | | it is probable that the asset created will generate future economic benefits; and |
| — | | the development cost of the asset can be measured reliably. |
Internally generated intangible assets are amortised on a straight line basis over their useful lives. Where no internally generated intangible asset can be recognised, development expenditure is recognised as an expense in the period in which it is incurred.
Impairment of Tangible and Intangible Assets
Intangible assets with an indefinite useful life, such as goodwill, are tested for impairment annually. All non-financial assets, tangible and intangible, are reviewed for impairment on the occurrence of events or circumstances which indicate that the carrying amount may not be recoverable.
An impairment loss would be recognised to the extent that the carrying amount of a non-financial asset exceeds its recoverable amount.
Recoverable amount is the higher of fair value less costs to sell and value in use. In assessing value in use, the estimated future cash flows are discounted to their present values using a pre-tax discount rate that reflects current market assessments of the time value of money and the risks specific to the asset. Where the asset does not generate cash flows that are independent from other assets, the Group estimates the recoverable amount of the cash-generating unit to which the asset belongs.
An impairment loss is recognised as an expense immediately. After the recognition of an impairment loss, any depreciation or amortisation charge for the asset is adjusted for future periods to allocate the asset’s revised carrying value, less estimated residual value, on a systematic basis, over its remaining useful life.
Where an impairment loss subsequently reverses, the carrying amount of the asset (cash-generating unit) is increased to the revised estimate of its recoverable amount, but the reversal is limited so that the increased carrying amount does not exceed the carrying amount that would have been determined had no impairment loss been recognised for the asset (cash-generating unit) in prior years. A reversal of an impairment loss is recognised as income immediately.
Inventories
Inventories are stated at the lower of cost and net realisable value. Cost comprises direct materials and, where applicable, those overheads that have been incurred in bringing the inventories to their present location and condition. Cost is calculated using the first-in-first-out (FIFO) method. Net realisable value represents the estimated selling price less all estimated costs of completion and costs to be incurred in marketing, selling and distribution.
Financial Instruments
Financial assets and financial liabilities are recognised on the Group’s balance sheet when the Group becomes a party to the contractual provisions of the instrument.
Loans and Receivables
Trade receivables, loans and other receivables that have fixed or determinable payments that are not quoted in an active market are classified as loans and receivables. Loans and receivables are measured at amortised cost using the effective interest method, less any
| | |
| 92 | | CSR plc Annual Report and Financial Statements 2014 |
impairment or appropriate allowances for estimated irrecoverable amounts. Interest income is recognised by applying the effective interest rate, except for short-term receivables when the recognition of interest would be immaterial.
Treasury deposits
Treasury deposits are recognised and derecognised on a trade date where a purchase or sale of a treasury deposit is under a contract whose terms require delivery of the investment within the timeframe established by the market concerned, and are initially measured at cost, including transaction costs.
Treasury deposits consist of money market deposits in USD, GBP and obligations of the United States government treasury with original maturities of over ninety days. Interest income is recorded as it accrues over the period of the investment at rates fixed at the time of inception.
Cash and Cash Equivalents
Cash and cash equivalents comprise cash on hand and demand deposits and other short-term highly liquid investments that are readily convertible to a known amount of cash and are subject to an insignificant risk of changes in value.
Financial Assets at FVTPL (Fair Value Through Profit and Loss)
Financial Assets classified within FVTPL are those that are ‘held for trading’, this being assets, principally United States government fixed income securities, that have been acquired for the purpose of selling in the near term or derivative financial instruments in designated hedging relationships for which the hedged item has been recognised in the income statement.
Financial assets at FVTPL are stated at fair value, with any resultant gain or loss recognised in the income statement. The net gain or loss recognised in the income statement incorporates any dividend or interest earned on the financial asset and is included in the ‘investment income’ line in the income statement. Fair value is determined in the manner described in note 31.
Available for sale financial assets
The Group has investments in unlisted shares that are not traded in an active market but are classified as AFS financial assets and stated at fair value (because the directors consider that fair value can be reliably measured). Fair value is determined in the manner described in note 31. Gains and losses arising from changes in fair value are recognised in other comprehensive income and accumulated in the investments revaluation reserve with the exception of impairment losses, which are recognised directly in the income statement. Where the investment is disposed of or is determined to be impaired, the cumulative gain or loss previously recognised in the investments revaluation reserve is reclassified into profit or loss.
De-recognition of Financial Assets
The Group derecognises a financial asset only when the contractual rights to the cash flows from the asset expire; or it transfers the financial asset and substantially all the risks and rewards of ownership of the asset to another entity. If the Group neither transfers nor retains substantially all the risks and rewards of ownership and continues to control the transferred asset, the Group recognises its retained interest in the asset and an associated liability for amounts it may have to pay.
Impairment of Financial Assets
Financial assets, other than those held at FVTPL, are assessed for indicators of impairment at each balance sheet date. Financial assets are impaired when there is objective evidence that, as a result of one or more events that have occurred after the initial recognition of the asset, the estimated future cash flows of the investment have been impaired. The carrying amount of the financial asset is reduced by the impairment loss directly for all financial assets with the exception of trade receivables where the carrying amount is reduced through the use of an allowance account. When a trade receivable is considered uncollectible, it is written off against the allowance account. Subsequent recoveries of amounts previously written off are credited against the allowance account. Changes in the carrying amount of the allowance account are recognised in the income statement.
Financial Liabilities and Equity
Financial liabilities and equity instruments are classified according to the substance of the contractual arrangements entered into.
Trade Payables
Trade payables are obligations to pay for goods or services that have been acquired in the ordinary course of business from suppliers.
Trade payables are not interest bearing and are initially measured at fair value, net of transaction cost. Subsequently these are measured at amortised cost using the effective interest method, with interest recognised on an effective yield basis.
Equity Instruments
An equity instrument is any contract that evidences a residual interest in the assets of the Group after deducting all of its liabilities. Equity instruments issued by the Group are recorded at the proceeds received, net of direct issue costs.
Financial Liabilities at FVTPL (Fair Value Through Profit and Loss)
Financial liabilities are classified as FVTPL where the financial liability has been designated as FVTPL or are derivative financial instruments in designated hedging relationships for which the hedged item has been recognised in the income statement.
De-recognition of Financial Liabilities
The Group derecognises financial liabilities when, and only when, the Group’s obligations are discharged, cancelled or they expire.
Derivative Financial Instruments
The Group uses foreign exchange forward contracts to hedge these exposures to the financial risks of changes in foreign currency exchange rates. The Group does not use derivative financial instruments for speculative purposes. Further details of derivative financial
Notes to the Consolidated Financial Statementscontinued
instruments are disclosed in note 31 to the consolidated financial statements.
The use of financial derivatives is governed by the Group’s policies approved by the Board of directors, which provides written principles on the use of financial derivatives.
Derivative financial instruments are initially recorded at fair value at the date a derivative contract is entered into and are subsequently re-measured to fair value at each balance sheet date. The resulting gain or loss is recognised in the income statement immediately unless the derivative is designated and effective as a hedging instrument.
Hedge Accounting
Hedges of foreign exchange risk on firm commitments are accounted for as cash flow hedges. The Group’s policy is to hedge between 75% and 90% of forecast GBP expenditure (a firm commitment) for the following 11 to 15 months.
At the inception of the hedge relationship, the Group documents the relationship between the hedging instrument and the hedged item, along with its risk management objectives and its strategy for undertaking various hedge transactions. Furthermore, at the inception of the hedge and on a quarterly basis, the Group documents whether the hedging instrument that is used in a hedging relationship is highly effective in offsetting changes in cash flows of the hedged item.
Cash Flow Hedges
The effective portion of changes in the fair value of derivatives that are designated and qualify as cash flow hedges are deferred in equity. The gain or loss relating to the ineffective portion is recognised immediately in the income statement.
Amounts deferred in equity are recycled into the income statement in the periods when the hedged item is recognised in the income statement.
Hedge accounting is discontinued when the Group revokes the hedging relationship, the hedging instrument expires or is sold, terminated, exercised or no longer qualifies for hedge accounting. Any cumulative gain or loss deferred in equity at that time remains in equity and is recognised when the forecast transaction is ultimately recognised in the income statement. When a forecast transaction is no longer expected to occur, the cumulative gain or loss that was deferred in equity is recognised immediately in the income statement.
Provisions
Provisions are recognised when the Group has a present obligation (legal or constructive) as a result of a past event, it is probable that the Group will be required to settle that obligation and a reliable estimate can be made of the amount of the obligation.
Provisions for warranty and returns costs are recognised at the date of sale of the relevant products, at the directors’ best estimate of the expenditure required to settle the Group’s liability.
Provision is made for onerous contracts at the fair value of the minimum unavoidable payments, net of any amounts recoverable. Where amounts are known and timings certain, onerous amounts are accrued instead.
A restructuring provision is recognised when the Group has developed a detailed formal plan for the restructuring and has raised a valid expectation in those affected that it will carry out the restructuring by starting to implement the plan or announcing its main features to those affected by it. The measurement of a restructuring provision includes only the direct expenditures arising from the restructuring, which are those amounts that are both necessarily entailed by the restructuring and not associated with the ongoing activities of the entity.
Share-based Payment
The Group issues equity-settled share-based payments to certain employees, including share options with non-market based vesting conditions. Equity settled share-based payments are measured at the fair value at the date of grant. The fair value determined at the grant date of the equity-settled share-based payments is expensed on a straight-line basis over the vesting period, based on the Group’s estimate of shares that will eventually vest.
Fair value is measured by use of a Black-Scholes model for most of share options in issue. The expected life used in the model has been adjusted, based on management’s best estimate, for the effects of non-transferability, exercise restrictions, and behavioural considerations.
For certain share options which include Absolute Total Shareholder Return (ATSR) related conditions the fair value is estimated through the use of a Monte-Carlo simulation.
Save-As-You-Earn ‘SAYE’ share options granted to employees are treated as cancelled when employees cease to contribute to the scheme. This results in accelerated recognition of the expenses that would have arisen over the remainder of the original vesting period.
For cash-settled share-based payments, the Group recognises a liability for the goods or services acquired, measured initially at the fair value of the liability. At each balance sheet date until the liability is settled, and at the date of settlement, the fair value of the liability is re-measured, with any changes in fair value recognised in the income statement.
Employee Benefit Trust
The Group has established an employee benefit trust which is a separately administered trust and is funded by loans from Group companies. The assets of the trust comprise shares in CSR plc and cash balances. The Group recognises assets and liabilities of the trust in the consolidated accounts and shares held by the trust are recorded at cost as a deduction from shareholders’ equity.
Contingent liabilities
A contingent liability may arise where there is possible obligation that arises from past events, whose occurrence or non-occurrence will
| | |
| 94 | | CSR plc Annual Report and Financial Statements 2014 |
only be confirmed by uncertain future events or where a present obligation arises from past events but where an outflow of resources from the Group is not probable and/or the amount of the obligation cannot be reliably measured. In these circumstances, the Group discloses the nature of such contingent liabilities. The Group recognises liabilities where there is a present obligation and an outflow of resources from the Group is probable and can be reliably measured.
Treasury shares
The Group holds shares in its own equity that it has reacquired as part of a share buy-back programme. The shares are shown as a deduction in equity and are measured at the fair value of the shares purchased and transaction costs.
Dividend distribution
A dividend distribution to the Company’s shareholders is recognised as a liability in the consolidated financial statements in the period in which the dividends are committed to be paid. In the case of a final dividend distribution, this will also be the period in which the dividends are approved by the Company’s shareholders. Interim dividends are recorded in the period in which they are approved and paid.
Investments in subsidiaries (Company only)
Investments in subsidiaries are shown at cost, plus capital contributions and less provisions for impairment.
4 Critical Accounting Judgements and Key Sources of Estimation Uncertainty
The preparation of financial statements requires the directors to make estimates and assumptions about future events that affect the reported amounts of assets and liabilities and disclosure of contingent assets and liabilities.
Future events and their effects cannot be determined with absolute certainty. Therefore, the determination of estimates requires the exercise of judgement based on various assumptions and other factors such as historical experience, current and expected economic conditions. The directors constantly re-evaluate these significant factors and make adjustments where facts and circumstances dictate. The directors believe that the following accounting policies are critical due to the degree of estimation required and / or the potential material impact they may have on the Group’s balance sheet and performance.
Critical accounting judgements
Revenue recognition
Sales are recognised when the significant risks and rewards of ownership have transferred to the buyer, it is probable that economic benefits associated with the transaction will flow to the Group and both the amount of revenue and the costs incurred or to be incurred in respect of the transaction can be measured reliably.
Management assesses at the point of delivery whether the above criteria have been met and revenue is recognised accordingly. Estimates are made for reductions to revenue from pricing agreements, price protection, other volume based rebates and expected returns, considering such factors as sales history and shipment information.
Development expenditure
At the point that development expenditure satisfies all specific criteria, as specified within IAS 38 Intangible Assets (refer to the research and development expenditure policy, in note 3, for a description of the criteria), it must be capitalised as an intangible asset and amortised over its expected useful economic life.
Management has considered the criteria for capitalisation of development expenditure and concluded that as the commercial viability of the products being designed is not typically confirmed until the very end of the development process, the significant majority of CSR’s development costs cannot be capitalised. Chips will only become commercially viable if they can be produced at a commercial manufacturing yield, with minimal waste from failing to satisfy quality requirements. Without high manufacturing yields, chips are not cost effective to produce and cannot be sold at a gross profit. Once commercial viability has been demonstrated the next phase of product development is to enter mass production, at which point subsequent development expenditure is highly immaterial.
The amount of development expenditure capitalised in 2014 was $nil (2013: $nil).
Key sources of estimation uncertainty
Taxation
Management’s judgement is required in determining the provision for income taxes, deferred tax assets and liabilities.
The Group is subject to the income tax laws of the various tax jurisdictions in which we operate, principally the United Kingdom. These laws are complex and subject to different interpretations by taxpayers and tax authorities. When establishing income tax provisions, we therefore make a number of judgements and interpretations about the application and interaction of these laws. Changes in these tax laws or our interpretations of these laws and the resolution of future tax audits could significantly impact our effective tax rate and the results of operations in a given period. Where it is probable that a position may be successfully challenged by revenue authorities, a tax provision is created for the tax on the probable adjustment.
Deferred tax assets have been recognised where management believes there are sufficient taxable temporary differences or it is probable that sufficient taxable profit will be available in future to realise deferred tax assets. Although the deferred tax assets which have been recognised are considered realisable, actual amounts could be reduced if future taxable income is lower than expected. This could materially affect the Group’s reported profit or loss and balance sheet.
Share-based payments
Non-market vesting conditions, namely continued employment throughout the vesting period, are included in assumptions about the number of shares that are expected to be issued from the exercise of share options or awards. CSR models the number of awards or
Notes to the Consolidated Financial Statementscontinued
options that are expected to vest based on management’s estimates of future employee turnover rates. Corresponding adjustments are made throughout the vesting period, to both the income statement and equity, to reflect the actual number of employees who leave employment before the vesting date, thereby not satisfying this vesting condition.
Valuation of certain assets and liabilities
In certain situations CSR bases the valuation of its assets and liabilities on its assessment of the future actions of third parties. This includes the likelihood that customers make warranty claims, actions taken by third parties to mitigate such claims, litigation activity, and performance conditions of certain contractual arrangements.
CSR bases its valuation judgments on an assessment of the current situation with the relevant third parties following discussions and negotiations, historical precedent in such scenarios and an assessment of the likelihood and impact of each event arising.
In 2014 such judgments impacted the carrying value of the cash held under Escrow arrangements (disclosed within ‘Short term assets’ in note 18), our litigation provisions and any contingent liabilities. In 2013 such judgments impacted the cash in Escrow, litigation provisions, and certain financial liabilities.
The basis of our decisions in each of these is detailed in the relevant notes to the consolidated financial statements.
Forecasts and discount rates
Management uses both forecast data and discount rates in the following instances:
The level of inventory provisioning is assessed with reference to the number of units of product held in inventory at the balance sheet date, in comparison to the expected demand for product based on forecast data for sales for the next six months. In most instances, where the amount of inventory held exceeds the expected demand for that inventory, a provision will be made for the excess inventory.
| — | | Goodwill and other intangible asset impairment (relevant for 2013) |
The Group assesses the carrying value of identifiable intangible assets, long-lived assets and goodwill annually, or more frequently if events or changes in circumstances indicate that such carrying value may not be recoverable. In order to assess the recoverable amount of Cash Generating Units (CGUs), and in turn the recoverable amount of goodwill, intangible assets and long lived assets allocated to these CGUs, value in use calculations are performed using forecast data of discounted cash flows, derived from both the budget for the next financial year, longer range plans covering the subsequent four years and a terminal value, derived from the final year of the longer range plan.
Deferred tax assets have been recognised where management believes there are sufficient taxable temporary differences or it is probable, based on forecast data, that sufficient taxable profit will be available in future to realise deferred tax assets
Forecast data is subject to assumptions concerning the growth in future sales, based on managerial estimates about conditions in the Group’s markets, as well as projected production costs and operating expenditures.
Discount rates are derived based on management’s assessment of risk inherent in the current business model.
Changes in forecast data and/or discount rates could have a significant impact on the Group’s balance sheet and performance.
In 2014, the recoverable value of goodwill and other intangible assets was estimated as the fair value less costs of disposal based on the offer price received from Qualcomm, as disclosed in the Scheme Document published in November 2014. Costs of disposal were also estimated based on the Scheme Document updated to reflect the actual costs incurred to date. The recoverable value was then allocated to CGUs based on the proportion of value in use of each CGUs generated during the 2013 impairment testing. As such, the review for impairment in goodwill and other intangible assets was not subject to the same level of estimation uncertainty in 2014, in comparison to 2013.
| | |
| 96 | | CSR plc Annual Report and Financial Statements 2014 |
5 Segmental Reporting
CSR is a provider of multifunction semiconductor platforms for the consumer electronics market.
Products from which Reportable Segments Derive their Revenues
The Group has four operating segments which are reported to the Chief Executive, who is our chief operating decision maker, for internal monitoring and allocation of resources. In our opinion each operating segment is a reporting segment.
The Group reportable segments under IFRS 8 ‘Operating Segments’ are therefore as follows:
| | |
Voice & Music | | Mono and Stereo Audio |
|
Auto | | Automotive and Personal Navigation Device (PND) applications |
|
Consumer | | Cameras, Gaming, Document Imaging, Indoor Location, Bluetooth Smart and other consumer applications |
|
Legacy | | Legacy Home Entertainment, Handset Connectivity and Handset Location |
|
Segment Revenues and Results
The following is an analysis of the Group’s revenue and results by reportable segment:
| | | | | | | | | | | | | | | | | | | | | | | | |
| 52 weeks ended 26 December 2014 | | Auto $’000 | | | Consumer $’000 | | | Voice & Music
$’000 | | | Legacy $’000 | | | Unallocated $’000 | | | Consolidated
$’000 | |
| |
| | | | | | |
Revenue | | | | | | | | | | | | | | | | | | | | | | | | |
| | | | | | |
Total segment revenue | | | 200,993 | | | | 155,447 | | | | 346,531 | | | | 71,802 | | | | – | | | | 774,773 | |
| |
Segment result | | | | | | | | | | | | | | | | | | | | | | | | |
| |
| | | | | | |
Underlying operating (loss) profit | | | (20,155 | ) | | | (18,115 | ) | | | 124,549 | | | | 23,662 | | | | – | | | | 109,941 | |
| | | | | | |
Share-based payment charges | | | | | | | | | | | | | | | | | | | (29,936 | ) | | | (29,936) | |
| | | | | | |
Amortisation of acquired intangible assets | | | | | | | | | | | | | | | | | | | (8,547 | ) | | | (8,547) | |
| | | | | | |
Integration and restructuring | | | | | | | | | | | | | | | | | | | (2,012 | ) | | | (2,012) | |
| | | | | | |
Transaction costs | | | | | | | | | | | | | | | | | | | (12,024 | ) | | | (12,024) | |
| | | | | | |
Other operating income | | | | | | | | | | | | | | | | | | | 1,347 | | | | 1,347 | |
| | | | | | |
Non-current asset impairment reversal | | | | | | | | | | | | | | | | | | | 23,267 | | | | 23,267 | |
| | | | | | |
Gain on disposal of Imaging IP | | | | | | | | | | | | | | | | | | | 14,931 | | | | 14,931 | |
| |
Operating profit | | | | | | | | | | | | | | | | | | | | | | | 96,967 | |
| |
| | | | | | |
Investment income | | | | | | | | | | | | | | | | | | | | | | | 731 | |
| | | | | | |
Exchange losses | | | | | | | | | | | | | | | | | | | | | | | (1,665) | |
| | | | | | |
Finance costs (note 9) | | | | | | | | | | | | | | | | | | | | | | | (2,200) | |
| |
Profit before tax | | | | | | | | | | | | | | | | | | | | | | | 93,833 | |
| |
The Group discloses underlying operating profit as the performance measure of segment result as this is the measure used in the decision-making and resource allocation process of the Chief Operating Decision Maker, which is the Group’s Chief Executive Officer.
There is no intra-segment revenue.
The accounting policies for the reportable segments are the same as the Group’s accounting policies.
Segment underlying operating profit represents operating profit earned by each segment without allocation, in each period, of share-based payment charges, amortisation of acquired intangible assets, integration and restructuring charges, transaction costs, other operating income, non-current asset impairment reversal, litigation and patent settlement charges, release of litigation provision, other operating income, goodwill and non-current asset impairment charges, fair value of contractual milestone payments and disposal of development operations.
Notes to the Consolidated Financial Statementscontinued
5 Segmental Reportingcontinued
| | | | | | | | | | | | | | | | | | | | | | | | |
| 52 weeks ended 27 December 2013 | | Auto $’000 | | | Consumer $’000 | | | Voice & Music
$’000 | | | Legacy $’000 | | | Unallocated $’000 | | | Consolidated
$’000 | |
| |
| | | | | | |
Revenue | | | | | | | | | | | | | | | | | | | | | | | | |
| | | | | | |
Total segment revenue | | | 228,834 | | | | 181,468 | | | | 311,962 | | | | 238,446 | | | | – | | | | 960,710 | |
| |
Segment result | | | | | | | | | | | | | | | | | | | | | | | | |
| |
| | | | | | |
Underlying operating (loss) profit | | | (7,426 | ) | | | (70,398 | ) | | | 123,094 | | | | 59,006 | | | | – | | | | 104,276 | |
| | | | | | |
Share-based payment charges | | | | | | | | | | | | | | | | | | | (38,143 | ) | | | (38,143) | |
| | | | | | |
Amortisation of acquired intangible assets | | | | | | | | | | | | | | | | | | | (16,793 | ) | | | (16,793) | |
| | | | | | |
Integration and restructuring | | | | | | | | | | | | | | | | | | | (24,678 | ) | | | (24,678) | |
| | | | | | |
Litigation and patent settlement charges | | | | | | | | | | | | | | | | | | | (4,650 | ) | | | (4,650) | |
| | | | | | |
Release of litigation provision | | | | | | | | | | | | | | | | | | | 9,827 | | | | 9,827 | |
| | | | | | |
Other operating income | | | | | | | | | | | | | | | | | | | 3,671 | | | | 3,671 | |
| | | | | | |
Goodwill and non-current asset impairment charges | | | | | | | | | | | | | | | | | | | (76,896 | ) | | | (76,896) | |
| | | | | | |
Fair value of contractual milestone payments | | | | | | | | | | | | | | | | | | | (5,000 | ) | | | (5,000) | |
| |
Operating loss | | | | | | | | | | | | | | | | | | | | | | | (48,386) | |
| |
| | | | | | |
Investment income | | | | | | | | | | | | | | | | | | | | | | | 920 | |
| | | | | | |
Exchange losses | | | | | | | | | | | | | | | | | | | | | | | (625) | |
| | | | | | |
Finance costs (note 9) | | | | | | | | | | | | | | | | | | | | | | | (4,368) | |
| |
Loss before tax | | | | | | | | | | | | | | | | | | | | | | | (52,459) | |
| |
| | | | | | |
| 52 weeks ended 28 December 2012 | | Auto $’000 | | | Consumer $’000 | | | Voice & Music
$’000 | | | Legacy $’000 | | | Unallocated $’000 | | | Consolidated
$’000 | |
| |
| | | | | | |
Revenue | | | | | | | | | | | | | | | | | | | | | | | | |
| | | | | | |
Total segment revenue | | | 212,178 | | | | 258,732 | | | | 190,119 | | | | 364,327 | | | | – | | | | 1,025,356 | |
| |
Segment result | | | | | | | | | | | | | | | | | | | | | | | | |
| |
| | | | | | |
Underlying operating profit (loss) | | | 3,245 | | | | (15,643 | ) | | | 75,115 | | | | 11,312 | | | | – | | | | 74,029 | |
| | | | | | |
Share-based payment charges | | | | | | | | | | | | | | | | | | | (27,753) | | | | (27,753) | |
| | | | | | |
Amortisation of acquired intangible assets | | | | | | | | | | | | | | | | | | | (22,732) | | | | (22,732) | |
| | | | | | |
Integration and restructuring | | | | | | | | | | | | | | | | | | | (27,523) | | | | (27,523) | |
| | | | | | |
Litigation and patent settlement charges | | | | | | | | | | | | | | | | | | | (15,500) | | | | (15,500) | |
| | | | | | |
Other operating income | | | | | | | | | | | | | | | | | | | 214 | | | | 214 | |
| | | | | | |
Disposal of development operations | | | | | | | | | | | | | | | | | | | 127,178 | | | | 127,178 | |
| |
Operating profit | | | | | | | | | | | | | | | | | | | | | | | 107,913 | |
| |
| | | | | | |
Investment income | | | | | | | | | | | | | | | | | | | | | | | 1,175 | |
| | | | | | |
Exchange losses | | | | | | | | | | | | | | | | | | | | | | | (395) | |
| | | | | | |
Finance costs (note 9) | | | | | | | | | | | | | | | | | | | | | | | (6,711) | |
| |
Profit before tax | | | | | | | | | | | | | | | | | | | | | | | 101,982 | |
| |
| | |
| 98 | | CSR plc Annual Report and Financial Statements 2014 |
Depreciation of property, plant and equipment and amortisation of other intangible assets have been apportioned to the operating segments as follows:
| | | | | | | | | | | | | | | | | | | | |
Depreciation of property, plant and equipment and amortisation of other intangible assets | | Auto
$’000 | | | Consumer
$’000 | | | Voice & Music
$’000 | | | Legacy
$’000 | | | Total
$’000 | |
| |
52 weeks ended 26 December 2014 | | | 8,791 | | | | 8,219 | | | | 6,170 | | | | 156 | | | | 23,336 | |
| |
52 weeks ended 27 December 2013 | | | 7,905 | | | | 11,211 | | | | 4,200 | | | | 805 | | | | 24,121 | |
| |
52 weeks ended 28 December 2012 | | | 4,950 | | | | 6,036 | | | | 4,436 | | | | 8,502 | | | | 23,924 | |
| |
No information is provided for segment assets and liabilities as these measures are not provided to the chief operating decision maker.
Revenues from Major Products
The Group’s revenues from its major products were as follows:
| | | | | | | | | | | | |
| | | 52 weeks ended
26 December 2014
$’000 | | | 52 weeks ended
27 December 2013
$’000 | | | 52 weeks ended
28 December 2012
$’000 | |
| |
Sale of integrated circuits | | | 721,865 | | | | 905,048 | | | | 964,774 | |
| | | |
Sale of software | | | 8,459 | | | | 10,930 | | | | 8,142 | |
| | | |
Royalties | | | 44,449 | | | | 44,732 | | | | 52,440 | |
| |
Consolidated revenue (excluding investment income) | | | 774,773 | | | | 960,710 | | | | 1,025,356 | |
| |
Geographical Information
The Group operates in three principal geographical areas— Europe (including the UK, the country of domicile), the Americas (including the USA) and Asia. The Group’s revenue from external customers and information about its segment assets (non-current assets excluding deferred tax assets and other financial assets) by geographical location is detailed below:
| | | | | | | | | | | | |
| Revenue | | 52 weeks ended
26 December 2014
$’000 | | | 52 weeks ended
27 December 2013
$’000 | | | 52 weeks ended
28 December 2012
$’000 | |
| |
Europe | | | 28,868 | | | | 32,352 | | | | 39,213 | |
| | | |
The Americas | | | 69,977 | | | | 73,395 | | | | 82,969 | |
| | | |
Asia | | | 675,928 | | | | 854,963 | | | | 903,174 | |
| |
| | | 774,773 | | | | 960,710 | | | | 1,025,356 | |
| |
Revenues are attributed to geographical areas on the basis of the customer’s manufacturing location.
| | | | | | | | | | | | |
| Non-current assets | | 26 December 2014
$’000 | | | 27 December 2013
$’000 | | | 28 December 2012
$’000 | |
| |
Europe | | | 129,888 | | | | 153,846 | | | | 160,807 | |
| | | |
The Americas | | | 85,926 | | | | 94,923 | | | | 107,652 | |
| | | |
Asia | | | 29,956 | | | | 24,787 | | | | 95,159 | |
| |
| | | 245,770 | | | | 273,556 | | | | 363,618 | |
| |
Non-current assets, being goodwill, property, plant and equipment and other intangible assets (excluding deferred tax assets) are attributed to the location where they are situated.
Information About Major Customers
In 2014, revenue of $44.4 million (2013: $112.1 million, 2012: $113.9 million), included within revenue arising from Consumer, Voice & Music and Auto and representing 6% (2013: 12%, 2012: 11%) of total revenue, related to the Group’s largest end customer.
In 2014, none of the Group’s end customers exceeded 10% of total revenue in the 52 week period, whereas in 2013 and 2012 only the largest end customer of the Group exceeded 10% of total revenue in the 52 week period. Revenue from the top five end customers represents 23% of total revenue (2013: 29%; 2012: 30%).
In 2014 our largest distributor accounted for approximately 29% of our revenue, compared to 21% of our revenue in 2013 and 16% of our revenue in 2012. This is included within revenue arising from Consumer, Voice & Music and Auto.
Notes to the Consolidated Financial Statementscontinued
6 Profit (loss) for the Period
Profit (loss) for the period has been arrived at after charging (crediting):
| | | | | | | | | | | | |
| | | 52 weeks ended
26 December 2014
$’000 | | | 52 weeks ended
27 December 2013
$’000 | | | 52 weeks ended
28 December 2012
$’000 | |
| |
Net foreign exchange losses | | | 1,795 | | | | 629 | | | | 1,638 | |
| | | |
Government grants towards staff and marketing costs | | | (120 | ) | | | (37 | ) | | | (671) | |
| | | |
Research and development UK tax credits | | | (9,878 | ) | | | (6,114 | ) | | | – | |
| | | |
Research and development costs, gross of R&D tax credits | | | 250,799 | | | | 279,140 | | | | 290,346 | |
| | | |
Depreciation of property, plant and equipment | | | 14,980 | | | | 12,484 | | | | 16,171 | |
| | | |
Loss (profit) on disposal of property, plant and equipment | | | 158 | | | | (196 | ) | | | 916 | |
| | | |
Amortisation of intangible assets | | | 16,903 | | | | 28,390 | | | | 30,485 | |
| | | |
Sublease income from non-cancellable operating leases | | | 1,951 | | | | 2,248 | | | | 1,099 | |
| | | |
Staff costs (see note 8) | | | 255,592 | | | | 301,625 | | | | 314,055 | |
| | | |
Cost of inventories recognised as expense | | | 293,894 | | | | 411,358 | | | | 468,500 | |
| | | |
Write-downs of inventories recognised as an expense | | | 4,182 | | | | 1,974 | | | | (2,267) | |
| | | |
Auditor’s remuneration for audit services (see note 7) | | | 1,002 | | | | 956 | | | | 993 | |
| |
| | | |
| 7 Auditor’s remuneration | | | | | | | | | | | | |
| | | |
| | | 52 weeks ended
26 December 2014
$’000 | | | 52 weeks ended
27 December 2013
$’000 | | | 52 weeks ended
28 December 2012
$’000 | |
| |
Fees payable to the Company’s auditor for the audit of the Company’s annual accounts | | | 72 | | | | 65 | | | | 68 | |
| | | |
Fees payable to the Company’s auditor and their associates for other services to the Group | | | | | | | | | | | | |
| | | |
— The audit of the Company’s subsidiaries pursuant to legislation | | | 675 | | | | 654 | | | | 678 | |
| | | |
— Services pursuant to section 404 of the Sarbanes-Oxley Act | | | 145 | | | | 132 | | | | 137 | |
| |
Total audit fees | | | 892 | | | | 851 | | | | 883 | |
| |
Other services | | | | | | | | | | | | |
| | | |
— Audit-related assurance | | | 110 | | | | 105 | | | | 110 | |
| | | |
— Taxation compliance services | | | 75 | | | | 208 | | | | 157 | |
| | | |
— Other taxation advisory services | | | 92 | | | | 53 | | | | 515 | |
| | | |
— Corporate finance services | | | 563 | | | | – | | | | 350 | |
| | | |
— Other services | | | – | | | | 34 | | | | – | |
| |
Total non-audit fees | | | 840 | | | | 400 | | | | 1,132 | |
| |
|
The audit-related assurance fees refer to fees for the performance of an interim review. Fees for corporate finance services in 2014 include professional services rendered in connection to the potential takeover of the Group by Qualcomm. 8 Staff Costs The average monthly number of employees (including executive directors) was: | |
| | | |
| | | 52 weeks ended
26 December 2014
Number | | | 52 weeks ended
27 December 2013
Number | | | 52 weeks ended
28 December 2012
Number | |
| |
Research and development | | | 1,499 | | | | 1,458 | | | | 1,654 | |
| | | |
Sales and marketing | | | 371 | | | | 413 | | | | 548 | |
| | | |
General and administrative | | | 241 | | | | 246 | | | | 272 | |
| |
| | | 2,111 | | | | 2,117 | | | | 2,474 | |
| |
| | |
| 100 | | CSR plc Annual Report and Financial Statements 2014 |
Their aggregate remuneration comprised:
| | | | | | | | | | | | |
| | | 52 weeks ended
26 December 2014
$’000 | | | 52 weeks ended
27 December 2013
$’000 | | | 52 weeks ended
28 December 2012
$’000 | |
| |
Salaries | | | 200,244 | | | | 238,140 | | | | 262,670 | |
| | | |
Social security costs | | | 24,477 | | | | 25,486 | | | | 17,541 | |
| | | |
Other pension costs | | | 8,298 | | | | 6,872 | | | | 8,109 | |
| | | |
Share-based payment charges | | | 22,573 | | | | 31,127 | | | | 25,735 | |
| |
| | | 255,592 | | | | 301,625 | | | | 314,055 | |
| |
| | | |
9 Finance Costs | | | | | | | | | | | | |
| | | 52 weeks ended
26 December 2014
$’000 | | | 52 weeks ended
27 December 2013
$’000 | | | 52 weeks ended
28 December 2012
$’000 | |
| |
Interest expense and similar charges | | | 358 | | | | 327 | | | | 594 | |
| | | |
Unwinding of discount rates | | | 1,842 | | | | 2,822 | | | | 4,019 | |
| | | |
Option premium cost | | | – | | | | – | | | | 2,098 | |
| | | |
Impairment of AFS investment | | | – | | | | 1,219 | | | | – | |
| |
| | | 2,200 | | | | 4,368 | | | | 6,711 | |
| |
| | | |
10 Dividends | | | | | | | | | | | | |
| | | 52 weeks ended
26 December 2014
$’000 | | | 52 weeks ended
27 December 2013
$’000 | | | 52 weeks ended
28 December 2012
$’000 | |
| |
| The directors have not proposed a final dividend for the period (2013: final dividend of $0.091 per share, 2012: final dividend of $0.080 per share) | | | – | | | | 15,203 | | | | 13,041 | |
| | | |
| Interim dividend for the period of $0.052 per share (2013: interim dividend of $0.045 per share, 2012: interim dividend of £0.023 per share) | | | 8,382 | | | | 7,317 | | | | 7,648 | |
| |
| | | 8,382 | | | | 22,520 | | | | 20,689 | |
| |
Notes to the Consolidated Financial Statementscontinued
11 Taxation
| | | | | | | | | | | | | | | | | | | | |
| | | 52 weeks ended
26 December 2014 $’000 | | | 52 weeks ended
27 December 2013 $’000 | | | 52 weeks ended 28 December 2012 $’000 |
|
| | | |
Current income tax charge | | | 3,533 | | | | 5,171 | | | 16,861 |
| | | |
Adjustment in respect of current income tax of prior years | | | 308 | | | | (4,853) | | | (299) |
|
Total current income tax charge | | | 3,841 | | | | 318 | | | 16,562 |
|
| | | |
Deferred tax charge (credit) | | | 6,098 | | | | 5,836 | | | 45,373 |
| | | |
Deferred tax benefit on recognition of previously unrecognised tax losses and temporary differences | | | (10,951) | | | | (435) | | | (16,456) |
| | | |
Deferred tax rate change | | | 126 | | | | (29) | | | 1,817 |
| | | |
Adjustment in respect of deferred tax of prior periods | | | (2,107) | | | | (11,820) | | | 3,453 |
|
Total deferred tax (credit) charge | | | (6,834) | | | | (6,448) | | | 34,187 |
|
Total tax (credit) charge | | | (2,993) | | | | (6,130) | | | 50,749 |
|
Corporation tax is calculated at 21.5% (2013: 23.25%; 2012: 24.5%) of the estimated assessable profit (loss) for the period. Taxation for other jurisdictions is calculated at the rates prevailing in the respective jurisdictions. The credit for the period can be reconciled to the profit (loss) per the income statement as follows: |
| | | 52 weeks ended 26 December 2014 | | | 52 weeks ended 27 December 2013 | | | 52 weeks ended 28 December 2012 |
|
| | | $’000 | | | % | | | $’000 | | | % | | | $’000 | | % |
|
Profit (loss) before tax | | | 93,833 | | | | 100.0 | | | | (52,459 | ) | | | 100.0 | | | 101,982 | | 100.0 |
|
| | | | | | |
Tax at the UK corporation tax rate of 21.5% (2013: 23.25%, 2012: 24.5%) | | | 20,174 | | | | (21.5 | ) | | | (12,197 | ) | | | 23.3 | | | 24,984 | | (24.5) |
| | | | | | |
Tax benefit of research and development expenditure | | | (928 | ) | | | 1.0 | | | | (5,954 | ) | | | 11.3 | | | (11,456) | | 11.2 |
| | | | | | |
Tax benefit of UK patent box | | | (2,282 | ) | | | 2.3 | | | | (2,656 | ) | | | 5.1 | | | – | | – |
| | | | | | |
Tax (benefit) expense of share based payments | | | (457 | ) | | | 0.5 | | | | (2,121 | ) | | | 4.0 | | | 3,499 | | (3.4) |
| | | | | | |
Effect of different tax rates of subsidiaries operating in other tax jurisdictions | | | 2,164 | | | | (2.3 | ) | | | 1,060 | | | | (2.0 | ) | | 6,834 | | (6.7) |
| | | | | | |
Adjustments to tax charge in respect of prior periods | | | (1,799 | ) | | | 1.9 | | | | (16,674 | ) | | | 31.8 | | | 3,154 | | (3.1) |
| | | | | | |
(Non-taxable income) non-deductible expenses | | | 1,238 | | | | (1.3 | ) | | | 2,954 | | | | (5.6 | ) | | 5,237 | | (5.2) |
| | | | | | |
Recognition of previously unrecognised tax losses and temporary differences | | | (10,951 | ) | | | 11.7 | | | | (435 | ) | | | 0.8 | | | (16,456) | | 16.1 |
| | | | | | |
(Unrecognised losses utilised) current period tax losses not recognised | | | (10,580 | ) | | | 11.3 | | | | 11,120 | | | | (21.2 | ) | | 9,626 | | (9.4) |
| | | | | | |
Deferred tax rate change | | | 126 | | | | (0.1 | ) | | | (29 | ) | | | 0.1 | | | 1,817 | | (1.8) |
| | | | | | |
Foreign withholding tax incurred and not creditible | | | 302 | | | | (0.3 | ) | | | 924 | | | | (1.8 | ) | | 6,397 | | (6.3) |
| | | | | | |
| Non-deductible costs and goodwill disposal relating to the disposal of development operations in handset connectivity and location | | | – | | | | – | | | | – | | | | – | | | 17,113 | | (16.7) |
| | | | | | |
Tax impact of Goodwill and non-current asset impairment | | | – | | | | – | | | | 17,878 | | | | (34.1 | ) | | – | | – |
|
| | | (2,993 | ) | | | 3.2 | | | | (6,130 | ) | | | 11.7 | | | 50,749 | | (49.8) |
|
The Finance Act 2013 enacted reductions in the UK Corporation tax rate from 23% to 21% from 1 April 2014 and from 21% to 20% from 1 April 2015. The effect of the new rate is to reduce the deferred tax asset by $0.08 million (2013: $0.02 million).
There are no additional proposed changes to the main rate of UK corporation tax. During 2014, a deferred tax asset of $11.0 million was recognised in respect of tax loss attributes in Israel on the basis that it is now probable they will be realised.
| | |
| 102 | | CSR plc Annual Report and Financial Statements 2014 |
In addition to the amounts charged to the income statement, the following amounts relating to tax have been recognised directly in other comprehensive income:
| | | | | | | | | | | | |
| Deferred tax | | 52 weeks ended
26 December 2014
$’000 | | | 52 weeks ended
27 December 2013
$’000 | | | 52 weeks ended
28 December 2012
$’000 | |
| |
Arising on income and expenses recognised in other comprehensive income: | | | | | | | | | | | | |
| | | |
Net tax on cash flow hedges | | | 1,452 | | | | (686 | ) | | | (1,210) | |
| | | |
Reclassifications from equity to the income statement: | | | | | | | | | | | | |
| | | |
Relating to cash flow hedges | | | 1,341 | | | | (131 | ) | | | 253 | |
| |
Total income tax recognised directly in other comprehensive income | | | 2,793 | | | | (817 | ) | | | (957) | |
| |
|
| In addition to the amount charged to the income statement and other comprehensive income, the following amounts relating to tax have been recognised directly in equity: | |
| Deferred tax | | 52 weeks ended
26 December 2014
$’000 | | | 52 weeks ended
27 December 2013
$’000 | | | 52 weeks ended
28 December 2012
$’000 | |
| |
Deferred tax benefit on share option gains | | | 5,613 | | | | 11,459 | | | | 573 | |
| | | |
Deferred tax benefit on losses in respect of share options exercised during the year | | | 4,902 | | | | 3,202 | | | | 436 | |
| |
| | | 10,515 | | | | 14,661 | | | | 1,009 | |
| |
Deferred tax
The following are the major deferred tax assets and liabilities recognised by the Group and movements thereon during the period and prior reporting period:
| | | | | | | | | | | | | | | | | | | | | | | | | | | | |
| | | Property, plant
and equipment
$’000 | | | Share-based
payment
$’000 | | | Intangibles
$’000 | | | Tax losses
$’000 | | | Hedging
differences
$’000 | | | Other short-term
temporary
differences
$’000 | | | Total $’000 | |
| |
At 28 December 2012 | | | 7,747 | | | | 2,714 | | | | (20,883 | ) | | | 71,223 | | | | (567 | ) | | | 24,068 | | | | 84,302 | |
| | | | | | | |
(Charge) credit to income | | | (895 | ) | | | 2,339 | | | | 15,531 | | | | 6,072 | | | | – | | | | (16,628 | ) | | | 6,419 | |
| | | | | | | |
Credit to equity | | | – | | | | 11,459 | | | | – | | | | 3,202 | | | | – | | | | – | | | | 14,661 | |
| | | | | | | |
Charge to other comprehensive income | | | – | | | | – | | | | – | | | | – | | | | (817 | ) | | | – | | | | (817) | |
| | | | | | | |
Recategorisation | | | 473 | | | | 4,236 | | | | 1,430 | | | | 783 | | | | – | | | | (6,922 | ) | | | – | |
| | | | | | | |
Effect of change in tax rate – equity | | | – | | | | (460 | ) | | | – | | | | – | | | | 99 | | | | – | | | | (361) | |
| | | | | | | |
Effect of change in tax rate – income | | | (284 | ) | | | (317 | ) | | | (10 | ) | | | 123 | | | | – | | | | 517 | | | | 29 | |
| |
At 27 December 2013 | | | 7,041 | | | | 19,971 | | | | (3,932 | ) | | | 81,403 | | | | (1,285 | ) | | | 1,035 | | | | 104,233 | |
| |
(Charge) credit to income | | | (439 | ) | | | (1,287 | ) | | | 519 | | | | 11,004 | | | | – | | | | (2,837 | ) | | | 6,960 | |
| | | | | | | |
Credit to equity | | | – | | | | 5,613 | | | | – | | | | 4,902 | | | | – | | | | – | | | | 10,515 | |
| | | | | | | |
Charge to other comprehensive income | | | – | | | | – | | | | – | | | | – | | | | 2,788 | | | | – | | | | 2,788 | |
| | | | | | | |
R&D Expenditure Credit transfer | | | – | | | | – | | | | – | | | | – | | | | – | | | | 470 | | | | 470 | |
| | | | | | | |
Effect of change in tax rate – equity | | | – | | | | 541 | | | | – | | | | – | | | | 5 | | | | – | | | | 546 | |
| | | | | | | |
Effect of change in tax rate – income | | | (103 | ) | | | (157 | ) | | | 255 | | | | (36 | ) | | | – | | | | (85 | ) | | | (126) | |
| |
At 26 December 2014 | | | 6,499 | | | | 24,681 | | | | (3,158 | ) | | | 97,273 | | | | 1,508 | | | | (1,417 | ) | | | 125,386 | |
| |
Notes to the Consolidated Financial Statementscontinued
11 Taxationcontinued
Certain deferred tax assets and liabilities have been offset where they relate to the same taxation authority and net settlement and offset is permitted. The following is the analysis of the deferred tax balances (after offset) for financial reporting purposes:
| | | | | | | | |
| | | 26 December 2014
$’000 | | | 27 December 2013
$’000 | |
| |
Deferred tax assets | | | 129,296 | | | | 109,181 | |
| | |
Deferred tax liabilities | | | (3,910 | ) | | | (4,948) | |
| |
| | | 125,386 | | | | 104,233 | |
| |
At the balance sheet date, the Group has unused tax losses of $858,804,327 (2013: $716,703,068) and unused tax credits of $39,517,828 (2013: $38,192,791) available for offset against future profits. A deferred tax asset has been recognised in respect of $276,558,069 (2013: $217,894,425) of the tax losses and $11,917,102 of tax credits (2013: $11,464,540). No deferred tax asset has been recognised in respect of the remaining unused tax losses of $582,246,258 (2013: $498,808,643) and unused tax credits of $27,600,726 (2013: $26,728,251) due to either a history of tax losses, uncertain tax positions, or it is not considered probable that there will be sufficient future taxable profits to realise the benefit of all deferred tax assets within certain subsidiary entities. Included in unrecognised tax losses and unrecognised tax credits are tax losses of $257,735,277 (2013: $212,129,934) and tax credits of $27,600,276 (2013: $26,728,251) that will expire in 5-19 years. Other losses may be carried forward indefinitely.
At the balance sheet date, no deferred tax liability has been recognised on temporary differences of $30,311,672 (2013: $28,289,628) relating to the unremitted earnings of overseas subsidiaries as the Group is able to control the timing of the reversal of these temporary differences and it is probable that they will not reverse in the foreseeable future. The temporary differences at 26 December 2014 represent only the unremitted earnings of those overseas subsidiaries where remittance to the UK of those earnings may still result in a tax liability, principally as a result of dividend withholding taxes levied by the overseas tax jurisdictions in which those subsidiaries operate.
The recognition of the deferred tax asset is based on management’s assessment of historic profitability, forecasted operating results based upon approved business plans and a review of the tax planning opportunities. Based on this, management concluded that there is convincing evidence for the recognition of deferred tax assets in excess of the deferred tax liability by $106,336,381 (2013: $88,250,962) in entities that have suffered a loss in the current or preceding periods.
12 Earnings (Loss) Per Share
Basic earnings (loss) per share is calculated by dividing profit (loss) by the weighted average number of ordinary shares in issue throughout the period, adjusting for ordinary shares held in Treasury and ordinary shares held by the Employee Benefit Trust.
For diluted earnings (loss) per share, the weighted average number of ordinary shares is further adjusted for the effect of potentially dilutive ordinary shares, arising from the assumed exercise of employee share options and share awards that are ‘in the money’ and for which management has identified that performance conditions, associated with the vesting of certain employee share options and awards, is likely to be achieved.
For a description of the Group’s employee share option and share award plans, refer to note 29.
Earnings (loss) per share is only diluted when the result for the period is a profit.
13 Goodwill
| | | | |
| Cost | | $’000 | |
| |
At 27 December 2013 and 28 December 2012 | | | 218,784 | |
| |
Recognised on acquisition of Reciva Limited | | | 1,991 | |
| |
At 26 December 2014 | | | 220,775 | |
| |
| |
Accumulated impairment losses | | | | |
At 28 December 2012 | | | (36,907) | |
| |
Impairment of goodwill associated with Cameras cash generating unit | | | (50,537) | |
| |
At 26 December 2014 and 27 December 2013 | | | (87,444) | |
| |
| Carrying Amount | | | | |
| |
At 26 December 2014 | | | 133,331 | |
| |
At 27 December 2013 | | | 131,340 | |
| |
At 28 December 2012 | | | 181,877 | |
| |
| | |
| 104 | | CSR plc Annual Report and Financial Statements 2014 |
Goodwill acquired in a business combination is allocated, at acquisition, to the cash generating units that are expected to benefit from that business combination. Further disclosures are provided below for all cash generating units where the Group holds an individual goodwill item relating to a CGU which is significant, which management considers to be 10% of the total net book value in comparison with the Group’s total carrying value of goodwill, or, where there are no significant allocations of goodwill at a lower level, for groups of cash generating units within a reportable segment. The carrying amount of goodwill has been allocated as follows:
| | | | | | | | |
| Reportable segments and cash generating units | | 26 December 2014
$’000 | | | 27 December 2013
$’000 | |
| |
Automotive Business Group | | | 51,404 | | | | 51,404 | |
| | |
Consumer Business Group | | | | | | | | |
| | |
Printers | | | 58,161 | | | | 58,161 | |
| | |
Other Consumer CGUs | | | 9,505 | | | | 9,505 | |
| | |
Voice & Music Business Group | | | 14,261 | | | | 12,270 | |
| |
| | | 133,331 | | | | 131,340 | |
| |
Movements in goodwill
In 2014 the acquisition of the people and assets of Reciva Limited recognised goodwill of $2.0 million, all of which was allocated to the Voice & Music cash generating unit.
In 2013 $50.5 million of goodwill allocated to the Cameras CGU was impaired following the decision to cease development of future camera–on-a-chip (COACH) platform products. There is now no goodwill allocated to the Cameras cash generating unit.
During 2012 goodwill of $151.5 million allocated to the Legacy CGU was de-recognised following the disposal of development operations in handset connectivity and handset location to Samsung during 2012, as it was no longer deemed to be recoverable. There is now no goodwill allocated to this CGU.
2014 impairment testing
The Group tests the assets allocated to different CGUs for impairment on an annual basis or more frequently if there are indications that goodwill might be impaired. The assets tested include directly attributable goodwill, intangible and tangible assets, and inventory as well as an allocation of corporate assets.
The recoverable value in use was estimated as the fair value less costs of disposal based on the offer price received from Qualcomm as disclosed in the Scheme document published in November 2014. Costs of disposal were also estimated based on the Scheme document updated to reflect the actual costs incurred to date, as well as costs expected to be incurred. The recoverable value was then allocated to CGUs based on an estimate of the relative fair value of each CGU. The estimation methodology is the same for all cash generating units.
The Group has conducted sensitivity analysis on a variety of scenarios when completing the annual impairment review. The directors have concluded that there are no cash generating units where reasonably possible changes in assumptions would cause the carrying amount of a CGU to exceed its recoverable value.
2013 impairment testing
In 2013 the Group estimated the recoverable amount based on the Group’s value in use. The estimation methodology was the same for all cash generating units.
The value in use calculations were based upon cash flow forecasts derived from the most recent financial budget and longer range financial plans which were reviewed and approved by management and the Board of Directors. The key assumptions for the value in use calculations were those regarding the growth in future sales, projected production costs, operating expenditures, discount rates and terminal growth rates.
Future sales were estimated based on recent reports on the markets the Group operates in, produced by independent analysts and containing estimates for market size for a number of different technologies in different end markets. These external estimates were compared with internal estimates to produce a considered view of available market size and likely market shares. Management used this information, combined with internal customer specific information regarding design wins, projected changes in market share-based on current positions and forecast technology penetration rates, to derive its best assessment of the future sales and gross margins. A terminal value was included for the period beyond five years from the balance sheet date based upon the estimated cashflows in the fifth year and a terminal growth rate of 3.5%. This rate was based on our assessment of the future growth potential of the Group, considering that much of our business operates in Asian markets where growth rates are typically high. While growth rates fell globally due to the macro economic situation, this rate was beneath the long term growth rate projected for our major markets.
Variation in selling prices and direct costs were based on well established trends in the semiconductor industry as well as management’s experience of how pricing and direct costs vary over a product’s lifecycle, incorporating the impacts of already quoted selling prices and the result of discussions with suppliers on future direct cost movements. Projected operating expenditures were based upon the long term operating model of the Group, adjusted to remove the impact of any planned restructuring activities.
Management used discount rates that equated to the weighted average cost of capital and estimating risk free rates based on US Treasury Bonds, using published equity betas for the Group and making a reasonable estimate of the Equity Risk Premium. Management has concluded that it was appropriate to use a pre tax discount rate of 12.7% in 2013, which fully reflected the risk profile of the Group.
Notes to the Consolidated Financial Statementscontinued
14 Other Intangible Assets
| | | | | | | | | | | | | | | | | | | | | | | | | | | | | | | | |
| | | Internally
developed
technology
$’000 | | | Trade names
$’000 | | | Purchased
developed
technology
$’000 | | | Purchased in
process
research and
development
$’000 | | | Customer
contracts and
relationships
$’000 | | | Software
licences and
intellectual
property
$’000 | | | Assets in the
course of
construction
$’000 | | | Total $’000 | |
| |
Cost | | | | | | | | | | | | | | | | | | | | | | | | | | | | | | | | |
| | | | | | | | |
At 28 December 2012 | | | 4,723 | | | | 5,510 | | | | 64,430 | | | | 40,630 | | | | 47,277 | | | | 65,578 | | | | 290 | | | | 228,438 | |
| | | | | | | | |
Additions | | | – | | | | – | | | | – | | | | – | | | | – | | | | 6,482 | | | | – | | | | 6,482 | |
| | | | | | | | |
Disposals | | | – | | | | – | | | | – | | | | – | | | | (2,950 | ) | | | (226 | ) | | | – | | | | (3,176) | |
| | | | | | | | |
Transfers | | | – | | | | – | | | | – | | | | – | | | | – | | | | – | | | | (257 | ) | | | (257) | |
| |
At 27 December 2013 | | | 4,723 | | | | 5,510 | | | | 64,430 | | | | 40,630 | | | | 44,327 | | | | 71,834 | | | | 33 | | | | 231,487 | |
| |
Additions | | | – | | | | – | | | | – | | | | – | | | | – | | | | 5,002 | | | | 1,533 | | | | 6,535 | |
| | | | | | | | |
Acquisition of Reciva business | | | – | | | | 3,100 | | | | – | | | | – | | | | – | | | | – | | | | – | | | | 3,100 | |
| | | | | | | | |
Disposals | | | – | | | | (1,790 | ) | | | (18,080 | ) | | | (6,050 | ) | | | (10,240 | ) | | | (243 | ) | | | – | | | | (36,403) | |
| |
At 26 December 2014 | | | 4,723 | | | | 6,820 | | | | 46,350 | | | | 34,580 | | | | 34,087 | | | | 76,593 | | | | 1,566 | | | | 204,719 | |
| |
Amortisation | | | | | | | | | | | | | | | | | | | | | | | | | | | | | | | | |
| | | | | | | | |
At 28 December 2012 | | | 4,723 | | | | 3,377 | | | | 22,625 | | | | 31,756 | | | | 17,677 | | | | 27,607 | | | | – | | | | 107,765 | |
| | | | | | | | |
Charge for the period | | | – | | | | 703 | | | | 8,173 | | | | 1,833 | | | | 6,086 | | | | 11,595 | | | | – | | | | 28,390 | |
| | | | | | | | |
Impairment loss | | | – | | | | 978 | | | | 12,269 | | | | 3,783 | | | | 6,949 | | | | 2,205 | | | | – | | | | 26,184 | |
| | | | | | | | |
Disposals | | | – | | | | – | | | | – | | | | – | | | | (2,949 | ) | | | (189 | ) | | | – | | | | (3,138) | |
| |
At 27 December 2013 | | | 4,723 | | | | 5,058 | | | | 43,067 | | | | 37,372 | | | | 27,763 | | | | 41,218 | | | | – | | | | 159,201 | |
| |
Charge for the period | | | – | | | | 870 | | | | 3,272 | | | | 859 | | | | 3,543 | | | | 8,359 | | | | – | | | | 16,903 | |
| | | | | | | | |
Disposals | | | – | | | | (1,790 | ) | | | (18,080 | ) | | | (6,050 | ) | | | (10,240 | ) | | | (243 | ) | | | – | | | | (36,403) | |
| |
At 26 December 2014 | | | 4,723 | | | | 4,138 | | | | 28,259 | | | | 32,181 | | | | 21,066 | | | | 49,334 | | | | – | | | | 139,701 | |
| |
Carrying amount | | | | | | | | | | | | | | | | | | | | | | | | | | | | | | | | |
| | | | | | | | |
At 26 December 2014 | | | – | | | | 2,682 | | | | 18,091 | | | | 2,399 | | | | 13,021 | | | | 27,259 | | | | 1,566 | | | | 65,018 | |
| |
At 27 December 2013 | | | – | | | | 452 | | | | 21,363 | | | | 3,258 | | | | 16,564 | | | | 30,616 | | | | 33 | | | | 72,286 | |
| |
At 28 December 2012 | | | – | | | | 2,133 | | | | 41,805 | | | | 8,874 | | | | 29,600 | | | | 37,971 | | | | 290 | | | | 120,673 | |
| |
Leased assets included above: | | | | | | | | | | | | | | | | | | | | | | | | | | | | | | | | |
| | | | | | | | |
At 26 December 2014 | | | – | | | | – | | | | – | | | | – | | | | – | | | | 793 | | | | – | | | | 793 | |
| | | | | | | | |
At 27 December 2013 | | | – | | | | – | | | | – | | | | – | | | | – | | | | 1,709 | | | | – | | | | 1,709 | |
| |
As a consequence of the Group’s decision in 2013 to cease investment in future COACH products, an impairment charge of $26.1 million was recognised in 2013, to reduce the carrying amount of intangible assets associated with the Cameras CGU within the Consumer segment down to $nil. These assets were subsequently sold during 2014.
Once it became certain that these assets would be sold, this triggered an assessment of the carrying value of assets allocated to the Cameras CGU within the Consumer Segment. The outcome of this assessment was to re-instate the intangibles assets, at a carrying amount equivalent to that if the assets had not been impaired ($23.3 million) and reverse the impairment charges made against those non-current assets in December 2013. Refer to note 33 for further details.
Refer to note 34 for further information about the Reciva business acquisition.
At 26 December 2014, the Group had entered into contractual commitments for the acquisition of other intangible assets amounting to $1,326,000 (2013: $849,000).
The net book value of materially significant software licenses are as follows:
| | | | | | | | | | | | |
| Software license | | End of Useful
Economic Life | | | 26 December 2014 $’000 | | | 27 December 2013
$’000 | |
| |
Multi-year licensing arrangement over wireless patent portfolio | | | December 2017 | | | | 5,412 | | | | 8,010 | |
| | | |
Multi-year licensing arrangement over certain processors and associated IP | | | Various | | | | 10,425 | | | | 10,724 | |
| |
| | |
| 106 | | CSR plc Annual Report and Financial Statements 2014 |
15 Property, Plant and Equipment
| | | | | | | | | | | | | | | | | | | | | | | | | | | | |
| | | | | | | | | | | | | | | | | | Assets in the | | | | |
| | | | | | Leasehold | | | Furniture and | | | Computer | | | Office | | | course of | | | | |
| | | Test equipment | | | improvements | | | fittings | | | equipment | | | equipment | | | construction | | | Total | |
| | | $’000 | | | $’000 | | | $’000 | | | $’000 | | | $’000 | | | $’000 | | | $’000 | |
| |
Cost | | | | | | | | | | | | | | | | | | | | | | | | | | | | |
| | | | | | | |
At 28 December 2012 | | | 95,810 | | | | 11,558 | | | | 3,085 | | | | 29,632 | | | | 4,504 | | | | – | | | | 144,589 | |
| | | | | | | |
Additions | | | 8,583 | | | | 9,039 | | | | 1,954 | | | | 2,386 | | | | 687 | | | | – | | | | 22,649 | |
| | | | | | | |
Disposals | | | (1,105) | | | | (342) | | | | (646) | | | | (179) | | | | (340) | | | | – | | | | (2,612) | |
| | | | | | | |
Transfers | | | 257 | | | | – | | | | – | | | | – | | | | – | | | | – | | | | 257 | |
| |
At 27 December 2013 | | | 103,545 | | | | 20,255 | | | | 4,393 | | | | 31,839 | | | | 4,851 | | | | – | | | | 164,883 | |
| | | | | | | |
Additions | | | 11,072 | | | | 6,665 | | | | 1,002 | | | | 2,915 | | | | 627 | | | | 370 | | | | 22,651 | |
| | | | | | | |
Disposals | | | (3,615) | | | | (16) | | | | (102) | | | | (354) | | | | (62) | | | | – | | | | (4,149) | |
| |
At 26 December 2014 | | | 111,002 | | | | 26,904 | | | | 5,293 | | | | 34,400 | | | | 5,416 | | | | 370 | | | | 183,385 | |
| |
Depreciation | | | | | | | | | | | | | | | | | | | | | | | | | | | | |
| | | | | | | |
At 28 December 2012 | | | 81,215 | | | | 9,032 | | | | 1,760 | | | | 23,198 | | | | 3,035 | | | | – | | | | 118,240 | |
| | | | | | | |
Charge for the period | | | 6,517 | | | | 1,392 | | | | 656 | | | | 3,205 | | | | 714 | | | | – | | | | 12,484 | |
| | | | | | | |
Disposals | | | (1,080) | | | | (290) | | | | (606) | | | | (164) | | | | (300) | | | | – | | | | (2,440) | |
| | | | | | | |
Impairment loss | | | 175 | | | | – | | | | – | | | | – | | | | – | | | | – | | | | 175 | |
| |
At 27 December 2013 | | | 86,827 | | | | 10,134 | | | | 1,810 | | | | 26,239 | | | | 3,449 | | | | – | | | | 128,459 | |
| | | | | | | |
Charge for the period | | | 6,870 | | | | 3,407 | | | | 882 | | | | 3,112 | | | | 709 | | | | – | | | | 14,980 | |
| | | | | | | |
Disposals | | | (3,534) | | | | (16) | | | | (9) | | | | (354) | | | | (62) | | | | – | | | | (3,975) | |
| |
At 26 December 2014 | | | 90,163 | | | | 13,525 | | | | 2,683 | | | | 28,997 | | | | 4,096 | | | | – | | | | 139,464 | |
| |
| | | | | | | |
Carrying amount | | | | | | | | | | | | | | | | | | | | | | | | | | | | |
| | | | | | | |
At 26 December 2014 | | | 20,839 | | | | 13,379 | | | | 2,610 | | | | 5,403 | | | | 1,320 | | | | 370 | | | | 43,921 | |
| | | | | | | |
At 27 December 2013 | | | 16,718 | | | | 10,121 | | | | 2,583 | | | | 5,600 | | | | 1,402 | | | | – | | | | 36,424 | |
| | | | | | | |
At 28 December 2012 | | | 14,595 | | | | 2,526 | | | | 1,325 | | | | 6,434 | | | | 1,469 | | | | – | | | | 26,349 | |
| |
Leased assets included above have a carrying amount of $nil (27 December 2013: $nil).
At 26 December 2014, the Group had entered into contractual commitments for the acquisition of property, plant and equipment amounting to $513,000 (27 December 2013: $1,016,000).
16 Long-term assets
| | | | | | | | |
| | | 26 December 2014
$’000 | | | 27 December 2013
$’000 | |
| |
Long-term assets | | | – | | | | 31,006 | |
| |
As part of the Samsung transaction during 2012, $31.0 million of the cash consideration was not received directly into CSR, but was placed by Samsung into an escrow account for use against future potential warranty claims from third parties. CSR has full rights over this cash, which will revert to CSR if unused after 36 months. There were no claims, either filed or outstanding, at the Balance Sheet date (27 December 2013: no claims filed or outstanding).
The Group has rights over any interest arising on the balance in escrow account and hence there is no requirement to discount this asset. At the balance sheet date, this asset was to revert to CSR in approximately nine months and accordingly has been reclassified as a current asset (refer to note 18).
The amounts held in escrow have been included as a component of the consideration for the disposal of development operations in handset connectivity and location, see note 35.
Notes to the Consolidated Financial Statementscontinued
17 Inventories
| | | | | | | | |
| | | 26 December 2014
$’000 | | | 27 December 2013
$’000 | |
| |
Raw materials | | | 15,020 | | | | 23,661 | |
| | |
Work in progress | | | 9,682 | | | | 17,575 | |
| | |
Finished goods | | | 31,718 | | | | 32,678 | |
| |
| | | 56,420 | | | | 73,914 | |
| |
18 Other Assets | |
| Trade and other receivables | | 26 December 2014
$’000 | | | 27 December 2013
$’000 | |
| |
Amounts receivable for sale of goods and software | | | 67,542 | | | | 67,705 | |
| | |
Amounts receivable for royalties | | | 9,091 | | | | 12,366 | |
| |
Total trade receivables | | | 76,633 | | | | 80,071 | |
| | |
Short-term assets | | | 38,506 | | | | – | |
| | |
VAT | | | 3,108 | | | | 2,362 | |
| | |
Other debtors | | | 20,852 | | | | 13,224 | |
| | |
Prepayments and accrued income | | | 14,418 | | | | 15,489 | |
| |
| | | 153,517 | | | | 111,146 | |
| |
Short-term assets
This is comprised of cash consideration received for both the disposal of development operations in handset connectivity and location (see note 35) and the disposal of Imaging IP (see note 33), which has been placed into an escrow account for use against future potential warranty claims from third parties. CSR has full rights over this cash, which will revert to CSR if unused after 36 months (disposal of development operations in handset connectivity) and 18 months (disposal of Imaging IP) after the respective disposal dates.
There were no claims, either filed or outstanding, at the Balance Sheet date (27 December 2013: no claims filed or outstanding).
The Group has rights over any interest arising on the balances held in escrow account and hence there is no requirement to discount these assets.
Trade receivables
The average credit period taken on trade receivables is 38 days (27 December 2013: 37 days). A specific allowance has been made for estimated irrecoverable amounts within trade receivables of $472,000 (27 December 2013: $136,000). This allowance has been determined by reference to past default experience. An allowance for credit notes and price adjustments has also been made within trade receivables of $350,000 (27 December 2013: $350,000).
Before accepting any new customers, the Group uses a credit scoring system to assess the potential customer’s credit quality and define credit limits by customer. Credit limits and credit quality are regularly reviewed. It is the policy of the Group to only transact with creditworthy entities to mitigate the risk of default associated with trade receivables. The Group provides for trade receivables based on amounts estimated as irrecoverable determined by reference to past default experience.
The directors consider that the carrying amount of trade and other receivables approximates to their fair value.
Cash and Cash Equivalents
Bank balances and cash comprise cash held by the Group and short-term bank deposits with an original maturity of three months or less. The carrying amount of these assets approximates to their fair value.
Credit Risk
The Group’s principal financial assets are cash and cash equivalents, treasury deposits and investments, and trade and other receivables.
The credit risk on liquid funds and derivative financial instruments is actively managed to limit the associated risk and counterparties are banks with high credit ratings assigned by international credit rating agencies.
| | |
| 108 | | CSR plc Annual Report and Financial Statements 2014 |
Exposure to credit risk
The carrying amount of financial assets represents the maximum credit exposure. The maximum exposure to credit risk at the reporting date was:
| | | | | | | | | | |
| | | | | | | 26 December 2014 | | | 27 December 2013 |
| | | | | | | $’000 | | | $’000 |
|
| | | | |
Total trade receivables | | | | | | | 76,633 | | | 80,071 |
| | | | |
VAT and other debtors | | | | | | | 23,960 | | | 15,586 |
| | | | |
Cash and cash equivalents | | | | | | | 207,843 | | | 227,468 |
| | | | |
Treasury deposits | | | | | | | 75,357 | | | 78,776 |
| | | | |
Derivative financial instruments | | | | | | | – | | | 6,171 |
|
| | | | |
| | | | | | | 383,793 | | | 408,072 |
|
|
| The maximum exposure to credit risk for total trade receivables at the reporting date by geographic region was: |
| | | | |
| | | | | | | 26 December 2014 | | | 27 December 2013 |
| | | | | | | $’000 | | | $’000 |
|
| | | | |
Europe | | | | | | | 2,641 | | | 2,621 |
| | | | |
USA | | | | | | | 6,595 | | | 6,658 |
| | | | |
Asia | | | | | | | 66,604 | | | 69,122 |
| | | | |
Other | | | | | | | 793 | | | 1,670 |
|
| | | | |
| | | | | | | 76,633 | | | 80,071 |
|
The Group’s exposure to credit risk is spread over a number of counterparties and customers with limited concentrations.
The Group’s largest customer accounts for $3.8 million of trade receivables at 26 December 2014 (27 December 2013: $5.2 million).
Impairment Losses
The aging of total trade receivables at the reporting date was:
| | | | | | | | | | | | | | |
| | | Gross 26 December 2014 | | | Impairment
26 December 2014 | | | Gross 27 December 2013 | | | Impairment
27 December 2013 |
| | | $’000 | | | $’000 | | | $’000 | | | $’000 |
|
| | | | |
Not past due | | | 70,168 | | | | (206 | ) | | | 78,489 | | | (175) |
| | | | |
Past due 1–30 days | | | 6,777 | | | | (210 | ) | | | 1,593 | | | (175) |
| | | | |
Past due 31–60 days | | | 60 | | | | (49 | ) | | | 47 | | | (27) |
| | | | |
Past due 61–90 days | | | 242 | | | | (242 | ) | | | 273 | | | – |
| | | | |
More than 91 days past due | | | 208 | | | | (115 | ) | | | 155 | | | (109) |
|
| | | | |
| | | 77,455 | | | | (822 | ) | | | 80,557 | | | (486) |
|
|
| The movement in the allowances in respect of trade receivables during the period was as follows: |
| | | | |
| | | | | | | | | 26 December 2014 | | | 27 December 2013 |
| | | | | | | | | $’000 | | | $’000 |
|
| | | | |
Balance at the beginning of the period | | | | | | | | | | | 486 | | | 799 |
| | | | |
Utilised in the period | | | | | | | | | | | (244 | ) | | (457) |
| | | | |
Additional provisions in the period | | | | | | | | | | | 580 | | | 144 |
|
| | | | |
Balance at the end of the period | | | | | | | | | | | 822 | | | 486 |
|
Included in the Group’s trade receivables balance are debtors with a carrying amount of $6.7 million (2013: $1.8 million) which are past due but for which the Group has not provided, as there has been no significant change in the credit quality of the receivables and the amounts are still considered recoverable. $5.6 million of the past due but not provided trade receivables were received within two weeks of the balance sheet date (2013: $1.1 million).
Based on past experience, the Group believes that no impairment allowance is necessary in respect of trade receivables not past due, other than for credit notes or price adjustments.
Notes to the Consolidated Financial Statementscontinued
19 Derivative Financial Instruments
Currency Derivatives
The Group utilises currency derivatives to hedge significant future transactions and cash flows. The instruments purchased during the year were denominated in both Sterling and Euros.
At the balance sheet date, the total notional amount of outstanding forward foreign exchange contracts, designated in hedging relationships, that the Group has committed is as below:
| | | | | | | | | | | | |
| | | | | | 26 December 2014 | | | 27 December 2013 | |
| | | | | | $’000 | | | $’000 | |
| |
| | | |
Forward foreign exchange contracts | | | | | | | 141,420 | | | | 104,195 | |
| |
|
The Group purchases sterling forward contracts to address significant exchange exposures for the next 14 months (2013: 12 months) on forecast Sterling expenditure. These arrangements are renewed on a rolling basis to cover between 11 and 15 months forward. At the balance sheet date, the fair value of the Group’s currency derivatives is shown below: Derivatives that are designated and effective as hedging instruments carried at fair value | |
| | | | | | 26 December 2014 | | | 27 December 2013 | |
| | | | | | $’000 | | | $’000 | |
| |
| | | |
Forward foreign exchange contracts | | | | | | | | | | | | |
| | | |
Assets | | | | | | | – | | | | 6,011 | |
| | | |
Liabilities | | | | | | | (7,409 | ) | | | – | |
| |
| | | |
| | | | | | | (7,409 | ) | | | 6,011 | |
| |
|
The fair value of currency derivatives that are designated and effective as cash flow hedges amounting to a liability of $7,409,000 (2013: asset of $6,011,000) has been deferred in equity. Net amounts of $5,674,000 (2013: $546,000; 2012: $991,000;) and $356,000 (2013: $24,000; 2012: $49,000) respectively have been transferred to operating expenses in the income statement and fixed assets in respect of contracts maturing in the period. Financial assets carried at Fair Value Through Profit or Loss (FVTPL) | |
| | | | | | 26 December 2014 | | | 27 December 2013 | |
| | | | | | $’000 | | | $’000 | |
| |
| | | |
Forward foreign exchange contracts | | | | | | | (226 | ) | | | 160 | |
| |
|
Further details of derivative financial instruments are given in note 31. 20. Other financial liabilities Trade and Other Payables | |
| | | Note | | | 26 December 2014 | | | 27 December 2013 | |
| | | | $’000 | | | $’000 | |
| |
| | | |
Trade creditors | | | | | | | 55,223 | | | | 49,468 | |
| | | |
Other taxation and social security | | | | | | | 6,280 | | | | 8,453 | |
| | | |
Other payables | | | | | | | 10,239 | | | | 8,203 | |
| | | |
Inventory accruals | | | | | | | 10,877 | | | | 13,605 | |
| | | |
Other accruals and deferred income | | | | | | | 98,873 | | | | 146,532 | |
| | | |
Defined benefit pension scheme deficit | | | 30 | | | | 36 | | | | 87 | |
| | | |
Obligations under finance leases | | | 21 | | | | - | | | | 728 | |
| |
| | | |
| | | | | | | 181,528 | | | | 227,076 | |
| |
| | | |
| | | | | | 26 December 2014 | | | 27 December 2013 | |
| | | | | | $’000 | | | $’000 | |
| |
| | | |
Analysed as: | | | | | | | | | | | | |
| | | |
Amounts due for settlement within 12 months (shown under current liabilities) | | | | | | | 164,691 | | | | 199,079 | |
| | | |
Amounts due for settlement after 12 months | | | | | | | 16,837 | | | | 27,997 | |
| |
| | | |
| | | | | | | 181,528 | | | | 227,076 | |
| |
| | |
| 110 | | CSR plc Annual Report and Financial Statements 2014 |
Trade creditors and accruals principally comprise amounts outstanding for trade purchases and ongoing costs. The average credit period taken for trade purchases is 44 days (2013: 37 days).
The directors consider that the carrying amount of trade and other payables approximates to their fair value.
For most suppliers, no interest is charged on trade payables. The Group has financial risk management policies in place to ensure that all payables are paid within the credit time-frame.
21 Obligations Under Finance Leases
| | | | | | | | | | | | | | | | | | | | |
| | | | | | Minimum lease payments | | | Present value of minimum lease payments | |
| |
| | | | | | 26 December 2014 | | | 27 December 2013 | | | 26 December 2014 | | | 27 December 2013 | |
| | | | | | $’000 | | | $’000 | | | $’000 | | | $’000 | |
| |
| | | | | |
Amounts payable under finance leases: | | | | | | | | | | | | | | | | | | | | |
| | | | | |
Within one year | | | | | | | – | | | | 725 | | | | – | | | | 725 | |
| | | | | |
In the second to fifth years inclusive | | | | | | | – | | | | 3 | | | | – | | | | 3 | |
| |
| | | | | |
| | | | | | | – | | | | 728 | | | | – | | | | 728 | |
| | | | | |
Less: future finance charges | | | | | | | – | | | | – | | | | – | | | | – | |
| |
| | | | | |
Present value of lease | | | | | | | – | | | | 728 | | | | – | | | | 728 | |
| | | | |
Less: Amount due for settlement within 12 months | | | | | | | | | | | | – | | | | (725) | |
(shown under current liabilities) | | | | | | | | | | | | | | | | | | | | |
| |
| | | | |
Amount due for settlement after 12 months | | | | | | | | | | | | – | | | | 3 | |
| |
|
It is the Group’s policy to lease certain of its equipment under finance leases and purchase certain software licences under agreements containing deferred payment terms. The group did not have any obligations under finance lease as at 26 December 2014. Interest rates are fixed at the contract date; all of the agreements containing deferred payment terms are interest free. All leases are on a fixed repayment basis and no arrangements have been entered into for contingent rental payments. At the end of 2013, the average lease term was 3 years and the average effective borrowing rate was 0%. Lease obligations with a present value of $561,000 were denominated in Sterling. All other obligations were denominated in either Chinese Renminbi or US Dollars. The Group’s obligations under finance leases are secured by the lessors’ right over the leased assets. 22 Provisions | |
| | | Onerous lease
provision
$’000 | | | Returns and warranty
provision $’000 | | | Litigation provision
$’000 | | | Restructuring
provision $’000 | | | Total | |
| |
| | | | | |
At 28 December 2012 | | | 4,633 | | | | 5,752 | | | | 9,888 | | | | 864 | | | | 21,137 | |
| | | | | |
Additional provision in the period | | | 2,467 | | | | 770 | | | | – | | | | 7,155 | | | | 10,392 | |
| | | | | |
Unwinding of discount | | | 191 | | | | – | | | | – | | | | – | | | | 191 | |
| | | | | |
Released in the period | | | (1,500 | ) | | | – | | | | (9,827 | ) | | | – | | | | (11,327) | |
| | | | | |
Utilised in period | | | (1,637 | ) | | | (5,094 | ) | | | (61 | ) | | | (1,015 | ) | | | (7,807) | |
| |
| | | | | |
At 27 December 2013 | | | 4,154 | | | | 1,428 | | | | – | | | | 7,004 | | | | 12,586 | |
| | | | | |
Additional provision in the period | | | – | | | | 1,614 | | | | – | | | | 1,504 | | | | 3,118 | |
| | | | | |
On acquisition of Reciva business | | | 91 | | | | – | | | | – | | | | – | | | | 91 | |
| | | | | |
Unwinding of discount | | | 42 | | | | – | | | | – | | | | – | | | | 42 | |
| | | | | |
Released in the period | | | (821 | ) | | | – | | | | – | | | | – | | | | (821) | |
| | | | | |
Utilised in period | | | (1,970 | ) | | | (129 | ) | | | – | | | | (7,693 | ) | | | (9,792) | |
| |
| | | | | |
At 26 December 2014 | | | 1,496 | | | | 2,913 | | | | – | | | | 815 | | | | 5,224 | |
| |
Notes to the Consolidated Financial Statementscontinued
22 Provisionscontinued
| | | | | | | | | | | | |
| | | | | | 26 December 2014 | | | 27 December 2013 | |
| | | | | | $’000 | | | $’000 | |
| |
| | | |
Amounts included within current liabilities | | | | | | | 4,407 | | | | 10,064 | |
| | | |
Amounts included within non-current liabilities | | | | | | | 817 | | | | 2,522 | |
| |
| | | |
| | | | | | | 5,224 | | | | 12,586 | |
| |
|
Onerous Lease Provision The Group has provided for the discounted anticipated costs of satisfying the terms of any onerous leases, less any anticipated income from subletting the buildings. It is anticipated that the provisions will be used over the remaining lease terms. Discount rates have been applied with reference to the rates on government bonds, with maturities corresponding to the remaining lease terms, which prevail in the jurisdiction of the lease. Returns and Warranty Provision The Group provides for the anticipated costs associated with contractual liabilities under standard warranty terms. It is anticipated that the provision will be utilised within one year (see note 3). Litigation Provision Through the acquisition of Zoran, the Group assumed the obligation to meet any liabilities that may arise as a consequence of continuing SEC investigations of former executives of Microtunes Inc., a subsidiary undertaking. This case was dismissed by the United States Supreme Court in March 2013, and, accordingly, the remaining provision of $9.8 million was released. Restructuring Provision In December 2013, the Group announced that it was to discontinue the development of its Camera-on-a-chip (COACH) platform and that this was to result in the loss of up to 200 employees by the middle of 2014. A provision for $6.3 million was held at 27 December 2013, in relation to employees affected by this announcement, and was fully utilised in 2014. Refer to note 28 for further information on integration and restructuring charges during the period. 23 Called-up Share Capital Company Authorised Share Capital | |
| | | | | | 26 December 2014 | | | 27 December 2013 | |
| | | | | | £’000 | | | £’000 | |
| |
| | |
350,000,000 (27 December 2013: 350,000,000) Ordinary Shares of £0.001 each – equity | | | | 350 | | | | 350 | |
| |
| | |
Allotted, Called-up and Fully Paid: | | | | | | | | | |
| | | |
| | | | | | 26 December 2014 | | | 27 December 2013 | |
| | | | | | $’000 | | | $’000 | |
| |
| | |
185,955,224 (27 December 2013: 187,494,513) Ordinary Shares of £0.001 each – equity | | | | 326 | | | | 326 | |
| |
|
Equity Shares: The Company has one class of ordinary shares which carries no right to fixed income. Changes to Share Capital The changes in share capital between 28 December 2013 and 26 December 2014 were as follows | |
| | | Number of ordinary
shares Number | | | Consideration
$’000 | | | Premium $’000 | |
| |
| | | |
Ordinary shares issued from employee option exercises | | | 4,821,439 | | | | 10,607 | | | | 10,596 | |
| | | |
Ordinary shares repurchased and subsequently cancelled | | | (6,360,728 | ) | | | (61,494 | ) | | | (61,483) | |
| |
| | | |
Net movement in Ordinary shares | | | (1,539,289 | ) | | | (50,887 | ) | | | (50,887) | |
| |
| | |
| 112 | | CSR plc Annual Report and Financial Statements 2014 |
The following options and awards over Ordinary Shares of £0.001 have been granted and were outstanding at the end of the period:
| | | | | | | | | | | | |
| Grant date | | Number of shares subject
to option or share award | | | Exercise price per share £ | | | Vesting period | |
| | | |
05 May 2005 | | | 4,538 | | | | 0.00100 | | | | 3 years | |
| | | |
05 May 2005 | | | 5,300 | | | | 0.00100 | | | | 3 years | |
| | | |
05 May 2005 | | | 30,450 | | | | 3.21000 | | | | 3 years | 2 |
| | | |
01 March 2006 | | | 25,000 | | | | 9.05000 | | | | 3 years | |
| | | |
25 May 2006 | | | 1,180 | | | | 0.00100 | | | | 3 years | |
| | | |
25 May 2006 | | | 218,280 | | | | 12.41000 | | | | 5 years | |
| | | |
02 August 2006 | | | 9,887 | | | | 11.09670 | | | | 5 years | |
| | | |
15 November 2006 | | | 17,625 | | | | 6.27000 | | | | 5 years | |
| | | |
28 February 2007 | | | 11,979 | | | | 7.68000 | | | | 5 years | |
| | | |
09 May 2007 | | | 15,869 | | | | 7.57000 | | | | 5 years | |
| | | |
05 June 2007 | | | 3,884 | | | | 0.00100 | | | | 3 years | |
| | | |
01 August 2007 | | | 17,812 | | | | 7.29000 | | | | 5 years | |
| | | |
14 November 2007 | | | 24,055 | | | | 6.44500 | | | | 5 years | |
| | | |
05 March 2008 | | | 9,174 | | | | 3.16000 | | | | 5 years | |
| | | |
11 June 2008 | | | 12,377 | | | | 0.00100 | | | | 3 years | |
| | | |
11 June 2008 | | | 17,187 | | | | 0.00100 | | | | 2 years | |
| | | |
04 November 2008 | | | 3,412 | | | | 0.00100 | | | | 2 years | |
| | | |
26 June 2009 | | | 658,000 | | | | Various | | | | Various | |
| | | |
15 March 2010 | | | 10,559 | | | | 4.84300 | | | | 3 years | 1 |
| | | |
03 September 2010 | | | 3,736 | | | | 2.99800 | | | | 3 years | |
| | | |
15 March 2011 | | | 34,873 | | | | 3.78500 | | | | 3 years | |
| | | |
15 March 2011 | | | 15,264 | | | | 3.78500 | | | | 3 years | |
| | | |
31 August 2011 | | | 1,322,837 | | | | Various | | | | Various | 5 |
| | | |
06 September 2011 | | | 1,759,105 | | | | 2.14000 | | | | 3 years | 4 |
| | | |
06 September 2011 | | | 55,777 | | | | 2.14000 | | | | 3 years | |
| | | |
16 December 2011 | | | 643,429 | | | | 1.90700 | | | | 3 years | |
| | | |
21 March 2012 | | | 1,652,214 | | | | 0.00100 | | | | 3 years | |
| | | |
21 March 2012 | | | 11,313 | | | | 0.00100 | | | | 3 years | |
| | | |
21 March 2012 | | | 1,766,718 | | | | 2.47500 | | | | 3 years | 4 |
| | | |
21 March 2012 | | | 38,610 | | | | 2.47500 | | | | 3 years | |
| | | |
29 March 2012 | | | 3,481 | | | | 0.00100 | | | | 3 years | |
| | | |
01 May 2012 | | | 754,111 | | | | 2.00800 | | | | 3 years | 3 |
| | | |
21 August 2012 | | | 73,697 | | | | 3.26000 | | | | 3 years | |
| | | |
25 October 2012 | | | 2,175 | | | | 0.00100 | | | | 2 years | |
| | | |
25 October 2012 | | | 28,341 | | | | 3.36500 | | | | 3 years | |
| | | |
26 March 2013 | | | 674,045 | | | | 0.00100 | | | | 2 years | |
| | | |
26 March 2013 | | | 996,113 | | | | 0.00100 | | | | 3 years | |
| | | |
26 March 2013 | | | 13,443 | | | | 0.00100 | | | | 2 years | |
| | | |
26 March 2013 | | | 166,130 | | | | 0.00100 | | | | 2 years | |
| | | |
26 March 2013 | | | 39,414 | | | | 0.00100 | | | | 3 years | |
| | | |
26 March 2013 | | | 471,863 | | | | 4.88700 | | | | 3 years | 4 |
| | | |
26 March 2013 | | | 70,299 | | | | 4.88700 | | | | 3 years | |
| | | |
01 May 2013 | | | 148,802 | | | | 3.52510 | | | | 3 years | 3 |
Notes to the Consolidated Financial Statementscontinued
23 Called-up Share Capitalcontinued
| | | | | | | | | | | | |
11 June 2013 | | | 6,036 | | | | 0.00100 | | | | 3 years | |
| | | |
11 June 2013 | | | 69,342 | | | | 0.00100 | | | | 2 years | |
| | | |
11 June 2013 | | | 21,829 | | | | 5.23500 | | | | 3 years | |
| | | |
13 August 2013 | | | 44,914 | | | | 0.00100 | | | | 2 years | |
| | | |
13 August 2013 | | | 17,931 | | | | 5.15000 | | | | 3 years | |
| | | |
12 November 2013 | | | 72,295 | | | | 0.00100 | | | | 2 years | |
| | | |
12 November 2013 | | | 40,523 | | | | 4.83900 | | | | 3 years | |
| | | |
19 March 2014 | | | 40,463 | | | | 0.00100 | | | | 2 years | |
| | | |
19 March 2014 | | | 5,540 | | | | 0.00100 | | | | 3 years | |
| | | |
19 March 2014 | | | 9,480 | | | | 7.19830 | | | | 3 years | |
| | | |
08 May 2014 | | | 401,870 | | | | 0.00100 | | | | 2 years | 6 |
| | | |
30 May 2014 | | | 18,934 | | | | 0.00100 | | | | 2 years | |
| | | |
30 May 2014 | | | 1,334 | | | | 0.00100 | | | | 3 years | |
| | | |
01 July 2014 | | | 510,552 | | | | 4.35200 | | | | 3 years | 3 |
| | | |
14 August 2014 | | | 737,466 | | | | 0.00100 | | | | 3 years | |
| | | |
14 August 2014 | | | 22,017 | | | | 0.00100 | | | | 2 years | |
| | | |
14 August 2014 | | | 8,248 | | | | 0.00100 | | | | 3 years | |
| | | |
14 August 2014 | | | 192,880 | | | | 5.24000 | | | | 3 years | 4 |
| | | |
18 December 2014 | | | 13,356 | | | | 0.00100 | | | | 3 years | |
| | | |
18 December 2014 | | | 974 | | | | 0.00100 | | | | 2 years | |
| |
| | | 14,078,342 | | | | | | | | | |
| |
| 1 | These options or awards have vesting conditions based on the Group’s performance against comparator companies based on TSR rankings over the vesting period. |
| 2 | These options or awards have vesting conditions based on EPS growth over the vesting period. |
| 3 | These options have been issued as part of the Company’s SAYE scheme. |
| 4 | These options have vesting conditions based on the growth of the Company’s share price over the vesting period. |
| 5 | The obligation for these options and Restricted Stock Units was assumed as a result of the acquisition of Zoran Corporation. Outstanding share options for non-European employees of Zoran Corporation were converted to options to acquire American depositary shares of CSR (or ‘CSR ADSs’) and outstanding RSUs were converted to CSR Contingent Share Awards that can be settled in CSR ADSs. Each CSR ADS represents four CSR ordinary shares. |
| 6 | These awards have been issued as part of the Company’s Executive Incentive Plan. |
Exercise period: Vested options and share awards are exercisable within ten years from the grant date, SAYE options are exercisable within 6 months of the vesting date.
24 Reserves
The share premium account, capital redemption reserve and hedging reserve are not distributable. The merger reserve arose on the combination of CSR plc and Cambridge Silicon Radio Limited and is not distributable.
The Employee Benefit Trust Reserve represents the cost of shares in CSR plc purchased in the market and held by the CSR plc Employee Benefit Trust (the ‘Trust’) to satisfy options under the Group’s share option schemes. During 2014, the Trust purchased 776,228 ordinary shares (2013: 541,894 ordinary shares) at an average weighted price of £5.78 (2013: £5.46). The Trust did not issue any ordinary shares to satisfy employee option exercises in either the current or previous periods.
As at 26 December 2014, there were 3,522,217 ordinary shares held by the Trust (2013: 2,775,989). The shares acquired by the Trust do not represent treasury shares for the purposes of the Companies Act and therefore remain as issued share capital. For accounting purposes, the treatment of the shares acquired by the Trust is different. In preparing the consolidated financial statements, the shares held by the Trust are treated as a deduction in shareholders’ equity.
During 2014, the Group did not purchase any ordinary shares to be held in treasury (2013: 6,302,089 ordinary shares were purchased, at an average weighted price of £5.13). 1,457,671 ordinary shares were issued from treasury in 2014 to satisfy employee option exercises (2013: 1,043,581 ordinary shares). As at 26 December 2014, there were 19,855,906 ordinary shares held in Treasury (2013: 21,313,577 ordinary shares).
| | |
| 114 | | CSR plc Annual Report and Financial Statements 2014 |
25 Notes to Cash Flow Statement
| | | | | | | | | | | | |
| | | 52 weeks ended | | | 52 weeks ended | | | 52 weeks ended | |
| | | 26 December 2014 | | | 27 December 2013 | | | 28 December 2012 | |
| | | $’000 | | | $’000 | | | $’000 | |
| |
| | | |
Net profit (loss) for the period | | | 96,826 | | | | (46,329 | ) | | | 51,233 | |
| | | |
Adjustments for: | | | | | | | | | | | | |
| | | |
Investment income | | | (731 | ) | | | (920 | ) | | | (1,175) | |
| | | |
Finance costs and exchange losses | | | 3,865 | | | | 4,993 | | | | 7,106 | |
| | | |
Income tax charge (credit) | | | (2,993 | ) | | | (6,130 | ) | | | 50,749 | |
| |
| | | |
Operating profit (loss) | | | 96,967 | | | | (48,386 | ) | | | 107,913 | |
| | | |
Depreciation of property, plant and equipment | | | 14,980 | | | | 12,484 | | | | 16,171 | |
| | | |
Amortisation of intangible assets | | | 16,903 | | | | 28,390 | | | | 30,485 | |
| | | |
Loss (gain) on disposal of property, plant and equipment | | | 158 | | | | (196 | ) | | | 916 | |
| | | |
Share-related charges | | | 22,612 | | | | 29,650 | | | | 24,480 | |
| | | |
Non-current asset impairment (reversal) charge | | | (23,267 | ) | | | 26,359 | | | | 2,300 | |
| | | |
Gain on disposal of Imaging IP | | | (14,931 | ) | | | – | | | | – | |
| | | |
Gain on disposal of development operations | | | – | | | | – | | | | (127,178) | |
| | | |
Decrease in provisions | | | (7,420 | ) | | | (8,551 | ) | | | (13,284) | |
| | | |
Impairment of Goodwill | | | – | | | | 50,537 | | | | – | |
| |
| | | |
Operating cash flows before movements in working capital | | | 106,002 | | | | 90,287 | | | | 41,803 | |
| | | |
Decrease in inventories | | | 17,494 | | | | 13,936 | | | | 32,497 | |
| | | |
(Increase) decrease in receivables | | | (4,429 | ) | | | 7,304 | | | | 6,635 | |
| | | |
Decrease in payables | | | (47,107 | ) | | | (26,309 | ) | | | (2,998) | |
| |
| | | |
Cash generated by operations | | | 71,960 | | | | 85,218 | | | | 77,937 | |
| | | |
Foreign taxes paid | | | (2,545 | ) | | | (2,489 | ) | | | (5,645) | |
| | | |
Corporation taxes received | | | – | | | | – | | | | 4,733 | |
| | | |
Interest paid | | | (340 | ) | | | (421 | ) | | | (3,097) | |
| |
| | | |
Net cash from operating activities | | | 69,075 | | | | 82,308 | | | | 73,928 | |
| |
Cash and cash equivalents (which are presented as a single class of asset on the face of the balance sheet) comprise cash at bank and other short term highly liquid investments with an original maturity of three months or less.
26 Contingent Liabilities
Intellectual property litigation is commonplace in our industry and poses risks and uncertainties that may materially and adversely affect or disrupt our business, customer relationships, expenses or results of operations. We are regularly involved in pending and threatened litigation in the course of our business and industry, which litigation may be inherently uncertain. With respect to both existing and future litigation, we will continue vigorously to defend ourselves and/or take other steps as we believe are in the overall interests of CSR and its shareholders.
The Company and one of its subsidiaries are currently involved in a patent infringement case as disclosed below. Other than this lawsuit, the Company and its subsidiaries are not involved in any legal or arbitration proceedings which may have, or have had in the 12 months preceding the date of this report, a significant effect on the consolidated financial statements. Further, other than as disclosed below, due to inherent uncertainties, no accurate qualification of any cost, or timing of such cost, which may arise from any of the legal proceedings outlined below can be made.
CSR is one of four named defendants in a patent infringement case filed by plaintiff Azure Networks, a patent portfolio non-practising entity, in the US District Court for the Eastern District of Texas on 13 January, 2015. The case is in the initial stages and a trial date has not been set. No provision has been recorded for the above-described case as cash outflow has not been deemed probable.
During the course of our ongoing group legal entity rationalisation programme, we have become aware of a possible, but not probable, exposure relating to overseas tax with respect to a prior period restructuring. CSR’s best estimate of this contingent liability is $2.8 million.
No provision has been recorded for any of the cases above as cash outflow has not been deemed probable.
Notes to the Consolidated Financial Statementscontinued
27 Operating Lease Arrangements
| | | | | | | | | | | | |
| | | 52 weeks ended | | | 52 weeks ended | | | 52 weeks ended | |
| | | 26 December 2014 | | | 27 December 2013 | | | 28 December 2012 | |
| | | $’000 | | | $’000 | | | $’000 | |
| |
| | | |
| Minimum lease payments under operating leases recognised in the income statement for the year | | | 30,243 | | | | 29,444 | | | | 32,803 | |
| |
At the balance sheet date, the Group had outstanding commitments for future minimum lease payments under non-cancellable operating leases, which fall due as follows:
| | | | | | | | | | | | |
| | | 26 December 2014 | | | 27 December 2013 | | | 28 December 2012 | |
| | | $’000 | | | $’000 | | | $’000 | |
| |
| | | |
Within one year | | | 34,606 | | | | 27,254 | | | | 29,412 | |
| | | |
In the second to fifth years inclusive | | | 41,014 | | | | 25,057 | | | | 38,269 | |
| | | |
After five years | | | 25,583 | | | | 13,583 | | | | 5,723 | |
| |
| | | |
| | | 101,203 | | | | 65,894 | | | | 73,404 | |
| |
Operating lease payments represent rentals payable by the Group for certain of its office properties, office equipment and software licences. Leases are negotiated for an average term of 4.86 years (2013: 5.03 years, 2012: 3.68 years) and rentals are fixed for an average of 4.61 years (2013: 4.76 years, 2012: 3.20 years).
The total of future minimum sublease payments expected to be received under non-cancellable subleases is $2,984,000 (2013: $4,028,000).
28 Integration and Restructuring
Costs recorded within integration and restructuring expenses in the period ended 26 December 2014 totalled $2.0 million. Components of the charge recognised during 2014, 2013 and 2012 include severance charges, onerous leases, building costs and consultancy and legal fees, as the Group consolidated its development and operations centres and office locations, as well as actions to optimise the legal entity structure. In addition CSR also incurred costs through contractual commitments with Samsung, as a result of the disposal of development operations in handset location and handset connectivity in Q4 2012. These arrangements have now expired and no further costs are anticipated.
A charge of $24.5 million was recorded in relation to integration and restructuring programmes during the period ended 27 December 2013.
At the end of 2013, the Group announced that it was to discontinue development of its camera-on-a-chip (COACH) platform, with the loss of up to 200 employees by the end of the second quarter 2014. Accordingly, a charge of $6.5 million, relating to anticipated severance payments, was recognised within integration and restructuring expenses which was fully utilised by 26 December 2014 (27 December 2013: provision of $6.3 million).
Integration and restructuring costs of approximately $25.2 million were incurred during the period ended 28 December 2012, of which the main components arose following the disposal of handset development operations to Samsung. During 2012 the Group continued with the restructuring programmes that were announced in 2011 following the Zoran acquisition and discontinued investment in DTV and silicon tuners. A provision of $0.2 million was held in relation to these programmes at 26 December 2014 (27 December 2013: $0.2 million; 28 December 2012: $0.9 million). It is expected that the remainder of this provision will be utilised in 2015.
29 Share-based payments
Equity-settled share option schemes
CSR plc has grants and awards in the following Share Schemes which result in charges to the Consolidated Income Statement:
Global Share Option Scheme
The Company has a share option scheme for all employees of the Group, under which share options were issued prior to flotation in February 2004, at a price based on the most recent private funding round. These options had a vesting period of five years and if the options remain unexercised after a period of ten years from the date of grant, the options lapse. Options are forfeited if the employee leaves the Group before the options vest. No grants have been made under this scheme since flotation.
Company Share Option Plan (CSOP)
The Company introduced a new scheme at flotation called the CSR plc Share Option Plan. Options granted under this plan have a three year vesting period and lapse on the tenth anniversary of the grant date, unless otherwise indicated below. Options are generally forfeited on cessation of employment.
| | |
| 116 | | CSR plc Annual Report and Financial Statements 2014 |
The following grants have been made under the scheme:
Flotation Grant
On the Company’s flotation, the Company issued share options to all employees, at a price based on the share price on the day of flotation.
Performance Grants
On the Company’s flotation in February 2004, and in May 2005, May 2006, May 2007, June 2008 and certain other dates (relating to employees joining) the Company issued share options at a price based on the average share price over the preceding three days. For options granted between 2004 and 2008, vesting is dependent upon meeting certain EPS based performance conditions.
With the decision to extend the grant of share awards with accompanying performance conditions to other employees, the Committee had decided that for grants from 2009 onwards, the performance condition for vesting would be changed to Total Shareholder Return (TSR).
The vesting of the options is subject to the Group satisfying a performance condition based on the Total Shareholder Return of the Company’s shares when compared to a group of companies selected at the time an award is first granted. In order for the shares to vest, the Group must have met or exceeded certain TSR thresholds when compared with the TSR performance of the group of other companies.
For grants from 2011 onwards, the Committee decided that a new performance condition, Absolute Total Shareholder Return (ATSR), be introduced.
The vesting of the options is subject to the Group satisfying a performance condition, based on the ATSR of the Company’s shares. In order for the shares to vest, the Group must have met or exceeded certain ATSR thresholds when compared to the Company’s average share price for the three months prior to the date the award is first granted.
Starter Grants
The Company grants options to new starters to assist in recruitment. Options are exercisable at a price equal to the average share price on the three days preceding the grant date. The vesting period of the options is over a period of five years with 40% vesting after two years and 5% vesting each quarter thereafter.
The Company has also issued starter grants to senior employees that vest after three years. 11,580 starter grants with these characteristics were issued in the current period (2013: 173,966 starter grants; 2012: 215,009 starter grants).
CSR Share Award Plan
In May 2005, the Company introduced the CSR plc Share Award Plan, which allows for options to be granted for exercise at a future date at a price equivalent to the nominal value of the Company’s shares of £0.001. The following awards have been made:
Retention Awards
The Company issues certain employees with rights to purchase shares at nominal value (£0.001) as a method of staff retention. The vesting period of these share awards is typically either two or three years. During 2012, following the completion of the Samsung transaction, retention awards were issued to certain employees with a one year vesting period. If the share awards remain unexercised after a period of ten years from the date of grant, the awards lapse. Awards are forfeited if the employee leaves the Group before the options vest.
Performance Awards
The Company issues certain employees with rights to purchase shares at nominal value (£0.001) as a method of staff incentivisation. The vesting period of these share awards is three years. Grants between 2005 and 2008 were subject to i) the satisfaction of a TSR condition (relative to a comparator group of companies); and ii) an improvement in the underlying financial performance of the Group. These awards have all lapsed.
From 2009 onwards, the Company issued certain employees with rights to purchase shares at nominal value. The vesting period of these grants is three years and vesting is dependent upon meeting certain EPS based performance conditions.
If the options remain unexercised after a period of ten years from the date of grant, the options lapse. Options are forfeited if the employee leaves the Group before the options vest.
Starter Awards
The Company grants rights to new starters to purchase shares at nominal value (£0.001) to assist recruitment. The vesting period of these awards is two years. If the share awards remain unexercised after a period of ten years from the date of grant, the awards lapse. Awards are forfeited if the employee leaves the Group before the options vest.
SAYE Schemes
The Company operates a SAYE scheme, whereby UK employees are allowed to subscribe to a monthly savings account for a period of three years; at the end of the three year period, the employee is allowed to either receive their saved amount plus interest or purchase shares in the Company at a price based on the average share price on the three days prior to commencement of the SAYE scheme, discounted by 20%. This scheme is open to all employees subject to Inland Revenue approved limits on total investment, and invitations are issued at regular intervals. Employees have a period of six months following the conclusion of the scheme to exercise their option to purchase shares.
Employee Stock Purchase Plan (ESPP) and Global Share Purchase Plan (GSPP)
The Company introduced the GSPP and amended and restated the ESPP in August 2012 following the approval of shareholders at the 2012 Annual General Meeting. These plans allow eligible employees to purchase shares in the Company at a 15% discount to the lower of
Notes to the Consolidated Financial Statementscontinued
29 Share-based paymentscontinued
the share prices on the first day of an offering period (typically a two year period) or at the end of a savings period (there are typically two one year savings period in each offering period). The purchase of shares is funded by payroll deductions made from net pay over a savings period. There is a limit on the aggregate payroll deductions per participant per savings period of $15,000.
Executive Incentive Plan (EIP)
The Company introduced this plan for its executive directors and senior management team following the approval of shareholders at the General Meeting in August 2011. The plan has two elements, element A and element B, both of which have a maximum payout of 125% of the participant’s salary. The percentage of the payout is determined according to the Group’s satisfaction of certain performance conditions and the participant achieving certain objectives. Element A is settled in cash or shares (executive directors are required to take payment in shares until they have satisfied their minimum shareholding requirement) and is paid annually. Element B is settled in shares following the end of the third year of the plan. A maximum forfeiture of 50% will be applied in each of the second and third plan years if the Group does not meet certain performance conditions. The number of shares issued is determined by the 30 day average share price at the end of the first plan year. This scheme vests over a period of 39 months.
SiRF Technology Holdings Inc., plans
For purely historic purposes of settling pre-acquisition obligations of option and award exercise, the Company has assumed all the obligations of the former SiRF Technology Holdings Inc. under pre-existing plans utilised by SiRF. The Company will not issue any options or awards under these plans going forward. All contractual terms of the assumed options remain the same, except for the converted number of shares and exercise price which were based on an exchange ratio determined as part of the merger agreement.
Zoran Corporation plans
Under the terms of the merger agreement, all outstanding RSUs and share options granted by Zoran were assumed by CSR and converted into RSUs and options exercisable for, at the election of CSR, either CSR ADSs or CSR ordinary shares. All contractual terms of the assumed options remain the same, except for the converted number of shares or ADSs and exercise prices which were based on an exchange ratio determined as part of the merger agreement. No options or awards will be granted under historic Zoran plans going forward.
| | | | | | | | | | | | | | | | | | | | | | | | |
| | | 26 December 2014 | | | 27 December 2013 | | | 28 December 2012 | |
| |
| | | Number | | | | | | Number | | | | | | Number | | | | |
| | | of share | | | Weighted | | | of share | | | Weighted | | | of share | | | Weighted | |
| | | options and | | | average exercise | | | options and | | | average exercise | | | options and | | | average exercise | |
| | | awards | | | price (£) | | | awards | | | price (£) | | | awards | | | price (£) | |
| |
| | | | | | |
Outstanding at beginning of period | | | 18,185,623 | | | | 2.59 | | | | 25,840,091 | | | | 3.08 | | | | 35,809,423 | | | | 3.12 | |
| | | | | | |
Granted during the period | | | 3,372,646 | | | | 1.83 | | | | 4,688,893 | | | | 1.22 | | | | 10,437,960 | | | | 1.06 | |
| | | | | | |
Forfeited during the period | | | (1,200,817 | ) | | | 4.57 | | | | (3,550,476 | ) | | | 6.28 | | | | (12,130,517 | ) | | | 2.40 | |
| | | | | | |
Exercised during the period | | | (6,279,110 | ) | | | 1.76 | | | | (8,792,885 | ) | | | 1.97 | | | | (8,276,775 | ) | | | 1.87 | |
| |
| | | | | | |
Outstanding at the end of the period | | | 14,078,342 | | | | 2.77 | | | | 18,185,623 | | | | 2.59 | | | | 25,840,091 | | | | 3.08 | |
| |
| | | | | | |
Exercisable at the end of the period | | | 4,748,037 | | | | 5.40 | | | | 3,875,083 | | | | 7.62 | | | | 9,908,854 | | | | 6.24 | |
| |
The weighted average share price at the date of exercise for share options exercised during the period was £6.85 (2013: £5.04; 2012: £2.89). The options outstanding at 26 December 2014 had a weighted average remaining contractual life of 6 years (2013: 6 years; 2012: 5 years). | |
| | | 26 December 2014 | | | 27 December 2013 | | | 28 December 2012 | |
| |
| | | Share options | | | Share awards | | | Share options | | | Share awards | | | Share options | | | Share awards | |
| |
| | | | | | |
Number granted during the period | | | 1,702,666 | | | | 1,669,980 | | | | 1,536,426 | | | | 3,152,467 | | | | 4,800,494 | | | | 5,637,466 | |
| | | | | | |
Aggregate estimated fair value | | | $6,612,711 | | | | $10,136,630 | | | | $4,672,195 | | | | $16,083,415 | | | | $5,080,998 | | | | $18,469,317 | |
| | | | | | |
Weighted average fair value | | | $3.88 | | | | $6.07 | | | | $3.04 | | | | $5.10 | | | | $1.06 | | | | $3.28 | |
| |
| | | | | | |
Range of exercise prices | | | £4.35 – £7.20 | | | | £0.001 | | | | £3.53 – £5.24 | | | | £0.001 | | | | £1.91 – £3.37 | | | | £0.001 | |
| |
| | |
| 118 | | CSR plc Annual Report and Financial Statements 2014 |
The fair values of the share option and share award grants were based on the following inputs:
SAYE Schemes
The inputs to the Black-Scholes model are as follows:
| | | | | | | | | | | | |
| | | 52 weeks ended | | | 52 weeks ended | | | 52 weeks ended | |
| | | 26 December 2014 | | | 27 December 2013 | | | 28 December 2012 | |
| |
| | | |
Weighted average share price (£) | | | 5.87 | | | | 4.98 | | | | 2.23 | |
| | | |
Weighted average exercise price (£) | | | 4.35 | | | | 3.53 | | | | 2.01 | |
| | | |
Expected volatility | | | 41% | | | | 43% | | | | 45% | |
| | | |
Expected life | | | 3 years | | | | 3 years | | | | 3 years | |
| | | |
Risk free rate | | | 2.29% | | | | 1.57% | | | | 2.28% | |
| | | |
Expected dividends | | | 1% | | | | 2% | | | | 3% | |
| |
Expected volatility was determined by calculating the historical volatility of the Group’s share price over a three year period, equivalent to the vesting period of the options. The expected life used in the model has been adjusted based on management’s best estimates, for the effects of non-transferability, exercise restrictions and behavioural considerations. Company Share Option Plan (CSOP) The inputs to the Black-Scholes model are as follows: | |
| | | 52 weeks ended | | | 52 weeks ended | | | 52 weeks ended | |
| | | 26 December 2014 | | | 27 December 2013 | | | 28 December 2012 | |
| |
| | | |
Weighted average share price (£) | | | 7.25 | | | | 4.78–5.23 | | | | 2.46–3.36 | |
| | | |
Weighted average exercise price (£) | | | 7.2 | | | | 4.84–5.24 | | | | 2.48–3.37 | |
| | | |
Expected volatility | | | 40% | | | | 40%–43% | | | | 44%–45% | |
| | | |
Expected life | | | 3 years | | | | 3 years | | | | 3 years | |
| | | |
Risk free rate | | | 2.23% | | | | 1.60%–2.18% | | | | 2.13%–2.38% | |
| | | |
Expected dividends | | | 1% | | | | 1.49%–1.60% | | | | 1.90%–2.60% | |
| |
Expected volatility was determined by calculating the historical volatility of the Group’s share price over a time period equivalent to the expected term of the options. The expected life used in the model has been adjusted based on management’s best estimates, for the effects of non-transferability, exercise restrictions and behavioural considerations. The adjustments for the performance conditions are reflected in the proportion of options anticipated to vest.
For options issued in, and subsequent to, 2011, the fair value was based upon the Monte-Carlo simulation of the performance of the Company’s share price against the ATSR conditions specified in the award, using the assumptions included above.
Expected volatility for each Company was determined by calculating the historical volatility of the individual Company’s share price over the 3 years from the date of grant.
Retention Awards and Starter Awards
The fair value was based upon the share price on the date of grant.
Performance Awards
For awards issued from 2009 onwards, the fair value was based on the share price on the date of grant as the performance conditions were market based.
ESPP scheme
The fair value of the ESPP is based on the maximum cash value that each participant is eligible to accrue under the scheme rules.
Share Option Charges
The Group recognised total expenses of $22,612,000 (2013: $29,650,000; 2012: $24,480,000) related to equity- settled share-based payment transactions.
Modification of equity-settled share-based payment charges
During the period, certain share options and share awards which had been granted as equity settled share-based payments were modified so that they would instead be settled by a cash payment. Under IFRS 2, where a cash payment is to be made to settle an equity settled share-based payment, this should be treated as a repurchase of equity instruments. Accordingly, $1,813,000 has been deducted from the share-based payment reserve, reflecting the fair value of the cash liability on the modification date.
Notes to the Consolidated Financial Statementscontinued
29 Share-based paymentscontinued
Cash-settled share-based payments
The Group issues to certain employees cash-settled share awards that require the Group to pay the value of the share awards to the employee on the date of the exercise after a specified vesting period. The Group has recorded a liability of $1,510,000 in 2014 (2013: $2,242,000, 2012: $1,502,000). Fair value of the awards is determined using the market value of the awards at the balance sheet date. The Group recognised a credit of $39,000 in the income statement in relation to its cash settled share-based payment schemes in 2014 (2013: expense of $1,477,000, 2012: expense of $1,185,000).
Other
Non underlying share-based payment charges, as disclosed in note 5, also includes employer taxes and social security costs on employee share options and share awards. During 2014, these costs totalled $7,363,000 (2013: $7,015,000, 2012: $2,019,000) and are also disclosed within note 8.
30 Retirement Benefit Obligations
a) Defined contribution schemes
The Group operates a defined contribution retirement benefit scheme for all qualifying employees. The assets of the scheme are held separately from those of the Group, in funds under the control of trustees.
The total cost recorded in the income statement of $8,298,000 (2013: $6,872,000; 2012: $8,109,000) represents contributions payable to this scheme by the Group at rates specified in the rules of the plan. As at 26 December 2014, contributions of $nil (27 December 2013: $nil) due in respect of the current reporting period had not been paid over to the scheme.
b) Defined benefit plan
As a consequence of the Group’s acquisition of Zoran on 31 August 2011, the Group has assumed the obligation for a defined benefit plan in CSR Israel Ltd (formerly Zoran Microelectronics Limited). Under Israeli law, there is a requirement to make severance payments to all employees who leave a company involuntarily. There is no such requirement for those employees who leave the company voluntarily. Severance payments are calculated based on varying factors, namely the length of employee service and salary and are funded entirely by individual investment funds held in the name of the employee by the Group. The Group does not hold a central fund to finance this obligation.
Where there are insufficient funds in these investment funds to meet involuntary severance obligations, there is a legal obligation for the Company to finance this shortfall. This therefore meets the definition of a post employment benefit and more specifically a defined benefit plan, under IAS 19.
The obligation for the company to make up the shortfall in severance payments of this nature is restricted to employees who joined the Company prior to 2007. Though there is no obligation for the Company to make severance payments for employees leaving voluntarily, the assets accumulated in the employee’s fund are returned to the employee when leaving the Company. Severance payments to employees who joined subsequent to 2007, have been accounted for as a defined contribution employment plan.
The valuation of the deficit in the balance sheet is based on the most recent actuarial valuation of the Plan as updated to take account of the market value of the assets and the present value of the liabilities of the Plan at 26 December 2014.
The analysis of movement in the deficit in the scheme for the period is:
| | | | |
| | | $’000 | |
| |
| |
Deficit at 28 December 2012 | | | 42 | |
| |
Expected return on plan assets net of interest cost | | | (6) | |
| |
Contributions paid | | | (885) | |
| |
Benefits paid in excess of plan assets held | | | (31) | |
| |
Current service cost | | | 552 | |
| |
Assets above the threshold | | | 424 | |
| |
Actuarial gains | | | (9) | |
| |
| |
Deficit at 27 December 2013 | | | 87 | |
| |
Expected return on plan assets net of interest cost | | | 2 | |
| |
Contributions paid | | | (508) | |
| |
Benefits paid in excess of plan assets held | | | (54) | |
| |
Current service cost | | | 510 | |
| |
Assets above the threshold | | | 154 | |
| |
Actuarial gains | | | (155) | |
| |
| |
Deficit at 26 December 2014 | | | 36 | |
| |
| | |
| 120 | | CSR plc Annual Report and Financial Statements 2014 |
As at 26 December 2014, the market value of the plan assets was $4,972,000 (27 December 2013: $10,049,000) and the net present value of the plan liabilities was $5,008,000 (27 December 2013: $10,136,000). The significant movement in both plan assets and plan liabilities can be attributed to a number of Israeli employees leaving the Group, and therefore also leaving the scheme, during the period. This was largely due to the restructuring programme, announced in December 2013, as a result of the decision to discontinue the development of the Group’s COACH platform.
The estimated amounts of contributions expected to be paid to the scheme during the current period is $0.4 million (2013: $1.4 million).
The following is analysis of the charges to the income statement and other comprehensive income:
| | | | | | | | | | | | |
| | | 52 weeks ended | | | 52 weeks ended | | | 52 weeks ended | |
| | | 26 December 2014 | | | 27 December 2013 | | | 28 December 2012 | |
| | | $’000 | | | $’000 | | | $’000 | |
| |
| | | |
Income statement | | | | | | | | | | | | |
| | | |
Analysis of amounts chargeable to operating profit (loss): | | | | | | | | | | | | |
| | | |
Current service cost | | | (510 | ) | | | (552 | ) | | | (762) | |
| | | |
Analysis of amounts (charged)/credited to investment income and finance costs: | | | | | | | | | | | | |
| | | |
Interest on Plan liabilities | | | (279 | ) | | | (430 | ) | | | (459) | |
| | | |
Expected return on assets in the Plan | | | 277 | | | | 436 | | | | 493 | |
| |
| | | |
Total chargeable to the income statement before deduction of tax | | | (512 | ) | | | (546 | ) | | | (728) | |
| |
| | | |
Other comprehensive income | | | | | | | | | | | | |
| | | |
Analysis of amounts recognised in the other comprehensive income: | | | | | | | | | | | | |
| | | |
Actuarial gains (losses) | | | 155 | | | | 9 | | | | (919) | |
| | | |
Pension scheme assets above the threshold | | | (154 | ) | | | (424 | ) | | | (656) | |
| |
| | | |
Total credit (charge) to other comprehensive income | | | 1 | | | | (415 | ) | | | (1,575) | |
| |
| | | |
Cumulative charge to other comprehensive income | | | (2,424 | ) | | | (2,425 | ) | | | (2,010) | |
| |
31 Financial Instruments
Financial Risk Management
The Group has exposure to the following risks from its use of financial instruments:
This note presents information about the Group’s exposure to each of the above risks, the Group’s objectives, policies and processes for measuring and managing risk, and the Group’s management of capital. Further quantitative disclosures are included throughout these consolidated financial statements.
The Board of Directors has overall responsibility for the establishment and oversight of the Group’s risk management framework. Risk management policies and systems are reviewed regularly to reflect changes in market conditions and the Group’s activities. The Group’s Audit Committee oversees how management monitors compliance with the Group’s risk management framework in relation to the risks faced by the Group.
Capital Risk Management
The Group’s policy is to maintain a strong capital base so as to maintain investor, creditor and market confidence and to sustain future development of the business. CSR intends to reinvest its cash balances in the business either through higher levels of investment in working capital and fixed assets or through further M&A activity to support the long-term ambitions of the Group. The capital structure of the Group consists of cash and cash equivalents, treasury deposits and equity attributable to the equity holders of CSR plc, comprising issued share capital, reserves and retained earnings as disclosed in notes 23 and 24. The Group is not subject to any externally imposed capital requirements.
The Group has a total of $283.2 million of treasury deposits and cash and cash equivalents as at 26 December 2014 (27 December 2013: $306.2 million).
Significant Accounting Policies
Details of the significant accounting policies and methods adopted, including the criteria for recognition, the basis of measurement and the basis on which income and expenses are recognised, in respect of each class of financial asset, financial liability and equity instrument are disclosed in note 3 to the consolidated financial statements.
Notes to the Consolidated Financial Statementscontinued
31 Financial Instrumentscontinued
| | | | | | | | |
| | | 26 December 2014 | | | 27 December 2013 | |
| | | $’000 | | | $’000 | |
| |
| | |
Financial assets | | | | | | | | |
| | |
Available for sale | | | 3,500 | | | | 2,500 | |
| | |
Loans and receivables (including cash and cash equivalents and treasury deposits) | | | 402,635 | | | | 416,768 | |
| | |
Derivative instruments in designated hedge accounting relationships | | | – | | | | 6,011 | |
| | |
Fair value through profit and loss (FVTPL) | | | 16,577 | | | | 13,936 | |
| |
| | |
| | | 422,712 | | | | 439,215 | |
| |
| | |
Financial liabilities | | | | | | | | |
| | |
Derivative instruments in designated hedge accounting relationships | | | (7,409 | ) | | | – | |
| | |
Amortised cost | | | (139,584 | ) | | | (142,930) | |
| | |
Fair value through profit and loss (FVTPL) | | | (226 | ) | | | (5,000) | |
| |
| | |
| | | (147,219 | ) | | | (147,930) | |
| |
Market Risk
Market risk is the risk that changes in market prices, such as foreign currency exchange rates and interest rate risk will affect the Group’s income or the value of its holdings of financial instruments. The objective of market risk management is to manage and control market risk exposures within acceptable parameters, while optimising the return on risk.
Market risk exposures are measured using sensitivity analysis.
Foreign Currency Risk Management
Substantially all of the Group’s sales and costs of sales are denominated in US dollars, the functional currency of all the entities within the Group. A substantial proportion of the Group’s fixed costs are denominated in Sterling and a significant proportion of the remainder is non-USD denominated. This exposure to different currencies may result in gains or losses with respect to movements in foreign exchange rates and the impact of such fluctuations could be material. Accordingly, the Group enters into hedging transactions pursuant to which it purchases Sterling under forward purchase contracts in order to cover the majority of its sterling exposure.
The carrying amounts of the Group’s sterling denominated monetary assets and liabilities at the reporting date are as follows:
| | | | | | | | | | | | | | | | |
| | | Liabilities | | | Assets | |
| | | 26 December 2014 | | | 27 December 2013 | | | 26 December 2014 | | | 27 December 2013 | |
| | | £’000 | | | £’000 | | | £’000 | | | £’000 | |
| |
| | | | |
GBP sterling | | | (11,748 | ) | | | (6,249 | ) | | | 11,006 | | | | 7,837 | |
| |
The following significant exchange rates applied during the period: | |
| | | Weighted average forward contract rate | | | | | | | |
| | | (contracts maturing in the period) | | | Period end spot rate | |
| | | 26 December 2014 | | | 27 December 2013 | | | 26 December 2014 | | | 27 December 2013 | |
| | | £’000 | | | $’000 | | | £’000 | | | $’000 | |
| |
| | | | |
GBP: USD | | | 1.5563 | | | | 1.5744 | | | | 1.5548 | | | | 1.649 | |
| |
Foreign Currency Sensitivity Analysis
A 10 percent strengthening of the US dollar against GBP sterling would have decreased equity and profit or increased equity and profit by the amounts shown below as at the reporting date shown. In management’s opinion, this is a reasonably possible change given current market conditions.
This analysis assumes that all other variables, in particular interest rates and other foreign currencies, remain constant. The analysis is performed on the same basis for 2013.
| | | | | | | | |
| | | Equity | | | Profit or (loss) | |
| 26 December 2014 | | $’000 | | | $’000 | |
| |
| | |
GBP | | | (8,734) | | | | (283) | |
| |
| | |
| | | Equity | | | Profit or (loss) | |
| 27 December 2013 | | $’000 | | | $’000 | |
| |
| | |
GBP | | | (7,481) | | | | (557) | |
| |
| | |
| 122 | | CSR plc Annual Report and Financial Statements 2014 |
A 10 percent weakening of the US dollar against GBP sterling would have had the equal but opposite effect, on the basis that all the other variables remain constant.
The movement in profit for the period is mainly attributable to the Group’s exposure to exchange movements in sterling denominated monetary assets and liabilities. The movement in equity is mainly as a result of the changes in fair value of forward foreign exchange contracts.
Forward Foreign Exchange Contracts
The following table indicates the periods in which the cash flows associated with derivatives that are cash flow hedges are expected to occur:
| | | | | | | | | | | | | | | | | | | | | | | | |
| Cash flow hedges | | Carrying
amount | | | Expected
cash flows | | | 3 months
or less | | | 3-6 months | | | 6-12 months | | | More than
one year | |
| |
26 December 2014 | | | | | | | | | | | | | | | | | | | | | | | | |
| | | | | | |
Forward foreign exchange contracts £’000 | | | – | | | | 86,250 | | | | 17,250 | | | | 17,250 | | | | 34,500 | | | | 17,250 | |
| | | | | | |
Forward foreign exchange contracts $’000 | | | – | | | | 141,420 | | | | 28,573 | | | | 28,741 | | | | 57,083 | | | | 27,023 | |
| | | | | | |
Fair value $’000 | | | (7,635 | ) | | | – | | | | (1,765 | ) | | | (1,962 | ) | | | (3,633 | ) | | | (275) | |
| | | | | | |
Average exchange rate | | | – | | | | 1.6397 | | | | 1.6564 | | | | 1.6661 | | | | 1.6546 | | | | 1.5666 | |
| |
27 December 2013 | | | | | | | | | | | | | | | | | | | | | | | | |
| | | | | | |
Forward foreign exchange contracts £’000 | | | – | | | | 67,000 | | | | 16,750 | | | | 16,750 | | | | 33,500 | | | | – | |
| | | | | | |
Forward foreign exchange contracts $’000 | | | – | | | | 104,195 | | | | 26,417 | | | | 25,580 | | | | 52,198 | | | | – | |
| | | | | | |
Fair value $’000 | | | 6,171 | | | | – | | | | 1,198 | | | | 2,028 | | | | 2,945 | | | | – | |
| | | | | | |
Average exchange rate | | | – | | | | 1.5551 | | | | 1.5771 | | | | 1.5272 | | | | 1.5581 | | | | – | |
| |
The Directors consider the periods in which the cash flows associated with the derivatives that are cash flow hedges are expected to occur approximate the periods when the cash flows associated with those cash flows are likely to impact profit or loss.
Interest Rate Risk Management
The Group has no significant direct exposure to fluctuations in interest rates other than those on interest-bearing cash balances. The majority of cash balances are held at fixed rates of interest and the effective rate of interest on those cash balances in the period was 0.15% (52 weeks ended 27 December 2013: 0.19%; 52 weeks ended 28 December 2012: 0.27%).
Credit risk
Credit Risk Management
Credit risk refers to the risk that a counterparty will default on its contractual obligations resulting in financial loss to the Group. The Group has adopted a policy of only dealing with creditworthy counterparties and obtaining sufficient collateral where appropriate, as a means of mitigating the risk of financial loss from defaults. The Group only transacts with entities that are rated the equivalent of investment grade and above for Treasury management purposes. This information is supplied by independent rating agencies where available and if not available, the Group uses other publicly available financial information and its own trading records to rate its major customers. The Group’s exposure and the credit ratings of its counterparties are continuously monitored and credit exposure is controlled by counterparty limits.
The credit risk on liquid funds and derivative financial instruments is limited because counterparties are banks with high credit ratings assigned by international credit rating agencies.
For cash and cash equivalents and treasury deposits, the Company only transacts with entities that are equivalent to investment grade and above.
Disclosures related to the credit risk associated with trade receivables are in note 18.
Notes to the Consolidated Financial Statementscontinued
31 Financial Instrumentscontinued
Liquidity risk
Liquidity Risk Management
The Group manages liquidity risk by maintaining adequate cash reserves and by continuously monitoring forecast and actual cash flows and matching the maturity of financial assets and liabilities. The Group has no significant borrowings from third parties and therefore liquidity risk is not considered a significant risk at this time. The table below details the Group’s remaining contractual maturity for its non-derivative financial liabilities with agreed repayment periods. The tables have been prepared based on undiscounted cash flows of financial liabilities based on the earliest date on which the Group can be required to pay.
| | | | | | | | | | | | | | | | | | | | | | | | | | | | |
| 26 December 2014 | | Weighted
average effective
interest rate
% | | | Less than
one month
$’000 | | | 1-2 months
$’000 | | | 2-3 months
$’000 | | | 3-6 months
$’000 | | | More than 6
months $’000 | | | Total $’000 | |
| |
Litigation accrual (undiscounted) | | | – | | | | 3,125 | | | | – | | | | – | | | | 3,125 | | | | 9,375 | | | | 15,625 | |
| | | | | | | |
Other payables | | | – | | | | 2,083 | | | | – | | | | 1,670 | | | | 775 | | | | 8,481 | | | | 13,009 | |
| | | | | | | |
Onerous lease provision (undiscounted) | | | – | | | | 152 | | | | 88 | | | | 88 | | | | 175 | | | | 1,069 | | | | 1,572 | |
| |
| | | | | | | 5,360 | | | | 88 | | | | 1,758 | | | | 4,075 | | | | 18,925 | | | | 30,206 | |
| |
| | | | | | | |
27 December 2013 | | Weighted average
effective
interest rate
% | | | Less than one month $’000 | | | 1-2 months $’000 | | | 2-3 months $’000 | | | 3-6 months $’000 | | | More than 6 months $’000 | | | Total
$’000 | |
| |
Obligations under finance leases | | | – | | | | – | | | | – | | | | 725 | | | | – | | | | 3 | | | | 728 | |
| | | | | | | |
Litigation accrual (undiscounted) | | | – | | | | 3,125 | | | | – | | | | – | | | | 3,125 | | | | 21,875 | | | | 28,125 | |
| | | | | | | |
Other payables | | | – | | | | 1,916 | | | | – | | | | 1,786 | | | | 775 | | | | 11,742 | | | | 16,219 | |
| | | | | | | |
Onerous lease provision (undiscounted) | | | – | | | | 147 | | | | 147 | | | | 147 | | | | 407 | | | | 3,594 | | | | 4,442 | |
| |
| | | | | | | 5,188 | | | | 147 | | | | 2,658 | | | | 4,307 | | | | 37,214 | | | | 49,514 | |
| |
Fair Value of Financial Instruments
The fair values of financial assets and liabilities are determined as follows:
Trade receivables and trade and other payables: The carrying amount of these short-term financial instruments approximates their fair value.
Derivatives: The fair value is estimated by discounting the difference between the contractual forward price and the current forward price for the residual maturity of the contract using an appropriate discount rate.
The carrying amounts of financial assets and liabilities in the consolidated financial statements approximates their fair values.
The following table provides an analysis of the financial assets, specifically money market funds and marketable debt instruments that are measured on a recurring basis, subsequent to initial recognition at fair value, grouped into Levels 1 to 3 based on the degree to which the fair value is observable:
Level 1 fair value measurements are those derived from quoted prices (unadjusted) in active markets for identical assets or liabilities;
Level 2 fair value measurements are those derived from inputs other than quoted prices included within Level 1 that are observable for the asset or liability, either directly (i.e. as prices) or indirectly (i.e. derived from prices); and
Level 3 fair value measurements are those derived from valuation techniques that include significant inputs for the asset and liability that are not based on observable market data (unobservable inputs).
| | |
| 124 | | CSR plc Annual Report and Financial Statements 2014 |
| | | | | | | | | | | | | | | | |
| 26 December 2014 | | Quoted prices in
Active Markets for
Identical Assets | | | Significant Other
Observable Inputs | | | Significant
Unobservable Inputs | | | | |
| |
| | | (Level 1) $’000 | | | (Level 2) $’000 | | | (Level 3) $’000 | | | Total $’000 | |
| |
Financial assets at FVTPL | | | | | | | | | | | | | | | | |
| | | | |
United States government fixed income debt securities1 | | | 16,577 | | | | – | | | | – | | | | 16,577 | |
| | | | |
Available for sale financial assets | | | | | | | | | | | | | | | | |
| | | | |
Shares in unquoted equity securities | | | – | | | | – | | | | 3,500 | | | | 3,500 | |
| | | | |
Financial liabilities at FVTPL | | | | | | | | | | | | | | | | |
| | | | |
Derivative instruments in designated hedge accounting relationships | | | – | | | | 7,409 | | | | – | | | | 7,409 | |
| | | | |
Designated hedge instruments recycled to the income statement | | | – | | | | 226 | | | | – | | | | 226 | |
| |
| | | | |
| 27 December 2013 | | Quoted prices in
Active Markets for
Identical Assets | | | Significant Other
Observable Inputs | | | Significant
Unobservable Inputs | | | | |
| |
| | | (Level 1) $’000 | | | (Level 2) $’000 | | | (Level 3) $’000 | | | Total $’000 | |
| |
Financial assets at FVTPL | | | | | | | | | | | | | | | | |
| | | | |
United States government fixed income debt securities1 | | | 13,776 | | | | – | | | | – | | | | 13,776 | |
| | | | |
Derivative instruments in designated hedge accounting relationships | | | – | | | | 6,011 | | | | – | | | | 6,011 | |
| | | | |
Fair value through profit and loss (FVTPL) | | | – | | | | 160 | | | | – | | | | 160 | |
| | | | |
Available for sale financial assets | | | | | | | | | | | | | | | | |
| | | | |
Shares in unquoted equity securities | | | – | | | | – | | | | 2,500 | | | | 2,500 | |
| | | | |
Financial liabilities at FVTPL | | | | | | | | | | | | | | | | |
| | | | |
Liability for contractual milestone payments | | | – | | | | – | | | | (5,000 | ) | | | (5,000) | |
| |
| 1 | Included within Treasury deposits within the consolidated balance sheet. |
The derivative instruments in designated hedging relationships, whose fair value includes the use of level 2 inputs, are valued with reference to the prevailing quoted forward exchange rate of the US Dollar to the British Pound Sterling at the balance sheet date.
The fair value of the unquoted equity shares can be determined as management monitors the ongoing investment by oversight involvement in the investees and due to the recent nature of the purchase, by either the Group or other equity holders of the investees.
As a result of this oversight involvement, it was identified that Group’s equity shareholding in one investee was fully impaired at 27 December 2013 and an impairment charge of $1.2 million was recognised accordingly.
The fair value of the contractual milestone payment was determined with reference to the likelihood of achieving contractual milestones, relating to the disposal of development operations in handset location and handset connectivity. At 27 December 2013, the fair value of the probabilities of these possible circumstances and their outcomes were assessed, using forecast data available internally to the Group, and a liability of $5.0 million has been recognised accordingly. This liability was paid during the 52 weeks ended 26 December 2014.
Reconciliation of Level 3 fair value measurements of financial assets:
| | | | |
| | | Available for sale
Unquoted equities
$’000 | |
| |
Balance at 28 December 2012 | | | 3,719 | |
| |
Total gains and losses in the income statement | | | (1,219) | |
| |
Balance at 27 December 2013 | | | 2,500 | |
| |
Purchases | | | 1,000 | |
| |
Balance at 26 December 2014 | | | 3,500 | |
| |
Notes to the Consolidated Financial Statementscontinued
32 Related Party Transactions
Transactions between the Company and its subsidiaries, which are related parties, have been eliminated on consolidation and are not disclosed in this note.
Remuneration of key management personnel
The remuneration of the directors, who are the key management personnel of the Group, is set out below:
| | | | | | | | | | | | |
| | | 52 weeks ended
26 December 2014 $’000 | | | 52 weeks ended
27 December 2013
$’000 | | | 52 weeks ended
28 December 2012
$’000 | |
| |
Short-term employee benefits | | | 3,816 | | | | 5,241 | | | | 5,004 | |
| | | |
Post-employment benefits | | | 205 | | | | 178 | | | | 173 | |
| | | |
Share-based payment | | | 2,738 | | | | 2,630 | | | | 3,721 | |
| |
| | | 6,759 | | | | 8,049 | | | | 8,898 | |
| |
Joep van Beurden (CEO) completed his service as Chairman of the Global Semiconductor Alliance (GSA) on 31 December 2013 and served as a Director of this organisation during 2014. CSR plc has paid membership fees of $25,000 to the GSA during the course of 2014 (2013: $25,000), sponsorship fees of $16,000 (2013: $37,100) and conference fees of $nil (2013: $2,037).
Dividends totalling $126,477 (2013: $94,474) were paid in the period in respect of ordinary shares held by the Company’s directors.
33 Sale of Imaging IP assets and reversal of asset impairment
CSR announced that it would cease investment in future COACH products in December 2013, resulting in a $76.9 million impairment charge, against the goodwill and non-current assets allocated to the Cameras cash generating unit (CGU) within the consumer segment, in the income statement for the 52 weeks ended 27 December 2013.
On 8 June 2014, CSR completed the sale of certain Imaging intellectual property (IP) assets associated with its camera business, together with the team devoted to their development. The sale was for a total consideration of $44.0 million, subject to post-closing conditions. The people and assets transferred were part of the camera-on-a-chip (COACH) operations.
Once it became certain that IP associated with the COACH business and allocated to the Cameras CGU was to be sold in June 2014 this triggered an assessment of the carrying value of assets allocated to this CGU. The outcome of this assessment was to reinstate the non-current assets, other than the goodwill, associated with the Camera CGU, at a carrying amount equivalent to that if the assets had not been impaired ($23.3 million) and reverse the impairment charges made against those non-current assets in December 2013. This resulted in a credit of $23.3 million within operating profit for the 52 week period ended 26 December 2014.
Following the disposal on 8 June 2014, CSR no longer holds any assets associated with the COACH business.
| | | | |
| | | $’000 | |
| |
Consideration | | | 44,000 | |
| |
Carrying amount of intangible assets | | | (23,267) | |
| |
Directly attributable costs | | | (5,802) | |
| |
Gain on disposal of Camera IP | | | 14,931 | |
| |
Consideration: | | | | |
| |
Cash and cash equivalents | | | 36,500 | |
| |
Cash to be held in an escrow account | | | 7,500 | |
| |
| | | 44,000 | |
| |
Net cash flow from disposal | | | | |
| |
Cash and cash equivalents received as consideration | | | 36,500 | |
| |
Directly attributable costs | | | (6,061) | |
| |
| | | 30,439 | |
| |
Consideration of $44.0 million was received during 2014, of which $7.5 million is held in an escrow account as at 26 December 2014 and is included within ‘Short-term assets’ in note 18.
The directly attributable costs of $5.8 million include legal and professional fees and the employment costs of certain employees from the transferred IP imaging development team, including a credit of $0.3 million for the reversal of accrued employee holiday pay which is a non-cash item.
| | |
| 126 | | CSR plc Annual Report and Financial Statements 2014 |
34 Acquisition of Reciva business
On 23 June 2014, Cambridge Silicon Radio Limited, a subsidiary of CSR plc, entered in to a sale agreement to purchase certain assets and a development team from Reciva Limited (subsequently re-named as Blue Cedar Ridge Limited) for total consideration of $5.0 million. Reciva aggregates internet radio and streaming music services in the cloud and provides a common interface which can stream multiple services to internet connected audio products. The acquisition will enhance CSR’s Voice & Music segment by adding streaming audio capabilities to its networked audio products via CSR’s service delivery platform.
The acquisition note is shown below:
Recognised amounts of assets acquired at fair value
| | | | |
| | | $’000 | |
| |
Intangible assets | | | 3,100 | |
| |
Provisions | | | (91) | |
| |
Net assets acquired | | | 3,009 | |
| |
Allocation to goodwill | | | 1,991 | |
| |
Total consideration | | | 5,000 | |
| |
Satisfied by: | | | | |
| |
Cash | | | 4,500 | |
| |
Contingent consideration | | | 500 | |
| |
Total consideration transferred | | | 5,000 | |
| |
Net cash outflow at balance sheet date | | | | |
| |
Cash consideration | | | (5,000) | |
| |
Directly attributable costs | | | (85) | |
| |
| | | (5,085) | |
| |
The contingent consideration was dependent upon the delivery of certain intellectual property, by Blue Cedar Ridge Limited to Cambridge Silicon Radio Limited, and was paid on 31 October 2014.
The goodwill arising on acquisition is attributable to future income from new customer contracts, as well as the expertise of the five members of staff who have transferred to CSR. It is not anticipated that any of the goodwill will be deductible for income tax purposes.
Directly attributable costs amounted to $0.1 million and have been recorded within SG&A expenses.
The contribution from the acquired business to the Group’s revenue and to the Group’s profit for the period between the date of the acquisition and the balance sheet date is negligible.
35 Disposal of Development Operations
On 17 July 2012, the Group entered into a conditional binding agreement with Samsung (the ‘Samsung Transaction’), for the transfer of development operations in handset connectivity and location, including 311 people, together with certain rights over the Group’s technology in these areas. None of the revenues associated with the Group’s existing handset products were transferred as part of the transaction. This transaction was completed on 4 October 2012.
The Consideration was subject to adjustment by up to $5 million in certain circumstances relating to the achievement of contractual milestones. As at 27 December 2013 the fair value of the probabilities of these possible circumstances and their outcomes were assessed and a liability of $5 million was recognised accordingly (28 December 2012: fair value of $nil). This liability was paid during the 52 weeks ended 26 December 2014.
The disposal was effected so that the Group could concentrate investment and resources on its five high growth markets of Voice & Music, Automotive Infotainment, Indoors Location, Imaging and Bluetooth Smart, accelerate its higher margin platform strategy and improve the Group’s overall market position.
Notes to the Consolidated Financial Statementscontinued
35 Disposal of Development Operationscontinued
The net assets transferred on 4 October 2012 were as follows:
| | | | |
| | | $’000 | |
| |
Attributable goodwill | | | 151,477 | |
| |
Financial assets | | | 2,877 | |
| |
Property, plant and equipment | | | 3,103 | |
| |
Intangible assets | | | 3,413 | |
| |
Financial liabilities | | | (1,713) | |
| |
Net assets disposed | | | 159,157 | |
| |
Additional liabilities recognised on disposal1 | | | 22,157 | |
| |
Reverse assignment premium | | | 1,508 | |
| |
Gain on disposal | | | 127,178 | |
| |
Total consideration | | | 310,000 | |
| |
Purchase price: | | | | |
| |
Cash and cash equivalents | | | 272,900 | |
| |
Cash held in an escrow account | | | 31,000 | |
| |
Withholding tax receivable | | | 6,100 | |
| |
| | | 310,000 | |
| |
Net cash inflow arising on disposal: | | | | |
| |
Consideration received in cash and cash equivalents | | | 272,900 | |
| |
Disposed cash and cash equivalents | | | (1,577) | |
| |
Directly attributable costs | | | (13,122) | |
| |
| | | 258,201 | |
| |
| 1 | Additional liabilities recognised on disposal primarily consists of additional employee compensation, incurred in conjunction with the transfer of 311 employees to Samsung, and professional fees incurred for the Samsung Transaction. |
The gain on the disposal of the development operations in handset connectivity and location has been recognised within the Group’s operating profit for the period ended 28 December 2012.
As part of the transaction, the Group’s entire shareholding in Cambridge Silicon Radio Sarl was transferred to Samsung. The gain recognised on this disposal was $8.5 million and this was recognised within the Group’s operating profit, as part of the total gain on disposal of development operations in handset connectivity and location.
Prior to disposal, the costs of these development operations has been disclosed in the Legacy operating segment.
| | |
| 128 | | CSR plc Annual Report and Financial Statements 2014 |
The following selected historical financial data should be read in conjunction with the ‘Business and Financial Review’ and the consolidated financial statements and related notes included elsewhere in this Annual Report. The following selected historical financial data as of 26 December 2014 and 27 December 2013, and for the periods ended 26 December 2014, 27 December 2013, and 28 December 2012 has been derived from our audited consolidated financial statements included elsewhere in this Annual Report.
The selected historical financial data presented below as of 31 December 2010 and 1 January 2010 and for the periods ended 31 December 2010 and 1 January 2010, have been derived from the audited financial statements of the Group, which are not included herein. The selected historical financial data as of each date and for each period presented, are prepared and presented in accordance with IFRS. These historical results are not necessarily indicative of results to be expected in any future period.
| | | | | | | | | | | | | | | | | | | | |
| | | 2014 $’000 | | | 2013 $’000 | | | 2012 $’000 | | | 2011 $’000 | | | 2010 $’000 | |
| |
| | | | | |
Results | | | | | | | | | | | | | | | | | | | | |
| | | | | |
Revenue | | | 774,773 | | | | 960,710 | | | | 1,025,356 | | | | 845,190 | | | | 800,608 | |
| |
| | | | | |
Operating profit (loss) | | | 96,967 | | | | (48,386 | ) | | | 107,913 | | | | (48,365 | ) | | | (6,253) | |
| |
| | | | | |
Profit (loss) before tax | | | 93,833 | | | | (52,459 | ) | | | 101,982 | | | | (51,464 | ) | | | (5,705) | |
| | | | | |
Taxation | | | 2,993 | | | | 6,130 | | | | (50,749 | ) | | | 85,330 | | | | 22,331 | |
| |
| | | | | |
Profit (loss) | | | 96,826 | | | | (46,329 | ) | | | 51,233 | | | | 33,866 | | | | 16,626 | |
| |
| | | | | |
Assets employed | | | | | | | | | | | | | | | | | | | | |
| | | | | |
Total assets | | | | | | | | | | | | | | | | | | | | |
| | | | | |
Non-current assets | | | 375,066 | | | | 382,737 | | | | 452,811 | | | | 617,068 | | | | 318,191 | |
| | | | | |
Net current assets | | | 310,454 | | | | 282,292 | | | | 287,467 | | | | 312,615 | | | | 505,312 | |
| | | | | |
Non-current liabilities | | | (21,564 | ) | | | (35,467 | ) | | | (45,344 | ) | | | (51,776 | ) | | | (48,939) | |
| |
| | | | | |
Net assets | | | 663,956 | | | | 629,562 | | | | 694,934 | | | | 877,907 | | | | 774,564 | |
| |
| | | | | |
Authorised share capital (£’000) | | | 350,000 | | | | 350,000 | | | | 350,000 | | | | 350,000 | | | | 350,000 | |
| | | | | |
Number of shares outstanding (number) | | | 185,955,224 | | | | 187,494,513 | | | | 203,231,504 | | | | 215,667,851 | | | | 184,953,312 | |
| | | | | |
Diluted share count (number) | | | 175,580,273 | | | | 164,181,841 | | | | 181,896,339 | | | | 181,393,972 | | | | 181,033,874 | |
| | | | | |
Key statistics | | | $ | | | | $ | | | | $ | | | | $ | | | | $ | |
| | | | | |
Diluted earnings (loss) per share | | | 0.59 | | | | (0.28 | ) | | | 0.26 | | | | 0.19 | | | | 0.09 | |
| | | | | |
Earnings (loss) per share | | | 0.55 | | | | (0.28 | ) | | | 0.25 | | | | 0.19 | | | | 0.09 | |
| |
We prepare our financial statements in accordance with IFRS, however we also report alternative measures that we call ‘underlying’. We believe that these measures give management and users a clearer understanding of the ongoing performance of the group, ignoring the impact of items that we deem to be exceptional and which may distort trends.
What are ‘underlying’ measures?
‘Underlying’ measures are financial metrics that different from those required under IFRS.
To calculate ‘underlying’ measures we exclude three types of transactions from the results reported under IFRS
| 1) | From time to time events occur which due to their size or nature are considered separately to the Group’s ongoing performance. |
| | The gains and losses of such items can have a material impact on the Group’s profit in either one year, or as a trend. Such items include: |
| – | The impact of significant disposals such as the Samsung transaction during 2012; |
| – | The cost of business transformations following such transactions; |
| – | Costs arising from the proposed Qualcomm Transaction during 2014; |
| – | The impact of any impairments of assets acquired on acquisitions, including goodwill. |
Where such events are excluded we provide additional analysis to enable these discrete events to be understood by users of the financial statements
| 2) | Costs arising from movement in the valuation of share options, including the tax impact of these changes, since we believe this reflects a non-cash cost which may obscure the trends in the ‘underlying’ business. Such charges are calculated on a number of assumptions which are outside of the Groups control such as the volatility of markets, comparator performance and employee behavior. |
| 3) | The impact of other non-cash accounting adjustments that are required under IFRS, the impact of which is outside the Company’s control (such as fair value adjustment on acquisition, and the unwind of these through ongoing amortisation). We believe that such charges obscure trends in ‘underlying’ business performance. |
The table on page 131 specifically defines our ‘underlying’ measures in comparison with the measures required under IFRS:
What do we use ‘underlying’ measures for?
We use ‘underlying’ measures to
| – | evaluate performance and value creation; |
| – | make resource allocation decisions; |
| – | provide performance targets for management remuneration and reward and |
| – | target long term growth opportunities |
Why do we report these ‘underlying’ measures in the financial statements?
We present ‘underlying’ measures in these financial statements as we believe they
| – | provide consistency between the way the business is reported, and the the way management view the business and discuss its performance with investors; |
| – | share metrics with all investors at the same time; |
| – | disclose the main drivers of management remuneration and reward and |
| – | assist investors in understanding management decisions and the long term value of CSR. |
Are ‘underlying’ measures robust and reliable to use?
CSR cautions that whilst we define our ‘underlying’ measures in detail on page 131, these are not defined terms under IFRS or any other GAAP, and therefore the definitions should be carefully reviewed by investors.
Investors should be aware that the definition of ‘underlying’ measures can differ between companies, even if such measures have similar names. In particular:
| – | ‘underlying’ measures are not intended to be a substitute for IFRS measures; |
| – | ‘underlying’ measures are not superior to the IFRS measures reported; |
| – | The adjustments made between ‘underlying’ and IFRS measures are in some cases recurring. We do not represent that these are outside the normal course of business and |
| – | Some of these adjustments are based on management’s judgement in terms of both classification and estimation. |
| | |
| 130 | | CSR plc Annual Report and Financial Statements 2014 |
Reconciliation of ‘underlying’ measures to IFRS.
The table below defines the calculation of our ‘underlying’ measures and shows the most directly comparable IFRS measure:
| | | | |
| Non-GAAP Financial Measure | | Explanation | | Most Directly Comparable IFRS Measure |
|
| | |
| underlying research and development expenses | | represents ‘research and development expenses’ excluding ‘share-based payment charges’ and ‘amortisation of acquired intangible assets’ | | other research and development expenses |
|
| | |
| underlying sales, general and administration expenses | | represents ‘sales, general and administration expenses’ excluding ‘amortisation of intangibles’, ‘share-based payment charges’, ‘integration and restructuring’, ‘transaction costs’ and ‘other operating income’ | | other sales, general and administration expenses |
|
| | |
| underlying gross profit | | represents ‘revenue’ less ‘other cost of sales’ and excludes ‘amortisation of acquired intangible assets’ and ‘fair value adjustment to inventory’ recorded before ‘gross profit’ | | gross profit |
|
| | |
| underlying gross margin | | represents the ratio of underlying gross profit to revenue | | gross margin |
|
| | |
| underlying cost of sales | | represents ‘other cost of sales’ less ‘amortisation of acquired intangible assets’ | | other cost of sales |
|
| | |
| underlying operating profit | | represents ‘underlying gross profit’ after deduction of ‘underlying research and development’ and ‘underlying sales, general and administrative expenses’ | | operating profit |
|
| | |
| underlying net profit | | represents ‘underlying operating profit’, plus investment revenue, less finance costs, excluding the unwinding of the discount on the litigation liability and tax, excluding the tax effects of the adjustments made to underlying operating profit and the recognition of deferred tax assets for acquired tax losses | | net profit |
|
| | |
| underlying taxation | | represents ‘tax’ excluding the tax effects of the adjustments made to underlying operating profit, the impact of tax rate changes on our deferred tax assets, the movement in uncertain tax positions in the year and changes to deferred tax assets due to additional loss (or other temporary difference) recognition or de-recognition | | taxation |
|
| | |
| underlying diluted earnings per share | | represents underlying net profit divided by the weighted average number of diluted shares | | diluted earnings per share |
|
The tables below reconcile our ‘underlying’ measures to the IFRS measures presented in our consolidated income statement for the current year (2014), and prior year comparatives (2013 and 2012).
Specifically they reconcile:
| – | Gross Profit to ‘Underlying Gross Profit’ |
| – | Gross Margin to ‘Underlying Gross Margin’ |
| – | R&D Expenses to ‘Underlying R&D Expenses’ |
| – | SG&A Expenses to ‘Underlying SG&A Expenses’ |
| – | Operating profit/loss to ‘Underlying operating profit/loss’ |
| – | Profit before tax to ‘Underlying profit before tax’ |
| – | Taxation to ‘Underlying taxation’ |
| – | Net Profit to ‘Underlying Net Profit’ (the phrase Net Profit can be substituted by ‘profit for the period’) |
| – | Diluted earnings per share (eps) to ‘underlying diluted eps’ |
| | | | | | | | | | | | | | | | | | | | | | | | | | | | | | | | | | | | |
| 52 weeks ended 26 December 2014 | | Gross Profit $’000 | | | Gross
Margin
% | | | R & D
Expense $’000 | | | SG & A
Expense
$’000 | | | Operating
profit $’000 | | | Profit b/f tax $’000 | | | Taxation
$’000 | | | Net Profit
$’000 | | | Diluted
EPS $ | |
| |
IFRS | | | 449,898 | | | | 58.1 | | | | (240,921 | ) | | | (150,208 | ) | | | 96,967 | | | | 93,833 | | | | 2,993 | | | | 96,826 | | | | 0.55 | |
| | | | | | | | | |
Amortisation of intangibles | | | 3,272 | | | | 0.4 | | | | 863 | | | | 4,413 | | | | 8,548 | | | | 8,548 | | | | (2,841 | ) | | | 5,707 | | | | 0.03 | |
| | | | | | | | | |
Share - based payment charges | | | – | | | | – | | | | 16,569 | | | | 13,366 | | | | 29,935 | | | | 29,935 | | | | (6,712 | ) | | | 23,223 | | | | 0.13 | |
| | | | | | | | | |
Integration and restructuring | | | – | | | | – | | | | – | | | | 2,012 | | | | 2,012 | | | | 2,012 | | | | (1,129 | ) | | | 883 | | | | 0.01 | |
| | | | | | | | | |
Transaction costs | | | – | | | | – | | | | – | | | | 12,024 | | | | 12,024 | | | | 12,024 | | | | 185 | | | | 12,209 | | | | 0.07 | |
| | | | | | | | | |
Other operating income | | | – | | | | – | | | | – | | | | (1,347 | ) | | | (1,347 | ) | | | (1,347 | ) | | | 290 | | | | (1,057 | ) | | | (0.01) | |
| | | | | | | | | |
Non–current asset impairment reversal | | | – | | | | – | | | | – | | | | – | | | | (23,267 | ) | | | (23,267 | ) | | | – | | | | (23,267 | ) | | | (0.14) | |
| | | | | | | | | |
Gain on sale of Imaging IP | | | – | | | | – | | | | – | | | | – | | | | (14,931 | ) | | | (14,931 | ) | | | 7 | | | | (14,924 | ) | | | (0.08) | |
| | | | | | | | | |
Unwinding of discount on non–underlying items | | | – | | | | – | | | | – | | | | – | | | | – | | | | 1,022 | | | | (220 | ) | | | 802 | | | | – | |
| | | | | | | | | |
Tax effect of UK patent box | | | – | | | | – | | | | – | | | | – | | | | – | | | | – | | | | 1,400 | | | | 1,400 | | | | 0.01 | |
| | | | | | | | | |
Deferred tax effect of change in UK tax rate | | | – | | | | – | | | | – | | | | – | | | | – | | | | – | | | | (86 | ) | | | (86 | ) | | | – | |
| | | | | | | | | |
Recognition of tax assets | | | – | | | | – | | | | – | | | | – | | | | – | | | | – | | | | (10,951 | ) | | | (10,951 | ) | | | (0.06) | |
| | | | | | | | | |
Movement in uncertain tax positions | | | – | | | | – | | | | – | | | | – | | | | – | | | | – | | | | (828 | ) | | | (828 | ) | | | – | |
| | | | | | | | | |
| Prior year tax adjustment relating to non-underlying items | | | – | | | | – | | | | – | | | | – | | | | – | | | | – | | | | 37 | | | | 37 | | | | – | |
| |
Underlying | | | 453,170 | | | | 58.5 | | | | (223,489 | ) | | | (119,740 | ) | | | 109,941 | | | | 107,829 | | | | (17,855 | ) | | | 89,974 | | | | 0.51 | |
| |
| | | | | | | | | |
| 52 weeks ended 27 December 2013 | | Gross Profit $’000 | | | Gross
Margin
% | | | R & D
Expense
$’000 | | | SG & A
Expense
$’000 | | | Operating (loss) profit $’000 | | | Profit b/f tax $’000 | | | Taxation
$’000 | | | Net (loss)
profit $’000 | | | Diluted
EPS $ | |
| |
IFRS | | | 495,267 | | | | 51.6 | | | | (273,026 | ) | | | (193,731 | ) | | | (48,386 | ) | | | (52,459 | ) | | | 6,130 | | | | (46,329 | ) | | | (0.28) | |
| | | | | | | | | |
Amortisation of intangibles | | | 8,173 | | | | 0.8 | | | | 1,832 | | | | 6,788 | | | | 16,793 | | | | 16,793 | | | | (4,638 | ) | | | 12,155 | | | | 0.07 | |
| | | | | | | | | |
Share-based payment charges | | | – | | | | – | | | | 22,728 | | | | 15,415 | | | | 38,143 | | | | 38,143 | | | | (9,188 | ) | | | 28,955 | | | | 0.17 | |
| | | | | | | | | |
Integration and restructuring | | | – | | | | – | | | | – | | | | 24,678 | | | | 24,678 | | | | 24,678 | | | | (4,325 | ) | | | 20,353 | | | | 0.12 | |
| | | | | | | | | |
Litigation settlement | | | – | | | | – | | | | – | | | | 4,650 | | | | 4,650 | | | | 4,650 | | | | (1,081 | ) | | | 3,569 | | | | 0.02 | |
| | | | | | | | | |
Goodwill and non-current asset impairment charges | | | – | | | | – | | | | – | | | | – | | | | 76,896 | | | | 76,896 | | | | – | | | | 76,896 | | | | 0.44 | |
| | | | | | | | | |
Release of litigation provision | | | – | | | | – | | | | – | | | | (9,827 | ) | | | (9,827 | ) | | | (9,827 | ) | | | 3,489 | | | | (6,338 | ) | | | (0.04) | |
| | | | | | | | | |
Other operating income | | | – | | | | – | | | | – | | | | (3,671 | ) | | | (3,671 | ) | | | (3,671 | ) | | | 853 | | | | (2,818 | ) | | | (0.02) | |
| | | | | | | | | |
Fair value of contractual milestones | | | – | | | | – | | | | – | | | | 5,000 | | | | 5,000 | | | | 5,000 | | | | (1,163 | ) | | | 3,837 | | | | 0.02 | |
| | | | | | | | | |
Unwinding of discount on non-underlying items | | | – | | | | – | | | | – | | | | – | | | | – | | | | 1,568 | | | | (365 | ) | | | 1,203 | | | | 0.01 | |
| | | | | | | | | |
Deferred tax effect of change in UK tax rate | | | – | | | | – | | | | – | | | | – | | | | – | | | | – | | | | (29 | ) | | | (29 | ) | | | – | |
| | | | | | | | | |
Tax effect of UK patent box | | | – | | | | – | | | | – | | | | – | | | | – | | | | – | | | | 2,078 | | | | 2,078 | | | | 0.01 | |
| | | | | | | | | |
Recognition of tax losses brought forward | | | – | | | | – | | | | – | | | | – | | | | – | | | | – | | | | 3,128 | | | | 3,128 | | | | 0.02 | |
| | | | | | | | | |
| Prior year adjustment and movement on uncertain tax positions | | | – | | | | – | | | | – | | | | – | | | | – | | | | – | | | | (15,548 | ) | | | (15,548 | ) | | | (0.10) | |
| | | | | | | | | |
Effect of not diluting a loss per share | | | – | | | | – | | | | – | | | | – | | | | – | | | | – | | | | – | | | | – | | | | 0.02 | |
| |
Underlying | | | 503,440 | | | | 52.4 | | | | (248,466 | ) | | | (150,698 | ) | | | 104,276 | | | | 101,771 | | | | (20,659 | ) | | | 81,112 | | | | 0.46 | |
| |
| | |
| 132 | | CSR plc Annual Report and Financial Statements 2014 |
Non-IFRS measurescontinued
| | | | | | | | | | | | | | | | | | | | | | | | | | | | | | | | | | | | |
| 52 weeks ended 28 December 2012 | | Gross Profit $’000 | | | Gross
Margin
% | | | R & D
Expense $’000 | | | SG & A
Expense
$’000 | | | Operating
profit $’000 | | | Profit b/f tax $’000 | | | Taxation
$’000 | | | Net Profit
$’000 | | | Diluted
EPS $ | |
| |
IFRS | | | 509,077 | | | | 49.6 | | | | (290,346 | ) | | | (237,996 | ) | | | 107,913 | | | | 101,982 | | | | (50,749 | ) | | | 51,233 | | | | 0.25 | |
| | | | | | | | | |
Amortisation of intangibles | | | 11,342 | | | | 1.2 | | | | 3,124 | | | | 8,266 | | | | 22,732 | | | | 22,732 | | | | (6,184 | ) | | | 16,548 | | | | 0.08 | |
| | | | | | | | | |
Share-based payment charges | | | – | | | | – | | | | 14,894 | | | | 12,859 | | | | 27,753 | | | | 27,753 | | | | (4,387 | ) | | | 23,366 | | | | 0.11 | |
| | | | | | | | | |
Integration and restructuring | | | – | | | | – | | | | – | | | | 27,523 | | | | 27,523 | | | | 27,523 | | | | (3,523 | ) | | | 24,000 | | | | 0.12 | |
| | | | | | | | | |
Litigation settlement | | | – | | | | – | | | | – | | | | 15,500 | | | | 15,500 | | | | 15,500 | | | | (3,798 | ) | | | 11,702 | | | | 0.06 | |
| | | | | | | | | |
Gain on disposal of development operations | | | – | | | | – | | | | – | | | | – | | | | (127,178 | ) | | | (127,178 | ) | | | 56,262 | | | | (70,916 | ) | | | (0.35) | |
| | | | | | | | | |
Other operating income | | | – | | | | – | | | | – | | | | (214 | ) | | | (214 | ) | | | (214 | ) | | | 52 | | | | (162 | ) | | | – | |
| | | | | | | | | |
Option premium for option on tender offer | | | – | | | | – | | | | – | | | | – | | | | – | | | | 2,098 | | | | (514 | ) | | | 1,584 | | | | 0.01 | |
| | | | | | | | | |
Unwinding of discount on non-underlying items | | | – | | | | – | | | | – | | | | – | | | | – | | | | 2,330 | | | | (571 | ) | | | 1,759 | | | | 0.01 | |
| | | | | | | | | |
Deferred tax effect of change in UK tax rate | | | – | | | | – | | | | – | | | | – | | | | – | | | | – | | | | 2,050 | | | | 2,050 | | | | 0.01 | |
| | | | | | | | | |
Recognition of tax losses brought forward | | | – | | | | – | | | | – | | | | – | | | | – | | | | – | | | | (8,732 | ) | | | (8,732 | ) | | | (0.04) | |
| | | | | | | | | |
Movement on uncertain tax positions | | | – | | | | – | | | | – | | | | – | | | | – | | | | – | | | | 2,939 | | | | 2,939 | | | | 0.01 | |
| |
Underlying | | | 520,419 | | | | 50.8 | | | | (272,328 | ) | | | (174,062 | ) | | | 74,029 | | | | 72,526 | | | | (17,155 | ) | | | 55,371 | | | | 0.27 | |
| |
| | | | | | | | | | | | |
| | | 52 weeks ended 26
December 2014
Number of shares | | | 52 weeks ended
27 December 2013
Number of shares | | | 52 weeks ended
28 December 2012
Number of shares | |
| |
Weighted average number of shares used in diluted earnings per share calculations | | | 175,580,273 | | | | 164,181,841 | | | | 203,231,504 | |
| |
Effect of dilutive potential ordinary shares – share options | | | – | | | | 11,058,408 | | | | – | |
| |
Weighted average number of shares used in underlying diluted earnings per share calculations | | | 175,580,273 | | | | 175,240,249 | | | | 203,231,504 | |
| |
Corporate and share information
History and development
CSR plc is the holding company of an international group of companies, the principal activities of which are the design and development of semiconductor integrated circuits, including platforms, and software that are used by many of the world’s leading technology and consumer-focused companies in a wide range of end markets. For more information on CSR’s business and strategy, please see pages 8 to 15 of the Strategic Report. CSR is domiciled in England and Wales, and its registered office and principal place of business is at Churchill House, Cambridge Business Park, Cowley Road, Cambridge, CB4 0WZ. Its telephone number is +44 (0) 1223 692000.
CSR was established in Cambridge in April 1999 by an engineering and marketing team that previously worked at Cambridge Consultants Limited, a technology and consulting firm based in Cambridge, that transferred certain assets, including the assignment and license on a non-exclusive royalty free basis of intellectual property rights, to CSR in exchange for ordinary shares.
CSR plc (the holding company) was incorporated and registered in England and Wales on 26 March 2001 with the name Cambridge Silicon Radio Holdings Limited (registered number 04187346), as a private company limited by shares under the Companies Act 1985. On 10 July 2001, the company was re-registered as a public company limited by shares with the name Cambridge Silicon Radio Holdings plc. On 25 October 2002, it was re-registered as a private company limited by shares with the name Cambridge Silicon Radio Holdings Limited and on 19 February 2004, it was re-registered as a public company limited by shares with the name CSR plc. CSR ordinary shares were admitted to the Official List of the UK Listing Authority and to trading on the main market of the London Stock Exchange in March 2004. CSR’s shares are listed on the premium segment of the Official List maintained by the UK Listing Authority. In connection with the acquisition of SiRF Technology Holdings, Inc. (‘SiRF’), CSR registered its ordinary shares in 2009 pursuant to Section 12(g) of the Securities Exchange Act of 1934, and became an SEC reporting company. In connection with the acquisition of Zoran Corporation (‘Zoran’) in August 2011, ordinary shares issued by CSR in the form of American Depositary Shares (‘ADSs’, each ADS representing four ordinary shares in CSR plc) were listed on the NASDAQ Stock Market and commenced trading on the NASDAQ Global Select Market.
In the last six years, we have sought to broaden our technological base and product range through a series of acquisitions, of which the most material were:
| — | | In June 2009, we acquired SiRF, for a consideration of $281.5 million satisfied by the issue of ordinary shares in CSR plc to holders as at 26 June 2009 of SiRF common stock, at a ratio of 0.741 of a CSR ordinary share for each SiRF share of common stock. |
| — | | In July 2010, we acquired APT Licensing Limited, a leading ultra-high-quality codec developer, for a consideration of $4.25 million. |
| — | | In August 2011, we acquired Zoran, a leading provider of digital solutions for the digital entertainment and digital imaging markets, for a consideration of $440.5 million, satisfied by: (i) the payment of $316.4 million in cash (being a payment of $6.26 in cash for each share of Zoran common stock held); and (ii) the issue of ordinary shares in CSR plc in the form of ADSs at a ratio of 0.589 ordinary shares for each Zoran share of common stock, to holders of Zoran Corporation common stock as at 31 August 2011. |
| — | | In June 2014, we acquired certain assets and a development team from Reciva Limited for a consideration of $5.0 million. The acquisition enhanced our Voice & Music business by adding streaming audio capabilities to our networked audio products via our service delivery platform. |
In October 2012, we disposed of our handset connectivity and handset location developments operations to Samsung Electronics Co., Ltd. (‘Samsung’) for $310 million in cash. Along with the disposal, we also transferred 311 people to Samsung. The cash consideration was subject to a maximum adjustment of a $5 million increase or decrease in certain circumstances, linked to the progress made in finalising the development of a Wi-Fi/Bluetooth combination connectivity chip, to which both CSR and Samsung will have rights to exploit in their respective end markets. In 2014, CSR paid $5 million to Samsung in respect of this provision. Upon completion of this transaction, Samsung Electronics Europe Holding Coöperatief U.A. invested $34.4 million in return for CSR ordinary shares. On 15 January 2014, Samsung disposed of their entire holding of ordinary shares in the Company.
On 15 October 2014, the boards of CSR plc and Qualcomm Incorporated (‘Qualcomm’) announced that an agreement had been reached regarding the terms of a recommended cash offer for the Company, whereby Qualcomm Global Trading Pte. Ltd. (‘QGT’), an indirect, wholly owned subsidiary of Qualcomm, will acquire the entire issued and to be issued share capital of CSR (the ‘Qualcomm Transaction’). As announced, the Qualcomm Transaction will be implemented by way of a court-sanctioned scheme of arrangement under Part 26 of the Companies Act 2006 (the ‘Scheme’) pursuant to which the Scheme Shares (as defined in the Scheme Document, which is defined below) will be cancelled and extinguished by way of a reduction in the capital of CSR plc and QGT (and/or its nominee(s)) will acquire newly issued shares paid up out of the reserve arising as a result of the cancellation of the Scheme Shares. On 12 November 2014, we published the Scheme document (the ‘Scheme Document’) which set out the detailed terms of the Scheme.
The court meeting and general meeting held on 4 December 2014, resulted in the approval of the Scheme and the passing of a special resolution to approve certain matters relating to the Scheme and the Qualcomm Transaction, including: the amendment of the Company’s Articles of Association, with effect from the date of the meetings, and the re-registration of the Company as a private company, the reduction of the share capital of CSR by cancelling the Scheme Shares (as defined in the Scheme Document) and the issue of new shares to QGT and/or its nominees, which will take effect on the dates indicated in the Scheme Document.
Under the terms of the Qualcomm Transaction, the Scheme Shareholders (as defined in the Scheme Document) on the Company’s register of members at 6.00 p.m. on the day before the Effective Date (as defined in the Scheme Document) will be entitled to receive 900 pence in cash for each CSR ordinary share held by them at that time.
The Qualcomm Transaction is subject to a number of regulatory and other conditions, which are set out in full in Part Three of the Scheme Document, and which include obtaining clearance from the relevant competition authorities in China, Germany, Japan, South Korea, Taiwan and the United States. Clearance has been obtained in respect of the United States, as announced on 15 December 2014, and in respect of Germany, as announced on 2 February 2015. It is expected that the Scheme will become effective by late summer 2015.
| | |
| 134 | | CSR plc Annual Report and Financial Statements 2014 |
Corporate and share informationcontinued
Research and development
We devote a substantial portion of our resources to identifying, evaluating, and developing ideas that we can bring to market as innovative technologies and products for our customers. As at 26 December 2014, we employed 1,515 people in research and development, across 17 R&D centres in 7 different countries. Our R&D expenditure was approximately $240.9 million in 2014 compared to $273.1 million in 2013 and $290.4 million in 2012. For more information on our business and the products and technologies in which we are investing see pages 8 to 15. For more information on our financial results and investment in R&D see page 22 of the Strategic Report.
Sales and marketing
Our sales and marketing function is centred in Cambridge, United Kingdom and San Jose, United States with sales and liaison offices in Boston and Plano, United States; Taipei, Taiwan; Seoul, South Korea; Tokyo, Japan; Singapore; Beijing, Shanghai and Shenzhen, China.
We market to original equipment manufacturers and original design manufacturers, principally through our direct sales force and, in North America, through sales representatives. We also market our products through a global network of distributors.
Our marketing efforts are supported by a team of applications engineers that provide technical support and assistance to existing and potential customers in designing, testing and qualifying systems that incorporate our products. This support is generally provided without charge to customers who have the potential to purchase large volumes of products. An important part of our marketing efforts involves providing technical support to product developers to encourage them to design products using our chips. For this purpose, we provide a range of development kits and tools.
Manufacturing
We are a ‘fabless’ semiconductor company, which means we subcontract all aspects associated with the manufacture (wafer fabrication, packaging and testing) of our products prior to shipping to our customers. TSMC and ASE remain the primary vendors for the volume of manufacturing, which is carried out at a number of locations across the world, comprising primarily Taiwan, but including South Korea, China, the US and Singapore. We do not have long-term contracts with any of these third parties, and thus have no contractual assurance as to their long-term availability or the costs associated with the supply of products and services.
Through all our subcontractors, we work to ensure that the Group is able to maintain sufficient capacity to support the demand for our products. The ability to supply our customers can be affected in the event of a loss of capacity at a supplier due to events affecting their business, such as natural disaster, interruption of their own supply chain or increased demand from our competitors, which may mean we are unable to secure the volumes of products we require to meet customer demand. This is discussed in more detail on pages 43 to 51 in the section that explains the risk factors which we face.
Raw materials
CSR sources both the manufacture and testing of its silicon wafers and the packaging of its integrated circuits from a small number of subcontractors, including those named above, who have facilities spread across multiple locations, primarily in Taiwan, but also in South Korea, China, the US and Singapore. CSR also purchases memory and certain other passive components from other commodity suppliers. These are standard components capable of being obtained through alternative sources, subject to the conduct of a product qualification process prior to adoption into manufacturing. The prices of our principal raw materials may be volatile. For example, precious metals such as copper and gold, that are used in our products, are subject to variation in price due to general supply and demand market dynamics, which can be affected by global economic issues, and potential shortages or delays in extraction and processing.
Seasonality
CSR has historically experienced increased net revenue in its second and third quarters compared with the fourth and first quarters primarily due to seasonal demand related to the holiday season. However, in 2013, there was a positive impact on revenues in the first half of the year due to the demand for mono headsets in China arising from the enforcement of hands-free driving legislation, which benefited our Voice & Music segment. Due to continued economic uncertainty and other factors, past historical patterns should not be considered a reliable indicator of our future net revenue or financial performance as historical seasonal patterns may not recur.
Governmental regulation
For a discussion of the possible material effects of governmental regulations on CSR’s business, please refer to the Risk Factors and to the discussion of risks relating to political, economic and regulatory conditions in the countries in which we and our customers operate on pages 43 to 51.
Intellectual property
Our success and ability to compete depends to a significant degree upon the protection of our proprietary technology. As at 26 December 2014, we had approximately 1,600 patents granted worldwide (with expiration dates ranging from 2014 to 2034) and approximately 600 pending patent applications compared to approximately 1,650 patents granted worldwide and approximately 850 pending patent applications as at 27 December 2013. The decrease in the numbers of patents granted and pending patent applications during 2014, is principally due to the sale to Qualcomm Incorporated of Imaging IP assets associated with the camera business in June 2014. We intend to continue to assess appropriate occasions for seeking patent protection for those aspects of our technology that we believe provides significant competitive advantage. Although we file patents to protect our inventions, our revenue is not dependent on any particular patent. We do not believe that the expiration or loss of a particular patent would materially harm our business.
CSR plc
Churchill House
Cambridge Business Park
Cowley Road
Cambridge
CB4 0WZ
Registered in England and Wales 4187346
www.csr.com
Advisers
| | |
|
| Auditors | | Deloitte LLP |
|
| Corporate brokers | | JPMorgan Cazenove Limited |
|
| Solicitors | | Slaughter and May |
|
| Bank | | Lloyds Bank plc |
|
| Share Information at 16 March 2014 | | |
|
| Shares outstanding (including shares underlying the ADSs) | | 166,331,652 |
|
| Trading Symbol (Ordinary Shares) | | CSR |
|
| Country of Registration | | England |
|
| Market | | London Stock Exchange |
|
| SEDOL | | 3414738 |
|
| Registrar | | Equiniti, Aspect House, Spencer Road, Lancing, West Sussex, BN99 6DA |
|
| ADSs | | evidenced by American Depositary Receipts, each ADS representing four ordinary shares of CSR |
|
| Trading Symbol (ADSs) | | CSRE |
|
| Market | | NASDAQ Global Select Market |
|
| Depositary | | JPMorgan Chase Bank N.A., PO Box 64504, St. Paul, MN 55164-0504 |
|
ADS payment information
The rights of ADS holders are set forth in the deposit agreement (‘Deposit Agreement’) entered into among JPMorgan Chase Bank, N.A., as depositary (the ‘Depositary’), ADS holders from time to time and CSR. CSR filed the Deposit Agreement with the SEC as an exhibit to its registration statement on Form F-6 on 26 July 2011. We summarise below some provisions of the Deposit Agreement relating to fees and charges that an ADS holder may have to pay, as well as fees and other payments made by the Depositary to CSR.
Fees payable by ADS holders
Under the terms of the Deposit Agreement, an ADR holder may have to pay the following service fees to the Depositary:
| | |
| Service | | Fees |
|
| Issuances, including against the deposit of ordinary shares, in respect of distribution of shares, rights or other property, stock dividend, stock splits, rights, merger; exchange of securities or other transaction or event or other distribution affecting the ADSs or ordinary shares | | Up to $5.00 per 100 ADSs (or fraction thereof) issued |
|
| Surrender of ADSs for withdrawal of ordinary shares, cancellation or reduction of ADSs | | Up to $5.00 per 100 ADSs (or fraction thereof) issued |
|
| Cash distributions | | Up to $0.05 per ADS |
|
| Transfer of ADRs | | $1.50 per ADR presented for transfer |
|
| Distribution or sale of securities, the fee being in an amount equal to the fee for the execution and delivery of ADSs that would have been charged as a result of the deposit of such securities | | Up to $5.00 per 100 ADSs (or fraction thereof) issued |
|
| Depositary administration services | | Up to $0.05 per ADS payable at the sole discretion of the Depositary by billing ADS holders or by deducting charges from one or more cash dividends or other cash distributions |
|
| Expenses of the Depositary incurred on behalf of ADS holders, including in connection with (a) compliance with applicable law or regulation (e.g. foreign exchange control regulations or any law or regulation relating to foreign investment), (b) stock transfer or other taxes and governmental charges, (c) electronic and facsimile transmission/delivery charges, (d) transfer or registration fees for the registration or transfers of underlying shares, and (e) the conversion of foreign currency into US dollars (which are paid out of such foreign currency) | | Expenses payable at the sole discretion of the Depositary by billing ADS holders or by deducting charges from one or more cash dividends or other cash distributions |
|
The Depositary has agreed to waive the issuance fee for the issuance of ADSs against the deposit of ordinary shares in connection with certain events and not to charge ADS holders for certain cash dividend fees or annual administrative service fees, unless otherwise agreed with CSR.
| | |
| 136 | | CSR plc Annual Report and Financial Statements 2014 |
Corporate and share informationcontinued
Fees and payments made by the Depositary to CSR
The Depositary has also agreed to reimburse CSR up to a certain limit for certain expenses in connection with the maintenance of the ADS programme, including investor relations activities, listing fees and reasonable legal, audit and accounting fees. The Depositary has further agreed to waive, on an annual basis, servicing fees relating to routine corporate actions, as well as other administration and operating expenses, including maintenance of DR register, administration of ADS holders’ accounts and custodian reconciliation.
Other than during the first year period after the effective date of the Deposit Agreement (when the Depositary reimbursed CSR up to $50,000 for certain expenses incurred by CSR in connection with the establishment of the ADS programme), no fees or other payments were paid by the Depositary to CSR.
Capital structure
| | | | | | | | |
| Holding | | Number of shareholders | | | % age of total shareholders | |
| |
1-1,000 | | | 613 | | | | 49.20 | |
| |
1,001-5,000 | | | 279 | | | | 22.39 | |
| |
5,001-10,000 | | | 84 | | | | 6.74 | |
| |
10,001-50,000 | | | 110 | | | | 8.83 | |
| |
50,001-100,000 | | | 33 | | | | 2.65 | |
| |
100,001-250,000 | | | 47 | | | | 3.77 | |
| |
Over 250,000 | | | 80 | | | | 6.42 | |
| |
Total | | | 1,246 | | | | 100 | |
| |
The information provided above is as at 16 March 2015.
Market prices
The primary trading market for CSR ordinary shares is the London Stock Exchange, where CSR ordinary shares trade under the ticker symbol ‘CSR’. As of 26 December 2014, there were 185,955,224 CSR ordinary shares outstanding, of which 19,855,906 shares were held in treasury.
The following table shows the high and low market prices for CSR ordinary shares in pounds sterling for the five most recent full financial years, for each full financial quarter for the two most recent full financial years and for each month within the last six months:
| | | | | | | | |
| | | | | | CSR Ordinary Shares (pence) | |
| Year | | High | | | Low | |
| |
2014 | | | 857.00 | | | | 512.50 | |
| |
2013 | | | 639.50 | | | | 333.80 | |
| |
2012 | | | 365.60 | | | | 187.80 | |
| |
2011 | | | 447.00 | | | | 154.10 | |
| |
2010 | | | 505.00 | | | | 280.90 | |
| |
| | |
| | | | | | CSR Ordinary Shares (pence) | |
| Quarter | | High | | | Low | |
| |
Fourth Quarter 2014 | | | 857.00 | | | | 645.00 | |
| |
Third Quarter 2014 | | | 795.00 | | | | 512.50 | |
| |
Second Quarter 2014 | | | 725.50 | | | | 534.00 | |
| |
First Quarter 2014 | | | 806.50 | | | | 632.00 | |
| |
Fourth Quarter 2013 | | | 639.50 | | | | 477.90 | |
| |
Third Quarter 2013 | | | 607.00 | | | | 485.70 | |
| |
Second Quarter 2013 | | | 570.00 | | | | 464.20 | |
| |
First Quarter 2013 | | | 492.80 | | | | 333.80 | |
| |
| | |
| | | | | | CSR Ordinary Shares (pence) | |
| Month | | High | | | Low | |
| |
February 2015 | | | 870.00 | | | | 852.50 | |
| |
January 2015 | | | 863.00 | | | | 852.50 | |
| |
December 2014 | | | 857.00 | | | | 831.50 | |
| |
November 2014 | | | 841.00 | | | | 818.00 | |
| |
October 2014 | | | 857.00 | | | | 645.00 | |
| |
September 2014 | | | 795.00 | | | | 728.50 | |
| |
CSR ordinary shares have been listed since 31 August 2011 on the NASDAQ in the form of ADSs, with each ADS representing four ordinary shares of CSR; the ticker symbol is ‘CSRE’.
The following table shows the high and low market prices for CSR ADSs in US dollars for the full financial years 2014, 2013 and 2012, for the portion of the 2011 financial year from the commencement of the listing, for each full financial quarter for the two most recent full financial years and for each month within the last six months:
| | | | | | | | |
| | | | | | CSR ADSs ($) | |
| Year | | High | | | Low | |
| |
2014 | | | 54.90 | | | | 34.05 | |
| |
2013 | | | 41.96 | | | | 21.66 | |
| |
2012 | | | 23.10 | | | | 11.51 | |
| |
2011 | | | 15.20 | | | | 9.38 | |
| |
| | |
| | | | | | CSR ADSs ($) | |
| Quarter | | High | | | Low | |
| |
Fourth Quarter 2014 | | | 54.90 | | | | 41.44 | |
| |
Third Quarter 2014 | | | 51.93 | | | | 34.05 | |
| |
Second Quarter 2014 | | | 48.36 | | | | 35.75 | |
| |
First Quarter 2014 | | | 53.39 | | | | 41.89 | |
| |
Fourth Quarter 2013 | | | 41.96 | | | | 30.00 | |
| |
Third Quarter 2013 | | | 37.14 | | | | 30.23 | |
| |
Second Quarter 2013 | | | 34.36 | | | | 28.49 | |
| |
First Quarter 2013 | | | 29.55 | | | | 21.66 | |
| |
Fourth Quarter 2012 | | | 23.10 | | | | 20.74 | |
| |
Third Quarter 2012 | | | 21.15 | | | | 13.56 | |
| |
Second Quarter 2012 | | | 15.13 | | | | 12.02 | |
| |
First Quarter 2012 | | | 16.32 | | | | 11.51 | |
| |
| | |
| | | | | | CSR ADSs ($) | |
| Month | | High | | | Low | |
| |
February 2015 | | | 53.45 | | | | 51.28 | |
| |
January 2015 | | | 52.70 | | | | 51.40 | |
| |
December 2014 | | | 53.00 | | | | 52.01 | |
| |
November 2014 | | | 53.77 | | | | 51.28 | |
| |
October 2014 | | | 54.90 | | | | 41.44 | |
| |
September 2014 | | | 51.93 | | | | 47.55 | |
| |
| | |
| 138 | | CSR plc Annual Report and Financial Statements 2014 |
Corporate and share informationcontinued
Return of capital to shareholders
Share buyback
During 2014, CSR undertook open-market purchases of its ordinary shares. The purchases, which are set forth in the table below, were instituted by the Board of CSR under authorities granted by shareholders at general meetings.
| | | | | | | | | | | | | | | | | | | | | | | | |
| Issuer Purchases of Equity Securities Period | | Start date | | | End date | | | Total Number of
Shares Purchased | | | Average Price Paid
per Share (pence) | | | Total Number of Shares
Purchased as Part of
Publicly Announced
Plans or Programmes1, 2 | | | Maximum Number
(or Approximate Dollar Value)
of Shares (or units) that May
Yet be Purchased Under the
Plans or Programmes2 | |
| |
May 2014 | | | 1 May | | | | 30 May | | | | 2,843,000 | | | | 562.09 | | | | 2,843,000 | | | | – | |
| |
June 2014 | | | 2 June | | | | 30 June | | | | 2,275,026 | | | | 599.99 | | | | 2,275,026 | | | | – | |
| |
July 2014 | | | 15 July | | | | 31 July | | | | 503,200 | | | | 571.30 | | | | 503,200 | | | | – | |
| |
August 2014 | | | 1 Aug | | | | 27 Aug | | | | 739,502 | | | | 539.65 | | | | 739,502 | | | | $8.5m | |
| |
| 1 | On 26 February 2014, CSR announced its intention to undertake a buyback of its ordinary shares of up to $50 million (the ‘First 2014 Share Buyback’). Pursuant to the general authorities obtained from shareholders at the Annual General Meetings held on 22 May 2013 and 21 May 2014, in the period from 1 May 2014 to 30 June 2014, the Company completed the purchase of 5,118,026 ordinary shares in the open market, all of which were cancelled. As at the close of the share buyback on 30 June 2014, the full $50 million had been expended. See Share capital – Other Statutory Information for more information. |
| | For the First 2014 Share Buyback, the Company entered into arrangements with J.P. Morgan Securities plc such that the Company purchased shares from J.P. Morgan Securities plc who had itself, acting as principal, first made market purchases of such shares. J.P. Morgan Securities plc acted as an independent third party, which allowed the First 2014 Share Buyback to continue to be undertaken following the end of the second financial quarter for the 2014 financial year, during what would otherwise have been a prohibited period of the Company. |
| 2 | In June 2014, the Board authorised a further share buyback of up to $20 million (the ‘Second 2014 Share Buyback’). Under the Second 2014 Share Buyback, purchases were made in the open market between 15 July 2014 and 27 August 2014 under a general authority provided by shareholders at the 2014 Annual General Meeting. A total of approximately $11.5 million, excluding commission, was expended and as at 27 August 2014, being the last day on which shares were acquired under the authority, 1,242,702 ordinary shares had been repurchased, all of which were cancelled. After this date the buyback was suspended due to the announcement on 28 August 2014 of the approach to the Company by Microchip Technology Inc. with regards to a possible offer for CSR. On 15 October 2014, as mentioned earlier, the offer from Qualcomm was announced, and in view of this and as previously advised, the Board does not intend to undertake any further share buybacks prior to the completion of this transaction. This general authority is renewed generally on an annual basis. |
| 3 | In the calculation of the approximate dollar value of the shares that may yet be purchased, under the Second 2014 Share Buyback, which was determined to be $8.5 million, excluding commission. |
Over the past three years, diluted earnings per ordinary share has increased from $0.25 in 2012 to $0.55 in 2014 and profit per 52 week period has increased over the same period from $51.2 million at the end of 2012 to $96.8 million at the end of 2014.
This trend can be attributed to improvements in operating expenses and gross margins, which have more than offset the decrease in revenue, as well as the recognition of gains on disposal of both development operations in handset location and handset connectivity in 2012 ($127.2 million) and disposal of Imaging IP in 2014 ($14.9 million). We recognised a loss in 2013, largely due to impairment charges of $76.9 million following the announcement to discontinue investment in the camera-on–a-chip (COACH) platform in December 2013. Of the impairment charges recorded in 2013, $23.3 million were reversed in 2014.
The diluted share count decreased from 203.2 million in 2012 to 175.6 million in 2014.
This trend can be attributed to the impact on the diluted share count of the completion of the tender offer at the end of 2012, during which CSR repurchased and subsequently cancelled 49.1 million shares, as well as subsequent buybacks in 2013 and 2014, under which a further 14.8 million shares were repurchased. The effect of the buybacks and tender offer on the diluted share count have been partially offset by the issue of 25.0 million ordinary shares, to satisfy employee share options and shares awards and other equity releases, as well as an increased dilutive effect of outstanding share options and awards due to share price increases over the same period.
The total shareholder return over the three year financial period ended 26 December 2014 was 375.4%, as the share price increased from £1.84 at the beginning of the 52 weeks ended 28 December 2012 to £8.49 as at 26 December 2014. The improvements in the share price over this period have been driven by growth in underlying earnings per ordinary share, the completion of a $285 million tender offer, as well as the repurchase of 17.3 million ordinary shares, and the receipt of a recommended cash offer for the Group of 900 pence per ordinary share from Qualcomm.
Total shareholder return has also been underpinned by a progressive dividend policy.
Dividend
It was the Board’s intention to follow a progressive dividend policy that reflected the underlying growth prospects of the Company. In light of the terms of the Qualcomm Transaction, the Board does not intend to pay, or to recommend for payment, any dividend at this time.
Exchange rates
The following table sets out, for the periods and dates indicated, the period end, average, high and low exchange rates for pounds sterling expressed in US dollars per £1.00.
| | | | | | | | | | | | |
| Year | | Average | | | High | | | Low | |
| |
2014 | | | 1.65 | | | | 1.72 | | | | 1.55 | |
| |
2013 | | | 1.56 | | | | 1.65 | | | | 1.48 | |
| |
2012 | | | 1.58 | | | | 1.63 | | | | 1.53 | |
| |
2011 | | | 1.60 | | | | 1.67 | | | | 1.54 | |
| |
2010 | | | 1.55 | | | | 1.64 | | | | 1.43 | |
| |
| | | |
| Month | | | | | High | | | Low | |
| |
February 2015 | | | | | | | 1.54 | | | | 1.50 | |
| |
January 2015 | | | | | | | 1.56 | | | | 1.50 | |
| |
December 2014 | | | | | | | 1.58 | | | | 1.55 | |
| |
November 2014 | | | | | | | 1.62 | | | | 1.56 | |
| |
October 2014 | | | | | | | 1.63 | | | | 1.59 | |
| |
September 2014 | | | | | | | 1.66 | | | | 1.61 | |
| |
Major shareholders
Information regarding our major shareholders is disclosed on page 81. None of the holders of CSR ordinary shares have voting rights that differ from those of other shareholders. JPMorgan Chase Bank N.A., as custodian of the Company’s ADR programme, held approximately 1.21% of the Company’s ordinary shares of 0.1 pence each at 16 March 2015 as nominee. The total number of ADRs outstanding at 16 March 2015 were 2,004,732. As of 16 March 2015, there were 197 shareholders with a US address on the register of shareholders, representing approximately 1.34% of CSR’s outstanding share capital. Because many of our ordinary shares are held by brokers and nominees, the number of recorded shareholders in the United States may not be representative of the number of beneficial shareholders in the United States. CSR is not directly or indirectly owned or controlled by any government, person or other legal entity. There are no arrangements known to CSR that could result in a change of control of CSR, other than the Qualcomm Transaction mentioned above.
Agent in the United States
The Company’s agent for service in the United States is National Registered Agents, Inc, 160 Greentree Drive, Suite 101, Dover, Delaware 19904.
Documents on display
Under the Exchange Act, we are required to file reports and other information with the SEC. Copies of these reports and other information, when so filed, including documents referred to in this Annual Report, may be inspected without charge and may be obtained at prescribed rates at the public reference facilities maintained by the SEC at Judiciary Plaza, 100 F Street, N.E., Washington, D.C. 20549. For further information regarding the operation of the public reference room and the copy charges, please call the SEC at 1-800-SEC-0330. The SEC maintains a website at www.sec.gov that contains reports, proxy and information statements, and other information regarding registrants that make electronic filings with the SEC using its EDGAR system. As a foreign private issuer, we are exempt from the rules of the Exchange Act prescribing the filing and content of quarterly reports and proxy statements, and our executive officers, directors and principal shareholders are exempt from the reporting and short-swing profit recovery provisions contained in Section 16 of the Exchange Act.
This Annual Report is also available, free of charge, at www.csr.com. You may also obtain copies of this Report, free of charge, by mail by requesting a copy from the Company Secretary. The information on our website is not incorporated by reference into this report.
Memorandum and Articles of Association
The following summarises certain provisions of the Company’s Memorandum and Articles of Association and applicable English law, as currently in effect. This summary is qualified in its entirety by reference to the Companies Act 2006 and the Company’s Memorandum and Articles of Association, copies of which can be obtained from Companies House in the United Kingdom or by writing to the Company Secretary. The Articles of Association of CSR plc were filed with the U.S. Securities and Exchange Commission on Form 6-K on 8 December 2014. Copies of the Company’s Memorandum and Articles of Association, as currently in force, are available from the US Securities and Exchange Commission website at www.sec.gov.
Objects and purposes
CSR plc was incorporated and registered in England and Wales on 26 March 2001 with the name Cambridge Silicon Radio Holdings Limited, as a private company limited by shares under the Companies Act 2006. On 10 July 2001, CSR was re-registered as a public company limited by shares with the name Cambridge Silicon Radio Holdings plc; on 25 October 2002, CSR was re-registered as a private company limited by shares with the name Cambridge Silicon Radio Holdings Limited; and on 19 February 2004, it was re-registered as a public company limited by shares with the name CSR plc (registered number 04187346).
Directors
The business of the Company is conducted under the supervision of the Board.
Conflicts of interest
The Companies Act 2006 requires a director of a company who is in any way interested, directly or indirectly, in a contract or proposed contract with the Company to declare the nature and extent of his interest to the other directors of the Company. The Companies Act
| | |
| 140 | | CSR plc Annual Report and Financial Statements 2014 |
Corporate and share informationcontinued
2006 also requires that a director must avoid a situation where a director has, or could have, a direct or indirect interest that conflicts, or possibly may conflict, with the company’s interests. It allows the non-conflicted directors of public companies to authorise such conflicts where appropriate, if a company’s articles of association so permit. CSR’s Articles of Association provide that the Board may in specified circumstances authorise any matter that would otherwise involve a director breaching his duty under the Companies Act 2006 to avoid a conflict of interest. They also provide that, subject to authorisation of such conflict, a director may retain any benefit derived by reason of that interest.
Borrowing powers
The Board may exercise the Company’s borrowing powers. Save with the previous sanction of an ordinary resolution, no money shall be borrowed if the principal amount outstanding of all borrowings by the group exceeds, or would as a result of such borrowing exceed, an amount equal to the greater of £300,000,000 and three times the Company’s adjusted capital and reserves.
Retirement
The Company’s Articles of Association state that a director shall retire from office and may offer himself for re-appointment when he has been appointed by the Board since the last annual general meeting, held office in the preceding two annual general meetings and did not retire at either of them, or has been in office, other than employment or executive office, for a continuous period of nine years or more at the date of the meeting.
The UK Corporate Governance Code requires all directors of FTSE 350 companies to be subject to annual election by shareholders. Accordingly, all directors will be retiring at the Annual General Meeting to be held on 20 May 2015 and offering themselves for re-election. This is explained in further detail in the Notice of Annual General Meeting, which is a separate document issued to shareholders.
Director qualifying shares
Directors of the Company are not required by the Memorandum or the Articles of Association to hold any shares in the Company.
Rights and restrictions attaching to the shares
Dividend rights
The shareholders may by ordinary resolution from time to time declare dividends not exceeding the amount recommended by the Board. The Board may pay interim dividends, and also any fixed rate dividend, whenever the financial position of CSR, in the opinion of the Board, justifies its payment. If the Board acts in good faith, it is not liable to holders of shares with preferred or similar rights for losses arising from the payment of interim or fixed dividends on other shares.
The Board may withhold payment of all or any part of any dividends or other moneys payable in respect of CSR’s shares from a person with at least a 0.25% interest in CSR shares or in a class of CSR shares if such a person has been served with a restriction notice after failure to provide CSR with information concerning interests in those shares required to be provided under the Companies Act 2006.
The Board may, if authorised by an ordinary resolution, offer shareholders (excluding any member holding shares as treasury shares) in respect of any dividend the right to elect to receive shares by way of scrip dividend instead of cash.
Any dividend unclaimed after a period of 12 years from the date when it was declared or became due for payment must be forfeited and revert to CSR unless the Board decides otherwise. CSR may stop sending cheques, warrants or similar financial instruments in payment of dividends by post in respect of any shares or may cease to employ any other means of payment, including payment by means of a relevant system, for dividends if either (i) at least two consecutive payments have remained uncashed or are returned undelivered or that means of payment has failed or (ii) one payment remains uncashed or is returned undelivered or that means of payment has failed and reasonable inquiries have failed to establish any new postal address or account of the holder. In addition, CSR must resume sending dividend cheques, warrants or similar financial instruments or employing that means of payment if the holder requests such resumption in writing.
Voting rights
Members will be entitled to vote at a general meeting or class meeting whether on a show of hands or a poll. Under the Companies Act 2006:
| (a) | on a show of hands every member who is present in person is entitled to one vote regardless of the number of shares he or she holds. Every proxy present who has been duly appointed by one or more shareholders entitled to vote on the resolution has one vote on a show of hands, unless the proxy is appointed by more than one shareholder in which case the proxy has one vote for and one vote against if the proxy has been instructed by one or more shareholders to vote for the resolution and by one or more shareholders to vote against the resolution. The Articles of Association provide that, where a proxy is given discretion as to how to vote on a show of hands, this will be treated as an instruction by the relevant member to vote in the way that the proxy decides to exercise that discretion; and |
| (b) | on a poll every member has one vote per share held by him and he may vote in person or by one or more proxies. Where he appoints more than one proxy, the proxies appointed by him taken together shall not have more extensive voting rights than he could exercise in person. |
The Articles of Association provide that resolutions put to a vote at a shareholders’ meeting will be decided on a show of hands, unless a poll is demanded by: (a) the chairman of the meeting; (b) not less than five members present in person or by proxy and entitled to vote; (c) a member or members present in person or by proxy and representing not less than one-tenth of the total voting rights of all the members having the right to vote on the resolution; or (d) a member or members present in person or by proxy and holding shares in CSR conferring a right to vote at the meeting being shares on which an aggregate sum has been paid up equal to not less than one-tenth of the total sum paid up on all the shares conferring that right.
A demand for a poll may be withdrawn with the consent of the chairman of the meeting at any time before the close of the meeting or the taking of the poll, whichever is the earlier. A demand so withdrawn shall not invalidate the result of a show of hands declared before the demand was made.
Under English law, any shareholder entitled to attend and vote at a meeting is entitled to appoint a proxy to exercise all or any of his rights to attend, speak and vote at a meeting of the company.
Rights to share in profits
Other than the provisions outlined above in relation to dividends that have been declared and the provisions below in relation to rights on a liquidation of CSR, shareholders have no rights to share in the profits of CSR.
Pre-emptive rights
Subject to the Companies Act 2006, any equity securities issued by CSR for cash must first be offered to CSR shareholders in proportion to their existing holdings of CSR ordinary shares.
The Companies Act 2006 and the Listing Rules made by the UK Listing Authority, allow for the disapplication of pre-emption rights, which may be waived by a special resolution of CSR shareholders, either generally or specifically, for a maximum period not exceeding five years.
Liquidation rights
The rights of shareholders to share in any surplus in the event of liquidation are not expressly dealt with in the Articles of Association. Under English law, if CSR is wound up (whether the liquidation is voluntary, under supervision of the Court, or by the Court), the liquidator is under a duty to collect in and realise the assets of CSR and to distribute them to CSR’s creditors, and, if there is a surplus, to CSR shareholders according to their entitlements. This applies whether the assets consist of property of one kind or of different kinds.
Redemption provisions
Subject to the provisions of the Companies Act 2006 and the Listing Rules, CSR may purchase or contract to purchase any of its ordinary shares on or off-market. CSR may only purchase its ordinary shares out of distributable reserves or the proceeds of a new issue of shares made for the purpose of funding the repurchase.
Sinking fund provisions
CSR shares are not subject to any sinking fund provision under its Memorandum or Articles of Association or under English law.
Capital calls
Shareholders have no liability for capital calls by the Company save that the directors can call on shareholders to pay the unpaid amount, if any, respecting their shares consisting of the nominal value of the shares and any premium which may be payable on those shares.
Variation of rights
The Articles of Association provide that the rights attached to any class of shares may be varied with the written consent of the holders of not less than three-fourths in nominal value of the issued shares of that class (calculated excluding any shares held as treasury shares), or with the sanction of a special resolution passed at a separate general meeting of the holders of those shares. At every such separate general meeting (except an adjourned meeting), the quorum must be two persons holding or representing by proxy not less than one-third in nominal value of the issued shares of the class (calculated excluding any shares held as treasury shares).
The rights conferred upon the holders of any shares are not, unless otherwise expressly provided in the rights attaching to those shares, deemed to be varied by the creation or issue of further shares ranking equally with them
General meetings
The Articles of Association rely on the Companies Act 2006 provisions dealing with the calling of general meetings. An annual general meeting of shareholders must be held once in every year within a period of six months beginning with the day following CSR’s accounting reference date. CSR’s Board may convene a general meeting of shareholders whenever they think fit or where they are requisitioned to do so by CSR shareholders in accordance with the Companies Act 2006.
General meetings may be held at such time and place as may be determined by CSR’s Board. An annual general meeting must be convened on at least 21 days’ written notice to shareholders entitled to receive notices. General meetings must be convened on at least 21 days’ written notice unless the requisite majority of shareholders has agreed to short notice. Under the Articles of Association, two shareholders must be present in person or by proxy and entitled to vote to constitute a quorum for all purposes at general meetings of CSR.
Pursuant to the authority obtained at the 2014 Annual General Meeting, the Company can call general meetings (other than an annual general meeting) on 14 days’ notice. Please see ‘Notice required for shareholder meetings’ under Other Statutory Information on page 80 for further information.
Limitation on voting rights
Persons who are neither residents in the UK nor UK nationals may freely hold, vote and transfer shares in the same manner as UK residents or nationals. Any member whose registered address is not within the UK can give the Company a postal address within the UK or an address for electronic communications at which notices may be served on him. Otherwise, a member whose registered address is not within the UK is not entitled to receive any notice from the Company.
| | |
| 142 | | CSR plc Annual Report and Financial Statements 2014 |
Corporate and share informationcontinued
Restrictions on share transfers
A summary of the restrictions on the transfer of securities in the Company is:
| 1. | the Board can decline to register any transfer of any share which is not a fully paid share; |
| 2. | registration of a transfer of an uncertificated share may be refused in the circumstances set out in the uncertificated securities rules and where, in the case of a transfer to joint holders, the number of joint holders to whom the uncertifcated share is to be transferred exceeds four; or |
| 3. | the Board may decline to register any transfer of a certificated share unless: |
| | (i) | the instrument of transfer is duly stamped or duly certified or otherwise shown to be exempt from stamp duty and is left at the place stipulated by the Board accompanied by the share certificate to which it relates (unless the transfer is by a person to whom the Company is not required to issue a certificate) and such other evidence as the Board may reasonably require to show the right of the person signing the instrument of transfer to make the transfer and, if the instrument of transfer is signed by some other person on his behalf, the authority of that person to do so; |
| | (ii) | the instrument of transfer is in respect of only one class of share; and |
| | (iii) | in the case of a transfer to joint holders, the number of joint holders to whom the share is to be transferred does not exceed four. |
Change of control
The Company was previously able to issue additional shares with any rights or restrictions attached to them as long as they were not restricted by any rights attached to existing shares. These rights or restrictions could be decided by the directors so long as there was no conflict with any resolution passed by the shareholders. The ability of the directors to issue shares with rights or restrictions that were different than those attached to the currently outstanding ordinary shares could have the effect of delaying, deferring or preventing change of control of the Company.
The Company is not permitted to issue new shares under the terms of the Qualcomm Transaction, subject to certain exceptions. Any shares that are issued on or before the Scheme Record Time (as defined in the scheme document sent to shareholders on 12 November 2014) will be issued subject to the terms of the scheme of arrangement, as required by the articles of association amended on 4 December 2014.
Disclosure of interests in shares
The UK Financial Conduct Authority and Disclosure and Transparency Rules impose an obligation upon a person who acquires or ceases to have notifiable interest in the relevant share capital of a public company to notify the company of that fact within two days (excluding weekends and bank holidays) of his or her knowing of its occurrence. The disclosure threshold is 3% and each 1% threshold above 3%.
In addition, the Companies Act 2006 provides that a public company may, by notice in writing, require a person whom the company knows or reasonably believes to be or to have been within the three preceding years, interested in the company’s issued voting share capital to (1) confirm whether this is or is not the case, and (2) if this is the case, to give further information that the company requires relating to his interest or any other interest in the company’s shares of which he is aware.
The Articles of Association provide that if the holder of any shares or a person who appears to be interested in those shares, fails to comply within the relevant period with any statutory notice in respect of those shares, or makes a statement in response to the notice which is false or inadequate in a material particular, CSR may restrict the rights relating to the identified shares, following a restriction notice. The restriction notice will state that the identified shares no longer give the shareholder any right to attend or vote either personally or by proxy at a shareholders’ meeting or to exercise any right in relation to the shareholders’ meetings. Where the identified shares make up 0.25% or more (in amount or in number) of the existing shares of a class at the date of delivery of the restriction notice, the restriction notice can also contain the following further restrictions: (i) the Board can withhold any dividend or part of a dividend or other money otherwise payable in respect of the identified shares without any right to the holder to receive any shares in lieu of dividend; and (ii) the Board can refuse to register a transfer of any of the identified shares which are certificated shares unless the Board is satisfied that they have been sold outright to an independent third party. Once a restriction notice has been given, the Board is free to cancel it or exclude any shares from it at any time they think fit. In addition, it must cancel the restriction notice within seven days of being satisfied that all information requested in the statutory notice has been given. Also, where any of the identified shares are sold and the Directors are satisfied that they were sold outright to an independent third party, they must cancel the restriction notice within seven days of receipt of the notification of the sale. The Articles of Association do not restrict in any way the provision of the legislation which apply to failures to comply with notices under the legislation.
The UK City Code on Takeovers and Mergers imposes rigorous disclosure requirements affecting parties to a proposed takeover, their ‘associates’ and persons acting ‘in concert’ in relation to the shares of a company. These requirements also extend to dealings by persons who directly or indirectly own or control (either before or as a result of the dealing) 1% or more of the equity shares in an offeror or offeree company or of any other class of shares relevant to the offer in question. These requirements have applied and continue to apply in respect of the Qualcomm Acquisition.
Rule 13d-1 of the US Securities Exchange Act of 1934 requires that a person or group acquiring beneficial ownership of more than 5% of equity securities registered under that Act discloses such information to the SEC within 10 days after the acquisition.
CSR is required by the Listing Rules of the UK Listing Authority to disclose in its annual report the identity and share interests of its directors and any persons connected with them, as defined in the Companies Act 2006, and of any person with an interest of 3% or more of its CSR ordinary shares. Please see pages 80 and 81 of Other Statutory Information.
Persons discharging managerial responsibilities (‘PDMRs’) (primarily directors and some senior executives), and their connected persons, must notify a public company such as CSR in writing of the occurrence of all transactions conducted on their own account in the shares of the company, or derivatives or any other financial instruments relating to those shares within four business days of the day on which the transaction occurred. The notification must contain specified information, including the name of the person involved, the type of transaction, the date on which it occurred, and the price and volume of the transaction. The public company must notify a regulatory news service (which will make the information public) of any information notified to it in accordance with these provisions. The notification to a regulatory news service must be made as soon as possible, and in any event by no later than the end of the business day following the receipt of the information by the company. In addition to the directors and taking into account their roles and responsibilities, we regard as PDMRs the General Counsel, the SVP Business Group and the Chief Technical Officer.
Differences from law in host country
With respect to the items described above, applicable UK law is not significantly different from applicable US law.
Changes in share capital
CSR may by ordinary resolution increase, consolidate, subdivide, or consolidate and then subdivide its shares or any of them. Subject to the Companies Act 2006, CSR, by resolution, may determine that, as between shares resulting from a subdivision, any of them may have a preference or advantage, or may be subject to restrictions as compared with the others. CSR may, by special resolution and with the approval of the court, reduce its share capital, share premium account, capital redemption reserve or any other undistributable reserve.
Material contracts
Excluding contracts entered into in the ordinary course of business, no contracts have been entered into in the two years preceding the date of this document by CSR or any other member of the Group that are considered material to its results or operations, other than the Cooperation Agreement with Qualcomm Global Trading Pte. Ltd. (‘QGT’), an indirect wholly owned subsidiary of Qualcomm Incorporated (‘Qualcomm’) dated 15 October 2014.
On 15 October 2014, CSR announced that it had reached agreement with Qualcomm regarding the terms of a recommended cash offer through which the entire issued and to be issued ordinary share capital of CSR will be acquired by QGT, to be effected by means of a court-sanctioned scheme of arrangement under the Companies Act 2006 (the ‘Qualcomm Transaction’). Under the terms of the Qualcomm Transaction, each Scheme Shareholder, as defined in the Scheme Document issued to shareholders on 15 November 2014, will receive 900 pence in cash for each CSR ordinary share held.
On 15 October 2014, CSR and QGT entered into a Cooperation Agreement in connection with the Qualcomm Transaction, pursuant to which QGT has agreed to use reasonable endeavours to implement the Qualcomm Transaction and satisfy the conditions that relate to antitrust clearances. In addition, on 3 September 2014, CSR and Qualcomm signed a Non Disclosure Agreement in connection with the proposed transaction.
Exchange controls
There are no government laws, decrees, regulations or other legislation in the United Kingdom that affect the export or import of capital, including, but not limited to, UK foreign exchange controls on the payment of dividends, interest or other payments to shareholders resident outside the UK.
There are currently no limitations on the right of non-UK residents or non-UK shareholders to hold or vote CSR ordinary shares imposed by English law or CSR’s Articles of Association.
Taxation (US Holders)
US federal income tax matters
The following general discussion describes the material US federal income tax consequences of the ownership and disposition of CSR ADSs or ordinary shares that are generally applicable to US holders (as defined below). However, this discussion does not address all aspects of taxation that may be relevant to particular US holders in light of their personal investment or tax circumstances or to persons that are subject to special tax rules. In addition, this discussion does not address the tax treatment of special classes of US holders, such as financial institutions, regulated investment companies, real estate investment trusts, insurance companies, tax-exempt entities, dealers or traders, persons that actually or constructively own 10% or more of the total combined voting stock of CSR, persons holding CSR ADSs or ordinary shares as part of a hedging or conversion transaction or as part of a ‘straddle,’ US expatriates, persons subject to the alternative minimum tax, and persons whose functional currency is not the US dollar. This discussion may not be applicable to holders who acquired CSR ADSs or ordinary shares pursuant to the exercise of options or warrants or otherwise as compensation. Furthermore, this discussion does not address any US federal estate or gift tax considerations, or state, local or non-US tax considerations. We urge you to consult your own tax advisor as to the specific tax consequences of the ownership and disposition of CSR ADSs or ordinary shares, including the applicable US federal, state, local and non-US income and other tax consequences to you of the ownership and disposition of CSR ADSs or ordinary shares.
| | |
| 144 | | CSR plc Annual Report and Financial Statements 2014 |
Corporate and share informationcontinued
As used in this discussion of US federal income tax consequences, a ‘US holder’ means a holder of CSR ADSs or ordinary shares who or that holds such ADSs or shares as a capital asset within the meaning of the Internal Revenue Code of 1986, as amended (the ‘Internal Revenue Code’), and is for US federal income tax purposes (i) a citizen or individual resident of the United States, (ii) a corporation or other entity taxable as a corporation organised under the laws of the United States, any State thereof or the District of Columbia, (iii) an estate the income of which is subject to US federal income taxation regardless of its source, or (iv) a trust (a) if a court within the United States is able to exercise primary jurisdiction over its administration and one or more US persons have authority to control all substantial decisions of the trust or (b) that has a valid election in effect under applicable Treasury regulations to be treated as a US person. If a pass-through entity, including a partnership or other entity classified as a partnership for US federal income tax purposes, is a beneficial owner of CSR ADSs or ordinary shares, the US federal income tax treatment of an owner or partner generally will depend upon the status of such owner or partner and upon the activities of the pass-through entity. Any owner or partner of a pass-through entity holding CSR ADSs or ordinary shares is urged to consult its own tax advisor. This discussion is based on the Internal Revenue Code, applicable US Department of the Treasury regulations, judicial authority, and administrative rulings and practice, all as of the date of this Annual Report.
All of the preceding authorities are subject to change, possibly with retroactive effect, so as to result in US federal income tax consequences different from those discussed below. CSR has not requested, and will not request, a ruling from the US Internal Revenue Service (the ‘IRS’) with respect to any of the US federal income tax consequences described below, and as a result there can be no assurance that the IRS will not disagree with or challenge any of the conclusions CSR has reached and describes herein.
Ownership of ADSs
For US federal income tax purposes, a US holder of CSR ADSs generally will be treated as the owner of the underlying shares represented by the ADSs. Accordingly, withdrawals or deposits of ordinary shares in exchange for CSR ADSs generally will not be subject to US federal income taxation.
Notwithstanding the foregoing, the US Department of the Treasury has expressed concerns that intermediaries in the chain of ownership between the holder of an ADS and the issuer of the security underlying the ADS may be taking actions that are inconsistent with the beneficial ownership of the underlying shares (for example, pre-releasing ADSs to persons who do not have the beneficial ownership of the securities underlying the ADSs). Accordingly, the analysis of the creditability of United Kingdom taxes and the availability of the reduced rate of tax for dividends received by certain non-corporate US holders, as described below, could be affected by actions taken by intermediaries in the chain of ownership between the holder of CSR ADSs and CSR if, as a result of such actions, the holders of CSR ADSs are not properly treated as the beneficial owners of the underlying ordinary shares. We are not aware of any intention to take any such actions, and accordingly, the remainder of this discussion assumes that holders of CSR ADSs will be properly treated as the beneficial owners of the underlying ordinary shares.
Passive Foreign Investment Company Rules
Special US federal income tax rules apply to US holders owning stock of a passive foreign investment company, or PFIC. A non-US corporation generally will be considered a PFIC for any taxable year in which (i) 75% or more of its gross income is passive income, or (ii) 50% or more of the average value of its assets are considered ‘passive assets’ (generally, assets that generate passive income). For this purpose, ‘passive income’ generally includes, among other things, interest, dividends, rents, royalties, certain gains from the sale of stock and securities and other investment income, and all cash is treated as a passive asset.
CSR believes that it was not a PFIC for its taxable year ended 26 December 2014. In the event the Qualcomm transaction does not close, based on the nature of anticipated income, assets and activities, CSR does not expect to become a PFIC for its taxable year ending 1 January 2016 or in the foreseeable future. However, the determination of PFIC status for any year can only be made on an annual basis at the end of such taxable year, is based on the application of complex US federal income tax rules and will depend on the composition of CSR’s income, assets and operations from time to time. Accordingly, there can be no assurance that the IRS will not challenge the determination made by CSR concerning its PFIC status or that CSR will not be a PFIC for any taxable year.
If CSR were classified as a PFIC, for any year during which a US holder holds CSR ADSs or ordinary shares, (regardless of whether CSR continues to be a PFIC), the US holder would be subject to special, adverse rules including taxation at maximum ordinary income rates plus an interest charge on both gains on sale and certain dividends, unless the US holder makes an election to be taxed under an alternative regime.
Certain elections may be available to a US holder if CSR were classified as a PFIC. CSR will continue to monitor whether it is or will become a PFIC and will provide US holders with information concerning the potential availability of such elections if CSR so determines.
US holders are urged to consult their own tax advisors concerning the potential application of the PFIC rules to their ownership and disposition of CSR ADSs or ordinary shares.
Distributions
Subject to the PFIC rules described above, for US federal income tax purposes, a US holder will generally include in gross income the amount of any distribution paid by CSR to the extent paid out of CSR’s current and/or accumulated earnings and profits, as determined for US federal income tax purposes, as dividend income when the distribution is actually or constructively received by the depositary, in the case of CSR ADSs, or by the US holder, in the case of ordinary shares. Non-corporate US holders currently are taxed at a maximum rate of 20% on dividends received from ‘qualified foreign corporations,’ provided the US holders satisfy certain holding period and other requirements. In order to be treated as a ‘qualified foreign corporation,’ CSR must be eligible for benefits of the United States income tax treaty with the United Kingdom. Although CSR believes that it is currently eligible for such treaty benefits, there can be no assurance that this will be the case for any taxable year. Further, non-corporate US holders will not be eligible for the reduced rates of dividend taxation if CSR is a PFIC for the taxable year of the dividend payment or the preceding taxable year. Corporate US holders will be taxed on dividends received from CSR at a 35% tax rate. Dividends generally will be income from sources outside of the United States for foreign tax credit limitation purposes, and generally will not be eligible for the dividends-received deduction that is allowed to US corporations in respect of dividends received from other US corporations. Distributions in excess of CSR’s current and/or accumulated earnings and profits, as determined for US federal income tax purposes, will be treated as a non-taxable return of capital to the extent of the US holder’s tax basis in the CSR ADSs or ordinary shares and thereafter as capital gain.
The amount of a distribution includible in the income of a US holder will be the US dollar value of the distribution determined at the spot rate on the date that distribution is eligible for inclusion in the income of the US holder, regardless of whether the payment is in fact converted into US dollars at such time. A US holder will have a basis in any GBP distributed by CSR equal to the US dollar value of the GBP on the date it is actually or constructively received by the US holder. Generally, any gain or loss resulting from currency exchange fluctuations during the period from the date the dividend payment is includible in income to the date that payment is converted into US dollars will be treated as US source ordinary income or loss.
Sale, exchange or other taxable disposition of CSR ADSs or ordinary shares
Subject to the PFIC rules described above, upon a sale or other disposition of CSR ADSs or ordinary shares, a US holder will generally recognise gain or loss for US federal income tax purposes in an amount equal to the difference between the US dollar value of the amount realised and the US holder’s tax basis, determined in US dollars, in the CSR ADSs or ordinary shares. Gain or loss recognised will be long-term capital gain or loss with respect to CSR ADSs or ordinary shares held for more than 12 months at the time of the sale or other disposition and any gain recognised generally will be income from sources within the United States for foreign tax credit limitation purposes. The deductibility of capital losses is subject to significant limitations.
Backup withholding and information reporting
In general, dividend payments with respect to CSR ADSs or ordinary shares and proceeds from the sale or other disposition of CSR ADSs or ordinary shares made (or deemed made) within the United States may be subject to information reporting to the IRS and US backup withholding (currently at a rate of 28%). Backup withholding will generally not apply to a holder who or that:
| — | | furnishes a correct taxpayer identification number and certifies, under penalties of perjury, that such holder is not subject to backup withholding on a Form W-9, and otherwise complies with applicable requirements of the backup withholding rules; |
| — | | is a corporation or otherwise exempt from backup withholding and, when required, demonstrates this fact; or |
| — | | provides a certification of foreign status on Form W-8BEN or a successor form. |
Backup withholding is not an additional tax. Amounts withheld under the backup withholding rules will be allowed as a refund or credit against a holder’s US federal income tax liability, provided the holder furnished the required information to the IRS in a timely manner.
In addition, certain US holders who are individuals that hold specified foreign financial assets (which may include CSR ADSs or ordinary shares) will be required to report information relating to such assets, subject to certain exceptions. US holders should consult their tax advisors regarding the effect, if any, of this requirement on their ownership and disposition of CSR ADSs or ordinary shares.
Additional tax on investment income
US holders that are individuals, estates or trusts and whose income exceeds certain thresholds will be subject to a 3.8% Medicare contribution tax on unearned income, including, among other things, dividends on, and capital gains from the sale or other disposition of, CSR ADSs or ordinary shares, subject to certain limitations and exceptions. US holders should consult their tax advisors regarding the possible implications of the additional tax on investment income described above.
UK tax matters
The following paragraphs summarise the material UK tax consequences for investors who are not resident in the UK for UK tax purposes (including US investors who are not resident in the UK for UK tax purposes) regarding ownership and disposal of CSR ordinary shares.
The following paragraphs, which are intended as a general guide only, are based on current UK tax legislation and what is understood to be HM Revenue & Customs (the UK tax authority) practice, both as of the date of this Annual Report, and both of which are subject to change at any time, possibly with retrospective effect. They summarise certain limited aspects of the UK tax treatment of holders of CSR ordinary shares and apply only to the position of holders of CSR ordinary shares who for UK tax purposes are beneficial owners of their CSR ordinary shares, hold their CSR ordinary shares as an investment (and not as assets to be realised in the course of a trade) and are not treated as having acquired their CSR ordinary shares by reason of their or another’s employment. They do not apply to holders of CSR ADSs. Holders of CSR ordinary shares or CSR ADSs who are in any doubt as to their tax position should consult an appropriate professional adviser.
| | |
| 146 | | CSR plc Annual Report and Financial Statements 2014 |
Corporate and share informationcontinued
Taxation of dividends
Under current UK tax legislation, no tax will be withheld by CSR from cash dividend payments. Holders of CSR ordinary shares who are resident outside the UK will generally not receive any payment from HM Revenue & Customs in respect of any tax credit on dividends paid by CSR.
Holders of CSR ordinary shares who are not resident in the UK and who do not carry on a trade, profession, or vocation in the UK through a branch, agency or permanent establishment in connection with which their CSR ordinary shares are held, used or acquired will not generally be liable to pay any UK tax in respect of any dividends received on their CSR ordinary shares. Holders of CSR ordinary shares who are resident in the UK or who carry on a trade, profession or vocation in the UK through a branch, agency or permanent establishment in connection with which their CSR ordinary shares are held, used or acquired are should consult an appropriate professional adviser.
Taxation of capital gains
A holder of CSR ordinary shares who is not resident in the UK will not ordinarily be liable to UK tax on capital gains realised on the disposal of CSR ordinary shares, unless, at the time of the disposal (in the case of an individual shareholder) he or she carries on a trade, profession or vocation in the UK through a branch or agency and those shares are, or have been, used, held or acquired for the purposes of that trade, profession or vocation or branch or agency or (in the case of a corporate shareholder) it carries on a trade through a permanent establishment in the UK and those shares are, or have been, used, held or acquired for the purposes of that trade or permanent establishment. A holder of CSR ordinary shares who is an individual and who is temporarily resident outside the UK may be liable on his return to the UK to UK tax on capital gains arising during the period of absence, subject to any available exemption or relief.
Stamp Duty and Stamp Duty Reserve Tax
No UK stamp duty or UK stamp duty reserve tax (‘UK SDRT’) will generally be payable on the issue of CSR ordinary shares.
Subject to the paragraph below, where CSR ordinary shares are issued or transferred (i) to, or to a nominee or agent for, a person whose business is or includes the provision of clearance services (a ‘Clearance Service’) or (ii) to, or to a nominee or agent for, a person whose business is or includes issuing depositary receipts (a ‘Depositary Receipt System’), UK stamp duty or UK SDRT will generally be payable at the rate of 1.5% of the consideration paid (rounded up to the nearest multiple of £5 in the case of UK stamp duty). The UK stamp duty or UK SDRT will generally be paid by the Clearance Service or the Depositary Receipt System, as the case may be, but will, in practice, generally be required to be reimbursed by CSR or by the holder of the CSR ordinary shares or CSR ADSs in question. A Clearance Service can elect under section 97A of the Finance Act 1986 (‘Section 97A’), provided certain conditions are satisfied, for the normal rate of UK stamp duty or UK SDRT (generally no charge on issue and a charge at 0.5% of the amount or value of the consideration paid, rounded up to the nearest £5 in the case of UK stamp duty, on transfer) to apply to issues or transfers of CSR ordinary shares into, and transactions within, such Clearance Service instead of the higher rate of 1.5% generally applying to an issue or transfer of CSR ordinary shares into the Clearance Service and the ability to transfer CSR ordinary shares while in the Clearance Service without there being UK stamp duty or UK SDRT.
Following a decision of the European Court of Justice in October 2009, HM Revenue & Customs have announced that they will not seek to apply the 1.5% UK SDRT charge where new shares are first issued (or, where it is integral to the raising of new capital, new shares are transferred) into a Clearance Service or a Depositary Receipt System. Thus, the 1.5% UK stamp duty or UK SDRT charge will apply only to the transfer of existing shares to Clearance Services or Depositary Receipt Systems in circumstances where the transfer is not integral to the raising of new capital. Investors should be aware that this area may be subject to further developments in the future.
No UK stamp duty or UK SDRT will generally be payable on the issue of CSR ordinary shares into CREST (the London Stock Exchange’s paperless trading system).
Subject to an exemption for certain low value transactions, the transfer on sale of CSR ordinary shares in certificated form will generally give rise to a liability, usually met by the purchaser, toad valorem UK stamp duty at the rate of 0.5% (rounded up to the nearest multiple of £5) of the amount or value of the consideration paid. An agreement to transfer such shares which is or becomes unconditional will generally give rise to UK SDRT at the rate of 0.5% of the amount or value of the consideration paid, such UK SDRT generally being payable by the transferee or purchaser. The liability to UK SDRT will generally be cancelled or any UK SDRT paid will be refunded if the agreement is completed by a duly stamped transfer within six years of either the date of the agreement or, if the agreement was conditional, the date when the agreement became unconditional.
A transfer of CSR ordinary shares on a paperless basis through CREST will generally be subject to UK SDRT at the rate of 0.5% of the amount or value of the consideration paid, which will be collected and accounted for to HM Revenue & Customs by CREST (such UK SDRT generally being borne by the transferee or purchaser). No UK stamp duty or UK SDRT will arise on a transfer of CSR ordinary shares into CREST provided that, in the case of UK SDRT, the transfer is not for money or money’s worth.
Generally, a gift of CSR ordinary shares or a transfer of such shares from a nominee to the beneficial owner will give rise to neither UK stamp duty nor UK SDRT.
The above statements are intended only as a general guide to the current UK stamp duty and UK SDRT position. Transfers to certain categories of person are not liable to UK stamp duty or UK SDRT and transfers to others may be liable at a higher rate. Holders of CSR ordinary shares who are in any doubt as to their tax position should consult an appropriate professional adviser.
Risks Related to owning CSR ordinary shares and ADSs
We may be treated as a PFIC.
As a non-US corporation owning substantial cash assets, there is an ongoing risk that we may be treated as a passive foreign investment company (‘PFIC’) for US federal income tax purposes depending on the ratio of the value of our assets, including goodwill, to our holdings of cash and liquid assets such as bank deposits and marketable securities. A non-US corporation generally will be considered a PFIC for any taxable year in which 75% or more of its gross income is passive income, or 50% or more of the average value of its assets consists of ‘passive assets’ (generally, assets that generate passive income). This determination is highly factual, and will depend on, among other things, our market valuation and future financial performance. We believe we were not a PFIC for the taxable year ended 26 December 2014, but if we were to be classified as a PFIC for any future taxable year, holders of ordinary shares or ADSs who are US taxpayers would be subject to adverse US federal income tax consequences. See page 145 for more information on PFICs.
Shareholders in countries other than the United Kingdom will suffer dilution if they are unable to participate in future pre-emptive equity offerings.
Under English law, shareholders usually have pre-emptive rights to subscribe on a pro rata basis in the issuance of new shares for cash. The exercise of pre-emptive rights by certain shareholders not resident in the United Kingdom may be restricted by applicable law or practice in the United Kingdom and overseas jurisdictions. In particular, the exercise of pre-emptive rights by US shareholders would be prohibited unless that rights offering is registered under the US Securities Act or an exemption from the registration requirements of the US Securities Act applies. Furthermore, under the Deposit Agreement for the ADSs, the Depositary Bank generally will not offer those rights to ADS holders unless both the rights and the underlying securities to be distributed to ADS holders are either registered under the US Securities Act, or exempt from registration under the US Securities Act with respect to all holders of ADSs. If no exemption applies and we do not wish to register a rights offering, shareholders in the United States may not be able or permitted to exercise their pre-emptive rights. We are also permitted under English law to disapply pre-emptive rights (subject to the approval of our shareholders by special resolution and investor committee guidance on the limits of any such disapplication) and thereby exclude certain shareholders, such as overseas shareholders, from participating in a rights offering (usually to avoid a breach of local securities laws).
The rights of our shareholders will be governed by English law and differ from the rights of stockholders under US law
Because we are a public limited company incorporated under the laws of England and Wales, the rights of shareholders and, therefore, certain of the rights of holders of ADSs, will be governed by English law and by the Articles. These rights differ from the typical rights of shareholders in US corporations. For example, the rights of shareholders to bring proceedings against us or our directors or officers or generally on behalf of a class of shareholders or other claimants may be more limited under English law than under the corporate law and case law of US jurisdictions.
Shareholders in countries other than the United Kingdom may have difficulty in effecting service of process on us or our directors in the US, in enforcing US judgments in the UK or in enforcing US securities laws in the UK courts.
Most of our directors and some of the experts named in this document are residents of countries other than the United States. As a result, it may not be possible for our shareholders in countries other than the UK to effect service of process within the United States upon all of our directors and executive officers and some of the experts named in this document or on us, or to obtain discovery of relevant documents and/or the testimony of witnesses. Our shareholders in countries other than the UK may have difficulties enforcing, in courts outside the United States, judgments obtained in the US courts against any of our directors and some of the experts named in this document or us (including actions under the civil liability provisions of the US securities laws). Those shareholders may also have difficulty enforcing liabilities under the US securities laws in legal actions originally brought in jurisdictions located outside the United States.
The market value of our ADSs and dividends may be adversely affected by fluctuations in the exchange rate between the US dollar and the pound sterling.
Fluctuations in the exchange rate between the US dollar and the pound sterling will affect the US dollar price of our ADSs and the market value of ordinary shares when expressed in US dollars. If the relative value of sterling to the US dollar declines, the US dollar price of the ADSs and the US dollar equivalent of the price of ordinary shares traded on the London Stock Exchange will also decline. We paid, and may in the future pay, cash dividends on the ordinary shares in sterling. A decline in the relative value of sterling to the US dollar would also result in a decline in the US dollar value of these dividends.
The market price of our ordinary shares and ADSs is volatile.
Stock markets in general during the past few years have experienced significant price and volume volatility. Technology stocks in particular have experienced wide fluctuations in prices, in some cases unrelated to the issuers’ operating performance. Our ordinary shares and ADSs are subject to significant fluctuations due to many factors, including but not limited to fluctuations in results of operations, acquisitions, litigation, announcements of new products, product enhancements or technological advances by us or our competitors, changes in earnings estimates by market analysts, and general market conditions or market conditions specific to particular industries. Our share price is subject to speculation in the press and the analyst community, changes in recommendations by financial analysts, changes in investors�� or analysts’ valuation measures for our stock, changes in global financial markets and global economies and general market trends unrelated to our performance. The market price of our ordinary shares and ADSs could be adversely affected by these factors and fluctuations.
| | |
| 148 | | CSR plc Annual Report and Financial Statements 2014 |
Corporate and share informationcontinued
The proposed transaction with Qualcomm may disrupt our business and, if the transaction does not occur, the price of our ordinary shares and ADSs may decline.
In October 2014, CSR and Qualcomm announced that agreement had been reached on the terms of a recommended cash offer through which our entire issued and to be issued ordinary share capital will be acquired by Qualcomm under a scheme of arrangement pursuant to the Companies Act 2006, subject to the satisfaction of certain closing conditions. The scheme of arrangement was approved by shareholders in December 2014, and the parties expect that it will become effective by late summer 2015. The proposed transaction, whether or not consummated, may disrupt our operations and business and may divert management’s attention and our resources from ongoing business and operations. Moreover, we may incur unexpected costs, charges or expenses resulting from the proposed transaction, some of which are payable by us whether or not the proposed transaction is consummated. Any of the foregoing could have a material adverse effect on our business, results of operations and financial condition.
The proposed acquisition is subject to closing conditions, such as the satisfaction of certain regulatory conditions, including antitrust clearances in China, Germany, Japan, South Korea, Taiwan and the United States. Although pursuant to the Cooperation Agreement Qualcomm has agreed to use reasonable endeavours to implement the acquisition and satisfy the conditions that relate to antitrust clearances, the closing conditions may ultimately not be satisfied on time or at all. If the proposed acquisition is not completed, the share price of our Ordinary Shares and ADSs may change to the extent that the current market price of our securities reflects an assumption that the acquisition will be completed, and it may decline significantly.
Liquidity in the market for our securities may be adversely affected by our maintenance of two exchange listings.
Our ADSs are traded on The NASDAQ Stock Market and our ordinary shares are listed on the premium segment of the Official List and trade on the Main Market of the London Stock Exchange. This dual listing may dilute the liquidity of our securities in one or both markets.
Holders of our ADSs may not have the same voting rights as the holders of ordinary shares and may not receive voting materials in time to be able to exercise their right to vote
Except as described in the Deposit Agreement, holders of ADSs will not be able to exercise voting rights on an individual basis, and must instruct the Depositary Bank on how to vote the shares underlying their ADSs. Because of this extra procedural step involved, the process for exercising voting rights could take longer for holders of ADSs than for holders of ordinary shares and, as a result, holders of ADSs may not be able to effectively exercise voting rights.
| | | | | | |
| Location | | Sq. feet | | Lease Expiration | | Purpose |
|
|
| | | |
Churchill House, Cambridge, England | | 53,046 | | June 2025 | | R&D, Operations, Sales and Administration |
|
|
| | | |
St John’s House, Cambridge, England | | 32,925 | | August 2016 | | R&D and Administration (partially sublet) |
|
|
| | | |
Unit 400, Cambridge, England | | 25,482 | | September 2016 | | R&D and Administration (partially sublet) |
|
|
| | | |
Selwyn House, Cambridge, England | | 20,400 | | June 2025 | | R&D, Sales and Administration |
|
|
| | | |
Trinity House, Cambridge, England | | 20,990 | | June 2025 | | R&D and Administration |
|
|
| | | |
Third Floor, 66-68 Hills Road, Cambridge, England | | 4,695 | | May 2015 | | Sublet |
|
|
| | | |
Belfast, Northern Ireland | | 5,800 | | April 2020 | | R&D |
|
|
| | | |
Manchester, England | | 3,362 | | February 2019 | | R&D |
|
|
| | | |
Bristol, England | | 6,477 | | February 2019 | | R&D |
|
|
| | | |
Phoenix, Arizona, USA | | 28,369 | | March 2020 | | R&D |
|
|
| | | |
Santa Ana, California, USA | | 12,643 | | March 2017 | | R&D |
|
|
| | | |
Detroit, Michigan, USA | | 14,300 | | November 2019 | | R&D |
|
|
| | | |
San Jose, California, USA | | 65,223 | | August 2023 | | R&D, Sales and Administration |
|
|
| | | |
Boston, Massachusetts, USA | | 54,736 | | August 2017 | | R&D, Sales and Administration |
|
|
| | | |
Plano, Texas, USA1 | | 43,680 | | March 2015 | | Operations and Sales |
|
|
| | | |
Richardson, Texas, USA1 | | 4,849 | | April 2020 | | Not in use |
|
|
| | | |
Haifa, Israel | | 110,718 | | November 2016 | | R&D, Operations and Administration (partially sublet) |
|
|
| | | |
Ingolstadt, Germany | | 32,184 | | December 2021 | | R&D, Operations and Administration (partially sublet) |
|
|
| | | |
Freiburg, Germany | | 5,317 | | September 2017 | | R&D |
|
|
| | | |
Bangalore, India | | 39,611 | | December 2015 | | R&D, Sales and Administration |
|
|
| | | |
Bangalore, India | | 37,375 | | May 2017 | | R&D, Sales and Administration |
|
|
| | | |
Noida, India | | 15,030 | | April 2023 | | R&D, Sales and Administration |
|
|
| | | |
Shanghai, China | | 44,447 | | August 2016 | | R&D, Sales and Administration |
|
|
| | | |
Shenzhen, China | | 8,231 | | October 2016 | | R&D, Sales and Administration |
|
|
| | | |
Beijing, China | | 244 | | September 2015 | | Sales |
|
|
| | | |
Singapore | | 3,211 | | June 2016 | | Operations, Sales and Administration |
|
|
| | | |
Seoul, South Korea | | 18,040 | | May 2017 | | Sales |
|
|
| | | |
Tokyo, Japan | | 10,215 | | July 2017 | | Sales |
|
|
| | | |
Chungli City, Taiwan | | 4,340 | | February 2017 | | Operations |
|
|
| | | |
Taipei, Taiwan | | 32,096 | | January 2017 | | R&D, Sales and Administration |
|
|
1 The Operations and Sales teams are expected to move to the Richardson location with effect from 20 March 2015.
| | |
| 150 | | CSR plc Annual Report and Financial Statements 2014 |
| | | | | | |
| Location | | Address | | Telephone | | Fax |
|
|
| | | |
China – Beijing | | Jing Hui Building, Room A005-A006, 3F, No 118, Jian Guo Lu Yi, Chao Yang District, Beijing, China | | +86 10 5890 2603 | | no fax |
|
|
| | | |
China – Shanghai | | Room 2801 King Tower, 28 Xinjinqiao Road, Pudong, Shanghai 201206, China | | +86 21 2898 1666 | | +86 21 3382 1173 |
|
|
| | | |
China – Shenzhen | | Room 01-06, 5/F, Rong Chao Building, No 4036, Jintian Road, Shenzhen 518026, China | | +86 755 2151 9499 | | +86 755 2151 9494 |
|
|
| | | |
Germany – Freiburg | | Karlsruherstra. 3, 79108 Freiburg, Germany | | +49 761 5952 1100 | | +49 761 5952 1188 |
|
|
| | | |
Germany – Ingolstadt | | Marie Curie Strasse 1, 85055 Ingolstadt, Germany | | +49 841 937 8000 | | +49 841 937 8010 |
|
|
| | | |
India – Bangalore | | 7th Floor, Wing-A, Etamin Block, Prestige Technology Park II, Marathahalli-Sarjapur Outer Ring Road, Marathahalli, Bangalore 560 103, India | | +91 80 2518 3000 | | +91 80 2518 3001 |
|
|
| | | |
India – Bangalore | | 7th Floor, Vector Block, Prestige Technology Park III, Marathahalli-Sarjapur Outer Ring Road, Marathahalli, Bangalore 560 103, India | | +91 80 2518 3000 | | +91 80 2518 3001 |
|
|
| | | |
India – Noida | | Advant Navis Business Park B – 502, 5th Floor, Tower – B, Plot No – 7, Sector – 142, Noida – 201305, NOIDA Greater NOIDA Expressway, Gautam Budh Nagar (U.P.) India | | +91 120 469 6000 | | +91 120 469 6111 |
|
|
| | | |
Israel – Haifa | | Advanced Technology Center, Building #8/2, PO Box 15015, Haifa, 31905, Israel | | +972 4 854 5777 | | +972 4 855 1550 |
|
|
| | | |
Japan, Tokyo | | Holland Hills Mori Tower 3F, 5-11-2 Toranomon, Minato-Ku, Tokyo105-0001, Japan | | +81 3 6403 7100 | | +81 3 6403 7101 |
|
|
| | | |
South Korea – Seoul | | 3F, S Unit, H Square, 680 Sampyung-Dong, Bundang-Gu, Seongnam, Gyunggi-Do, 463-400, South Korea | | +82 2 6444 2000 | | +82 2 6444 2001 |
|
|
| | | |
Singapore | | 101 Thomson Road #22-03, United Square, Singapore 307591 | | +65 6827 0500 | | +65 6354 4969 |
|
|
| | | |
Taiwan – Chungli | | 11/F 146 Jhongshan Road, Chungli City, Taoyuan 32041, Taiwan, R.O.C | | +886 3 4267000 | | +886 3 4267001 |
|
|
| | | |
Taiwan – Taipei | | 7F, No. 99, Jing-Ye 1st Road, Taipei 10462, Taiwan, R.O.C | | +886 2 2175 9200 | | +886 2 2175 9300 |
|
|
| | | |
UK – Belfast | | Unit 2 (Ground Floor South), The Legacy Building, Northern Ireland Science Park, Queen’s Road, Queen’s Island, Belfast, BT3 9DT, UK | | +44 2890 463140 | | +44 2890 463141 |
|
|
| | | |
UK – Bristol | | Equinox North, Great Park Road, Bradley Stoke Bristol, BS32 4QL, UK | | +44 1454 826000 | | no fax |
|
|
| | | |
UK – Cambridge | | Churchill House, Cambridge Business Park, Cowley Road, Cambridge, CB4 0WZ, UK | | +44 1223 692000 | | +44 1223 692001 |
|
|
| | | |
UK – Cambridge | | St John’s House, St John’s Innovation Park, Cowley Road, Cambridge, CB4 0ZT, UK | | +44 1223 692000 | | +44 1223 692001 |
|
|
| | | |
UK – Cambridge | | Selwyn House, Cambridge Business Park, Cowley Road, Cambridge, CB4 0WZ, UK | | +44 1223 692000 | | +44 1223 692001 |
|
|
| | | |
UK – Cambridge | | Trinity House, Cambridge Business Park, Cowley Road, Cambridge, CB4 0WZ, UK | | +44 1223 692000 | | +44 1223 692001 |
|
|
| | | |
UK – Cambridge | | Unit 400, Cambridge Science Park, Milton Road, Cambridge, CB4 0WH, UK | | +44 1223 692000 | | +44 1223 692001 |
|
|
| | | |
UK – Manchester | | 4th Floor Quay West, Trafford Wharf Road, Manchester, M17 1PL, UK | | +44 161 772 1240 | | +44 161 772 1260 |
|
|
| | | |
USA – Detroit | | 1900 Opdyke Court, Auburn Hills, Detroit, Michigan 48326, USA | | +1 248 409 1400 | | +1 248 409 1401 |
|
|
| | | |
USA – Boston | | One Wall Street, Burlington, Massachusetts 01803, USA | | +1 781 791 6000 | | +1 781 791 6111 |
|
|
| | | |
USA – Phoenix | | Suite 119, 303 W Elliot Road, Tempe, Arizona 85284, USA | | +1 602 343 2692 | | +1 480 491 1038 |
|
|
| | | |
USA – Plano | | 2201 10th Street, Plano, Texas 75074, USA | | +1 972 673 1600 | | +1 972 673 1602 |
|
|
| | | |
USA – Richardson | | 2100 Lakeside Boulevard, Suite 475, Richardson, Texas 75082, USA | | +1 972 673 1600 | | +1 972 673 1815 |
|
|
| | | |
USA – Santa Ana | | 1231 East Dyer Road, Suite 200, Santa Ana, California 92705, USA | | +1 714 435 4900 | | +1 714 435 4993 |
|
|
| | | |
USA – San Jose | | 1060 Rincon Circle, San Jose, California 95131, USA | | +1 408 523 6500 | | +1 408 523 6501 |
|
|
Form 20-F cross reference guide
US Items
The table below sets out the location in this document of the information required by Form 20-F under the rules and regulations of the United States Securities and Exchange Commission. This Annual Report on Form 20-F for the fiscal year ended 26 December 2014 has not been approved or disapproved by the SEC nor has the SEC passed judgment upon the adequacy or accuracy of this Annual Report on Form 20-F.
No other information in this document is included in the Form 20-F or incorporated by reference into any filing by the Company under the Securities Act.
| | | | | | |
| Item | | Form 20-F Caption | | Location in this document | | Page(s) |
| | | |
| 1 | | Identity of directors, senior management and advisers | | Not applicable | | |
| | | |
| 2 | | Offer statistics and expected timetable | | Not applicable | | |
| | | |
| 3 | | Key information | | | | |
| | | |
| 3A | | Selected financial data | | Five year summary | | 129 |
| | | |
| 3B | | Capitalisation and indebtedness | | Not applicable | | |
| | | |
| 3C | | Reasons for the offer and use of proceeds | | Not applicable | | |
| | | |
| 3D | | Risk factors | | Risk Factors | | 43 |
| | | |
| 4 | | Information on the Company | | | | |
| | | |
| 4A | | History and development of the company | | Financial report | | 18 |
| | | |
| | | | Financial Report – Balance Sheet | | 24 |
| | | |
| | | | Notes to the Consolidated Financial Statements – Note 15: | | |
| | | | Property, Plant and Equipment | | 107 |
| | | |
| | | | Notes to the Consolidated Financial Statements – Note 34: | | |
| | | | Acquisition of assets | | 127 |
| | | |
| | | | Corporate and Share Information – History and Development | | 134 |
| | | |
| | | | | Corporate and Share Information – Agent in the United States | | 140 |
| | | |
| 4B | | Business overview | | What we do | | 2 |
| | | |
| | | | Chairman’s statement – Our competitive environment | | 6 |
| | | |
| | | | Strategic Report – Our Business Model | | 8 |
| | | |
| | | | Chief Executive’s review – Our five strategic areas of focus | | 9 |
| | | |
| | | | Chief Executive’s review – Trends in our marketplace | | 10 |
| | | |
| | | | Chief Executive’s review – Our platform positions | | 11 |
| | | |
| | | | Chief Executive’s review – Our technologies | | 13 |
| | | |
| | | | Chief Executive’s review – Our performance in platforms | | 14 |
| | | |
| | | | Corporate and share information – Seasonality | | 135 |
| | | |
| | | | Corporate and share information – Raw materials | | 135 |
| | | |
| | | | Corporate and share information – Intellectual property | | 135 |
| | | |
| | | | | Corporate and share information – Governmental regulation | | 135 |
| | | |
| | | | | Corporate and share information – Sales and marketing | | 135 |
| | | |
| 4C | | Organisational structure | | List of Subsidiaries of CSR plc | | Exhibit 8 |
| | | |
| | | | Notes to the Consolidated Financial Statements – Note 1: | | |
| | | | | General Information | | 88 |
| | | |
| 4D | | Property, plant and equipment | | Financial Report – Intangible assets and property, plant and equipment | | 24 |
| | | |
| | | | Financial Report – Corporate Social Responsibility | | 36 |
| | | |
| | | | Financial Report – Environment | | 39 |
| | | |
| | | | Notes to the Consolidated Financial Statements – Note 15: | | |
| | | | Property, Plant and Equipment | | 107 |
| | | |
| | | | | CSR’s Worldwide offices | | 150 |
| | | |
| 4A | | Unresolved staff comments | | None | | |
| | | |
| 5 | | Operating and financial review and prospects | | | | |
| | | |
| 5A | | Operating results | | Chief Executive’s review – Financial review of the year | | 8, 10 |
| | | | | | and 12 |
| | | |
| | | | Financial report – Overview | | 18-26 |
| | | |
| | | | | Financial report – review of 2014 and review of 2013 | | 20-30 |
| | | |
| 5B | | Liquidity and capital resources | | Financial report – Balance sheet, cash flow in 2014 compared | | 24-26 |
| | | | to 2013, cash flow in 2013 compared to 2012 | | and 30 |
| | | |
| | | | Other statutory information – Going concern | | 81 |
| | | |
| | | | Notes to the Consolidated Financial Statements – Note 1: Going concern | | 88 |
| | | |
| | | | Notes to the Consolidated Financial Statements – | | |
| | | | | Note 25: Notes to the Cash Flow Statement | | 115 |
| | |
| 152 | | CSR plc Annual Report and Financial Statements 2014 |
Form 20-F cross reference guidecontinued
| | | | | | |
| Item | | Form 20-F Caption | | Location in this document | | Page(s) |
| 5C | | Research and development, patents and licences, etc | | Financial Report – Research and Development (R&D) expenses | | 22 |
| | | |
| | | | Notes to the Consolidated Financial Statements – Note 6: Profit (loss) for the Period | | 100 |
| | | |
| | | | Notes to the Consolidated Financial Statements – Note 14: Other Intangible Assets | | 106 |
| | | |
| | | | | Corporate and share information – Intellectual property | | 135 |
| 5D | | Trend information | | Trends In Our Marketplace | | 10 |
| | | |
| | | | | Looking ahead | | 12 |
| 5E | | Off-balance sheet arrangements | | Financial Report – Contractual Obligations and Commitments | | 25 |
| | | | Notes to the Consolidated Financial Statements – Note 21: Obligations Under Finance Leases | | 111 |
| | | |
| | | | Notes to the Consolidated Financial Statements – Note 26: Contingent Liabilities | | 115 |
| | | |
| | | | | Notes to the Consolidated Financial Statements – Note 27: Operating Lease Arrangements | | 116 |
| 5F | | Tabular disclosure of contractual obligations | | Financial Report – Contractual Obligations and Commitments | | 25 |
| 5G | | Safe Harbour | | Cautionary note regarding forward looking statements | | 155 |
| 6 | | Directors, senior management and employees | | | | |
| 6A | | Directors and senior management | | Board of Directors | | 52 |
| 6B | | Compensation | | Remuneration report1 | | 68 |
| | | |
| | | | | Notes to the Consolidated Financial Statements – Note 32: Related Party Transactions | | 126 |
| 6C | | Board practices | | Board of Directors | | 52 |
| | | |
| | | | Corporate Governance Report | | 54 |
| | | |
| | | | | Remuneration report1 | | 68 |
| 6D | | Employees | | Where we operate | | 5 |
| | | |
| | | | Strategic report – KPIs – Headcount | | 16 |
| | | |
| | | | Financial Report – Employees by function and region | | 39 |
| | | |
| | | | Notes to the Consolidated Financial Statements – Note 8: | | |
| | | | | Staff Costs | | 100 |
| 6E | | Share ownership | | Remuneration report1 | | 68 |
| | | |
| | | | Other Statutory Information – Directors’ interests in shares | | 80 |
| | | |
| | | | Notes to the Consolidated Financial Statements – Note 29: Share-based payments | | 116 |
| 7 | | Major shareholders and related party transactions | | | | |
| 7A | | Major shareholders | | Other Statutory Information – Substantial shareholdings | | 81 |
| | | | | Corporate and Share Information – Major shareholders | | 140 |
| 7B | | Related party transactions | | Notes to the Consolidated Financial Statements – Note 32: Related Party Transactions | | 126 |
| 7C | | Interests of experts and counsel | | Not applicable | | |
| 8 | | Financial information | | | | |
| 8A | | Consolidated statements and other financial information | | Financial report – Dividend policy | | 31 |
| | | |
| | | | Report of the independent registered public accounting firm | | 83 |
| | | |
| | | | Consolidated Financial Statements | | 84 |
| | | |
| | | | | Notes to the Consolidated Financial Statements – Note 26: Contingent Liabilities | | 115 |
| 8B | | Significant changes | | Not applicable | | |
| 9 | | The offer and listing | | | | |
| 9A | | Offer and listing details | | Corporate and share information – Market prices | | 137 |
| 9B | | Plan of distribution | | Not applicable | | |
| 9C | | Markets | | Corporate and share information – History and development | | 134 |
| 9D | | Selling shareholders | | Not applicable | | |
| 9E | | Dilution | | Not applicable | | |
| 9F | | Expenses of the issue | | Not applicable | | |
| 10 | | Additional information | | | | |
| 10A | | Share capital | | Not applicable | | |
| 10B | | Memorandum and articles of association | | Corporate and share information – Memorandum and Articles of Association | | 140 |
| 10C | | Material contracts | | Corporate and share information – Material contracts | | 144 |
| 10D | | Exchange controls | | Corporate and share information – Exchange controls | | 144 |
| 10E | | Taxation | | Corporate and share information – Taxation (US Holders) | | 144 |
| | | | | | |
| Item | | Form 20-F Caption | | Location in this document | | Page(s) |
| 10F | | Dividends and paying agents | | Not applicable | | |
| 10G | | Statement by experts | | Not applicable | | |
| 10H | | Documents on display | | Corporate and share information – Documents on display | | 140 |
| 10I | | Subsidiary information | | Not applicable | | |
| 11 | | Quantitative and qualitative disclosures about market risk | | Notes to the Consolidated Financial Statements – Note 31: | | |
| | | | | Financial Instruments | | 121 |
| 12 | | Description of securities other than equity securities | | Corporate and share information – ADS payment information | | 136 |
| | | |
| | | | Corporate and share information – Fees payable by ADS holders | | 136 |
| 13 | | Defaults, dividend arrearages and delinquencies | | None | | |
| 14 | | Material modifications to the rights of security holders | | None | | |
| | and use of proceeds | | | | |
| 15 | | Controls and procedures | | Corporate Governance report – Controls and procedures under the Sarbanes-Oxley Act | | 65 |
| | | |
| | | | Management’s report on internal control over financial reporting | | 65 |
| | | |
| | | | Report of independent registered public accounting firm – internal control over financial reporting | | 65 |
| | | |
| | | | Report of independent registered public accounting firm | | 83 |
| 16A | | Audit committee financial expert | | Corporate Governance Report – Audit Committee | | 59 |
| 16B | | Code of ethics | | Corporate Governance Report – Ethics Policy | | 55 |
| 16C | | Principal accountant fees and services | | Corporate Governance Report – Interaction with the external Auditors | | 62 |
| 16D | | Exemptions from the listing standards for audit committees | | Not applicable | | |
| 16E | | Purchases of equity securities by the issuer and affiliated purchasers | | Corporate and share information – Market Prices | | 137 |
| 16F | | Change in registrant’s certifying accountant | | None | | |
| 16G | | Corporate governance | | Corporate Governance Report – US listing requirements | | 66 |
| 16H | | Mine Safety Disclosure | | Not applicable | | |
| 17 | | Financial statements | | Not applicable | | |
| 18 | | Financial statements | | Report of independent registered public accounting firm | | 83 |
| | | | | Consolidated Financial Statements | | 84 |
| 19 | | Exhibits | | Filed with the SEC | | |
1An analysis of the remuneration, interests in ordinary shares and options over ordinary shares of each of the Directors is presented in the Remuneration Report.
| | |
| 154 | | CSR plc Annual Report and Financial Statements 2014 |
Cautionary note regarding forward looking statements
This Annual Report does not constitute an invitation to underwrite, subscribe for, or otherwise acquire or dispose of any CSR plc shares.
This Annual Report contains “forward looking statements” in relation to the future financial and operating performance and outlook of CSR and the recommended cash offer for CSR by Qualcomm (the “Qualcomm Offer”), as well as other future events and their potential effects on CSR. Generally, the words “will”, “may”, “should”, “continue”, “believes”, “targets”, “plans”, “expects”, “estimates”, “aims”, “intends”, “anticipates”, or similar expressions or negatives thereof identify forward looking statements. Forward looking statements include statements relating to the following: (i) expected developments in our product portfolio, expected revenues in both our Core and Legacy businesses, expected margins, expected trends, expected growth in our Core business (including Voice & Music, Auto and Bluetooth Smart, as well as the potential for our indoor location business), expected annualised operating costs savings, expected future cash generation, expected future tax rates, expected future design wins and increase in market share, expected timing of product releases and expected timing of product development milestones, expected incorporation of our products in those of our customers, adoption of new technologies, the expectation of volume shipments of our products, expected product markets and their expansion or contraction, opportunities in our industry and our ability to take advantage of those opportunities, the potential success to be derived from strategic partnerships, potential acquisitions, the potential impact of capacity constraints, the effect of our financial performance on our share price, the impact of government regulation, expected performance against adverse economic conditions, and other expectations and beliefs of our management; and (ii) the expected benefits from the Qualcomm Offer.
Actual results and developments could differ materially from those expressed or implied by these forward looking statements as a result of numerous risks and uncertainties. These factors include, but are not limited to:
| — | | the ability to realise the expected benefits from the Qualcomm Offer in the amounts or the timeframe anticipated; |
| — | | the effects of governmental regulation; |
| — | | risks associated with the development of new products in response to market demand and CSR’s ability to ensure timely delivery of such products in accordance with expectations; |
| — | | a reduction in demand for consumer products due to challenging and uncertain economic conditions; |
| — | | increased expenses associated with new product introductions, masks, or process changes; |
| — | | risks relating to forecasting consumer demand for and market acceptance of CSR’s products and the products that use CSR’s products; |
| — | | declines in the average selling prices of CSR’s products; |
| — | | cancellation of existing orders or the failure to secure new orders; |
| — | | difficulties related to distributors who supply our products to customers; |
| — | | errors or failures in the hardware or software components of CSR’s products; |
| — | | risks associated with securing sufficient capacity from the third-parties that manufacture, assemble and test CSR’s products and other risks relating to CSR’s fabless business model; |
| — | | risks associated with existing or future litigation, including the risk that the Company will be enjoined from shipping or selling its products; |
| — | | risks associated with acquiring and protecting intellectual property and other commercially sensitive information; |
| — | | the cyclicality of the semiconductor industry; |
| — | | the potential for disruption in the supply of wafers or assembly or testing services due to changes in business conditions, natural disasters, terrorist activities, public health concerns or other factors; |
| — | | CSR’s ability to manage past and future acquisitions and realise the expected commercial benefits and synergies for such acquisitions in the amounts and timeframes anticipated; |
| — | | CSR’s ability to attract and retain key personnel, including engineers and technical personnel; |
| — | | the difficulty in predicting future results; and |
| — | | other risks and uncertainties discussed in this Annual Report, including, without limitation, under the heading “Risk Factors” on pages 43 to 51. |
The reader is cautioned not to place undue reliance on these forward looking statements, which speak only as of the date of this Annual Report. Neither CSR nor any other person undertakes any obligation to update or revise publicly any of the forward looking statements set out herein, whether as a result of new information, future events or otherwise, except to the extent legally required.
Glossary
ADR: negotiable certificate issued by a US bank representing a specified number of shares (or one share) in a foreign stock that is traded on a US exchange. ADRs are denominated in US dollars, with the underlying security held by a US financial institution overseas. ADRs help to reduce administration and duty costs that would otherwise be levied on each transaction
ADS: a US dollar-denominated equity share of a foreign-based company available for purchase on an American stock exchange. American Depositary Shares (ADSs) are issued by depository banks in the US under agreement with the issuing foreign company; the entire issuance is called an American Depositary Receipt (ADR) and the individual shares are referred to as ADSs
baseband: describing that part of a radio telecommunication system in which information is processed before modulating on to, or after demodulating off, a radio frequency (RF) carrier wave
beacon: an indoor proximity positioning tool, typically Bluetooth Smart powered, that can notify nearby devices such as smartphones of its presence
bill of materials: a list of the individual parts (or material) which comprise a finished product and the cost of each of those individual parts
Bluetooth: is an open wireless protocol for exchanging data over short distances from fixed and mobile devices
Bluetooth Smart (formerly known as Bluetooth low energy or BTLE): is designed to work side-by-side with and complement Bluetooth. It operates in 2.4 GHz ISM band. Devices using ultra low power Bluetooth will be smaller and more energy-efficient than their Bluetooth counterparts
chip: short for a microchip; semiconductor device or integrated circuit
cloud: in common usage, the term “the cloud” is essentially a metaphor for the Internet; the phrase “in the cloud” can refer software, platforms and infrastructure that are sold as a service, i.e. remotely through the Internet.
codec: short for compressor/decompressor, a codec is any technology for compressing and decompressing data. Codecs can be implemented in software, hardware or a combination of both. Some popular codecs for computer video include MPEG and Indeo. In telecommunications it is short for coder/decoder, a device that encodes or decodes a signal. For example, telephone companies use codecs to convert binary signals transmitted on their digital networks to analog signals converted on their analog networks
connectivity: enabling two electronic devices to communicate with each other and transfer data (voice/audio/music/picture/word files) using radio waves
Console: a computer game console is a device that outputs a video signal to display a video game; it can be a machine designed for consumers to use for playing video games on a television, or home computer, or it can be in the form of a handheld game console
CSR Group: CSR plc and its subsidiaries
design win: CSR records a design win when a product using one of its ICs becomes qualified
digital: the representation of data by a series of bits or discrete values such as 0s and 1s
fabless: short for fabricationless, a business model used in the semiconductor industry, where the manufacture (or fabrication) of IC’s is subcontracted to a foundry
fabless semiconductor company: company that uses a third party semiconductor fabrication service to manufacture silicon chips as opposed to fabrication facilities owned directly
foundry: a semiconductor manufacturing site that makes integrated circuits
gaming: a term describing the playing a video, internet or computer game
GNSS: A satellite navigation system (system of satellites that provide autonomous geo-spatial positioning with global coverage. It allows small electronic receivers to determine their location (longitude, latitude, and altitude) to high precision – within a few metres – using time signals transmitted along a line of sight by radio from satellites; the signals also allow the electronic receivers to calculate the current local time to high precision, which allows time synchronisation) with global coverage may be termed a global navigation satellite system or GNSS
GPS: Global Positioning Systems: a satellite based radio navigation system that allows receiving devices to take an accurate location fix of the device on the surface of the earth. Positions are derived by measuring the time of arrival of signals broadcast from the constellation of satellites, and knowledge of the instantaneous positions of the satellites. (The information required to calculate this being broadcast at a very low data rate by the satellites themselves, and is known as almanac and ephemeris data)
HID: Human Interface Device: a computer device that interacts directly with and often takes input from humans and may deliver data to humans
IC orintegrated circuit: a semiconductor device consisting of many thousands or millions of interconnected transistors and other components
indoor location: positioning and navigation in locations such as shopping centres, airports, convention centres, and other pedestrian areas
Infotainment: term and popular buzzword for a media device or service that delivers a combination of information and entertainment. The content delivered via infotainment is designed to be informative yet entertaining enough to attract and maintain the consumer’s interest
IoT: Internet of Things; a computing concept that describes a future where everyday physical objects will be connected to the internet and be able to identify themselves to other devices
ISO: International Standards Organisation: the international organisation responsible for developing and maintaining worldwide standards for manufacturing, environmental management systems, computers, data communications, and many other fields
| | |
| 156 | | CSR plc Annual Report and Financial Statements 2014 |
Additional informationcontinued
ISO 14000: a series of standards related to environmental management that exists to help organisations (a) minimise how their operations (processes etc.) negatively affect the environment (i.e. cause adverse changes to air, water, or land); (b) comply with applicable laws, regulations, and other environmentally oriented requirements, and (c) continually improve in the aforementioned matters
ISO 9000: a series of international standards for quality assurance in business practices, ratified by the ISO beginning in 1987. Certification of ISO 9000 compliance is important for selling many types of goods and services including data-communications equipment and services
low latency: low latency concerns the management of delays that occur between an input and a corresponding output that reduces them to such an extent as to render them unnoticeable to the human eye or ear. In respect of CSR’s new audio coding technology it reduces the delay, or “latency”, of stereo audio signals over Bluetooth connectivity, effectively enabling consumers to watch video while listening to synchronised wireless audio
memory: any device that can store data in machine-readable format which may include RAM, ROM and Flash
ODM: orOriginal Design Manufacturer: a manufacturer that designs and manufactures equipment for another company who will, in turn sell this to the end-user
OEM: orOriginal Equipment Manufacturer: a manufacturer that sells equipment to retail and wholesale outlets
OSHAS 18001: is a British Standard for occupational health and safety management systems; it exists to help organisations put in place demonstrably sound occupational health and safety performance; it is widely seen as the world’s most recognised occupational health and safety management systems standard
PC: personal computer
Personal Navigation Device orPND: is a portable electronic product which combines a positioning capability (such as GPS) and navigation functions and enables the user to find out where they are located and get directions to move from one place to another
package: the package of a semiconductor is the physical and electrical interface between the chip and the system in which it operates
platform: a set of hardware and software that provides the core functionality of an end product or a subsystem within the end product e.g. an auto navigation platform consists of an Embedded Processor+OS with visualisation capabilities +GPS combined with navigation algorithms and necessary peripherals; a smartphone platform consists of an Apps Processor+OS+Modem combined with voice, visualisation & data communication protocols and necessary peripherals; a wireless audio platform consists of an audio DSP+Bluetooth (or another wireless link) combined with audio algorithms and necessary peripherals
product qualification: the approval of a product or process for use by an ODM or OEM
protocol: a method by which two dissimilar systems can communicate
SA 8000: is an auditable certification standard that encourages organisations to develop, maintain, and apply socially acceptable practices in the workplace.
Samsung Group: Samsung Electronics Co., Ltd. and its subsidiaries
Samsung Transaction: disposal by CSR plc of its handset connectivity and handset location development operations to Samsung Electronics Co., Ltd. for $310 million in cash, along with the transfer of 311 people, which completed on 4 October 2012; the consideration was subject to a maximum adjustment of $5 million increase or decrease in certain circumstances, linked to the progress made in finalising the development of a WiFi/Bluetooth combination connectivity chip, to which both CSR and Samsung will have the rights to exploit in their respective end markets
SDK: software development kit
semiconductor: a material, typically crystalline, that can be altered to allow electrical current to flow or not flow in a pattern; common semiconductors are silicon, germanium and gallium-arsenide and the term is also used to apply to IC’s made from these materials
silicon: a semiconducting material used to make wafers, widely used in the semiconductor industry as the basic material for integrated circuits
smartphone: a generic name for a voice centric mobile phone that also offers advanced capabilities often using a computer like operating system to enable PC functionality
soundbox: a standalone wireless speaker
speaker dock: a cradle for a portable media player that serves to charge and connect the unit to a receiving device and enable music to be heard from its speakers
stereo headset: a mobile headset which connects to a mobile phone, PDA, MP3 player or other device using Bluetooth and sits on both ears of the user
SoC: System on chip is a technology that takes all the necessary electronic circuits and parts for a complete system and integrates them into a single circuit (Silicon chip)
software solution: a solution where instructions and data are read from memory (or memories) and then the instructions interpreted and executed by a microprocessor to modify the data in the intended way
soundbar: a special (sometimes wireless) loudspeaker which creates a stereo- or surround-sound effect from a single cabinet, usually much wider than it is high, and mounted above or below a display device, e.g. atop a computer monitor or beneath a television screen
tablet (PC): a type of notebook computer that has an LCD screen on which the user can write using a special-purpose pen, or stylus. The handwriting is digitised and can be converted to standard text through handwriting recognition, or it can remain as handwritten text. The stylus also can be used to type on a pen-based key layout where the lettered keys are arranged differently than a QWERTY keyboard
Tier One: a description of a leading, normally global manufacturer that supplies products in high volume to end-user markets
wafer:a disc made of a semiconducting material such as silicon, usually between 150mm (6’) and 300mm (12’) in diameter, in which integrated circuits are manufactured; a wafer may contain several thousand individual integrated circuits
wearable(s): wearables are clothing and accessories incorporating computer and advanced electronic technologies; they can be worn by a consumer and often include tracking information related to health and fitness; other wearable tech gadgets include devices that have small motion sensors to take photos and sync with the user’s mobile devices; examples of wearable devices include watches, fitness wristbands, glasses, contact lenses, e-textiles and smart fabrics, headbands, beanies and caps, and jewellery
Wi-Fi: Wireless Fidelity is a technology that allows an electronic device to exchange data or connect to the internet wirelessly using UHF radio waves
yield: when used in connection with manufacturing, the ratio of the number of usable products to the total number of products on a wafer
Trademarks and registered trademarks
The following is a list of CSR trademarks and registered trademarks that appear in the Annual Report.
| | | | | | | | |
µEnergy® | | CSR µEnergy® | | CSRB5341® | | Quatro® | | SiRFstarIV™ |
aptX® | | CSRmesh® | | CSRB5342® | | Reciva® | | SiRFstarV™ |
aptX® Low Latency | | CSR1010™ | | DDFA® | | SiRF® | | SiRFusion™ |
COACH® | | CSR1011™ | | DirectOffice® | | SiRFatlasVI™ | | VibeHub™ |
CSR & Logo® | | CSR8510™ | | MAPX™ | | SiRFprimaII™ | | Zoran® |
Unless otherwise stated, words and logos marked with ™ or ® are trademarks registered or owned by CSR plc or one of its group companies and may be registered in one or more jurisdictions save that not all such marks are registered in all countries where our products are available.
Bluetooth® and the Bluetooth logos are trademarks owned by Bluetooth SIG, Inc. and licensed to CSR.
IEEE Standard 802.11™, 802.11a™, 802.11b™, 802.11d™, 802.11e™, 802.11F™, 802.11g™, 802.11h™, 802.11i™, 802.11j™, 802.11k™, 802.11m™, 802.11n™, 802.11p™, 802.11r™, 802.11s™, 802.11T™, 802.11v™, 802.11u™, 802.11w™, 802.11y™ and 802.11z™ are trademarks of the IEEE.
Wi-Fi®, Wi-Fi Alliance®, WMM®, Wi-Fi Protected Access®, WPA®, WPA2®, Wi-Fi Protected Setup™ and Wi-Fi Multimedia™ are trademarks of the Wi-Fi Alliance.
Other products, services and names used in this document may have been trademarked by their respective owners.
The publication of this information does not imply that any licence is granted under any patent or other rights owned by CSR plc or its affiliates.
| | |
| 158 | | CSR plc Annual Report and Financial Statements 2014 |


The registrant hereby certifies that it meets all of the requirements for filing on Form 20-F and that it has duly caused and authorized the undersigned to sign this annual report on its behalf.
| | |
CSR plc |
(Registrant) |
| |
By: | | |
|
/s/ Joep van Beurden |
Name: | | Joep van Beurden |
Title: | | Chief Executive Officer |
|
/s/ Will Gardiner |
Name: | | Will Gardiner |
Title: | | Chief Financial Officer |
|
Date: 19 March 2015 |
Index to the Exhibits
| | | | |
Exhibit
No | | Description | | Page |
| | |
3 | | Articles of Association of CSR plc | | 167 |
| | |
8 | | List of subsidiaries of CSR plc | | 225 |
| | |
10.1 | | Cooperation Agreement between Qualcomm Global Trading Pte. Ltd. and CSR plc | | 227 |
| | |
10.2 | | Non-Disclosure Agreement between CSR plc and Qualcomm Incoporated | | 244 |
| | |
12.1 | | Certification of Chief Executive Officer pursuant to Rule 13a-14(a) | | 250 |
| | |
12.2 | | Certification of Chief Financial Officer pursuant to Rule 13a-14(a) | | 251 |
| | |
13.1 | | Certification of Chief Executive Officer and Chief Financial Officer pursuant to 18 U.S.C. 1350 | | 252 |
| | |
15.1 | | Consent of Independent Registered Public Accounting Firm | | 253 |


