As filed with the Securities and Exchange Commission on October 12, 2006
Registration No. 333-135943
UNITED STATES SECURITIES AND EXCHANGE COMMISSION
Washington, D.C. 20549
Amendment No. 2
to
Form F-1
REGISTRATION STATEMENT
UNDER
THE SECURITIES ACT OF 1933
NACG Holdings Inc.
(Exact name of registrant as specified in its charter)
| | | | | |
Canada
(State or Other Jurisdiction of
Incorporation or Organization) | | 1629
(Primary Standard Industrial
Classification Code Number) | | Not Applicable
(I.R.S. Employer
Identification Number) |
| | | |
Zone 3, Acheson Industrial Area
2-53016 Highway 60
Acheson, Alberta T7X 5A7
(780) 960-7171
(Address, including zip code, and telephone
number, including area code, of registrant’s
principal executive offices) | | Vincent J. Gallant
Zone 3, Acheson Industrial Area
2-53016 Highway 60
Acheson, Alberta T7X 5A7
(780) 960-7171
(Name, address, including zip code, and telephone
number, including area code, of agent for service) |
Copies to:
| | | |
Gary W. Orloff, Esq.
Bracewell & Giuliani LLP
711 Louisiana Street, Suite 2300
Houston, Texas 77002-2770
Phone: (713) 221-1306
Fax: (713) 221-2166 | | Kris F. Heinzelman, Esq.
Cravath, Swaine & Moore LLP
825 Eighth Avenue
New York, New York 10019-7475
Phone: (212) 474-1336
Fax: (212) 474-3700 |
Approximate date of commencement of proposed sale of the securities to the public: As soon as practicable after the effective date of this Registration Statement.
If any of the securities being registered on this Form are to be offered on a delayed or continuous basis pursuant to Rule 415 under the Securities Act of 1933, check the following box. o
If this Form is filed to register additional securities for an offering pursuant to Rule 462(b) under the Securities Act, check the following box and list the Securities Act registration statement number of the earlier effective registration statement for the same offering. o
If this Form is a post-effective amendment filed pursuant to Rule 462(c) under the Securities Act, check the following box and list the Securities Act registration number of the earlier effective registration statement for the same offering. o
If this Form is a post-effective amendment filed pursuant to Rule 462(d) under the Securities Act, check the following box and list the Securities Act registration number of the earlier effective registration statement for the same offering. o
The Registrant hereby amends this Registration Statement on such date or dates as may be necessary to delay its effective date until the registrant shall file a further amendment which specifically states that this Registration Statement shall thereafter become effective in accordance with Section 8(a) of the Securities Act of 1933 or until this Registration Statement shall become effective on such date as the Securities and Exchange Commission, acting pursuant to said Section 8(a), may determine.
The information in this prospectus is not complete and may be changed. We may not sell these securities until the registration statement filed with the Securities and Exchange Commission is effective. This prospectus is not an offer to sell these securities and it is not soliciting an offer to buy these securities in any state where the offer or sale is not permitted.
|
SUBJECT TO COMPLETION, DATED OCTOBER 12, 2006
Shares
North American Energy Partners Inc.
Common Shares
Prior to the offering, there has been no public market for our common shares. The initial public offering price of our common shares is expected to be between US$ and US$ per share. We will apply to list our common shares on the New York Stock Exchange under the symbol “NOA”. We also will apply to list our common shares on the Toronto Stock Exchange under the symbol “NOA”.
We are selling common shares, and the selling shareholders are selling common shares. The underwriters have an option to purchase a maximum of additional common shares from us and the selling shareholders to cover over-allotments. We will not receive any of the proceeds from the sale of common shares by the selling shareholders.
Investing in our common shares involves risks. See “Risk Factors” beginning on page 15.
| | | | | | | | | | | | | | | | | |
| | | | | Underwriting | | | Proceeds to North | | | Proceeds to the | |
| | | Price to | | | Discounts and | | | American Energy | | | Selling | |
| | | Public | | | Commissions | | | Partners Inc. | | | Shareholders | |
| | | | | | | | | | | | | |
| Per Share | | | US$ | | | | US$ | | | | US$ | | | | US$ | |
| Total | | | US$ | | | | US$ | | | | US$ | | | | US$ | |
Delivery of the common shares will be made on or about , 2006.
Neither the Securities and Exchange Commission nor any state securities commission has approved or disapproved of these securities or determined if this prospectus is truthful or complete. Any representation to the contrary is a criminal offense.
| | |
| Credit Suisse | UBS Investment Bank | Jefferies & Company |
CIBC World Markets
Simmons & Company
The date of this prospectus is , 2006.
TABLE OF CONTENTS
You should rely only on the information contained in this document or to which we have referred you. We have not and the underwriters have not authorized anyone to provide you with information that is different. If anyone provides you with different or inconsistent information, you should not rely on it. This document may only be used where it is legal to sell these securities. The information in this document may only be accurate on the date of this document.
Dealer Prospectus Delivery Obligation
Until , 2006 (25 days after the commencement of this offering), all dealers that effect transactions in these securities, whether or not participating in this offering, may be required to deliver a prospectus. This is in addition to the dealer’s obligation to deliver a prospectus when acting as an underwriter and with respect to unsold allotments or subscriptions.
i
PROSPECTUS SUMMARY
This summary highlights key information contained elsewhere in this prospectus. It does not contain all of the information that you should consider in making your investment decision. For a more complete understanding of us and this offering, you should read and consider the entire prospectus, including the information set forth under “Risk Factors.”We state our financial statements in Canadian dollars. In this prospectus, references to “Canadian dollars,” “dollars,” “C$” or “$” are to the currency of Canada, and references to “U.S. dollars” or “US$” are to the currency of the United States.Unless the context otherwise requires, the information in this prospectus gives effect to the proposed amalgamation of NACG Holdings Inc., NACG Preferred Corp. and North American Energy Partners Inc., which amalgamated company will continue under the name North American Energy Partners Inc. See “The Reorganization.” The common shares of the amalgamated North American Energy Partners Inc. are the common shares being offered hereby.
Our Company
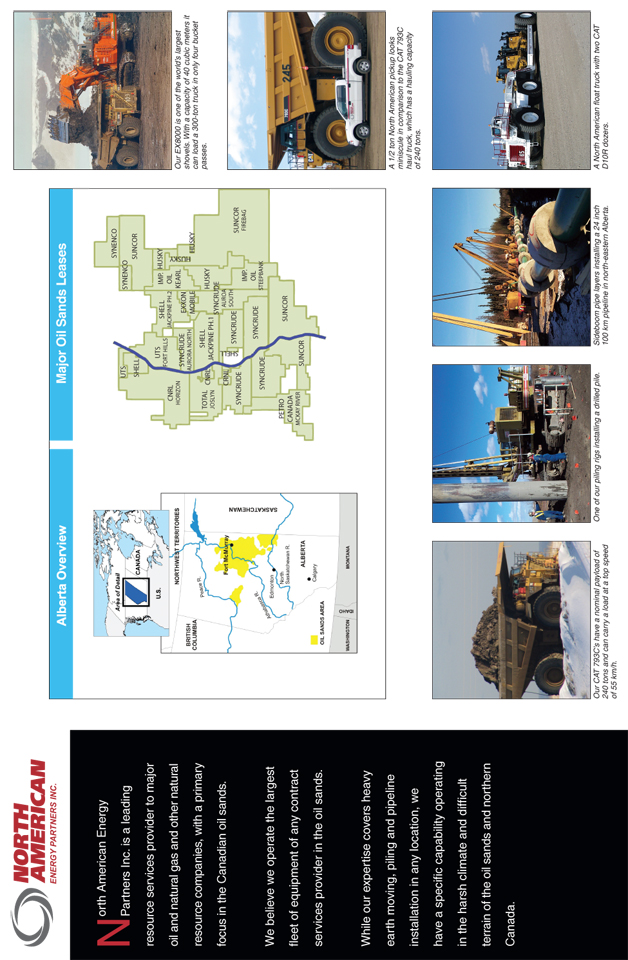
We are a leading resource services provider to major oil and natural gas and other natural resource companies, with a primary focus in the Canadian oil sands. We provide a wide range of mining and site preparation, piling and pipeline installation services to our customers across the entire lifecycle of their projects. We are the largest provider of contract mining services in the oil sands area, and we believe we are the largest piling foundations installer in western Canada. In addition, we believe that we operate the largest fleet of equipment of any contract resource services provider in the oil sands. Our total fleet includes over 555 pieces of diversified heavy construction equipment supported by over 570 ancillary vehicles. While our expertise covers heavy earth moving, piling and pipeline installation in any location, we have a specific capability operating in the harsh climate and difficult terrain of the oil sands and northern Canada.
Our core market is the Canadian oil sands, where we generated 71% of our fiscal 2006 revenue. The oil sands are located in three regions of northern Alberta: Athabasca, Cold Lake and Peace River. Oil sands operators produce and process bitumen, which is the extremely heavy oil trapped in the sands. According to the Alberta Energy and Utilities Board, or EUB, Canada’s oil sands are estimated to hold 315 billion barrels of ultimately recoverable oil reserves, with established reserves of almost 174 billion barrels as of the end of 2004, second only to Saudi Arabia and approximately six times the recoverable reserves in the United States. Approximately 32 billion barrels of the reserves in the oil sands are recoverable by open pit mining techniques. According to the Canadian National Energy Board, or NEB, oil sands production of bitumen is expected to increase from 1.1 million barrels per day, or “bpd,” in 2005 to approximately 3.0 million bpd by 2015 and account for 75% of total Canadian oil output, compared to approximately 50% of output today. In order to achieve this increase in production, the NEB estimates that over $95 billion of capital expenditures will be required through 2015.
Our significant knowledge, experience, equipment capacity and scale of operations in the oil sands differentiates us from our competition. Our principal customers are the major operators in the oil sands, including all three of the producers that currently mine bitumen, being Syncrude Canada Ltd., Suncor Energy Inc. and Albian Sands Energy Inc. (a joint venture among Shell Canada Limited, Chevron Canada Limited and Western Oil Sands Inc.). Canadian Natural Resources Limited, or CNRL, another significant customer, is developing a bitumen-mining project in the oil sands. We provide services to every company in the oil sands that uses surface mining techniques for its production. We also provide site construction services for in-situ producers, which use horizontally drilled wells to inject steam into deposits and pump bitumen to the surface.
We have long-term relationships with most of our customers. For example, we have been providing services to Syncrude and Suncor since they pioneered oil sands development over 30 years ago and we have worked with EnCana Corporation, or EnCana, for over 20 years. We believe our customers’ leases have an average remaining productive life of over 35 years. In addition, 34% of our revenues in fiscal 2006 were derived from recurring, long-term contracts, which assists in providing stability in our operations.
1
We provide services to our customers through three primary segments:
| | |
|
| | • | Mining and Site Preparation. Surface mining for oil sands and other natural resources; construction of infrastructure associated with mining operations and reclamation activities; clearing, stripping, excavating and grading for mining operations and industrial site construction for mega-projects; and underground utility installation for plant, refinery and commercial building construction; |
|
| |
|
| | • | Piling. Installing all types of driven and drilled piles, caissons and earth retention and stabilization systems for industrial projects primarily focused in the oil sands; and |
|
| |
|
| | • | Pipeline Installation. Installing transmission and distribution pipe made of various materials. |
|
As a result of our extensive experience and expertise in the oil sands, we are often engaged at an early stage to help our customers plan and estimate costs to develop oil sands projects which may entail the expenditure of several billions of dollars over the three to four year life of project construction. We provide our customers with information about working in the oil sands, including details about the differential in the cost of undertaking various projects in the summer or the winter, constructability, equipment availability and requirements and availability of labor. Our early stage or“first-in” involvement in projects gives us the opportunity to demonstrate our capability and insight into our customers’ plans and schedules, thereby allowing us to achieve greater accuracy in forecasting our future equipment and labor needs.
For the year ended March 31, 2006, we had total revenue of $492.2 million and operating income of $49.4 million compared to total revenue of $357.3 million and operating income of $9.4 million for the year ended March 31, 2005. The following charts provide our revenues by segment and by end market for the year ended March 31, 2006:
Our Competitive Strengths
Leading market position. We are the largest provider of contract mining services in the oil sands area, and we believe we are the largest piling foundations installer in western Canada. We have operated in western Canada for over 50 years and have participated in every significant oil sands mining project since operators first began working in the oil sands over 30 years ago. We believe the combination of our significant size, extensive experience and broad service offerings has allowed us to develop our leading market position and reputation as the service provider of choice in the oil sands.
Large, well-maintained equipment fleet strategically located in the Canadian oil sands. As of March 31, 2006, we had a heavy equipment fleet of over 350 units and over 270 ancillary vehicles located in the oil sands. Many of these units are among the largest pieces of equipment in the world and are designed for use in the largest earthmoving and mining applications globally. Our large, diverse fleet gives us flexibility in scheduling jobs and allows us to be responsive to our customers’ needs. We also operate
2
four significant maintenance and repair centers on the sites of the major oil sands projects. These factors help us to be more efficient, while concurrently increasing our equipment utilization and thereby improving our profitability.
Broad service offering across a project’s lifecycle. We provide our customers with resource services to meet their needs across the entire lifecycle of a project. Given the capital intensive and long-term nature of oil sands projects, our broad service offerings provide us with a competitive advantage and position us to transition from one stage of the project to the next, as we typically have knowledge of a project during its initial planning and budgeting phase. We use this knowledge to help secure contracts during the initial construction of the project as well as plan for recurring and follow-on work. As a result, we have a reputation as a“first-in, last-out” service provider.
Long-term customer relationships. We have worked successfully for many years and believe we have well-established relationships with major oil sands and conventional oil and gas producers. These relationships are based on our success in meeting our customers’ requirements, including strong safety and performance records, a well-maintained, highly capable fleet with specific equipment dedicated to individual customers and a staff of well-trained, experienced supervisors, operators and mechanics. Historically, our largest customers by revenue have included Syncrude, Suncor, Albian and EnCana.
Experienced management team. Our management team has well-established relationships with major oil sands producers and other resource industry leaders in our core markets. We believe that our management team’s experience in the resource services and mining industries enhances our ability to accomplish our strategic objectives and effectively manage our transition from a private company to a public company.
Our Strategy
Capitalize on growth opportunities in the Canadian oil sands. We intend to leverage our market leadership position and successful track record with our customers in the oil sands to benefit from the expected rapid growth in this end market. The NEB estimates that between 2006 and 2015 $8.5 billion to $10.9 billion of annual capital expenditures will be required to achieve expected increases in production. To capitalize on these opportunities as they arise, we plan to continue to regularly add to our equipment fleet.
Leverage our complementary services. We intend to build on our“first-in” position to cross-sell other services that we provide. Our complementary service segments allow us to compete for many different forms of business. Given our technical capabilities, performance history andon-site presence, we are well positioned to compete for new business in our service segments. Unplanned work requirements frequently arise with little notice, which we are well-positioned to execute, given ouron-site location and complementary service offerings. Furthermore, we intend to pursue selective acquisition growth opportunities that expand our complementary service offerings.
Increase our recurring revenue base. We provide services both during construction and while the project is in operation. Work required as an integral part of an operating project provides us with the opportunity to perform recurring services for our customers. Over the past several years we have increased our recurring revenues from mining services, from 20% of revenues in fiscal 2004 to 34% in fiscal 2006. Oil sands operators’ needs for these types of services will increase as they expand their operations and as new oil sands operations come on line.
Leverage long-term relationships with existing customers. Several of our oil sands customers have announced intentions to increase their production capacity by expanding the infrastructure at their sites. We intend to continue to build on our relationships with these and other existing oil sands customers to win a substantial share of the services outsourced in connection with these projects.
Increase our presence outside of the Canadian oil sands. Canada has significant reserves of various natural resources, including diamonds, coal and gold. We intend to utilize the expertise we have gained in the oil sands to provide similar services to other natural resource mining companies.
3
Enhance operating efficiencies to improve revenue and margins. We have initiated an operational improvement plan focused on implementing systems and process improvements, performance measurement techniques, enhanced communication and improved organizational effectiveness. This plan is designed to enhance our profitability, competitiveness and ability to effectively respond to opportunities in the markets we serve by improving the availability of our equipment.
Our business is primarily driven by the demand for our services from the development, expansion and operation of oil sands projects.
Increasing global energy demand and improvements in mining and in-situ technology have resulted in a significant increase in Canadian oil sands investments. There are currently two main methods of oil sands extraction: open pit mining and in-situ. We currently provide most of our services to companies operating open pit mines to recover bitumen reserves. These customers utilize our services for surface mining, site preparation, piling, pipe installation, site maintenance, equipment and labor supply and land reclamation.
Outlook. According to the NEB, as of June 2006, there were 21 mining and upgrader projects in various stages, ranging from announcement to construction, with start-up dates through 2010. If all of these projects proceed as scheduled, the planned investment in new projects for 2006 through 2010 will exceed $38 billion and an additional $17 billion will be invested in project additions or existing projects over the same period. Oil sands production has grown four-fold since 1990 and exceeded one million barrels per day in 2005. The NEB expects oil sands production to reach approximately 3.0 million barrels per day and account for over 75% of total Canadian oil production by 2015. Both the Canadian Energy Research Institute, or CERI, and the NEB have found that even at a price of approximately $25 per barrel the rate of oil sands supply can profitably double in the next 10 to 12 years.
Pipeline Infrastructure and Construction. To transport the increased production expected from the oil sands and to provide natural gas as an energy source to the oil sands region, significant investment will be required to expand pipeline capacity. To date, there have been significant greenfield and expansion projects announced. We are in various stages of discussions to provide services for some of these projects and believe we are well positioned to compete for these sizeable pipeline opportunities.
We provide services to conventional oil and gas producers, in addition to our work in the oil sands. The Canadian Energy Pipeline Association estimates that over $20 billion of pipeline investment in Canada will be required for the development of new long haul pipelines, feeder systems and other related pipeline construction. Conventional oil and gas producers require pipeline installation services in order to connect producing wells to nearby pipeline systems. Canadian natural gas production is expected to increase with the development of arctic gas reserves. A producer group led by Imperial Oil has been formed for the purpose of bidding for work on construction of a pipeline proposed from the MacKenzie River delta to existing natural gas pipelines in northern Alberta. We are actively working with Imperial Oil and have provided it with constructability and planning reviews.
According to the government agency Natural Resources Canada, Canada is also one of the largest mining nations in the world, producing approximately 70 different minerals and metals. In 2004, the mining and minerals processing industries contributed $41.8 billion to the Canadian economy, an amount equal to approximately 4.0% of GDP. The value of minerals produced (excluding petroleum and natural gas) reached $26.4 billion in 2005.
4
According to Natural Resources Canada, the diamond mining industry has grown from 2.6 million carats of production in 2000 to an estimated 12.3 million carats of production in 2005, representing a compounded annual growth rate of approximately 36%, and establishing Canada as the third largest diamond producing country in the world by value. We believe Canadian diamond mining will continue to grow. Outside the oil sands, we have identified the growing Canadian diamond mining industry as a primary target for new business opportunities.
We intend to build on our core services and strong regional presence to capitalize on the opportunities in the minerals mining industries of Canada.
| |
| Commercial and Public Construction |
According to the government agency Statistics Canada and the Alberta government, the Canadian commercial and public construction market was approximately $22 billion in 2005 and is expected to grow 3% annually through 2009. Western Canada has experienced and is expected to continue to experience strong economic and population growth. The Alberta government has responded to this growth by allocating approximately $6.5 billion to public facilities and infrastructure improvement and expansion projects from 2004 to 2007.
According to the Alberta government, as of June 2006, the inventory of planned commercial, retail and residential projects in Alberta was valued at approximately $5.1 billion. The 2010 Olympic Winter Games in British Columbia will require approximately $3.0 billion in infrastructure and construction spending. The significant resources and capital intensive nature of the core infrastructure and construction services required to meet these demands, along with our strong local presence and significant regional experience, position us to capitalize on the growing infrastructure demands of western Canada.
The Reorganization
Concurrently with the consummation of this offering, NACG Holdings Inc., NACG Preferred Corp. and North American Energy Partners Inc. will amalgamate into one entity, North American Energy Partners Inc. This amalgamation, together with certain other reorganization transactions, are referred to collectively as the “Reorganization.” The voting common shares of North American Energy Partners Inc. after giving effect to the Reorganization are the shares being offered hereby. This offering is contingent upon completion of the Reorganization. See “The Reorganization.”
Corporate Information
We were incorporated under the Canada Business Corporations Act in October 2003 in connection with the acquisition on November 26, 2003 (the “Acquisition”) of certain businesses from Norama Ltd., our predecessor company. See “Business — Our History.” Our head office is located at Zone 3, Acheson Industrial Area, 2-53016 Highway 60, Acheson, Alberta, T7X 5A7, Canada, our registered office is located at 2700, 10155-102 Street, Edmonton, Alberta, T5J 4G8, Canada, and our telephone number is (780) 960-7171. Our website address is www.nacg.ca. The information contained in or accessible through our website is not a part of this prospectus or the registration statement of which this prospectus forms a part.
5
The Offering
| | |
|
| Common shares offered by us | | shares ( shares if the underwriters’ over-allotment option is fully exercised) |
|
| |
| Common shares offered by the selling shareholders | | shares ( shares if the underwriters’ over-allotment option is fully exercised) |
| |
| Underwriters’ over-allotment option | | shares |
| |
|
| Common shares to be outstanding after this offering | | shares ( shares if the underwriters’ over-allotment option is fully exercised) |
|
| |
Common shares to be owned by the selling shareholders after this
offering | | shares ( shares if the underwriters’ over-allotment option is fully exercised) |
| |
|
| Use of proceeds | | We estimate that our proceeds from this offering, after deducting underwriting discounts and commissions and estimated offering expenses payable by us, will be approximately US$158.8 million, or C$176.4 million, assuming the shares are offered at US$ , or C$ , per share, respectively, which is the midpoint of the estimated offering price range set forth on the cover page of this prospectus. We will use the net proceeds of this offering to purchase certain equipment currently under operating leases, repurchase all of our outstanding 9% senior secured notes, acquire all of the outstanding Seller preferred shares and for other general corporate purposes, including potential acquisitions. See “Use of Proceeds.” |
|
| |
| | We will not receive any proceeds from the sale of shares by the selling shareholders. |
| |
| Proposed New York Stock Exchange symbol | | “NOA” |
| |
| Proposed Toronto Stock Exchange symbol | | “NOA” |
Unless otherwise indicated, all information in this prospectus assumes the underwriters do not exercise their over-allotment option and references to the number of common shares to be outstanding after the completion of this offering do not include:
| | |
|
| | • | 111,542 shares issuable upon exercise of outstanding stock options under our 2004 Share Option Plan as of September 30, 2006; and |
|
| |
|
| | • | 3,458 additional shares reserved for issuance under our 2004 Share Option Plan. |
|
Risk Factors
Investing in our common shares involves substantial risk. Please read “Risk Factors” beginning on page 15 for a discussion of certain factors you should consider in evaluating an investment in our common shares.
6
Summary Consolidated Historical and Pro Forma Financial Data
We were initially formed in October 2003 in connection with the Acquisition on November 26, 2003. As a result, the summary consolidated historical financial data presented below for the period from April 1, 2003 to November 25, 2003 is derived from the historical audited consolidated financial statements of Norama Ltd., our predecessor, included elsewhere in this prospectus. The summary consolidated historical financial data presented below for the period from November 26, 2003 to March 31, 2004 and as of and for the fiscal years ended March 31, 2005 and 2006 is derived from our audited consolidated financial statements included elsewhere in this prospectus. The summary consolidated historical financial data for the three months ended June 30, 2005 and as of and for the three months ended June 30, 2006 is derived from our unaudited consolidated financial statements included elsewhere in this prospectus. As a result of the Acquisition, the consolidated financial data for the period before November 26, 2003 is not necessarily comparable to the consolidated financial data for periods after November 25, 2003. Any historical financial data for the year ended March 31, 2004 presented below has been derived from the historical financial statements of Norama Ltd. for the period from April 1, 2003 to November 25, 2003, and our historical financial statements for the period from November 26, 2003 to March 31, 2004. The summary consolidated historical financial data for the three months ended June 30, 2006 is not necessarily indicative of the results that may be expected for ensuing fiscal quarters or for the full fiscal year ending March 31, 2007.
The summary consolidated pro forma financial data presented below for the fiscal year ended March 31, 2006 and as of and for the three months ended June 30, 2006 gives effect to the Reorganization and this offering and the use of proceeds therefrom and is derived from our unaudited pro forma financial statements. See “Unaudited Pro Forma Financial Information.” The summary consolidated pro forma financial data is presented for informational purposes only and does not purport to represent what our results of operations actually would have been had the transactions reflected occurred on the dates indicated or to project our results of operations for any future period.
The information presented below should be read in conjunction with “Management’s Discussion and Analysis of Financial Condition and Results of Operations,” “Unaudited Pro Forma Financial Information” and our audited and unaudited consolidated financial statements and related notes included elsewhere in this prospectus. All of the financial information presented below has been prepared in accordance with Canadian GAAP, which differs in certain significant respects from U.S. GAAP. For a discussion of the principal differences between Canadian GAAP and U.S. GAAP as they pertain to us, see note 23 to our consolidated financial statements included elsewhere in this prospectus.
7
| | | | | | | | | | | | | | | | | | | | | | | | | | | | | | | | | | | | |
| | | Historical | | | | Pro Forma | |
| | | | | | | | | | | | |
| | | Predecessor | | | | | | | | | |
| | | | | | | | | | | Three Months | | | | |
| | | April 1, 2003 | | | | November 26, | | | Year Ended | | | Ended | | | | | | Three Months | |
| | | to | | | | 2003 to | | | March 31, | | | June 30, | | | | Year Ended | | | Ended | |
| | | November 25, | | | | March 31, | | | | | | | | | | March 31, | | | June 30, | |
| | | 2003(a) | | | | 2004 | | | 2005 | | | 2006 | | | 2005 | | | 2006 | | | | 2006 | | | 2006 | |
| | | | | | | | | | | | | | | | | | | | | | | | | | | |
| | | | | | | | | | | | (Unaudited) | | | | (Unaudited) | |
| | | (Dollars in thousands, except per share amounts) | |
Statement of Operations Data: | | | | | | | | | | | | | | | | | | | | | | | | | | | | | | | | | | |
| Revenue(b) | | $ | 250,652 | | | | $ | 127,611 | | | $ | 357,323 | | | $ | 492,237 | | | $ | 104,359 | | | $ | 138,100 | | | | $ | 492,237 | | | $ | 138,100 | |
| | Project costs | | | 156,976 | | | | | 83,256 | | | | 240,919 | | | | 308,949 | | | | 66,546 | | | | 67,009 | | | | | 304,579 | | | | 66,380 | |
| | Equipment costs | | | 43,484 | | | | | 13,686 | | | | 52,831 | | | | 64,832 | | | | 17,014 | | | | 23,935 | | | | | 64,832 | | | | 23,935 | |
| | Equipment operating lease expense | | | 10,502 | | | | | 1,430 | | | | 6,645 | | | | 16,405 | | | | 2,898 | | | | 7,200 | | | | | 3,328 | | | | 2,106 | |
| | Depreciation | | | 6,566 | | | | | 6,674 | | | | 20,762 | | | | 21,725 | | | | 4,989 | | | | 7,312 | | | | | 24,762 | | | | 8,422 | |
| | | | | | | | | | | | | | | | | | | | | | | | | | | |
| Gross profit | | | 33,124 | | | | | 22,565 | | | | 36,166 | | | | 80,326 | | | | 12,912 | | | | 32,644 | | | | | 94,736 | | | | 37,257 | |
| | General and administrative | | | 7,783 | | | | | 6,065 | | | | 22,873 | | | | 30,903 | | | | 7,250 | | | | 9,235 | | | | | 32,684 | | | | 9,145 | |
| | (Gain) loss on disposal of plant and equipment | | | (49 | ) | | | | 131 | | | | 494 | | | | (733 | ) | | | 272 | | | | 113 | | | | | (733 | ) | | | 113 | |
| | Amortization of intangible assets | | | — | | | | | 12,928 | | | | 3,368 | | | | 730 | | | | 183 | | | | 183 | | | | | 730 | | | | 183 | |
| | | | | | | | | | | | | | | | | | | | | | | | | | | |
| Operating income | | | 25,390 | | | | | 3,441 | | | | 9,431 | | | | 49,426 | | | | 5,207 | | | | 23,113 | | | | | 62,055 | | | | 27,816 | |
| | Management fee(c) | | | 41,070 | | | | | — | | | | — | | | | — | | | | — | | | | — | | | | | — | | | | — | |
| | Interest expense(d) | | | 2,457 | | | | | 10,079 | | | | 31,141 | | | | 68,776 | | | | 49,863 | | | | 10,168 | | | | | 27,423 | | | | 6,685 | |
| | Foreign exchange (gain) loss | | | (7 | ) | | | | (661 | ) | | | (19,815 | ) | | | (13,953 | ) | | | 1,221 | | | | (13,466 | ) | | | | (8,103 | ) | | | (10,214 | ) |
| | Loss on acquisition of Series A preferred shares | | | — | | | | | — | | | | — | | | | — | | | | — | | | | — | | | | | 679 | | | | — | |
| | Gain on acquisition of Seller preferred shares | | | — | | | | | — | | | | — | | | | — | | | | — | | | | — | | | | | (8,000 | ) | | | — | |
| | Loss on repurchase of 9% senior secured notes | | | — | | | | | — | | | | — | | | | — | | | | — | | | | — | | | | | 3,428 | | | | — | |
| | Other (income) expense | | | (367 | ) | | | | (230 | ) | | | (421 | ) | | | 1,118 | | | | 1,895 | | | | (583 | ) | | | | 1,118 | | | | (583 | ) |
| | Realized and unrealized loss on derivative financial instruments | | | — | | | | | 12,205 | | | | 43,113 | | | | 14,689 | | | | 1,282 | | | | 7,996 | | | | | 14,689 | | | | 7,996 | |
| | | | | | | | | | | | | | | | | | | | | | | | | | | |
| Income (loss) before income taxes | | | (17,763 | ) | | | | (17,952 | ) | | | (44,587 | ) | | | (21,204 | ) | | | (49,054 | ) | | | 18,998 | | | | | 30,821 | | | | 23,932 | |
| | Income taxes (benefit) | | | (6,622 | ) | | | | (5,670 | ) | | | (2,264 | ) | | | 737 | | | | 150 | | | | 1,104 | | | | | 737 | | | | 105 | |
| | | | | | | | | | | | | | | | | | | | | | | | | | | |
| Net income (loss)(e) | | $ | (11,141 | ) | | | $ | (12,282 | ) | | $ | (42,323 | ) | | $ | (21,941 | ) | | $ | (49,204 | ) | | $ | 17,894 | | | | $ | 30,084 | | | $ | 23,827 | |
| | | | | | | | | | | | | | | | | | | | | | | | | | | |
| Net income (loss) per share: | | | | | | | | | | | | | | | | | | | | | | | | | | | | | | | | | | |
| | Basic | | | | | | | $ | (13.28 | ) | | $ | (45.66 | ) | | $ | (23.62 | ) | | $ | (53.02 | ) | | $ | 19.22 | | | | $ | | | | $ | | |
| | Diluted | | | | | | | | (13.28 | ) | | | (45.66 | ) | | | (23.62 | ) | | | (53.02 | ) | | | 14.16 | | | | | | | | | | |
| Weighted average shares: | | | | | | | | | | | | | | | | | | | | | | | | | | | | | | | | | | |
| | Basic | | | | | | | | 925,000 | | | | 926,986 | | | | 928,740 | | | | 928,000 | | | | 931,000 | | | | | | | | | | |
| | Diluted | | | | | | | | 925,000 | | | | 926,986 | | | | 928,740 | | | | 928,000 | | | | 1,307,780 | | | | | | | | | | |
| | | |
Balance Sheet Data (end of period): | | | | | | | | | | | | | | | | | | | | | | | | | | | | | | | | | | |
| Cash and cash equivalents | | | | | | | $ | 36,595 | | | $ | 17,924 | | | $ | 42,804 | | | | | | | $ | 45,093 | | | | | | | | $ | 70,220 | |
| Plant and equipment, net | | | | | | | | 167,905 | | | | 177,089 | | | | 185,566 | | | | | | | | 191,269 | | | | | | | | | 236,268 | |
| Total assets | | | | | | | | 489,974 | | | | 540,155 | | | | 587,011 | | | | | | | | 598,332 | | | | | | | | | 669,902 | |
| Total debt(f) | | | | | | | | 313,798 | | | | 310,402 | | | | 314,959 | | | | | | | | 302,373 | | | | | | | | | 234,937 | |
| Other long-term financial liabilities(f) | | | | | | | | 46,266 | | | | 86,723 | | | | 141,179 | | | | | | | | 149,543 | | | | | | | | | 71,030 | |
| Total long-term financial liabilities(f) | | | | | | | | 352,027 | | | | 395,354 | | | | 453,092 | | | | | | | | 448,483 | | | | | | | | | 302,534 | |
| Seller preferred shares(g) | | | | | | | | 35,000 | | | | 35,000 | | | | 35,000 | | | | | | | | 35,000 | | | | | | | | | — | |
| Series A preferred shares(g) | | | | | | | | — | | | | — | | | | 375 | | | | | | | | 391 | | | | | | | | | — | |
| Series B preferred shares(g) | | | | | | | | — | | | | — | | | | 42,193 | | | | | | | | 43,122 | | | | �� | | | | | — | |
| Total shareholders’ equity(h) | | | | | | | | 80,355 | | | | 38,829 | | | | 18,111 | | | | | | | | 36,317 | | | | | | | | | 258,761 | |
8
| | | | | | | | | | | | | | | | | | | | | | | | | | | | | | | | | | | |
| | | Historical | | | Pro Forma | |
| | | | | | | | | | | | | | | |
| | | Predecessor | | | | | | | | | |
| | | | | | | | | | | | Three Months | | | |
| | | April 1, 2003 | | | | November 26, | | | Year Ended | | | | Ended | | | | | Three Months | |
| | | to | | | | 2003 to | | | March 31, | | | | June 30, | | | Year Ended | | | Ended | |
| | | November 25, | | | | March 31, | | | | | | | | | | March 31, | | | June 30, | |
| | | 2003(a) | | | | 2004 | | | 2005 | | | 2006 | | | | 2005 | | | 2006 | | | 2006 | | | 2006 | |
| | | | | | | | | | | | | | | | | | | | | | | | | | | |
| | | | | | | | | | | | | (Unaudited) | | | (Unaudited) | |
| | | (Dollars in thousands, except per share amounts) | |
Other Financial Data: | | | | | | | | | | | | | | | | | | | | | | | | | | | | | | | | | | |
| EBITDA(i) | | $ | (8,740 | ) | | | $ | 11,729 | | | $ | 10,684 | | | $ | 70,027 | | | | $ | 5,981 | | | $ | 36,661 | | | $ | 83,556 | | | $ | 39,222 | |
| Consolidated EBITDA(i) | | | (8,789 | ) | | | | 23,462 | | | | 34,448 | | | | 70,648 | | | | | 8,651 | | | | 31,511 | | | | 82,513 | | | | 37,334 | |
| Cash provided by (used in) operating activities | | | 2,509 | | | | | 15,477 | | | | (4,833 | ) | | | 33,864 | | | | | (16,130 | ) | | | 15,254 | | | | | | | | | |
| Cash used in investing activities | | | (4,625 | ) | | | | (364,514 | ) | | | (25,055 | ) | | | (22,168 | ) | | | | (2,955 | ) | | | (11,574 | ) | | | | | | | | |
| Cash provided by financing activities | | | 6,967 | | | | | 385,632 | | | | 11,217 | | | | 13,184 | | | | | 14,773 | | | | (1,391 | ) | | | | | | | | |
| Capital expenditures, net of capital leases | | | 5,234 | | | | | 2,501 | | | | 25,679 | | | | 29,015 | | | | | 5,693 | | | | 11,843 | | | | | | | | | |
| | |
| (a) | | The historical statement of operations data and other financial data for the period from April 1, 2003 to November 25, 2003 have been derived from the historical financial statements of Norama Ltd. The financial statements for periods ended before November 26, 2003 are not necessarily comparable in all respects to the financial statements for periods ended after November 25, 2003. See “Business — Our History.” |
| |
|
| (b) | | Effective April 1, 2005, we changed our accounting policy regarding the recognition of revenue on claims. This change in accounting policy has been applied retroactively. Prior to this change, revenue from claims was included in total estimated contract revenue when awarded or received. After this change, claims are included in total estimated contract revenue, only to the extent that contract costs related to the claim have been incurred and when it is probable that the claim will result in a bona fide addition to contract value and can be reliably estimated. Those two conditions are satisfied when (1) the contract or other evidence provides a legal basis for the claim or a legal opinion is obtained providing a reasonable basis to support the claim, (2) additional costs incurred were caused by unforeseen circumstances and are not the result of deficiencies in our performance, (3) costs associated with the claim are identifiable and reasonable in view of work performed and (4) evidence supporting the claim is objective and verifiable. No profit is recognized on claims until final settlement occurs. This can lead to a situation where costs are recognized in one period and revenue is recognized when customer agreement is obtained or claim resolution occurs, which can be in subsequent periods. Historical claim recoveries should not be considered indicative of future claim recoveries. The change in policy resulted in an increase in claims revenue and unbilled revenue of approximately $6.1 million and $8.1 million for the three months ended June 30, 2006 and 2005, respectively, and $12.9 million for the year ended March 31, 2006, but did not result in any adjustments to prior periods. Substantially all of the amounts recognized as claims revenue have been collected subsequent to March 31, 2006. |
|
| |
| (c) | | Management fees paid to the corporate shareholder of our predecessor company, Norama Ltd., represented fees for services rendered and were determined with reference to taxable income. Subsequent to the Acquisition on November 26, 2003, these fees are no longer paid. |
9
| | |
| (d) | | Interest expense consists of the following (in thousands): |
| | | | | | | | | | | | | | | | | | | | | | | | | | | | | | | | | | | |
| | | Historical | | | | Pro Forma | |
| | | | | | | | | | | | |
| | | Predecessor | | | | | | | | | �� |
| | | | | | | | | | | Three Months | | | | |
| | | April 1, 2003 | | | | November 26, | | | Year Ended | | | Ended | | | | | | Three Months | |
| | | to | | | | 2003 to | | | March 31, | | | June 30, | | | | Year Ended | | | Ended | |
| | | November 25, | | | | March 31, | | | | | | | | | | March 31, | | | June 30, | |
| | | 2003 | | | | 2004 | | | 2005 | | | 2006 | | | 2005 | | | 2006 | | | | 2006 | | | 2006 | |
| | | | | | | | | | | | | | | | | | | | | | | | | | | |
| | | | | | | | | | | | (Unaudited) | | | | (Unaudited) | |
| Interest on senior notes | | $ | — | | | | $ | 8,096 | | | $ | 23,189 | | | $ | 28,838 | | | $ | 6,535 | | | $ | 7,346 | | | | $ | 23,238 | | | $ | 5,817 | |
| Interest on senior secured credit facility/revolving credit facility | | | 599 | | | | | 1,089 | | | | 3,274 | | | | 564 | | | | 564 | | | | — | | | | | 564 | | | | — | |
| Change in redemption value of Series B preferred shares | | | — | | | | | — | | | | — | | | | 34,668 | | | | 41,498 | | | | 929 | | | | | — | | | | — | |
| Amortization of deferred financing costs | | | — | | | | | 814 | | | | 2,554 | | | | 3,338 | | | | 672 | | | | 887 | | | | | 2,307 | | | | 578 | |
| Other | | | 1,858 | | | | | 80 | | | | 2,124 | | | | 1,368 | | | | 594 | | | | 1,006 | | | | | 1,314 | | | | 290 | |
| | | | | | | | | | | | | | | | | | | | | | | | | | | |
| | | $ | 2,457 | | | | $ | 10,079 | | | $ | 31,141 | | | $ | 68,776 | | | $ | 49,863 | | | $ | 10,168 | | | | $ | 27,423 | | | $ | 6,685 | |
| | | | | | | | | | | | | | | | | | | | | | | | | | | |
| | |
| (e) | | Our consolidated financial statements have been prepared in accordance with Canadian GAAP, which differs in certain material respects from U.S. GAAP. If U.S. GAAP were employed, our net loss would be adjusted as follows (in thousands): |
| | | | | | | | | | | | | | | | | | | | | | | | | | | | | | | | | | | | |
| | | Historical | | | | Pro Forma | |
| | | | | | | | | | | | |
| | | Predecessor | | | | | | | | | |
| | | | | | | | | | | Three Months | | | | |
| | | April 1, 2003 | | | | November 26, | | | Year Ended | | | Ended | | | | | | Three Months | |
| | | to | | | | 2003 to | | | March 31, | | | June 30, | | | | Year Ended | | | Ended | |
| | | November 25, | | | | March 31, | | | | | | | | | | March 31, | | | June 30, | |
| | | 2003 | | | | 2004 | | | 2005 | | | 2006 | | | 2005 | | | 2006 | | | | 2006 | | | 2006 | |
| | | | | | | | | | | | | | | | | | | | | | | | | | | |
| | | | | | | | | | | | (Unaudited) | | | | (Unaudited) | |
| Net income (loss) – Canadian GAAP | | $ | (11,141 | ) | | | $ | (12,282 | ) | | $ | (42,323 | ) | | $ | (21,941 | ) | | $ | (49,204 | ) | | $ | 17,894 | | | | $ | 30,084 | | | $ | 23,827 | |
| Capitalized interest(1) | | | — | | | | | — | | | | — | | | | 847 | | | | 107 | | | | 249 | | | | | 847 | | | | 249 | |
| Depreciation of capitalized interest(1) | | | — | | | | | — | | | | — | | | | — | | | | — | | | | (44 | ) | | | | — | | | | (44 | ) |
| Amortization using effective interest method(2) | | | — | | | | | — | | | | — | | | | 590 | | | | 43 | | | | 135 | | | | | 345 | | | | 82 | |
| Realized and unrealized loss on derivative financial instruments(3) | | | — | | | | | — | | | | — | | | | (484 | ) | | | — | | | | (159 | ) | | | | (578 | ) | | | (119 | ) |
| Difference between accretion of Series B preferred shares under Canadian GAAP and U.S. GAAP(4) | | | — | | | | | — | | | | — | | | | — | | | | — | | | | 90 | | | | | — | | | | — | |
| | | | | | | | | | | | | | | | | | | | | | | | | | | |
| Income (loss) before income taxes | | | (11,141 | ) | | | | (12,282 | ) | | | (42,323 | ) | | | (20,988 | ) | | | (49,054 | ) | | | 18,165 | | | | | 30,698 | | | | 23,995 | |
| Income taxes: | | | | | | | | | | | | | | | | | | | | | | | | | | | | | | | | | | |
| | Deferred income taxes | | | — | | | | | — | | | | — | | | | — | | | | — | | | | (364 | ) | | | | — | | | | (258 | ) |
| | | | | | | | | | | | | | | | | | | | | | | | | | | |
| Net income (loss) – U.S. GAAP | | $ | (11,141 | ) | | | $ | (12,282 | ) | | $ | (42,323 | ) | | $ | (20,988 | ) | | | (49,054 | ) | | | 17,801 | | | | $ | 30,698 | | | $ | 23,737 | |
| | | | | | | | | | | | | | | | | | | | | | | | | | | |
| Net income (loss) per share – basic – U.S. GAAP | | | | | | | $ | (13.28 | ) | | $ | (45.66 | ) | | $ | (22.60 | ) | | $ | (52.86 | ) | | $ | 19.12 | | | | $ | | | | $ | | |
| | | | | | | | | | | | | | | | | | | | | | | | | | | |
| Net income (loss) per share – diluted – U.S. GAAP | | | | | | | $ | (13.28 | ) | | $ | (45.66 | ) | | $ | (22.60 | ) | | $ | (52.86 | ) | | $ | 14.05 | | | | $ | | | | $ | | |
| | | | | | | | | | | | | | | | | | | | | | | | | | | |
10
| | |
|
| | (1) U.S. GAAP requires capitalization of interest costs as part of the historical cost of acquiring certain qualifying assets that require a period of time to prepare for their intended use. This is not required under Canadian GAAP. Accordingly, the capitalized amount is subject to depreciation in accordance with our policies when the asset is placed into service. |
|
| |
| | (2) Under Canadian GAAP, we defer and amortize debt issuance costs on a straight-line basis over the stated term of the related debt. Under U.S. GAAP, we are required to amortize financing costs over the stated term of the related debt using the effective interest method resulting in a consistent interest rate over the term of the debt. |
| |
| | (3) U.S. GAAP requires that every derivative instrument (including certain derivative instruments embedded in other contracts and debt instruments) be recorded in the balance sheet as either an asset or liability measured at its fair value. The issuances of our 83/4% senior notes and 9% senior secured notes both included certain contingent embedded derivatives which provided for the acceleration of redemption by the holder at a premium in certain instances. These embedded derivatives met the criteria for bifurcation from the debt contract and separate measurement at fair value. Under U.S. GAAP, the embedded derivatives have been measured at fair value and classified as part of the carrying amount of the senior notes on the consolidated balance sheet, with changes in the fair value being recorded in net income (loss) as realized and unrealized (gain) loss on derivative financial instruments for the period. Under Canadian GAAP, separate accounting of embedded derivatives from the host contract is not permitted. |
| |
|
| | (4) Under Canadian GAAP, we classify the Series B preferred shares as a liability and accrete the carrying amount of $42.2 million on their amendment date (March 30, 2006) to the December 31, 2011 redemption value of $69.6 million using the effective interest method. Under U.S. GAAP, we recognize the fair value of the amended Series B preferred shares as minority interest as such amount was recognized as temporary equity in the accounts of the pre-amalgamated North American Energy Partners Inc., the issuer of the Series B preferred shares, in accordance with Emerging Issues Task Force Topic D-98. Under U.S. GAAP, we accrete the initial fair value of the amended Series B preferred shares of $45.9 million recorded on their amendment date (March 30, 2006) to the December 31, 2011 redemption value of $69.6 million using the effective interest method, which is consistent with the treatment of the Series B preferred shares as temporary equity in the financial statements of the pre-amalgamated North American Energy Partners Inc. The accretion charge is recognized as a charge to minority interest under U.S. GAAP and interest expense in our financial statements under Canadian GAAP. |
|
| |
|
| (f) | | Total debt as of June 30, 2006 consist of the following (in thousands): |
|
| | | | | |
| Revolving credit facility | | $ | — | |
| Obligations under capital leases, including current portion | | | 11,937 | |
| 9% senior secured notes due 2010 | | | 67,436 | |
83/4% senior notes due 2011 | | | 223,000 | |
| | | | |
| Total debt | | $ | 302,373 | |
| | | | |
| | |
|
| | Our 83/4% senior notes are reflected above at the current exchange rate at each balance sheet date. We have entered into cross-currency and interest rate swaps, which represent an economic hedge of the 83/4% senior notes. At maturity, we will be required to pay $263.0 million in order to retire these senior notes and the swaps. This amount reflects the fixed exchange rate of C$1.315 = US$1.00 established as of November 26, 2003, the inception of the swap contracts. |
|
| |
|
| | Other long-term financial liabilities consist of derivative financial instruments and redeemable preferred shares. |
|
| |
|
| | Total long-term financial liabilities consists of total debt, excluding current portion of obligations under capital leases, plus our redeemable preferred shares and the value of the cross-currency and interest rate swaps recognized on our balance sheet. |
|
| |
| (g) | | The Series A preferred shares of NACG Preferred Corp. are referred to as the Seller preferred shares. The Series A preferred shares of North American Energy Partners Inc. are referred to as the Series A preferred shares. The Series B preferred shares of North American Energy Partners Inc. are referred to as the Series B preferred shares. See note 13(a) to our consolidated financial statements included elsewhere in this prospectus for a description of the preferred shares. |
11
| | |
| (h) | | The cumulative effect of material differences between Canadian and U.S. GAAP on shareholders’ equity is as follows (in thousands): |
| | | | | | | | | | | | | | | | | | | | | | |
| | | | | | | | | | | | Pro Forma | |
| | | | | | | | | | | | | |
| | | March 31, | | | March 31, | | | March 31, | | | June 30, | | | | June 30, | |
| | | 2004 | | | 2005 | | | 2006 | | | 2006 | | | | 2006 | |
| | | | | | | | | | | | | | | | | |
| | | | | | | | | (Unaudited) | | | | (Unaudited) | |
| Shareholders’ equity – Canadian GAAP | | $ | 80,355 | | | $ | 38,829 | | | $ | 18,111 | | | $ | 36,317 | | | | $ | 258,761 | |
| Capitalized interest(1) | | | — | | | | — | | | | 847 | | | | 1,096 | | | | | 1,096 | |
| Depreciation of capitalized interest(1) | | | — | | | | — | | | | — | | | | (44 | ) | | | | (44 | ) |
| Amortization using effective interest method(2) | | | — | | | | — | | | | 590 | | | | 725 | | | | | 427 | |
| Realized and unrealized loss on derivative financial instruments(3) | | | — | | | | — | | | | (484 | ) | | | (643 | ) | | | | (697 | ) |
| Excess of fair value of amended Series B preferred shares over carrying value of original Series B preferred shares(4) | | | — | | | | — | | | | (3,707 | ) | | | (3,707 | ) | | | | — | |
| Cumulative difference between accretion of Series B preferred shares under Canadian GAAP and U.S. GAAP(4) | | | — | | | | — | | | | — | | | | 90 | | | | | — | |
| Deferred income taxes | | | — | | | | — | | | | — | | | | (364 | ) | | | | (258 | ) |
| | | | | | | | | | | | | | | | | |
| Shareholders’ equity – U.S. GAAP | | $ | 80,355 | | | $ | 38,829 | | | $ | 15,357 | | | $ | 33,470 | | | | $ | 259,285 | |
| | | | | | | | | | | | | | | | | |
| | |
|
| | (1) U.S. GAAP requires capitalization of interest costs as part of the historical cost of acquiring certain qualifying assets that require a period of time to prepare for their intended use. This is not required under Canadian GAAP. Accordingly, the capitalized amount is subject to depreciation in accordance with our policies when the asset is placed into service. |
|
| |
| | (2) Under Canadian GAAP, we defer and amortize debt issuance costs on a straight-line basis over the stated term of the related debt. Under U.S. GAAP, we are required to amortize financing costs over the stated term of the related debt using the effective interest method resulting in a consistent interest rate over the term of the debt. |
| |
| | (3) U.S. GAAP requires that every derivative instrument (including certain derivative instruments embedded in other contracts and debt instruments) be recorded in the balance sheet as either an asset or liability measured at its fair value. The issuances of our 83/4% senior notes and 9% senior secured notes both included certain contingent embedded derivatives which provided for the acceleration of redemption by the holder at a premium in certain instances. These embedded derivatives met the criteria for bifurcation from the debt contract and separate measurement at fair value. Under U.S. GAAP, the embedded derivatives have been measured at fair value and classified as part of the carrying amount of the senior notes on the consolidated balance sheet, with changes in the fair value being recorded in net income as realized and unrealized (gain) loss on derivative financial instruments for the period. Under Canadian GAAP, separate accounting of embedded derivatives from the host contract is not permitted. |
| |
|
| | (4) Prior to the modification of the terms of the Series B preferred shares, there were no differences between Canadian GAAP and U.S. GAAP related to the Series B preferred shares. As a result of the modification of terms of the Series B preferred shares on March 30, 2006, under Canadian GAAP, we continue to classify the Series B preferred shares as a liability and accrete the carrying amount to the December 31, 2011 redemption value of $69.6 million using the effective interest method. Under U.S. GAAP, the Company recognized the fair value of the Series B preferred shares as minority interest as such amount was recognized as temporary equity in the accounts of the pre-amalgamated North American Energy Partners Inc., the issuer of the shares, in accordance with EITF Topic D-98 and recognized a charge of $3.7 million to retained earnings for the difference between the fair value and the carrying amount of the Series B preferred shares on the modification date. Under U.S. GAAP, we accrete the initial fair value of the Series B preferred shares of $45.9 million to the December 31, 2011 redemption value of $69.6 million using the effective interest method, which is consistent with the treatment of the Series B preferred shares as temporary equity in the financial statements of the pre-amalgamated North American Energy Partners Inc. The accretion charge is recognized as a charge to minority interest as opposed to retained earnings in the accounts of North American Energy Partners Inc. under U.S. GAAP and interest expense in our financial statements under Canadian GAAP. |
|
12
| | |
|
| (i) | | EBITDA is calculated as net income (loss) before interest expense, income taxes, depreciation and amortization. Consolidated EBITDA is defined as EBITDA, excluding the effects of foreign exchange gain or loss, realized and unrealized gain or loss on derivative financial instruments, non-cash stock-based compensation expense, gain or loss on disposal of plant and equipment and certain other non-cash items included in the calculation of net income (loss). We believe that EBITDA is a meaningful measure of the performance of our business because it excludes items, such as depreciation and amortization, interest and taxes, that are not directly related to the operating performance of our business. Management reviews EBITDA to determine whether capital assets are being allocated efficiently. In addition, our revolving credit facility requires us to maintain a minimum Consolidated EBITDA. Non-compliance with this financial covenant could result in our being required to immediately repay all amounts outstanding under our revolving credit facility. We are required to maintain a minimum trailing twelve month Consolidated EBITDA through December 31, 2006 of $65.5 million, with this minimum amount increasing periodically until maturity. However, EBITDA and Consolidated EBITDA are not measures of performance under Canadian GAAP or U.S. GAAP and our computations of EBITDA and Consolidated EBITDA may vary from others in our industry. EBITDA and Consolidated EBITDA should not be considered as alternatives to operating income or net income as measures of operating performance or cash flows as measures of liquidity. EBITDA and Consolidated EBITDA have important limitations as analytical tools, and you should not consider them in isolation, or as substitutes for analysis of our results as reported under Canadian GAAP or U.S. GAAP. For example, EBITDA and Consolidated EBITDA: |
|
| | |
| | • | do not reflect our cash expenditures or requirements for capital expenditures or capital commitments; |
| |
| | • | do not reflect changes in, or cash requirements for, our working capital needs; |
| |
| | ��� | do not reflect the interest expense or the cash requirements necessary to service interest or principal payments on our debt; |
| |
| | • | exclude tax payments that represent a reduction in cash available to us; and |
| |
| | • | do not reflect any cash requirements for assets being depreciated and amortized that may have to be replaced in the future. |
| |
| | In addition, Consolidated EBITDA excludes foreign exchange gains and losses and unrealized and realized gains and losses on derivative financial instruments, which, in the case of unrealized losses, may ultimately result in a liability that will need to be paid and, in the case of realized losses, represents an actual use of cash during the period. |
| |
|
| | A reconciliation of net income (loss) to EBITDA as set forth in our consolidated statements of operations is as follows (in thousands): |
|
| | | | | | | | | | | | | | | | | | | | | | | | | | | | | | | | | | | | |
| | | Historical | | | | Pro Forma | |
| | | | | | | | | | | | |
| | | Predecessor | | | | | | | | | |
| | | | | | | | | | | Three Months | | | | |
| | | April 1, 2003 | | | | November 26, | | | Year Ended | | | Ended | | | | | | Three Months | |
| | | to | | | | 2003 to | | | March 31, | | | June 30, | | | | Year Ended | | | Ended | |
| | | November 25, | | | | March 31, | | | | | | | | | | March 31, | | | June 30, | |
| | | 2003 | | | | 2004 | | | 2005 | | | 2006 | | | 2005 | | | 2006 | | | | 2006 | | | 2006 | |
| | | | | | | | | | | | | | | | | | | | | | | | | | | |
| | | | | | | | | | | | (Unaudited) | | | | (Unaudited) | |
| Net income (loss) | | $ | (11,141 | ) | | | $ | (12,282 | ) | | $ | (42,323 | ) | | $ | (21,941 | ) | | $ | (49,204 | ) | | $ | 17,894 | | | | $ | 30,084 | | | $ | 23,827 | |
| Adjustments: | | | | | | | | | | | | | | | | | | | | | | | | | | | | | | | | | | |
| | Depreciation | | | 6,566 | | | | | 6,674 | | | | 20,762 | | | | 21,725 | | | | 4,989 | | | | 7,312 | | | | | 24,762 | | | | 8,422 | |
| | Amortization | | | — | | | | | 12,928 | | | | 3,368 | | | | 730 | | | | 183 | | | | 183 | | | | | 730 | | | | 183 | |
| | Interest expense | | | 2,457 | | | | | 10,079 | | | | 31,141 | | | | 68,776 | | | | 49,863 | | | | 10,168 | | | | | 27,243 | | | | 6,685 | |
| | Income taxes (benefit) | | | (6,622 | ) | | | | (5,670 | ) | | | (2,264 | ) | | | 737 | | | | 150 | | | | 1,104 | | | | | 737 | | | | 105 | |
| | | | | | | | | | | | | | | | | | | | | | | | | | | |
| EBITDA(1) | | $ | (8,740 | ) | | | $ | 11,729 | | | $ | 10,684 | | | $ | 70,027 | | | $ | 5,981 | | | $ | 36,661 | | | | $ | 83,556 | | | $ | 39,222 | |
| | | | | | | | | | | | | | | | | | | | | | | | | | | |
13
A reconciliation of EBITDA to Consolidated EBITDA is as follows (in thousands):
| | | | | | | | | | | | | | | | | | | | | | | | | | | | | | | | | | | | |
| | | Historical | | | | Pro Forma | |
| | | | | | | | | | | | |
| | | Predecessor | | | | | | | | | |
| | | | | | | | | | | Three Months | | | | |
| | | April 1, 2003 | | | | November 26, | | | Year Ended | | | Ended | | | | | | Three Months | |
| | | to | | | | 2003 to | | | March 31, | | | June 30, | | | | Year Ended | | | Ended | |
| | | November 25, | | | | March 31, | | | | | | | | | | March 31, | | | June 30, | |
| | | 2003 | | | | 2004 | | | 2005 | | | 2006 | | | 2005 | | | 2006 | | | | 2006 | | | 2006 | |
| | | | | | | | | | | | | | | | | | | | | | | | | | | |
| | | | | | | | | | | | (Unaudited) | | | | (Unaudited) | |
| EBITDA | | $ | (8,740 | ) | | | $ | 11,729 | | | $ | 10,684 | | | $ | 70,027 | | | $ | 5,981 | | | $ | 36,661 | | | | $ | 83,556 | | | $ | 39,222 | |
| Adjustments: | | | | | | | | | | | | | | | | | | | | | | | | | | | | | | | | | | |
| | Unrealized foreign exchange loss (gain) on senior notes | | | — | | | | | (740 | ) | | | (20,340 | ) | | | (14,258 | ) | | | 928 | | | | (13,571 | ) | | | | (8,103 | ) | | | (10,319 | ) |
| | Loss (gain) on disposal of plant and equipment | | | (49 | ) | | | | 131 | | | | 494 | | | | (733 | ) | | | 272 | | | | 113 | | | | | (733 | ) | | | 113 | |
| | Realized and unrealized loss on derivative financial instruments | | | — | | | | | 12,205 | | | | 43,113 | | | | 14,689 | | | | 1,282 | | | | 7,996 | | | | | 14,689 | | | | 7,996 | |
| | Non-cash stock-based compensation expense | | | — | | | | | 137 | | | | 497 | | | | 923 | | | | 188 | | | | 312 | | | | | 1,104 | | | | 322 | |
| | Gain on acquisition of Seller preferred shares | | | — | | | | | — | | | | — | | | | — | | | | — | | | | — | | | | | (8,000 | ) | | | — | |
| | | | | | | | | | | | | | | | | | | | | | | | | | | |
| Consolidated EBITDA(1) | | $ | (8,789 | ) | | | $ | 23,462 | | | $ | 34,448 | | | $ | 70,648 | | | $ | 8,651 | | | $ | 31,511 | | | | $ | 82,513 | | | | 37,334 | |
| | | | | | | | | | | | | | | | | | | | | | | | | | | |
| | |
| | (1) | Pro forma EBITDA and pro forma Consolidated EBITDA for the year ended March 31, 2006 include losses of $4.1 million due to the repurchase of our 9% senior secured notes and the Series A preferred shares because the definition of Consolidated EBITDA in our revolving credit facility does not adjust for cash gains and losses. |
14
RISK FACTORS
An investment in our common shares entails a high degree of risk. You should carefully consider the following risk factors and other information presented in this prospectus before deciding to purchase our common shares. If the events underlying these risks actually occur, our business, financial condition and results of operations could be materially adversely affected and you may lose all or part of your investment.
Risks Related to Our Business
| |
| Anticipated major projects in the oil sands may not materialize. |
Notwithstanding the NEB’s estimates regarding new investment and growth in the Canadian oil sands, planned and anticipated projects in the oil sands and other related projects may not materialize. The underlying assumptions on which the projects are based are subject to significant uncertainties, and actual investments in the oil sands could be significantly less than estimated. Projected investments and new projects may be postponed or cancelled for any number of reasons, including among others:
| | |
| | • | changes in the perception of the economic viability of these projects; |
| |
| | • | shortage of pipeline capacity to transport production to major markets; |
| |
| | • | lack of sufficient governmental infrastructure to support growth; |
| |
| | • | shortage of skilled workers in this remote region of Canada; and |
| |
| | • | cost overruns on announced projects. |
| |
| Changes in our customers’ perception of oil prices over the long-term could cause our customers to defer, reduce or stop their investment in oil sands projects, which would, in turn, reduce our revenue from those customers. |
Due to the amount of capital investment required to build an oil sands project, or construct a significant expansion to an existing project, investment decisions by oil sands operators are based upon long-term views of the economic viability of the project. Economic viability is dependent upon the anticipated revenues the project will produce, the anticipated amount of capital investment required and the anticipated cost of operating the project. One of the most important considerations is the price of oil. The long-term outlook for the price of oil is influenced by many factors, including the condition of developed and developing economies and the resulting demand for oil and gas, the level of supply of oil and gas, the actions of the Organization of Petroleum Exporting Countries, governmental regulation, political conditions in oil producing nations, including those in the Middle East, war or the threat of war in oil producing regions and the availability of fuel from alternate sources. If our customers believe the long-term outlook for the price of oil is not favorable or believe oil sands projects are not viable for any other reason, they may delay, reduce or cancel plans to construct new oil sands projects or expansions to existing projects. Delays, reductions or cancellations of major oil sands projects could have a material adverse impact on our financial condition and results of operations.
| |
| | Insufficient pipeline, upgrading and refining capacity could cause our customers to delay, reduce or cancel plans to construct new oil sands projects or expand existing projects, which would, in turn, reduce our revenue from those customers. |
For our customers to operate successfully in the oil sands, they must be able to transport the bitumen produced to upgrading facilities and transport the upgraded oil to refineries. Some oil sands projects have upgraders at the mine site and others transport bitumen to upgraders located elsewhere. While current pipeline and upgrading capacity is sufficient to upgrade current bitumen production and transport such production to refineries, future increases in production from new oil sands projects and expansions to existing projects will require increased upgrading and pipeline capacity. If these increases do not
15
materialize, whether due to inadequate economics for the sponsors of such projects, shortages of labor or materials or any other reason, our customers may be unable to efficiently deliver increased production to market and may therefore delay, reduce or cancel planned capital investment. Such delays, reductions or cancellations of major oil sands projects would adversely affect our prospects and could have a material adverse impact on our financial condition and results of operations.
| |
| Lack of sufficient governmental infrastructure to support the growth in the oil sands region could cause our customers to delay, reduce or cancel their future expansions, which would, in turn, reduce our revenue from those customers. |
The development in the oil sands region has put a great strain on the existing government infrastructure, necessitating substantial improvements to accommodate the growth in the region. The local government having responsibility for a majority of the oil sands region has been exceptionally impacted by this growth and is not currently in a position to provide the necessary additional infrastructure. In an effort to delay further development until infrastructure funding issues are resolved, the local governmental authority has sought to intervene in a hearing in July 2006 to consider an application by a major oil sands company to the EUB for approval to expand its operations and may take similar action with respect to any future applications. If the necessary infrastructure is not put in place, future growth of our customers’ operations could be delayed, reduced or canceled which could in turn adversely affect our prospects and could have a material adverse impact on our financial condition and results of operations.
| |
| Shortages of qualified personnel or significant labor disputes could adversely affect our business. |
Alberta, and in particular the oil sands area, has had and continues to have a shortage of skilled labor and other qualified personnel. New mining projects in the area will only make it more difficult for us and our customers to find and hire all the employees required to work on these projects. We are continuously seeking ways to hire the people we need, including more project managers, trades people and other employees with the required skills. We have expanded our efforts to find qualified candidates outside of Canada who might relocate to our area. In addition, we have undertaken more extensive training of existing employees and we are enhancing our use of technology and developing programs to provide better working conditions. We believe the labor shortage, which affects us and all of our major customers, will continue to be a challenge for everyone in the mining and oil and gas industries in western Canada for the foreseeable future. If we are not able to recruit and retain enough employees with the appropriate skills, we may be unable to maintain our customer service levels, and we may not be able to satisfy any increased demand for our services. This, in turn, could have a material adverse effect on our business, financial condition and results of operations. If our customers are not able to recruit and retain enough employees with the appropriate skills, they may be unable to develop projects in the oil sands area.
Substantially all of our hourly employees are subject to collective bargaining agreements to which we are a party or are otherwise subject. Any work stoppage resulting from a strike or lockout could have a material adverse effect on our business, financial condition and results of operations. In addition, our customers employ workers under collective bargaining agreements. Any work stoppage or labor disruption experienced by our key customers could significantly reduce the amount of our services that they need.
| |
| Cost overruns by our customers on their projects may cause our customers to terminate future projects or expansions which could adversely affect the amount of work we receive from those customers. |
Oil sands development projects require substantial capital expenditures. In the past, several of our customers’ projects have experienced significant cost overruns, impacting their returns. As new projects are contemplated or built, if cost overruns continue to challenge our customers, they could reassess future projects and expansions which could adversely affect the amount of work we receive from our customers.
16
| |
| Our ability to grow our operations in the future may be hampered by our inability to obtain long lead time equipment, particularly tires, which are currently in limited supply. |
Our ability to grow our business is in part dependent upon obtaining equipment on a timely basis. Due to the long production lead times of our suppliers of large mining equipment, we must forecast our demand for equipment many months or even years in advance. If we fail to forecast accurately, we could suffer equipment shortages or surpluses, which could have a material adverse impact on our financial condition and results of operations.
Global demand for tires of the size and specifications we require is exceeding the available supply. For example, we currently have four trucks that we cannot utilize because we cannot get tires of the appropriate size and specifications. We expect the supply/demand imbalance for certain tires to continue for several years. Our inability to procure tires to meet the demands for our existing fleet as well as to secure tires to meet new demand for our services could have an adverse effect on our ability to grow our business.
| |
| Our customer base is concentrated, and the loss of or a significant reduction in business from a major customer could adversely impact our financial condition. |
We receive most of our revenues from providing services to a small number of major oil sands mining companies. Revenue from our five largest customers represented approximately 68% and 69% of our total revenue for the fiscal years ended March 31, 2005 and 2006, respectively, and those customers are expected to continue to account for a significant percentage of our revenues in the future. For the year ended March 31, 2006, CNRL, Syncrude and Grande Cache Coal Corp. were our three largest customers, accounting for 32%, 16% and 10%, respectively, of our total revenue. For the last five fiscal years, the majority of our revenues in our pipeline business resulted from work performed for EnCana. If we lose or experience a significant reduction of business from one or more of our significant customers, we may not be able to replace the lost work with work from other customers. Our long-term contracts typically allow our customers to unilaterally reduce or eliminate the work which we are to perform under the contract. Our contracts generally allow the customer to terminate the contract without cause. The loss of or significant reduction in business with one or more of our major customers, whether as a result of completion of a contract, early termination or failure or inability to pay amounts owed to us, could have a material adverse effect on our business and results of operations.
| |
| Because most of our customers are Canadian energy companies, a downturn in the Canadian energy industry could result in a decrease in the demand for our services. |
Most of our customers are Canadian energy companies. A downturn in the Canadian energy industry could cause our customers to slow down or curtail their current production and future expansions which would, in turn, reduce our revenue from those customers. Such a delay or curtailment could have a material adverse impact on our financial condition and results of operations.
| |
| | Lump sum and unit-price contracts expose us to losses when our estimates of project costs are lower than actual costs. |
Approximately 51% and 58% of our revenue for the fiscal years ended March 31, 2005 and 2006, respectively, was derived from lump sum and unit-price contracts. See “Management’s Discussion and Analysis of Financial Condition and Results of Operations – Critical Accounting Policies and Estimates – Revenue Recognition.” Lump sum and unit-price contracts require us to guarantee the price of the services we provide and thereby expose us to losses if our estimates of project costs are lower than the actual project costs we incur. Our profitability under these contracts is dependent upon our ability to accurately predict the costs associated with our services. The costs we actually incur may be affected by a
17
variety of factors beyond our control. Factors that may contribute to actual costs exceeding estimated costs and which therefore affect profitability include, without limitation:
| | |
| | • | site conditions differing from those assumed in the original bid; |
| |
| | • | scope modifications during the execution of the project; |
| |
| | • | the availability and cost of skilled workers in the geographic location of the project; |
| |
| | • | the availability and proximity of materials; |
| |
| | • | unfavorable weather conditions hindering productivity; |
| |
| | • | inability or failure of our customers to perform their contractual commitments; |
| |
| | • | equipment availability and productivity and timing differences resulting from project construction not starting on time; and |
| |
| | • | the general coordination of work inherent in all large projects we undertake. |
When we are unable to accurately estimate the costs of lump sum and unit-price contracts, or when we incur unrecoverable cost overruns, the related projects result in lower margins than anticipated or may incur losses, which could adversely impact our results of operations, financial condition and cash flow. For example, on a recent major site preparation and underground installation contract, a combination of unfavorable weather conditions hindering productivity, higher than expected costs due to labor shortages, schedule acceleration and higher than expected costs resulting from underestimation of the project’s complexity at the time the contract bid was prepared led to significant cost overruns. This had a significant impact on our operations. See “Management’s Discussion and Analysis of Financial Condition and Results of Operations – Segmented Results of Operations – Fiscal Year Ended March 31, 2006 Compared to Fiscal Year Ended March 31, 2005 – Revenue – Mining and Site Preparation.”
| |
| Until we establish and maintain effective internal controls over financial reporting, we cannot assure you that we will have appropriate procedures in place to eliminate future financial reporting inaccuracies and avoid delays in financial reporting. |
North American Energy Partners Inc., our subsidiary prior to the Reorganization, has financial reporting obligations arising from the indentures governing the 83/4% senior notes and 9% senior secured notes. NACG Holdings Inc. is a holding company for North American Energy Partners Inc. and the two companies will amalgamate as part of the Reorganization. We have had continuing problems providing accurate and timely financial information and reports and have restated North American Energy Partners’ financial statements three times since the beginning of our 2005 fiscal year. In April of 2005, we had to restate North American Energy Partners’ financial statements for the first and second quarters of fiscal 2005 to properly account for costs incurred in those quarters. During fiscal 2006, we had to restate North American Energy Partners’ financial statements for each period after November 26, 2003 to the quarter ended December 31, 2004 and the quarter ended June 30, 2005 to eliminate the impact of hedge accounting with respect to the derivative financial instruments. We also had to restate North American Energy Partners’ financial statements for the first quarter of fiscal 2006 to correct the accounting for various aspects of the refinancing transactions which occurred in May 2005. Each of these restatements resulted in our inability to file North American Energy Partners’ financial statements within the deadlines imposed by covenants in the indentures governing our 83/4% senior notes and 9% senior secured notes. See “Management’s Discussion and Analysis of Financial Condition and Results of Operations – Restatements.”
We have identified a number of significant weaknesses (as defined under Canadian auditing standards) in our financial reporting processes and internal controls. See “Management’s Discussion and Analysis of Financial Condition and Results of Operations — Significant Weaknesses in Financial Reporting and Internal Controls.” As a result, there can be no assurance that we will be able to generate accurate financial reports in a timely manner. Failure to do so would cause us to breach the reporting
18
requirements of U.S. and Canadian securities regulations in the future as well as the covenants applicable to our indebtedness. This could, in turn, have a material adverse effect on our business and financial condition. Until we establish and maintain effective internal controls and procedures for financial reporting, we may not have appropriate measures in place to eliminate financial statement inaccuracies and avoid delays in financial reporting.
| |
| If, as of the end of our 2008 fiscal year, we are unable to assert that our internal control over financial reporting is effective, or if our auditors are unable to confirm our assessment, investors could lose confidence in our reported financial information, and the trading price of our common shares and our business could be adversely affected. |
We are in the process of documenting, and plan to test our internal control procedures in order to satisfy the requirements of Section 404 of the Sarbanes-Oxley Act, commencing with our fiscal year ending March 31, 2008. The Sarbanes-Oxley Act requires an annual assessment by management of the effectiveness of internal control over financial reporting effective March 31, 2008 and an attestation report by independent auditors addressing this assessment effective March 31, 2009. We cannot be certain that we will be able to comply with all of our reporting obligations and successfully complete the procedures, certification and attestation requirements of Section 404 of the Sarbanes-Oxley Act in a timely manner. During the course of our testing we may identify deficiencies that we may not be able to remedy in time to meet the deadline imposed by the Sarbanes-Oxley Act for compliance with the requirements of Section 404. Effective internal control over financial reporting is important to help produce reliable financial reports and to prevent financial fraud. If we are unable to assert that our internal control over financial reporting is effective as of the end of our 2008 fiscal year, or if our independent auditors are unable to attest as of the end of our 2009 fiscal year that our management’s report is fairly stated or are unable to express an opinion on management’s evaluation or on the effectiveness of our internal controls, we could be subject to heightened regulatory scrutiny, investors could lose confidence in our reported financial information and the trading price of our common shares and our ability to maintain confidence in our business could be adversely affected.
| |
| Our substantial debt could adversely affect us, make us more vulnerable to adverse economic or industry conditions and prevent us from fulfilling our debt obligations. |
We have a substantial amount of debt outstanding and significant debt service requirements. As of June 30, 2006, we had outstanding approximately $302.4 million of debt, including approximately $79.4 million of secured indebtedness and capital leases. We also have cross-currency and interest rate swaps with a balance sheet liability of $71.0 million as of June 30, 2006 and which are secured equally and ratably with our revolving credit facility. We also had $18.0 million of outstanding, undrawn letters of credit, which reduce the amount of available borrowings under our revolving credit facility. Our substantial indebtedness could have serious consequences, such as:
| | |
| | • | limiting our ability to obtain additional financing to fund our working capital, capital expenditures, debt service requirements, potential growth or other purposes; |
| |
| | • | limiting our ability to use operating cash flow in other areas of our business; |
| |
| | • | limiting our ability to post surety bonds required by some of our customers; |
| |
| | • | placing us at a competitive disadvantage compared to competitors with less debt; |
| |
| | • | increasing our vulnerability to, and reducing our flexibility in planning for, adverse changes in economic, industry and competitive conditions; and |
| |
| | • | increasing our vulnerability to increases in interest rates because borrowings under our revolving credit facility and payments under some of our equipment leases are subject to variable interest rates. |
19
The potential consequences of our substantial indebtedness make us more vulnerable to defaults and place us at a competitive disadvantage. Further, if we do not have sufficient earnings to service our debt, we would need to refinance all or part of our existing debt, sell assets, borrow more money or sell securities, none of which we can guarantee we will be able to achieve on commercially reasonable terms, if at all.
| |
| The terms of our debt agreements may restrict our current and future operations, particularly our ability to respond to changes in our business or take certain actions. |
Our revolving credit facility and the indentures governing our notes limit, among other things, our ability and the ability of our subsidiaries to:
| | |
| | • | incur or guarantee additional debt, issue certain equity securities or enter into sale and leaseback transactions; |
| |
| | • | pay dividends or distributions on our shares or repurchase our shares, redeem subordinated debt or make other restricted payments; |
| |
| | • | incur dividend or other payment restrictions affecting certain of our subsidiaries; |
| |
| | • | issue equity securities of subsidiaries; |
| |
| | • | make certain investments or acquisitions; |
| |
| | • | create liens on our assets; |
| |
| | • | enter into transactions with affiliates; |
| |
| | • | consolidate, merge or transfer all or substantially all of our assets; and |
| |
| | • | transfer or sell assets, including shares of our subsidiaries. |
Our revolving credit facility and some of our equipment lease programs also require us, and our future credit facilities may require us, to maintain specified financial ratios and satisfy specified financial tests, some of which become more restrictive over time. Our ability to meet these financial ratios and tests can be affected by events beyond our control, and we may be unable to meet those tests.
As a result of these covenants, our ability to respond to changes in business and economic conditions and to obtain additional financing, if needed, may be significantly restricted, and we may be prevented from engaging in transactions that might otherwise be considered beneficial to us. The breach of any of these covenants could result in an event of default under our revolving credit facility or any future credit facilities or under the indentures governing our notes. Under our revolving credit facility, our failure to pay certain amounts when due to other creditors, including to certain equipment lessors, or the acceleration of such other indebtedness, would also result in an event of default. Upon the occurrence of an event of default under our revolving credit facility or future credit facilities, the lenders could elect to stop lending to us or declare all amounts outstanding under such credit facilities to be immediately due and payable. Similarly, upon the occurrence of an event of default under the indentures governing our notes, the outstanding principal and accrued interest on the notes may become immediately due and payable. If amounts outstanding under such credit facilities and indentures were to be accelerated, or if we were not able to borrow under our revolving credit facility, we could become insolvent or be forced into insolvency proceedings and you could lose your investment in us.
Between March 31, 2004 and May 19, 2005, it was necessary to obtain a series of waivers and amend our then-existing credit agreement to avoid or to cure our default of various covenants contained in that credit agreement. We ultimately replaced that credit agreement with a new credit agreement on May 19, 2005, which we replaced with our current amended and restated credit agreement dated as of July 19, 2006.
Our inability to file North American Energy Partners’ financial statements for the periods ended December 31, 2004, March 31, 2005 and September 30, 2005 with the SEC within the deadlines imposed by covenants in the indentures governing our 83/4% senior notes and our 9% senior secured notes caused us
20
to be out of compliance with such covenants. In each case, we filed these financial statements before the lack of compliance became an event of default under the indentures.
| |
| We may not be able to generate sufficient cash flow to meet our debt service and other obligations due to events beyond our control. |
For the year ended March 31, 2005, we had negative operating cash flow of $4.8 million. Our ability to generate sufficient operating cash flow to make scheduled payments on our indebtedness and meet other capital requirements will depend on our future operating and financial performance. Our future performance will be impacted by a range of economic, competitive and business factors that we cannot control, such as general economic and financial conditions in our industry or the economy generally.
A significant reduction in operating cash flows resulting from changes in economic conditions, increased competition, reduced work or other events could increase the need for additional or alternative sources of liquidity and could have a material adverse effect on our business, financial condition, results of operations, prospects and our ability to service our debt and other obligations. If we are unable to service our indebtedness, we will be forced to adopt an alternative strategy that may include actions such as selling assets, restructuring or refinancing our indebtedness, seeking additional equity capital or reducing capital expenditures. We may not be able to effect any of these alternative strategies on satisfactory terms, if at all, or they may not yield sufficient funds to make required payments on our indebtedness.
| |
| Currency rate fluctuations could adversely affect our ability to borrow under our revolving credit facility and to repay our 83/4% senior notes and 9% senior secured notes and may affect the cost of goods we purchase. |
Our ability to borrow under our revolving credit facility is limited, in part, by the derivative financial instruments recorded as liabilities on our balance sheet, which reduce the availability under our revolving credit facility on a dollar-for-dollar basis. If the Canadian dollar increases in value against the U.S. dollar, as it has in the recent past, the liabilities related to the derivative financial instruments will increase, which may adversely affect our liquidity or even cause an event of default under our revolving credit facility if such liabilities were to increase to the extent that the amount of outstanding borrowings and letters of credit would exceed the reduced availability under our revolving credit facility.
We have entered into cross-currency and interest rate swaps that represent economic hedges of our 83/4% senior notes, which are denominated in U.S. dollars. The current exchange rate between the Canadian and U.S. dollars as compared to the rate implicit in the swap agreement has resulted in a large liability on the balance sheet under the caption “derivative financial instruments.” If the Canadian dollar increases in value or remains at its current value against the U.S. dollar, then if we repay the 83/4% senior notes prior to their maturity in 2011, we will have to pay this liability.
Substantially all of our revenues and costs are incurred in Canadian dollars. However, the obligation represented by our 9% senior secured notes is denominated in U.S. dollars. If the Canadian dollar loses value against the U.S. dollar while other factors remain constant, our ability to pay interest and principal on these notes may be diminished.
Exchange rate fluctuations may also cause the price of goods to increase or decrease for us. For example, a decrease in the value of the Canadian dollar compared to the U.S. dollar would proportionately increase the cost of equipment which is sold to us or priced in U.S. dollars. Between January 1, 2006 and September 30, 2006, the Canadian dollar/U.S. dollar exchange rate varied from a high of 0.9100 Canadian dollars per U.S. dollar to a low of 0.8534 Canadian dollars per U.S. dollar.
| |
| If we are unable to obtain surety bonds or letters of credit required by some of our customers, our business could be impaired. |
We are at times required to post a bid or performance bond issued by a financial institution, known as a surety, to secure our performance commitments. The surety industry experiences periods of unsettled and
21
volatile markets, usually in the aftermath of substantial loss exposures or corporate bankruptcies with significant surety exposure. Historically, these types of events have caused reinsurers and sureties to reevaluate their committed levels of underwriting and required returns. If for any reason, whether because of our financial condition, our level of secured debt or general conditions in the surety bond market, our bonding capacity becomes insufficient to satisfy our future bonding requirements, our business and results of operations could be adversely affected.
Some of our customers require letters of credit to secure our performance commitments. Our revolving credit facility provides for the issuance of letters of credit up to $55.0 million, and at June 30, 2006, we had $18.0 million of issued letters of credit outstanding. One of our major contracts allows the customer to request up to $50.0 million in letters of credit. While this level has not been requested to date, we would either have to lower other letters of credit or cash collateralize other obligations to provide this amount of letters of credit. If we were unable to provide letters of credit in the amount requested by this customer, we could lose business from such customer and our business and cash flow would be adversely affected. In addition, the company that provides our surety bonds currently requires $10.0 million of security in the form of either letters of credit, cash collateralization or a combination thereof. If our capacity to issue letters of credit under our revolving credit facility and our cash on hand are insufficient to satisfy our customers and surety, our business and results of operations could be adversely affected.
| |
| A change in strategy by our customers to reduce outsourcing could adversely affect our results. |
Outsourced mining and site preparation services constitute a large portion of the work we perform for our customers. For example, our mining and site preparation project revenues constituted approximately 74% of our revenues in each of the fiscal years ended March 31, 2005 and March 31, 2006. The election by one or more of our customers to perform some or all of these services themselves, rather than outsourcing the work to us, could have a material adverse impact on our business and results of operations.
| |
| Our operations are subject to weather-related factors that may cause delays in our completion of projects. |
Because our operations are located in western Canada and northern Ontario, we are often subject to extreme weather conditions. While our operations are not significantly affected by normal seasonal weather patterns, extreme weather, including heavy rain and snow, can cause us to delay the completion of a project, which could adversely impact our results of operations.
| |
| We are dependent on our ability to lease equipment, and a tightening of this form of credit could adversely affect our ability to bid for new work and/or supply some of our existing contracts. |
A portion of our equipment fleet is currently leased from third parties. Further, we anticipate leasing substantial amounts of equipment to perform the work on contracts for which we have been engaged in the upcoming year, particularly the overburden removal contract with CNRL. Other projects on which we are engaged in the future may require us to lease additional equipment. If equipment lessors are unable or unwilling to provide us with the equipment we need to perform our work, our results of operations will be materially adversely affected.
| |
| Our business is highly competitive and competitors may outbid us on major projects that are awarded based on bid proposals. |
We compete with a broad range of companies in each of our markets. Many of these competitors are substantially larger than we are. In addition, we expect the anticipated growth in the oil sands region will attract new and sometimes larger competitors to enter the region and compete against us for projects. This increased competition may adversely affect our ability to be awarded new business.
Approximately 80% of the major projects that we pursue are awarded to us based on bid proposals, and projects are typically awarded based in large part on price. We often compete for these projects against companies that have substantially greater financial and other resources than we do and therefore
22
can better bear the risk of underpricing projects. We also compete against smaller competitors that may have lower overhead cost structures and, therefore, may be able to provide their services at lower rates than we can. Our business may be adversely impacted to the extent that we are unable to successfully bid against these companies. The loss of existing customers to our competitors or the failure to win new projects could materially and adversely affect our business and results of operations.
| |
| A significant amount of our revenue is generated by providing non-recurring services. |
More than 60% of our revenue for the year ended March 31, 2006 was derived from projects which we consider to be non-recurring. This revenue primarily relates to site preparation and piling services provided for the construction of extraction, upgrading and other oil sands mining infrastructure projects. Future revenues from these types of services will depend upon customers expanding existing mines and developing new projects.
| |
| Penalty clauses in our customer contracts could expose us to losses if total project costs exceed original estimates or if projects are not completed by specified completion date milestones. |
A portion of our revenue is derived from contracts which have performance incentives and penalties depending on the total cost of a project as compared to the original estimate. We could incur significant penalties based on cost overruns. In addition, the total project cost as defined in the contract may include not only our work, but also work performed by other contractors. As a result, we could incur penalties due to work performed by others over which we have no control. We may also incur penalties if projects are not completed by specified completion date milestones. These penalties, if incurred, could have a significant impact on our profitability under these contracts.
| |
| Demand for our services may be adversely impacted by regulations affecting the energy industry. |
Our principal customers are energy companies involved in the development of the oil sands and in natural gas production. The operations of these companies, including their mining operations in the oil sands, are subject to or impacted by a wide array of regulations in the jurisdictions where they operate, including those directly impacting mining activities and those indirectly affecting their businesses, such as applicable environmental laws. As a result of changes in regulations and laws relating to the energy production industry, including the operation of mines, our customers’ operations could be disrupted or curtailed by governmental authorities. The high cost of compliance with applicable regulations may cause customers to discontinue or limit their operations, and may discourage companies from continuing development activities. As a result, demand for our services could be substantially affected by regulations adversely impacting the energy industry.
| |
| Environmental laws and regulations may expose us to liability arising out of our operations or the operations of our customers. |
Our operations are subject to numerous environmental protection laws and regulations that are complex and stringent. We regularly perform work in and around sensitive environmental areas such as rivers, lakes and forests. Significant fines and penalties may be imposed on us or our customers for non-compliance with environmental laws and regulations, and our contracts generally require us to indemnify our customers for environmental claims suffered by them as a result of our actions. In addition, some environmental laws impose strict, joint and several liability for investigative and remediation costs in relation to releases of harmful substances. These laws may impose liability without regard to negligence or fault. We also may be subject to claims alleging personal injury or property damage if we cause the release of, or any exposure to, harmful substances.
We own or lease, and operate, several properties that have been used for a number of years for the storage and maintenance of equipment and other industrial uses. Fuel may have been spilled, or hydrocarbons or other wastes may have been released on these properties. Any release of substances by us or by third parties who previously operated on these properties may be subject to laws which impose joint
23
and several liability for clean-up, without regard to fault, on specific classes of persons who are considered to be responsible for the release of harmful substances into the environment.
| |
| Failure by our customers to obtain required permits and licenses may affect the demand for our services. |
The development of the oil sands requires our customers to obtain regulatory and other permits and licenses from various governmental licensing bodies. Our customers may not be able to obtain all necessary permits and licenses that may be required for the development of the oil sands on their properties. In such a case, our customers’ projects will not proceed, thereby adversely impacting demand for our services.
| |
| Our projects expose us to potential professional liability, product liability, warranty or other claims. |
We install deep foundations, often in congested and densely populated areas, and provide construction management services for significant projects. Notwithstanding the fact that we generally will not accept liability for consequential damages in our contracts, any catastrophic occurrence in excess of insurance limits at projects where our structures are installed or services are performed could result in significant professional liability, product liability, warranty or other claims against us. Such liabilities could potentially exceed our current insurance coverage and the fees we derive from those services. A partially or completely uninsured claim, if successful and of a significant magnitude, could result in substantial losses.
| |
| We may not be able to achieve the expected benefits from any future acquisitions, which would adversely affect our financial condition and results of operations. |
We intend to pursue selective acquisitions as a method of expanding our business. However, we may not be able to identify or successfully bid on businesses that we might find attractive. If we do find attractive acquisition opportunities, we might not be able to acquire these businesses at a reasonable price. If we do acquire other businesses, we might not be able to successfully integrate these businesses into our then-existing business. We might not be able to maintain the levels of operating efficiency that acquired companies will have achieved or might achieve separately. Successful integration of acquired operations will depend upon our ability to manage those operations and to eliminate redundant and excess costs. Because of difficulties in combining operations, we may not be able to achieve the cost savings and other size-related benefits that we hoped to achieve after these acquisitions. Any of these factors could harm our financial condition and results of operations.
| |
| Aboriginal peoples may make claims against our customers or their projects regarding the lands on which their projects are located. |
Aboriginal peoples have claimed aboriginal title and rights to a substantial portion of western Canada. Any claims that may be asserted against our customers, if successful, could have an adverse effect on our customers which may, in turn, negatively impact our business.
| |
| Unanticipated short term shutdowns of our customers’ operating facilities may result in temporary cessation or cancellation of projects in which we are participating. |
The majority of our work is generated from the development, expansion and ongoing maintenance of oil sands mining, extraction and upgrading facilities. Unplanned shutdowns of these facilities due to events outside our control or the control of our customers, such as fires, mechanical breakdowns and technology failures, could lead to the temporary shutdown or complete cessation of projects in which we are working. When these events have happened in the past, our business has been adversely affected. Our ability to maintain revenues and margins may be affected to the extent these events cause reductions in the utilization of equipment.
24
| |
| Many of our senior officers have either recently joined the company or have just been promoted and have only worked together as a management team for a short period of time. |
We recently made several significant changes to our senior management team. In May 2005, we hired a new Chief Executive Officer and promoted our Vice President, Operations to Chief Operating Officer. In January 2005 we hired a new Treasurer, who is now our Vice President, Supply Chain. In June 2006, we hired a new Vice President, Human Resources, Health, Safety and Environment. In September 2006, we hired a new Chief Financial Officer. As a result of these and other recent changes in senior management, many of our officers have only worked together as a management team for a short period of time and do not have a long history with us. Because our senior management team is responsible for the management of our business and operations, failure to successfully integrate our senior management team could have an adverse impact on our business, financial condition and results of operations.
| |
| We will incur significantly higher costs as a result of being a public company. |
As a public company, we will incur significantly higher legal, accounting and other expenses than we did as a private company. In addition, the Sarbanes-Oxley Act of 2002, as well as similar or related rules adopted by the SEC, Canadian securities regulatory authorities and the U.S. and Canadian stock exchanges on which we may list our common shares, have imposed substantial requirements on public companies, including requiring changes in corporate governance practices and requirements relating to internal control over financial reporting under Section 404 of the Sarbanes-Oxley Act. We expect these rules and regulations to increase our legal and financial compliance costs and to make some activities more time-consuming and costly.
Risks Related to Our Common Shares and This Offering
| |
| If you purchase common shares in this offering, you will experience immediate dilution in the net tangible book value per share and could experience further dilution as a result of any additional share issuances, such as under our share option plan. |
The initial public offering price of our common shares is substantially higher than the net tangible book value per share of the common shares that will be issued. Accordingly, if you purchase common shares in this offering, at an assumed initial public offering price of US$ , or C$ , per share (the midpoint of the range set forth on the cover of this prospectus), you will incur immediate dilution of approximately US$ , or C$ , respectively, in the pro forma net tangible book value per common share. This means that investors who purchase shares will pay a price per share that exceeds the book value of our net tangible assets after subtracting our liabilities. See “Dilution.”
Moreover, each person purchasing common shares in this offering will experience further dilution to the extent that additional common shares are issued, such as upon exercise of options granted under our 2004 share option plan.
| |
| There has been no active trading market for our common shares, and an active trading market for the common shares may not develop. |
Prior to this offering, there has not been a public market for our common shares. We cannot predict the extent to which investor interest in our company will lead to the development of an active trading market on a United States or Canadian stock exchange or otherwise or how liquid that market might become. If an active market does not develop, it will affect your ability to sell our common shares that you buy and the market price of the shares.
The offering price for the common shares being sold in this offering will be determined by negotiations between the underwriters and us and does not purport to be indicative of prices that will prevail in the market for our common shares following this offering.
25
| |
| | Fluctuations in the value of the Canadian and U.S. dollars can affect the value of our common shares and future dividends, if any. |
Our operations and our principal executive offices are in Canada. Accordingly, we report our results in Canadian dollars. If you are a U.S. shareholder, the value of your investment in us will fluctuate as the U.S. dollar rises and falls against the Canadian dollar. Also, if we pay dividends in the future, we will pay those dividends in Canadian dollars. Accordingly, if the U.S. dollar rises in value relative to the Canadian dollar, the U.S. dollar value of the dividend payments received by a U.S. common shareholder would be less than they would have been if exchange rates were stable.
| |
| If our share price fluctuates after this offering, you could lose a significant part of your investment. |
There has been significant volatility in the market price and trading volume of equity securities, which is unrelated to the financial performance of the companies issuing the securities. The market price of our common shares is likely to be similarly volatile, and you may not be able to resell your shares at or above the offering price due to fluctuations in the market price of our common shares, including changes in price caused by factors unrelated to our operating performance or prospects.
Specific factors that may have a significant effect on the market price for our common shares include:
| | |
| | • | changes in projections as to the level of capital spending in the oil sands region; |
| |
| | • | changes in stock market analyst recommendations or earnings estimates regarding our common shares, other comparable companies or the construction or oil and gas industries generally; |
| |
| | • | actual or anticipated fluctuations in our operating results or future prospects; |
| |
| | • | reaction to our public announcements; |
| |
| | • | strategic actions taken by us or our competitors, such as acquisitions or restructurings; |
| |
| | • | new laws or regulations or new interpretations of existing laws or regulations applicable to our business and operations; |
| |
| | • | changes in accounting standards, policies, guidance, interpretations or principles; |
| |
| | • | adverse conditions in the financial markets or general economic conditions, including those resulting from war, incidents of terrorism and responses to such events; |
| |
| | • | sales of common shares by us, members of our management team or our existing shareholders; and |
| |
| | • | the extent of analysts’ interest in following our company. |
| |
| Future sales, or the perception of future sales, of a substantial amount of our common shares may depress the price of our common shares. |
Future sales, or the perception of the availability for sale, of substantial amounts of our common shares could adversely affect the prevailing market price of our common shares and could impair our ability to raise capital through future sales of equity securities at a time and price that we deem appropriate.
We, our executive officers and directors, the selling shareholders and certain other principal shareholders have agreed, subject to certain exceptions, that neither we nor they will offer, sell, contract to sell, pledge or otherwise dispose of, directly or indirectly, or file with the SEC or the securities regulatory authorities in Canada, a registration statement or prospectus under applicable securities legislation, relating to any of our common shares or securities convertible into or exchangeable or exercisable for any of our common shares, or publicly disclose the intention to make any offer, sale, pledge, disposition or filing without the prior consent of Credit Suisse Securities (USA) LLC and UBS Securities LLC for 180 days after the date of this prospectus, subject under certain circumstances to extension. See “Underwriting.” Following the expiration of thislock-up period, all of the common shares owned by our existing investors
26
that will not be sold in this offering will be eligible for future sale pursuant to Rule 144 (in the case of sales in the United States), subject to the applicable volume, manner of sale, holding period and other limitations of that rule and pursuant to National Instrument45-102, Resale of Securities (in the case of sales in Canada), subject to fulfilling the procedural requirements of that instrument. In addition, our existing equity investors have registration rights with respect to their common shares that they will retain following this offering. See “Shares Eligible for Future Sale” for a discussion of the common shares that may be sold into the public market in the future.
We may issue our common shares or convertible securities from time to time as consideration for future acquisitions and investments. In the event any such acquisition or investment is significant, the number of common shares or convertible securities that we may issue could be significant. We may also grant registration rights covering those shares or convertible securities in connection with any such acquisitions and investments. Any additional capital raised through the sale of our common shares or securities convertible into our common shares will dilute your percentage ownership in us.
| |
| | We currently do not intend to pay cash dividends on our common shares, and our ability to pay dividends is limited by our debt agreements, our subsidiaries’ ability to distribute funds to us and Canadian law. |
We have never paid cash dividends on our common shares. It is our present intention to retain all future earnings for use in our business, and we do not expect to pay cash dividends on the common shares in the foreseeable future. Any future determination to pay cash dividends will be at the discretion of our board of directors and will depend on our results of operations, financial condition, current and anticipated cash needs, contractual restrictions, restrictions imposed by applicable law and other factors that our board of directors considers relevant. Our ability to declare dividends is restricted by the terms of our revolving credit facility and the indentures that govern our notes. See “Description of Certain Indebtedness.”
Substantially all of the assets shown on our consolidated balance sheet are held by our subsidiaries. Accordingly, our earnings and cash flow and our ability to pay dividends are largely dependent upon the earnings and cash flows of our subsidiaries and the distribution or other payment of such earnings to us in the form of dividends.
Our ability to pay dividends is also subject to the satisfaction of a statutory solvency test under Canadian law, which requires that there be no reasonable grounds for believing that (1) we are, or would after the payment be, unable to pay our liabilities as they become due or (2) the realizable value of our assets would, after payment of the dividend, be less than the aggregate of our liabilities and stated capital of all classes.
| |
| Our principal shareholders are in a position to affect our ongoing operations, corporate transactions and other matters, and their interests may conflict with or differ from your interests as a shareholder. |
Upon the consummation of the Reorganization and this offering, investment entities controlled by The Sterling Group, L.P., Genstar Capital, L.P., Perry Strategic Capital Inc. and SF Holding Corp. (formerly Stephens Group, Inc.), whom we collectively refer to as the sponsors, will collectively own approximately % of our common shares (approximately % of our common shares if the underwriters’ over-allotment option is exercised in full). As a result, the sponsors and their affiliates effectively will be able to control the outcome of most matters submitted to a vote of our shareholders, including the election of members of our board of directors.
Regardless of whether the sponsors maintain a controlling interest in our common shares, so long as a designated affiliate of each sponsor holds our common shares, such sponsor will have certain rights, including the right to obtain copies of financial data and other information regarding us, the right to consult with and advise our management and the right to visit and inspect any of our properties and facilities. See “Related Party Transactions — Voting and Corporate Governance Agreement — Termination.”
27
For so long as the sponsors own a significant percentage of our outstanding common shares, even if less than a majority, the sponsors will be able to control or exercise a controlling influence over our business and affairs, including the incurrence of indebtedness by us, the issuance of any additional common shares or other equity securities, the repurchase of common shares and the payment of dividends, if any, and will have the power to determine or significantly influence the outcome of matters submitted to a vote of our shareholders, including election of directors, mergers, consolidations, sales or dispositions of assets, other business combinations and amendments to our articles of incorporation. The interests of the sponsors and their affiliates may not coincide with the interests of our other shareholders. In particular, the sponsors and their affiliates are in the business of making investments in companies and they may, from time to time, acquire and hold interests in businesses that compete directly or indirectly with us. The sponsors and their affiliates may also pursue, for their own account, acquisition opportunities that may be complementary to our business, and as a result, those acquisition opportunities may not be available to us. So long as the sponsors and their affiliates continue to own a significant portion of the outstanding common shares, they will continue to be able to significantly influence or effectively control our decisions.
| |
| We are a holding company and rely on our subsidiaries for our operating funds, and our subsidiaries have no obligation to supply us with any funds. |
We are a holding company with no operations of our own. We conduct our operations through subsidiaries and are dependent upon our subsidiaries for the funds we need to operate. Each of our subsidiaries is a distinct legal entity and has no obligation to transfer funds to us. The ability of our subsidiaries to transfer funds to us could be restricted by the terms of our financings. The payment of dividends to us by our subsidiaries is subject to legal restrictions as well as various business considerations and contractual provisions, which may restrict the payment of dividends and distributions and the transfer of assets to us.
| |
| You may be unable to enforce actions against us and certain of our directors and officers and others named in this prospectus under U.S. federal securities laws. |
We are a corporation incorporated under the Canada Business Corporations Act. Consequently, we are and will be governed by all applicable provincial and federal laws of Canada. Several of our directors and officers and others named in this prospectus reside principally in Canada. Because these persons are located outside the United States, it may not be possible for you to effect service of process within the United States upon those persons. Furthermore, it may not be possible for you to enforce against us or them, in or outside the United States, judgments obtained in U.S. courts, because substantially all of our assets and the assets of these persons are located outside the United States. We have been advised that there is doubt as to the enforceability, in original actions in Canadian courts, of liabilities based upon the U.S. federal securities laws and as to the enforceability in Canadian courts of judgments of U.S. courts obtained in actions based upon the civil liability provisions of the U.S. federal securities laws. Therefore, it may not be possible to enforce those actions against us, our directors and officers or other persons named in this prospectus.
28
CAUTIONARY NOTE REGARDING FORWARD-LOOKING STATEMENTS
This prospectus contains forward-looking statements within the meaning of the United States federal securities laws and securities legislation in the provinces and territories of Canada. Statements that are not historical facts, including statements about activities, events or developments that we or a third party expect, believe or anticipate will occur in the future, are forward-looking statements. Forward-looking statements include statements preceded by, followed by or that include the words “may,” “could,” “would,” “should,” “believe,” “expect,” “anticipate,” “plan,” “estimate,” “target,” “project,” “intend,” “continue,” “further” or similar expressions. These statements include, among others, statements regarding our expected business outlook, anticipated financial and operating results, our business strategy and means to implement the strategy, our objectives, the amount and timing of capital expenditures, the likelihood of our success in expanding our business, financing plans, budgets, working capital needs and sources of liquidity.
Forward-looking statements are only predictions and are not guarantees of performance. These statements are based on beliefs and assumptions, which in turn are based on currently available information. Important assumptions relating to the forward-looking statements include, among others, assumptions regarding demand for our services, the expansion of our business, the timing and cost of planned capital expenditures, competitive conditions and general economic conditions. These assumptions could prove inaccurate. Forward-looking statements also involve risks and uncertainties, which could cause actual results to differ materially from those contained in any forward-looking statement. Many of these risks and uncertainties are beyond our ability to control or predict and the occurrence of any such risk or uncertainty could be material. These factors include, but are not limited to, the following:
| | |
| | • | the timing and success of business development efforts; |
| |
| | • | changes in oil and gas prices; |
| |
| | • | our ability to hire and retain a skilled labor force; |
| |
| | • | our ability to bid successfully on new projects and accurately forecast costs associated with unit-price or lump sum contracts; |
| |
| | • | our ability to establish and maintain effective internal controls; |
| |
| | • | our substantial debt, which could make us more vulnerable to adverse economic conditions and affect our ability to comply with the terms of the agreements governing our indebtedness; |
| |
| | • | restrictive covenants in our debt agreements, which may restrict the manner in which we operate our business; |
| |
| | • | foreign currency exchange rate fluctuations, capital markets conditions and inflation rates; |
| |
| | • | weather conditions; |
| |
| | • | our ability to obtain surety bonds as required by some of our customers; |
| |
| | • | decreases in outsourcing work by our customers or shut-downs or cutbacks at major businesses that use our services; |
| |
| | • | our ability to purchase or lease equipment; |
| |
| | • | changes in laws or regulations, third party relations and approvals, and decisions of courts, regulators and governmental bodies that may adversely affect our business or the business of the customers we serve; |
29
| | |
| | • | our ability to successfully identify and acquire new businesses and assets and integrate them into our existing operations; and |
| |
| | • | those other factors discussed in the section entitled “Risk Factors.” |
The foregoing list should not be construed to be exhaustive. We believe the forward-looking statements in this prospectus are reasonable; however, there is no assurance that the actions, events or results of the forward-looking statements will occur or, if any of them do, what impact they will have on our results of operations or financial condition. In view of these uncertainties, you should not place undue reliance on any forward-looking statements, which are based on our current expectations. Further, forward-looking statements speak only as of the date they are made, and, other than as required by applicable law, we undertake no obligation to update publicly any of them in light of new information or future events.
30
USE OF PROCEEDS
We estimate that our proceeds from this offering, after deducting underwriting discounts and commissions and estimated offering expenses payable by us, will be approximately US$158.8 million, or C$176.4 million, assuming the shares are offered at US$ , or C$ , per share, respectively, which is the midpoint of the estimated offering price range set forth on the cover page of this prospectus. A $1.00 increase or decrease in the assumed initial public offering price per share would increase or decrease the net proceeds to us by approximately $ million. We will not receive any proceeds from the sale of shares by the selling shareholders.
We intend to use the net proceeds of this offering as follows:
| | |
|
| | • | approximately $45.0 million to purchase certain equipment currently under operating leases, including prepayment penalties, |
|
| |
|
| | • | approximately $76.3 million to repurchase all of our outstanding 9% senior secured notes due 2010, which notes were used for refinancing bank indebtedness, related fees and expenses and for general corporate purposes, |
|
| |
|
| | • | $27.0 million to acquire all of the outstanding Seller preferred shares, and |
|
| |
| | • | with the balance available for general corporate purposes, including working capital, capital expenditures and potential acquisitions. While we currently have no agreements for the acquisition of any material business or assets, we regularly evaluate potential acquisitions and may effect them quickly and at any time. |
As noted above, we intend to use a portion of the proceeds from this offering to repurchase our 9% senior secured notes due 2010. We will incur a pre-tax charge in the fiscal period that the tender offer is consummated of approximately $11.2 million, representing the tender offer premium and the write-off of debt issuance costs associated with these notes. In addition, upon consummation of this offering, we have agreed to pay the sponsors $2.0 million to terminate our advisory services agreement, which will also represent a charge in a like amount. See “Related Party Transactions — Advisory Services Agreement.”
DIVIDEND POLICY
We have not declared or paid any dividends on our common shares since our inception on October 17, 2003, and we do not anticipate declaring or paying any dividends on our common shares for the foreseeable future. We currently intend to retain any future earnings to finance future growth. Any future determination to pay dividends will be at the discretion of our board of directors and will depend on our financial condition, results of operations, capital requirements and other factors the board of directors considers relevant. In addition, our ability to declare and pay dividends is restricted by our governing statute, as well as the terms our revolving credit facility and the indentures that govern our notes. See “Description of Certain Indebtedness.”
31
CAPITALIZATION
The following table sets forth our cash and consolidated capitalization as of June 30, 2006 (unaudited):
| | |
| | • | on an actual basis; |
| |
| | • | as adjusted on a pro forma basis to give effect to the Reorganization; and |
| |
| | • | as further adjusted on a pro forma basis to give effect to this offering and the use of proceeds therefrom, assuming the shares are offered at US$ , or C$ , per share, which is the midpoint of the estimated offering price range set forth on the cover page of this prospectus. |
The following table should be read in conjunction with, and is qualified in its entirety by reference to, the information under the sections entitled “Use of Proceeds,” “Management’s Discussion and Analysis of Financial Condition and Results of Operations,” “Unaudited Pro Forma Financial Information” and “Description of Share Capital” and our consolidated financial statements and the notes thereto included elsewhere in this prospectus.
| | | | | | | | | | | | | | | | |
| | | June 30, 2006 | |
| | | | |
| | | | | Pro Forma for the | |
| | | | | Pro Forma | | | Reorganization | |
| | | | | for the | | | and the | |
| | | Actual | | | Reorganization | | | Offering(a) | |
| | | | | | | | | | |
| | | (In thousands) | |
| Cash and cash equivalents | | $ | 45,093 | | | $ | 44,093 | | | $ | 70,220 | |
| | | | | | | | | | |
| Total debt (including current portion): | | | | | | | | | | | | |
| | Revolving credit facility(b) | | $ | — | | | $ | — | | | $ | — | |
| | Obligations under capital leases | | | 11,937 | | | | 11,937 | | | | 11,937 | |
| | 9% senior secured notes due 2010 | | | 67,436 | | | | 67,436 | | | | — | |
| | 83/4% senior notes due 2011(c) | | | 223,000 | | | | 223,000 | | | | 223,000 | |
| | | | | | | | | | |
| | | Total debt, including current portion | | | 302,373 | | | | 302,373 | | | | 234,937 | |
| Derivative financial instruments | | | 71,030 | | | | 71,030 | | | | 71,030 | |
| Redeemable preferred shares: | | | | | | | | | | | | |
| | Seller preferred shares | | | 35,000 | | | | — | | | | — | |
| | Series A preferred shares | | | 391 | | | | — | | | | — | |
| | Series B preferred shares | | | 43,122 | | | | — | | | | — | |
| | | | | | | | | | |
| | | Total redeemable preferred shares | | | 78,513 | | | | — | | | | — | |
| Shareholders’ equity(d): | | | | | | | | | | | | |
| | Common shares | | | 93,100 | | | | 136,221 | | | | 318,160 | (e) |
| | Contributed surplus | | | 1,869 | | | | 1,869 | | | | 1,869 | |
| | Deficit | | | (58,652 | ) | | | (50,561 | ) | | | (61,268 | ) |
| | | | | | | | | | |
| | | Total shareholders’ equity | | | 36,317 | | | | 87,529 | | | | 258,761 | |
| | | | | | | | | | |
| | | | Total capitalization | | $ | 533,326 | | | $ | 505,025 | | | $ | 634,948 | |
| | | | | | | | | | |
| | |
| (a) | | A $1.00 increase or decrease in the assumed initial public offering price per share would increase or decrease each of cash, share capital, total shareholders’ equity and total capitalization by $ million, assuming the number of shares offered by us, as set forth on the cover page of this prospectus, remains the same and after deducting the estimated underwriting discounts and estimated offering expenses payable by us. |
| |
| (b) | | We entered into an amended and restated credit agreement dated as of July 19, 2006 to provide for borrowings and letters of credit in an aggregate amount of $55.0 million. As of July 20, 2006, we had approximately $37.0 million of available borrowings under the revolving credit facility after taking into account $18.0 million of outstanding and undrawn letters of credit. See “Description of Certain Indebtedness – Revolving Credit Facility.” |
| |
|
| (c) | | Our 83/4 senior notes are reflected at the current exchange rate as of June 30, 2006. We have entered into cross-currency and interest rate swaps, which represent an economic hedge of the 83/4% senior notes. At maturity, we will be required to pay $263.0 million (compared to $294.0 million at June 30, 2006) in order to retire these senior notes and the swaps. This amount reflects the fixed exchange rate of C$1.315 = US$1.00 established as of November 26, 2003, the inception of the swap contracts. |
|
| |
|
| (d) | | This table does not reflect 111,542 common shares issuable upon exercise of outstanding stock options under our existing stock option plan as of September 30, 2006. |
|
| |
|
| (e) | | Assumes we receive net proceeds from this offering of approximately US$158.8 million, or C$176.4 million. |
|
32
DILUTION
If you invest in our common shares, your interest will be diluted to the extent of the difference between the public offering price per common share and the as adjusted net tangible book value per common share after this offering. Dilution results from the fact that the per share offering price of the common shares is in excess of the net tangible book value per share attributable to our existing shareholders for the presently outstanding common shares.
Our net tangible book value as of June 30, 2006 was approximately $ million, or $ per common share. Net tangible book value per share is determined by dividing our tangible shareholders’ equity, which is total tangible assets less total liabilities, by the aggregate number of common shares outstanding. Tangible assets represent total assets excluding goodwill and other intangible assets.
After giving effect to the Reorganization, our sale of common shares in this offering at an assumed offering price of US$ , or C$ , per share (which is the midpoint of the estimated offering price range set forth on the cover page of this prospectus) and the application of the proceeds from this offering as described under “Use of Proceeds,” as adjusted net tangible book value (deficiency) as of June 30, 2006 would have been $ million, or $ per share. This represents an immediate increase in as adjusted net tangible book value of $ per share to our existing shareholders and an immediate dilution of $ per share to new investors purchasing common shares in this offering.
The following table illustrates this dilution on a per share basis:
| | | | | | | | | | |
| Assumed initial public offering price per share | | | | | | $ | | |
| |
| | Net tangible book value (deficiency) per share as of June 30, 2006 | | $ | | | | | | |
| |
| | Increase in pro forma net tangible book value per share attributable to the offering | | | | | | | | |
| | | | | | | |
| |
| Pro forma net tangible book value per share after the offering | | | | | | | | |
| | | | | | | |
| |
| Dilution in net tangible book value per share to new investors | | | | | | $ | | |
| | | | | | | |
A $1.00 increase or decrease in the assumed initial public offering price per share would increase or decrease our net tangible book value after the offering by $ and increase or decrease the dilution to new investors by $ , assuming the number of shares offered by us, as set forth on the cover page of this prospectus, remains the same and after deducting the estimated underwriting discounts and estimated offering expenses payable by us.
The following table summarizes, on the same pro forma as adjusted basis as of June 30, 2006, the total number of common shares purchased from us or the selling shareholders, the total consideration paid and the average price per share paid by the existing shareholders and by new investors purchasing shares in this offering:
| | | | | | | | | | | | | | | | | | | | | |
| | | Shares Purchased | | | Total Consideration | | | |
| | | | | | | | | Average Price | |
| | | Number | | | Percent | | | Amount | | | Percent | | | Per Share | |
| | | | | | | | | | | | | | | | |
| Existing shareholders | | | | | | | % | | | $ | | | | | % | | | $ | | |
| New investors | | | | | | | | | | | | | | | | | | | | |
| | | | | | | | | | | | | | | | |
| Total | | | | | | | 100.0% | | | $ | | | | | 100.0% | | | | | |
| | | | | | | | | | | | | | | | |
33
THE REORGANIZATION
The following chart depicts our organizational structure prior to the consummation of the transactions described below and this offering.
| |
| (1) | See the list of our subsidiaries under “Business — Subsidiaries.” |
Concurrently with the consummation of this offering, each of NACG Holdings Inc., NACG Preferred Corp. and North American Energy Partners Inc. propose to amalgamate into one entity, North American Energy Partners Inc. An amalgamation under Canadian law is similar to a merger under U.S. law in that it involves combining two or more corporations together. In a merger, there is one surviving corporation into which one or more corporations merge and the surviving corporation, in addition to continuing to own its assets and being subject to its obligations, will effectively assume the assets and obligations of the corporations which merged into the surviving corporation. Under an amalgamation, the corporation resulting from the amalgamation, in this case the amalgamated North American Energy Partners Inc., although not referred to as a surviving corporation under Canadian law, will also own all the assets of and assume all of the obligations of each of the amalgamating entities. The share capital of North American Energy Partners Inc. after the amalgamation will consist of common shares and non-voting common shares. Prior to the amalgamation, our common shares will undergo a -for- split.
Prior to the amalgamation, the Series A preferred shares issued by the pre-amalgamated North American Energy Partners Inc. will be purchased by us for its redemption value of $1.0 million of cash. Each holder of Series B preferred shares issued by the pre-amalgamated North American Energy Partners Inc. will receive five NACG Holdings Inc. common shares for each Series B preferred share held (such number of common shares to be adjusted according to the share split described above). Immediately prior to the amalgamation, the Seller preferred shares will be acquired by NACG Holdings Inc. for a $27.0 million promissory note issued to the holders of such shares. The Seller preferred shares will be cancelled as part of the Reorganization and we will repay the promissory note immediately after the offering with proceeds from the offering. Subsequent to the amalgamation, existing common and non-voting common shareholders of NACG Holdings Inc. will hold common and non-voting common shares of the amalgamated North American Energy Partners Inc. Any outstanding options under our 2004 share option plan will become options to purchase common shares of the amalgamated North American Energy Partners Inc., and the number and exercise price of such options will be adjusted according to the share split described above.
The above transactions are referred to collectively as the “Reorganization.” The voting common shares of North American Energy Partners Inc. after giving effect to the Reorganization are the shares being offered hereby.
34
The following depicts our organizational structure after the Reorganization and this offering:
| |
| (1) | See the list of our subsidiaries under “Business — Subsidiaries.” |
This offering is contingent upon completion of the Reorganization.
35
SELECTED HISTORICAL FINANCIAL DATA
We were initially formed in October 2003 in connection with the Acquisition on November 26, 2003. See “Business — Our History.” As a result, the selected historical consolidated financial data presented below as of and for each of the fiscal years ended March 31, 2002 and 2003 and for the period from April 1, 2003 to November 25, 2003 is derived from the audited consolidated financial statements of Norama Ltd., our predecessor. The financial statements of Norama Ltd. for the period from April 1, 2003 to November 25, 2003 are included elsewhere in this prospectus. The selected historical consolidated financial data presented below for the period from November 26, 2003 to March 31, 2004 and as of and for each of the fiscal years ended March 31, 2005 and 2006 is derived from our audited consolidated financial statements included elsewhere in this prospectus. The selected historical consolidated financial data for the three months ended June 30, 2005 and as of and for the three months ended June 30, 2006 is derived from our unaudited consolidated financial statements included elsewhere in this prospectus. As a result of the Acquisition, the consolidated financial data for the periods before November 26, 2003 is not necessarily comparable to the consolidated financial data for periods after November 25, 2003. The selected historical consolidated financial data for the three months ended June 30, 2006 is not necessarily indicative of the results that may be expected for ensuing fiscal quarters or for the full fiscal year ending March 31, 2007.
The information presented below should be read in conjunction with “Management’s Discussion and Analysis of Financial Condition and Results of Operations” and our audited and unaudited consolidated financial statements and related notes included elsewhere in this prospectus. All of the financial information presented below has been prepared in accordance with Canadian GAAP, which differs in certain significant respects from U.S. GAAP. For a discussion of the principal differences between Canadian GAAP and U.S. GAAP as they pertain to us, see note 23 to our consolidated financial statements included elsewhere in this prospectus.
| | | | | | | | | | | | | | | | | | | | | | | | | | | | | | | | | | | |
| | | Predecessor | | | | | | | | | | | | |
| | | | | | | | | | | | | |
| | | | | | | | | | | | Three Months | |
| | | Year Ended | | | April 1, 2003 | | | | November 26, | | | Year Ended | | | Ended | |
| | | March 31, | | | to | | | | 2003 to | | | March 31, | | | June 30, | |
| | | | | | November 25, | | | | March 31, | | | | | | | |
| | | 2002(a) | | | 2003(a) | | | 2003(a) | | | | 2004 | | | 2005 | | | 2006 | | | 2005 | | | 2006 | |
| | | | | | | | | | | | | | | | | | | | | | | | | | |
| | | | | | | | | | | | | | | | (Unaudited) | |
| | | (Dollars in thousands, except per share amounts) | |
Statement of operations data: | | | | | | | | | | | | | | | | | | | | | | | | | | | | | | | | | |
| Revenue(b) | | $ | 249,351 | | | $ | 344,186 | | | $ | 250,652 | | | | $ | 127,611 | | | $ | 357,323 | | | $ | 492,237 | | | $ | 104,359 | | | $ | 138,100 | |
| | Project costs | | | 127,996 | | | | 219,979 | | | | 156,976 | | | | | 83,256 | | | | 240,919 | | | | 308,949 | | | | 66,546 | | | | 67,009 | |
| | Equipment costs | | | 56,693 | | | | 55,871 | | | | 43,484 | | | | | 13,686 | | | | 52,831 | | | | 64,832 | | | | 17,014 | | | | 23,935 | |
| | Equipment operating lease expense | | | 20,596 | | | | 16,357 | | | | 10,502 | | | | | 1,430 | | | | 6,645 | | | | 16,405 | | | | 2,898 | | | | 7,200 | |
| | Depreciation | | | 11,299 | | | | 10,974 | | | | 6,566 | | | | | 6,674 | | | | 20,762 | | | | 21,725 | | | | 4,989 | | | | 7,312 | |
| | | | | | | | | | | | | | | | | | | | | | | | | | |
| Gross profit | | | 32,767 | | | | 41,005 | | | | 33,124 | | | | | 22,565 | | | | 36,166 | | | | 80,326 | | | | 12,912 | | | | 32,644 | |
| | General and administrative | | | 12,794 | | | | 12,233 | | | | 7,783 | | | | | 6,065 | | | | 22,873 | | | | 30,903 | | | | 7,250 | | | | 9,235 | |
| | Gain (loss) on disposal of plant and equipment | | | (218 | ) | | | (2,265 | ) | | | (49 | ) | | | | 131 | | | | 494 | | | | (733 | ) | | | 272 | | | | 113 | |
| | Amortization of intangible assets | | | — | | | | — | | | | — | | | | | 12,928 | | | | 3,368 | | | | 730 | | | | 183 | | | | 183 | |
| | | | | | | | | | | | | | | | | | | | | | | | | | |
| Operating income | | | 20,191 | | | | 31,037 | | | | 25,390 | | | | | 3,441 | | | | 9,431 | | | | 49,426 | | | | 5,207 | | | | 23,113 | |
| | Management fee(c) | | | 14,400 | | | | 8,000 | | | | 41,070 | | | | | — | | | | — | | | | — | | | | — | | | | — | |
| | Interest expense(d) | | | 3,510 | | | | 4,162 | | | | 2,457 | | | | | 10,079 | | | | 31,141 | | | | 68,776 | | | | 49,863 | | | | 10,168 | |
| | Foreign exchange (gain) loss | | | (17 | ) | | | (234 | ) | | | (7 | ) | | | | (661 | ) | | | (19,815 | ) | | | (13,953 | ) | | | 1,221 | | | | (13,466 | ) |
| | Other (income) expense | | | — | | | | — | | | | (367 | ) | | | | (230 | ) | | | (421 | ) | | | 1,118 | | | | 1,895 | | | | (583 | ) |
| | Realized and unrealized loss on derivative financial instruments | | | — | | | | — | | | | — | | | | | 12,205 | | | | 43,113 | | | | 14,689 | | | | 1,282 | | | | 7,996 | |
| | | | | | | | | | | | | | | | | | | | | | | | | | |
| Income (loss) before income taxes | | | 2,298 | | | | 19,109 | | | | (17,763 | ) | | | | (17,952 | ) | | | (44,587 | ) | | | (21,204 | ) | | | (49,054 | ) | | | 18,998 | |
| | Income taxes (benefit) | | | 689 | | | | 6,620 | | | | (6,622 | ) | | | | (5,670 | ) | | | (2,264 | ) | | | 737 | | | | 150 | | | | 1,104 | |
| | | | | | | | | | | | | | | | | | | | | | | | | | |
| Net income (loss)(e) | | $ | 1,609 | | | $ | 12,489 | | | $ | (11,141 | ) | | | $ | (12,282 | ) | | $ | (42,323 | ) | | $ | (21,941 | ) | | $ | (49,204 | ) | | $ | 17,894 | |
| | | | | | | | | | | | | | | | | | | | | | | | | | |
Net income (loss) per share data: | | | | | | | | | | | | | | | | | | | | | | | | | | | | | | | | | |
| Net income (loss) per share: | | | | | | | | | | | | | | | | | | | | | | | | | | | | | | | | | |
| | Basic | | | | | | | | | | | | | | | $ | (13.28 | ) | | $ | (45.66 | ) | | $ | (23.62 | ) | | $ | (53.02 | ) | | $ | 19.22 | |
| | Diluted | | | | | | | | | | | | | | | | (13.28 | ) | | | (45.66 | ) | | | (23.62 | ) | | | (53.02 | ) | | | 14.16 | |
| Weighted average shares: | | | | | | | | | | | | | | | | | | | | | | | | | | | | | | | | | |
| | Basic | | | | | | | | | | | | | | | | 925,000 | | | | 926,986 | | | | 928,740 | | | | 928,000 | | | | 931,000 | |
| | Diluted | | | | | | | | | | | | | | | | 925,000 | | | | 926,986 | | | | 928,740 | | | | 928,000 | | | | 1,307,780 | |
36
| | | | | | | | | | | | | | | | | | | | | | | | | | | | | | | | | | |
| | | Predecessor | | | | | | | | | | | | |
| | | | | | | | | | | | | |
| | | | | | | | | | | | Three Months | |
| | | Year Ended | | | April 1, 2003 | | | | November 26, | | | Year Ended | | | Ended | |
| | | March 31, | | | to | | | | 2003 to | | | March 31, | | | June 30, | |
| | | | | | November 25, | | | | March 31, | | | | | | | |
| | | 2002(a) | | | 2003(a) | | | 2003(a) | | | | 2004 | | | 2005 | | | 2006 | | | 2005 | | | 2006 | |
| | | | | | | | | | | | | | | | | | | | | | | | | | |
| | | | | | | | | | | | | | | | (Unaudited) | |
| | | (Dollars in thousands, except per share amounts) | |
Balance sheet data (end of period): | | | | | | | | | | | | | | | | | | | | | | | | | | | | | | | | | |
| Cash | | $ | 436 | | | $ | 651 | | | | | | | | $ | 36,595 | | | $ | 17,924 | | | $ | 42,804 | | | | | | | $ | 45,093 | |
| Plant and equipment, net | | | 56,759 | | | | 76,234 | | | | | | | | | 167,905 | | | | 177,089 | | | | 185,566 | | | | | | | | 191,269 | |
| Total assets | | | 120,431 | | | | 158,584 | | | | | | | | | 489,974 | | | | 540,155 | | | | 587,011 | | | | | | | | 598,332 | |
| Total debt(f) | | | 50,139 | | | | 63,401 | | | | | | | | | 313,798 | | | | 310,402 | | | | 314,959 | | | | | | | | 302,373 | |
| Other long-term financial liabilities(f) | | | — | | | | — | | | | | | | | | 46,266 | | | | 86,723 | | | | 141,179 | | | | | | | | 149,543 | |
| Total long-term financial liabilities(f) | | | 27,969 | | | | 40,342 | | | | | | | | | 387,027 | | | | 430,354 | | | | 530,660 | | | | | | | | 526,996 | |
| Seller preferred shares | | | — | | | | — | | | | | | | | | 35,000 | | | | 35,000 | | | | 35,000 | | | | | | | | 35,000 | |
| Series A preferred shares | | | — | | | | — | | | | | | | | | — | | | | — | | | | 375 | | | | | | | | 391 | |
| Series B preferred shares | | | — | | | | — | | | | | | | | | — | | | | — | | | | 42,193 | | | | | | | | 43,122 | |
| Total shareholders’ equity(g) | | | 17,379 | | | | 29,818 | | | | | | | | | 80,355 | | | | 38,829 | | | | 18,111 | | | | | | | | 36,317 | |
Other financial data: | | | | | | | | | | | | | | | | | | | | | | | | | | | | | | | | | |
| EBITDA(h) | | $ | 17,107 | | | $ | 34,245 | | | $ | (8,740 | ) | | | $ | 11,729 | | | $ | 10,684 | | | $ | 70,027 | | | $ | 5,981 | | | $ | 36,661 | |
| Consolidated EBITDA(h) | | | 16,889 | | | | 31,980 | | | | (8,789 | ) | | | | 23,462 | | | | 34,448 | | | | 70,648 | | | | 8,651 | | | | 31,511 | |
| Cash provided by (used in) operating activities | | | 4,175 | | | | 16,283 | | | | 2,509 | | | | | 15,477 | | | | (4,833 | ) | | | 33,864 | | | | (16,130 | ) | | | 15,254 | |
| Cash used in investing activities | | | (6,464 | ) | | | (18,745 | ) | | | (4,625 | ) | | | | (364,514 | ) | | | (25,055 | ) | | | (22,168 | ) | | | (2,955 | ) | | | (11,574 | ) |
| Cash provided by (used in) financing activities | | | (8,522 | ) | | | 2,677 | | | | 6,967 | | | | | 385,632 | | | | 11,217 | | | | 13,184 | | | | 14,773 | | | | (1,391 | ) |
| Capital expenditures, net of capital leases | | | 8,668 | | | | 22,932 | | | | 5,234 | | | | | 2,501 | | | | 25,679 | | | | 29,015 | | | | 5,693 | | | | 11,843 | |
| | |
| (a) | | The historical balance sheet data, statement of operations data and other financial data as of and for years ended March 31, 2002 and 2003 and the period from April 1 to November 25, 2003 have been derived from the historical financial statements of Norama Ltd. The financial statements for periods ended before November 26, 2003 are not necessarily comparable in all respects to the financial statements for periods ended after November 25, 2003. See “Business — Our History.” |
| |
|
| (b) | | Effective April 1, 2005, we changed our accounting policy regarding the recognition of revenue on claims. This change in accounting policy has been applied retroactively. Prior to this change, revenue from claims was included in total estimated contract revenue when awarded or received. After this change, claims are included in total estimated contract revenue, only to the extent that contract costs related to the claim have been incurred and when it is probable that the claim will result in a bona fide addition to contract value and can be reliably estimated. Those two conditions are satisfied when (1) the contract or other evidence provides a legal basis for the claim or a legal opinion is obtained providing a reasonable basis to support the claim, (2) additional costs incurred were caused by unforeseen circumstances and are not the result of deficiencies in our performance, (3) costs associated with the claim are identifiable and reasonable in view of work performed and (4) evidence supporting the claim is objective and verifiable. No profit is recognized on claims until final settlement occurs. This can lead to a situation where costs are recognized in one period and revenue is recognized when customer agreement is obtained or claim resolution occurs, which can be in subsequent periods. Historical claim recoveries should not be considered indicative of future claim recoveries. The change in policy resulted in an increase in claims revenue and unbilled revenue of approximately $6.1 million and $8.1 million for the three months ended June 30, 2006 and 2005, respectively, and $12.9 million for the year ended March 31, 2006, but did not result in any adjustments to prior periods. Substantially all of the amounts recognized as claims revenue have been collected subsequent to March 31, 2006. |
|
| |
| (c) | | Management fees paid to the corporate shareholder of our predecessor company, Norama Ltd., represented fees for services rendered and were determined with reference to taxable income. Subsequent to the Acquisition on November 26, 2003, these fees are no longer paid. |
37
| | |
| (d) | | Interest expense consists of the following (in thousands): |
| | | | | | | | | | | | | | | | | | | | | | | | | | |
| | | Predecessor | | | | | | | | | | | | |
| | | | | | | | | | | | | |
| | | April 1, 2003 | | | | | | | | Three Months | |
| | | to | | | | November 26, | | | Year Ended | | | Ended | |
| | | November 25, | | | | 2003 to | | | March 31, | | | June 30, | |
| | | | | | | March 31, | | | | | | | |
| | | 2003 | | | | 2004 | | | 2005 | | | 2006 | | | 2005 | | | 2006 | |
| | | | | | | | | | | | | | | | | | | | |
| | | | | | | | | | | | (Unaudited) | |
| Interest on senior notes | | $ | — | | | | $ | 8,096 | | | $ | 23,189 | | | $ | 28,838 | | | $ | 6,535 | | | $ | 7,346 | |
| Interest on senior secured credit facility/revolving credit facility | | | 599 | | | | | 1,089 | | | | 3,274 | | | | 564 | | | | 564 | | | | — | |
| Change in redemption value of Series B preferred shares | | | — | | | | | — | | | | — | | | | 34,668 | | | | 41,498 | | | | 929 | |
| Amortization of deferred financing costs | | | — | | | | | 814 | | | | 2,554 | | | | 3,338 | | | | 672 | | | | 887 | |
| Other | | | 1,858 | | | | | 80 | | | | 2,124 | | | | 1,368 | | | | 594 | | | | 311 | |
| | | | | | | | | | | | | | | | | | | | |
| | | $ | 2,457 | | | | $ | 10,079 | | | $ | 31,141 | | | $ | 68,776 | | | $ | 49,863 | | | $ | 10,168 | |
| | | | | | | | | | | | | | | | | | | | |
| | |
| (e) | | Our consolidated financial statements have been prepared in accordance with Canadian GAAP, which differs in certain material respects from U.S. GAAP. If U.S. GAAP were employed, our net income (loss) would be adjusted as follows (in thousands): |
| | | | | | | | | | | | | | | | | | | | | | | | | | | | | | | | | | | |
| | | Predecessor | | | | | | | | | | | | |
| | | | | | | | | | | | | |
| | | | | | | | | | | | | | Three Months | |
| | | Year Ended | | | | | | November 26, | | | | | Ended | |
| | | March 31, | | | April 1, 2003 to | | | | 2003 to | | | Year Ended March 31, | | | June 30, | |
| | | | | | November 25, | | | | March 31, | | | | | | | |
| | | 2002 | | | 2003 | | | 2003 | | | | 2004 | | | 2005 | | | 2006 | | | 2005 | | | 2006 | |
| | | | | | | | | | | | | | | | | | | | | | | | | | |
| | | | | | | | | | | | | | | | (Unaudited) | |
| Net income (loss) — Canadian GAAP | | $ | 1,609 | | | $ | 12,489 | | | $ | (11,141 | ) | | | $ | (12,282 | ) | | $ | (42,323 | ) | | $ | (21,941 | ) | | $ | (49,204 | ) | | $ | 17,894 | |
| Capitalized interest(1) | | | — | | | | — | | | | — | | | | | — | | | | — | | | | 847 | | | | 107 | | | | 249 | |
| Depreciation of capitalized interest(1) | | | — | | | | — | | | | — | | | | | — | | | | — | | | | — | | | | — | | | | (44 | ) |
| Amortization using effective interest method(2) | | | — | | | | — | | | | — | | | | | — | | | | — | | | | 590 | | | | 43 | | | | 135 | |
| Realized and unrealized loss on derivative financial instruments(3) | | | — | | | | — | | | | — | | | | | — | | | | — | | | | (484 | ) | | | — | | | | (159 | ) |
| Difference between accretion of Series B preferred shares under Canadian and U.S. GAAP(4) | | | — | | | | — | | | | — | | | | | — | | | | — | | | | — | | | | — | | | | 90 | |
| | | | | | | | | | | | | | | | | | | | | | | | | | |
| Income (loss) before income taxes | | | 1,609 | | | | 12,489 | | | | (11,141 | ) | | | | (12,282 | ) | | | (42,323 | ) | | | (20,988 | ) | | | (49,054 | ) | | | 18,165 | |
| Income taxes: | | | | | | | | | | | | | | | | | | | | | | | | | | | | | | | | | |
| | Deferred income taxes | | | — | | | | — | | | | — | | | | | — | | | | — | | | | — | | | | — | | | | (364 | ) |
| | | | | | | | | | | | | | | | | | | | | | | | | | |
| Net income (loss) – U.S. GAAP | | $ | 1,609 | | | $ | 12,489 | | | $ | (11,141 | ) | | | $ | (12,282 | ) | | $ | (42,323 | ) | | $ | (20,988 | ) | | | (49,054 | ) | | | 17,801 | |
| | | | | | | | | | | | | | | | | | | | | | | | | | |
| Net income (loss) per share – basic – U.S. GAAP | | | | | | | | | | | | | | | $ | (13.28 | ) | | $ | (45.66 | ) | | $ | (22.60 | ) | | $ | (52.86 | ) | | $ | 19.12 | |
| | | | | | | | | | | | | | | | | | | | | | | | | | |
| Net income (loss) per share – diluted – U.S. GAAP | | | | | | | | | | | | | | | $ | (13.28 | ) | | $ | (45.66 | ) | | $ | (22.60 | ) | | $ | (52.86 | ) | | $ | 14.05 | |
| | | | | | | | | | | | | | | | | | | | | | | | | | |
38
| | |
|
| | (1) U.S. GAAP requires capitalization of interest costs as part of the historical cost of acquiring certain qualifying assets that require a period of time to prepare for their intended use. This is not required under Canadian GAAP. Accordingly, the capitalized amount is subject to depreciation in accordance with our policies when the asset is placed into service. |
|
| |
| | (2) Under Canadian GAAP, we defer and amortize debt issuance costs on a straight-line basis over the stated term of the related debt. Under U.S. GAAP, we are required to amortize financing costs over the stated term of the related debt using the effective interest method resulting in a consistent interest rate over the term of the debt. |
| |
| | (3) U.S. GAAP requires that every derivative instrument (including certain derivative instruments embedded in other contracts and debt instruments) be recorded in the balance sheet as either an asset or liability measured at its fair value. The issuances of our 83/4% senior notes and 9% senior secured notes both included certain contingent embedded derivatives which provided for the acceleration of redemption by the holder at a premium in certain instances. These embedded derivatives met the criteria for bifurcation from the debt contract and separate measurement at fair value. Under U.S. GAAP, the embedded derivatives have been measured at fair value and classified as part of the carrying amount of the senior notes on the consolidated balance sheet, with changes in the fair value being recorded in net income as realized and unrealized (gain) loss on derivative financial instruments for the period. Under Canadian GAAP, separate accounting of embedded derivatives from the host contract is not permitted. |
| |
|
| | (4) Under Canadian GAAP, we classify the Series B preferred shares as a liability and accrete the carrying amount of $42.2 million on their amendment date (March 30, 2006) to the December 31, 2011 redemption value of $69.6 million using the effective interest method. Under U.S. GAAP, we recognize the fair value of the amended Series B preferred shares as minority interest as such amount was recognized as temporary equity in the accounts of the pre-amalgamated North American Energy Partners Inc., the issuer of the Series B preferred shares, in accordance with Emerging Issues Task Force Topic D-98. Under U.S. GAAP, we accrete the initial fair value of the amended Series B preferred shares of $45.9 million recorded on their amendment date (March 30, 2006) to the December 31, 2011 redemption value of $69.6 million using the effective interest method, which is consistent with the treatment of the Series B preferred shares as temporary equity in the financial statements of the pre-amalgamated North American Energy Partners Inc. The accretion charge is recognized as a charge to minority interest under U.S. GAAP and interest expense in our financial statements under Canadian GAAP. |
|
| |
|
| (f) | | Total debt as of June 30, 2006 consist of the following (in thousands): |
|
| | | | | |
| Revolving credit facility | | $ | — | |
| Obligations under capital leases, including current portion | | | 11,937 | |
| 9% senior secured notes due 2010 | | | 67,436 | |
83/4% senior notes due 2011 | | | 223,000 | |
| | | | |
| Total debt | | $ | 302,373 | |
| | | | |
| | |
|
| | Our 83/4% senior notes are reflected above at the current exchange rate at each balance sheet date. We have entered into cross-currency and interest rate swaps, which represent an economic hedge of the 83/4% senior notes. At maturity, we will be required to pay $263.0 million in order to retire these senior notes and the swaps. This amount reflects the fixed exchange rate of C$1.315 = US$1.00 established as of November 26, 2003, the inception of the swap contracts. |
|
| |
|
| | Other long-term financial liabilities consist of derivative financial instruments and redeemable preferred shares. |
|
| |
| | Total long-term financial liabilities consists of total debt, excluding current portion of obligations under capital leases, plus our redeemable preferred shares and the value of the cross-currency and interest rate swaps recognized on our balance sheet. |
39
| | |
| (g) | | The cumulative effect of material differences between Canadian and U.S. GAAP on shareholders’ equity is as follows (in thousands): |
| | | | | | | | | | | | | | | | | |
| | | March 31, | | | March 31, | | | March 31, | | | June 30, | |
| | | 2004 | | | 2005 | | | 2006 | | | 2006 | |
| | | | | | | | | | | | | |
| | | | | | | | | (Unaudited) | |
| Shareholders’ equity – Canadian GAAP | | $ | 80,355 | | | $ | 38,829 | | | $ | 18,111 | | | $ | 36,317 | |
| Capitalized interest(1) | | | — | | | | — | | | | 847 | | | | 1,096 | |
| Depreciation of capitalized interest(1) | | | — | | | | — | | | | — | | | | (44 | ) |
| Amortization using effective interest method(2) | | | — | | | | — | | | | 590 | | | | 725 | |
| Realized and unrealized loss on derivative financial instruments(3) | | | — | | | | — | | | | (484 | ) | | | (643 | ) |
| Excess of fair value of amended Series B preferred shares over carrying value of original Series B preferred shares(4) | | | — | | | | — | | | | (3,707 | ) | | | (3,707 | ) |
| Cumulative difference between accretion of Series B preferred shares under Canadian GAAP and U.S. GAAP(4) | | | — | | | | — | | | | — | | | | 90 | |
| Deferred income taxes | | | — | | | | — | | | | — | | | | (364 | ) |
| | | | | | | | | | | | | |
| Shareholders’ equity – U.S. GAAP | | $ | 80,355 | | | $ | 38,829 | | | $ | 15,357 | | | $ | 33,470 | |
| | | | | | | | | | | | | |
| | |
|
| | (1) U.S. GAAP requires capitalization of interest costs as part of the historical cost of acquiring certain qualifying assets that require a period of time to prepare for their intended use. This is not required under Canadian GAAP. Accordingly, the capitalized amount is subject to depreciation in accordance with our policies when the asset is placed into service. |
|
| |
| | (2) Under Canadian GAAP, we defer and amortize debt issuance costs on a straight-line basis over the stated term of the related debt. Under U.S. GAAP, we are required to amortize financing costs over the stated term of the related debt using the effective interest method resulting in a consistent interest rate over the term of the debt. |
| |
| | (3) U.S. GAAP requires that every derivative instrument (including certain derivative instruments embedded in other contracts and debt instruments) be recorded in the balance sheet as either an asset or liability measured at its fair value. The issuances of our 83/4% senior notes and 9% senior secured notes both included certain contingent embedded derivatives which provided for the acceleration of redemption by the holder at a premium in certain instances. These embedded derivatives met the criteria for bifurcation from the debt contract and separate measurement at fair value. Under U.S. GAAP, the embedded derivatives have been measured at fair value and classified as part of the carrying amount of the senior notes on the consolidated balance sheet, with changes in the fair value being recorded in net income as realized and unrealized (gain) loss on derivative financial instruments for the period. Under Canadian GAAP, separate accounting of embedded derivatives from the host contract is not permitted. |
| |
|
| | (4) Prior to the modification of the terms of the Series B preferred shares, there were no differences between Canadian GAAP and U.S. GAAP related to the Series B preferred shares. As a result of the modification of terms of the Series B preferred shares on March 30, 2006, under Canadian GAAP, we continue to classify the Series B preferred shares as a liability and accrete the carrying amount to the December 31, 2011 redemption value of $69.6 million using the effective interest method. Under U.S. GAAP, the Company recognized the fair value of the Series B preferred shares as minority interest as such amount was recognized as temporary equity in the accounts of the pre-amalgamated North American Energy Partners Inc., the issuer of the shares, in accordance with EITF Topic D-98 and recognized a charge of $3.7 million to retained earnings for the difference between the fair value and the carrying amount of the Series B preferred shares on the modification date. Under U.S. GAAP, we accrete the initial fair value of the Series B preferred shares of $45.9 million to the December 31, 2011 redemption value of $69.6 million using the effective interest method, which is consistent with the treatment of the Series B preferred shares as temporary equity in the financial statements of the pre-amalgamated North American Energy Partners Inc. The accretion charge is recognized as a charge to minority interest as opposed to retained earnings in the accounts of the pre-amalgamated North American Energy Partners Inc. under U.S. GAAP and interest expense in our financial statements under Canadian GAAP. |
|
| |
|
| (h) | | EBITDA is calculated as net income (loss) before interest expense, income taxes, depreciation and amortization. Consolidated EBITDA is defined as EBITDA, excluding the effects of foreign exchange gain or loss, realized and unrealized gain or loss on derivative financial instruments, non-cash stock-based compensation expense, gain or loss on disposal of plant and equipment and certain other non-cash items included in the calculation of net income (loss). We believe that EBITDA is a meaningful measure of the performance of our business because it excludes items, such as depreciation and |
|
40
| | |
| | amortization, interest and taxes, that are not directly related to the operating performance of our business. Management reviews EBITDA to determine whether capital assets are being allocated efficiently. In addition, our revolving credit facility requires us to maintain a minimum Consolidated EBITDA. Non-compliance with this financial covenant could result in our being required to immediately repay all amounts outstanding under our revolving credit facility. We are required to maintain a minimum trailing twelve month Consolidated EBITDA through December 31, 2006 of $65.5 million, with this minimum amount increasing periodically until maturity. However, EBITDA and Consolidated EBITDA are not measures of performance under Canadian GAAP or U.S. GAAP and our computations of EBITDA and Consolidated EBITDA may vary from others in our industry. EBITDA and Consolidated EBITDA should not be considered as alternatives to operating income or net income as measures of operating performance or cash flows as measures of liquidity. EBITDA and Consolidated EBITDA have important limitations as analytical tools, and you should not consider them in isolation, or as substitutes for analysis of our results as reported under Canadian GAAP or U.S. GAAP. For example, EBITDA and Consolidated EBITDA: |
| | |
| | • | do not reflect our cash expenditures or requirements for capital expenditures or capital commitments; |
| |
| | • | do not reflect changes in, or cash requirements for, our working capital needs; |
| |
| | • | do not reflect the interest expense or the cash requirements necessary to service interest or principal payments on our debt; |
| |
| | • | exclude tax payments that represent a reduction in cash available to us; and |
| |
| | • | do not reflect any cash requirements for assets being depreciated and amortized that may have to be replaced in the future. |
| |
| | In addition, Consolidated EBITDA excludes foreign exchange gains and losses and unrealized and realized gains and losses on derivative financial instruments, which, in the case of unrealized losses, may ultimately result in a liability that will need to be paid and, in the case of realized losses, represents an actual use of cash during the period. |
| |
| | A reconciliation of net income (loss) to EBITDA as set forth in our consolidated statements of operations is as follows (in thousands): |
| | | | | | | | | | | | | | | | | | | | | | | | | | | | | | | | | | | |
| | | Predecessor | | | | | | | | | | | | |
| | | | | | | | | | | | | |
| | | | | | | | | | | | | | Three Months | |
| | | Year Ended | | | April 1, 2003 | | | | November 26, | | | | | Ended | |
| | | March 31, | | | to | | | | 2003 to | | | Year Ended March 31, | | | June 30, | |
| | | | | | November 25, | | | | March 31, | | | | | | | |
| | | 2002 | | | 2003 | | | 2003 | | | | 2004 | | | 2005 | | | 2006 | | | 2005 | | | 2006 | |
| | | | | | | | | | | | | | | | | | | | | | | | | | |
| | | | | | | | | | | | | | | | (Unaudited) | |
| Net income (loss) | | $ | 1,609 | | | $ | 12,489 | | | $ | (11,141 | ) | | | $ | (12,282 | ) | | $ | (42,323 | ) | | $ | (21,941 | ) | | $ | (49,204 | ) | | $ | 17,894 | |
| Adjustments: | | | | | | | | | | | | | | | | | | | | | | | | | | | | | | | | | |
| | Depreciation | | | 11,299 | | | | 10,974 | | | | 6,566 | | | | | 6,674 | | | | 20,762 | | | | 21,725 | | | | 4,989 | | | | 7,312 | |
| | Amortization | | | — | | | | — | | | | — | | | | | 12,928 | | | | 3,368 | | | | 730 | | | | 183 | | | | 183 | |
| | Interest expense | | | 3,510 | | | | 4,162 | | | | 2,457 | | | | | 10,079 | | | | 31,141 | | | | 68,776 | | | | 49,863 | | | | 10,168 | |
| | Income taxes | | | 689 | | | | 6,620 | | | | (6,622 | ) | | | | (5,670 | ) | | | (2,264 | ) | | | 737 | | | | 150 | | | | 1,104 | |
| | | | | | | | | | | | | | | | | | | | | | | | | | |
| EBITDA | | $ | 17,107 | | | $ | 34,245 | | | $ | (8,740 | ) | | | $ | 11,729 | | | $ | 10,684 | | | $ | 70,027 | | | $ | 5,981 | | | $ | 36,661 | |
| | | | | | | | | | | | | | | | | | | | | | | | | | |
41
A reconciliation of EBITDA to Consolidated EBITDA is as follows (in thousands):
| | | | | | | | | | | | | | | | | | | | | | | | | | | | | | | | | | | |
| | | Predecessor | | | | | | | | | | | | |
| | | | | | | | | | | | | |
| | | | | | | | | | | | Three Months | |
| | | Year Ended | | | April 1, 2003 | | | | November 26, | | | Year Ended | | | Ended | |
| | | March 31, | | | to | | | | 2003 to | | | March 31, | | | June 30, | |
| | | | | | November 25, | | | | March 31, | | | | | | | |
| | | 2002 | | | 2003 | | | 2003 | | | | 2004 | | | 2005 | | | 2006 | | | 2005 | | | 2006 | |
| | | | | | | | | | | | | | | | | | | | | | | | | | |
| | | | | | | | | | | | | | | | (Unaudited) | |
| EBITDA | | $ | 17,107 | | | $ | 34,245 | | | $ | (8,740 | ) | | | $ | 11,729 | | | $ | 10,684 | | | $ | 70,027 | | | $ | 5,981 | | | $ | 36,661 | |
| Adjustments: | | | | | | | | | | | | | | | | | | | | | | | | | | | | | | | | | |
| | Unrealized foreign exchange loss (gain) on senior notes | | | — | | | | — | | | | — | | | | | (740 | ) | | | (20,340 | ) | | | (14,258 | ) | | | 928 | | | | (13,571 | ) |
| | Loss (gain) on disposal of plant and equipment | | | (218 | ) | | | (2,265 | ) | | | (49 | ) | | | | 131 | | | | 494 | | | | (733 | ) | | | 272 | | | | 113 | |
| | Realized and unrealized loss on derivative financial instruments | | | — | | | | — | | | | — | | | | | 12,205 | | | | 43,113 | | | | 14,689 | | | | 1,282 | | | | 7,996 | |
| | Non-cash stock-based compensation expense | | | — | | | | — | | | | — | | | | | 137 | | | | 497 | | | | 923 | | | | 188 | | | | 312 | |
| | | | | | | | | | | | | | | | | | | | | | | | | | |
| Consolidated EBITDA | | $ | 16,889 | | | $ | 31,980 | | | $ | (8,789 | ) | | | $ | 23,462 | | | $ | 34,448 | | | $ | 70,648 | | | $ | 8,651 | | | $ | 31,511 | |
| | | | | | | | | | | | | | | | | | | | | | | | | | |
42
UNAUDITED PRO FORMA FINANCIAL INFORMATION
The following unaudited pro forma financial information is derived from our historical consolidated financial statements included elsewhere in this prospectus. The unaudited pro forma financial information should be read in conjunction with our consolidated financial statements and related notes included elsewhere in this prospectus, “Management’s Discussion and Analysis of Financial Condition and Results of Operations” and the other financial information included elsewhere in this prospectus.
The unaudited pro forma statements of operations for the fiscal year ended March 31, 2006 and the three months ended June 30, 2006 and balance sheet as of June 30, 2006 have been prepared to give pro forma effect to (a) the Reorganization and (b) the sale of common shares in this offering and application of the net proceeds from this offering, in the case of the statements of operations, as if they had occurred on April 1, 2005 and, in the case of the balance sheet, as if they had occurred on June 30, 2006.
The unaudited pro forma consolidated financial information reflects pro forma adjustments that are described in the accompanying notes and are based on available information and assumptions that we believe are reasonable, but are subject to change. We have made, in our opinion, all adjustments that are necessary to present fairly the pro forma financial information. The unaudited pro forma financial information is presented for informational purposes only and does not purport to represent what our actual results of operations or financial position would have been had the Reorganization and this offering been consummated on the dates indicated and does not purport to be indicative of our financial position as of any future date or our results of operations for any future period.
43
Unaudited Pro Forma Condensed Consolidated Balance Sheet
As of June 30, 2006
| | | | | | | | | | | | | | | | | | | | | | | | |
| | | | | | | | | | | Pro Forma | |
| | | | | | | | | | | for the | |
| | | | | Adjustments | | | Pro Forma | | | Adjustments | | | Reorganization | |
| | | | | for the | | | for the | | | for this | | | and this | |
| | | Historical | | | Reorganization | | | Reorganization | | | Offering | | | Offering | |
| | | | | | | | | | | | | | | | |
| | | (In thousands of Canadian dollars) | |
ASSETS | | | | | | | | | �� | | | | | | | | | | | |
| Current assets: | | | | | | | | | | | | | | | | | | | | |
| | Cash and cash equivalents | | $ | 45,093 | | | $ | (1,000 | )(a) | | $ | 44,093 | | | $ | 26,127 | (c)(e) | | $ | 70,220 | |
| | Accounts receivable & unbilled revenue | | | 114,421 | | | | | | | | 114,421 | | | | | | | | 114,421 | |
| | Prepaid expenses & other current assets | | | 3,811 | | | | | | | | 3,811 | | | | | | | | 3,811 | |
| | Future income taxes | | | 10,291 | | | | | | | | 10,291 | | | | | | | | 10,291 | |
| | | | | | | | | | | | | | | | |
| | | | 173,616 | | | | | | | | 172,616 | | | | | | | | 198,743 | |
| | | | | | | | | | | | | | | | |
| Future income taxes | | | 16,790 | | | | | | | | 16,790 | | | | 6,291 | (i) | | | 23,081 | |
| Plant and equipment | | | 191,269 | | | | | | | | 191,269 | | | | 44,999 | (d) | | | 236,268 | |
| Goodwill | | | 198,549 | | | | | | | | 198,549 | | | | | | | | 198,549 | |
| Intangible assets, net | | | 589 | | | | | | | | 589 | | | | | | | | 589 | |
| Deferred financing costs, net | | | 17,519 | | | | | | | | 17,519 | | | | (4,847 | )(e) | | | 12,672 | |
| | | | | | | | | | | | | | | | |
| | | Total assets | | $ | 598,332 | | | | | | | $ | 597,332 | | | | | | | $ | 669,902 | |
| | | | | | | | | | | | | | | | |
| |
LIABILITIES AND SHAREHOLDERS’ EQUITY | | | | | | | | | | | | | | | | | | | | |
| Current liabilities: | | | | | | | | | | | | | | | | | | | | |
| | Accounts payable & accrued liabilities | | $ | 75,166 | | | | 26,300 | (f) | | $ | 101,466 | | | | (27,605 | )(e)(f)(h) | | $ | 73,861 | |
| | Billings in excess of costs incurred and estimated earnings on uncompleted contracts | | | 6,616 | | | | | | | | 6,616 | | | | | | | | 6,616 | |
| | Current portion of capital lease obligations | | | 3,433 | | | | | | | | 3,433 | | | | | | | | 3,433 | |
| | Future income taxes | | | 4,882 | | | | | | | | 4,882 | | | | | | | | 4,882 | |
| | | | | | | | | | | | | | | | |
| | | | | 90,097 | | | | | | | | 116,397 | | | | | | | | 88,792 | |
| | | | | | | | | | | | | | | | |
| Capital lease obligations | | | 8,504 | | | | | | | | 8,504 | | | | | | | | 8,504 | |
| Senior notes | | | 290,436 | | | | | | | | 290,436 | | | | (67,436 | )(e) | | | 223,000 | |
| Future income taxes | | | 23,435 | | | | | | | | 23,435 | | | | (3,621 | )(i) | | | 19,814 | |
| Derivative financial instruments | | | 71,030 | | | | | | | | 71,030 | | | | | | | | 71,030 | |
| Seller preferred shares | | | 35,000 | | | | (35,000 | )(f) | | | — | | | | | | | | — | |
| Series A preferred shares | | | 391 | | | | (391 | )(a) | | | — | | | | | | | | — | |
| Series B preferred shares | | | 43,122 | | | | (43,122 | )(b) | | | — | | | | | | | | — | |
| | | | | | | | | | | | | | | | |
| | | Total liabilities | | | 562,015 | | | | | | | | 509,802 | | | | | | | | 411,141 | |
| | | | | | | | | | | | | | | | |
| Shareholders’ equity: | | | | | | | | | | | | | | | | | | | | |
| | Common shares | | | 93,100 | | | | 43,122 | (b) | | | 136,221 | | | | 181,939 | (g)(i) | | | 318,160 | |
| | Contributed surplus | | | 1,869 | | | | | | | | 1,869 | | | | | | | | 1,869 | |
| | Deficit | | | (58,652 | ) | | | 8,091 | (a)(f) | | | (50,561 | ) | | | (10,707 | )(e)(h)(i) | | | (61,268 | ) |
| | | | | | | | | | | | | | | | |
| | | Total shareholders’ equity | | | 36,317 | | | | | | | | 87,529 | | | | | | | | 258,761 | |
| | | | | | | | | | | | | | | | |
| | | | Total liabilities and shareholders’ equity | | $ | 598,332 | | | | | | | $ | 597,332 | | | | | | | $ | 669,902 | |
| | | | | | | | | | | | | | | | |
See Notes to Unaudited Pro Forma Condensed Consolidated Financial Information.
44
Unaudited Pro Forma Condensed Consolidated Statement of Operations
Fiscal Year Ended March 31, 2006
| | | | | | | | | | | | | | | | | | | | | | |
| | | | | | | | | | | Pro Forma | |
| | | | | | | | | | | for the | |
| | | | | Adjustments | | | Pro Forma | | | Adjustments | | | Reorganization | |
| | | | | for the | | | for the | | | for this | | | and this | |
| | | Historical | | | Reorganization | | | Reorganization | | | Offering(a) | | | Offering | |
| | | | | | | | | | | | | | | | |
| | | (In thousands of Canadian dollars, except per share amounts) | |
| Revenue | | $ | 492,237 | | | | | | | $ | 492,237 | | | | | | | $ | 492,237 | |
| | Project costs | | | 308,949 | | | | | | | | 308,949 | | | | (4,370 | )(e) | | | 304,579 | |
| | Equipment costs | | | 64,832 | | | | | | | | 64,832 | | | | | | | | 64,832 | |
| | Equipment operating lease expense | | | 16,405 | | | | | | | | 16,405 | | | | (13,077 | )(e) | | | 3,328 | |
| | Depreciation | | | 21,725 | | | | | | | | 21,725 | | | | 3,037 | (f) | | | 24,762 | |
| | | | | | | | | | | | | | | | |
| Gross profit | | | 80,326 | | | | | | | | 80,326 | | | | | | | | 94,736 | |
| | | | | | | | | | | | | | | | |
| | General and administrative | | | 30,903 | | | | | | | | 30,903 | | | | 1,781 | (g)(k) | | | 32,684 | |
| | Gain on disposal of property and equipment | | | (733 | ) | | | | | | | (733 | ) | | | | | | | (733 | ) |
| | Amortization of intangible assets | | | 730 | | | | | | | | 730 | | | | | | | | 730 | |
| | | | | | | | | | | | | | | | |
| Operating income | | | 49,426 | | | | | | | | 49,426 | | | | | | | | 62,055 | |
| | | | | | | | | | | | | | | | |
| | Interest expense | | | 68,776 | | | | (34,722 | )(b) | | | 34,054 | | | | (6,631 | )(h) | | | 27,243 | |
| | Foreign exchange gain | | | (13,953 | ) | | | | | | | (13,953 | ) | | | 5,850 | (i) | | | (8,103 | ) |
| | Loss on acquisition of Series A preferred shares | | | — | | | | 679 | (c) | | | 679 | | | | | | | | 679 | |
| | Gain on acquisition of Seller preferred shares | | | — | | | | (8,000 | )(d) | | | (8,000 | ) | | | | | | | (8,000 | ) |
| | Loss on repurchase of 9% senior secured notes | | | — | | | | | | | | — | | | | 3,428 | (j) | | | 3,428 | |
| | Realized and unrealized loss on derivative financial instruments | | | 14,689 | | | | | | | | 14,689 | | | | | | | | 14,689 | |
| | Financing costs | | | 2,095 | | | | | | | | 2,095 | | | | | | | | 2,095 | |
| | Other income | | | (977 | ) | | | | | | | (977 | ) | | | | | | | (977 | ) |
| | | | | | | | | | | | | | | | |
| Income (loss) before income taxes | | | (21,204 | ) | | | | | | | 20,839 | | | | | | | | 30,821 | |
| | Income taxes | | | 737 | | | | | | | | 737 | | | | | | | | 737 | |
| | | | | | | | | | | | | | | | |
| Net income (loss)(m) | | $ | (21,941 | ) | | | | | | $ | 20,102 | | | | | | | $ | 30,084 | |
| | | | | | | | | | | | | | | | |
| Net income (loss) per share: | | | | | | | | | | | | | | | | | | | | |
| | Basic | | $ | 23.62 | | | | | | | | | | | | | | | $ | | |
| | | | | | | | | | | | | | | | |
| | Diluted | | $ | 23.62 | | | | | | | | | | | | | | | $ | | |
| | | | | | | | | | | | | | | | |
| Weighted average shares: | | | | | | | | | | | | | | | | | | | | |
| | Basic | | | 928,000 | | | | | | | | | | | | | | | | | |
| | | | | | | | | | | | | | | | |
| | Diluted | | | 928,000 | | | | | | | | | | | | | | | | | |
| | | | | | | | | | | | | | | | |
See Notes to Unaudited Pro Forma Condensed Consolidated Financial Information.
45
Unaudited Pro Forma Condensed Consolidated Statement of Operations
Three Months Ended June 30, 2006
| | | | | | | | | | | | | | | | | | | | | | |
| | | | | | | | | | | Pro Forma | |
| | | | | | | | | | | for the | |
| | | | | Adjustments | | | Pro Forma | | | Adjustments | | | Reorganization | |
| | | | | for the | | | for the | | | for this | | | and this | |
| | | Historical | | | Reorganization | | | Reorganization | | | Offering(a) | | | Offering | |
| | | | | | | | | | | | | | | | |
| | | (In thousands of Canadian dollars, except per share amounts) | |
| Revenue | | $ | 138,000 | | | | | | | $ | 138,000 | | | | | | | $ | 138,100 | |
| | Project costs | | | 67,009 | | | | | | | | 67,009 | | | | (629 | )(e) | | | 66,380 | |
| | Equipment costs | | | 23,935 | | | | | | | | 23,935 | | | | | | | | 23,935 | |
| | Equipment operating lease expense | | | 7,200 | | | | | | | | 7,200 | | | | (5,094 | )(e) | | | 2,106 | |
| | Depreciation | | | 7,312 | | | | | | | | 7,312 | | | | 1,110 | (f) | | | 8,422 | |
| | | | | | | | | | | | | | | | |
| Gross profit | | | 32,644 | | | | | | | | 32,644 | | | | | | | | 37,257 | |
| | | | | | | | | | | | | | | | |
| | General and administrative | | | 9,235 | | | | | | | | 9,235 | | | | (90 | )(g)(k) | | | 9,145 | |
| | Loss on disposal of property and equipment | | | 113 | | | | | | | | 113 | | | | | | | | 113 | |
| | Amortization of intangible assets | | | 183 | | | | | | | | 183 | | | | | | | | 183 | |
| | | | | | | | | | | | | | | | |
| Operating income | | | 23,113 | | | | | | | | 23,113 | | | | | | | | 27,816 | |
| | | | | | | | | | | | | | | | |
| | Interest expense | | | 10,168 | | | | (1,644 | )(b) | | | 8,524 | | | | (1,839 | )(h) | | | 6,685 | |
| | Foreign exchange gain | | | (13,466 | ) | | | | | | | (13,466 | ) | | | 3,252 | (i) | | | (10,214 | ) |
| | Realized and unrealized loss on derivative financial instruments | | | 7,996 | | | | | | | | 7,996 | | | | | | | | 7,996 | |
| | Other income | | | (583 | ) | | | | | | | (583 | ) | | | | | | | (583 | ) |
| | | | | | | | | | | | | | | | |
| Income before income taxes | | | 18,998 | | | | | | | | 20,642 | | | | | | | | 23,932 | |
| | Income taxes | | | 1,104 | | | | | | | | 1,104 | | | | (999 | )(l) | | | 105 | |
| | | | | | | | | | | | | | | | |
| Net income(m) | | $ | 17,894 | | | | | | | $ | 19,538 | | | | | | | $ | 23,827 | |
| | | | | | | | | | | | | | | | |
| Net income per share: | | | | | | | | | | | | | | | | | | | | |
| | Basic | | $ | 19.22 | | | | | | | | | | | | | | | $ | | |
| | | | | | | | | | | | | | | | |
| | Diluted | | $ | 14.16 | | | | | | | | | | | | | | | $ | | |
| | | | | | | | | | | | | | | | |
| Weighted average shares: | | | | | | | | | | | | | | | | | | | | |
| | Basic | | | 931,000 | | | | | | | | | | | | | | | | | |
| | | | | | | | | | | | | | | | |
| | Diluted | | | 1,307,789 | | | | | | | | | | | | | | | | | |
| | | | | | | | | | | | | | | | |
See Notes to Unaudited Pro Forma Condensed Consolidated Financial Information.
46
Notes to Unaudited Pro Forma Condensed Consolidated Financial Information
1. Basis of Presentation
The following unaudited pro forma condensed consolidated statements of operations for the fiscal year ended March 31, 2006 and the three months ended June 30, 2006 and unaudited pro forma condensed consolidated balance sheet as of June 30, 2006 have been prepared to give pro forma effect to (a) the Reorganization and (b) the sale of common shares in this offering and the use of the net proceeds from this offering, in the case of the statements of operations, as if they had occurred on April 1, 2005 and, in the case of the balance sheet, as if they had occurred on June 30, 2006 (collectively the “Transactions,” which are more fully described in note 2 below).
The accompanying unaudited pro forma condensed consolidated financial information has been prepared by management based on the unaudited consolidated balance sheet as at June 30, 2006 and the unaudited consolidated statement of operations for the three-month period ended June 30, 2006 and from the audited consolidated statement of operations for the year ended March 31, 2006. It should be read in conjunction with our audited consolidated financial statements as at and for the year ended March 31, 2006 and our unaudited interim financial statements as at and for the three months ended June 30, 2006 included elsewhere in the prospectus.
The unaudited pro forma condensed financial information has been prepared in accordance with Canadian GAAP consistent with our significant accounting policies described in note 2 to our audited consolidated financial statements for the year ended March 31, 2006. The unaudited pro forma condensed consolidated financial information is reconciled to U.S. GAAP in a manner consistent with Item 17 of Form 20-F. Measurement differences between Canadian GAAP and U.S. GAAP are consistent with those described in note 23 to our unaudited consolidated financial statements for the three months ended June 30, 2006 and our audited consolidated financial statements for the year ended March 31, 2006.
The unaudited pro forma condensed consolidated financial information reflects pro forma adjustments that are described in the accompanying notes and are based on currently available information and assumptions that we believe provide a reasonable basis for presenting the significant effects of the Reorganization and this offering. We have made, in our opinion, all adjustments that are necessary to present fairly the pro forma financial information. The unaudited pro forma condensed consolidated financial information is presented for informational purposes only and does not purport to represent what our actual results of operations or financial position would have been had the Reorganization and this offering been consummated on the dates indicated and does not purport to be indicative of our financial position as of any future date or our results of operations for any future period. Actual adjustments will differ from the pro forma adjustments.
2. The Transactions
(a) The Reorganization
Prior to this offering, each of NACG Holdings Inc., NACG Preferred Corp. and North American Energy Partners Inc. propose to amalgamate into one entity, North American Energy Partners Inc. Prior to the amalgamation, the following transactions will take place:
| | |
|
| | • | The issued and outstanding common shares of NACG Holdings Inc. will be subject to a for split. The computation of pro forma basic and diluted earnings per share have been adjusted to reflect this split. |
|
| |
|
| | • | NACG Holdings Inc. will purchase all of the issued and outstanding Series A preferred shares for cash consideration of $1.0 million pursuant to affiliate purchase rights provisions under the terms of the Series A preferred shares. |
|
| |
|
| | • | In accordance with the terms of a put/ call agreement dated March 30, 2006, NACG Holdings Inc. will exercise its call option to acquire all of the issued and outstanding Series B preferred shares. |
|
47
| | |
|
| | | Each holder of the Series B preferred shares will receive five common shares of NACG Holdings Inc. for each Series B preferred share held (376,220 common shares of NACG Holdings Inc. will be issued in exchange for the Series B preferred shares for no additional consideration, with such number of shares to be adjusted pursuant to the share split described above). Under the terms of the put/ call agreement, the Series B preferred shares will be contributed to NACG Preferred Corp., which in turn will contribute the Series B preferred shares to the pre-amalgamated North American Energy Partners Inc. for cancellation. |
|
| |
|
| | • | NACG Holdings Inc. will acquire all of the issued and outstanding Seller preferred shares in exchange for a promissory note of $27.0 million, and the Seller preferred shares will be cancelled. These notes will subsequently be redeemed for cash from a portion of the proceeds received from this offering. |
|
(b) Use of Proceeds
We expect to issue common shares in this offering for gross cash proceeds of $194.4 million, less underwriting discounts and commissions of $12.6 million and estimated offering expenses of approximately $5.4 million. We intend to use the expected net proceeds of approximately US$158.8 million, or C$176.4 million, from this offering as follows:
| | |
|
| | • | We will acquire certain equipment currently under operating leases for cash consideration of $45.0 million and will terminate certain operating lease obligations, including early termination penalties. Because the early termination penalties are nominal, the Company will account for the cash outlay as a cost to acquire the equipment. |
|
| |
|
| | • | We will repurchase all of our outstanding 9% senior secured notes for cash consideration of $73.6 million. This price represents a premium of 9.5% over the stated value of the notes. The noteholders have agreed to receive $73.6 million in exchange for the notes plus accrued interest, subject to the completion of this offering. |
|
| |
|
| | • | We will terminate the advisory services agreement with our sponsors. A termination fee of $2.0 million will be paid upon the completion of this offering to terminate the advisory services agreement. |
|
3. Notes to Unaudited Pro Forma Condensed Consolidated Balance Sheet
The adjustments included in the unaudited pro forma condensed consolidated balance sheet assume that the following events occurred on June 30, 2006 as follows:
| | |
|
| (a) | | Reflects the purchase of the Series A preferred shares for $1.0 million in connection with the Reorganization. The excess of the redemption amount over the carrying value of the Series A preferred shares at June 30, 2006 of $0.6 million has been charged to deficit. |
|
| |
|
| (b) | | Reflects the conversion of the Series B preferred shares into common shares in connection with the Reorganization. As a result, the carrying amount of the Series B preferred shares of $43.1 million at June 30, 2006 has been eliminated and the value of our common shares has increased by a corresponding amount. |
|
| |
|
| (c) | | Reflects the net cash proceeds from this offering that will be available for general corporate purposes. No pro forma adjustment has been recorded for any interest income that may be earned related to available funds to be used for general corporate purposes. |
|
| |
|
| (d) | | Reflects the purchase of certain equipment under operating leases and short-term rental agreements for cash consideration of $45.0 million with a portion of the proceeds from this offering. |
|
| |
|
| (e) | | Reflects the repurchase of all of our outstanding 9% senior secured notes with $76.3 million from the proceeds from this offering, including the tender offer premium, and accrued interest resulting in an extinguishment loss of $8.3 million and the write-off of deferred financing costs of $4.8 million, both of which have been charged to deficit. |
|
48
| | |
|
| (f) | | Reflects the acquisition of all of the outstanding Seller preferred shares in exchange for notes payable of $27.0 million and the subsequent cancellation of the Seller preferred shares as part of the Reorganization. These notes payable will subsequently be redeemed for cash from proceeds received from this offering. The extinguishment gain of $8.0 million and the reversal of accrued dividends on the Seller preferred shares of $0.7 million at June 30, 2006 has been recorded as a reduction to deficit. |
|
| |
|
| (g) | | Reflects the cash proceeds from this offering of common shares of $194.4 million, less underwriting discounts and commissions of $12.6 million and estimated offering expenses of approximately $5.4 million. |
|
| |
|
| (h) | | Reflects $2.0 million payment to terminate the advisory services agreement, net of the reversal of $0.1 million charged under the advisory services agreement. |
|
| |
|
| (i) | | Reflects the tax effect of the above pro forma adjustments. |
|
4. Notes to Unaudited Pro Forma Condensed Consolidated Statements of Operations
The adjustments included in the unaudited pro forma condensed consolidated statements of operations assume that the following events occurred on April 1, 2005 as follows:
| | |
|
| (a) | | The Unaudited Pro Forma Condensed Consolidated Statements of Operations do not give effect to the application of our proceeds from this offering that will be available for general corporate purposes. No pro forma adjustment has been recorded for any interest income that may be earned related to available funds to be used for general corporate purposes. |
|
| |
|
| (b) | | Reflects the decrease in interest expense of $34.7 million and $1.6 million for the year ended March 31, 2006 and the three months ended June 30, 2006, respectively, resulting from the conversion of the Series B preferred shares into NACG Holdings Inc. common shares and the purchase of the Series A preferred shares. |
|
| |
|
| (c) | | Reflects the difference between the $1.0 million redemption amount for the Series A preferred shares and their $0.4 million carrying value on May 19, 2005, their issue date. |
|
| |
|
| (d) | | Reflects the difference between the $27.0 million acquisition amount for the Seller preferred shares and their $35.0 million carrying value at April 1, 2005. |
|
| |
|
| (e) | | Reflects the reduction in project costs and equipment operating lease expense of $17.4 million and $5.7 million for the year ended March 31, 2006 and the three months ended June 30, 2006, respectively, resulting from the purchase of equipment under certain operating leases with a portion of the proceeds from this offering. |
|
| |
|
| (f) | | Reflects the increase in depreciation expense of $3.0 million and $1.1 million for the year ended March 31, 2006 and the three months ended June 30, 2006, respectively, resulting from the purchase of equipment under certain operating leases with a portion of the proceeds from this offering. |
|
| |
|
| (g) | | Reflects the $2.0 million payment to terminate the advisory services agreement with the sponsors, net of the reversal of $0.4 million charged under the advisory services agreement for the year ended March 31, 2006 and the reversal of $0.1 million charged under the advisory services agreement for the three months ended June 30, 2006. |
|
| |
|
| (h) | | Reflects the decrease in interest expense of $6.6 million and $1.8 million for the year ended March 31, 2006 and the three months ended June 30, 2006, respectively, including amortization of deferred financing costs of $1.0 million and $0.3 million for the year ended March 31, 2006 and the three months ended June 30, 2006, respectively. This resulted from the repurchase of all of our outstanding 9% senior secured notes, assuming the repurchase occurred on May 19, 2005, the date the notes were issued. |
|
49
| | |
|
| (i) | | Reflects the elimination of foreign exchange gains of $5.9 million and $3.3 million for the year ended March 31, 2006 and the three months ended June 30, 2006, respectively, recorded with respect to our 9% senior secured notes. |
|
| |
|
| (j) | | Reflects the loss of $3.4 million required to repurchase all of our outstanding 9% senior secured notes on May 19, 2005, the date the notes were issued. |
|
| |
|
| (k) | | Reflects the remeasurement at fair value of 37,276 options granted to employees and directors during the year ended March 31, 2006 and 6,388 options granted to employees and directors during the three months ended June 30, 2006 under the terms of the 2004 Share Option Plan. The 2004 Share Option Plan provides that each option includes a cashless exercise alternative which provides that we may elect at our sole discretion to physically settle the cashless exercise with shares. The fair values of the options granted have been measured using the assumptions set out in note 21 to our consolidated financial statements included elsewhere in this prospectus, except that an expected volatility of 40% has been assumed in the Black-Scholes option-pricing model. The fair values of $3.3 million and $0.5 million for the respective awards have increased compensation expense by $0.2 million and $10,000 for the year ended March 31, 2006 and the three months ended June 30, 2006, respectively. |
|
| |
|
| (l) | | Reflects the tax effect of the above pro forma adjustments resulting in $1.0 million of tax expense due to the removal of the previous valuation allowance. |
|
| |
|
| (m) | | These unaudited pro forma condensed consolidated financial statements have been prepared in accordance with Canadian GAAP, which differs in certain respects from U.S. GAAP. If U.S. GAAP were employed, our pro forma net income would be as follows: |
|
| | | | | | | | | | |
| | | | | Three Months | |
| | | Year Ended | | | Ended | |
| | | March 31, 2006 | | | June 30, 2006 | |
| | | | | | | |
| | | (in thousands) | |
| Pro forma net income — Canadian GAAP | | $ | 30,084 | | | $ | 23,827 | |
| Capitalized interest(1) | | | 847 | | | | 249 | |
| Depreciation of capitalized interest(1) | | | — | | | | (44 | ) |
| Amortization using effective interest method(2) | | | 345 | | | | 82 | |
| Realized and unrealized loss on derivative financial instruments(3) | | | (578 | ) | | | (119 | ) |
| | | | | | | |
| Income before income taxes | | | 30,698 | | | | 23,995 | |
| Income taxes: | | | | | | | | |
| | Deferred income taxes | | | — | | | | (258 | ) |
| | | | | | | |
| Pro forma net income — U.S. GAAP | | $ | 30,698 | | | $ | 23,737 | |
| | | | | | | |
| | |
|
| | The cumulative effect of these adjustments on our pro forma shareholders’ equity is as follows: |
|
| | | | | |
| | | June 30, 2006 | |
| | | | |
| | | (in thousands) | |
| Pro forma shareholders’ equity — Canadian GAAP | | $ | 258,761 | |
| Capitalized interest(1) | | | 1,096 | |
| Depreciation of capitalized interest(1) | | | (44 | ) |
| Amortization using effective interest method(2) | | | 427 | |
| Realized and unrealized loss on derivative financial instruments(3) | | | (697 | ) |
| Deferred income taxes | | | (258 | ) |
| | | | |
| Pro forma shareholders’ equity — U.S. GAAP | | $ | 259,285 | |
| | | | |
| | |
|
| | The areas of material difference between Canadian and U.S. GAAP and their impact on our unaudited pro forma condensed consolidated financial statements are described below: |
|
50
| | |
|
| | (1) U.S. GAAP requires capitalization of interest costs as part of the historical cost of acquiring certain qualifying assets that require a period of time to prepare for their intended use. This is not required under Canadian GAAP. Accordingly, the capitalized amount is subject to depreciation in accordance with our policies when the asset is placed into service. |
|
| |
|
| | (2) Under Canadian GAAP, we defer and amortize debt issuance costs on a straight-line basis over the stated term of the related debt. Under U.S. GAAP, we are required to amortize financing costs over the stated term of the related debt using the effective interest method resulting in a consistent interest rate over the term of the debt in accordance with Accounting Principles Board Opinion No. 21. |
|
| |
|
| | (3) Statement of Financial Accounting Standard No. 133, Accounting for Derivative Instruments and Hedging Activities establishes accounting and reporting standards requiring that every derivative instrument (including certain derivative instruments embedded in other contracts and debt instruments) be recorded in the balance sheet as either an asset or liability measured at its fair value. On November 26, 2003, we issued 83/4% senior notes for US$200 million (Canadian $263 million). This issuance included certain contingent embedded derivatives which provided for the acceleration of redemption by the holder at a premium in certain instances. This embedded derivative met the criteria for bifurcation from the debt contract and separate measurement at fair value. The embedded derivative has been measured at fair value and classified as part of the carrying amount of the notes on the pro forma condensed consolidated balance sheet, with changes in the fair value being recorded in net income (loss) as realized and unrealized (gain) loss on derivative financial instruments for the period under U.S. GAAP. Under Canadian GAAP, separate accounting of embedded derivatives from the host contract is not permitted by CICA Emerging Issues Committee Abstract No. 117. |
|
51
MANAGEMENT’S DISCUSSION AND ANALYSIS OF
FINANCIAL CONDITION AND RESULTS OF OPERATIONS
The following discussion should be read in conjunction with the financial statements and the notes thereto included elsewhere in this prospectus. The following discussion contains forward-looking statements, which reflect the expectations, beliefs, plans and objectives of management about future financial performance and assumptions underlying our judgments concerning the matters discussed below. See “Cautionary Note Regarding Forward-Looking Statements.” These statements, accordingly, involve estimates, assumptions, judgments and uncertainties. In particular, this pertains to management’s comments on financial resources, capital spending and the outlook for our business. Our actual results could differ from those discussed in the forward-looking statements. Factors that could cause or contribute to any differences include, but are not limited to, those discussed below and elsewhere in this prospectus, particularly in “Risk Factors.”
Overview
We provide services primarily to major oil and natural gas, petrochemical and other natural resource companies operating in western Canada. These services are offered through three operating segments: Mining and Site Preparation, Piling and Pipeline.
The Mining and Site Preparation operating segment, accounting for 74.5% of our fiscal 2006 revenues, is involved in a variety of activities, including: surface mining for oil sands and other natural resources, including overburden removal, hauling sand and gravel and supplying labor and equipment to support customers’ mining operations; construction of infrastructure associated with mining operations and reclamation activities; clearing, stripping, excavating and grading for mining operations and industrial site construction mega-projects; and underground utility installation for plant, refinery and commercial building construction.
The Piling operating segment, accounting for 18.6% of our fiscal 2006 revenues, installs all types of driven and drilled piles, caissons and earth retention and stabilization systems for industrial projects primarily focused in the oil sands and related petrochemical or refinery complexes, as well as commercial buildings and infrastructure projects.
The Pipeline operating segment, accounting for 6.9% of our fiscal 2006 revenues, installs transmission and distribution pipe made of various materials for oil, natural gas and water.
The Reorganization, the Acquisition and Financial Statement Presentation
Concurrently with the consummation of this offering, NACG Holdings Inc., NACG Preferred Corp. and North American Energy Partners Inc. propose to amalgamate into one entity, North American Energy Partners Inc. As a result, the amalgamated North American Energy Partners Inc. will own all of the assets and assume all of the liabilities and obligations of the three amalgamated entities. See “The Reorganization.” Accordingly, our results of operations and financial condition after the amalgamation may not be comparable to our historical results discussed below.
We were initially formed in October 2003 in connection with the Acquisition on November 26, 2003. See “Business — Our History.” Included in the comparative information presented for the fiscal year ended March 31, 2004 are the results of Norama Ltd., our predecessor company, up to November 25, 2003, plus our results subsequent to November 25, 2003. The information for the periods that occurred after November 25, 2003 may not be directly comparable to the information provided for the pre-acquisition period as a result of the purchase of equipment under operating leases and the effect of the revaluation of assets and liabilities to their estimated fair values in accordance with the application of purchase accounting pursuant to Canadian and U.S. GAAP.
52
Restatements
The consolidated financial statements of North American Energy Partners Inc., our subsidiary which has financial reporting obligations arising from the 83/4% senior notes and 9% senior secured notes, restated its financial statements for the fiscal year ended March 31, 2004 and the quarters ended June 30, 2004, September 30, 2004, December 31, 2004 and June 30, 2005, as described more fully below. The consolidated financial statements of NACG Holdings Inc. presented in this prospectus have not been restated. NACG Holdings Inc. is a holding company for North American Energy Partners Inc., and the two companies will amalgamate as part of the Reorganization.
| |
| Misstatements due to internal control deficiencies |
During the third quarter of fiscal 2005, our management discovered a number of accounts payable invoices recorded in the third fiscal quarter which related to costs actually incurred in the first and second quarters of fiscal 2005. Management proceeded to review the matter and discovered a number of additional accounting errors, leading management to conduct a review of our accounts and balances. The review identified a number of deficiencies in our processes and internal controls that contributed to several misstated amounts in North American Energy Partners’ unaudited interim consolidated financial statements for the two quarters ended June 30, 2004 and September 30, 2004. We restated these quarters in April of 2005, after which we made a late filing of North American Energy Partners’ December 31, 2004 financial statements.
Management’s review identified project, equipment and general and administrative expenses related to the previously reported three months ended June 30, 2004 and six months ended September 30, 2004 that had not been recorded in the appropriate periods. The understated expenses resulted primarily from our failure to accrue in a timely manner the related costs of unprocessed accounts payable invoices. In addition, in performing its review, management also identified certain equipment costs related to the replacement of heavy construction equipment component parts which were expensed and should have been capitalized in accordance with our capital assets policy. As a result, in the restatement we recorded adjustments to capitalize certain equipment costs previously expensed. Finally, we reduced the management bonus provision accordingly in light of the reduction in earnings resulting from the restatement adjustments.
In addition to the increase in costs resulting from our review, several errors related to revenues were also discovered. Some of the unrecorded costs described above that should have been recorded in the three months and six months ended September 30, 2004 related to projects under cost plus and time-and-material type contracts. Revenues under these types of contracts are recognized as costs are incurred. Consequently, the understatement of costs for the three months and six months ended September 30, 2004 resulted in an understatement of related revenues. Additionally, we determined that we had understated our proportionate share of revenues related to our interest in a joint venture. These increases in revenues were offset by an overstatement of revenues primarily from one customer due to incorrect billing rates as well as duplicate and non-billable transactions in our financial systems.
These are deficiencies that we are currently addressing through the implementation of the requirements of Section 404 of the Sarbanes-Oxley Act of 2002 and Multilateral Instrument 52-109 in Canada and with a focused effort on the high risk areas. For example, we started a procurement project in the spring of 2005 to implement the purchase order functionality in our financial systems and to train our staff in the effective use of purchase orders to track our commitments and to record our expenses in a timely manner. We also added to our finance staff, and in particular we now have additional in-house GAAP expertise. There are a number of initiatives that still need to be completed, and there can be no assurance that we will be able to generate accurate financial reports in a timely manner.
| |
| Derivative financial instruments |
In preparing North American Energy Partners’ financial statements for the fiscal year ended March 31, 2005, we reviewed the accounting treatment of our derivative financial instruments and
53
concluded that there were technical deficiencies in the hedge documentation of the cross-currency swap and interest rate swap contracts used to manage our foreign exchange risk exposure related to our U.S. dollar denominated 83/4% senior notes since the inception of the derivative financial contracts on November 26, 2003, which deficiencies could not be corrected retroactively. Therefore, we determined that it was necessary to restate all reported periods after November 26, 2003 to the quarter ended December 31, 2004 and the quarter ended June 30, 2005 to eliminate the impact of hedge accounting. This restatement also resulted in the late filing of North American Energy Partners’ financial statements for the fiscal year ended March 31, 2005. The restatement was accomplished by recognizing the foreign exchange gain or loss relating to the senior notes for each period and recording the derivative financial instruments at fair value and the realized and unrealized gains and losses in the derivative instruments for each period through the consolidated statements of operations, along with the associated future income tax effects.
The resulting accounting does not impact our risk management activities and has no impact on the timing or amount of cash flows related to our 83/4% senior notes or interest rate and cross-currency swap agreements. It does not affect our ability to make required payments on our outstanding debt obligations. Finally, our economic risk management strategies have not required amendment.
| |
| Valuation of Series A and Series B preferred shares |
After issuing North American Energy Partners’ financial statements for the quarter ended June 30, 2005, we reviewed the accounting treatment of the Series A and Series B preferred shares issued as part of the refinancing transactions which occurred on May 19, 2005. We previously recorded the Series A preferred shares at the redemption amount of $1.0 million. However, we determined that since both the amount to be paid and the settlement date related to the Series A preferred shares are fixed, the Series A preferred shares should be measured at the present value of the amount to be paid at settlement, accruing interest expense using the interest rate implicit at inception. These preferred shares were issued to one of the counterparties to our swap agreements. Accordingly, we reduced the initial value of the preferred shares from $1.0 million to $0.3 million, decreasing financing costs for the current period by $0.7 million. In addition, we accrued interest expense and recorded the increase in the associated liability in the three months ended June 30, 2005.
The Series B preferred shares were initially recorded at $7.5 million, the amount of cash consideration received upon their issuance. Since both the amount to be paid and the settlement date vary based on specified conditions, we determined that the Series B preferred shares should be measured initially at fair value and subsequently re-measured at the amount of cash that would be paid based upon the redemption conditions specified in the contract as if settlement occurred at the current reporting date. Any change in the redemption amount from the previous reporting date, in excess of the initial measurement amount, is recorded as interest expense. We restated the carrying value of the Series B preferred shares to the amount that would be paid if the shares were redeemed at the reporting date, which resulted in an increase in the value of the preferred shares of $41.4 million as of June 30, 2005 with an equal and corresponding increase in interest expense.
After issuing North American Energy Partners’ financial statements for the quarter ended June 30, 2005, we reviewed the accounting treatment of the financing costs incurred in connection with the issuance of our 9% senior secured notes and the establishment of our revolving credit facility on May 19, 2005. $5.3 million of these costs were inappropriately expensed. We concluded that these costs should have been deferred and amortized over the term of the related financing, which is up to five years.
The restatements of North American Energy Partners’ financial statements for the quarter ended June 30, 2005 to correct the accounting for the Series A and Series B preferred shares and the financing costs resulted in our untimely filing of North American Energy Partners’ financial statements for the quarter ended September 30, 2005.
54
Significant Weaknesses in Financial Reporting and Internal Controls
In the course of our fiscal 2006 audit, we identified a number of significant weaknesses in regard to our financial reporting process and internal controls. A weakness in internal control is significant if the deficiency is such that a material misstatement is not likely to be prevented or detected in the consolidated financial statements being audited.
We noted that sufficient documentation to support the recognition of claims revenue was not available on a timely basis during the course of the audit. Also, management’s preparation and analysis of forecast estimates to complete were prepared that differed materially from actual results. Our contract estimating, field reporting, accounting records, committed costs and management reporting were not sufficiently integrated to ensure that the data generated in the accounting records was useful for management’s evaluation of contract progress.
Finally, we noted that formal contracts were not always obtained for construction projects and service arrangements. Failure to obtain formally executed contracts increases the risk of disputes regarding the terms of the agreements and/or whether the services have been rendered as agreed.
Critical Accounting Policies and Estimates
Certain accounting policies require management to make significant estimates and assumptions about future events that affect the amounts reported in our financial statements and the accompanying notes. Therefore, the determination of estimates requires the exercise of management’s judgment. Actual results could differ from those estimates, and any differences may be material to our financial statements.
Our contracts with customers fall under the following contract types: cost-plus, time-and-materials, unit-price and lump sum. While the contracts are generally less than one year in duration, we do have several long-term contracts.
| | |
| | • | Cost-plus. A cost-plus contract is where all work is completed based on actual costs incurred to complete the work. These costs include all labor, equipment, materials and any subcontractor’s costs. In addition to these direct costs, all site and corporate overhead costs are charged to the project. An agreed upon fee in the form of a fixed percentage is then applied to all costs charged to the project. This type of contract is utilized where the project involves a large amount of risk or the scope of the project cannot be readily determined. Revenue recognition is based on actual incurred costs to date plus an applicable fee that represents profit. |
| |
| | • | Time-and-materials. A time-and-materials contract involves using the components of a cost-plus job to calculate rates for the supply of labor and equipment. In this regard, all components of the rates are fixed and we are compensated for each hour of labor and equipment supplied. The risk associated with this type of contract is the estimation of the rates and incurring expenses in excess of a specific component of the agreed upon rate. Therefore, any cost overrun must come out of the fixed margin included in the rates. Revenue is recognized as the labor, equipment, materials, subcontract costs and other services are supplied to the customer. |
| |
| | • | Unit-price. A unit-price contract is utilized in the execution of projects with large repetitive quantities of work and is commonly utilized for site preparation, mining and pipeline work. We are compensated for each unit of work we perform (for example, cubic meters of earth moved, lineal meters of pipe installed or completed piles). Within the unit price contract, there is an allowance for labor, equipment, materials and any subcontractor’s costs. Once these costs are calculated, we add any site and corporate overhead costs along with an allowance for the margin we want to achieve. The risk associated with this type of contract is in the calculation of the unit costs with respect to completing the required work. Revenue on unit-price contracts is recognized using thepercentage-of-completion method, measured by the ratio of costs incurred to date to estimated total cost. |
55
| | |
| | • | Lump sum. A lump sum contract is utilized when a detailed scope of work is known for a specific project. Thus, the associated costs can be readily calculated and a firm price provided to the customer for the execution of the work. The risk lies in the fact that there is no escalation of the price if the work takes longer or more resources are required than were estimated in the established price. The price is fixed regardless of the amount of work required to complete the project. Revenue on lump sum contracts is recognized using thepercentage-of-completion method, measured by the ratio of costs incurred to date to estimated total cost. |
The mix of contract types varies year-by-year. For the fiscal year ended March 31, 2006, our contracts consisted of 15% cost-plus, 25% time-and-materials, 45% unit-price and 15% lump sum.
Profit for each type of contract is included in revenue when its realization is reasonably assured. Estimated contract losses are recognized in full when determined. Change orders are included in total estimated contract revenue when it is probable that the change order will result in a bona fide addition to contract value and can be reliably estimated. Revenue in excess of costs from unpriced change orders, extra work and variations in the scope of work is recognized after both the costs are incurred or services are provided and realization is assured beyond a reasonable doubt. Claims are included in total estimated contract revenue, only to the extent that contract costs related to the claim have been incurred, when it is probable that the claim will result in a bona fide addition to contract value and the amount of revenue can be reliably estimated. Claims are included in total estimated contract revenue, only to the extent that contract costs related to the claim have been incurred and when it is probable that the claim will result in a bona fide addition to contract value and can be reliably estimated. Those two conditions are satisfied when (1) the contract or other evidence provides a legal basis for the claim or a legal opinion is obtained providing a reasonable basis to support the claim, (2) additional costs incurred were caused by unforeseen circumstances and are not the result of deficiencies in our performance, (3) costs associated with the claim are identifiable and reasonable in view of work performed and (4) evidence supporting the claim is objective and verifiable. No profit is recognized on claims until final settlement occurs. This can lead to a situation where costs are recognized in one period and revenue is recognized when customer agreement is obtained or claim resolution occurs, which can be in subsequent periods. Historical claim recoveries should not be considered indicative of future claim recoveries. Costs incurred for bidding and obtaining contracts are expensed as incurred.
The accuracy of our revenue and profit recognition in a given period is dependent, in part, on the accuracy of our estimates of the cost to complete each unit-price and lump sum project. Our cost estimates use a detailed “bottom up” approach. We believe our experience allows us to produce materially reliable estimates. However, our projects can be highly complex, and in almost every case, the profit margin estimates for a project will either increase or decrease to some extent from the amount that was originally estimated at the time of the related bid. Because we have many projects of varying levels of complexity and size in process at any given time, these changes in estimates can offset each other without materially impacting our profitability. However, large changes in cost estimates, particularly in the bigger, more complex projects, can have a significant effect on profitability.
Factors that can contribute to changes in estimates of contract cost and profitability include, without limitation:
| | |
| | • | site conditions that differ from those assumed in the original bid, to the extent that contract remedies are unavailable; |
| |
| | • | identification and evaluation of scope modifications during the execution of the project; |
| |
| | • | the availability and cost of skilled workers in the geographic location of the project; |
| |
| | • | the availability and proximity of materials; |
| |
| | • | unfavorable weather conditions hindering productivity; |
| |
| | • | equipment productivity and timing differences resulting from project construction not starting on time; and |
| |
| | • | general coordination of work inherent in all large projects we undertake. |
56
The foregoing factors, as well as the stage of completion of contracts in process and the mix of contracts at different margins, may cause fluctuations in gross profit between periods, and these fluctuations may be significant.
The most significant estimate in accounting for plant and equipment is the expected useful life of the asset and the expected residual value. Most of our property, plant and equipment has a long life which can exceed 20 years with proper repair work and preventative maintenance. Useful life is measured in operated hours, excluding idle hours, and a depreciation rate is calculated for each type of unit. Depreciation expense is determined each day based on actual operated hours.
Another key estimate is the expected cash flows from the use of an asset and the expected disposal proceeds in applying Canadian Institute of Chartered Accountants Handbook Section 3063 “Impairment of Long-Lived Assets” and Section 3475 “Disposal of Long-Lived Assets and Discontinued Operations.” These standards require the recognition of an impairment loss for a long-lived asset to be held and used when changes in circumstances cause its carrying value to exceed the total undiscounted cash flows expected from its use. An impairment loss, if any, is determined as the excess of the carrying value of the asset over its fair value. Equally important is the expected fair value of assets that are available-for-sale.
As described under “Consolidated Financial Position – Impairment of Goodwill”, we perform our annual goodwill impairment test in the third quarter of each year, and more frequently if events or changes in circumstances indicate that an impairment loss may have been incurred. Impairment is tested at the reporting unit level by comparing the reporting unit’s carrying amount to its fair value. The process of determining fair values is subjective and requires us to exercise judgment in making assumptions about future results, including revenue and cash flow projections at the reporting unit level, and discount rates.
| |
| Derivative financial instruments |
We use derivative financial instruments to manage economic risks from fluctuations in exchange rates and interest rates. These instruments include cross-currency swap agreements and interest rate swap agreements. These instruments are only used for risk management purposes. We do not hold or issue derivative financial instruments for trading or speculative purposes. Derivative financial instruments are subject to standard credit terms and conditions, financial controls, management and risk monitoring procedures.
Our derivative financial instruments are not designated as hedges for accounting purposes and are recorded on the balance sheet at fair value, which is determined based on values quoted by the counterparties to the agreements.
Description of Components of Statement of Operations
Revenue
Revenue includes all amounts earned from the performance of our projects, including amounts arising from change orders and claims. For a description of our revenue recognition policy, refer to note 2(c) to our consolidated financial statements included elsewhere in this prospectus.
Project costs
Included in project costs are all direct expenses incurred in the execution of our projects, including direct labor, short-term equipment rentals, materials and payments to subcontractors.
57
Equipment costs
Included in equipment costs are parts, shop labor and overhead related to the maintenance of our equipment fleet. Equipment insurance premiums and demobilization costs are also included in equipment costs.
Equipment operating lease expense
Lease payments on plant and equipment, other than payments on capital leases, are recorded as equipment operating lease expense.
Depreciation
Depreciation includes amortization of our plant and equipment. For a description of our depreciation policy, please see note 2(g) to our consolidated financial statements included elsewhere in this prospectus.
General and administrative
General and administrative expenses include administrative and other expenses that are not directly attributable to the execution of our contracts. These would include, but are not limited to, management and administrative salaries and wages, non-equipment related insurance, professional fees, office and computer expenses and travel. Stock based compensation is also recorded as general and administrative expense, as are advisory fees paid to the sponsors.
Amortization of intangible assets
Amortization of intangible assets includes the amortization of our intangible assets, being customer contracts, trade names, non-competition agreements and employee arrangements arising from the Acquisition.
Interest expense
Interest expense includes the interest on our 9% senior secured notes, 83/4% senior notes, revolving credit facility and capital lease obligations. Interest expense also includes amortization of deferred financing costs, the change in redemption value of the Series B preferred shares (until March 30, 2006) and the accretion of the Series A preferred shares and the Series B preferred shares (subsequent to March 30, 2006) to their redemption values.
Prior to our amendment of the terms of the Series B preferred shares on March 30, 2006, the definition of the redemption price of the Series B preferred shares included, in addition to other terms, an amount equal to 25% of the fair value of the common shares of North American Energy Partners Inc. As a result of this definition, any change in the fair value of North American Energy Partners’ common shares could result in a corresponding change in the redemption value of the Series B preferred shares and, as a consequence, fluctuations in interest expense. The amendment eliminated this calculation from the definition of redemption price. As a result, the Series B preferred shares will now be accreted from $42.2 million to their December 31, 2011 redemption value of $69.6 million, with corresponding periodic charges to interest expense.
Foreign exchange gain
Foreign exchange gain includes realized and unrealized foreign currency gains or losses on our 9% senior secured notes and 83/4% senior notes, as well as miscellaneous currency gains or losses realized on the settlement of payables in the normal course of operations. The foreign currency risk relating to both the principal and interest payments on the 83/4% senior notes has been managed with a cross currency swap and interest rate swaps which went into effect concurrent with the issuance of the same notes. The swaps on the 83/4% senior notes do not qualify for hedge accounting under CICA Accounting Guideline 13 and are remeasured at fair value each reporting period and the changes in fair value are recorded under the
58
caption “Realized and unrealized loss on derivative financial instruments” in our consolidated financial statements. For more information regarding our derivative financial instruments, refer to note 18(c) to our consolidated financial statements included elsewhere in this prospectus.
Other income
Other income consists of non-operating revenue resulting from interest income and other miscellaneous income sources.
Financing costs
Costs incurred in the course of financing or refinancing debt obligations, and which cannot be deferred for accounting purposes, are included in financing costs. Deferred financing costs associated with debt that has been retired are also written off and recorded as financing costs.
Realized and unrealized loss on derivative financial instruments
Derivative financial instruments are carried on the balance sheet at fair value, and periodic unrealized changes in fair value are recorded as realized and unrealized loss on derivative financial instruments. For more information regarding our derivative financial instruments, refer to note 18(c) to our consolidated financial statements included elsewhere in this prospectus.
Management fees
Management fees were fees charged for management services provided to the predecessor company by Norama Inc., its former parent company. Subsequent to the Acquisition on November 26, 2003, these fees are no longer paid.
Income taxes (benefit)
Income and capital taxes, as well as the impact of changes in our future income tax assets and liabilities are included in income taxes (benefit).
59
Results of Operations
| | | | | | | | | | | | | | | | | | | | | | | | | | | | | | | | | | | | | | | | | |
| | | Year Ended March 31, | | | Three Months Ended June 30, | |
| | | | | | | |
| | | 2004(a) | | | 2005 | | | 2006 | | | 2005 | | | 2006 | |
| | | | | | | | | | | | | | | | |
| | | (Non-GAAP) | | | | | | | | | | | (Unaudited) | |
| | | (Dollars in thousands) | |
Revenue | | $ | 378,263 | | | | 100.0 | % | | $ | 357,323 | | | | 100.0 | % | | $ | 492,237 | | | | 100.0 | % | | $ | 104,359 | | | | 100.0 | % | | $ | 138,100 | | | | 100.0 | % |
| Project costs | | | 240,232 | | | | 63.5 | | | | 240,919 | | | | 67.4 | | | | 308,949 | | | | 62.8 | | | | 66,546 | | | | 63.8 | | | | 67,009 | | | | 48.5 | |
| Equipment costs | | | 57,170 | | | | 15.1 | | | | 52,831 | | | | 14.8 | | | | 64,832 | | | | 13.2 | | | | 17,014 | | | | 16.3 | | | | 23,935 | | | | 17.3 | |
| Equipment operating lease expense | | | 11,932 | | | | 3.2 | | | | 6,645 | | | | 1.9 | | | | 16,405 | | | | 3.3 | | | | 2,898 | | | | 2.8 | | | | 7,200 | | | | 5.2 | |
| Depreciation | | | 13,240 | | | | 3.5 | | | | 20,762 | | | | 5.8 | | | | 21,725 | | | | 4.4 | | | | 4,989 | | | | 4.8 | | | | 7,312 | | | | 5.3 | |
| | | | | | | | | | | | | | | | | | | | | | | | | | | | | | | |
Gross profit | | | 55,689 | | | | 14.7 | | | | 36,166 | | | | 10.1 | | | | 80,326 | | | | 16.3 | | | | 12,912 | | | | 12.4 | | | | 32,644 | | | | 23.6 | |
| General and administrative | | | 13,848 | | | | 3.7 | | | | 22,873 | | | | 6.4 | | | | 30,903 | | | | 6.3 | | | | 7,250 | | | | 6.9 | | | | 9,235 | �� | | | 6.7 | |
| Loss (gain) on disposal of plant and equipment | | | 82 | | | | 0.0 | | | | 494 | | | | 0.1 | | | | (733 | ) | | | (0.1 | ) | | | 272 | | | | 0.3 | | | | 113 | | | | 0.1 | |
| Amortization of intangible assets | | | 12,928 | | | | 3.4 | | | | 3,368 | | | | 1.0 | | | | 730 | | | | 0.1 | | | | 183 | | | | 0.2 | | | | 183 | | | | 0.1 | |
| | | | | | | | | | | | | | | | | | | | | | | | | | | | | | | |
Operating income | | | 28,831 | | | | 7.6 | | | | 9,431 | | | | 2.6 | | | | 49,426 | | | | 10.0 | | | | 5,207 | | | | 5.0 | | | | 23,113 | | | | 16.7 | |
| Interest expense | | | 12,536 | | | | 3.3 | | | | 31,141 | | | | 8.7 | | | | 68,776 | | | | 14.0 | | | | 49,863 | | | | 47.8 | | | | 10,168 | | | | 7.4 | |
| Foreign exchange gain | | | (668 | ) | | | (0.2 | ) | | | (19,815 | ) | | | (5.5 | ) | | | (13,953 | ) | | | (2.8 | ) | | | 1,221 | | | | 1.2 | | | | (13,446 | ) | | | (9.7 | ) |
| Other income | | | (597 | ) | | | (0.2 | ) | | | (421 | ) | | | (0.1 | ) | | | (977 | ) | | | (0.2 | ) | | | (200 | ) | | | (0.2 | ) | | | (583 | ) | | | (0.4 | ) |
| Financing costs | | | — | | | | — | | | | — | | | | — | | | | 2,095 | | | | 0.4 | | | | 2,095 | | | | 2.0 | | | | — | | | | 0.0 | |
| Realized and unrealized loss on derivative financial instruments | | | 12,205 | | | | 3.2 | | | | 43,113 | | | | 12.1 | | | | 14,689 | | | | 3.0 | | | | 1,282 | | | | 1.2 | | | | 7,996 | | | | 5.8 | |
| Management fees | | | 41,070 | | | | 10.9 | | | | — | | | | — | | | | — | | | | — | | | | — | | | | — | | | | — | | | | — | |
| | | | | | | | | | | | | | | | | | | | | | | | | | | | | | | |
Income (loss) before income taxes | | | (35,715 | ) | | | (9.4 | ) | | | (44,587 | ) | | | (12.5 | ) | | | (21,204 | ) | | | (4.4 | ) | | | (49,054 | ) | | | (47.0 | ) | | | 18,998 | | | | 13.8 | |
| Income taxes (benefit) | | | (12,292 | ) | | | (3.2 | ) | | | (2,264 | ) | | | (0.6 | ) | | | 737 | | | | 0.1 | | | | 150 | | | | 0.1 | | | | 1,104 | | | | 0.8 | |
| | | | | | | | | | | | | | | | | | | | | | | | | | | | | | | |
Net income (loss) | | $ | (23,423 | ) | | | (6.2 | )% | | $ | (42,323 | ) | | | (11.8 | )% | | $ | (21,941 | ) | | | (4.5 | )% | | $ | (49,204 | ) | | | (47.1 | )% | | $ | 17,894 | | | | 13.0 | % |
| | | | | | | | | | | | | | | | | | | | | | | | | | | | | | | |
60
| | | | | | | | | | | | | | | | | | | | | | | | | | | | | | | | | | | | | | | | | | | |
| | | Year Ended March 31, | | | Three Months Ended June 30, | |
| | | | | | | |
| | | 2004(a) | | | 2005 | | | 2006 | | | 2005 | | | 2006 | |
| | | | | | | | | | | | | | | | |
| | | (Non-GAAP) | | | | | | | | | | | (Unaudited) | |
| | | (Dollars in thousands) | |
Segmented Results of Operations | | | | | | | | | | | | | | | | | | | | | | | | | | | | | | | | | | | | | | | | |
| Revenue by operating segment: | | | | | | | | | | | | | | | | | | | | | | | | | | | | | | | | | | | | | | | | |
| | Mining and site preparation | | $ | 235,772 | | | | 62.3 | % | | $ | 264,835 | | | | 74.1 | % | | $ | 366,721 | | | | 74.5 | % | | $ | 82,637 | | | | 79.2 | % | | $ | 111,387 | | | | 80.7 | % |
| | Piling | | | 48,982 | | | | 13.0 | | | | 61,006 | | | | 17.1 | | | | 91,434 | | | | 18.6 | | | | 20,030 | | | | 19.2 | | | | 23,276 | | | | 16.9 | |
| | Pipeline | | | 93,509 | | | | 24.7 | | | | 31,482 | | | | 8.8 | | | | 34,082 | | | | 6.9 | | | | 1,692 | | | | 1.6 | | | | 3,437 | | | | 2.4 | |
| | | | | | | | | | | | | | | | | | | | | | | | | | | | | | | |
| | | Total | | $ | 378,263 | | | | 100.0 | % | | $ | 357,323 | | | | 100.0 | % | | $ | 492,237 | | | | 100.0 | % | | | 104,359 | | | | 100.0 | % | | $ | 138,100 | | | | 100.0 | % |
| | | | | | | | | | | | | | | | | | | | | | | | | | | | | | | |
| Profit by operating segment: | | | | | | | | | | | | | | | | | | | | | | | | | | | | | | | | | | | | | | | | |
| | Mining and site preparation | | $ | 25,899 | | | | 47.4 | % | | $ | 11,617 | | | | 38.9 | % | | $ | 50,730 | | | | 61.7 | % | | $ | 11,689 | | | | 78.8 | % | | $ | 24,127 | | | | 73.6 | % |
| | Piling | | | 10,831 | | | | 19.8 | | | | 13,319 | | | | 44.6 | | | | 22,586 | | | | 27.4 | | | | 2,838 | | | | 19.1 | | | | 7,976 | | | | 24.3 | |
| | Pipeline | | | 17,946 | | | | 32.8 | | | | 4,902 | | | | 16.5 | | | | 8,996 | | | | 10.9 | | | | 309 | | | | 2.1 | | | | 659 | | | | 2.0 | |
| | | | | | | | | | | | | | | | | | | | | | | | | | | | | | | |
| | | Total | | $ | 54,676 | | | | 100.0 | % | | $ | 29,838 | | | | 100.0 | % | | $ | 82,312 | | | | 100.0 | % | | $ | 14,836 | | | | 100.0 | % | | $ | 32,762 | | | | 100.0 | % |
| | | | | | | | | | | | | | | | | | | | | | | | | | | | | | | |
| Equipment hours by operating segment: | | | | | | | | | | | | | | | | | | | | | | | | | | | | | | | | | | | | | | | | |
| | Mining and site preparation | | | 511,546 | | | | 73.6 | % | | | 673,613 | | | | 88.2 | % | | | 811,891 | | | | 93.0 | % | | | 174,714 | | | | 94.1 | % | | | 236,098 | | | | 95.1 | % |
| | Piling | | | 57,569 | | | | 8.3 | | | | 56,460 | | | | 7.4 | | | | 37,300 | | | | 4.3 | | | | 7,452 | | | | 4.0 | | | | 11,097 | | | | 4.5 | |
| | Pipeline | | | 126,033 | | | | 18.1 | | | | 33,847 | | | | 4.4 | | | | 24,197 | | | | 2.8 | | | | 3,585 | | | | 1.9 | | | | 1,102 | | | | 0.4 | |
| | | | | | | | | | | | | | | | | | | | | | | | | | | | | | | |
| | | Total | | | 695,148 | | | | 100.0 | % | | | 763,920 | | | | 100.0 | % | | | 873,388 | | | | 100.0 | % | | | 185,751 | | | | 100.0 | % | | | 248,297 | | | | 100.0 | % |
| | | | | | | | | | | | | | | | | | | | | | | | | | | | | | | |
| | |
| (a) | | The historical statement of operations and other financial data for the year ended March 31, 2004 have been derived from the historical financial statements of Norama Ltd. for the period from April 1, 2003 to November 25, 2003 and our historical financial statements for the period from November 26, 2003 to March 31, 2004. The pre- and post-Acquisition periods during the fiscal year ended March 31, 2004 have strictly been added together. The combined results do not reflect the results that would have been obtained had the Acquisition occurred at the beginning of the period. No pro forma adjustments have been made to attempt to reflect the results of operations that would have been attained had the Acquisition occurred at the beginning of the period. GAAP does not allow for such a combination of pre- and post-Acquisition periods. The Acquisition was primarily a change of ownership of the business we acquired from Norama Ltd., and we have operated the business in substantially the same manner as Norama Ltd. did before the Acquisition. Therefore, the pre- and post-Acquisition periods are presented on a combined basis to allow for a meaningful comparison to other full fiscal years. Any references to the fiscal year ended March 31, 2004 below shall refer to the combined periods. |
| |
| Three Months Ended June 30, 2006 Compared to Three Months Ended June 30, 2005 |
Revenue.Revenue increased by $33.7 million, or 32.3%, from $104.4 million for the three months ended June 30, 2005 to $138.1 million for the three months ended June 30, 2006.
| | |
| | • | Mining and Site Preparation.Mining and Site Preparation revenue increased by $28.8 million, or 34.8%, from $82.6 million for the three months ended June 30, 2005 to $111.4 million for the three months ended June 30, 2006, primarily due to increased activity in 2006 related to a large site preparation project for Shell and the continued ramp up on the CNRL overburden removal project in the Fort McMurray region. Additionally, there was a claim settlement arising from a site |
61
| | |
|
| | | preparation project completed during 2005 for which $6.1 million was recognized as revenue in the current reporting period. |
|
| |
|
| | • | Piling.Piling revenue increased by $3.2 million, or 16.5%, from $20.0 million for the three months ended June 30, 2005 to $23.3 million for the three months ended June 30, 2006, primarily due to a higher volume of projects in the Fort McMurray and Calgary regions because of strong economic and construction activities. |
|
| |
|
| | • | Pipeline.Pipeline revenue increased by $1.7 million, or 100.0%, from $1.7 million for the three months ended June 30, 2005 to $3.4 million for the three months ended June 30, 2006 due to an increase in work performed for EnCana. |
|
Project costs.Project costs increased by $0.5 million, or 0.7%, from $66.5 million for the three months ended June 30, 2005 to $67.0 million for the three months ended June 30, 2006. The small increase in project costs in relation to the large increase in revenue is primarily due to better performance on projects and the claim settlement as discussed above. As a percentage of revenue, project costs were 48.5% in the three months ended June 30, 2006 as compared to 63.8% in the three months ended June 30, 2005. This improvement was primarily due to better margins on site preparation projects and a changing project work mix from more labor-intensive projects in the three months ended June 30, 2005 to more equipment-intensive projects during the three months ended June 30, 2006.
Equipment costs.Equipment costs increased by $6.9 million, or 40.7%, from $17.0 million for the three months ended June 30, 2005 to $23.9 million for the three months ended June 30, 2006, primarily due to increased activity levels and higher repair and maintenance costs caused by increased usage of larger equipment and increased overhead and shop costs. As a percentage of revenue, equipment costs were 17.3% during the three months ended June 30, 2006 as compared to 16.3% during the three months ended June 30, 2005.
Equipment operating lease expense.Operating lease expense increased by $4.3 million, or 148.5%, from $2.9 million for the three months ended June 30, 2005 to $7.2 million for the three months ended June 30, 2006, primarily due to the addition of new leased equipment to support new projects, including the 10-year CNRL overburden project.
Depreciation.Depreciation expense increased by $2.3 million, or 46.6%, from $5.0 million for the three months ended June 30, 2005 to $7.3 million for the three months ended June 30, 2006. The increase was primarily due to the additional equipment hours related to higher activity levels, as our heavy equipment fleet is depreciated based on operated hours. As a percentage of revenue, depreciation increased to 5.3% from 4.8% primarily due to our use of more leased equipment relative to owned equipment.
Gross profit.Gross profit increased by $19.7 million, or 152.8%, from $12.9 million for the three months ended June 30, 2005 to $32.6 million for the three months ended June 30, 2006. As a percentage of revenue, gross profit increased to 23.6% for the fiscal period ended June 30, 2006 from 12.4% for the fiscal period ended June 30, 2005, primarily due to a claim settlement, improved performance on site preparation projects, increased activity levels and more efficient use of equipment as discussed above.
| | |
|
| | • | Mining and Site Preparation.Mining and Site Preparation operating segment profit increased by $12.4 million over the three months ended June 30, 2005. This was primarily due to increased project activity and better margins due to a claim settlement over the comparative period’s project work, as discussed above. |
|
| |
|
| | • | Piling.Piling operating segment profit increased $5.1 million due to increased volume and higher margin work primarily in the Fort McMurray and Calgary regions as discussed above. |
|
| |
|
| | • | Pipeline.Pipeline operating segment profit increased by $0.4 million compared to the three months ended June 30, 2005. Increased volume of work was the primary contributor to the increase in operating segment profit. |
|
62
General and administrative expenses.General and administrative expenses increased by $2.0 million, or 27.4%, from $7.3 million for the three months ended June 30, 2005 to $9.2 million for the three months ended June 30, 2006. The increase was primarily due to increased salaries as a result of bonus accruals resulting from our improved financial performance and higher professional fees for audit, legal and general consulting requirements compared to the three months ended June 30, 2005. As a percentage of revenue, general and administrative expenses were 6.7% for the three months ended June 30, 2006, compared to 6.9% for the three months ended June 30, 2005.
Amortization of intangible assets.Amortization of intangible assets was the same as the prior year period at $0.2 million for the three months ended June 30, 2006. The amortization of intangible assets during the three months ended June 30, 2006 and 2005 was related to trade names, a non-competition agreement and employee arrangements. Substantially all of the intangible assets had been amortized as of March 31, 2006 as the majority of the cost related to customer contracts in progress that were amortized at a rapid rate due to their short-term nature.
Operating income.Operating income increased by $17.9 million, or 343.9%, from $5.2 million for the three months ended June 30, 2005 to $23.1 million for the three months ended June 30, 2006. The increase was primarily due to the $19.7 million increase in gross profit, in addition there were $0.2 million less in losses from the disposal of plant and equipment, partially offset by the $2.0 million increase in general and administrative expenses.
Interest expense.Interest expense decreased by $39.7 million, or 79.6%, from $49.9 million for the three months ended June 30, 2005 to $10.2 million for the three months ended June 30, 2006. The reduction in interest expense was primarily due to the issuance of the Series B preferred shares in May 2005 and the requirement to record changes in the redemption value of the Series B preferred shares from the date of issuance to June 30, 2005 as interest expense. The shares were issued May 19, 2005 for cash proceeds of $7.5 million and by the end of June 30, 2005 the redemption value was $49.0 million, resulting in interest expense of $41.5 million for the three months ended June 30, 2005. Due to the amendment of the Series B preferred shares on March 30, 2006, interest expense is now being accreted from the carrying value on that date of $42.2 million to their redemption amount of $69.6 million in 2011. Interest expense for the three months ended June 30, 2006 included $0.7 million of accretion on the Seller preferred shares.
Foreign exchange gain.We recognized a foreign exchange gain of $13.4 million for the three months ended June 30, 2006 as compared to a loss of $1.2 million for the prior period ending June 30, 2005. Substantially all of the gain in the current period relates to the exchange difference between the Canadian and U.S. dollar on translation of the US$60.5 million of 9% senior secured notes issued in May 2005 and the US$200.0 million of 83/4% senior notes.
Financing costs.Financing costs were $nil for the three months ended June 30, 2006, a decrease of $2.1 million from the prior period ending June 30, 2005. During the three months ended June 30, 2005, financing costs included $0.3 million representing the issuance of the Series A preferred shares in May 2005, plus a charge of $1.8 million relating to the write off of deferred financing costs related to our previous senior secured credit facility that was repaid in May 2005.
Realized and unrealized loss on derivative financial instruments.The realized and unrealized loss on derivative financial instruments totaled $8.0 million for the three months ended June 30, 2006. The loss relates primarily to the change in the fair value of the derivatives, which are economic hedges related to our 83/4% senior notes. The realized and unrealized loss on the derivative financial instruments totaled $1.2 million for the three months ended June 30, 2005.
Income taxes.Income tax expense was $1.1 million for the three months ended June 30, 2006, as compared to $0.1 million for the three months ended June 30, 2005. Income tax expense as a percentage of income before tax for the three months ended June 30, 2006 differs from the statutory rate of 33.6% primarily due to the elimination of the valuation allowance of $5.9 million during the current quarter. For the quarter ended June 30, 2005, current income tax expense reflects only the federal large corporation
63
tax, which is a form of minimum tax as a full valuation allowance was recorded against our net future tax asset given the uncertainty of recognizing the benefit of the net future tax asset.
| |
| Fiscal Year Ended March 31, 2006 Compared to Fiscal Year Ended March 31, 2005 |
Revenue.Revenue increased by $134.9 million, or 37.8%, from $357.3 million for the fiscal year ended March 31, 2005 to $492.2 million for the fiscal year ended March 31, 2006.
| | |
| | • | Mining and Site Preparation.Mining and Site Preparation revenue increased by $101.9 million, or 38.5%, from $264.8 million for the fiscal year ended March 31, 2005 to $366.7 million for the fiscal year ended March 31, 2006, primarily due to activity in fiscal 2006 related to the large site preparation and underground utility installation and overburden removal project for CNRL and a substantial mining services project for Grande Cache Coal Corporation. Revenue generated by these projects in fiscal 2006 more than offset the decline in revenue resulting from the substantial completion of the Syncrude Upgrader Expansion, or UE-1, and OPTI/ Nexen Long Lake projects. In addition, we recognized $12.9 million of claims revenue and unbilled revenue in the fiscal year ended March 31, 2006 as a result of a change in accounting policy. See “Accounting Policy Changes – Revenue Recognition.” |
| |
| | • | Piling.Piling revenue increased by $30.4 million, or 49.9%, from $61.0 million for the fiscal year ended March 31, 2005 to $91.4 million for the fiscal year ended March 31, 2006, primarily due to a higher volume of projects in the Fort McMurray, Vancouver and Regina regions because of strong economic and construction activity, as well as the addition of several large piling projects, including projects for Suncor Energy and Flint Infrastructure Services Ltd. |
| |
| | • | Pipeline.Pipeline revenue increased by $2.6 million, or 8.3%, from $31.5 million for the fiscal year ended March 31, 2005 to $34.1 million for the fiscal year ended March 31, 2006 due to an increase in work performed for EnCana and CNRL in fiscal 2006. |
Project costs.Project costs increased by $68.0 million, or 28.2%, from $240.9 million for the fiscal year ended March 31, 2005 to $308.9 million for the fiscal year ended March 31, 2006, primarily due to higher activity levels. As a percentage of revenue, project costs were 62.8% in the fiscal year ended March 31, 2006 as compared to 67.4% in the prior fiscal year. The decline was primarily due to better performance on site preparation projects over the prior fiscal year and a changing project work mix from more labor-intensive projects in the prior fiscal year to more equipment-intensive projects in fiscal 2006.
Equipment costs.Equipment costs increased by $12.0 million, or 22.7%, from $52.8 million for the fiscal year ended March 31, 2005 to $64.8 million for the fiscal year ended March 31, 2006, primarily due to increased activity levels and higher repair and maintenance costs. Our heavy equipment fleet size increased by five units over the prior year fleet size of 457. As a percentage of revenue, equipment costs were 13.2% as compared to 14.8% in the prior fiscal year, primarily due to increased activity levels allowing higher efficiency usage of equipment.
Equipment operating lease expense.Equipment operating lease expense increased by $9.8 million, or 148.5%, from $6.6 million for the fiscal year ended March 31, 2005 to $16.4 million for the fiscal year ended March 31, 2006, primarily due to the addition of new leased equipment to support new projects, including the10-year CNRL overburden project.
Depreciation.Depreciation expense increased by $0.9 million, or 4.3%, from $20.8 million for the fiscal year ended March 31, 2005 to $21.7 million for the fiscal year ended March 31, 2006. The increase was primarily due to the increase in equipment hours related to higher activity levels, as our heavy equipment fleet is depreciated based on operated hours, which increase was partially offset by the use of more leased equipment. As a percentage of revenue, depreciation decreased to 4.4% from 5.8% primarily due to our use of more leased equipment relative to owned equipment.
Gross profit.Gross profit increased by $44.1 million, or 121.8%, from $36.2 million for the fiscal year ended March 31, 2005 to $80.3 million for the fiscal year ended March 31, 2006. As a percentage of
64
revenue, gross profit increased to 16.3% for the fiscal year ended March 31, 2006 from 10.1% for the fiscal year ended March 31, 2005, primarily due to improved performance on site preparation projects, increased activity levels and more efficient use of equipment.
Segment profit
| | |
| | • | Mining and Site Preparation.Mining and Site Preparation operating segment profit increased by $39.1 million over the prior year. This was primarily due to increased project activity and performance combined with efficient use of equipment and the loss recognition on a large steam-assisted gravity drainage site project in fiscal 2005. |
| |
| | • | Piling.Piling operating segment profit increased $9.3 million due to increased volume and higher margin work primarily in the Fort McMurray and Calgary regions. |
| |
| | • | Pipeline.Pipeline operating segment profit increased by $4.1 million over the prior year due to the 8.3% increase in revenue combined with higher margin work completed for CNRL and EnCana in the current year. |
General and administrative expenses.General and administrative expenses increased by $8.0 million, or 34.9%, from $22.9 million for the fiscal year ended March 31, 2005 to $30.9 million for the fiscal year ended March 31, 2006. The increase was primarily due to increased professional fees incurred in the first and second quarters of fiscal 2006 as a result of the May 2005 financing transactions and increased salaries as a result of bonus accruals from improved financial performance and our hiring of new executive officers and staff to manage increased activity and corporate requirements. As a percentage of revenue, general and administrative expenses were 6.3% for the fiscal year ended March 31, 2006, as compared to 6.4% for the fiscal year ended March 31, 2005.
Amortization of intangible assets.Amortization of intangible assets decreased by 79.4%, from $3.4 million for the fiscal year ended March 31, 2005 to $0.7 million for the fiscal year ended March 31, 2006. The amortization of intangible assets in both fiscal 2006 and fiscal 2005 was related to the customer contracts in progress, trade names, a non-competition agreement and employee arrangements that were acquired in the Acquisition on November 26, 2003. Substantially all of the cost of the intangible assets had been amortized as of March 31, 2006 as the majority of the cost relates to customer contracts in progress that were amortized at a rapid rate due to their short-term nature.
Operating income.Operating income increased by $40.0 million, or 425.5%, from $9.4 million for the fiscal year ended March 31, 2005 to $49.4 million for the fiscal year ended March 31, 2006. The increase was primarily due to the $44.1 million increase in gross profit, the $0.7 million gain from the disposal of property, plant and equipment and the $2.7 million reduction in amortization of intangible assets, partially offset by the $8.0 million increase in general and administrative expenses.
Interest expense.Interest expense increased by $37.7 million, or 121.2%, from $31.1 million for the fiscal year ended March 31, 2005 to $68.8 million for the fiscal year ended March 31, 2006. Interest expense increased by $5.6 million due to the issuance of US$60.5 million of 9% senior secured notes in May 2005 and by $34.7 million due to the changes in the redemption value of our Series B preferred shares which were issued in May 2005, partially offset by a $3.3 million decrease in interest expense due to full repayment of the borrowings under our senior secured credit facility in May 2005.
Foreign exchange gain.We recognized a foreign exchange gain of $14.0 million for the fiscal year ended March 31, 2006 as compared to a gain of $19.8 million for the prior fiscal year. Substantially all of the gain in fiscal 2006 related to the exchange difference between the Canadian and U.S. dollar on translation of the US$60.5 million of 9% senior secured notes issued in May 2005 and the US$200.0 million of 83/4% senior notes, while the gain in the prior fiscal year related only to the US$200.0 million of 83/4% senior notes.
Financing costs.Financing costs were $2.1 million for the fiscal year ended March 31, 2006, and there were no financing costs for the fiscal year ended March 31, 2005. Financing costs included
65
$0.3 million representing the issuance of the Series A preferred shares in May 2005, plus a write off of $1.8 million for deferred financing costs related to the previous senior secured credit facility that was repaid in May 2005.
Realized and unrealized loss on derivative financial instruments.The realized and unrealized loss on the cross-currency and interest rate swap agreements was $14.7 million for the fiscal year ended March 31, 2006. These losses relate primarily to themark-to-market changes in the fair value of the derivatives, which relate to the 83/4% senior notes. The realized and unrealized loss on the derivative financial instruments was $43.1 million for the fiscal year ended March 31, 2005.
Income taxes.Income tax expense was $0.7 million for the fiscal year ended March 31, 2006, as compared to a net benefit of $2.3 million for the fiscal year ended March 31, 2005. At March 31, 2006, we had accumulated non-capital losses for income tax purposes of approximately $66.4 million, the majority of which expire in 2012 and 2013. We have recorded a full valuation allowance to reduce the net future income tax asset to zero, reflecting the uncertainty of realizing the benefit of the losses before they expire. The income tax expense reflects only the Large Corporations Tax, which is a form of minimum tax.
| |
| Fiscal Year Ended March 31, 2005 Compared to Fiscal Year Ended March 31, 2004 |
Revenue.Revenue decreased by $21.0 million, or 5.6%, from $378.3 million for the fiscal year ended March 31, 2004 to $357.3 million for the fiscal year ended March 31, 2005.
| | |
| | • | Mining and Site Preparation.Mining and Site Preparation revenue increased by $29.0 million, or 12.3%, from $235.8 million for the fiscal year ended March 31, 2004 to $264.8 million for the fiscal year ended March 31, 2005. Contributing to this increase was revenue from new projects such as the underground utility installation contract for CNRL and the mining services contract for Grande Cache Coal Corporation, as well as the OPTI/ Nexen Long Lake project. Offsetting these increases were decreases in revenue from the Syncrude UE-1 project as this contract neared completion, the Syncrude Aurora II project as this contract was completed in the fiscal 2004, and the Albian site as they lowered their demand for contract services in fiscal 2005. |
| |
| | • | Piling.Piling revenue increased by $12.0 million, or 24.5% from $49.0 million for the fiscal year ended March 31, 2004 to $61.0 million for the fiscal year ended March 31, 2005, primarily due to a higher volume of contracts in the Vancouver, Regina and Fort McMurray regions due to strong economic activity, as well as the addition of large piling contracts for Flint Infrastructure Services Ltd. and Suncor Energy. This additional work more than offset the loss of revenue generated by the Syncrude UE-1 piling contract in fiscal 2004. |
| |
| | • | Pipeline. Pipeline revenue decreased by $62.0 million, or 66.3%, from $93.5 million for the fiscal year ended March 31, 2004 to $31.5 million for the fiscal year ended March 31, 2005, primarily due to a decrease in work performed for EnCana in fiscal 2005. The decrease in volume was primarily due to our customer repositioning its efforts in the region and drilling a much lower number of gas wells. |
Project costs. Project costs increased by $0.6 million, or 0.3%, from $240.2 million for the fiscal year ended March 31, 2004 to $240.9 million for the fiscal year ended March 31, 2005. As a percentage of revenue, project costs were 67.4% of revenue in the fiscal year ended March 31, 2005 as compared to 63.5% in the prior fiscal year. In the fiscal year ended March 31, 2005, abnormally high costs as a percentage of revenue were incurred on a large steam-assisted gravity drainage site project.
Equipment costs. Equipment costs decreased by $4.3 million, or 7.6%, from $57.2 million for the fiscal year ended March 31, 2004 to $52.8 million for the fiscal year ended March 31, 2005. As a percentage of revenue, equipment costs were 14.8% as compared to 15.1% in the prior fiscal year. Equipment maintenance costs were lower in fiscal 2005 because newer equipment added during the year required fewer repairs.
66
Equipment operating lease expense. Equipment operating lease expense decreased by $5.3 million, or 44.3%, from $11.9 million for the fiscal year ended March 31, 2004 to $6.6 million for the fiscal year ended March 31, 2005, primarily due to the purchase of equipment under operating leases in connection with the Acquisition on November 26, 2003.
Depreciation. Depreciation expense increased by $7.5 million, or 56.8%, from $13.2 million for the fiscal year ended March 31, 2004 to $20.8 million for the fiscal year ended March 31, 2005. As a percentage of revenue, depreciation increased to 5.8% from 3.5%. The increase was primarily due to the addition of new equipment resulting from the buy-out of the leased and rented equipment in November 2003 and increased depreciable asset values resulting from the revaluation of assets to their estimated fair values in accordance with the application of purchase accounting in connection with the Acquisition on November 26, 2003. The year-over-year increase in equipment hours also contributed to the increased depreciation expense for the fiscal year ended March 31, 2005.
Gross profit. Gross profit decreased by $19.5 million, or 35.1%, from $55.7 million for the fiscal year ended March 31, 2004 to $36.2 million for the fiscal year ended March 31, 2005, primarily due to loss recognition on a large steam-assisted gravity drainage site project and a significant decrease in revenue from our Pipeline segment. As a percentage of revenue, gross profit decreased to 10.1% for the fiscal year ended March 31, 2005 from 14.7% for the fiscal year ended March 31, 2004.
Segment profit
| | |
| | • | Mining and Site Preparation. Mining and Site Preparation segment profit decreased by $14.3 million, or 55.2%, from $25.9 million for the fiscal year ended March 31, 2004 to $11.6 million for the fiscal year ended March 31, 2005. This was primarily due to loss recognition on a large steam-assisted gravity drainage site project in fiscal 2005. |
| |
| | • | Piling. Piling segment profit increased by $2.5 million, or 23.2% from $10.8 million for the fiscal year ended March 31, 2004 to $13.3 million for the fiscal year ended March 31, 2005, primarily due to a higher volume of contracts in the Vancouver, Regina and Fort McMurray regions due to strong economic activity, as well as the addition of large piling contracts for Flint Infrastructure Services Ltd. and Suncor Energy. |
| |
| | • | Pipeline. Pipeline segment profit decreased by $13.0 million, or 72.6%, from $17.9 million for the fiscal year ended March 31, 2004 to $4.9 million for the fiscal year ended March 31, 2005, primarily due to a decrease in work performed for our major pipeline customer in fiscal 2005. |
General and administrative expenses. General and administrative expenses increased by $9.0 million, or 65.2%, from $13.8 million for the fiscal year ended March 31, 2004 to $22.9 million for the fiscal year ended March 31, 2005. As a percentage of revenue, general and administrative expenses increased from 3.7% to 6.4%. The increase was primarily attributable to higher staff levels, increased salaries, higher legal and consulting costs and increased professional fees related to North American Energy Partners’ restatement of two quarters of financial statements in the fiscal year ended March 31, 2005.
Amortization of intangible assets. Amortization of intangible assets decreased by $9.6 million, or 73.9%, from $12.9 million for the fiscal year ended March 31, 2004 to $3.4 million for the fiscal year ended March 31, 2005. The amortization of intangible assets in both fiscal 2005 and fiscal 2004 was related to the customer contracts in progress and related relationships, trade names, a non-competition agreement and employee arrangements that were acquired in the Acquisition on November 26, 2003. A majority of the cost of the intangible assets had been amortized as of March 31, 2005, as most of the costs related to customer contracts acquired in the Acquisition in November 2003 that were amortized at a rapid rate due to their short-term nature.
Operating income. Operating income decreased by $19.4 million, or 67.3%, from $28.8 million for the fiscal year ended March 31, 2004 to $9.4 million for the fiscal year ended March 31, 2005. The decrease was primarily due to the $19.5 million decrease in gross profit and the $9.0 million increase in general and administrative expenses, partially offset by the $9.6 million decrease in amortization expense.
67
Interest expense. Interest expense increased by $18.6 million, or 148.4%, from $12.5 million for the fiscal year ended March 31, 2004 to $31.1 million for the fiscal year ended March 31, 2005, primarily due to the addition of our 83/4% senior notes issued in November 2003, to finance a portion of the Acquisition and borrowings under our senior secured credit facility.
Foreign exchange gain. We recognized a foreign exchange gain of $19.8 million for the fiscal year ended March 31, 2005 as compared to a gain of $0.7 million for the prior fiscal year. The foreign exchange gains in both the current and prior periods related primarily to the change in the balance owed on the 83/4% senior notes due to the appreciation in the value of the Canadian dollar relative to the U.S. dollar.
Realized and unrealized loss on derivative financial instruments. For the fiscal year ended March 31, 2005, the realized and unrealized losses on our cross-currency and interest rate swap agreements related to our 83/4% senior notes were $2.7 million and $40.4 million, respectively, as compared to $0.9 million and $11.3 million, respectively, for the fiscal year ended March 31, 2004. The losses in both fiscal 2005 and fiscal 2004 related primarily to the changes in the fair value of the derivatives in the period due to the appreciation in the value of the Canadian dollar relative to the U.S. dollar.
Management fees. We did not incur any management fee expense for the fiscal year ended March 31, 2005. For the fiscal year ended March 31, 2004, we incurred management fee expense of $41.1 million. Management fees were fees charged for management services provided to the predecessor company by Norama Inc., its former parent company. Subsequent to the Acquisition on November 26, 2003, these fees are no longer paid.
Income taxes. We had a net benefit from income taxes of $2.3 million for the fiscal year ended March 31, 2005, as compared to a net benefit of $12.3 million for the fiscal year ended March 31, 2004. At March 31, 2005, we had accumulated non-capital losses for income tax purposes of approximately $90.8 million, the majority of which expire in 2012 and 2013. We recorded a full valuation allowance to reduce the net future income tax asset to zero, reflecting the uncertainty of realizing the benefit of the losses before they expire.
Comparative Quarterly Results
A number of factors contribute to variations in our results between periods, such as weather, timing of customer capital spending on large oil sands and natural gas related projects, our ability to manage our project related business so as to avoid or minimize periods of relative inactivity and the strength of the western Canadian economy.
| | | | | | | | | | | | | | | | | | | | | | | | | | | | | | | | | | | | | |
| | | | | | | | | | | | | | | | | | | Fiscal | |
| | | | | | | Year | |
| | | Fiscal Year 2005 | | | Fiscal Year 2006 | | | 2007 | |
| | | | | | | | | | |
| | | Q1 | | | Q2 | | | Q3 | | | Q4 | | | Q1 | | | Q2 | | | Q3 | | | Q4 | | | Q1 | |
| | | | | | | | | | | | | | | | | | | | | | | | | | | | |
| | | (In millions of dollars, except equipment hours) | |
| Revenue | | $ | 70.9 | | | $ | 82.7 | | | $ | 81.0 | | | $ | 122.7 | | | $ | 104.4 | | | $ | 124.0 | | | $ | 121.5 | | | $ | 142.3 | | | $ | 138.1 | |
| Gross profit | | | 8.1 | | | | 9.8 | | | | (5.7 | ) | | | 24.0 | | | | 12.9 | | | | 21.9 | | | | 13.8 | | | | 31.7 | | | | 32.6 | |
| Net income (loss) | | | (5.1 | ) | | | (4.7 | ) | | | (32.4 | ) | | | (0.1 | ) | | | (49.2 | ) | | | 11.5 | | | | 2.1 | | | | 13.7 | | | | 17.9 | |
| Equipment hours | | | 137,434 | | | | 193,205 | | | | 191,555 | | | | 241,727 | | | | 185,751 | | | | 234,649 | | | | 221,355 | | | | 231,633 | | | | 248,297 | |
The ratio of equipment hours incurred to revenue earned varies from quarter to quarter due to the mix of contract types, the mix and size of equipment used for each project and the mix of project cost types (materials, subcontractor expenses, labor and equipment) on each project.
Seasonality and Contract Timing
We generally experience a decline in revenues during our first quarter of each fiscal year due to seasonality, as weather conditions make operations in our operating regions difficult during this period. The level of activity in our mining and site preparation and pipeline installation segments declines when frost leaves the ground and many secondary roads are temporarily rendered incapable of supporting the weight
68
of heavy equipment. The duration of this period is referred to as “spring breakup” and has a direct impact on our activity levels. Our fourth quarter revenues are typically our highest as ground conditions are best and customers often begin spending their new capital expenditure budgets. The commencement or completion of large customer contracts during a quarter, changes in the mix of contract type and the mix of equipment used also can have significant impacts on variability of results from quarter to quarter. As a result,full-year results are not likely to be a direct multiple of any particular quarter or combination of quarters.
Consolidated Financial Position
At June 30, 2006, we had net working capital of $83.5 million compared to $68.5 million at March 31, 2006. The increase was primarily due to increased cash and cash equivalents of $2.3 million, increased work in progress generating higher accounts receivable and unbilled revenues of $3.7 million, an increase in prepaid expenses of $2.0 million, a $5.4 million net future income tax benefit, a decrease in accounts payable and accrued liabilities of $3.5 million, partially offset by an increase of $1.5 million billings in excess of costs on uncompleted projects, and an increase in the current portion of capital lease obligations of $0.4 million. It is our belief that cash generated from operations and available borrowings under our revolving credit facility will be sufficient to meet our present requirements.
At March 31, 2006, we had net working capital of $68.5 million compared to a net working capital position of $41.7 million at March 31, 2005. The increase was primarily due to increased cash and cash equivalents of $24.9 million, work in progress generating higher accounts receivable and unbilled revenue by $11.5 million, partially offset by an increase of $9.5 million in accounts payable, accrued liabilities, billings in excess of costs on uncompleted projects and current portion of capital lease obligations.
Plant and equipment net of depreciation increased by $5.7 million at June 30, 2006 from March 31, 2006 primarily due to the addition of large construction equipment to support growing operations.
Plant and equipment net of depreciation increased by $8.5 million at March 31, 2006 from March 31, 2005 primarily due to the construction of a shop to support the maintenance requirements of our10-year overburden removal project for CNRL and the expansion of our head office. A portion of the increase also resulted from equipment purchases to replace retired equipment.
Capital lease obligations, including the current portion, increased by $1.0 million at June 30, 2006 from March 31, 2006 due to the addition of new leased vehicles and a drill rig to support new projects.
Capital lease obligations, including the current portion, increased by $3.7 million at March 31, 2006 from the balance at March 31, 2005 due to the addition of new leased vehicles and a viper drill to support new projects.
Impairment of Goodwill
In accordance with Canadian Institute of Chartered Accountants’ Handbook Section 3062, “Goodwill and Other Intangible Assets”, we review our goodwill for impairment annually or whenever events or changes in circumstances suggest that the carrying amount may not be recoverable. We are required to test our goodwill for impairment at the reporting unit level and we have determined that we have three reporting units. The test for goodwill impairment is a two-step process:
| | |
| | • | Step 1 – We compare the carrying amount of each reporting unit to its fair value. If the carrying amount of a reporting unit exceeds its fair value, we have to perform the second step of the process. If not, no further work is required. |
| |
| | • | Step 2 – We compare the implied fair value of each reporting unit’s goodwill to its carrying amount. If the carrying amount of a reporting unit’s goodwill exceeds its fair value, an impairment loss will be recognized in an amount equal to that excess. |
69
We completed Step 1 of this test during the quarter ended December 31, 2005 and were not required to record an impairment loss on goodwill. We conduct our annual assessment of goodwill in December of each year.
Liquidity and Capital Resources
Operating activities for the three months ended June 30, 2006 resulted in a net increase in cash of $15.3 million. Increased income was partially offset by an increase in accounts receivable and a decrease in accrued liabilities. The net usage of cash in operating activities for the three months ended June 30, 2005 was $16.1 million primarily due to lower margin work on a major site grading project and unfavorable working capital changes.
Operating activities for the fiscal year ended March 31, 2006 resulted in a net increase in cash of $33.9 million. Increased earnings and accrued liabilities were partially offset by an increase in accounts receivable. The net usage of cash in operating activities for the fiscal year ended March 31, 2005 was $4.8 million primarily due to an increase in unbilled revenue due to billing delays and poor performance from a major site grading project. Operating activities for the fiscal year ended March 31, 2004 resulted in a net increase in cash of $15.5 million, primarily as a result of a decrease in accounts receivable.
During the three months ended June 30, 2006, we invested $4.7 million in sustaining capital expenditures and $7.1 million in growth capital expenditures, for total capital expenditures of $11.8 million. In the three months ended June 30, 2005, we invested $1.3 million in sustaining capital expenditures and $4.4 million in growth capital expenditures, for total capital expenditures of $5.7 million.
During the fiscal year ended March 31, 2006, we invested $7.4 million in sustaining capital expenditures and $21.6 million in growth capital expenditures, for total capital expenditures of $29.0 million. In the fiscal year ended March 31, 2005, we invested $7.5 million in sustaining capital expenditures and $18.2 million in growth capital expenditures, for total capital expenditures of $25.7 million. In the fiscal year ended March 31, 2004, we invested $0.5 million in sustaining capital expenditures and $2.0 million in growth capital expenditures, for total capital expenditures of $2.5 million. These capital expenditure amounts exclude any equipment additions financed under capital leases.
Sustaining capital expenditures are those that are required to keep our existing fleet of equipment at its optimum average age through maintenance or replacement. Growth capital expenditures relate to equipment additions required to perform increased sizes or numbers of projects.
Financing activities during the three months ended June 30, 2006 resulted in a cash outflow of $1.4 million, primarily as a result of capital lease repayments and financing costs. Financing activities during the three months ended June 30, 2005 resulted in a net cash inflow of $14.8 million. This was a result of the proceeds from the issuance of the US$60.5 million of 9% senior secured notes and $7.5 million of Series B preferred shares which were used to repay the amount outstanding under our senior secured credit facility and to pay for the fees and expenses related to the refinancing.
Financing activities during the fiscal year ended March 31, 2006 resulted in a cash inflow of $13.1 million. A portion of the proceeds from the issuance of the US$60.5 million of 9% senior secured notes and $7.5 million of Series B preferred shares was used to repay the amount outstanding under our senior secured credit facility and to pay the fees and expenses related to the refinancing. Payments of $2.2 million were also made on our capital lease obligations. Financing activities during the fiscal year ended March 31, 2005 related primarily to borrowings under our revolving credit facility, term credit facility scheduled repayments and repayment of capital lease obligations.
70
Our primary uses of cash are to purchase property, plant and equipment, fulfill debt repayment and interest payment obligations and finance working capital requirements.
We have outstanding US$200 million of 83/4% senior notes due 2011. The foreign currency risk relating to both the principal and interest payments on the 83/4% senior notes has been managed with a cross-currency swap and interest rate swaps which went into effect concurrent with the issuance. Interest of US$8.8 million is payable semi-annually in June and December of each year until the notes mature on December 1, 2011. The swap agreements are economic hedges of the changes in the Canadian dollar-U.S. dollar exchange rate, but they do not meet the criteria to qualify for hedge accounting. There are no principal payments required on the 83/4% senior notes until maturity.
Our US$60.5 million of 9% senior secured notes were issued on May 19, 2005 pursuant to a private placement. On July 26, 2005, we registered substantially identical notes with the United States Securities and Exchange Commission and exchanged them for the notes issued in the private placement. The foreign currency risk relating to both the principal and interest payments on the 9% senior secured notes has not been hedged. Interest of US$2.7 million is payable semi-annually in June and December of each year until the notes mature on June 1, 2010. There are no principal payments required on the 9% senior secured notes until maturity.
Further, one of our major contracts allows the customer to request up to $50 million in letters of credit. While this level has not been requested to date, we would either have to lower other letters of credit or cash collateralize other obligations to provide this amount of letters of credit.
We maintain a significant equipment and vehicle fleet comprised of units with various remaining useful lives. Once units reach the end of their useful lives, it becomes cost prohibitive to continue to maintain them and, therefore, they must be replaced. As a result, we are continually acquiring new equipment to replace retired units and to expand the fleet to meet growth as new projects are awarded to us. It is important to adequately maintain the large revenue-producing fleet in order to avoid equipment downtime which can impact our revenue stream and inhibit our ability to satisfactorily perform on our projects. In order to conserve cash, we have financed our recent requirements for large pieces of heavy construction equipment through operating leases. In addition, we continue to lease a portion of our motor vehicle fleet and assumed several heavy equipment operating leases from Norama Ltd. in connection with the Acquisition on November 26, 2003.
Our cash requirements during the three months ended June 30, 2006 and the fiscal year ended March 31, 2006 increased due to continued growth and additional operating and capital expenditures associated with new projects. Our cash requirements for fiscal 2007 include funding operating lease obligations, debt and interest repayment obligations and working capital as activity levels are expected to continue to increase. In addition, we will require capital to finance further vehicle and equipment acquisitions for upcoming new projects.
We expect our sustaining capital expenditures to range from $10 million to $15 million per year over the next two years. We expect our total capital expenditures to range from $50 million to $60 million in fiscal 2007. It is our belief that cash generated from operations and available borrowings under our revolving credit facility will be sufficient to meet these requirements.
Our principal sources of cash are funds from operations and borrowings under our revolving credit facility. We entered into an amended and restated credit agreement dated as of July 19, 2006 to provide for borrowings and the issuance of letters of credit of up to $55.0 million, subject to borrowing base limitations. As of July 20, 2006, we had approximately $37.0 million of available borrowings under the revolving credit facility after taking into account $18.0 million of outstanding and undrawn letters of credit to support bonding requirements and performance guarantees associated with customer contracts and operating leases. The facility bears interest at the Canadian prime rate plus 2%. The indebtedness under
71
the revolving credit facility, including the liability under the swaps used to manage the foreign currency risk on the 83/4% senior notes, is secured by substantially all of our assets and those of our subsidiaries, including accounts receivable, inventory and plant and equipment, and a pledge of the shares of the pre-amalgamated North American Energy Partners Inc. and that of its subsidiaries.
Our revolving credit facility contains covenants that restrict our activities, including restrictions on creating liens, engaging in mergers, consolidations and sales of assets, incurring additional indebtedness, giving guaranties, engaging in different businesses, making loans and investments, making certain capital expenditures and making certain dividend, debt and other restricted payments. Under the revolving credit facility, we also are required to satisfy certain financial covenants, including a minimum interest coverage ratio, a maximum leverage ratio and a minimum consolidated EBITDA requirement. Consolidated EBITDA is defined in the credit facility as the sum, without duplication, of (1) consolidated net income, (2) consolidated interest expense, (3) provisions for taxes based on income, (4) total depreciation expense, (5) total amortization expense, (6) costs and expenses incurred by us in entering into the credit facility, (7) accrual of stock-based compensation expense to the extent not paid in cash, and (8) other non-cash items (other than any such non-cash item to the extent it represents an accrual of or reserve for cash expenditures in any future period), but only, in the case of clauses (2)-(8), to the extent deducted in the calculation of consolidated net income, less other non-cash items added in the calculation of consolidated net income (other than any such non-cash item to the extent it will result in the receipt of cash payments in any future period), all of the foregoing as determined on a consolidated basis for us in conformity with GAAP. The required minimum trailing twelve months Consolidated EBITDA through December 31, 2006 is $65.5 million, and this minimum amount increases periodically until the credit facility matures. We believe Consolidated EBITDA as defined in the credit facility is an important measure of our liquidity.
The Series B preferred shares were initially issued by the pre-amalgamated North American Energy Partners Inc. for net cash proceeds of $7.5 million on May 19, 2005 to our existing common shareholders, including the sponsors. For additional information on the Series B preferred shares, see note 13(a) to our consolidated financial statements included elsewhere in this prospectus.
Between March 31, 2004 and May 19, 2005, it was necessary to obtain a series of waivers and amend our then-existing credit agreement to avoid or to cure our default of various covenants contained in that credit agreement. We ultimately replaced that credit agreement with a new credit agreement on May 19, 2005, which we replaced with our current amended and restated credit agreement dated as of July 19, 2006.
Our inability to file North American Energy Partners Inc.’s financial statements for the periods ended December 31, 2004, March 31, 2005 and September 30, 2005 with the SEC within the deadlines imposed by covenants in the indentures governing our 83/4% senior notes and our 9% senior secured notes caused us to be out of compliance with such covenants. In each case, we filed our financial statements before the non-compliance became an event of default under the indentures.
Outlook
Other than as described elsewhere herein, we are not aware of any events, trends, uncertainties, demands or commitments that would materially affect our future revenues, profitability, liquidity or capital resources or that would cause reported financial information not to be indicative of future operating results or financial condition.
72
Contractual Obligations and Other Commitments
Our principal contractual obligations relate to our long-term debt (83/4% senior notes and 9% senior secured notes), preferred shares and capital and operating leases. The following table summarizes our future contractual obligations, excluding interest payments unless otherwise noted, as of June 30, 2006.
| | | | | | | | | | | | | | | | | | | | | | | | | |
| | | Payments Due by Fiscal Year | |
| | | | |
| | | | | 2011 and | |
| | | Total | | | 2007 | | | 2008 | | | 2009 | | | 2010 | | | After | |
| | | | | | | | | | | | | | | | | | | |
| | | (In millions) | |
| Long-term debt(a) | | $ | 290.4 | | | $ | — | | | $ | — | | | $ | — | | | $ | — | | | $ | 290.4 | |
| Seller preferred shares | | | 35.0 | | | | — | | | | — | | | | — | | | | — | | | | 35.0 | |
| Series A preferred shares(b) | | | 1.0 | | | | — | | | | — | | | | — | | | | — | | | | 1.0 | |
| Series B preferred shares(b) | | | 69.6 | | | | — | | | | — | | | | — | | | | — | | | | 69.6 | |
| Capital leases (including interest) | | | 13.1 | | | | 4.0 | | | | 3.7 | | | | 3.1 | | | | 2.1 | | | | 0.2 | |
| Operating leases | | | 55.7 | | | | 17.5 | | | | 18.1 | | | | 9.8 | | | | 8.1 | | | | 2.2 | |
| | | | | | | | | | | | | | | | | | | |
| Total contractual obligations | | $ | 464.8 | | | $ | 21.5 | | | $ | 21.8 | | | $ | 12.9 | | | $ | 10.2 | | | $ | 398.4 | |
| | | | | | | | | | | | | | | | | | | |
| | |
|
| | (a) | Includes $223.0 million related to our 83/4% senior notes. We have entered into cross-currency and interest rate swaps, which represent an economic hedge of the 83/4% senior notes. At maturity, we will be required to pay $263.0 million in order to retire these senior notes and the swaps. This amount reflects the fixed exchange rate of C$1.315 = US$1.00 established as of November 26, 2003, the inception of the swap contracts. At June 30, 2006 the carrying value of the derivative financial instruments was $71.0 million. |
|
| |
|
| | (b) | Reflected at fully accreted redemption value. |
|
Off-Balance Sheet Arrangements
As of June 30, 2006, we had $18.0 million of outstanding, undrawn letters of credit issued under our revolving credit facility.
Stock-Based Compensation
Some of our directors, officers, employees and service providers have been granted options to purchase our common shares under a stock-based compensation plan. See “Management.”
Recently Adopted Canadian Accounting Pronouncements
Effective November 26, 2003, we prospectively adopted the provisions of CICA Accounting Guideline 13, “Hedging Relationships”(“AcG-13”), which specifies the circumstances in which hedge accounting is appropriate, including the identification, documentation, designation, and effectiveness of hedges, and the discontinuance of hedge accounting. We determined that all of our then existing derivative financial instruments did not qualify for hedge accounting on the adoption date ofAcG-13.
| |
| Generally accepted accounting principles |
Effective November 26, 2003, we adopted CICA Handbook Section 1100, “Generally Accepted Accounting Principles,” which establishes standards for financial reporting in accordance with Canadian GAAP, and describes what constitutes Canadian GAAP and its sources. This section also provides guidance on sources to consult when selecting accounting policies and determining appropriate disclosures when the primary sources of Canadian GAAP do not provide guidance. The adoption of this standard did not have a material impact on our consolidated financial statements.
73
Effective January 1, 2004, we prospectively adopted CICA Emerging Issues Committee Abstract No. 141, “Revenue Recognition,” and CICA Emerging Issues Committee Abstract No. 142, “Revenue Arrangements with Multiple Deliverables,” which incorporate the principles and guidance for revenue recognition provided under United States generally accepted accounting principles (“U.S. GAAP”). No changes to the recognition, measurement or classification of revenue were made as a result of the adoption of these standards.
| |
| Consolidation of variable interest entities |
Effective January 1, 2005, we prospectively adopted CICA Accounting Guideline 15, “Consolidation of Variable Interest Entities”(“AcG-15”). Variable interest entities (“VIEs”) are entities that have insufficient equity at risk to finance their operations without additional subordinated financial support and/or entities whose equity investors lack one or more of the specified essential characteristics of a controlling financial interest. AcG-15 provides specific guidance for determining when an entity is a variable interest entity (“VIE”) and who, if anyone, should consolidate the VIE. We have determined the joint venture in which we have an investment (see note 15(c) to our consolidated financial statements included elsewhere in this prospectus) qualifies as a VIE and began consolidating this VIE effective January 1, 2005.
| |
| Arrangements containing a lease |
Effective January 1, 2005, we adoptedEIC-150, “Determining Whether an Arrangement Contains a Lease” (“EIC-150”). EIC-150 addresses a situation where an entity enters into an arrangement, comprising a transaction that does not take the legal form of a lease but conveys a right to use a tangible asset in return for a payment or series of payments. The implementation of this standard did not have a material impact on our consolidated financial statements.
In April 2005, we adopted amendedEIC-144, “Accounting by a Customer (Including a Reseller) for Certain Consideration Received from a Vendor”(“EIC-144”).EIC-144 requires companies to recognize the benefit of non-discretionary rebates for achieving specified cumulative purchasing levels as a reduction of the cost of purchases over the relevant period, provided the rebate is probable and reasonably estimable. Otherwise, the rebates would be recognized as purchasing milestones are achieved. The implementation of this new standard did not have a material impact on our consolidated financial statements.
| |
| Accounting for convertible debt instruments |
In October 2005, the CICA issued EIC-158 “Accounting for Convertible Debt Instruments” (“EIC-158”) which provides guidance on whether an issuer of certain types of convertible debt instruments should classify the instruments as liabilities or equity and, if a liability, when it should be classified as a current liability. EIC-158 was applicable for convertible debt instruments issued after October 17, 2005. The adoption of this standard did not have an impact on our consolidated financial statements.
| |
| Non-monetary transactions |
Effective January 1, 2006, we adopted CICA Handbook Section 3831, “Non-monetary Transactions”. The new standard requires that an asset exchanged or transferred in a non-monetary transaction must be measured at its fair value except when: the transaction lacks commercial substance; the transaction is an exchange of production or property held for sale in the ordinary course of business for production or property to be sold in the same line of business to facilitate sales to customers other than the parties to the exchange; neither the fair value of the assets or services received nor the fair value of the assets or services given up is reliably measurable; or the transaction is a non-monetary, non-reciprocal transfer to owners that represents a spin-off or other form of restructuring or liquidation. In these cases, the transaction must
74
be measured at carrying value. The adoption of this standard did not have a material impact on our consolidated financial statements.
| |
| Implicit variable interests under AcG-15 |
Effective January 1, 2006, we adoptedEIC-157, “Implicit Variable Interests Under AcG-15”(“EIC-157”).EIC-157 requires a company to assess whether it has an implicit variable interest in a VIE or potential VIE when specific conditions exist. An implicit variable interest acts the same as an explicit variable interest except it involves the absorbing and/or receiving of variability indirectly from the entity (rather than directly). The identification of an implicit variable interest is a matter of judgment that depends on the relevant facts and circumstances. The adoption of this standard did not have a material impact on our consolidated financial statements.
| |
| Conditional asset retirement obligations |
In November 2005, the CICA issued EIC-159, “Conditional Asset Retirement Obligations” (“EIC-159”) to clarify the accounting treatment for a legal obligation to perform an asset retirement activity in which the timing and/or method of settlement are conditional on a future event that may or may not be within the control of the entity. Under EIC-159, an entity is required to recognize a liability for the fair value of a conditional asset retirement obligation if the obligation can be reasonably estimated. The guidance is effective April 1, 2006, although early adoption is permitted, and is to be applied retroactively, with restatement of prior periods. We adopted this standard in fiscal 2006, and the adoption did not have a material impact on our consolidated financial statements.
In January 2005, the CICA issued Handbook Section 3855, “Financial Instruments – Recognition and Measurement”, Handbook Section 1530, “Comprehensive Income”, and Handbook Section 3865, “Hedges”. The new standards are effective for interim and annual financial statements for fiscal years beginning on or after October 1, 2006, specifically April 1, 2007 for us. Earlier adoption is permitted. The new standards will require presentation of a separate statement of comprehensive income under specific circumstances. Foreign exchange gains and losses on the translation of the financial statements of self-sustaining subsidiaries previously recorded in a separate section of shareholder’s equity will be presented in comprehensive income. Derivative financial instruments will be recorded in the balance sheet at fair value and the changes in fair value of derivatives designated as cash flow hedges will be reported in comprehensive income. We are currently assessing the impact of the new standards.
Accounting Policy Changes
Effective April 1, 2005, we changed our accounting policy regarding the recognition of revenue on claims by reflecting the amount of claims revenue on unit price contracts and to provide better matching of revenues and expenses under the criteria set forth in AICPA Statement of Position 81-1. Prior to this change, revenue from claims was included in total estimated contract revenue when awarded or received. Once contract performance is underway, we often experience changes in conditions, client requirements, specifications, designs, materials and work schedule. Generally, a “change order” will be negotiated with our customer to modify the original contract to approve both the scope and price of the change. Occasionally, however, disagreements arise regarding changes, their nature, measurement, timing and other characteristics that impact costs and revenue under the contract. When a change becomes a point of dispute between our customer and us, we then consider it as a claim.
Costs related to change orders and claims are recognized when they are incurred. Change orders are included in total estimated contract revenue when it is probable that the change order will result in a bona fide addition to contract value and can be reliably estimated. Prior to April 1, 2005, revenue from claims was included in total estimated contract revenue when awarded or received. After April 1, 2005, claims are
75
included in total estimated contract revenue, only to the extent that contract costs related to the claim have been incurred, when it is probable that the claim will result in a bona fide addition to contract value and can be reliably estimated. Those two conditions are satisfied when (1) the contract or other evidence provides a legal basis for the claim or a legal opinion is obtained providing a reasonable basis to support the claim, (2) additional costs incurred were caused by unforeseen circumstances and are not the result of deficiencies in our performance, (3) costs associated with the claim are identifiable and reasonable in view of work performed and (4) evidence supporting the claim is objective and verifiable. This can lead to a situation where costs are recognized in one period and revenue, when the above conditions warrant recognition of the claim, occurs in subsequent periods. Historical claim recoveries should not be considered indicative of future claim recoveries. This change in policy resulted in an increase in claims revenue and unbilled revenue of approximately $6.1 million and $8.1 million for the three months ended June 30, 2006 and 2005, respectively, and $12.9 million for the year ended March 31, 2006, but did not result in any adjustments to prior periods. For additional information, refer to note 2(c) to our consolidated financial statements included elsewhere in this prospectus.
U.S. Generally Accepted Accounting Principles
Our consolidated financial statements have been prepared in accordance with Canadian GAAP, which differs in certain material respects from U.S. GAAP. The nature and effect of these differences are set out in note 23 to our consolidated financial statements included in this prospectus.
| |
| United States accounting pronouncements recently adopted |
In December 2003, the U.S. Financial Accounting Standards Board (the “FASB”) issued FASB Interpretation No. 46 (revised December 2003), “Consolidation of Variable Interest Entities” (“FIN 46R”), which addresses how a business enterprise should evaluate whether it has a controlling financial interest in an entity through means other than voting rights and accordingly should consolidate the entity. FIN 46R replaces FASB Interpretation No. 46, “Consolidation of Variable Interest Entities,” which was issued in January 2003. We are required to apply FIN 46R to variable interests in VIEs created after December 31, 2003. With respect to entities that do not qualify to be assessed for consolidation based on voting interests, FIN 46R generally requires a company that has a variable interest(s) that will absorb a majority of the VIE’s expected losses if they occur, receive a majority of the entity’s expected residual returns if they occur, or both, to consolidate that VIE. For variable interests in VIEs created before January 1, 2004, the Interpretation was applied beginning on January 1, 2005. For any VIEs that must be consolidated under FIN 46R that were created before January 1, 2004, the assets, liabilities and noncontrolling interests of the VIE initially would be measured at their carrying amounts with any difference between the net amount added to the balance sheet and any previously recognized interest being recognized as the cumulative effect of an accounting change. If determining the carrying amounts is not practicable, fair value at the date FIN 46R first applies may be used to measure the assets, liabilities and noncontrolling interest of the VIE. We have has determined the joint venture in which we have an investment (see note 15(c) to our consolidated financial statements included elsewhere in this prospectus) qualifies as a VIE.
Statement of Financial Accounting Standards No. 150, “Accounting for Certain Financial Instruments with Characteristics of both Liabilities and Equity,” was issued in May 2003. This Statement establishes standards for the classification and measurement of certain financial instruments with characteristics of both liabilities and equity. The Statement also includes required disclosures for financial instruments within its scope. We adopted the Statement as of January 1, 2004 except for certain mandatorily redeemable financial instruments. For certain mandatorily redeemable financial instruments, we adopted the Statement on January 1, 2005. The adoption of the standard required us to reclassify the carrying value of the Seller preferred shares from minority interest to redeemable preferred shares. After the adoption of the standard, we issued other mandatorily redeemable preferred shares that were within the scope of the standard, which have been disclosed in note 13(a) to our consolidated financial statements included elsewhere in this prospectus.
76
In November 2004, the FASB issued Statement of Financial Accounting Standards No. 151, “Inventory Costs.” This standard requires the allocation of fixed production overhead costs be based on the normal capacity of the production facilities and unallocated overhead costs recognized as an expense in the period incurred. In addition, other items such as abnormal freight, handling costs and wasted materials require treatment as current period charges rather than being considered an inventory cost. This standard was effective for fiscal 2006 for us. The adoption of this standard did not have a material impact on our financial statements.
In March 2005, the FASB issued FASB Interpretation No. 47, “Accounting for Conditional Asset Retirement Obligations, an interpretation of FASB Statement No. 143” (“FIN 47”), which requires an entity to recognize a liability for the fair value of a conditional asset retirement obligation when incurred if the liability’s fair value can be reasonably estimated. FIN 47 is effective for fiscal years ending after December 15, 2005. The adoption of this standard did not have a material impact on our financial statements.
Statement of Financial Accounting Standards No. 153, “Exchanges of Non-monetary Assets – an Amendment of APB Opinion 29” (“SFAS 153”), was issued in December 2004. Accounting Principles Board (“APB”) Opinion 29 is based on the principle that exchanges of non-monetary assets should be measured based on the fair value of assets exchanged. SFAS 153 amends APB Opinion 29 to eliminate the exception for non-monetary exchanges of similar productive assets and replaces it with a general exception for exchanges of non-monetary assets that do not have commercial substance. The standard is effective for us for non-monetary asset exchanges occurring in fiscal periods beginning after June 15, 2005, beginning July 1, 2005 for us. The adoption of this standard did not have a material impact on our financial statements.
In March 2005, FASB Staff Position FIN 46R-5, “Implicit Variable Interests under FASB Interpretation No. 46(R), Consolidation of Variable Interest Entities”, to address whether a company has an implicit variable interest in a VIE or potential VIE when specific conditions exist. The guidance describes an implicit variable interest as an implied financial interest in an entity that changes with changes in the fair value of the entity’s net assets exclusive of variable interests. An implicit variable interest acts the same as an explicit variable interest except that it involves the absorbing and/or receiving of variability indirectly from the entity (rather than directly). This guidance was adopted in 2006 and did not have a material impact on our consolidated financial statements.
Statement of Financial Accounting Standards No. 123R, “Share-Based Payment” (“SFAS 123R”) requires companies to recognize in the income statement, the grant-date fair value of stock options and other equity-based compensation issued to employees. The fair value of liability-classified awards is remeasured subsequently at each reporting date through the settlement date, while the fair value of equity-classified awards is not subsequently remeasured. The revised standard is effective for non-public companies beginning with the first annual reporting period that begins after December 15, 2005, which in our case is the period beginning April 1, 2006. We have used the fair value method under Statement 123 since its inception. We adopted SFAS 123R prospectively since we use the minimum value method for purposes of complying with Statement 123. The adoption of this standard did not have a material impact on our consolidated financial statements.
In May 2005, the FASB issued Statement of Financial Accounting Standards No. 154, “Accounting Changes and Error Corrections” (“SFAS 154”) which replaces Accounting Principles Board Opinions No. 20 “Accounting Changes” and Statement of Financial Accounting Standards No. 3, “Reporting Accounting Changes in Interim Financial Statements – An Amendment of APB Opinion No. 28.” SFAS 154 provides guidance on the accounting for and reporting of accounting changes and error corrections. It establishes retrospective application, or the latest practicable date, as the required method for reporting a change in accounting principle and the reporting of a correction of an error. SFAS 154 is effective for accounting changes and corrections of errors made in our fiscal year beginning on April 1, 2006. The adoption of this standard did not have a material impact on our consolidated financial statements.
77
| |
| Recent United States accounting pronouncements not yet adopted |
Statement of Financial Accounting Standards No. 155, “Accounting for Certain Hybrid Financial Instruments – an amendment of FASB Statements No. 133 and 140” (“SFAS 155”) was issued February 2006. This Statement is effective for all financial instruments acquired, issued, or subject to a remeasurement (new basis) event occurring after the beginning of an entity’s first fiscal year that begins after September 15, 2006. The fair value election provided for in paragraph 4(c) of this Statement may also be applied upon adoption of this Statement for hybrid financial instruments that had been bifurcated under paragraph 12 of Statement 133 prior to the adoption of this Statement. This states that an entity that initially recognizes a host contract and a derivative instrument may irrevocably elect to initially and subsequently measure that hybrid financial instrument, in its entirety, at fair value with changes in fair value recognized in earnings. SFAS 155 is applicable for all financial instruments acquired or issued in our 2007 fiscal year although early adoption is permitted. We are currently reviewing the impact of this Statement.
In June 2006, the FASB issued Interpretation No. 48, “Accounting for Uncertainty in Income Taxes — an interpretation of FASB Statement No. 109” (“FIN 48”) which clarifies the accounting for uncertainty in income taxes recognized in an enterprise’s financial statements in accordance with FASB Statement No. 109, “Accounting for Income Taxes”. FIN 48 prescribes a recognition threshold and measurement attribute for the financial statement recognition and measurement of a tax position taken or expected to be taken in a tax return. This Interpretation also provides guidance on derecognition, classification, interest and penalties, accounting in interim periods, disclosure, and transition requirements. We are currently reviewing the impact of this Interpretation. FIN 48 is effective for fiscal years beginning after December 15, 2006, specifically April 1, 2007 for us.
Statement of Financial Accounting Standards No. 157, “Fair Value Measurement” (“SFAS 157”) was issued September 2006. The Statement provides guidance for using fair value to measure assets and liabilities. The Statement also expands disclosures about the extent to which companies measure assets and liabilities at fair value, the information used to measure fair value, and the effect of fair value measurement on earnings. This Statement applies under other accounting pronouncements that require or permit fair value measurements. This Statement does not expand the use of fair value measurements in any new circumstances. Under this Statement, fair value refers to the price that would be received to sell an asset or paid to transfer a liability in an orderly transaction between market participants in the market in which the entity transacts. SFAS 157 is effective for us for fair value measurements and disclosures made by us in our fiscal year beginning on April 1, 2008. We are currently reviewing the impact of this statement.
Quantitative and Qualitative Disclosures Regarding Market Risk
We are subject to currency exchange risk as our 83/4% senior notes and 9% senior secured notes are denominated in U.S. dollars and all of our revenues and most of our expenses are denominated in Canadian dollars. We have entered into cross currency swap and interest rate swap agreements to manage the foreign currency risk on the 83/4% senior notes. The hedging instrument consists of three components: a U.S. dollar interest rate swap; a U.S. dollar-Canadian dollar cross-currency basis swap; and a Canadian dollar interest rate swap that results in us mitigating our exposure to the variability of cash flows caused by currency fluctuations relating to the US$200 million senior notes. The hedges can be cancelled at the counterparty’s option at any time after December 1, 2007 if the counterparty pays a cancellation premium. The premium is equal to 4.375% of the US$200 million if exercised between December 1, 2007 and December 1, 2008; 2.1875% if exercised between December 1, 2008 and December 1, 2009; and 0.000% if cancelled after December 1, 2009. We have not hedged the foreign currency risk on the 9% senior secured notes. Each $0.01 increase or decrease in the U.S. dollar-Canadian dollar exchange rate would change the interest cost on the 9% senior secured notes by $0.05 million per year.
78
We are subject to interest rate risk in connection with our revolving credit facility. The facility bears interest at variable rates based on the Canadian prime rate plus 2% or Canadian bankers’ acceptance rate plus 3%. Assuming our then-existing revolving credit facility was fully drawn at $40 million, excluding the $18 million of outstanding letters of credit at June 30, 2006, each 1.0% increase or decrease in the applicable interest rate would have changed the interest cost by $0.4 million per year. In the future, we may enter into interest rate swaps involving the exchange of floating for fixed rate interest payments to reduce interest rate volatility.
We also lease equipment with a variable lease payment tied to prime rates. At June 30, 2006, for each 1.0% annual fluctuation in this rate, annual lease expense will change by $0.2 million.
Inflation
The rate of inflation has not had a material impact on our operations as many of our contracts contain a provision for annual escalation. If inflation remains at its recent levels, it is not expected to have a material impact on our operations in the foreseeable future if we are able to pass cost increases along to our customers.
79
BUSINESS
Our Company
We are a leading resource services provider to major oil and natural gas and other natural resource companies, with a primary focus in the Canadian oil sands. We provide a wide range of mining and site preparation, piling and pipeline installation services to our customers across the entire lifecycle of their projects. We are the largest provider of contract mining services in the oil sands area, and we believe we are the largest piling foundations installer in western Canada. In addition, we believe that we operate the largest fleet of equipment of any contract resource services provider in the oil sands. Our total fleet includes over 555 pieces of diversified heavy construction equipment supported by over 570 ancillary vehicles. While our expertise covers heavy earth moving, piling and pipeline installation in any location, we have a specific capability operating in the harsh climate and difficult terrain of the oil sands and northern Canada. By understanding the terrain, having skilled personnel and a diverse, well-maintained and well-positioned fleet, we are able to meet the demands of a growing customer base.
Our core market is the oil sands, where we generated 71% of our fiscal 2006 revenue. The oil sands are located in three regions of northern Alberta: Athabasca, Cold Lake and Peace River. According to the Alberta Energy and Utilities Board, or EUB, Canada’s oil sands are estimated to hold 315 billion barrels of ultimately recoverable oil reserves, with established reserves of almost 174 billion barrels as of the end of 2004, second only to Saudi Arabia. According to the Canadian National Energy Board, or NEB, oil sands production of bitumen is expected to increase from 1.1 million barrels per day, or “bpd,” in 2005 to approximately 3.0 million bpd by 2015 and account for 75% of total Canadian oil output, compared to approximately 50% of output today. In order to achieve this increase in production, the NEB estimates that over $95 billion of capital expenditures by companies operating in the oil sands will be required through 2015.
Our significant knowledge, experience, equipment capacity and scale of operations in the oil sands differentiates us from our competition. Our principal customers are the major operators in the oil sands, including all three of the producers that currently mine bitumen, being Syncrude Canada Ltd., Suncor Energy Inc. and Albian Sands Energy Inc. (a joint venture among Shell Canada Limited, Chevron Canada Limited and Western Oil Sands Inc.). Canadian Natural Resources Limited, or CNRL, another significant customer, is developing a bitumen-mining project in the oil sands. We provide services to every company in the oil sands that uses surface mining techniques for its production. These surface mining techniques account for over 70% of total oil sands production. We also provide site construction services for in-situ producers, which use horizontally drilled wells to inject steam into deposits and pump bitumen to the surface.
We have long-term relationships with most of our customers. For example, we have been providing services to Syncrude Canada Ltd. and Suncor Energy Inc. since they pioneered oil sands development over 30 years ago. We believe our customers’ leases have an average remaining productive life of over 35 years. In addition, 34% of our revenues in fiscal 2006 were derived from recurring, long-term contracts, which assists in providing stability in our operations.
We provide services to our customers through three primary segments:
| | |
|
| | • | Mining and Site Preparation. Surface mining for oil sands and other natural resources, including overburden removal, hauling sand and gravel and supplying labor and equipment to support customers’ mining operations; construction of infrastructure associated with mining operations and reclamation activities; clearing, stripping, excavating and grading for mining operations and industrial site construction for mega-projects; and underground utility installation for plant, refinery and commercial building construction; |
|
| |
| | • | Piling. Installing all types of driven and drilled piles, caissons and earth retention and stabilization systems for industrial projects primarily focused in the oil sands and related petrochemical or refinery complexes, as well as commercial buildings and infrastructure projects; and |
80
| | |
| | • | Pipeline Installation. Installing transmission and distribution pipe made of various materials for oil, natural gas and water. |
As a result of our extensive experience and expertise in the oil sands, we are often engaged at an early stage to help our customers plan and estimate costs to develop oil sands projects which may entail the expenditure of several billions of dollars over the three to four year life of project construction. We provide our customers with information about working in the oil sands, including details about the differential in the cost of undertaking various projects in the summer or the winter, constructability, equipment availability and requirements and availability of labor. Our early stage or“first-in” involvement in projects gives us the opportunity to demonstrate our capability and insight into our customers’ plans and schedules, thereby allowing us to achieve greater accuracy in forecasting our future equipment and labor needs. With large trucks costing $3 million to $4 million each, shovels costing up to $20 million each, the global shortage of large truck tires and the lead times for delivery of this equipment extending many months into the future, the insight we gain about future projects facilitates our long-term planning.
For the year ended March 31, 2006, we had total revenue of $492.2 million and operating income of $49.4 million compared to total revenue of $357.3 million and operating income of $9.4 million for the year ended March 31, 2005. The following charts provide our revenues by segment and by end market for the year ended March 31, 2006:
Our History
NACG Holdings Inc. was formed in October 2003 in connection with the Acquisition. On October 31, 2003, two of our wholly-owned subsidiaries, as the buyers, entered into a purchase and sale agreement with Norama Ltd. and one of its subsidiaries, as the sellers. On November 26, 2003, pursuant to the purchase and sale agreement, Norama Ltd. sold to the buyers the businesses comprising North American Construction Group in exchange for total consideration of approximately $401 million, net of cash received and including the impact of certain post-closing adjustments. For further information regarding the Acquisition, see note 3 to our consolidated financial statements included elsewhere in this prospectus. The businesses we acquired from Norama Ltd. have been in operation since 1953. Prior to the Acquisition, NACG Holdings Inc. had no operations or significant assets, and the Acquisition was primarily a change of ownership of the businesses acquired. Subsequent to the Acquisition, we have operated the businesses in substantially the same manner as prior to the Acquisition.
81
Our Competitive Strengths
We believe our competitive strengths include:
We are the largest provider of contract mining services in the oil sands area, and we believe we are the largest piling foundations installer in western Canada. We have operated in western Canada for over 50 years and have participated in every significant oil sands mining project since operators first began working in the oil sands over 30 years ago. We believe we operate the largest fleet of any contract resource services provider in the oil sands. We are one of only a few companies capable of taking on long-term, large-scale projects with the major operators in the oil sands. In addition, we have extensive experience operating in the challenging working conditions created by the harsh climate and difficult terrain of the oil sands and northern Canada. We believe the combination of our significant size, extensive experience and broad service offerings has allowed us to develop our leading market position and reputation as the service provider of choice in the oil sands. For example, we have recently been selected by CNRL to provide substantial services under several contracts, including a10-year overburden removal contract.
| |
| Large, well-maintained equipment fleet strategically located in the Canadian oil sands |
As of March 31, 2006, we had a heavy equipment fleet of over 350 units located in the oil sands, made up of shovels, excavators, trucks and dozers. Many of these units are among the largest pieces of equipment in the world and are designed for use in the largest earthmoving and mining applications globally. In addition, we had over 270 ancillary vehicles located in the oil sands, including small shovels, excavators and trucks, as well as loaders, graders, scrapers, cranes, pipelayers and drill rigs, which allow us to execute a full range of jobs for our customers. Our large, diverse fleet gives us flexibility in scheduling jobs and allows us to be responsive to our customers’ needs. A well-maintained fleet is critical in the harsh climatic and environmental conditions we encounter. We operate four significant maintenance and repair centers, which are capable of accommodating the largest pieces of equipment in our fleet, on the sites of the major oil sands projects. These factors help us to be more efficient, thereby reducing costs to our customers to further improve our competitive edge, while concurrently increasing our equipment utilization and thereby improving our profitability.
In addition, we have a major repair facility located at our corporate headquarters near Edmonton, Alberta. This facility can perform the same major maintenance and repair activities as those maintenance centers in the oil sands and therefore acts as aback-up facility in the event of peak maintenance or repair requirements for oil sands equipment.
| |
| Broad service offering across a project’s lifecycle |
We provide our customers with resource services to meet their needs across the entire lifecycle of a project. These services include overburden removal, engineering assistance, construction of infrastructure, site grading, piling and pipe installation,day-to-day site maintenance, equipment supply, site upgrading services and land rehabilitation. Given the capital intensive and long-term nature of oil sands projects, our broad service offerings provide us with a competitive advantage and position us to transition from one stage of the project to the next, as we typically have knowledge of a project during its initial planning and budgeting phase. We use this knowledge to help secure contracts during the initial construction of the project as well as plan for recurring and follow-on work. As a result, we have a reputation as a“first-in, last-out” service provider in the oil sands. For example, we have both removed overburden and reclaimed land for Syncrude.
| |
| Long-term customer relationships |
We have worked successfully for many years and believe we have well-established relationships with major oil sands and conventional oil and gas producers. These relationships are based on our success in meeting our customers’ requirements, including strong safety and performance records, a well-maintained,
82
highly capable fleet with specific equipment dedicated to individual customers and a staff of well-trained, experienced supervisors, operators and mechanics. Historically, our largest customers by revenue have included Syncrude Canada Ltd., Suncor Energy Inc., Albian Sands Energy Inc. and EnCana Corporation. We have worked with oil sands mining operators Syncrude, Suncor and Albian since they began operations in the oil sands, which in the case of Syncrude and Suncor was over 30 years ago. We also have worked with EnCana for over 20 years, providing pipeline installation services throughout western Canada and, more recently, services to support its new in-situ mining operations in the oil sands.
| |
| Experienced management team |
Our management team has well-established relationships with major oil sands producers and other resource industry leaders in our core markets. We believe that our management team’s experience in the resource services and mining industries enhances our ability to accomplish our strategic objectives and effectively manage our transition from a private company to a public company. The entire management team is focused on further developing our culture of performance and accountability and continuing our tradition of offering high quality service to our customers. In addition, our management and operations teams have the local-level knowledge to identify acquisition opportunities.
Our Strategy
We intend to pursue the following strategies:
| |
| Capitalize on growth opportunities in the Canadian oil sands |
We intend to build on our market leadership position and successful track record with our customers in the oil sands to benefit from the expected rapid growth in this end market. The NEB estimates that between 2006 and 2015 $8.5 billion to $10.9 billion of annual capital expenditures, for a total of over $95 billion, will be required to achieve expected increases in production. We believe that these planned expenditures will not only allow us to increase our business from current projects but also create opportunities to provide our services to new projects. To capitalize on these opportunities, we plan to continue to add to our equipment fleet. This new equipment will be acquired in regular intervals and, together with our existing fleet, will enable us to compete for new business opportunities in the oil sands as they arise.
| |
| Leverage our complementary services |
We intend to build on our“first-in” position to cross-sell other services that we provide. Our complementary service segments, including site preparation, pipeline installation, piling and other mining services allow us to compete for many different forms of business. Given our technical capabilities, performance history andon-site presence, we are well positioned to compete for new business in our service segments. For example, either during or after providing site preparation services to customers, we can often use the specific knowledge of the project to provide other services such as underground pipeline installation or piling work. We are often able to provide these additional services seamlessly and quickly, utilizing existingon-site resources. Unplanned work requirements frequently arise with little notice, which we are well-positioned to execute, given ouron-site location and complementary service offerings. For example, during a recent site development project, we were asked with short lead time to install a large diameter water pipeline. We were able to coordinate our site development and pipeline projects such that we began installing pipeline on a completed portion of the site without impacting the site development schedule. Furthermore, we intend to pursue selective acquisition growth opportunities that expand our complementary service offerings.
| |
| Increase our recurring revenue base |
We provide services both during construction and while the project is in operation. Work required as an integral part of an operating project provides us with the opportunity to perform recurring services for
83
our customers. Over the past several years we have increased our recurring revenues from mining services, including overburden removal, reclamation, road construction and maintenance and surface mining, from 20% of revenues in fiscal 2004 to 34% in fiscal 2006. Oil sands operators’ needs for these types of services will increase as they expand their operations and as new oil sands operations come on line. We expect to increase the amount of revenues from recurring services to our existing customers. For our planning purposes, we estimate that there are typically annual outsourced operating expenses of approximately 2% to 10% of the total capital expenditures on a mining project.
| |
| Leverage long-term relationships with existing customers |
Several of our oil sands customers have announced intentions to increase their production capacity by expanding the infrastructure at their sites. We intend to continue to build on our relationships with these and other existing oil sands customers to win a substantial share of the mining and site preparation, piling and pipeline services outsourced in connection with these projects. For example, we worked closely with Albian and its largest shareholder, Shell, at the Muskeg River site during its development in 2001 and we were recently awarded new work on the Jackpine expansion project.
| |
| Increase our presence outside of the Canadian oil sands |
Canada has significant reserves of various natural resources, including diamonds, coal and gold. We intend to utilize the expertise we have gained in the oil sands to provide similar services to other natural resource mining companies. For example, we entered into a contract with De Beers in November 2005 to provide site preparation services over a27-month period at its second diamond mine in Canada. We are actively working with existing customers on additional “planning-stage” opportunities outside the oil sands.
| |
| Enhance operating efficiencies to improve revenue and margins |
We have initiated an operational improvement plan focused on implementing systems and process improvements, performance measurement techniques, enhanced communication and improved organizational effectiveness. This plan is designed to enhance our profitability, competitiveness and ability to effectively respond to opportunities in the markets we serve by improving the availability of our equipment through enhanced maintenance, providing the opportunity for increased utilization. Given our large fleet and the industry’s shortage of available machinery, we are implementing strategies to increase the utilization of our fleet by deploying our equipment more efficiently to improve revenues. This initiative will also enhance margins by taking advantage of the fixed-cost nature of our equipment. Our maintenance initiative will further improve margins by improving equipment availability and reducing repair time, thereby enabling us to deploy our fleet for longer periods of time and more frequently.
Our Markets
Our business is primarily driven by the demand for our services from the development, expansion and operation of oil sands projects. Decisions by oil sands operators to make capital investments are driven by a number of factors, with one of the most important being the expected long-term price of oil.
Oil sands are grains of sand covered by a thin layer of water and coated by heavy oil, or bitumen. Bitumen, because of its structure, does not flow, and therefore requires non-conventional extraction techniques to separate it from the sand and other foreign matter. There are currently two main methods of extraction: open pit mining, where bitumen deposits are sufficiently close to the surface to make it economically viable to recover the bitumen by treating mined sand in a surface plant; and in-situ, where bitumen deposits are buried too deep for open pit mining to be cost effective, and operators instead inject steam into the deposit so that the bitumen can be separated from the sand and pumped to the surface. We currently provide most of our services to companies operating open pit mines to recover bitumen reserves.
84
These customers utilize our services for surface mining, site preparation, piling, pipe installation, site maintenance, equipment and labor supply and land reclamation.
According to the EUB, the oil sands contained almost 174 billion barrels of established oil reserves as of the end of 2005, approximately 32 billion barrels of which is recoverable by open pit mining techniques. This is second only to Saudi Arabia’s 264 billion barrels and approximately six times the recoverable reserves in the United States. Beginning in the mid-1990’s, increasing global energy demand and improvements in mining and in-situ technology resulted in a significant increase in oil sands investments. This increased level of investment was also driven by a revised royalty regime adopted by the Government of Alberta in 1997, which was designed to accelerate investment in the oil sands. Under the revised royalty structure, oil sands operators pay a royalty of 1% of gross revenue until the operator has recovered all its allowed costs in respect of a project plus a return allowance, after which the royalty increases to the greater of 25% of net revenue or 1% of gross revenue.
Total Oil Reserves by Country
Source: Oil and Gas Journal, December 19, 2005
The following maps show the location of the oil sands and the primarily surface mineable leases within the oil sands.
Outlook. According to CAPP, approximately $36 billion was invested in the oil sands from 1996 through 2004. Oil sands production has grown four-fold since 1990 and exceeded one million barrels per day in 2005. The NEB expects oil sands production to reach approximately 3.0 million barrels per day and account for over 75% of total Canadian oil production by 2015. By comparison, the Ghawar field in Saudi Arabia currently produces 5.0 million barrels per day, representing over 6% of the world’s total production and over 50% of Saudi Arabia’s production.
85
Total Bitumen Production From the Oil Sands
The following chart shows the expected capital expenditures in the oil sands through 2015 according to the NEB’s 2006 Energy Market Assessment.
The NEB estimates that between 2006 and 2015 $8.5 billion to $10.9 billion of annual capital expenditures, for a total of over $95 billion, will be required to achieve expected increases in production. Both the CERI and the NEB have found that even at a price of approximately $25 per barrel the rate of oil sands supply can profitably double in the next 10 to 12 years. According to the NEB, as of June 2006, there were 21 mining and upgrader projects in various stages, ranging from announcement to construction, withstart-up dates through 2010. If all of these projects proceed as scheduled, the planned investment in new projects for 2006 through 2010 will exceed $38 billion and an additional $17 billion will be invested in project additions or existing projects over the same period. Beyond 2010, several new multibillion dollar projects and a number of smaller multimillion dollar projects are being considered by various oil sands operators. We intend to pursue business opportunities from these projects. According to the NEB, the 21 projects with start up dates through 2010 are as follows:
| | | | | | | | | | | | | | | | | |
| | | | | | | | | Bitumen | |
| | | | | | | Startup | | | Capacity | |
| Company | | Project Name | | | Status | | | Date | | | (bpd) | |
| | | | | | | | | | | | | |
| Athabasca Oil Sands Project (Albian) | | Muskeg River Mine Expansion and Debottleneck | | | Application | | | | 2010 | | | | 115,000 | |
| | | | Jackpine Mine | | | | Approved | | | | 2010 | | | | 100,000 | |
| | | | Scotford Upgrader Debottleneck | | | | Application | | | | 2007 | | | | 45,000 | |
| | | | Scotford Upgrader Expansion | | | | Application | | | | 2009 | | | | 90,000 | |
| CNRL | | | Horizon Mine and Upgrader | | | | Construction | | | | 2008 | | | | 135,000 | |
| Husky | | Lloydminster Upgrader Debottleneck | | | Construction | | | | 2006 | | | | 12,000 | |
| Imperial/ ExxonMobil | | | Kearl Mine | | | | Application | | | | 2010 | | | | 100,000 | |
86
| | | | | | | | | | | | | | | | | |
| | | | | | | | | Bitumen | |
| | | | | | | Startup | | | Capacity | |
| Company | | Project Name | | | Status | | | Date | | | (bpd) | |
| | | | | | | | | | | | | |
| OPTI/ Nexen | | | Long Lake Upgrader | | | | Construction | | | | 2007 | | | | 72,000 | |
| Suncor | | | Steepbank Debottleneck | | | | Construction | | | | 2006 | | | | 25,000 | |
| | | | Millennium Mine Debottleneck | | | | Construction | | | | 2008 | | | | 23,000 | |
| | | | Millennium Coker Unit | | | | Construction | | | | 2008 | | | | 116,000 | |
| | | | Voyageur Upgrader | | | | Application | | | | 2010 | | | | 156,000 | |
| Syncrude | | | Stage 3 Expansion | | | | Construction | | | | 2006 | | | | 116,300 | |
| Synenco | | | Northern Lights Mine | | | | Disclosure | | | | 2009 | | | | 50,000 | |
| | | | Northern Lights Upgrader | | | | Disclosure | | | | 2010 | | | | 50,000 | |
| Total E&P | | | Joslyn Mine | | | | Application | | | | 2010 | | | | 50,000 | |
| | | | Joslyn/Surmont Upgrader | | | | Announced | | | | 2010 | | | | 50,000 | |
| BA Energy | | | Heartland Upgrader Phase 1 | | | | Construction | | | | 2008 | | | | 54,400 | |
| | | | Heartland Upgrader Phase 2 | | | | Approved | | | | 2010 | | | | 54,400 | |
| North West Upgrading | | | North West Upgrader | | | | Application | | | | 2010 | | | | 50,000 | |
| Peace River Oil Upgrading | | | Bluesky Upgrader | | | | Announced | | | | 2010 | | | | 25,000 | |
Pipeline Infrastructure and Construction. To transport the increased production expected from the oil sands and to provide natural gas as an energy source to the oil sands region, significant investment will be required to expand pipeline capacity. To date, there have been significant greenfield and expansion projects announced, including: Kinder Morgan Canada’s proposal to expand the TransMountain pipeline system, which transports oil from the oil sands area to Burnaby, British Columbia; Enbridge Inc.’s proposed Gateway pipeline, which will transport oil from the oil sands area to Kitimat, British Columbia; the proposed Access Pipeline (a joint venture between MEG Energy Corp. and Devon ARL Canada Corp.), which will transport bitumen from the oil sands to refineries in Edmonton, Alberta and diluent from Edmonton, Alberta to the oil sands area; TransCanada Corporation’s proposed Keystone pipeline project, which will transport oil from Hardisty, Alberta to the Chicago area; and the proposed Spirit pipeline system (a joint venture between Kinder Morgan Canada and Pembina Pipeline Corporation), which will transport condensate from Kitimat, British Columbia to Edmonton, Alberta. We are in various stages of discussions to provide services for some of these projects. We believe that our service offerings and pipeline construction experience position us well to compete for the sizeable pipeline opportunities required for the expected growth in oil sands production.
We provide services to conventional oil and gas producers, in addition to our work in the oil sands. The Canadian Energy Pipeline Association estimates that over $20 billion of pipeline investment in Canada will be required for the development of new long haul pipelines, feeder systems and other related pipeline construction. Conventional oil and gas producers require pipeline installation services in order to connect producing wells to nearby pipeline systems. According to CAPP, Canada is one of the world’s largest producers of oil and gas, producing approximately 2.5 million barrels of oil per day and approximately 17.1 billion cubic feet of natural gas per day. Canadian natural gas production is expected to increase with the development of arctic gas reserves. A producer group has been formed by Imperial Oil Limited, ConocoPhillips Canada Limited, Shell Canada and the Aboriginal Pipeline Group for the purpose of bidding for work on the construction of a pipeline proposed to extend 1,220 kilometers (758 miles) from the MacKenzie River delta in the Beaufort Sea to existing natural gas pipelines in northern Alberta. Under the group’s proposal, Imperial Oil will lead the construction and operate the pipeline. We are actively working with Imperial Oil and have provided it with constructability and planning reviews. We hope to repeat our history of providing initial engineering assistance on projects and then subsequently being awarded contracts on these projects.
87
According to the government agency Natural Resources Canada, Canada is also one of the largest mining nations in the world, producing approximately 70 different minerals and metals. In 2004, the mining and minerals industries processing contributed $41.8 billion to the Canadian economy, an amount equal to approximately 4.0% of GDP. The value of minerals produced (excluding petroleum and natural gas) reached $26.4 billion in 2005. According to the EUB, Canada ranks tenth in the world in total proven coal reserves. Alberta contains 70% of Canada’s coal reserves and, by volume, produces approximately half of the coal mined in Canada annually.
The diamond mining industry in Canada is relatively new, having extracted diamonds for only eight years. According to Natural Resources Canada, the industry has grown from 2.6 million carats of production in 2000 to an estimated 12.3 million carats of production in 2005, representing a compounded annual growth rate of approximately 36%, and establishing Canada as the third largest diamond producing country in the world by value after Botswana and Russia. We believe Canadian diamond mining will continue to grow as existing mines increase production and new mine projects are developed. Outside the oil sands, we have identified the growing Canadian diamond mining industry as a primary target for new business opportunities.
We intend to build on our core services and strong regional presence to capitalize on the opportunities in the minerals mining industries of Canada. According to Natural Resources Canada’s 2004 estimate, the capital and repair expenditures needed to support the minerals mining industry would be over $5.6 billion in 2005.
| |
| Commercial and Public Construction |
According to the government agency Statistics Canada, the Canadian commercial and public construction market was approximately $22 billion in 2005. According to the Alberta government, the commercial and public construction market in Alberta is expected to grow 3% annually through 2009. As a result of the significant activity in the energy sector, western Canada has experienced and is expected to continue to experience strong economic and population growth. The Alberta government has responded to the potential strain that this growth will have on public facilities and infrastructure by allocating approximately $6.5 billion to improvement and expansion projects from 2004 to 2007. This need for infrastructure to support growth, along with historic under investment in infrastructure, provides for a strong infrastructure spending outlook.
The success of the energy industry in western Canada is also leading to increased commercial development in many urban centers in British Columbia and Alberta. According to the Alberta government, as of June 2006, the inventory of planned commercial, retail and residential projects in Alberta was valued at approximately $5.1 billion. These large expenditures will be further supplemented by the 2010 Olympic Winter Games, which will be held in the Vancouver area. The Organizing Committee of the Olympic Games estimates that the 2010 Olympic Winter Games will require an additional $3.0 billion in infrastructure and construction spending. The significant resources and capital intensive nature of the core infrastructure and construction services required to meet these demands, along with our strong local presence and significant regional experience, position us to implement our business model to capitalize on the large and growing infrastructure and construction demands of western Canada.
Our Operations
We provide our services through three primary segments: mining and site preparation, piling and pipeline installation. Over the past 50 years, we have developed an expertise operating in the difficult working conditions created by the climate and terrain of western Canada. We provide these services primarily for our oil and gas and other natural resource customers.
88
The chart below shows the revenues generated by each operating segment for the fiscal years ended March 31, 2002 through March 31, 2006:
| | | | | | | | | | | | | | | | | | | | | | | | | | | | | | | | | | | | | | | | | | |
| | | Year Ended March 31, | |
| | | | |
| | | 2002(a) | | | 2003(a) | | | 2004(a) | | | 2005 | | | 2006 | |
| | | | | | | | | | | | | | | | |
| | | | | | | | | | | (Non-GAAP) | | | | | | | |
| | | | | | | | | | | | | | | | | | |
| | | (Dollars in thousands) | |
| Mining and site preparation | | $ | 186,141 | | | | 74.6 | % | | $ | 245,235 | | | | 71.3 | % | | $ | 235,772 | | | | 62.4 | % | | $ | 264,835 | | | | 74.1 | % | | $ | 366,721 | | | | 74.5 | % |
| Piling | | | 35,132 | | | | 14.1 | | | | 61,006 | | | | 17.7 | | | | 48,982 | | | | 12.9 | | | | 61,006 | | | | 17.1 | | | | 91,434 | | | | 18.6 | |
| Pipeline installation | | | 28,078 | | | | 11.3 | | | | 37,945 | | | | 11.0 | | | | 93,509 | | | | 24.7 | | | | 31,482 | | | | 8.8 | | | | 34,082 | | | | 6.9 | |
| | | | | | | | | | | | | | | | | | | | | | | | | | | | | | | |
| | Total | | $ | 249,351 | | | | 100.0 | % | | $ | 344,186 | | | | 100.0 | % | | $ | 378,263 | | | | 100.0 | % | | $ | 357,323 | | | | 100.0 | % | | $ | 492,237 | | | | 100.0 | % |
| | | | | | | | | | | | | | | | | | | | | | | | | | | | | | | |
| | |
| | (a) | Revenues for the fiscal years ended March 31, 2002 and 2003 are of Norama Ltd., our predecessor company. Revenues for the fiscal year ended March 31, 2004 consist of the revenues of Norama Ltd. from April 1, 2003 to November 25, 2003, prior to the Acquisition, combined with our revenues from November 26, 2003 to March 31, 2004, after the Acquisition. The pre- and post- Acquisition periods during the fiscal year ended March 31, 2004 have strictly been added together. No pro forma adjustments have been made to attempt to reflect the revenues that would have been attained had the Acquisition occurred at the beginning of the period. GAAP does not allow for such a combination of pre- and post-Acquisition periods. The Acquisition was primarily a change of ownership of the business we acquired from Norama Ltd., and we have operated the business in substantially the same manner as Norama Ltd. did before the Acquisition. Therefore, the pre- and post-Acquisition periods are presented on a combined basis to allow for a meaningful comparison to other full fiscal years. |
| |
| Mining and site preparation |
Our mining and site preparation segment encompasses a wide variety of services. Our contract mining business represents an outsourcing of the equipment and labor component of the oil and gas and other natural resources mining business. Our site preparation services include clearing, stripping, excavating and grading for mining operations and other general construction projects, as well as underground utility installation for plant, refinery and commercial building construction. This business unit utilizes the vast majority of our equipment fleet and employs over 800 people. The majority of the employees and equipment associated with this business unit are located in the Canadian oil sands area.
For the fiscal years ended March 31, 2005 and 2006, revenues from this segment accounted for 74% and 75% of our total revenues, respectively.
Many oil sands and natural resource mining companies utilize contract services for mine site operations. Our mining services consist of overburden removal; the hauling of sand and gravel; mining of the ore body and delivery of the ore to the crushing facility; supply of labor and equipment to support the owners’ mining operations; construction of infrastructure associated with mining operations; and reclamation activities, which include contouring of waste dumps and placement of secondary materials and muskeg. The major producers outsource mine site operations to contractors such as our company to allow them to focus their resources on exploration and property development and to benefit from a variety of cost efficiencies that we can provide. We believe mining contractors typically have wage rates lower than those of the mining company and more flexible operating arrangements with personnel allowing for improved uptime and performance.
Oil sands operators use our services to prepare their sites for the construction of the mining infrastructure, including extraction plants and upgrading facilities, and for the eventual mining of the oil sands ore located on their properties. Outside of the oil sands, our site preparation services are used to assist in the construction of roads, natural resource mines, plants, refineries, commercial buildings, dams and irrigation systems. In order to successfully provide these types of services in the oil sands, our operators are required to use heavy equipment to transform barren terrain and difficult soil or rock conditions into a stable environment for site development. Our extensive fleet of equipment is used for clearing the earth of vegetation and removing topsoil that is not usable as a stable subgrade and site grading, which includes grading, leveling and compacting the site to provide a solid foundation for transportation or building. We also provide utility pipe installation for the private and public sectors in western Canada. We are experienced in working with piping materials such as HDPE, concrete, PVC and
89
steel. This work involves similar methods as those used for field, transmission and distribution pipelines in the oil and gas industry, but is generally more intricate and time consuming as the work is typically performed in existing plants with numerous tie-ins to live systems.
Our capabilities include the installation of all types of driven and drilled piles, caissons and earth retention and stabilization systems for commercial buildings; private industrial projects, such as plants and refineries; and infrastructure projects, such as bridges. Our piling business employs approximately 100 people. Oil and gas companies developing the oil sands and related infrastructure represented approximately two-thirds of our piling clients for fiscal 2006. The remaining one-third of our piling clients were primarily commercial construction builders operating in the Edmonton, Calgary, Regina and Vancouver areas.
In providing piling services, we currently operate a variety of crawler-mounted drill rigs, a fleet of25- to 100-ton capacity piling cranes and pile driving hammers of all types from our Edmonton, Calgary, Regina, Vancouver and Fort McMurray locations. Piles and caissons are deep foundation systems that extend up to 30 meters below a structure. Piles are long narrow shafts that distribute a load from a supported structure (such as a building or bridge) throughout the underlying soil mass and are necessary whenever the available footing area beneath a structure is insufficient to support the load above it. The foundation chosen for any particular structure depends on the strength of the rock or soil, magnitude of structural loads and depth of groundwater level.
For the fiscal years ended March 31, 2005 and 2006, revenues from this segment accounted for 17% and 19% of our total revenues, respectively.
We install field, transmission and distribution pipe made of steel, plastic and fiberglass materials. We employ our fleet of construction equipment and skilled technical operators to build and test the pipelines for the delivery of oil and natural gas from the producing field to the consumer. Our pipeline teams have expertise in hand welding selected grade pipe and in operating in the harsh conditions of remote regions in western and northern Canada.
For the last five fiscal years virtually all of our revenues in our pipeline business resulted from work performed for EnCana. Despite our limited client base in this segment over the past five years, we believe there are significant opportunities to increase our market share by capitalizing on the projected pipeline expansion in western Canada.
For the fiscal years ended March 31, 2005 and 2006, revenues from this segment accounted for 9% and 7% of our total revenues, respectively.
Equipment
We operate and maintain over 555 pieces of diversified heavy equipment, including crawlers, graders, loaders, mining trucks, compactors, scrapers and excavators, as well as over 570 ancillary vehicles, including various service and maintenance vehicles. The equipment is in good condition, normal wear and tear excepted. Our revolving credit facility and our 9% senior secured notes are secured by liens on substantially all of our equipment. See “Description of Certain Indebtedness.” We lease some of this equipment, which leases contain purchase options.
90
The following table sets forth information regarding our fleet of heavy equipment as of March 31, 2006:
| | | | | | | | | | | | | | | | |
| | | Capacity | | Horsepower | | | Number | | | Number | |
| Category | | Range | | Range | | | in Fleet | | | Leased | |
| | | | | | | | | | | | |
Mining and site preparation: | | | | | | | | | | | | | | |
| | Articulating trucks | | 30-42 tons | | | 305-460 | | | | 36 | | | | — | |
| | Mining trucks | | 50-330 tons | | | 650-2,700 | | | | 98 | | | | 29 | |
| | Shovels | | 36-58 cubic yards | | | 2,600-3,760 | | | | 4 | | | | 2 | |
| | Excavators | | 1-20 cubic yards | | | 94-1,350 | | | | 106 | | | | 15 | |
| | Crawler tractors | | N/A | | | 120-1,350 | | | | 90 | | | | 14 | |
| | Graders | | 14-24 feet | | | 150-500 | | | | 20 | | | | 8 | |
| | Scrapers | | 28-31 cubic yards | | | 450 | | | | 14 | | | | — | |
| | Loaders | | 1.5-16 cubic yards | | | 110-690 | | | | 44 | | | | 1 | |
| | Skidsteer loaders | | 1-2.25 cubic yards | | | 70-150 | | | | 38 | | | | — | |
| | Packers | | 44,175-68,796 lbs | | | 216-315 | | | | 20 | | | | — | |
Pipeline: | | | | | | | | | | | | | | |
| | Snow cats | | N/A | | | 175 | | | | 3 | | | | — | |
| | Trenchers | | N/A | | | 165 | | | | 2 | | | | — | |
| | Pipelayers | | 16,000-140,000 lbs | | | 78-265 | | | | 34 | | | | — | |
Piling: | | | | | | | | | | | | | | |
| | Drill rigs | | 60-135 feet (drill depth) | | | 210-1,500 | | | | 31 | | | | 2 | |
| | Cranes | | 25-100 tons | | | 200-263 | | | | 17 | | | | 1 | |
| | | | | | | | | | | | |
| Total | | | 557 | | | | 72 | |
| | | | | | | |
For the three months ended June 30, 2006 and 2005 and the fiscal years ended March 31, 2006, 2005 and 2004, we incurred expense of $23.9 million, $17.0 million, $64.8 million, $52.8 million and $57.2 million, respectively, to maintain our equipment in good working condition.
Customers
We derive a significant amount of our revenues from a small number of oil and gas companies. Our customer base includes major energy companies such as Syncrude, Albian, EnCana, Suncor and CNRL. We have large mining customers outside of the oil sands, including De Beers. We also perform commercial construction-related services for other customers in the public and private sectors. Our largest three customers for the fiscal year ended March 31, 2006, CNRL, Syncrude and Grande Cache Coal Corp., accounted for 32%, 16% and 10% of our revenues, respectively. Collectively, our five largest customers accounted for 69% and 68% of our revenues for the fiscal years ended March 31, 2006 and 2005, respectively. We have relatively few customers in our mining and site preparation and pipeline installation segments and many small customers in our piling segment. For the last five fiscal years, the majority of our revenues in our pipeline business resulted from work performed for EnCana.
Contracts
We complete work under the following types of contracts: cost-plus, time-and-materials, unit-price and lump sum. Each contract contains a different level of risk associated with its formation and execution.
Cost-plus.A cost-plus contract is where all work is completed based on actual costs incurred to complete the work. These costs include all labor, equipment, materials and any subcontractor’s costs. In addition to these direct costs, all site and corporate overhead costs are charged to the job. An agreed upon fee in the form of a fixed percentage is then applied to all costs charged to the project. This type of
91
contract is utilized where the project involves a large amount of risk or the scope of the project cannot be readily determined.
Time-and-materials.A time-and-materials contract involves using the components of a cost-plus job to calculate rates for the supply of labor and equipment. In this regard, all components of the rates are fixed and we are compensated for each hour of labor and equipment supplied. The risk associated with this type of contract is the estimation of the rates and incurring expenses in excess of a specific component of the agreed upon rate. Therefore, any cost overrun must come out of the fixed margin included in the rates.
Unit-price.A unit-price contract is utilized in the execution of projects with large repetitive quantities of work and is commonly utilized for site preparation, mining and pipeline work. We are compensated for each unit of work we perform (for example, cubic meters of earth moved, lineal meters of pipe installed or completed piles). Within the unit price contract, there is an allowance for labor, equipment, materials and any subcontractor’s costs. Once these costs are calculated, we add any site and corporate overhead costs along with an allowance for the margin we want to achieve. The risk associated with this type of contract is in the calculation of the unit costs with respect to completing the required work.
Lump sum.A lump sum contract is utilized when a detailed scope of work is known for a specific project. Thus, the associated costs can be readily calculated and a firm price provided to the customer for the execution of the work. The risk lies in the fact that there is no escalation of the price if the work takes longer or more resources are required than were estimated in the established price. The price is fixed regardless of the amount of work required to complete the project.
The mix of contract types varies year-by-year. For the fiscal year ended March 31, 2006, our contracts consisted of 15% cost-plus, 27% time-and-materials, 44% unit-price and 14% lump sum.
In addition to the contracts listed above, we also use master service agreements for work in the oil and gas sector where the scope of the project is not known and timing is critical to ensure the work gets completed. The master service agreement is a form of atime-and-materials agreement that specifies what rates will be charged for the supply of labor and equipment to undertake work. The agreement does not identify any specific scope or schedule of work. In this regard, the customer’s representative establishes what work is to be done at each location. We use master service agreements with the work we perform for EnCana.
We also do a substantial amount of work as a subcontractor where we are governed by the contracts with the general contractor to which we are not a party. Subcontracts vary in type and conditions with respect to the pricing and terms and are governed by one specific prime contract that governs a large project generally. In such cases, the contract with the subcontractors contains more specific provisions regarding a specified aspect of a project.
Material Contracts
We are party to the following material contracts, other than contracts entered into in the ordinary course of our business:
Employment Agreements with Executive Officers.Please see “Management — Written Employment Arrangements” for information regarding these contracts.
Advisory Services Agreements.Please see “Related Party Transactions — Advisory Services Agreement” for information regarding this agreement. This agreement will be terminated in connection with this offering.
Office Leases with Company Owned by a Director.Please see “Related Party Transactions — Office Leases” for information regarding these leases.
92
Voting and Corporate Governance Agreement.Please see “Related Party Transactions — Voting and Corporate Governance Agreement” for information regarding this agreement. This agreement will terminate upon completion of this offering.
Registration Rights Agreement.Please see “Related Party Transactions — Registration Rights Agreement” for information regarding this agreement.
Revolving Credit Facility.Please see “Description of Certain Indebtedness — Revolving Credit Facility” for information regarding the amended and restated credit agreement that provides our revolving credit facility.
Indentures Governing Our 9% Senior Secured Notes due 2010 and 83/4% Senior Notes due 2011.Please see “Description of Certain Indebtedness — 9% Senior Secured Notes due 2010” and “ — 83/4% Senior Notes due 2011” for information regarding these indentures.
Shareholders Agreements.Please see “Description of Share Capital — Shareholders Agreements” for information regarding this agreement. Both shareholders agreements will terminate upon completion of this offering.
Subsidiaries
After completion of the Reorganization, our subsidiaries will consist of the following, each of which will be directly or indirectly wholly-owned by us.
| | | |
| | | State or Other Jurisdiction of |
| Name | | Incorporation or Organization |
| | | |
| North American Construction Group Inc. | | Canada |
| North American Caisson Ltd. | | Alberta, Canada |
| North American Construction Ltd. | | Canada |
| North American Engineering Inc. | | Alberta, Canada |
| North American Enterprises Ltd. | | Alberta, Canada |
| North American Industries Inc. | | Alberta, Canada |
| North American Maintenance Ltd. | | Alberta, Canada |
| North American Mining Inc. | | Alberta, Canada |
| North American Pipeline Inc. | | Alberta, Canada |
| North American Road Inc. | | Alberta, Canada |
| North American Services Inc. | | Alberta, Canada |
| North American Site Development Ltd. | | Alberta, Canada |
| North American Site Services Inc. | | Alberta, Canada |
| Griffiths Pile Driving Inc. | | Alberta, Canada |
| NACG Finance LLC | | Delaware |
Joint Venture
We are party to a joint venture operated through a corporation called Noramac Ventures Inc., or Noramac, with Fort McKay Construction Ltd. created for the purpose of performing contracts for the construction, development and operation of open-pit mining projects within a 50 kilometre radius of Fort McKay, Alberta, which require the provision of heavy construction equipment. The affairs of Noramac are managed, and all decisions and determinations with respect to Noramac are made, by a management committee equally represented by us and our partner. The management committee is responsible for determining the percentage of work in relation to each contract that will be performed by us and by our partner, provided that contracts for a duration of less than two years and of a tender value between $10.0 million and $100.0 million which require a parent guarantee or performance bond will be subcontracted to us. The joint venture agreement provides that if the management committee does not tender for a contract, or fails to reach agreement on the terms upon which Noramac will tender for a contract, we or our partner may pursue the contract in our respective capacities without hindrance,
93
interference or participation by the other party. The joint venture agreement does not prohibit or restrict us from undertaking and performing, for our own account, any work for existing customers other than work to be performed by Noramac pursuant to an existing contract between Noramac and such customer. The joint venture is accounted for as a variable interest entity and consolidated in our financial statements.
Major Suppliers
We have long-term relationships with the following equipment suppliers: Finning International Inc. (45 years), Wajax Income Fund (20 years) and Brandt Tractor Ltd. (30 years). Finning is a major Caterpillar heavy equipment dealer for Canada. Wajax is a major Hitachi equipment supplier to us for both mining and construction equipment. We purchase or rent John Deere equipment, including excavators, loaders and small bulldozers, from Brandt Tractor. In addition to the supply of new equipment, each of these companies is a major supplier for equipment rentals, parts and service labor.
We obtain tires for our equipment from local distributors. Tires of the size and specifications we require are generally in short supply. We expect the supply/demand imbalance for certain tires to continue for some time.
Competition
Our business is highly competitive in each of our markets. Historically, the majority of our new business was awarded to us based on past client relationships without a formal bidding process, in which typically a small number of pre-qualified firms submit bids for the project work. Recently, in order to generate new business with new customers, we have had to participate in formal bidding processes. As new major projects arise, we expect to have to participate in bidding processes on a meaningful portion of the work available to us on these projects. Factors that impact competition include price, safety, reliability, scale of operations, availability and quality of service. Most of our clients and potential clients in the oil sands area operate their own heavy mining equipment fleet. However, these operators have historically outsourced a significant portion of their mining and site preparation operations and other construction services.
Our principal competitors in the mining and site preparation segment include Cross Construction Ltd., Klemke Mining Corporation, Ledcor Construction Limited, Neegan Development Corporation Ltd., Peter Kiewit Sons Co., Tercon Contractors Ltd., Sureway Construction Ltd. and Thompson Bros. (Constr) Ltd. The main competition to our deep foundation piling operations comes from Agra Foundations Limited and Double Star Co. The primary competitors in the pipeline installation business include Ledcor Construction Limited, Washcuk Pipe Line Construction Ltd. and Midwest Management (1987) Ltd. Voice Construction Ltd. and I.G.L. Industrial Services are the major competitors in underground utilities installation.
In the public sector, we compete against national firms, and there is usually more than one competitor in each local market. Most of our public sector customers are local governments that are focused on serving only their home regions. Competition in the public sector continues to increase, and we typically choose to compete on projects only where we can utilize our equipment and operating strengths to secure profitable business.
Properties and Facilities
We own and lease a number of buildings and properties for use in our business. Our administrative functions are located at our headquarters near Edmonton, Alberta, which also houses a major equipment maintenance facility. Project management and equipment maintenance are also performed at regional facilities in Calgary and Fort McMurray, Alberta; Vancouver, Fort Nelson and Prince George, British Columbia; and Regina, Saskatchewan. We occupy office and shop space in British Columbia, Alberta and Saskatchewan under leases which expire between late 2007 and 2011, subject to various renewal and termination rights. We expect to renew our office lease that expires in 2007 with rates that are competitive with the prevailing markets rates at that time. We also occupy, without charge, some customer-provided
94
lands. Our revolving credit facility and our 9% senior secured notes are secured by liens on substantially all of our properties. See “Description of Certain Indebtedness.” The following table describes our primary facilities.
| | | | | |
| Location | | Function | | Owned or Leased |
| | | | | |
| Acheson, Alberta | | Corporate headquarters and major equipment repair facility | | Leased(a) |
| |
| Calgary, Alberta | | Regional office and equipment repair facility – piling operations | | Building Owned
Land Leased(b) |
| |
Syncrude Mine Site,
South End
Fort McMurray, Alberta | | Regional office and major equipment repair facility – earthworks and mining operations | | Building Owned
Land Provided |
| |
Syncrude Plant Site
Fort McMurray, Alberta | | Satellite office and minor repair facility – all operations | | Building Rented(c)
Land Provided |
| |
CNRL Plant Site
Fort McMurray, Alberta | | Site office and maintenance facility | | Facility Owned
Land Provided |
| |
Aurora Mine Site
Fort McMurray, Alberta | | Satellite office and equipment repair facility – all operations | | Building Under
Construction
Land Provided |
| |
Albian Sands Mine Site
Fort McMurray, Alberta | | Satellite office and equipment repair facility – all operations | | Building Leased(d)
Land Provided |
| |
| New Westminster, British Columbia | | Regional office and equipment repair facility – piling operations | | Building Owned
Land Leased(e) |
| |
| Fort Nelson, British Columbia | | Satellite office – pipeline operations | | Leased(f) |
| |
| Regina, Saskatchewan | | Regional office and equipment repair facility – piling operations | | Leased(g) |
| | |
| (a) | | Lease expires November 30, 2007. |
| |
| (b) | | Lease expires December 31, 2010. |
| |
| (c) | | Lease expires November 30, 2009. |
| |
| (d) | | Leased on a month-to-month basis. |
| |
| (e) | | Lease expires March 31, 2010. |
| |
| (f) | | Lease expires July 10, 2008. |
| |
| (g) | | Lease expires March 14, 2008. |
Our locations were chosen for their geographic proximity to our major customers. We believe our facilities are sufficient to meet our needs for the foreseeable future.
Law and Regulations and Environmental Matters
Many aspects of our operations are subject to various federal, provincial and local laws and regulations, including, among others:
• permitting and licensing requirements applicable to contractors in their respective trades,
• building and similar codes and zoning ordinances,
• laws and regulations relating to consumer protection and
• laws and regulations relating to worker safety and protection of human health.
95
We believe we have all material required permits and licenses to conduct our operations and are in substantial compliance with applicable regulatory requirements relating to our operations. Our failure to comply with the applicable regulations could result in substantial fines or revocation of our operating permits.
Our operations are subject to numerous federal, provincial and municipal environmental laws and regulations, including those governing the release of substances, the remediation of contaminated soil and groundwater, vehicle emissions and air and water emissions. These laws and regulations are administered by federal, provincial and municipal authorities, such as Alberta Environment, Saskatchewan Environment, the British Columbia Ministry of Environment, and other governmental agencies. The requirements of these laws and regulations are becoming increasingly complex and stringent, and meeting these requirements can be expensive. The nature of our operations and our ownership or operation of property expose us to the risk of claims with respect to environmental matters, and there can be no assurance that material costs or liabilities will not be incurred with such claims. For example, some laws can impose strict, joint and several liability on past and present owners or operators of facilities at, from or to which a release of hazardous substances has occurred, on parties who generated hazardous substances that were released at such facilities and on parties who arranged for the transportation of hazardous substances to such facilities. If we were found to be a responsible party under these statutes, we could be held liable for all investigative and remedial costs associated with addressing such contamination, even though the releases were caused by a prior owner or operator or third party. We are not currently named as a responsible party for any environmental liabilities on any of the properties on which we currently perform or have performed services. However, our leases typically include covenants which obligate us to comply with all applicable environmental regulations and to remediate any environmental damage caused by us to the leased premises. In addition, claims alleging personal injury or property damage may be brought against us if we cause the release of, or any exposure to, harmful substances.
Capital expenditures relating to environmental matters during the three months ended June 30, 2006 and 2005 and the fiscal years ended March 31, 2006, 2005 and 2004 were not material. We do not currently anticipate any material adverse effect on our business or financial position as a result of future compliance with applicable environmental laws and regulations. Future events, however, such as changes in existing laws and regulations or their interpretation, more vigorous enforcement policies of regulatory agencies or stricter or different interpretations of existing laws and regulations may require us to make additional expenditures which may be material.
Employees and Labor Relations
As of June 30, 2006, we had over 150 salaried and over 1,200 hourly employees. We also utilize the services of subcontractors in our construction business. Approximately 10% to 15% of the construction work we do is done through subcontractors. Approximately 1,000 employees are members of various unions and work under collective bargaining agreements. The majority of our work is done through employees governed by a collective bargaining agreement with the International Union of Operating Engineers Local 955, the primary term of which expires on October 31, 2009, and under a collective bargaining agreement with the Alberta Road Builders and Heavy Construction Association and the International Union of Operating Engineers Local 955, the primary term of which expires on February 28, 2007. Additionally, we recently signed a10-year labor agreement for mining work at the CNRL site in the oil sands. We are subject to other industry and specialty collective agreements under which we complete work, the primary terms of all of which are currently in effect. We believe that our relationships with all our employees, both union and non-union, are satisfactory. We have never experienced a strike or lockout.
96
Legal Proceedings
In February 2005, Renée Gouin and Elaine Busch commenced a claim against their brothers, Martin Gouin and Roger Gouin, their father, Jean Yvon Gouin, and a number of companies, including our subsidiary, North American Construction Group Inc. The plaintiffs allege that they maintain beneficial ownership interests in the Gouin “family business.” The assets of certain of those businesses were sold to us in the Acquisition. The plaintiffs further allege that the proceeds of such ownership interests, including cash and preferred shares of NACG Preferred Corp., our subsidiary, are being wrongfully held by the Gouin brothers and that certain management fees paid by North American Construction Group Inc. to the corporate shareholder of our predecessor company, Norama Ltd., were excessive. The plaintiffs seek, among other things: damages in the amount of $57.8 million each; a declaration that they hold a beneficial interest in the “family business;” a constructive trust over the “family business;” an accounting and tracing of the sale proceeds, assets and shares; and rectification of share registers.
Pursuant to the purchase agreement relating to the Acquisition, Martin Gouin, Roger Gouin, Norama Ltd., and North American Equipment Ltd. have agreed to indemnify North American Construction Group Inc. We have notified Martin Gouin, Roger Gouin, Norama Ltd., and North American Equipment Ltd. that we are seeking indemnity from them under the purchase agreement for the cost of our defense and any damages arising out of the lawsuit. We have taken the position that North American Construction Group Inc. is not a properly named defendant in the lawsuit. Discoveries are ongoing and we will continue to assess our position as the matter proceeds.
From time to time, we are a party to litigation and legal proceedings that we consider to be a part of the ordinary course of business. While no assurance can be given, we believe that, taking into account reserves and insurance coverage, none of the litigation or legal proceedings in which we are currently involved, including the litigation described above, could reasonably be expected to have a material adverse effect on our business, financial condition or results of operations. We may, however, become involved in material legal proceedings in the future.
97
OUR EQUITY SPONSORS
Our principal shareholders include investment entities affiliated with The Sterling Group, L.P., Genstar Capital, L.P., Perry Strategic Capital Inc. and SF Holding Corp.(formerly Stephens Group, Inc.), whom we refer to collectively as the “sponsors.”
The Sterling Group, L.P. is a private equity investment firm which sponsors leveraged buyout and recapitalization transactions primarily in manufacturing, industrial service and distribution industries. Sterling joins with management teams to acquire companies where it has identified specific opportunities to grow and improve the business. Since its founding in 1982, Sterling has completed over 50 acquisitions with a total transaction value of over US$7 billion. Sterling currently manages investment funds totaling approximately US$600 million in commitments.
Genstar Capital, L.P. is a private equity investment firm focused on making growth, buyout, recapitalization and consolidation transactions. Genstar has completed transactions in the life sciences, business /IT services and industrial technology industries.
Perry Strategic Capital Inc. is an affiliate of Perry Corp., a private investment firm formed in 1988 to focus on alternative investments. Perry Corp. currently manages approximately US$12 billion allocated across a variety of asset classes including publicly traded equity and debt securities, private equity and real estate. The firm manages dedicated industry-focused portfolios and seeks to develop strong relationships with management of companies in which it invests. Perry employs over 120 professionals and support staff in offices in New York, Hong Kong and London.
SF Holding Corp. is a privately held, Little Rock, Arkansas based holding company which conducts extensive merchant banking activities. It is an affiliate of Stephens Inc., an investment banking firm that is a member of the National Association of Securities Dealers and the New York Stock Exchange. Investments of SF Holding Corp. include oil and gas, health care, financial services, data processing services and software, publishing, agriculture, manufacturing and retailing. SF Holding Corp. seeks opportunities where management needs capital and desires a knowledgeable and reliable financial partner.
98
MANAGEMENT
Directors and Executive Officers
The following sets forth information about our directors and executive officers. Ages reflected are as of September 30, 2006. Each director is elected for a one-year term or until such person’s successor is duly elected or appointed, unless his office is earlier vacated. Unless otherwise indicated below, the business address of each of our directors and executive officers is Zone 3, Acheson Industrial Area, 2-53016 Highway 60, Acheson, Alberta T7X 5A7.
| | | | | | | | |
| Name and Municipality of Residence | | Age | | | Position |
| | | | | | |
| Rodney J. Ruston | | | 55 | | | Director, President and Chief Executive Officer |
| | Edmonton, Alberta | | | | | | |
| Vincent J. Gallant | | | 48 | | | Vice President, Corporate |
| | Edmonton, Alberta | | | | | | |
| Robert G. Harris | | | 58 | | | Vice President, Human Resources, Health, |
| | Edmonton, Alberta | | | | | | Safety & Environment |
| Christopher J. Hayman | | | 43 | | | Vice President, Supply Chain |
| | St. Albert, Alberta | | | | | | |
| William M. Koehn | | | 44 | | | Vice President, Operations and Chief Operating |
| | Spruce Grove, Alberta | | | | | | Officer |
| Miles W. Safranovich | | | 42 | | | Vice President, Business Development and |
| | Spruce Grove, Alberta | | | | | | Estimating |
| Douglas A. Wilkes | | | 51 | | | Vice President, Finance and Chief Financial |
| | Surrey, British Columbia | | | | | | Officer |
| Ronald A. McIntosh | | | 64 | | | Chairman of the Board |
| | Calgary, Alberta | | | | | | |
| George R. Brokaw | | | 38 | | | Director |
| | Southampton, New York | | | | | | |
| John A. Brussa | | | 49 | | | Director |
| | Calgary, Alberta | | | | | | |
| Donald R. Getty(a) | | | 73 | | | Director |
| | Edmonton, Alberta | | | | | | |
| Martin P. Gouin(b) | | | 45 | | | Director |
| | Edmonton, Alberta | | | | | | |
| John D. Hawkins | | | 42 | | | Director |
| | Houston, Texas | | | | | | |
| William C. Oehmig | | | 57 | | | Director |
| | Houston, Texas | | | | | | |
| Richard D. Paterson | | | 63 | | | Director |
| | San Francisco, California | | | | | | |
| Allen R. Sello | | | 67 | | | Director |
| | West Vancouver, British Columbia | | | | | | |
| Peter W. Tomsett | | | 48 | | | Director |
| | West Vancouver, British Columbia | | | | | | |
| K. Rick Turner | | | 48 | | | Director |
| | Little Rock, Arkansas | | | | | | |
| |
|
| (a) | Mr. Getty will not seek reelection as a director at our planned November 3, 2006 meeting of shareholders. |
|
|
| (b) | Effective with the purchase of the Seller preferred shares, Mr. Gouin will resign as a director. |
|
Rodney J. Rustonbecame our President and Chief Executive Officer and one of our directors on May 9, 2005. Previously, Mr. Ruston was Managing Director and Chief Executive Officer of Ticor
99
Limited an Australian-based natural resources company with operations throughout Australia and in South Africa and Madagascar, from June 2000 to July 2004. From July 2003 until May 2005 he served as Chairman of the Australian Minerals Tertiary Education Council. Mr. Ruston has spent his entire career in the natural resources industry, holding management positions with Pasminco Ltd., Savage Resources Ltd., Wambo Mining Corporation, Oakbridge Ltd. and Kembla Coal & Coke Pty. Ltd. He also served as a Principal with Ruston Consulting Services Pty. Ltd., a management consulting firm providing business advice to the natural resources industry. Mr. Ruston received his Bachelor of Engineering in Mining from the University of New South Wales and a Master of Business Administration from the University of Wollongong.
Vincent J. Gallantwas appointed Vice President, Corporate on June 15, 2005. Previously, he served as Vice President, Finance since November 26, 2003. He joined our predecessor company in 1997 as Vice President, Finance. Prior to joining North American, Mr. Gallant held a number of positions, including Comptroller at Alberta Energy Company Ltd. and Controller for Edmonton Telephones. He obtained his Chartered Accountant Designation in 1983 after articling with Peat, Marwick, Mitchell and Company. Mr. Gallant received his Bachelor of Arts in Economics from the University of Alberta. He obtained his Certified Financial Planning designation in 2001.
Robert G. Harrisjoined us in June 2006 as Vice President, Human Resources, Health, Safety & Environment. Mr. Harris began his career in 1969 with Chrysler Canada in various personnel and human resources positions before taking on the role of Environmental Health & Safety Manager and subsequently the Labour Relations Supervisor role. In 1982, he accepted a position with IPSCO Inc. where he was responsible for human resources over 6 facilities in Canada and the USA. Since 1987, he has held senior human resources roles at Labatt Breweries of Canada including National Manager, Industrial Relations & Training and Director, Human Resources at both regional and national levels. Mr. Harris graduated in 1969 from the University of Windsor with a Bachelor of Arts in Sociology/ Psychology and has received his Certified Human Resources Professional designation.
Christopher J. Haymanjoined us in January 2005 as Treasurer, a position he held until being appointed Vice President, Finance in June 2005. He was appointed Vice President, Supply Chain in September 2006. Previously he worked for Finning Canada, from November 1998 to January 2005, initially as Assistant Controller and eventually becoming Vice President and Controller. Prior to this he held positions at Enbridge, Telus and Thorne, Ernst and Whinney. Mr. Hayman received his Bachelor of Commerce with an Accounting major from the University of Alberta and is a Chartered Accountant.
William M. Koehnbecame our Vice President, Operations on November 26, 2003 and our Chief Operating Officer on December 8, 2004. Previously, he served as Vice President, Operations for our predecessor company since 2002. He joined our predecessor company in 1989 and became the Fort McMurray Regional Manager in 1997. Prior to this he was a Senior Civil Engineer with Quintette Coal Ltd. Mr. Koehn attended the University of Alberta and received his Bachelor of Science in Civil Engineering and has completed his Masters in Construction Engineering and Management.
Miles W. Safranovichjoined us in November 2004 and held the position of General Manager, Industrial and Heavy Civil until he was appointed Vice President, Contracts and Technical Services in July 2005 and Vice President, Business Development and Estimating in July 2006. He has extensive experience in the construction industry, spending most of his career at Voice Construction Ltd. where he held a variety of positions between 2000 and October 2004, including Operations Manager and Construction Manager. Mr. Safranovich attended the University of Alberta and obtained a Bachelor of Science in Biology in 1986 and a Bachelor of Science in Civil Engineering specializing in Construction Management in 1992.
Douglas A. Wilkesbecame our Vice President, Finance and Chief Financial Officer on September 18, 2006. From January 2005 to September 2006, Mr. Wilkes was a self-employed consultant. During this period, Mr. Wilkes also served as Chief Financial Officer of Liberty Copper Corporation from June 2005 to December 2005. From April 2004 to December 2004, he served as Chief Financial Officer for Canfor Corporation. Mr. Wilkes was Chief Financial Officer of Slocan Forest Products Ltd. between April 2002
100
and March 2004 and of BCR Group of Companies between May 2000 and March 2002. Mr. Wilkes was also Chief Financial Officer of Tolko Industries from 1992 to 2000. His early career experiences include financial leadership roles with Weyerhaeuser Company and BC Hydro after serving five years with a major global audit accounting firm. He is a Chartered Accountant and holds a Bachelor of Commerce from the University of British Columbia.
Ronald A. McIntoshbecame the Chairman of our Board of Directors on May 20, 2004. Mr. McIntosh was Chairman of NAV Energy Trust, a Calgary-based oil and natural gas investment fund from January 2004 to August 2006. Between October 2002 and January 2004, he was President and Chief Executive Officer of Navigo Energy Inc. and was instrumental in the conversion of Navigo into NAV Energy Trust. From July 2002 to October 2002, Mr. McIntosh managed his personal investments. He was Senior Vice President and Chief Operating Officer of Gulf Canada Resources Limited from December 2001 to July 2002 and Vice President, Exploration and International of Petro-Canada from April 1996 through November 2001. Mr. McIntosh’s significant experience in the energy industry includes the former positions of Chief Operating Officer of Amerada Hess Canada and Director of Crispin Energy Inc. Mr. McIntosh is on the Board of Directors of Advantage Oil & Gas Ltd. and C1 Energy Ltd.
George R. Brokawbecame one of our Directors on June 28, 2006. Mr. Brokaw joined Perry Capital, L.L.C., an affiliate of Perry Corp., in August 2005 as a Managing Director. Perry Strategic Capital Inc., also an affiliate of Perry Corp., is a private investment firm and provides certain services to us pursuant to an advisory services agreement. Investment entities controlled by Perry Corp. are holders of our common shares and Series B preferred shares of the pre-amalgamated North American Energy Partners Inc. See “Related Party Transactions – Advisory Services Agreement” and “Principal and Selling Shareholders.” From January 2003 to May 2005, Mr. Brokaw was Managing Director (Mergers & Acquisitions) of Lazard Frères & Co. LLC, which he joined in 1996. Between 1994 and 1996, he was an investment banking associate for Dillon Read & Co. Mr. Brokaw received a Bachelor of Arts degree from Yale University and a J.D. and M.B.A. from the University of Virginia.
John A. Brussa became one of our Directors on November 26, 2003. Mr. Brussa is a senior partner and head of the Tax Department at the law firm of Burnet, Duckworth & Palmer LLP, a leading natural resource and energy law firm located in Calgary. He has been a partner since 1987 and has worked at the firm since 1981. Mr. Brussa is Chairman of Penn West Energy Trust, Crew Energy Inc. and Divestco Inc. Mr. Brussa also serves as a director of a number of natural resource and energy companies and mutual fund trusts. He is a member and former Governor of the Executive Committee of the Canadian Tax Foundation. Mr. Brussa attended the University of Windsor and received his Bachelor of Arts in History and Economics in 1978 and his Bachelor of Laws in 1981.
Donald R. Getty became one of our Directors on November 26, 2003. Since 1992, Mr. Getty has been President and Chief Executive Officer of Sunnybank Investments Ltd., a private investment and consulting firm based in Edmonton, Alberta. Mr. Getty was a director of American Eco Corporation in 2000 when it made application for bankruptcy protection under Chapter 11 of the United States Bankruptcy Code and under the Canadian Companies’ Creditors Arrangement Act. American Eco subsequently completed the sale of certain of its assets and discontinued its principal operations. Mr. Getty was the 11th Premier of Alberta since the province was formed in 1905, a position he held from 1985 to 1992. As Premier, Mr. Getty’s government was successful in emphasizing development of non-conventional oil projects and diversifying Alberta’s economy, among other initiatives. Before serving as Premier of Alberta, Mr. Getty had a distinguished career in both the public and private sectors. Mr. Getty graduated from the University of Western Ontario with an Honours degree in Business Administration and in 2003 he received an Honourary Degree of Law from the University of Lethbridge. In addition, Mr. Getty was appointed an officer of the Order of Canada in 1998 and a member of the Alberta Order of Excellence in 1994.
Martin P. Gouin became one of our Directors on November 26, 2003. Mr. Gouin was President and Chief Executive Officer of North American Construction Group Inc. from 1995 until November 2003. Prior to that he held numerous positions at North American, including Vice President of Operations, and
101
has more than 25 years experience in the industry. Since 2002, Mr. Gouin has been the President of Norama Inc., a management and holding company. He is a director of Tirecraft Group Inc., one of the largest wholesale and retail distributors of tires in North America, and Emerge Developments, with holdings in office and commercial real estate. Mr. Gouin is a member of Young Presidents Organization and attended the University of Alberta, majoring in economics.
John D. Hawkins became one of our Directors on October 17, 2003. Mr. Hawkins joined The Sterling Group, L.P. in 1992 and has been a Principal since 1999. The Sterling Group, a private equity investment firm, provides certain services to us pursuant to an advisory services agreement, and an investment entity affiliated with The Sterling Group is a holder of our common shares and Series B preferred shares of the pre-amalgamated North American Energy Partners Inc. See “Related Party Transactions – Advisory Services Agreement” and “Principal and Selling Shareholders.” Before joining Sterling he was on the professional staff of Arthur Andersen & Co. from 1986 to 1990. Mr. Hawkins previously served on the board of Exopack Holding Corp. He received a Bachelor of Science in Business Administration in Accounting from the University of Tennessee and his M.B.A. from the Owen Graduate School of Management at Vanderbilt University.
William C. Oehmig served as Chairman of our Board of Directors from November 26, 2003 until assuming the role of Director on May 20, 2004. He is a Principal with The Sterling Group, L.P., a private equity investment firm. The Sterling Group provides certain services to us pursuant to an advisory services agreement, and an investment entity affiliated with The Sterling Group is a holder of our common shares and Series B preferred shares of the pre-amalgamated North American Energy Partners Inc. See “Related Party Transactions – Advisory Services Agreement” and “Principal and Selling Shareholders.” Prior to joining Sterling in 1984, Mr. Oehmig worked in banking, mergers and acquisitions, and represented foreign investors in purchasing and managing U.S. companies in the oilfield service, manufacturing, distribution, heavy equipment and real estate sectors. He began his career in Houston in 1974 at Texas Commerce Bank. Mr. Oehmig currently serves on the boards of Propex Fabrics Inc. and Panolam Industries International Incorporated. In the past he has served as Chairman of Royster-Clark, Purina Mills, and as a director of Exopack and Sterling Diagnostic Imaging. Mr. Oehmig received his B.B.A. in economics from Transylvania University and his M.B.A. from the Owen Graduate School of Management at Vanderbilt University.
Richard D. Paterson became one of our Directors on August 18, 2005. Mr. Paterson has been a Managing Director of Genstar Capital since 1988. Genstar Capital provides certain services to us pursuant to an advisory services agreement, and certain investment entities controlled by Genstar are holders of our common shares and Series B preferred shares of the pre-amalgamated North American Energy Partners Inc. See “Related Party Transactions – Advisory Services Agreement” and “Principal and Selling Shareholders.” Before founding Genstar Capital, Mr. Paterson served as Senior Vice President and CFO of Genstar Corporation, a $4 billion NYSE company, where he was responsible for finance, tax, information systems and public reporting. He has been active in corporate acquisitions for more than 25 years. Mr. Paterson started his career in 1984 as an auditor with Coopers & Lybrand in Montreal. He currently serves as Chairman of the Board of New A.C. Inc. and is also a Director of INSTALLS Inc. LLC, American Pacific Enterprises LLC, Propex Fabrics Inc., Woods Equipment Company and Altra Industrial Motion, Inc. Mr. Paterson earned a Bachelor of Commerce from Concordia University and is a Chartered Accountant.
Allen R. Sello became one of our Directors on January 26, 2006. His career began at Ford Motor Company of Canada in 1964, where he held numerous finance and marketing management positions, including Treasurer. In 1979 Mr. Sello joined Gulf Canada Limited, at which he held various senior financial positions, including Vice President and Controller. He was appointed Vice President, Finance of successor company Gulf Canada Resources Limited in 1987 and Chief Financial Officer in 1988. Mr. Sello then joined International Forest Products Ltd. in 1996 as Chief Financial Officer. From 1999 until his retirement in 2004 he held the position of Senior Vice President and Chief Financial Officer for UMA Group Limited. Mr. Sello is currently Vice-Chair of the Vancouver Board of Trade Government Budget and Finance Committee, a trustee of Sterling Shoes Income Fund and a director of Infowave
102
Software Inc. Mr. Sello received his Bachelor of Commerce from the University of Manitoba and his M.B.A. from the University of Toronto.
Peter W. Tomsettbecame one of our directors in September 2006. From September 2004 to January 2006, Mr. Tomsett was President & Chief Executive Officer of Placer Dome Inc. based in Vancouver, B.C. He joined the Placer Dome Group in 1986 as a Mining Engineer with the Project Development group in Sydney, Australia. In April 2000, Mr. Tomsett became Vice-President Operations for Placer Dome Asia Pacific Limited and in January 2001 assumed the role of Executive Vice President, Asia-Pacific for Placer Dome Inc. In 2004, Mr. Tomsett also took on responsibility for Placer Dome Africa which includes mines in South Africa and Tanzania. Mr. Tomsett has been a Director of the Minerals Council of Australia, the World Gold Council and the International Council for Mining & Metals. He was a member of the Australian Institute of Company Directors and is a member of the Australian Institute of Mining and Metallurgy and the Canadian Institute of Mining, Metallurgy and Petroleum. Mr. Tomsett graduated with a Bachelor of Engineering (Honours) in Mining Engineering from the University of New South Wales and also attained a Master of Science (Distinction) in Mineral Production Management from the Imperial College, London.
K. Rick Turner became one of our Directors on November 26, 2003. Mr. Turner has been employed by Stephens’ family entities since 1983. SF Holding Corp, formerly Stephens Group, Inc., provides certain services to us pursuant to an advisory services agreement, and an investment entity controlled by SF Holding Corp. is a holder of our common shares and Series B preferred shares of the pre-amalgamated North American Energy Partners Inc. See “Related Party Transactions – Advisory Services Agreement” and “Principal and Selling Shareholders.” Mr. Turner is currently Senior Managing Principal of The Stephens Group, LLC. He first became a private equity principal in 1990 after serving as the Assistant to the Chairman, Jackson T. Stephens. His areas of focus have been oil and gas exploration, natural gas gathering, processing industries and power technology. Mr. Turner currently serves as a director of Atlantic Oil Corporation, SmartSignal Corporation, JV Industrials, LLC, JEBCO Seismic LLC and the general partner of Energy Transfer Partners, LP (ETP) and the general partner of Energy Transfer Equity, LP (ETE). Prior to joining Stephens, he was employed by Peat, Marwick, Mitchell and Company. Mr. Turner earned his B.S.B.A. from the University of Arkansas and is a non-practicing CPA.
The Board and Board Committees
Our board supervises the management of our business as provided by Canadian law. We intend to comply with the listing requirements of the NYSE applicable to domestic listed companies, which would require that our board of directors be composed of a majority of independent directors within one year of the listing of our common shares on the NYSE. Accordingly, we intend to adjust the board membership to comply with this requirement following the completion of this offering.
Our board has established the following committees:
| | |
| | • | The Audit Committee recommends independent public accountants to the board, reviews the quarterly and annual financial statements and associated audit reports and reviews the fees paid to our auditors. The Audit Committee reports its findings to the board and makes recommendations to the board for ratification. Rule 10A-3 under the Securities Exchange Act of 1934, as amended, and the listing requirements of the NYSE and the requirements of the Canadian securities regulatory authorities require that our audit committee be composed of a majority of independent directors within 90 days of the effectiveness of the registration statement of which this prospectus is a part and that it be composed solely of independent directors within one year of such date. Accordingly, we intend to adjust the composition of the audit committee following the completion of this offering. Following this offering, one member of the audit committee will be designated as the audit committee financial expert, as defined by Item 401(h) of Regulation S-K of the Exchange Act. Our board of directors will adopt a written charter for the audit committee that will be available on our website after the completion of this offering. The Audit Committee is currently composed of Messrs. Brokaw, Hawkins, McIntosh, Sello and Turner, with Mr. Sello serving as Chairman. |
103
| | |
|
| | • | The Compensation Committee is charged with the responsibility for supervising executive compensation policies for us and our subsidiaries, administering the employee incentive plans, reviewing officers’ salaries, approving significant changes in executive employee benefits and recommending to the board such other forms of remuneration as it deems appropriate. The listing requirements of the NYSE applicable to domestic listed companies require that our compensation committee be composed of a majority of independent directors within 90 days of the listing of our common shares on the NYSE and that it be composed solely of independent directors within one year of such listing. Accordingly, we intend to adjust the composition of the compensation committee following the completion of this offering. Our board of directors will adopt a written charter for the compensation committee that will be available on our website after the completion of this offering. The Compensation Committee is currently composed of Messrs. Brussa, Oehmig, Paterson and Sello, with Mr. Paterson serving as Chairman. |
|
| |
|
| | • | The Governance Committee is responsible for recommending to the board of directors proposed nominees for election to the board of directors by the shareholders at annual meetings, including an annual review as to the renominations of incumbents and proposed nominees for election by the board of directors to fill vacancies that occur between shareholder meetings, and making recommendations to the board of directors regarding corporate governance matters and practices. The listing requirements of the NYSE applicable to domestic listed companies require that we establish a nominating and corporate Governance Committee composed of a majority of independent directors within 90 days of the listing of our common shares on the NYSE and that it be composed solely of independent directors and have at least three members within one year of such listing. Our board of directors will adopt a written charter for the Governance Committee that will be available on our website after the completion of this offering. The Governance Committee is currently composed of Messrs. Brussa, Hawkins, Paterson, Tomsett and Turner, with Mr. Tomsett serving as Chairman. |
|
| |
|
| | • | The Risk Committee is responsible for overseeing all of our non-financial risks, approving our risk management policies and reviewing the risks and related risk mitigation plans within our strategic plan. The Risk Committee is currently composed of Messrs. Brokaw, McIntosh, Oehmig and Tomsett, with Mr. Oehmig serving as Chairman. |
|
The board may also establish other committees.
Compensation Committee Interlocks and Insider Participation
None of the members of the Compensation Committee is or has been one of our officers or employees, and none of our executive officers served during fiscal 2006 on a board of directors of another entity which has employed any of the members of the Compensation Committee.
Web Access
We will provide access through our website atwww.nacg.ca to current information relating to governance, including a copy of each board committee charter, our Code of Conduct, our corporate governance guidelines and other matters impacting our governance principles. You may also contact our Vice President, Corporate for paper copies of these documents free of charge. The information contained in our website is not a part of this prospectus or the registration statement of which this prospectus forms a part.
Director Compensation
Our directors, other than Messrs. Gouin, McIntosh and Ruston, each receive an annual aggregate retainer of $32,500 and a fee of $1,500 for each meeting of the board or any committee of the board that they attend, and are reimbursed for reasonableout-of-pocket expenses incurred in connection with their services pursuant to our policies. The chairman of our audit committee receives an additional annual retainer of $10,000. Mr. McIntosh, our Chairman of the Board, receives an annual retainer of $150,000. In
104
addition, Mr. McIntosh received bonuses of $205,000 in June 2005 and $163,733 in July 2006. Messrs. Gouin and Ruston do not receive director compensation.
In addition, our directors have received grants of stock options under the 2004 Share Option Plan. Effective November 2003, each director, excluding Messrs. Brokaw, Gouin, McIntosh, Paterson, Sello, Tomsett and Ruston, received options to purchase 1,388 common shares. Mr. McIntosh received options to acquire 3,500 common shares in May 2004, Mr. Paterson received options to purchase 1,388 common shares in November 2005, Mr. Sello received options to purchase 1,388 common shares in February 2006 and Mr. Brokaw received options to purchase 1,388 common shares in June 2006. All these options have an exercise price of $100 per share, vest at the rate of 20% per year over five years and expire ten years after their grant date. The vesting of the options granted to Messrs. Brokaw and Paterson has been accelerated as if they had been issued effective November 2003. Mr. Tomsett was granted options to acquire 1,388 common shares in September 2006. These options have an exercise price of $335 per share, vest at the rate of 20% per year over five years and expire ten years after their grant date.
We offered each director holding stock options, excluding Messrs. McIntosh and Ruston, the option to have all of his options become immediately exercisable on the condition that he exercise all such options by September 30, 2006. One director, Mr. Oehmig, accepted this offer. The stock options of the directors who did not accept this offer remain unchanged.
Executive Compensation
The following summary compensation table sets forth the total value of compensation earned by our Chief Executive Officer and each of the other four most highly compensated officers as of March 31, 2006, collectively called the named executive officers, for services rendered in all capacities to us for the fiscal years ended March 31, 2006, 2005 and 2004.
Summary Compensation Table
| | | | | | | | | | | | | | | | | | | | | | |
| | | | | | | | | | | Long-Term | |
| | | | | Compensation | |
| | | Annual Compensation | | | | |
| | | | | | Securities | |
| | | Fiscal | | | | | Other Annual | | | Underlying | |
| Name and Principal Position | | Year | | | Salary | | | Bonus | | | Compensation | | | Options(a) | |
| | | | | | | | | | | | | | | | |
| Rodney J. Ruston | | | 2006 | | | $ | 536,539 | | | $ | 300,000 | | | | (d | ) | | | 27,500 | |
| | President and | | | | | | | | | | | | | | | | | | | | |
| | Chief Executive Officer | | | | | | | | | | | | | | | | | | | | |
| | (Hired May 2005) | | | | | | | | | | | | | | | | | | | | |
| William M. Koehn | | | 2006 | | | | 240,000 | | | | 241,385 | (b) | | | (d | ) | | | — | |
| | Vice President, Operations | | | 2005 | | | | 224,000 | | | | — | | | | (d | ) | | | — | |
| | and Chief Operating Officer | | | 2004 | | | | 170,000 | | | | 1,040,000 | (b)(c) | | | (d | ) | | | 5,000 | |
| Vincent J. Gallant | | | 2006 | | | | 204,000 | | | | 235,350 | (b) | | | (d | ) | | | — | |
| | Vice President, Corporate | | | 2005 | | | | 204,000 | | | | — | | | | (d | ) | | | — | |
| | | | | 2004 | | | | 162,000 | | | | 1,040,000 | (b)(c) | | | (d | ) | | | 5,000 | |
| Miles W. Safranovich(e) | | | 2006 | | | | 195,808 | | | | 210,384 | (b) | | | (d | ) | | | 2,000 | |
| | Vice President, Contracts | | | 2005 | | | | 61,385 | | | | — | | | | (d | ) | | | 3,000 | |
| | & Technical Services | | | | | | | | | | | | | | | | | | | | |
| | (Hired November 2004) | | | | | | | | | | | | | | | | | | | | |
| Christopher J. Hayman(f) | | | 2006 | | | | 183,641 | | | | 186,910 | (b) | | | (d | ) | | | 2,000 | |
| | Vice President, Finance | | | 2005 | | | | 56,250 | | | | — | | | | (d | ) | | | 3,000 | |
| | (Hired January 2005) | | | | | | | | | | | | | | | | | | | | |
| | |
| (a) | | Consists of options to purchase our common shares. The options granted to Mr. Ruston expire on May 9, 2015. The options granted to Messrs. Koehn and Gallant expire on November 26, 2013. The options granted in fiscal 2005 and 2006 to Mr. Safranovich expire on November 17, 2014 and |
105
| | |
| | November 2, 2015, respectively. The options granted in fiscal 2005 and 2006 to Mr. Hayman expire on February 17, 2015 and November 2, 2015, respectively. |
| |
| (b) | | Bonus pursuant to our Annual Incentive Plan. |
| |
| (c) | | Includes a $750,000 transaction bonus and a $250,000 performance bonus, both paid by Norama Inc., the parent company of Norama Ltd., upon closing of the Acquisition. |
| |
| (d) | | The amount of other annual compensation does not exceed the lesser of $50,000 and 10% of the salary and bonus for the fiscal year. |
| |
|
| (e) | | Effective July 2006, Mr. Safranovich was appointed Vice President, Business Development & Estimating. |
|
| |
|
| (f) | | Effective September 2006, Mr. Hayman was appointed Vice President, Supply Chain and is no longer Vice President, Finance. |
|
Option Grants in Fiscal 2006
| | | | | | | | | | | | | | | | | | | | | |
| | | Number of | | | Percentage of | | | | | | | |
| | | Securities | | | Total Options | | | | | | | |
| | | Underlying | | | Granted to | | | | | | | |
| | | Options | | | Employees in | | | Exercise | | | | | Grant Date | |
| Name | | Granted | | | Fiscal Year | | | Price | | | Expiration Date | | | Value(a) | |
| | | | | | | | | | | | | | | | |
| Rodney J. Ruston | | | 27,500 | | | | 79.7% | | | $ | 100 | | | | May 9, 2015 | | | $ | 2,014,302 | |
| William M. Koehn | | | — | | | | — | | | | — | | | | — | | | | — | |
| Vincent J. Gallant | | | — | | | | — | | | | — | | | | — | | | | — | |
| Miles W. Safranovich | | | 2,000 | | | | 5.8% | | | $ | 100 | | | | November 2, 2015 | | | | 104,090 | |
| Christopher J. Hayman | | | 2,000 | | | | 5.8% | | | $ | 100 | | | | November 2, 2015 | | | | 104,090 | |
| | |
| (a) | | Value estimated using the Black-Scholes option-pricing model. For assumptions used, see note 21 to our consolidated financial statements included elsewhere in this prospectus. |
Aggregated Option Exercises in Fiscal 2006 and Fiscal Year End Option Values
| | | | | | | | | | | | | | | | | |
| | | | | | | Number of | | | Value of | |
| | | | | | | Securities | | | Unexercised | |
| | | | | | | Underlying | | | In-the-Money | |
| | | | | | | Unexercised Options | | | Options at | |
| | | Shares | | | | | at March 31, 2006 | | | March 31, 2006 | |
| | | Acquired on | | | Value | | | (Exercisable/ | | | (Exercisable/ | |
| Name | | Exercise | | | Realized | | | Unexercisable) | | | Unexercisable) | |
| | | | | | | | | | | | | |
| Rodney J. Ruston | | | — | | | | — | | | | —/27,500 | | | | —/ — | |
| William M. Koehn | | | — | | | | — | | | | 2,000/3,000 | | | | —/ — | |
| Vincent J. Gallant | | | — | | | | — | | | | 2,000/3,000 | | | | —/ — | |
| Miles W. Safranovich | | | — | | | | — | | | | 600/4,400 | | | | —/ — | |
| Christopher J. Hayman | | | — | | | | — | | | | 600/4,400 | | | | —/ — | |
Options to Purchase Common Shares
The following chart sets forth information as of June 30, 2006, regarding outstanding options granted under our 2004 Share Option Plan.
| | | | | | | | | | | | | |
| | | Common Shares | | | | | |
| | | Underlying Options | | | | | Exercise | |
| Category | | Granted | | | Exercised | | | Price | |
| | | | | | | | | | |
| All executive officers and past executive officers | | | 55,300 | | | | — | | | $ | 100 | |
| All directors and past directors who are not also executive officers | | | 15,992 | | | | — | | | | 100 | |
| All other employees or past employees | | | 32,250 | | | | — | | | | 100 | |
106
Retirement Benefits for Executive Officers and Directors
For the fiscal year ended March 31, 2006, the total amount we set aside for pension, retirement and similar benefits for our executive officers and directors was $54,677, consisting of employer matching contributions to our executive officers’ Registered Retirement Savings Plan, a Canadian tax-deferred retirement savings plan, accounts of up to 5% of salary.
Retention Bonus
Norama Inc., the parent of Norama Ltd., will pay to each of Messrs. Koehn and Gallant a retention bonus of $750,000, plus interest, on November 26, 2006, three years after the closing of the Acquisition, provided they are still employed by us.
Annual Incentive Plan
We have established a management incentive plan. The incentive plan is administered by the Compensation Committee. The plan has established an annual bonus pool to be paid to participants if a target level of financial performance is achieved. If our actual financial performance exceeds or falls short of the targeted level of performance, the amount of the pool available to be paid will increase or decrease, respectively. The Compensation Committee will recommend to the board of directors the amount of the total pool, the target financial performance, the eligible participants and each participant’s share of the potential pool.
Share Option Plan
Our board has approved the Amended and Restated 2004 Share Option Plan. The amended plan is subject to shareholder approval at our planned November 3, 2006 shareholder meeting and, if approved, will become effective on the closing of this offering. The amended option plan will be administered by the Compensation Committee. Option grants under the amended option plan may be made to our directors, officers, employees and consultants selected by the Compensation Committee. The amended option plan will provide for the discretionary grant of options to purchase common shares. Options granted under the amended plan will be evidenced by an agreement, which will specify the vesting, exercise price and expiration of such options. Options to be granted under the amended option plan will have an exercise price of not less than the volume weighted average trading price of the common shares on the Toronto Stock Exchange or the New York Stock Exchange at the time of grant. The amended option plan provides that up to 10% of our issued and outstanding common shares from time to time may be reserved for issuance or issued from treasury under the amended option plan.
In the event of certain change of control events as defined in the amended option plan, all outstanding options will become immediately vested and exercisable. The amended option plan provides that our board can make certain specified amendments to the option plan subject to receipt of shareholder and regulatory approval, and further authorizes the Board to make all other amendments to the Plan, subject only to regulatory approval but without shareholder approval. The amendments the board may make without shareholder approval include amendments of a housekeeping nature, changes to the vesting provisions of an option or the option plan, changes to the termination provisions of an option or the option plan which do not entail an extension beyond the original expiry date, the discontinuance of the option plan, and the addition of provisions relating to phantom share units, such as restricted share units and deferred share units which result in participants receiving cash payments, and the terms governing such features.
The amended option plan provides that each option includes a cashless exercise alternative which provides a holder of an option with the right to elect to receive cash in lieu of purchasing the number of shares under the option. Notwithstanding such right, the amended option plan provides that we may elect, at our sole discretion, to stock settle the option.
All outstanding options granted under the 2004 Stock Option Plan will remain outstanding after the amended and restated plan becomes effective. We have reserved 115,000 common shares for issuance
107
under the existing option plan. As of September 30, 2006, there were 111,542 shares issuable upon exercise of outstanding share options and 3,458 were available for issuance.
Profit Sharing Plan
Our board has established a profit sharing plan covering all full-time salaried and certain hourly employees, excluding executive officers. The profit sharing plan is administered by the Compensation Committee. Amounts paid under the profit sharing plan will constitute taxable income in the year received and will be based on our financial performance over a period of time to be determined by the Compensation Committee. The Compensation Committee will recommend to the board of directors for approval a target level of financial performance to be achieved and an amount to be set aside for profit sharing if the target is met. If financial performance exceeds this minimum level, we may make distributions to employees. The Compensation Committee may change the amount set aside for profit sharing and the proportion of such amount allocated to an individual employee or group of employees.
Share Ownership of Directors and Executive Officers
As of September 30, 2006, all of our directors and executive officers, as a group, beneficially owned, directly or indirectly, or exercised control or direction over approximately 4.62% of our common shares. See “Principal and Selling Shareholders.”
Employment Agreements
We have an employment agreement with Rodney Ruston, our President and Chief Executive Officer. The initial term of Mr. Ruston’s employment is five years, beginning May 2005, unless earlier terminated. If his employment is terminated by us without cause or if his employment is not renewed at the end of the initial five year term, Mr. Ruston will receive a severance payment equal to his then-annual salary plus the amount of his bonus payment in the year preceding the termination date. The arrangement provides for a $500,000 annual salary, to be reviewed annually by the board of directors, plus an initial grant of options to purchase 27,500 common shares, with an exercise price of $100 per share and subject to vesting at the rate of 20% per year. During the term of the agreement, Mr. Ruston is eligible for an annual cash bonus of up to 100% of his annual salary upon achievement of performance targets approved by the board, receives a monthly vehicle allowance of $800, receives reimbursement of the annual fee for membership in one health or sports club and receives an annual travel allowance of $25,000 to cover the costs of traveling to and from his home country of Australia.
We also have employment agreements with Vincent Gallant, our Vice President, Corporate; Robert Harris, our Vice President, Human Resources Health, Safety & Environment; Christopher Hayman, our Vice President, Supply Chain; William Koehn, our Vice President, Operations and Chief Operating Officer; Miles Safranovich, our Vice President, Business Development and Estimating; and Douglas Wilkes, our Vice President, Finance and Chief Financial Officer.
In each case, the executive officer’s employment will continue until terminated by him or us in accordance with the provisions of his respective agreement. In the cases of Messrs. Gallant, Hayman, Koehn, Safranovich and Wilkes, if his employment is terminated by us without cause, he will receive a payment equal to one year annual base salary if terminated on or prior to his fifth anniversary of employment with us or our predecessors, a payment equal to one and a quarter times his annual base salary if terminated after his fifth anniversary but on or before his tenth anniversary or a payment of one and a half times his annual base salary if terminated after the tenth anniversary of employment with us or our predecessors plus a payment equal to 90% of the amount of his target bonus payment for the current fiscal year pro rated to the date of termination. If Mr. Harris’ employment is terminated by us without cause, he will receive a payment of three months of salary in lieu of notice, plus a severance payment equal to one year annual base salary and a payment equal to 90% of the amount of his annual bonus payment pro rated to the date of termination. Mr. Gallant’s agreement allows him to retire as of June 30, 2008 with three months advance notice and requires him to continue as a service provider for a transition
108
period during which he will receive no compensation or benefits, but Mr. Gallant may exercise all vested options until November 30, 2008.
These agreements provide for an annual salary of $210,630 for Mr. Gallant, $210,000 for Mr. Harris, $212,800 for Mr. Hayman, $252,000 for Mr. Koehn, $224,000 for Mr. Safranovich, and $250,000 for Mr. Wilkes, each to be reviewed annually by the board of directors, plus an initial grant of options to purchase 5,000 common shares, subject to vesting at the rate of 20% per year and with an exercise price of $100 per share, except in the case of Mr. Wilkes whose options have an exercise price of $335 per share.
During the term of the agreement, each executive officer is eligible for an annual cash bonus of up to 100% of his annual salary upon achievement of performance targets approved by the board, receives a monthly vehicle allowance of $800 and receives reimbursement of the annual fee for membership in one club or an allowance for similar expenditures. In addition, Mr. Wilkes is provided a serviced apartment for a maximum of four months and receives reimbursement for reasonable travel expenses between Vancouver and Edmonton weekly through December 31, 2007 and every other week from January 1, 2008 through December 31, 2009.
Each executive officer has agreed to a non-competition period of two years after the termination of his respective employment, regardless of the reason for the cessation of such employment.
109
RELATED PARTY TRANSACTIONS
Advisory Services Agreement
We are party to an advisory services agreement, dated November 21, 2003, with The Sterling Group, L.P., Genstar Capital, L.P., Perry Strategic Capital Inc., and SF Holding Corp., referred to in the agreement as the “sponsors,” that will be terminated in connection with this offering for aggregate consideration of $2.0 million. Pursuant to the agreement, the sponsors provided certain services to us, including financial advisory services in connection with corporate financing transactions and business combinations. In exchange for such services, on each June 30, we were obligated to pay the sponsors whose services had not terminated in accordance with the agreement, as a group, an annual management fee in cash totaling the greater of $400,000 or 0.5% of our EBITDA for the previous twelve-month period ended March 31. On June 30, 2006, we paid the sponsors, as a group, $400,000 for the twelve months ended March 31, 2006. The agreement also provided that we would indemnify the sponsors against liabilities relating to their services and would reimburse the sponsors for their expenses in connection with their services. This agreement was not negotiated on an arms’-length basis.
In addition, the agreement provided that if we or any of our subsidiaries determined within ten years of the date of the closing of the Acquisition to acquire any business or assets having a value of US$1.0 million or more, referred to in the agreement as a “future corporate transaction,” or to offer its securities for sale publicly or privately or to otherwise raise any debt or equity financing, referred to in the agreement as a “future securities transaction,” the relevant company would retain one or more of the sponsors, whose services had not been terminated in accordance with the agreement, as a group, as consultants with respect to the transaction. For any future corporate transactions, the relevant sponsors were entitled under the agreement to receive a fee in the amount of 1% of the aggregate consideration paid for the Acquisition plus the aggregate amount of assumed liabilities and, regardless of whether such future corporate transaction was consummated, reimbursement of any expenses or fees incurred by any sponsor in connection therewith. For any future securities transactions, the relevant sponsors were entitled to receive under the agreement a fee in the amount of 0.5% of the aggregate gross proceeds to the companies from such transaction and, regardless of whether such future securities transaction was consummated, reimbursement of any expenses or fees incurred by any sponsor in connection therewith. Actual amounts payable for these services were limited by the terms of our 9% senior secured notes. Assuming we receive aggregate gross proceeds from this offering of US$175 million, the sponsors will be entitled to a fee of US$875,000.
Office Leases
We are party to lease agreements with Acheson Properties Ltd., a company owned, indirectly and in part, by Martin Gouin, one of our directors. Mr. Gouin has a 50% beneficial interest in Acheson Properties Ltd. Pursuant to the agreements, we lease our corporate headquarters in Acheson, Alberta, and our offices in Fort Nelson, British Columbia and Regina, Saskatchewan. See “Business – Properties and Facilities.” For the three months ended June 30, 2006 and 2005 and the fiscal years ended March 31, 2005 and 2006, we paid $314,565, $292,371, $823,827 and $836,484, respectively, pursuant to these leases. The lease agreements were in place before the Acquisition in November 2003. We believe the terms of these lease agreements are similar to what would have been obtained from an unaffiliated third party.
Voting and Corporate Governance Agreement
We are party to a voting agreement, dated November 26, 2003, with affiliates of the sponsors that will terminate upon the completion of this offering. The agreement included the following provisions:
The agreement provided that, as long as a shareholder party to the agreement, along with its affiliates, and various permitted transferees owned at least 50% of the common shares that it initially purchased in
110
our November 2003 offering of common shares, such shareholder could designate one nominee for election to our board of directors. In addition, as long as Sterling Group Partners I, L.P. and various permitted transferees owned at least 75% of the common shares that it initially purchased in the offering of common shares, it could designate one additional nominee for election to our board of directors. Each shareholder party to the agreement agreed to vote the common shares held by it for each of the designated director nominees. The shareholder parties to the agreement had also agreed to vote their common shares in favor of the election to the board of directors of independent directors designated by a specified majority of the shareholder parties to the agreement or their appointed voting representatives. The voting agreement contained similar provisions for the removal of a director designated for removal by the parties to the agreement. Messrs. Hawkins and Oehmig were the director designees of The Sterling Group. Mr. Paterson was the director designee of Genstar Capital. Mr. Brokaw was the director designee of Perry Strategic Capital. Mr. Turner was the director designee of SF Holding Corp.
The voting agreement provided that each shareholder party to the agreement would not, and would not permit any of its affiliates to, enter into, renew, extend or be a party to any transaction or series of transactions with us or any of our subsidiaries without the prior written consent of the holders of a specified majority of shares subject to the agreement, other than such holder or its affiliates, except for:
| | |
| | • | issuances of capital shares pursuant to, or the funding of, employment arrangements, share options and share ownership plans approved by the board of directors; |
| |
| | • | the grant of share options or similar rights to employees and directors pursuant to plans approved by the board of directors; |
| |
| | • | loans or advances to executive officers approved by the board of directors; |
| |
| | • | the payment of reasonable fees to our directors and the directors of our subsidiaries who are not our employees or employees of our subsidiaries in their capacities as board members or members of committees of the board as may be approved by the board; |
| |
| | • | any transaction between our subsidiaries; and |
| |
| | • | the registration rights agreement described below, the investor shareholders agreement described in “Description of Share Capital — Shareholders Agreements” and the advisory services agreement described in this “Related Party Transactions” section. |
The voting agreement will terminate upon the completion of this offering. However, we intend to enter into a letter agreement with each sponsor pursuant to which we will engage such sponsor to provide their expertise and advice to us for no fee, which is in their interest because of their investment in us. In order for the sponsors to provide such advice, we will
| | |
|
| | • | provide them copies of all documents, reports, financial data and other information regarding us, |
|
| |
|
| | • | permit them to consult with and advise our management on matters relating to our operations, |
|
| |
|
| | • | permit them to discuss our company’s affairs, finances and accounts with our officers, directors and outside accountants, |
|
| |
|
| | • | permit them to visit and inspect any of our properties and facilities, including but not limited to books of account, |
|
| |
|
| | • | permit them to attend, to the extent that a director is not related to the sponsor, to designate and send a representative to attend all meetings of our board of directors in a non-voting observer capacity, |
|
| |
|
| | • | provide them copies of certain of our financial statements and reports, and |
|
111
| | |
| | • | provide them copies of all materials sent by us to our board of directors, other than materials relating to transactions in which the sponsor has an interest. |
We may terminate a sponsor’s letter agreement in certain circumstances.
All the foregoing rights will be subject to customary confidentiality requirements and subject to security clearance requirements imposed by applicable government authorities.
Shareholders Agreements
All holders of our common shares who are also our employees or employees of any of our subsidiaries are parties to an employee shareholders agreement. All other holders of our common shares are parties to an investor shareholders agreement. See “Description of Share Capital — Shareholders Agreements.” Both the employee shareholders agreement and the investor shareholders agreement will terminate upon the completion of this offering.
Registration Rights Agreement
We are party to a registration rights agreement with certain of our shareholders, including affiliates of each of the sponsors, Paribas North America, Inc. and Mr. William Oehmig, one of our directors. After our initial public offering, the shareholders party to the agreement and their permitted transferees are entitled, subject to certain limitations, to include their common shares in a registration of common shares we initiate under the Securities Act of 1933, as amended. In addition, after the 120th day following an initial public offering of the common shares, any one or more shareholders party to the agreement has the right to require us to effect the registration of all or any part of such shareholders’ common shares under the Securities Act, referred to as a “demand registration,” so long as the amount of common shares to be registered has an aggregate fair market value of at least US$5.0 million and, at such time, the SEC has ordered or declared effective fewer than four demand registrations initiated by us pursuant to the registration rights agreement. In the event the aggregate number of common shares which the shareholders party to the agreement request us to include in any registration, together, in the case of a registration we initiate, with the common shares to be included in such registration, exceeds the number which, in the opinion of the managing underwriter, can be sold in such offering without materially affecting the offering price of such shares, the number of shares of each shareholder to be included in such registration will be reduced pro rata based on the aggregate number of shares for which registration was requested. The shareholders party to the agreement have the right to require, after four demand registrations, one registration in which their common shares will not be subject to pro rata reduction with others entitled to registration rights.
We may opt to delay the filing of a registration statement required pursuant to any demand registration for:
| | |
| | • | up to 120 days if we have |
| | |
| | • | decided to file a registration statement for an underwritten public offering of our common equity securities, the net proceeds of which are expected to be at least US$20.0 million, or |
| |
| | • | initiated discussions with underwriters in preparation for a public offering of our common equity securities as to which we expect to receive net proceeds of at least US$20.0 million and the demand registration, in the underwriters’ opinion, would have a material adverse effect on the offering or |
| |
| | • | up to 90 days following a request for a demand registration if we are in possession of material information that we reasonably deem advisable not to disclose in a registration statement. |
Our right to delay the filing of a registration statement if we possess information that we deem advisable not to disclose does not obviate any disclosure obligations which we may have under the Exchange Act or other applicable laws; it merely permits us to avoid filing a registration statement if our management believes that such a filing would require the disclosure of information which otherwise is not
112
required to be disclosed and the disclosure of which our management believes is premature or otherwise inadvisable.
The registration rights agreement contains customary provisions whereby we and the shareholders party to the agreement indemnify and agree to contribute to each other with regard to losses caused by the misstatement of any information or the omission of any information required to be provided in a registration statement filed under the Securities Act. The registration rights agreement requires us to pay the expenses associated with any registration other than sales discounts, commissions, transfer taxes and amounts to be borne by underwriters or as otherwise required by law.
Series B Preferred Shares
The Series B preferred shares were initially issued by the pre-amalgamated North American Energy Partners Inc. for cash proceeds of $7.5 million on May 19, 2005 to our existing common shareholders, including the sponsors. North American Energy Partners Inc. subsequently offered and sold $0.9 million of Series B preferred shares to certain of our existing common shareholders and used the proceeds from this subsequent sale to repurchase a like amount of Series B preferred shares from the sponsors. All such Series B preferred shares were issued or repurchased, as the case may be, at a price of $100 per share. On June 15, 2005, the Series B preferred shares were split 10-for-1. For additional information on the Series B preferred shares, refer to note 13(a) in our consolidated financial statements included elsewhere in this prospectus.
Recent Sales of Securities to Related Parties
In March 2006, one of our directors was issued 1,000 common shares and 81 Series B preferred shares. In December 2005, three of our officers were issued an aggregate of 2,000 common shares and an aggregate of 163 Series B preferred shares. In July 2004, one of our directors was issued 2,000 common shares, and another of our directors was issued 1,000 common shares in August 2004. All such common shares were issued at $100 per share and all such Series B preferred shares were issued at $100 per share.
113
PRINCIPAL AND SELLING SHAREHOLDERS
The following table presents information regarding the beneficial ownership of our common shares as of September 30, 2006, based on information available to us, by:
| | |
| | • | each of the named executive officers; |
| |
| | • | each of our directors; |
| |
| | • | all of our directors and executive officers as a group; |
| |
|
| | • | each of the selling shareholders identified in the table as offering common shares hereby; and |
|
| |
| | • | each beneficial owner of more than 5% of our outstanding voting common shares. |
The information in this section does not give effect to the Reorganization. As of September 30, 2006, we had 911,768 voting common shares and 20,620 non-voting common shares outstanding. For purposes of this section, “common shares” refers only to the voting common shares. Except as otherwise indicated in the footnotes to the table, each of the beneficial owners listed has, to our knowledge, sole voting and investment power with respect to the indicated common shares. Except as otherwise indicated, the address of each of the beneficial owners is c/o North American Energy Partners Inc., Zone 3, Acheson Industrial Area,2-53016 Highway 60, Acheson, Alberta, T7X 5A7, Canada.
The amounts and percentages of shares beneficially owned are reported on the basis of SEC regulations governing the determination of beneficial ownership of securities. Under SEC rules, a person is deemed to be a “beneficial owner” of a security if that person has or shares voting power or investment power, which includes the power to dispose of or to direct the disposition of such security. A person is also deemed to be a beneficial owner of any securities of which that person has a right to acquire beneficial ownership within 60 days. Securities that can be so acquired are deemed to be outstanding for purposes of computing such person’s ownership percentage, but not for purposes of computing any other person’s percentage. Under these rules, more than one person may be deemed to be a beneficial owner of the same securities and a person may be deemed to be a beneficial owner of securities as to which such person has no economic interest.
Each of the beneficial owners of more than 5% of our outstanding common shares in the table below acquired such shares on November 26, 2003 in connection with the Acquisition. With the exception of Sterling Group Partners I, L.P., from which we repurchased 17,408 shares in January 2004, there has been no significant change in the percentage ownership held by such beneficial owners since November 26, 2003. None of such shareholders has different voting rights than the other holders of common shares.
Unless otherwise noted, each of the beneficial owners named in the following table is also the shareholder of record with respect to such shares.
| | | | | | | | | | | | | | | | | | | | | | | | | | | | | |
| | | | | | | | | | | | | Common Shares | |
| | | | | | | | | | | | | Beneficially Owned | |
| | | | | | | | | After the Offering | |
| | | Common Shares | | | Common | | | Common Shares | | | Assuming Full | |
| | | Beneficially Owned | | | Shares | | | Beneficially Owned | | | Exercise of Over- | |
| | | Prior to the Offering | | | Offered Hereby | | | After the Offering | | | Allotment Option | |
| | | | | | | | | | | | | |
| Name and Address of Beneficial Owner | | Number | | | % | | | Number | | | Number | | | % | | | Number | | | % | |
| | | | | | | | | | | | | | | | | | | | | | |
| George R. Brokaw | | | 555 | (a) | | | * | | | | — | | | | | | | | | | | | | | | | | |
| John A. Brussa | | | 4,555 | (a) | | | * | | | | — | | | | | | | | | | | | | | | | | |
| Vincent J. Gallant | | | 7,000 | (b) | | | * | | | | — | | | | | | | | | | | | | | | | | |
| Donald R. Getty | | | 2,388 | (c) | | | * | | | | | | | | | | | | | | | | | | | | | |
| Martin P. Gouin | | | — | | | | — | | | | — | | | | | | | | | | | | | | | | | |
| Robert G. Harris | | | — | | | | — | | | | — | | | | | | | | | | | | | | | | | |
| John D. Hawkins | | | 555 | (a)(i) | | | * | | | | — | | | | | | | | | | | | | | | | | |
| Christopher J. Hayman | | | 1,600 | (d) | | | * | | | | — | | | | | | | | | | | | | | | | | |
| William M. Koehn | | | 7,000 | (b) | | | * | | | | — | | | | | | | | | | | | | | | | | |
| Ronald A. McIntosh | | | 3,400 | (e) | | | * | | | | — | | | | | | | | | | | | | | | | | |
114
| | | | | | | | | | | | | | | | | | | | | | | | | | | | | | |
| | | | | | | | | | | | | Common Shares | |
| | | | | | | | | | | | | Beneficially Owned | |
| | | | | | | | | After the Offering | |
| | | Common Shares | | | Common | | | Common Shares | | | Assuming Full | |
| | | Beneficially Owned | | | Shares | | | Beneficially Owned | | | Exercise of Over- | |
| | | Prior to the Offering | | | Offered Hereby | | | After the Offering | | | Allotment Option | |
| | | | | | | | | | | | | |
| Name and Address of Beneficial Owner | | Number | | | % | | | Number | | | Number | | | % | | | Number | | | % | |
| | | | | | | | | | | | | | | | | | | | | | |
| William C. Oehmig | | | 6,626 | (f)(g) | | | * | | | | — | | | | | | | | | | | | | | | | | |
| Richard D. Paterson | | | 555 | (a)(k) | | | * | | | | — | | | | | | | | | | | | | | | | | |
| Rodney J. Ruston | | | 6,000 | (g) | | | * | | | | — | | | | | | | | | | | | | | | | | |
| Allen R. Sello | | | 1,000 | | | | * | | | | — | | | | | | | | | | | | | | | | | |
| Miles W. Safranovich | | | 1,100 | (d) | | | * | | | | — | | | | | | | | | | | | | | | | | |
| Peter W. Tomsett | | | — | | | | — | | | | — | | | | | | | | | | | | | | | | | |
| K. Rick Turner | | | 555 | (a) | | | * | | | | — | | | | | | | | | | | | | | | | | |
| Douglas A. Wilkes | | | — | | | | — | | | | — | | | | | | | | | | | | | | | | | |
| Directors and executive officers as a group (18 persons) | | | 42,889 | (h) | | | 4.62 | | | | — | | | | | | | | | | | | | | | | | |
| Sterling Group Partners I, L.P. | | | 272,456 | (i) | | | 29.88 | | | | | | | | | | | | | | | | | | | | | |
| | Eight Greenway Plaza, Suite 702
Houston, Texas 77046 | | | | | | | | | | | | | | | | | | | | | | | | | | | | |
| Perry Luxco S.A.R.L. | | | 104,542 | (j) | | | 11.47 | | | | | | | | | | | | | | | | | | | | | |
| | Carré Bonn
20, Rue de la Poste
L-2346 Luxembourg | | | | | | | | | | | | | | | | | | | | | | | | | | | | |
| Perry Partners, L.P. | | | 92,707 | (j) | | | 10.17 | | | | | | | | | | | | | | | | | | | | | |
| | 767 Fifth Avenue
19th Floor
New York, New York 10153 | | | | | | | | | | | | | | | | | | | | | | | | | | | | |
| Genstar Capital Partners III, L.P. | | | 190,412 | (k) | | | 20.88 | | | | | | | | | | | | | | | | | | | | | |
| | Four Embarcadero Center Suite 1900
San Francisco, California 94111 | | | | | | | | | | | | | | | | | | | | | | | | | | | | |
| Stargen III, L.P. | | | 6,838 | (k) | | | * | | | | | | | | | | | | | | | | | | | | | |
| | Four Embarcadero Center
Suite 1900
San Francisco, California 94111 | | | | | | | | | | | | | | | | | | | | | | | | | | | | |
| Stephens-NACG LLC | | | 131,500 | (l) | | | 14.42 | | | | | | | | | | | | | | | | | | | | | |
| | 111 Center Street
Little Rock, Arkansas 72201 | | | | | | | | | | | | | | | | | | | | | | | | | | | | |
| Paribas North America, Inc. | | | 65,750 | (m) | | | 7.21 | | | | | | | | | | | | | | | | | | | | | |
| | 787 Seventh Avenue
New York, New York 10019 | | | | | | | | | | | | | | | | | | | | | | | | | | | | |
| Perry Partners International, Inc. | | | — | (j) | | | * | | | | | | | | | | | | | | | | | | | | | |
| | 767 Fifth Avenue
19thFloor
New York, New York 10153 | | | | | | | | | | | | | | | | | | | | | | | | | | | | |
| L.H. Caldwell | | | 6,575 | (n) | | | * | | | | | | | | | | | | | | | | | | | | | |
| | 736 Market Street, Suite 1400
Chattanooga, TN 37402 | | | | | | | | | | | | | | | | | | | | | | | | | | | | |
| TSW II, L.P. | | | 6,575 | (n) | | | * | | | | | | | | | | | | | | | | | | | | | |
| | 736 Market Street, Suite 1400
Chattanooga, TN 37402 | | | | | | | | | | | | | | | | | | | | | | | | | | | | |
| Gary L. Rosenthal | | | 657 | (o) | | | * | | | | | | | | | | | | | | | | | | | | | |
| | Eight Greenway Plaza, Suite 720
Houston, Texas 77046 | | | | | | | | | | | | | | | | | | | | | | | | | | | | |
| R. Kent Wallace | | | 394 | (p) | | | * | | | | | | | | | | | | | | | | | | | | | |
| | Eight Greenway Plaza, Suite 720
Houston, Texas 77046 | | | | | | | | | | | | | | | | | | | | | | | | | | | | |
115
| | |
| * | | Less than 1%. |
| |
| (a) | | Includes currently exercisable options to purchase 555 shares. |
| |
| (b) | | Includes currently exercisable options to purchase 2,000 shares. |
| |
|
| (c) | | Includes currently exercisable options to purchase 1,388 shares. |
|
| |
|
| (d) | | Includes currently exercisable options to purchase 600 shares. |
|
| |
|
| (e) | | Includes currently exercisable options to purchase 1,400 shares. |
|
| |
|
| (f) | | Includes 1,842 shares that have been donated by Mr. Oehmig but over which Mr. Oehmig retains sole voting power. |
|
| |
|
| (g) | | Includes currently exercisable options to purchase 5,500 shares. |
|
| |
|
| (h) | | Includes currently exercisable options to purchase 16,263 shares. |
|
| |
|
| (i) | | Sterling Group Partners I GP, L.P. is the sole general partner of Sterling Group Partners I, L.P. Sterling Group Partners I GP, L.P. has five general partners, each of which is wholly-owned by one of Frank J. Hevrdejs, William C. Oehmig, T. Hunter Nelson, John D. Hawkins and C. Kevin Garland. Each of these individuals disclaims beneficial ownership of the shares owned by Sterling Group Partners I, L.P. Sterling Group Partners I, L.P. is an affiliate of The Sterling Group, L.P., one of our sponsors. See “Our Equity Sponsors.” |
|
| |
|
| (j) | | Richard Perry is the President and sole shareholder of Perry Corp., which is the investment manager of Perry Luxco S.A.R.L. and Perry Partners International, Inc. and the managing general partner of Perry Partners, L.P. As such, Mr. Perry may be deemed to have beneficial ownership over the respective common shares owned by Perry Luxco S.A.R.L., Perry Partners, L.P. and Perry Partners International, Inc.; however, Mr. Perry disclaims such beneficial ownership, except to the extent of his pecuniary interest, if any, therein. Perry Corp. is an affiliate of Perry Strategic Capital Inc., one of our sponsors. See “Our Equity Sponsors.” |
|
| |
|
| (k) | | Genstar Capital III, L.P. is the sole general partner of each of Genstar Capital Partners III, L.P. and Stargen III, L.P., and Genstar III GP LLC is the sole general partner of Genstar Capital III, L.P. Jean-Pierre L. Conte, Richard F. Hoskins and Richard D. Paterson are the managing members of Genstar III GP LLC. In such capacity, Messrs. Conte, Hoskins and Paterson may be deemed to beneficially own common shares beneficially owned, or deemed to be beneficially owned, by Genstar III GP LLC, but disclaim such beneficial ownership. Genstar Capital Partners III, L.P. and Stargen III, L.P. are affiliates of Genstar Capital, L.P., one of our sponsors. See “Our Equity Sponsors.” |
|
| |
|
| (l) | | SF Holding Corp. is the sole manager of Stephens-NACG LLC. Warren A. Stephens owns 50% of the capital shares of SF Holding Corp. and may be deemed to have beneficial ownership of the common shares beneficially owned by Stephens-NACG LLC. SF Holding Corp. is one of our sponsors. See “Our Equity Sponsors.” |
|
| |
|
| (m) | | Includes 20,620 non-voting common shares, which are convertible on a share-for-share basis into voting common shares in certain circumstances, including if such shares are sold in this offering. |
|
| |
|
| (n) | | Mr. Caldwell may be deemed to beneficially own the shares beneficially owned by TSW II, L.P. Mr. Caldwell owns an approximately 0.85% limited partner interest in Sterling Group Partners I, L.P. and therefore may be deemed to have beneficial ownership of the common shares beneficially owned by Sterling Group Partners I, L.P. to the extent of his pecuniary interest therein. |
|
| |
|
| (o) | | Mr. Rosenthal is a principal with The Sterling Group, L.P., one of our sponsors. |
|
| |
|
| (p) | | Mr. Wallace is an employee of The Sterling Group, L.P., one of our sponsors, and was our Secretary from October 2003 to June 2005. |
|
116
DESCRIPTION OF CERTAIN INDEBTEDNESS
Revolving Credit Facility
We entered into an amended and restated credit agreement dated as of July 19, 2006 with a syndicate of lenders that provides us with a $55.0 million revolving credit facility. The following is a summary of certain provisions of the revolving credit facility.
General. Our revolving credit facility provides for an original principal amount of up to $55.0 million under which revolving loans may be made and under which letters of credit may be issued. The facility will mature on March 1, 2010.
Security. The credit facility is secured by a first priority lien on substantially all of our and our subsidiaries’ existing and after-acquired property (tangible and intangible), including, without limitation, all accounts receivable, inventory, equipment, intellectual property and other personal property, and all real property, whether owned or leased, and a pledge of the shares of the pre-amalgamated North American Energy Partners Inc. and the shares of its subsidiaries, subject to various exceptions.
Interest rates and fees. The facility bears interest at variable rates based on the Canadian prime rate plus 2.0% per annum (1.5% per annum for swing line loans). Interest is payable monthly in arrears and computed on the basis of a365-day year. Letters of credit are subject to a 3.0% per annum fee and to a fronting fee equal to the greater of $500 or 0.25% per annum of the daily drawable amount paid quarterly in arrears. Canadian bankers’ acceptances are subject to a 3.0% per annum stamping fee calculated on the principal amount at maturity. Commitment fees equal to 0.50% per annum multiplied by the daily average unused portion of the credit facility are computed on the basis of a365-day year and payable quarterly in arrears. During an event of default, interest rates are increased by 2% per annum in excess of the rate otherwise payable.
Prepayments and commitment reductions. The credit facility may be prepaid in whole or in part without premium or penalty, except for bankers’ acceptances, which will not be prepayable prior to their maturity. However, the credit facility requires prepayments under various circumstances, such as: (i) 100% of the net cash proceeds of certain asset dispositions, subject to certain reinvestment rights, (ii) 100% of the net cash proceeds from our issuance of debt, subject to certain exceptions, (iii) 100% of the net cash proceeds from our issuance of equity (excluding the proceeds from this offering) and capital contributions to NACG Preferred Corp. in excess of a specified amount, (iv) 100% of all casualty and condemnation proceeds, subject to certain reinvestment rights and (v) such amounts as may be necessary to ensure that the outstanding portion of the credit facility does not exceed the commitments and the outstanding portion of the credit facility, plus total liabilities of North American Energy Partners Inc. and its subsidiaries under hedge agreements with lenders on a mark-to-market basis, does not exceed the borrowing base, as defined below.
Borrowing Base. The borrowing base is defined in the credit agreement to mean an aggregate amount equal to: (i) 60% of the book value of our consolidated property, plant and equipment, plus (ii) 75% of the value of eligible accounts receivable, as defined in the credit facility, plus (iii) unrestricted cash and cash equivalents in excess of $15.0 million. The sum of borrowings and letters of credit under the credit facility, plus ourmark-to-market liabilities under all secured swaps may not exceed the borrowing base. Had this facility been in place as of June 30, 2006, the borrowing base, as defined above, would have been approximately $203.8 million. As of June 30, 2006, themark-to-market liabilities under existing secured swap agreements was approximately $71.0 million. As a result, the total amount of available borrowings under this revolving credit facility would have been approximately $55.0 million as of such date. After taking into account $18.0 million of issued and outstanding letters of credit, the remaining amount of available borrowings as of that date would have been approximately $37.0 million.
117
Covenants. The credit facility contains restrictive covenants limiting our ability, and the ability of our subsidiaries to, without limitation and subject to various exceptions:
| | |
| | • | incur debt or enter into sale and leaseback transactions or contractual contingent obligations; |
| |
| | • | prepay, purchase or otherwise acquire or retire prior to stated maturity certain debt or amend the indentures; |
| |
| | • | create or allow to exist liens or other encumbrances; |
| |
| | • | transfer assets (including any class of stock or the voting rights of any of our subsidiaries) except for sales and other transfers of inventory or surplus, immaterial or obsolete assets in our ordinary course of business and other exceptions set forth in the credit agreement; |
| |
| | • | enter into mergers, consolidations and asset dispositions of all or substantially all of our, or any of our subsidiaries, properties; |
| |
| | • | make investments, including acquisitions; |
| |
| | • | enter into transactions with related parties other than in the ordinary course of business on an arm’s-length basis on terms no less favorable to us than those available from third parties; |
| |
| | • | make any material change in the general nature of the business conducted by us; and |
| |
| | • | pay dividends or redeem shares of capital stock. |
Under the credit facility, we are required to satisfy certain financial covenants, including a minimum interest coverage ratio, a maximum leverage ratio and a minimum consolidated EBITDA requirement.
Events of default. The credit facility contains customary events of default, including, without limitation, failure to make payments when due, defaults under other agreements or instruments of indebtedness, noncompliance with covenants, breaches of representations and warranties, bankruptcy, judgments in excess of specified amounts, invalidity of loan documents, impairment of security interest in collateral, and changes of control.
9% Senior Secured Notes due 2010
General. On May 19, 2005, we issued an aggregate of US$60,481,000 of 9% senior secured notes pursuant to an indenture among us, the subsidiary guarantors and Wells Fargo Bank, N.A., as trustee. These notes will mature on June 1, 2010. Interest on these notes accrues at 9% per annum and is payable in arrears on June 1 and December 1 of each year. All of our subsidiaries jointly and severally guarantee the 9% senior notes. We have made an offer to repurchase and have received tenders for all of the outstanding 9% senior secured notes. We will use a portion of the proceeds from this offering to complete this repurchase.
Security. The 9% senior secured notes and related guarantees are secured by a lien on substantially all of our assets and the assets of our existing and future restricted subsidiaries (other than any immaterial subsidiaries), including a pledge of the stock of our existing and future subsidiaries. Pursuant to the terms of an intercreditor agreement, the security interest in the assets that secure the 9% senior secured notes and the guarantees are subordinated to prior liens thereon that secure our revolving credit facility and the swap agreements, discussed below.
Redemption and Repurchase. We may redeem some or all of the 9% senior secured notes at any time on or after June 1, 2008, at specified redemption prices. We may redeem up to 35% of the original aggregate principal amount of the 9% senior secured notes in the event of certain equity sales at any time on or after June 1, 2008 at specified redemption prices. We may redeem all but not part of the 9% senior secured notes in the event of various changes in the laws affecting withholding taxes. We are not required to make mandatory redemption or sinking fund payments with respect to the 9% senior secured notes. We will be required to offer to repurchase the 9% senior secured notes from holders if we undergo a change of control or sell our assets in specified circumstances.
118
Covenants. The indenture governing the 9% senior secured notes restricts, among other things, our ability to pay dividends, redeem capital stock or prepay certain subordinated debt; incur additional debt or issue preferred stock; grant liens; merge, consolidate or transfer substantially all of our assets; enter into certain transactions with affiliates; impose restrictions on any subsidiary’s ability to pay dividends or transfer assets to us; enter into certain sale and leaseback transactions; permit subsidiaries to guarantee debt; and take actions that would materially impair the security interests in favor of the trustee. All of these restrictions are subject to customary exceptions.
83/4% Senior Notes due 2011
General. On November 26, 2003, we issued an aggregate of US$200.0 million of 83/4% senior unsecured notes pursuant to an indenture among us, the subsidiary guarantors and Wells Fargo Bank, N.A., as trustee. These notes will mature on December 1, 2011. Interest on these notes accrues at 83/4% per annum and is payable in arrears on June 1 and December 1 of each year. All of our subsidiaries jointly and severally guarantee the 83/4% senior notes.
Redemption and Repurchase. We may redeem some or all of the 83/4% senior notes at any time on or after December 1, 2007, at specified redemption prices. We may redeem up to 35% of the original aggregate principal amount of the 83/4% senior notes in the event of certain equity sales at any time on or after December 1, 2007 at specified redemption prices. We may redeem all but not part of the notes in the event of various changes in the laws affecting withholding taxes. We are not required to make mandatory redemption or sinking fund payments with respect to the 83/4% senior notes. We will be required to offer to repurchase the 83/4% senior notes from holders if we undergo a change of control or sell our assets in specified circumstances. Neither the Reorganization nor this offering constitutes a change of control under the indenture.
Covenants. The indenture governing the 83/4% senior notes restricts, among other things, our ability to pay dividends, redeem capital stock or prepay certain subordinated debt; incur additional debt or issue preferred stock; grant liens; merge, consolidate or transfer substantially all of our assets; enter into certain transactions with affiliates; impose restrictions on any subsidiary’s ability to pay dividends or transfer assets to us; enter into certain sale and leaseback transactions; and permit subsidiaries to guarantee debt. All of these restrictions are subject to customary exceptions.
Swap Agreements
We have entered into two separate International Swap Dealer Association – Master Agreements, one with BNP Paribas, as counterparty, dated November 23, 2003, and one with HSBC Bank Canada, as counterparty, dated March 26, 2004. These agreements are collectively referred to as the swap agreements. Pursuant to the swap agreements, we have and may enter into one or more interest rate or currency swap transactions governed by the terms of the swap agreements and the confirmations issued by the counterparty in respect of each transaction. The swap agreements contain customary representations and warranties, covenants and events of default. Specifically, each swap agreement contains a provision that an event of default under our existing credit agreement will constitute an event of default under such swap agreement and that the counterparty will be entitled to terminate the swap agreement if our payment obligations to the counterparty cease to be securedpari passuwith the obligations under the credit agreement. As of June 30, 2006, the liability, measured at fair value, associated with the swap agreements was approximately $71.0 million.
119
DESCRIPTION OF SHARE CAPITAL
General
After completion of the Reorganization, our articles of amalgamation will authorize us to issue an unlimited number of voting common shares, an unlimited number of non-voting common shares and an unlimited number of Series A preferred shares. After the completion of the Reorganization and prior to this offering, we will have common shares outstanding and held of record by 90 shareholders, and non-voting common shares outstanding and held of record by one shareholder.
Some of the statements contained herein are summaries of the material provisions of our articles of amalgamation relating to dividends, distribution of assets upon dissolution, liquidation or winding up and are qualified in their entirety by reference to our articles of amalgamation.
Voting Common Shares
The shares being offered in this offering are our voting common shares. Unless the context requires otherwise, references in this section to “common shares” are to our voting common shares only. Each voting common share has an equal and ratable right to receive dividends to be paid from our assets legally available therefor when, as and if declared by our board of directors. Our ability to declare dividends is restricted by the terms of our revolving credit facility and the indentures that govern the 83/4% senior and the 9% senior secured notes. See “Description of Certain Indebtedness.”
In the event of our dissolution, liquidation or winding up, the holders of common shares are entitled to share equally and ratably in the assets available for distribution after payments are made to our creditors. Except as provided by the investor shareholders agreement discussed under “Shareholders Agreements – Preemptive Rights” below, holders of common shares have no preemptive rights or other rights to subscribe for our securities. Each common share entitles the holder thereof to one vote in the election of directors and all other matters submitted to a vote of shareholders, and holders of common shares have no rights to cumulate their votes in the election of directors.
On October 17, 2003, we issued 10 common shares to Sterling Group Partners I, L.P. in connection with our formation. On November 26, 2003, we issued an aggregate of 904,380 common shares and 20,620 non-voting common shares to our executive officers and directors, investment entities controlled by our sponsors and certain persons associated with the sponsors in exchange for an aggregate of $92.5 million in cash in connection with the Acquisition. On January 15, 2004, we issued an aggregate of 17,408 common shares to our directors, officers and employees and certain persons associated with the sponsors in exchange for an aggregate of $1.7 million in cash. We used the net proceeds from these sales to repurchase a like amount of our common shares from Sterling Group Partners I, L.P. On July 23, 2004, we issued 2,000 common shares to one of our directors in exchange for $200,000 in cash. On August 20, 2004, we issued 1,000 common shares to one of our directors in exchange for $100,000 in cash. On December 31, 2005, we issued an aggregate of 2,000 common shares to our executive officers in exchange for an aggregate of $200,000 in cash. On March 30, 2006, we issued 1,000 common shares to one of our directors in exchange for $100,000 in cash.
Non-Voting Common Shares
Regulatory requirements applicable to affiliates of Paribas North America, Inc., an affiliate of BNP Paribas, the lender under our revolving credit facility, limit the amount of our voting shares it may own. Therefore, in addition to our voting common shares that it owns, it also owns all of our non-voting common shares, which it acquired on November 26, 2003. Except as prescribed by Canadian law and except in limited circumstances, the non-voting common shares have no voting rights but are otherwise identical to the voting common shares in all respects. The non-voting common shares are convertible into voting common shares on a share-for-share basis at the option of Paribas North America if it transfers, sells or otherwise disposes of the converted voting common shares (1) in a public offering of our voting common shares; (2) to a third party that, prior to such sale, controls us; (3) to a third party that, after
120
such sale, is a beneficial owner of not more than 2% of our outstanding voting shares; (4) in a transaction that complies with Rule 144 under the Securities Act; or (5) in a transaction approved in advance by regulatory bodies.
Other Provisions of Our Articles of Incorporation and By-Laws and the Canadian Business Corporations Act
| |
| Stated Objects or Purposes |
Our articles of incorporation do not contain stated objects or purposes and do not place any limitations on the business that we may carry on.
Power to vote on matters in which a director is materially interested.The Canada Business Corporations Act, or CBCA, states that a director must disclose, in accordance with the provisions of the CBCA, the nature and extent of an interest the director has in a material contract or material transaction, whether made or proposed, with us, if the director is a party to the contract or transaction, is a director or an officer, or an individual acting in a similar capacity, of a party to the contract or transaction or has a material interest in a party to the contract or transaction.
A director who holds a disclosable interest in respect of any contract or transaction into which we have entered or propose to enter shall not vote on any directors’ resolution to approve that contract or transaction, unless the contract or transaction:
| | |
| | • | relates primarily to the director’s remuneration as a director, officer, employee or agent of us or an affiliate; |
| |
| | • | is for indemnity or insurance otherwise permitted under the CBCA; or |
| |
| | • | is with an affiliate of ours. |
Borrowing power exercisable by directors. Our articles of incorporation authorize our board of directors, on our behalf, to borrow money on our credit, issue debt, provide guarantees or mortgage, pledge or otherwise create a security interest in our property without authorization of our shareholders.
Directors’ power to determine the compensation of directors.The CBCA provides that the remuneration of our directors, if any, may be determined by our directors subject to the articles of incorporation and bylaws and any agreement among all of the shareholders restricting the powers of the directors. That remuneration may be in addition to any salary or other remuneration paid to any of our officers or employees who are also directors.
Retirement or non-retirement of directors under an age limit requirement. Neither our articles of incorporation nor the CBCA impose any mandatory age-related retirement or non-retirement requirement for our directors.
Number of shares required to be owned by a director.Neither our articles of incorporation nor the CBCA provide that a director is required to hold any of our shares as a qualification for holding his or her office.
| |
| Action Necessary to Change the Rights of Holders of Our Shares |
Our shareholders can authorize the alteration of our articles of incorporation to create or vary the special rights or restrictions attached to any of our shares by passing a special resolution. However, a right or special right attached to any class or series of shares may not be prejudiced or interfered with unless the shareholders holding shares of the class or series to which the right or special right is attached consent by a special separate resolution. A special resolution means a resolution passed by: (a) a majority of not less than two-thirds of the votes cast by the applicable class or series of shareholders who vote in person or by
121
proxy at a general meeting, or (b) a resolution consented to in writing by all of the shareholders holding the applicable class or series of shares.
We are required to hold an annual general meeting of our shareholders at least once every calendar year at a time and place determined by our board of directors, provided that the meeting must not be called later than 15 months after the preceding annual general meeting, although, as a result of applicable rules of the stock exchange on which we may be listed, the meeting must be held no later than six months after the end of our fiscal year. A meeting of our shareholders may be held anywhere in Canada, or provided the shareholders agree, anywhere outside of Canada.
Our board, the chairman of the board or the president may, at any time, call a special meeting of our shareholders.
A notice convening a meeting of shareholders, specifying the date, time and location of the meeting and, where a meeting is to consider special business, the general nature of the special business, must be given to shareholders not less than 21 days nor more than 60 days prior to the meeting, although, as a result of applicable securities rules, the time for notice is effectively longer. Under the CBCA, shareholders entitled to notice of a meeting may waive or reduce the period of notice for that meeting, provided applicable securities rules are met. The accidental omission to send notice of any meeting of shareholders to, or the non-receipt of any notice by, any person entitled to notice does not invalidate any proceedings at that meeting.
A quorum for general meetings is one person present and being, or representing by proxy, shareholders holding in the aggregate not less than a majority of the outstanding shares entitled to be voted at the meeting. If a quorum is present at the opening of any meeting of shareholders, the shareholders present or represented may proceed with the business of the meeting notwithstanding that a quorum is not present throughout the meeting. If a quorum is not present at the opening of any meeting of shareholders, the shareholders present or represented may adjourn the meeting to a fixed time and place but may not transact any other business.
Holders of our voting common shares are entitled to attend general meetings of our shareholders. Except as otherwise provided with respect to our non-voting common shares, and except as otherwise required by law, the holders of our non-voting common shares are not entitled as a class to receive notice of, attend or vote at any meetings of our shareholders.
Neither our articles of incorporation nor our by-laws contain any change of control limitations with respect to a merger, acquisition or corporate restructuring that involves us.
| |
| Shareholder Ownership Disclosure |
Neither our articles of incorporation nor our by-laws provide for any ownership threshold above which shareholder ownership must be disclosed.
Shareholders Agreements
All holders of our common shares who are also our employees or employees of any of our subsidiaries are parties to an employee shareholders agreement. All other holders of our common shares are parties to an investor shareholders agreement. The shareholders agreements include the following provisions:
| |
| Certain Transfers/ Rights of First Refusal and Tag Along Rights |
Except for certain permitted transfers, the investor shareholders agreement permits the shareholders who are parties to that agreement to transfer their common shares or any interest therein only upon receipt
122
of a written bona fide third-party offer and after offering all such shares first to us and then to the other shareholders that are parties to the agreement at the price and on the terms specified in the third-party offer and offering such other shareholders the right to participate in such transfer on a pro rata basis. In the event that we and the other shareholders do not accept all of the shares subject to the offer and the other shareholders expect not to participate in such transfer, the offering shareholder may transfer any remaining shares to the third party on no more favorable terms than those specified in the offer for a limited period of time.
Except for certain permitted transfers, the employee shareholders agreement permits the shareholders who are parties to that agreement to transfer their common shares or any interest therein only (1) upon receipt of a written bona fide third-party offer, (2) after the shareholder has held such shares for at least two years and (3) after offering all such shares to us at the price and on the terms specified in the third-party offer. In the event that we do not accept all of the shares subject to the offer, the offering shareholder may transfer any remaining shares to the third-party on no more favorable terms than those specified in the offer for a limited period of time. Also, if an employee shareholder is for any reason no longer employed by us or any of our subsidiaries before the two-year anniversary of the date the holder becomes a party to the agreement, the holder must sell all of his or her shares to us at the then fair market value of the shares.
Each shareholders agreement contains provisions requiring all shareholders who are parties thereto to join in any control disposition, as defined below, to or with an independent third party, as defined below, or group of independent third parties and requiring their consent to the sale of all or substantially all of our consolidated assets to an independent third party or a group of independent third parties, in either case if the transaction is approved by the holders of at least two-thirds of the shares subject to the investor shareholders agreement and if, pursuant to the transaction, all of such holders are entitled to receive the same form and amount of consideration with respect to their shares. Each holder that is a party to either agreement agrees to consent to and raise no objections to such an approved transaction, to waive any dissenter’s rights or similar rights and to sell the common shares held by such holder on the terms and conditions approved. A control disposition is defined as any disposition or class of related dispositions which would have the effect of transferring to any transferee or group beneficial ownership of a number of the common shares (a) that exceeds 40% of the then-outstanding common shares, on a fully-diluted basis, or (b) if thereafter the proposed transferee would directly or indirectly have beneficial ownership of 50% or more of all the then-outstanding common shares, on a fully-diluted basis. An independent third party is defined as any person or entity that does not own more than 5% of the outstanding common shares on an as-if converted basis, and any person or entity that is not affiliated with or associated with any such 5% holder.
Subject to specified exceptions, the investor shareholders agreement provides the holders of common shares who are parties thereto preemptive rights in the event of an offering of any of our capital shares. These exceptions include an initial public offering; an approved sale; securities issued upon conversion of convertible securities previously issued in compliance with the agreement; issuances to employees, prospective employees, directors and prospective directors, if approved by our board of directors; issuances of shares resulting in net proceeds to us of less than an aggregate of US$5.0 million; issuances as consideration for the acquisition of any business entity if we or any of our subsidiaries owns at least a majority of the voting power of the entity being acquired and the acquisition is approved by our board of directors; issuances to any bank, subordinated debt lender, equipment lessor, landlord or other similar financial institution or investor in connection with a loan transaction or equipment lease or similar commercial transaction provided that any such transaction is approved by our board of directors; and issuances in connection with any stock split, stock dividend, distribution or recapitalization by us. The preemptive rights provided under the agreement expire 10 days after the holders receive written notice of
123
the offering, and we will then have 270 days in which to sell the shares the holders have elected not to purchase.
The employee shareholders agreement does not provide any preemptive rights.
Each shareholders agreement requires that, at any time that we are engaged in an underwritten public offering of our securities, each shareholder who is a party to either agreement shall refrain from making any disposition of common shares on a securities exchange or in theover-the-counter or any other public trading market for a period of time not to exceed 180 days. This provision, however, does not limit any shareholder’s right to include common shares held by it in any such underwritten public offering pursuant to any demand or piggyback registration rights that such shareholder may have.
Each shareholders agreement provides that notwithstanding certain other provisions of the respective agreements permitting transfers of shares, no transfer will be made which would cause, in our reasonable judgment, a material breach of or default or acceleration of payments under any agreement to which we or any of our subsidiaries is a party under which the indebtedness or liability of us or any of our subsidiaries is more than $1.0 million.
The employee shareholders agreement will terminate upon any of the following events: (i) our dissolution; (ii) after 10 days notice from us to all the holders party to the agreement; or (iii) the completion of a registered public offering of common shares (excluding certain offerings) resulting in net proceeds to us of at least $100 million.
The investor shareholders agreement will terminate upon any of the following events: (i) our dissolution; (ii) any event that reduces the number of shareholders party to the agreement to one in accordance with the terms of the investor shareholders agreement; (iii) the completion of a registered public offering of common shares (excluding certain offerings) resulting in net proceeds to us of at least $100 million; or (iv) the written approval of the holders of 90% of the shares subject to the agreement.
Both the employee shareholders agreement and the investor shareholders agreement will terminate upon the completion of this offering.
Voting and Corporate Governance Agreement and Registration Rights Agreement
We are party to a voting agreement and a registration rights agreement with certain of our common shareholders. See “Related Party Transactions.” The voting agreement will terminate upon the completion of this offering, but designated affiliates of the shareholders party to the voting agreement will retain various rights. See “Related Party Transactions — Voting and Corporate Governance Agreement.”
Transfer Agent
CIBC Mellon Trust Company, located in Calgary, Alberta and Mellon Financial Services LLC, located in Jersey City, New Jersey are co-transfer agents and registrars for our common shares.
Exchange Controls
Limitations on the ability to acquire and hold our common shares may be imposed by the Competition Act (Canada). This legislation permits the Commissioner of Competition of Canada, or Commissioner, to review any acquisition of a significant interest in us. This legislation grants the Commissioner jurisdiction, for up to three years, to seek a remedial order, including an order to prohibit
124
the acquisition, from the Canadian Competition Tribunal, which order may be granted where the Competition Tribunal finds that the acquisition substantially prevents or lessens, or is likely to substantially prevent or lessen, competition in any market in Canada.
This legislation also requires any person or persons who intend to acquire more than 20% of our common shares or, if such person or persons already own 20% or more of our common shares prior to the acquisition, more than 50% of our common shares, to file a notification with the Canadian Competition Bureau if certain financial thresholds are exceeded. Where a notification is required, the legislation prohibits completion of the acquisition until the expiration of a statutory waiting period, unless the Commissioner provides written notice that he or she does not intend to challenge the acquisition.
The Investment Canada Act (Canada), or Investment Act, requires each “non-Canadian,” as determined in the Investment Act, who commences a new business activity in Canada or acquires control of an existing Canadian business, where the establishment or acquisition of control is not a reviewable transaction by Canadian authorities under the Investment Act, to file a notification in prescribed form. Subject to certain exceptions, a transaction that is reviewable under the Investment Act may not be implemented until an application for review has been filed and the responsible Minister of the federal cabinet has determined that the investment is likely to be of “net benefit to Canada” taking into account the factors, where relevant, set out in the Investment Act. An investment in our common shares by a non-Canadian would be reviewable under the Investment Act if it were an investment to acquire control of us and the value of our assets was $5.0 million or more as determined pursuant to the Investment Act. The Investment Act provides for special review thresholds for non-Canadians who qualify as “WTO investors” under the Investment Act. The Investment Act sets out rules to determine who is a WTO investor. A WTO investor is a defined term in the Investment Act and would include, for example, nationals or governments of a World Trade Organization member country or entities controlled by such individuals or governments. Under the Investment Act, an investment in our common shares by a non-Canadian who is a “WTO investor” (as defined in the Investment Act) would be reviewable only if it were an investment to acquire control of us pursuant to the Investment Act and the value of our assets (as determined pursuant to the Investment Act) was equal to or greater than a specified amount, which varies annually. The specified threshold amount is $265 million in 2006 (as determined under the Investment Act). This threshold is subject to an annual adjustment pursuant to the Investment Act.
The Investment Act contains various rules to determine if there has been an acquisition of control. For example, for purposes of determining whether an investor has acquired control of a corporation by acquiring common shares, the following general rules apply: the acquisition of a majority of the voting interests or the undivided ownership interests in the voting shares of an entity that is a corporation is deemed to be acquisition of control of that entity; the acquisition of less than a majority, but one-third or more, of the voting shares of a corporation or of an equivalent undivided ownership interest in the voting shares of the corporation is presumed to be acquisition of control of that corporation unless it can be established that, on the acquisition, the corporation is not controlled in fact by the acquiror through the ownership of voting shares; and the acquisition of less than one-third of the voting shares of a corporation or of an equivalent undivided ownership interest in the voting shares of the corporation is deemed not to be acquisition of control of that corporation. Certain transactions in relation to our common shares would be exempt from review from the Investment Act, including, for example:
| | |
| | • | acquisition of our common shares by a person in the ordinary course of that person’s business as a trader or dealer in securities; |
| |
| | • | acquisition or control of us in connection with the realization of security granted for a loan or other financial assistance and not for any purpose related to the provisions of the Investment Act; and |
125
| | |
| | • | acquisition or control of us by reason of an amalgamation, merger, consolidation or corporate reorganization following which the ultimate direct or indirect control in fact of us, through the ownership of voting interests, remains unchanged. |
The foregoing provisions of the Competition Act and the Investment Act could prevent or delay an acquisition of our company by a third party or other transaction that our shareholders may consider desirable. The foregoing summary of certain provisions of the Competition Act and the Investment Act is not complete and is qualified in its entirety by reference to the Competition Act and Investment Act.
There is no law, governmental decree or regulation in Canada that restricts the export or import of capital, or that would affect the remittance of dividends (if any) or other payments by us to non-resident holders of our common shares, other than withholding requirements under applicable tax laws.
126
SHARES ELIGIBLE FOR FUTURE SALE
Based on the number of common shares outstanding at , 2006, after giving effect to the Reorganization and after this offering, we will have common shares outstanding, assuming no exercise of outstanding options. After completion of the Reorganization, we will have non-voting common shares outstanding. These shares are convertible into voting common shares on a share-for-share basis, subject to various limitations. Of the outstanding shares, the shares sold in this offering will be freely tradable without restriction or further registration under the Securities Act, except that any shares held by our “affiliates” as that term is defined in Rule 144 promulgated under the Securities Act may only be sold in compliance with the limitations described below. The remaining common shares held by existing security holders are, and any common shares issued upon conversion of ournon-voting common shares will be, restricted. The common shares under contractuallock-up agreements with us may first be sold at various times after the expiration of the lock-up period described below.
In general, under Rule 144 as currently in effect, if one year has elapsed since the date of acquisition of restricted stock from us or any of our affiliates, and we have been a reporting company under the Exchange Act for at least 90 days, the holder of such restricted stock can sell the shares, provided that the number of shares sold by such person within any three-month period does not exceed the greater of:
| | |
| | • | 1.0% of the total number of common shares then outstanding; or |
| |
| | • | the average weekly trading volume of our common shares during the four calendar weeks preceding the date on which notice of the sale is filed with the SEC. |
Sales under Rule 144 are also subject to certain manner of sale provisions, notice requirements and the availability of certain current public information about us. If two years have elapsed since the date of acquisition of restricted stock from us or any of our affiliates and the holder is not one of our affiliates at any time during the three months preceding the proposed sale, such person can sell such shares in the public market under Rule 144(k) without regard to the volume limitations, manner of sale provisions, public information requirements or notice requirements.
Lock-Up Agreements
We have agreed that we will not offer, sell, contract to sell, pledge or otherwise dispose of, directly or indirectly, or file with the SEC a registration statement under the Securities Act or a prospectus with a Canadian securities regulatory authority, relating to, any of our common shares or securities convertible into or exchangeable or exercisable for any common shares, or publicly disclose the intention to make any offer, sale, pledge, swap, hedge, disposition or filing, without the prior written consent of Credit Suisse Securities (USA) LLC and UBS Securities LLC for a period of 180 days after the date of this prospectus, subject to extension.
Our officers and directors, the selling shareholders and certain other principal shareholders have agreed that they will not offer, sell, contract to sell, pledge or otherwise dispose of, directly or indirectly, any of our common shares or securities convertible into or exchangeable or exercisable for any common shares, enter into a transaction that would have the same effect, or enter into any swap, hedge or other arrangement that transfers, in whole or in part, any of the economic consequences of ownership of our common shares or publicly disclose the intention to make any offer, sale, pledge or disposition, or enter into any transaction, swap, hedge or other arrangement, without, in each case, the prior written consent of Credit Suisse Securities (USA) LLC and UBS Securities LLC for a period of 180 days after the date of this prospectus, subject to extension.
Form S-8 Registration Statements
We intend to file one or more registration statements on Form S-8 under the Securities Act following this offering to register our common shares that are issuable pursuant to our stock option plan. These registration statements are expected to become effective upon filing. Shares covered by these registration
127
statements will then be eligible for resale in the public market without restriction, subject to any applicablelock-up agreements and to Rule 144 limitations applicable to affiliates described above.
Rule 701
Any of our directors, officers, employees, advisors or consultants who held options to purchase common shares under a written compensatory plan or contract, such as our share option plan, prior to the effective date of the registration statement of which this prospectus is a part may be entitled to rely on the resale provisions of Rule 701. Rule 701 permits affiliates to sell their Rule 701 shares under Rule 144 without complying with the holding period requirements of Rule 144. Rule 701 further provides that non-affiliates may sell such shares under Rule 144 without having to comply with the holding period, public information, volume limitation or notice provisions of Rule 144. All holders of Rule 701 shares are required to wait until 90 days after the effective date of the registration statement of which this prospectus is a part before selling such shares. However, shares held by our directors and officers are subject tolock-up agreements and will only become eligible for sale upon the expiration of thelock-up period applicable to them, unless Credit Suisse Securities (USA) LLC and UBS Securities LLC release all or a portion of any Rule 701 shares subject to the lock-up.
Canadian Resale Restrictions
The sale of any of our common shares issued to our existing shareholders as a result of the Reorganization in the public market in Canada will be subject to restrictions under applicable Canadian securities laws, including, in certain cases, a lapse of a four-month period since the date we became a reporting issuer under the securities laws of any Canadian province or territory.
The sale of any of our common shares in Canada which constitutes a “control distribution” under Canadian securities law (generally a sale by a person or a group of persons holding more than 20% of our outstanding voting securities) will be subject to restrictions under applicable Canadian securities laws in addition to those restrictions noted above, unless the sale is qualified under a prospectus filed with Canadian securities regulatory authorities or if prior notice of the sale is filed with the Canadian securities regulatory authorities at least seven days before any sale and there has been compliance with certain other requirements and restrictions regarding the manner of sale, payment of commissions, reporting and availability of current public information about us.
128
INCOME TAX CONSIDERATIONS
Material U.S. Income Tax Considerations
The following discussion addresses the material U.S. federal income tax considerations relating to the purchase, ownership and disposition of our common shares. This discussion is based on the provisions of the Internal Revenue Code of 1986, as amended, the applicable treasury regulations promulgated under the Internal Revenue Code, judicial authority and current administrative rulings and practice. All of these authorities may change without notice, possibly on a retroactive basis. This summary deals only with holders that will hold common shares as capital assets within the meaning of Section 1221 of the Internal Revenue Code. It does not address tax considerations applicable to investors that may be subject to special tax rules, such as banks and other financial institutions; tax-exempt organizations; persons subject to alternative minimum tax; partnerships and other pass-through entities (as determined for U.S. federal income tax purposes); insurance companies; traders or dealers in securities or currencies; custodians, nominees or similar financial intermediaries holding common shares for others; or persons that will hold common shares as a position in a hedging transaction, straddle or conversion transaction for U.S. federal income tax purposes. This summary does not discuss the tax consequences of any conversion of currency into or out of the U.S. dollar as such a conversion relates to the purchase, ownership or disposition of the common shares, nor does it discuss the consequences of any U.S. federal estate and gift tax laws or state, local or foreign tax laws (other than those included under “– Material Canadian Income Tax Considerations”). If a partnership holds our common shares, the tax treatment of a partner will generally depend upon the status of the partner and the activities of the partnership. If you are a partner of a partnership holding our common shares you should consult your tax advisors. We have not sought any ruling from the Internal Revenue Service, or the IRS, with respect to the statements made and the conclusions reached in the following summary. There can be no assurance that the IRS will agree with such statements and conclusions.
THE SUMMARY OF MATERIAL U.S. INCOME TAX CONSIDERATIONS IS INTENDED TO PROVIDE ONLY A GENERAL SUMMARY AND IS NOT INTENDED TO BE A COMPLETE ANALYSIS OR DESCRIPTION OF ALL POTENTIAL U.S. FEDERAL INCOME TAX CONSEQUENCES. TAX LAWS ARE VERY COMPLICATED. PROSPECTIVE INVESTORS IN THE COMMON SHARES SHOULD CONSULT THEIR OWN TAX ADVISORS WITH RESPECT TO THE APPLICATION OF THE U.S. FEDERAL INCOME TAX LAWS TO THEIR PARTICULAR SITUATIONS AS WELL AS ANY TAX CONSEQUENCES ARISING UNDER THE LAWS OF ANY STATE, LOCAL OR FOREIGN TAXING JURISDICTION OR UNDER ANY APPLICABLE TAX TREATY.
U.S. Holders
A U.S. Holder is the beneficial owner of a common share that, for U.S. federal income tax purposes, is:
| | |
| | • | an individual citizen or resident of the United States; |
| |
| | • | a corporation (or other entity taxable as a corporation) created or organized under the laws of the United States, any state thereof or the District of Columbia; |
| |
| | • | an estate, the income of which is subject to U.S. federal income taxation regardless of its source; or |
| |
| | • | a trust, if one or more U.S. persons (as defined in Section 7701(a)(30) of the Internal Revenue Code) have the authority to control all substantial decisions of the trust and a court within the United States is able to exercise primary supervision over the administration of the trust. |
Anon-U.S. Holder is a beneficial owner of a common share who is not a U.S. Holder.
129
| |
| Treatment of U.S. Holders |
A U.S. Holder that receives a distribution with respect to our common shares generally must include the amount in gross income as a dividend to the extent attributable to our current and accumulated earnings and profits (as determined under U.S. federal income tax principles). If the distribution is not a dividend because it exceeds the U.S. Holder’s pro rata share of our current and accumulated earnings and profits, the distribution will be treated first as a tax-free return of capital and reduce (but not below zero) the adjusted tax basis of the U.S. Holder’s shares. If the distribution exceeds the adjusted tax basis, the remainder will be taxed as capital gain (see “Sale of Shares” below).
Dividends received by non-corporate U.S. Holders in taxable years beginning before January 1, 2009 from a qualified foreign corporation are taxed at the same rates as long-term capital gains. A “qualified foreign corporation” includes a foreign corporation that is eligible for the benefits of a comprehensive income tax treaty with the United States. Since we are eligible for the benefits of the tax treaty between Canada and the United States, and the treaty has been determined to be a comprehensive income tax treaty, we are a “qualified foreign corporation.”
U.S. Holders may deduct any Canadian tax withheld from distributions in computing their U.S. federal taxable income. Alternatively, a U.S. Holder may claim a credit against U.S. federal income tax liability (see “Foreign Tax Credit” below). Corporate U.S. Holders generally will not be allowed a dividends-received deduction with respect to any dividends from us.
Generally, dividends to a U.S. Holder will be treated as passive income (or “passive category income” for taxable years beginning after December 31, 2006) for foreign tax credit purposes. Subject to some limitations, a U.S. Holder may elect to claim a credit against its U.S. federal income tax liability (in lieu of a deduction) for Canadian withholding tax deducted from our distributions. The credit is limited to U.S. federal income tax attributable to a U.S. Holder’s passive income from foreign sources. Since we are a qualified foreign corporation for non-corporate U.S. Holders, our dividends qualify for taxation at the same preferential rates that apply to long-term capital gains. Consequently, the dividend amount that would otherwise be treated as received from foreign sources is reduced by multiplying the dividend by a fraction, the numerator of which is the preferential capital gains rate and the denominator of which is the ordinary income tax rate applicable to the U.S. Holder. The effect of this reduction is to reduce the federal income attributable to foreign source income against which the credit may be claimed. Canadian withholding taxes that cannot be claimed as a credit in the year paid may be carried back to the preceding year and forward ten years, subject to the same limitations.
A U.S. Holder generally will recognize capital gain or loss on the sale of our shares equal to the difference between: (a) the amount of cash plus the fair market value of any property received for the shares and (b) the U.S. Holder’s adjusted tax basis in the shares. The gain or loss will be treated as capital gain or loss from the U.S. sources. It will be long-term capital gain or loss if the U.S. Holder has held the shares for more than 12 months. The top marginal rate applicable to net long-term capital gain for a non-corporate U.S. Holder is 15%. There is no preferential long-term gain rate for corporate U.S. Holders. Any capital gain that is not long-term capital gain is taxed at ordinary income rates. Deduction of capital losses is subject to significant limitations.
| |
| Controlled Foreign Corporations |
U.S. Holders that own stock in a foreign corporation that is classified as a “controlled foreign corporation” (“CFC”) may be subject to current taxation on certain earnings of the CFC. A CFC is a foreign corporation more than 50% of whose total voting power or value is owned by U.S. shareholders. For these purposes, a U.S. shareholder is any person or entity that owns, directly or indirectly, 10% or more of the total combined voting power of the foreign corporation. Based on the expected distribution of
130
our common shares among U.S. Holders andnon-U.S. Holders, we do not expect to be classified as a CFC. However, future ownership changes could cause us to become a CFC. Potential U.S. Holders are advised to consult their tax advisors concerning the potential application of the CFC rules to their particular circumstances.
Non-U.S. Holders
Non-U.S. Holders should not be subject to U.S. federal income tax with respect to dividends and proceeds received on the sale, exchange or redemption of our common shares.
Information Reporting and Backup Withholding
In general, holders may be subject to information reporting and backup withholding at a rate of 28% with respect to dividends and proceeds received on the sale, exchange, or redemption of a common share. The information reporting and backup withholding requirements discussed below generally do not apply to payments to corporations, whether domestic or foreign.
An individual U.S. Holder generally will be subject to backup withholding on payments or proceeds received through a U.S. broker or nominee unless such U.S. Holder provides its taxpayer identification number to the payor on a properly executed Internal Revenue Service Form W-9 or other similar form and the IRS has not notified the payor that backup withholding is required for such U.S. Holder.
Anon-U.S. Holder generally will be subject to backup withholding on payments or proceeds received through a U.S. broker or nominee unless suchnon-U.S. Holder certifies its foreign status by providing a properly executed Internal Revenue Service Form W-8 BEN,W-8 IMY,W-8 ECI or W-8EXP.
Backup withholding is not an additional tax, and any amount withheld under the backup withholding rules will be creditable against the U.S. federal tax liability of such holder and may give rise to a refund upon furnishing the required information to the Internal Revenue Service.
Material Canadian Income Tax Considerations
The following summarizes the main Canadian federal income tax consequences applicable to a holder that acquires common shares pursuant to this offering and who, at all times for purposes of the Income Tax Act (Canada) (the “Act”), is the beneficial owner of the common shares, holds the common shares as capital property, deals at arm’s length with us and with the selling shareholders, is not affiliated with us or a selling shareholder, is not a resident and is not deemed to be a resident of Canada during any taxation year in which it owns the common shares, and does not use or hold the common shares in the course of carrying on, or otherwise in connection with, a business in Canada (a “non-Canadian holder”). This summary does not deal with special situations, such as the particular circumstances of traders or dealers, limited liability companies, partnerships, tax exempt entities, insurers or financial institutions.
This summary is based on the relevant provisions of the Act and the regulations thereunder (the “Regulations”) and our Canadian counsel’s understanding of the published administrative and assessing practices of the Canada Revenue Agency as of the date hereof. It also takes into account specific proposals to amend the Act and the Regulations publicly announced by the Minister of Finance (Canada) prior to the date hereof but there is no certainty that such proposals will be enacted in the form proposed, if at all. This summary does not otherwise take into account or anticipate any changes in law, whether by way of legislative, judicial or governmental action or interpretation, nor does it address any provincial, territorial or foreign income tax considerations.
In this summary we do not purport to address all tax considerations that may be important to a particular non-Canadian holder, in light of the holder’s circumstances, concerning the consequences of acquiring, holding or disposing of common shares. We encourage non-Canadian holders to consult their own tax advisors having regard to their particular circumstances.
131
A non-Canadian holder will generally be subject to a 25% Canadian withholding tax on dividends we pay or credit, or are deemed to pay or credit, on the common shares. This rate may be reduced under the provisions of an applicable income tax convention between Canada and the non-Canadian holder’s country of residence. A non- Canadian holder who is resident in the United States and entitled to the benefit of the Canada-United States Income Tax Convention (1980) (the “U.S. Treaty”) will generally be entitled to a 15% rate of withholding tax for dividends.
If a non-Canadian holder disposes of common shares that are “taxable Canadian property” at the time of the disposition, the holder will be subject to tax under the Act on any taxable capital gain realized on the disposition, unless the provisions of an applicable income tax convention exempt the gain from the tax.
A common share will be “taxable Canadian property” at the time of a disposition if, at that time, it is not listed on a stock exchange that is prescribed in the Regulations. Prescribed stock exchanges include The Nasdaq National Market, The New York Stock Exchange and the Toronto Stock Exchange. A common share that is listed on a prescribed stock exchange will be taxable Canadian property if the non-Canadian holder, persons with whom the non-Canadian holder does not deal at arm’s length, or the non-Canadian holder together with such persons, has owned 25% or more of our issued shares of any class or series at any time during the60-month period that ends at the time of the disposition. Notwithstanding the foregoing, a common share may be deemed to be taxable Canadian property in certain other circumstances set out in the Act.
A non-Canadian holder’s taxable capital gain in respect of shares that are taxable Canadian property will be one-half of the amount by which the proceeds of disposition, net of any reasonable costs of disposition, exceed the adjusted cost base of the shares to the holder. The U.S. Treaty provides an exemption from Canadian capital gains tax for a non-Canadian holder who is a resident of the United States for purposes of the U.S. Treaty provided that our common shares do not derive their value principally from real property situated in Canada.
If a common share is not listed on a prescribed stock exchange at the time of disposition, a non-Canadian holder will be subject to the notification and withholding requirements in section 116 of the Act. A purchaser of unlisted shares will be required to withhold up to 25% of the purchase price otherwise payable to a non-Canadian holder and remit the same to the CRA if the non-Canadian holder has not obtained an acceptable tax clearance certificate in accordance with that section. The notification and withholding requirement in section 116 will apply notwithstanding that any gain may ultimately be exempt from Canadian tax pursuant to an applicable income tax convention, although all or a part of the tax withheld in such circumstances may be refunded upon the non-Canadian holder filing a Canadian income tax return, depending on the holder’s personal circumstances.
A non-Canadian holder whose shares are taxable Canadian property at the time of a disposition will be required to file a Canadian income tax return for that taxation year, whether or not the holder realizes a taxable capital gain on the disposition or is entitled to an exemption from Canadian tax in respect of such a gain pursuant to an applicable income tax convention.
132
UNDERWRITING
General
Under the terms and subject to the conditions contained in an underwriting agreement dated , 2006, we and the selling shareholders have agreed to sell to the underwriters named below, for whom Credit Suisse Securities (USA) LLC and UBS Securities LLC are acting as representatives, the following respective numbers of common shares:
| | | | | | |
| | | Number of | |
| Underwriter | | Shares | |
| | | | |
| Credit Suisse Securities (USA) LLC | | | | |
| UBS Securities LLC | | | | |
| Jefferies & Company, Inc. | | | | |
| CIBC World Markets Corp. | | | | |
| Simmons & Company International | | | | |
| Stephens Inc. | | | | |
| Peters & Co. Limited | | | | |
| | | | |
| | Total | | | | |
| | | | |
The offering is being made concurrently in the United States and in the provinces and territories of Canada. The common shares will be offered in the United States through Credit Suisse Securities (USA) LLC, UBS Securities LLC and Jefferies & Company, Inc., and such dealers who are registered to offer the common shares for sale in the United States as may be designated by the underwriters. The common shares will be offered in the provinces and territories of Canada through affiliates of the underwriters, including Credit Suisse Securities (Canada), Inc. and UBS Securities Canada Inc., and such dealers who are registered to offer the common shares for sale in such provinces and territories as may be designated by the underwriters.
The obligations of the underwriters under the underwriting agreement may be terminated at their discretion on the occurrence of certain stated events. The underwriting agreement provides that the underwriters are obligated to purchase all the common shares in the offering if any are purchased, other than those shares covered by the over-allotment option described below. The underwriting agreement also provides that, in the event of a default, the purchase commitments of non-defaulting underwriters may be increased or the offering may be terminated.
We and the selling shareholders have granted to the underwriters a30-day option to purchase up to additional common shares from us and an aggregate of additional common shares from the selling shareholders on a pro rata basis at the initial public offering price less the underwriting discounts and commissions. The option may be exercised only to cover any over-allotments of common shares.
The public offering price for common shares offered in the United States and elsewhere outside Canada is payable in U.S. dollars, and the public offering price for common shares sold in Canada is payable in Canadian dollars, except as may otherwise be agreed by the underwriters. The Canadian dollar amount is the approximate equivalent of the U.S. dollar amount based on the prevailing U.S. Canadian dollar exchange rate on the date of the underwriting agreement.
The underwriters propose to offer the common shares initially at the public offering price on the cover page of this prospectus and to selling group members at that price less a selling concession of US$ per share (or C$ per share for shares sold in Canada). The underwriters and the selling group members may allow a discount of US$ per share (or C$ per share for shares sold in Canada) on sales to other broker/ dealers. After the initial public offering in the United States and elsewhere outside of Canada, the underwriters may change the public offering price and concession and discount to broker/ dealers. In Canada, after the underwriters have made a bona fide effort to sell all of the common shares offered in Canada under this prospectus at the initial public offering price specified above, the offering price may be decreased and thereafter further changed, from time to time, to an amount not
133
greater than the initial public offering price and the concession and reallowance may be changed. In the event of a reduction in the public offering price, the compensation realized by the underwriters will be reduced accordingly.
The following table summarizes the compensation and estimated expenses we will pay:
| | | | | | | | | | | | | | | | | |
| | | Per Share | | | Total | |
| | | | | | | |
| | | Without | | | With | | | Without | | | With | |
| | | Over-allotment | | | Over-allotment | | | Over-allotment | | | Over-allotment | |
| | | | | | | | | | | | | |
| Underwriting Discounts and Commissions paid by us | | US$ | | | | US$ | | | | US$ | | | | US$ | | |
| Expenses payable by us | | US$ | | | | US$ | | | | US$ | | | | US$ | | |
We estimate that our out-of-pocket expenses for this offering will be approximately US$4.8 million, consisting of US$26,750 for SEC registration fees, US$80,000 for Canadian securities regulatory authority filing fees, US$340,000 for New York Stock Exchange and Toronto Stock Exchange listing fees, US$150,000 for printing expenses, US$1.8 million for legal fees, US$1.2 million for accounting fees, US$10,000 for NASD filing fees, US$875,000 to our sponsors pursuant to the advisory services agreement and US$350,000 for miscellaneous expenses.
The offering is being conducted in accordance with the applicable provisions of Rule 2720 of the National Association of Securities Dealers, Inc. Conduct Rules because an affiliate of Stephens Inc., one of the underwriters, owns 10% or more of our common shares. Rule 2720 requires that the initial public offering price of our common shares not be higher than that recommended by a “qualified independent underwriter” meeting certain standards. Accordingly, Credit Suisse Securities (USA) LLC is assuming the responsibilities of acting as the qualified independent underwriter in pricing the offering and conducting due diligence. The initial public offering price of the shares of common stock is no higher than the price recommended by Credit Suisse Securities (USA) LLC.
The underwriters will not confirm sales to any accounts over which they exercise discretionary authority without first receiving a written consent from those accounts.
We have agreed that we will not offer, sell, contract to sell, pledge or otherwise dispose of, directly or indirectly, or file with the SEC a registration statement under the Securities Act or file with the securities regulatory authorities in Canada a prospectus under applicable securities laws relating to, any common shares or securities convertible into or exchangeable or exercisable for any common shares, or publicly disclose the intention to make any offer, sale, pledge, disposition or filing, without the prior written consent of Credit Suisse Securities (USA) LLC and UBS Securities LLC, for a period of 180 days after the date of this prospectus. However, in the event that either (1) during the last 17 days of the “lock-up” period, we release earnings results or material news or a material event relating to us occurs or (2) prior to the expiration of the “lock-up” period, we announce that we will release earnings results during the16-day period beginning on the last day of the “lock-up” period, then in either case the expiration of the “lock-up” period will be extended until the expiration of the18-day period beginning on the date of the release of the earnings results or the occurrence of the material news or event, as applicable, unless Credit Suisse Securities (USA) LLC and UBS Securities LLC waive, in writing, such an extension.
Our directors and executive officers, the selling shareholders and certain other principal shareholders have agreed that they will not offer, sell, contract to sell, pledge or otherwise dispose of, directly or indirectly, any common shares or securities convertible into or exchangeable or exercisable for any common shares, enter into a transaction that would have the same effect, or enter into any swap, hedge or other arrangement that transfers, in whole or in part, any of the economic consequences of ownership of our common shares, whether any of these transactions are to be settled by delivery of our common shares or other securities, in cash or otherwise, or publicly disclose the intention to make any offer, sale, pledge or disposition, or to enter into any transaction, swap, hedge or other arrangement, without, in each case, the prior written consent of Credit Suisse Securities (USA) LLC and UBS Securities LLC, for a period of 180 days after the date of this prospectus. However, in the event that either (1) during the last 17 days of the “lock-up” period, we release earnings results or material news or a material event relating to us occurs
134
or (2) prior to the expiration of the “lock-up” period, we announce that we will release earnings results during the16-day period beginning on the last day of the “lock-up” period, then in either case the expiration of the “lock-up” period will be extended until the expiration of the18-day period beginning on the date of the release of the earnings results or the occurrence of the material news or event, as applicable, unless Credit Suisse Securities (USA) LLC and UBS Securities LLC waive, in writing, such an extension.
We have been advised by Credit Suisse Securities (USA) LLC and UBS Securities LLC that they have no present intent or arrangement to release any common shares subject to a lock-up, and will consider the release of any lock-up on a case-by-case basis. Upon a request to release any common shares subject to a lock-up, Credit Suisse (USA) LLC and UBS Securities LLC would consider the particular circumstances surrounding the request, including but not limited to, the length of time before the lock-up expires, the number of common shares requested to be released, the reasons for the request, the possible impact on the market for our common shares and whether the holder of common shares requesting the release is an officer, director or other affiliate of us.
The underwriters have reserved for sale at the initial public offering price up to common shares for employees, directors and other persons associated with us who have expressed an interest in purchasing common shares in the offering. The number of shares available for sale to the general public in the offering will be reduced to the extent these persons purchase the reserved shares. Any reserved shares not so purchased will be offered by the underwriters to the general public on the same terms as the other shares.
We and the selling shareholders have agreed to indemnify the underwriters and Credit Suisse Securities (USA) LLC, in its capacity as qualified independent underwriter, against liabilities under the Securities Act and the securities laws of the provinces of Canada or contribute to payments that the underwriters may be required to make in that respect.
Prior to the offering, there has been no public market for our common shares. The initial public offering price will be determined by negotiation between us and the representatives and will not necessarily reflect the market price of the common shares following the offering. The principal factors that will be considered in determining the initial public offering price will include:
| | |
| | • | the information presented in this prospectus and otherwise available to the underwriters; |
| |
| | • | the history of and prospects for our industry in which we will compete; |
| |
| | • | an assessment of our management; |
| |
| | • | our present operations; |
| |
| | • | our historical results of operations; |
| |
| | • | our earnings prospects; |
| |
| | • | the general condition of the securities markets at the time of the offering; and |
| |
| | • | the recent market prices of, and the demand for, publicly traded common shares of generally comparable companies. |
We cannot assure you that the initial public offering price will correspond to the price at which the common shares will trade in the public market subsequent to this offering or that an active trading market for the common shares will develop and continue after this offering.
Certain of the underwriters and their respective affiliates have in the past and may in the future perform various financial advisory, investment banking and other services for us, our affiliates and our officers in the ordinary course of business, for which they received and will receive customary fees and expenses. As broker-dealers who make a market in debt securities, the underwriters and their respective affiliates, in the ordinary course of their trading and brokerage activities, from time to time may own some of our outstanding debt securities or otherwise trade or effect transactions for their own accounts or the accounts of customers.
135
Affiliates of Credit Suisse Securities (USA) LLC have an economic interest in us through Genstar Capital Partners III, L.P. Credit Suisse has an economic interest in approximately 1% of our common shares and Series B preferred shares held by Genstar Capital Partners III, L.P.
Stephens-NACG LLC, which is an affiliate of Stephens Inc., owns 14.44% of our common shares. In addition, members of the Stephens family who own controlling interests of the parent of Stephens Inc. own approximately 36% of Stephens-NACG LLC, resulting in an indirect ownership of our voting securities of less than 10%. Members of the Stephens family who own the controlling interests of the parent of Stephens Inc. and the immediate family members of those persons own approximately 73% of Stephens-NACG LLC, resulting in an indirect ownership of our voting securities of slightly more than 10%.
CIBC Mellon Trust Company, the transfer agent for the common shares, is a 50/50 joint venture between Mellon Financial Corp. and Canadian Imperial Bank of Commerce, which is an affiliate of CIBC World Markets Corp.
An affiliate of CIBC World Markets Corp. is a lender under our revolving credit facility and participates in the cross-currency and interest rate swaps which went into effect concurrent with the issuance of our 83/4% senior notes due 2011. Accordingly, we may be considered a connected issuer of CIBC World Markets Corp. under applicable Canadian securities laws. The offering price for our common shares was determined by negotiation between us and the underwriters. The affiliate of CIBC World Markets Corp. did not play any role in those determinations or decisions; however, the affiliate has been advised of this offering and its terms. None of the proceeds of this offering, except for that portion of the proceeds payable to the underwriters for their fees and expenses, will be applied for the benefit of the underwriters or their affiliates.
In connection with the offering, the underwriters may engage in stabilizing transactions, over-allotment transactions, syndicate covering transactions and penalty bids in accordance with Regulation M under the Exchange Act.
| | |
| | • | Over-allotment involves sales by the underwriters of shares in excess of the number of shares the underwriters are obligated to purchase, which creates a syndicate short position for the underwriters. The short position may be either a covered short position or a naked short position. In a covered short position, the number of shares over-allotted by the underwriters is not greater than the number of shares that they may purchase in the over-allotment option. In a naked short position, the number of shares involved is greater than the number of shares in the over-allotment option. The underwriters may close out any covered short position by either exercising their over-allotment option and/or purchasing shares in the open market. |
| |
| | • | Stabilizing transactions permit bids to purchase the underlying security so long as the stabilizing bids do not exceed a specified maximum. |
| |
| | • | Syndicate covering transactions involve purchases of the common shares in the open market after the distribution has been completed in order to cover syndicate short positions. In determining the source of shares to close out the short position, the underwriters will consider, among other things, the price of shares available for purchase in the open market as compared to the price at which they may purchase shares through the over-allotment option. If the underwriters sell more shares than could be covered by the over- allotment option, a naked short position, the position can only be closed out by buying shares in the open market. A naked short position is more likely to be created if the underwriters are concerned that there could be downward pressure on the price of the shares in the open market after pricing that could adversely affect investors who purchase in the offering. |
| |
| | • | Penalty bids permit the underwriters to reclaim a selling concession from a syndicate member when the common shares originally sold by such syndicate member are purchased in a stabilizing or syndicate covering transaction to cover syndicate short positions. |
136
Pursuant to rules and policy statements of certain Canadian securities regulators, the underwriters may not, at any time during the period ending on the date the selling process for the common shares ends and all stabilization arrangements relating to the common shares are terminated, bid for or purchase our common shares. The foregoing restrictions are subject to certain exceptions including (a) a bid for or purchase of our common shares if the bid or purchase is made through the facilities of the Toronto Stock Exchange, or TSX, in accordance with the Universal Market Integrity Rules of Market Regulation Services Inc., (b) a bid or purchase on behalf of a client, other than certain prescribed clients, provided that the client’s order was not solicited by the underwriter, or if the client’s order was solicited, the solicitation occurred before the commencement of a prescribed restricted period, and (c) a bid or purchase to cover a short position entered into prior to the commencement of a prescribed restricted period. The underwriters may engage in market stabilization or market balancing activities on the TSX, where the bid for or purchase of our common shares is for the purpose of maintaining a fair and orderly market in such common shares, subject to price limitations applicable to such bids or purchases. Such transactions, if commenced, may be discontinued at any time.
Subject to the foregoing, in order to facilitate this offering and for a limited period the underwriters may purchase and sell our common shares in the open market. These transactions may include short sales, stabilizing transactions and purchases to cover positions created by short sales. Short sales involve the sale by the underwriters of a greater number of securities than they are required to purchase in this offering. Stabilizing transactions consist of certain bids or purchases made for the purpose of preventing or retarding a decline in the market price of such securities while this offering is in progress. The underwriters also may impose penalty bids, under which selling concessions allowed to syndicate members or other broker-dealers participating in this offering are reclaimed if common shares previously distributed in this offering are repurchased in connection with stabilization transactions or otherwise. These activities by the underwriters may stabilize, maintain or otherwise affect the market price of our common shares. As a result, the price of our common shares may be higher than the price that might otherwise exist in the open market. If these activities are commenced, they may be discontinued by the underwriters at any time and must be discontinued after a limited period. These transactions may be effected on the New York Stock Exchange, the TSX or otherwise.
Selling Restrictions
Our common shares are being offered for sale in those jurisdictions in the United States, Canada, Europe, Asia and elsewhere where it is lawful to make such offers.
Each of the underwriters has represented and agreed that it has not offered, sold or delivered and will not offer, sell or deliver any of our common shares directly or indirectly, or distribute this prospectus or any other offering material relating to our common shares, in or from any jurisdiction except under circumstances that will result in compliance with the applicable laws and regulations thereof and that will not impose any obligations on us except as set forth in the underwriting agreement.
United Kingdom
Each of the underwriters has represented and agreed that:
| | |
| | • | it has only communicated or caused to be communicated and will only communicate or cause to be communicated an invitation or inducement to engage in investment activity (within the meaning of section 21 of FSMA) to persons who have professional experience in matters relating to investments falling within Article 19(5) of the Financial Services and Markets Act of 2000 (Financial Promotion) Order 2005 or in circumstances in which section 21 of FSMA does not apply to the company; and |
| |
| | • | it has complied with, and will comply with all applicable provisions of FSMA with respect to anything done by it in relation to the common shares in, from or otherwise involving the United Kingdom. |
137
European Economic Area
In relation to each Member State of the European Economic Area which has implemented the Prospectus Directive (each, a “Relevant Member State”), each Underwriter has represented and agreed that with effect from and including the date on which the Prospectus Directive is implemented in that Relevant Member State (the “Relevant Implementation Date”) it has not made and will not make an offer of common shares to the public in that Relevant Member State prior to the publication of a prospectus in relation to the common shares which has been approved by the competent authority in that Relevant Member State or, where appropriate, approved in another Relevant Member State and notified to the competent authority in that Relevant Member State, all in accordance with the Prospectus Directive, except that it may, with effect from and including the Relevant Implementation Date, make an offer of common shares to the public in that Relevant Member State at any time,
| | |
| | • | to legal entities which are authorized or regulated to operate in the financial markets or, if not so authorized or regulated, whose corporate purpose is solely to invest in securities; |
| |
| | • | to any legal entity which has two or more of (1) an average of at least 250 employees during the last financial year; (2) a total balance sheet of more than€43,000,000 and (3) an annual net turnover of more than€50,000,000, as shown in its last annual or consolidated accounts; |
| |
| | • | to fewer than 100 natural or legal persons (other than qualified investors as defined in the Prospectus Directive) subject to obtaining the prior consent of the manager for any such offer; or |
| |
| | • | in any other circumstances which do not require the publication by the Issuer of a prospectus pursuant to Article 3 of the Prospectus Directive. |
For the purposes of this provision, the expression an “offer of common shares to the public” in relation to any shares in any Relevant Member State means the communication in any form and by any means of sufficient information on the terms of the offer and the common shares to be offered so as to enable an investor to decide to purchase or subscribe the common shares, as the same may be varied in that Relevant Member State by any measure implementing the Prospectus Directive in that Relevant Member State and the expression Prospectus Directive means Directive 2003/71/ EC and includes any relevant implementing measure in each Relevant Member State.
Hong Kong
The underwriters and each of their affiliates have not (i) offered or sold, and will not offer or sell, in Hong Kong, by means of any document, our common shares other than (a) to “professional investors” as defined in the Securities and Futures Ordinance (Cap. 571) of Hong Kong and any rules made under that Ordinance or (b) in other circumstances which do not result in the document being a “prospectus” as defined in the Companies Ordinance (Cap. 32) of Hong Kong or which do not constitute an offer to the public within the meaning of that Ordinance or (ii) issued or had in its possession for the purposes of issue, and will not issue or have in its possession for the purposes of issue, whether in Hong Kong or elsewhere any advertisement, invitation or document relating to our common shares which is directed at, or the contents of which are likely to be accessed or read by, the public in Hong Kong (except if permitted to do so under the securities laws of Hong Kong) other than with respect to our securities which are or are intended to be disposed of only to persons outside Hong Kong or only to “professional investors” as defined in the Securities and Futures Ordinance and any rules made under that Ordinance. The contents of this document have not been reviewed by any regulatory authority in Hong Kong. You are advised to exercise caution in relation to the offer. If you are in any doubt about any of the contents of this document, you should obtain independent professional advice.
Singapore
This prospectus or any other offering material relating to our common shares has not been and will not be registered as a prospectus with the Monetary Authority of Singapore, and the shares of common shares will be offered in Singapore pursuant to exemptions under Section 274 and Section 275 of the
138
Securities and Futures Act, Chapter 289 of Singapore (the “Securities and Futures Act”). Accordingly, our common shares may not be offered or sold, or be the subject of an invitation for subscription or purchase, nor may this prospectus or any other offering material relating to our common shares be circulated or distributed, whether directly or indirectly, to the public or any member of the public in Singapore other than (a) to an institutional investor or other person specified in Section 274 of the Securities and Futures Act, (b) to a sophisticated investor, and in accordance with the conditions specified in Section 275 of the Securities and Futures Act or (c) otherwise pursuant to, and in accordance with the conditions of, any other applicable provision of the Securities and Futures Act.
Japan
The underwriters will not offer or sell any of our common shares directly or indirectly in Japan or to, or for the benefit of, any Japanese person or to others, for re-offering or re-sale directly or indirectly in Japan or to any Japanese person, except in each case pursuant to an exemption from the registration requirements of, and otherwise in compliance with, the Securities and Exchange Law of Japan and any other applicable laws and regulations of Japan. For purposes of this paragraph, “Japanese person” means any person resident in Japan, including any corporation or other entity organized under the laws of Japan.
Switzerland
Our common shares may be offered in Switzerland only on the basis of a non-public offering. This prospectus does not constitute an issuance prospectus according to articles 652a or 1156 or the Swiss Federal Code of Obligations or a listing prospectus according to article 32 of the Listing Rules of the Swiss exchange. Our common shares may not be offered or distributed on a professional basis in or from Switzerland and neither this prospectus nor any other offering material relating to shares of our common shares may be publicly issued in connection with any such offer or distribution. The shares have not been and will not be approved by any Swiss regulatory authority. In particular, the shares are not and will not be registered with or supervised by the Swiss Federal Banking Commission, and investors may not claim protection under the Swiss Investment Fund Act.
A prospectus in electronic format may be made available on the web sites maintained by one or more of the underwriters, or selling group members, if any, participating in this offering and one or more of the underwriters participating in this offering may distribute prospectuses electronically. The representatives may agree to allocate a number of shares to underwriters and selling group members for sale to their online brokerage account holders. Internet distributions will be allocated by the underwriters and selling group members that will make internet distributions on the same basis as other allocations.
Other than the prospectus in electronic format, the information on any underwriter’s or selling group member’s website is not part of the prospectus or the registration statement of which this prospectus forms a part, has not been approved or endorsed by us or any underwriter or selling group member in its capacity as underwriter or selling group member and should not be relied upon by investors.
139
LEGAL MATTERS
Certain legal matters in connection with the common shares being offered will be passed upon for us by Bracewell & Giuliani LLP, Houston, Texas with respect to matters of U.S. law, and by Borden Ladner Gervais LLP, Toronto, Ontario with respect to matters of Canadian law. Certain members of Bracewell & Giuliani LLP own beneficially less than 1% of the common shares of North American Energy Partners Inc. The underwriters have been represented by Cravath, Swaine & Moore LLP, New York, New York and Bennett Jones LLP, Calgary, Alberta. As of the date hereof, the partners, counsel and associates of each of Borden Ladner Gervais LLP and Bennett Jones LLP beneficially own, directly or indirectly, respectively as a group, none of our common shares.
EXPERTS
The consolidated balance sheets of NACG Holdings Inc. as at March 31, 2006 and 2005 and the consolidated statements of operations and retained earnings (deficit) and cash flows of NACG Holdings Inc. for the years ended March 31, 2006 and 2005 and the period November 26, 2003 to March 31, 2004 and of Norama Ltd. for the period April 1, 2003 to November 25, 2003 included in this prospectus have been audited by KPMG LLP, Chartered Accountants, as stated in their reports appearing in this prospectus.
The consolidated balance sheets of NACG Holdings Inc. as at June 30, 2006 and 2005 and the consolidated statements of operations and retained earnings (deficit) and cash flows of NACG Holdings Inc. for the three months ended June 30, 2006 and 2005 included in this prospectus have not been audited.
WHERE YOU CAN FIND MORE INFORMATION
This prospectus is part of a registration statement, which term includes all amendments thereto, on Form F-1 that we have filed with the SEC under the Securities Act covering the common shares we are offering. As permitted by the rules and regulations of the SEC, this prospectus omits certain information contained in the registration statement and the exhibits to the registration statement. For further information with respect to us and our common shares, you should refer to the registration statement and to its exhibits and schedules. We make reference in this prospectus to certain of our contracts, agreements and other documents that are filed as exhibits to the registration statement. For additional information regarding those contracts, agreements and other documents, please see the exhibits attached to the registration statement. We also file various reports and other information with the SEC.
You can read the registration statement and the exhibits and schedules filed with the registration statement or any reports, statements or other information we have filed or file, at the SEC Public Reference Room located at 100 F Street, NE, Room 1580, Washington, D.C. 20549. Please call the SEC at1-800-SEC-0330 for further information regarding the Public Reference Room and the SEC’s copying charges. The SEC also maintains an Internet site that contains reports, information statements and other material that are filed through the SEC’s Electronic Data Gathering, Analysis and Retrieval (EDGAR) System. This system can be accessed at http://www.sec.gov. You can find reports and other information that we file electronically with the SEC by reference to our corporate name or to our CIK number, 0001368519.
140
We will provide a copy of any exhibit incorporated by reference in the registration statement of which this prospectus forms a part, without charge, by written or oral request directed to us at the following address and phone number:
| |
| | North American Energy Partners Inc.
Zone 3 Acheson Industrial Area
Acheson, Alberta
Canada T7X 5A7
Telephone: 780-960-7171
Attention: Vice President, Corporate |
As a foreign private issuer, we are exempt from the rule under the Exchange Act prescribing the furnishing and content of proxy statements to shareholders. Because we are a foreign private issuer, we, our directors and our officers are also exempt from the short swing profit recovery provisions of Section 16 of the Exchange Act.
After this offering, we will also be subject to the informational requirements of the securities commissions in all provinces of Canada. You are invited to read and copy any reports, statements or other information, other than confidential filings, that we file with the Canadian provincial securities commissions. These filings are also electronically available from the Canadian System for Electronic Document Analysis and Retrieval (SEDAR) (http://www.sedar.com), the Canadian equivalent of the SEC’s electronic document gathering and retrieval system. We intend to furnish our shareholders with annual reports containing consolidated financial statements audited by independent registered chartered accountants.
ENFORCEABILITY OF CIVIL LIABILITIES AGAINST FOREIGN PERSONS
We are a corporation incorporated under the Canada Business Corporations Act. Consequently, we are and will be governed by all applicable provincial and federal laws of Canada. Several of our directors and officers and others named in this prospectus reside principally in Canada. Because these persons are located outside the United States, it may not be possible for you to effect service of process within the United States upon those persons. Furthermore, it may not be possible for you to enforce against us or them, in or outside the United States, judgments obtained in U.S. courts, because substantially all of our assets and the assets of these persons are located outside the United States. We have been advised that there is doubt as to the enforceability, in original actions in Canadian courts, of liabilities based upon the U.S. federal securities laws and as to the enforceability in Canadian courts of judgments of U.S. courts obtained in actions based upon the civil liability provisions of the U.S. federal securities laws. Therefore, it may not be possible to enforce those actions against us, our directors and officers or other persons named in this prospectus.
INDUSTRY DATA AND FORECASTS
This prospectus includes industry data and forecasts that we have obtained from publicly available information, various industry publications, other published industry sources and our internal data and estimates.
For example, in this prospectus, information regarding actual and anticipated production, reserves and current and scheduled projects in the Canadian oil sands was obtained from the Alberta Energy and Utilities Board, or EUB, and from the Energy Market Assessment — June 2006,Canada’s Oil Sands: Opportunities and Challenges to 2015 — An Update, referred to as the “2006 Energy Market Assessment,” published by the Canadian National Energy Board, or NEB. Information regarding historical capital expenditures in the oil sands was obtained from the Canadian Association of Petroleum Producers, or CAPP.
141
Industry publications and other published industry sources generally indicate that the information contained therein was obtained from sources believed to be reliable, but do not guarantee the accuracy and completeness of such information. Although we believe that these publications and reports are reliable, we have not independently verified the data.
Our internal data, estimates and forecasts are based upon information obtained from our customers, trade and business organizations and other contacts in the markets in which we operate and our management’s understanding of industry conditions. Although we believe that such information is reliable, we have not had such information verified by any independent sources.
References to barrels of oil related to the oil sands in this document are quoted directly from source documents and refer to both barrels of bitumen and barrels of bitumen that have been upgraded into synthetic crude oil, which is considered synthetic because its original hydrocarbon mark has been altered in the upgrading process. We understand that there is generally some shrinkage of bitumen volumes through the upgrading process. The shrinkage is approximately 11% according to the NEB. We have not made any estimates or calculations with regard to these volumes and have quoted these volumes as they appeared in the related source documents.
NON-GAAP FINANCIAL MEASURES
The body of generally accepted accounting principles applicable to us is commonly referred to as “GAAP.” A non-GAAP financial measure is generally defined by the Securities and Exchange Commission, or SEC, and by the Canadian securities regulatory authorities as one that purports to measure historical or future financial performance, financial position or cash flows, but excludes or includes amounts that would not be so adjusted in the most comparable GAAP measures. In this prospectus, we disclose EBITDA and Consolidated EBITDA, both non-GAAP financial measures. Our revolving credit facility requires us to maintain a minimum Consolidated EBITDA. EBITDA is calculated as net income (or loss) before interest expense, taxes, depreciation and amortization. Consolidated EBITDA is defined as EBITDA, excluding the effects of foreign exchange gain or loss, realized and unrealized gain or loss on derivative financial instruments, non-cash stock-based compensation expense and gain or loss on disposal of plant and equipment. EBITDA and Consolidated EBITDA are not substitutes for the GAAP measures of net income (or loss) or cash flows. We believe that EBITDA is a meaningful measure of the performance of our business because it excludes items, such as depreciation and amortization, interest and taxes, that are not directly related to the operating performance of our business. Non-compliance with the minimum Consolidated EBITDA financial covenant could result in our being required to immediately repay all amounts outstanding under our revolving credit facility. We are required to maintain a minimum trailing twelve months Consolidated EBITDA through December 31, 2006 of $65.5 million, with this minimum amount increasing periodically until maturity. Our methods of calculating EBITDA and Consolidated EBITDA may vary from others in our industry.
EXCHANGE RATE DATA
The following table sets forth, for the periods indicated, the high, low and average noon buying rates, in each case for the purchase of one Canadian dollar, expressed in U.S. dollars, based on the inverse of the noon buying rate in the city of New York for cable transfers in Canadian dollars as certified for customs purposes by the Federal Reserve Bank of New York. As of October 4, 2006, the noon buying rate was C$1.00 = US$0.8861.
| | | | | | | | | | | | | | | | | | | | | | | | | |
| | | 2006 | |
| | | | |
| | | April | | | May | | | June | | | July | | | August | | | September | |
| | | | | | | | | | | | | | | | | | | |
| High for period | | | 0.8926 | | | | 0.9100 | | | | 0.9098 | | | | 0.8999 | | | | 0.9037 | | | | 0.9048 | |
| Low for period | | | 0.8534 | | | | 0.8903 | | | | 0.8896 | | | | 0.8760 | | | | 0.8840 | | | | 0.8872 | |
142
| | | | | | | | | | | | | | | | | | | | | |
| | | Year Ended March 31, | |
| | | | |
| | | 2002 | | | 2003 | | | 2004 | | | 2005 | | | 2006 | |
| | | | | | | | | | | | | | | | |
| Average for period(1) | | | 0.6381 | | | | 0.6474 | | | | 0.7412 | | | | 0.7852 | | | | 0.8409 | |
| |
| (1) | Determined by averaging the exchange rates on the last day of each month during the respective period. |
GLOSSARY OF TERMS
The following are definitions of certain terms commonly used in our industry and this prospectus.
“Bitumen”means the molasses-like substance that comprises the oil in the oil sands.
“Established reserves”means those reserves recoverable under current technology and present and anticipated economic conditions specifically proved by drilling, testing or production, plus the portion of contiguous recoverable reserves that are interpreted to exist from geological, geophysical or similar information with reasonable certainty.
“Muskeg”means a swamp or bog formed by an accumulation of sphagnum moss, leaves and decayed matter resembling peat.
“Oil sands”means the grains of sand covered by a thin layer of water and coated by heavy oil, or bitumen
“Overburden”means the layer of rocky, clay-like material that covers the oil sands.
“Ultimately recoverable oil reserves”means an estimate of the initial established reserves that will have been developed in an area by the time all exploratory and development activity has ceased, having regard for the geological prospects of that area and anticipated technology and economic conditions. Ultimate recoverable oil reserves include cumulative production, remaining established reserves and future additions through extensions and revisions to existing pools and the discovery of new pools. Ultimate potential can be expressed by the following simple equation: Ultimate potential = initial established reserves + additions to existing pools + future discoveries.
“Upgrading”means the conversion of heavy bitumen into a lighter crude oil by increasing the hydrogen to carbon ratio, either through the removal of carbon (coking) or the addition of hydrogen (hydroprocessing).
143
INDEX TO FINANCIAL STATEMENTS
| | | | | | |
| Audited Consolidated Financial Statements of NACG Holdings Inc. | | | | |
| | Report of Independent Registered Public Accounting Firm | | | F-2 | |
| | Consolidated Balance Sheets as of March 31, 2005 and 2006 and June 30, 2006 (unaudited) | | | F-3 | |
| | Consolidated Statements of Operations and Retained Earnings (Deficit) for the Fiscal Years Ended March 31, 2004, 2005 and 2006 and the Three Months Ended June 30, 2005 and 2006 (unaudited) | | | F-4 | |
| | Consolidated Statements of Cash Flows for the Fiscal Years Ended March 31, 2004, 2005 and 2006 and the Three Months Ended June 30, 2005 and 2006 (unaudited) | | | F-5 | |
| | Notes to the Consolidated Financial Statements | | | F-6 | |
F-1
REPORT OF INDEPENDENT REGISTERED PUBLIC ACCOUNTING FIRM
To the Board of Directors of NACG Holdings Inc.
We have audited the consolidated balance sheets of NACG Holdings Inc. as at March 31, 2006 and 2005 and the consolidated statements of operations and retained earnings (deficit) and cash flows of NACG Holdings Inc. for the years ended March 31, 2006 and 2005, the period from November 26, 2003 to March 31, 2004 and of Norama Ltd. (the “Predecessor Company”) for the period April 1, 2003 to November 25, 2003. These financial statements are the responsibility of the Company’s management. Our responsibility is to express an opinion on these consolidated financial statements based on our audits.
We conducted our audits in accordance with the standards of the Public Company Accounting Oversight Board (United States). Those standards require that we plan and perform an audit to obtain reasonable assurance whether the financial statements are free of material misstatement. An audit includes examining, on a test basis, evidence supporting the amounts and disclosures in the financial statements. An audit also includes assessing the accounting principles used and significant estimates made by management, as well as evaluating the overall financial statement presentation. We believe that our audits provide a reasonable basis for our audit opinion.
In our opinion, these consolidated financial statements referred to above present fairly, in all material respects, the financial position of NACG Holdings Inc. as of March 31, 2006 and 2005 and the results of operations and cash flows of NACG Holdings Inc. for the years ended March 31, 2006 and 2005, the period from November 26, 2003 to March 31, 2004, and of the Predecessor Company for the period April 1, 2003 to November 25, 2003 in accordance with Canadian generally accepted accounting principles.
As discussed in Note 2(c) and 2(q) to the consolidated financial statements, the Company changed its accounting policy with respect to the recognition of revenue on claims and has adopted new accounting pronouncements related to the accounting by a customer (including a reseller) for certain consideration received from a vendor, the accounting for convertible debt instruments, the accounting for non-monetary transactions, the accounting for implicit variable interests and the accounting for conditional asset retirement obligations in 2006.
Canadian generally accepted accounting principles vary in certain significant respects from accounting principles generally accepted in the United States of America. Information relating to the nature and effect of such differences is presented in note 23 to the consolidated financial statements.
/s/KPMG llp
Chartered Accountants
Edmonton, Canada
July 19, 2006, except as to notes 24(b), 24(c), and 24(d),
which are as of October 11, 2006
F-2
NACG HOLDINGS INC.
Consolidated Balance Sheets
| | | | | | | | | | | | | | |
| | | March 31, | | | March 31, | | | June 30, | |
| | | 2005 | | | 2006 | | | 2006 | |
| | | | | | | | | | |
| | | (In thousands of Canadian dollars) | |
| | | | | (Unaudited) | |
| ASSETS |
| Current assets: | | | | | | | | | | | | |
| | Cash and cash equivalents | | $ | 17,924 | | | $ | 42,804 | | | $ | 45,093 | |
| | Accounts receivable (note 4) | | | 57,745 | | | | 67,235 | | | | 76,302 | |
| | Unbilled revenue (note 5) | | | 41,411 | | | | 43,494 | | | | 38,119 | |
| | Inventory | | | 134 | | | | 57 | | | | 13 | |
| | Prepaid expenses | | | 1,862 | | | | 1,796 | | | | 3,798 | |
| | Future income taxes (note 12) | | | 15,100 | | | | 5,583 | | | | 10,291 | |
| | | | | | | | | | |
| | | | 134,176 | | | | 160,969 | | | | 173,616 | |
| Future income taxes (note 12) | | | 13,485 | | | | 23,367 | | | | 16,790 | |
| Plant and equipment (note 6) | | | 177,089 | | | | 185,566 | | | | 191,269 | |
| Goodwill (note 3) | | | 198,549 | | | | 198,549 | | | | 198,549 | |
| Intangible assets, net of accumulated amortization of $17,209 (March 31, 2006 – $17,026; March 31, 2005 – $16,296) (note 7) | | | 1,502 | | | | 772 | | | | 589 | |
| Deferred financing costs, net of accumulated amortization of $6,891 (March 31, 2006 – $6,004; March 31, 2005 – $3,368) (note 8) | | | 15,354 | | | | 17,788 | | | | 17,519 | |
| | | | | | | | | | |
| | | $ | 540,155 | | | $ | 587,011 | | | $ | 598,332 | |
| | | | | | | | | | |
| |
| LIABILITIES AND SHAREHOLDERS’ EQUITY |
| Current liabilities: | | | | | | | | | | | | |
| | Accounts payable | | $ | 59,090 | | | $ | 54,085 | | | $ | 53,503 | |
| | Accrued liabilities (note 9) | | | 15,201 | | | | 24,603 | | | | 21,663 | |
| | Billings in excess of costs incurred and estimated earnings on uncompleted contracts (note 5) | | | 1,325 | | | | 5,124 | | | | 6,616 | |
| | Current portion of capital lease obligations (note 10) | | | 1,771 | | | | 3,046 | | | | 3,433 | |
| | Future income taxes (note 12) | | | 15,100 | | | | 5,583 | | | | 4,882 | |
| | | | | | | | | | |
| | | | 92,487 | | | | 92,441 | | | | 90,097 | |
| Senior secured credit facility (note 11(a)) | | | 61,257 | | | | — | | | | — | |
| Capital lease obligations (note 10) | | | 5,454 | | | | 7,906 | | | | 8,504 | |
| Senior notes (note 11(b)) | | | 241,920 | | | | 304,007 | | | | 290,436 | |
| Derivative financial instruments (note 18(c)) | | | 51,723 | | | | 63,611 | | | | 71,030 | |
| Redeemable preferred shares (note 13(a)) | | | 35,000 | | | | 77,568 | | | | 78,513 | |
| Future income taxes (note 12) | | | 13,485 | | | | 23,367 | | | | 23,435 | |
| | | | | | | | | | |
| | | | 501,326 | | | | 568,900 | | | | 562,015 | |
| | | | | | | | | | |
| Shareholders’ equity: | | | | | | | | | | | | |
| | Common shares (authorized – unlimited number of voting and non-voting common shares; issued and outstanding – June 30, 2006 and March 31, 2006 – 910,380 voting common shares and 20,620 non-voting common shares (March 31, 2005 – 907,380 voting common shares and 20,620 non-voting common shares)) (note 13(b)) | | | 92,800 | | | | 93,100 | | | | 93,100 | |
| | Contributed surplus (notes 13(c) and 21) | | | 634 | | | | 1,557 | | | | 1,869 | |
| | Deficit | | | (54,605 | ) | | | (76,546 | ) | | | (58,652 | ) |
| | | | | | | | | | |
| | | | 38,829 | | | | 18,111 | | | | 36,317 | |
| | | | | | | | | | |
| Commitments (note 19) | | | | | | | | | | | | |
| United States generally accepted accounting principles (note 23) | | | | | | | | | | | | |
| Subsequent events (notes 11(c), 21 and 24) | | | | | | | | | | | | |
| | | | | | | | | | |
| | | $ | 540,155 | | | $ | 587,011 | | | $ | 598,332 | |
| | | | | | | | | | |
See accompanying notes to consolidated financial statements.
F-3
NACG HOLDINGS INC.
Consolidated Statements of Operations and Retained Earnings (Deficit)
| | | | | | | | | | | | | | | | | | | | | | | | | | | |
| | | Predecessor | | | | | | | | | | | | |
| | | Company | | | | | | | | | | | | |
| | | | | | | | | | | | | | | |
| | | Period from | | | | Period from | | | | | | | Three Months | | | Three Months | |
| | | April 1, 2003 to | | | | November 26, 2003 | | | Year Ended | | | Year Ended | | | Ended | | | Ended | |
| | | November 25, | | | | to March 31, | | | March 31, | | | March 31, | | | June 30, | | | June 30, | |
| | | 2003 | | | | 2004 | | | 2005 | | | 2006 | | | 2005 | | | 2006 | |
| | | | | | | | | | | | | | | | | | | | |
| | | (In thousands of Canadian dollars) | |
| | | | | | | | (Unaudited) | |
| Revenue | | $ | 250,652 | | | | $ | 127,611 | | | $ | 357,323 | | | $ | 492,237 | | | $ | 104,359 | | | $ | 138,100 | |
| | | | | | | | | | | | | | | | | | | | |
| Project costs | | | 156,976 | | | | | 83,256 | | | | 240,919 | | | | 308,949 | | | | 66,546 | | | | 67,009 | |
| Equipment costs | | | 43,484 | | | | | 13,686 | | | | 52,831 | | | | 64,832 | | | | 17,014 | | | | 23,935 | |
| Equipment operating lease expense | | | 10,502 | | | | | 1,430 | | | | 6,645 | | | | 16,405 | | | | 2,898 | | | | 7,200 | |
| Depreciation | | | 6,566 | | | | | 6,674 | | | | 20,762 | | | | 21,725 | | | | 4,989 | | | | 7,312 | |
| | | | | | | | | | | | | | | | | | | | |
| Gross profit | | | 33,124 | | | | | 22,565 | | | | 36,166 | | | | 80,326 | | | | 12,912 | | | | 32,644 | |
| General and administrative (notes 17(a) and 17(b)) | | | 7,783 | | | | | 6,065 | | | | 22,873 | | | | 30,903 | | | | 7,250 | | | | 9,235 | |
| (Gain) loss on disposal of property, plant and equipment | | | (49 | ) | | | | 131 | | | | 494 | | | | (733 | ) | | | 272 | | | | 113 | |
| Amortization of intangible assets | | | — | | | | | 12,928 | | | | 3,368 | | | | 730 | | | | 183 | | | | 183 | |
| | | | | | | | | | | | | | | | | | | | |
| Operating income before the undernoted | | | 25,390 | | | | | 3,441 | | | | 9,431 | | | | 49,426 | | | | 5,207 | | | | 23,113 | |
| Interest expense (note 14) | | | 2,457 | | | | | 10,079 | | | | 31,141 | | | | 68,776 | | | | 49,863 | | | | 10,168 | |
| Foreign exchange (gain) loss (note 18(c)) | | | (7 | ) | | | | (661 | ) | | | (19,815 | ) | | | (13,953 | ) | | | 1,221 | | | | (13,466 | ) |
| Realized and unrealized loss on derivative financial instruments (note 18(c)) | | | — | | | | | 12,205 | | | | 43,113 | | | | 14,689 | | | | 1,282 | | | | 7,996 | |
| Financing costs (note 8) | | | — | | | | | — | | | | — | | | | 2,095 | | | | 2,095 | | | | — | |
| Other income | | | (367 | ) | | | | (230 | ) | | | (421 | ) | | | (977 | ) | | | (200 | ) | | | (583 | ) |
| Management fees (note 17(c)) | | | 41,070 | | | | | — | | | | — | | | | — | | | | — | | | | — | |
| | | | | | | | | | | | | | | | | | | | |
| Income (loss) before income taxes | | | (17,763 | ) | | | | (17,952 | ) | | | (44,587 | ) | | | (21,204 | ) | | | (49,054 | ) | | | 18,998 | |
| Income taxes (note 12): | | | | | | | | | | | | | | | | | | | | | | | | | |
| | Current income taxes | | | 218 | | | | | 1,178 | | | | 2,711 | | | | 737 | | | | 150 | | | | (132 | ) |
| | Future income taxes | | | (6,840 | ) | | | | (6,848 | ) | | | (4,975 | ) | | | — | | | | — | | | | 1,236 | |
| | | | | | | | | | | | | | | | | | | | |
| Net income (loss) for the period | | | (11,141 | ) | | | | (12,282 | ) | | | (42,323 | ) | | | (21,941 | ) | | | (49,204 | ) | | | 17,894 | |
| Retained earnings (deficit), beginning of period | | | 29,817 | | | | | — | | | | (12,282 | ) | | | (54,605 | ) | | | (54,605 | ) | | | (76,546 | ) |
| | | | | | | | | | | | | | | | | | | | |
| Retained earnings (deficit), end of period | | $ | 18,676 | | | | $ | (12,282 | ) | | $ | (54,605 | ) | | $ | (76,546 | ) | | $ | (103,809 | ) | | $ | (58,652 | ) |
| | | | | | | | | | | | | | | | | | | | |
| Net income (loss) per share – basic (note 13(d)) | | $ | — | | | | $ | (13.28 | ) | | $ | (45.66 | ) | | $ | (23.62 | ) | | $ | (53.02 | ) | | $ | 19.22 | |
| | | | | | | | | | | | | | | | | | | | |
| Net income (loss) per share – diluted (note 13(d)) | | $ | — | | | | $ | (13.28 | ) | | $ | (45.66 | ) | | $ | (23.62 | ) | | $ | (53.02 | ) | | $ | 14.16 | |
| | | | | | | | | | | | | | | | | | | | |
See accompanying notes to consolidated financial statements
F-4
NACG HOLDINGS INC.
Consolidated Statements of Cash Flows
| | | | | | | | | | | | | | | | | | | | | | | | | | | | |
| | | Predecessor | | | | | | | | | | | | |
| | | Company | | | | | | | | | | | | |
| | | | | | | | | | | | | | | |
| | | Period from | | | | Period from | | | | | | | Three Months | | | Three Months | |
| | | April 1, 2003 to | | | | November 26, 2003 | | | Year Ended | | | Year Ended | | | Ended | | | Ended | |
| | | November 25, | | | | to March 31, | | | March 31, | | | March 31, | | | June 30, | | | June 30, | |
| | | 2003 | | | | 2004 | | | 2005 | | | 2006 | | | 2005 | | | 2006 | |
| | | | | | | | | | | | | | | | | | | | |
| | | (In thousands of Canadian dollars) | |
| | | | | | | | (Unaudited) | |
| Cash provided by (used in): | | | | | | | | | | | | | | | | | | | | | | | | | |
| Operating activities: | | | | | | | | | | | | | | | | | | | | | | | | | |
| | Net income (loss) for the period | | $ | (11,141 | ) | | | $ | (12,282 | ) | | $ | (42,323 | ) | | $ | (21,941 | ) | | $ | (49,204 | ) | | $ | 17,894 | |
| | Items not affecting cash: | | | | | | | | | | | | | | | | | | | | | | | | | |
| | | Depreciation | | | 6,566 | | | | | 6,674 | | | | 20,762 | | | | 21,725 | | | | 4,989 | | | | 7,312 | |
| | | Amortization of intangible assets | | | — | | | | | 12,928 | | | | 3,368 | | | | 730 | | | | 183 | | | | 183 | |
| | | Amortization of deferred financing costs | | | — | | | | | 814 | | | | 2,554 | | | | 3,338 | | | | 672 | | | | 887 | |
| | | Financing costs (note 8) | | | — | | | | | — | | | | — | | | | 2,095 | | | | 2,095 | | | | — | |
| | | (Gain) loss on disposal of plant and equipment | | | (49 | ) | | | | 131 | | | | 494 | | | | (733 | ) | | | 272 | | | | 113 | |
| | | Unrealized foreign exchange gain on senior notes (note 18(c)) | | | — | | | | | (740 | ) | | | (20,340 | ) | | | (14,258 | ) | | | 928 | | | | (13,571 | ) |
| | | Unrealized loss on derivative financial instruments (note 18(c)) | | | — | | | | | 11,266 | | | | 40,457 | | | | 11,888 | | | | 587 | | | | 7,419 | |
| | | (Decrease) increase in allowance for doubtful accounts | | | 141 | | | | | (60 | ) | | | (69 | ) | | | (94 | ) | | | (67 | ) | | | — | |
| | | Stock-based compensation expense (note 21) | | | — | | | | | 137 | | | | 497 | | | | 923 | | | | 188 | | | | 312 | |
| | | Change in redemption value and accretion of mandatorily redeemable preferred shares | | | — | | | | | — | | | | — | | | | 34,722 | | | | 41,507 | | | | 945 | |
| | | Future income taxes | | | (6,840 | ) | | | | (6,848 | ) | | | (4,975 | ) | | | — | | | | — | | | | 1,236 | |
| | Net changes in non-cash working capital (note 15(b)) | | | 13,832 | | | | | 3,457 | | | | (5,258 | ) | | | (4,531 | ) | | | (18,280 | ) | | | (7,476 | ) |
| | | | | | | | | | | | | | | | | | | | |
| | | | 2,509 | | | | | 15,477 | | | | (4,833 | ) | | | 33,864 | | | | (16,130 | ) | | | 15,254 | |
| | | | | | | | | | | | | | | | | | | | |
| Investing activities: | | | | | | | | | | | | | | | | | | | | | | | | | |
| | Purchase of plant and equipment | | | (5,234 | ) | | | | (2,501 | ) | | | (25,679 | ) | | | (29,015 | ) | | | (5,693 | ) | | | (11,843 | ) |
| | Net changes in non-cash working capital (note 15(b)) | | | — | | | | | — | | | | — | | | | 1,391 | | | | 2,350 | | | | (204 | ) |
| | Proceeds on disposal of plant and equipment | | | 609 | | | | | 5,765 | | | | 624 | | | | 5,456 | | | | 388 | | | | 473 | |
| | Acquisition (note 3) | | | — | | | | | (367,778 | ) | | | — | | | | — | | | | — | | | | — | |
| | | | | | | | | | | | | | | | | | | | |
| | | | (4,625 | ) | | | | (364,514 | ) | | | (25,055 | ) | | | (22,168 | ) | | | (2,955 | ) | | | (11,574 | ) |
| | | | | | | | | | | | | | | | | | | | |
| Financing activities: | | | | | | | | | | | | | | | | | | | | | | | | | |
| | Issuance of 9% senior secured notes (note 11(b)) | | | — | | | | | — | | | | — | | | | 76,345 | | | | 76,345 | | | | — | |
| | Repayment of senior secured credit facility (note 11(a)) | | | (4,428 | ) | | | | (1,500 | ) | | | (7,250 | ) | | | (61,257 | ) | | | (61,257 | ) | | | — | |
| | Issuance of Series B preferred shares (note 13(a)) | | | — | | | | | — | | | | — | | | | 8,376 | | | | 7,500 | | | | — | |
| | Repurchase of Series B preferred shares (note 13(a)) | | | — | | | | | — | | | | — | | | | (851 | ) | | | — | | | | — | |
| | Financing costs (note 8) | | | — | | | | | (18,080 | ) | | | (642 | ) | | | (7,546 | ) | | | (7,381 | ) | | | (618 | ) |
| | Repayment of capital lease obligations | | | (3,289 | ) | | | | (288 | ) | | | (1,198 | ) | | | (2,183 | ) | | | (434 | ) | | | (773 | ) |
| | Increase in senior secured credit facility | | | — | | | | | — | | | | 20,007 | | | | — | | | | — | | | | — | |
| | Issuance of 83/4% senior notes | | | — | | | | | 263,000 | | | | — | | | | — | | | | — | | | | — | |
| | Issuance of common shares | | | — | | | | | 92,500 | | | | 300 | | | | 300 | | | | — | | | | — | |
| | Proceeds from term credit facility | | | — | | | | | 50,000 | | | | — | | | | — | | | | — | | | | — | |
| | Advances from Norama Inc. | | | 17,696 | | | | | — | | | | — | | | | — | | | | — | | | | — | |
| | Decrease in cheques issued in excess of cash deposits | | | (2,496 | ) | | | | — | | | | — | | | | — | | | | — | | | | — | |
| | Decrease in operating line of credit | | | (516 | ) | | | | — | | | | — | | | | — | | | | — | | | | — | |
| | | | | | | | | | | | | | | | | | | | |
| | | | 6,967 | | | | | 385,632 | | | | 11,217 | | | | 13,184 | | | | 14,773 | | | | (1,391 | ) |
| | | | | | | | | | | | | | | | | | | | |
| Increase (decrease) in cash and cash equivalents | | | 4,851 | | | | | 36,595 | | | | (18,671 | ) | | | 24,880 | | | | (4,312 | ) | | | 2,289 | |
| Cash and cash equivalents, beginning of period | | | — | | | | | — | | | | 36,595 | | | | 17,924 | | | | 17,924 | | | | 42,804 | |
| | | | | | | | | | | | | | | | | | | | |
| Cash and cash equivalents, end of period | | $ | 4,851 | | | | $ | 36,595 | | | $ | 17,924 | | | $ | 42,804 | | | $ | 13,612 | | | $ | 45,093 | |
| | | | | | | | | | | | | | | | | | | | |
See accompanying notes to consolidated financial statements
F-5
NACG HOLDINGS INC.
Notes to the Consolidated Financial Statements
For the three months ended June 30, 2006 (unaudited) and June 30, 2005 (unaudited), the years ended March 31, 2006, and March 31, 2005, the period from November 26, 2003
to March 31, 2004 and the period from April 1, 2003 to November 25, 2003 of
Norama Ltd. (the “Predecessor Company”)
(Amounts in thousands of Canadian dollars unless otherwise specified)
NACG Holdings Inc. (the “Company”) was incorporated under the Canada Business Corporations Act on October 17, 2003. The Company had no operations prior to November 26, 2003. After giving effect to the acquisition described in note 3, the Company completes all forms of civil projects including contract mining, industrial and commercial site development, pipeline and piling installations. NACG Holdings Inc. is a holding company with no active business operations. Substantially all of the business activities and assets shown on the Company’s consolidated balance sheet are conducted and held by its subsidiary, North American Energy Partners Inc. (“NAEPI”). Accordingly, the Company’s earnings and cash flow and its ability to pay dividends are largely dependent upon the earnings and cash flows of NAEPI and the distribution or other payment of such earnings to the Company in the form of dividends. The ability of NAEPI to declare dividends to its ultimate parent, NACG Holdings Inc., is restricted by (a) the terms of the NAEPI Series A preferred shares, (b) the terms of the NAEPI Series B preferred shares, (c) the terms of the NACG Preferred Corp. Series A preferred shares, (d)restrictions contained within the revolving credit facility of NAEPI and (e) terms of the indentures related to the U.S. dollar denominated 83/4% senior notes of NAEPI and the U.S. dollar denominated 9% senior secured notes of NAEPI. The restricted net assets of the Company as of June 30, 2006 are approximately $36.3 million (March 31, 2006 – $18.1 million).
| |
| 2. | Significant accounting policies |
These consolidated financial statements are prepared in accordance with Canadian generally accepted accounting principles (“GAAP”). Material inter-company transactions and balances are eliminated on consolidation. Material items that give rise to measurement differences to the consolidated financial statements under United States GAAP are outlined in note 23.
These consolidated financial statements include the accounts of the Company, its wholly-owned subsidiary, NACG Preferred Corp.; the wholly-owned subsidiary of NACG Preferred Corp., NAEPI; the wholly-owned subsidiaries of NAEPI, NACG Finance LLC and North American Construction Group Inc.
F-6
NACG HOLDINGS INC.
Notes to the Consolidated Financial Statements — (Continued)
(“NACGI”); the Company’s joint venture, Noramac Ventures Inc. (note 15(c)), and the following subsidiaries of NACGI:
| | | | | |
| | | % Owned | |
| | | | |
| • North American Caisson Ltd. | | | 100% | |
| • North American Construction Ltd. | | | 100% | |
| • North American Engineering Ltd. | | | 100% | |
| • North American Enterprises Ltd. | | | 100% | |
| • North American Industries Inc. | | | 100% | |
| • North American Mining Inc. | | | 100% | |
| • North American Maintenance Ltd. | | | 100% | |
| • North American Pipeline Inc. | | | 100% | |
| • North American Road Inc. | | | 100% | |
| • North American Services Inc. | | | 100% | |
| • North American Site Development Ltd. | | | 100% | |
| • North American Site Services Inc. | | | 100% | |
| • Griffiths Pile Driving Inc. | | | 100% | |
In preparation for the acquisition described in Note 3, effective July 31, 2003, all of the issued common shares of NACGI and North American Equipment Ltd. (“NAEL”) were transferred from Norama Inc. to its new wholly-owned subsidiary, Norama Ltd. (the“Predecessor Company”). The consolidated financial statements of Norama Ltd. are depicted in these financial statements as thePredecessor Companyand have been prepared using the continuity of interest method of accounting to reflect the combined carrying values of the assets, liabilities and shareholder’s equity as well as the combined operating results of NAEL and NACGI for all comparative periods presented. The consolidated financial statements for periods ended before November 26, 2003 are not comparable in all respects to the consolidated financial statements for periods ended after November 25, 2003.
ThePredecessor Companyhas been operating continuously in western Canada since 1953.
The preparation of financial statements in conformity with Canadian GAAP requires management to make estimates and assumptions that affect the reported amounts of assets, liabilities, revenues, expenses and disclosures reported in these consolidated financial statements and accompanying notes.
Significant estimates made by management include the assessment of the percentage of completion on unit-price or lump-sum contracts (including estimated total costs and provisions for estimated losses) and the recognition of claims and change orders on contracts, assumptions used to value derivative financial instruments, assumptions used to determine redemption value of redeemable securities, assumptions used in periodic impairment testing, and estimates and assumptions used in the determination of the allowance for doubtful accounts. Actual results could differ materially from those estimates.
The Company performs the majority of its projects under the following types of contracts: time-and-materials; cost-plus; unit-price; and lump sum. For time-and-materials and cost-plus contracts, revenue is recognized as costs are incurred. Revenue on unit-price and lump sum contracts is recognized on thepercentage-of-completion method, measured by the ratio of costs incurred to date to estimated total costs.
F-7
NACG HOLDINGS INC.
Notes to the Consolidated Financial Statements — (Continued)
Excluded from costs incurred to date, particularly in the early stages of the contract, are the costs of items that do not relate to performance of our contracted work.
The length of the Company’s contracts varies from less than one year on typical contracts to several years for certain larger contracts. Contract project costs include all direct labour, material, subcontract, and equipment costs and those indirect costs related to contract performance such as indirect labour, supplies, and tools. General and administrative costs are charged to expense as incurred. Provisions for estimated losses on uncompleted contracts are made in the period in which such losses are determined. Changes in project performance, project conditions, and estimated profitability, including those arising from contract penalty provisions and final contract settlements, may result in revisions to costs and income that are recognized in the period in which such adjustments are determined. Profit incentives are included in revenue when their realization is reasonably assured.
Effective April 1, 2005, the Company changed its accounting policy regarding the recognition of revenue on claims. This change in accounting policy has been applied retroactively. Once contract performance is underway, the Company will often experience changes in conditions, client requirements, specifications, designs, materials and work schedule. Generally, a “change order” will be negotiated with the customer to modify the original contract to approve both the scope and price of the change. Occasionally, however, disagreements arise regarding changes, their nature, measurement, timing and other characteristics that impact costs and revenue under the contract. When a change becomes a point of dispute between the Company and a customer, the Company will then consider it as a claim.
Costs related to change orders and claims are recognized when they are incurred. Change orders are included in total estimated contract revenue when it is probable that the change order will result in a bona fide addition to contract value and can be reliably estimated.
Prior to April 1, 2005, revenue from claims was included in total estimated contract revenue when awarded or received. After April 1, 2005, claims are included in total estimated contract revenue, only to the extent that contract costs related to the claim have been incurred and when it is probable that the claim will result in a bona fide addition to contract value and can be reliably estimated. Those two conditions are satisfied when (1) the contract or other evidence provides a legal basis for the claim or a legal opinion is obtained providing a reasonable basis to support the claim, (2) additional costs incurred were caused by unforeseen circumstances and are not the result of deficiencies in our performance, (3) costs associated with the claim are identifiable and reasonable in view of work performed and (4) evidence supporting the claim is objective and verifiable. No profit is recognized on claims until final settlement occurs. This can lead to a situation where costs are recognized in one period and revenue is recognized when customer agreement is obtained or claim resolution occurs, which can be in subsequent periods. Historical claim recoveries should not be considered indicative of future claim recoveries.
The change in policy resulted in an increase in claims revenue and unbilled revenue of approximately $6.1 million (unaudited) for the three months ended June 30, 2006 (the three months ended June 30, 2005 – $8.1 million (unaudited); the year ended March 31, 2006 – $12.9 million; the year ended March 31, 2005 – $nil; November 26, 2003 to March 31, 2004 – $nil; April 1, 2003 to November 25, 2005 – $nil).
The asset entitled “unbilled revenue” represents revenue recognized in advance of amounts invoiced. The liability entitled “billings in excess of costs incurred and estimated earnings on uncompleted contracts” represents amounts invoiced in excess of revenue recognized.
| |
| (d) | Cash and cash equivalents: |
Cash and cash equivalents include cash on hand, bank balances net of outstanding cheques, and short-term investments with maturities of three months or less.
F-8
NACG HOLDINGS INC.
Notes to the Consolidated Financial Statements — (Continued)
| |
| (e) | Allowance for doubtful accounts: |
The Company evaluates the probability of collection of accounts receivable and records an allowance for doubtful accounts, which reduces the receivables to the amount management reasonably believes will be collected. In determining the amount of the allowance, the following factors are considered: the length of time the receivable has been outstanding, specific knowledge of each customer’s financial condition, and historical experience.
Inventory is carried at the lower of cost, on afirst-in, first-out basis, and replacement cost, and primarily consists of job materials.
Plant and equipment are recorded at cost. Major components of heavy construction equipment in use such as engines, transmissions, and undercarriages are recorded separately. Spare component parts are charged to earnings when they are put into use. Equipment under capital lease is recorded at the present value of minimum lease payments at the inception of the lease. Depreciation is not recorded until an asset is put into service. Depreciation for each category is calculated based on the cost, net of the estimated residual value, over the estimated useful life of the assets on the following bases and annual rates:
| | | | | |
| Asset | | Basis | | Rate |
| | | | | |
| Heavy equipment | | Straight-line | | Operating hours |
| Major component parts in use | | Straight-line | | Operating hours |
| Spare component parts | | N/A | | N/A |
| Other equipment | | Straight-line | | 10-20% |
| Licensed motor vehicles | | Declining balance | | 30% |
| Office and computer equipment | | Straight-line | | 25% |
| Buildings | | Straight-line | | 10% |
| Leasehold improvements | | Straight-line | | Lease term |
| Assets under construction | | N/A | | N/A |
The cost of period repairs and maintenance is expensed to the extent that the expenditure serves only to restore the asset to its original condition.
Goodwill represents the excess purchase price paid by the Company over the fair value of the tangible and identifiable intangible assets and liabilities acquired. Goodwill is not amortized but instead is tested for impairment annually or more frequently if events or changes in circumstances indicate that the asset might be impaired. The impairment test is carried out in two steps. In the first step, the carrying amount of the reporting unit, including goodwill, is compared with its fair value. When the fair value of the reporting unit exceeds its carrying amount, goodwill of the reporting unit is not considered to be impaired and the second step of the impairment test is unnecessary. The second step is carried out when the carrying amount of a reporting unit exceeds its fair value, in which case, the implied fair value of the reporting unit’s goodwill, determined in the same manner as the value of goodwill is determined in a business combination, is compared with its carrying amount to measure the amount of the impairment loss, if any.
F-9
NACG HOLDINGS INC.
Notes to the Consolidated Financial Statements — (Continued)
The Company tested goodwill for impairment at December 31, 2005 and determined that there was no impairment in carrying value. The Company conducts its annual assessment of goodwill on December 31 of each year.
Intangible assets acquired include: customer contracts in progress and related relationships, which are being amortized based on the net present value of the estimated period cash flows over the remaining lives of the related contracts; trade names, which are being amortized on a straight-line basis over their estimated useful life of 10 years; a non-competition agreement, which is being amortized on a straight-line basis over the five-year term of the agreement; and employee arrangements, which are being amortized on a straight-line basis over the three-year term of the arrangement.
| |
| (j) | Deferred financing costs: |
Costs relating to the issuance of the senior notes and the revolving credit facility have been deferred and are being amortized on a straight-line basis over the term of the related debt. Deferred financing costs related to debt that has been extinguished is written-off in the period of extinguishment.
| |
| (k) | Impairment of long-lived assets: |
Long-lived assets and certain identifiable intangibles are reviewed for impairment whenever events or changes in circumstances indicate that the carrying amount of an asset may not be recoverable. Recoverability of assets to be held and used is assessed by a comparison of the carrying amount of an asset to future undiscounted cash flows expected to be generated by the asset. If such assets are considered to be impaired, the impairment loss is recognized for the amount by which the carrying amount of the assets exceeds the fair value of the assets. Assets to be disposed of by sale are reported at the lower of their carrying amount or fair value less costs to sell.
| |
| (l) | Foreign currency translation: |
The functional currency of the Company is Canadian dollars. Transactions denominated in foreign currencies are recorded at the rate of exchange prevailing at the transaction date. Monetary assets and liabilities, including long-term debt denominated in U.S. dollars, are translated into Canadian dollars at the rate of exchange prevailing at the balance sheet date.
| |
| (m) | Derivative financial instruments: |
The Company uses derivative financial instruments to manage economic risks from fluctuations in exchange rates and interest rates. These instruments include cross-currency swap agreements and interest rate swap agreements. All such instruments are only used for risk management purposes. The Company does not hold or issue derivative financial instruments for trading or speculative purposes. Derivative financial instruments are subject to standard credit terms and conditions, financial controls, management and risk monitoring procedures.
A derivative financial instrument must be designated and effective, at inception and on at least a quarterly basis, to be accounted for as a hedge. For cash flow hedges, effectiveness is achieved if the changes in the cash flows of the derivative financial instrument substantially offset the changes in the cash flows of the hedged position and the timing of the cash flows is similar. Effectiveness for fair value hedges is achieved if changes in the fair value of the derivative financial instrument substantially offset changes in the fair value of the hedged item attributable to the risk being hedged. In the event that a derivative financial instrument does not meet the designation or effectiveness criteria, the derivative financial
F-10
NACG HOLDINGS INC.
Notes to the Consolidated Financial Statements — (Continued)
instrument is accounted for at fair value and realized and unrealized gains and losses on the derivative are recognized in the Consolidated Statement of Operations and Deficit in accordance with the Canadian Institute of Chartered Accountants (“CICA”) Emerging Issues Committee Abstract No. 128, “Accounting for Trading, Speculative or Non-Hedging Derivative Financial Instruments”(“EIC-128”). If a derivative financial instrument that previously qualified for hedge accounting no longer qualifies or is settled or de-designated, the carrying value at that date is deferred and recognized when the corresponding hedged transaction is recognized in earnings. Premiums paid or received with respect to derivatives that are hedges are deferred and amortized to income over the term of the hedge.
The Company uses the asset and liability method of accounting for income taxes. Under the asset and liability method, future income tax assets and liabilities are recognized for the future tax consequences attributable to differences between the financial statement carrying amounts of existing assets and liabilities and their respective tax bases. Future income tax assets and liabilities are measured using enacted or substantively enacted tax rates expected to apply to taxable income in the years in which those temporary differences are expected to be recovered or settled. The effect on future income tax assets and liabilities of a change in tax rates is recognized in income in the period that includes the date of enactment or substantive enactment. A valuation allowance is recorded against any future income tax asset if it is more likely than not that the asset will not be realized.
| |
| (o) | Stock–based compensation plan: |
The Company accounts for all stock-based compensation payments in accordance with a fair value based method of accounting. Under this fair value based method, compensation cost is measured using the Black-Scholes model using an expected volatility assumption of nil (the “minimum value” approach) at the grant date and is expensed over the award’s vesting period, with a corresponding increase to contributed surplus.
Basic earnings per share are computed by dividing net earnings (loss) available to common shareholders by the weighted average number of shares outstanding during the year (see note 13(d)). Diluted per share amounts are calculated using the treasury stock and if-converted methods. The treasury stock method increases the diluted weighted average shares outstanding to include additional shares from the assumed exercise of stock options, if dilutive. The number of additional shares is calculated by assuming that outstanding in-the-money stock options were exercised and that the proceeds from such exercises, including any unamortized stock-based compensation cost, were used to acquire shares of common stock at the average market price during the year. The if-converted method assumes the conversion of convertible securities at the later of the beginning of the reported period or issuance date, if dilutive.
| |
| (q) | Recently adopted Canadian accounting pronouncements: |
Effective November 26, 2003, the Company prospectively adopted the provisions of CICA Accounting Guideline 13, “Hedging Relationships”(“AcG-13”), which specifies the circumstances in which hedge accounting is appropriate, including the identification, documentation, designation, and effectiveness of hedges, and the discontinuance of hedge accounting. The Company determined that all of its then existing derivative financial instruments did not qualify for hedge accounting on the adoption date ofAcG-13.
F-11
NACG HOLDINGS INC.
Notes to the Consolidated Financial Statements — (Continued)
| |
| ii. Generally accepted accounting principles: |
Effective November 26, 2003, the Company adopted CICA Handbook Section 1100, “Generally Accepted Accounting Principles,” which establishes standards for financial reporting in accordance with Canadian GAAP, and describes what constitutes Canadian GAAP and its sources. This section also provides guidance on sources to consult when selecting accounting policies and determining appropriate disclosures when the primary sources of Canadian GAAP do not provide guidance. The adoption of this standard did not have a material impact on the consolidated financial statements.
| |
| iii. Revenue recognition: |
Effective January 1, 2004, the Company prospectively adopted CICA Emerging Issues Committee Abstract No. 141, “Revenue Recognition,” and CICA Emerging Issues Committee Abstract No. 142, “Revenue Arrangements with Multiple Deliverables,” which incorporate the principles and guidance for revenue recognition provided under United States generally accepted accounting principles (“U.S. GAAP”). No changes to the recognition, measurement or classification of revenue were made as a result of the adoption of these standards.
| |
| iv. Consolidation of variable interest entities: |
Effective January 1, 2005, the Company prospectively adopted the CICA Accounting Guideline 15, “Consolidation of Variable Interest Entities”(“AcG-15”). Variable interest entities (“VIEs”) are entities that have insufficient equity at risk to finance their operations without additional subordinated financial support and/or entities whose equity investors lack one or more of the specified essential characteristics of a controlling financial interest. AcG-15 provides specific guidance for determining when an entity is a variable interest entity (“VIE”) and who, if anyone, should consolidate the VIE. The Company has determined the joint venture in which it has an investment (note 15(c)) qualifies as a VIE and began consolidating this VIE effective January 1, 2005.
| |
| v. Arrangements containing a lease: |
Effective January 1, 2005, the Company adopted the CICA Emerging Issues Committee Abstract No. 150, “Determining Whether an Arrangement Contains a Lease” (“EIC-150”). EIC-150 addresses a situation where an entity enters into an arrangement, comprising a transaction that does not take the legal form of a lease but conveys a right to use a tangible asset in return for a payment or series of payments. The implementation of this standard did not have a material impact on the Company’s consolidated financial statements.
In April 2005, the Company adopted the CICA Emerging Issues Committee Abstract No. 144, “Accounting by a Customer (Including a Reseller) for Certain Consideration Received from a Vendor”(“EIC-144”).EIC-144 requires companies to recognize the benefit of non-discretionary rebates for achieving specified cumulative purchasing levels as a reduction of the cost of purchases over the relevant period, provided the rebate is probable and reasonably estimable. Otherwise, the rebates would be recognized as purchasing milestones are achieved. The implementation of this new standard did not have a material impact on the Company’s consolidated financial statements.
| |
| vii. Accounting for convertible debt instruments: |
In October 2005, the CICA issued Emerging Issues Committee Abstract No. 158 “Accounting for Convertible Debt Instruments” (“EIC-158”) which provides guidance on whether an issuer of certain types of convertible debt instruments should classify the instruments as liabilities or equity and, if a
F-12
NACG HOLDINGS INC.
Notes to the Consolidated Financial Statements — (Continued)
liability, when it should be classified as a current liability. EIC-158 was applicable for convertible debt instruments issued after October 17, 2005. The adoption of this standard did not have an impact on the Company’s consolidated financial statements.
| |
| viii. Non-monetary transactions: |
Effective January 1, 2006, the Company adopted the requirements of CICA Handbook Section 3831, “Non-monetary Transactions”. The new standard requires that an asset exchanged or transferred in a non-monetary transaction must be measured at its fair value except when: the transaction lacks commercial substance; the transaction is an exchange of production or property held for sale in the ordinary course of business for production or property to be sold in the same line of business to facilitate sales to customers other than the parties to the exchange; neither the fair value of the assets or services received nor the fair value of the assets or services given up is reliably measurable; or the transaction is a non-monetary, non-reciprocal transfer to owners that represents a spin-off or other form of restructuring or liquidation. In these cases, the transaction must be measured at carrying value. The adoption of this standard did not have a material impact on the Company’s consolidated financial statements.
| |
| ix. Implicit variable interests under AcG-15: |
Effective January 1, 2006, the Company adopted the CICA Emerging Issues Committee Abstract No. 157, “Implicit Variable Interests Under AcG-15”(“EIC-157”).EIC-157 requires a company to assess whether it has an implicit variable interest in a VIE or potential VIE when specific conditions exist. An implicit variable interest acts the same as an explicit variable interest except it involves the absorbing and/or receiving of variability indirectly from the entity (rather than directly). The identification of an implicit variable interest is a matter of judgment that depends on the relevant facts and circumstances. The adoption of this standard did not have a material impact on the Company’s consolidated financial statements.
| |
| x. Conditional asset retirement obligations: |
In November 2005, the CICA issued Emerging Issues Committee Abstract No. 159, “Conditional Asset Retirement Obligations” (“EIC-159”) to clarify the accounting treatment for a legal obligation to perform an asset retirement activity in which the timing and/or method of settlement are conditional on a future event that may or may not be within the control of the entity. Under EIC-159, an entity is required to recognize a liability for the fair value of a conditional asset retirement obligation if the obligation can be reasonably estimated. The guidance is effective April 1, 2006, although early adoption is permitted, and is to be applied retroactively, with restatement of prior periods. The Company adopted this standard adopted this standard in fiscal 2006, and the adoption did not have a material impact on the Company’s consolidated financial statements.
| |
| (r) | Recent Canadian accounting pronouncements not yet adopted: |
| |
| i. Financial instruments: |
In January 2005, the CICA issued Handbook Section 3855, “Financial Instruments – Recognition and Measurement”, Handbook Section 1530, “Comprehensive Income”, and Handbook Section 3865, “Hedges”. The new standards are effective for interim and annual financial statements for fiscal years beginning on or after October 1, 2006, specifically April 1, 2007 for the Company. Earlier adoption is permitted. The new standards will require presentation of a separate statement of comprehensive income under specific circumstances. Foreign exchange gains and losses on the translation of the financial statements of self-sustaining subsidiaries previously recorded in a separate section of shareholder’s equity will be presented in comprehensive income. Derivative financial instruments will be recorded in the
F-13
NACG HOLDINGS INC.
Notes to the Consolidated Financial Statements — (Continued)
balance sheet at fair value and the changes in fair value of derivatives designated as cash flow hedges will be reported in comprehensive income. The Company is currently assessing the impact of the new standards.
On November 26, 2003, NACG Preferred Corp. and NACG Acquisition Inc. (“NACG Acquisition”), a wholly-owned subsidiary of NAEPI, acquired from thePredecessor Companyall of the outstanding common shares of NACGI. ThePredecessor Companysold 30 shares of NACGI to NACG Preferred Corp. in exchange for $35.0 million of NACG Preferred Corp.’s Series A preferred shares. NACG Preferred Corp. then contributed the 30 shares of NACGI to NAEPI in exchange for common shares. NAEPI then contributed the 30 shares of NACGI to NACG Acquisition in exchange for common shares. ThePredecessor Company sold the remaining 170 shares of NACGI to NACG Acquisition in exchange for approximately $195.5 million in cash including the impact of various post-closing adjustments. In addition, NACG Acquisition acquired substantially all of the property, plant and equipment, prepaid expenses and accounts payable of NAEL for $175.0 million in cash. NACG Acquisition and NACGI amalgamated on the same day and the successor company continued as NACGI.
The total purchase price was approximately $230.0 million for the common shares of NACGI and $175.0 million for the property, plant and equipment, prepaid expenses and accounts payable of NAEL. The purchase price was subject to an adjustment of $0.5 million based on the closing working capital of NACGI at November 25, 2003 which has been accounted for as increased goodwill. The total consideration payable by NACG Preferred Corp. and NACG Acquisition to the sellers was approximately $405.5 million including the impact of certain post-closing adjustments. Of the cash consideration, $92.5 million came from the Company’s sale of its equity.
The Company accounted for the acquisition as a business combination using the purchase method. The results of NACGI’s operations have been included in the consolidated financial statements of the Company since November 26, 2003. The following table summarizes the fair value of the assets acquired and liabilities assumed at the date of acquisition:
| | | | | | | |
| Current assets, including cash of $19,642 | | $ | 83,910 | |
| Property, plant and equipment, including capital leases of $2,131 | | | 176,779 | |
| Intangible assets | | | 17,798 | |
| Goodwill | | | 198,549 | |
| | | | |
| | Total assets acquired | | | 477,036 | |
| | | | |
| Current liabilities | | | (40,662 | ) |
| Future income taxes | | | (11,823 | ) |
| Capital lease obligations | | | (2,131 | ) |
| | | | |
| | Total liabilities assumed | | | (54,616 | ) |
| | | | |
| | | Net assets acquired | | $ | 422,420 | |
| | | | |
F-14
NACG HOLDINGS INC.
Notes to the Consolidated Financial Statements — (Continued)
The acquisition was financed as follows:
| | | | | | |
Proceeds from issuance of 83/4% senior notes | | $ | 263,000 | |
| Proceeds from issuance of share capital | | | 92,500 | |
Proceeds from issuance of Series A
preferred shares of NACG Preferred Corp. | | | 35,000 | |
| Proceeds from initial borrowing under the new: | | | | |
| | Term credit facility | | | 50,000 | |
| | Revolving credit facility | | | — | |
| Less: deferred financing costs | | | (18,080 | ) |
| | | | |
| | | $ | 422,420 | |
| | | | |
The net cash cost of the acquisition was:
| | | | | |
| Net assets acquired | | $ | 422,420 | |
| Less: issuance of Series A preferred shares of NACG Preferred Corp. | | | (35,000 | ) |
| Less: cash acquired from acquisition and financing | | | (19,642 | ) |
| | | | |
| | | $ | 367,778 | |
| | | | |
The intangible assets relate to customer contracts in progress and related relationships, trade names, a non-competition agreement, and employee arrangements and are subject to amortization.
The goodwill was assigned to mining and site preparation, piling and pipeline segments in the amounts of $125,447, $40,349, and $32,753, respectively. None of the goodwill is deductible for income tax purposes.
Transaction costs of $25,080 were incurred on the acquisition, $7,000 of which were accounted for as increased goodwill and $18,080 of which were recorded as deferred financing costs.
The current assets included $19,642 in cash acquired, of which $15,623 was surplus cash from the financing.
| | | | | | | | | | | | | |
| | | March 31, | | | March 31, | | | June 30, | |
| | | 2005 | | | 2006 | | | 2006 | |
| | | | | | | | | | |
| | | | | | | (Unaudited) | |
| Accounts receivable – trade | | $ | 45,379 | | | $ | 55,666 | | | $ | 67,542 | |
| Accounts receivable – holdbacks | | | 12,476 | | | | 10,748 | | | | 8,302 | |
| Accounts receivable – other | | | 54 | | | | 891 | | | | 528 | |
| Allowance for doubtful accounts | | | (164 | ) | | | (70 | ) | | | (70 | ) |
| | | | | | | | | | |
| | | $ | 57,745 | | | $ | 67,235 | | | $ | 76,302 | |
| | | | | | | | | | |
Accounts receivable – holdbacks represent amounts up to 10% under certain contracts that the customer is contractually entitled to withhold until completion of the project. The customer is obligated to retain this amount in a lien fund to ensure that subcontractors are paid and to ensure that any remedial or warranty work is performed.
F-15
NACG HOLDINGS INC.
Notes to the Consolidated Financial Statements — (Continued)
| |
| 5. | Costs incurred and estimated earnings net of billings on uncompleted contracts |
| | | | | | | | | | | | | | |
| | | March 31, | | | March 31, | | | June 30, | |
| | | 2005 | | | 2006 | | | 2006 | |
| | | | | | | | | | |
| | | | | | | (Unaudited) | |
| | Costs incurred and estimated earnings on uncompleted contracts | | $ | 885,301 | | | $ | 610,006 | | | $ | 443,468 | |
| Less: billings to date | | | (845,215 | ) | | | (571,636 | ) | | | (411,965 | ) |
| | | | | | | | | | |
| | | $ | 40,086 | | | $ | 38,370 | | | $ | 31,503 | |
| | | | | | | | | | |
Costs incurred and estimated earnings net of billings on uncompleted contracts is presented in the consolidated balance sheets under the following captions:
| | | | | | | | | | | | | | |
| | | March 31, | | | March 31, | | | June 30, | |
| | | 2005 | | | 2006 | | | 2006 | |
| | | | | | | | | | |
| | | | | | | (Unaudited) | |
| Unbilled revenue | | $ | 41,411 | | | $ | 43,494 | | | $ | 38,119 | |
| | Billings in excess of costs incurred and estimated earnings on uncompleted contracts | | | (1,325 | ) | | | (5,124 | ) | | | (6,616 | ) |
| | | | | | | | | | |
| | | $ | 40,086 | | | $ | 38,370 | | | $ | 31,503 | |
| | | | | | | | | | |
| | | | | | | | | | | | | |
| | | | | Accumulated | | | Net Book | |
| June 30, 2006 | | Cost | | | Depreciation | | | Value | |
| | | | | | | | | | |
| | | (Unaudited) | | | (Unaudited) | | | (Unaudited) | |
| Heavy equipment | | $ | 178,517 | | | $ | 34,885 | | | $ | 143,632 | |
| Major component parts in use | | | 6,129 | | | | 2,363 | | | | 3,766 | |
| Spare component parts | | | 3,678 | | | | — | | | | 3,678 | |
| Other equipment | | | 13,480 | | | | 4,568 | | | | 8,912 | |
| Licensed motor vehicles | | | 20,156 | | | | 9,195 | | | | 10,961 | |
| Office and computer equipment | | | 3,459 | | | | 1,675 | | | | 1,784 | |
| Buildings | | | 15,927 | | | | 65 | | | | 15,862 | |
| Leasehold improvements | | | 2,972 | | | | 339 | | | | 2,633 | |
| Assets under construction | | | 41 | | | | — | | | | 41 | |
| | | | | | | | | | |
| | | $ | 244,359 | | | $ | 53,090 | | | $ | 191,269 | |
| | | | | | | | | | |
F-16
NACG HOLDINGS INC.
Notes to the Consolidated Financial Statements — (Continued)
| | | | | | | | | | | | | |
| | | | | Accumulated | | | Net Book | |
| March 31, 2006 | | Cost | | | Depreciation | | | Value | |
| | | | | | | | | | |
| Heavy equipment | | $ | 174,042 | | | $ | 31,347 | | | $ | 142,695 | |
| Major component parts in use | | | 4,922 | | | | 2,091 | | | | 2,831 | |
| Spare component parts | | | 1,170 | | | | — | | | | 1,170 | |
| Other equipment | | | 13,074 | | | | 4,186 | | | | 8,888 | |
| Licensed motor vehicles | | | 18,223 | | | | 8,410 | | | | 9,813 | |
| Office and computer equipment | | | 3,362 | | | | 1,493 | | | | 1,869 | |
| Leasehold improvements | | | 2,959 | | | | 247 | | | | 2,712 | |
| Assets under construction | | | 15,588 | | | | — | | | | 15,588 | |
| | | | | | | | | | |
| | | $ | 233,340 | | | $ | 47,774 | | | $ | 185,566 | |
| | | | | | | | | | |
| | | | | | | | | | | | | |
| | | | | Accumulated | | | Net Book | |
| March 31, 2005 | | Cost | | | Depreciation | | | Value | |
| | | | | | | | | | |
| Heavy equipment | | $ | 165,296 | | | $ | 17,966 | | | $ | 147,330 | |
| Major component parts in use | | | 4,659 | | | | 1,182 | | | | 3,477 | |
| Spare component parts | | | 841 | | | | — | | | | 841 | |
| Other equipment | | | 12,088 | | | | 2,473 | | | | 9,615 | |
| Licensed motor vehicles | | | 16,043 | | | | 4,670 | | | | 11,373 | |
| Office and computer equipment | | | 2,088 | | | | 791 | | | | 1,297 | |
| Assets under construction | | | 3,156 | | | | — | | | | 3,156 | |
| | | | | | | | | | |
| | | $ | 204,171 | | | $ | 27,082 | | | $ | 177,089 | |
| | | | | | | | | | |
The above amounts include as at June 30, 2006 $16,317 (unaudited) (March 31, 2006 – $14,559; March 31, 2005 – $8,637) of assets under capital lease and accumulated depreciation of $5,109 (unaudited) (March 31, 2006 – $4,479; March 31, 2005 – $1,968) related thereto. During the three months ended June 30, 2006, additions of property, plant and equipment included $1,758 acquired by means of capital leases (unaudited) (three months ended June 30, 2005 – $981 (unaudited); year ended March 31, 2006 – $5,910; year ended March 31, 2005 – $5,385; November 26, 2003 to March 31, 2004 – $1,195; April 1, 2003 to November 25, 2003 – $nil). Depreciation of equipment under capital leases of $630 for the three months ended June 30, 2006 (unaudited) (three months ended June 30, 2005 – $540 (unaudited); year ended March 31, 2006 – $2,545; year ended March 31, 2005 – $1,659; November 26, 2003 to March 31, 2004 – $320; April 1, 2003 to November 25, 2003 – $677) is included in depreciation expense.
| | | | | | | | | | | | | |
| | | | | Accumulated | | | Net Book | |
| June 30, 2006 | | Cost | | | Amortization | | | Value | |
| | | | | | | | | | |
| | | (Unaudited) | | | (Unaudited) | | | (Unaudited) | |
| Customer contracts in progress and related relationships | | $ | 15,323 | | | $ | 15,323 | | | $ | — | |
| Trade names | | | 350 | | | | 90 | | | | 260 | |
| Non-competition agreement | | | 100 | | | | 52 | | | | 48 | |
| Employee arrangements | | | 2,025 | | | | 1,744 | | | | 281 | |
| | | | | | | | | | |
| | | $ | 17,798 | | | $ | 17,209 | | | $ | 589 | |
| | | | | | | | | | |
F-17
NACG HOLDINGS INC.
Notes to the Consolidated Financial Statements — (Continued)
| | | | | | | | | | | | | |
| | | | | Accumulated | | | Net Book | |
| March 31, 2006 | | Cost | | | Amortization | | | Value | |
| | | | | | | | | | |
| Customer contracts in progress and related relationships | | $ | 15,323 | | | $ | 15,323 | | | $ | — | |
| Trade names | | | 350 | | | | 81 | | | | 269 | |
| Non-competition agreement | | | 100 | | | | 47 | | | | 53 | |
| Employee arrangements | | | 2,025 | | | | 1,575 | | | | 450 | |
| | | | | | | | | | |
| | | $ | 17,798 | | | $ | 17,026 | | | $ | 772 | |
| | | | | | | | | | |
| | | | | | | | | | | | | |
| | | | | Accumulated | | | Net Book | |
| March 31, 2005 | | Cost | | | Amortization | | | Value | |
| | | | | | | | | | |
| Customer contracts in progress and related relationships | | $ | 15,323 | | | $ | 15,323 | | | $ | — | |
| Trade names | | | 350 | | | | 47 | | | | 303 | |
| Non-competition agreement | | | 100 | | | | 26 | | | | 74 | |
| Employee arrangements | | | 2,025 | | | | 900 | | | | 1,125 | |
| | | | | | | | | | |
| | | $ | 17,798 | | | $ | 16,296 | | | $ | 1,502 | |
| | | | | | | | | | |
Amortization of intangible assets of $183 was recorded for the three months ended June 30, 2006 (unaudited) (three months ended June 30, 2005 – $183 (unaudited); year ended March 31, 2006 $730; year ended March 31, 2005 – $3,368; November 26, 2003 to March 31, 2004 – $12,928; April 1, 2003 to November 25, 2003 – $nil).
The estimated amortization expense for each of the next five years is as follows:
| | | | | |
| For the year ending March 31, | | |
| 2007 | | $ | 505 | |
| 2008 | | | 55 | |
| 2009 | | | 48 | |
| 2010 | | | 35 | |
| 2011 and thereafter | | | 129 | |
| | | | |
| | | $ | 772 | |
| | | | |
| |
| 8. | Deferred financing costs |
For the year ended March 31, 2006, financing costs of $7,546 were incurred in connection with the issuance of the 9% senior secured notes and revolving credit facility and were recorded as deferred financing costs. In addition, financing costs of $321 were incurred in connection with the issuance of the NAEPI Series A redeemable preferred shares and expensed in the current year.
In connection with the repayment of the senior secured credit facility on May 19, 2005, the Company wrote off deferred financing costs of $1,774 (note 11(a)).
Amortization of deferred financing costs of $887 (unaudited) was recorded for the three months ended June 30, 2006 (three months ended June 30, 2005 – 672 (unaudited); year ended March 31, 2006 – $3,338; year ended March 31, 2005 – $2,554; November 26, 2003 to March 31, 2004 – $814; April 1, 2003 to November 25, 2003 – $nil).
F-18
NACG HOLDINGS INC.
Notes to the Consolidated Financial Statements — (Continued)
| | | | | | | | | | | | | |
| | | March 31, | | | March 31, | | | June 30, | |
| | | 2005 | | | 2006 | | | 2006 | |
| | | | | | | | | | |
| | | | | | | (Unaudited) | |
| Accrued interest payable | | $ | 9,127 | | | $ | 10,878 | | | $ | 3,373 | |
| Payroll liabilities | | | 2,283 | | | | 7,423 | | | | 9,289 | |
| Income and other taxes payable | | | 1,679 | | | | 1,241 | | | | 1,562 | |
| Liabilities related to equipment leases | | | 2,112 | | | | 5,061 | | | | 7,439 | |
| | | | | | | | | | |
| | | $ | 15,201 | | | $ | 24,603 | | | $ | 21,663 | |
| | | | | | | | | | |
| |
| 10. | Capital lease obligations |
The Company leases a portion of its licensed motor vehicles for which the minimum lease payments due in each of the five fiscal years as at June 30, 2006 are as follows:
| | | | | | |
| | | (Unaudited) | |
| | 2007 (July 2006 to March 2007) | | $ | 2,919 | |
| | 2008 | | | 3,960 | |
| | 2009 | | | 3,176 | |
| | 2010 | | | 2,396 | |
| | 2011 | | | 527 | |
| | | | |
| | | | 12,978 | |
| Less: amount representing interest – weighted average rate of 4.69% | | | 1,042 | |
| | | | |
| Present value of minimum capital lease payments | | | 11,937 | |
| Less: current portion | | | 3,433 | |
| | | | |
| | | $ | 8,504 | |
| | | | |
The Company leases a portion of its licensed motor vehicles for which the minimum lease payments due in each of the next five fiscal years as at March 31, 2006 are as follows:
| | | | | | |
| | 2007 | | $ | 3,766 | |
| | 2008 | | | 3,620 | |
| | 2009 | | | 2,963 | |
| | 2010 | | | 2,090 | |
| | 2011 | | | 224 | |
| | | | |
| | | | 12,663 | |
| Less amount representing interest weighted average rate of 6.57% | | | 1,711 | |
| | | | |
| Present value of minimum capital lease payments | | | 10,952 | |
| Less current portion | | | 3,046 | |
| | | | |
| | | $ | 7,906 | |
| | | | |
F-19
NACG HOLDINGS INC.
Notes to the Consolidated Financial Statements — (Continued)
| |
| (a) | Senior secured credit facility: |
| | | | | | | | | | | | | |
| | | March 31, | | | March 31, | | June 30, |
| | | 2005 | | | 2006 | | 2006 |
| | | | | | | | |
| | | | | | | (Unaudited) |
| Revolving credit facility | | $ | 20,007 | | | $ | — | | | $ | — | |
| Term credit facility | | | 41,250 | | | | — | | | | — | |
| | | | | | | | | | |
| | | $ | 61,257 | | | $ | — | | | $ | — | |
| | | | | | | | | | |
The Company refers to the revolving credit facility and the term loan collectively as the “senior secured credit facility.”
On May 19, 2005, the Company repaid its entire indebtedness under the senior secured credit facility using the net proceeds from the issuance of the 9% senior secured notes (note 11(b)) and the NAEPI Series B redeemable preferred shares (note 13(a)).
| | | | | | | | | | | | | |
| | | March 31, | | | March 31, | | | June 30, | |
| | | 2005 | | | 2006 | | | 2006 | |
| | | | | | | | | | |
| | | | | | | (Unaudited) | |
83/4% senior unsecured notes due 2011 | | $ | 241,920 | | | $ | 233,420 | | | $ | 223,000 | |
| 9% senior secured notes due 2010 | | | — | | | | 70,587 | | | | 67,436 | |
| | | | | | | | | | |
| | | $ | 241,920 | | | $ | 304,007 | | | $ | 290,436 | |
| | | | | | | | | | |
The 83/4% senior notes were issued on November 26, 2003 in the amount of US$200 million (Canadian $263 million) by NAEPI. These notes mature on December 1, 2011 and bear interest at 83/4% payable semi-annually on June 1 and December 1 of each year.
The 83/4% senior notes are unsecured senior obligations and rank equally with all other existing and future unsecured senior debt and senior to any subordinated debt that may be issued by NAEPI or any of its subsidiaries. NACG Holdings Inc. is not a guarantor of this debt. The notes are effectively subordinated to all secured debt to the extent of the value of the assets securing such debt.
The 83/4% senior notes are redeemable at the option of NAEPI, in whole or in part, at any time on or after: December 1, 2007 at 104.375% of the principal amount; December 1, 2008 at 102.188% of the principal amount; December 1, 2009 at 100.00% of the principal amount; plus, in each case, interest accrued to the redemption date. At any time, or from time to time, on or before December 1, 2006 NAEPI may, at its option, use the net cash proceeds of one or more public equity offerings, to redeem up to 35% of the principal amount of the 83/4% senior notes at a redemption price equal to 108.75% of the principal amount of the 83/4% senior notes redeemed plus accrued and unpaid interest, if any, to the date of redemption; provided that: at least 65% of the principal amount of 83/4% senior notes remains outstanding immediately after any such redemption; and NAEPI makes such redemption within 90 days after the closing of any such public equity offering. If a change of control occurs, NAEPI will be required to offer to purchase all or a portion of each holder’s 83/4% senior notes, at a purchase price in cash equal to 101% of the principal amount of the notes offered for repurchase plus accrued interest to the date of purchase.
The 9% senior secured notes were issued on May 19, 2005 in the amount of US$60.481 million (Canadian $76.345 million) by NAEPI. These notes mature on June 1, 2010 and bear interest at 9% payable semi-annually on June 1 and December 1 of each year.
F-20
NACG HOLDINGS INC.
Notes to the Consolidated Financial Statements — (Continued)
The 9% senior secured notes are senior secured obligations and rank equally with all other existing and future secured debt and senior to any subordinated debt that may be issued by NAEPI or any of its subsidiaries. NACG Holdings Inc. is not a guarantor of this debt. The notes are effectively senior to all existing and future unsecured senior debt including the 83/4% senior notes and are effectively subordinated to NAEPI’s swap agreements and new revolving credit facility to the extent of the value of the assets securing such debt.
The 9% senior secured notes are redeemable at the option of NAEPI, in whole or in part, at any time on or after: June 1, 2008 at 104.50% of the principal amount; June 1, 2009 at 102.25% of the principal amount; June 1, 2010 at 100.00% of the principal amount; plus, in each case, interest accrued to the redemption date. At any time, or from time to time, on or before June 1, 2007 NAEPI may, at its option, use the net cash proceeds of one or more public equity offerings, to redeem up to 35% of the principal amount of the 9% senior secured notes at a redemption price equal to 109.0% of the principal amount of the 9% senior secured notes redeemed plus accrued and unpaid interest, if any, to the date of redemption; provided that: at least 65% of the principal amount of 9% senior secured notes remains outstanding immediately after any such redemption; and NAEPI makes such redemption within 90 days after the closing of any such public equity offering. If a change of control occurs, NAEPI will be required to offer to purchase all or a portion of each holder’s 9% senior secured notes, at a purchase price in cash equal to 101% of the principal amount of the notes offered for repurchase plus accrued interest to the date of purchase.
| |
| (c) | Revolving credit facility: |
On May 19, 2005, NAEPI entered into a revolving credit facility with a syndicate of lenders. The revolving facility provided for borrowings of up to $40.0 million, subject to borrowing base limitations, under which revolving loans may have been made and letters of credit, up to a limit of $30.0 million, may have been issued. The facility bore interest at the Canadian prime rate plus 2% per annum or Canadian bankers’ acceptance stamping fee of 3% per annum. The indebtedness under the revolving credit facility was secured by substantially all of NAEPI’s assets and those of its subsidiaries, including accounts receivable, inventory and property, plant and equipment, and a pledge of the NAEPI’s capital stock and that of its subsidiaries. The expiry date of the revolving credit facility was March 1, 2010.
In connection with that revolving credit facility, NAEPI was required to amend its existing swap agreements to increase the effective rate of interest on its 83/4% senior notes from 9.765% to 9.889% (note 18(c)) and issue to one of the counterparties to the swap agreements $1.0 million of NAEPI Series A redeemable preferred shares (note 13(a)).
As of June 30, 2006, NAEPI had no outstanding borrowings under the revolving credit facility and had issued $18.0 million (unaudited) in letters of credit to support bonding requirements and performance guarantees associated with customer contracts and operating leases. NAEPI’s borrowing availability under the facility, after taking into account the borrowing base limitations, was $16.1 million (unaudited) at June 30, 2006.
As of March 31, 2006 the Company had no outstanding borrowings under the revolving credit facility and had issued $18.0 million in letters of credit to support bonding requirements and performance guarantees associated with customer contracts and operating leases. The Company’s borrowing availability under the facility, after taking into account the borrowing base limitations, was $9.3 million at March 31, 2006.
NAEPI entered into an amended and restated credit agreement dated as of July 19, 2006 (note 24).
F-21
NACG HOLDINGS INC.
Notes to the Consolidated Financial Statements — (Continued)
Income tax provision (recovery) differs from the amount that would be computed by applying the Federal and provincial statutory income tax rate to income from continuing operations. The reasons for the differences are as follows:
| | | | | | | | | | | | | | | | | | | | | | | | | | |
| | | Predecessor | | | | | | | | | | | |
| | | Company | | | | | | | | | | | |
| | | | | | Period from | | | | | | | |
| | | Period from | | | November 26, | | | | | | | Three Months Ended | |
| | | April 1, 2003 to | | | 2003 to | | | Year Ended | | | Year Ended | | | | |
| | | November 25, | | | March 31, | | | March 31, | | | March 31, | | | June 30, | | | June 30, | |
| | | 2003 | | | 2004 | | | 2005 | | | 2006 | | | 2005 | | | 2006 | |
| | | | | | | | | | | | | | | | | | | |
| | | | | | | | | | | (Unaudited) | |
| Net loss before income taxes | | $ | (17,763 | ) | | $ | (17,952 | ) | | $ | (44,587 | ) | | $ | (21,204 | ) | | $ | (49,054 | ) | | $ | 18,998 | |
| Statutory tax rate | | | 36.60 | % | | | 35.20 | % | | | 33.62 | % | | | 33.62 | % | | | 33.62 | % | | | 32.12 | % |
| | | | | | | | | | | | | | | | | | | |
| Expected provision (recovery) at statutory tax rate | | $ | (6,501 | ) | | $ | (6,319 | ) | | $ | (14,990 | ) | | $ | (7,129 | ) | | $ | (16,492 | ) | | $ | 6,102 | |
| Increase (decrease) related to: | | | | | | | | | | | | | | | | | | | | | | | | |
| | Change in future income tax liability, resulting from substantially enacted change in future statutory income tax rates | | | (669 | ) | | | (342 | ) | | | — | | | | — | | | | — | | | | 252 | |
| | Change in redemption value and accretion of redeemable preferred shares | | | — | | | | — | | | | — | | | | 11,674 | | | | 14,063 | | | | 304 | |
| | Change in future income tax liability, resulting from valuation allowance | | | — | | | | — | | | | 12,189 | | | | (4,097 | ) | | | 3,802 | | | | (5,858 | ) |
| | Large corporations tax | | | 137 | | | | 319 | | | | 871 | | | | 716 | | | | 150 | | | | (136 | ) |
| | Other | | | 411 | | | | 672 | | | | (334 | ) | | | (427 | ) | | | (1,373 | ) | | | 440 | |
| | | | | | | | | | | | | | | | | | | |
| Income tax provision (recovery) | | $ | (6,622 | ) | | $ | (5,670 | ) | | $ | (2,264 | ) | | $ | 737 | | | $ | 150 | | | $ | 1,104 | |
| | | | | | | | | | | | | | | | | | | |
Due to the elimination of the Canadian Federal Large Corporations Tax, the Company has recorded a current income tax recovery during the three months ended June 30, 2006 of $136 (unaudited) to reverse amounts expensed during the fourth quarter of fiscal 2006.
Future income tax expense for the three months ended June 30, 2006 includes a recovery of $5,858 (unaudited) resulting from the elimination of the valuation allowance. Management considers the scheduled reversals of future income tax liabilities, the character of income tax assets and available tax planning strategies of the Company and its subsidiaries when evaluating the expected realization of future income tax assets. Based on management’s estimate of the expected realization of future income tax assets during the current period, the Company eliminated the valuation allowance recorded against future income tax assets to reflect that it is more likely than not that the future income tax assets will be realized.
F-22
NACG HOLDINGS INC.
Notes to the Consolidated Financial Statements — (Continued)
The income tax effects of temporary differences that give rise to future income tax assets and liabilities are as follows:
| | | | | | | | | | | | | | |
| | | March 31, | | | March 31, | | | June 30, | |
| | | 2005 | | | 2006 | | | 2006 | |
| | | | | | | | | | |
| | | | | | | (Unaudited) | |
| Future income tax assets: | | | | | | | | | | | | |
| | Non-capital losses carried forward | | $ | 30,538 | | | $ | 22,312 | | | $ | 16,241 | |
| | Derivative financial instruments | | | 8,068 | | | | 6,843 | | | | 4,526 | |
| | Unrealized foreign exchange on senior notes | | | — | | | | 2,299 | | | | 2,236 | |
| | Billings in excess of costs on uncompleted contracts | | | — | | | | 1,723 | | | | 2,125 | |
| | Capital lease obligations | | | — | | | | 1,631 | | | | 1,953 | |
| | | | | | | | | | |
| | Total future income tax assets | | | 38,606 | | | | 34,808 | | | | 27,081 | |
| | Less valuation allowance | | | (9,955 | ) | | | (5,858 | ) | | | — | |
| | | | | | | | | | |
| | Net future income tax assets | | | 28,651 | | | | 28,950 | | | | 27,081 | |
| | | | | | | | | | |
| Future income tax liabilities: | | | | | | | | | | | | |
| | Unbilled revenue and uncertified revenue included in accounts receivable | | | 10,972 | | | | 1,970 | | | | 2,215 | |
| | Accounts receivable – holdbacks | | | 4,194 | | | | 3,613 | | | | 2,667 | |
| | Property, plant and equipment | | | 12,432 | | | | 20,263 | | | | 19,719 | |
| | Deferred financing costs | | | 548 | | | | 1,038 | | | | 1,037 | |
| | Intangible assets | | | 505 | | | | 130 | | | | 95 | |
| | Unrealized foreign exchange on senior notes | | | — | | | | 1,936 | | | | 2,584 | |
| | | | | | | | | | |
| | Total future income tax liabilities | | | 28,651 | | | | 28,950 | | | | 28,317 | |
| | | | | | | | | | |
| Net future income taxes | | $ | — | | | $ | — | | | $ | (1,236 | ) |
| | | | | | | | | | |
Classified as:
| | | | | | | | | | | | | |
| | | March 31, | | | March 31, | | | June 30, | |
| | | 2005 | | | 2006 | | | 2006 | |
| | | | | | | | | | |
| | | | | | | (Unaudited) | |
| Current asset | | $ | 15,100 | | | $ | 5,583 | | | $ | 10,291 | |
| Long-term asset | | | 13,485 | | | | 23,367 | | | | 16,790 | |
| Current liability | | | (15,100 | ) | | | (5,583 | ) | | | (4,882 | ) |
| Long-term liability | | | (13,485 | ) | | | (23,367 | ) | | | (23,435 | ) |
| | | | | | | | | | |
| | | $ | — | | | $ | — | | | $ | (1,236 | ) |
| | | | | | | | | | |
At March 31, 2006, the Company has non-capital losses for income tax purposes of approximately $50,898 which expire as follows:
F-23
NACG HOLDINGS INC.
Notes to the Consolidated Financial Statements — (Continued)
| |
| (a) | Redeemable preferred shares: |
| | | | | | | | | | | | | |
| | | March 31, | | | March 31, | | | June 30, | |
| | | 2005 | | | 2006 | | | 2006 | |
| | | | | | | | | | |
| | | | | | | (Unaudited) | |
| NACG Preferred Corp. Series A redeemable preferred shares(i) | | $ | 35,000 | | | $ | 35,000 | | | $ | 35,000 | |
| NAEPI Series A preferred shares (ii) | | | — | | | | 375 | | | | 391 | |
| NAEPI Series B preferred shares (iii) | | | — | | | | 42,193 | | | | 43,122 | |
| | | | | | | | | | |
| | | $ | 35,000 | | | $ | 77,568 | | | $ | 78,513 | |
| | | | | | | | | | |
| |
| i. | NACG Preferred Corp. preferred shares |
Issued:
| | | | | | | | | |
| | | Number of | | | |
| | | Shares | | | Amount | |
| | | | | | | |
| Outstanding at November 26, 2003 | | | — | | | $ | — | |
| Issued | | | 35,000 | | | | 35,000 | |
| Redeemed | | | — | | | | — | |
| | | | | | | |
| Outstanding at March 31, 2004 | | | 35,000 | | | $ | 35,000 | |
| Issued | | | — | | | | — | |
| Redeemed | | | — | | | | — | |
| | | | | | | |
| Outstanding at March 31, 2005 | | | 35,000 | | | $ | 35,000 | |
| Issued | | | — | | | | — | |
| Redeemed | | | — | | | | — | |
| | | | | | | |
| Outstanding at March 31, 2006 | | | 35,000 | | | $ | 35,000 | |
| Issued (unaudited) | | | — | | | | — | |
| Redeemed (unaudited) | | | — | | | | — | |
| | | | | | | |
| Outstanding at June 30, 2006 (unaudited) | | | 35,000 | | | $ | 35,000 | |
| | | | | | | |
NACG Preferred Corp. is authorized to issue an unlimited number of Series A preferred shares. The NACG Preferred Corp. Series A preferred shares accrue dividends at a rate of $80.00 per share annually if earnings before interest, taxes, depreciation and amortization (“EBITDA”) for NAEPI is in excess of $75.0 million for the year. The dividends are payable in cash, additional NACG Preferred Corp. Series A preferred shares, or any combination of cash and shares as determined by the Company. The number of shares issuable is .001 of a whole NACG Preferred Corp. Series A preferred share for each $1.00 of dividend declared.
The NACG Preferred Corp. Series A preferred shares, which were issued in connection with the acquisition described in note 3 and were recorded at their guaranteed redemption amount, are redeemable at any time at the option of the Company, and are required to be redeemed on or before November 26, 2012. The redemption price is $1,000.00 per share plus all accrued and unpaid dividends.
In the event of a change in control, each holder of NACG Preferred Corp. Series A preferred shares has the right to require the Company to redeem all or any part of such holder’s shares.
F-24
NACG HOLDINGS INC.
Notes to the Consolidated Financial Statements — (Continued)
| |
| ii. | NAEPI Series A preferred shares |
Issued:
| | | | | | | | | |
| | | Number of | | | |
| | | Shares | | | Amount | |
| | | | | | | |
| Outstanding at November 26, 2003 | | | — | | | $ | — | |
| Issued | | | — | | | | — | |
| Redeemed | | | — | | | | — | |
| | | | | | | |
| Outstanding at March 31, 2004 | | | — | | | | — | |
| Issued | | | — | | | | — | |
| Redeemed | | | — | | | | — | |
| | | | | | | |
| Outstanding at March 31, 2005 | | | — | | | | — | |
| Issued | | | 1,000 | | | | 321 | |
| Accretion | | | — | | | | 54 | |
| | | | | | | |
| Outstanding at March 31, 2006 | | | 1,000 | | | $ | 375 | |
| Issued (unaudited) | | | — | | | | — | |
| Accretion (unaudited) | | | — | | | | 16 | |
| | | | | | | |
| Outstanding at June 30, 2006 (unaudited) | | | 1,000 | | | $ | 391 | |
| | | | | | | |
NAEPI is authorized to issue an unlimited number of Series A preferred shares. The NAEPI Series A preferred shares are non-voting and are not entitled to any dividends. The NAEPI Series A preferred shares are mandatorily redeemable at $1,000 per share on the earlier of (1) December 31, 2011 and (2) an Accelerated Redemption Event, specifically (i) the occurrence of a change of control, or (ii) if there is an initial public offering of common shares, the later of (a) the consummation of the initial public offering or (b) the date on which all of the Company’s 83/4% senior notes and the Company’s 9% senior secured notes are no longer outstanding. NAEPI may redeem the NAEPI Series A preferred shares, in whole or in part, at $1,000 per share at any time.
The NAEPI Series A preferred shares were issued to one of the counterparties to NAEPI’s swap agreements on May 19, 2005 in connection with the amendment of NAEPI’s revolving credit facility. These shares are not entitled to accrue or receive dividends and are required to be redeemed on or before December 31, 2011 for $1.0 million.
The NAEPI Series A preferred shares were initially recorded at their fair value on the date of issuance, which was estimated to be $321 based on the present value of the required cash flows using the rate implicit at inception. Each reporting period, the accretion of the carrying value to the present value of the redemption amount at the balance sheet date is recorded as interest expense. For the three months ended June 30, 2006, the Company recognized $16 of accretion as interest expense (unaudited) (three months ended June 30, 2005 – $nil (unaudited); year ended March 31, 2006 – $54; year ended March 31, 2005 – $nil; November 26, 2003 to March 31, 2004 – $nil; April 1, 2003 to November 25, 2005 – $nil).
F-25
NACG HOLDINGS INC.
Notes to the Consolidated Financial Statements — (Continued)
| |
| iii. | NAEPI Series B preferred shares |
Issued:
| | | | | | | | | |
| | | Number of | | | |
| | | Shares | | | Amount | |
| | | | | | | |
| Outstanding at November 26, 2003 | | | — | | | $ | — | |
| Issued | | | — | | | | — | |
| Redeemed | | | — | | | | — | |
| | | | | | | |
| Outstanding at March 31, 2004 | | | — | | | | — | |
| Issued | | | — | | | | — | |
| Redeemed | | | — | | | | — | |
| | | | | | | |
| Outstanding at March 31, 2005 | | | — | | | $ | — | |
| Issued | | | 83,462 | | | | 8,376 | |
| Repurchased | | | (8,218 | ) | | | (851 | ) |
| Change in redemption amount | | | — | | | | 34,668 | |
| | | | | | | |
| Outstanding at March 31, 2006 | | | 75,244 | | | $ | 42,193 | |
| | | | | | | |
| Issued (unaudited) | | | — | | | | — | |
| Repurchased (unaudited) | | | — | | | | — | |
| Change in redemption amount (unaudited) | | | — | | | | — | |
| Accretion (unaudited) | | | — | | | | 929 | |
| | | | | | | |
| Outstanding at June 30, 2006 (unaudited) | | | 75,244 | | | $ | 43,122 | |
| | | | | | | |
NAEPI is authorized to issue an unlimited number of Series B preferred shares. The NAEPI Series B preferred shares are non-voting and are entitled to cumulative dividends at an annual rate of 15% of the issue price of each share. No dividends are payable on NAEPI common shares or other classes of preferred shares (defined as Junior Shares) unless all cumulative dividends have been paid on the NAEPI Series B preferred shares and NAEPI declares a NAEPI Series B preferred share dividend equal to 25% of the Junior Share dividend (except for dividends paid as part of employee and officer arrangements, intercompany administrative charges of up to $1 million annually and tax sharing arrangements). As long as any NAEPI Series A preferred shares remain outstanding and subject to the restrictions contained within the 83/4% senior notes and the 9% senior secured notes, dividends shall not be paid (but shall otherwise accrue) on the NAEPI Series B preferred shares. Subject to the prior redemption of the NAEPI Series A preferred shares, the NAEPI Series B preferred shares are mandatorily redeemable on the earlier of (1) December 31, 2011 and (2) an Accelerated Redemption Event, specifically (i) a change of control or (ii) if there is an initial public offering of common shares, the later of (a) the consummation of the initial public offering or (b) the date on which all of the Company’s 83/4% senior unsecured notes and the Company’s 9% senior secured notes are no longer outstanding. Subject to the restrictive covenants contained within the indenture agreement for the 9% senior secured notes, the indenture agreement for the 83/4% senior notes and the revolving credit facility agreement, NAEPI may redeem the NAEPI Series B preferred shares, in whole or in part, at any time.
The payment of dividends and the redemption of the NAEPI Series B preferred shares are prohibited by NAEPI’s revolving credit facility agreement. The payment of dividends and the redemption of the NAEPI Series B preferred shares is also restricted by the indenture agreements governing NAEPI’s 9% senior secured notes and 83/4% senior notes. Cumulative undeclared dividends on the NAEPI Series B preferred shares amounted to $1,263 at June 30, 2006 (unaudited).
F-26
NACG HOLDINGS INC.
Notes to the Consolidated Financial Statements — (Continued)
The NAEPI Series B preferred shares were issued to existing non-employee shareholders of the Company for cash proceeds of $7.5 million on May 19, 2005. The NAEPI Series B preferred shares were initially issued to certain non-employee shareholders with the agreement that an offer to purchase these NAEPI Series B preferred shares would also be extended to other existing shareholders of the Company on a pro rata basis to their interest in the common shares of the Company. On August 31, 2005, NAEPI issued 8,218 NAEPI Series B preferred shares for consideration of $851 to certain shareholders of the Company as a result of this offering. On November 1, 2005, NAEPI repurchased and cancelled 8,218 of the NAEPI Series B preferred shares held by the original non-employee shareholders for cash consideration of $851.
On June 15, 2005, the NAEPI Series B preferred shares were split 10-for-1.
Subsequent to initial issuance, an additional 244 NAEPI Series B preferred shares were issued for cash consideration of $24.
Initially, the redemption price of the NAEPI Series B preferred shares was an amount equal to the greatest of (i) two times the issue price, less the amount, if any, of dividends previously paid in cash on the NAEPI Series B preferred shares; (ii) an amount, not to exceed $100 million which, after taking into account any dividends previously paid in cash on such NAEPI Series B preferred shares, provides the holder with a 40% rate of return, compounded annually, on the issue price from the date of issuance; and (iii) an amount, not to exceed $100 million, which is equal to 25% of the arm’s length fair market value of NAEPI’s common shares without taking into account the NAEPI Series B preferred shares.
On March 30, 2006, the terms of the NAEPI Series B preferred shares were amended to eliminate option (iii) from the calculation of the redemption price of the shares.
Prior to the amendment to the terms of the NAEPI Series B preferred shares on March 30, 2006, the NAEPI Series B preferred shares were considered mandatorily redeemable and the Company was required to measure the NAEPI Series B preferred shares at the amount of cash that would be paid under the conditions specified in the contract if settlement occurred at each reporting date prior to the amendment. At March 30, 2006, management estimated the redemption amount to be $42,193. As a result, the Company has recognized the increase in the carrying value of $34,668 as an increase in interest expense for the year ended March 31, 2006.
Concurrent with the amendment to the NAEPI Series B preferred shares, the Company entered into a Put/ Call Agreement with the holders of the NAEPI Series B preferred shares. The Put/ Call Agreement grants to each holder of the NAEPI Series B preferred shares the right (the “Put/ Call Right”) to require the Company to exchange each of the holder’s NAEPI Series B preferred shares for five common shares of the Company. The Put/ Call Right may only be exercised upon delivery by the Company of an “Event Notice”, being either: (i) a redemption or purchase call for the redemption or purchase of the NAEPI Series B preferred shares in connection with (A) a redemption on December 31, 2011, or (B) an Accelerated Redemption Event; or (ii) a notice in connection with a Liquidation Event (defined as a liquidation, winding-up or dissolution of NAEPI, whether voluntary or involuntary).
The Put/ Call Agreement also grants the Company the right to require the holders of the NAEPI Series B preferred shares to exchange each of their NAEPI Series B preferred shares for 5 common shares in the capital of the Company upon delivery of a call notice to shareholders within five business days of an Event Notice.
As a result of the March 30, 2006 amendment to the terms of the NAEPI Series B preferred shares, and the concurrent execution of the Put/ Call Agreement, the Company has accounted for the amendment as a related party transaction at carrying amount. No value was ascribed to the equity classified Put/Call Right as it was a related party transaction. The NAEPI Series B preferred shares will now be accreted
F-27
NACG HOLDINGS INC.
Notes to the Consolidated Financial Statements — (Continued)
from their carrying value of $42.2 million on the date of amendment to their redemption value of $69.6 million on December 31, 2011 through a charge to interest expense using the effective interest method over the period until December 31, 2011. For the three months ended June 30, 2006, the Company recognized $929 of accretion as interest expense (unaudited).
Authorized:
Unlimited number of common voting shares
Unlimited number of common non-voting shares
Issued:
| | | | | | | | | |
| | | Number of | | | |
| | | Shares | | | Amount | |
| | | | | | | |
Common voting shares | | | | | | | | |
| Outstanding at November 26, 2003 | | | — | | | $ | — | |
| Issued | | | 904,380 | | | | 90,438 | |
| Redeemed | | | — | | | | — | |
| | | | | | | |
| Outstanding at March 31, 2004 | | | 904,380 | | | | 90,438 | |
| Issued | | | 3,000 | | | | 300 | |
| Redeemed | | | — | | | | — | |
| | | | | | | |
| Outstanding at March 31, 2005 | | | 907,380 | | | | 90,738 | |
| Issued | | | 3,000 | | | | 300 | |
| Redeemed | | | — | | | | — | |
| | | | | | | |
| Outstanding at March 31, 2006 | | | 910,380 | | | $ | 91,038 | |
| Issued (unaudited) | | | — | | | | — | |
| Redeemed (unaudited) | | | — | | | | — | |
| | | | | | | |
| Outstanding at June 30, 2006 (unaudited) | | | 910,380 | | | $ | 91,038 | |
| | | | | | | |
Common non-voting shares | | | | | | | | |
| Outstanding at November 26, 2003 | | | — | | | $ | — | |
| Issued | | | 20,620 | | | | 2,062 | |
| Redeemed | | | — | | | | — | |
| | | | | | | |
| Outstanding at March 31, 2004 | | | 20,620 | | | | 2,062 | |
| Issued | | | — | | | | — | |
| Redeemed | | | — | | | | — | |
| | | | | | | |
| Outstanding at March 31, 2005 | | | 20,620 | | | | 2,062 | |
| Issued | | | — | | | | — | |
| Redeemed | | | — | | | | — | |
| | | | | | | |
| Outstanding at March 31, 2006 | | | 20,620 | | | $ | 2,062 | |
| Issued (unaudited) | | | — | | | | — | |
| Redeemed (unaudited) | | | — | | | | — | |
| | | | | | | |
| Outstanding at June 30, 2006 (unaudited) | | | 20,620 | | | $ | 2,062 | |
| | | | | | | |
Total common shares (unaudited) | | | 931,000 | | | $ | 93,100 | |
| | | | | | | |
F-28
NACG HOLDINGS INC.
Notes to the Consolidated Financial Statements — (Continued)
During the period from November 26, 2003 to March 31, 2004, 904,380 common voting shares and 20,620 common non-voting shares were issued for cash consideration of $92.5 million. During the year ended March 31, 2005, 3,000 common voting shares were issued for cash consideration of $300 to certain Directors of the Company. During the year ended March 31, 2006, 3,000 common voting shares were issued for cash consideration of $300 to certain Directors of the Company.
| | | | | |
| Balance, November 26, 2003 | | $ | — | |
| Stock-based compensation (note 21) | | | 137 | |
| | | | |
| Balance, March 31, 2004 | | | 137 | |
| Stock-based compensation (note 21) | | | 497 | |
| | | | |
| Balance, March 31, 2005 | | | 634 | |
| Stock-based compensation (note 21) | | | 923 | |
| | | | |
| Balance, March 31, 2006 | | $ | 1,557 | |
| Stock-based compensation (note 21) (unaudited) | | | 312 | |
| | | | |
| Balance, June 30, 2006 (unaudited) | | $ | 1,869 | |
| | | | |
| |
| (d) | Net income (loss) per share: |
Basic net income (loss) per share is computed on the basis of the weighted average number of common shares outstanding. Diluted net income (loss) per share is computed on the basis of the weighted average number of common shares outstanding plus the effect of outstanding stock options using the treasury stock method and the dilutive effect of convertible securities using the if-converted method. For the three months ended June 30, 2005 (unaudited), the years ending March 31, 2006 and March 31, 2005, and the period from November 26, 2003 to March 31, 2004, the effect of outstanding stock options and convertible securities on net loss per share was anti-dilutive as the Company was in a loss position. As such, the effect of outstanding stock options and convertible securities used to calculate the diluted net loss per share has not been disclosed.
F-29
NACG HOLDINGS INC.
Notes to the Consolidated Financial Statements — (Continued)
| | | | | | | | | | | | | | | | | | | | | | |
| | | Period from | | | | | | | | | |
| | | November 26, | | | | | | | Three Months | | | Three Months | |
| | | 2003 to | | | Year ended | | | Year ended | | | Ended | | | Ended | |
| | | March 31, | | | March 31, | | | March 31, | | | June 30, | | | June 30, | |
| | | 2004 | | | 2005 | | | 2006 | | | 2005 | | | 2006 | |
| | | | | | | | | | | | | | | | |
| | | | | | | | | (Unaudited) | |
Basic net income (loss) per share | | | | | | | | | | | | | | | | | | | | |
| Net loss | | $ | (12,282 | ) | | $ | (42,323 | ) | | $ | (21,941 | ) | | $ | (49,204 | ) | | $ | 17,894 | |
| Weighted average number of common shares outstanding | | | 925,000 | | | | 926,986 | | | | 928,740 | | | | 928,000 | | | | 931,000 | |
| | | | | | | | | | | | | | | | |
| Net loss per common share — basic and diluted | | $ | (13.28 | ) | | $ | (45.66 | ) | | $ | (23.62 | ) | | $ | (53.02 | ) | | $ | 19.22 | |
| | | | | | | | | | | | | | | | |
Diluted net income (loss) per share | | | | | | | | | | | | | | | | | | | | |
| Net income (loss) available to common shareholders | | $ | (12,282 | ) | | $ | (42,323 | ) | | $ | (21,941 | ) | | $ | (49,204 | ) | | $ | 17,894 | |
| Dilutive effect of NAEPI Series B preferred shares | | | — | | | | — | | | | — | | | | — | | | | 630 | |
| | | | | | | | | | | | | | | | |
| Net income (loss), assuming dilution | | $ | (12,282 | ) | | $ | (42,323 | ) | | $ | (21,941 | ) | | $ | (49,204 | ) | | $ | 18,524 | |
| Weighted average number of common shares outstanding | | | 925,000 | | | | 926,986 | | | | 928,740 | | | | 928,000 | | | | 931,000 | |
| | | | | | | | | | | | | | | | |
| | Dilutive effect of: | | | | | | | | | | | | | | | | | | | | |
| NAEPI Series B preferred shares | | | — | | | | — | | | | — | | | | — | | | | 376,220 | |
| Stock options | | | — | | | | — | | | | — | | | | — | | | | 560 | |
| | | | | | | | | | | | | | | | |
| Weighted average number of diluted common shares outstanding | | | 925,000 | | | | 926,986 | | | | 928,740 | | | | 928,000 | | | | 1,307,780 | |
| | | | | | | | | | | | | | | | |
| Diluted net income (loss) per common share | | $ | (13.28 | ) | | $ | (45.66 | ) | | $ | (23.62 | ) | | $ | (53.02 | ) | | $ | 14.16 | |
| | | | | | | | | | | | | | | | |
F-30
NACG HOLDINGS INC.
Notes to the Consolidated Financial Statements — (Continued)
| | | | | | | | | | | | | | | | | | | | | | | | | |
| | | Predecessor | | | | | | | | | | | |
| | | Company | | | | | | | | | | | |
| | | | | | | | | | | | |
| | | | | Period from | | | | | | | Three Months | |
| | | Period from | | | November 26, | | | | | | | Ended | |
| | | April 1, 2003 to | | | 2003 to | | | Year Ended | | | Year Ended | | | | |
| | | November 25, | | | March 31, | | | March 31, | | | March 31, | | | June 30, | | | June 30, | |
| | | 2003 | | | 2004 | | | 2005 | | | 2006 | | | 2005 | | | 2006 | |
| | | | | | | | | | | | | | | | | | | |
| | | | | | | | | | | (Unaudited) | |
| Interest on senior notes | | $ | — | | | $ | 8,096 | | | $ | 23,189 | | | $ | 28,838 | | | $ | 6,535 | | | $ | 7,346 | |
| Interest on senior secured credit facility | | | 599 | | | | 1,089 | | | | 3,274 | | | | 564 | | | | 564 | | | | — | |
| Interest on capital lease obligations | | | 294 | | | | 56 | | | | 230 | | | | 457 | | | | 89 | | | | 154 | |
| Interest on NACG Preferred Corp. Series A preferred shares | | | — | | | | — | | | | — | | | | — | | | | — | | | | 700 | |
| Change in redemption value of Series B preferred shares | | | — | | | | — | | | | — | | | | 34,668 | | | | 41,498 | | | | 929 | |
| Accretion of Series A preferred shares | | | — | | | | — | | | | — | | | | 54 | | | | 9 | | | | 16 | |
| Interest on advances from Norama Inc. | | | 1,468 | | | | — | | | | — | | | | — | | | | — | | | | — | |
| | | | | | | | | | | | | | | | | | | |
| Interest on long-term debt | | | 2,361 | | | | 9,241 | | | | 26,693 | | | | 64,581 | | | | 48,695 | | | | 9,145 | |
| Amortization of deferred financing costs | | | — | | | | 814 | | | | 2,554 | | | | 3,338 | | | | 672 | | | | 887 | |
| Other interest | | | 96 | | | | 24 | | | | 1,894 | | | | 857 | | | | 496 | | | | 136 | |
| | | | | | | | | | | | | | | | | | | |
| | | $ | 2,457 | | | $ | 10,079 | | | $ | 31,141 | | | $ | 68,776 | | | $ | 49,863 | | | $ | 10,168 | |
| | | | | | | | | | | | | | | | | | | |
| |
| (a) | Supplemental cash flow information: |
| | | | | | | | | | | | | | | | | | | | | | | | | | |
| | | Predecessor | | | | | | | | | | | |
| | | Company | | | | | | | | | | | |
| | | | | | | | | | | | |
| | | | | Period from | | | | | | | Three Months | |
| | | Period from | | | November 26, | | | | | | | Ended | |
| | | April 1, 2003 to | | | 2003 to | | | Year Ended | | | Year Ended | | | | |
| | | November 25, | | | March 31, | | | March 31, | | | March 31, | | | June 30, | | | June 30, | |
| | | 2003 | | | 2004 | | | 2005 | | | 2006 | | | 2005 | | | 2006 | |
| | | | | | | | | | | | | | | | | | | |
| | | | | | | | | | | (Unaudited) | |
| Cash paid during the period for: | | | | | | | | | | | | | | | | | | | | | | | | |
| | Interest | | $ | 2,431 | | | $ | 1,736 | | | $ | 31,398 | | | $ | 28,978 | | | $ | 14,671 | | | $ | 15,844 | |
| | Income taxes | | | 325 | | | | 269 | | | | 3,588 | | | | 617 | | | | 163 | | | | 190 | |
| Cash received during the period for: | | | | | | | | | | | | | | | | | | | | | | | | |
| | Interest | | | 100 | | | | 177 | | | | 362 | | | | 530 | | | | 108 | | | | 486 | |
| | Income taxes | | | — | | | | 18 | | | | — | | | | 2 | | | | — | | | | — | |
| Non-cash transactions: | | | | | | | | | | | | | | | | | | | | | | | | |
| | Acquisition of plant and equipment by means of capital leases | | | — | | | | 1,195 | | | | 5,385 | | | | 5,910 | | | | 981 | | | | 1,758 | |
| | Issuance of Series A preferred shares | | | — | | | | — | | | | — | | | | 321 | | | | 321 | | | | — | |
F-31
NACG HOLDINGS INC.
Notes to the Consolidated Financial Statements — (Continued)
| |
| (b) | Net change in non-cash working capital: |
| | | | | | | | | | | | | | | | | | | | | | | | | | |
| | | Predecessor | | | | | | | | | | | |
| | | Company | | | | | | | | | | | |
| | | | | | Period from | | | | | | | |
| | | Period from | | | November 26, | | | | | | | Three Months Ended | |
| | | April 1, 2003 to | | | 2003 to | | | Year Ended | | | Year Ended | | | | |
| | | November 25, | | | March 31, | | | March 31, | | | March 31, | | | June 30, | | | June 30, | |
| | | 2003 | | | 2004 | | | 2005 | | | 2006 | | | 2005 | | | 2006 | |
| | | | | | | | | | | | | | | | | | | |
| | | | | | | | | | | (Unaudited) | |
| Operating activities: | | | | | | | | | | | | | | | | | | | | | | | | |
| | Accounts receivable | | $ | 3,338 | | | $ | 19,556 | | | $ | (24,029 | ) | | $ | (9,396 | ) | | $ | 3,463 | | | $ | (9,067 | ) |
| | Unbilled revenue | | | 15,289 | | | | (17,528 | ) | | | (13,735 | ) | | | (2,083 | ) | | | (6,740 | ) | | | 5,375 | |
| | Inventory | | | — | | | | (1,609 | ) | | | 1,475 | | | | 77 | | | | 26 | | | | 44 | |
| | Prepaid expenses | | | (544 | ) | | | (295 | ) | | | (590 | ) | | | 66 | | | | (957 | ) | | | (2,002 | ) |
| | Accounts payable | | | (2,794 | ) | | | (2,839 | ) | | | 29,789 | | | | (6,209 | ) | | | (5,031 | ) | | | (508 | ) |
| | Accrued liabilities | | | (1,457 | ) | | | 6,172 | | | | 507 | | | | 9,215 | | | | (8,194 | ) | | | (2,810 | ) |
| | Billings in excess of costs incurred and estimated earnings on uncompleted contracts | | | — | | | | — | | | | 1,325 | | | | 3,799 | | | | (847 | ) | | | 1,492 | |
| | | | | | | | | | | | | | | | | | | |
| | | $ | 13,832 | | | $ | 3,457 | | | $ | (5,258 | ) | | $ | (4,531 | ) | | $ | (18,280 | ) | | $ | (7,476 | ) |
| | | | | | | | | | | | | | | | | | | |
| Investing activities: | | | | | | | | | | | | | | | | | | | | | | | | |
| | Accounts payable | | $ | — | | | $ | — | | | $ | — | | | $ | 1,204 | | | $ | 1,398 | | | $ | (74 | ) |
| | Accrued liabilities | | | — | | | | — | | | | — | | | | 187 | | | | 952 | | | | (130 | ) |
| | | | | | | | | | | | | | | | | | | |
| | | $ | — | | | $ | — | | | $ | — | | | $ | 1,391 | | | $ | 2,350 | | | $ | (204 | ) |
| | | | | | | | | | | | | | | | | | | |
| |
| (c) | Investment in joint venture: |
The Company has determined that the joint venture in which it participates is a variable interest entity as defined byAcG-15 and that the Company is the primary beneficiary. Accordingly, the joint venture has been consolidated on a prospective basis effective January 1, 2005. During the fourth quarter of 2005, the arrangement of this joint venture was amended such that the Company is responsible for all of its activities and revenues. As a result, no minority interest has been recorded.
The Company’s transactions with the joint venture eliminate on consolidation.
Details of the Company’s proportionate share of the results of operations and cash flows of the joint venture, prior to its consolidation, that are included in the consolidated financial statements are as follows:
| | | | | | | | | | | | | |
| | | Predecessor | | | | | |
| | | Company | | | | | |
| | | | | | Period from | | | |
| | | Period from | | | November 26, | | | Nine Months | |
| | | April 1, 2003 to | | | 2003 to | | | Ended | |
| | | November 25, | | | March 31, | | | December 31, | |
| | | 2003 | | | 2004 | | | 2004 | |
| | | | | | | | | | |
| Revenue | | $ | 340 | | | $ | 4 | | | $ | 7,631 | |
| Project costs | | | (308 | ) | | | 21 | | | | (8,840 | ) |
| General and administrative | | | (5 | ) | | | (37 | ) | | | — | |
| | | | | | | | | | |
| Net income (loss) | | $ | 27 | | | $ | (12 | ) | | $ | (1,209 | ) |
| | | | | | | | | | |
F-32
NACG HOLDINGS INC.
Notes to the Consolidated Financial Statements — (Continued)
| | | | | | | | | | | | | | |
| | | Predecessor | | | | | |
| | | Company | | | | | |
| | | | | | Period from | | | |
| | | Period from | | | November 26, | | | Nine Months | |
| | | April 1, 2003 to | | | 2003 to | | | Ended | |
| | | November 25, | | | March 31, | | | December 31, | |
| | | 2003 | | | 2004 | | | 2004 | |
| | | | | | | | | | |
| Cash provided by: | | | | | | | | | | | | |
| | Operating activities | | $ | (49 | ) | | $ | 61 | | | $ | (4,668 | ) |
| | Investing activities | | | — | | | | — | | | | — | |
| | Financing activities | | | 49 | | | | (59 | ) | | | 5,061 | |
| | | | | | | | | | |
| | | $ | — | | | $ | (2 | ) | | $ | 393 | |
| | | | | | | | | | |
The Company conducts business in three business segments: Mining and Site Preparation, Piling and Pipeline.
| | |
| | • | Mining and Site Preparation: |
| |
| | The Mining and Site Preparation segment provides mining and site preparation services, including overburden removal and reclamation services, project management and underground utility construction, to a variety of customers throughout Western Canada. |
| |
| | The Piling segment provides deep foundation construction and design build services to a variety of industrial and commercial customers throughout Western Canada. |
| |
| | The Pipeline segment provides both small and large diameter pipeline construction and installation services to energy and industrial clients throughout Western Canada. |
| |
| (b) | Results by business segment: |
| | | | | | | | | | | | | | | | | |
| | | Mining and Site | | | | | | | |
| For the three months ended June 30, 2006 | | Preparation | | | Piling | | | Pipeline | | | Total | |
| | | | | | | | | | | | | |
| | | (Unaudited) | |
| Revenues from external customers | | $ | 111,387 | | | $ | 23,276 | | | $ | 3,437 | | | $ | 138,100 | |
| Depreciation of plant and equipment | | | 4,947 | | | | 648 | | | | 132 | | | | 5,727 | |
| Segment profits | | | 24,127 | | | | 7,976 | | | | 659 | | | | 32,762 | |
| Segment assets | | | 338,280 | | | | 82,632 | | | | 40,541 | | | | 461,453 | |
| Expenditures for segment plant and equipment | | | 6,984 | | | | 1,330 | | | | — | | | | 8,314 | |
| | | | | | | | | | | | | | | | | |
| | | Mining and Site | | | | | | | |
| For the three months ended June 30, 2005 | | Preparation | | | Piling | | | Pipeline | | | Total | |
| | | | | | | | | | | | | |
| | | (Unaudited) | |
| Revenues from external customers | | $ | 82,637 | | | $ | 20,030 | | | $ | 1,692 | | | $ | 104,359 | |
| Depreciation of plant and equipment | | | 2,347 | | | | 432 | | | | 87 | | | | 2,866 | |
| Segment profits | | | 11,689 | | | | 2,838 | | | | 309 | | | | 14,836 | |
| Segment assets | | | 321,492 | | | | 83,293 | | | | 39,606 | | | | 444,391 | |
| Expenditures for segment plant and equipment | | | 3,115 | | | | 192 | | | | — | | | | 3,307 | |
F-33
NACG HOLDINGS INC.
Notes to the Consolidated Financial Statements — (Continued)
| | | | | | | | | | | | | | | | | |
| | | Mining and Site | | | | | | | |
| For the Year Ended March 31, 2006 | | Preparation | | | Piling | | | Pipeline | | | Total | |
| | | | | | | | | | | | | |
| Revenues from external customers | | $ | 366,721 | | | $ | 91,434 | | | $ | 34,082 | | | $ | 492,237 | |
| Depreciation of plant and equipment | | | 10,118 | | | | 2,543 | | | | 1,352 | | | | 14,013 | |
| Segment profits | | | 50,730 | | | | 22,586 | | | | 8,996 | | | | 82,312 | |
| Segment assets | | | 327,850 | | | | 84,117 | | | | 48,804 | | | | 460,771 | |
| Expenditures for segment plant and equipment | | | 25,090 | | | | 880 | | | | 82 | | | | 26,052 | |
| | | | | | | | | | | | | | | | | |
| | | Mining and Site | | | | | | | |
| For the Year Ended March 31, 2005 | | Preparation | | | Piling | | | Pipeline | | | Total | |
| | | | | | | | | | | | | |
| Revenues from external customers | | $ | 264,835 | | | $ | 61,006 | | | $ | 31,482 | | | $ | 357,323 | |
| Depreciation of plant and equipment | | | 10,308 | | | | 2,335 | | | | 218 | | | | 12,861 | |
| Segment profits | | | 11,617 | | | | 13,319 | | | | 4,902 | | | | 29,838 | |
| Segment assets | | | 315,740 | | | | 74,975 | | | | 48,635 | | | | 439,350 | |
| Expenditures for segment plant and equipment | | | 16,888 | | | | 202 | | | | 774 | | | | 17,864 | |
| | | | | | | | | | | | | | | | | |
| | | Mining and Site | | | | | | | |
| For the Period from November 26, 2003 to March 31, 2004 | | Preparation | | | Piling | | | Pipeline | | | Total | |
| | | | | | | | | | | | | |
| Revenues from external customers | | $ | 53,404 | | | $ | 9,565 | | | $ | 64,642 | | | $ | 127,611 | |
| Depreciation of plant and equipment | | | 3,116 | | | | 465 | | | | 383 | | | | 3,964 | |
| Segment profits | | | 8,154 | | | | 2,501 | | | | 12,892 | | | | 23,547 | |
| Segment assets | | | 264,822 | | | | 76,896 | | | | 68,751 | | | | 410,469 | |
| Expenditures for segment plant and equipment | | | 61 | | | | 30 | | | | 1,671 | | | | 1,762 | |
| | | | | | | | | | | | | | | | | |
| Predecessor Company | | | | | | | | |
| | | Mining and Site | | | | | | | |
| For the Period from April 1, 2003 to November 25, 2003 | | Preparation | | | Piling | | | Pipeline | | | Total | |
| | | | | | | | | | | | | |
| Revenues from external customers | | $ | 182,368 | | | $ | 39,417 | | | $ | 28,867 | | | $ | 250,652 | |
| Depreciation of plant and equipment | | | 3,590 | | | | 1,256 | | | | 158 | | | | 5,004 | |
| Segment profits | | | 17,745 | | | | 8,330 | | | | 5,054 | | | | 31,129 | |
| Segment assets | | | 77,906 | | | | 31,792 | | | | 15,904 | | | | 125,602 | |
| Expenditures for segment plant and equipment | | | 2,591 | | | | 417 | | | | — | | | | 3,008 | |
F-34
NACG HOLDINGS INC.
Notes to the Consolidated Financial Statements — (Continued)
| |
| i. | Income (loss) before income taxes: |
| | | | | | | | | | | | | | | | | | | | | | | | | |
| | | Predecessor | | | | | | | | | | | |
| | | Company | | | | | | | | | | | |
| | | | | | Period from | | | | | | | |
| | | Period from | | | November 26, | | | | | | | Three Months Ended | |
| | | April 1, 2003 to | | | 2003 to | | | Year Ended | | | Year Ended | | | | |
| | | November 25, | | | March 31, | | | March 31, | | | March 31, | | | June 30, | | | June 30, | |
| | | 2003 | | | 2004 | | | 2005 | | | 2006 | | | 2005 | | | 2006 | |
| | | | | | | | | | | | | | | | | | | |
| | | | | | | | | | | (Unaudited) | |
| Total profit for reportable segments | | $ | 31,129 | | | $ | 23,547 | | | $ | 29,838 | | | $ | 82,312 | | | $ | 14,836 | | | $ | 32,762 | |
| Unallocated corporate expenses | | | (41,300 | ) | | | (40,437 | ) | | | (80,219 | ) | | | (102,190 | ) | | | (61,626 | ) | | | (13,533 | ) |
| Unallocated equipment revenue (costs) | | | (7,592 | ) | | | (1,062 | ) | | | 5,794 | | | | (1,326 | ) | | | (2,264 | ) | | | (231 | ) |
| | | | | | | | | | | | | | | | | | | |
| Income (loss) before income taxes | | $ | (17,763 | ) | | $ | (17,952 | ) | | $ | (44,587 | ) | | $ | (21,204 | ) | | $ | (49,054 | ) | | $ | 18,998 | |
| | | | | | | | | | | | | | | | | | | |
| | | | | | | | | | | | | |
| | | March 31, | | | March 31, | | | June 30, | |
| | | 2005 | | | 2006 | | | 2006 | |
| | | | | | | | | | |
| | | | | | | (Unaudited) | |
| Total assets for reportable segments | | $ | 439,350 | | | $ | 460,771 | | | $ | 461,453 | |
| Corporate assets | | | 100,805 | | | | 126,240 | | | | 136,879 | |
| | | | | | | | | | |
| Total assets | | $ | 540,155 | | | $ | 587,011 | | | $ | 598,332 | |
| | | | | | | | | | |
The Company’s goodwill was assigned to the Mining and Site Preparation, Piling and Pipeline segments in the amounts of $125,447, $40,349, and $32,753, respectively.
Substantially all of the Company’s assets are located in Western Canada and the activities are carried out throughout the year.
The following customers accounted for 10% or more of total revenues:
| | | | | | | | | | | | | | | | | | | | | | | | | |
| | | Predecessor | | | | | | | | | | | |
| | | Company | | | | | | | | | | | |
| | | | | | | | | | | | |
| | | | | Period from | | | | | | | Three Months | |
| | | Period from | | | November 26, | | | | | | | Ended | |
| | | April 1, 2003 to | | | 2003 to | | | Year Ended | | | Year Ended | | | | |
| | | November 25, | | | March 31, | | | March 31, | | | March 31, | | | June 30, | | | June 30, | |
| | | 2003 | | | 2004 | | | 2005 | | | 2006 | | | 2005 | | | 2006 | |
| | | | | | | | | | | | | | | | | | | |
| | | | | | | | | | | (Unaudited) | |
| Customer A | | | — | | | | — | | | | — | | | | 2% | | | | 1% | | | | 20% | |
| Customer B | | | — | | | | — | | | | 12 | % | | | 32% | | | | 34% | | | | 15% | |
| Customer C | | | 64 | % | | | 27 | % | | | 26 | % | | | 16% | | | | 15% | | | | 11% | |
| Customer D | | | — | | | | — | | | | 9 | % | | | 10% | | | | 14% | | | | 8% | |
| Customer E | | | 9 | % | | | 11 | % | | | 8 | % | | | 5% | | | | 4% | | | | 5% | |
| Customer F | | | — | | | | 4 | % | | | 11 | % | | | 2% | | | | 4% | | | | 4% | |
| Customer G | | | 12 | % | | | 51 | % | | | 10 | % | | | 6% | | | | 2% | | | | 2% | |
F-35
NACG HOLDINGS INC.
Notes to the Consolidated Financial Statements — (Continued)
This revenue by major customer was earned in all three segments: Mining and Site Preparation, Pipeline and Piling.
| |
| 17. | Related party transactions |
All related party transactions described below are measured at the exchange amount of consideration established and agreed to by the related parties.
| |
| (a) | Transactions with Sponsors: |
The Sterling Group, L.P. (“Sterling”), Genstar Capital, L.P., Perry Strategic Capital Inc., and SF Holding Corp. (formerly Stephens Group, Inc.), (the “Sponsors”), entered into an agreement with the Company and certain of its subsidiaries to provide consulting and advisory services with respect to the organization of the companies, employee benefit and compensation arrangements, and other matters. As compensation for these services an advisory fee of $100 for the three months ended June 30, 2006 (unaudited) (three months ended June 30, 2005 – $100 (unaudited); year ended March 31, 2006 – $400; year ended March 31, 2005 – $400; November 26, 2003 to March 31, 2004 – $133; April 1, 2003 to November 25, 2003 – $ nil) is payable to the Sponsors, as a group. Additionally, for the year ended March 31, 2006 7,500 NAEPI Series B preferred shares were issued to the above Sponsor group in exchange for cash of $7.5 million (see note 13(a)).
Pursuant to several office lease agreements, for the three months ended June 30, 2006 the Company paid $315 (unaudited) (three months ended June 30, 2005 – $292 (unaudited); year ended March 31, 2006 – $836; year ended March 31, 2005 – $824; November 26, 2003 to March 31, 2004 – $292; April 1, 2003 to November 25, 2003 – $387) to a company owned, indirectly and in part, by a member of its Board of Directors.
| |
| (c) | Predecessor company transactions: |
Norama Inc., the parent company of Norama Ltd., charged a fee for management services provided to NACGI. The management fee was paid in reference to taxable income.
The Company is exposed to market risks related to interest rate and foreign currency fluctuations. To mitigate these risks, the Company uses derivative financial instruments such as foreign currency and interest rate swap contracts.
The fair values of the Company’s cash and cash equivalents, accounts receivable, unbilled revenue, accounts payable and accrued liabilities approximate their carrying amounts.
The fair value of the senior secured credit facility, senior notes and capital lease obligations (collectively “the debt”) are based on management estimates which are determined by discounting cash flows required under the debt at the interest rate currently estimated to be available for loans with similar terms. Based on these estimates, the fair value of the Company’s senior secured credit facility and capital lease obligations as at June 30, 2006 (unaudited), March 31, 2006 and March 31, 2005 are not significantly different than their carrying values as they bear interest at floating rates. The market value of the 9% senior secured notes as at June 30, 2006 is $72,387 (unaudited) (March 31, 2006 – $74,646; March 31, 2005 – $nil) compared to a carrying value of $67,437 (unaudited) (March 31, 2006 – $70,587;
F-36
NACG HOLDINGS INC.
Notes to the Consolidated Financial Statements — (Continued)
March 31, 2005 – $nil). The market value of the 83/4% notes as at June 30, 2006 is $224,226 (unaudited) (March 31, 2006 – $228,752; March 31, 2005 – $216,750) compared to a carrying value of $223,000 (unaudited) (March 31, 2006 – $233,420; March 31, 2005 – $241,920).
The Company is subject to interest rate risk on the revolving credit facility and capital lease obligations. At June 30, 2006, for each 1% annual fluctuation in the interest rate, the annual cost of financing will change by approximately $102 (unaudited) (March 31, 2006 – $94; March 31, 2005 – $635).
The Company also leases equipment with a variable lease payment component that is tied to prime rates. At June 30, 2006, for each 1% annual fluctuation in these rates, annual lease expense will change by approximately $226 (unaudited) (March 31, 2006 – $244; March 31, 2005 – $293).
| |
| (c) | Foreign currency risk and derivative financial instruments: |
The Company has 83/4% senior notes denominated in U.S. dollars in the amount of US$200 million. In order to reduce its exposure to changes in the U.S. to Canadian dollar exchange rate, the Company, concurrent with the closing of the acquisition on November 26, 2003, entered into a cross-currency swap agreement to manage this foreign currency exposure for both the principal balance due on December 1, 2011 as well as the semi-annual interest payments through the whole period beginning from the issuance date to the maturity date. In conjunction with the cross-currency swap agreement, the Company also entered into a U.S. dollar interest rate swap and a Canadian dollar interest rate swap with the net effect of converting the 8.75% rate payable on the 83/4% senior notes into a fixed rate of 9.765% for the duration that the 83/4% senior notes are outstanding. On May 19, 2005 in connection with the amendment of the Company’s revolving credit facility, this fixed rate was increased to 9.889%. These derivative financial instruments do not qualify for hedge accounting. The Company’s derivative financial instruments are carried on the consolidated balance sheets at their fair value of $71,030 at June 30, 2006 (unaudited) (March 31, 2006 – $63,611; March 31, 2005 – $51,723). The fair value of the Company’s cross-currency and interest rate swap agreements are based on values quoted by the counterparties to the agreements.
At June 30, 2006 (unaudited) and March 31, 2006, the notional principal amount of the cross-currency swap was US$200 million. The notional principal amounts of the interest rate swaps were US$200 million and Canadian $263 million.
The Company has not hedged its exposure to changes in the U.S. to Canadian dollar exchange rate resulting from the issuance of the 9% senior secured notes.
The Company is subject to foreign currency risk on U.S. dollar operating lease commitments as the Company has not entered into a cross-currency swap agreement to hedge this foreign currency exposure.
Reflective of its normal business, a majority of the Company’s accounts receivable are due from large companies operating in the resource sector. The Company regularly monitors the activity and balances in these accounts to manage its credit risk and provides an allowance for any doubtful accounts.
F-37
NACG HOLDINGS INC.
Notes to the Consolidated Financial Statements — (Continued)
At June 30, 2006, March 31, 2006 and March 31, 2005, the following customers represented 10% or more of accounts receivable and unbilled revenue:
| | | | | | | | | | | | | |
| | | March 31, | | | March 31, | | | June 30, | |
| | | 2005 | | | 2006 | | | 2006 | |
| | | | | | | | | | |
| | | | | | | (unaudited) | |
| Customer A | | | 33% | | | | 21% | | | | 9% | |
| Customer B | | | 9% | | | | 11% | | | | 2% | |
| Customer C | | | 11% | | | | 9% | | | | 16% | |
The annual future minimum lease payments in respect of operating leases in each of the five fiscal years and thereafter as at June 30, 2006 are as follows:
| | | | | |
| | | (Unaudited) | |
| 2007 (July 2006 to March 2007) | | $ | 17,546 | |
| 2008 | | | 18,070 | |
| 2009 | | | 9,827 | |
| 2010 | | | 8,148 | |
| 2011 and thereafter | | | 2,211 | |
| | | | |
| | | $ | 55,802 | |
| | | | |
The annual future minimum lease payments in respect of operating leases for the next five fiscal years and thereafter as at March 31, 2006 are as follows:
| | | | | |
| For the year ending March 31, | | | | |
| 2007 | | $ | 21,176 | |
| 2008 | | | 16,506 | |
| 2009 | | | 9,587 | |
| 2010 | | | 8,148 | |
| 2011 and thereafter | | | 2,232 | |
| | | | |
| | | $ | 57,649 | |
| | | | |
| |
| 20. | Employee contribution plans |
The Company and its subsidiaries match voluntary contributions made by the employees to their Registered Retirement Savings Plans to a maximum of 5% of base salary for each employee. Contributions made by the Company during the three months ended June 30, 2006 were $122 (unaudited) (three months ended June 30, 2005 – $91 (unaudited); year ended March 31, 2006 – $409; year ended March 31, 2005 – $305; November 26, 2003 to March 31, 2004 – $68; April 1, 2003 to November 25, 2003 – $122).
F-38
NACG HOLDINGS INC.
Notes to the Consolidated Financial Statements — (Continued)
| |
| 21. | Stock-based compensation plan |
Under the 2004 Share Option Plan, Directors, Officers, employees and service providers to the Company are eligible to receive stock options to acquire common shares in the Company. The stock options expire ten years from the grant date or on termination of employment. Options may be exercised at a price determined at the time the option is awarded, and vest as follows: no options vest on the award date and twenty per cent vest on each of the five following award date anniversaries. The maximum number of common shares issuable under this plan may not exceed 105,000, of which 1,458 are still available for issue as at June 30, 2006 (unaudited) (March 31, 2006 – 1,682). Subsequent to June 30, 2006, the Company approved an increase in the maximum number of common shares issuable under this plan to 115,000. ThePredecessor Company did not have any stock-based compensation plans.
| | | | | | | | | |
| | | | | Weighted Average | |
| | | Number of | | | Exercise Price | |
| | | Options | | | $ Per Share | |
| | | | | | | |
| Outstanding at November 26, 2003 | | | — | | | $ | — | |
| Granted | | | 54,130 | | | | 100.00 | |
| Exercised | | | — | | | | — | |
| Forfeited | | | — | | | | — | |
| | | | | | | |
| Outstanding at March 31, 2004 | | | 54,130 | | | | 100.00 | |
| Granted | | | 24,112 | | | | 100.00 | |
| Exercised | | | — | | | | — | |
| Forfeited | | | (2,000 | ) | | | (100.00 | ) |
| | | | | | | |
| Outstanding at March 31, 2005 | | | 76,242 | | | | 100.00 | |
| Granted | | | 37,276 | | | | 100.00 | |
| Exercised | | | — | | | | — | |
| Forfeited | | | (10,200 | ) | | | (100.00 | ) |
| | | | | | | |
| Outstanding at March 31, 2006 | | | 103,318 | | | $ | 100.00 | |
| Granted (unaudited) | | | 6,388 | | | | 100.00 | |
| Exercised (unaudited) | | | — | | | | — | |
| Forfeited (unaudited) | | | (6,164 | ) | | | (100.00 | ) |
| | | | | | | |
| Outstanding at June 30, 2006 (unaudited) | | | 103,542 | | | $ | 100.00 | |
| | | | | | | |
At June 30, 2006, the weighted average remaining contractual life of outstanding options is 8.3 years (unaudited) (March 31, 2006 – 8.2 years; March 31, 2005 – 8.9 years). The Company recorded $312 of compensation expense related to the stock options in the three months ended June 30, 2006 (unaudited) (three months ended June 30, 2005 – $188 (unaudited); year ended March 31, 2006 – $923; year ended March 31, 2005 – $497; period from November 26, 2003 to March 31, 2004 – $137) with such amount being credited to contributed surplus.
F-39
NACG HOLDINGS INC.
Notes to the Consolidated Financial Statements — (Continued)
The fair value of each option granted by the Company was estimated on the grant date using the Black-Scholes option-pricing model with the following assumptions:
| | | | | | | | | | | | | | | | | | | | | | |
| | | Period from | | | | | | | |
| | | November 26, | | | | | | | Three Months Ended | |
| | | 2003 to | | | Year Ended | | | Year Ended | | | | |
| | | March 31, | | | March 31, | | | March 31, | | | June 30, | | | June 30, | |
| | | 2004 | | | 2005 | | | 2006 | | | 2005 | | | 2006 | |
| | | | | | | | | | | | | | | | |
| | | | | | | | | (Unaudited) | |
| Number of options granted | | | 54,130 | | | | 24,112 | | | | 37,276 | | | | 20,000 | | | | 6.388 | |
| Weighted average fair value per option granted($) | | | 37.71 | | | | 68.50 | | | | 68.13 | | | | 80.86 | | | | 61.51 | |
| Weighted average assumptions | | | | | | | | | | | | | | | | | | | | |
| | Dividend yield | | | nil | % | | | nil | % | | | nil | % | | | nil | % | | | nil | % |
| | Expected volatility | | | nil | % | | | nil | % | | | nil | % | | | nil | % | | | nil | % |
| | Risk-free interest rate | | | 4.79 | % | | | 4.25 | % | | | 4.13 | % | | | 4.18 | % | | | 4.63 | % |
| | Expected life (years) | | | 10 | | | | 10 | | | | 10 | | | | 10 | | | | 10 | |
The Company has offered to accelerate the vesting of 11,104 options held by certain members of its Board of Directors, providing for the options to become immediately exercisable on the condition that such options be exercised by September 30, 2006. The vesting period for stock options held by any Director that does not accept the Company’s offer will remain unchanged. The accounting impact of the short term inducement (including the impact on the vesting period) will be recorded when the directors exercise their options.
Certain of the comparative figures have been reclassified to conform to the current year’s presentation. The current year’s presentation was changed to conform the financial statements to the method of presentation used by NAEPI in its financial statements as well as to adopt certain public company presentation and disclosure requirements.
F-40
NACG HOLDINGS INC.
Notes to the Consolidated Financial Statements — (Continued)
| |
| 23. | United States generally accepted accounting principles |
These consolidated financial statements have been prepared in accordance with Canadian GAAP, which differs in certain material respects from U.S. GAAP. If U.S. GAAP were employed, the Company’s net loss would be adjusted as follows:
| | | | | | | | | | | | | | | | | | | | | | | | | | |
| | | Predecessor | | | | | | | | | | | |
| | | Company | | | | | | | | | | | |
| | | | | | Period from | | | | | | | |
| | | Period from | | | November 26, | | | | | | | Three Months Ended | |
| | | April 1, 2003 to | | | 2003 to | | | Year Ended | | | Year Ended | | | | |
| | | November 25, | | | March 31, | | | March 31, | | | March 31, | | | June 30, | | | June 30, | |
| | | 2003 | | | 2004 | | | 2005 | | | 2006 | | | 2005 | | | 2006 | |
| | | | | | | | | | | | | | | | | | | |
| | | | | | | | | | | (Unaudited) | |
| Net income (loss) (as reported) | | $ | (11,141 | ) | | $ | (12,282 | ) | | $ | (42,323 | ) | | $ | (21,941 | ) | | $ | (49,204 | ) | | $ | 17,894 | |
| Capitalized interest(a) | | | — | | | | — | | | | — | | | | 847 | | | | 107 | | | | 249 | |
| Depreciation of capitalized interest(a) | | | — | | | | — | | | | — | | | | — | | | | — | | | | (44 | ) |
| Amortization using effective interest method(b) | | | — | | | | — | | | | — | | | | 590 | | | | 43 | | | | 135 | |
| Realized and unrealized loss on derivative financial instruments(e) | | | — | | | | — | | | | — | | | | (484 | ) | | | — | | | | (159 | ) |
| Difference between accretion of Series B preferred shares under Canadian GAAP and U.S. GAAP(f) | | | — | | | | — | | | | — | | | | — | | | | — | | | | 90 | |
| | | | | | | | | | | | | | | | | | | |
| Income (loss) before income taxes | | | (11,141 | ) | | | (12,282 | ) | | | (42,323 | ) | | | (20,988 | ) | | | (49,054 | ) | | $ | 18,165 | |
| Income taxes: | | | | | | | | | | | | | | | | | | | | | | | | |
| | Deferred income taxes | | | — | | | | — | | | | — | | | | — | | | | — | | | | (364 | ) |
| | | | | | | | | | | | | | | | | | | |
| Net income (loss) – U.S. GAAP | | $ | (11,141 | ) | | $ | (12,282 | ) | | $ | (42,323 | ) | | $ | (20,988 | ) | | | (49,054 | ) | | $ | 17,801 | |
| | | | | | | | | | | | | | | | | | | |
Basic net income (loss) per share–
U.S. GAAP | | $ | — | | | $ | (13.28 | ) | | $ | (45.66 | ) | | $ | (22.60 | ) | | $ | (52.86 | ) | | $ | 19.12 | |
| | | | | | | | | | | | | | | | | | | |
| Diluted net income (loss) per share – U.S. GAAP | | $ | — | | | $ | (13.28 | ) | | $ | (45.66 | ) | | $ | (22.60 | ) | | $ | (52.86 | ) | | $ | 14.02 | |
| | | | | | | | | | | | | | | | | | | |
F-41
NACG HOLDINGS INC.
Notes to the Consolidated Financial Statements — (Continued)
The cumulative effect of material differences between Canadian and U.S. GAAP on the consolidated shareholder’s equity of the Company is as follows:
| | | | | | | | | | | | | |
| | | March 31, | | | March 31, | | | June 30, | |
| | | 2005 | | | 2006 | | | 2006 | |
| | | | | | | | | | |
| | | | | | | (Unaudited) | |
| Shareholders’ equity (as reported) – Canadian GAAP | | $ | 38,829 | | | $ | 18,111 | | | $ | 36,317 | |
| Capitalized interest(a) | | | — | | | | 847 | | | | 1,096 | |
| Depreciation of capitalized interest(a) | | | — | | | | — | | | | (44 | ) |
| Amortization using effective interest method(b) | | | — | | | | 590 | | | | 725 | |
| Realized and unrealized loss on derivative financial instruments(e) | | | — | | | | (484 | ) | | | (643 | ) |
| Excess of fair value of amended NAEPI Series B preferred shares over carrying value of original NAEPI Series B preferred shares(f) | | | — | | | | (3,707 | ) | | | (3,707 | ) |
| Cumulative difference between accretion of Series B preferred shares under Canadian GAAP and U.S. GAAP(f) | | | — | | | | — | | | | 90 | |
| Deferred income taxes | | | — | | | | — | | | | (364 | ) |
| | | | | | | | | | |
| Shareholders’ equity – U.S. GAAP | | $ | 38,829 | | | $ | 15,357 | | | $ | 33,470 | |
| | | | | | | | | | |
F-42
NACG HOLDINGS INC.
Notes to the Consolidated Financial Statements — (Continued)
A continuity of each component of the Company’s shareholders’ equity under U.S. GAAP is as follows:
| | | | | | | | | | | | | | | | | |
| | | Common | | | Contributed | | | | | |
| | | Shares | | | Surplus | | | Deficit | | | Total | |
| | | | | | | | | | | | | |
| Balance, November 26, 2003 – U.S. GAAP | | $ | — | | | $ | — | | | $ | — | | | $ | — | |
| Issue of common voting shares | | | 90,438 | | | | — | | | | — | | | | 90,438 | |
| Issue of common non-voting shares | | | 2,062 | | | | — | | | | — | | | | 2,062 | |
| Net loss | | | — | | | | — | | | | (12,282 | ) | | | (12,282 | ) |
| Stock based compensation (note 13(c)) | | | — | | | | 137 | | | | — | | | | 137 | |
| | | | | | | | | | | | | |
| Balance, March 31, 2004 – U.S. GAAP | | | 92,500 | | | | 137 | | | | (12,282 | ) | | | 80,355 | |
| | | | | | | | | | | | | |
| Issue of common voting shares | | | 300 | | | | — | | | | — | | | | 300 | |
| Net loss | | | — | | | | — | | | | (42,323 | ) | | | (42,323 | ) |
| Stock based compensation (note 13(c)) | | | — | | | | 497 | | | | — | | | | 497 | |
| | | | | | | | | | | | | |
| Balance, March 31, 2005 – U.S. GAAP | | | 92,800 | | | | 634 | | | | (54,605 | ) | | | 38,829 | |
| | | | | | | | | | | | | |
| Issue of common voting shares | | | 300 | | | | — | | | $ | — | | | | 300 | |
| Net loss | | | — | | | | — | | | | (20,988 | ) | | | (20,988 | ) |
| Excess of fair value of amended NAEPI Series B preferred shares over carrying value of original NAEPI Series B preferred shares(f) | | | — | | | | — | | | | (3,707 | ) | | | (3,707 | ) |
| | | | | | | | | | | | | |
| Stock based compensation (note 13(c)) | | | — | | | | 923 | | | | — | | | | 923 | |
| | | | | | | | | | | | | |
| Balance, March 31, 2006 – U.S. GAAP | | | 93,100 | | | | 1,557 | | | | (79,300 | ) | | | 15,357 | |
| | | | | | | | | | | | | |
| Net income (unaudited) | | | — | | | | — | | | | 17,801 | | | | 17,801 | |
| Stock based compensation (note 13(c)) (unaudited) | | | — | | | | 312 | | | | — | | | | 312 | |
| | | | | | | | | | | | | |
| Balance, June 30, 2006 – U.S. GAAP (unaudited) | | $ | 93,100 | | | $ | 1,869 | | | $ | (61,499 | ) | | $ | 33,470 | |
| | | | | | | | | | | | | |
The areas of material difference between Canadian and U.S. GAAP and their impact on the Company’s consolidated financial statements are described below:
| |
| (a) | Capitalization of interest: |
U.S. GAAP requires capitalization of interest costs as part of the historical cost of acquiring certain qualifying assets that require a period of time to prepare for their intended use. This is not required under Canadian GAAP. Accordingly, the capitalized amount is subject to depreciation in accordance with the Company’s policies when the asset is placed into service.
Under Canadian GAAP, the Company defers and amortizes debt issuance costs on a straight-line basis over the stated term of the related debt. Under U.S. GAAP, the Company is required to amortize financing costs over the stated term of the related debt using the effective interest method resulting in a consistent interest rate over the term of the debt in accordance with Accounting Principles Board Opinion No. 21 (“APB 21”).
F-43
NACG HOLDINGS INC.
Notes to the Consolidated Financial Statements — (Continued)
| |
| (c) | Reporting comprehensive income: |
Statement of Financial Accounting Standards No. 130, “Reporting Comprehensive Income” (“SFAS 130”) establishes standards for the reporting and display of comprehensive income and its components in a full set of general purpose financial statements. Comprehensive income equals net income (loss) for the period as adjusted for all other non-owner changes in shareholders’ equity. SFAS 130 requires that all items that are required to be recognized under accounting standards as components of comprehensive income be reported in a financial statement. The only component of comprehensive income (loss) is the net income (loss) for the period.
| |
| (d) | Stock-based compensation: |
Up until April 1, 2006, the Company followed the provisions of Statement of Financial Accounting Standards No. 123, “Stock-Based Compensation” for U.S. GAAP purposes. As the Company uses the fair value method of accounting for all stock-based compensation payments under Canadian GAAP there were no differences between Canadian and U.S. GAAP prior to April 1, 2006. On April 1, 2006, the Company adopted the provisions of Statement of Financial Accounting Standards No. 123(R), “Share-Based Payment” (“SFAS 123R”). As the Company used the minimum value method for purposes of complying with Statement of Financial Accounting Standards No. 123, it was required to adopt SFAS 123(R) prospectively.
The methodology for determining the expense to be recognized in each period that is prescribed by SFAS 123(R) differs from that prescribed by Canadian GAAP. Canadian GAAP permits accounting for forfeitures of share-based payments as they occur while U.S. standards require an estimate of forfeitures to be made at the date of grant and thereafter until the requisite service period has been completed or the awards are cancelled. The required adjustment under U.S. GAAP to account for estimated forfeitures was not significant for all periods presented.
During the three months ended June 30, 2006, the Company granted 6,388 stock options to an employee and director. In determining the grant-date fair value of these stock options, the Company included an expected volatility of 40%. The additional compensation cost for these stock options under U.S. GAAP was not significant.
| |
| (e) | Derivative financial instruments: |
Statement of Financial Accounting Standard No. 133, Accounting for Derivative Instruments and Hedging Activities (“SFAS 133”) establishes accounting and reporting standards requiring that every derivative instrument (including certain derivative instruments embedded in other contracts and debt instruments) be recorded in the balance sheet as either an asset or liability measured at its fair value. On November 26, 2003, the Company issued 83/4% senior notes for US$200 million (Canadian $263 million) and on May 19, 2005 the Company issued 9% senior secured notes for US$60.4 million (Canadian $76.3 million). Both of these issuances included certain contingent embedded derivatives which provided for the acceleration of redemption by the holder at a premium in certain instances. These embedded derivatives met the criteria for bifurcation from the debt contract and separate measurement at fair value. The embedded derivatives have been measured at fair value and classified as part of the carrying amount of the Senior Notes on the consolidated balance sheet, with changes in the fair value being recorded in net income as realized and unrealized (gain) loss on derivative financial instruments for the period under U.S. GAAP. Under Canadian GAAP, separate accounting of embedded derivatives from the host contract is not permitted by CICA Emerging Issues Committee Abstract No. 117.
F-44
NACG HOLDINGS INC.
Notes to the Consolidated Financial Statements — (Continued)
| |
| (f) | NAEPI Series B Preferred Shares: |
Prior to the modification of the terms of the NAEPI Series B preferred shares, there were no differences between Canadian GAAP and U.S. GAAP related to the NAEPI Series B preferred shares. As a result of the modification of terms of NAEPI’s Series B preferred shares on March 30, 2006, under Canadian GAAP, the Company continues to classify the NAEPI Series B preferred shares as a liability and accretes the carrying amount of $42.2 million to the December 31, 2011 redemption value of $69.6 million using the effective interest method. Under U.S. GAAP, the Company recognized the fair value of the amended NAEPI Series B preferred shares as minority interest as such amount was recognized as temporary equity in the accounts of NAEPI in accordance with Emerging Issues Task Force Topic D-98 (“EITF D-98”) and recognized a charge of $3.7 million to retained earnings for the difference between the fair value and the carrying amount of the Series B preferred shares on the modification date. Under U.S. GAAP, the Company accretes the initial fair value of the NAEPI Series B preferred shares of $45.9 million to the December 31, 2011 redemption value of $69.6 million using the effective interest method, which is consistent with the treatment of the NAEPI Series B preferred shares as temporary equity in the financial statements of NAEPI. The accretion charge is recognized as a charge to minority interest (as opposed to retained earnings in the accounts of NAEPI) under U.S. GAAP and interest expense in the Company’s financial statements under Canadian GAAP.
| |
| (g) | Investment in joint venture: |
The Company has determined that the joint venture in which it participates is a VIE and that the Company is the primary beneficiary. Accordingly the joint venture has been consolidated on a prospective basis effective January 1, 2005. Prior to its consolidation, the joint venture was accounted for using the proportionate consolidation method under Canadian GAAP. Under U.S. GAAP, investments in joint ventures are accounted for using the equity method. The different accounting treatment affects only the display and classification of financial statement items and not net earnings or shareholders’ equity. Rules prescribed by theSecurities and Exchange Commissionof the United States permit the use of the proportionate consolidation method in the reconciliation to U.S. GAAP provided the joint venture is an operating entity and the significant financial operating policies are, by contractual agreement, jointly controlled by all parties having an interest in the joint venture. In addition, the Company disclosed in note 15(c) the major components of its financial statements resulting from the use of the proportionate consolidation method to account for its interest in the joint venture prior to its consolidation.
The tax effects of temporary differences under Canadian GAAP are described as future income taxes in these financial statements whereas such amounts are described as deferred income taxes under U.S. GAAP.
| |
| (i) | United States accounting pronouncements recently adopted: |
In December 2003, the U.S. Financial Accounting Standards Board (the “FASB”) issued FASB Interpretation No. 46 (revised December 2003), “Consolidation of Variable Interest Entities” (“FIN 46R”), which addresses how a business enterprise should evaluate whether it has a controlling financial interest in an entity through means other than voting rights and accordingly should consolidate the entity. FIN 46R replaces FASB Interpretation No. 46, “Consolidation of Variable Interest Entities,” which was issued in January 2003. The Company is required to apply FIN 46R to variable interests in VIEs created after December 31, 2003. With respect to entities that do not qualify to be assessed for consolidation based on voting interests, FIN 46R generally requires a company that has a variable interest(s) that will absorb a majority of the VIE’s expected losses if they occur, receive a majority of the
F-45
NACG HOLDINGS INC.
Notes to the Consolidated Financial Statements — (Continued)
entity’s expected residual returns if they occur, or both, to consolidate that VIE. For variable interests in VIEs created before January 1, 2004, the Interpretation was applied beginning on January 1, 2005. For any VIEs that must be consolidated under FIN 46R that were created before January 1, 2004, the assets, liabilities and noncontrolling interests of the VIE initially would be measured at their carrying amounts with any difference between the net amount added to the balance sheet and any previously recognized interest being recognized as the cumulative effect of an accounting change. If determining the carrying amounts is not practicable, fair value at the date FIN 46R first applies may be used to measure the assets, liabilities and noncontrolling interest of the VIE. The Company has determined the joint venture in which it has an investment (note 15(c)) qualifies as a VIE.
Statement of Financial Accounting Standards No. 150, “Accounting for Certain Financial Instruments with Characteristics of both Liabilities and Equity,” was issued in May 2003. This Statement establishes standards for the classification and measurement of certain financial instruments with characteristics of both liabilities and equity. The Statement also includes required disclosures for financial instruments within its scope. The Statement was adopted by the Company on January 1, 2004, except for certain mandatorily redeemable financial instruments. For certain mandatorily redeemable financial instruments, the Statement was adopted on January 1, 2005. The adoption of the standard required the Company to reclassify the carrying value of the NACG Preferred Corp. Series A preferred shares from minority interest to redeemable preferred shares. After the adoption of the standard, the Company issued other mandatorily redeemable preferred shares that were within the scope of the standard, which have been disclosed in note 13(a) to the consolidated financial statements.
In November 2004, the FASB issued Statement of Financial Accounting Standards No. 151, “Inventory Costs”. This standard requires the allocation of fixed production overhead costs be based on the normal capacity of the production facilities and unallocated overhead costs recognized as an expense in the period incurred. In addition, other items such as abnormal freight, handling costs and wasted materials require treatment as current period charges rather than being considered an inventory cost. This standard was effective for fiscal 2006 for the Company. The adoption of this standard did not have a material impact on the Company’s financial statements.
In March 2005, the FASB issued FASB Interpretation No. 47, “Accounting for Conditional Asset Retirement Obligations, an interpretation of FASB Statement No. 143” (“FIN 47”), which requires an entity to recognize a liability for the fair value of a conditional asset retirement obligation when incurred if the liability’s fair value can be reasonably estimated. FIN 47 is effective for fiscal years ending after December 15, 2005. The adoption of this standard did not have a material impact on the Company’s financial statements.
Statement of Financial Accounting Standards No. 153, “Exchanges of Non-monetary Assets – an Amendment of APB Opinion 29” (“SFAS 153”), was issued in December 2004. Accounting Principles Board (“APB”) Opinion 29 is based on the principle that exchanges of non-monetary assets should be measured based on the fair value of assets exchanged. SFAS 153 amends APB Opinion 29 to eliminate the exception for non-monetary exchanges of similar productive assets and replaces it with a general exception for exchanges of non-monetary assets that do not have commercial substance. The standard is effective for the Company for non-monetary asset exchanges occurring in fiscal periods beginning after June 15, 2005, beginning July 1, 2005 for the Company. The adoption of this standard did not have a material impact on the Company’s financial statements.
In March 2005, FASB Staff Position FIN 46R-5, “Implicit Variable Interests under FASB Interpretation No. 46(R), Consolidation of Variable Interest Entities”, to address whether a company has an implicit variable interest in a VIE or potential VIE when specific conditions exist. The guidance describes an implicit variable interest as an implied financial interest in an entity that changes with changes in the fair value of the entity’s net assets exclusive of variable interests. An implicit variable
F-46
NACG HOLDINGS INC.
Notes to the Consolidated Financial Statements — (Continued)
interest acts the same as an explicit variable interest except that it involves the absorbing and/or receiving of variability indirectly from the entity (rather than directly). This guidance was adopted in 2006 and did not have a material impact on the Company’s consolidated financial statements.
The impact of the adoption of SFAS 123R is described in note 23(d).
In May 2005, the FASB issued Statement of Financial Accounting Standards No. 154, “Accounting Changes and Error Corrections” (“SFAS 154”) which replaces Accounting Principles Board Opinions No. 20 “Accounting Changes” and Statement of Financial Accounting Standards No. 3, “Reporting Accounting Changes in Interim Financial Statements – An Amendment of APB Opinion No. 28.” SFAS 154 provides guidance on the accounting for and reporting of accounting changes and error corrections. It establishes retrospective application, or the latest practicable date, as the required method for reporting a change in accounting principle and the reporting of a correction of an error. SFAS 154 is effective for accounting changes and corrections of errors made in fiscal years beginning after December 15, 2005 and is required to be adopted by the Company in its fiscal year beginning on April 1, 2006. The adoption of this standard did not have a material impact on the Company’s consolidated financial statements.
| |
| (j) | Recent United States accounting pronouncements not yet adopted: |
Statement of Financial Accounting Standards No. 155, “Accounting for Certain Hybrid Financial Instruments – an amendment of FASB Statements No. 133 and 140” (“SFAS 155”) was issued February 2006. This Statement is effective for all financial instruments acquired, issued, or subject to a remeasurement (new basis) event occurring after the beginning of an entity’s first fiscal year that begins after September 15, 2006. The fair value election provided for in paragraph 4(c) of this Statement may also be applied upon adoption of this Statement for hybrid financial instruments that had been bifurcated under paragraph 12 of Statement 133 prior to the adoption of this Statement. This states that an entity that initially recognizes a host contract and a derivative instrument may irrevocably elect to initially and subsequently measure that hybrid financial instrument, in its entirety, at fair value with changes in fair value recognized in earnings. SFAS 155 is applicable for all financial instruments acquired or issued in the Company’s 2007 fiscal year although early adoption is permitted. The Company is currently reviewing the impact of this statement.
In June 2006, the FASB issued Interpretation No. 48, “Accounting for Uncertainty in Income Taxes — An Interpretation of FASB Statement No. 109” (“FIN 48”) which clarifies the accounting for uncertainty in income taxes recognized in an enterprise’s financial statements in accordance with FASB Statement No. 109, “Accounting for Income Taxes”. FIN 48 prescribes a recognition threshold and measurement attribute for the financial statement recognition and measurement of a tax position taken or expected to be taken in a tax return. This Interpretation also provides guidance on derecognition, classification, interest and penalties, accounting in interim periods, disclosure, and transition requirements. FIN 48 is effective for fiscal years beginning after December 15, 2006, specifically April 1, 2007 for the Company. The Company is currently reviewing the impact of this Interpretation.
Statement of Financial Accounting Standards No. 157, “Fair Value Measurement” (“SFAS 157”) was issued September 2006. The Statement provides guidance for using fair value to measure assets and liabilities. The Statement also expands disclosures about the extent to which companies measure assets and liabilities at fair value, the information used to measure fair value, and the effect of fair value measurement on earnings. This Statement applies under other accounting pronouncements that require or permit fair value measurements. This Statement does not expand the use of fair value measurements in any new circumstances. Under this Statement, fair value refers to the price that would be received to sell an asset or paid to transfer a liability in an orderly transaction between market participants in the market in which the entity transacts. SFAS 157 is effective for the Company for fair value measurements and
F-47
NACG HOLDINGS INC.
Notes to the Consolidated Financial Statements — (Continued)
disclosures made by the Company in its fiscal year beginning on April 1, 2008. The Company is currently reviewing the impact of this statement.
(a) The Company entered into an amended and restated credit agreement, dated as of July 19, 2006, to provide for borrowings of up to $55.0 million, subject to borrowing base limitations, under which revolving loans and letters of credit may be issued. Prime rate revolving loans under the amended and restated credit agreement will bear interest at the Canadian prime rate plus 2.0% per annum and swing line revolving loans will bear interest at the Canadian prime rate plus 1.5% per annum. Canadian bankers’ acceptances have stamping fees equal to 3.0% per annum and letters of credit are subject to a fee of 3.0% per annum.
Advances under the amended and restated agreement are margined with a borrowing base calculation defined as the aggregate of 60.0% of the net book value of the Company’s plant and equipment, 75.0% of eligible accounts receivable and un-pledged cash in excess of $15.0 million. The sum of all borrowings (including issued letters of credit) and the mark-to-market value of the Company’s liability under existing swap agreements must not exceed the borrowing base. The amended and restated credit facility is secured by a first priority lien on substantially all of the Company’s existing and after-acquired property.
The facility contains certain restrictive covenants including, but not limited to, incurring additional debt, transferring or selling assets, making investments (including acquisitions, paying dividends or redeeming shares of capital stock). The Company is also required to meet certain financial covenants. Other terms of the agreement, including the expiry date, did not change. The expiry date of the amended and restated revolving credit facility is March 1, 2010.
During the three months ended June 30, 2006, financing fees of $100 (unaudited) were incurred in connection with the amended and restated credit agreement and were recorded as deferred financing costs.
(b) On July 21, 2006, the Company filed an initial registration statement with the U.S. Securities and Exchange Commission and a preliminary prospectus with securities commissions in every jurisdiction in Canada relating to the initial public offering of voting common shares. Both the registration statement and the preliminary prospectus have subsequently been amended.
Prior to, or concurrent with, the consummation of the proposed offering, the Company, NACG Preferred Corp. and NAEPI are planning to amalgamate into one new entity, North American Energy Partners Inc. In addition, the Company is planning a share split prior to the proposed offering being completed. The voting common shares of the new entity, North American Energy Partners Inc., will be the shares offered in the proposed offering.
Prior to, or concurrent with, the amalgamation referred to above, the Company will repurchase the NACG Preferred Corp. Series A preferred shares for cash consideration of $27.0 million and all accrued dividends at that time will be forfeited. The repurchase is subject to the successful completion of the proposed offering.
Prior to the amalgamation referred to above, it is the Company’s intention to repurchase the NAEPI Series A preferred shares for their redemption value of $1.0 million and to cancel the consulting and advisory services agreement with the Sponsors, under which the Company has received ongoing consulting and advisory services with respect to the organization of the companies, employee benefit and compensation arrangements, and other matters. The consideration to be paid for the cancellation of the
F-48
NACG HOLDINGS INC.
Notes to the Consolidated Financial Statements — (Continued)
consulting and advisory services agreement on the closing of the proposed offering is expected to be $2.0 million. Under the agreement, the Sponsors will also receive a fee equal to 0.5% of the aggregate gross proceeds to the Company from the proposed offering. In addition, it is planned that each holder of NAEPI Series B preferred shares will, for each NAEPI Series B preferred share held, receive five common shares (the number of common shares will be adjusted for the planned share split) in the amalgamated North American Energy Partners Inc. As part of the amalgamation, existing common and non-voting common shareholders of the Company will receive common and non-voting common shares of the amalgamated North American Energy Partners Inc.
The anticipated net proceeds from the offering, after deducting underwriting fees and estimated offering expenses, are being proposed to be used to purchase certain equipment currently under operating leases, repurchase all of the Company’s outstanding 9% senior secured notes due 2010 and repurchase all of the NACG Preferred Corp. Series A preferred shares as described above. The balance of the anticipated net proceeds would be available for general corporate purposes, including working capital, capital expenditures and potential acquisitions.
The completion of the proposed offering, including the planned reorganization described above, is subject to a number of approvals by the shareholders (including preferred shareholders of NACG Preferred Corp. and NAEPI) and the acceptance of the registration statement and prospectus by securities regulatory authorities in the United States and Canada.
(c) Subsequent to June 30, 2006, the Company was informed by the Canada Revenue Agency and taxation officials from Alberta, Ontario and Quebec that certain financing arrangements and tax structures, which a wholly-owned subsidiary had taken part in, are being reviewed and challenged. If the tax authorities are successful in their challenge, the potential future tax liability is estimated to be $1 million, including estimated interest and penalties. The Company is satisfied that its tax structure met the technical requirements of the tax laws and regulations and the related tax benefit was properly recognized; accordingly, no liability has been accrued as at June 30, 2006. The Company is currently assessing its response to this challenge.
(d) On October 6, 2006, the Company’s Board of Directors approved the Amended and Restated 2004 Share Option Plan. The amended plan is subject to shareholder approval and, if approved, will become effective on the closing of the proposed offering described in note 24(b) above. Option grants under the amended option plan may be made to Directors, Officers, employees and consultants selected by the Compensation Committee of the Company’s Board of Directors. Options granted under the amended plan will be evidenced by an agreement, which will specify the vesting, exercise price and expiration of such options. Options to be granted under the amended option plan will have an exercise price of not less than the volume weighted average trading price of the common shares on the Toronto Stock Exchange or the New York Stock Exchange at the time of grant. The amended option plan provides that up to 10% of the Company’s issued and outstanding common shares from time to time may be reserved for issuance or issued from treasury under the amended option plan.
In the event of certain change of control events as defined in the amended option plan, all outstanding options will become immediately vested and exercisable. The amended option plan provides that the Company’s Board of Directors can make certain specified amendments to the option plan subject to receipt of shareholder and regulatory approval, and further authorizes the Board of Directors to make all other amendments to the plan, subject only to regulatory approval but without shareholder approval. The amendments the Board of Directors may make without shareholder approval include amendments of a housekeeping nature, changes to the vesting provisions of an option or the option plan, changes to the termination provisions of an option or the option plan which do not entail an extension beyond the original
F-49
NACG HOLDINGS INC.
Notes to the Consolidated Financial Statements — (Continued)
expiry date, the discontinuance of the option plan, and the addition of provisions relating to phantom share units, such as restricted share units and deferred share units which result in participants receiving cash payments, and the terms governing such features.
The amended option plan provides that each option includes a cashless exercise alternative which provides a holder of an option with the right to elect to receive cash in lieu of purchasing the number of shares under the option. Notwithstanding such right, the amended option plan provides that the Company may elect, at its sole discretion, to stock settle the option.
All outstanding options granted under the 2004 Stock Option Plan (note 21) will remain outstanding after the amended and restated plan becomes effective. Subsequent to June 30, 2006 the Company approved, the maximum number of common shares issuable under this plan to 115,000.
F-50
PART II
INFORMATION NOT REQUIRED IN PROSPECTUS
| |
| Item 6. | Indemnification of Directors and Officers |
| |
| Applicable Laws of Canada |
Section 124 of the Canada Business Corporations Act provides that a corporation may indemnify a present or former director or officer of the corporation, or another individual who acts or acted at the corporation’s request as a director or officer, or an individual acting in a similar capacity, of another entity, against all costs, charges and expenses, including an amount paid to settle an action or satisfy a judgment, reasonably incurred by the individual in respect of any civil, criminal, administrative, investigative or other proceeding in which the individual is involved because of that association with the corporation or other entity, provided that the individual (a) acted honestly and in good faith with a view to the best interests of the corporation or, as the case may be, the other entity; and (b) in the case of a criminal or administrative action or proceeding that is enforced by a monetary penalty, had reasonable grounds for believing that the individual’s conduct was lawful.
Section 124 of the Canada Business Corporations Act also provides that a corporation may advance moneys to a director, officer or other individual for the costs, charges and expenses of a proceeding referred to above. The individual shall repay the moneys if the individual does not fulfill the conditions set out in set out in subsections (a) and (b) above.
A corporation may, with the approval of a court, indemnify an individual referred to above, or advance moneys as set out above, in respect of an action by or on behalf of the corporation or other entity to procure a judgment in its favour, to which the individual is made a party because of the individual’s association with the corporation or other entity against all costs, charges and expenses reasonably incurred by the individual in connection with such action, if the individual fulfills the conditions set out in subsections (a) and (b) above.
Notwithstanding the above, an individual is entitled to indemnity from the corporation in respect of all costs, charges and expenses reasonably incurred by the individual in connection with the defense of any civil, criminal, administrative, investigative or other proceeding to which the individual is subject because of the individual’s association with the corporation or other entity as described above, if the individual seeking indemnity (a) was not judged by the court or other competent authority to have committed any fault or omitted to do anything that the individual ought to have done; (b) acted honestly and in good faith with a view to the best interests of the corporation, or, as the case may be, to the best interests of the other entity for which the individual acted as director or officer or in a similar capacity at the corporation’s request; and (c) in the case of a criminal or administrative action or proceeding that is enforced by a monetary penalty, had reasonable grounds for believing that the individual’s conduct was lawful.
NACG Holdings Inc.’s by-laws provide that, subject to the limitations contained in the Canada Business Corporations Act, the corporation shall indemnify a director or officer, a former director or officer, or another individual who acts or acted at the corporation’s request as a director or officer, or an individual acting in a similar capacity, of another entity, against all costs, charges and expenses, including an amount paid to settle an action or satisfy a judgment, reasonably incurred by the individual in respect of any civil, criminal, administrative, investigative or other action or proceeding in which the individual is involved because of such individual’s association with the corporation or other entity, if the individual (a) acted honestly and in good faith with a view to the best interests of the corporation, or, as the case may be, to the best interests of the other entity for which the individual acted as director or officer or in a
II-1
similar capacity at the request of the corporation; and (b) in the case of a criminal or administrative action or proceeding that is enforced by a monetary penalty, the individual had reasonable grounds for believing that the individual’s conduct was lawful. The by-laws also provide that the corporation may advance moneys to an individual entitled to indemnification for the costs, charges and expenses of such proceedings.
NACG Holdings Inc.’s by-laws also provide that the corporation may purchase and maintain insurance for the benefit of any individual referred to above against any liability incurred by the individual in the individual’s capacity as a director or officer, or similar capacity, of the corporation or of another entity, if the individual acts or acted at the request of the corporation.
NACG Holdings Inc. has entered into indemnity agreements with each of its officers and directors pursuant to which the corporation is obligated to indemnify such officer or director to the full extent permitted by applicable law. The form of such indemnity agreement is filed as an exhibit to this registration statement.
NACG Holdings Inc. maintains liability insurance policies covering its officers and directors against some liabilities, including certain liabilities under the Securities Act of 1933 and Canadian securities laws, that may be incurred by them.
The underwriting agreement filed as Exhibit 1.1 to this registration statement provides that the underwriters are obligated, under certain circumstances, to indemnify our officers and directors and their respective controlling persons against certain liabilities, including liabilities under the Securities Act of 1933.
Insofar as indemnification for liabilities arising under the Securities Act of 1933 may be permitted to directors, officers or persons controlling us pursuant to the foregoing provisions, we have been informed that in the opinion of the Securities and Exchange Commission such indemnification is against public policy as expressed in the Act and is therefore unenforceable.
| |
| Item 7. | Recent Sales of Unregistered Securities |
In the three years prior to the filing of this registration statement, the registrant and its subsidiaries sold the following securities which were not registered under the Securities Act:
On October 17, 2003, NACG Holdings Inc. issued 10 common shares to Sterling Group Partners I, L.P. in exchange for $4,000 in cash in connection with the formation of NACG Holdings Inc. This sale was exempt from registration pursuant to Section 4(2) of the Securities Act as a transaction not involving a public offering.
On November 26, 2003, NACG Holdings Inc. issued an aggregate of 904,380 common shares and 20,620 non-voting common shares to its executive officers and directors, investment entities controlled by the sponsors, an affiliate of BNP Paribas and certain persons associated with the sponsors in exchange for an aggregate of $92.5 million in cash in connection with the Acquisition. These sales were exempt from registration pursuant to Section 4(2) of the Securities Act as transactions not involving a public offering.
II-2
On January 15, 2004, NACG Holdings Inc. issued an aggregate of 17,408 common shares to its directors, officers and employees and certain persons associated with the sponsors in exchange for an aggregate of $1.7 million in cash. NACG Holdings Inc. used the net proceeds from these sales to repurchase a like amount of its common shares from Sterling Group Partners I, L.P. These sales met the conditions of Rule 506 under the Securities Act and were therefore exempt from registration pursuant to Section 4(2) of the Securities Act.
On July 23, 2004, NACG Holdings Inc. issued 2,000 common shares to one of its directors in exchange for $200,000 in cash. This sale was exempt from registration pursuant to Section 4(2) of the Securities Act as a transaction not involving a public offering.
On August 20, 2004, NACG Holdings Inc. issued 1,000 common shares to one of its directors in exchange for $100,000 in cash. This sale was exempt from registration pursuant to Section 4(2) of the Securities Act as a transaction not involving a public offering.
On December 31, 2005, NACG Holdings Inc. issued an aggregate of 2,000 common shares to its executive officers in exchange for an aggregate of $200,000 in cash. On March 30, 2006, NACG Holdings Inc. issued 1,000 of its common shares to one of its directors in exchange for $100,000 in cash. These sales were exempt from registration pursuant to Section 4(2) of the Securities Act as transactions not involving a public offering.
On November 26, 2003, NACG Preferred Corp. issued 35,000 of its Series A preferred shares to Norama Ltd. as partial consideration for the Acquisition. This sale was exempt from registration pursuant to Section 4(2) of the Securities Act as a transaction not involving a public offering.
| |
| North American Energy Partners Inc. |
On November 26, 2003, North American Energy Partners Inc. issued a total of US$200.0 million of 83/4% senior notes due 2011 to Qualified Institutional Buyers in a transaction that met the conditions of Rule 144A and to offshore buyers in a transaction that met the conditions of Regulation S under the Securities Act.
On May 19, 2005, North American Energy Partners Inc. issued US$60.5 million of 9% senior secured notes due 2010 to Qualified Institutional Buyers in a transaction that met the conditions of Rule 144A and to offshore buyers in a transaction that met the conditions of Regulation S under the Securities Act.
On May 19, 2005, North American Energy Partners Inc. issued 75,000 (adjusted for a subsequent 10-for-1 share split) of its Series B preferred shares to investment entities controlled by the sponsors in exchange for $7.5 million in cash. This sale was exempt from registration pursuant to Section 4(2) of the Securities Act as a transaction not involving a public offering.
On May 19, 2005, North American Energy Partners Inc. issued 1,000 of its Series A preferred shares to BNP Paribas, the lender under North American Energy Partners Inc.’s revolving credit facility, as partial consideration for entering into a new revolving credit facility. This sale was exempt from registration pursuant to Section 4(2) of the Securities Act as a transaction not involving a public offering.
On August 31, 2005, North American Energy Partners Inc. issued an aggregate of 8,218 of its Series B preferred shares to existing common shareholders of NACG Holdings Inc. in exchange for an aggregate of $821,800 in cash. North American Energy Partners Inc. used the net proceeds from these sales to repurchase a like amount of Series B preferred shares from investment entities controlled by the sponsors on a pro rata basis in accordance with their percentage ownership of Series B preferred shares.
II-3
These sales met the conditions of Rule 506 under the Securities Act and were therefore exempt from registration pursuant to Section 4(2) of the Securities Act.
On December 31, 2005, North American Energy Partners Inc. issued an aggregate of 163 of its Series B preferred shares to its executive officers in exchange for $16,300 in cash. On March 30, 2006, North American Energy Partners Inc. issued 81 of its Series B preferred shares to one of its directors in exchange for $8,100 in cash. These sales were exempt from registration pursuant to Section 4(2) of the Securities Act as transactions not involving a public offering.
| |
| Item 8. | Exhibits and Financial Statement Schedules |
| | | | | | | |
| Exhibit | | | | |
| Number | | | | Description |
| | | | | |
| | 1 | .1* | | — | | Form of underwriting agreement. |
| | 2 | .1* | | — | | Purchase Agreement, dated October 31, 2003, among Norama Ltd. and North American Equipment Ltd., as Sellers, Martin Gouin and Roger Gouin, as Principals, and NACG Preferred Corp. and NACG Acquisition Inc., as Buyers. |
| | 3 | .1** | | — | | Articles of Incorporation of NACG Holdings Inc., as amended. |
| | 3 | .2** | | — | | By-law No. 1 of NACG Holdings Inc. |
| | 4 | .1** | | — | | Registration Rights Agreement, dated as of November 26, 2003, among NACG Holdings Inc. and the shareholders party thereto. |
| | 4 | .2† | | — | | Amended and Restated 2004 Share Option Plan. |
| | 5 | .1* | | — | | Opinion of Borden Ladner Gervais LLP. |
| | 10 | .1** | | — | | First Amended and Restated Credit Agreement, dated as of July 19, 2006, among North American Energy Partners Inc., the lenders named therein and BNP Paribas (Canada), as Administrative Agent and Collateral Agent. |
| | 10 | .2 | | — | | Intercreditor Agreement, dated as of May 19, 2005, between GE Finance Canada Holding Company, Wells Fargo Bank, N.A. and Computershare Trust Company of Canada, and consented to by North American Energy Partners Inc. and its subsidiaries (filed as Exhibit 10.2 to North American Energy Partners Inc.’s registration statement on Form F-4, Registration No. 333-125610 (the “2005 Registration Statement”), and incorporated herein by reference). |
| | 10 | .3 | | — | | Form of Indemnity Agreement between NACG Holdings Inc., NACG Preferred Corp., North American Energy Partners Inc., North American Construction Group Inc. and their respective officers and directors (filed as Exhibit 10.3 to the 2005 Registration Statement and incorporated herein by reference). |
| | 10 | .4 | | — | | Indenture, dated as of November 26, 2003, among North American Energy Partners Inc., the guarantors named therein and Wells Fargo Bank, N.A., as Trustee (filed as Exhibit 4.1 to North American Energy Partners Inc.’s registration statement on Form F-4, Registration No. 333-111396, and incorporated herein by reference). |
| | 10 | .5 | | — | | Indenture, dated as of May 19, 2005, among North American Energy Partners Inc., the guarantors named therein and Wells Fargo Bank, N.A., as Trustee (filed as Exhibit 4.1 to the 2005 Registration Statement and incorporated herein by reference). |
| | 10 | .6† | | — | | Employment Agreement with Rodney J. Ruston. |
| | 10 | .7† | | — | | Employment Agreement with Vincent J. Gallant. |
| | 10 | .8† | | — | | Employment Agreement with Robert G. Harris. |
| | 10 | .9† | | — | | Employment Agreement with Christopher J. Hayman. |
II-4
| | | | | | | |
| Exhibit | | | | |
| Number | | | | Description |
| | | | | |
| | 10 | .10† | | — | | Employment Agreement with William M. Koehn. |
| | 10 | .11† | | — | | Employment Agreement with Miles W. Safranovich. |
| | 10 | .12*** | | — | | Overburden Removal and Mining Services Contract, dated November 17, 2004, between Canadian Natural Resources Limited and Noramac Ventures Inc. |
| | 10 | .13** | | — | | Amended and Restated Joint Venture Agreement, dated September 30, 2004, among North American Construction Group Inc., Fort McKay Construction Ltd. and Noramac Ventures Ltd, including the assignment of contract from Noramac Ventures Ltd. to North American Construction Group Inc., dated February 27, 2006. |
| | 10 | .14** | | — | | Office Lease, as amended as of November 26, 2003, between Acheson Properties Ltd. and North American Construction Group Inc. |
| | 10 | .15** | | — | | Office Lease, dated as of March 15, 2003, between Acheson Properties Ltd. and North American Construction Group Inc. |
| | 10 | .16** | | — | | Office Lease, dated as of July 1, 2003, between Acheson Properties Ltd. and North American Construction Group Inc. |
| | 10 | .17* | | — | | Voting and Corporate Governance Agreement, dated November 26, 2003, among NACG Holdings Inc. and the shareholders party thereto. |
| | 10 | .18* | | — | | Advisory Services Agreement, dated November 21, 2003, between NACG Holdings Inc. and its subsidiaries and The Sterling Group, L.P., Genstar Capital, L.P., Perry Strategic Capital, Inc. and Stephens Group, Inc. |
| | 10 | .19† | | — | | Employment Agreement with Douglas A. Wilkes. |
| | 10 | .20* | | — | | Series A Preferred Share Purchase Agreement, dated October 7, 2006, among NACG Holdings Inc., NACG Preferred Corp., North American Construction Group Inc. and Norama Ltd. |
| | 21 | .1** | | — | | Subsidiaries of NACG Holdings Inc. |
| | 23 | .1* | | — | | Consent of Borden Ladner Gervais LLP (included in their opinion filed as Exhibit 5.1). |
| | 23 | .2* | | — | | Consent of KPMG LLP. |
| | 24 | .1** | | — | | Powers of attorney. |
| | 24 | .2* | | — | | Power of attorney. |
| |
| *** | Portions of this exhibit have been omitted pursuant to a request for confidential treatment and have been filed separately with the Securities and Exchange Commission. |
| | |
| | † | To be filed by amendment. |
(b) Financial Statement Schedules
II-5
Schedule II — Valuation And Qualifying Accounts
Allowance for doubtful accounts receivable
| | | | | | | | | | | | | | | | | |
| | | Balance, | | | Charged to | | | | | |
| | | Beginning of | | | Costs and | | | | | Balance, | |
| | | Period | | | Expense(1) | | | Deductions(2) | | | End of Period | |
| | | | | | | | | | | | | |
| April 1, 2003 to November 25, 2003 (Predecessor) | | $ | 152,000 | | | $ | 141,000 | | | $ | — | | | $ | 293,000 | |
| November 26, 2003 to March 31, 2004 | | | 293,000 | | | | 47,836 | | | | (12,164 | ) | | | 233,000 | |
| April 1, 2004 to March 31, 2005 | | | 233,000 | | | | 40,378 | | | | (109,789 | ) | | | 163,589 | |
| April 1, 2005 to March 31, 2006 | | | 163,589 | | | | (93,830 | ) | | | (187,661 | ) | | | 69,758 | |
| April 1, 2006 to June 30, 2006 | | | 69,758 | | | | — | | | | — | | | | 69,758 | |
| |
| (1) | Represents increase (decrease) in allowance for doubtful accounts receivable charged to expense. |
| |
| (2) | Represents the accounts receivable written-off against the allowance for doubtful accounts receivable. |
Future income tax asset valuation allowance
| | | | | | | | | | | | | | | | | |
| | | Balance, | | | Charged to | | | | | |
| | | Beginning of | | | Costs and | | | | | Balance, | |
| | | Period | | | Expense(1) | | | Deductions | | | End of Period | |
| | | | | | | | | | | | | |
| April 1, 2003 to November 25, 2003 (Predecessor) | | $ | — | | | $ | — | | | $ | — | | | $ | — | |
| November 26, 2003 to March 31, 2004 | | | — | | | | — | | | | — | | | | — | |
| April 1, 2004 to March 31, 2005 | | | — | | | | 9,955 | | | | — | | | | 9,955 | |
| April 1, 2005 to March 31, 2006 | | | 9,955 | | | | (4,097 | ) | | | — | | | | 5,858 | |
| April 1, 2006 to June 30, 2006 | | | 5,858 | | | | — | | | | (5,858 | ) | | | — | |
| |
| (1) | Represents increase (decrease) in valuation allowance charged to provision for future income taxes. |
The undersigned registrant hereby undertakes to provide to the underwriters at the closing specified in the underwriting agreement certificates in such denominations and registered in such names as required by the underwriters to permit prompt delivery to each purchaser.
Insofar as indemnification for liabilities arising under the Securities Act of 1933 may be permitted to directors, officers and controlling persons of the registrant pursuant to the foregoing provisions, or otherwise, the registrant has been advised that in the opinion of the Securities and Exchange Commission such indemnification is against public policy as expressed in the Securities Act of 1933 and is, therefore, unenforceable. In the event that a claim for indemnification against such liabilities (other than the payment by the registrant of expenses incurred or paid by a director, officer or controlling person of the registrant in the successful defense of any action, suit or proceeding) is asserted by such director, officer or controlling person in connection with the securities being registered, the registrant will, unless in the opinion of its counsel the matter has been settled by controlling precedent, submit to a court of appropriate jurisdiction the question whether such indemnification by it is against public policy as expressed in the Securities Act of 1933 and will be governed by the final adjudication of such issue.
II-6
The undersigned registrant hereby undertakes that:
| |
| | (1) For purposes of determining any liability under the Securities Act of 1933, the information omitted from the form of prospectus filed as part of this registration statement in reliance upon Rule 430A and contained in a form of prospectus filed by the registrant pursuant to Rule 424(b)(1) or (4) or 497(h) under the Securities Act shall be deemed to be part of this registration statement as of the time it was declared effective. |
| |
| | (2) For the purpose of determining any liability under the Securities Act of 1933, each post-effective amendment that contains a form of prospectus shall be deemed to be a new registration statement relating to the securities offered therein, and the offering of such securities at that time shall be deemed to be the initial bona fide offering thereof. |
II-7
SIGNATURES
Pursuant to the requirements of the Securities Act of 1933, the registrant certifies that it has reasonable grounds to believe that it meets all of the requirements for filing on Form F-1 and has duly caused this registration statement, or amendment thereto, to be signed on its behalf by the undersigned, thereunto duly authorized, in the City of Acheson, Alberta, Canada, on October 12, 2006.
| | |
| | By: | /s/Vincent J. Gallant |
| |
| | |
| | Vincent J. Gallant |
| | Vice President, Corporate |
Pursuant to the requirements of the Securities Act of 1933, this registration statement, or amendment thereto, has been signed by the following persons in the capacities indicated on October 12, 2006.
| | | | | |
| Name | | Title |
| | | |
| |
/s/Rodney J. Ruston
Rodney J. Ruston | | Director, President and Chief Executive Officer
(Principal Executive Officer) |
| |
/s/Douglas A. Wilkes
Douglas A. Wilkes | | Vice President, Finance and Chief Financial Officer
(Principal Financial and Accounting Officer) |
| |
*
George R. Brokaw | | Director |
| |
*
John A. Brussa | | Director |
| |
*
Donald R. Getty | | Director |
| |
*
Martin P. Gouin | | Director |
| |
/s/John D. Hawkins
John D. Hawkins | | Director and authorized representative
in the United States |
| |
/s/Ronald A. McIntosh
Ronald A. McIntosh | | Chairman |
| |
*
William C. Oehmig | | Director |
| |
*
Richard D. Paterson | | Director |
| |
*
Allen R. Sello | | Director |
| |
*
Peter W. Tomsett | | Director |
| |
*
K. Rick Turner | | Director |
| |
| Constituting all of the Board of Directors | | |
| |
| *By: | | /s/Vincent J. Gallant
Vincent J. Gallant
Attorney-in-fact for persons indicated | | |
II-8
EXHIBIT INDEX
| | | | | | | |
| Exhibit | | | | |
| Number | | | | Description |
| | | | | |
| | 1 | .1* | | — | | Form of underwriting agreement. |
| | 2 | .1* | | — | | Purchase Agreement, dated October 31, 2003, among Norama Ltd. and North American Equipment Ltd., as Sellers, Martin Gouin and Roger Gouin, as Principals, and NACG Preferred Corp. and NACG Acquisition Inc., as Buyers. |
| | 3 | .1** | | — | | Articles of Incorporation of NACG Holdings Inc., as amended. |
| | 3 | .2** | | — | | By-law No. 1 of NACG Holdings Inc. |
| | 4 | .1** | | — | | Registration Rights Agreement, dated as of November 26, 2003, among NACG Holdings Inc. and the shareholders party thereto. |
| | 4 | .2† | | — | | Amended and Restated 2004 Share Option Plan. |
| | 5 | .1* | | — | | Opinion of Borden Ladner Gervais LLP. |
| | 10 | .1** | | — | | First Amended and Restated Credit Agreement, dated as of July 19, 2006, among North American Energy Partners Inc., the lenders named therein and BNP Paribas (Canada), as Administrative Agent and Collateral Agent. |
| | 10 | .2 | | — | | Intercreditor Agreement, dated as of May 19, 2005, between GE Finance Canada Holding Company, Wells Fargo Bank, N.A. and Computershare Trust Company of Canada, and consented to by North American Energy Partners Inc. and its subsidiaries (filed as Exhibit 10.2 to North American Energy Partners Inc.’s registration statement on Form F-4, Registration No. 333-125610 (the “2005 Registration Statement”), and incorporated herein by reference). |
| | 10 | .3 | | — | | Form of Indemnity Agreement between NACG Holdings Inc., NACG Preferred Corp., North American Energy Partners Inc., North American Construction Group Inc. and their respective officers and directors (filed as Exhibit 10.3 to the 2005 Registration Statement and incorporated herein by reference). |
| | 10 | .4 | | — | | Indenture, dated as of November 26, 2003, among North American Energy Partners Inc., the guarantors named therein and Wells Fargo Bank, N.A., as Trustee (filed as Exhibit 4.1 to North American Energy Partners Inc.’s registration statement on Form F-4, Registration No. 333-111396, and incorporated herein by reference). |
| | 10 | .5 | | — | | Indenture, dated as of May 19, 2005, among North American Energy Partners Inc., the guarantors named therein and Wells Fargo Bank, N.A., as Trustee (filed as Exhibit 4.1 to the 2005 Registration Statement and incorporated herein by reference). |
| | 10 | .6† | | — | | Employment Agreement with Rodney J. Ruston. |
| | 10 | .7† | | — | | Employment Agreement with Vincent J. Gallant. |
| | 10 | .8† | | — | | Employment Agreement with Robert G. Harris. |
| | 10 | .9† | | — | | Employment Agreement with Christopher J. Hayman. |
| | 10 | .10† | | — | | Employment Agreement with William M. Koehn. |
| | 10 | .11† | | — | | Employment Agreement with Miles W. Safranovich. |
| | 10 | .12*** | | — | | Overburden Removal and Mining Services Contract, dated November 17, 2004, between Canadian Natural Resources Limited and Noramac Ventures Inc. |
| | 10 | .13** | | — | | Amended and Restated Joint Venture Agreement, dated September 30, 2004, among North American Construction Group Inc., Fort McKay Construction Ltd. and Noramac Ventures Ltd., including the assignment of contract from Noramac Ventures Ltd. to North American Construction Group Inc., dated February 27, 2006. |
| | 10 | .14** | | — | | Office Lease, as amended as of November 26, 2003, between Acheson Properties Ltd. and North American Construction Group Inc. |
| | 10 | .15** | | — | | Office Lease, dated as of March 15, 2003, between Acheson Properties Ltd. and North American Construction Group Inc. |
| | | | | | | |
| Exhibit | | | | |
| Number | | | | Description |
| | | | | |
| | 10 | .16** | | — | | Office Lease, dated as of July 1, 2003, between Acheson Properties Ltd. and North American Construction Group Inc. |
| | 10 | .17* | | — | | Voting and Corporate Governance Agreement, dated November 26, 2003, among NACG Holdings Inc. and the shareholders party thereto. |
| | 10 | .18* | | — | | Advisory Services Agreement, dated November 21, 2003, between NACG Holdings Inc. and its subsidiaries and The Sterling Group, L.P., Genstar Capital, L.P., Perry Strategic Capital, Inc. and Stephens Group, Inc. |
| | 10 | .19† | | — | | Employment Agreement with Douglas A. Wilkes. |
| | 10 | .20* | | — | | Series A Preferred Share Purchase Agreement, dated October 7, 2006, among NACG Holdings Inc., NACG Preferred Corp., North American Construction Group Inc. and Norama Ltd. |
| | 21 | .1** | | — | | Subsidiaries of NACG Holdings Inc. |
| | 23 | .1* | | — | | Consent of Borden Ladner Gervais LLP (included in their opinion filed as Exhibit 5.1). |
| | 23 | .2* | | — | | Consent of KPMG LLP. |
| | 24 | .1** | | — | | Powers of attorney. |
| | 24 | .2* | | — | | Power of attorney. |
| |
| *** | Previously filed. Portions of this exhibit have been omitted pursuant to a request for confidential treatment and have been filed separately with the Securities and Exchange Commission. |
| | |
| | † | To be filed by amendment. |