UNITED STATES
SECURITIES AND EXCHANGE COMMISSION
Washington, D.C. 20549
FORM 10-K
(Mark One)
| x | ANNUAL REPORT PURSUANT TO SECTION 13 OR 15(d) OF THE SECURITIES EXCHANGE ACT OF 1934 |
For the fiscal year ended December 31, 2007
or
| o | TRANSITION REPORT PURSUANT TO SECTION 13 OR 15(d) OF THE SECURITIES EXCHANGE ACT OF 1934 |
For the transition period from __________ to __________
Commission file number: 01-31937
YANGLIN SOYBEAN, INC.
(Exact name of registrant as specified in its charter)
Nevada (State or other jurisdiction of incorporation or organization) | | 20-4136884 (I.R.S. Employer Identification No.) |
NO. 99 FANRONG STREET, JIXIAN COUNTY
SHUANG YA SHAN CITY
HEILONGJIANG PROVINCE
CHINA, 155900
(Address of Principal Executive Offices)
86-469-469300
(Registrant’s Telephone Number, Including Area Code)
VICTORY DIVIDE MINING COMPANY
(Former Name, Former Address And Former Fiscal Year, If Changed Since Last Report)
Securities registered pursuant to Section 12(b) of the Act: None
Securities registered pursuant to Section 12(g) of the Act:
Title of Each Class: | | Name of Each Exchange on Which Registered |
| Common Stock, par value $0.001 | | None |
Indicate by check mark if the registrant is a well-known seasoned issuer, as defined in Rule 405 of the Securities Act.
Yes o No þ
Indicate by check mark if the registrant is not required to file reports pursuant to Section 13 or Section 15(d) of the Act.
Yes o No þ
Indicate by check mark whether the registrant (1) has filed all reports required to be filed by Sections 13 or 15(d) of the Securities Exchange Act of 1934 during the preceding 12 months (or for such shorter period that the registrant was required to file such reports), and (2) has been subject to such filing requirements for the past 90 days. Yes þ No o
Indicate by check mark if disclosure of delinquent filers pursuant to Item 405 of Regulation S-K is not contained herein, and will not be contained, to the best of registrant’s knowledge, in definitive proxy or information statements incorporated by reference in Part III of this Form 10-K or any amendment to this Form 10-K. Yes o No þ
Indicate by check mark whether the registrant is a large accelerated filer, an accelerated filer, or a non-accelerated filed. See definition of “accelerated filer and large accelerated filer” in Rule 12b-2 of the Exchange Act. (Check one):
Large accelerated filer o | Accelerated filer o | Non-accelerated filer þ |
| | | |
Indicate by check mark whether the registrant is a shell company (as defined in Rule 12b-2 of the Act):
Yes o No þ
The total revenue for the most recent fiscal year is US $155,206,867.
There was no active public trading market as of the last business day of the Company’s second fiscal quarter.
As of March 31, 2008, there are 20,000,003 shares of common stock outstanding.
YANGLIN SOYBEAN, INC.
(A Nevada Corporation)
TABLE OF CONTENTS
| | | | Page |
| | PART I | | |
| Item 1 | Business | | 3 |
| Item 1A | Risk Factors | | 16 |
| Item 1B | Unresolved Staff Comments | | 25 |
| Item 2 | Properties | | 26 |
| Item 3 | Legal Proceedings | | 27 |
| Item 4 | Submission of Matters to a Vote of Security Holders | | 27 |
| | | | |
PART II |
| Item 5 | Market for Registrant’s Common Equity, Related Stockholder Matters and Issuer Purchases of Equity Securities | | 27 |
| Item 6 | Selected Financial Data | | 27 |
| Item 7 | Management’s Discussion and Analysis of Financial Condition and Results of Operation | | 29 |
| Item 7A | Quantitative and Qualitative Disclosures About Market Risk | | 29 |
| Item 8 | Financial Statements and Supplementary Data | | 44 |
| Item 9 | Changes in and Disagreements With Accountants on Accounting and Financial Disclosure | | 45 |
| Item 9A | Controls and Procedures | | 45 |
| Item 9B | Other Information | | 47 |
| | | | |
PART III |
| Item 10 | Directors, Executive Officers and Corporate Governance | | 47 |
| Item 11 | Executive Compensation | | 49 |
| Item 12 | Security Ownership of Certain Beneficial Owners and Management and Related Stockholder Matters | | 51 |
| Item 13 | Certain Relationships and Related Transactions, and Director Independence | | 54 |
| Item 14 | Principal Accounting Fees and Services | | 55 |
| | | | |
PART IV |
| Item 15 | Exhibits and Financial Statement Schedules | | 56 |
PART I
Item 1. Business
Organizational History
Yanglin Soybean Inc. (formerly known as Victory Divide Mining Company, the “Company”) was incorporated in the state of Nevada on May 26, 1921. Prior to October 3, 2007 the company has only nominal operations and assets.
On October 3, 2007, the Company executed a reverse-merger with Faith Winner Investments Limited (“Faith Winner (BVI)”) by an exchange of shares whereby the Company issued 18,500,000 common shares at $0.001 par value in exchange for all Faith Winner (BVI) shares.
Faith Winner (BVI) formed Faith Winner (Jixian) Agriculture Development Company (“Faith Winner (Jixian)” or “WFOE”), which entered into a series of agreements with Heilongjiang Yanglin Soybean Group Co., Ltd. (“Yanglin”) including but not limited to management, loan, purchase option, consignment, trademark licensing, non-competition, etc. As a result of entering the abovementioned agreements, WFOE is deemed to control Yanglin as a Variable Interest Entity as required by FASB Interpretation No. 46 (revised December 2003) Consolidated of Variable Interest Entities, an Interpretation of ARB No. 51
The reverse-merger also included an equity financing of $21,500,000 by the issuance of 10,000,000 Series A Convertible Preferred Stock at $2.15 per share to 10 accredited investors.
The Company, through its subsidiaries and Yanglin (hereinafter, collectively referred to as “the Group”), is now in the business of manufacturing, distribution, and selling of non-genetically modified soybean oil, salad oil, and soybean meal throughout the Province of Heilongjiang, China.
On January 17, 2008, the Company changed its name from “Victory Divide Mining Company” to Yanglin Soybean, Inc.”
Our Industry
We are a leading non-genetically modified (non-GM) soybean processor in the PRC. We currently manufacture soybean oil in bulk package and soybean meal which are sold throughout China our customers directly or through distributors. Most of our customer (approximately 80%) are located in Northern China.
Our manufacturing process includes sifting, crushing, heating and pressing soybeans, extracting and separating oil from crushed soybeans, and cleansing, hydrating and packaging oil as well as drying and packaging soybean meal. Currently, our main products include soybean oil, salad oil and soybean meal. We plan to broaden our product line to include high end products such as squeezed oil, powdered oil and protein concentrates, textured protein, and defatted soybean powder, while greatly enlarging the production capacity of salad oil. We have installed the equipment for manufacturing squeezed oil and expanded the production line for salad oil and have started production of these products by the end of 2007. The production facilities for powdered oil have been built and are now in trial production phase. We have also begun to build facilities for manufacturing soybean protein concentrates, textured protein and defatted soy powder, and these production lines will be put into operations in the middle of 2008.
The Soybean Processing Industry
Soybean processing is a traditional industry. Typically, soybeans are ground and refined into soybean oil and protein meal, which in turn are processed into refined oils, animal feed, proteins and more value-added products such as foods, pharmaceuticals and cosmetics.
(i) Soybean Oil and Soybean Salad Oil
Soybean oil is obtained by the extraction of oil from soybean seeds. Soybean oil contains various vitamins, minerals and unsaturated fatty acids which are essential to the well-being of the human body. It is an important ingredient in products such as salad dressings, margarine, paint and medicines. The price, adaptability and performance of soybean oil make it appropriate for a broad range of food, chemical and medical manufacturing applications. Soybean oil refers to Grade IV oil, as compared to the more refined salad oil. Both oils are for human consumption.
(ii) Soybean Meal
Soybean meal is manufactured by grinding soybean flakes which remain after removal of most of the oil from soybeans by a solvent or mechanical extraction process. Soybean meal is an important raw material used in the animal feed and farming industry due to its high protein content, low fat composition and edible characteristics. Given the PRC’s closer proximity to customers in the Asian region, there is a growing demand for PRC produced soybean meal from countries such as Korea and Japan. This in turn has led to an increase in demand for our soybean meal products.
Growth in the Soybean Industry
Apart from being a food commodity, soybean oil is also used in the cosmetics, pharmaceutical and medical industries. As soybean oil consumption in the PRC has been rapidly increasing, the PRC has imported soybean oil from other countries, such as Argentina, Brazil and the USA. In 2004/2005, the PRC imported 1.7 million tons of soybean oil. It is further projected that the demand for soybean oil in the PRC will increase to 14.4 million tons by 2015. (Source: http://www.chinawinner.net/nongchanpin00016.htm). We believe that such a development will have a positive impact on our business operations.
| | |
World Vegetable Oil Consumption 2006 | |
| | |
| |
| | | | | | |
| | | Million Short Tons | | Million Metric Tons | |
| Palm | | | 42.0 | | | 38.1 | |
| Soybeans | | | 39.3 | | | 35.7 | |
| Rapeseed | | | 19.7 | | | 17.8 | |
| Sunflower seed | | | 11.3 | | | 10.2 | |
| Peanut | | | 5.4 | | | 4.9 | |
| Cottonseed | | | 5.2 | | | 4.8 | |
| Palm Kernel | | | 4.8 | | | 4.3 | |
| Coconut | | | 3.6 | | | 3.3 | |
| Olive | | | 3.2 | | | 2.9 | |
| Total | | | 134.5 | | | 122.0 | |
Source: USDA
| | |
World Protein Meal Consumption 2006 | |
| | |
| |
| | | Million Short Tons | | Million Metric Tons | |
| Soybeans | | | 166.7 | | | 151.3 | |
| Rapeseed | | | 30.2 | | | 27.4 | |
| Cottonseed | | | 16.4 | | | 14.9 | |
| Sunflower seed | | | 12.7 | | | 11.5 | |
| Peanut | | | 6.3 | | | 5.7 | |
| Fish | | | 6.0 | | | 5.5 | |
| Palm Kernel | | | 6.1 | | | 5.5 | |
| Copra | | | 1.9 | | | 1.7 | |
| Total | | | 246.3 | | | 223.4 | |
Source: USDA
In the past few years, the soybean industry has seen a period of sustained growth. We believe that the soybean industry in the PRC has significant potential for further growth and we, through Yanglin, are well positioned to take advantage of such growth. Soybeans are grown for their oil and protein and are used to manufacture various products including soybean oil and soybean meal. According to the Food and Agriculture Organization of the United Nations, global consumption of oils and fats has been steadily increasing, rising at an average rate of approximately 3-4%. The growth is driven by the sustained income growth in the emerging market countries such as the PRC and India and we believe it is the increased consumption of soybean and palm oil in these countries that is to account for the bulk of such growth.
Specifically, the PRC is a major importer of soybeans. In recent years, there has been a marked increase in the volume of soybeans imported by the PRC from countries such as the USA, Argentina and Brazil. The latest statistics of China’s Customs showed that the PRC imported 30.8 million tons of soybeans in 2007, at a growth of about 9% over the previous year (source: China’s 2007 Import Volume of Soybean Reached Record-high 30.82 Million Tons, http://content.caixun.com/NE/00/nm/NE00nmcu.shtml). China’s National Grains and Oils Information Center estimated that the total consumption of soybeans from 2005 to 2006 (October 2005 to September 2006) was 42.32 million tons. (Source: ,http://sg.biz.yahoo.com/060223/15/3ywco.html, February 23, 2006-12-20, Source: http://www.tdctrade.com/report/indprof/indprof_070703.htm dated July 9, 2007)
We believe that such growth in consumption of soybeans in the PRC market is beneficial to our business operations and presents great potential for our further development.
Source: http://sjzl.agri.gov.cn/rpt/reportControl/reports.aspx?Target=_self&ReportID=21
Non-Genetically Modified Soybean Products
Genetically modified soybean plants are widespread in the world’s leading soybean producing countries (such as Brazil, Argentina and the United States) and genetically modified soybeans comprise a very large proportion of the world’s soybean production. Conversely, most of the soybean food products exported from the PRC is primarily made from non-genetically modified soybeans that are cultivated and grown in the PRC.
We believe that a growing number of consumers prefer their soybean products to be made from non-genetically modified soybeans. Owing to potential health issues associated with genetically modified soybean products, such non-genetically modified soybean products are perceived to be “green” and hence more desirable to certain classes of consumers than genetically modified soybean products, especially with respect to soy protein and other value-added soybean products. Furthermore, we believe that as a result of the increasing affluence and sophistication of the consumers in the PRC, European Union, Korea and Japan, they have also become more aware of potential health issues arising from the consumption of genetically modified soybean products and are willing to pay a premium for non-genetically modified soybean products.
As a producer of non-genetically modified soybean products, we believe we are well positioned to take advantage of such growth.
Government Support for the Soybean Industry
In addition, there has been strong government support for the development of our industry. In recent years, the PRC government has sought to differentiate soybean exports from the PRC from those from other international exporters of soybeans such as the United States and Argentina. Specifically, the PRC government has take measures to promote industries and enterprises, such as our business operations, that produce non-genetically modified soybean food products. In 2003, the PRC Ministry of Agriculture announced a plan to develop the PRC’s northeastern region (including the Heilongjiang province where we are located) into the world’s largest non-genetically modified soybean production centre for export within five years.
In addition, the Heilongjiang provincial government has introduced a number of measures to develop its organic farming industry such as improving its local agriculture infrastructure and promoting the development of large industrial groups that produce green and organic food products. Over the past five years, Heilongjiang's green food industry has grown significantly and has become an important growth sector in Heilongjiang’s burgeoning economy. Further, we believe that the proportion of “deep-processed” soybean food products produced by the PRC will increase and is expected to grow significantly, particularly with the completion of the PRC’s largest non-genetically modified soybean deep-processing base in by 2010.
We believe that these various government initiatives at national and local level will have a positive impact on the further development of our business operations.
Our Competitive Advantages
We believe that we have several competitive advantages:
1. Our products have favorable brand recognition because of the superior quality of our products;
2. Our workers have great skills and experience in the soybean industry. Many of them worked in the industry for more than 20 years;
3. Our business is better managed and is more flexible than many larger state-owned soybean processors. As a privately owned business, we are more efficient and in better financial conditions.
4. Our costs are lower than those of our major competitors because our management is lean and efficient.
5. We have vast sales networks covering the most areas of China and better arrangements of the distributors which save cost and promote higher efficiency.
6. We believe that we are one of the largest players in the non-genetically modified soybean industry. Given that large international agricultural conglomerates such as Archer Daniels Midlands and Cargill produce predominantly genetically modified soybean food products, we do not face direct competition from these players in our niche market.
Our Strategy
Increase Our Sources of Supply
Due to the increasing market demand, we expect our business to grow significantly in the next few years. Our need for soybean supply will only increase. In order to increase our raw material supplies, we intend to expand the soybean cultivation area supplying us through the development of further supply arrangements with other private and state-owned farms within the Heilongjiang province. Currently, we have access to soybeans produced in approximately 164,745 acres of farmland and we plan to increase our access to approximately 823,723 acres of farmland in the next few years in other locations by signing up more soybean farmers and through other arrangements.
Expand Capacity by Building New Plants or through Acquisitions
To meet the demand for soybean products, we plan to increase our capacity. We intend to expand our production facilities by acquiring of 3 or 4 additional factories. We expect that these acquisitions will allow us to increase our current annual soybean processing capacity to approximately 1.5 million tons of soybeans over the next 3 years.
Expansion of our Sales Network
We currently sell more in the northern China than other parts of China and currently do not have many sales offices in the South. We plan to expand our sales and marketing network by establishing more sales offices within the PRC. In addition, we are talking to potential agents in Southeast Asia and Russia. We intend to use Chinese export agents to manage currency risk. Our plan is to expand internationally into countries such as Singapore, Malaysia, Canada and the United States.
Expansion of our Product Line
We believe that value added soybean products will yield higher profits margins for our operations. We intend to expand our product lines to include the following high end soybean products:
(i) Powdered Soybean Oil
Powdered soybean oil is manufactured by processing soybean oil and soybean salad oil together with corn syrup and other raw materials. Powdered soybean oil not only retains the nutritional value of liquid soybean oil , but also has a long shelf life and can be easily packaged and transported. In addition, powdered soybean oil can be used as a cheap substitute for milk or powdered milk because it can be easily dissolved or mixed with other ingredients in water to produce a mixture that has a strong fragrance similar to that of milk, as well as containing beneficial proteins and minerals.
(ii) Textured Protein
Textured protein products are manufactured from soy protein. Textured protein products are hydrated in the production process and accordingly have a symmetrical, consistent and smooth texture and specific structure. Textured protein can be added to food products to impart a taste that is similar to that of meat. Therefore, textured protein can be used as a food substitute for beef and pork. In addition, textured protein contains anti-oxygenation ingredients that could prolong the shelf-life of certain food products.
(iii) Defatted Soybean Powder
Defatted soybean powder is manufactured from specially-extracted soy meal and has a high protein content (higher than 50 per cent.). Defatted soybean powder can be added to fish, noodles, meat, dairy products and candy to improve the quality and taste of food. Further, defatted soybean powder can prolong shelf life [and reduce cost.
(iv) Squeezed Oil
Squeezed oil is made by extracting crude soybean oil from selected soybeans through traditional methods of refining and hydration in order to remove the acids in the oil. Squeezed oil is readily absorbed by the human body and contains no cholesterol. It possesses vitamins such as A, D, and E, as well as other nutrients which have been shown to help growth, improve immunity and prevent hypertension and arteriosclerosis.
(v) Concentrated Soy Protein
Concentrated soy protein has a high protein content of up to 98% and contains no cholesterol. Concentrated soy protein can be used as an ingredient in food products to improve their texture and nutritional value. Concentrated soy protein is used as an ingredient in a wide range of food products, including nutritional supplements, seafood, processed meats, frozen food, nutritional beverages, cream soups, sauces and snacks.
Our Current Products
Our current products include the following:
Product | Use | Major Customers | 2007 Volume (tons) |
| Soybean Oil | Cooking | Yingkou Bohai Grease Industrial Co. Ltd., Yi Liping | 49,566 |
| Salad Oil | Cooking | Yingkou Bohai Grease Industrial Co. Ltd., Yu Guanghai | 15,207 |
| Soybean Meal | Animal Feed | Yingkou Bohai Grease Industrial Co. Ltd., Tongliao Hongzhan Animal Feed Factory, Li Yuqiu, Gu Changchun, Wang Chunyu | 319,706 |
We sell our products under the “Yanglin” brand name to various geographic regions of the PRC through our various distribution channels (see “Sales and Marketing” below) directly to our customers primarily within the PRC market. In the fiscal year ending 2007, we processed approximately 385,000 tons of soybeans and generated total revenues amounting to approximately $155.2 million with net income amounting to $10.3 million. Within the 2007 production volume of our main products, namely soybean meal, soybean oil and salad oil, soybean meal occupied a major share of about 83%, while soybean oil and salad oil made up 17% together.
Our Suppliers of Soybeans
Maintaining a stable supply of raw materials (soybeans) is one of the key components for our success. We purchase all our soybean supplies from various farms in the Heilongjiang province. We have established and maintained good relationships with these farms.
The following is a list of our top ten major suppliers of soybeans for the financial year ended December 31, 2007:
| Supplier | | Amount Purchased (in US$) | | % of Total Purchases (%) | |
| Baoqing North Granary | | | 10,905,894.11 | | | 7.46 | |
| Cui Bingyan | | | 6,138,677.51 | | | 4.20 | |
| Duan Xufeng | | | 5,437,402.67 | | | 3.72 | |
| Chi Cuie | | | 5,211,779.68 | | | 3.56 | |
| Wang Li | | | 5,176,965.99 | | | 3.54 | |
| Tang Lijun | | | 4,890,610.42 | | | 3.35 | |
| Jiang Minghui | | | 4,279,171.14 | | | 2.93 | |
| Bai Wenlong | | | 4,261,078.14 | | | 2.91 | |
| Chen Fuzhen | | | 3,622,287.92 | | | 2.48 | |
| Chen Libin | | | 3,534,869.87 | | | 2.42 | |
Note: the amounts are converted from RMB value using the yearly average rate of 2007, 1USD = 7.6172RMB.
Our top ten suppliers together made up an aggregate of 36.6% of our total supply of soybeans, but our biggest supplier only supplied less than 7.5% of our total supply, while none of the other top suppliers occupied a share of over 5%. We believe this diversification of supply is beneficial to us as it increases our bargaining power and prevents us from being over-reliant on any single supplier.
We have been using a unique type of arrangements with soybean suppliers. Through our affiliate company, Heilongjiang Yanglin Group Seed Co. Ltd., we supply these farmers with “Yanglin” soybean seeds which provide higher oil yield. Pursuant to annual supply contracts, the farmers sell the harvested soybeans back to us. We extend favorable commercial terms to these farmers, such as low price and credit payment terms, for them to purchase “Yanglin” soybean seeds, and offer favorable price, which is higher than average market price, and cash-upon-delivery payment terms to the farmers for our purchases of the harvested soybeans grown from “Yanglin” soybean seeds. These arrangements ensure that we maintain good relations with our suppliers, enjoy a stable supply of soybeans that meet our high quality standards at competitive rates, and allow us to maintain a low rate of expenditure on raw materials.
To further ensure a consistent and supply of soybeans and to increase its volume, we intend to enter into similar supply agreements with other soybean farmers in the PRC.
The Supplier of “Yanglin” Soybean Seeds
Heilongjiang Yanglin Group Seed Co, Ltd. is owned and managed by Mr. Shulin Liu, our chief executive officer.
Heilongjiang Yanglin Group Seed Co., Ltd has developed several strains of non-genetically modified soybean seeds (collectively, “Yanglin” seeds”). The Yanglin “East Nong 42” and the “Black Nong 44” boast high protein and fat content. It has also developed the high oil content “Yang 02-01”, “Yang 03-02” and “Yang 03-03” soybean seeds, the high protein content “Yang 03-656” soybean seeds and the high protein and high yielding “Yang 03-149” soybean seeds.
A brief summary of the characteristics of each strain of soybean seed is set forth below:
Soybean | Oil Content | Protein Content | Status of Development |
| “East Nong 42” | 19.33% | 45% - 46.4% | Completed |
| “Black Nong 44” | 21.56% - 22.61% | 38.56% - 46.69% | Completed |
| “Yang 02-01” (high oil) | 22.3%-22.6% | 37.8%-40.2% | Received governmental approval |
| “Yang 03-02” (high oil) | 21.9%-22.7% | 37.2%-41.5% | In trial phase |
| “Yang 03-03” (high protein) | 21.7%-22.1% | 38.4%-45.9% | In trial phase |
| “Yang 03-656” (high protein) | 19.8%-20.6% | 39.7%-45.3% | In trial phase |
| “Yang 03-149” (high protein) | 20.3%-21.9% | 41.5%-44.7% | In trail phase |
Major Customers
Our customers are primarily distributors of soybean oil and soybean meal, with some of them being soybean food processors and animal feed manufacturers. The following is a list of our top ten major customers for fiscal year 2007. All of our major customers are located in the PRC.
Customers | Type of Product | Fiscal 2007 Sales (USD) | % of Total Sales (%) |
| Yingkou Bohai Grease Industrial Co. Ltd. | Soybean Oil | 15,705,039.65 | 10.1% |
| Wang Chunyu | Soybean Meal | 5,290,261.11 | 3.4% |
| Huang Zujian | Soybean Meal | 5,184,750.61 | 3.3% |
| Tongliao Hongzhan Animal Feed Factory | Soybean Meal | 4,553,189.66 | 2.9% |
| Wang Linli | Soybean Meal | 4,233,973.89 | 2.7% |
| Gu Changchun | Soybean Meal | 3,764,879.43 | 2.4% |
| Wang Xihe | Soybean Meal | 3,669,944.96 | 2.4% |
| Li Yuqiu | Soybean Meal | 3,666,983.30 | 2.4% |
| Li Zhengqian | Soybean Meal | 3,407,444.15 | 2.2% |
| Yu Guanghai | Soybean Meal | 3,379,734.87 | 2.2% |
Note: the amounts are converted from RMB value using the yearly average rate of 2007, 1USD = 7.6172RMB.
Our sales are widely diversified among our customers. Our largest customer accounts for only 10.1 % of our total sales in fiscal 2007 while our top ten customers accounted for about 34 % of our net sales in fiscal 2007. As such, we are not dependent on any single customer and have accordingly maintained our bargaining position in relation to our customers. Holding such a diversified customer base, we have mitigated the commercial risk and associated impact of the loss of sales from any single customer. As we begin to expand our product offering to include “high end” soybean products, our customer base will accordingly change to include more industrial users and some retail consumers.
Sales of Products by Type and Locations
The following table shows the breakdown of sales volume by customer type.
Type | Salad Oil | Soy Oil | Soy Meal |
Volume (Tonnes) | Number of customers | % | Volume (Tonnes) | Number of customers | % | Volume (Tonnes) | Number of customers | % |
| Distributor | 14,898 | 71 | 98 | 48,080 | 85 | 97 | 287,740 | 85 | 90 |
| Food Manufacturer | | | | | | | 2,877 | 8 | 0.9 |
| Animal Feed Manufacturer | | | | | | | 25,576 | 14 | 8 |
| Others | 309 | 5 | 2 | 1,486 | 8 | 3 | 3,513 | 4 | 1.1 |
| Total | 15,207 | 76 | 100 | 49,566 | 93 | 100 | 319,706 | 111 | 100 |
All our sales are primarily made to customers within the PRC, though some of our products may be exported by some of the distributors to countries such as Japan, Korea, Russia and India. The geographical distribution of our sales in the PRC for fiscal 2007 is shown below.
Province | Sales Revenue (Salad Oil) | Sales Revenue (Soybean Oil) | Sales Revenue (Soybean Meal) |
Volume (Tonnes) | Value (USD) | Volume (Tonnes) | Value (USD) | Volume (Tonnes) | Value (USD) |
| Heilongjiang | 13,686 | 14,014,298.24 | 29,752 | 28,254,752.43 | 35,970 | 10,414,262.27 |
| Jilin | 1,521 | 1,557,485.58 | 17,355 | 16,481,622.36 | 36,936 | 10,693,944.71 |
| Liaoning | | | 2,459 | 2,335,265.89 | 64,841 | 18,773,177.10 |
| Inner Mongolia | | | | | 8,999 | 2,605,447.49 |
| Beijing | | | | | 9,994 | 2,893,526.19 |
| Tianjin | | | | | 9,598 | 2,778,873.76 |
| Shandong | | | | | 15,987 | 4,628,657.52 |
| Shanxi | | | | | 15,789 | 4,571,331.31 |
| Henan | | | | | 14,798 | 4,284,410.71 |
| Sha’anxi | | | | | 9,591 | 2,776,847.08 |
| Gansu | | | | | 10,285 | 2,977,778.36 |
| Guangxi | | | | | 17,987 | 5,207,710.19 |
| Sichuan | | | | | 18,976 | 5,494,051.74 |
| Hebei | | | | | 49,955 | 14,463,424.53 |
Note: the amounts are converted from RMB value using the yearly average rate of 2007, 1USD = 7.6172RMB.
Our Competitors
Our competitors are the non-genetically modified soybean processors operating in the PRC. Our main competitor is Heilongjiang 93 Oil and Fat Co., Ltd., an integrated state-owned enterprise which is located in Heilongjiang, Dalian and Tianjin. The rest of our competitors are smaller state-owned enterprises.
Position | Company | Estimated Annual Non-GM Production Capacity (in Tonnes) | Estimated Market Share |
| 1 | Heilongjiang Jiushan 93 Group (SOE) | 600,000 | 6.7% |
2 | Yanglin Soybean Group, Ltd | 520,000 | 5.0% |
| 3 | Shandong Gaotang Lanshan Group (SOE) | 200,000 | 2.2% |
| 4 | Henan Xuchang Vegetable Oil Company (SOE) | 100,000 | 1.1% |
| 5 | Qitaihe City Nature Oil Company | 100,000 | 1.1% |
| 6 | Shandong Guanxian Vegetable Oil Company | 100,000 | 1.1% |
| 7 | Jiamusi Zhenda Company | 90,000 | 1.0% |
Source: Information from respective companies' websites and Yanglin estimates
We do not compete with companies that produce genetically modified soybean products, whether in the PRC or internationally.
Sales and Marketing
Apart from our high product quality, our marketing efforts have also contributed to our success in PRC markets. Presently, our main method of selling our products is direct marketing, supplemented with indirect marketing. Given that we are located in the Heilongjiang province, we are in close proximity to our suppliers and customers, so it’s easier for us to deal with them directly (as opposed to going through the Dalian Commodities Exchange).
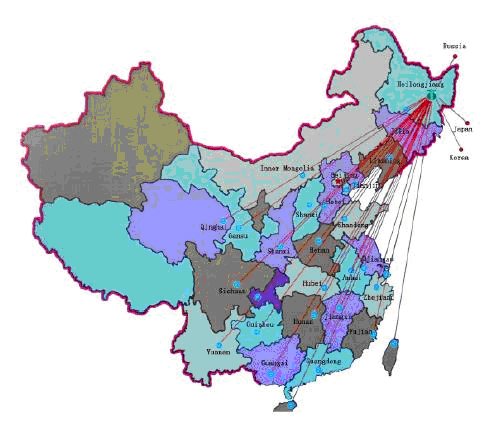
We have sales offices in more than 5 cities in the PRC with approximately 40 independent distributors spread over approximately 27 provinces. These provinces include locations in the northeastern, northwestern and southern regions of the PRC. Furthermore, we have a dedicated in-house sales team with approximately 10 salespersons. Their duties include monitoring the soybean industry, collecting market and price information, developing and managing distributors, providing recommendations for our marketing and sales strategy and pricing policies, filling sales orders and after-sale services.
The following map illustrates the geographical coverage of our sales and distribution network within the PRC:
In addition to our direct marketing efforts in the PRC, and as part of our international expansion plans, we plan to appoint sales agents in North America, Europe, Russia, Japan, Korea and other countries in southeast Asia in the near future.
Advertising
We advertise our products through various forms of media, including billboards alongside highways. We are now building our own business website (www.yanglin.com.cn).
In addition, our marketing team develops and maintains a unified and distinctive image throughout all our corporate publicity materials, including our corporate billboard advertisements, media publicity and corporate branding.
Publicity
We hold an annual conference with the distributors and potential customers to promote our products. We regularly attend exhibitions in different regions to market our products, and plan to attend the Guangzhou Commodity Fair to promote our high end products when we begin to produce them. We plan to maintain and strengthen our existing customer relations through symposiums, guided tours of the company and direct correspondences that provide further information of our product offering. We will also strengthen communications with the relevant government departments in order to keep abreast of new policies and guidelines. This will enable us to adapt quickly to any changes, better seize business opportunities and develop new markets.
Delivery of Products
Approximately 70 % of our products are transported to our customers by railways, thanks to our easy access to the PRC railroad network (see “Our Competitive Advantages”). The costs of transportation are borne by our customers and are pre-paid in advance ahead of delivery of the products. The remainder of our products is collected from our facilities by our customers.
Pricing and Terms
Prices of our products are determined based on the daily spot market price, which is determined by the average of ex-works prices of local producers and the quotation on commodities exchanges. We distinguish between long-term customers and short-term customers and provide rebate policies accordingly. Our short-term customers (typically customers we have been dealing with for less than a year) are required to pay us the full retail price in cash in advance of delivery of their ordered products. For our long-term customers, we may offer credit terms as well as certain preferential terms to them depending on the size of their orders. Since we are paid with cash in advance most of the time, there are almost no accounts receivables.
The current prices for our products, as of December 31, 2007 are: (including VAT)
Products | | Price (USD/metric ton) | |
| Soybean oil (Grade IV) | | $ | 1,451 | |
| Salad oil | | $ | 1,533 | |
| Soybean meal | | $ | 472 | |
Based on the basis exchange rate of 1US$ = 7.3046 RMB as published on the website of People’s Bank of China on December 28, 2007.
For the past three years, the price of soybean meal has been in the range of $246 per metric ton to $493 per metric ton (converted at the above mentioned foreign exchange rate published on the website of People’s Bank of China on December 28, 2007; the same rate is used hereinafter). By comparison the price range of soybean oil has been in the range of $659 per metric ton to $1,451 per metric ton, while the price range of salad oil was from $746 per metric ton to $1,533 per metric ton. The prices of our products are determined by taking into account the costs of labour as well as the seasonality of demand in the soybean market. Traditionally, our prices of our raw materials are lowest during the soybean harvest period between October and December. Our prices then peak from January to February because of the New Year and Spring Festival.
Intellectual Property
We have registered the following trademarks in the PRC, which are currently used for all our products:
Trademark | Country of Registration | Class | Registration Number | Date of Registration | Validity Period |
| “Yanglin”logo | PRC | [29] | 1587278 | June 14, 2001 | From June 14, 2001 to June 13, 2011 |
| “Yanglin”logo | PRC | [31] | 1586742 | June 14, 2001 | From June 14, 2001 to June 13, 2011 |
Class 29 is for meat, fish, poultry and game; meat extracts, preserved, dried and cooked fruits and vegetables; jellies, jams, fruit sauces; eggs, milk and milk products; edible oils and fats. Class 31 is for agricultural, horticultural and forestry products and grains not included in other classes; live animals, fresh fruits and vegetables; seeds, natural plants and flowers; foodstuffs for animals, malt.
Employees
Currently we have 466 employees, most of whom are involved in production and operations.
The functional breakdown of our full-time employees as at December 31, 2005, 2006 and 2007 was:
| | | FY2005 | | FY2006 | | FY2007 | |
| Production and operations | | | 212 | | | 291 | | | 291 | |
| Sales | | | 6 | | | 10 | | | 10 | |
| Management | | | 30 | | | 163 | | | 165 | |
| Total number of employees | | | 248 | | | 464 | | | 466 | |
Along with staff incentive policies, we provide social security to every employee who signs a long term contract with us, and we have paid all social security fees as required by laws and regulations.
We have a system of periodic performance reviews that are conducted annually.
Insurance
We have the following insurance policies:
Description of Policy | Term | Coverage ($) | Premium ($) | Insured |
| China Pacific Insurance Co., AAAH0300003307 | From Jan. 29, 2007 to Jan. 28, 2008 | 30,327.72 | 174.73 | The boiler of Factory No. 1 |
| China Dadi Insurance Co., PQZA200723010600000008 | From Jul. 10, 2007 to Jul. 9, 2008 | 1,782,920.71 | 2,396.77 | Workshop and Office Building of Factory No. 3 |
| China Dadi Insurance Co., PQZA200723010600000007 | From Jul. 10, 2007 to Jul. 10, 2008 | 2,221,703.38 | 2,986.62 | Machinery of Factory No. 3 |
| China Dadi Insurance Co., PQZA200723010600000008 | From Jul. 12, 2007 to Jul. 11, 2008 | 260,319.11 | 1,849.71 | The boiler of Factory No. 3 |
| China Pingan Insurance Co., 21900004601010700013 | From Sep. 29, 2007 to Sep. 29, 2008 | 2,886,315.47 | 4,157.20 | Machinery of Factory No. 1 |
| China Life Insurance Co. | From Jun. 30, 2007 to May. 29, 2008 | - | 2,441.84 | The employees of the three factories |
Note: the amounts in the column Coverage are converted from RMB value using the year end rate of 2007, 1USD = 7.3141RMB, and those in the column Premium are converted from RMB value using the yearly average rate of 2007, 1USD = 7.6172RMB.
Government Regulations
We are subject to various government regulations, such as Food Sanitation Law, Environment Protection Law and Fire Prevention Law, and to national standards for food issued by the national Food and Drug Administration. We have obtained the Sanitation Admission certificate from the local Sanitation Bureau as well as the industrial production permit, and our facilities are regularly inspected by local authorities.
In addition, we have been issued an ISO 9001-2000 Certificate by the Beijing Zhongjing Kehuan Quality Authorization Co. Ltd and a Certificate of Class A Green Food by the China Center of Development of Green Food.
Environmental Compliance
We are subject to the PRC environmental laws, rules and regulations governing our type of manufacturing facility. We have complied with the prescribed standard of environmental protection as evidenced by a certificate issued by the Jixian Environment Protection Bureau dated February, 2007.
The treatment of our waste water is subject to the PRC Environment Protection Law. Our process of treating waste water meets the strict requirement of this law.
Item 1A. Risk Factors
Cautionary Statement Regarding Future Results, Forward-Looking Information And Certain Important Factors
In this report we make, and from time to time we otherwise make, written and oral statements regarding our business and prospects, such as projections of future performance, statements of management’s plans and objectives, forecasts of market trends, and other matters that are forward-looking statements within the meaning of Section 27A of the Securities Act of 1933 and Section 21E of the Securities Exchange Act of 1934. Statements containing the words or phrases “will likely result,” “are expected to,” “will continue,” “is anticipated,” “estimates,” “projects,” “believes,” “expects,” “anticipates,” “intends,” “target,” “goal,” “plans,” “objective,” “should” or similar expressions identify forward-looking statements, which may appear in documents, reports, filings with the Securities and Exchange Commission, news releases, written or oral presentations made by officers or other representatives made by us to analysts, stockholders, investors, news organizations and others, and discussions with management and other of our representatives. For such statements, we claim the protection of the safe harbor for forward-looking statements contained in the Private Securities Litigation Reform Act of 1995.
Our future results, including results related to forward-looking statements, involve a number of risks and uncertainties. No assurance can be given that the results reflected in any forward-looking statements will be achieved. Any forward-looking statement speaks only as of the date on which such statement is made. Our forward-looking statements are based upon assumptions that are sometimes based upon estimates, data, communications and other information from suppliers, government agencies and other sources that may be subject to revision. Except as required by law, we do not undertake any obligation to update or keep current either (i) any forward-looking statement to reflect events or circumstances arising after the date of such statement, or (ii) the important factors that could cause our future results to differ materially from historical results or trends, results anticipated or planned by us, or which are reflected from time to time in any forward-looking statement.
In addition to other matters identified or described by us from time to time in filings with the SEC, there are several important factors that could cause our future results to differ materially from historical results or trends, results anticipated or planned by us, or results that are reflected from time to time in any forward-looking statement. Some of these important factors, but not necessarily all important factors, include the following:
Risks Related To Our Business
Our raw material supply is vulnerable to natural disasters, which could severely disrupt the normal operation of our business and therefore adversely affect our business.
As soybeans are our main raw materials and most of our soybeans are grown in and obtained from farmers in the Heilongjiang province, natural disasters such as drought, earthquakes, floods, and heavy rains in Heilongjiang may lead to a shortage in our supply of soybeans and result in soybean price increases, and consequently adversely affect our operations.
Our efforts to manufacture value added products may not be successful.
In order to grow our business and achieve higher profit margins, we have begun to construct new plants and add new equipment to manufacture value added products such as high-grade oil, protein concentrate, textured protein, powdered oil, etc. If the consumers do not accept our new products, the market for such products has not fully developed, or we do not have experienced sales personnel to market such products, we may not achieve the result as we expect and our business operation and financial conditions may be adversely affected.
Soybean prices fluctuate greatly. This may adversely affect our operations.
As a commodity, soybeans are subject to the price fluctuation of the commodity market in China and indirectly to the international commodity market. For example, the soybean price went up from RMB 1.23 per 500 grams at the beginning of the last year to RMB2.13 per 500 grams at the end of 2007, and in early March 2008 it has climbed to as high as RMB 2.75 per 500 grams, due to both the shortage in soybean supply caused by a severe drought in 2007 and farmers’ cutting growing areas of soybeans brought by the continuously low price level by the end of 2006. If the soybean price increases significantly, we may have a problem caused by increased demand on working capital to satisfy the raw materials needs of our operations.
Our full capacity may be reached soon. Our growth may be impacted if we could not expand our capacity in the near future.
The designed capacity of our facilities is 520,000 tons per year and the maximum utilization rate for our industry is approximately 90%. We processed 385,000 tons of soybean in 2007 and we expect to process about 420,000 tons in 2008. We will soon need additional capacity to grow our business. If we are not able to build or acquire new facilities in 2009, the growth of our business maybe adversely affected.
We do not have long-term soybean supply contracts, which could have a material adverse effect on us.
Currently, we source about 70% of our raw materials from farmers with whom we have a long term relationship and about 30% from intermediaries who purchase directly from other farmers. However, we do not have long term contracts with the farmers or the intermediaries. All current supply contracts with the soybean farmers are one-year contracts without fixed prices. Therefore, we may not be able to control supply risks. Any significant fluctuation in price of our raw materials could have a material adverse effect on the manufacturing cost of our products.
We have tried to mitigate the risks by paying attractive premium to those farmers who will purchase “Yanglin” soybean seeds, cultivate and plant them and then sell the soybeans to us in order to guarantee our soybean supplies. However, if our competitors also pay premium or even pay higher premium to attract the suppliers, we may lose our advantage in purchasing price and lose some of the soybean supplies.
The soybean price is largely beyond our control in addition to natural disaster or supply competition.
The soybean price may also be affected by other factors in addition to natural disaster or supply competition, such as global commodity price increase, government control or suppliers’ financial difficulties. We may have limited options in the short-term for alternative supply if our suppliers fail for any reason, including suppliers’ business failure or financial difficulties to continue the supply of raw materials. Moreover, identifying and accessing alternative sources may increase our costs. Although raw materials are generally available and we have not experienced any raw material shortage in the past, we cannot assure that the necessary materials will continue to be available to us at prices currently in effect or acceptable to us.
Some of our land may be reclaimed by the government and this may materially impact our operations.
Most land in China is state-owned and land use rights may be granted, transferred, leased or allocated. Allocated land use rights are generally provided by the government for an indefinite period (usually to state-owned entities) and cannot be pledged, mortgaged, leased, or transferred by the user. As the same time, allocated land can be reclaimed by the government at any time. The lands occupied by Factory No. 1 and No. 2 is allocated land and accordingly subject to the risk of being reclaimed. We are in the process of applying for the land use rights over Factory No. 2 to be changed to transferred. Although the risk being reclaimed is very small because the government is encouraging the growth of our industry and in general the market economy system and will continue to support our business, we cannot guarantee the land will not be reclaimed in the future.
We may lose our advantages if there is emergence of new production technologies for other competitors.
Our business is dependent on our ability to utilize current technologies to produce high quality products with low cost. Currently, we employ advanced technologies now available in our manufacturing process. However, newer and better manufacturing technologies may emerge. If we are unable to adapt the production processes to newer and more efficient manufacturing technologies that may be used by our competitors to manufacture products that are of higher quality or at a lower cost, we may lose market share and our financial performance may be adversely affected because we do not have the financial resources to build new facilities using such new technologies.
Our manufacturing process is highly dangerous, which could cause adverse effects on our operation.
In our manufacturing process, we use highly inflammable and explosive chemical solutions. Therefore, fires and explosions could occur, which could cause delay in our production, damages to our facilities and injuries to our workers.
We receive a significant portion of our revenues from a small number of customers. Our business will be harmed if our main customers reduce their orders from us.
Our customers mainly comprise approximately 40 distributors of soybean oil and other soybean products, as well as soybean food product and animal feed manufacturers. Although our sales are widely diversified among our customers and our largest customer accounts for only 10% of our total sales, our top ten customers accounted for about 34% of our net sales in fiscal 2007. Dependence on a few customers could make it difficult to negotiate attractive prices for our products and could expose us to the risk of substantial losses if a single dominant customer ceases purchasing. If we lose any customers and are unable to replace them with other customers that would purchase a similar amount of our products, our revenues and net income would decline considerably.
Our product delivery is dependent upon the efficiency of the rail system and any disruption in the services or increase in transportation costs will have a material adverse impact on our operations.
Approximately 70% of our products are transported to our customers by rail. We are largely dependent upon the efficiency of China’s rail system and network to deliver our products. Any disruption of their service will largely impact our ability to fulfill our orders on a timely basis and recognize revenue. Also any increase in transportation costs may deter our customers and lead them to source products from other nearby suppliers, thus negatively affecting our sales.
Potential environmental liability could have a material adverse effect on our operations and financial condition.
To the knowledge of management, we have complied with the prescribed standard of environment protection as evidenced by a certificate issued by the government. Although it has not been alleged by government officials that we have violated any current environmental regulations, we cannot assure that the government will not amend the current environmental protection laws and regulations. Our business and operating results may be materially and adversely affected if we were to be held liable for violating existing environmental regulations or if we were to increase expenditures to comply with environmental regulations affecting our operations.
Inadequate funding for our capital expenditure may affect our growth strategy and profitability.
Our continued growth depends upon our ability to raise capital from outside sources. To maintain our profitability, we should increase the efficiency and achieve economies of scale in production of those low-margin products, and at the same time to develop those high-margin profit products. Adequate funding is needed to expand the production scale or develop new products. However, adequate funding is dependent upon a number of factors, including but without limitation the nation’s or the world’s economy, our business condition, the financial environment as well as the relevant legal environment. If we are unable to obtain sufficient financing, our growth and profitability may be adversely limited.
The sales price fluctuation for our products is periodic, which could affect on our financial results.
The prices of our products vary seasonably, among others, by the change of soybean supply and demand. Usually, our prices are lowest during the soybean harvest time between October and December and on the peak from January to February because of the New Year and Spring Festival. However, the price also subject to other conditions. As a result, we believe that period-to-period comparisons of our historical results of businesses are not necessarily meaningful and that you should not rely on them as an indication for future performance. It is also possible that our quarterly results of operations may be below the expectations of public market analysts and investors.
Risks Related To Our Management and Internal Control
It will probably cost us a long time to establish adequate management and internal controls. As a result, there may be some operation risks with respect to our business management.
We are constantly striving to establish and improve our business management and internal accounting control to forecast, budget and allocate our funds. However, as a Chinese company that has just become a US public company, it is difficult for us to hire and retain a sufficient number of qualified employees of management and internal control in a short period. It will also probably take us a long time to educate our employees about the internal control. As a result, we may experience difficulty in collecting financial data and preparing financial statements, books of account and corporate records, and instituting business practices that meet international standards in a short period.
We depend on key personnel for our business operations, whose discontinuance could incur our high replacement cost.
Our future success depends substantially on the continued services of our executive officers, especially Mr. Shulin Liu, our chairman and chief executive officer, Mr. Zhongtai Guo, chief operating officer, and Mr. Shaocheng Xu, chief financial officer. If one or more of our key executive officers are unable or unwilling to continue in their present positions, we may not be able to replace them readily, if at all. Therefore, our business may be severely disrupted, and we may incur additional expenses and take additional time to recruit and retain new officers.
We may not be able to effectively protect our proprietary rights, which could harm our business and competitive position.
Our success depends, in part, on our ability to protect our proprietary rights. At present, we have registered the trademarks for “Yanglin” logo in China which are currently used for all our products. We cannot assure you that we will be able to effectively protect our trademarks in the future. Currently, implementation of PRC intellectual property-related laws has historically been lacking, primarily because of ambiguities in the PRC laws and difficulties in enforcement. Accordingly, intellectual property rights and confidentiality protections in the PRC may not be as effective as in the United States or other developed countries. Policing unauthorized use of proprietary technology is difficult and expensive, and we might need to resort to litigation to enforce our rights or defend us, or to determine the enforceability, scope and validity of our proprietary rights or those of others. Such litigation may require significant expenditure of cash and management efforts and could harm our business, financial condition and results of operations. An adverse determination in any such litigation will impair our intellectual property rights and may harm our business, competitive position, business prospects and reputation.
We may be exposed to intellectual property infringement and other claims by third parties, which, if successful, could cause us to pay significant damage awards and incur other costs.
While we believe that the technology we use is not protected by any patent or intellectual property rights, we face the risk of being the subject of intellectual property infringement claims. The validity and scope of claims relating to the manufacturing of soybean products may involve complex technical, legal and factual questions and analysis and, therefore, may be highly uncertain. The defense and prosecution of intellectual property suits, patent opposition proceedings and related legal and administrative proceedings can be both costly and time consuming and may significantly divert the efforts and resources of our technical and management personnel. An adverse determination in any such litigation or proceedings to which we may become a party could subject us to significant liability, including damage awards to third parties, require us to seek licenses from third parties, to pay ongoing royalties, or to redesign our products or subject us to injunctions preventing the manufacture and sale of our products. Protracted litigation could also result in our customers or potential customers deferring or limiting their purchase or use of our products until resolution of such litigation. Further, we do not have adequate product liability insurance coverage against defective products as our products are manufactured according to fairly basic formulas. Any disputes so far have been resolved through friendly negotiations. There is no guarantee that we will not be involved in any legal proceedings should such negotiations fail one day.
Risks Related to Our Expansion
We give no assurances that any plans for future expansion will be implemented or that they will be successful.
While we have expansion plans, which include manufacturing “deep-processed” and refined soybean products, expanding our production lines and expanding our sales, there is no guarantee that such plans will be implemented or that they will be successful. These plans are subject to, among other things, the feasibility to meet the challenges we face, our ability to arrange for sufficient funding for more manufacturing facilities and the increasing working capital and the ability to hire qualified and capable employees to carry out these expansion plans.
Our personnel may not effectively support our growth and therefore impeding the expansion plan.
We currently have sufficient experienced and skilled employees for our business operations. But if our business and markets grow and develop, it will be necessary for us to expand our operation in an orderly fashion, which will put added pressure on our management and operational infrastructure. We may not have the requisite experience to manage and operate a larger, more modern manufacturing plant and bigger production lines. In addition, we may face challenges in product offerings and in integrating acquired businesses. These events would increase demands on our existing management, workforce and facilities. Failure to satisfy these increased demands could interrupt or adversely affect our operations and cause production backlogs, longer product development time frames and administrative inefficiencies.
We may not able to increase our sources for soybean supply. As a result, we may not support our plan to increase production.
In order to increase our raw material supplies, we intend to expand our soybean supply area through development of additional farmland soybean agreements, which in turn will be accomplished through contract negotiations with private farmers and cooperation with state-owned farms. However, it is difficult to obtain access to farmlands from private farmers or state-owned farms. If we cannot expand the soybean supply area, we may not be able to increase the supplies of the soybean and our plan to increase soybean production.
We may have difficulty to expand our sales network in domestic market or to explore new overseas market.
We intend to intensify our marketing efforts in the PRC by expanding existing sales and marketing network coverage to reach more areas by establishing more sales offices within the PRC and maybe in other countries such as Singapore, Malaysia, Canada and the United States. However, overseas consumers may not accept the value of non-generically modified soybean products and would not like to pay the premium of it. It also may be difficult to expand the sales channels in China’s markets if we are unable to advertise our products through various forms of media. But the advertising in commercial magazines, popular newspapers or over the internet will enhance our sales costs.
Our acquisition plan may not succeed, which will adversely affect our overall expansion plan.
We plan to expand our production facilities through the acquisition of approximately 3 to 4 additional factories, which can increase our current annual soybean production capacity up to about 1.5 million tons of soybeans over the next 3 years. However, it will be difficult for us to negotiate the acquisition with those factories, who may bargain for higher acquiring prices. Additionally, the acquisition will be submitted to the government for approval. That process may increase the risk of the acquisition failure or increase our acquisition cost, which decreases the value of the acquisition. If our acquisition fails, it will block our overall expansion plan.
Risks Related To Our Industry
China’s commitments to the World Trade Organization may intensify competition.
In connection with its accession to the World Trade Organization, China made many commitments including opening its markets to foreign products, allowing foreign companies to conduct distribution business and reducing customs duties. Foreign manufacturers may begin to manufacture non-genetically modified soybean products and ship their products or establish manufacturing facilities in China. Competition from foreign companies may reduce profit margins and hence our business results would suffer.
If the substitute products for soybean oil increase, we may lose our market share of soybean oil market.
Substitute products for soybean oil, such as vegetable oil of peanut and palm oil could increase the intensity of competition faced by us. With the appearance of substitute products for soybean oil, consumers have more choices. Part of consumers may prefer vegetable oil. As a result, we may lose our market share of soybean oil market.
If we are not be able to maintain competitive in non-genetically modified soybean product business, we may not achieve sufficient product revenues.
At present, we are the largest and most integrated private non-genetically modified soybean producer in China. Our products compete with a multitude of products developed, manufactured and marketed by others and we expect competition from new market entrants in the future. Our current competitors are the other domestic non-genetically modified soybean companies and global manufacturers who may enter the non-genetically modified soybean business. Although currently we view ourselves in a favorable position, we may not remain competitive if existing or future competing products may provide better quality, greater utility, lower cost or other benefits from their intended uses than our products, or may offer comparable performance at lower cost. If our products fail to capture and maintain market share, we may not achieve sufficient product revenues, and our business would suffer.
The inability of the PRC government to keep the PRC a genetically modified-free soybean zone will remove our competitive edge and negatively impact our operations.
We distinguish ourselves from our competitors in that we manufacture and sell non-genetically modified soybean products. Because the PRC is a non-genetically modified soybean growing zone, our competitors are not the large, better capitalized producers of genetically modified soybean products. The PRC has one of the strictest bio-safety regulations in the world, requiring safety certificates and labeling of genetically modified products. However, with so much genetically modified soybeans being imported into the country, there is a question as to whether the PRC is able to keep it a genetically modified-free soybean zone. If the PRC is unsuccessful in keeping the PRC a genetically modified-free soybean zone and our soybeans are tainted through pollination, we will lose our competition edge and this would adversely affect our operations.
Our failure to comply with ongoing governmental regulations could hurt our operations and reduce our market share.
In China, the food industry is undergoing increasing regulations as environmental awareness increases in China. The trend is that the Chinese government toughens its regulations and penalties for violations of environmental regulations. New regulatory actions are constantly changing our industry. Although we believe we have complied with applicable government regulations, there is no assurance that we will be able to do so in the future.
Risks Related To Doing Business In China
We face the risk that changes in the policies of the PRC government could have a significant impact upon the business we may be able to conduct in the PRC and the profitability of such business.
All of our business operations are conducted in China. Accordingly, our business, financial condition, results of operations and prospects are affected significantly by economic, political and legal developments in China. The Chinese economy differs from the economies of most developed countries in many respects, including level of government involvement in economic activities, stage of national development, and control of foreign exchange.
While the Chinese economy has grown significantly in the past 20 years, the growth has been uneven, both geographically and among various sectors of the economy. Policies of the PRC government can have significant effects on the economic conditions of the PRC. The PRC government has confirmed that economic development will follow the model of a market economy. Under this direction, we believe that the PRC will continue to strengthen its economic and trading relationships with foreign countries and business development in the PRC will follow market forces. While we believe that this trend will continue, we cannot assure you that this will be the case. A change in policies by the PRC government could adversely affect our interests by, among other factors: changes in laws, regulations or the interpretation of laws and regulations, confiscatory taxation, restrictions on currency conversion, imports or sources of supplies, or the expropriation or nationalization of private enterprises. Although the PRC government has been pursuing economic reform policies for more than two decades, we cannot assure you that the government will continue to pursue such policies or that such policies may not be significantly altered, especially in the event of a change in leadership, social or political disruption, or other circumstances affecting the PRC’s political, economic and social life.
Our business is largely subject to the uncertain legal environment in China and your legal protection could be limited.
The Chinese legal system is a civil law system based on written statutes. Unlike common law systems, it is a system in which precedents set in earlier legal cases are not generally used. The overall effect of legislation enacted over the past 20 years has been to enhance the protections afforded to foreign invested enterprises in China. However, these laws, regulations and legal requirements are relatively recent and are evolving rapidly, and their interpretation and enforcement involves uncertainties. These uncertainties could limit the legal protections available to foreign investors, such as the right of foreign invested enterprises to hold licenses and permits such as requisite business licenses. In addition, all of our executive officers and our directors are residents of China, and substantially all the assets of these persons are located outside the U.S. As a result, it could be difficult for investors to effect service of process in the U.S., or to enforce a judgment obtained in the U.S. against us or any of these persons.
The Chinese government exerts substantial influence over the manner in which we must conduct our business activities.
China only recently has permitted provincial and local economic autonomy and private economic activities. Chinese government has exercised and continues to exercise substantial control over virtually every sector of the Chinese economy through regulation and state ownership. Our ability to operate in China may be harmed by changes in its laws and regulations, including those relating to taxation, import and export tariffs, environmental regulations, land use rights, property and other matters. We believe that our operations in China are in material compliance with all applicable legal and regulatory requirements. However, the central or local governments of these jurisdictions may impose new, stricter regulations or interpretations of existing regulations that would require additional expenditures and efforts on our part to ensure our compliance with such regulations or interpretations. Accordingly, government actions in the future, including any decision not to continue to support recent economic reforms and to return to a more centrally planned economy, or regional or local variations in the implementation of economic policies, could have a significant effect on economic conditions in China or particular regions thereof, and could require us to divest ourselves of any interest we hold in Chinese properties.
Inflation in China may inhibit our activity to conduct business in China.
In recent years, the Chinese economy has experienced periods of rapid expansion and high rates of inflation. During the past ten years, the rate of inflation in China has been as high as 20.7% and as low as -2.2%. These factors have led to the adoption by Chinese government, from time to time, of various corrective measures designed to restrict the availability of credit or regulate growth and contain inflation. While inflation has been more moderate since 1995, high inflation may in the future cause Chinese government to impose controls on credit and/or prices, or to take other action, which could inhibit economic activity in China, and thereby harm the market for our products.
Restrictions on currency exchange may limit our ability to receive and use our revenues effectively.
The majority of our revenues will be settled in Renminbi and U.S. Dollars, and any future restrictions on currency exchanges may limit our ability to use revenue generated in Renminbi to fund any future business activities outside China or to make dividend or other payments in U.S. dollars. Although the Chinese government introduced regulations in 1996 to allow greater convertibility of the Renminbi for current account transactions, significant restrictions still remain, including primarily the restriction that foreign-invested enterprises may only buy, sell or remit foreign currencies after providing valid commercial documents at those banks in China authorized to conduct foreign exchange business. In addition, conversion of Renminbi for capital account items, including direct investment and loans, is subject to governmental approval in China, and companies are required to open and maintain separate foreign exchange accounts for capital account items. We cannot be certain that the Chinese regulatory authorities will not impose more stringent restrictions on the convertibility of the Renminbi.
The fluctuation of the Renminbi may materially and adversely affect your investment.
The value of our common stock will be affected by the foreign exchange rate between U.S. dollars and Renminbi, and between those currencies and other currencies in which our sales may be denominated. For example, to the extent that we need to convert U.S. dollars into Renminbi for our operational needs and should the Renminbi appreciate against the U.S. dollar at that time, our financial position, the business of the company, and the price of our common stock may be harmed. If we decide to convert our Renminbi into U.S. dollars for the purpose of declaring dividends on our common stock or for other business purposes and the U.S. dollar appreciates against the Renminbi, the U.S. dollar equivalent of our earnings from our subsidiaries in China would be reduced.
We may not be able to distribute our assets upon liquidation.
Our assets are predominately located inside China. Under the laws governing foreign investment enterprises in China, dividend distribution and liquidation are allowed but subject to special procedures under the relevant laws and rules. Any dividend payment will be subject to the decision of the board of directors and subject to foreign exchange rules governing such repatriation. Any liquidation is subject to both the relevant government agency’s approval and supervision as well the foreign exchange control. This may generate additional risk for our investors in case of liquidation.
We may be treated as a resident enterprise for PRC tax purposes after the Enterprise Income Tax Law becomes effective on January 1, 2008, which may subject us to PRC income tax for any dividends we receive from our subsidiaries and PRC income tax withholding for any dividends we pay to our non-PRC shareholders.
The Enterprise Income Tax Law provides that enterprises established outside of China whose “de facto management bodies” are located in China are considered “resident enterprises” and will generally be subject to the uniform 25.0% enterprise income tax rate as to their global income, including income we receive from our subsidiaries. The term “de facto management bodies” is not defined under the Enterprise Income Tax Law and it is currently unclear in which situations a non-PRC enterprise’s “de facto management body” is located in China. All of our management is currently based in China, and if a majority of the members of our management team continue to be located in China after the effective date of the Enterprise Income Tax Law, we may be considered a PRC resident enterprise and therefore subject to PRC enterprise income tax at the rate of 25% on our worldwide income, which will include any dividend income we receive from our subsidiaries. If we are required under the Enterprise Income Tax Law to pay income tax for any dividends we receive from our subsidiaries, our revenues could decrease significantly.
We have limited business insurance coverage in China, which could harm our business.
We are exposed to many risks, including equipment failures, natural disasters, industrial accidents, power outages, and other business interruptions. We do not carry business interruption insurance and as a result, we may be required to pay for financial and other losses, damages and liabilities, including those caused by natural disasters and other events beyond our control, out of our own funds, which could have a material adverse effect on our business, financial condition and results of operations.
Any future outbreak of severe acute respiratory syndrome or avian influenza in China, or similar adverse public health developments, may severely disrupt our business and operations.
A renewed outbreak of severe acute respiratory syndrome, the Avian Flu or another widespread public health problem in China, where all of our manufacturing facilities are located and where all of our revenues are derived from, could have a negative effect on our operations. In addition, there have been confirmed human cases of avian influenza in PRC, Vietnam, Iraq, Thailand, Indonesia, Turkey, Cambodia and other countries which have proven fatal in some instances. If such an outbreak or any other similar epidemic were to spread in China, where our operations are located, it may adversely affect our business and operating results. Such an outbreak could have an impact on our operations as a result of quarantines or closures of our manufacturing facilities or the retail outlets, which would severely disrupt our operations, the sickness or death of our key officers and employees, and a general slowdown in the Chinese economy.
Risks Related To The Market For Our Stock
Our Common Stocks subject to price volatility and may result in losses for investors.
The stock market has experienced significant price and volume fluctuations that have particularly affected the trading prices of equity securities of many companies that have business operations exclusively in China. These fluctuations have often been unrelated or disproportionate to the operating performance of many of these companies. Any negative change in the public’s perception of these companies could decrease our stock price regardless of our operating results. The market price of our common stock has been and may continue to be volatile. We expect our stock price to be subject to fluctuations as a result of a variety of factors, including factors beyond our control.
These factors include without limitation actual or anticipated variations in our quarterly operating results, announcements of technological innovations or new products or services by us or our competitors, announcements relating to strategic relationships or acquisitions, additions or terminations of coverage of our common stock by securities analysts, statements by securities analysts regarding us or our industry, conditions or trends in the our industry, and changes in the economic performance and/or market valuations of other soybean product companies.
The prices at which our common stock trades will affect our ability to raise capital, which may have an adverse affect on our ability to fund our operations.
Our common stock may be considered to be a “penny stock” and, as such, the market for our common stock may be further limited by certain SEC rules applicable to penny stocks.
To the extent the price of our common stock remains below $5.00 per share or we have net tangible assets of $2,000,000 or less, our common shares will be subject to certain “penny stock” rules promulgated by the SEC. Those rules impose certain sales practice requirements on brokers who sell penny stock to persons other than established customers and accredited investors (generally institutions with assets in excess of $5,000,000 or individuals with net worth in excess of $1,000,000). For transactions covered by the penny stock rules, the broker must make a special suitability determination for the purchaser and receive the purchaser’s written consent to the transaction prior to the sale. Furthermore, the penny stock rules generally require, among other things, that brokers engaged in secondary trading of penny stocks provide customers with written disclosure documents, monthly statements of the market value of penny stocks, disclosure of the bid and asked prices, disclosure of the compensation to the brokerage firm, and disclosure of the sales person working for the brokerage firm. These rules and regulations adversely affect the ability of brokers to sell our common shares and limit the liquidity of our securities.
We do not intend to pay cash dividends in the foreseeable future.
We do not anticipate paying any cash dividends in the foreseeable future. We currently intend to retain all available funds and any future earnings for use in the operation and expansion of our business. In addition, the terms of any future debt or credit facility may preclude us from paying any dividends. As a result, capital appreciation, if any, of our common stock will be your sole source of potential gain in your investment for the foreseeable future.
Our chief executive officer could exert significant influence over our significant corporate decisions and may act in a manner that advances his best interests and not necessarily those of other stockholders.
Our Chief Executive Officer, Mr. Shulin Liu and his wife Mrs. Huanqin Ding, beneficially own approximately 91% of our common stock through their 100% holding in Winner State (BVI). As a result, Mr. Liu may be able to influence significantly the outcome of all matters requiring stockholder approval, including the election and removal of directors and any merger, consolidation, or sale of all or substantially all of our assets and he may act in a manner that advances his best interests and not necessarily those of other stockholders, including investors in this offering, by, among other things: delaying, deferring or preventing a change in control of us; entrenching our management and/or our board of directors; impeding a merger, consolidation, takeover or other business combination involving us; discouraging a potential acquirer from making a tender offer or otherwise attempting to obtain control of us; or causing us to enter into transactions or agreements that are not in the best interests of all stockholders.
There is currently a very limited trading market for our common stock
Our common stock is quoted on the over-the-counter Bulletin Board. However, our bid and asked quotations have not regularly appeared on the OTC Bulletin Board for any consistent period of time. There is no established trading market for our common stock and our common stock may never be included for trading on any stock exchange or through any other quotation system (including, without limitation, the NASDQ Stock Market). You may not be able to sell your shares due to the absence of a trading market.
We will incur increased costs as a result of changes in laws and regulations relating to corporate governance matters.
As a public reporting company, we will need to comply with the Sarbanes-Oxley Act of 2002 and the related rules and regulations adopted by the SEC, including expanded disclosures, accelerated reporting requirements and more complex accounting rules. Compliance with Section 404 of the Sarbanes-Oxley Act of 2002 and other requirements will increase our costs and require additional management resources. Additionally, these laws and regulations could make it more difficult or more costly for us to obtain certain types of insurance, including director and officer liability insurance, and we may be forced to accept reduced policy limits and coverage or incur substantially higher costs to obtain the same or similar coverage. The impact of these events could also make it more difficult for us to attract and retain qualified persons to serve on our board of directors, our board committees or as executive officers. We are presently evaluating and monitoring developments with respect to these laws and regulations and cannot predict or estimate the amount or timing of additional costs we may incur to respond to their requirements.
We may not be able to achieve and maintain an effective system of internal control over financial reporting, a failure which may prevent us from accurately reporting our financial results or detecting and preventing fraud.
We will be subject to reporting obligations under the U.S. securities law. Beginning with out annual report on Form 10-K for the fiscal year ending December 31, 2007, we will be required to prepare a management report on our internal control over financial reporting containing our management’s assessment of the effectiveness of our internal control over financial reporting. In addition, our independent registered public accounting firm must attest to and report on the effectiveness of our internal control over financial reporting. Our management may conclude that our internal controls over our financial reporting is not effective. Moreover, even if our management concludes that our internal control over financial reporting is effective our independent registered public accounting firm may still decline to attest to the effectiveness or may issue a report that is qualified if it is not satisfied with our controls or the level at which our controls are documented, designed, operated or reviewed, or if it interprets the relevant requirements differently from us. Our reporting obligations as a public company will place a significant strain on our management, operational and financial resources and systems for the foreseeable future.
We may require additional capital, which may not be available on commercially reasonable terms, or at all.
Capital raise through the sale of equity securities may result in dilution to our shareholders. The incurrence of indebtedness would result in increased debt service obligations and could result in operating and financing covenants that would restrict our operations. Financing may be unavailable in amounts or on terms acceptable to us, or at all. Failure to obtain such additional capital could have an adverse impact on our business strategies and growth prospects.
Item 1B. Unresolved Staff Comments
There are no unresolved comments from the SEC.
ITEM 2. Description of Properties
Our Property
We own and operate three soybean production factories in Jixian county in the Heilongjiang province. Our factories have a combined annual soybean processing capacity of 520,000 tons.
Factory No.1 manufactures salad oil, Grade IV soybean oil and soybean meal. Factory No. 2 manufactures Grade IV soybean oil and soybean meal. Our newest facility, Factory No.3, which was built in 2005, manufactures Grade IV soybean oil, soybean meal and salad oil. Our new, high end products, including defatted soy powder, soy protein concentrates and textured protein, will be manufactured in Factory No. 2. Powdered soy oil will be produced in Factory No. 3. We have finished building the production lines for salad oil and squeezed oil and put them into operations in the last quarter of 2007.
The following tables indicate the land area and annual production capacity of our production facilities:
Production Facility | Area | Capacity |
| Factory No. 1 | 27,000 m2 | 100,000 |
| Factory No. 2 | 43,572 m2 | 120,000 |
| Factory No. 3 | 45,596 m2 | 300,000 |
Annual Production Capacity for 2006 (Tonnes) | | Actual Output for 2006 (Tonnes) | | Utilization Rate for 2006 | | Annual Production Capacity for 2007 (Tonnes) | | Actual Output for 2007 (Tonnes) | | Utilization Rate for 2007 | |
| 520,000 | | | 310,000 | | | 59 | % | | 520,000 | | | 385,000 | | | 74 | % |
Note: The annual production capacity is based on 3 shifts (8 hours per shift) a day for 300 days a year.
We purchased the land use rights for the 45,596 m2 of land of Factory No. 3. The land use rights for Factory No. 1 and No. 2 is allocated by the local government at minimal cost.
Our machinery and equipment for soybean processing include conveyor belt, sifting machines, dyers; steamer, crushers; flaking machines, extractors; distillers; packaging machines; containers, etc. Our machinery has been kept in good conditions and with property insurance coverage.
Item 3. Legal Proceedings
There are no known pending legal proceedings to which we or our properties are subject.
Item 4. Submission Of Matters To A Vote Of Shareholders
No matters were submitted to a vote of shareholders in the last quarter.
PART II
Item 5. Market For Registrant’s Common Equity, Related Shareholder Matters, And Issuer Purchases Of Equity Securities
Our stock is currently quoted on the Over the Counter Bulletin Board and our trading symbol is "YSYB.OB”. There has never been any established public market for shares of our Common Stock.
The following table sets forth for the period indicated the prices of the Common Stock in the over-the-counter market, as reported and summarized by the OTC Bulletin Board. Such prices are based on inter-dealer bid and asked prices, without markup, markdown, commissions, or adjustments and may not represent actual transactions.
| CALENDAR QUARTER ENDED | | HIGH | | LOW | |
| March 31, 2007 | | | 0 | * | | 0 | * |
| June 30, 2007 | | | 0 | * | | 0 | * |
| September 30, 2007 | | | 0 | * | | 0 | * |
| December 31, 2007 | | | 4.50 | | | 2.50 | |
* There was almost no trading activity of the company’s common stock on and before September 30, 2007.
On March 28, 2008, the last reported sale price of our common stock on the Over the Counter Bulletin Board was $3.90 per share.
Shareholders
As of March 31, 2008, we have 20,000,003 shares of Common Stock issued and outstanding held by approximately 360 shareholders and 10,000,000 shares of Preferred Stock issued and outstanding held by approximately 10 shareholders. We have authorized and issued 10,000,000 Series A Preferred Stock and authorized 10,000,000 Series B Preferred Stock but have not issued any Series B Preferred Stock.
Dividend Policy
Our board of directors has not declared a dividend on our Common Stock during the last two fiscal years or the subsequent interim period and we do not anticipate the payments of dividends in the near future, as we intend to reinvest our profits to grow operations. We rely on dividends from Yanglin for our funds and PRC regulations may limit the amount of funds distributed to us from Yanglin, which will affect our ability to declare any dividends.
Repurchases of Equity Securities
No repurchases of our common stock were made in a month within the fourth quarter of the fiscal year covered by this report.
Item 6. Selected Financial Data
SELECTED CONSOLIDATED FINANCIAL DATA
You should read the following selected consolidated financial data in conjunction with “Management's Discussion and Analysis of Financial Condition and Results of Operations,” the financial statements and related notes, and the other financial information included in this prospectus.
Consolidated Statement of Operations | | The year ended Dec. 31, 2003 ($) | | The year ended Dec. 31, 2004 ($) | | The year ended Dec. 31, 2005 ($) | | The year ended Dec. 31, 2006 ($) | | The year ended Dec. 31, 2007 ($) | |
| | | (unaudited) | | (audited) | | (audited) | | (audited) | | (audited) | |
| Sales Revenue (net of discounts, returns and allowances) | | | 20,077,560 | | | 26,046,389 | | | 38,107,145 | | | 88,078,494 | | | 155,206,867 | |
| Other sales | | | | | | 279,222 | | | 323,320 | | | - | | | - | |
| Cost of sales | | | (19,144,441 | ) | | (24,557,296 | ) | | (35,132,664 | ) | | (79,862,179 | ) | | (142,568,658 | ) |
| Gross Profit | | | 933,119 | | | 1,768,315 | | | 3,297,801 | | | 8,216,315 | | | 12,638,209 | |
| Selling expenses | | | (42,035 | ) | | (54,553 | ) | | (43,094 | ) | | (63,209 | ) | | (146,411 | ) |
| General and administrative expenses | | | (702,247 | ) | | (902,258 | ) | | (1,103,262 | ) | | (1,078,184 | ) | | (1,825,498 | ) |
| Income from continuing operations | | | 188,836 | | | 811,504 | | | 2,151,445 | | | 7,074,922 | | | 10,666,300 | |
| Interest expense, net | | | (73,762 | ) | | (100,455 | ) | | (150,370 | ) | | (219,032 | ) | | (394,705 | ) |
| Other income | | | 32,146 | | | 211,168 | | | - | | | - | | | 52,433 | |
| Other expense | | | (24,087 | ) | | | | | - | | | - | | | - | |
| Income before taxation | | | 123,133 | | | 922,217 | | | 2,001,075 | | | 6,855,890 | | | 10,324,028 | |
| Income tax | | | - | | | - | | | - | | | - | | | - | |
| Net Income | | | 123,133 | | | 922,217 | | | 2,001,075 | | | 6,855,890 | | | 10,324,028 | |
| Basic net income per common share | | | 0.004 | | | 0.046 | | | 0.100 | | | 0.343 | | | 0.516 | |
| Diluted net income per common share | | | 0.004 | | | 0.046 | | | 0.100 | | | 0.343 | | | 0.344 | |
| Consolidated Balance Sheets | | The year ended Dec. 31, 2003 ($) | | The year ended Dec. 31, 2004 ($) | | The year ended Dec. 31, 2005 ($) | | The year ended Dec. 31, 2006 ($) | | The year ended Dec. 31, 2007 ($) | |
| | | (unaudited) | | (audited) | | (audited) | | (audited) | | (audited) | |
| Current Assets | | | 12,343,642 | | | 13,069,478 | | | 9,911,883 | | | 11,272,054 | | | 35,828,927 | |
| Total Assets | | | 19,204,789 | | | 20,454,198 | | | 27,090,833 | | | 35,245,747 | | | 70,732,531 | |
| Current Liabilities | | | 6,339,685 | | | 6,350,104 | | | 10,634,636 | | | 11,050,319 | | | 15,587,625 | |
| Total Liabilities | | | 6,339,685 | | | 6,670,729 | | | 10,908,533 | | | 11,512,096 | | | 16,044,732 | |
| Total Stockholders’ Equity | | | 12,865,104 | | | 13,783,469 | | | 16,182,300 | | | 23,733,651 | | | 54,687,799 | |
Item 7. Management’s Discussion and Analysis of Financial Condition and Results of Operation
The following discussion of our financial condition and results of operations should be read in conjunction with our audited consolidated financial statements and the notes to those financial statements appearing elsewhere in this Form 10-K. This discussion contains forward-looking statements that involve significant risks and uncertainties. As a result of many factors, such as those set forth under "Forward Looking Statements" and "Item 1A. Risk Factors" and elsewhere in this Form 10-K, our actual results may differ materially from those anticipated in these forward-looking statements.
Company Overview
We are a leading non-genetically modified (non-GM) soybean processor in the PRC. We currently manufacture Grade 4 soy bean oil in bulk package and soybean meal which are sold throughout China to our customers directly or through distributors. Most of our customer (approximately 80%) are located in Northern China.
Our manufacturing process includes sifting, crushing, heating and pressing soybeans, extracting and separating oil from crushed soybeans, and cleansing, hydrating and packaging of oil as well as drying and packaging soybean meal. Currently, our main products include soybean oil, salad oil and soybean meal. We plan to broaden our product line to include high end products such as squeezed oil, powdered oil and protein concentrates, textured protein and defatted soybean powder, while greatly enlarging the production capacity of salad oil. We have installed the equipment for manufacturing squeezed oil and expanded the production line for salad oil and have started production of these products by the end of 2007. The production facilities for powdered oil have been built and are now in trial production phase. We have also begun to build facilities for manufacturing soybean protein concentrates, textured protein and defatted soy powder, and these production lines will be put into operations in the middle of 2008.
We sell our products under the “Yanglin” brand name to various geographic regions of the PRC through our various distribution channels (see “Sales and Marketing” below) directly to our customers primarily within the PRC market. In the fiscal year ending 2007, we processed approximately 385,000 tons of soybeans and generated total revenues amounting to approximately $155.2 million with net income amounting to $10.3 million.
Our goal is to become the champion in the non-GM soybean industry of China, and we are fully confident that we can surely accomplish it in the near future. We are now considering future expansion and acquisition plan, with the intention to significantly increase our processing capacity. The plan is now still in preliminary stage, but this will nevertheless be a vital step in achieving our objective. On the other side, we are also making great efforts to improve and strengthen our management and internal control system. We have engaged Ernst & Young as consultant on our Sarbanes-Oxley compliance project, and Ernst & Young’s project team has started to review our internal control. We believe that we can complete the project successfully by the end of 2008, providing ourselves with a great opportunity to reinforce our capability to protect the interests of the company and the shareholders and improve management effectiveness and efficiency.
Organizational History
Yanglin Soybean Inc. (f/k/a, Victory Divide Mining Company, the “Company”) was incorporated in the state of Nevada on May 26, 1921. Prior to October 3, 2007 the company has only nominal operations and assets.
On October 3, 2007, the Company executed a reverse-merger with Faith Winner Investments Limited (“Faith Winner (BVI)”) by an exchange of shares whereby the Company issued 18,500,000 common shares at $0.001 par value in exchange for all Faith Winner (BVI) shares.
Faith Winner (BVI) formed Faith Winner (Jixian) Agriculture Development Company (“Faith Winner (Jixian)” or “WFOE”), which entered into a series of agreements with Heilongjiang Yanglin Soybean Group Co., Ltd. (“Yanglin”) including but not limited to management, loan, purchase option, consignment, trademark licensing, non-competition, etc. As a result of entering the abovementioned agreements, WFOE is deemed to control Yanglin as a Variable Interest Entity as required by FASB Interpretation No. 46 (revised December 2003) Consolidated of Variable Interest Entities, an Interpretation of ARB No. 51.
The reverse-merger also included an equity financing of $21,500,000 by the issuance of 10,000,000 Series A Convertible Preferred Stock at $2.15 per share to 10 accredited investors.
The Company, through its subsidiaries and Yanglin, (hereinafter, collectively referred to as “the Group”), is now in the business of manufacturing, distribution, and selling of non-genetically modified soybean oil, soybean salad oil, and soybean meal throughout the Province of Heilongjiang, China.
On January 17, 2008, the Company changed its name from “Victory Divide Mining Company” to Yanglin Soybean, Inc.”
Major Performance Factors
Revenue
We derive our revenue mainly from the sales of 3 main products, namely soybean oil (4th grade), salad oil and soybean meal. The revenue may be affected by the following factors:
| Processing capacity of soybean; |
| Pricing of soybean oil, salad oil and soybean meal; |
Processing capacity of soybean. Our current annual processing capacity of soybean is 520,000 metric tons, which is sufficient for our current production plan of processing about 420,000 metric tons of soybeans in 2008.
Pricing of soybean oil, salad oil and soybean meal. Generally speaking, we determine the price of our products based on market price and our cost, while there’s an overall trend of increase to compensate for the inflation. Our price is usually more competitive than that of our major rivalry, mostly state owned enterprises (SOEs), because we have higher operating efficiency and better control over cost.
Market demand. The growth potential of our revenue depends on the market demand for our products. As the total market demand for these products is much larger than that is sufficient to absorb our production, and our products have been recognized as of high quality and competitive price, we can sell almost all of our production volume, and we believe that there’s high growth potential for our sales revenue, especially when our high-end products are put into the market.
Cost of Sales
Cost of sales generally consists of four major parts: raw materials, labor, production overhead and manufacturing related depreciation. Raw material mainly refers to soybean, and it accounts for the most significant part of the cost of sales (COS), or about 94%. Labor cost is relatively low and only makes up 0.3% of COS. Production overhead includes auxiliary materials, utility expenses, machinery maintenance costs, inspection costs and other related expenses. Depreciation costs are applied to manufacturing facilities and equipment, such as production lines, steam generators, factory buildings, etc.
Cost of sales is mainly determined by the following factors, directly or indirectly:
| The availability and price of raw materials, especially soybeans. |
| Output ratio and operating efficiency of production facilities. |
The availability and price of raw materials, especially soybeans. Raw material cost accounts for the major portion of COS, and soybean is the only major raw material, so the fluctuation in its price will have a material impact on our cost. The price of soybean may be affected by a series of factors, including the production volume of soybeans, the transactions of soybeans on futures market, etc. Meanwhile, if there’s shortage in supply of raw materials, our production facilities will have to operate at lower than the achievable maximum efficiency. As our processing volume occupies a relatively small portion of total soybean supply of Heilongjiang Province, let alone the whole China, we expect that this factor will have little influence over our cost.
Output ratio and operating efficiency of production facilities. Output ration is the ratio between the input of raw materials, mostly soybeans, and the output of products. The more units of products we can produce using a single unit of raw material, the higher the output ratio. As the labor, production overhead and manufacturing related depreciation expenses are mostly of a fixed nature, generally speaking, the more we produce, the lower the unit cost. Our output ratio and operating efficiency is being raised continuously, due to the recent purchase and renovation of facilities and equipment, the enhanced competence and proficiency of staff and the improvement in management skills.
Gross Profit
Gross profit is the result of the combined effects of the following factors: (a) the selling price of our products, (b) the sales volume and the individual profit margin of each product, and (c) the cost of sales. Currently the profit margin of our soybean oil and meal are relatively stable, so is gross profit. We expect that the overall gross profit will rise in the future, as we will be launching some high-end products with higher profit margin.
Operating Expenses
Operating expenses comprise of selling expenses and general & administrative expenses. Generally speaking, operating expenses occupy only a very small portion of total costs and expenses. For the past 2 years, the ratio of operating expenses as a percentage of net sales value was kept at lower than 1.3%.
Selling expenses generally include business development expenses, sales meeting expenses, loading & handling, advertising, and sales-related staff salaries and welfare expenses, and travel expenses. We expect that these expenses will rise materially in the following years, as we will be recruiting more sales staff and expanding sales network, establishing new sales channels, plus inputting investment in promotion and advertising, to promote and sale our new products.
General & administrative expenses cover the depreciation of office buildings and equipment, office expenses & supplies, management & administrative salaries, etc. These expenses are, generally speaking, more of a fixed nature. There may be increase in these expenses, as we will restructure our organizational structure and improve management institutions. Besides, we are now implementing our Sarbanes-Oxley Act compliance project of our internal control system and have engaged Ernst & Young as our consultant on this project. As this project involves the redesigning and restructuring of the whole internal control system and its processes, we expect that it will cause a material increase in our management expenses.
Income Tax
We are a company incorporated in the State of Nevada and Faith Winner (BVI) is incorporated under the laws of the British Virgin Islands, and we conduct all our operations under certain contractual arrangements with Yanglin, a PRC company.
Although we are subject to United States taxation, we do not anticipate incurring significant United States income tax liability for the foreseeable future because:
| | | we do not conduct any material business or maintain any branch office in the United States, |
| | | the earnings generated from our non-U.S. operating companies are generally eligible for a deferral from United States taxation until such earnings are repatriated to the United States, and |
| | | we believe that we will not generate any significant amount of income inclusions under the income imputation rules applicable to a United States company that owns "controlled foreign corporations" for United States federal income tax purposes. |
Therefore, we have made no provision for U.S. federal income taxes or tax benefits on the undistributed earnings and/or losses.
Yanglin, a PRC company has income tax liabilities in the PRC. PRC enterprise income tax is calculated based on taxable income determined under PRC accounting principles. In accordance with Income Tax Law applicable to domestic companies, we are generally subject to an enterprise income tax rate of 33% (30% state income taxes plus 3% local income taxes).
However, as Yanglin has been recognized as a Key Leading Enterprise in the Industrialization of Agriculture Industry by a collection of government agencies, including the National Committee of Reform and Development, the Department of Finance and the Department of Agriculture, we enjoy a complete exemption from income taxes. Our status is reviewed each two years. We are confident that we will continue to enjoy this status due to our size of operations and status in this industry.
Results of Operations
The following table shows the operating results for the years ended December 31, 2005, December 31, 2006 and December 31, 2007.
Consolidated Statement of Operations | | The year ended Dec. 31, 2005 ($) | | The year ended Dec. 31, 2006 ($) | | The year ended Dec. 31, 2007 ($) | |
| | | (audited) | | (audited) | | (audited) | |
| Sales Revenue (net of discounts, returns and allowances) | | | 38,107,145 | | | 88,078,494 | | 155,206,867 | |
| Other sales | | | 323,320 | | | - | | - | |
| Cost of sales | | | (35,132,664 | ) | | (79,862,179 | ) | (142,568,658 | ) |
| Gross Profit | | | 3,297,801 | | | 8,216,315 | | 12,638,209 | |
| Selling expenses | | | (43,094 | ) | | (63,209 | ) | (146,411 | ) |
| General and administrative expenses | | | (1,103,262 | ) | | (1,078,184 | ) | (1,825,498 | ) |
| Income from continuing operations | | | 2,151,445 | | | 7,074,922 | | 10,666,300 | |
| Interest expense, net | | | (150,370 | ) | | (219,032 | ) | (394,705 | ) |
| Other income | | | - | | | - | | 52,433 | |
| Other expense | | | - | | | - | | - | |
| Income before taxation | | | 2,001,075 | | | 6,855,890 | | 10,324,028 | |
| Income tax | | | - | | | - | | - | |
| Net Income | | | 2,001,075 | | | 6,855,890 | | 10,324,028 | |
| Foreign currency translation adjustment | | | 397,756 | | | 675,461 | | 2,466,192 | |
| Comprehensive income | | | 2,398,831 | | | 7,531,351 | | 12,790,220 | |
Year Ended December 31, 2007 Compared with Year Ended December 31, 2006
Net Sales
| | | For The Year Ended December 31 | | Period to Period Change | |
| Item | | 2007 Amount ($) | | 2006 Amount ($) | | Amount ($) | | % | |
Soybean meal | | | 92,563,442 | | | 58,770,932 | | | 33,792,510 | | | 57.5 | |
Soybean oil | | | 47,071,641 | | | 22,149,399 | | | 24,922,242 | | | 112.5 | |
Salad Oil | | | 15,571,784 | | | 7,158,163 | | | 8,413,621 | | | 117.5 | |
Total Net Sales | | | 155,206,867 | | | 88,078,494 | | | 67,128,373 | | | 76.2 | |
Net sales revenue was $155,206,867 for the year ended December 31, 2007, an increase of $67,128,373 or 76.2% from $88,078,494 for the year ended December 31, 2006. This is primarily due to the 24.7% increase in our processing volume and the resultant growth in sales volume, and the significant increase in the market price of soybean products. Three main products of ours, namely soybean meal, soybean oil and salad oil, achieved a year over year growth rate of 57.5%, 112.5% and 117.5% respectively.
In the year ended December 31, 2007, we processed 385,087 metric tons of soybeans and produced 308,069 tons of soybean meal, 49,576 tons of soybean oil and 15,238 tons of salad oil, compared to 309,161 metric tons of soybean, 245,948 tons of soybean meal, 38,700 tons of soybean oil and 11,863 tons of salad oil respectively for the previous year, achieving the growth rates of 24.6%, 25.3%, 28.1% and 28.4% respectively. In the year ended December 31, 2007, we sold 319,706 tons of soybean meal, 49,566 tons of soybean oil and 15,207 tons of salad oil, achieving the growth rates of 35.8%, 27.2% and 25.5% respectively over the year 2006 ended December 31, 2006 when we sold 235,338 tons of soybean meal, 38,960 tons of soybean oil and 12,118 tons of salad oil. We sold as much of our products as we could produce even though we increased our production volume in 2007. This is because the demand for soybean products in PRC market is large as compared to the total supply, and our sales also benefited from our efforts in capitalizing on the favorable reputation of our products among customers.
Meanwhile, the price of processed soybean products went up continuously during 2007, in line with the increasing soybean price. The average selling price of soybean meal increased by $40 or 15.9% from $250 per ton over the year ended December 31, 2006 to $290 per ton over the year ended December 31, 2007, while the price of soybean oil rose by $381 or 67.0% from $569 per ton to $950 per ton over the same period, and the price increase of salad oil over the period was $433 or 73.3%, from $591 per ton to $1,024 per ton. The comparison from another time spot perspective shows that The price of soybean oil rose from $840 per ton at the end of December of 2006 to $1,283 at the end of December of 2007, at a growth rate of 52.7%, and that of soybean meal jumped from $236 per ton at the end of December of 2006 to $417 per ton at the end of December of 2007, at a growth rate of 76.7%. This factor contributed to the significant increase in our sales revenue.
Cost of Sales and Gross Profit
| | | For The Year Ended December 31 | | Period to Period Change | |
| | | 2007 | | % of Sales | | 2006 | | %of Sales | | | | | |
| | | Amount ($) | | Revenue | | Amount ($) | | Revenue | | Amount ($) | | % | |
Soybean meal | | | (86,654,275 | ) | | 93.6 | | | (53,256,342 | ) | | 90.6 | | | 33,397,933 | | | 62.7 | |
Soybean oil | | | (42,075,631 | ) | | 89.4 | | | (20,080,631 | ) | | 90.7 | | | 21,995,000 | | | 109.5 | |
Salad Oil | | | (13,838,752 | ) | | 88.9 | | | (6,525,206 | ) | | 91.2 | | | 7,313,546 | | | 112.1 | |
Cost of Sales | | | (142,568,658 | ) | | 91.9 | | | (79,862,179 | ) | | 90.7 | | | 62,706,479 | | | 78.5 | |
| | | | | | | | | | | | | | | | | | | | |
Soybean meal | | | 5,909,167 | | | 6.4 | | | 5,514,590 | | | 9.4 | | | 394,577 | | | 7.2 | |
Soybean oil | | | 4,996,010 | | | 10.6 | | | 2,068,768 | | | 9.3 | | | 2,927,242 | | | 141.5 | |
Salad Oil | | | 1,733,032 | | | 11.1 | | | 632,957 | | | 8.8 | | | 1,100,075 | | | 173.8 | |
Gross Profit | | | 12,638,209 | | | 8.1 | | | 8,216,315 | | | 9.3 | | | 4,421,894 | | | 53.8 | |
Our cost of sales for the year ended December 31, 2007 rose by $62,706,479 or 78.5% over the year ended December 31, 2006, from $79,862,179 to $142,568,658, while the ratio of cost as a percentage to net sales value rose to 91.9% from 90.7% over the period. The main reasons for these changes were the significant increase in the price of soybeans and the significant increase of processing and production volume in 2007.
The rise in soybean price was caused by two reasons. First, the drought in the summer of 2007 caused soybean production volume to fall significantly in Heilongjiang province, with some of Heilongjiang’s soybean production areas witnessing a 60% fall in volume. Second, the continuously low price in 2006 and prior years discouraged the farmers from planting soybean, and this caused a shrink in the growing area of soybean in China, i.e. 12% less in 2007 than in 2006. The reduction in supply resulted in the average unit cost of soybeans rising to about $405 per ton for the year ended December 31, 2007, from around $236 per ton for the year ended December 31, 2006, an increase of approximately 72%. The comparison from a time spot perspective shows that The purchase price in our local area rose from $298 per ton at the end of December of 2006 which is approximately 73.2% to $515 at the end of December of 2007.
The rise in the ratio of cost as a percentage to net sales value was the product of the difference between the growth rate of the price of soybean, which is the major raw material and the cost of which constitutes the majority of cost of sales, and those of the prices of soybean products. As stated above, the average purchase price of soybean rose by 72% from 2006 to 2007. During the same period, the average selling price of soybean oil and salad oil increased by 67% and 73.4% respectively, more than sufficient to compensate for the increase in raw material cost, so their respective ratio of cost as a percentage to net sales value fell by 1.3% and 2.3%. However, the increase in the average selling price of soybean meal of 2007 over 2006 was only 15.9%, obviously insufficient to cover the rise in raw material cost, so it caused a 3% increase in the ratio of its cost as a percentage to its net sales value. As the sales volume of soybean meal was far larger than the aggregate of soybean oil and salad oil, for example 319,706 tons of soybean meal was sold in 2007 as compared to 64,773 tons of soybean oil and salad oil sold in total in that year, soybean meal has a major factor in determining the overall cost structure, so the overall ratio of cost as a percentage to net sales value grew by 1.2% from 2006 to 2007.
The unusual rise in soybean price caused the rise in the ratio of cost as a percentage to net sales value and, consequently, the fall in gross profit margin, from 9.3% in 2006 to 8.1% in 2007, though the absolute amount of gross profit enjoyed an increase of $4,421,894 or 53.8% at the same time. The growth in absolute value was mainly due to the increase in sales volume and sales price.
We expect that the ratio of cost as a percentage to net sales value may drop in 2008, as the yearly average purchase price of soybean of 2008 is expected to stabilize and fall as compare to that of 2007. The reasons are: first the drought is an exceptional event at an unusual scale; second, the significant increase in soybean price in 2007 has provided strong motives for farmers to expand the growing area of soybeans. As a result, we believe that the gross profit margin will rise gradually in the future. There are other reasons for this expected increase in gross profit margin: (1) our enhanced ability to reduce the effect of the fluctuating soybean prices, including sourcing soybean from other soybean production areas within Heilongjiang and expanding our soybean storage facilities; (2) further improvements of our production efficiency.
Operating Expenses
| | | For The Year Ended December 31 | | Period to Period | |
| | | 2007 | | % of Sales | | 2006 | | % of Sales | | Change | |
| | | Amount ($) | | Revenue | | Amount ($) | | Revenue | | Amount ($) | | % | |
| Selling Expenses | | | (146,411 | ) | | 0.09 | | | (63,209 | ) | | 0.07 | | | 83,202 | | | 131.6 | |
| General & Administrative Expenses | | | (1,825,498 | ) | | 1.17 | | | (1,078,184 | ) | | 1.22 | | | 747,314 | | | 69.3 | |
Total Operating Expenses | | | (1,971,909 | ) | | 1.27 | | | (1,141,393 | ) | | 1.29 | | | 830,516 | | | 72.8 | |
Selling expenses for the year ended December 31, 2007 increased by $83,202 or 131.6% over the year ended December 31, 2006. This was mainly due to the increase in sales-related shipping and handling expenses, which usually is related to sales volume directly. Another reason was that we had recruited more sales persons while raising the overall salary level of sales staff. As a percentage of net sales, selling expenses increased from 0.07% of 2006 to 0.09% of 2007.
General and administrative expenses for the year ended December 31, 2007 rose by $747,314 or 69.3%, from $1,078,184 for the year ended December 31, 2006, to $1,825,498 for the year ended December 31, 2007. The increase was primarily due to the management expenses, including legal, auditing, consulting and travel expenses, spent for the equity financing closed at October 3, 2007. As a percentage of net sales, general and administrative expenses fell from 1.22% for the year ended December 31, 2006 to 1.17% for the year ended December 31, 2007.
We expect that selling expenses will increase significantly in the following years when we launch our new high end products, as we need to expand our sales network and develop new sales channel, and to conduct much more promotion and advertising. General and administrative expenses may also go up, because we will reorganize our organizational structure to get ready for future expansion. In addition, there will be increased expenses spent in strengthening our reporting, compliance, internal controls and corporate governance systems to be compliant with relevant laws and regulations applicable to a U.S. listed company.
Income from Continuing Operations and Net Income
| | | For The Year Ended December 31 | | Period to Period | |
| | 2007 | | % of Sales | | 2006 | | %of Sales | | Change | |
| | | Amount ($) | | Revenue | | Amount ($) | | Revenue | | Amount ($) | | % | |
| Income from continuing operations | | | 10,666,300 | | | 6.9 | | | 7,074,922 | | | 8.0 | | | 3,591,378 | | | 50.8 | |
| Interest expenses, net | | | (394,705 | ) | | 0.25 | | | (219,032 | ) | | 0.24 | | | 175,673 | | | 80.2 | |
| Other income, net of expenses | | | 52,433 | | | 0.03 | | | - | | | - | | | 52,433 | | | 100 | |
| Income tax | | | - | | | | | | - | | | | | | | | | | |
Net income | | | 10,324,028 | | | 6.7 | | | 6,855,890 | | | 7.8 | | | 3,468,138 | | | 50.6 | |
| Foreign currency translation adjustment | | | 2,466,192 | | | | | | 675,461 | | | 0.76 | | | 1,790,731 | | | 265.1 | |
Comprehensive income | | | 12,790,220 | | | 8.2 | | | 7,531,351 | | | 8.6 | | | 5,258,869 | | | 69.8 | |
Income from continuing operations rose 50.8% or $3,591,378 for the year ended December 31, 2007, at $10,666,300, over the year ended December 31, 2006, at $7,074,922, thanks to the increase by 76.2% in sales revenue. At the same time, operating margin fell from 8.0% to 6.9%, due to the unexpected significant rise in soybean price as described above, as soybean purchasing costs constitute the major portion of our costs, while the ratio of selling expenses and general and administrative expenses as a percentage of net sales is quite small. We expect to see this ratio rise slightly in the future, as soybean price is expected to fall and stabilize by end of this year , and there would be further improvement of operating efficiency due to accumulation of skills and experience and larger economy of scales because of increasing sales volume.
Net interest expense increased by $175,673 or 80.2% from the year ended December 31, 2006 to the year ended December 31, 2007. As a percentage of net sales, net interest expense was 0.25% for the year ended December 31, 2007, compared to 0.24% for the year ended December 31, 2006. The increase was largely due to the higher demand for short term bank loan as the source of working capital in accordance to the large increase in our production volume. At December 31, 2007, the balance of short term loan was $12,305,000, almost doubling over the balance at December 31, 2006, $6,523,825.
Other income was $52,433 for the year ended December 31, 2007, where there was no other income for the year ended December 31, 2006.
Since we have been recognized as a Key Leading Enterprise in the Industrialization of Agriculture Industry by the government, so we can enjoy a complete exemption from income taxes. We are confident that in the foreseeable future we will continue to enjoy this favorable policy due to our size of operations and status in this industry.
Net income increased by $3,468,138 or 50.6% from the year ended December 31, 2006 to the year ended December 31, 2007. At the same time, net profit margin fell from 7.8% to 6.7%. This was for the same reason as income from continuing operations, as there was unexpected significant rise in the price of soybean, our major raw material.
As the exchange rate of China’s currency, RMB, against US Dollar keeps increasing, the average rate had risen from 1USD to 7.98189RMB in 2006 to 1USD to 7.61720RMB in 2007, so we have achieved $2,466,192 of foreign currency translation gains for the year ended December 31, 2007, compared to $675,461 for the year ended December 31, 2006. Due to this reason, the comprehensive income for the year ended December 31, 2007 reached $12,790,220, an increase of $5,258,869 or 69.8% over $7,531,351 for the year ended December 31, 2006. And such gains sufficiently compensated for the significant increase in soybean price, as the ratio of comprehensive income as a percentage of net sales for the year ended December 31, 2007 reached 8.2%, a little bit lower than 8.6% for the year ended December 31, 2006.
However, the change of foreign exchange rate can be affected by a series of complicated factors, including but not limited to, the government’s policy, the trend on global money market, the general economic status of the countries, etc., so we cannot estimate, with any reasonable certainty, the effect of these fluctuations on our future business, product pricing, results of operations or financial conditions, but the fluctuation of the RMB may materially and adversely affect your investment if the current trend of appreciation of RMB is reversed.
Year Ended December 31, 2006 Compared with Year Ended December 31, 2005
Net Sales
| | | For The Year Ended December 31 | | Period to Period Change | |
| Item | | 2006 Amount ($) | | 2005 Amount ($) | | Amount ($) | | % | |
Soybean meal | | | 58,770,932 | | | 25,439,483 | | | 33,331,449 | | | 131.0 | |
Soybean oil | | | 22,149,399 | | | 11,420,786 | | | 10,728,613 | | | 93.9 | |
Salad Oil | | | 7,158,163 | | | 1,052,868 | | | 6,105,295 | | | 579.9 | |
Soybean | | | - | | | 194,008 | | | (194,008 | ) | | -100 | |
Total Net Sales | | | 88,078,494 | | | 38,107,145 | | | 49,971,349 | | | 131.1 | |
Net sales revenue was $88,078,494 for the year ended December 31, 2006, an increase of $49,971,349 or 131.1% from that of $38,107,145 for the year ended December 31, 2005. This is primarily due to the 143.5% increase in our processing volume and the resultant growth in sales volume. Three main products of our,namely soybean meal, soybean oil and salad oil, have achieved a growth rate of 131.0%, 93.9% and 579.9%, respectively over 2006.
In the year ended December 31, 2006, we processed 309,161 metric tons of soybean, and produced 245,948 tons of soybean meal, 38,700 tons of soybean oil and 11,863 tons of salad oil, compared to 126,978 metric tons of soybean, 101,685 tons of soybean meal, 19,496 tons of soybean oil and 1,635 tons of salad oil, respectively, for the previous year, achieving a growth rate of 143.5%, 141.9%, 98.5% and 625.6%, repectively. This significant growth was primarily attributed to our Plant No. 3, which became operational at the very end of 2005. It added 300,000 tons of annual soybean processing capacity to the original capacity of 220,000 tons, and it was newly built by ourselves and equipped with brand new production lines and facilities.
In the year ended December 31, 2006, we sold 235,338 tons of soybean meal, 38,960 tons of soybean oil and 12,118 tons of salad oil, achieving a growth rate of 127.1%, 99.2% and 672.8%, respectively, over 103,650 tons of soybean meal, 19,563 tons of soybean oil and 1,568 tons of salad oil for the year ended December 31, 2005. We sold as much of our products as we could produce even though we increased our production volume in 2006. This is because the demand for soybean products in PRC market is large as compared to the total supply, and our sales also benefited from our efforts in capitalizing on the favorable reputation of our products among customers. Another important reason for sales growth was our efforts spent in reorganizing our sales network to remove inefficient use of sales resources and raised motivation for distributors.
Cost of Sales and Gross Profit
| | | For The Year Ended December 31 | | Period to Period Change | |
| | | 2006 | | % of Sales | | 2005 | | %of Sales | | | | | |
| | | Amount ($) | | Revenue | | Amount ($) | | Revenue | | Amount ($) | | % | |
Soybean meal | | | (53,256,342 | ) | | 90.6 | | | (23,541,691 | ) | | 92.5 | | | 29,714,651 | | | 126.2 | |
Soybean oil | | | (20,080,631 | ) | | 90.7 | | | (10,409,603 | ) | | 91.1 | | | 9,671,028 | | | 92.9 | |
Salad Oil | | | (6,525,206 | ) | | 91.2 | | | (984,096 | ) | | 93.5 | | | 5,541,110 | | | 563.0 | |
Soybean | | | - | | | - | | | (197,274 | ) | | 101.7 | | | (197,274 | ) | | (100 | ) |
Cost of Sales | | | (79,862,179 | ) | | 90.7 | | | (35,132,664 | ) | | 92.2 | | | 44,729,515 | | | 127.3 | |
| | | | | | | | | | | | | | | | | | | | |
Soybean meal | | | 5,514,590 | | | 9.4 | | | 1,897,792 | | | 7.5 | | | 3,616,798 | | | 190.6 | |
Soybean oil | | | 2,068,768 | | | 9.3 | | | 1,011,183 | | | 8.9 | | | 1,057,585 | | | 104.6 | |
Salad Oil | | | 632,957 | | | 8.8 | | | 68,772 | | | 6.5 | | | 564,185 | | | 820.4 | |
Soybean | | | - | | | - | | | (3,266 | ) | | (1.7 | ) | | 3,266 | | | 100.0 | |
Gross Profit | | | 8,216,315 | | | 9.3 | | | 2,974,481 | | | 7.8 | | | 5,241,834 | | | 176.2 | |
Our cost of sales for the year ended December 31, 2006 rose by $44,729,515 or 127.3% over the year ended December 31, 2005, from $35,132,664 to $79,862,179, while the ratio of cost as a percentage to net sales value dropped from 92.2% to 90.7% over the period. The main reason for the increase in cost of sales was the significant increase in processing and production volume.
In the year ended December 31, 2006, we processed 309,161 metric tons of soybean, and produced 245,948 tons of soybean meal, 38,700 tons of soybean oil and 11,863 tons of salad oil, compared to 126,978 metric tons of soybean, 101,685 tons of soybean meal, 19,496 tons of soybean oil and 1,635 tons of salad oil, respectively, for the previous year, achieving a growth rate of 143.5%, 141.9%, 98.5% and 625.6%, respectively. The cost of sales increase was in line with this significant growth in sales volume. The result was that the costs of soybean meal, soybean oil and salad oil grew only by 126.2%, 92.9% and 563% respectively. In the mean time, thanks to the high efficiency of Plant No. 3’s brand new equipment and the accumulation of the skills and experience of our staff, improved output ratio in production had helped to lower the ratio of costs of sales as a percentage of net sales, from 92.2% to 90.7%.
Gross profit was $8,216,315 for the year ended December 31, 2006, an increase of $5,241,834 or 176.2% from $2,974,481 for the year ended December 31, 2005. The main reasonfor this increase was the significant growth in sales volume as result of the increase in production volume and the reorganization of our sales network. The improvement in output ratio effectively lowered the ratio of costs of sales as a percentage of net sales and thus raised gross margin, from 7.8% to 9.3%.
Operating Expenses
| | | For The Year Ended December 31 | | Period to Period | |
| | | 2006 | | % of Sales | | 2005 | | %of Sales | | Change | |
| | | Amount ($) | | Revenue | | Amount ($) | | Revenue | | Amount ($) | | % | |
| Selling Expenses | | | (63,209 | ) | | 0.07 | | | (43,094 | ) | | 0.11 | | | 20,115 | | | 46.7 | |
| General & Administrative Expenses | | | (1,078,184 | ) | | 1.22 | | | (1,103,262 | ) | | 2.89 | | | (25,078 | ) | | (2.27 | ) |
Total Operating Expenses | | | (1,141,393 | ) | | 1.29 | | | (1,146,356 | ) | | 3.0 | | | (4,963 | ) | | (0.43 | ) |
Selling expenses for the year ended December 31, 2006 increased by $20,115 or 46.7% over the year ended December 31, 2005. This was mainly due to the increase in sales-related shipping and handling expenses, which usually is directly correlate with sales volume. As a percentage of net sales, selling expenses dropped from 0.11% to 0.07% over the year.
General and administrative expenses for the year ended December 31, 2006 fell by $25,078 or 2.27%, from $1,103,262 for the year ended December 31, 2005, to $1,078,184 for the year ended December 31, 2006. As a percentage of net sales, general and administrative expenses dropped from 2.89% to 1.22% over the year. The decrease was primarily due to the fairly fixed nature of many of our management expenses, like the depreciation of our office buildings and equipment, office expenses, supplies, administrative salaries, insurance, and utilities, while our sales revenue rose significantly over the year.
Income from Continuing Operations and Net Income
| | | For The Year Ended December 31 | | Period to Period | |
| | | 2006 | | %of Sales | | 2005 | | %of Sales | | Change | |
| | Amount ($) | | Revenue | | Amount ($) | | Revenue | | Amount ($) | | % | |
| Income from continuing operations | | | 7,074,922 | | | 8.0 | | | 2,151,445 | | | 5.6 | | | 4,923,477 | | | 228.8 | |
| Interest expenses, net | | | (219,032 | ) | | 0.24 | | | (150,370 | ) | | 0.39 | | | 68,662 | | | 45.7 | |
| Other income, net of expenses | | | - | | | - | | | - | | | - | | | - | | | - | |
| Income tax | | | - | | | - | | | - | | | - | | | - | | | - | |
Net income | | | 6,855,890 | | | 7.8 | | | 2,001,075 | | | 5.3 | | | 4,854,815 | | | 242.6 | |
| Foreign currency translation adjustment | | | 675,461 | | | 0.76 | | | 397,756 | | | 1.0 | | | 277,705 | | | 69.8 | |
Comprehensive income | | | 7,531,351 | | | 8.6 | | | 2,398,831 | | | 6.3 | | | 5,132,520 | | | 214.0 | |
Income from continuing operations rose 228.8% or $4,923,477 for the year ended December 31, 2006, at $7,074,922, over the year ended December 31, 2005, at $2,151,445, thanks mostly to the increase of 131.1% in sales revenue, while the ratio as a percentage of net sales of cost of sales and general and administrative expenses had dropped. As a result, operating margin rose from 5.6% to 8.0%, thanks to the improvement of operating efficiency due to the accumulation of skills and experience and largerer economy of scales .
Net interest expense increased by $68,662 or 45.7% from the year ended December 31, 2005 to the year ended December 31, 2006. The change was largely due to the higher demand for short term bank loan as the source of working capital in accordance to the large increase in our production volume. As a percentage of net sales, net interest expense was 0.24% for the year ended December 31, 2006, compared to 0.39% for the year ended December 31, 2005, due to the increase of 131.1% in sales revenue and the better efficiency in using the borrowings.
We have been recognized as a Key Leading Enterprise in the Industrialization of Agriculture Industry by the government, so we can enjoy a complete exemption from income taxes. We are confident that in the foreseeable future we will continue to enjoy this favorable policy due to our size of operations and status in this industry.
Net income increased by $4,854,815 or 242.6% from the year ended December 31, 2005 to the year ended December 31, 2006, while net profit margin rose from 5.3% to 7.8%. This was for the same reason as income from continuing operations, as there was an increase of 131.1% in sales revenue, while the ratio as a percentage of net sales of cost of sales and general and administrative expenses had dropped.
As the exchange rate of China’s currency, RMB, against US Dollar keeps increasing, the average rate had risen from 1USD to 8.20329RMB in 2005 to 1USD to 7.98189RMB in 2006, so we achieved $675,461 of foreign currency translation gains for the year ended December 31, 2006, compared to $397,756 for the year ended December 31, 2005. Partly due to this reason, the comprehensive income for the year ended December 31, 2006 reached $7,531,351, an increase of $5,132,520 or 214.0% over $2,398,831 for the year ended December 31, 2005.
However, the change of foreign exchange rate can be affected by a series of complicated factors, including but not limited to, the government’s policy, the trend on global money market, the general economic status of the countries, etc., so we cannot estimate, with any reasonable certainty, the effect of these fluctuations on our future business, product pricing, results of operations or financial conditions, but the fluctuation of the RMB may materially and adversely affect your investment if the current trend of appreciation of RMB is reversed.
Liquidity and Capital Resources
Generally, we finance our business with cash flow from operations and short-term bank loans and we use shareholders’ equity investment and retained earnings to meet capital expenditures.
Working capital mainly consists of raw materials purchases, salaries, production overhead (auxiliary materials, utilities, etc.) and finance expenses. Raw materials (soybean) purchases constitute the majority of our working capital.
Because we usually pay cash to our suppliers upon purchase of soybeans, there is a greater than normal need for cash around harvest season. Our pattern of operations is as follows: (i) we will keep a large cash reserve by early October, which is harvest time, and take short-term loans from banks at that time (ii) we will build up a substantial inventory of soybeans so that for the period till the end of the year and for the following half year, we will have sufficient raw materials to maintain smooth operations and convert finished products to cash, and (iii) we will repay the short-term loans that we had taken by the end of June or July the following year.
Our working capital requirements may be influenced by quite a few factors, including the fluctuation of raw material prices, cash flow, competition, our relationships with suppliers or customers, the availability of credit facilities and financing alternatives, none of which can be predicted with high level of certainty.
Operating Activities
Year Ended December 31, 2007 Compared with Year Ended December 31, 2006
Cash used in operating activities for the year ended December 31, 2007 was $4,866,156, while cash generated from operating activities for the year ended December 31, 2006 was $7,268,151. This drop was caused by the unusual and exceptionally significant rise in soybean price in year 2007 (please refer to section “Cost of Sales and Gross Profit” above in the comparison between the operating results of 2007 and 2006).
As mentioned above, the reduction in supply resulted in the fact that the average unit cost of our soybeans rose to about $405 per ton for the year ended December 31, 2007, from around $236 per ton for the year ended December 31, 2006, a growth rate of 72%. And the comparison of soybean prices from another angle shows that the purchase price in our local area rose from $298 per ton at the end of December of 2006 by 73.2% to $515 at the end of December of 2007. However, overall speaking, the rise in the average selling price of soybean products could not compensate for the increase in raw material cost (please refer to section “Cost of Sales and Gross Profit” above in the comparison between the operating results of 2007 and 2006).
Meanwhile, the demand for soybean had also increased greatly over the year. In the year ended December 31, 2007, we processed 385,087 tons metric tons of soybeans, compared to 309,161 metric tons of soybean of the previous year, achieving a growth rate of 24.6%. And to counter the supply shortage in 2007 and to prepare ourselves for satisfying higher production volume in 2008, we had built up significant stocks. At the end of 2006, our inventory level of soybeans was less than 17,800 tons, and it rose to over 35,000 tons at the end of 2007, an increase of 157%. The combined effect of these 2 factors resulted in a 321% growth in the cost of inventories maintained at the end of 2007, standing at $15.5 million, compared to only less than $3.7 million at the end of 2006.
For the above reasons, we had to spent a great more amount of cash on procuring and maintaining our inventories. In the year ended December 31, 2007, $9,712,307 cash was used in procuring and maintaining inventories. In addition, $5,508,012 cash was used as advances to suppliers. We used to pay almost ignorable advances to suppliers. However, due to the material fall in soybeans supply, we have to pay large advances to major suppliers to secure the supply of raw materials.
Our view is that the cash outflow in operating activities of 2007 was of a temporary and exceptional nature, and it was an isolated event, so it cannot be reasonably used to estimate the trend of our operational results in the future. The draught in 2007 was an unforeseeable event at an exceptional scale, and the rise of soybean price has put strong stimulation on farmers to grow soybeans, the availability of soybean and thus its price will be stabilized and its long-term trend is a falling one. Generally speaking, our cash flows are healthy and stable, as we have very large sales revenue and we sell mostly on cash basis, with ignorable A/R. Actually the situation has been improved greatly since the beginning of 2008. In the first 2 months, we have already achieved a net cash inflow from operations of about $1.65 million. We are confident to achieve a good cash flow from our operations in 2008.
Other major adjustments affecting cash flows from operating activities of 2007 are:
| (1) | An addition of $182,708 due to the collection of accounts receivables. |
| (2) | A reduction of $1,667,452 of prepaid VAT and other taxes, as they increased in line with purchase volume of raw materials. |
| (3) | An addition of $714,295 due to decrease in other receivables. |
| (4) | A reduction of $730,106 for decrease in accounts payables. |
| (5) | A reduction of $698,636 for decrease in other payables. |
| (6) | An addition of $152,225 due to increase in customers deposits. |
Year Ended December 31, 2006 Compared with Year Ended December 31, 2005
Cash generated from operating activities for the year ended December 31, 2006 was $7,268,151, compared to cash used in operating activities of $82,307 for the year ended December 31, 2005.
The major adjustments affecting cash flows from operating activities of 2007 are:
| (1) | An addition of $353,941 due to the decrease of accounts receivables. |
| (2) | A reduction of $1,814,596 for cash used in inventories. |
| (3) | An addition of $463,017 due to decrease in other receivables. |
| (4) | An addition of $166,753 due to increase in accounts payables. |
| (5) | A reduction of $142,442 for decrease in customers deposits. |
Investing Activities
Year Ended December 31, 2007 Compared with Year Ended December 31, 2006
Net cash used in investing activities for the year ended December 31, 2007 was $12,413,404, compared to $9,519,203 for the year ended December 31, 2006. The major item of investing activities in 2007 was $11,702,842 payment for construction in progress, which was primarily spent for the renovation of Plant No.2 and the construction of the production lines for new high end products and the related facilities in that plant.
We satisfied the demand for cash used in capital investment mostly with the proceeds from the equity financing completed on October 3, 2007 (please refer to section “Recent Events” in financing activities below), supplemented by our own cash reserves.
Year Ended December 31, 2006 Compared with Year Ended December 31, 2005
Net cash used in investing activities for the fiscal year ended December 31, 2006 was $9,519,203, compared to net cash used in investing activities of $7,298,639 for the year ended December 31, 2005. There were two major investing activities: $7,251,862 of payment for plant and equipment, and $2,267,341 of payment for land use rights. These amounts were mostly spent on two items: installments of the payment due after completion for the construction and equipment of Plant No. 3, which was completed at the end of 2005, and the purchase of new equipment and machinery for the two older plants, namely Plant No. 1 and No. 2.
We satisfied this cash need with our cash reserves brought forward from the year 2005 and cash generated from the year 2006 operations.
Financing Activities
Recent Events
On October 3, 2007, we completed, at a price of $2.15 per share, a private placement of 10,000,000 shares of Series A Convertible Preferred Stock, par value $0.001 per share and attached warrants to purchase Common Stock. The gross proceeds of the offering was $21.5 million.
Year Ended December 31, 2007 Compared with Year Ended December 31, 2006
Net cash provided by financing activities was $22,926,970 for the year ended December 31, 2007, compared to $2,222,504 for the year ended December 31, 2006. The major items for 2007 are:
| (1) | $17,849,093 of proceeds from issue of share capital and warrants. This was the proceeds from the private placement mentioned above. |
| (2) | $11,815,365 of bank borrowings. This was short-term bank loan to satisfy working capital needs. |
Year Ended December 31, 2006 Compared with Year Ended December 31, 2005
Net cash provided by financing activities was $2,222,504 for the year ended December 31, 2006, compared to $1,759,693 for the year ended December 31, 2005. The major items for 2006 are:
| (1) | $6,898,366 of bank borrowings. This was short-term bank loan to satisfy working capital needs. |
Loans
The balance of short-term bank loans was $12,305,000 at December 31, 2007, compared to $6,523,825 at December 31, 2006. This increase was mainly due to the huge increase in demand for working capital, caused mainly by both the increase need for raw materials to satisfy the material growth of processing volume and the exceptional and unexpected rise in soybean price (please refer to the section “Cost of Sales and Gross Profit” in the comparison between the operational results of 2007 and 2006 above).
The balance of our long-term bank loan was about $457,107 at December 31, 2007, plus a current portion of $47,433, payable within one year of balance sheet date.
Currently we have a credit line of up to RMB600 million, or about USD85.56 million using current exchange rate of 1USD to 7.0130RMB, based on our credit rank AA granted by Agricultural Development Bank. We believe that this would be sufficient for our future working capital needs at the current operation and capacity level.
Future Cash Commitments
We have made ambitious capital investment plans for six new projects between fiscal 2007 and fiscal 2008, estimated at a total value of over $20.4 million. This demand for investment capital will be mainly met with the proceeds from our private placement mentioned above, and partly with our cash reserves.
Critical Accounting Policies and Estimates
Management's discussion and analysis of its financial condition and results of operations are based upon our consolidated financial statements, which have been prepared in accordance with United States generally accepted accounting principles. Our financial statements reflect the selection and application of accounting policies which require management to make significant estimates and judgments. See note 1 to our consolidated financial statements, "Summary of Significant Accounting Policies and Organization". We believe that the following reflect the more critical accounting policies that currently affect our financial condition and results of operations:
Method of Accounting
Yanglin Soybean, Inc. (“the Company”) maintains its general ledger and journals with the accrual method accounting for financial reporting purposes. The financial statements and notes are representations of management. Accounting policies adopted by the Company conform to generally accepted accounting principles in the United States of America and have been consistently applied in the presentation of financial statements.
The share exchange transaction has been accounted for as a recapitalization of Victory Divide Mining Company (“VDMC”, the former name of Yanglin Soybean, Inc.) where the Company (the legal acquirer) is considered the accounting acquiree and Faith Winner (BVI) (the legal acquiree) is considered the accounting acquirer. As a result of this transaction, the Company is deemed to be a continuation of the business of Faith Winner (BVI).
Accordingly, the accompanying financial statements are those of the accounting acquirer: Faith Winner (BVI). The historical stockholders’ equity of the accounting acquirer prior to the share exchange has been retroactively restated as if the share exchange transaction occurred as of the beginning of the first period presented.
Principles of Consolidation
The consolidated financial statements, which include the Company and its subsidiaries, are complied in accordance with generally accepted accounting principles in the United States of America. All significant inter-company accounts and transactions have been eliminated. The consolidated financial statements include 100% of assets, liabilities, and net income or loss of those wholly-owned subsidiaries.
The company owned the three subsidiaries since its reverse-merger on October 3, 2007. Retroactively restated as of December 31, 2006, 2005, and 2004, the detailed identities of the consolidating subsidiaries would have been as follows:
| Name of Company | | Place of incorporation | | Attributable interest | |
| | | | | | |
| Faith Winner Investments Ltd | | | British Virgin Islands | | | 100 | % |
| | | | | | | | |
| Faith Winner (Jixian) Agriculture Development Company | | | PRC | | | 100 | % |
| | | | | | | | |
| Heilongjiang Yanglin Soybean Group Co. Ltd | | | PRC | | | 100 | % |
| *Note: This is a variable interest entity | | | | | | | |
Use of estimates
The preparation of the financial statements in conformity with generally accepted accounting principles in the United States of America requires management to make estimates and assumptions that affect the reported amounts of assets and liabilities and disclosure of contingent assets and liabilities at the date of the financial statements and the reported amounts of revenues and expenses during the reporting periods. Management makes these estimates using the best information available at the time the estimates are made; however actual results could differ materially from those estimates.
Economic and political risks
The operations of the Company, through its subsidiaries and Heilongjiang Yanglin Soybean Group Co., Ltd. (“Yanglin”) (hereinafter, collectively referred to as “the Group”), are conducted in the PRC. Accordingly, the Company’s business, financial condition and results of operations may be influenced by the political, economic and legal environment in the PRC, and by the general state of the PRC economy.
The Group’s operations in the PRC are subject to special considerations and significant risks not typically associated with companies in North America and Western Europe. These include risks associated with, among others, the political, economic and legal environment and foreign currency exchange. The Group’s results may be adversely affected by changes in the political and social conditions in the PRC, and by changes in governmental policies with respect to laws and regulations, anti-inflationary measures, currency conversion, remittances abroad, and rates and methods of taxation, among other things.
Land use rights
Land use rights are stated at cost less accumulated amortisation. Amortisation is provided over the respective useful lives, using the straight-line method. Estimated useful lives are arranging from 22 to 50 years.
Property, plant and equipment
Plant and equipment are carried at cost less accumulated depreciation. Depreciation is provided over their estimated useful lives, using the straight-line method. Estimated useful lives of the plant and equipment are as follows:
| | Buildings | 10 years | | |
| | Machinery and equipment | 3.5 - 30 years | | |
| | Office equipment | 4 - 20 years | | |
| | Motor vehicles | 10 years | | |
The cost and related accumulated depreciation of assets sold or otherwise retired are eliminated from the accounts and any gain or loss is included in the statement of income. The cost of maintenance and repairs is charged to income as incurred, whereas significant renewals and betterments are capitalized.
Accounting for the impairment of long-lived assets
The long-lived assets held and used by the Group are reviewed for impairment whenever events or changes in circumstances indicate that the carrying amount of assets may not be recoverable. It is reasonably possible that these assets could become impaired as a result of technology or other industry changes. Determination of recoverability of assets to be held and used is by comparing the carrying amount of an asset to future net undiscounted cash flows to be generated by the assets.
If such assets are considered to be impaired, the impairment to be recognized is measured by the amount by which the carrying amount of the assets exceeds the fair value of the assets. Assets to be disposed of are reported at the lower of the carrying amount or fair value less costs to sell.
During the reporting years, there was no impairment loss.
Inventories
Inventories consisting of finished goods, and raw materials are stated at the lower of cost or market value. Substantially all inventory costs are determined using the weighted average basis. Finished goods are comprised of direct materials, direct labor and an appropriate proportion of overhead.
Trade receivables
Trade receivables are recognized and carried at the original invoice amount less allowance for any uncollectible amounts. An allowance for doubtful accounts is maintained for all customers based on a variety of factors, including the length of time the receivables are past due, significant one-time events and historical experience. Bad debts are written off as incurred.
Cash and cash equivalents
The Company considers all highly liquid investments purchased with original maturities of three months or less to be cash equivalents. The Company maintains bank accounts only in the PRC. The Company does not maintain any bank accounts in the United States of America.
Foreign currency translation
The accompanying financial statements are presented in United States dollars. The functional The reporting currency of the Group is the U.S. dollar (US$). Faith Winner (Jixian) and Yanglin use its local currency, Renminbi (RMB), as its functional currency. Results of operations and cash flow are translated at average exchange rates during the period, and assets and liabilities are translated at the end of period exchange rates. Translation adjustments resulting from this process are included in accumulated other comprehensive income in stockholders’ equity. Transaction gains and losses that arise from exchange rate fluctuations from transactions denominated in a currency other than the functional currency are included in the results of operations as incurred.
The PRC government imposes significant exchange restrictions on fund transfers out of the PRC that are not related to business operations. These restrictions have not had a material impact on the Group because it has not engaged in any significant transactions that are subject to the restrictions.
The exchange rates used to translate amounts in RMB into US$ for the purposes of preparing the consolidated financial statements were as follows:
| | | 2007 | | 2006 | | 2005 | | 2004 | |
| Year end RMB : US$ exchange rate | | | 7.31410 | | | 7.81750 | | | 8.07340 | | | 8.28650 | |
| Average yearly RMB : US$ exchange rate | | | 7.61720 | | | 7.98189 | | | 8.20329 | | | 8.28723 | |
The RMB is not freely convertible into foreign currency and all foreign exchange transactions must take place through authorized institutions. No representation is made that the RMB amounts could have been, or could be, converted into US$ at the rates used in translation.
Revenue recognition
Revenue represents the invoiced value of goods sold recognized upon the delivery of goods to customers. Revenue is recognized when all of the following criteria are met: Persuasive evidence of an arrangement exists, delivery has occurred or services have been rendered, and the seller’s price to the buyer is fixed or determinable
Costs of sales
Cost of sales consists primarily of material costs, employee compensation, depreciation and related expenses, which are directly attributable to the production of products. Write-down of inventory to lower of cost or market is also recorded in cost of revenues.
Income taxes
The Group accounts for income tax using an asset and liability approach and allows for recognition of deferred tax benefits in future years. Under the asset and liability approach, deferred taxes are provided for the net tax effects of temporary differences between the carrying amounts of assets and liabilities for financial reporting purposes and the amounts used for income tax purposes. A valuation allowance is provided for deferred tax assets if it is more likely than not these items will either expire before the Group is able to realize their benefits, or that future realization is uncertain.
Statutory reserves
As stipulated by the PRC’s Company Law and as provided in the Faith Winner (Jixian), and Yanglin’s Articles of Association, Faith Winner and Heilongjiang Yanglin’s net income after taxation can only be distributed as dividends after appropriation has been made for the following:
| (1) | Making up cumulative prior years’ losses, if any; |
| (2) | Allocations to the “Statutory surplus reserve” of at least 10% of income after tax, as determined under PRC accounting rules and regulations, until the fund amounts to 50% of the Company's registered capital, which is restricted for set off against losses, expansion of production and operation or increase in registered capital; |
| (3) | Allocations of 5-10% of income after tax, as determined under PRC accounting rules and regulations, to the Company's “Statutory common welfare fund”, which is restricted for capital expenditure for the collective benefits of the Company's employees; and |
| (4) | Allocations to the discretionary surplus reserve, if approved in the shareholders’ general meeting. |
Comprehensive income
Comprehensive income is defined to include all changes in equity except those resulting from investments by owners and distributions to owners. Among other disclosures, all items that are required to be recognized under current accounting standards as components of comprehensive income are required to be reported in a financial statement that is presented with the same prominence as other financial statements. The Group’s current component of other comprehensive income is the foreign currency translation adjustment.
Recent accounting pronouncements
In September 2006, the SEC issued SAB No. 108, which provides guidance on the process of quantifying financial statement misstatements. In SAB No. 108, the SEC staff establishes an approach that requires quantification of financial statement errors, under both the iron-curtain and the roll-over methods, based on the effects of the error on each of the Company’s financial statements and the related financial statement disclosures. SAB No.108 is generally effective for annual financial statements in the first fiscal year ending after November 15, 2006. The transition provisions of SAB No. 108 permit existing public companies to record the cumulative effect in the first year ending after November 15, 2006 by recording correcting adjustments to the carrying values of assets and liabilities as of the beginning of that year with the offsetting adjustment recorded to the opening balance of retained earnings. The Company does not anticipate that the adoption of this standard will have a material impact on these financial statements.
In February 2007, FASB issued Statement of Financial Accounting Standards No. (“SFAS”) 159, “The Fair Value Option for Financial Assets and Financial Liabilities - Including an Amendment of FASB Statement No. 115” (“SFAS 159”). SFAS 159 permits entities to choose to measure many financial instruments and certain other items at fair value. Entities that elect the fair value option will report unrealized gains and losses in earnings at each subsequent reporting date. The fair value option may be elected on an instrument-by-instrument basis, with a few exceptions. SFAS 159 also establishes presentation and disclosure requirements to facilitate comparisons between entities that choose different measurement attributes for similar assets and liabilities. The requirements of SFAS 159 are effective for our fiscal year beginning on January 1, 2008.
The Company does not anticipate that the adoption of this standard will have a material impact on these financial statements.
In September 2006, the Financial Accounting Standards Board (“FASB”) issued Statement of Financial Accounting Standard (“SFAS”) No. 157, "Fair Value Measurements”. SFAS 157 defines fair value, establishes a framework for measuring fair value, and expands disclosures about fair value measurements. SFAS 157 is effective as of the beginning of the first fiscal year that begins after November 15, 2007. As such, the Company is required to adopt these provisions at the beginning of the fiscal year ended December 31, 2008. The Company is currently evaluating the impact of SFAS 157 on its consolidated financial statements.
In December 2007, the SEC issued Staff Accounting Bulletin No. 110 (“SAB 110”). SAB 110 permits companies to continue to use the simplified method, under certain circumstances, in estimating the expected term of “plain vanilla” options beyond December 31, 2007. SAB 110 updates guidance provided in SAB 107 that previously stated that the Staff would not expect a company to use the simplified method for share option grants after December 31, 2007. Adoption of SAB 110 is not expected to have a material impact on the Company’s consolidated financial statements
In December 2007, the Financial Accounting Standards Board issued Statement of Financial Accounting Standard (“SFAS”) No. 160, "Noncontrolling Interests in Consolidated Financial Statements, an amendment of ARB No. 51”. SFAS 160 establishes accounting and reporting standards for the noncontrolling interest in a subsidiary and for the deconsolidation of a subsidiary. SFAS 160 is effective for fiscal years, and interim periods within those fiscal years, beginning on or after December 15, 2008. As such, the Company is required to adopt these provisions at the beginning of the fiscal year ended December 31, 2009. The Company is currently evaluating the impact of SFAS 160 on its consolidated financial statements but does not expect it to have a material effect
In December 2007, the Financial Accounting Standards Board issued Statement of Financial Accounting Standard (“SFAS”) No. 141(R), "Business Combinations”. SFAS 141(R) establishes principles and requirements for how the acquirer recognizes and measures in its financial statements the identifiable assets acquired, the liabilities assumed, an any noncontrolling interest in the acquiree, recognizes and measures the goodwill acquired in the business combination or a gain from a bargain purchase, and determines what information to disclose to enable users of the financial statements to evaluate the nature and financial effects of the business combination. SFAS 141(R) is effective for fiscal years, and interim periods within those fiscal years, beginning on or after December 15, 2008. As such, the Company is required to adopt these provisions at the beginning of the fiscal year ended December 31, 2009. The Company is currently evaluating the impact of SFAS 141(R) on its consolidated financial statements but does not expect it to have a material effect.
Off-Balance Sheet Arrangements
We do not have any off-balance sheet arrangements.
Item 7A. Quantitative And Qualitative Disclosures About Market Risk
Market risk is the risk of loss to future earnings, to fair values or to future cash flows that may result from changes in the price of a financial instrument. The value of a financial instrument may change as a result of changes in interest rates, exchange rates, commodity prices, equity prices and other market changes. Our cash and cash equivalents are held for working capital purposes and consist primarily of bank deposits. We do not enter into investments for trading or speculative purposes.
Interest Rate Risk
We currently do not have any long-term debt. Our exposure to interest rate risk primarily relates to the interest income generated by excess cash invested in demand deposits. We have not used derivative financial instruments in our investment portfolio in order to reduce interest rate risk. Interest earning instruments carry a degree of interest rate risk and our future interest income may change, depending on market interest rate movement.
Foreign Currency Risk
Our business is operated in the PRC, and its value is effectively denominated in Renminbi. The fluctuation of foreign exchange rate between U.S. dollars and Renminbi could affect the value of our common stock. Our revenues and expenses are primarily denominated in Renminbi, and so our exposure to foreign exchange risks should generally be limited. We do not have material monetary assets and liabilities denominated in U.S. dollars, although to the extent that we do in the future, the fluctuation of foreign exchange rate would affect the value of these monetary assets and liabilities denominated in U.S. dollars. Generally, appreciation of Renminbi against U.S. dollars will devaluate the assets and liabilities denominated in U.S. dollar, while devaluation of Renminbi again U.S. dollars will appreciate the assets and liabilities denominated in U.S. dollar. In China, very limited hedging transactions are available to reduce our exposure to exchange rate fluctuations. To date, we have not entered into any hedging transactions in an effort to reduce our exposure to foreign currency exchange risk. While we may decide to enter into hedging transactions in the future, the availability and effectiveness of these hedges may be limited and we may not be able to successfully hedge our exposure at all.
Commodity Price Risk
We engage in manufacturing of non-genetically modified soybean-based products in the PRC. Our main raw materials are commodities. Our exposure to commodity price risk is directly related to fluctuations of PRC domestic market and indirectly related to that of international market.
Item 8. Financial Statements And Supplementary Data
Please refer to Item 15 “Exhibits and Financial Statement Schedules” of this report.
Item 9. Changes In and Disagreements With Accountants On Accounting and Financial Disclosure
On October 1, 2007, we dismissed S.W. Hatfield, CPA as our independent accountant. During the fiscal years 2005, 2006 and through the date of his dismissal, we had no disagreements with S.W. Hatfield, CPA on any matter of accounting principles or practices, financial statement disclosure, or auditing scope or procedure, which disagreements, if not resolved to the satisfaction of S.W. Hatfield, CPA, would have caused it to make reference to the subject matter of such disagreements in its report on our financial statements for such periods. During the fiscal years 2005, 2006 and through the date of his dismissal, there were no reportable events as defined under Item 304(a)(1)(v) of Regulation S-K adopted by the SEC.
On October 1, 2007, we retained Samuel H. Wong & Company, LLP as the new independent accountant. Samuel H. Wong & Company, LLP issued a report on the audited financial statements of Heilonjiang Yanglin Soybean Group Co. Ltd.. for the three years ended December 31, 2004, December 31, 2005, and December 31, 2006 which were included in our current report on Form 8-K filed on October 10, 2007. Samuel H. Wong & Company, LLP also reviewed the interim financial statements of Heilongjiang Yanglin Soybean Group Co., Ltd. for the three months ended March 31, 2007 and the six months ended June 30, 2007, and the proforma balance sheet of Victory Divide Mining Company as of June 30, 2007, which were also included in our current report on Form 8-K filed on October 10, 2007. Samuel H. Wong & Company, LLP also reviewed the interim financial statements of Victory Divide Company for the nine months ended September 30, 2007 which were included in our quarterly report on Form 10-Q filed on November 29, 2007. The reports and reviews did not contain an adverse opinion or disclaimer of opinion, nor was it modified as to uncertainty, audit scope or accounting principles. There were no disagreements with Samuel H. Wong & Company, LLP on any matter of accounting principles or practices, financial statement disclosure, or auditing scope or procedure, which, if not resolved to the satisfaction of Samuel H. Wong & Company, LLP, would have caused it to make reference to the subject matter of the disagreement(s) in connection with its reports.
On January 16, 2008, we dismissed Samuel H. Wong & Company, LLP as our independent accountant. On the same date, we retained Albert Wong & Company, LLP to serve as our principal independent accountant.
Item 9a. Controls And Procedures
Management’s Report on Internal Control over Financial Reporting
Management of the Company is responsible for establishing and maintaining adequate internal control over financial reporting and for the assessment of the effectiveness of internal controls over financial reporting. The Company's internal control system over financial reporting is a process designed under the supervision of the Company's Chief Executive Officer and Chief Financial Officer to provide reasonable assurance regarding the reliability of financial reporting and the preparation of the consolidated financial statements in accordance with United States generally accepted accounting principles (“U.S. GAAP”).
As required by Rule 13a-15 under the Securities Exchange Act, as amended, our management has carried out an evaluation, with the participation and under the supervision of our Chief Executive Officer and Chief Financial Officer, of the effectiveness of the design and operation of our disclosure controls and procedures as of December 31, 2007, using the criteria in the Internal Control-Integrated Framework issued by the Committee of Sponsoring Organizations of the Treadway Commission (COSO). Disclosure controls and procedures refer to controls and other procedures designed to ensure that information required to be disclosed in the reports we file or submit under the Securities Exchange Act is recorded, processed, summarized and reported within the time periods specified in the rules and forms of the SEC and that such information is accumulated and communicated to our management, including our Chief Executive Officer and Chief Financial Officer, as appropriate, to allow timely decisions regarding required disclosure. In designing and evaluating our disclosure controls and procedures, management recognizes that any controls and procedures, no matter how well designed and operated, can provide only reasonable assurance of achieving the desired control objectives, and management is required to apply its judgment in evaluating and implementing possible controls and procedures.
Management conducted its evaluation of disclosure controls and procedures under the supervision of our Chief Executive Officer and our Chief Financial Officer. Based upon, and as of the date of this evaluation, our Chief Executive Officer and Chief Financial Officer concluded that our disclosure controls and procedures contained significant deficiencies and material weaknesses. We believe that the deficiencies and weaknesses in our disclosure controls and procedures result from weaknesses in our internal controls over financial reporting. The significant deficiencies and material weaknesses include: there is no complete version of Code of Conduct has been formulated; there is lack of the articles for the board of directors and of independent directors; special committees of the board have not been established; no formal accounting manual has been issued; the procedures for managing the management procedures have not been stipulated. They will be described in details in the section “Management’s Remediation Initiatives and Interim Measures” below.
As we have disclosed in our prior SEC filings, we conduct all of our operations through our Chinese operating subsidiaries, which were privately owned until October 2007. At the time of their acquisition, these Chinese companies did not have in place the financial controls and procedures required of a U.S. public company. Now as a public company, we are implementing and will continue to implement remediation initiatives and interim measures with respect to our internal controls over financial reporting.
In the absence of full implementation of the remediation initiatives described below, we have undertaken additional measures in the interim to ensure that our consolidated financial statements included in this report were prepared in accordance with accounting principles generally accepted in the United States. Accordingly, the Company's management believes that the consolidated financial statements included in this report fairly present in all material respects the Company's financial condition, results of operations and cash flows for the periods presented and that this report does not contain any untrue statement of a material fact or omit to state a material fact necessary to make the statements made, in light of the circumstances under which such statements were made, not misleading with respect to the period covered by this report.
Management’s Remediation Initiatives and Interim Measures
The following is a description of each deficiency or weakness with respect to our internal controls over financial reporting identified by our outside auditors and the remediation initiatives that we have implemented or intend to implement in the near future.
| | 1) | The Company has not formulated a complete Code of Conduct applicable to all staff, with Chinese and English version, defining acceptable business conduct, conflict of interests and other expected moral behavior, and including anti-fraud mechanism. Also the procedure ruling the drafting, revision, reviewing, approval and issue of the Code should be formulated. Besides, no formal system has been set up for reporting of fraud. |
Remediation Initiative
We are now drafting a Code of Conduct and it will be reviewed and approved by the board of directors once formulated. The Code applies to all employees. Meanwhile we will formulate a procedure ruling the drafting, revision, reviewing, approval and issue of the Code. We will also establish a channel for issuing and communicating the Code of Conduct.
| | 2) | The Company does not have a formal system for employees to report and expose fraud. |
Remediation Initiative
Currently we have a hot-line system for reporting fraud. We will develop this into a formal mechanism of anti-fraud, and appoint a special department and certain employees to receive, record, investigate and follow up anti-fraud reports.
| | 3) | The Company currently does not have a complete set of Articles for the board of directors. The Company now does not have any independent director. |
Remediation Initiative
We are now drafting the Articles for the board of directors, which define the composition and the rights and responsibilities of the board, the terms of directors, the rules of meeting and other important aspects of the management of the board. We are now also seeking for appropriate candidates of at least 3 independent directors.
| | 4) | The special committees of the board, including audit committee, appointment committee and compensation committee, have not been established. |
Remediation Initiative
We will establish the committees and appoint qualified directors as their members. Audit committee will be formed by at least 3 directors with appropriate level of financial knowledge, within which there will be at least 1 financial expert.
| | 5) | The Company does not have an accounting policy manual based on U.S. GAAP and have not formulated formal procedures on the accounting treatment of significant transactions and processes. |
Remediation Initiative
We are now drafting the accounting manual and will include accounting policies and the detailed procedures of accounting treatments of business transactions and other affairs in it. We are seeking accountants skilled and experienced in several key areas of accounting, including Chinese accounting rules and U.S. GAAP, U.S. GAAP consolidation requirements, and SEC financial reporting requirements. In addition, we plan to allocate additional resources to train our existing accounting staff.
| | 6) | The Company does not have a formal procedure on review, update and approval of the management procedures. |
Remediation Initiative
We will formulate a formal procedure on the issue, and require written confirmation from key managers for the issue of management procedures. We will also conduct training when material change is made to the procedures.
Changes in Internal Controls over Financial Reporting
Other than the remediation measures described above, during the year ended December 31, 2007, there was no change in our internal controls over financial reporting that has materially affected, or that is reasonably likely to materially affect, our internal control over financial reporting.
This annual report does not include an attestation report of the Company’s registered public accounting firm regarding internal control over financial reporting. Management’s report was not subject to attestation by the Company’s registered public accounting firm pursuant to temporary rules of the Securities and Exchange Commission that permit the Company to provide only management’s report in this annual report.
Item 9b. Other Information
None.
PART III
Item 10. Directors, Executive Officers and Corporate Governance
Our Directors and Executive Officers
We have provided below certain information about our executive officers and directors. Our directors serve one-year terms or until their successors are elected Officers serve at the discretion of the board of directors.
Name | | Age | | Position |
| Shulin Liu | | 44 | | Chief Executive Officer/Director |
| Shaocheng Xu | | 33 | | Chief Financial Officer |
| Yang Miao | | 36 | | Director |
| Zongtai Guo | | 50 | | Director and Chief Operating Officer |
| Yulin Liu | | 51 | | President and General Manager of Heilongjiang Yanglin Soybean Group Co. Ltd |
| Shuhua Xia | | 56 | | Accounting Supervisor of Heilongjiang Yanglin Soybean Group Co. Ltd |
The following is a summary of the biographical information of our directors and officers:
Shulin Liu, is founder, Chairman and Chief Executive Officer of Yanglin. Mr. Liu is involved in Yanglin’s overall management and is responsible for establishing strategic directions. Prior to establishing Yanglin, between 1980 and 1983, Mr. Liu worked as a government officer in Shuangyashan Jixian County, Fuli Town. Subsequently, Mr. Liu assumed the positions of supervisor at the Shuangyashan Jixian County Land Authority, supervisor of the Minerals Resources Management Station, and manager of Labor Service Company of Land Bureau of Jixian County from 1983-992. Between 1992 and 1996, Mr. Liu was appointed General Manger of Jixian Construction Material Food and Oil Trading Company. From 1996-2000, he was manager of Jinxian County Longfu Food & Oil Trade Co. Ltd., Xiwang Feed Company, Jixian County Tianlin Food & Oil Co. Ltd in Jixian County. In 2001, he jointly established Jixian County Golden Land Oil Company Limited with Ms. Huanqin Ding and Mr. Shulin Liu and has been the Chief Executive Officer, Chairman and a director since. Mr. Liu holds a Master degree in Enterprise Management from Heilongjiang University.
Shaocheng Xu, was appointed as Yanglin’s Chief Financial Officer in March 2007. Previously, he worked as the Internal Control Supervisor at Citigroup Asia Pacific Operations Center from July 2005 to August 2006. From September 2001 to August 2004, he was the corporate management coordinator for United Automotive Electronics Systems Co., Ltd. Mr. Xu received his Bachelor of Arts in English from Foreign Affairs College of China in 1997. He is currently studying for a Master of Accounting with the Shanghai University of Finance and Economics. Mr. Xu is also soon to be qualified as a Professional Accountant with the Association of Chartered Certified Accountants (ACCA) of the United Kingdom.
Yang Miao, joined Yanglin the Vice President and Secretary to the Board of Directors. Previously, he served as the managing director of Redwood Capital Inc. from September 2005 to July 2006, and the managing director of Yuehai Zhongcheng Mechanical and Electrical Equipment Company. He worked for China National Overseas Engineering Corporation as expatriate an project manager from August 1995 to June 2002.
Zongtai Guo, joined Yanglin as its Vice President and Chief Operating Officer in 2006. Mr. Guo is responsible sales, operations and assists Mr. Shulin Liu, Yanglin’s President and Chief Executive Officer, in the strategic planning and the development of Yanglin. Prior to joining Yanglin, Mr. Guo was the Vice President of Qingdao Haoke Family Products Company between 2004 and 2005. From 2001 to 2003, he was an Assistant Manager at Heilongjiang Sanjiang Food Company. He also worked in Shanghai Yikun Food Company as its General Manager from 1999 to 2000. From 1994 to 1998, Mr. Guo also worked in various companies such as Hainan Longhua Company and China Xingnan Company and Heilongjiang Eight One Farm University as their Finance Manager. He graduated from Bayi Agriculture Development University of Heilongjiang Province, majoring degree in Enterprise Management and became a qualified accountant in the PRC in 1993.
Yulin Liu, was appointed Yanglin’s President and General Manager in March 2007. He is responsible for Yanglin’s day-to-day operations. Mr. Liu has a strong background in financial management. He worked as chief internal auditor of the Central Bank of Ji Xian County between 1986 and 1989. He was the vice president of Industrial and Commercial Bank of China, Ji Xian County between 1989 and 2001. From January 2002 to May 2005, he was the President of Industrial and Commercial Bank of China, Jianshan Branch and from May 2005 to February 2007, he was President of Industrial and Commercial Bank of China, Dianchang Branch. Mr. Liu graduated from Harbin Senior Finance College, majoring in Finance
Shuhua Xia, joined Yanglin as Chief Accountant in 2003. Ms. Xia is primarily responsible for Yanglin’s accounting and financial operations as well as its reporting requirements. Prior to joining Yanglin, Ms. Xia was the Finance Manager of Jixian Drying Tobacco Leaf Factory from 1991-2002. She also held various positions in Jixian Steel and Iron Factory including Finance Manager from 1986 to 1990, and Finance Supervisor from 1970 to 1983. Between 1983 and 1986, Ms. Xia pursued and obtained a Junior College degree from Jiamusi Engineering College.
There are no family relationships among our directors and executive officers except that Yulin Liu is the first cousin of Shulin Liu. There is no arrangement or understanding between or among our executive officers and directors pursuant to which any director or officer was or is to be selected as a director or officer, and there is no arrangement, plan or understanding as to whether non-management shareholders will exercise their voting rights to continue to elect the current board of directors.
Our directors and executive officers have not, during the past five years:
| | | had any bankruptcy petition foiled by or against any business of which was a general partner or executive officer, either at the time of the bankruptcy or within two years prior to that time, |
| | | been convicted in a criminal proceeding and is not subject to a pending criminal proceeding, |
| | | been subject to any order, judgment or decree, not subsequently reversed, suspended or vacated, of any court of competent jurisdiction, permanently or temporarily enjoining, barring, suspending or otherwise limiting his involvement in any type of business, securities, futures, commodities or banking activities; or |
| | | been found by a court of competent jurisdiction (in a civil action), the Securities Exchange Commission or the Commodity Futures Trading Commission to have violated a federal or state securities or commodities law, and the judgment has not been reversed, suspended or vacate |
Board Composition and Committees:
Our Board has four (4) members. We have not engaged any independent directors yet.
Audit Committee Financial Expert
Our board of directors currently acts as our audit committee. Because we only recently consummated the Share Exchange Agreement and the Share Purchase Agreement, our board of directors is still in the process of finding an “audit committee financial expert” as defined in Item 401(e) of Regulation S-B and is “independent” as that term is used in Item 7(d)(3)(iv) of Schedule 14A under the Securities Exchange Act.
Audit Committee
We have not yet formed an audit committee. At the present time, we believe that the members of board of directors are collectively capable of analyzing and evaluating our financial statements and understanding internal controls and procedures for financial reporting. We, however, recognize the importance of good corporate governance and intend to appoint an audit committee comprised entirely of independent directors, including at least one financial expert in the near future.
Compensation Committee
We do not presently have a Compensation Committee. Our board of directors presently acts as the Compensation Committee.
Nominating Committee
We do not presently have a Nominating Committee. Our board of directors presently acts as the Nominating Committee.
Section 16(a) Beneficial Ownership Reporting Compliance
Section 16(a) of the Exchange Act requires our executive officers, directors and beneficial owners of more than ten percent (10%) to report their beneficial ownership of equity interests in the company to the SEC. Their initial reports are required to be filed using the SEC's Form 3, and they are required to report subsequent purchases, sales, and other changes using the SEC's Form 4, which must be filed within two business days of most transactions. Officers, directors, and persons owning more than 10% of our capital shares are required by SEC regulations to furnish us with copies of all of reports they file pursuant to Section 16(a).
According to our records, Zhongtai Guo and Yang Miao has not filed their form 3 in a timely manner.
Code of Ethics
We currently do not have a Code of Ethics and the Board intends to adopt one in the near future.
Item 11 Executive Compensation
The Company’s executive compensation program is designed to pay key management personnel competitive remuneration based on the authority, responsibility and accountability of the position held by the individual. In addition, the Company considers the competitive environment relative to compensation paid to senior management with comparable job scope in companies in related industries and of approximate size.
The following is a summary of the compensation paid by the company to its executive officers for 2007 ended December 31, 2007 and for 2006 ended December 31, 2006. No other executive officers received compensation in excess of $100,000 for the year of 2007 and 2006.
Compensation Table
Name & Principal Position | | Year | | Salary (1) | | Bonus | | Non-Equity Incentive Plan Compensation | | All other Compensation | | Total | |
Shulin Liu (President and Chief Executive Officer ) | | 2007 2006 | | $ $ | 31,508 40,090 | | | 0 0 | | | 0 0 | | | 0 0 | | $ $ | 31,508 40,090 | |
Shaocheng Xu (Chief Financial Officer )(2) | | 2007 | | $ | 18,905 | | | 0 | | | 0 | | | 0 | | $ | 18,905 | |
Zongtai Guo (Chief Operational Officer ) | | 2007 2006 | | $ $ | 23,631 7,517 | | | 0 0 | | | 0 0 | | | 0 0 | | $ $ | 23,631 7,517 | |
Glenn A. Little (President, Chief Executive Officer Officer and Chief Financial) (3) | | 2007 2006 | | | 0 0 | | | 0 0 | | | 0 0 | | | 0 0 | | | 0 0 | |
Yulin Liu (President and General Manager of Heilongjiang Yanglin Soybean Group Co. Ltd)(4) | | 2007 | | $ | 23,631 | | | 0 | | | 0 | | | 0 | | $ | 23,631 | |
| (1) | The relevant exchange rates for financial years 2007 and 2006 are $1 to RMB7.6172 and $1 to RMB7.98189. |
| | |
| (2) | Shaocheng Xu, was appointed as Yanglin’s Chief Financial Officer in March 2007. |
| | |
| (3) | Mr. Little was appointed President, Chief Executive Officer and Chief Financial Officer in February 2006. He resigned from these positions effective October 3, 2007. |
| | |
| (4) | Yulin Liu, was appointed Yanglin’s President and General Manager in March 2007. |
Compensation Discussion & Analysis
Yanglin strives to provide its named executive officers (as defined in Item 402 of Regulation S-K) with a competitive base salary that is in-line with their roles and responsibilities when compared to peer companies of comparable size in the same or similar locality.
It is not uncommon for PRC private corporations in that locality to have base salaries as the sole and only form of compensation. The base salary level is established and reviewed based on the level of responsibilities, the experience and tenure of the individual and the current and potential contributions of the individual. The base salary is compared to the list of similar positions within comparable peer companies and with consideration of the executive’s relative experience in his or her position. Base salaries are reviewed periodically and at the time of promotion or other changes in responsibilities.
We plan to implement a more comprehensive compensation program, which takes into account other elements of compensation, including without limitation, short and long term compensation, cash and non-cash, and other equity-based compensation such as stock options. Such compensation program shall be comparative to our peers in the industry and aimed to retain and attract talented individuals.
We will also consider forming a Compensation Committee comprising predominantly of independent directors to oversee the compensation of our named executive officers.
Grants of Plan-Based Awards
The Company currently does not have any award plans. No options were granted to any officer in 2007.
Outstanding Equity Awards at Fiscal Year End
The Company currently does not have an equity compensation plan. No options or shares of stock were granted to any officer in 2007.
Option Exercises and Stock Vested
No options were exercised and no shares of stock were vested in 2007.
Pension Benefits
The Company does not have any pension plans for its officers.
Nonqualified Deferred Compensation
There was no nonqualified deferred compensation for the officers in 2007.
Potential Payment Upon Termination or Change in Control
The Company currently does not have payment arrangements for its officers upon termination or change in control.
Compensation of Directors
We have no formal or informal arrangements or agreements to compensate our directors for services they provide as directors. We plan to implement a compensation program for our independent directors, as and when they are appointed, which we anticipate will include such elements as an annual retainer, meeting attendance fees and stock options. The details of such compensation program will be negotiated with each such director.
The directors for Yanglin are not compensated for their services as directors up till now.
Item 12. Security Ownership Of Certain Beneficial Owners And Management And Related Shareholders Matters
The following table sets forth certain information with respect to the beneficial ownership of our voting securities following the closing of the Share Exchange Agreement and the Series A Convertible Preferred Stock Purchase Agreement by (i) any person or group owning more than 5% of each class of voting securities, (ii) each director, (iii) our chief executive officer and our top three most highly compensated officers and (iv) all executive officers and directors as a group as of March 31, 2008.
Name and Address of Beneficial Owner | | Amount and Nature of Beneficial Ownership (1) | | Percentage of Class (1) | |
| | | Series A | | Series B | | Common Stock | | | |
Owner of More than 5% of Class | | | | | | | | | |
| | | | | | | | | | | | | | |
Vision Opportunity Master Fund Ltd 20 West 55th Street, 5th Floor, New York, NY 10019-5373 | | | 3,720,930 | | | | | | | | | 37.2 | % |
| | | | | | | | | | | | | | |
Sansar Capital Special Opportunity Master Fund, LP (Cayman Master) Walkers SPV Ltd. Walkers House Mary Street 908GT Georgetown, Grand Cayman Cayman Islands | | | 2,767,442 | | | | | | | | | 27.7 | % |
| | | | | | | | | | | | | | |
Vicis Capital Master Fund 126 East 56th Streey, 7th Floor, New York, NY 10019-5373 | | | 2,093,023 | | | | | | | | | 20.9 | % |
| | | | | | | | | | | | | | |
Vision Opportunity Master Fund Ltd 20 West 55th Street, 5th Floor, New York, NY 10019-5373 (2) | | | | | | 3,382,664 | | | | | | 43.4 | % |
| | | | | | | | | | | | | | |
Sansar Capital Special Opportunity Master Fund, LP (Cayman Master) Walkers SPV Ltd. Walkers House Mary Street 908GT Georgetown, Grand Cayman Cayman Islands (2) | | | | | | 2,515,856 | | | | | | 32.3 | % |
| | | | | | | | | | | | | | |
Vicis Capital Master Fund 126 East 56th Streey, 7th Floor, New York, NY 10019-5373 (2) | | | | | | 1,902,748 | | | | | | 24.4 | % |
| | | | | | | | | | | | | | |
Vision Opportunity Master Fund Ltd 20 West 55th Street, 5th Floor, New York, NY 10019-5373 (7) | | | | | | | | | 18,283,985 | (3) | | 47.8 | % |
| | | | | | | | | | | | | | |
| Sansar Capital Special Opportunity Master Fund, LP (Cayman Master) (7) | | | | | | | | | 13,208,245 | (3) | | 39.8 | % |
Vicis Capital Master Fund 126 East 56th Streey, 7th Floor, New York, NY 10019-5373 (7) | | | 9,989,429 | (3) | | 33.3 | % |
| | | | | | | | |
Winner State Investments Limited No. 99, Fanrong Street, Jixian Town, Heilongjiang, the People’s Republic of China. | | | 18,200,000 | (4)(5) | | 91.0 | % |
| | | | | | | | |
Directors and Executive Officers | | | | | | | |
Shulin Liu 99 Fanrong Street, Jixian County, Heilongjiang Province, People’s Republic of China 155900 | | | 9,100,000 | (5) | | 45.5 | % |
| | | | | | | | |
| Yang Miao | | | 100,000 | | | 0.5 | % |
| | | | | | | | |
All Directors and Executive Officers | | | 9,200,000 | | | 46 | % |
| (1) | In determining beneficial ownership of our preferred stock, the number of shares shown includes shares which the beneficial owner may acquire upon exercise of warrants or options which may be acquired within 60 days. In determining the percent of preferred stock owned by a person or entity on March 31, 2008, (a) the numerator is the number of shares of the class beneficially owned by such person or entity, including shares which the beneficial ownership may acquire within 60 days of exercise of warrants or options, and (b) the denominator is the sum of (i) the total shares of that class outstanding on March 31, 2008, and (ii) the total number of shares that the beneficial owner may acquire upon exercise of the warrants and option. Unless otherwise stated, each beneficial owner has sole power to vote and dispose of its shares. |
In addition, in determining the percent of common stock owned by a person or entity on March 31, 2008, (a) the numerator is the number of shares of the class beneficially owned by such person and includes shares which the beneficial owner may acquire within 60 days upon conversion or exercise of a derivative security, and (b) the denominator is the sum of (i) the shares of that class outstanding on March 31, 2008, (20,000,000 shares of Common Stock)and (ii) the total number of shares that the beneficial owner may acquire upon conversion or exercise of a derivative security within such 60 day period. Unless otherwise stated, each beneficial owner has sole power to vote and dispose of the shares.
| (2) | On October 3, 2007, we entered and consummated a Series A Preferred Agreement for the sale of a total of 10,000,000 shares of our newly designated Series A Preferred Shares. Pursuant to the Series A Preferred Agreement, each purchaser who purchases not less than $4 million worth of Series A Preferred Shares shall also be issued a Series J Warrant, to purchase such number of our newly designated Series B Preferred Shares, equal to the Purchase Price (as defined in the Series A Preferred Agreement) paid by such purchaser pursuant to this Agreement divided by $2.37 or, if the Purchase Price is reduced pursuant to Section 1.6 of the Agreement, 110% of the adjusted per share Purchase Price. Vision Opportunity Master Fund Ltd, Sansar Capital and Vicis Master Fund have exceeded this threshold and have been granted a Series J Warrant to purchase 3,382,664, 2,515,856 and 1,902,748 shares of our Series B Preferred Shares respectively. |
| (3) | Each Series A Preferred Share is convertible, at the option of the holder, into one share of our Common Stock. Accordingly, in total, the Series A Preferred Shares are convertible into 10,000,000 shares of our Common Stock. |
Pursuant to the Series A Preferred Agreement, the Purchasers shall also be issued (i) Series A Warrants to purchase the number of shares of our Common Stock equal to one hundred percent (100%) of the number of shares of Common Stock issuable upon conversion of the Series A Preferred Shares purchased by each Purchaser and (ii) Series B Warrants to purchase the number of shares of Common Stock equal to fifty percent (50%) of the number of shares of Common Stock issuable upon conversion of the Series A Preferred Shares purchased by each Purchaser.
| | Also, each Purchaser who purchases not less than $4 million worth of Series A Preferred shall also be issued (i) a Series J Warrant, to purchase such number of our newly designated Series B Preferred Shares, par value $0.001 per share, (ii) a Series C Warrant to purchase the number of shares of Common Stock equal to one hundred percent (100%) of the number of Series B Preferred Shares purchased by such Purchaser pursuant to the Series J Warrant, and (z) a Series D Warrant to purchase the number of shares of Common Stock equal to fifty percent (50%) of the number of Series B Preferred Shares purchased by such Purchasers pursuant to the Series J Warrant. |
Pursuant to Section 3.27 of the Series A Preferred Agreement, at no time may a Purchaser of preferred shares convert their preferred shares into shares of our Common Stock if the number of shares of Common Stock to be issued pursuant to such conversion would exceed, when aggregated with all other shares of Common Stock beneficially owned by such Purchaser at such time, the number of shares of Common Stock which would result in such Purchaser beneficially owning (as determined in accordance with Section 13(d) of the Exchange Act and the rules thereunder) in excess of 4.99% of the then issued and outstanding shares of Common Stock; provided, however, that upon a Purchaser providing us with sixty-one (61) days notice that such Purchaser wishes to waive the cap, then the cap will be of no force or effect with regard to all or a portion of the preferred shares referenced in the waiver notice.
| (4) | On October 3, 2007, we acquired Faith Winner (BVI) in a share exchange transaction with Winner State (BVI), Fang Chen, Yang Miao and Ying Zhang. Winner State (BVI), Fang Chen, Yang Miao and Ying Zhang are collectively the owners of 100% of the Faith Shares. |
In the Share Exchange, we received the Faith Shares from Winner State (BVI), Fang Chen, Yang Miao and Ying Zhang and in exchange we issued and delivered to them 18,500,000 of our newly -issued shares of Common Stock. Winner State (BVI) received 18,200,000 shares of Common Stock.
| (5) | Winner State (BVI) is jointly owned in equal shares by Mr. Shulin Liu, our Chief Executive Officer and his wife, Ms. Huanqin Ding. Accordingly, shares of Common Stock issued to Winner State (BVI) as a result of the consummation of the Share Exchange Agreement are beneficially attributed to Mr. Shulin Liu and Ms. Huanqin Ding based on their respective shareholder percentage ownership in Winner State (BVI) immediately prior to the Share Exchange. Mr Shulin Liu was appointed our director and Chief Executive Officer on October 3, 2007. |
| (6) | Mr. Glenn Little was appointed our President, Chief Executive Officer and Chief Financial Officer in February 2006. He resigned from these positions effective October 3, 2007. He resigned from his position as director on October 13, 2007. |
| (7) | As of March 31, 2008, below is a breakdown of the current holdings of: |
Name | | Amount and Nature of Beneficial Ownership | |
| | | Preferred Stock | | Common Stock | | Warrants | |
| | | Series A | | Series B | | | | A | | B | | J | | C | | D | |
| Vision Opportunity Master Fund Ltd | | | 3,720,930 | | | — | | | 525,000 | | | 3,720,930 | | | 1,860,465 | | | 3,382,664 | | | 3,382,664 | | | 1,691,332 | |
| Sansar Capital Special Opportunity Master Fund, LP (Cayman Master) | | | 2,767,442 | | | — | | | — | | | 2,767,442 | | | 1,383,721 | | | 2,515,856 | | | 2,515,856 | | | 1,257,928 | |
| Vicis Capital Master Fund | | | 2,093,023 | | | — | | | — | | | 2,093,023 | | | 1,046,512 | | | 1,902,748 | | | 1,902,748 | | | 951,374 | |
As of March 31, 2008, we had outstanding (i) 20,000,000 shares of Common Stock, (ii) 10,000,000 shares of Series A Preferred Shares, which were issued in a private placement to the Purchasers under the Series A Preferred Agreement, (iii) Series A Warrants to purchase an aggregate of 10,000,000 shares of Common Stock at $2.75 per share, (iv) Series B Warrants to purchase an aggregate of 5,000,000 shares of Common Stock at $3.50 per share, (v) Series J Warrants to purchase an aggregate of 7,801,268 shares of Series B Preferred Shares at $2.37 per share; (vi) Series C Warrants to purchase an aggregate of 7,801,268 shares of Common Stock at $3.03 per share, (vii) Series D Warrants to purchase an aggregate of 3,900,634 shares of Common Stock at $3.85 per share, (viii) Series E Warrants to purchase 1,000,000 shares of Common Stock issued to Kuhns Brothers, Inc. and its designees under the Kuhns Bros Engagement Agreement at $2.58 per share and (ix) Series F Warrants to purchase 500,000 shares of Common Stock issued to Mass Harmony Asset Management Limited pursuant to the Mass Harmony Financial Consulting Agreement at $3.01 per share.
Each of Series A, B, C, D, E and F Warrants have five year terms. Series J Warrants have an eighteen (18) month term. The Series C and D Warrants are only exercisable once the Series J Warrant is exercised.
Item 13. Certain Relationships and Related Transactions
Consulting Agreement
On October 3, 2007, we entered into a consulting agreement (“Consulting Agreement”) with our ex-President, Chief Executive Officer and Chief Financial Officer, Glenn A. Little. Pursuant to the Consulting Agreement, the services to be performed by Mr. Little include providing advice, information and true and correct copies of documents regarding our historical records and operations to our auditors, attorneys, officers and directors, and signing such documents as they may reasonably request and providing information to the extent the requested information is reasonably available to Mr. Little. In consideration thereof, Mr. Little will be paid the sum of $550,000; provided, however, that as a condition to the making of the foregoing payment, he shall have: (i) delivered a resignation from all officer positions effective upon delivery, (ii) delivered a resignation as director which shall be effective on the tenth (10th) day after we mail a Schedule 14f-1 to our shareholders of record; and (iii) appointed Mr. Shulin Liu as our director and Chief Executive Officer and Mr. Shaocheng Xu as our Chief Financial Officer. Mr. Little completed the provision of the services and was paid $550,000 as provided in the Consulting Agreement on October 4, 2007.
Share Exchange Agreement
On October 3, 2007, we acquired Faith Winner (BVI) in a share exchange transaction with Winner State (BVI), Fang Chen, Yang Miao and Ying Zhang. Both Faith Winner (BVI) and Winner State (BVI) are companies incorporated in the British Virgin Islands. Winner State (BVI), Fang Chen, Yang Miao and Ying Zhang were collectively the owners of 100% of the outstanding voting stock of Faith Winner (BVI) (such shares, the “Faith Shares”; and such transaction, the “Share Exchange”).
In the Share Exchange, we received the Faith Shares from Winner State (BVI), Fang Chen, Yang Miao and Ying Zhang and in exchange we issued and delivered to them 18,500,000 of our newly -issued shares of $0.001 par value common stock. The Share Exchange was effected pursuant to the terms of an agreement among us and Winner State (BVI), Fang Chen, Yang Miao and Ying Zhang executed on the date of the Share Exchange (the “Share Exchange Agreement”).
As a result of the consummation of the Share Exchange Agreement, (i) we ceased to be a shell company as that term is defined in Rule 12b-2 under the Exchange Act, (ii) Faith Winner (BVI) is now our wholly-owned subsidiary, and (iii) through its newly-acquired subsidiary, Faith Winner (Jixian) Agriculture Development Company or WFOE, we now indirectly control, through a series of contractual arrangements, the business of Yanglin.
Mass Harmony Financial Consulting Agreement
On November 2, 2006, Yanglin entered into a Financial Consulting Agreement (the “MHA Agreement”) with Mass Harmony Asset Management Limited (“MHA”). Pursuant to the MHA Agreement, Yanglin is to pay MHA an aggregate of RMB300,000 (approximately US$39,891), half of which is payable within five business days upon the execution of the MHA Agreement, and the balance is due within five business days after the closing of a reverse merger.
Additionally. MHA is also to receive 1% of the issued and outstanding common stock of the Company post-private placement (including the underlying common stock of the Series A Preferred Stock) and warrants to purchase common stock of the Company valued at 5% of the dollar amount of private placement at an exercise price of 140% of the Series A Preferred Stock price. i.e. 500,000 warrants.
The services MHA shall render, pursuant to the MHA Agreement includes initial due diligence on Yanglin, preparing Yanglin’s business plan and assisting in the corporate restructuring and financial documentation. Our incumbent director, Yang Miao is the Managing Director and a shareholder of MHA.
Procedures for Approval of Related Party Transactions
Our policy is that our board of directors is charged with reviewing and approving all potential related party transactions. All such related party transactions are then required to be reported under applicable SEC rules. Otherwise, we have not adopted procedures for review of, or standards for approval of, these transactions, but instead review such transactions on a case-by-case basis.
Item 14. Principal Accounting Fees And Services
October 1, 2007, we retained Samuel H. Wong & Company, LLP as the new independent accountant. Samuel H. Wong & Company, LLP issued a report on the audited financial statements of Heilonjiang Yanglin Soybean Group Co. Ltd.. for the three years ended December 31, 2004, December 31, 2005, and December 31, 2006 which were included in our current report on Form 8-K filed on October 10, 2007. Samuel H. Wong & Company, LLP also reviewed the interim financial statements of Heilongjiang Yanglin Soybean Group Co., Ltd. for the three months ended March 31, 2007 and the six months ended June 30, 2007, and the proforma balance sheet of Victory Divide Mining Company as of June 30, 2007, which were also included in our current report on Form 8-K filed on October 10, 2007. Samuel H. Wong & Company, LLP also reviewed the interim financial statements of Victory Divide Company for the nine months ended September 30, 2007 which were included in our quarterly report on Form 10-Q filed on November 29, 2007.
On January 16, 2008, we dismissed Samuel H. Wong & Company, LLP as our independent accountant. On the same date, we retained Albert Wong & Company, LLP to serve as our principal independent accountant.
All of the services described below were approved by our board prior to performance. Our board has determined that the payments made to its independent accountant for these services are compatible with maintaining such auditor's independence.
Audit Fees. The aggregate fees billed by Samuel H. Wong & Company, LLP, for professional services rendered for the audit of the company’s financial statements for the three years ended December 31, 2004, December 31, 2005, and December 31, 2006 as well as for the review of the interim financial statements ended September 30, 2007 are $150,000.
The aggregate fees billed by Albert Wong & Company, LLP for professional services rendered for the audit of the company’s financial statements for the four years ended December 31, 2004, December 31, 2005, December 31, 2006 and December 31, 2007 are $90,000.
Audit-Related Fees. There were no fees for assurance and related services by Samuel H. Wong & Company, LLP or Albert Wong & Company, LLP.
Tax Fees. There were no fees for services for the income tax returns in US by Samuel H. Wong & Company, LLP or Albert Wong & Company, LLP.
All Other Fees. There was no other fees for either audit-related or non-audit services billed by Samuel H. Wong & Company, LLP or Albert Wong & Company, LLP.
PART IV
Item 15. Exhibits And Financial Statement Schedules
(a) (1) Financial Statements
(2) Financial Statement Schedules
None
YANGLIN SOYBEAN INC. (FORMERLY KNOWN AS VICTORY DIVIDE MINING COMPANY)
CONSOLIDATED FINANCIAL STATEMENTS
DECEMBER 31, 2007, 2006, 2005 AND 2004
(Stated in US dollars)
YANGLIN SOYBEAN INC. F/K/A VICTORY DIVIDE MINING COMPANY
| CONTENTS | | PAGES |
| | | |
| REPORT OF INDEPENDENT REGISTERED PUBLIC ACCOUNTING FIRM | | 58 |
| | | |
| CONSOLIDATED BALANCE SHEETS | | 59 – 60 |
| | | |
| CONSOLIDATED STATEMENTS OF INCOME AND COMPREHENSIVE INCOME | | 61 |
| | | |
| CONSOLIDATED STATEMENTS OF STOCKHOLDERS’ EQUITY | | 62 |
| | | |
| CONSOLIDATED STATEMENTS OF CASH FLOWS | | 63 |
| | | |
| NOTES TO CONSOLIDATED FINANCIAL STATEMENTS | | 64 – 81 |
ALBERT WONG & CO. CERTIFIED PUBLIC ACCOUNTANTS 7th Floor, Nan Dao Commercial Building 359-361 Queen’s Road Central Hong Kong Tel : 2851 7954 Fax: 2545 4086 ALBERT WONG B.Soc., Sc., LL.B., P.C.LL., Barrister-at-law, C.P.A.(Practising). | |
To: The board of directors and stockholders of
Yanglin Soybean Inc.
Report of Independent Registered Public Accounting Firm
We have audited the accompanying consolidated balance sheets of Yanglin Soybean Inc. and subsidiaries as of December 31, 2007, 2006, 2005 and 2004 and the related consolidated statements of income, stockholders' equity and cash flows for the years then ended. These consolidated financial statements are the responsibility of the Company's management. Our responsibility is to express an opinion on these consolidated financial statements based on our audit.
We conducted our audit in accordance with standards of the Public Company Accounting Oversight Board (United States). Those standards require that we plan and perform the audit to obtain reasonable assurance about whether the financial statements are free of material misstatement. An audit includes examining, on a test basis, evidence supporting the amounts and disclosures in the financial statements. An audit also includes assessing the accounting principles used and significant estimates made by management, as well as evaluating the overall financial statement presentation. We believe that our audits provide a reasonable basis for our opinion.
In our opinion, the consolidated financial statements referred to above present fairly, in all material respects, the consolidated financial position of Yanglin Soybean Inc. as of December 31, 2007, 2006, 2005 and 2004 and the results of its operations and its cash flows for the years then ended in conformity with accounting principles generally accepted in the United States of America.
| Hong Kong | Albert Wong & Co. |
| March 29, 2008 | Certified Public Accountants |
YANGLIN SOYBEAN INC. F/K/A VICTORY DIVIDE MINING COMPANY | | | | | | | |
| | | | | | | | | | | | |
CONSOLIDATED BALANCE SHEETS | | | | | | | | | | | |
AS AT DECEMBER 31, 2007, 2006, 2005 AND 2004 | | | | | | | | | |
(Stated in US Dollars) | | | | | | | | | | | |
| | | | | | | | | | | | |
| | | Notes | | 2007 | | 2006 | | 2005 | | 2004 | |
ASSETS | | | | | | | | | | | |
| Current assets | | | | | | | | | | | |
| Cash and cash equivalents | | | 2(j | ) | $ | 9,210,121 | | $ | 3,013,520 | | $ | 2,946,423 | | $ | 8,435,453 | |
| Pledged deposits | | | 4 | | | 500,000 | | | - | | | - | | | - | |
| Accounts receivable | | | 2(i)&5 | | | 13,854 | | | 190,989 | | | 534,866 | | | 536,452 | |
| Inventories | | | 2(h)&7 | | | 17,883,652 | | | 7,268,594 | | | 5,244,189 | | | 3,256,755 | |
| Advances to suppliers | | | | | | 5,736,267 | | | - | | | 1,526 | | | 5,584 | |
| Prepaid VAT and other taxes | | | | | | 2,457,137 | | | 674,184 | | | 607,383 | | | 314,680 | |
| Other receivables | | | 6 | | | 27,896 | | | 124,767 | | | 577,496 | | | 520,554 | |
| | | | | | | | | | | | | | | | | |
| | | | | | | | | | | | | | | | | |
| Total current assets | | | | | $ | 35,828,927 | | $ | 11,272,054 | | $ | 9,911,883 | | $ | 13,069,478 | |
| Property, plant and equipment, net | | | 2(f)&8 | | | 22,563,196 | | | 20,557,531 | | | 15,646,165 | | | 6,177,618 | |
| Land use rights, net | | | 2(e)&9 | | | 3,444,081 | | | 3,416,162 | | | 1,118,471 | | | 1,117,938 | |
| Prepaid deposits for equipment and | | | | | | | | | | | | | | | | |
| construction | | | | | | 8,896,327 | | | - | | | 414,314 | | | 89,164 | |
| | | | | | | | | | | | | | | | | |
| | | | | | | | | | | | | | | | | |
TOTAL ASSETS | | | | | $ | 70,732,531 | | $ | 35,245,747 | | $ | 27,090,833 | | $ | 20,454,198 | |
| | | | | | | | | | | | | | | | | |
See notes to consolidated financial statements
YANGLIN SOYBEAN INC. F/K/A VICTORY DIVIDE MINING COMPANY | | | | | | | |
| | | | | | | | | | | | |
CONSOLIDATED BALANCE SHEETS | | | | | | | | | | | |
AS AT DECEMBER 31, 2007, 2006, 2005 AND 2004 | | | | | | | | | |
(Stated in US Dollars) | | | | | | | | | | | |
| | | | | | | | | | | | |
| | | Notes | | 2007 | | 2006 | | 2005 | | 2004 | |
LIABILITIES AND | | | | | | | | | | | |
STOCKHOLDERS’ EQUITY | | | | | | | | | | | |
| Current liabilities | | | | | | | | | | | |
| Short term bank loans | | | 10 | | $ | 12,305,000 | | $ | 6,523,825 | | $ | 4,335,235 | | $ | 2,425,479 | |
| Current portion of long term bank | | | | | | | | | | | | | | | | |
| loans | | | 12 | | | 47,433 | | | 51,309 | | | 27,390 | | | 29,149 | |
| Accounts payable | | | | | | 12,921 | | | 723,506 | | | 535,715 | | | 1,754,410 | |
| Amounts due to construction | | | | | | - | | | 885,811 | | | 2,736,888 | | | - | |
| Other payables | | | 11 | | | 44,380 | | | 24,763 | | | 93,940 | | | 150,972 | |
| Customers deposits | | | | | | 2,656,777 | | | 2,337,371 | | | 2,404,180 | | | 1,774,682 | |
| Accrued liabilities | | | | | | 521,114 | | | 503,734 | | | 501,288 | | | 215,412 | |
| | | | | | | | | | | | | | | | | |
| | | | | | | | | | | | | | | | | |
| Total current liabilities | | | | | $ | 15,587,625 | | $ | 11,050,319 | | $ | 10,634,636 | | $ | 6,350,104 | |
| Long term liabilities | | | | | | | | | | | | | | | | |
| Long term bank loans | | | 12 | | | 457,107 | | | 461,777 | | | 273,897 | | | 320,625 | |
| | | | | | | | | | | | | | | | | |
| | | | | | | | | | | | | | | | | |
TOTAL LIABILITIES | | | | | $ | 16,044,732 | | $ | 11,512,096 | | $ | 10,908,533 | | $ | 6,670,729 | |
| | | | | | | | | | | | | | | | | |
STOCKHOLDERS’ EQUITY | | | | | | | | | | | | | | | | |
| Preferred Stock - $0.001 par value | | | | | | | | | | | | | | | | |
| 50,000,000 share authorized ; | | | | | | | | | | | | | | | | |
| 9,999,999, none, none, and none | | | | | | | | | | | | | | | | |
| issued and outstanding as of | | | | | | | | | | | | | | | | |
| December 31, 2007, 2006, 2005, and | | | | | | | | | | | | | | | | |
| 2004 respectively. | | | 13 | | $ | 2,923,815 | | $ | - | | $ | - | | $ | - | |
| | | | | | | | | | | | | | | | | |
| Common stock - $0.001 par value | | | | | | | | | | | | | | | | |
| 100,000,000 shares authorized; | | | | | | | | | | | | | | | | |
| 20,000,003, 20,000,003, 20,000,003, | | | | | | | | | | | | | | | | |
| and 20,000,003 shares issued and | | | | | | | | | | | | | | | | |
| outstanding as of December 31, | | | | | | | | | | | | | | | | |
| 2007, 2006, 2005, and 2004 | | | 14 | | | 20,000 | | | 20,000 | | | 20,000 | | | 20,000 | |
| respectively. | | | | | | | | | | | | | | | | |
| Additional paid-in capital | | | 14 | | | 27,487,549 | | | 12,247,436 | | | 12,227,436 | | | 12,227,436 | |
| Statutory reserves | | | 2(t | ) | | 3,490,834 | | | 1,716,827 | | | 643,236 | | | 270,697 | |
| Retained earnings | | | | | | 17,410,219 | | | 8,860,198 | | | 3,077,899 | | | 1,449,363 | |
| Accumulated other comprehensive | | | | | | | | | | | | | | | | |
| income | | | 2(u | ) | | 3,355,382 | | | 889,190 | | | 213,729 | | | -184,027 | |
| | | | | | | | | | | | | | | | | |
| | | | | | | | | | | | | | | | | |
| | | | | | $ | 54,687,799 | | $ | 23,733,651 | | $ | 16,182,300 | | $ | 13,783,469 | |
| | | | | | | | | | | | | | | | | |
| | | | | | | | | | | | | | | | | |
| | | | | | | | | | | | | | | | | |
TOTAL LIABILITIES AND | | | | | | | | | | | | | | | | |
STOCKHOLDERS’ EQUITY | | | | | $ | 70,732,531 | | $ | 35,245,747 | | $ | 27,090,833 | | $ | 20,454,198 | |
| | | | | | | | | | | | | | | | | |
YANGLIN SOYBEAN INC. F/K/A VICTORY DIVIDE MINING COMPANY | | | | | | | |
| | | | | | | | | | | | |
CONSOLIDATED STATEMENTS OF INCOME AND COMPREHENSIVE INCOME | | | | | |
FOR THE YEARS ENDED DECEMBER 31, 2007, 2006, 2005 AND 2004 | | | | | | | |
(Stated in US Dollars) | | | | | | | | | | | |
| | | | | | | | | | | | |
| | | | | 2007 | | 2006 | | 2005 | | 2004 | |
| | | Notes | | | | | | | | | |
| | | | | | | | | | | | |
| | | | | | | | | | | | |
| Net sales | | | 2(l)&21 | | $ | 155,206,867 | | $ | 88,078,494 | | $ | 38,107,145 | | $ | 26,046,389 | |
| Other sales | | | 18 | | | - | | | - | | | 323,320 | | | 279,222 | |
| Cost of sales | | | 2(m)&21 | | | -142,568,658 | | | -79,862,179 | | | -35,132,664 | | | -24,557,296 | |
| | | | | | | | | | | | | | | | | |
| | | | | | | | | | | | | | | | | |
| Gross profit | | | | | $ | 12,638,209 | | $ | 8,216,315 | | $ | 3,297,801 | | $ | 1,768,315 | |
| | | | | | | | | | | | | | | | | |
| Selling expenses | | | | | | -146,411 | | | -63,209 | | | -43,094 | | | -54,553 | |
| General and administrative expenses | | | | | | -1,825,498 | | | -1,078,184 | | | -1,103,262 | | | -902,258 | |
| | | | | | | | | | | | | | | | | |
| | | | | | | | | | | | | | | | | |
| Income from continuing operations | | | | | $ | 10,666,300 | | $ | 7,074,922 | | $ | 2,151,445 | | $ | 811,504 | |
| | | | | | | | | | | | | | | | | |
| Interest expenses, net | | | 16 | | | -394,705 | | | -219,032 | | | -150,370 | | | -100,455 | |
| Other income-government grant | | | | | | 39,385 | | | - | | | - | | | 211,168 | |
| Other income-gain on disposal of fixed | | | | | | | | | | | | | | | | |
| assets | | | | | | 13,048 | | | - | | | - | | | - | |
| | | | | | | | | | | | | | | | | |
| | | | | | | | | | | | | | | | | |
| Income before taxation | | | | | $ | 10,324,028 | | $ | 6,855,890 | | $ | 2,001,075 | | $ | 922,217 | |
| | | | | | | | | | | | | | | | | |
| Income tax | | | 2(s)&17 | | | - | | | - | | | - | | | - | |
| | | | | | | | | | | | | | | | | |
| | | | | | | | | | | | | | | | | |
| Net income | | | | | $ | 10,324,028 | | $ | 6,855,890 | | $ | 2,001,075 | | $ | 922,217 | |
| | | | | | | | | | | | | | | | | |
| Foreign currency translation adjustment | | | | | | 2,466,192 | | | 675,461 | | | 397,756 | | | 398 | |
| | | | | | | | | | | | | | | | | |
| | | | | | | | | | | | | | | | | |
| Comprehensive income | | | | | | 12,790,220 | | | 7,531,351 | | | 2,398,831 | | | 922,615 | |
| | | | | | | | | | | | | | | | | |
| | | | | | | | | | | | | | | | | |
| Basic earnings per share | | | 15 | | $ | 0.516 | | $ | 0.343 | | $ | 0.1 | | $ | 0.046 | |
| | | | | | | | | | | | | | | | | |
| | | | | | | | | | | | | | | | | |
| Diluted earnings per share | | | 15 | | | 0.344 | | | 0.343 | | | 0.1 | | | 0.046 | |
| | | | | | | | | | | | | | | | | |
| | | | | | | | | | | | | | | | | |
| Basic weighted average share | | | | | | | | | | | | | | | | |
| outstanding | | | 15 | | | 19,998,473 | | | 19,998,473 | | | 19,998,473 | | | 19,998,473 | |
| | | | | | | | | | | | | | | | | |
| | | | | | | | | | | | | | | | | |
| Diluted weighted average share | | | | | | | | | | | | | | | | |
| outstanding | | | 15 | | | 29,998,472 | | | 19,998,473 | | | 19,998,473 | | | 19,998,473 | |
| | | | | | | | | | | | | | | | | |
YANGLIN SOYBEAN INC. F/K/A VICTORY DIVIDE MINING COMPANY | | | | | | | | | | | |
| | | | | | | | | | | | | | | | | | |
CONSOLIDATED STATEMENTS OF STOCKHOLDERS’ EQUITY | | | | | | | | | | | | | |
FOR THE YEARS ENDED DECEMBER 31, 2007, 2006, 2005 AND 2004 | | | | | | | | | | | |
(Stated in US Dollars) | | | | | | | | | | | | | | | | | |
| | | | | | | | | | | | | | | | | | |
| | | | | | | | | | | | | | | Accumulated | | | |
| | | Common stock | | | | Additional | | | | | | other | | | |
| | | Number | | | | Preferred | | paid-in | | Statutory | | Retained | | comprehensive | | | |
| | | of share | | Amount | | stock | | capital | | reserves | | earnings | | income | | Total | |
| | | | | | | | | | | | | | | | | | |
| Bal., 1/1/2004 | | | 20,000,003 | | $ | 20,000 | | | - | | | 12,047,530 | | | 119,636 | | | 678,207 | | | -184,425 | | | 12,680,948 | |
| Net income | | | - | | | - | | | - | | | - | | | - | | | 922,217 | | | - | | | 922,217 | |
| Addition of capital | | | - | | | - | | | - | | | 179,906 | | | - | | | - | | | - | | | 179,906 | |
| Appropriations to | | | | | | | | | | | | | | | | | | | | | | | | | |
| surplus reserves | | | - | | | - | | | - | | | - | | | 151,061 | | | -151,061 | | | - | | | - | |
| Foreign currency | | | | | | | | | | | | | | | | | | | | | | | | | |
| adjustment | | | - | | | - | | | - | | | - | | | - | | | - | | | 398 | | | 398 | |
| | | | | | | | | | | | | | | | | | | | | | | | | | |
| | | | | | | | | | | | | | | | | | | | | | | | | | |
| Bal., 12/31/2004 | | | 20,000,003 | | $ | 20,000 | | | - | | | 12,227,436 | | | 270,697 | | | 1,449,363 | | | -184,027 | | | 13,783,469 | |
| | | | | | | | | | | | | | | | | | | | | | | | | | |
| | | | | | | | | | | | | | | | | | | | | | | | | | |
| | | | | | | | | | | | | | | | | | | | | | | | | | |
| Bal., 1/1/2005 | | | 20,000,003 | | $ | 20,000 | | | - | | | 12,227,436 | | | 270,697 | | | 1,449,363 | | | -184,027 | | | 13,783,469 | |
| Net income | | | - | | | - | | | - | | | - | | | - | | | 2,001,075 | | | - | | | 2,001,075 | |
| Appropriations to | | | | | | | | | | | | | | | | | | | | | | | | | |
| surplus reserves | | | - | | | - | | | - | | | - | | | 372,539 | | | -372,539 | | | - | | | - | |
| Foreign currency | | | | | | | | | | | | | | | | | | | | | | | | | |
| adjustment | | | - | | | - | | | - | | | - | | | - | | | - | | | 397,756 | | | 397,756 | |
| | | | | | | | | | | | | | | | | | | | | | | | | | |
| | | | | | | | | | | | | | | | | | | | | | | | | | |
| Bal., 12/31/2005 | | | 20,000,003 | | $ | 20,000 | | | - | | | 12,227,436 | | | 643,236 | | | 3,077,899 | | | 213,729 | | | 16,182,300 | |
| | | | | | | | | | | | | | | | | | | | | | | | | | |
| | | | | | | | | | | | | | | | | | | | | | | | | | |
| | | | | | | | | | | | | | | | | | | | | | | | | | |
| Bal., 1/1/2006 | | | 20,000,003 | | $ | 20,000 | | | - | | | 12,227,436 | | | 643,236 | | | 3,077,899 | | | 213,729 | | | 16,182,300 | |
| Net income | | | - | | | - | | | - | | | - | | | - | | | 6,855,890 | | | - | | | 6,855,890 | |
| Addition of capital | | | - | | | - | | | - | | | 20,000 | | | - | | | - | | | - | | | 20,000 | |
| Appropriations to | | | | | | | | | | | | | | | | | | | | | | | | | |
| surplus reserves | | | - | | | - | | | - | | | - | | | 1,073,591 | | | -1,073,591 | | | - | | | - | |
| Foreign currency | | | | | | | | | | | | | | | | | | | | | | | | | |
| adjustment | | | - | | | - | | | - | | | - | | | - | | | - | | | 675,461 | | | 675,461 | |
| | | | | | | | | | | | | | | | | | | | | | | | | | |
| | | | | | | | | | | | | | | | | | | | | | | | | | |
| Bal., 12/31/2006 | | | 20,000,003 | | $ | 20,000 | | | - | | | 12,247,436 | | | 1,716,827 | | | 8,860,198 | | | 889,190 | | | 23,733,651 | |
| | | | | | | | | | | | | | | | | | | | | | | | | | |
| | | | | | | | | | | | | | | | | | | | | | | | | | |
| | | | | | | | | | | | | | | | | | | | | | | | | | |
| Bal., 1/1/2007 | | | 20,000,003 | | $ | 20,000 | | | - | | | 12,247,436 | | | 1,716,827 | | | 8,860,198 | | | 889,190 | | | 23,733,651 | |
| Net income | | | - | | | - | | | - | | | - | | | - | | | 10,324,028 | | | - | | | 10,324,028 | |
| Reverse acquisition | | | - | | | - | | | - | | | - | | | - | | | - | | | - | | | - | |
| Addition of capital | | | - | | | - | | | 2,923,815 | | | 15,240,113 | | | - | | | - | | | - | | | 18,163,928 | |
| Appropriations to | | | | | | | | | | | | | | | | | | | | | | | | | |
| surplus reserves | | | - | | | - | | | - | | | - | | | 1,774,007 | | | -1,774,007 | | | - | | | - | |
| Foreign currency | | | | | | | | | | | | | | | | | | | | | | | | | |
| adjustment | | | - | | | - | | | - | | | - | | | - | | | - | | | 2,466,192 | | | 2,466,192 | |
| | | | | | | | | | | | | | | | | | | | | | | | | | |
| | | | | | | | | | | | | | | | | | | | | | | | | | |
| Bal., 12/31/2007 | | | 20,000,003 | | $ | 20,000 | | | 2,923,815 | | | 27,487,549 | | | 3,490,834 | | | 17,410,219 | | | 3,355,382 | | | 54,687,799 | |
| | | | | | | | | | | | | | | | | | | | | | | | | | |
YANGLIN SOYBEAN INC. F/K/A VICTORY DIVIDE MINING COMPANY | | | | | | | |
| | | | | | | | | | |
CONSOLIDATED STATEMENTS OF CASH FLOWS | | | | | | | |
FOR THE YEARS ENDED DECEMBER 31, 2007, 2006, 2005 AND 2004 | | | | | | | |
(Stated in US Dollars) | | | | | | | | | |
| | | | | | | | | | |
| | | 2007 | | 2006 | | 2005 | | 2004 | |
| Cash flows from operating activities | | | | | | | | | |
| Net income | | $ | 10,324,028 | | $ | 6,855,890 | | $ | 2,001,075 | | $ | 922,217 | |
| Depreciation | | | 2,028,313 | | | 1,461,597 | | | 512,370 | | | 503,092 | |
| Amortization | | | 78,397 | | | 52,827 | | | 32,542 | | | 27,061 | |
| Gain on disposal of fixed assets | | | -13,048 | | | - | | | - | | | - | |
| | | | | | | | | | | | | | |
| Adjustments to reconcile net income to net | | | | | | | | | | | | | |
| cash (used in) provided by operating activities: | | | | | | | | | | | | | |
| Accounts receivable | | | 182,708 | | | 353,941 | | | 15,498 | | | -77,589 | |
| Inventories | | | -9,712,307 | | | -1,814,596 | | | -1,871,350 | | | 3,068,939 | |
| Advances to suppliers | | | -5,508,012 | | | 1,544 | | | 4,139 | | | -5,584 | |
| Prepaid VAT and other taxes | | | -1,667,452 | | | -45,954 | | | -279,892 | | | 470,583 | |
| Other receivables | | | 714,295 | | | 463,017 | | | -40,972 | | | 35,130 | |
| Accounts payable | | | -730,106 | | | 166,753 | | | -1,244,928 | | | -1,747,811 | |
| Other payables | | | -698,636 | | | -70,762 | | | -60,051 | | | -414,050 | |
| Customers deposits | | | 152,225 | | | -142,442 | | | 573,510 | | | 1,592,010 | |
| Accrued liabilities | | | -16,561 | | | -13,664 | | | 275,752 | | | -39,553 | |
| | | | | | | | | | | | | | |
| | | | | | | | | | | | | | |
| Net cash provided by/(used in) operating activities | | $ | -4,866,156 | | $ | 7,268,151 | | $ | -82,307 | | $ | 4,334,445 | |
| | | | | | | | | | | | | | |
| Cash flows from investing activities | | | | | | | | | | | | | |
| Payment of plant and equipment | | | -386,260 | | | -7,251,862 | | | -6,578,076 | | | -199,502 | |
| Sales proceeds of plant and equipment | | | 55,138 | | | - | | | - | | | - | |
| Payment of construction in progress | | | -11,702,842 | | | - | | | -716,540 | | | -709,226 | |
| Payment of land use right | | | 120,560 | | | -2,267,341 | | | -4,023 | | | -144,784 | |
| Increase in restricted cash | | | -500,000 | | | - | | | - | | | - | |
| | | | | | | | | | | | | | |
| Net cash used in investing activities | | $ | -12,413,404 | | $ | -9,519,203 | | $ | -7,298,639 | | $ | -1,053,512 | |
| | | | | | | | | | | | | | |
| Cash flows from financing activities | | | | | | | | | | | | | |
| Issue of share capital and warrants | | | 17,849,093 | | | 20,000 | | | - | | | 179,906 | |
| Bank borrowings | | | 11,815,365 | | | 6,898,366 | | | 6,473,013 | | | 2,385,598 | |
| Bank loan repayments | | | -6,737,488 | | | -4,696,050 | | | -4,713,320 | | | -2,400,296 | |
| | | | | | | | | | | | | | |
| Net cash provided by financing activities | | $ | 22,926,970 | | $ | 2,222,316 | | $ | 1,759,693 | | $ | 165,208 | |
| | | | | | | | | | | | | | |
| Net in cash and cash equivalents (used)/sourced | | | 5,647,410 | | | -28,736 | | | -5,621,253 | | | 3,446,141 | |
| | | | | | | | | | | | | | |
| Effect of foreign currency translation on cash and | | | | | | | | | | | | | |
| cash equivalents | | | 549,091 | | | 95,833 | | | 132,223 | | | 425 | |
| | | | | | | | | | | | | | |
| Cash and cash equivalents-beginning of year | | | 3,013,520 | | | 2,946,423 | | | 8,435,453 | | | 4,988,887 | |
| | | | | | | | | | | | | | |
| Cash and cash equivalents-end of year | | $ | 9,210,121 | | $ | 3,013,520 | | $ | 2,946,423 | | $ | 8,435,453 | |
| | | | | | | | | | | | | | |
| Supplementary cash flow information: | | | | | | | | | | | | | |
| Interest received | | $ | 64,277 | | $ | 26,715 | | $ | 5,721 | | $ | 2,686 | |
| Interest paid | | | 457,647 | | | 244,723 | | | 155,925 | | | 103,057 | |
YANGLIN SOYBEAN INC. F/K/A VICTORY DIVIDE MINING COMPANY
NOTES TO CONSOLIDATED FINANCIAL STATEMENTS
(Stated in US Dollars)
| 1. | ORGANIZATION AND PRINCIPAL ACTIVITIES |
Yanglin Soybean Inc. (the “Company”) was incorporated in the state of Nevada on May 26, 1921. Prior to October 3, 2007 the company has only nominal operations and assets.
On October 3, 2007, the Company executed a reverse-merger with Faith Winner Investments Limited (“Faith Winner (BVI)”) by an exchange of shares whereby the Company issued 18,500,000 common shares at $0.001 par value in exchange for all Faith Winner (BVI) shares.
Faith Winner (BVI) acquired Faith Winner (Jixian) Agriculture Development Company (“Faith Winner (Jixian)” or “WFOE”), which entered into a series of agreements with Heilongjiang Yanglin Soybean Group Co., Ltd. (“Yanglin”) including but not limited to management, loan, purchase option, consignment, trademark licensing, non-competion, etc. As a result of entering the abovementioned agreements, WFOE deem to control Yanglin as a Variable Interest Entity as required by FASB Interpretation No. 46 (revised December 2003) Consolidated of Variable Interest Entities, an Interpretation of ARB No. 51
The reverse-merger also included an equity financing of $21,500,000 by the issuance of 10,000,000 Series A Convertible Preferred Stock at $2.15 per share to 10 accredited investors.
The Company, through its subsidiaries and Yanglin, (hereinafter, collectively referred to as “the Group”), is now in the business of manufacturing, distribution, and selling of non-genetically modified soybean oil, soybean salad oil, and soybean meal throughout the Province of Heilongjiang, China.
| 2. | SUMMARY OF SIGNIFICANT ACCOUNTING POLICIES |
The Company maintains its general ledger and journals with the accrual method accounting for financial reporting purposes. The financial statements and notes are representations of management. Accounting policies adopted by the Company conform to generally accepted accounting principles in the United States of America and have been consistently applied in the presentation of financial statements.
The share exchange transaction has been accounted for as a recapitalization of Yanglin Soybean Inc. where the Company (the legal acquirer) is considered the accounting acquiree and Faith Winner (BVI) (the legal acquiree) is considered the accounting acquirer. As a result of this transaction, the Company is deemed to be a continuation of the business of Faith Winner (BVI).
Accordingly, the accompanying financial statements are those of the accounting acquirer: Faith Winner (BVI). The historical stockholders’ equity of the accounting acquirer prior to the share exchange has been retroactively restated as if the share exchange transaction occurred as of the beginning of the first period presented.
YANGLIN SOYBEAN INC. F/K/A VICTORY DIVIDE MINING COMPANY
NOTES TO CONSOLIDATED FINANCIAL STATEMENTS
(Stated in US Dollars)
| 2. | SUMMARY OF SIGNIFICANT ACCOUNTING POLICIES (Continued) |
| (b) | Principles of Consolidation |
The consolidated financial statements, which include the Company and its subsidiaries, are complied in accordance with generally accepted accounting principles in the United States of America. All significant inter-company accounts and transactions have been eliminated. The consolidated financial statements include 100% of assets, liabilities, and net income or loss of those wholly-owned subsidiaries.
The company owned the three subsidiaries since its reverse-merger on October 3, 2007. Retroactively restated as of December 31, 2006, 2005, and 2004, the detailed identities of the consolidating subsidiaries would have been as follows:
Name of Company | | Place of incorporation | | Attributable interest | |
| | | | | | |
| Faith Winner Investments Ltd | | | British Virgin Islands | | | 100 | % |
| | | | | | | | |
| Faith Winner (Jixian) Agriculture Development Company | | | PRC | | | 100 | % |
| | | | | | | | |
| Heilongjiang Yanglin Soybean Group Co. Ltd | | | PRC | | | 100 | % |
| *Deemed variable interest entity member | | | | | | | |
The preparation of the financial statements in conformity with generally accepted accounting principles in the United States of America requires management to make estimates and assumptions that affect the reported amounts of assets and liabilities and disclosure of contingent assets and liabilities at the date of the financial statements and the reported amounts of revenues and expenses during the reporting periods. Management made these estimates using the best information available at the time the estimates were made; however actual results could differ materially from those estimates.
| (d) | Economic and political risks |
The Group’s operations are conducted in the PRC. Accordingly, the Company’s business, financial condition and results of operations may be influenced by the political, economic and legal environment in the PRC, and by the general state of the PRC economy.
The Group’s operations in the PRC are subject to special considerations and significant risks not typically associated with companies in North America and Western Europe. These include risks associated with, among others, the political, economic and legal environment and foreign currency exchange. The Group’s results may be adversely affected by changes in the political and social conditions in the PRC, and by changes in governmental policies with respect to laws and regulations, anti-inflationary measures, currency conversion, remittances abroad, and rates and methods of taxation, among other things.
YANGLIN SOYBEAN INC. F/K/A VICTORY DIVIDE MINING COMPANY
NOTES TO CONSOLIDATED FINANCIAL STATEMENTS
(Stated in US Dollars)
| 2. | SUMMARY OF SIGNIFICANT ACCOUNTING POLICIES (Continued) |
Land use rights are stated at cost less accumulated amortisation. Amortisation is provided over the respective useful lives, using the straight-line method. Estimated useful lives are arranging from 22 to 50 years.
| (f) | Property, plant and equipment |
Plant and equipment are carried at cost less accumulated depreciation. Depreciation is provided over their estimated useful lives, using the straight-line method. Estimated useful lives of the plant and equipment are as follows:
| 10 years |
| Machinery and equipment | 3.5 - 30 years |
| 4 - 20 years |
| Motor vehicles | 10 years |
The cost and related accumulated depreciation of assets sold or otherwise retired are eliminated from the accounts and any gain or loss is included in the statement of income. The cost of maintenance and repairs is charged to income as incurred, whereas significant renewals and betterments are capitalized.
| (g) | Accounting for the impairment of long-lived assets |
The long-lived assets held and used by the Group are reviewed for impairment whenever events or changes in circumstances indicate that the carrying amount of assets may not be recoverable. It is reasonably possible that these assets could become impaired as a result of technology or other industry changes. Determination of recoverability of assets to be held and used is by comparing the carrying amount of an asset to future net undiscounted cash flows to be generated by the assets.
If such assets are considered to be impaired, the impairment to be recognized is measured by the amount by which the carrying amount of the assets exceeds the fair value of the assets. Assets to be disposed of are reported at the lower of the carrying amount or fair value less costs to dispose.
During the reporting years, there was no known impairment loss.
Inventories consist of finished goods, and raw materials, and are stated at the lower of cost or market value. Substantially all inventory costs are determined using the weighted average basis. Finished goods are comprised of direct materials, direct labor and an appropriate proportion of overhead.
YANGLIN SOYBEAN INC. F/K/A VICTORY DIVIDE MINING COMPANY
NOTES TO CONSOLIDATED FINANCIAL STATEMENTS
(Stated in US Dollars)
| 2. | SUMMARY OF SIGNIFICANT ACCOUNTING POLICIES (Continued) |
Trade receivables are recognized and carried at the original invoice amount less allowance for any uncollectible amounts. An allowance for doubtful accounts is maintained for all customers in considering with a variety of factors, including the length of past due, significant one-time events and the company’s historical experience. Bad debts are written off as incurred.
| (j) | Cash and cash equivalents |
The Company considers all highly liquidate investments purchased with original maturities of three months or less to be cash equivalents. The Company maintains bank accounts only in the PRC. The Company does not maintain any bank accounts in the United States of America.
| | | 2007 | | 2006 | | 2005 | | 2004 | |
| Cash on hand | | | 18,362 | | | 13,808 | | | 39,661 | | | 16,048 | |
| Industrial And Commercial Bank of China | | | - | | | 229 | | | 2,034 | | | 33,098 | |
| Agricultural Development Bank of China | | | 1,362,651 | | | 448,935 | | | 371,592 | | | - | |
| Agricultural Bank of China | | | 7,829,108 | | | 2,550,548 | | | 2,532,726 | | | 8,385,907 | |
| Bank of China | | | - | | | - | | | 410 | | | 400 | |
| (k) | Foreign currency translation |
The accompanying financial statements are presented in United States dollars. The reporting currency of the Group is the U.S. dollar (USD). Faith Winner (Jixian) and Yanglin use its local currency, Renminbi (RMB), as its functional currency. Results of operations and cash flow are translated at average exchange rates during the period, and assets and liabilities are translated at the end of period exchange rates. Translation adjustments resulting from this process are included in accumulated other comprehensive income in stockholders’ equity. Transaction gains and losses that arise from exchange rate fluctuations from transactions denominated in a currency other than the functional currency are included in the results of operations as incurred.
The PRC government imposes significant exchange restrictions on fund transfers out of the PRC that are not related to business operations. These restrictions have not had a material impact on the Group because it has not engaged in any significant transactions that are subject to the restrictions.
The exchange rates used to translate amounts in RMB into USD for the purposes of preparing the consolidated financial statements were as follows:
| | | 2007 | | 2006 | | 2005 | | 2004 | |
| Year end RMB : USD exchange rate | | | 7.31410 | | | 7.81750 | | | 8.07340 | | | 8.28650 | |
| Average yearly RMB : USD exchange rate | | | 7.61720 | | | 7.98189 | | | 8.20329 | | | 8.28723 | |
The RMB is not freely convertible into foreign currency and all foreign exchange transactions must take place through authorized institutions. No representation is made that the RMB amounts could have been, or could be, converted into USD at the rates used in translation.
YANGLIN SOYBEAN INC. F/K/A VICTORY DIVIDE MINING COMPANY
NOTES TO CONSOLIDATED FINANCIAL STATEMENTS
(Stated in US Dollars)
| 2. | SUMMARY OF SIGNIFICANT ACCOUNTING POLICIES (Continued) |
Revenue represents the invoiced value of goods sold recognized upon the delivery of goods to customers. Revenue is recognized when all of the following criteria are met: Persuasive evidence of an arrangement exists, delivery has occurred or services have been rendered, and the seller’s price to the buyer is fixed or determinable
Cost of sales consists primarily of direct material costs, direct labor cost, direct depreciation and related direct expensesattributable to the production of products. Written-down of inventory to lower of cost or market is also reflected in cost of revenues.
The Group did not have lease which met the criteria of capital lease. Leases which do not qualify as capital lease are classified as operating lease. Operating lease rental payment included in general and administrative expenses were nil, $123,822, $113,369 and $142,388 for the years ended December 31, 2007, 2006, 2005 and 2004 respectively.
The Group expensed all advertising costs as incurred. Advertising expenses included in selling expenses were $9,167, $501, $291 and $5,015 for the years ended December 31, 2007, 2006, 2005 and 2004 respectively.
All shipping and handling are expensed as incurred. Shipping and handling expenses included in selling expenses were $75,347, $50,446, $28,746, and $26,055 for the years ended December 31, 2007, 2006, 2005 and 2004 respectively.
| (q) | Research and development |
All research and development costs are expensed as incurred. The research and development costs included in general and administrative expenses were $11,815, nil, nil, and nil for the years ended December 31, 2007, 2006, 2005, and 2004 respectively.
Retirement benefits in the form of contributions under defined contribution retirement plans to the relevant authorities are charged to the statements of income as incurred. The retirement benefit funding included in general and administrative expenses were $168,535, $72,129, $27,073 and $24,742 for the years ended December 31, 2007, 2006, 2005 and 2004 respectively.
YANGLIN SOYBEAN INC. F/K/A VICTORY DIVIDE MINING COMPANY
NOTES TO CONSOLIDATED FINANCIAL STATEMENTS
(Stated in US Dollars)
| 2. | SUMMARY OF SIGNIFICANT ACCOUNTING POLICIES (Continued) |
The Group accounts for income tax using an asset and liability approach and allows for recognition of deferred tax benefits in future years. Under the asset and liability approach, deferred taxes are provided for the net tax effects of temporary differences between the carrying amounts of assets and liabilities for financial reporting purposes and the amounts used for income tax purposes. A valuation allowance is provided for deferred tax assets if it is more likely than not these items will either expire before the Group is able to realize their benefits, or that future realization is uncertain.
As stipulated by the PRC’s Company Law and as provided in the Faith Winner (Jixian), and Yanglin’s Articles of Association, Faith Winner and Heilongjiang Yanglin’s net income after taxation can only be distributed as dividends after appropriation has been made for the following:
| | (i) | Making up cumulative prior years’ losses, if any; |
| | (ii) | Allocations to the “Statutory surplus reserve” of at least 10% of income after tax, as determined under PRC accounting rules and regulations, until the fund amounts to 50% of the Company's registered capital, which is restricted for set off against losses, expansion of production and operation or increase in registered capital; |
| | (iii) | Allocations of 5-10% of income after tax, as determined under PRC accounting rules and regulations, to the Company's “Statutory common welfare fund”, which is restricted for capital expenditure for the collective benefits of the Company's employees; and |
| | (iv) | Allocations to the discretionary surplus reserve, if approved in the shareholders’ general meeting. |
On December 31, 2001, Heilongjiang Yanglin established a statutory surplus reserve as well as a statutory common welfare fund and commenced to appropriate 10% and 5%, respectively of the PRC net income after taxation to these reserves. The amounts included in the statutory reserves consisted of surplus reserve of $2,327,222 and common welfare fund of $1,163,612 as of December 31, 2007.
Comprehensive income is defined to include all changes in equity except those resulting from investments by owners and distributions to owners. Among other disclosures, all items that are required to be recognized under current accounting standards as components of comprehensive income are required to be reported in a financial statement that is presented with the same prominence as other financial statements. The Group’s current component of other comprehensive income is the foreign currency translation adjustment.
YANGLIN SOYBEAN INC. F/K/A VICTORY DIVIDE MINING COMPANY
NOTES TO CONSOLIDATED FINANCIAL STATEMENTS
(Stated in US Dollars)
| 2. | SUMMARY OF SIGNIFICANT ACCOUNTING POLICIES (Continued) |
| (v) | Recent accounting pronouncements |
In September 2006, the FASB issued SFAS 157, Fair Value Measurements, which defines fair value, establishes a framework for measuring fair value in generally accepted accounting principles, and expands disclosures about fair value measurements. SFAS 157 applies under other accounting pronouncements that require or permit fair value measurements, where fair value is the relevant measurement attribute. The standard does not require any new fair value measurements. SFAS 157 is effective for financial statements issued for fiscal year beginning after November 15, 2007, and interim periods within that fiscal year. The Company is currently evaluating the impact of SFAS 157 on its operation and financial conditions.
In September 2006, the SEC issued SAB No. 108, which provides guidance on the process of quantifying financial statement misstatements. In SAB No. 108, the SEC staff establishes an approach that requires quantification of financial statement errors, under both the iron-curtain and the roll-over methods, based on the effects of the error on each of the Company’s financial statements and the related financial statement disclosures. SAB No.108 is generally effective for annual financial statements in the first fiscal year ending after November 15, 2006. The transition provisions of SAB No. 108 permit existing public companies to record the cumulative effect in the first year ending after November 15, 2006 by recording correcting adjustments to the carrying values of assets and liabilities as of the beginning of that year with the offsetting adjustment recorded to the opening balance of retained earnings. The Company does not anticipate that the adoption of this standard will have a material impact on these consolidated financial statements
In February 2007, FASB issued Statement of Financial Accounting Standards No. (“SFAS”) 159, “The Fair Value Option for Financial Assets and Financial Liabilities - Including an Amendment of FASB Statement No. 115” (“SFAS 159”). SFAS 159 permits entities to choose to measure many financial instruments and certain other items at fair value. Entities that elect the fair value option will report unrealized gains and losses in earnings at each subsequent reporting date. The fair value option may be elected on an instrument-by-instrument basis, with a few exceptions. SFAS 159 also establishes presentation and disclosure requirements to facilitate comparisons between entities that choose different measurement attributes for similar assets and liabilities. The requirements of SFAS 159 are effective for our fiscal year beginning on January 1, 2008. The Company does not anticipate that the adoption of this standard will have a material impact on these consolidated financial statements.
In December 2007, the SEC issued Staff Accounting Bulletin No. 110 (“SAB 110”). SAB 110 permits companies to continue to use the simplified method, under certain circumstances, in estimating the expected term of “plain vanilla” options beyond December 31, 2007. SAB 110 updates guidance provided in SAB 107 that previously stated that the Staff would not expect a company to use the simplified method for share option grants after December 31, 2007. Adoption of SAB 110 is not expected to have a material impact on the Company’s consolidated financial statements
YANGLIN SOYBEAN INC. F/K/A VICTORY DIVIDE MINING COMPANY
NOTES TO CONSOLIDATED FINANCIAL STATEMENTS
(Stated in US Dollars)
| 2. | SUMMARY OF SIGNIFICANT ACCOUNTING POLICIES (Continued) |
In December 2007, the Financial Accounting Standards Board issued Statement of Financial Accounting Standard (“SFAS”) No. 160, "Noncontrolling Interests in Consolidated Financial Statements, an amendment of ARB No. 51”. SFAS 160 establishes accounting and reporting standards for the noncontrolling interest in a subsidiary and for the deconsolidation of a subsidiary. SFAS 160 is effective for fiscal years, and interim periods within those fiscal years, beginning on or after December 15, 2008. As such, the Company is required to adopt these provisions at the beginning of the fiscal year ended December 31, 2009. The Company is currently evaluating the impact of SFAS 160 on its consolidated financial statements but does not expect it to have a material effect
In December 2007, the Financial Accounting Standards Board issued Statement of Financial Accounting Standard (“SFAS”) No. 141(R), "Business Combinations”. SFAS 141(R) establishes principles and requirements for how the acquirer recognizes and measures in its financial statements the identifiable assets acquired, the liabilities assumed, an any noncontrolling interest in the acquiree, recognizes and measures the goodwill acquired in the business combination or a gain from a bargain purchase, and determines what information to disclose to enable users of the financial statements to evaluate the nature and financial effects of the business combination. SFAS 141(R) is effective for fiscal years, and interim periods within those fiscal years, beginning on or after December 15, 2008. As such, the Company is required to adopt these provisions at the beginning of the fiscal year ended December 31, 2009. The Company is currently evaluating the impact of SFAS 141(R) on its consolidated financial statements but does not expect it to have a material effect.
YANGLIN SOYBEAN INC. F/K/A VICTORY DIVIDE MINING COMPANY
NOTES TO CONSOLIDATED FINANCIAL STATEMENTS
(Stated in US Dollars)
| 3. | CONCENTRATIONS OF CREDIT RISK AND MAJOR CUSTOMERS |
Financial instruments which potentially expose the Group to concentrations of credit risk, consists of cash and accounts receivable as of December 31, 2007, 2006, 2005, and 2004. The Group performs ongoing evaluations of its cash position and credit evaluations to ensure sound collections and minimize credit losses exposure.
As of December 31, 2007, 2006, 2005, and 2004, the Group’s bank deposits were all conducted with banks in the PRC where there is currently no rule or regulation mandated on obligatory insurance of bank accounts.
For the years ended December 31, 2007, 2006, 2005, and 2004, all of the Group’s sales were generated from the PRC. In addition, all accounts receivable as of December 31, 2007, 2006, 2005, and 2004 also arose in the PRC.
The maximum amount of loss exposure due to credit risk that the Group would bear if the counter parties of the financial instruments failed to perform represents the carrying amount of each financial asset in the balance sheet.
Normally the Group does not require collateral from customers or debtors.
Details of the customer account for 10% or more of the Group’s revenue are as follows:
| | | Year ended December 31, | |
| | | 2007 | | 2006 | | 2005 | | 2004 | |
| | | | | | | | | | |
| Customer A | | $ | 9,067,445 | | $ | - | | $ | - | | $ | - | |
Details of customer account for 10% or more of the Group’s accounts receivable are as follows:
| | | December 31, | |
| | | 2007 | | 2006 | | 2005 | | 2004 | |
| | | | | | | | | | |
| Customer B | | $ | 7,928 | | $ | - | | $ | - | | $ | - | |
| Customer C | | | 7,140 | | | - | | | - | | | - | |
| Customer D | | | - | | | 81,361 | | | - | | | - | |
| Customer E | | | - | | | 111,317 | | | - | | | - | |
| Customer F | | | - | | | - | | | 63,631 | | | - | |
| Customer G | | | - | | | - | | | 363,146 | | | 358,222 | |
YANGLIN SOYBEAN INC. F/K/A VICTORY DIVIDE MINING COMPANY
NOTES TO CONSOLIDATED FINANCIAL STATEMENTS
(Stated in US Dollars)
Pledged deposits are restricted cash with banks for operating security purpose.
| 5. | ACCOUNTS RECEIVABLE, NET |
| | | 2007 | | 2006 | | 2005 | | 2004 | |
| | | | | | | | | | |
| Accounts receivable, gross | | $ | 15,067 | | $ | 192,678 | | $ | 537,336 | | $ | 539,000 | |
| Provision for doubtful debts | | | (1,213 | ) | | (1,689 | ) | | (2,470 | ) | | (2,548 | ) |
| | | | | | | | | | | | | | |
| | | $ | 13,854 | | $ | 190,989 | | $ | 534,866 | | $ | 536,452 | |
All of the above accounts receivable are due within 12 months of aging.
An analysis of the allowance for doubtful accounts for the years ended December 31, 2007, 2006, 2005 and 2004 is as follows:
| | | 2007 | | 2006 | | 2005 | | 2004 | |
| | | | | | | | | | |
| Balance at beginning of year | | $ | 1,689 | | $ | 2,470 | | $ | 2,548 | | $ | 2,306 | |
| Addition/(reduction) of bad debt expense | | | (569 | ) | | (844 | ) | | (143 | ) | | 242 | |
| Foreign exchange adjustment | | | 93 | | | 63 | | | 65 | | | - | |
| | | | | | | | | | | | | | |
| Balance at end of year | | $ | 1,213 | | $ | 1,689 | | | 2,470 | | | 2,548 | |
Allowance was made when collection of the full amount is no longer probable. Management reviews and adjusts this allowance periodically based on historical experience, current economic climate as well as its evaluation of the collectibility of outstanding accounts. The Group evaluates the credit risks of its customers utilizing historical data and estimations of future performance.
Other receivables are as follows:
| | | 2007 | | 2006 | | 2005 | | 2004 | |
| Advances to employees for purchasing | | | | | | | | | | | | | |
| Materials | | $ | 14,108 | | $ | 89,570 | | $ | 492,088 | | $ | 258,527 | |
| Advances for traveling | | | - | | | - | | | 54,820 | | | 44,627 | |
| Loans to employees | | | 9,777 | | | 14,176 | | | 10,163 | | | 213,550 | |
| Sundry | | | 4,011 | | | 21,021 | | | 20,425 | | | 3,850 | |
| | | | | | | | | | | | | | |
| | | $ | 27,896 | | $ | 124,767 | | $ | 577,496 | | $ | 520,554 | |
Loans to employees are unsecured, interest-free, and repayable on demand.
Inventories comprise the followings:
| | | 2007 | | 2006 | | 2005 | | 2004 | |
| | | | | | | | | | |
| Finished goods | | $ | 537,360 | | $ | 3,106,642 | | $ | 718,697 | | $ | 1,318,048 | |
| Raw materials | | | 17,346,292 | | | 4,161,952 | | | 4,525,492 | | | 1,938,707 | |
| | | | | | | | | | | | | | |
| | | $ | 17,883,652 | | $ | 7,268,594 | | $ | 5,244,189 | | $ | 3,256,755 | |
YANGLIN SOYBEAN INC. F/K/A VICTORY DIVIDE MINING COMPANY
NOTES TO CONSOLIDATED FINANCIAL STATEMENTS
(Stated in US Dollars)
| 8. | PROPERTY, PLANT AND EQUIPMENT, NET |
Property, plant and equipment comprise the followings:
| | | 2007 | | 2006 | | 2005 | | 2004 | |
| At cost | | | | | | | | | | | | | |
| Building | | $ | 7,060,690 | | $ | 6,602,826 | | $ | 1,679,186 | | $ | 1,620,385 | |
| Machinery and equipment | | | 17,900,662 | | | 16,709,858 | | | 11,179,178 | | | 4,548,975 | |
| Office equipment | | | 134,060 | | | 110,394 | | | 106,896 | | | 91,942 | |
| Motor vehicles | | | 1,054,995 | | | 708,048 | | | 638,389 | | | 480,454 | |
| | | | | | | | | | | | | | |
| | | $ | 26,150,407 | | $ | 24,131,126 | | $ | 13,603,649 | | $ | 6,741,756 | |
| Less: accumulated | | | | | | | | | | | | | |
| depreciation | | | (5,931,919 | ) | | (3,573,595 | ) | | (2,015,299 | ) | | (1,456,242 | ) |
| | | | | | | | | | | | | | |
| | | $ | 20,218,488 | | $ | 20,557,531 | | $ | 11,588,350 | | $ | 5,285,514 | |
| Construction in progress | | | 2,344,708 | | | - | | | 4,057,815 | | | 892,104 | |
| | | | | | | | | | | | | | |
| | | $ | 22,563,196 | | $ | 20,557,531 | | $ | 15,646,165 | | $ | 6,177,618 | |
As of December 31, 2007, building with net book value of $3,135,292 and machinery and equipment with net book value of $5,190,309 of the Company were pledged as collateral under certain loan arrangements. These loans were primarily obtained for general working capital.
Depreciation and amortization expense is included in the statement of income and comprehensive income as follows:
| | | 2007 | | 2006 | | 2005 | | 2004 | |
| | | | | | | | | | |
| Cost of sales | | $ | 1,686,129 | | $ | 1,158,120 | | $ | 420,381 | | $ | 430,279 | |
| General and administrative | | | | | | | | | | | | | |
| expenses | | | 342,184 | | | 303,477 | | | 91,989 | | | 72,813 | |
| | | | | | | | | | | | | | |
| | | $ | 2,028,313 | | $ | 1,461,597 | | $ | 512,370 | | $ | 503,092 | |
Construction in progress represents direct costs of construction and design fees incurred. Capitalization of these costs ceases and the construction in progress is transferred to plant and equipment when substantially all the activities necessary to prepare the assets for their intended use are completed. No depreciation is provided until it is completed and ready for intended use. Capital commitments in respect of these projects are $6,199,515 at December 31, 2007.
Construction in progress mainly comprises capital expenditures for construction of the Group’s corporate campus, including offices, factories and staff dormitories.
YANGLIN SOYBEAN INC. F/K/A VICTORY DIVIDE MINING COMPANY
NOTES TO CONSOLIDATED FINANCIAL STATEMENTS
(Stated in US Dollars)
Intangible assets are as follows:
| | | 2007 | | 2006 | | 2005 | | 2004 | |
| | | | | | | | | | |
| Land use rights, at cost | | $ | 3,743,422 | | $ | 3,619,839 | | $ | 1,263,465 | | $ | 1,230,970 | |
| Less: accumulated amortization | | | (299,341 | ) | | (203,677 | ) | | (144,994 | ) | | (113,032 | ) |
| | | | | | | | | | | | | | |
| | | $ | 3,444,081 | | $ | 3,416,162 | | $ | 1,118,471 | | $ | 1,117,938 | |
Amortization expenses included in the costs of sales for the years ended December 31, 2007, 2006, 2005, and 2004 were $78,397, $52,827, $32,542, and $27,061, respectively.
As of December 31, 2007, land use rights with net book value of $1,233,393 of the Group were pledged as collateral under certain loan arrangements. These loans were primarily obtained for general working capital.
Short term bank loans are as follows:
| | | 2007 | | 2006 | | 2005 | | 2004 | |
| Loans from Agricultural Development | | | | | | | | | | | | | |
| Bank of China, interest rates at 7.02% | | | | | | | | | | | | | |
| per annum, due August 29, 2008 | | $ | 8,203,333 | | $ | - | | $ | - | | $ | - | |
| | | | | | | | | | | | | | |
| Loans from Agricultural Development | | | | | | | | | | | | | |
| Bank of China, interest rates at 7.29% | | | | | | | | | | | | | |
| per annum, due November 21, 2008 | | | 4,101,667 | | | - | | | - | | | - | |
| | | | | | | | | | | | | | |
| Loans from Agricultural Development | | | | | | | | | | | | | |
| Bank of China, interest rates at 6.12% | | | | | | | | | | | | | |
| per annum, due June 29, 2007 | | | - | | | 6,523,825 | | | | | | | |
| | | | | | | | | | | | | | |
| Loans from Industrial And | | | | | | | | | | | | | |
| Commercial Bank of China, interest | | | | | | | | | | | | | |
| rates at 7.25% per annum, due | | | | | | | | | | | | | |
| September 18, 2006 | | | - | | | - | | | 619,319 | | | 2,353,226 | |
| | | | | | | | | | | | | | |
| Loans from County Deposit Centre interest rates at 7.25% per annum, | | | | | | | | | | | | | |
| due November 9, 2005 | | | - | | | - | | | - | | | 32,583 | |
YANGLIN SOYBEAN INC. F/K/A VICTORY DIVIDE MINING COMPANY
NOTES TO CONSOLIDATED FINANCIAL STATEMENTS
(Stated in US Dollars)
| 10. | SHORT TERM BANK LOANS (Continued) |
| Loans from Industrial And | | | | | | | | | | | | | |
| Commercial Bank of China, interest | | | | | | | | | | | | | |
| rates at 5.58% per annum, due | | | | | | | | | | | | | |
| December 1, 2006 | | | - | | | - | | | - | | | 39,670 | |
| | | | | | | | | | | | | | |
| Loans from Agricultural Development | | | | | | | | | | | | | |
| Bank of China, interest rates at 5.22% | | | | | | | | | | | | | |
| per annum, due April 12, 2006 | | | - | | | - | | | 3,715,916 | | | - | |
| | | | | | | | | | | | | | |
| | | $ | 12,305,000 | | $ | 6,523,825 | | $ | 4,335,235 | | $ | 2,425,479 | |
Interest paid for the years ended December 31, 2007, 2006, 2005, and 2004 were $415,632, $223,296, $142,951, and $92,918, respectively.
Other payables are as follows:
| | | 2007 | | 2006 | | 2005 | | 2004 | |
| | | | | | | | | | |
| Due for employees | | $ | 10,670 | | $ | 9,982 | | $ | 67,889 | | $ | 54,545 | |
| Subsidy loan from government | | | - | | | - | | | - | | | 69,993 | |
| Sundry | | | 33,710 | | | 14,781 | | | 26,051 | | | 26,434 | |
| | | | | | | | | | | | | | |
| | | $ | 44,380 | | $ | 24,763 | | $ | 93,940 | | $ | 150,972 | |
Due for employees are unsecured, interest-free, and repayable on demand. They are travel and expenses reimbursements.
Subsidy loan from government are unsecured, interest-free and due on April 30, 2005.
YANGLIN SOYBEAN INC. F/K/A VICTORY DIVIDE MINING COMPANY
NOTES TO CONSOLIDATED FINANCIAL STATEMENTS
(Stated in US Dollars)
Long term bank loans are as follows:
| | | 2007 | | 2006 | | 2005 | | 2004 | |
| Loans from Industrial | | | | | | | | | | | | | |
| And Commercial Bank of China, | | | | | | | | | | | | | |
| interest rates at 8.892% per annum, | | | | | | | | | | | | | |
| with various installments, final | | | | | | | | | | | | | |
| due October 28, 2016 | | $ | 504,540 | | $ | 513,086 | | $ | 301,287 | | $ | 349,774 | |
| | | | | | | | | | | | | | |
| Current portion due within one year | | | (47,433 | ) | | (51,309 | ) | | (27,390 | ) | | (29,149 | ) |
| | | | | | | | | | | | | | |
| | | $ | 457,107 | | $ | 461,777 | | $ | 273,897 | | $ | 320,625 | |
All of the installments due in 2007 were paid on their due dates. Interest paid for the years ended December 31, 2007, 2006, 2005, and 2004 were $42,015, $21,427, $12,974, and $10,139, respectively.
The future principal payments under the bank loans as of December 31, 2007 are as follows:
| Year | | | | |
| | | | | |
| 2008 | | $ | 47,433 | |
| 2009 | | | 50,979 | |
| 2010 | | | 54,523 | |
| 2011 | | | 58,067 | |
| 2012 | | | 61,611 | |
| Thereafter | | | 231,927 | |
| | | | | |
| | | $ | 504,540 | |
YANGLIN SOYBEAN INC. F/K/A VICTORY DIVIDE MINING COMPANY
NOTES TO CONSOLIDATED FINANCIAL STATEMENTS
(Stated in US Dollars)
| 13. | PREFERRED STOCK AND WARRANTS |
On October 3, 2007, the Company sold 10,000,000 shares of Series A Preferred Stock and various stock purchase warrants for cash consideration totaling $21.5 million dollars. The exercise price, expiration date and number of share eligible to be purchased with the warrants are summarized in the following table:
| Series of warrant | | Number of shares | | Exercise price | | Contractual term | |
| Series A | | | 10,000,000 | | $ | 2.75 | | | 5.00 years | |
| Series B | | | 5,000,000 | | $ | 3.50 | | | 5.00 years | |
| Series J | | | 7,801,268 | | $ | 2.37 | | | 1.50 years | |
| Series C | | | 7,801,268 | | $ | 3.03 | | | 5.00 years | |
| Series D | | | 3,900,634 | | $ | 3.85 | | | 5.00 years | |
The Series A preferred stock has liquidation rights senior to common stock and to any other class or series of stock issued by the Company not designated as ranking senior to or pari passu with the Series A Preferred Share. In the event of a liquidation of the Company, holders of Series A preferred stock are entitled to receive a distribution equal to $2.15 per share of Series A preferred stock prior to any distribution to the holders of common stock or any other stock that ranks junior to the Series A Preferred Shares. The Series A preferred stock is entitled to non-cumulative dividends only upon declaration of dividends by the Company. To date, no dividends have been declared or accrued. The Series A preferred stock will participate based on their respective as-if conversion rates if the Company declares any dividends. Holders of Series A Preferred Shares also have voting rights required by applicable law and the relevant number of votes shall be equal to the number of shares of Common Stock issuable upon conversion of Series A Preferred Shares.
The gross proceeds of the transaction were $21.5 million. The proceeds from the transaction were allocated to the Series A preferred stock, warrants and beneficial conversion feature based on the relative fair value of the securities. The value of the Preferred Series A was determined by reference to the market price of the common shares into which it converts, and the gross value of the warrants was calculated using the Black -Scholes model with the following assumptions: expected life of 5 year, volatility of 27% and an interest rate of 4.24%.
The Company recognized a beneficial conversion feature discount on the Series A preferred stock at its intrinsic value, which was the fair value of the common stock at the commitment date for the Series A preferred stock investment, less the effective conversion price but limited to the $21.5 million of proceeds received from the sale. The Company recognized the $8.0 million beneficial conversion feature as an increase in paid in capital in the accompanying consolidated balance sheets on the date of issuance of the Series A preferred shares since the Series A preferred shares were convertible at the issuance date.
The agreement, also provides that if the Company doesn’t file, or if the registration statements aren’t declared effective throughout the required period, or if the company ceases to trade on certain exchanges as defined, the Company shall pay damages equal to 1.5% of the amount invested for each calendar month capped at a cumulative damage payment amount of 15%. Further, if the Company fails to obtain a listing on NASDAQ or the New York Stock Exchange, then 1,000,000 shares of common stock of the company will be given to the investors. The company is accounting for these penalties in accordance with FAS 5 - Accounting for Contingencies, whereby the penalty will not be recorded as a liability until and if it is probable the penalty will be incurred. No penalty has been recorded in the accompanying consolidated financial statements for this instance.
YANGLIN SOYBEAN INC. F/K/A VICTORY DIVIDE MINING COMPANY
NOTES TO CONSOLIDATED FINANCIAL STATEMENTS
(Stated in US Dollars)
As a result of the Group’s reverse-merger on October 3, 2007, the Group’s capital structure has been changed. The number of common stock was 20,000,003 after reverse-merger. The common stock is $20,000 with paid-in capital $27,487,549. The new capital structure will be retroactively restated in the consolidated balance sheet as of December 31, 2007, 2006, 2005 and 2004.
The calculation of the basic and diluted earnings per share attributable to the common stock holders is based on the following data:
| Earnings: | | 2007 | | 2006 | | 2005 | | 2004 | |
| Earnings for the purpose of basic | | | | | | | | | |
| earnings per share | | $0.516 | | $0.343 | | $0.100 | | $0.046 | |
| Effect of dilutive potential common | | | | | | | | | |
| stock | | | (0.172 | ) | | - | | | - | | | - | |
| | | | | | | | | | | | | | |
| Earnings for the purpose of dilutive | | | | | | | | | | | | | |
| earnings per share | | $ | 0.344 | | $ | 0.343 | | $ | 0.100 | | $ | 0.046 | |
| | | | | | | | | | | | | | |
| Number of shares: | | | | | | | | | | | | | |
| Weighted average number of | | | | | | | | | | | | | |
| common stock for the purpose of basic | | | | | | | | | | | | | |
| earnings per share | | | 19,998,473 | | | 19,998,473 | | | 19,998,473 | | | 19,998,473 | |
| Effect of dilutive potential common | | | | | | | | | | | | | |
| stock | | | 9,999,999 | | | - | | | - | | | - | |
| | | | | | | | | | | | | | |
| Weighted average number of common | | | | | | | | | | | | | |
| stock for the purpose of dilutive | | | | | | | | | | | | | |
| earnings per share | | | 29,998,472 | | | 19,998,473 | | | 19,998,473 | | | 19,998,473 | |
YANGLIN SOYBEAN INC. F/K/A VICTORY DIVIDE MINING COMPANY
NOTES TO CONSOLIDATED FINANCIAL STATEMENTS
(Stated in US Dollars)
| 16. | INTEREST EXPENSES, NET |
Interest expenses, net for the years ended December 31, 2007, 2006, 2005 and 2004 are as follows:
| | | 2007 | | 2006 | | 2005 | | 2004 | |
| | | | | | | | | | |
| Interests on bank borrowings | | $ | 457,647 | | $ | 244,723 | | $ | 155,925 | | $ | 103,057 | |
| Bank charges | | | 1,335 | | | 1,024 | | | 166 | | | 84 | |
| Bank deposit interest income | | | (64,277 | ) | | (26,715 | ) | | (5,721 | ) | | (2,686 | ) |
| | | | | | | | | | | | | | |
| | | $ | 394,705 | | $ | 219,032 | | $ | 150,370 | | $ | 100,455 | |
The Company is registered in the State of Nevada whereas its subsidiary, Faith Winner (BVI) being incorporated in the British Virgin Islands is not subject to any income tax and conducts all of its business through its PRC subsidiary, Faith Winner (Jixian) and VIE, Yanglin (see note 1).
Faith Winner (Jixian), and Yanglin, being registered in the PRC, are subject to PRC’s Enterprise Income Tax. Pursuant to the PRC Income Tax Laws, Enterprise Income Taxes (“EIT”) is generally imposed at a statutory rate of 33%, which comprises 30% national income tax and 3% local income tax.
However, Yanglin has been named as a leading enterprise in the agricultural area and awarded with a tax exemption for the years up to 2008. After 2008, review is required for the extension of the tax exemption status.
A reconciliation between the income tax computed at the U.S. statutory rate and the Group’s provision for income tax is as follows:
| | | 2007 | | 2006 | | 2005 | | 2004 | |
| | | | | | | | | | |
| U.S. statutory rate | | | 34 | % | | 34 | % | | 34 | % | | 34 | % |
| Foreign income not recognized in the U.S. | | | (34 | )% | | (34 | )% | | (34 | )% | | (34 | )% |
| PRC Enterprise Income Tax | | | 33 | % | | 33 | % | | 33 | % | | 33 | % |
| Tax exemption | | | (33 | )% | | (33 | )% | | (33 | )% | | (33 | )% |
| | | | | | | | | | | | | | |
| Provision for income tax | | | - | | | - | | | - | | | - | |
Other sales are short distance transportation charges for customers.
| 19. | FAIR VALUE OF FINANCIAL INSTRUMENTS |
The fair value of a financial instrument is the amount at which the instrument could be exchanged in a current transaction between willing parties. The carrying amounts of financial assets and liabilities, such as cash and cash equivalents, accounts receivable, other receivables, accounts payable, and other payables, approximate their fair values because of the short maturity of these instruments and market rates of interest available to the Group.
YANGLIN SOYBEAN INC. F/K/A VICTORY DIVIDE MINING COMPANY
NOTES TO CONSOLIDATED FINANCIAL STATEMENTS
(Stated in US Dollars)
Originally, the Group has four product segments. Since 2006, Soybean trading segment was ceased. For the years ended December 31, 2007, 2006, 2005 and 2004, the Group’s net sales and cost of sales from these four segments, soybean meal, soybean oil, soybean and salad oil products are shown as follows:
2007 | | Soybean | | Soybean | | | | | | | |
| | | meal | | oil | | Soybean | | Salad oil | | Consolidated | |
| | | | | | | | | | | | |
| Net sales | | | 92,563,442 | | | 47,071,641 | | | - | | | 15,571,784 | | | 155,206,867 | |
| Cost of sales | | | (86,654,275 | ) | | (42,075,631 | ) | | - | | | (13,838,752 | ) | | (142,568,658 | ) |
| | | | | | | | | | | | | | | | | |
| Segment result | | | 5,909,167 | | | 4,996,010 | | | - | | | 1,733,032 | | | 12,638,209 | |
2006 | | Soybean | | Soybean | | | | | | | |
| | | meal | | oil | | Soybean | | Salad oil | | Consolidated | |
| | | | | | | | | | | | |
| Net sales | | | 58,770,932 | | | 22,149,399 | | | - | | | 7,158,163 | | | 88,078,494 | |
| Cost of sales | | | (53,256,342 | ) | | (20,080,631 | ) | | - | | | (6,525,206 | ) | | (79,862,179 | ) |
| | | | | | | | | | | | | | | | | |
| Segment result | | | 5,514,590 | | | 2,068,768 | | | - | | | 632,957 | | | 8,216,315 | |
2005 | | Soybean | | Soybean | | | | | | | |
| | | meal | | oil | | Soybean | | Salad oil | | Consolidated | |
| | | | | | | | | | | | |
| Net sales | | | 25,439,483 | | | 11,420,786 | | | 194,008 | | | 1,052,868 | | | 38,107,145 | |
| Cost of sales | | | (23,541,691 | ) | | (10,409,603 | ) | | (197,274 | ) | | (984,096 | ) | | (35,132,664 | ) |
| | | | | | | | | | | | | | | | | |
| Segment result | | | 1,897,792 | | | 1,011,183 | | | (3,266 | ) | | 68,772 | | | 2,974,481 | |
2004 | | Soybean | | Soybean | | | | | | | |
| | | meal | | oil | | Soybean | | Salad oil | | Consolidated | |
| | | | | | | | | | | | |
| Net sales | | | 16,790,003 | | | 7,153,854 | | | 834,659 | | | 1,267,873 | | | 26,046,389 | |
| Cost of sales | | | (15,849,872 | ) | | (6,980,263 | ) | | (728,516 | ) | | (998,645 | ) | | (24,557,296 | ) |
| | | | | | | | | | | | | | | | | |
| Segment result | | | 940,131 | | | 173,591 | | | 106,143 | | | 269,228 | | | 1,489,093 | |
(3) Exhibits
The exhibits listed on the Exhibit Index (following the signatures section of this report) are included, or incorporated by reference, in this annual report.
SIGNATURES
In accordance with Section 13 or 15(d) of the Exchange Act, the registrant caused this report to be signed on its behalf by the undersigned, thereunto duly authorized.
| | YANGLIN SOYBEAN INC | |
| | (Registrant) | |
| | | |
| | | /s/ Shulin Liu | |
| | Shulin Liu | |
| | | |
| | Chief Executive Officer, | |
| | Chairman of the Board Chief | |
| | | |
| Date: March 31, 2008 | |
In accordance with the Exchange Act, this report has been signed below by the following persons on behalf of the Registrant and in the capacities and on the dates indicated.
Signature | | Title | | Date |
| | | | | |
/s/ Shulin Liu | | | Chief Executive Officer, | | March 31, 2008 |
| Shulin Liu | | | Chairman of the Board | | |
| | | | | | |
/s/ Shaocheng Xu | | | Chief Financial Officer | | March 31, 2008 |
| Shaocheng Xu | | | | | |
| | | | | | |
/s/ Yang Miao | | | Director | | March 31, 2008 |
| Yang Miao | | | | | |
| | | | | | |
/s/ Zongtai Guo | | | Director | | March 31, 2008 |
| Zongtai Guo | | | | | |
EXHIBIT INDEX
| 3.1 | Articles of Incorporation of the registrant filed with the British Virgin Islands Registrar of Corporate Affairs on July 6, 2006, incorporated by reference to the exhibit of the same number to our report on Form 10-SB filed with the SEC on July 12, 2007. |
| | |
| 3.2 | Bylaws incorporated by reference to the exhibit of the same number to our report on Form 10-SB filed with the SEC on July 12, 2007. |
| 3.3 | Specimen of Common Stock certificate incorporated by reference to the exhibit of the same number to our report on Form 8-k filed with the SEC on October 10, 2007. |
| | |
| 3.4 | Certificate of Designations authorizing the Series A Convertible Preferred Stock incorporated by reference to the exhibit of the same number to our report on Form 8-k filed with the SEC on October 10, 2007. |
| | |
| 3.5 | Certificate of Designations authorizing the Series B Convertible Preferred Stock incorporated by reference to the exhibit of the same number to our report on Form 8-k filed with the SEC on October 10, 2007. |
| | |
| 4.1 | Form of Series A Warrant incorporated by reference to the exhibit of the same number to our report on Form 8-k filed with the SEC on October 10, 2007. |
| | |
| 4.2 | Form of Series B Warrant incorporated by reference to the exhibit of the same number to our report on Form 8-k filed with the SEC on October 10, 2007. |
| | |
| 4.3 | Form of Series J Warrant incorporated by reference to the exhibit of the same number to our report on Form 8-k filed with the SEC on October 10, 2007. |
| | |
| 4.4 | Form of Series C Warrant incorporated by reference to the exhibit of the same number to our report on Form 8-k filed with the SEC on October 10, 2007. |
| | |
| 4.5 | Form of Series D Warrant incorporated by reference to the exhibit of the same number to our report on Form 8-k filed with the SEC on October 10, 2007. |
| | |
| 4.6 | Form of Series E Warrant issued to Kuhns Brothers, Inc. incorporated by reference to the exhibit of the same number to our report on Form 8-k filed with the SEC on October 10, 2007. |
| | |
| 4.7 | Form of Series F Warrant issued to Mass Harmony Asset Management Limited incorporated by reference to the exhibit of the same number to our report on Form 8-k filed with the SEC on October 10, 2007. |
| | |
| 4.8 | Registration Rights Agreement dated October 3, 2007, by and among the Company and the Purchasers, incorporated by reference to the exhibit of the same number to our report on Form 8-k filed with the SEC on October 10, 2007. |
| | |
| 4.9 | Series J Registration Rights Agreement dated October 3, 2007, by and among the Company, Vision Opportunity Master Fund Ltd., Sansar Capital Special Opportunity Master Fund, LP (Cayman Master) and Vicis Capital Master Fund, incorporated by reference to the exhibit of the same number to our report on Form 8-k filed with the SEC on October 10, 2007. |
| 4.10 | Lock-Up Agreement, dated as of October 3, 2007, by and among the Company and Winner State (BVI), incorporated by reference to the exhibit of the same number to our report on Form 8-k filed with the SEC on October 10, 2007. |
| | |
| 4.11 | Share Exchange Agreement, dated as of October 3, 2007 between the Company, Winner State (BVI), Fang Chen, Yang Miao and Ying Zhang, incorporated by reference to the exhibit of the 10.1 to our report on Form 8-k filed with the SEC on October 10, 2007. |
| | |
| 4.12 | Series A Convertible Preferred Stock Purchase Agreement, dated as of October 3, 2007 between the Company and the Purchasers, incorporated by reference to the exhibit of 10.2 to our report on Form 8-k filed with the SEC on October 10, 2007. |
| 4.13 | Securities Escrow Agreement, dated October 3, 2007, by and between the Company, Vision Opportunity Master Fund, Ltd as representative of the Purchasers, Winner State (BVI) and Loeb & Loeb LLP, as escrow agent, incorporated by reference to the exhibit of 10.3 to our report on Form 8-k filed with the SEC on October 10, 2007. |
| | |
| 10.1 | Consulting Agreement, dated as of October 3, 2007, by and among the Company and Glenn A. Little, incorporated by reference to the exhibit of 10.4 to our report on Form 8-k filed with the SEC on October 10, 2007. |
| | |
| 10.2 | Engagement Letter Agreement, dated December 12, 2006, by and between Yanglin and Kuhns Brothers, Inc, incorporated by reference to the exhibit of 10.5 to our report on Form 8-k filed with the SEC on October 10, 2007. |
| | |
| 10.3 | Mass Harmony Financial Consulting Agreement (MHA Agreement), dated November 2, 2006 by and between Yanglin and Mass Harmony Asset Management Limited, incorporated by reference to the exhibit of 10.6 to our report on Form 8-k filed with the SEC on October 10, 2007. |
| | |
| 10.4 | The Consignment Agreements, dated as of September 1, 2007, incorporated by reference to the exhibit of 10.7 to our report on Form 8-k filed with the SEC on October 10, 2007. |
| | |
| 10.5 | Exclusive Purchase Option Agreement, dated as of September 24, 2007, incorporated by reference to the exhibit of 10.8 to our report on Form 8-k filed with the SEC on October 10, 2007. |
| | |
| 10.6 | Registered Trademark Transfer Agreement, dated as of September 24, 2007, incorporated by reference to the exhibit of 10.9 to our report on Form 8-k filed with the SEC on October 10, 2007. |
| | |
| 10.7 | Trademark Licensing Agreement, dated as of September 24, 2007, incorporated by reference to the exhibit of 10.10 to our report on Form 8-k filed with the SEC on October 10, 2007. |
| | |
| 10.8 | Consigned Management Agreement, dated as of September 24, 2007, incorporated by reference to the exhibit of 10.11 to our report on Form 8-k filed with the SEC on October 10, 2007. |
| | |
| 10.9 | Loan Agreement, dated as of September 24, 2007, incorporated by reference to the exhibit of 10.12 to our report on Form 8-k filed with the SEC on October 10, 2007. |
| 10.10* | Form of soybean purchase contract |
| | |
| 10.11* | Form of sales contract for soybean product |
| | |
| 10.12* | Employment Contract-Shulin Liu as of Sept. 24, 2007 |
| | |
| 10.13* | Employment Contract-Shaocheng Xu as of Sept. 24, 2007 |
| | |
| 10.14* | Employment Contract-Zongtai Guo as of Sept. 24, 2007 |
| | |
| 16.1 | Letter from the Company to Hatfield, incorporated by reference to the exhibit of the same number to our report on Form 8-k filed with the SEC on October 10, 2007. |
| | |
| 16.2 | Letter from Hatfield to the SEC, incorporated by reference to the exhibit of the same number to our report on Form 8-k filed with the SEC on October 10, 2007. |
| | |
| 16.3 | Letter of Samuel H. Wong & Company, LLP, dated February 26, 2008, incorporated by reference to the exhibit of 16.1 to our report on Form 8-k/A filed with the SEC on February 28, 2008. |
| | |
| 16.4 | Letter of Samuel H. Wong & Company, LLP, dated March 17, 2008, incorporated by reference to the exhibit of 16.1 to our report on Form 8-k/A filed with the SEC on March 28, 2008. |
| | |
| 21.1 | List of Subsidiaries incorporated by reference to the exhibit of same number to our report on Form 8-k filed with the SEC on October 10, 2007 |
| | |
| 31.1* | Certification Pursuant to Section 302 of the Sarbanes-Oxley Act of 2002. |
| | |
| 31.2* | Certification Pursuant to Section 302 of the Sarbanes-Oxley Act of 2002. |
| | |
| 32.1* | Certification Pursuant to 18 U.S.C. Section 1350, as Adopted pursuant to Section 906 of the Sarbanes-Oxley Act of 2002. |
| | |
| 32.2* | Certification Pursuant to 18 U.S.C. Section 1350, as Adopted pursuant to Section 906 of the Sarbanes-Oxley Act of 2002. |
| | |
| * | Filed herewith. |