 Investor Presentation September 2007 * * * * * * * * Exhibit 99.1 |
 Safe Harbor Statement THE WORDS “BELIEVES, ANTICIPATES, EXPECTS” AND SIMILAR EXPRESSIONS ARE INTENDED TO IDENTIFY FORWARD LOOKING STATEMENTS. SUCH STATEMENTS ARE SUBJECT TO CERTAIN RISKS AND UNCERTAINTIES, WHICH COULD CAUSE ACTUAL RESULTS TO DIFFER MATERIALLY FROM THOSE PROJECTED IN THE FORWARD LOOKING STATEMENTS. THE RISKS AND UNCERTAINTIES ARE DISCUSSED IN OUR ANNUAL REPORT ON U.S. SECURITY AND EXCHANGE COMMISSION (“SEC”) FORM 10-K, OUR QUARTERLY REPORT ON SEC FORM 10-Q, PARTICULARLY IN THE SECTION TITLED RISK FACTORS. READERS ARE CAUTIONED NOT TO PLACE UNDUE RELIANCE ON THESE FORWARD LOOKING STATEMENTS, WHICH SPEAK ONLY AS OF THE DATE HEREOF. THE COMPANY UNDERTAKES NO OBLIGATIONS TO PUBLICLY RELEASE THE RESULTS OF ANY REVISIONS TO FORWARD LOOKING STATEMENTS, WHICH MAY BE MADE TO REFLECT EVENTS OR CIRCUMSTANCES AFTER THE DATE HEREOF OR TO REFLECT THE OCCURRENCE OF UNANTICIPATED EVENTS. 2 |
 Net Atlas Proved Reserves (1) 795 Bcfe Proved Reserves Managed for Others 308 Bcfe Total Proved Reserves Managed by Atlas 1,103 Bcfe Over 1.1 Trillion Mcfe of Natural Gas Reserves Under Management Atlas Energy Resources, LLC 3 1 Reflect proved reserve quantities in Appalachia as of 12/31/06 and proved reserve quantities in Michigan as of 6/30/07. |
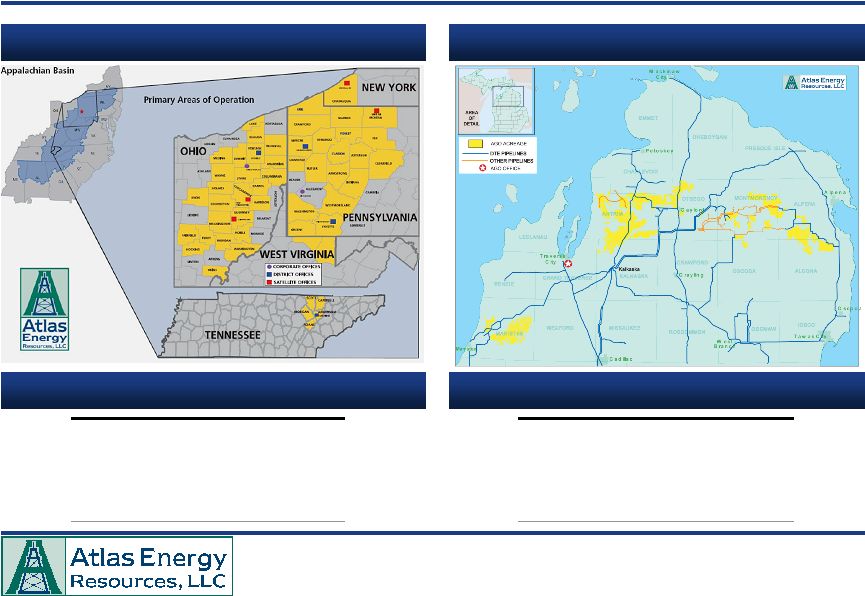 Net Proved Reserves as of 12/31/06 181 Bcfe Net Proved Reserves as of 6/30/07 614 Bcfe Current Average Daily Production 30 Mmcfe / d Current Average Daily Production 60 Mmcfe / d Reserve Life (years) 18.3 Reserve Life (years) 28.5 % Natural Gas 93.0% % Natural Gas 99.0% Atlas Energy Gas and Oil Operations Appalachian Primary Areas of Operation Michigan Primary Areas of Operation Proved Reserves Proved Reserves 4 |
 Atlas Energy’s Unique Business Model: Scaleable, Low Risk, High Return Gas and Oil Production Partnership Management • Leading sponsor of tax advantaged investment partnerships – Raised $218 million 2006 – Expect to raise at least $340 million in 2007 • Enhanced rates of returns on our capital – Generates significant fee-based revenues – Carried interests to our account • Fee revenue reduces the risk of our cash flows – Largely upfront – Continuing fee revenue for the life of the well – Not directly dependent on commodity prices • Appalachian Basin – One of the largest operators in the Appalachian Basin • 181 Bcfe of net proved reserves as of 12/31/06 • Current net daily production of 30 Mmcfe/d; 90 Mmcfe/d operated • Approximately 657,000 net acres / 426,000 net undeveloped • Approximately 230,000 net acres in the deeper Marcellus Shale Play; 9 wells drilled and 7 completed • Approximately 3,000 future shallow drilling locations identified • Michigan – Antrim Shale • Approximately 614 Bcfe of net proved reserves as of 6/30/07 • Interest in approximately 2,200 producing wells • Current net Daily Production of ~60 Mmcfe/d • Approximately 294,000 net acres / 66,000 net undeveloped • Over 900 future shallow drilling and recompletion locations identified 5 |
 6 Investment Highlights Dynamic approach to growth – Among 10 most active drillers in the country; over 1,100 wells to be drilled in 2007 – Completed accretive acquisitions for $1.3 billion in first nine months since IPO (December 2006) Continuing success in exceeding expectations – Increased guidance for 2008 distributions to $2.20 to $2.40 per unit; up 34% since IPO – Increased total proved reserves to 795 Bcfe; up 364% since IPO – Increased net daily production to 90 Mmcfe / day; up 233% since IPO Leading sponsor of tax advantaged investment partnerships – Increased funds raised in 2007 to at least $340 million; up 56% over the prior year and 26% over our guidance at the time of the IPO – Carried interest and fees generated enhancing rate of return Low risk profile – Long-lived reserves with shallow decline ratios; R / P ratio of 25.2 years – 98% of wells drilled are successful – Approximately 70% of expected natural gas production is hedged over the next five years – Distributions protected by 1.2x coverage ratio – Conservative maintenance capital expenditure budget of $52 million Growing inventory of drilling locations will continue expansion – Identified 3,900 shallow drilling and recompletion opportunities – Net undeveloped acres of 492,000; up 67% from the time of IPO Emerging Marcellus Shale opens new vistas for ATN – 230,000 net prospective acres could contain over 2,000 vertical locations – Reserve potential of 1.0 – 2.0 Tcfe of natural gas reserves net to ATN – Horizontal drilling could increase economics even further |
 Partnership Management Summary |
   Partnership Management Business Model – Appalachia The Value to Investors Receives an allocation of intangible drilling credits which are deducted in the year incurred - Target a 90% IDC deduction Monthly cash distribution for the life of the wells Production Margin - ATN typically takes a 35% partnership interest - Includes 7% carried interest - $75MM 2006 gross margin Upfront Well Construction and Completion Fees - Cost plus 15% mark-up - $26MM 2006 gross margin Upfront Administrative and Oversight Fees - $15,000 fixed fee for each shallow well drilled - Administrative fees for Marcellus wells are flexible - $12MM 2006 fees Monthly Well Service Fees - Operating and administrative fee per month for the life of the well; currently $437 per well - $6MM 2006 gross margin The Value to ATN Acreage Dedication Credit - Typically $10–15,000 per well - Credit towards ATN’s capital contribution 8 |
 ATN Net Investment Assumptions IRR to ATN Investment Partnerships Enhance Returns to Atlas Energy ATN Partnership Contribution $(104,500) Plus: Land Contribution 11,300 Plus: Administrative Fee 15,000 Plus: Well Construction Mark-Up 36,750 ATN Net Investment $(41,450) EUR 156 Mmcfe Realized natural gas price $8.00 Third-Party Drilling and Completion Cost $279,000 Total Well Cost to Partnership $339,000 ATN Partnership Contribution $104,500 ATN Percentage Ownership of Partnership 34% “Heads Up” 20% Partnership Model 74% 9 |
 Investment $10,000 Realized Natural Gas Price $8.00 Total Well EUR 156 Mmcf Decline Profile Typical Appalachia Federal Tax Rate 35% State Tax Rate 5% Gas Price Sensitivity IRR @ $10.00 Mcf 27% IRR @ $8.00 Mcf 19% IRR @ $6.00 Mcf 9% Base Case ($100,000 Investment) Initial Tax Savings $36,000 Cash Distributions (year 1-10) $118,347 Terminal Value (4.0x year 10 CF) $21,034 Net Investment Assumptions Anticipated IRR to Investor How Do the Investors Fair? 10 – 24% Internal Rate of Return (1) 1 Based on average hedge price for 2008. |
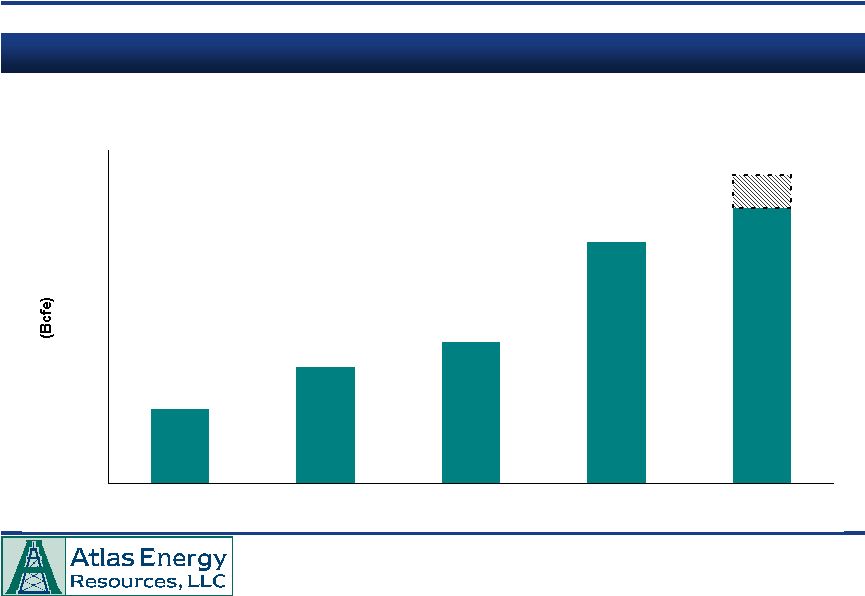
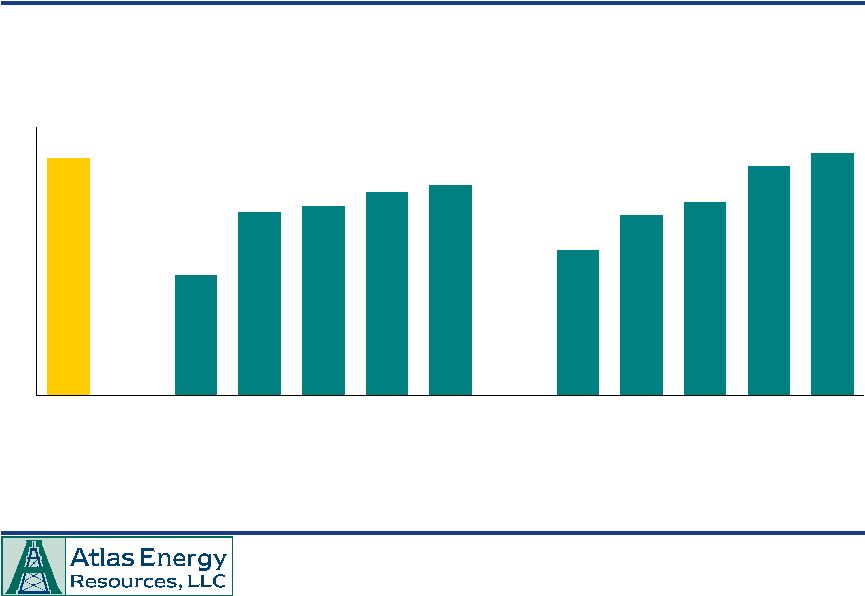
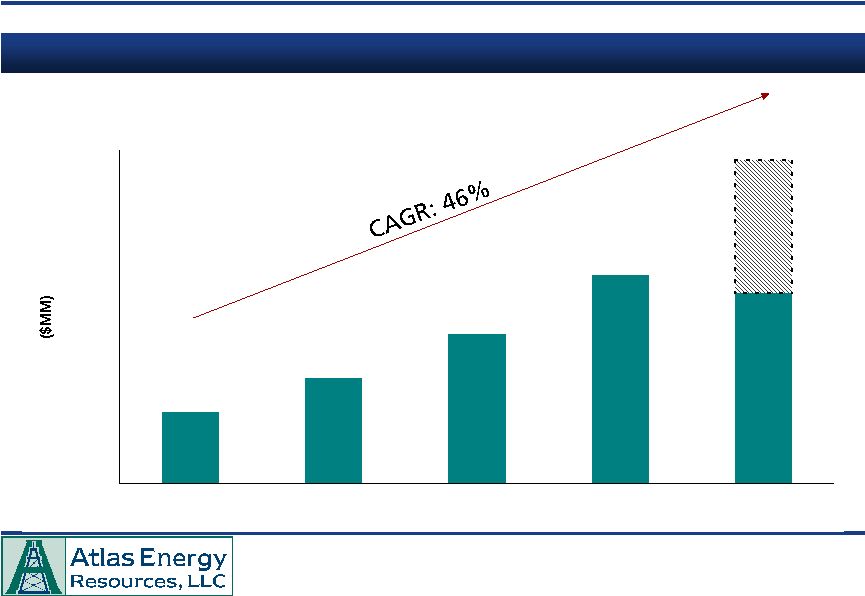 $75.1 $111.6 $156.9 $218.5 $200.0 YTD $340.0 (Expected ) 0.0 50.0 100.0 150.0 200.0 250.0 300.0 $350.0 2003 2004 2005 2006 2007E ATN: Partnership Funds Raised Capital Raised ($MM) 11 |
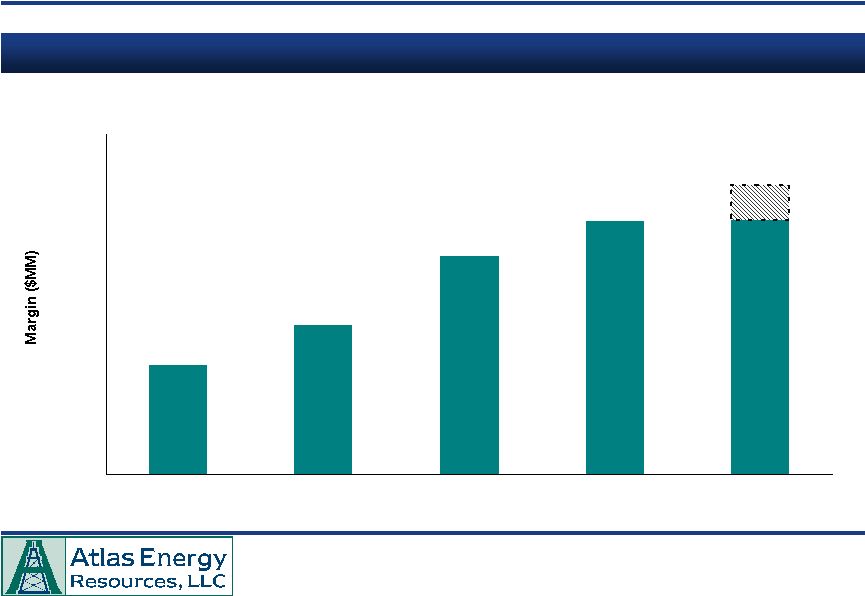
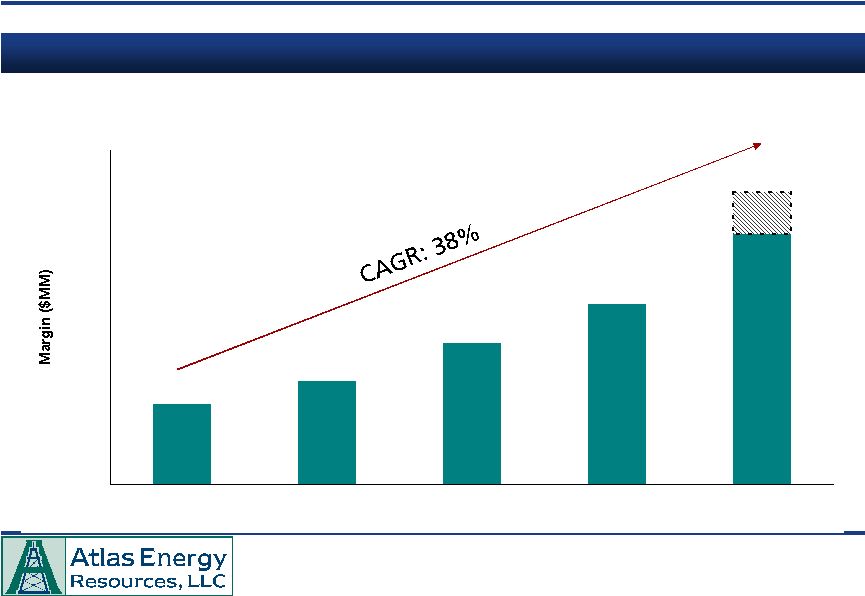 $60.0 – $70.0 $19.4 $24.8 $33.8 $43.3 0.0 10.0 20.0 30.0 40.0 50.0 60.0 70.0 $80.0 2003 2004 2005 2006 2007E ATN: Partnership Management Segment Margin Segment Margin ($MM) 12 |
 • ATN has the trust of the financial planning community – 35+ years of continuous programs • Diverse base of broker dealers and investors would take years to cultivate – More than 100 separate broker dealers are selling our programs in 2007, up from 80 in 2006 – AIG, ING, Lincoln Financial, Mass Mutual, First Global, Linsco – among others – 32,000 individual investors – Average ticket size of approximately $40,000 – Marketed in all 50 states • Scale supports cost of partnership administration • Regulatory compliance is a learned skill 13 Partnership Management Business has Large Barriers to Entry |
 Appalachian Gas and Oil Asset Overview |
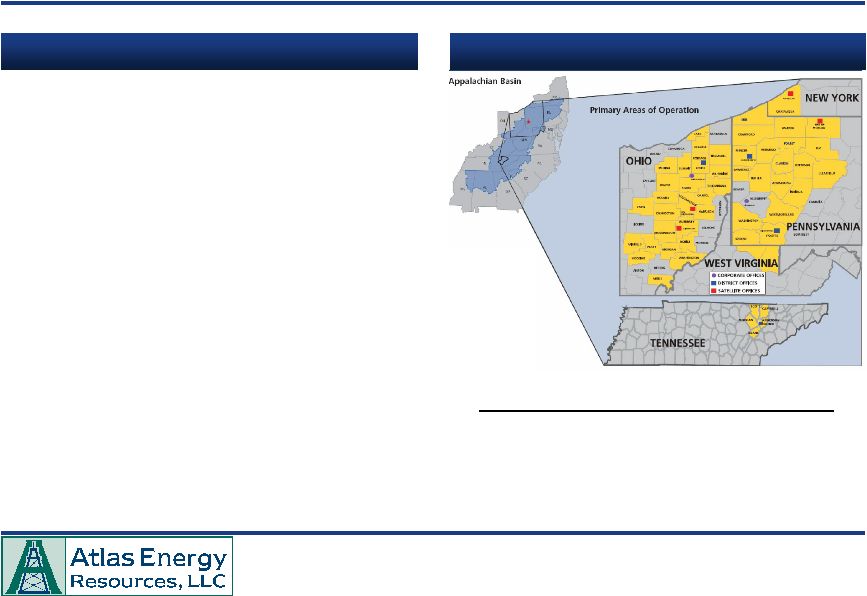 Atlas Energy Gas and Oil Operations – Appalachia Operational Highlights • Atlas Energy Appalachia is one of the largest operators in the Appalachian Basin – Operate over 6,700 wells producing over 90 Mmcfe per day – Will drill over 1,000 wells in 2007 • Wells produce 30 to 50 years • Drilling success rates of greater than 98% • Receive $.60 to $.80 premium over NYMEX – Location premium of $0.30 - $0.40 per MMBtu – Average Btu content of 1,050 / mcfe results in additional premium of approximately $0.40 • Traditional shallow target formations include: the Clinton/Medina formations of Ohio / NW Pennsylvania; the upper Devonian sandstones of Central and Southwest Pennsylvania; and the Monteagle, Chattanooga Shale and Stones River formations of Tennessee • The Appalachian Basin remains largely unexplored for deep gas prospects (below 6,000 feet) 15 Net Acreage 657,000 Developed 231,000 Undeveloped 426,000 Net Reserves (Bcfe) 181.0 Identified Future Drilling Locations 3,000 Current Daily Net Production (Mmcfe/d) 30 Primary Areas of Operation |
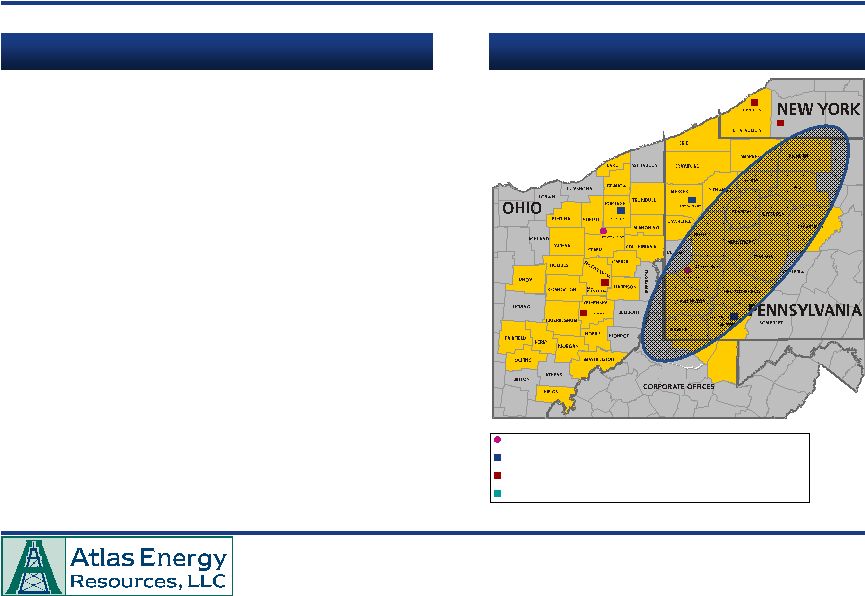 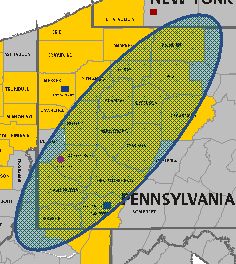  Emerging Marcellus Shale Play Corporate Offices District Offices Satellite Offices Areas in which we have Acreage and Production • Atlas Energy is Well-Positioned in the Emerging Marcellus Shale Play – Black, organic rich blanket shale formation found throughout much of Western Pennsylvania – Industry banter of vertical type-well EUR of “600 to 1,000 Mmcfe” within our range of expectations – Vertical D&C costs $1.0 to $1.3 million • Aggressively expanding land position – Hold approximately 230,000 acres currently, compared to 86,000 acres in summer 2006 – 1,500 to 2,000 potential locations – 1.0 to 2.0 Tcfe of potential reserves net to ATN • While still early, we are pleased with the results – Have drilled nine vertical wells; seven have been completed and are currently online – Management plans to have drilled up to 50 vertical Marcellus Shale wells by the end of 1Q’08 – Horizontal drilling could enhance economics even further. Planning to drill a horizontal well with another industry partner in 2007 Marcellus Shale 16 LEWIS RUN WEST VIRGINIA Highlights |
 10.3 – 10.7 9.9 8.7 8.4 7.9 7.0 8.0 9.0 10.0 11.0 2003 2004 2005 2006 2007E Gas and Oil Production - Appalachia Production (Bcfe) 17 |
 Appalachia Gas and Oil Segment Margin Segment Margin ($MM) 18 $75 - $85 $32.2 $44.0 $64.1 $74.6 0.0 20.0 40.0 60.0 80.0 100.0 2003 2004 2005 2006 2007E |
 Michigan Gas and Oil Asset Overview |
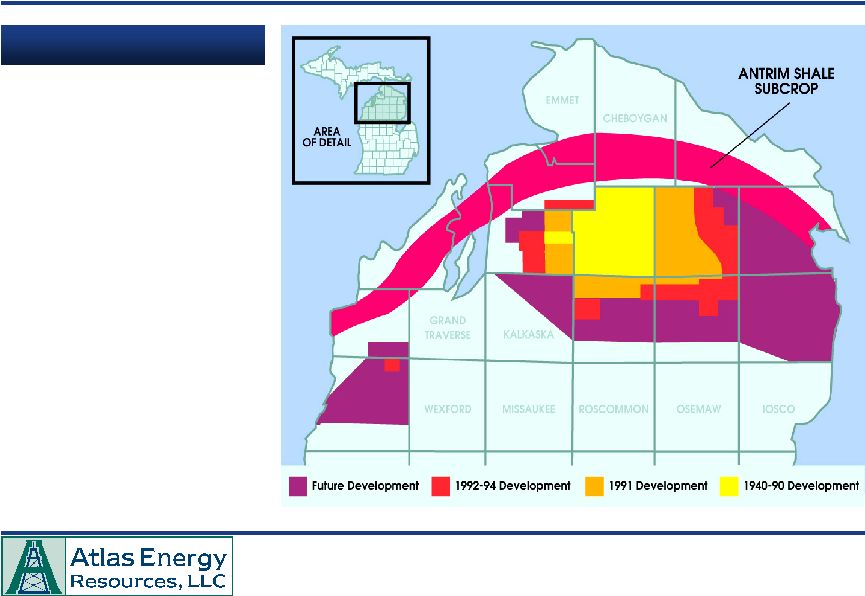 Atlas Energy Gas and Oil Operations – Michigan Antrim Shale 20 • Antrim has been producing since the 1940’s • Drilling nuisance until the 1980’s • Section 29 tax credit and existing infrastructure created drilling boom • One of first shale plays to evolve and mature Michigan Antrim Shale |
 Net Acreage 294,000 Developed 228,000 Undeveloped 66,000 Net Reserves (Bcfe) 613.7 Identified Future Drilling and Recompletion Locations 900 Current Daily Net Production (Mmcfe/d) 60 Atlas Energy Gas and Oil Operations – Michigan Antrim Shale – Michigan Operational Highlights 21 • ATN Michigan is now the largest operator in Northern Michigan’ s Antrim Shale – Consistent performance and cash flow – Low-cost operator – 30% lower LOE / mcfe than competitors – Ability to develop tracts with difficult surface issues – Consolidation through acquisitions of other operators • Long-lived, shallow decline proved reserves – 99% natural gas; 66% proved developed; R / P >28 years • Approximately 2,200 producing wells – Approximately 75% operated / 78% avg. working interest and over 900 future drilling locations and recompletion identified • Growing net acreage position: – Leasing activities add 10,000 to 15,000 acres / year – Although mature, the field continues to expand through development of technology and successful testing of new areas • Horizontal wells have opened up new areas of development |
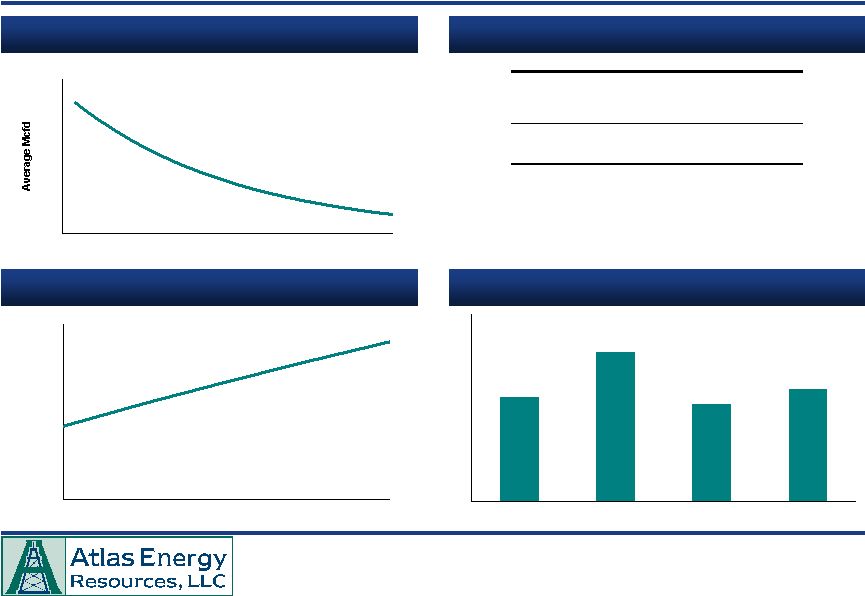 0 10 20 30 40 50 60 70 80 0 5 10 15 20 25 Years $290 $288 $295 $289 2004 2005 2006 2007 0.0% 5.0% 10.0% 15.0% 20.0% 25.0% 30.0% 35.0% 40.0% 45.0% 50.0% $5.00 $6.00 $7.00 $8.00 $9.00 Atlas Energy Gas and Oil Operations – Antrim Economics Cost Analysis Typical Type Curve 22 Historical Drilling Costs ($MM / well) IRRs at Various Gas Prices Capital Costs Amount ($) Drilling $110,000 Completion 120,000 Flowline 50,000 Land 10,000 Total $290,000 Operating Costs Amount ($) Average Royalty Rate 20% Gathering Costs – Transportation Costs ($0.31) / Mcf Marketing Fees – Severance Taxes 6.0% Ad Valorem Taxes 1.5% Lease Operating Expenses $700 / well / month |
 Acquisition Strategy |
 24 Acquisition Strategy • Third Party Acquisitions of Proved Producing Properties: – Sustained accretion to distributable cash flow per share – Long-lived established production – Minimal technical / reserve risk – Aggressive use of hedging to secure future cash flow • Acreage and Drilling Locations to Support Drilling Programs: – Known areas of operations |
 Financial Overview |
 26 As of % of ($ in millions) June 30, 2007 Capitalization Cash and Cash Equivalents $5.6 Revolving Credit Facility $713.9 46.7% Other Secured Debt 0.0 0.0% Total Debt $713.9 46.7% Total Stockholder's Equity $815.1 53.3% Total Capitalization $1,529.0 100.0% Credit Metrics Total Debt / Book Capitalization 47% Total Debt / Proved Reserves ($ / Mcfe) $0.90 Total Debt / PDP ($ / Mcfe) $1.25 PV - 10 / Total Debt 2.0x Statistics (1) Proved Reserves (Bcfe) 795 PDP Reserves (Bcfe) 571 PV - 10 ($MM) $1,428.1 Financial Snapshot 1 Reflect proved reserve quantities in Appalachia as of 12/31/06 and proved reserve quantities in Michigan as of 6/30/07. |
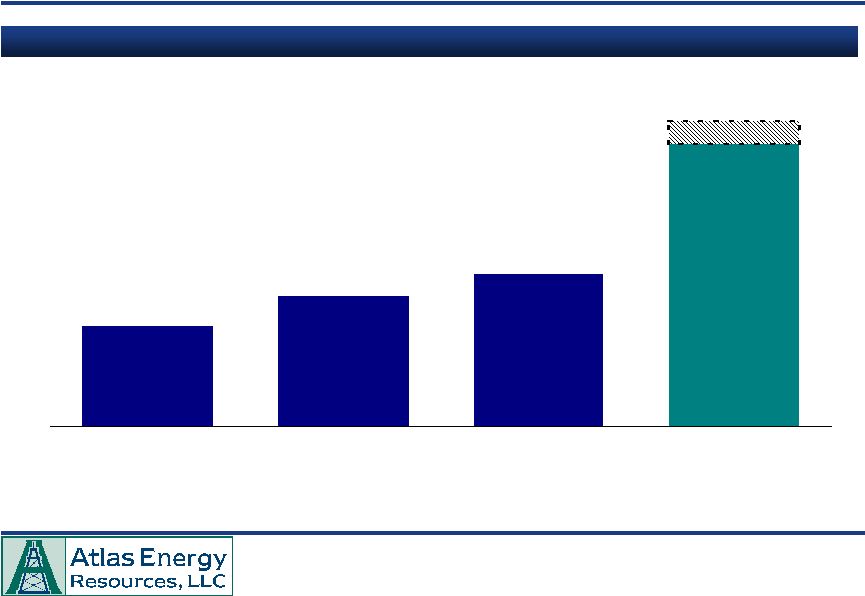 Atlas Energy Financial Performance EBITDA ($MM) 27 $62.3 $80.6 $94.6 $175 - $190 2004 2005 2006 2007E |
 7.08% 3.58% 5.47% 5.65% 6.08% 6.27% 4.35% 5.37% 5.76% 6.83% 7.24% 0.00% 1.00% 2.00% 3.00% 4.00% 5.00% 6.00% 7.00% 8.00% Atlas Energy Resources LLC Public MLP General Partners Mid Cap Pipeline/ Midstream MLPs MLP Average Coal MLPs Large Cap Pipeline/ Midstream MLPs Constellation Energy Partners, LP Breitburn Energy Partners, LP EV Energy Partners, LP Legacy Reserves, LP Linn Energy, LLC Attractive Distribution Yield 28 Note: As of 9/6/2007. Yields reflect midpoint of current 2008 distribution guidance for all companies. 1 Public MLP General Partners: AHD, AHGP, BGH, EPE, HPGP, MGG, NRGP, NSH, PVG and XTXI. 2 Mid Cap Pipeline Midstream MLPs: APL, CPNO, DEP, DPM, EROC, GEL, HEP, HLND, KGS, MMLP, MWE, NGLS, RGNC, SEP, SGLP, SXL, TCLP, TLP, EXLP, WPZ and XTEX. 3 Coal MLPs: ARLP, NRP and PVR. 4 Large Cap Pipeline Midstream MLPs: BPL, BWP, EEP, EPD, ETP, KMP, MMP, NS, OKS, PAA, and TPP. |
 Hedging Summary |
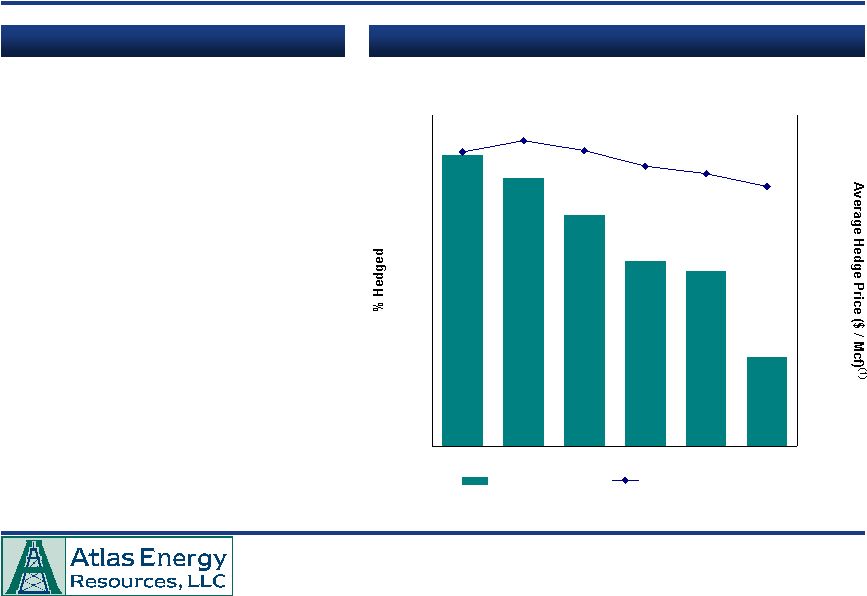 88% 81% 70% 56% 53% 27% 0% 10% 20% 30% 40% 50% 60% 70% 80% 90% 100% 2007 2008 2009 2010 2011 2012 – $2.00 $4.00 $6.00 $8.00 $10.00 % Hedged Average Hedge Price Hedged Production Volume 30 Distribution Stability Key Attributes of Distribution Stability • Fee based revenues from investment partnerships • Long-lived, high success rate reserves • Drilling flexibility due to high operatorship • Hedge program 1 Includes an estimated positive basis differential and Btu adjustment. Average hedge price calculated as weighted average of swap hedge contract price and mid-point of costless collar hedge price. |
 Avg. Hedge Avg. Hedge (%) Floor Ceiling Calendar Year Hedged (2)(4) ($ / Mcf) (1)(3) ($ / Mcf) (1)(3) 2007 2% $8.42 $9.59 2008 2% $8.42 $10.43 2009 – – – 2010 3% $8.70 $9.76 2011 9% $8.45 $9.46 Avg. Hedge (%) Price Calendar Year Hedged (2) ($ / Mcf) (1)(3) 2007 86% $8.89 2008 79% $9.23 2009 70% $8.94 2010 53% $8.42 2011 44% $8.09 2012 27% $7.85 Atlas Energy Hedges 1 In thousand cubic feet (“mcf”). 2 Percentages hedged are based on a) for 2007, Appalachia and Michigan projected production for full year 2007, and b) for 2008 and forward, projected production for Appalachia for full year 2007 and projected production for Michigan for full year 2008. 3 Includes an estimated positive basis differential and Btu adjustment. Fixed Price Swaps Costless Collars 31 |
 * * * * * * * * |