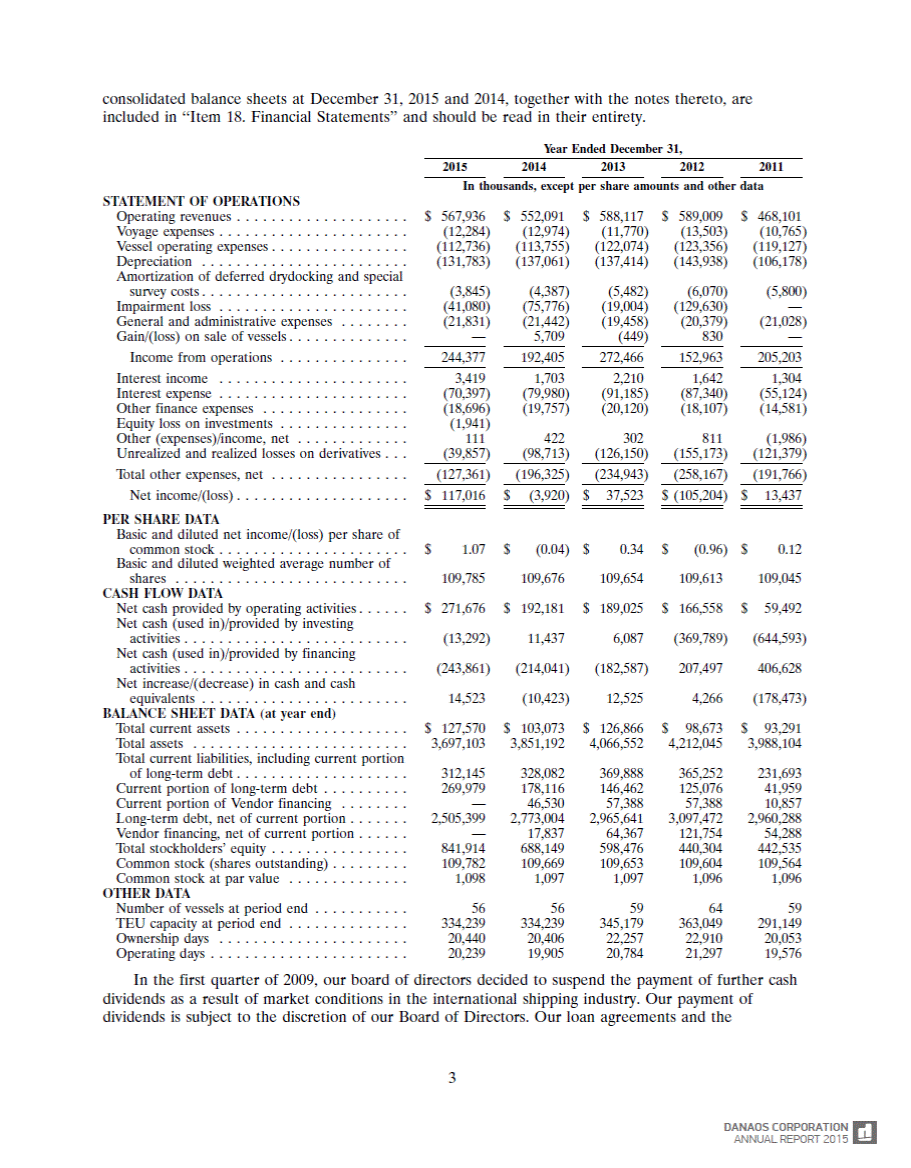
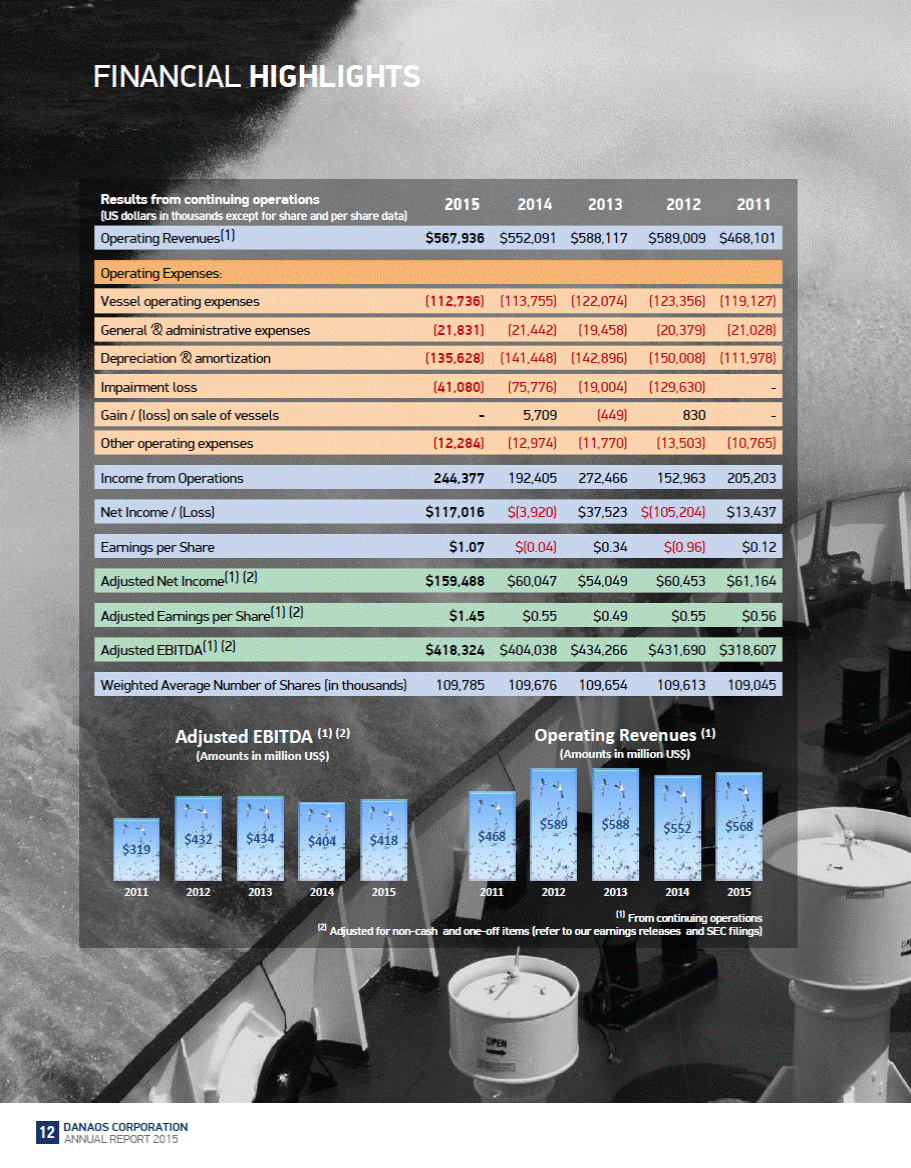
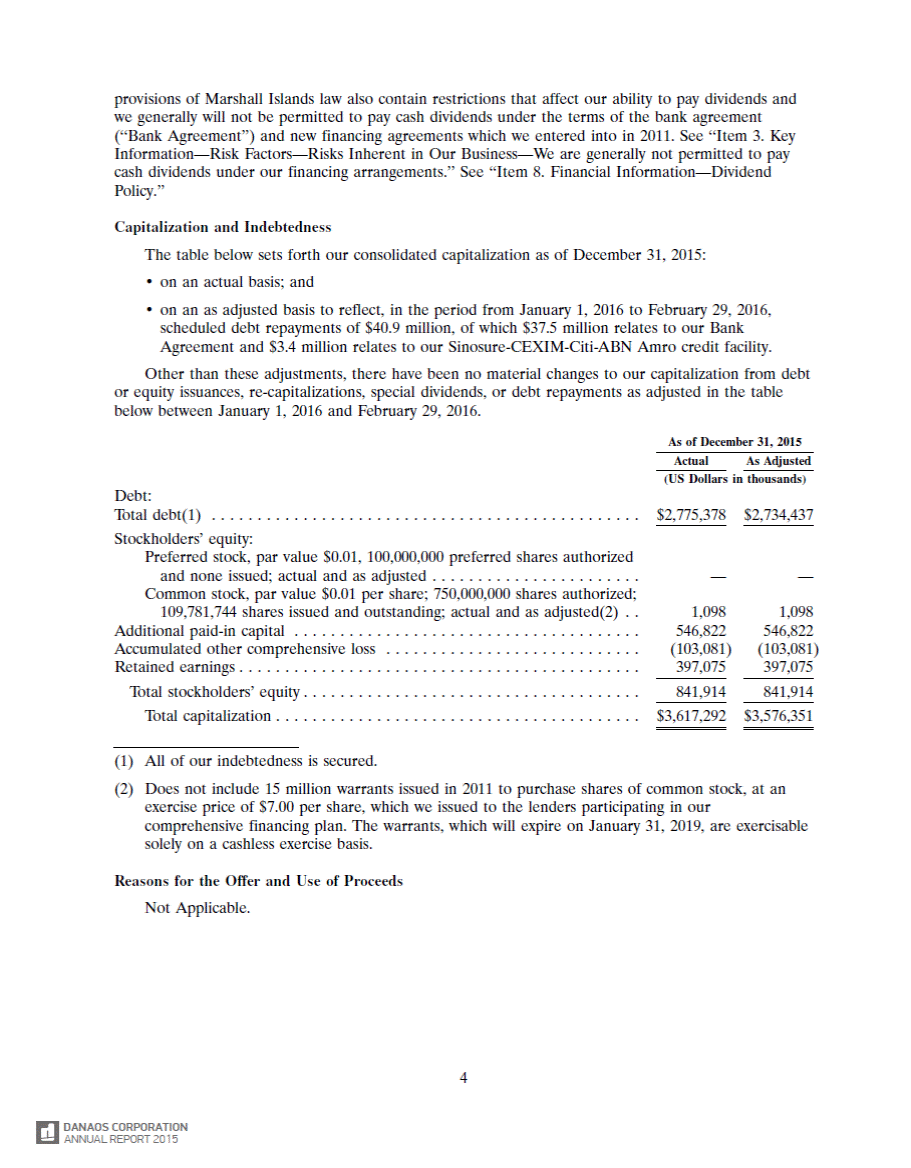
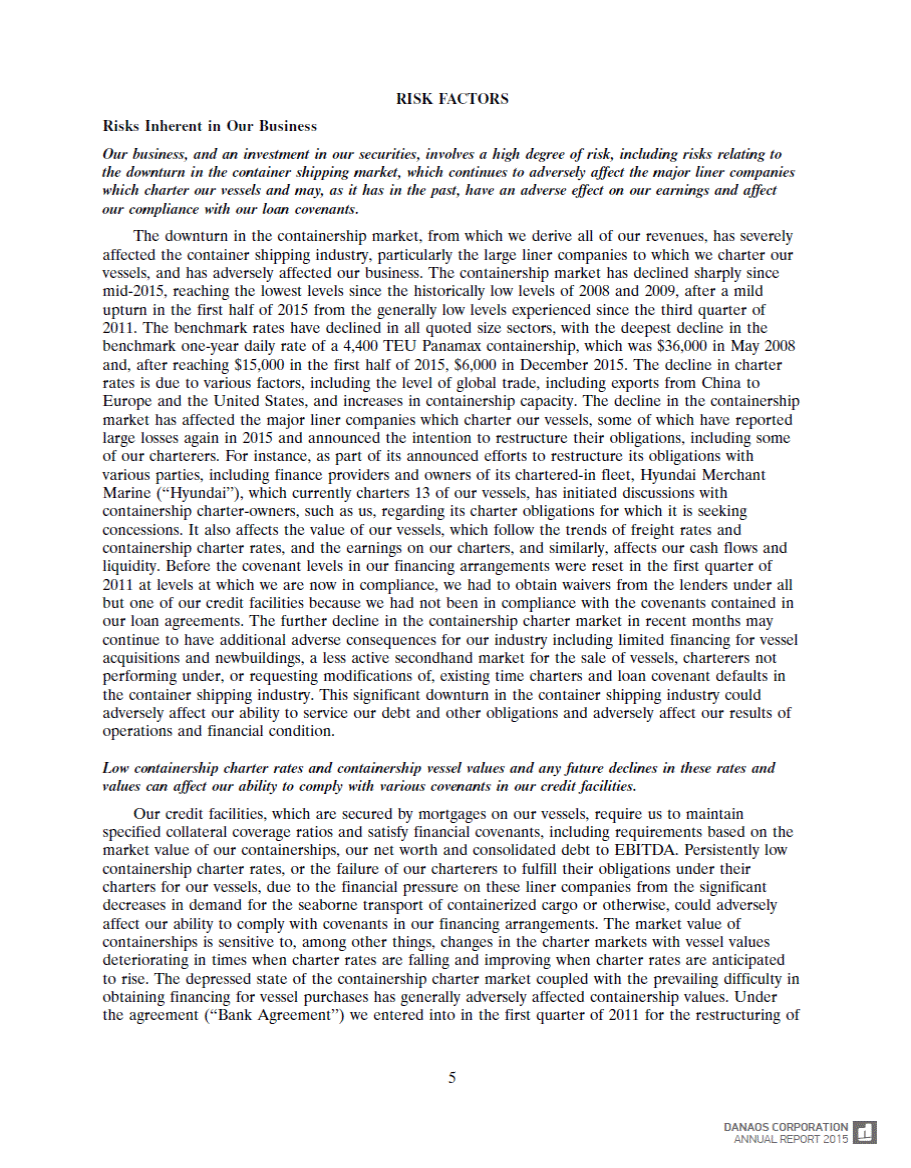
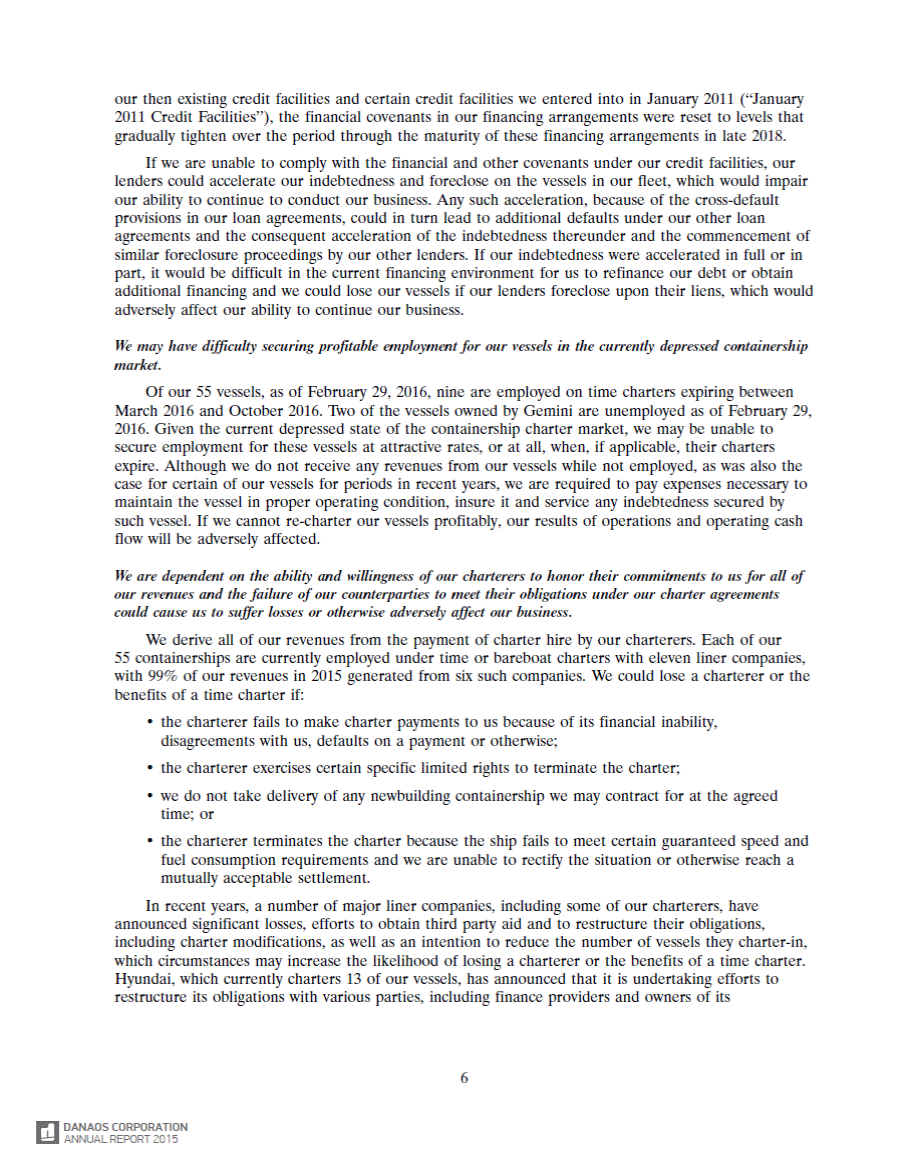
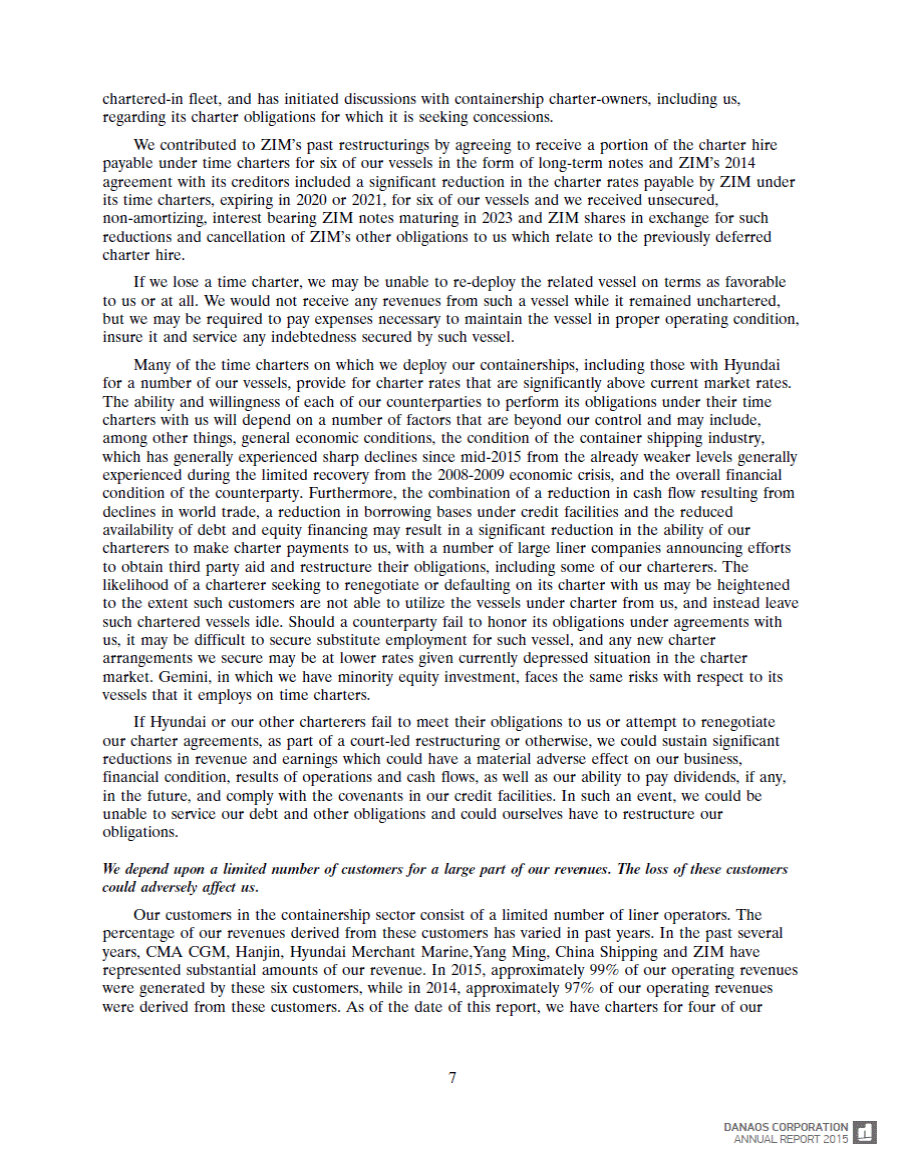
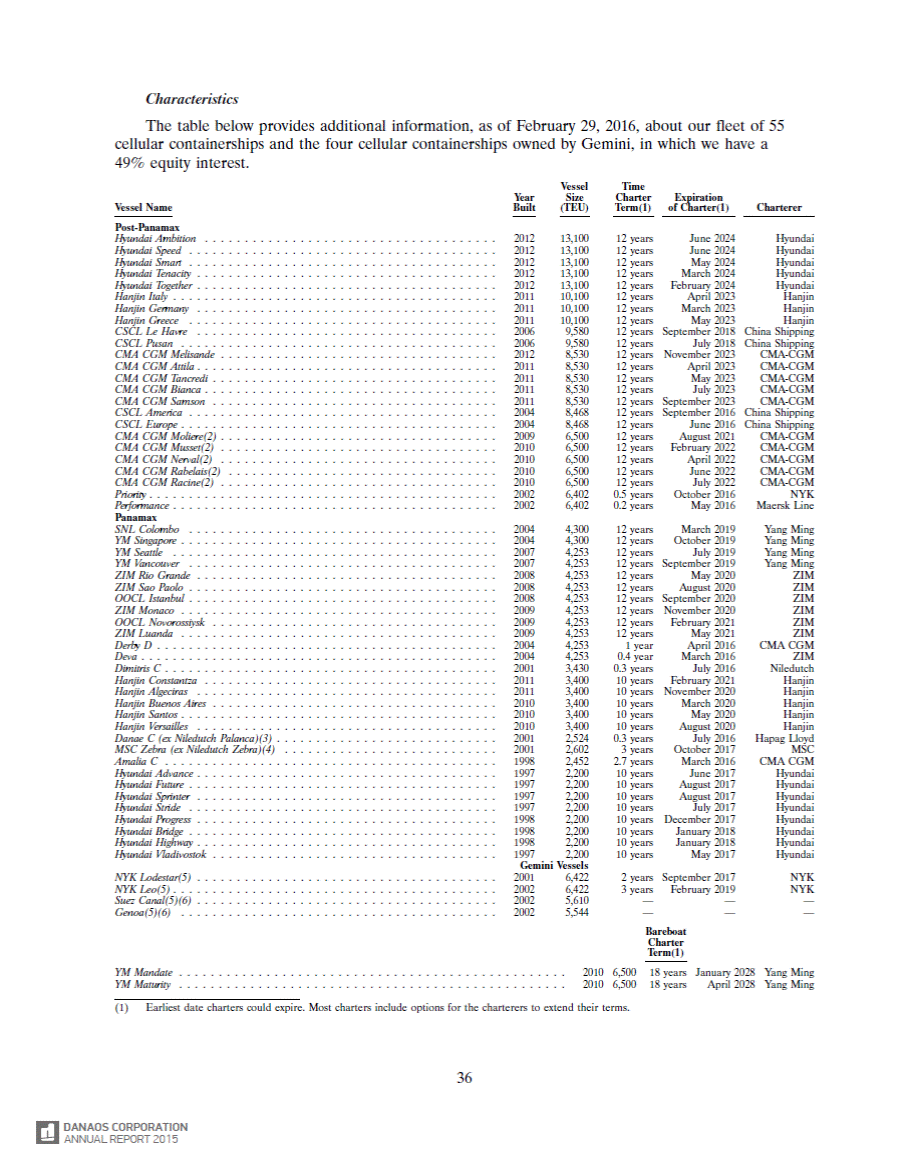
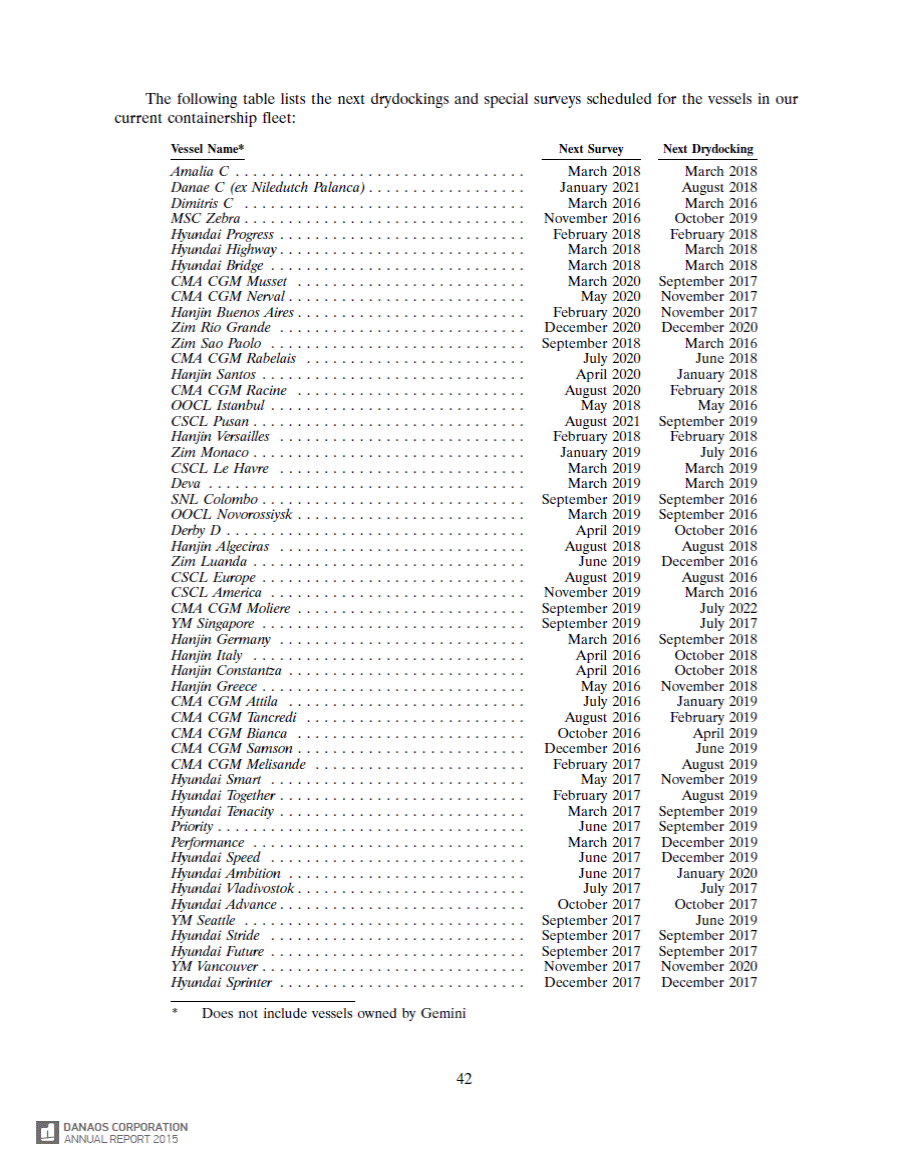
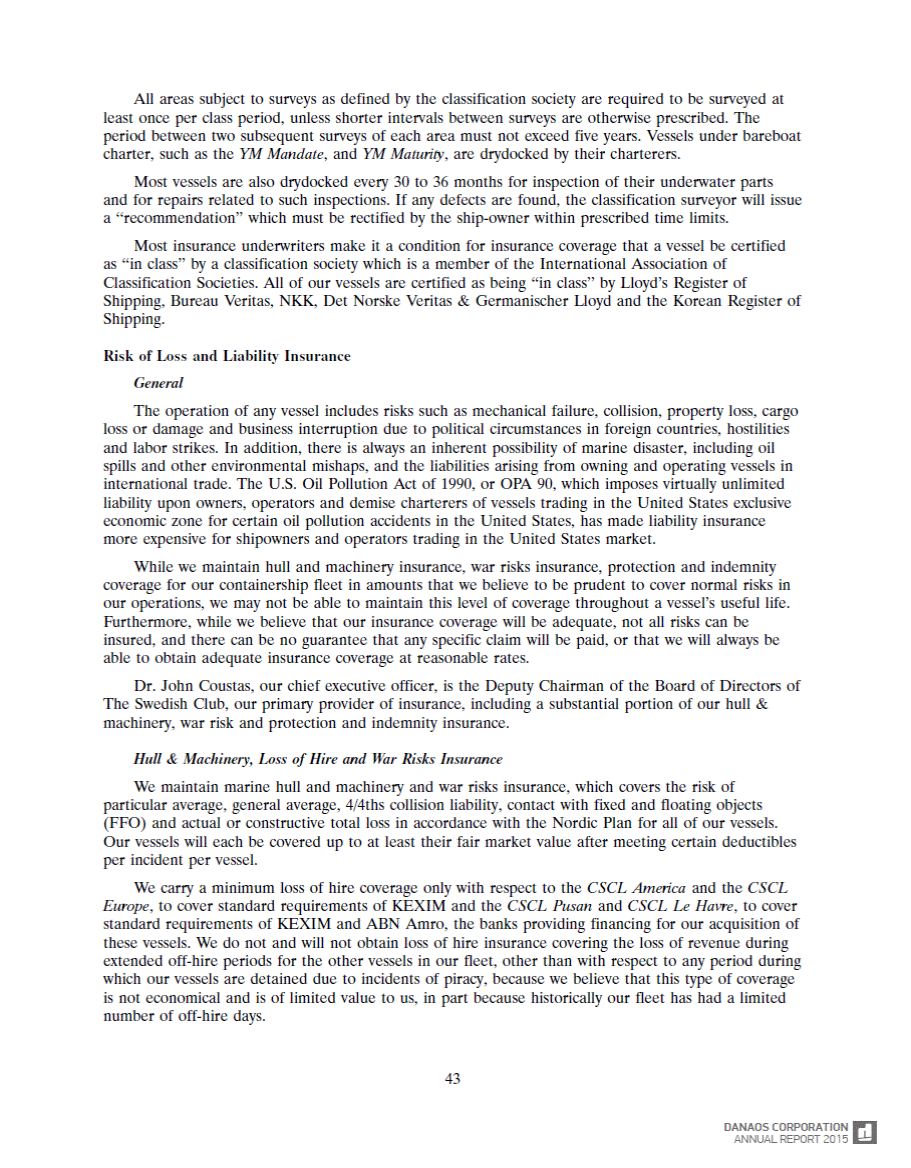
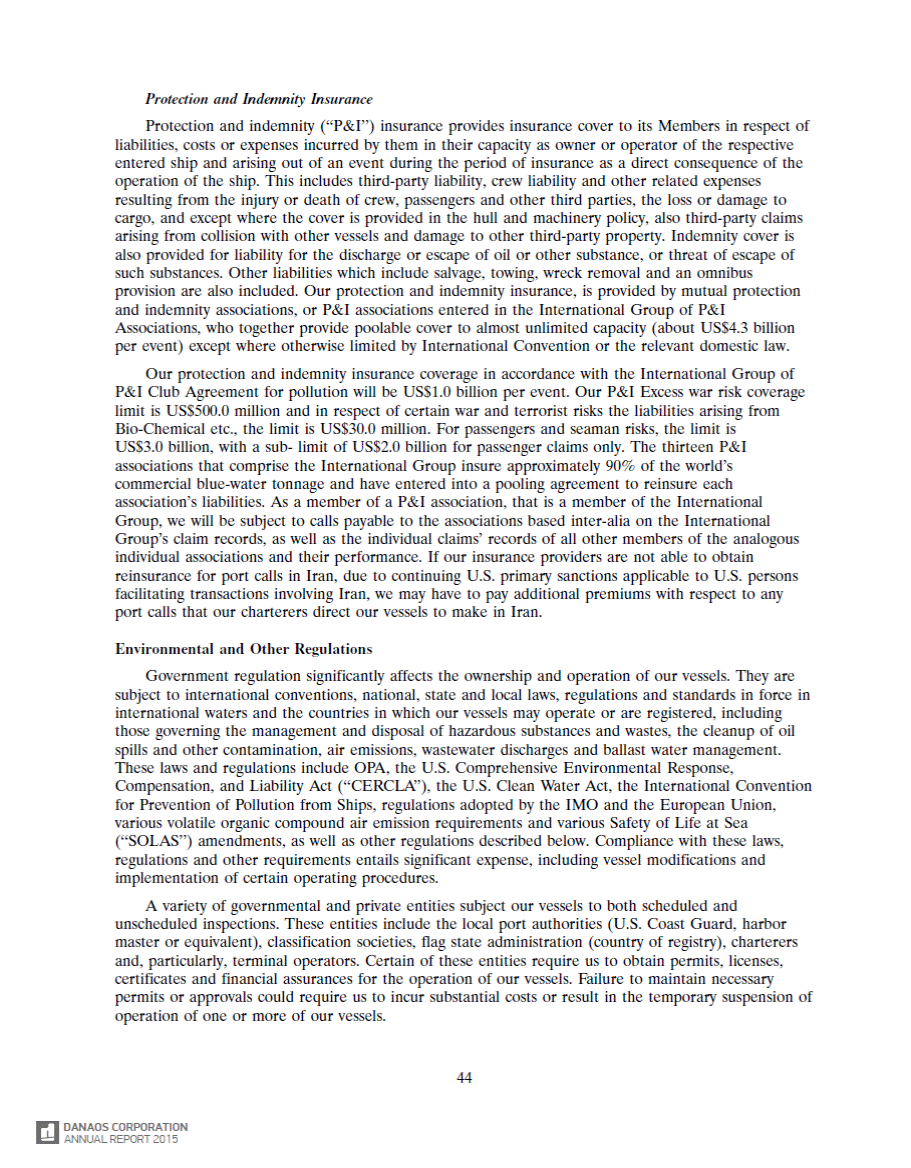
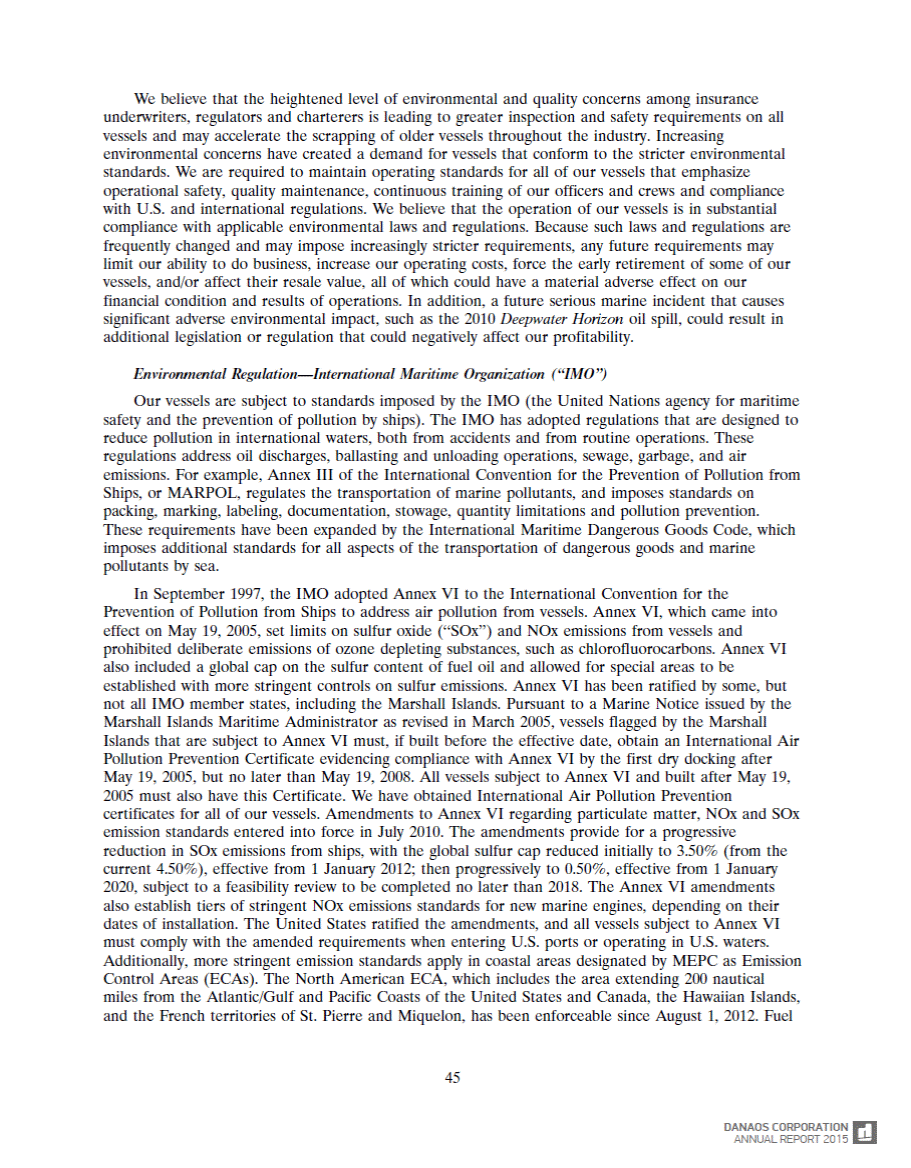
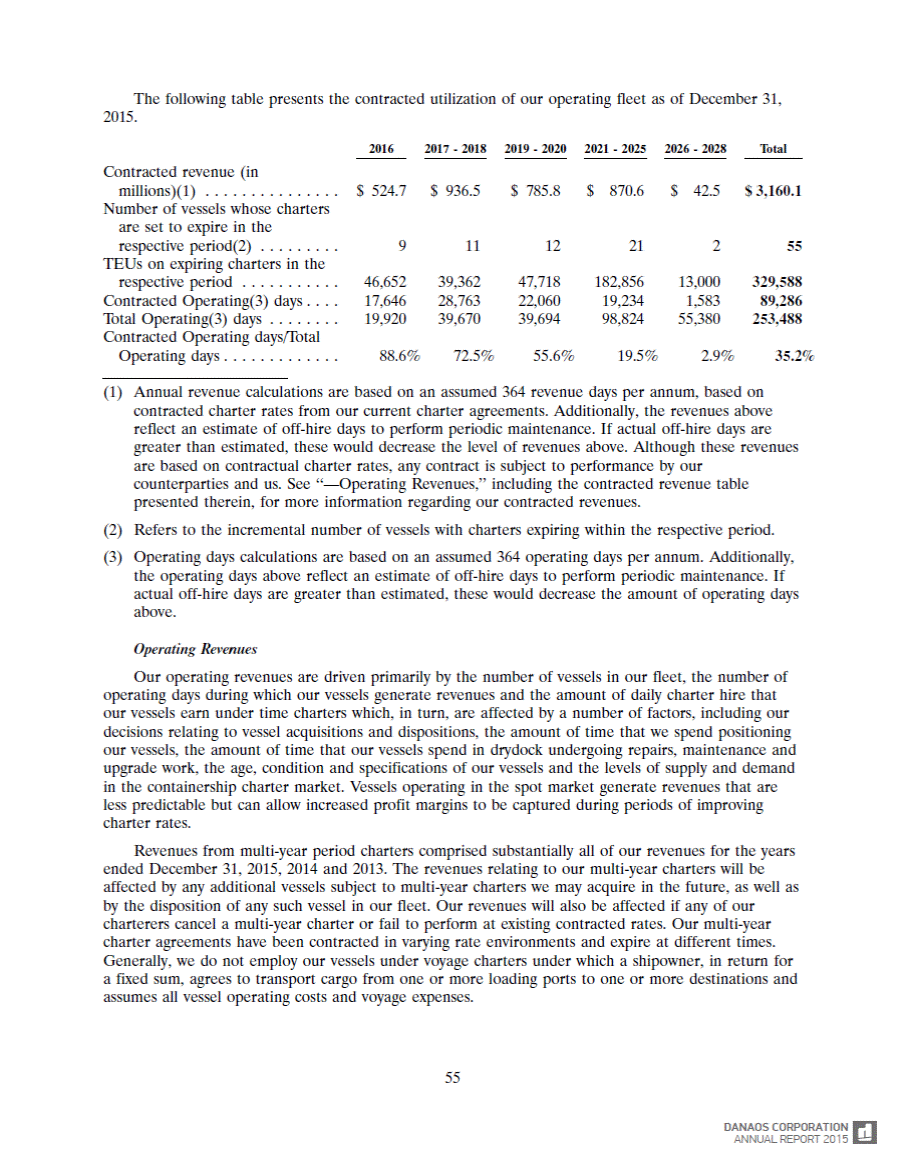
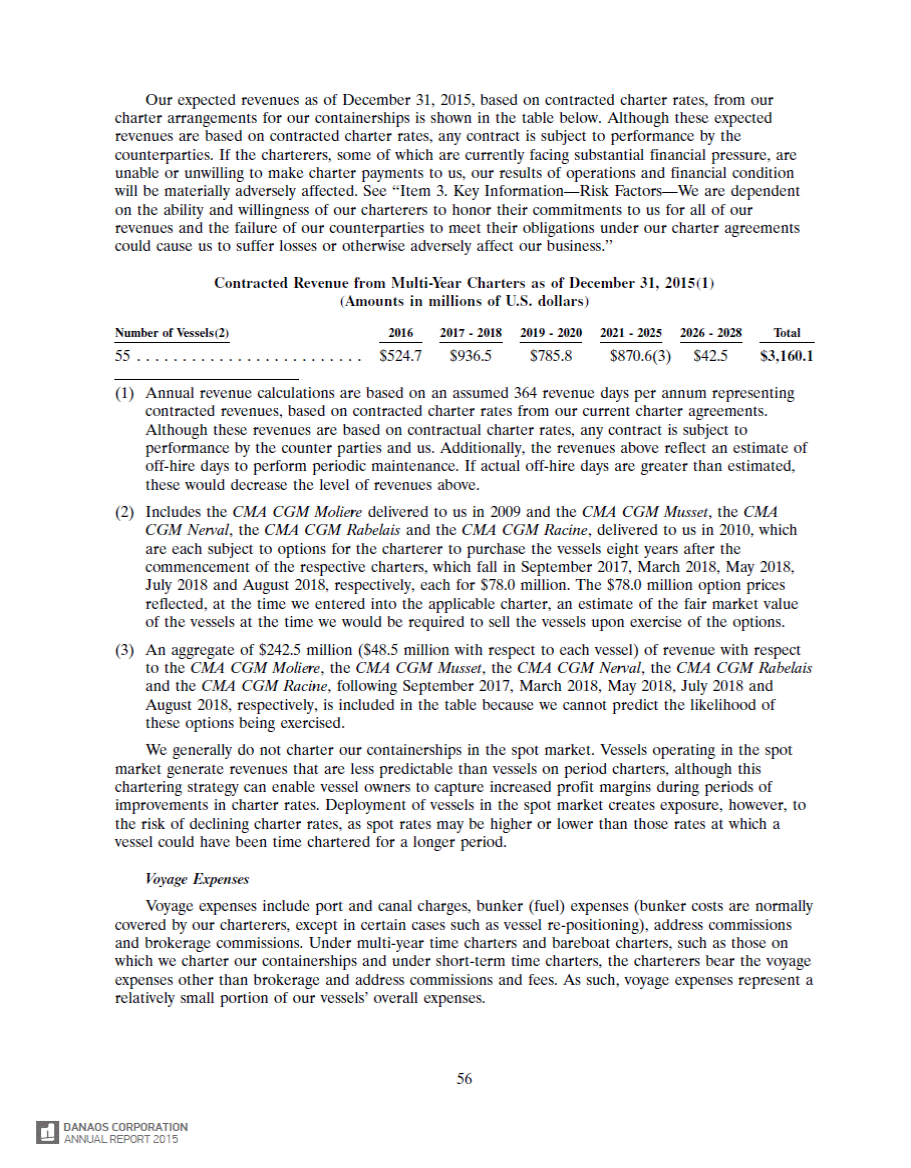
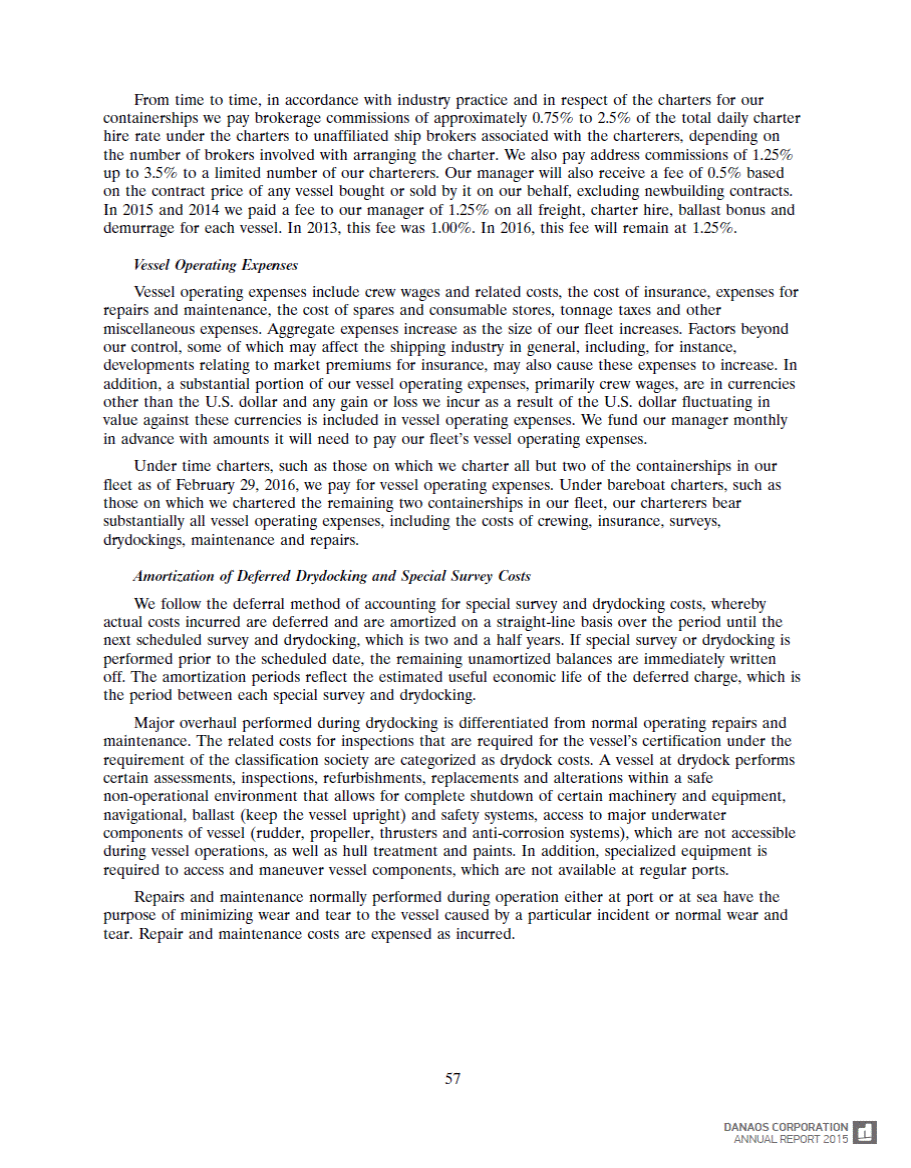
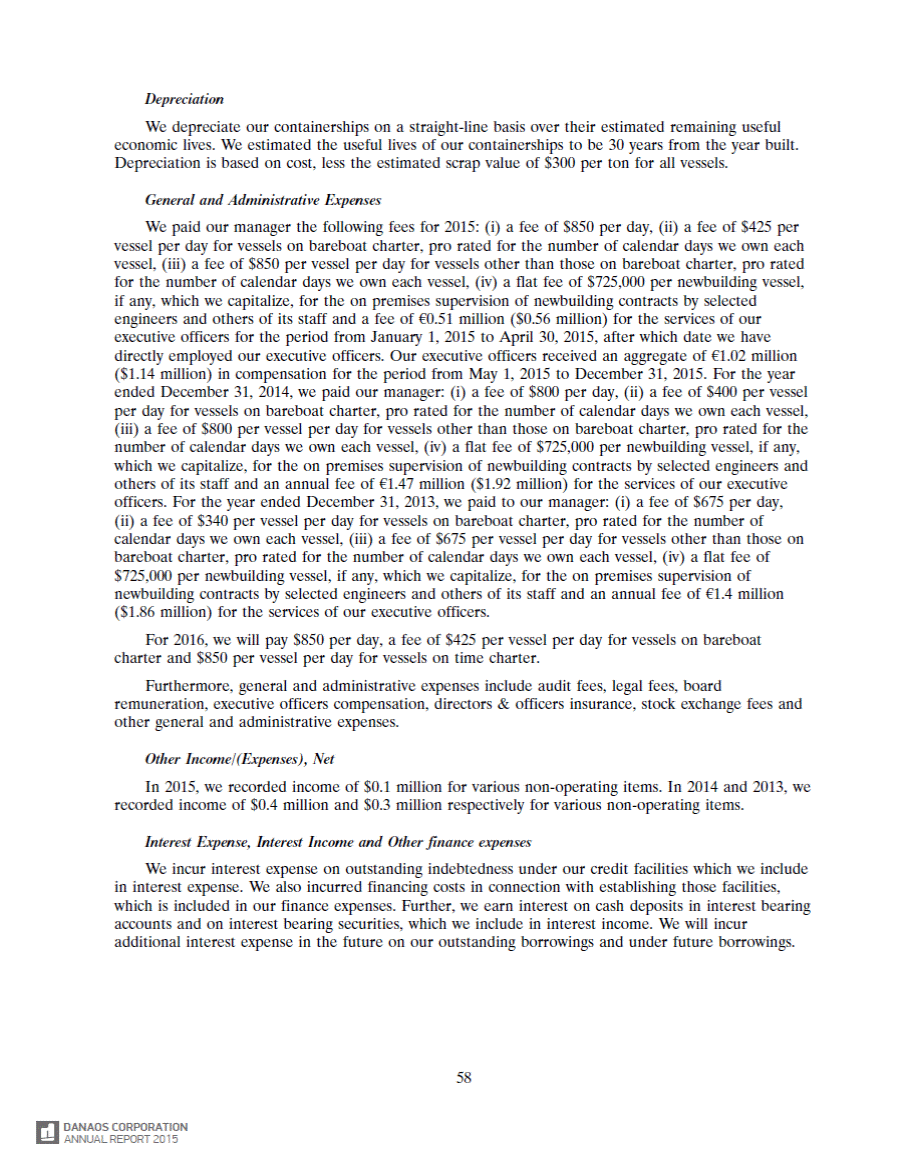
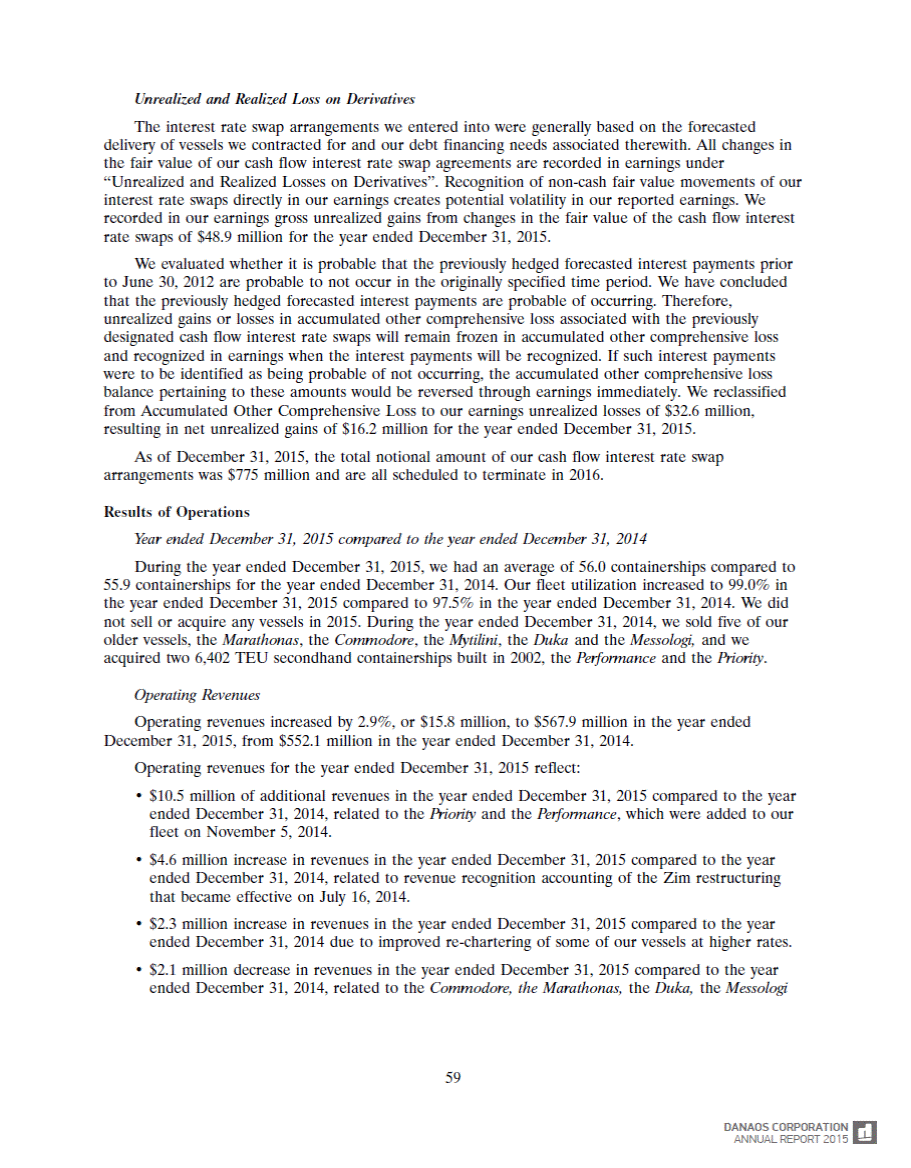
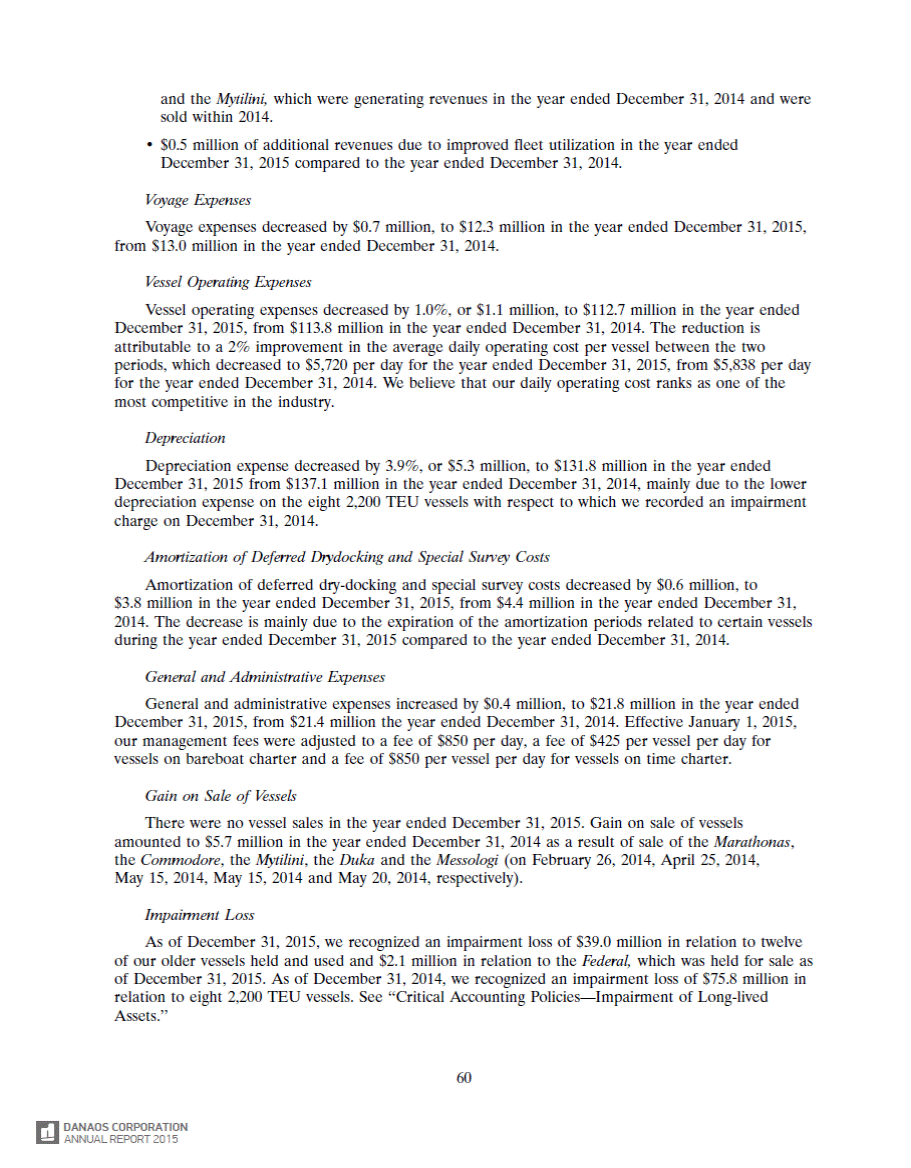
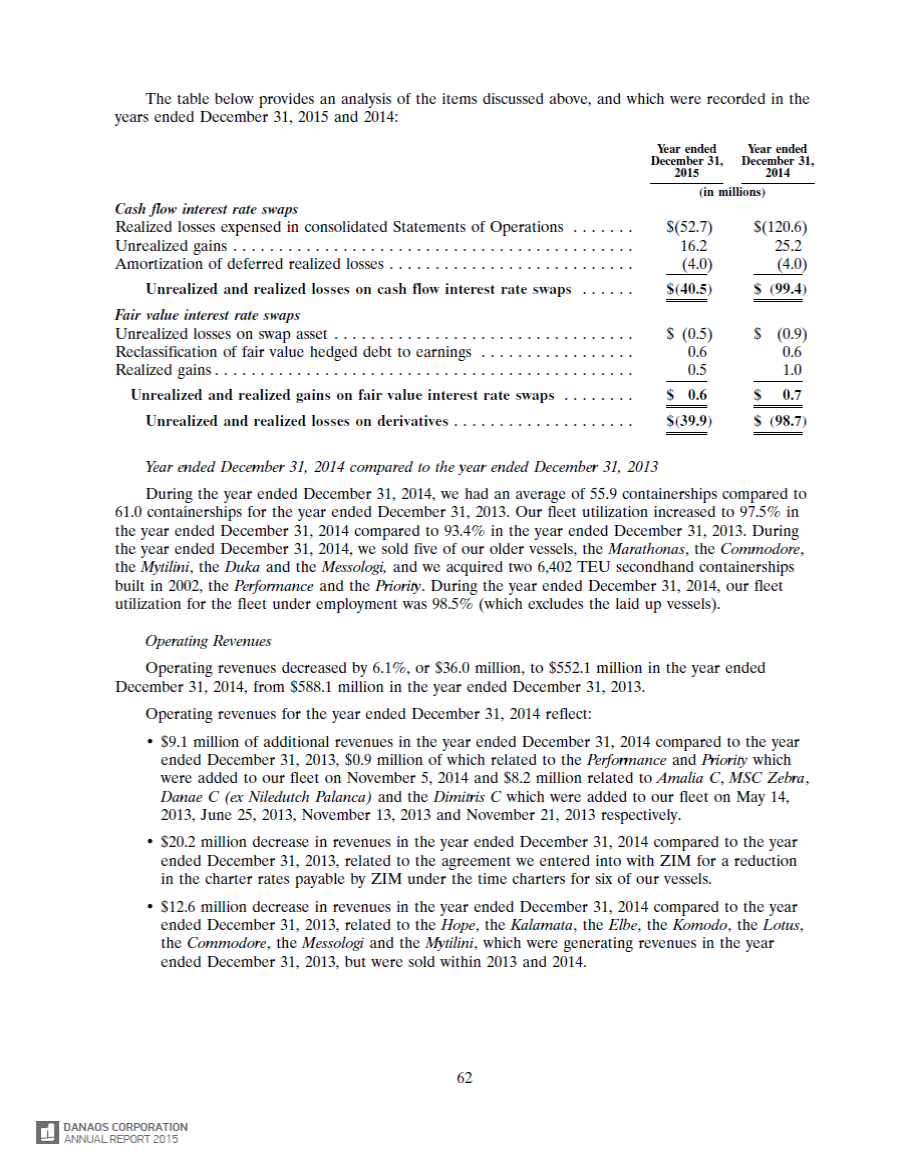
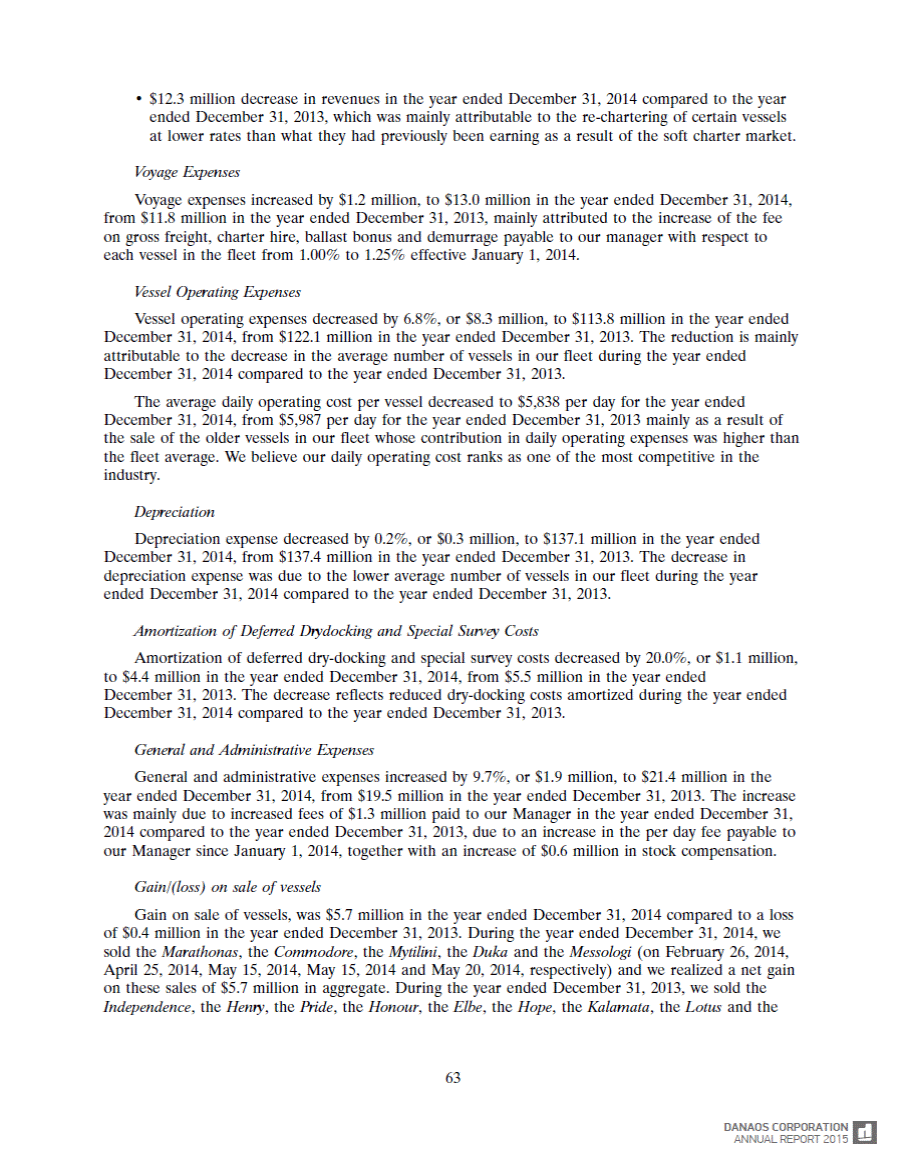
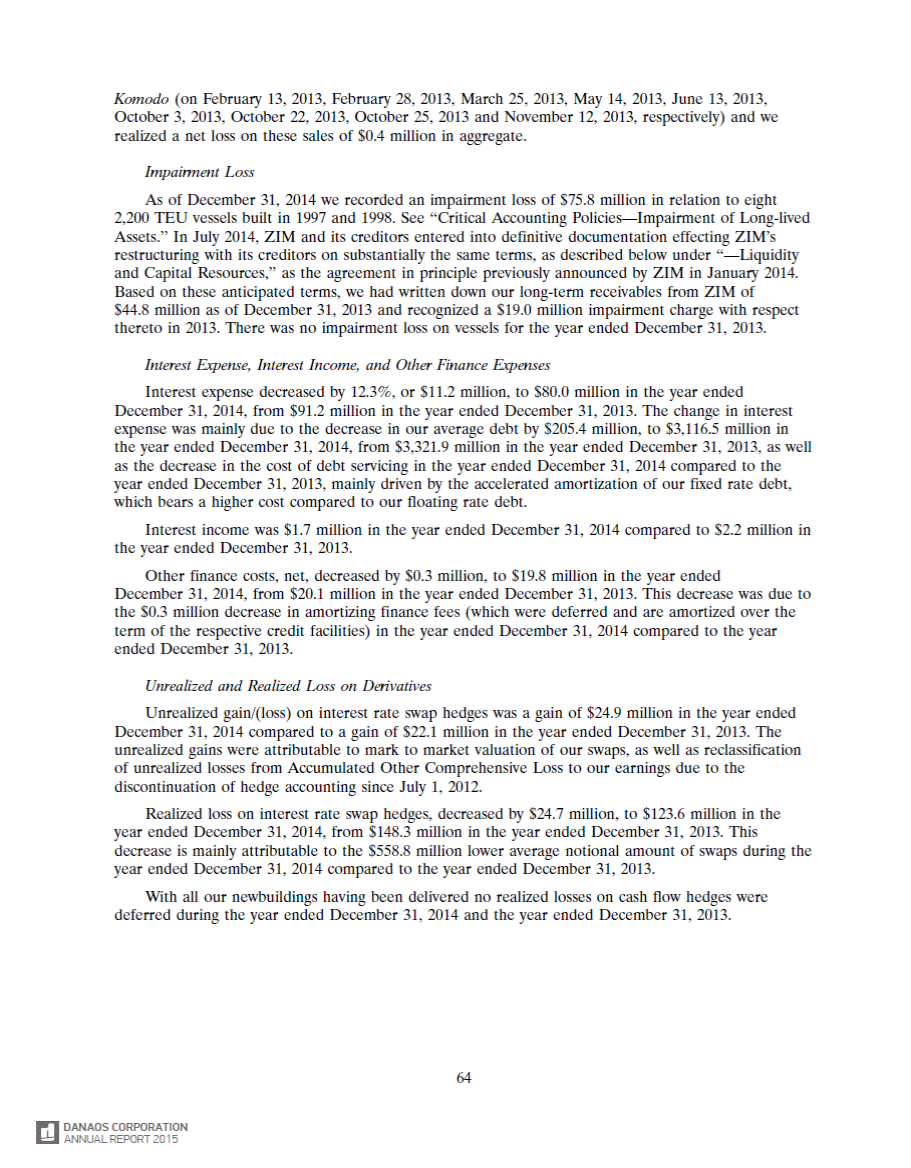
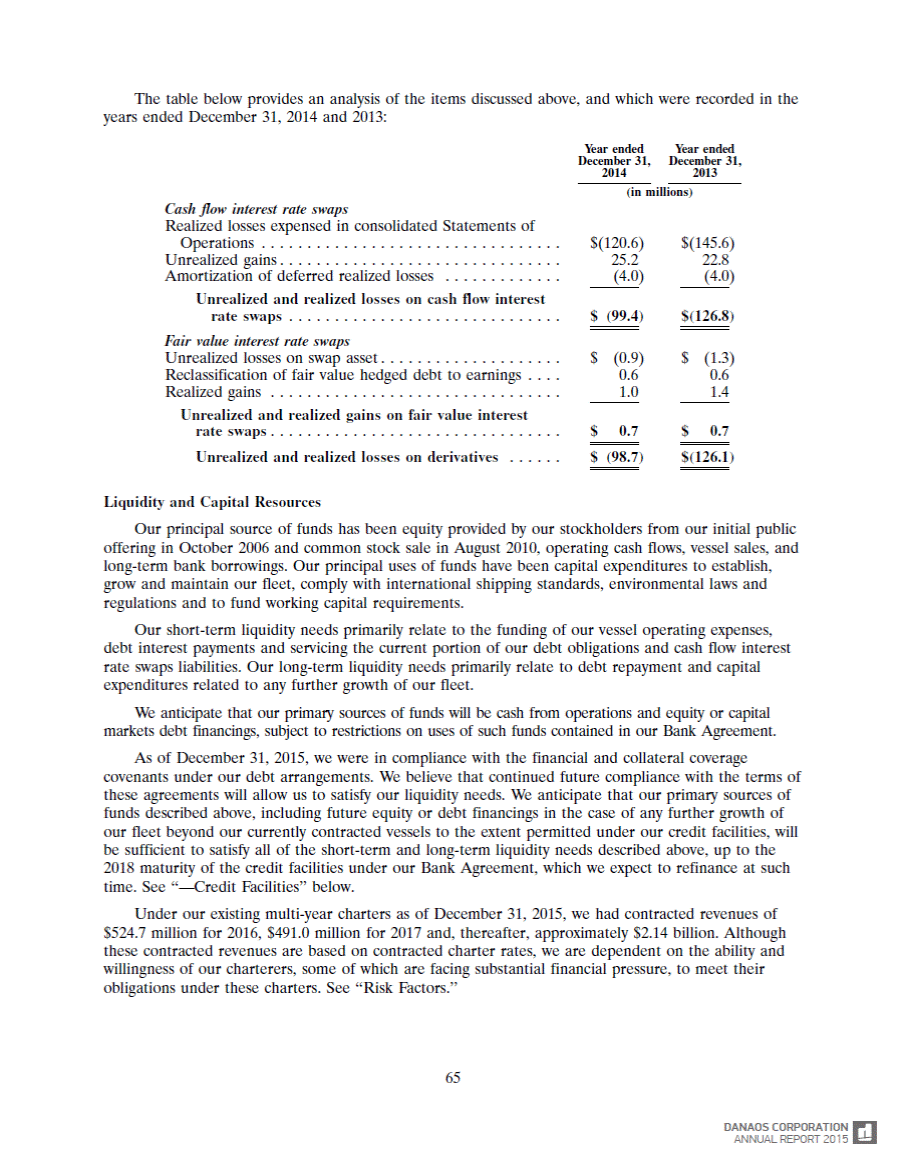
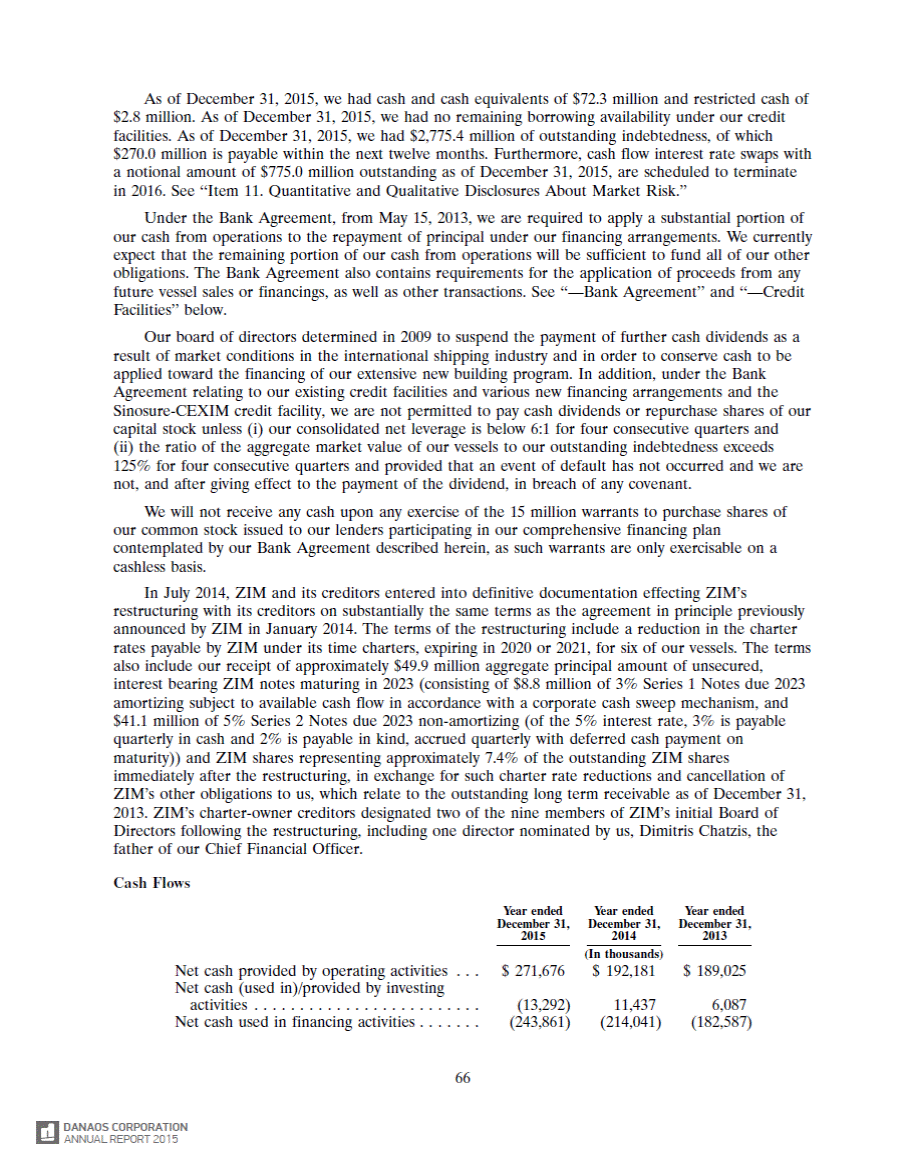
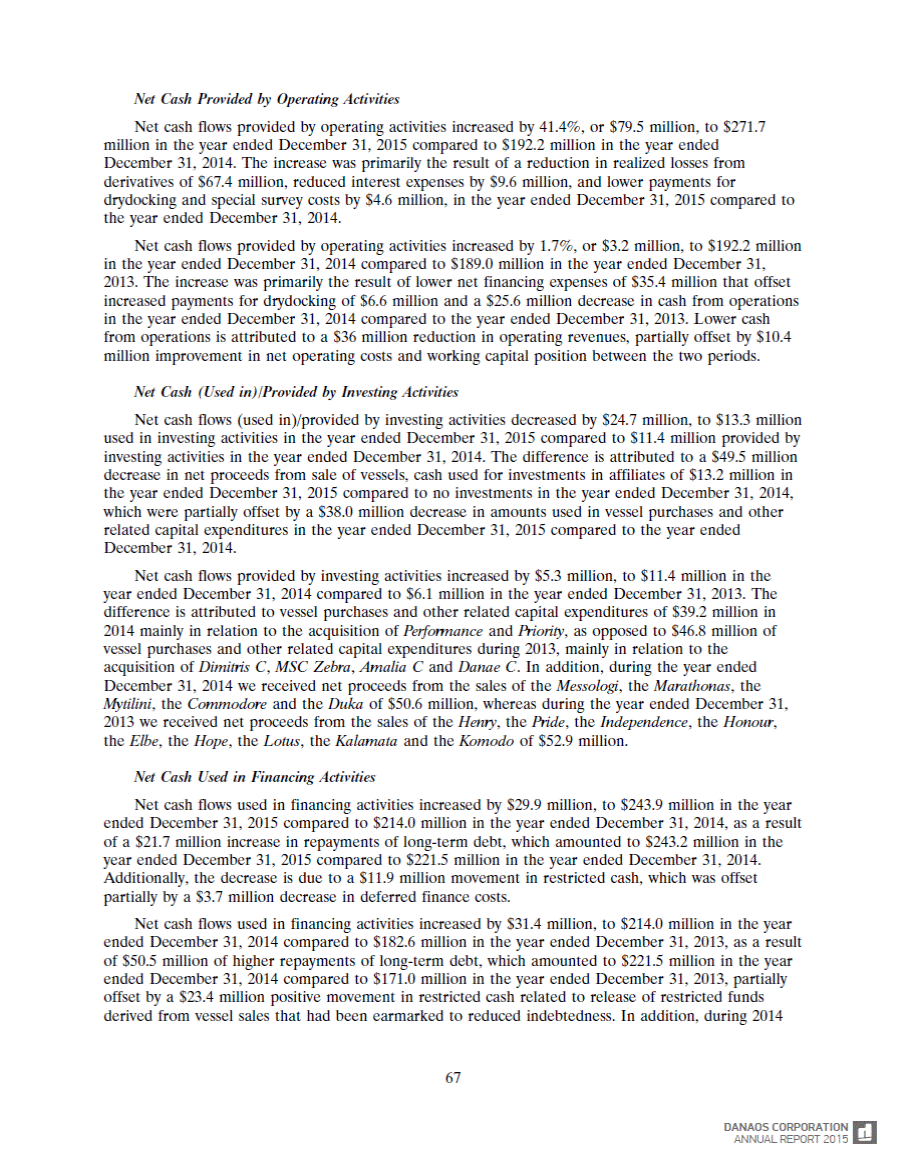
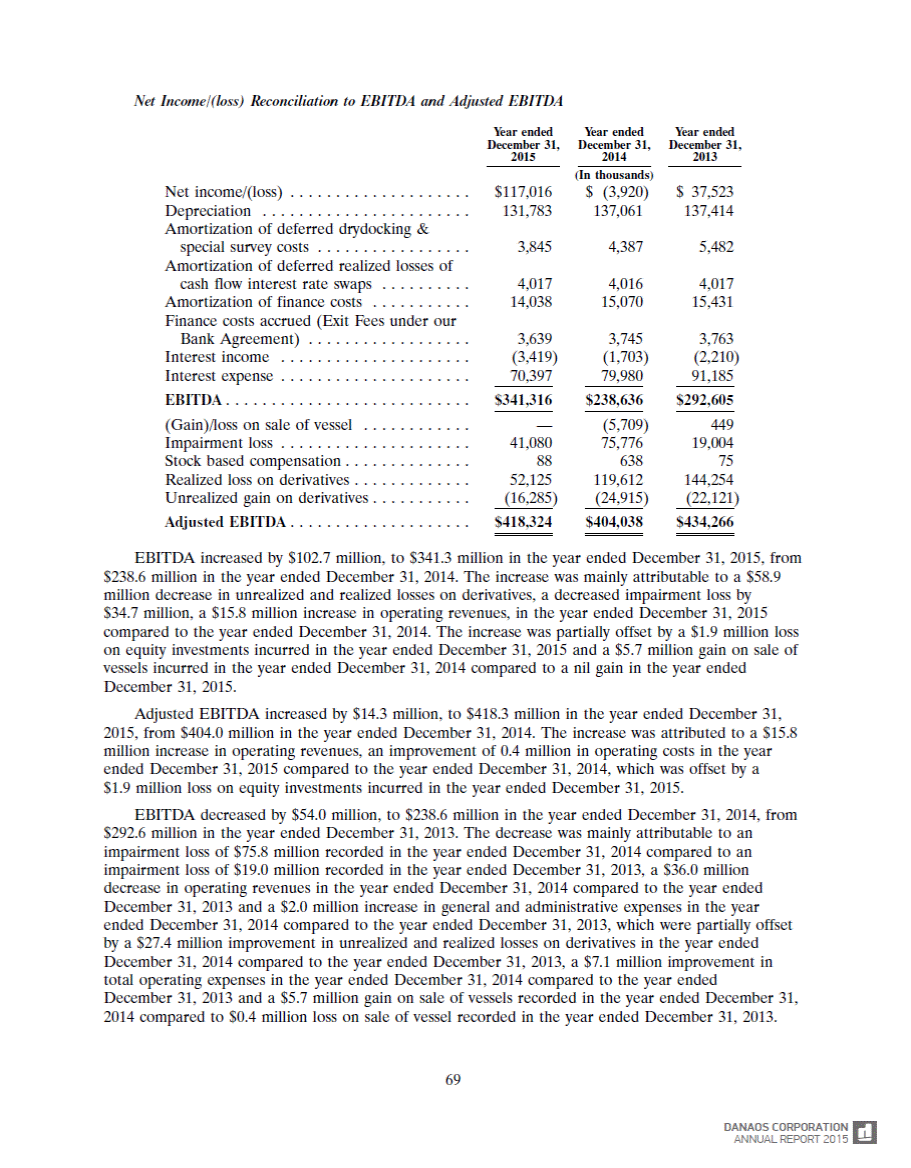
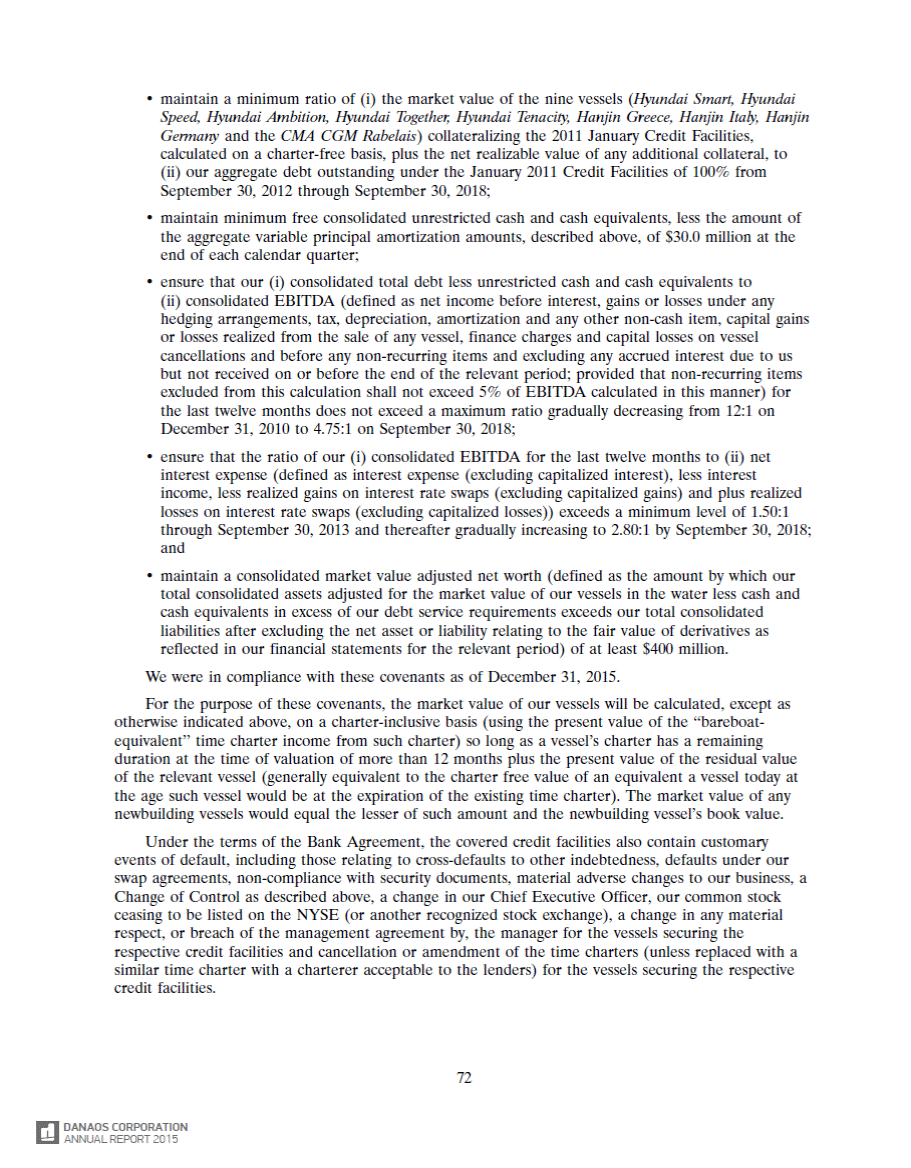
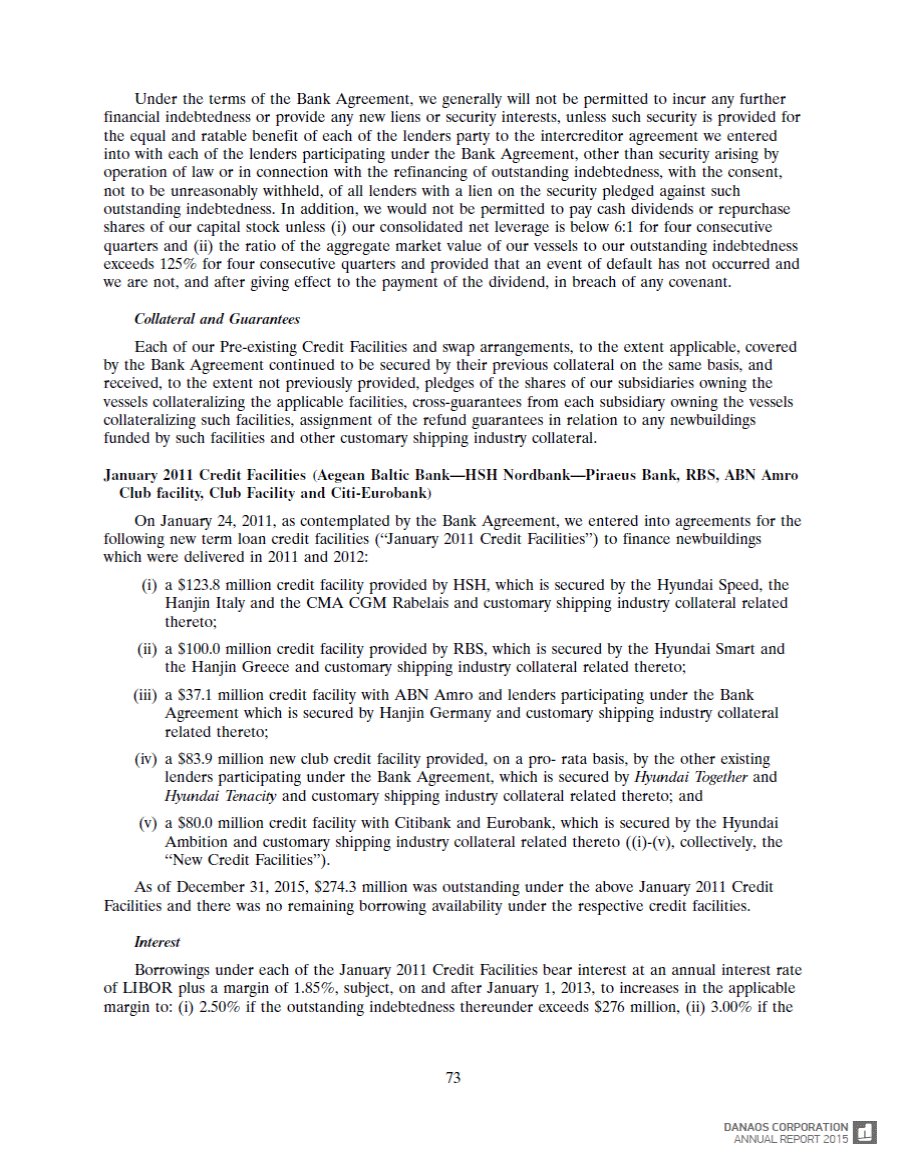
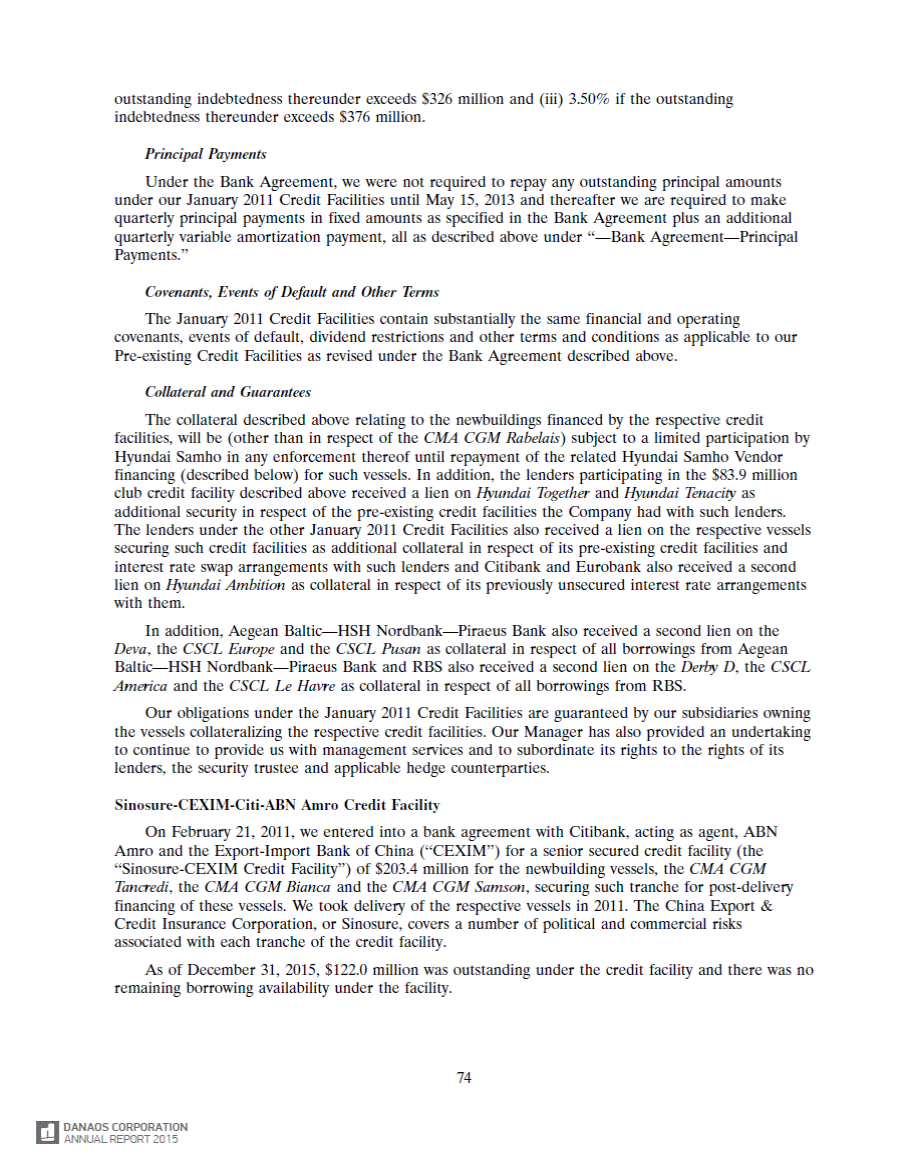
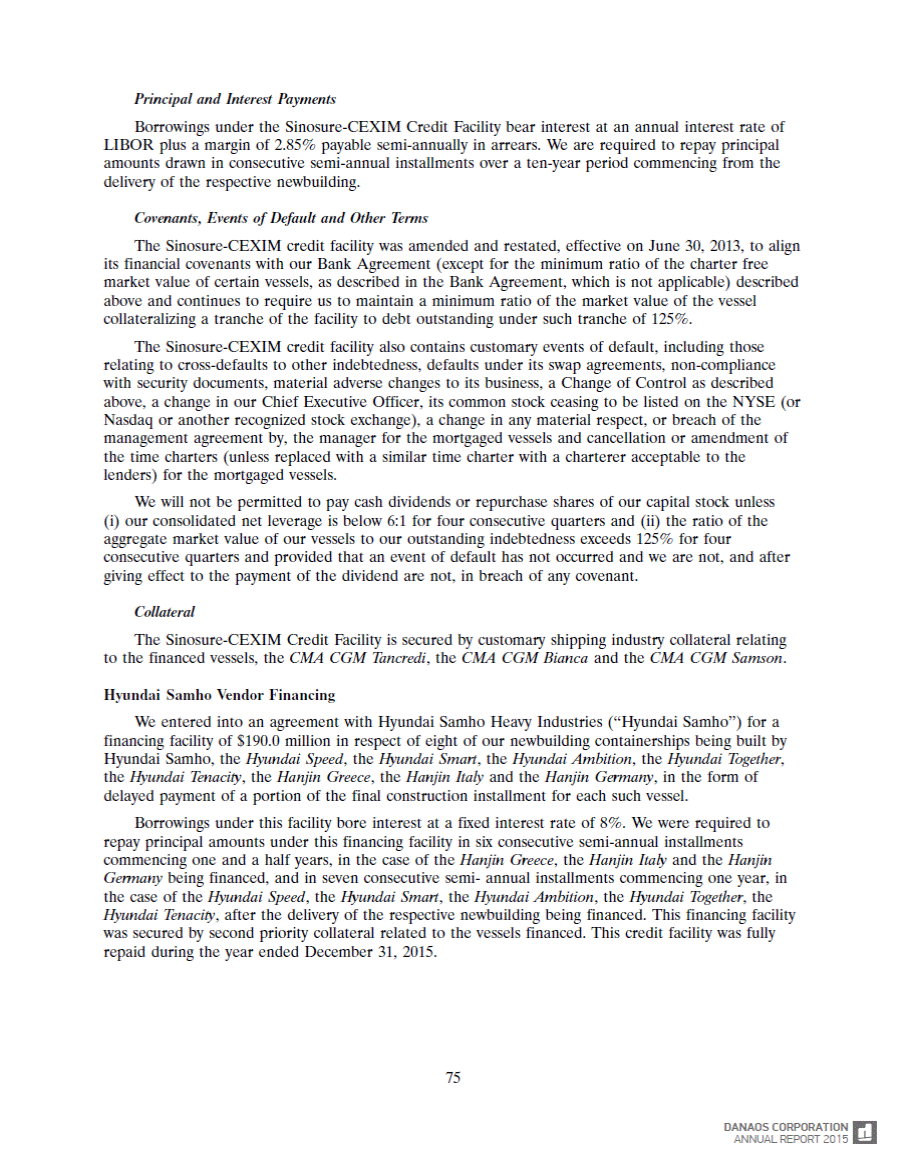
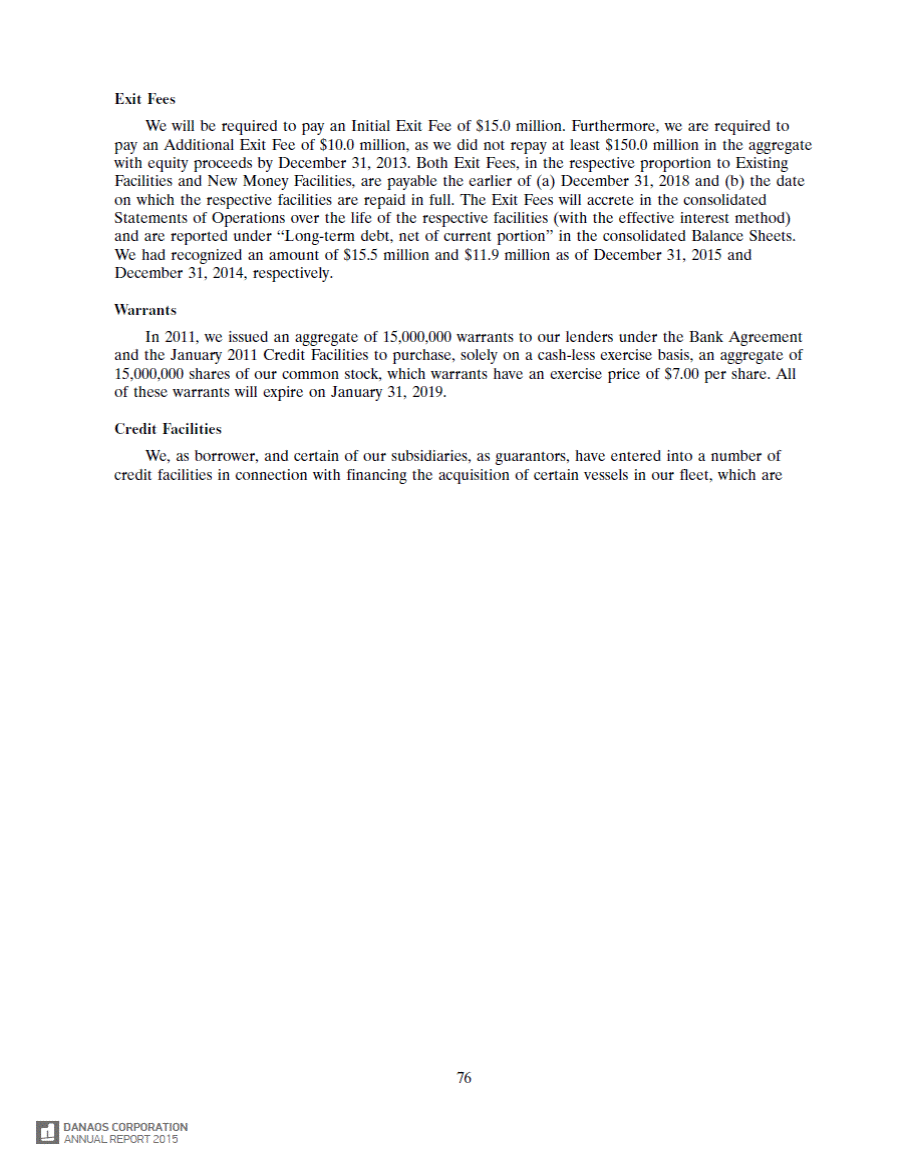
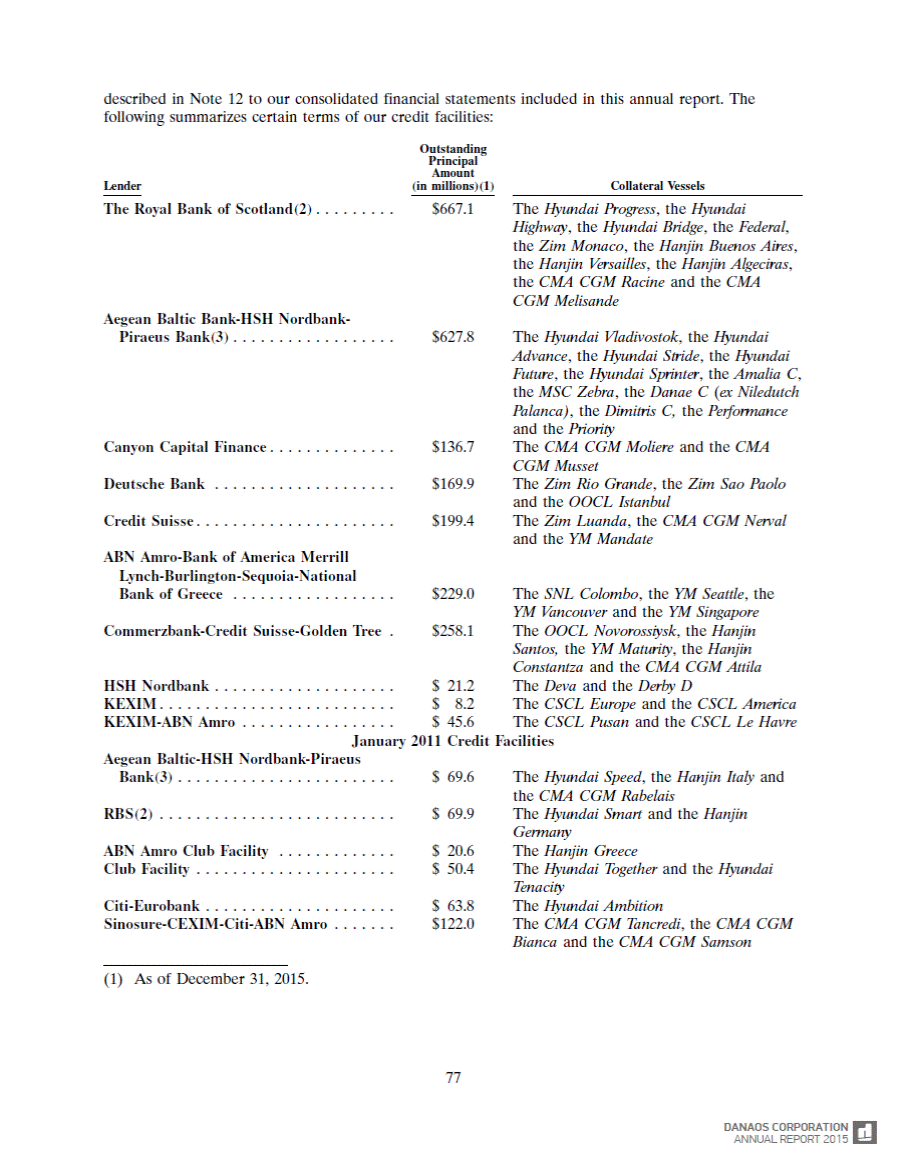
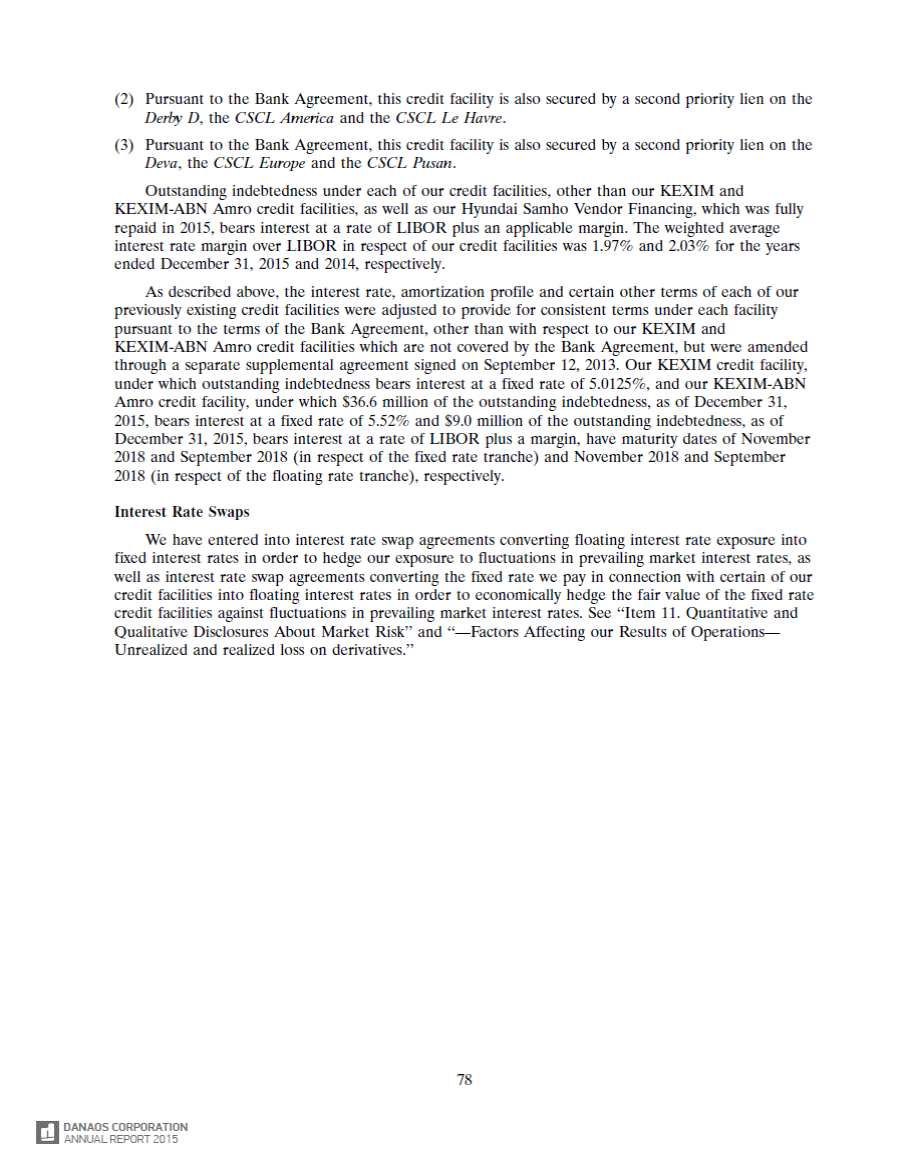
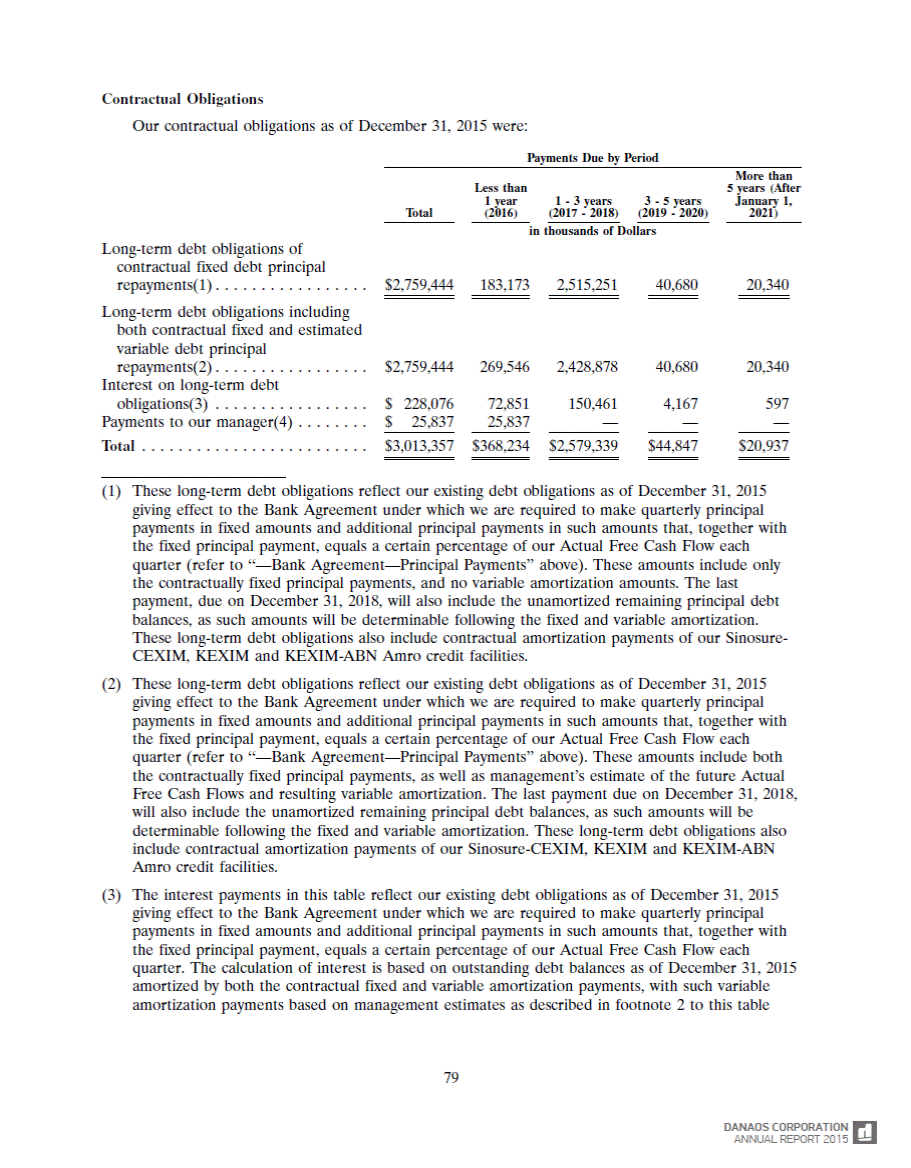
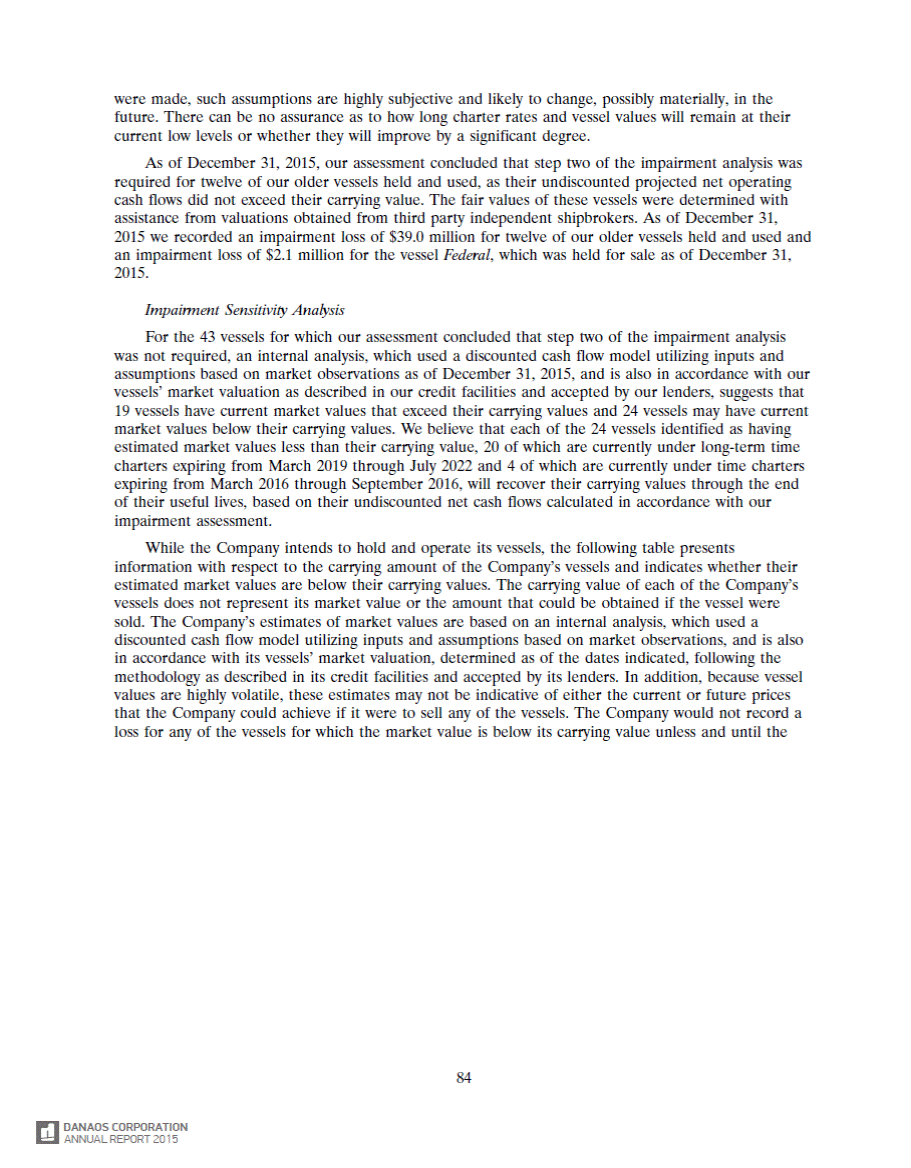
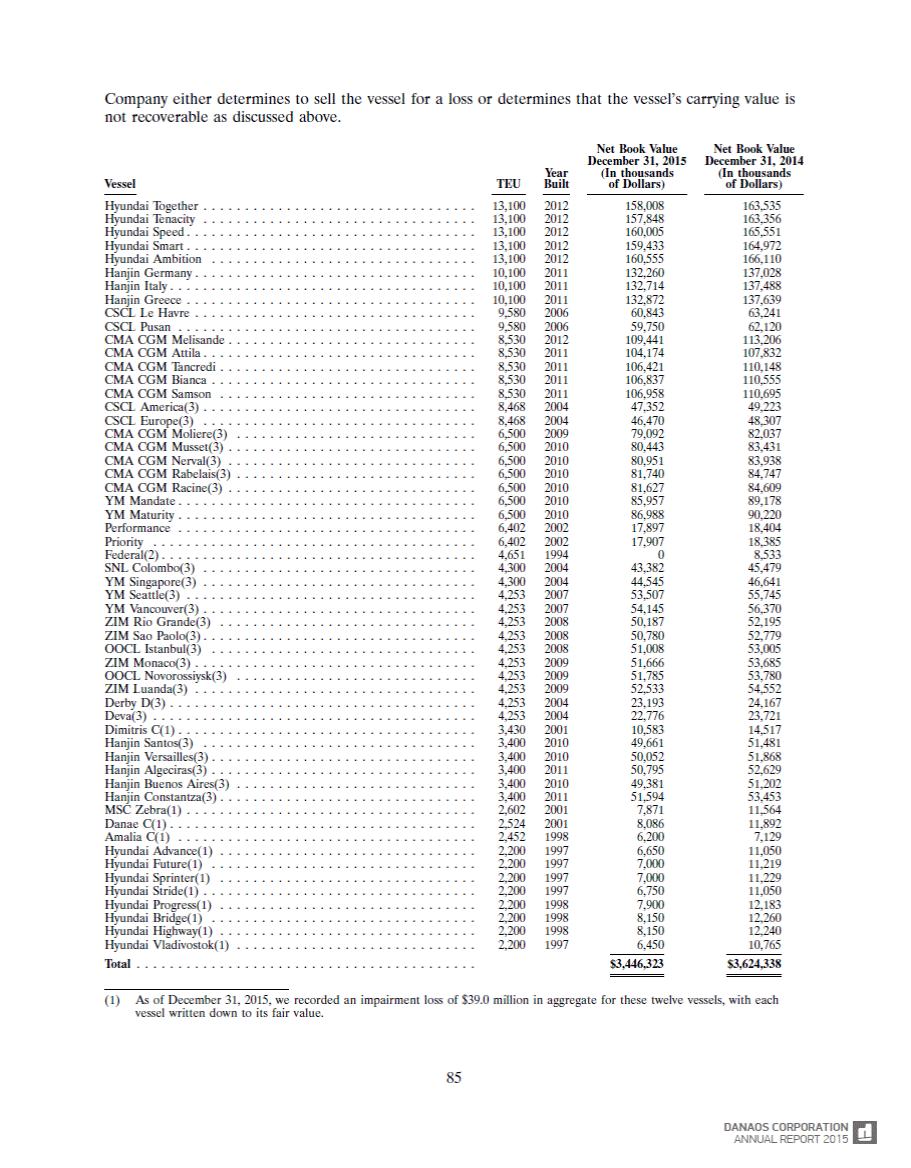
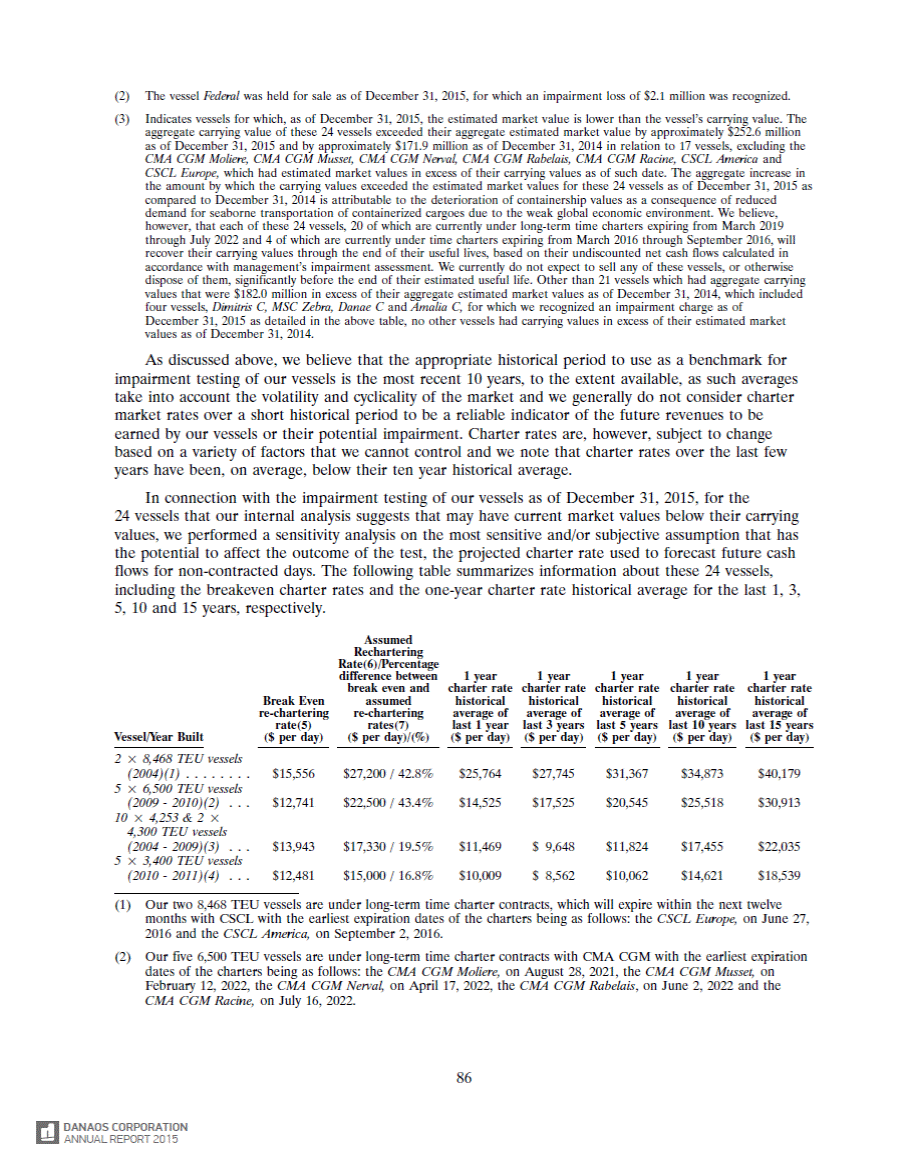
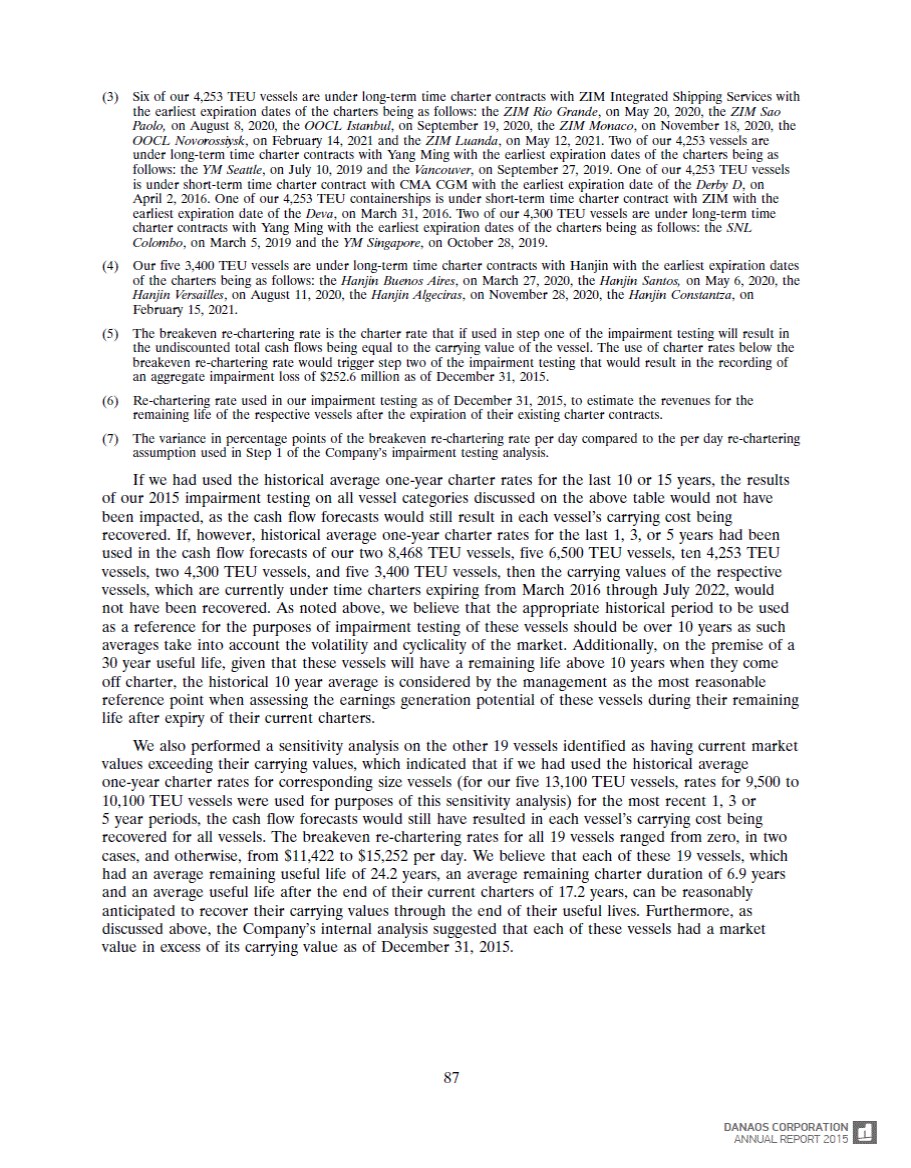
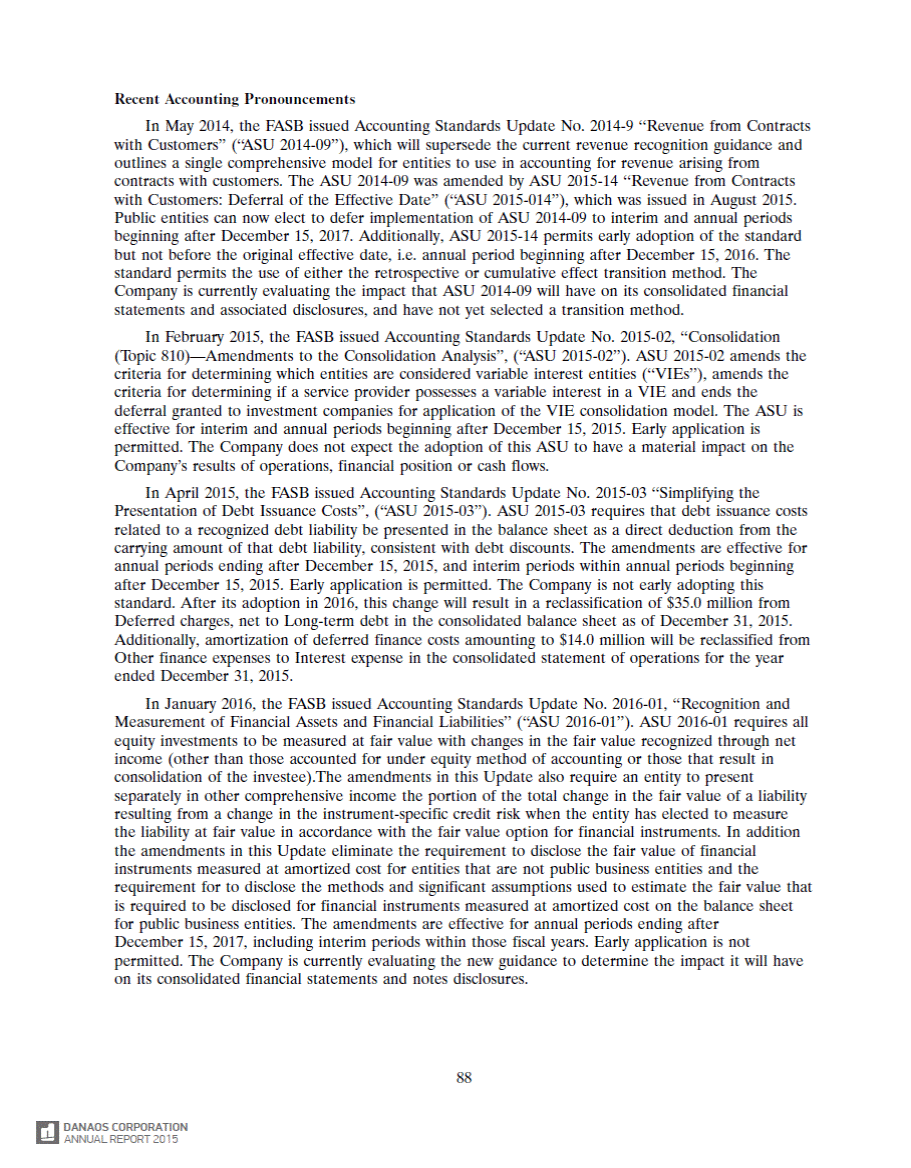
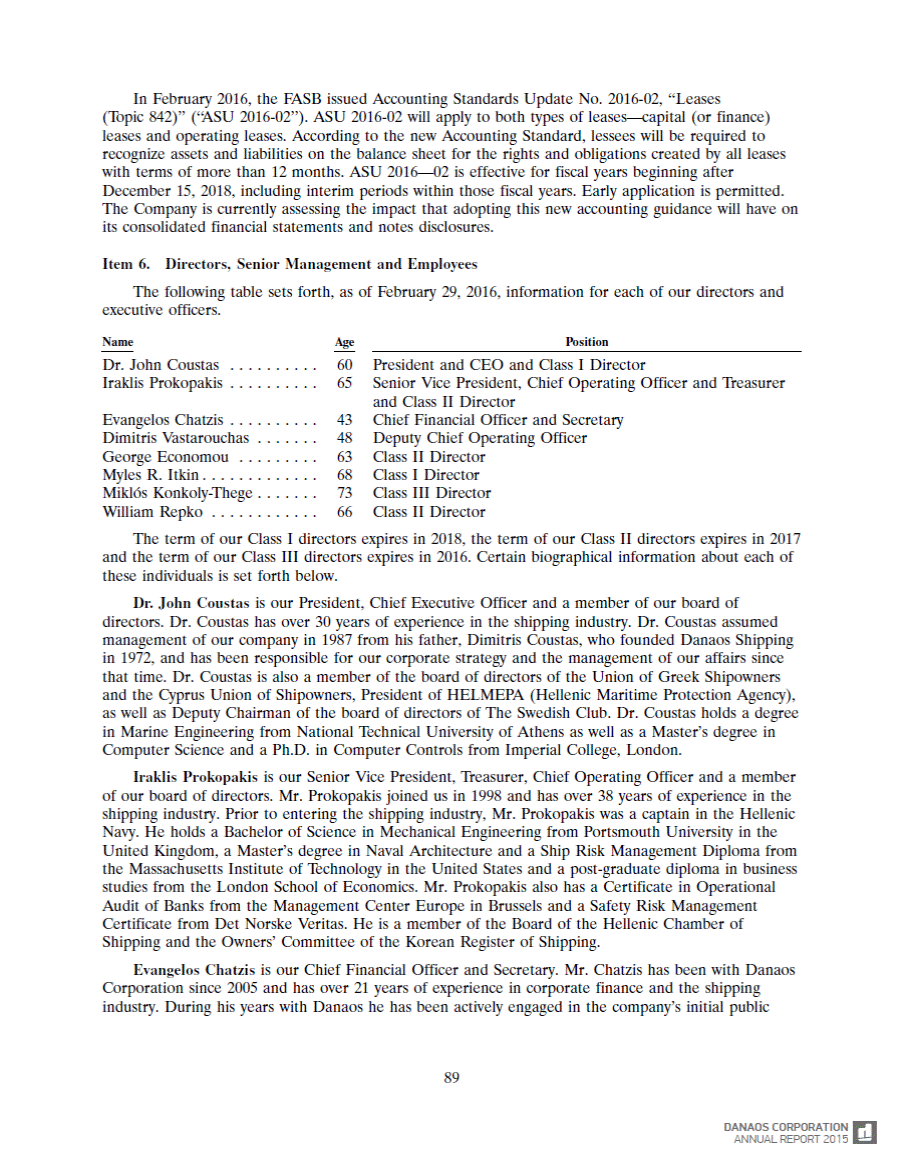
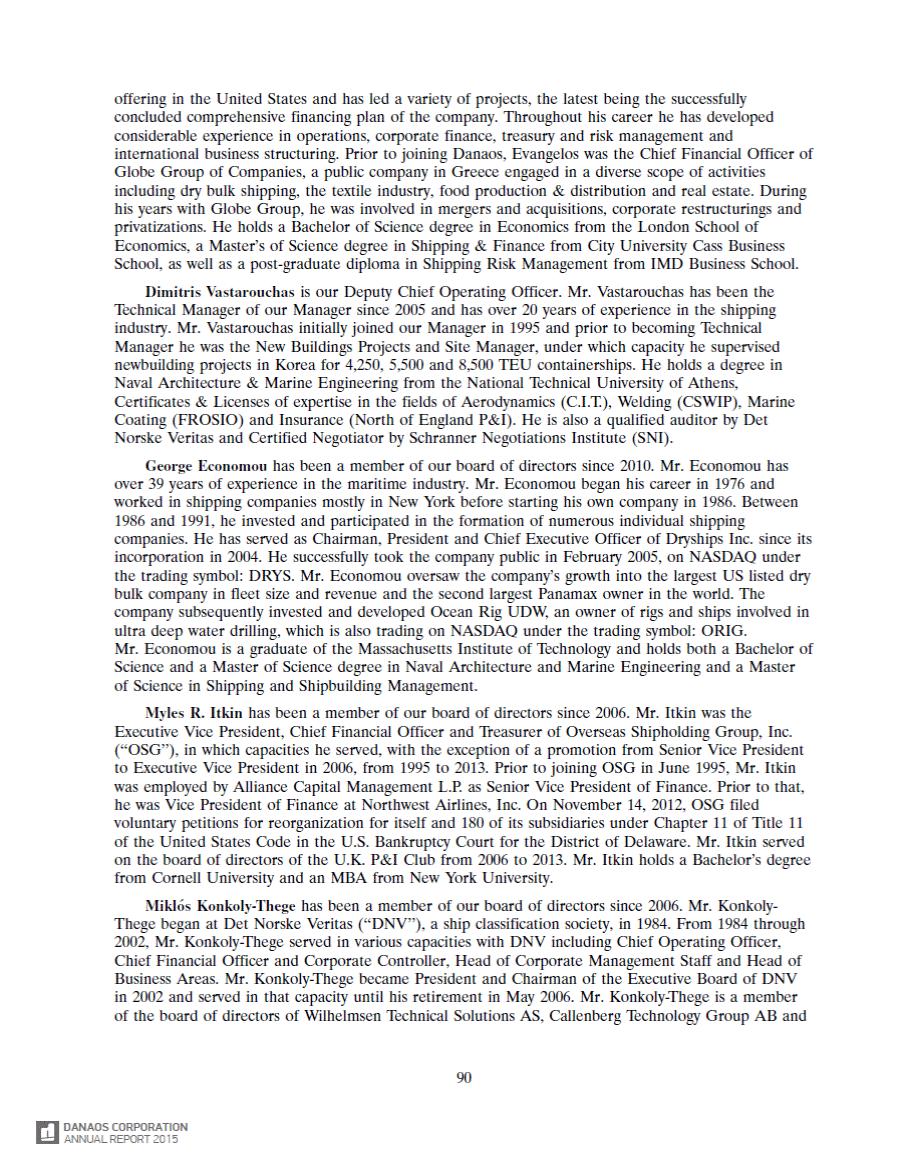
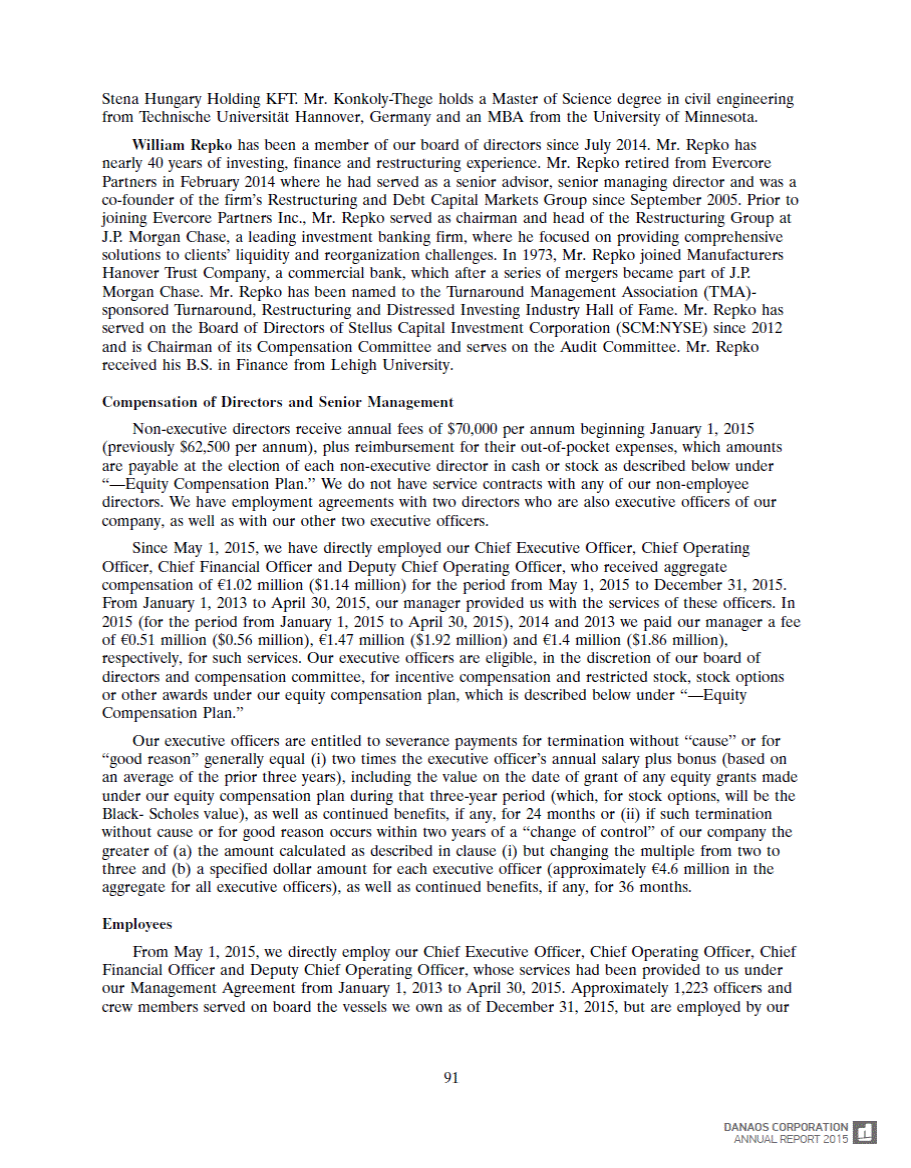
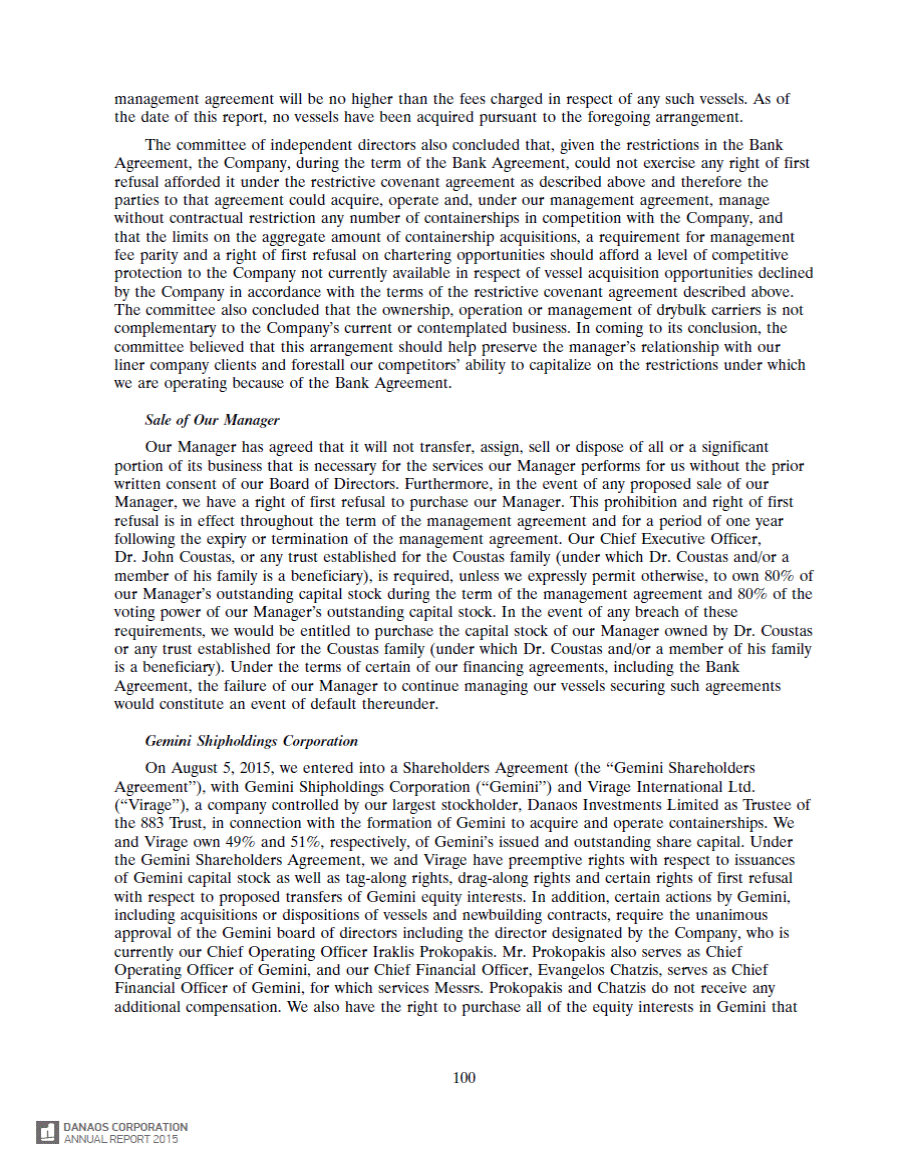
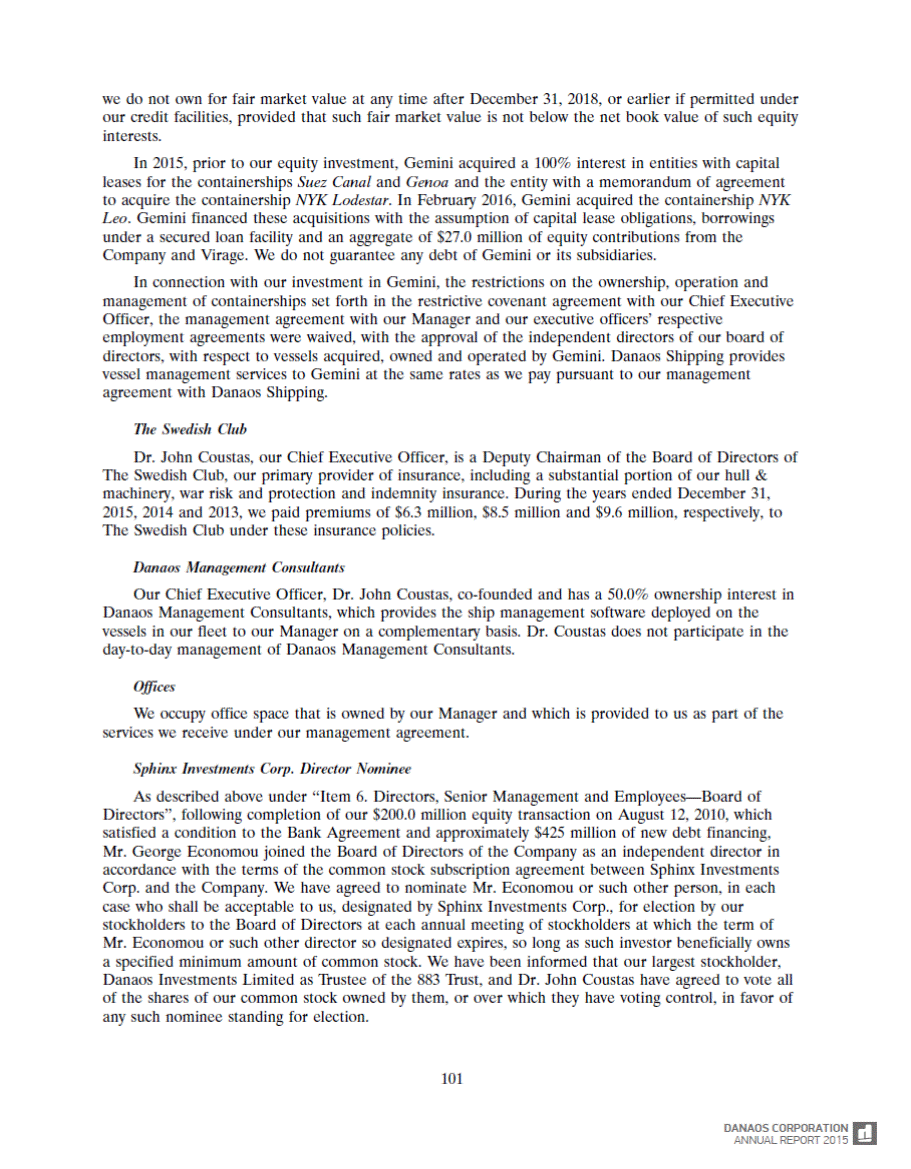
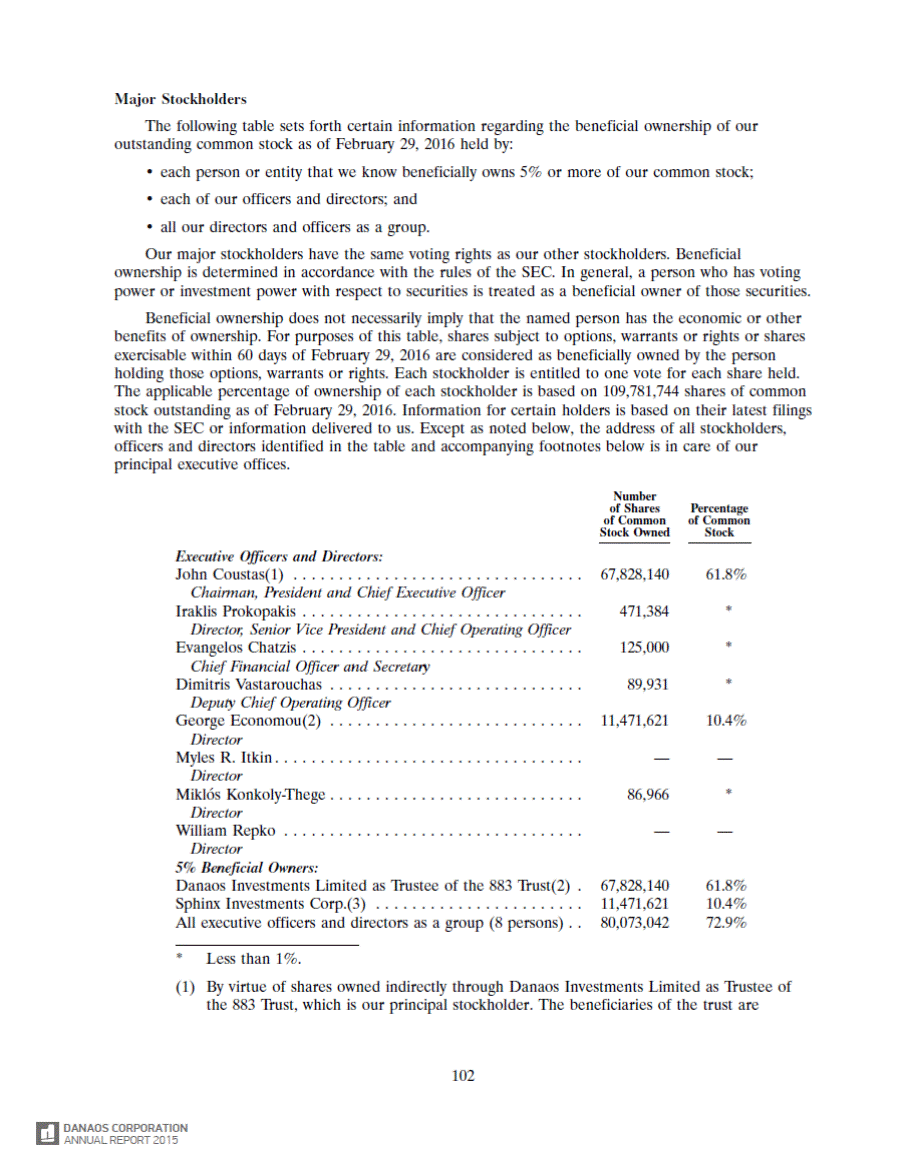
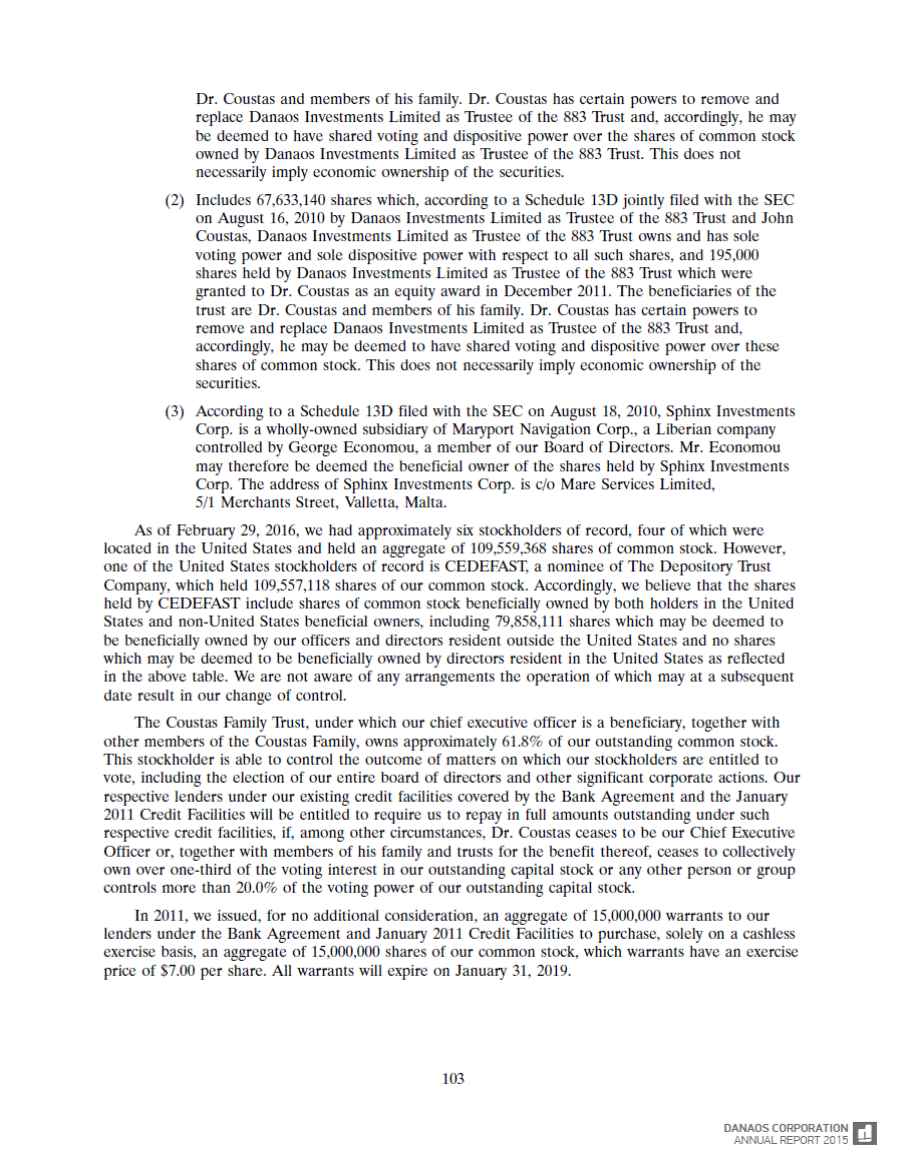
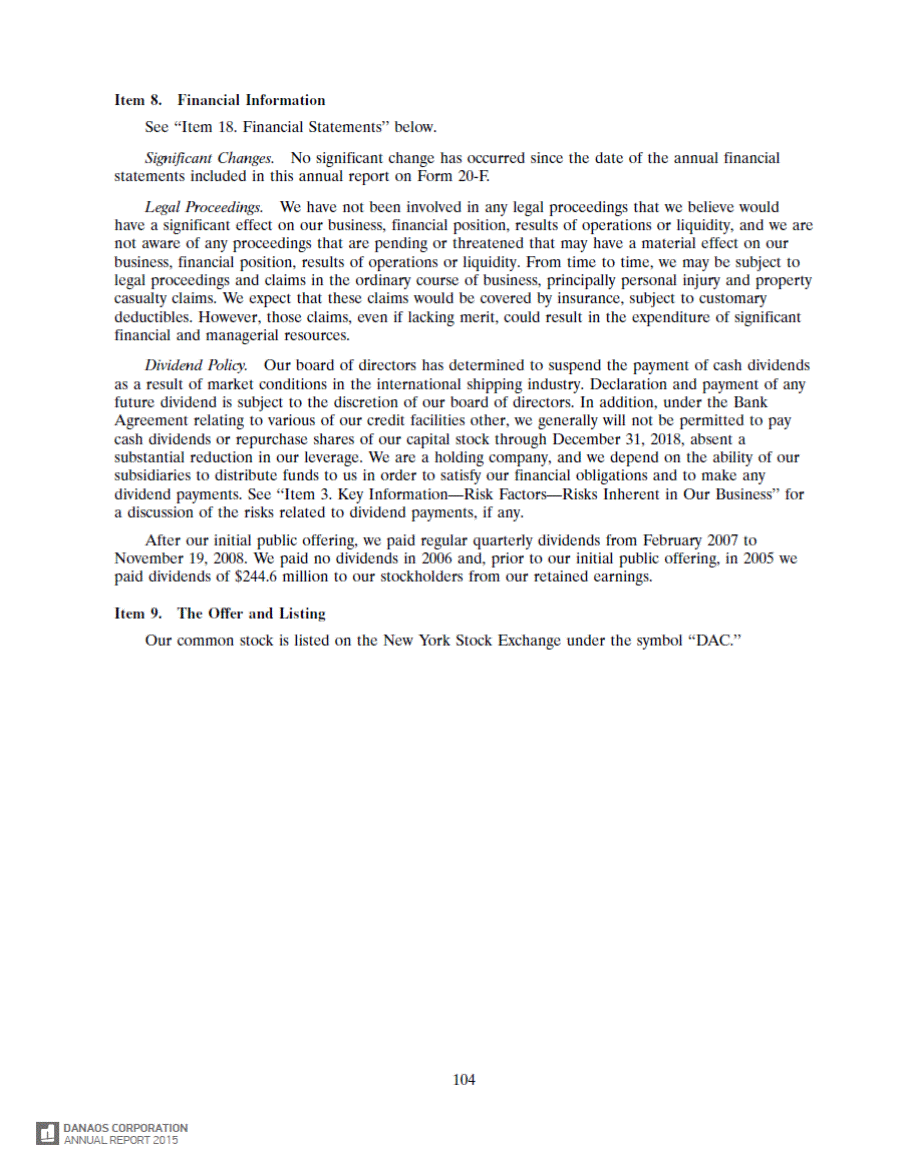
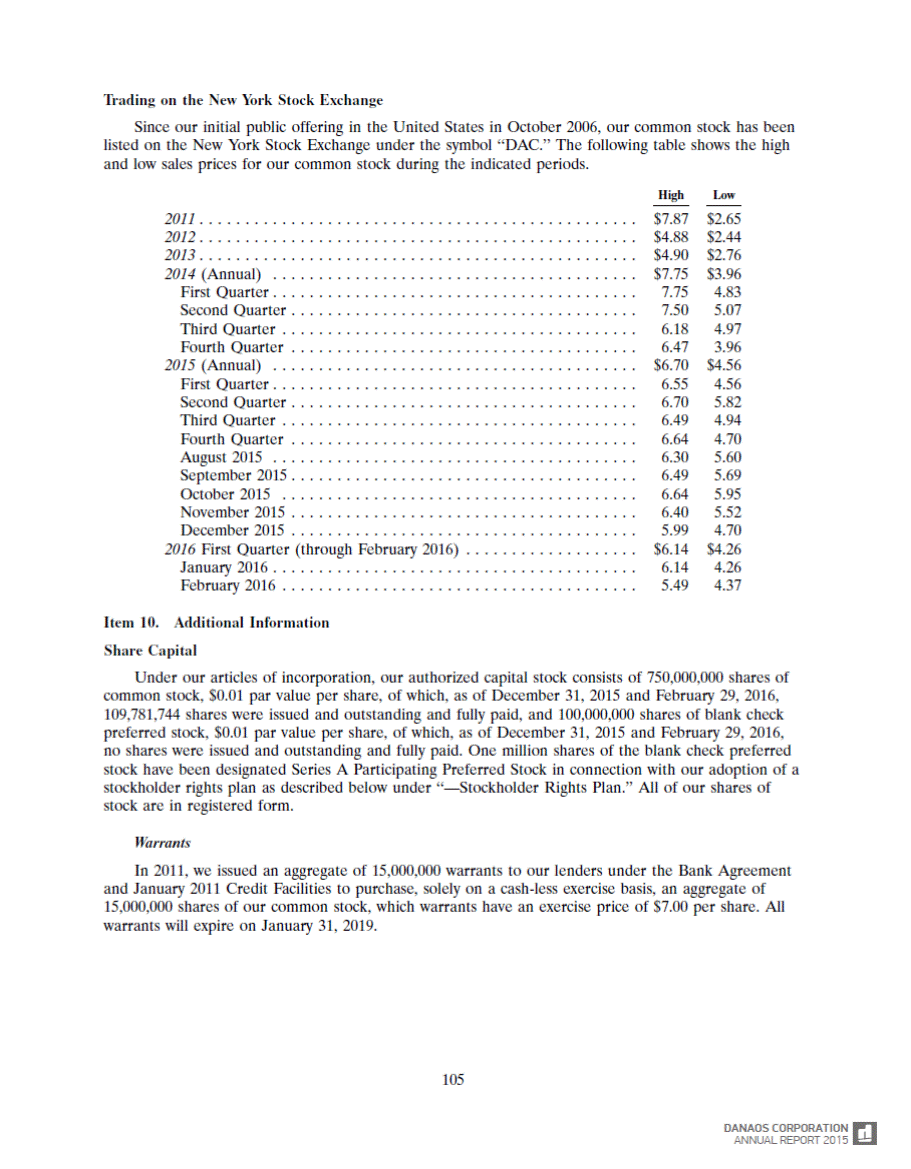
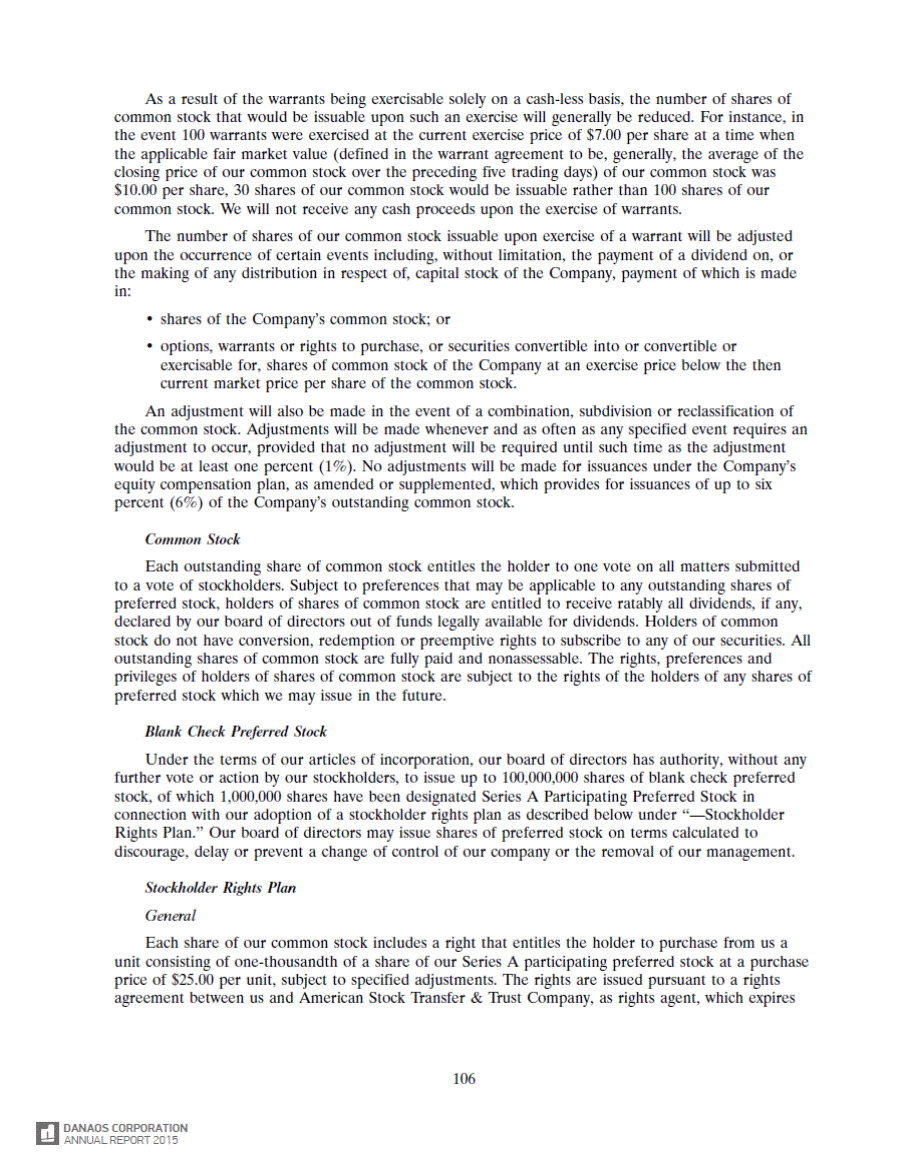
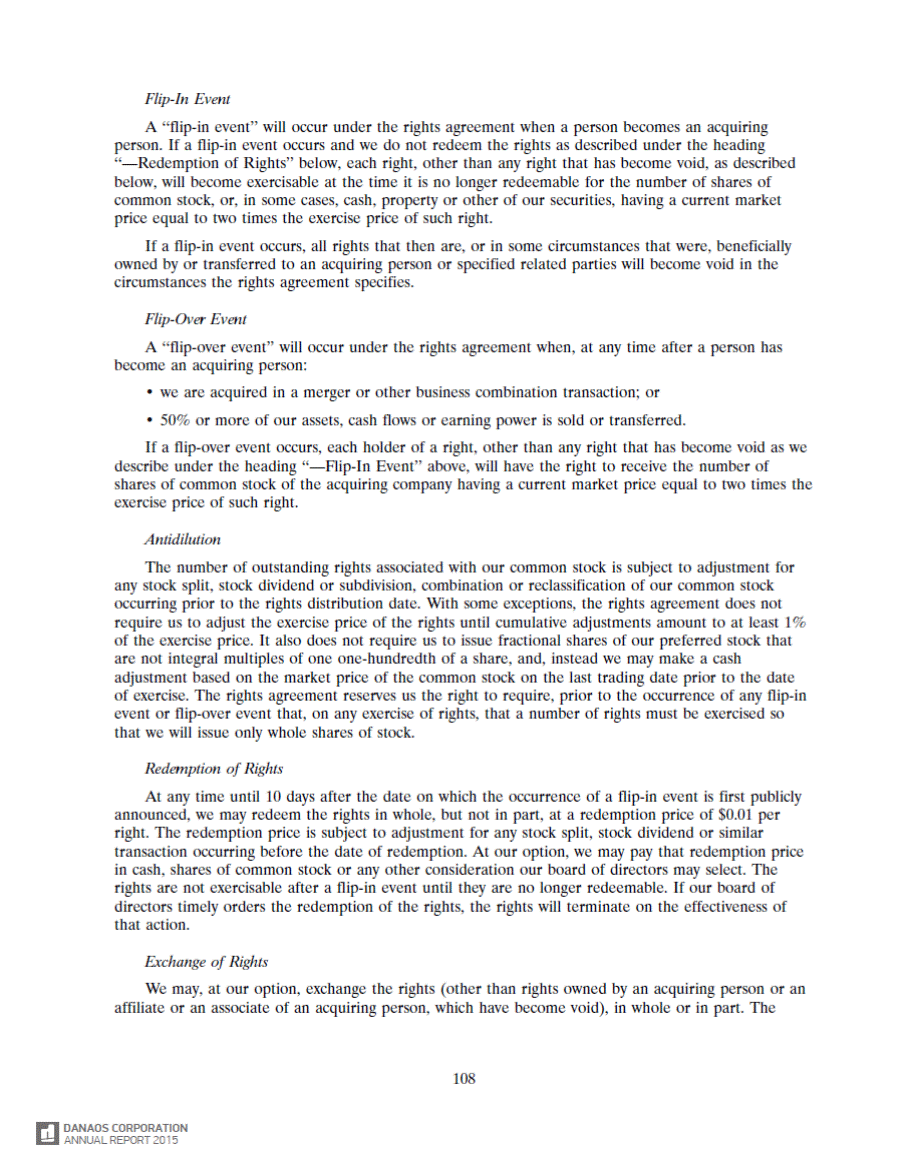
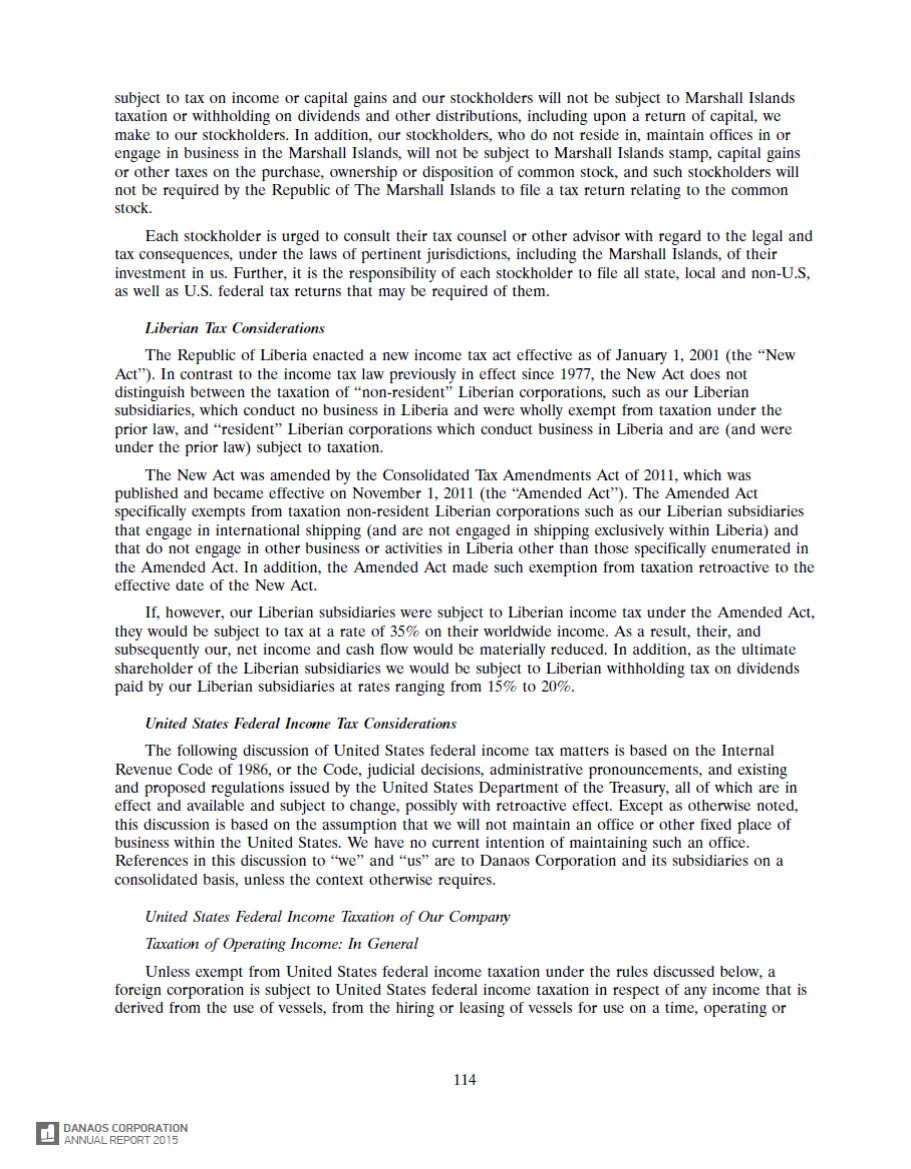
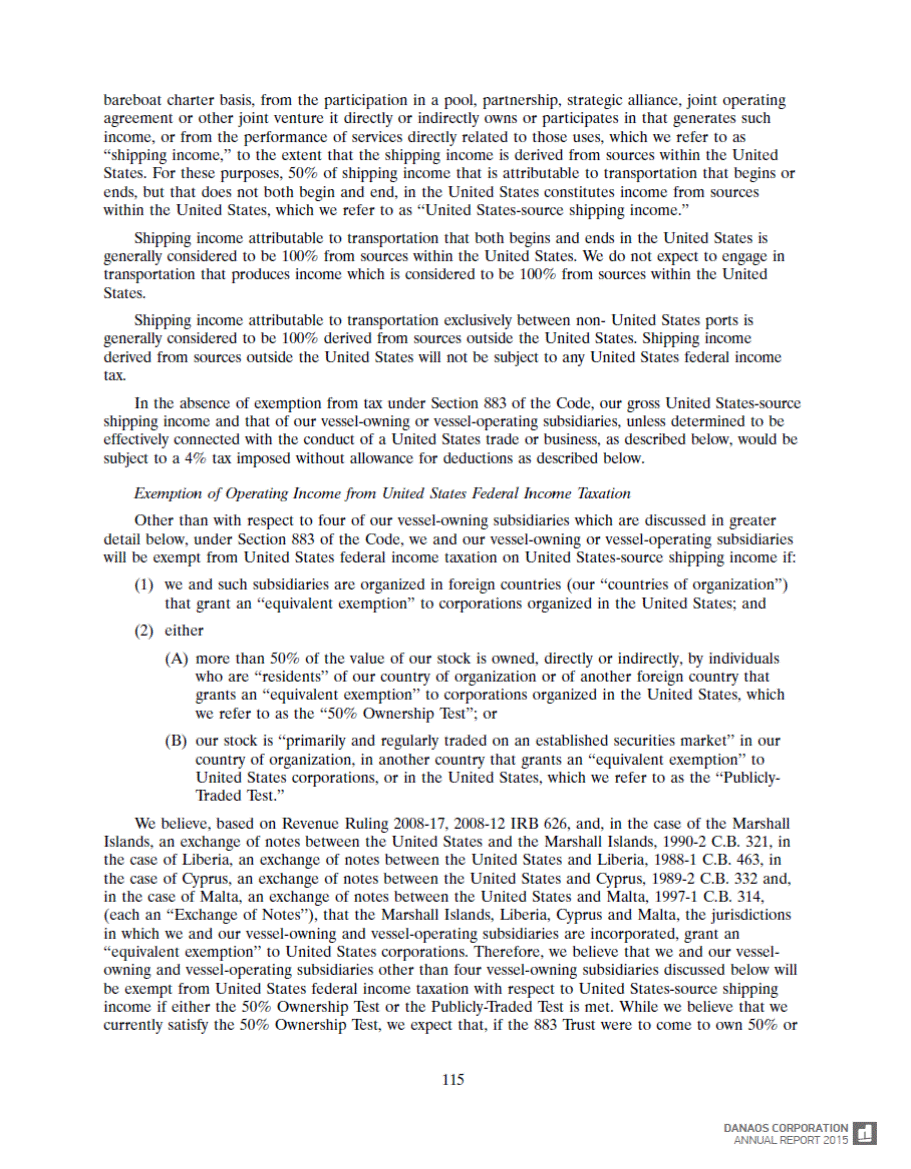
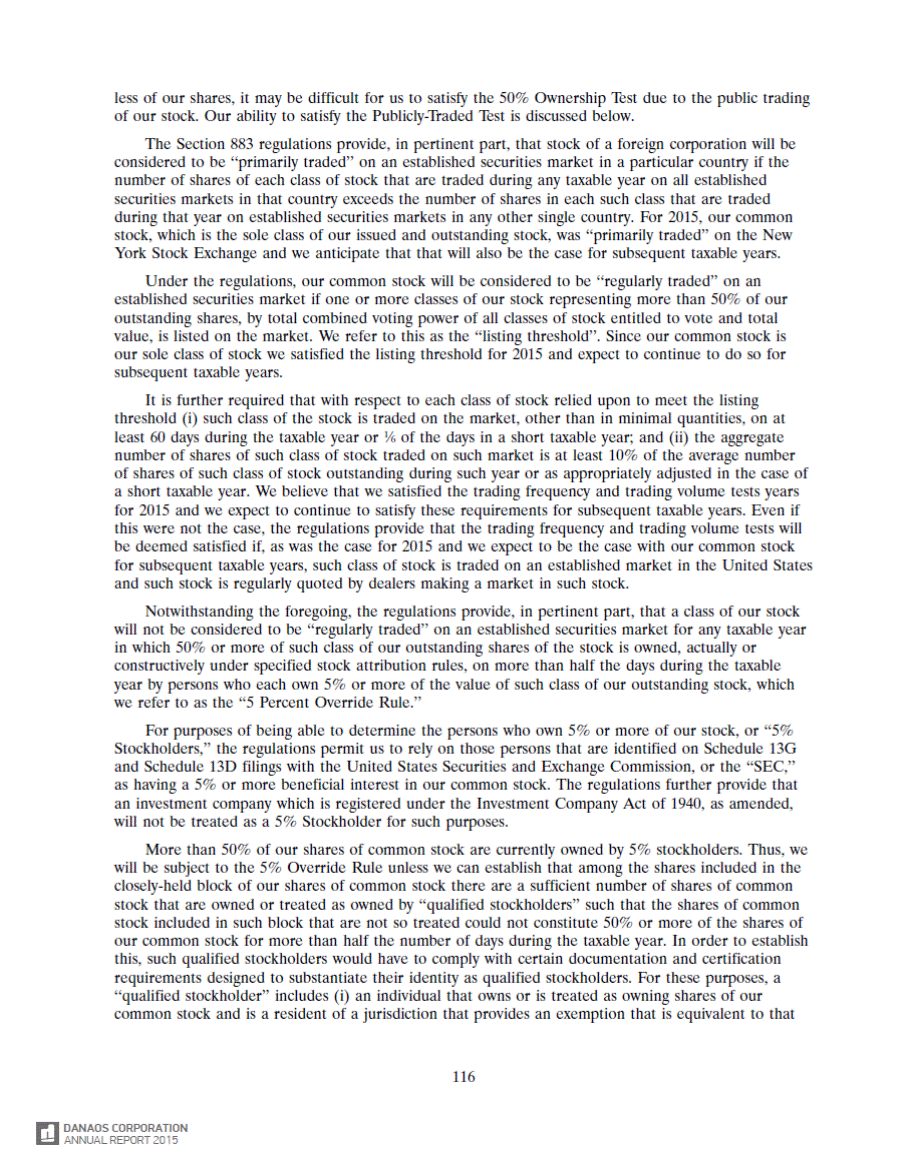
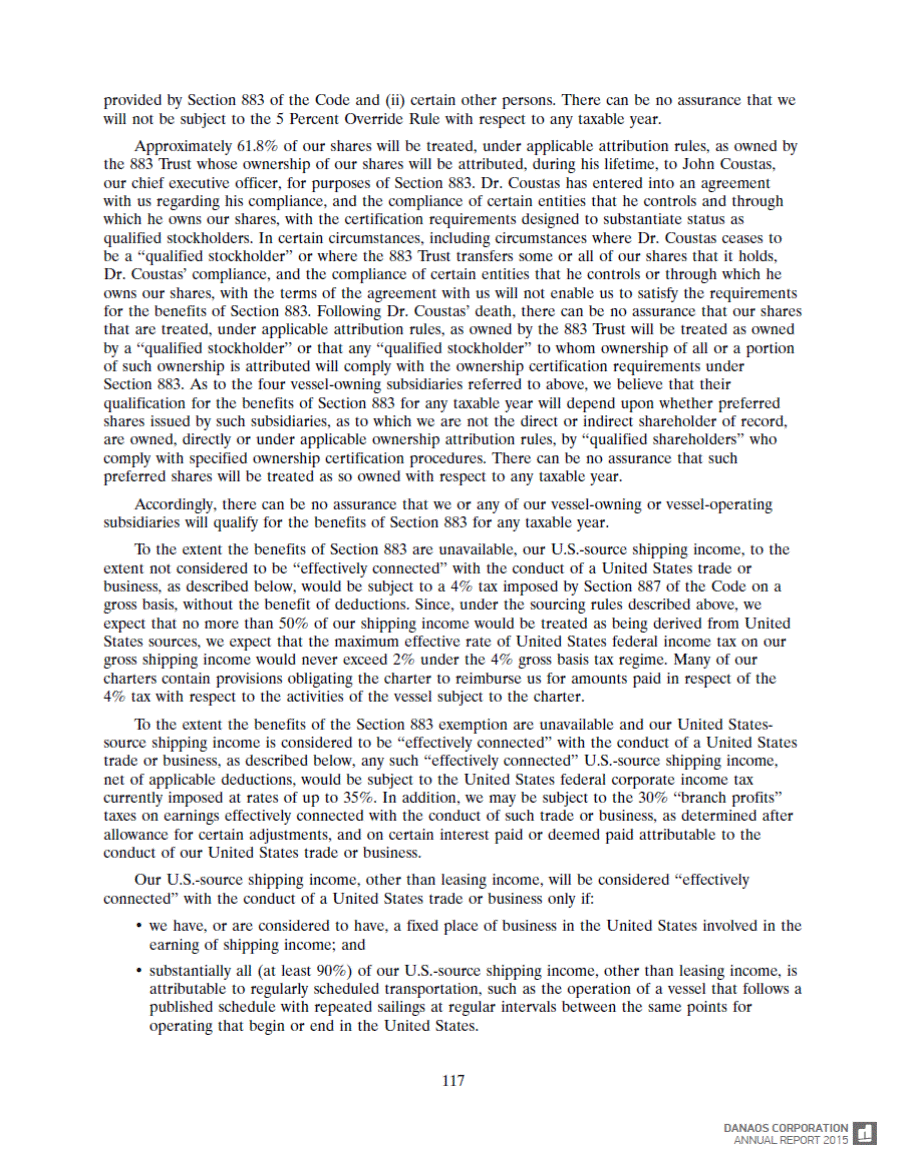
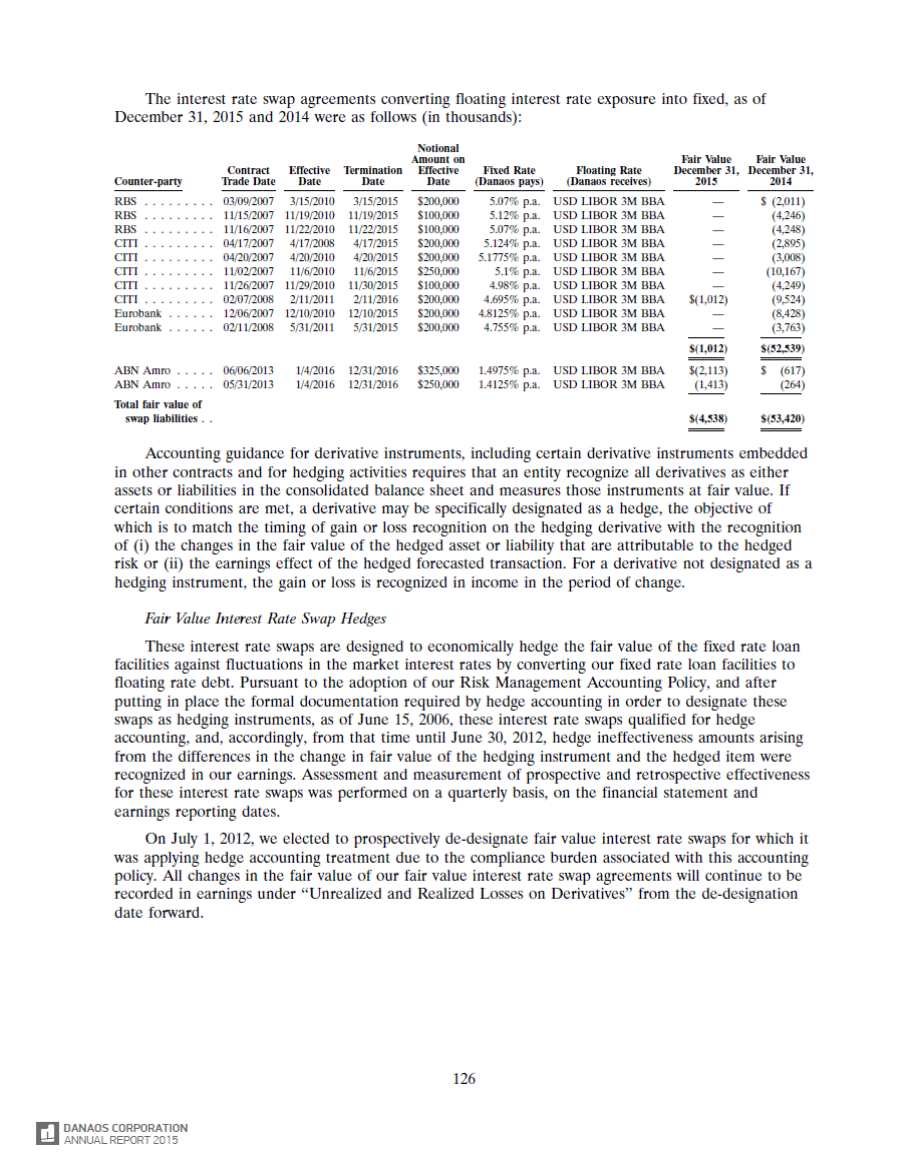
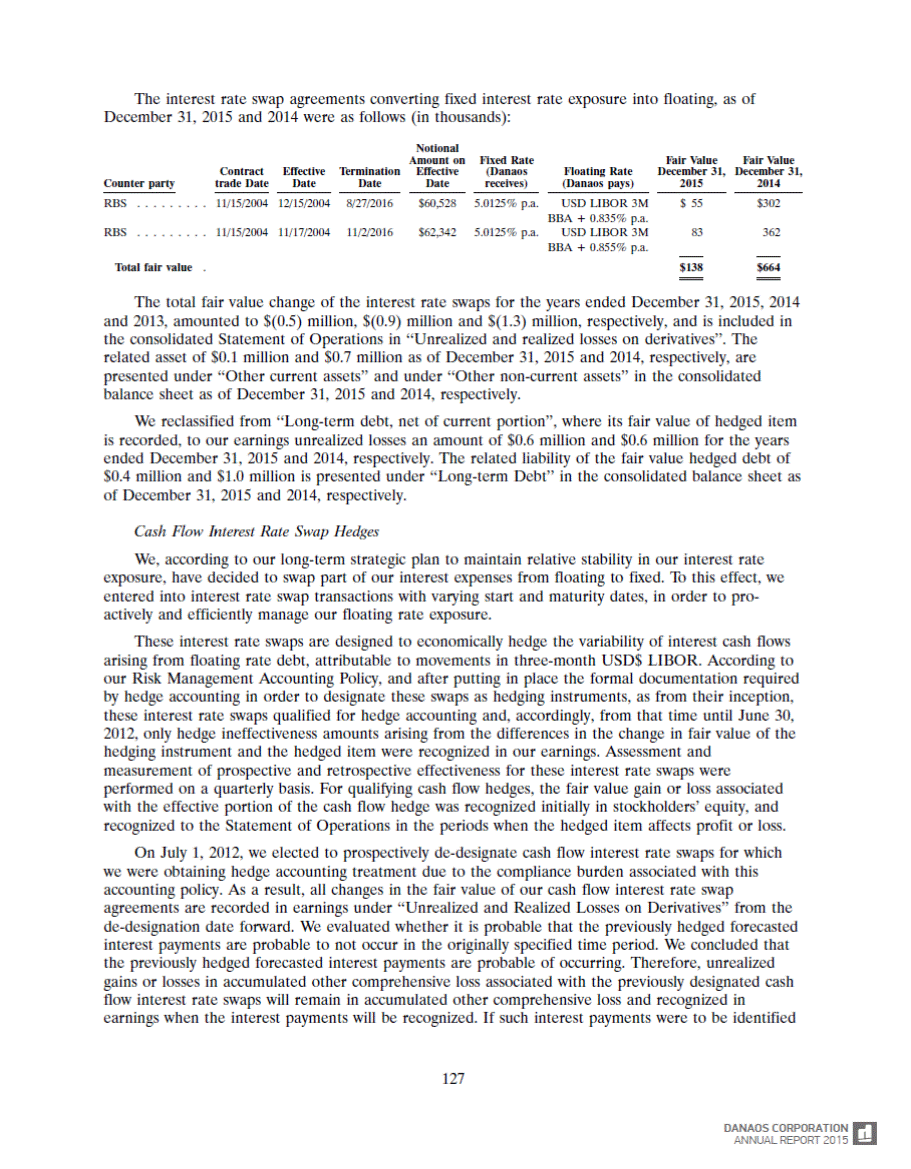
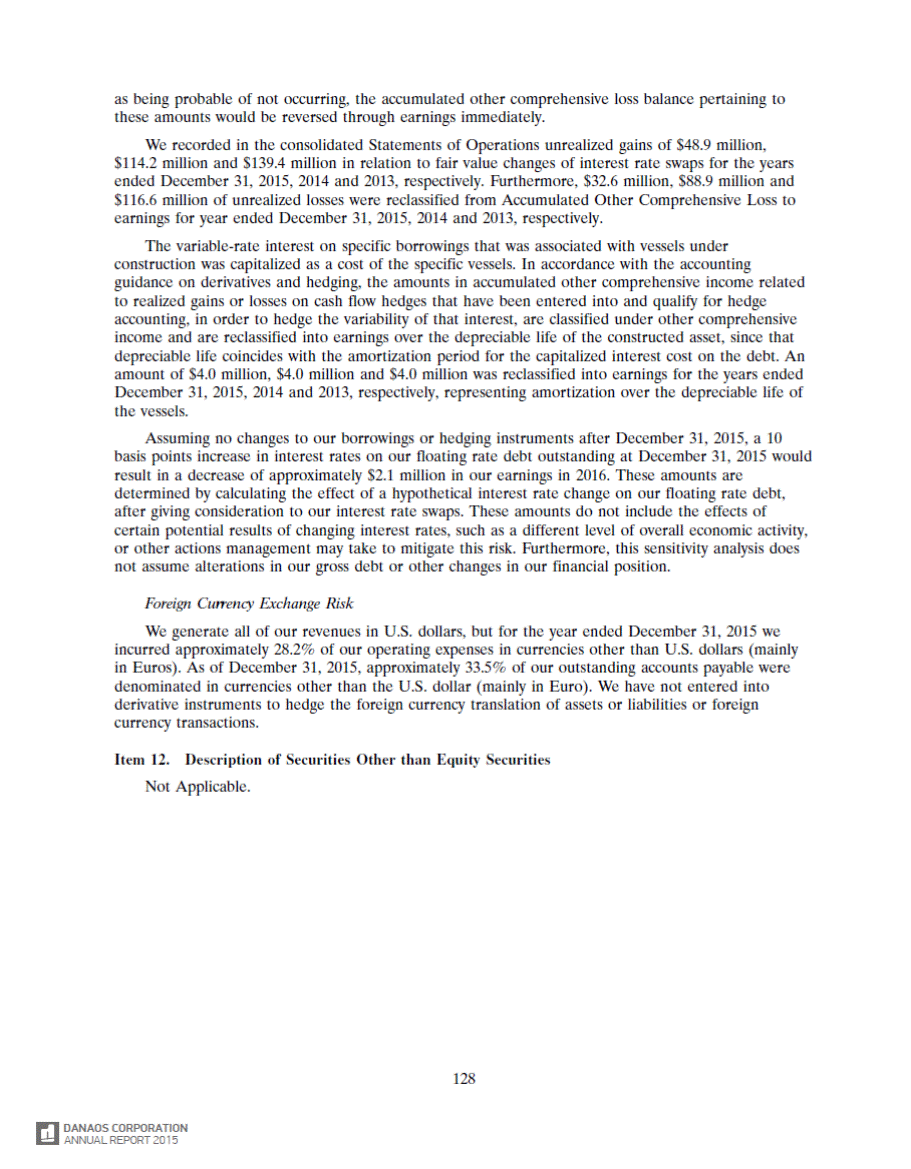
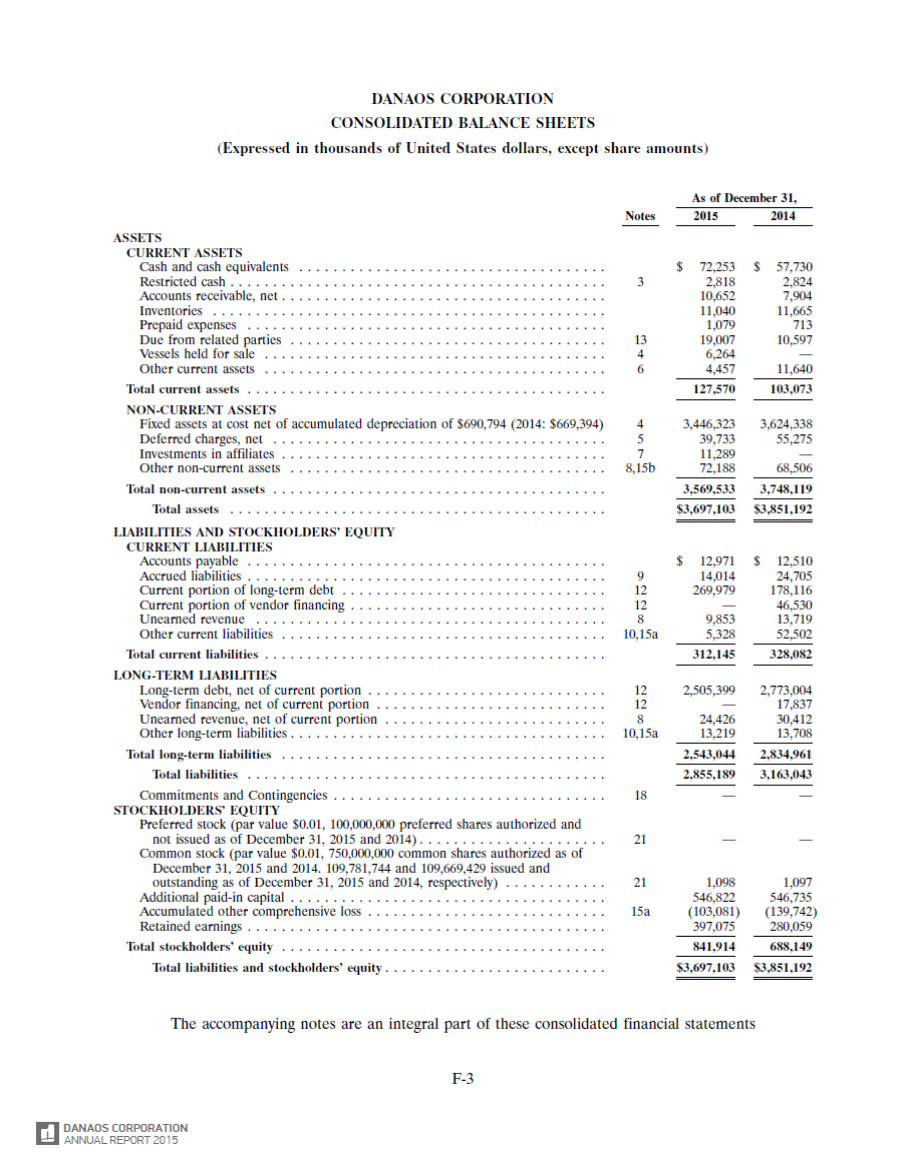
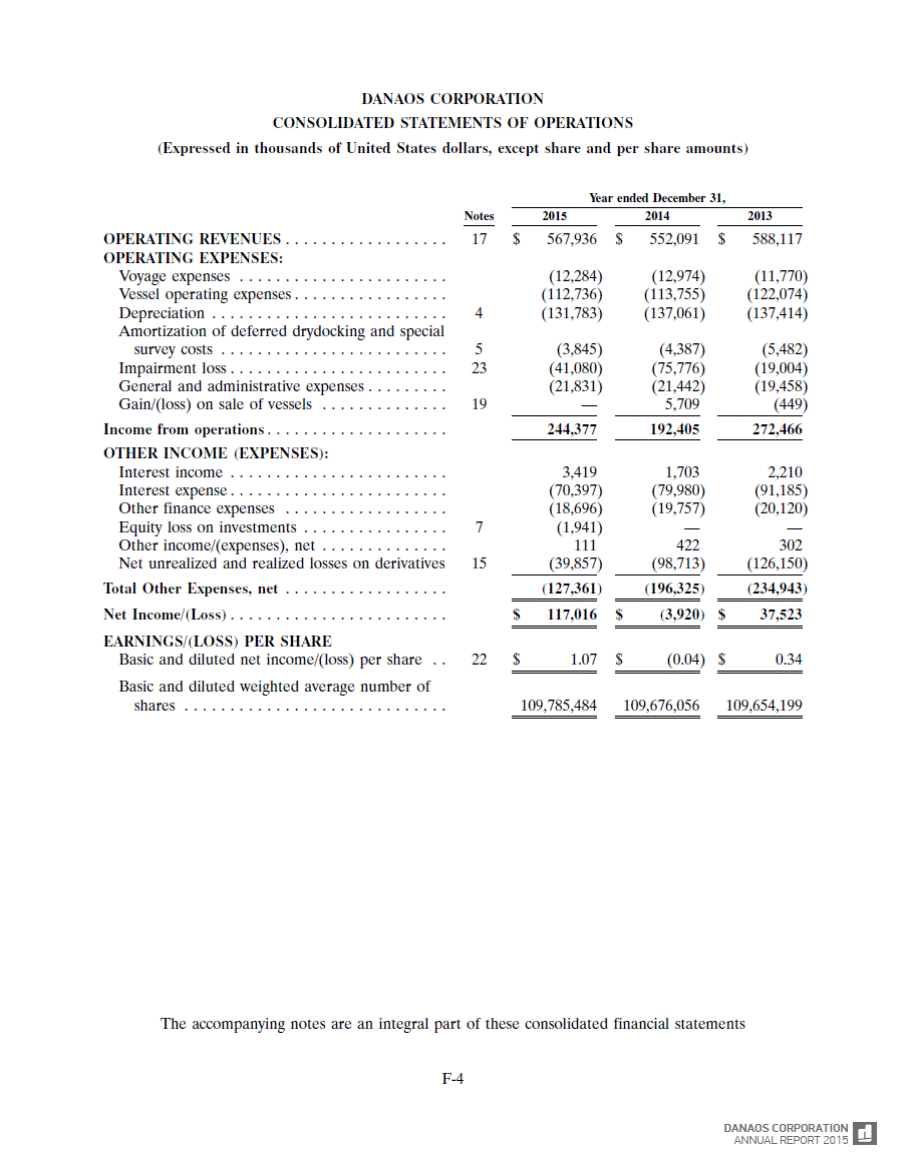
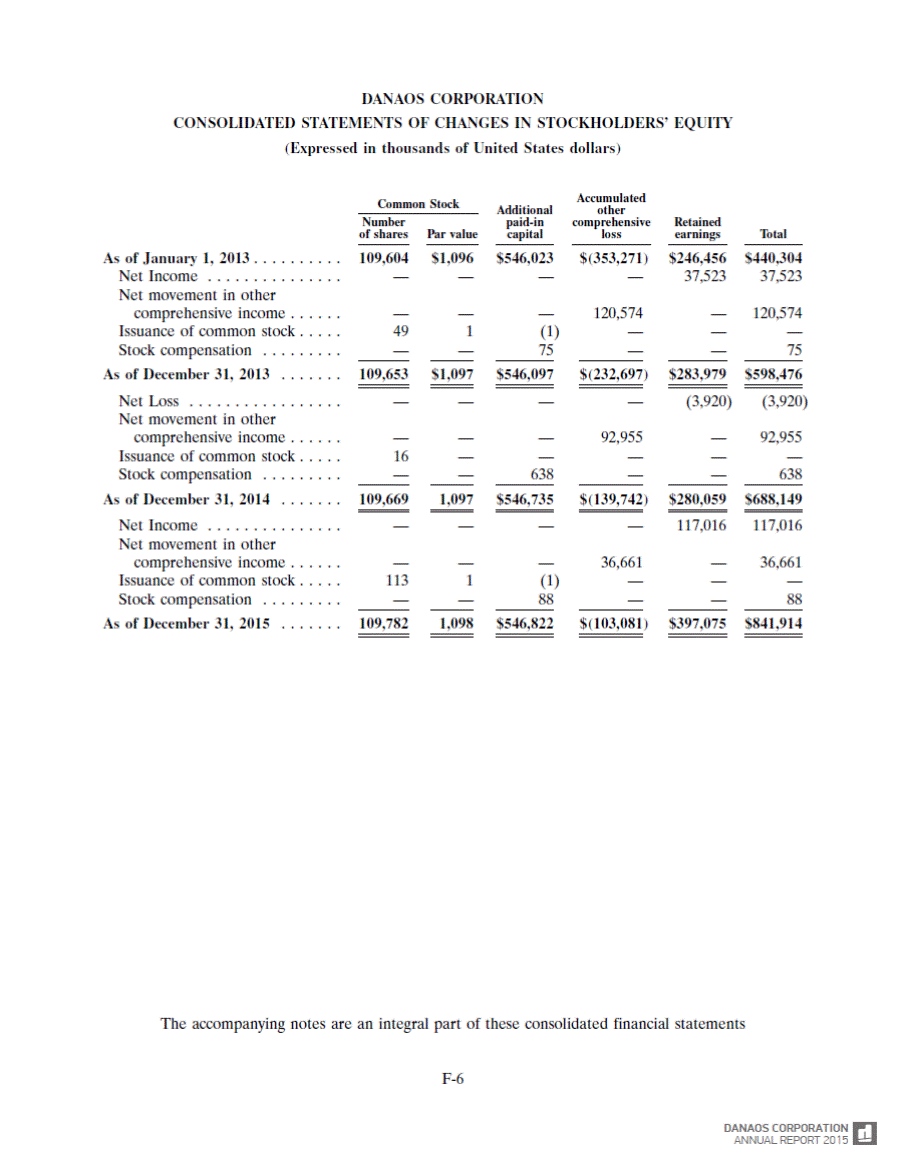
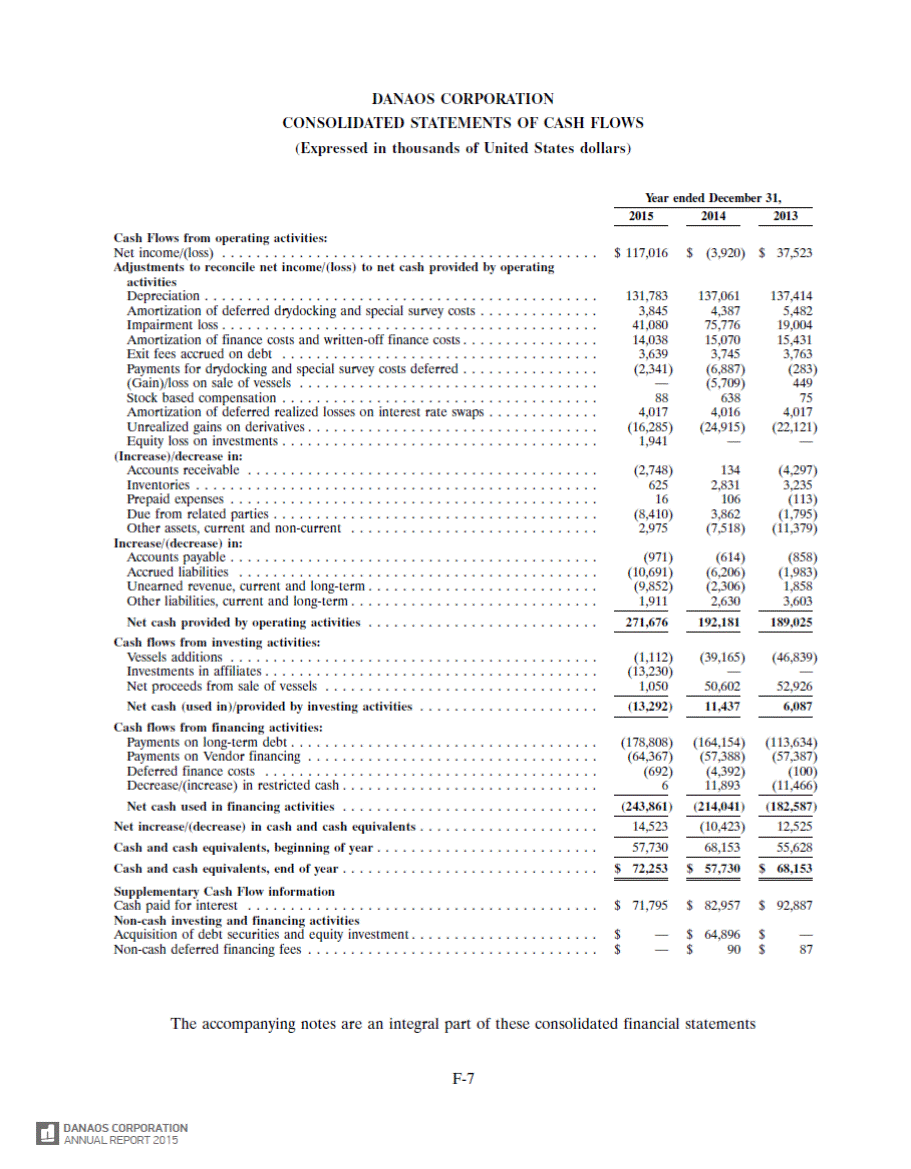
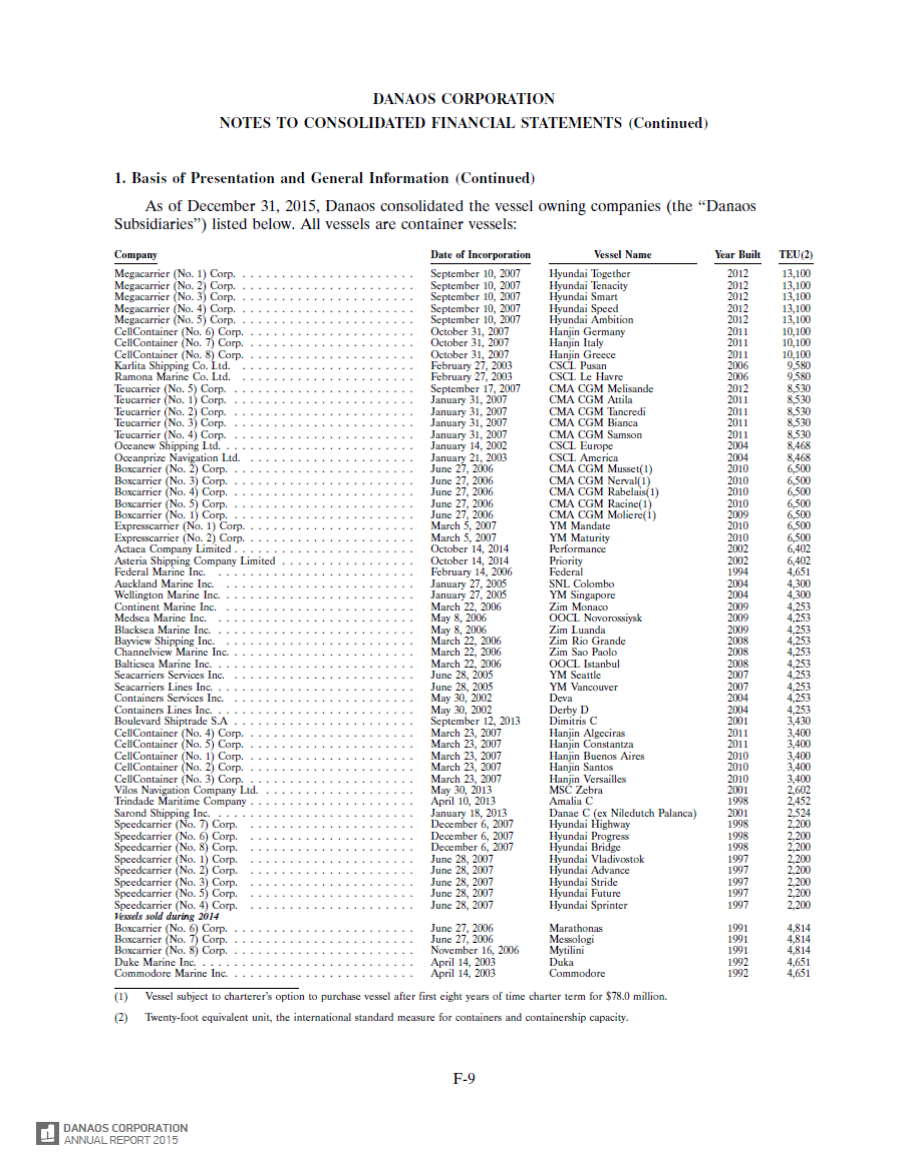
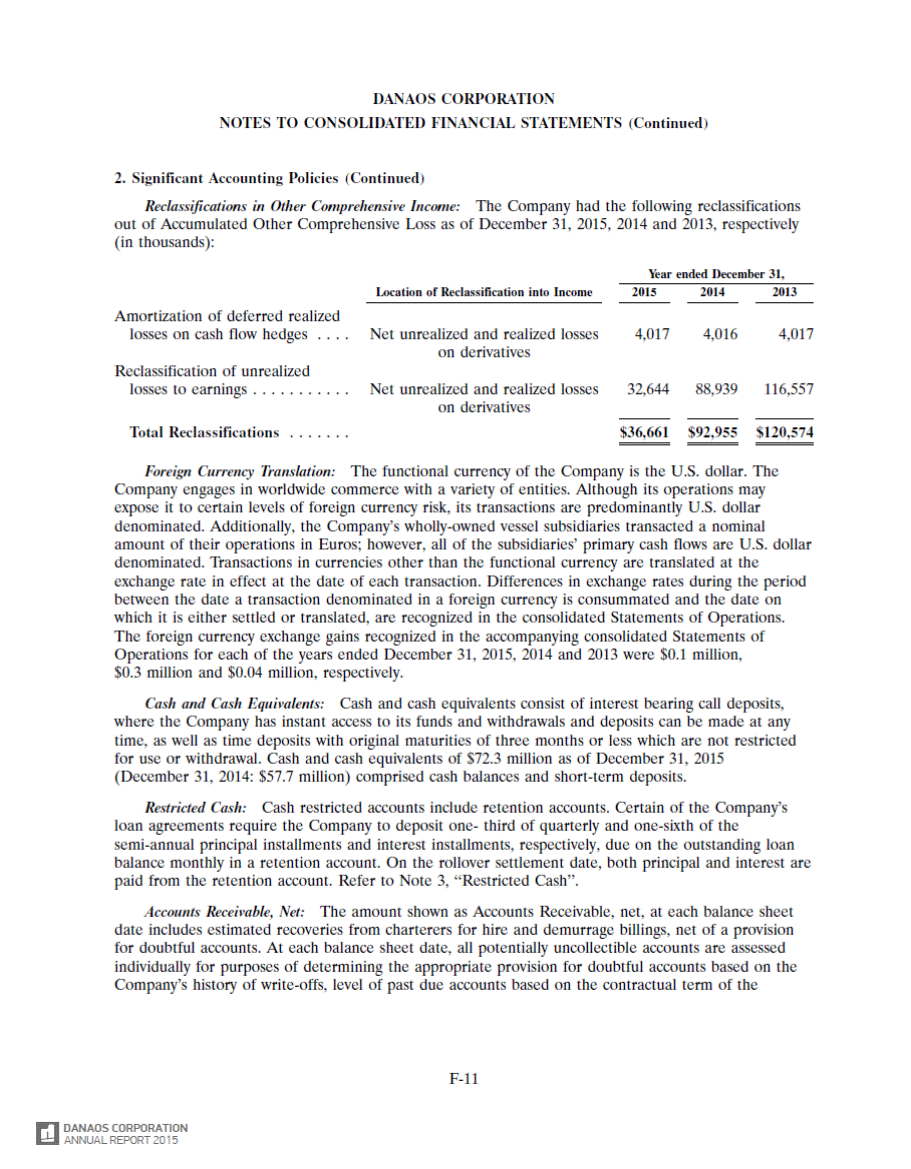
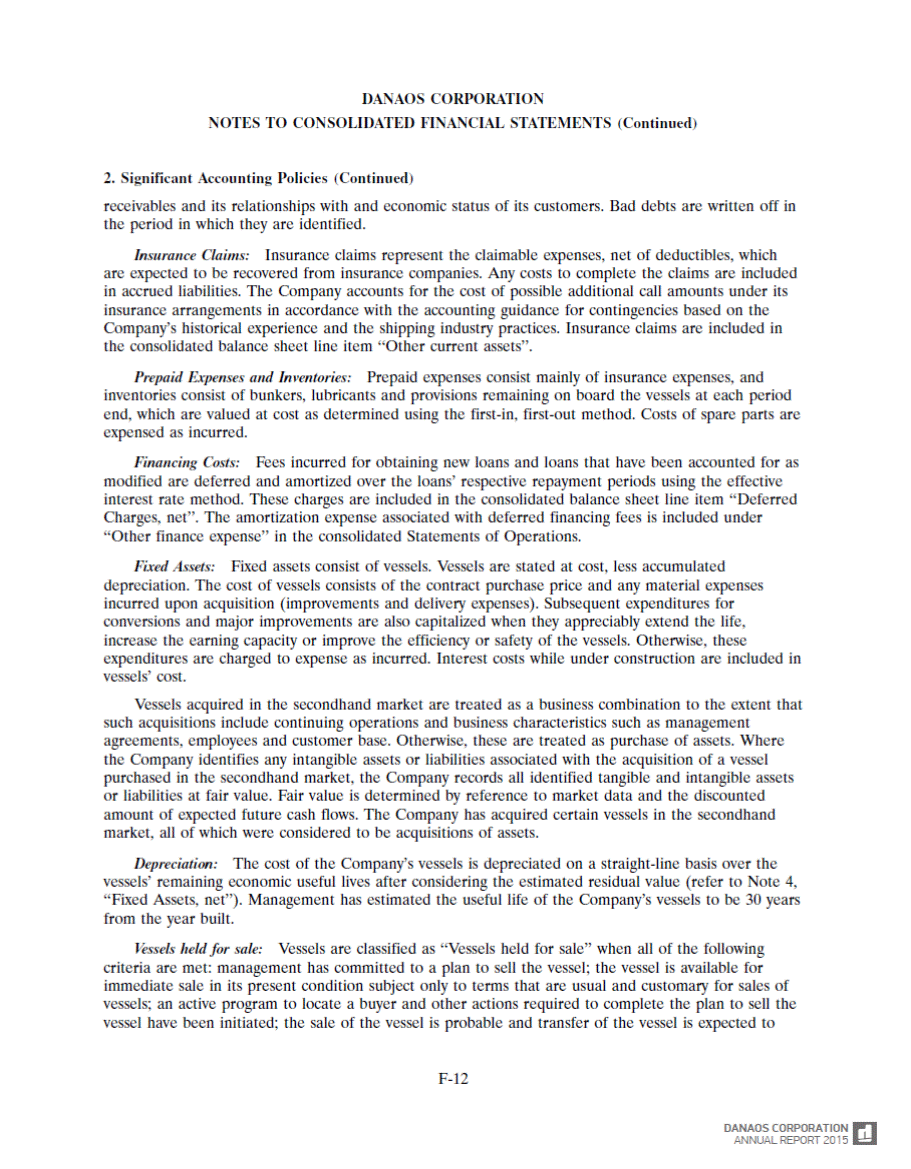
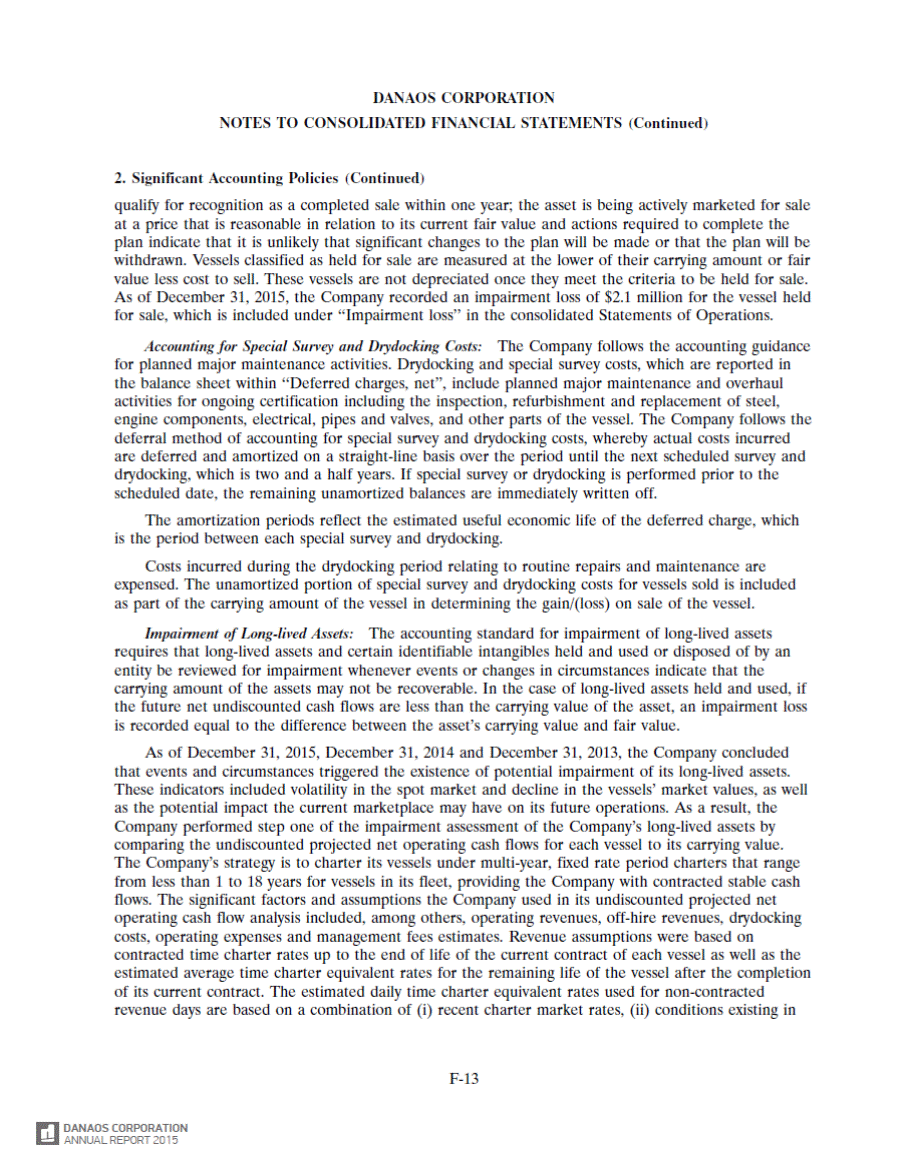
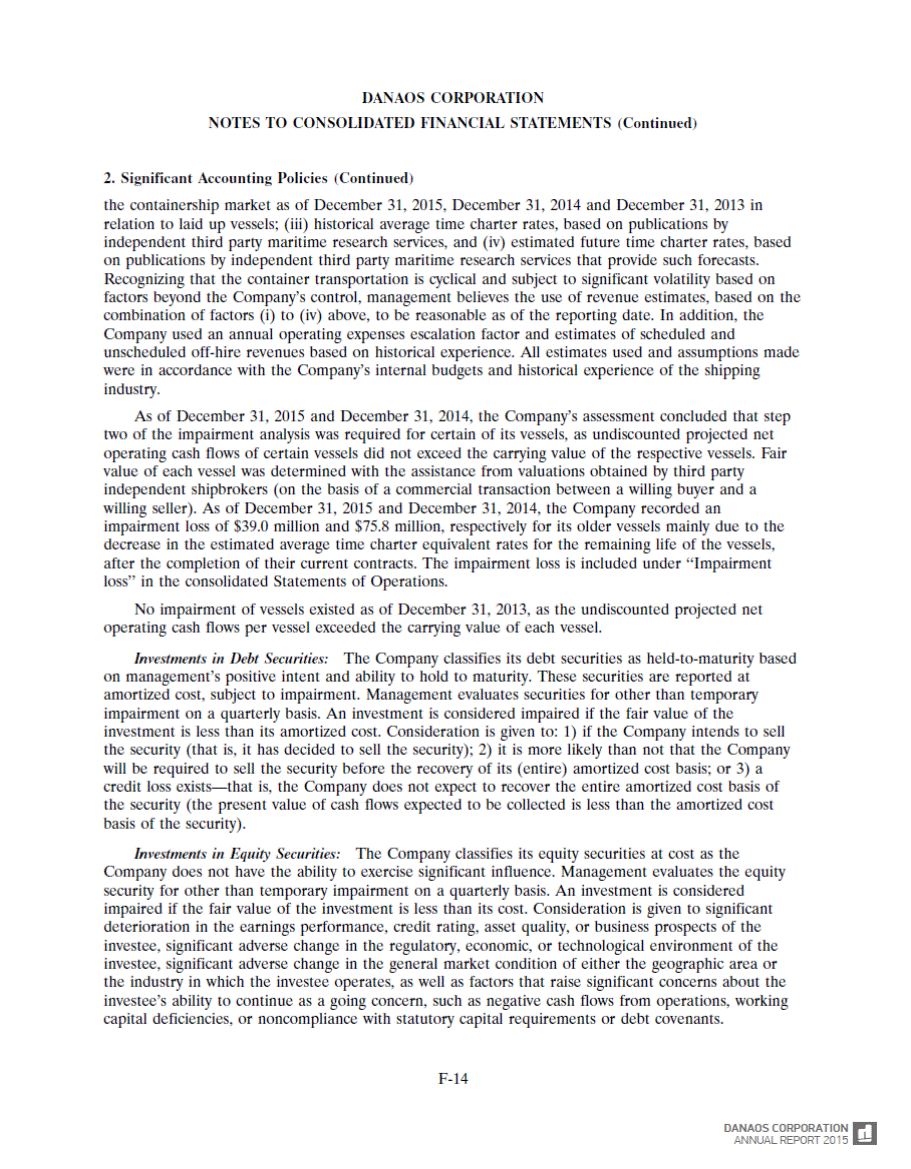
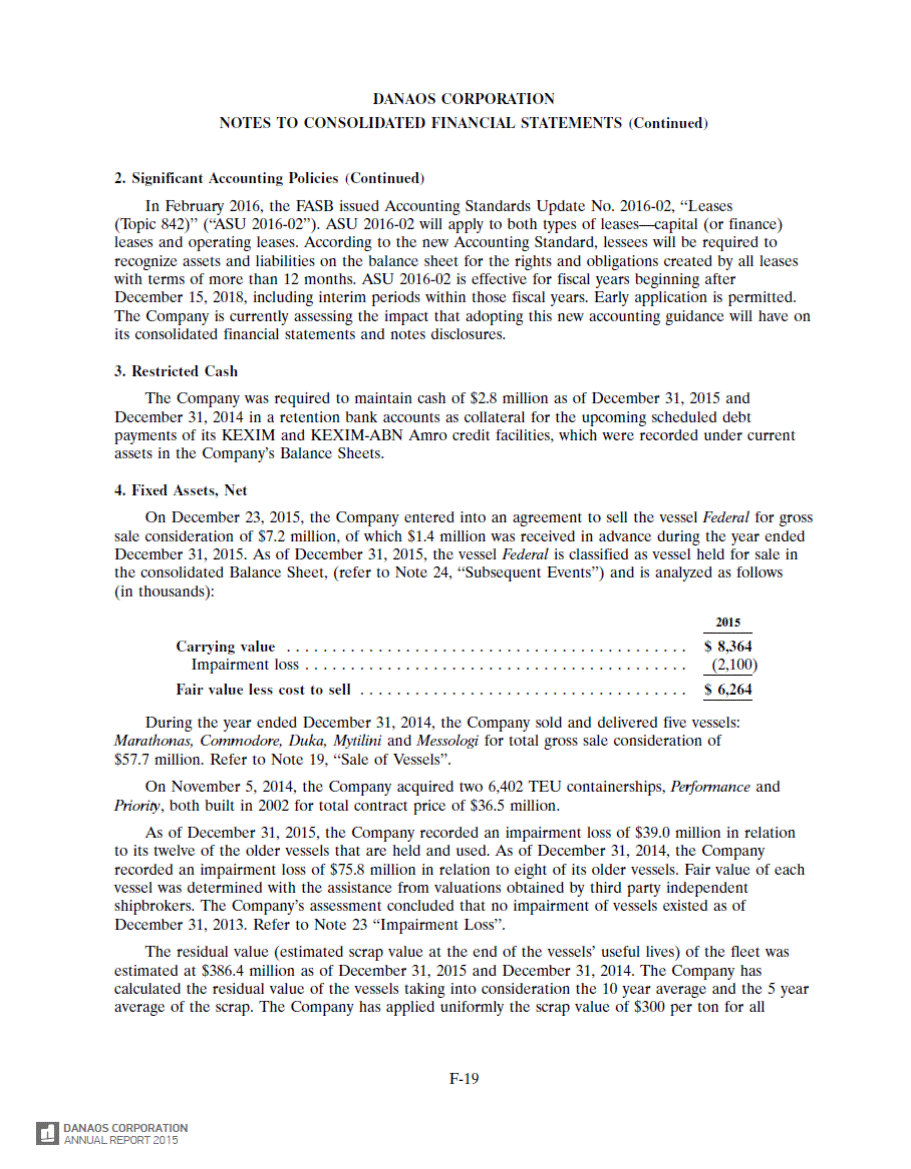
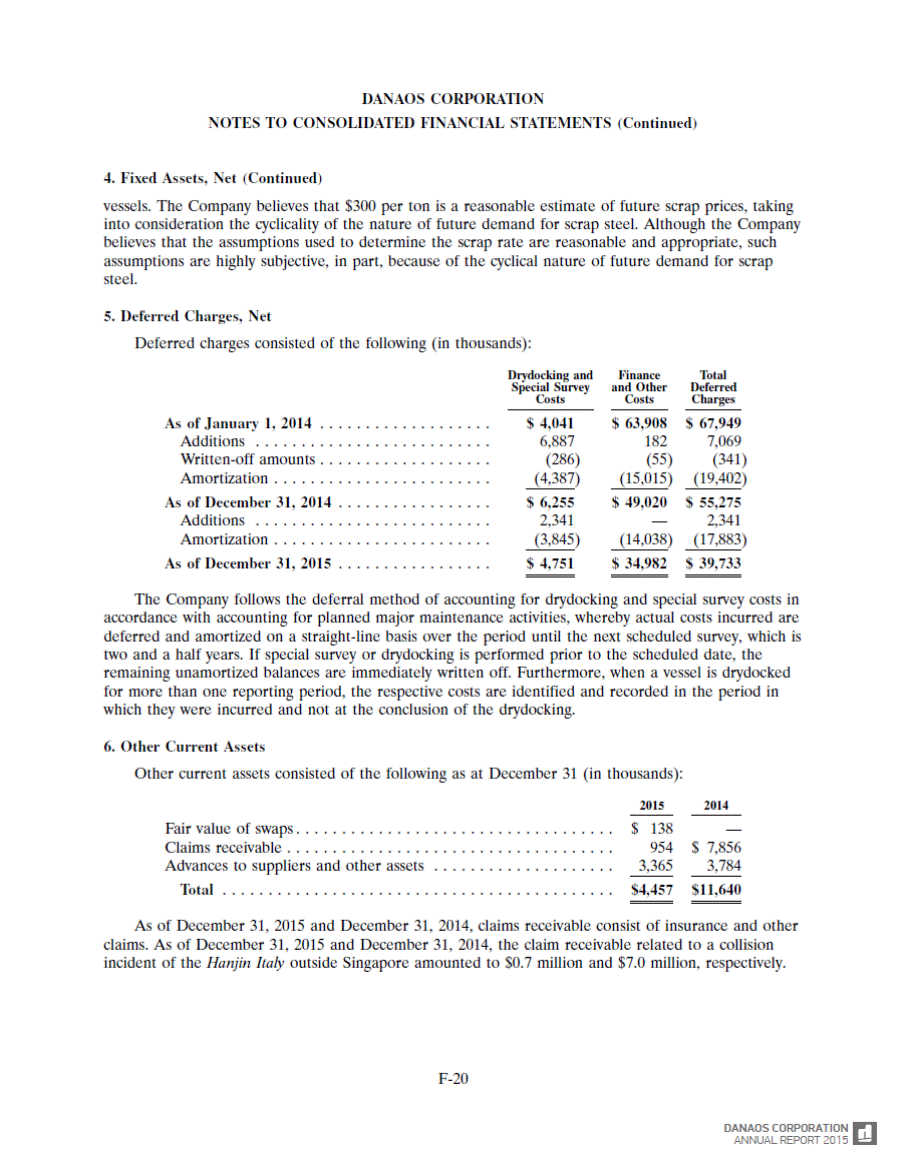
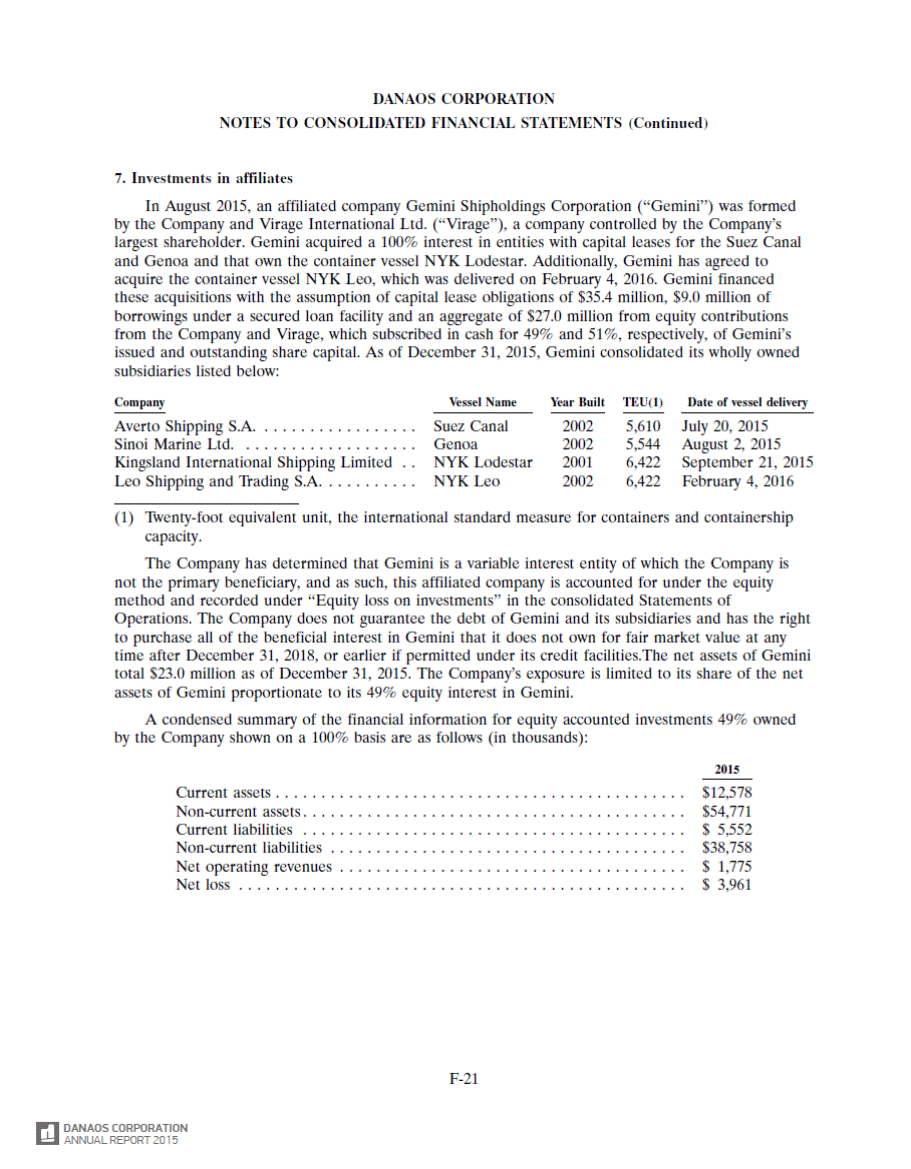
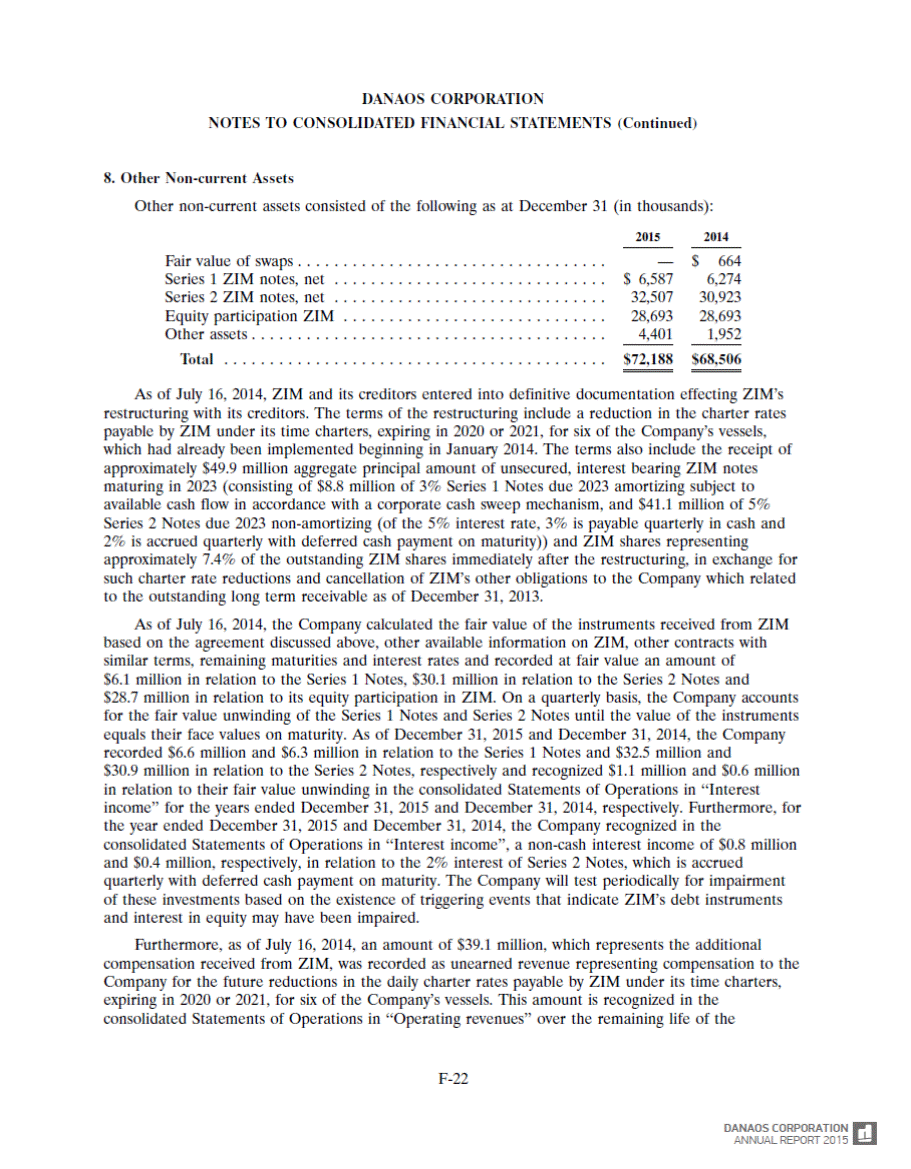
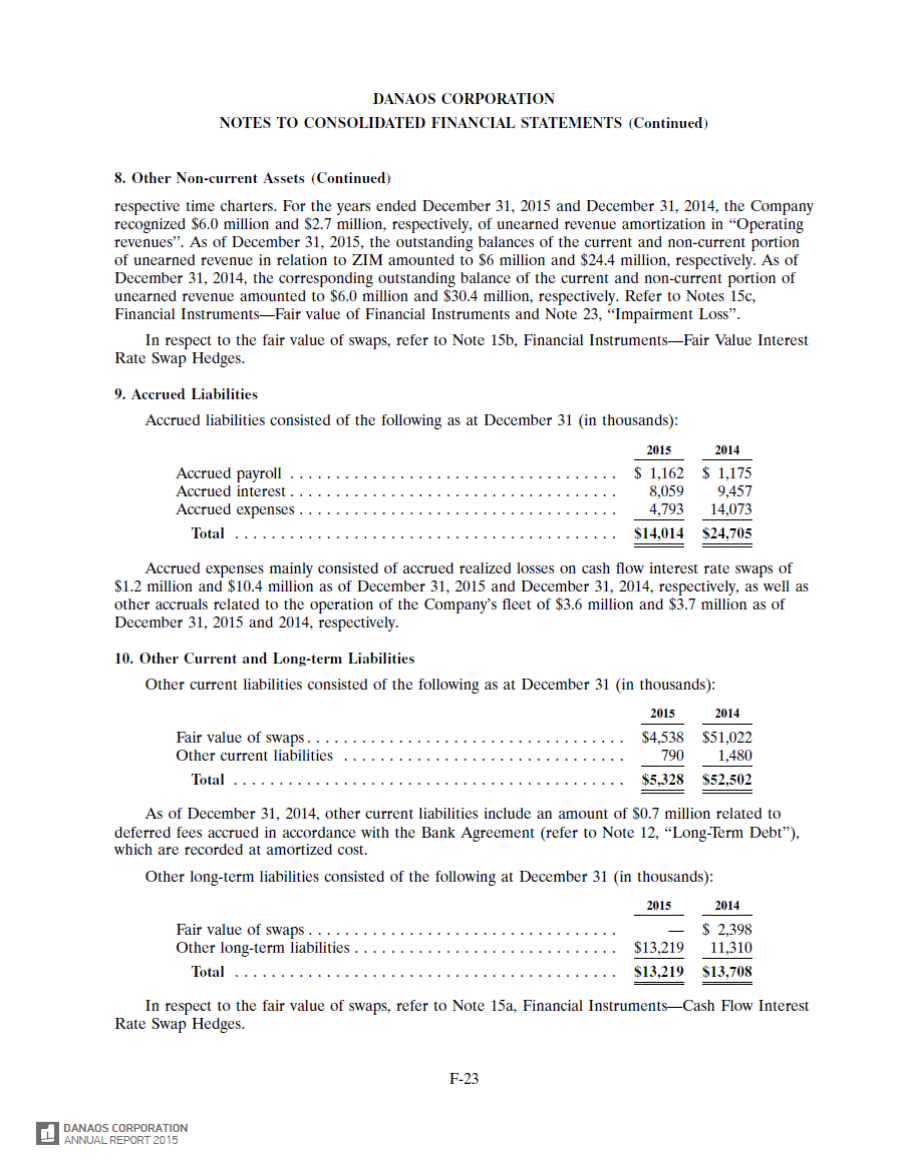
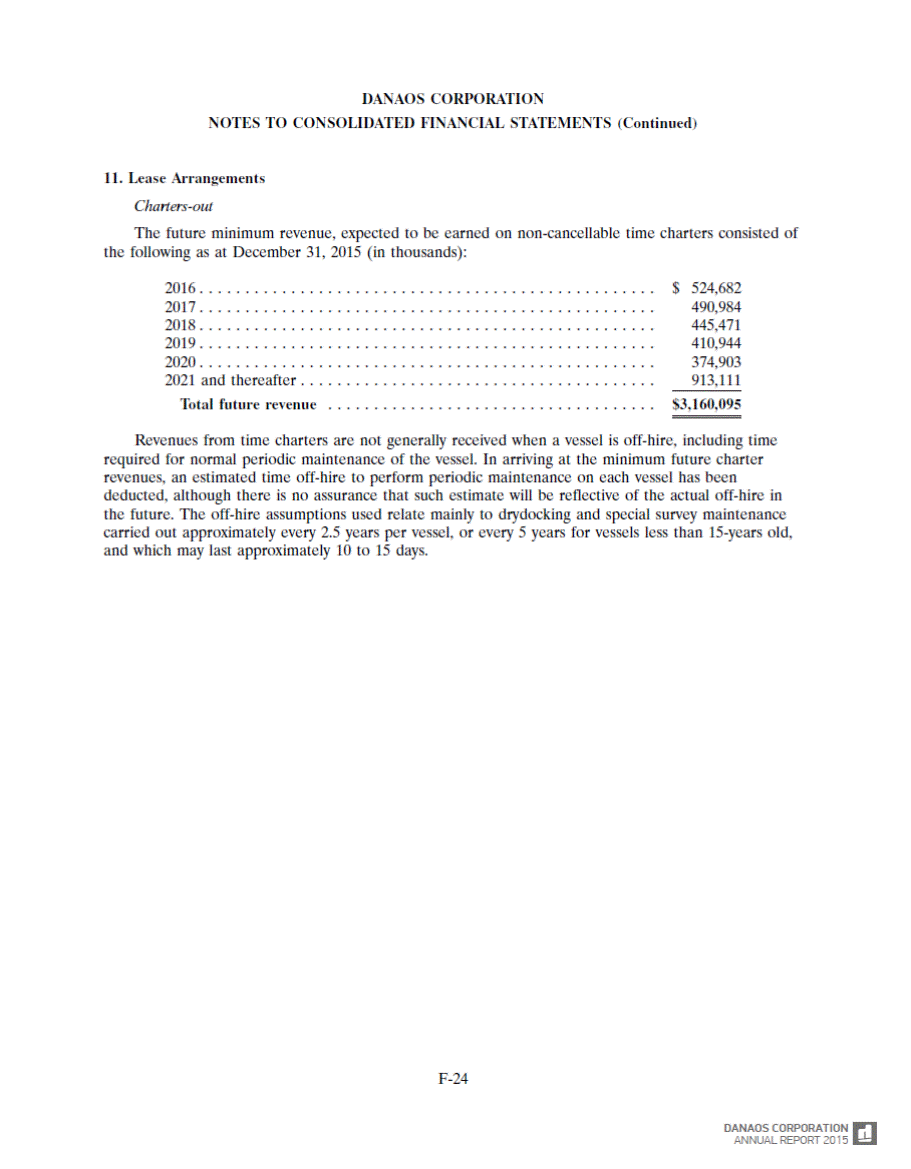
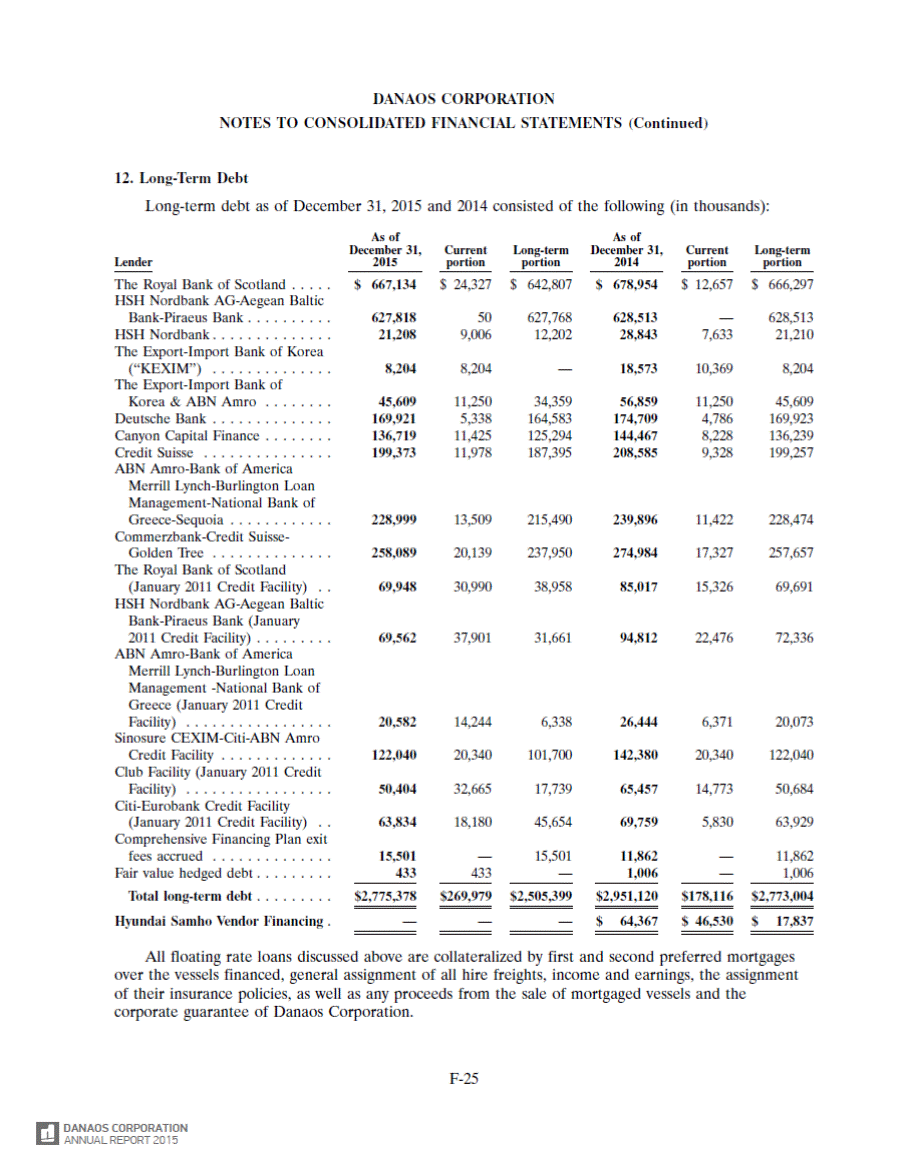
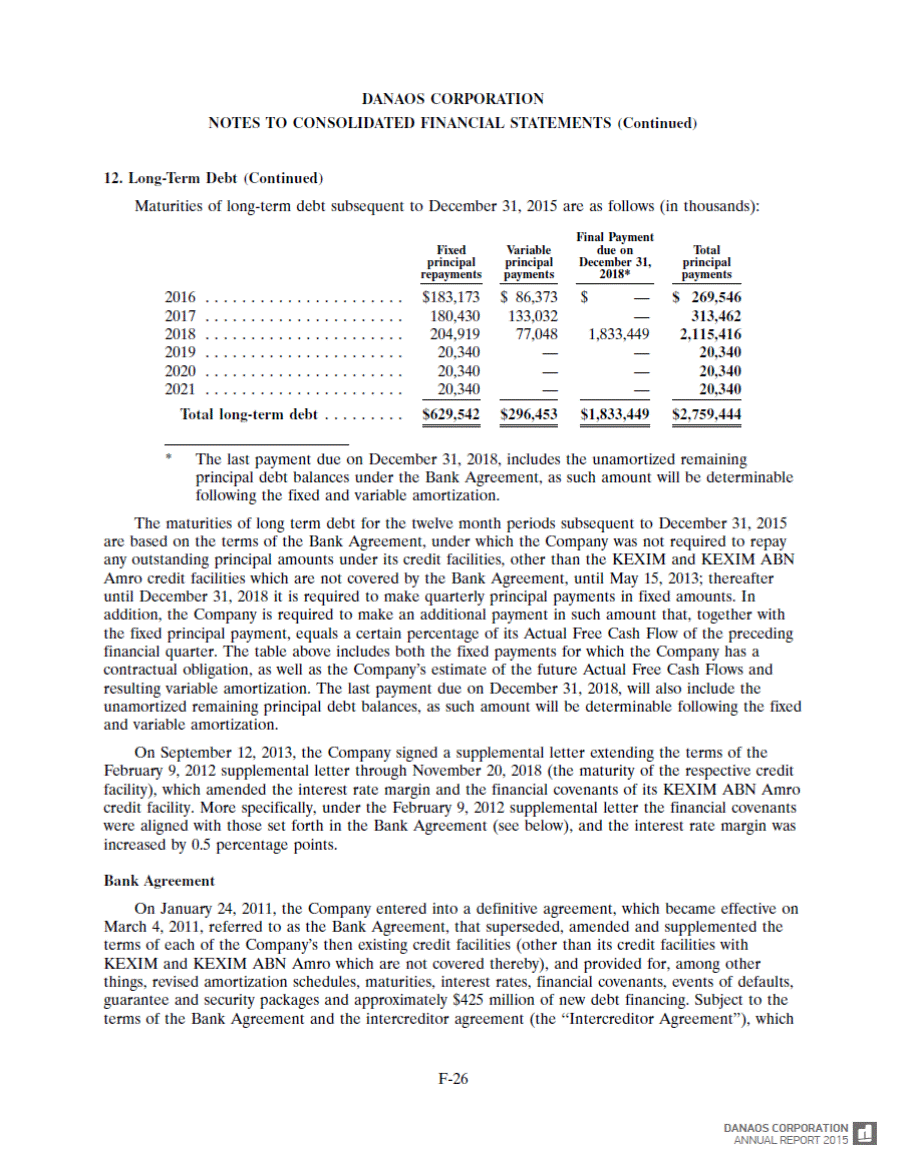
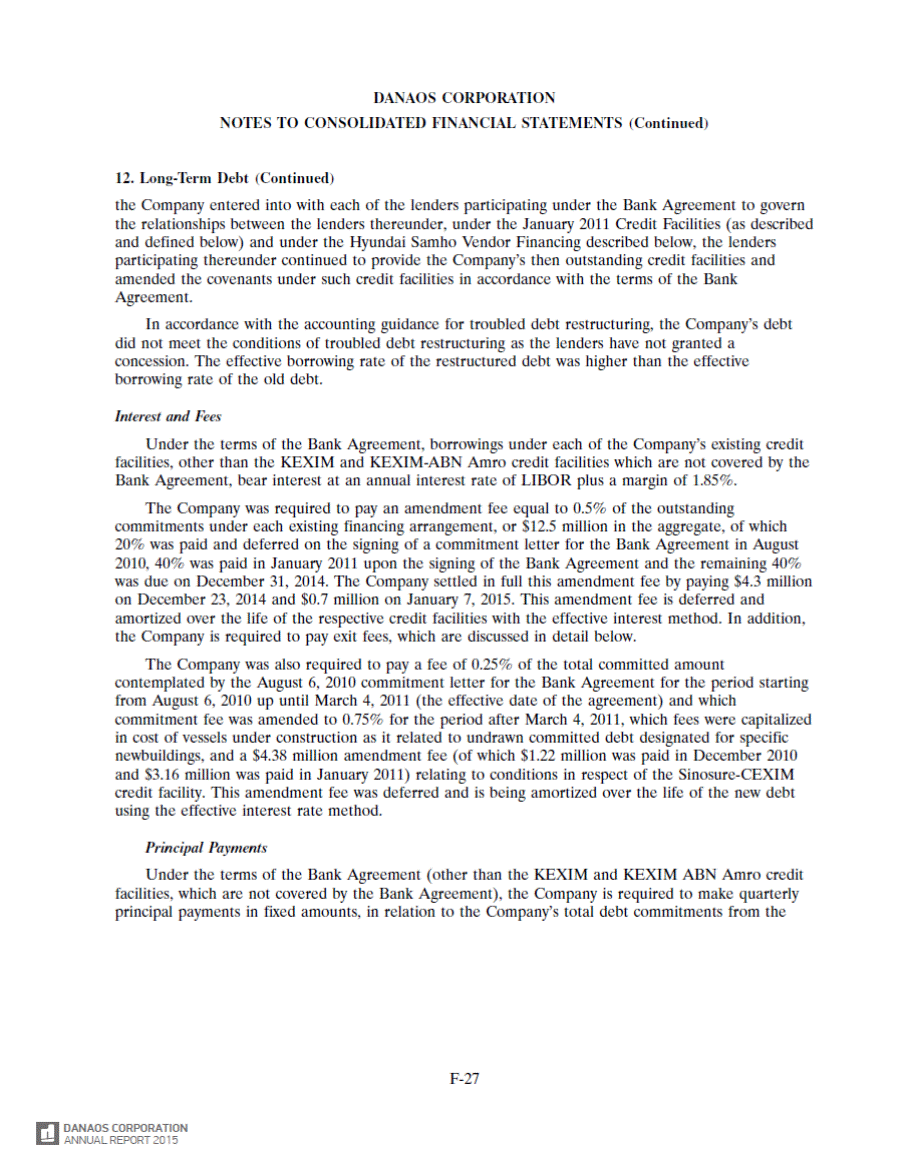
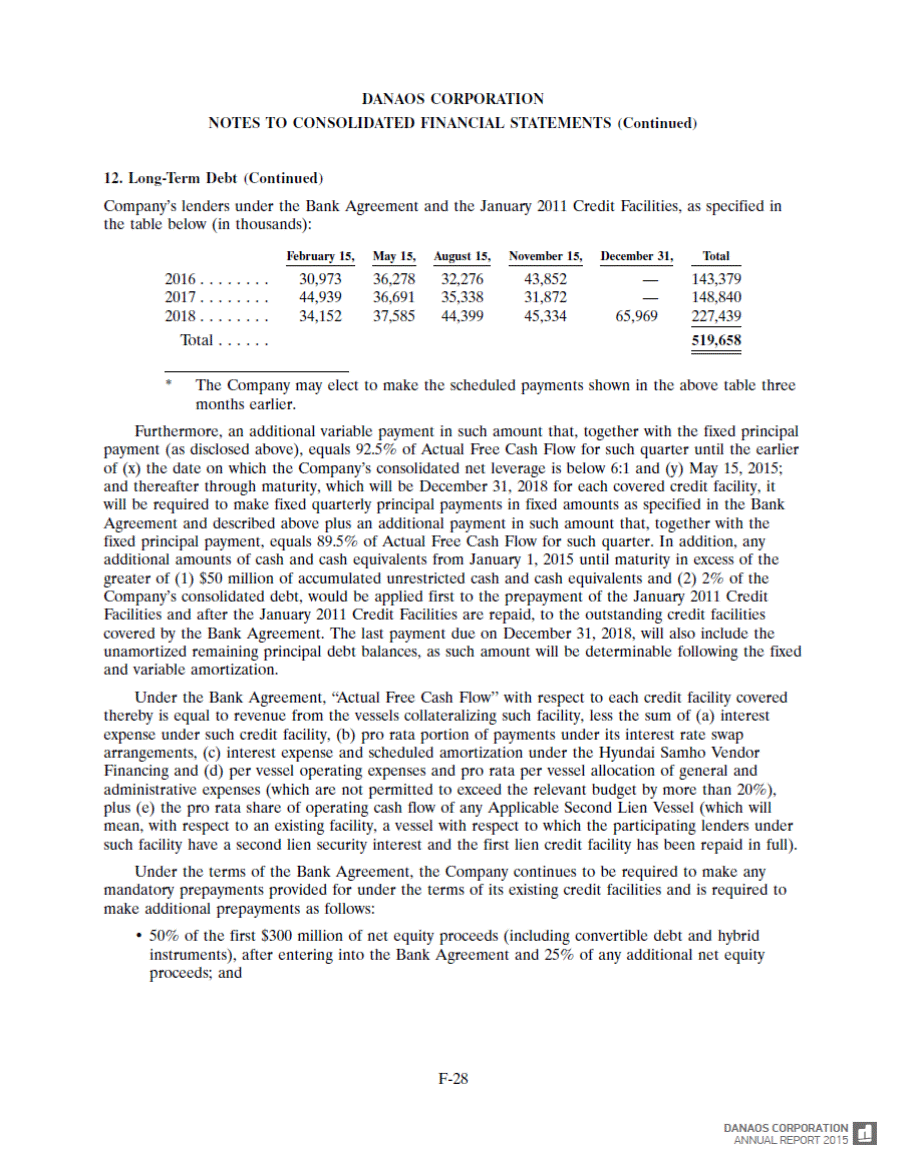
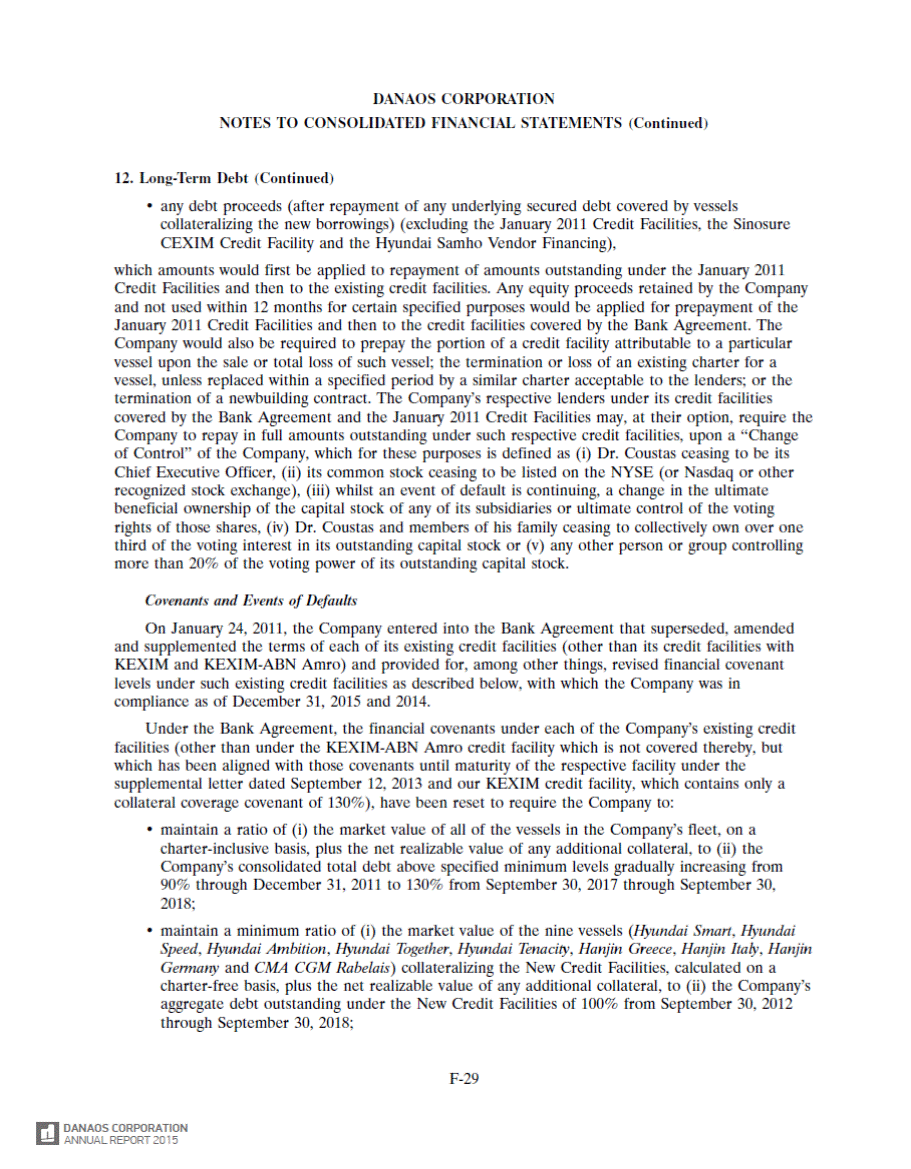
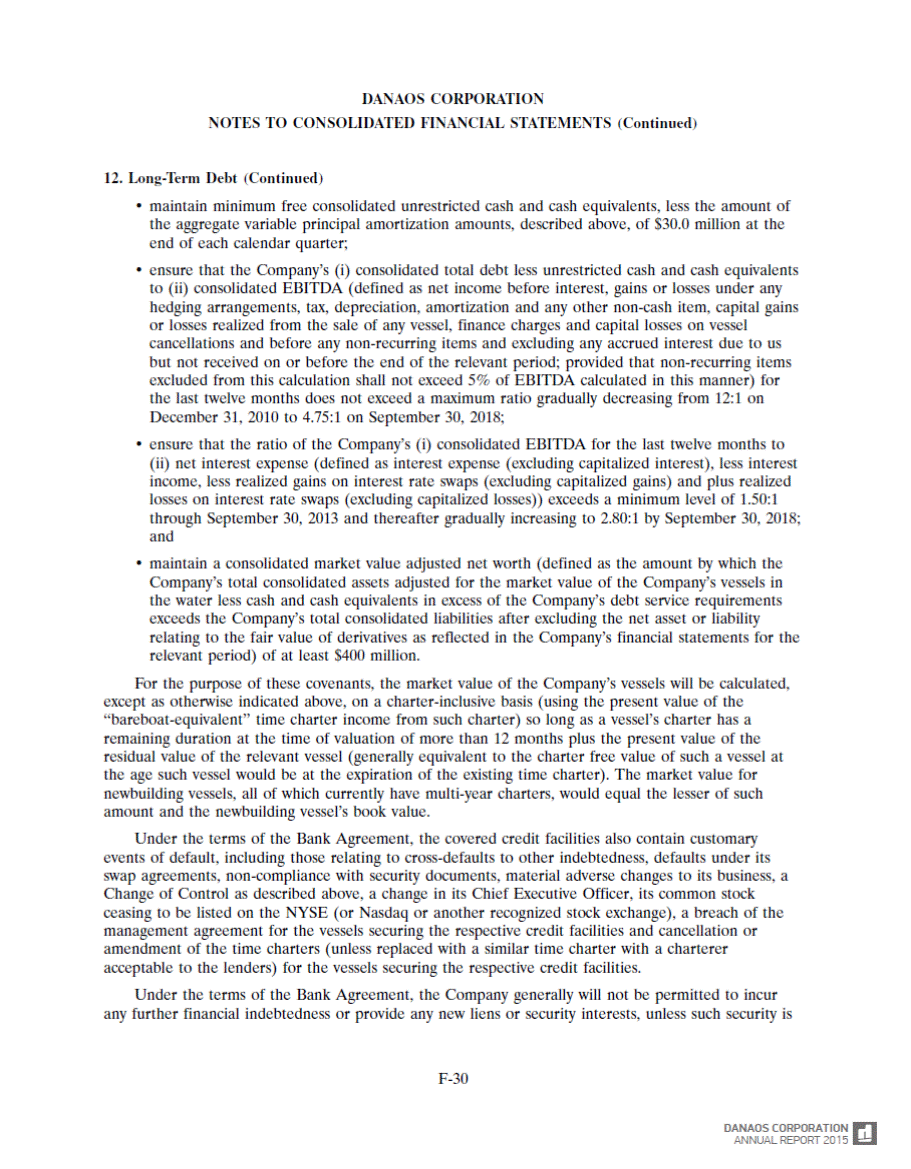
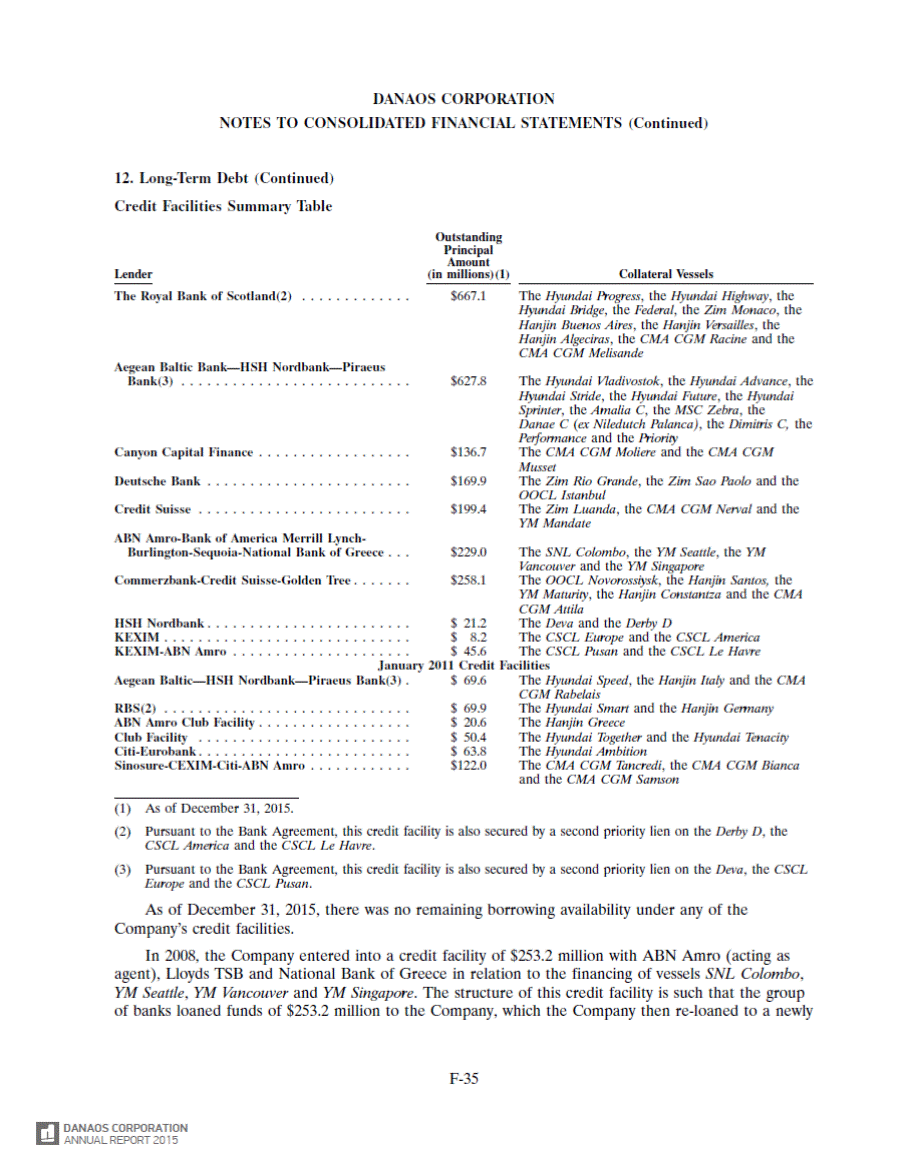
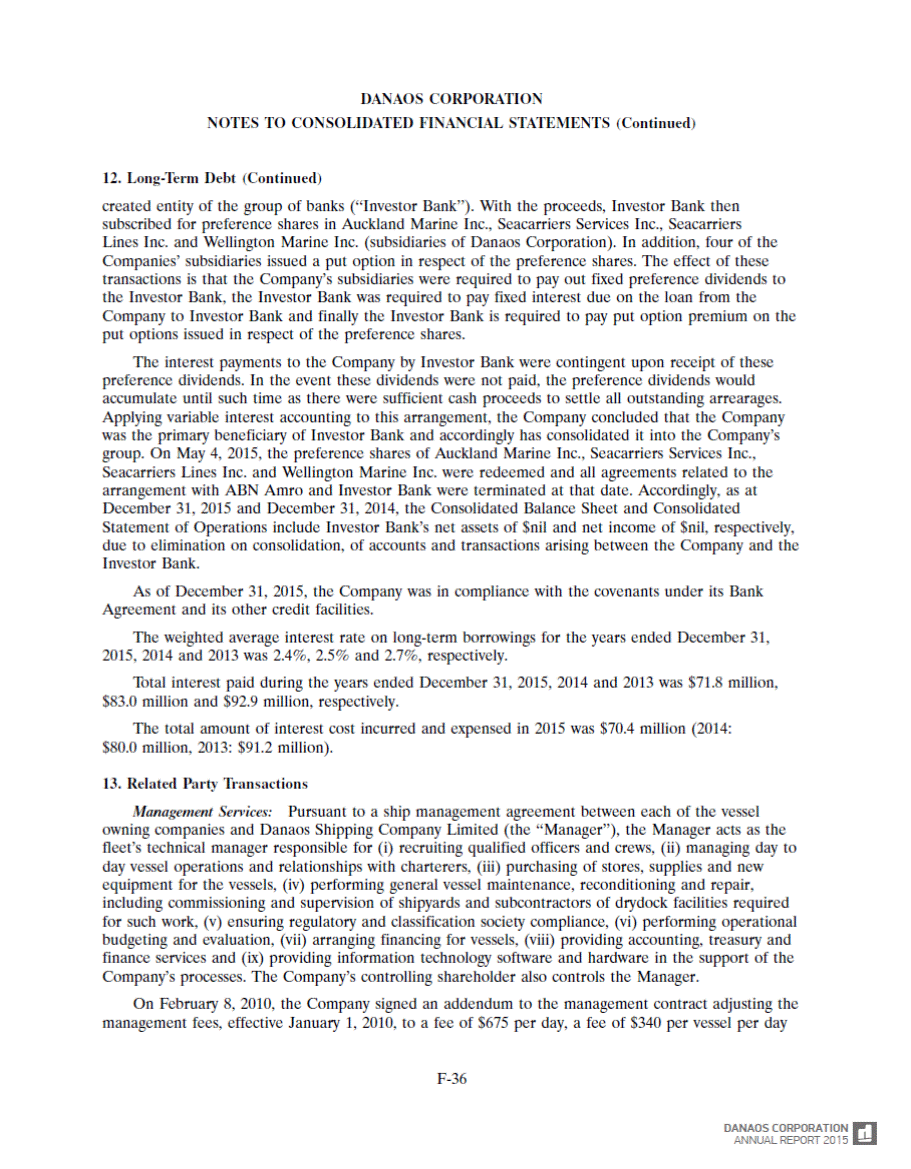
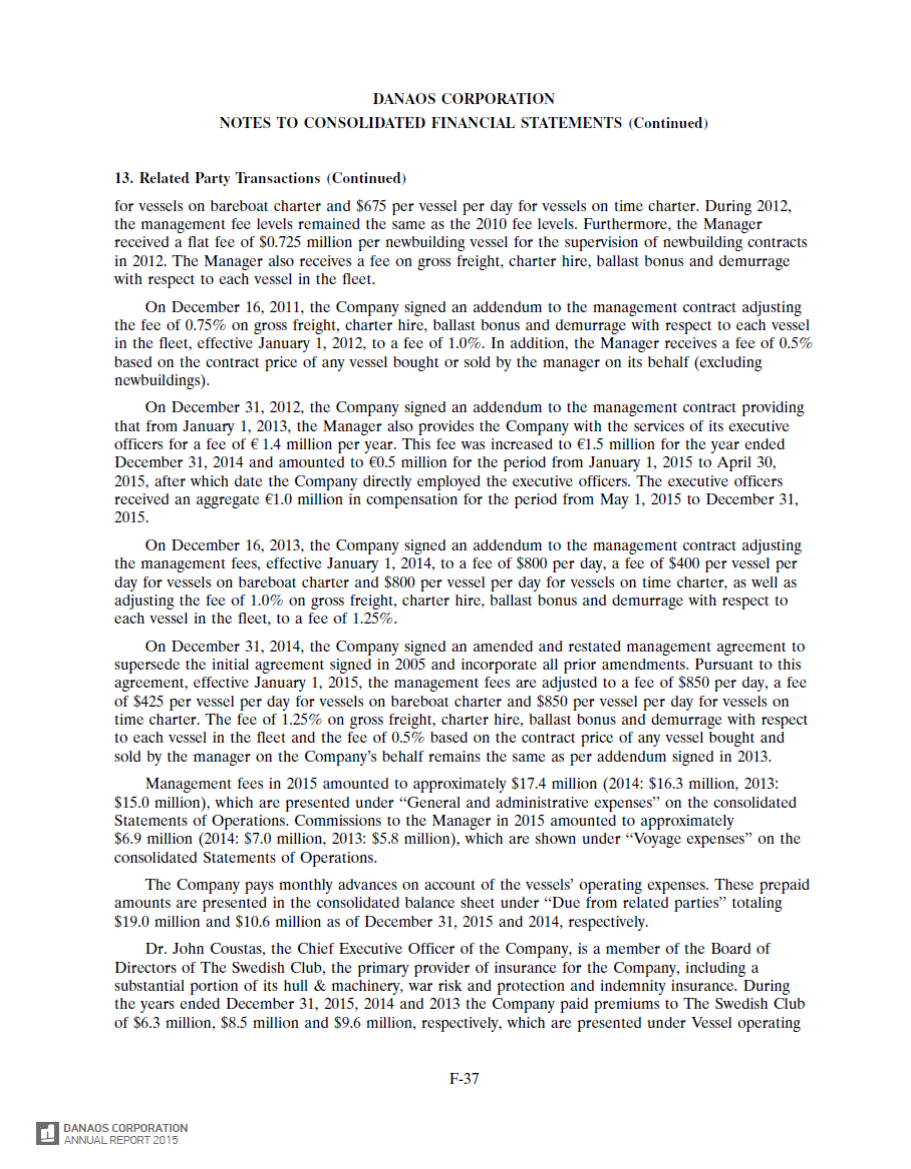
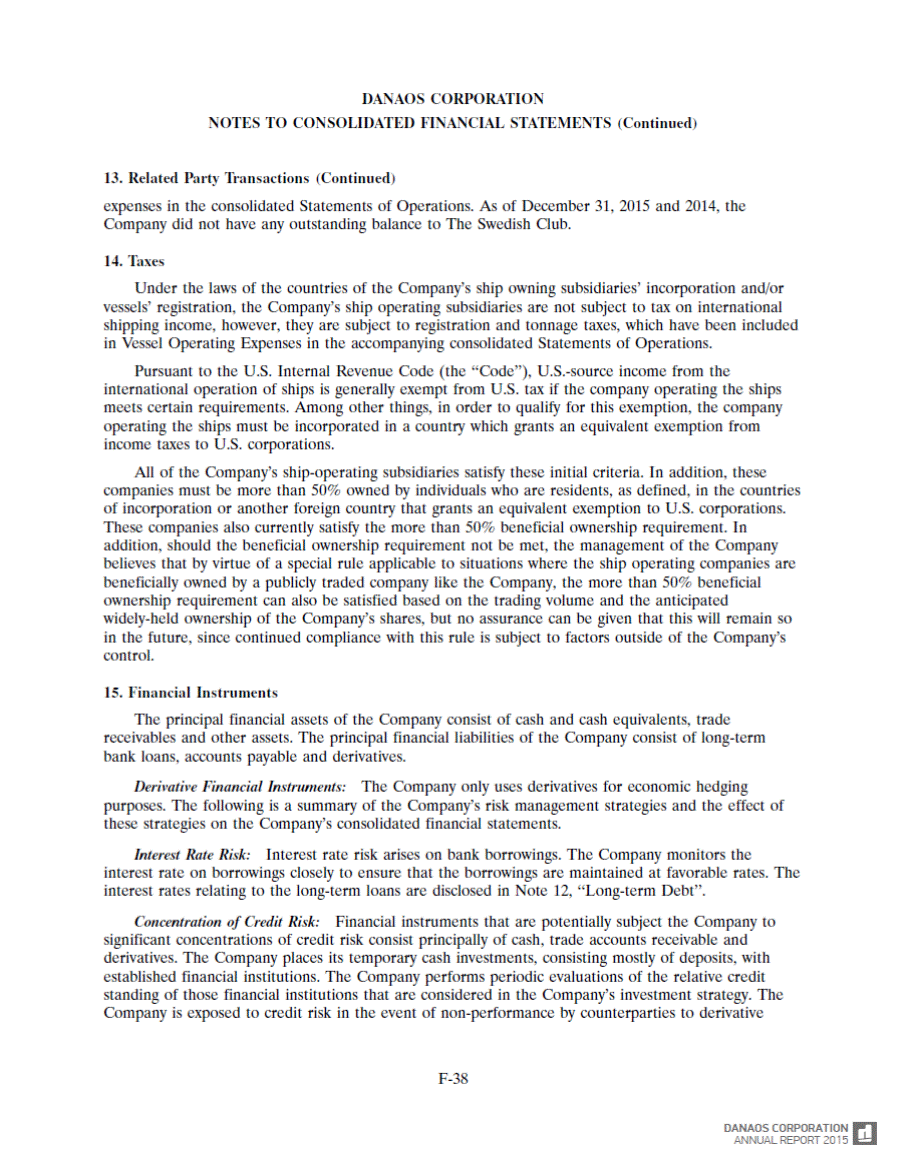
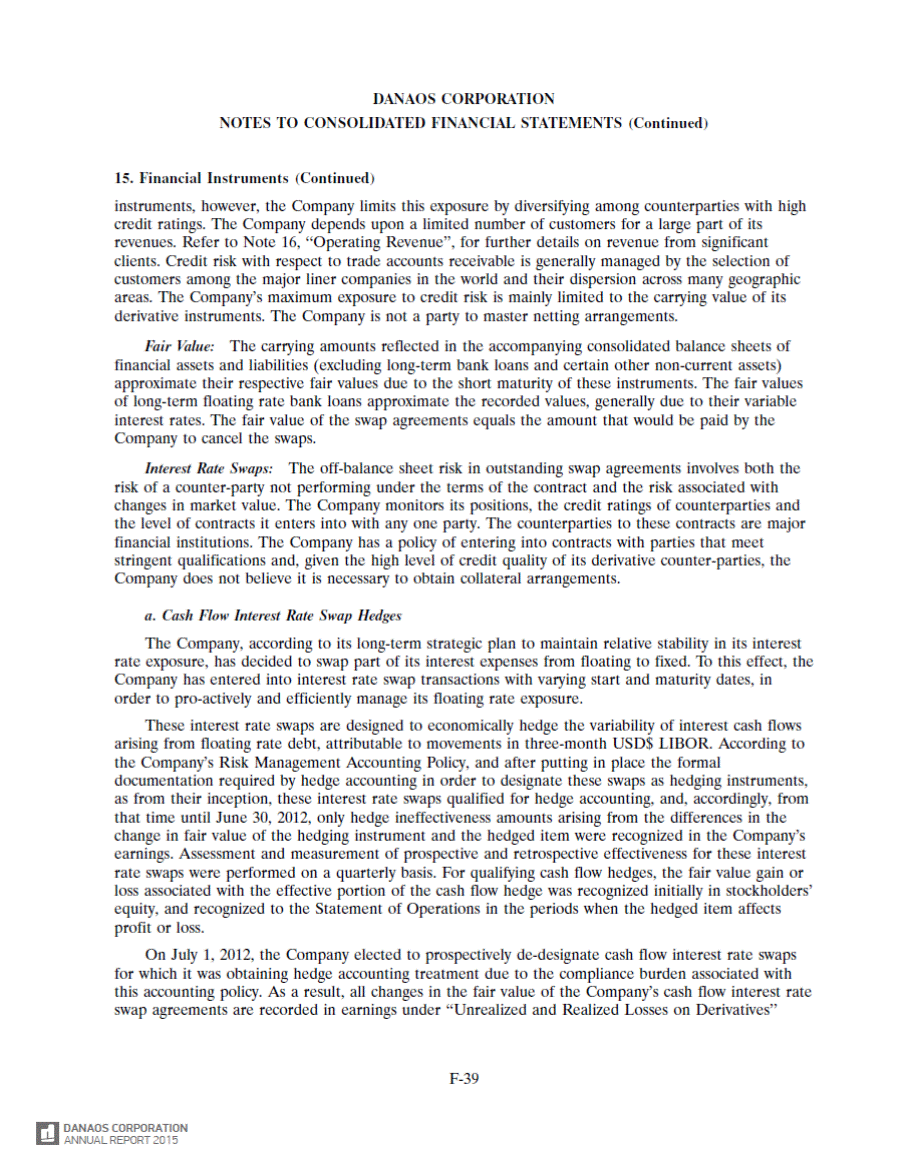
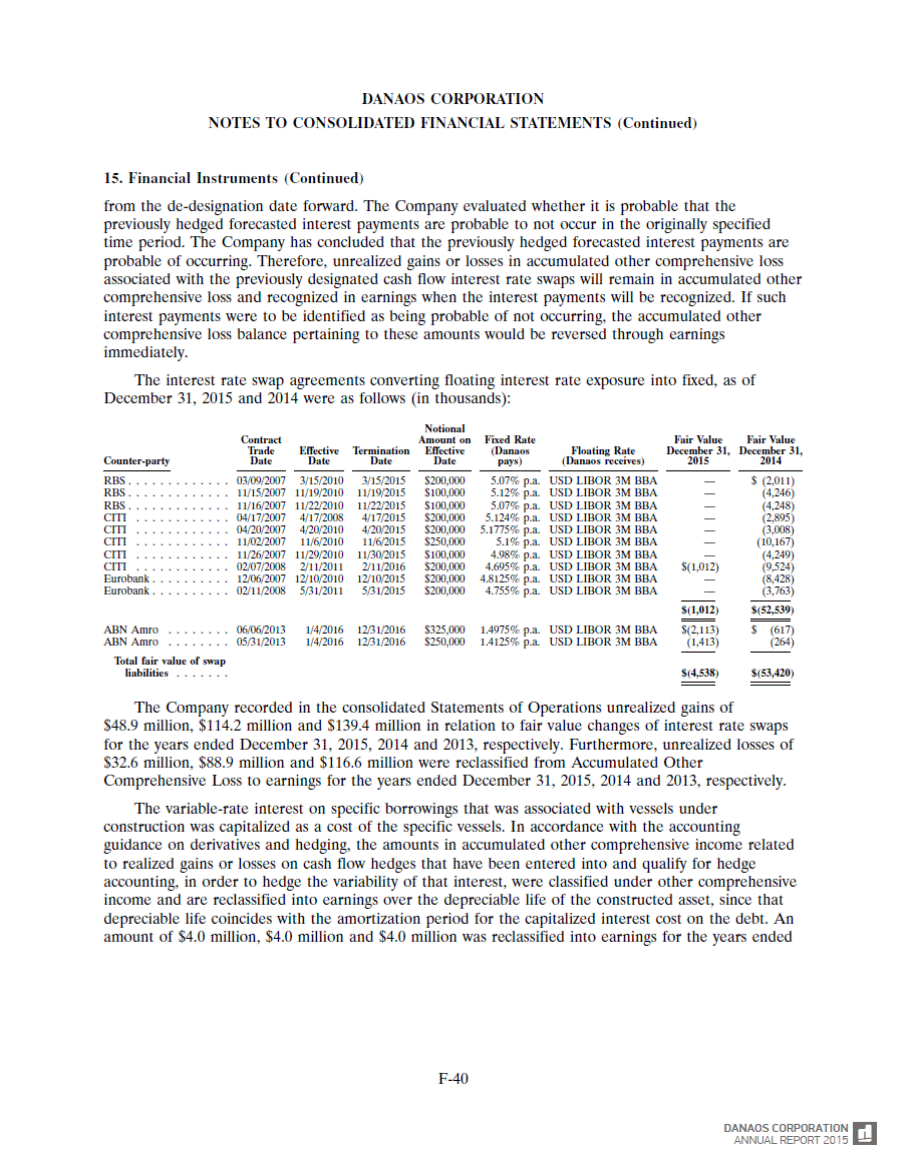
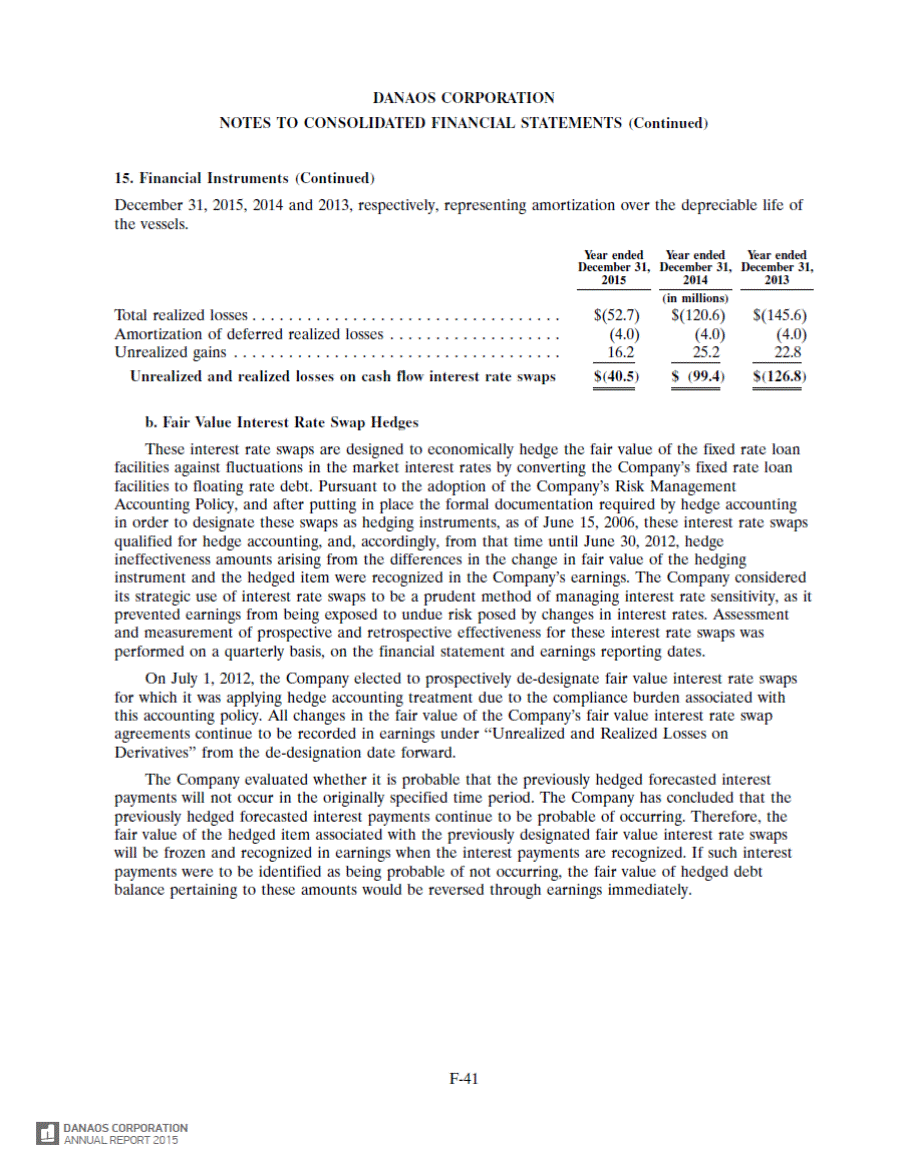
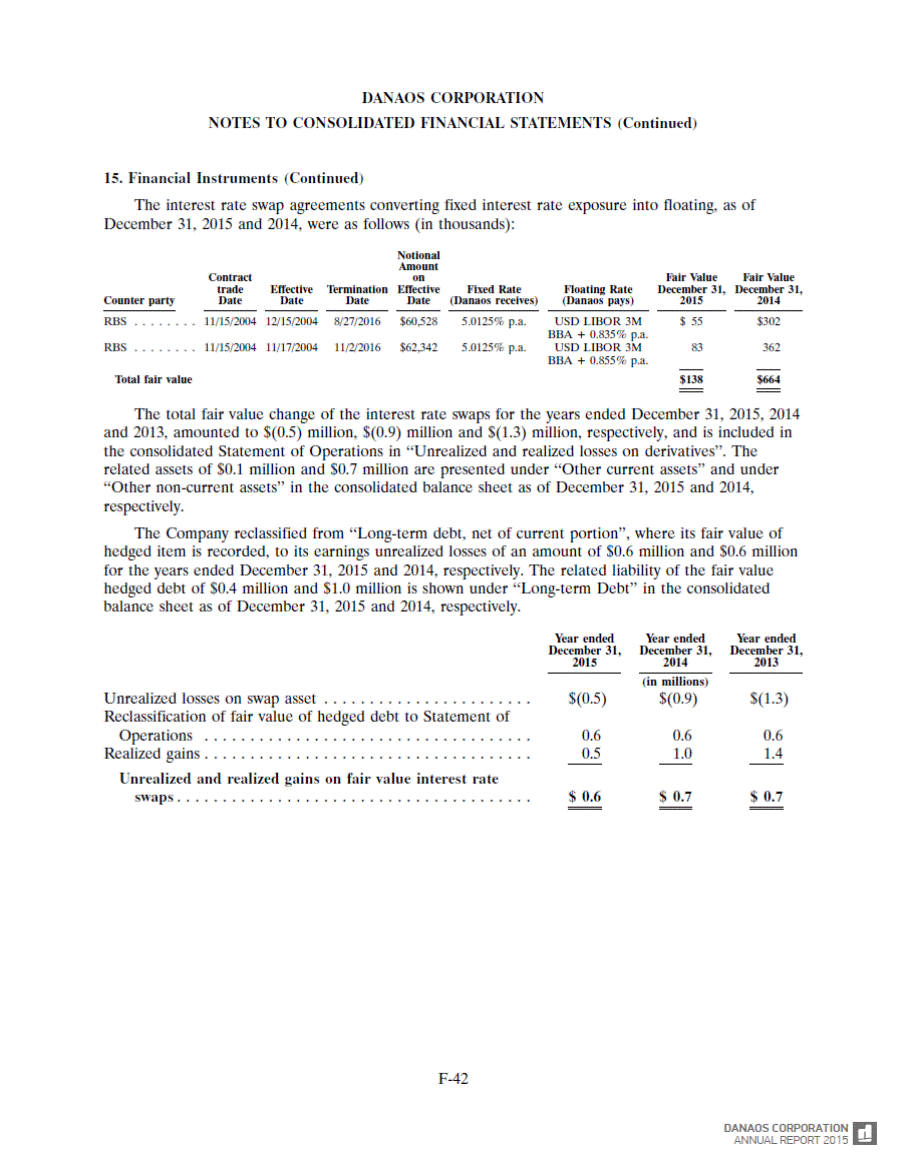
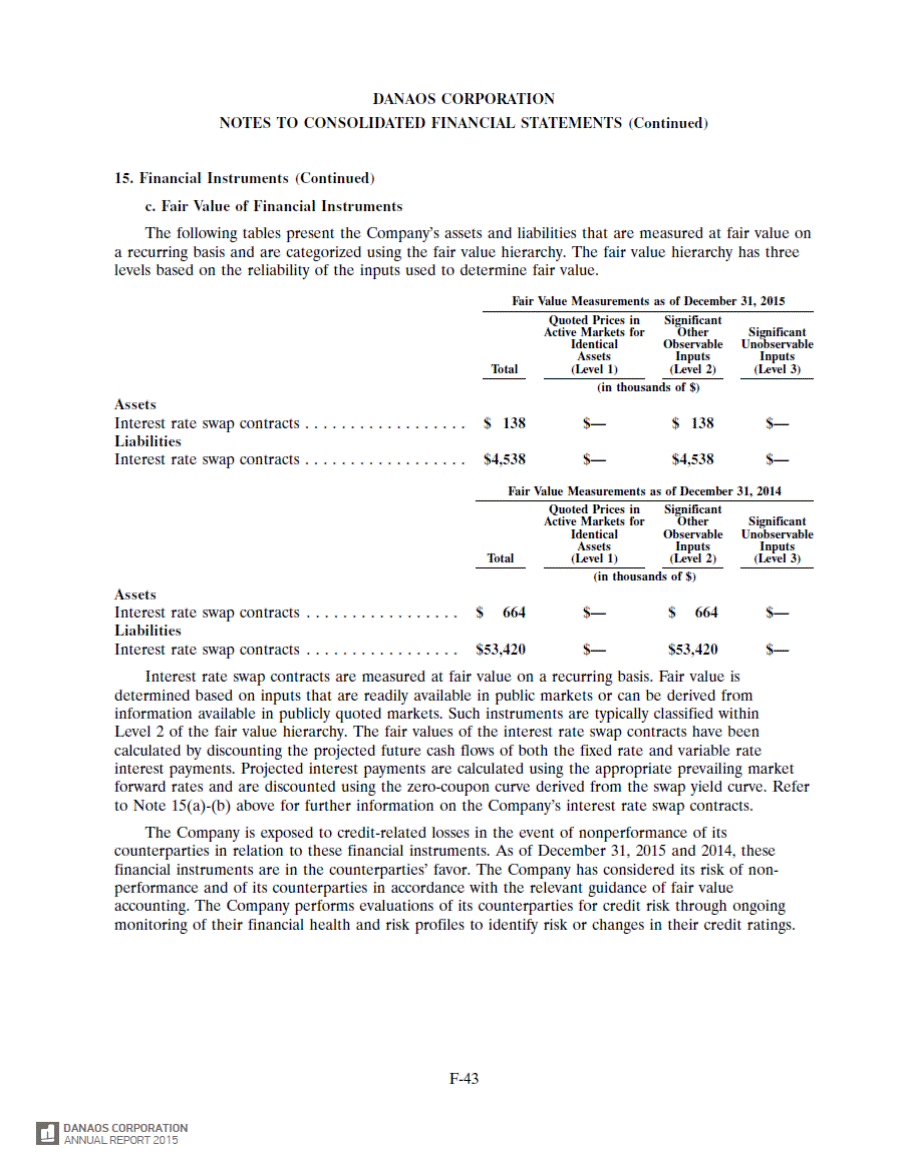
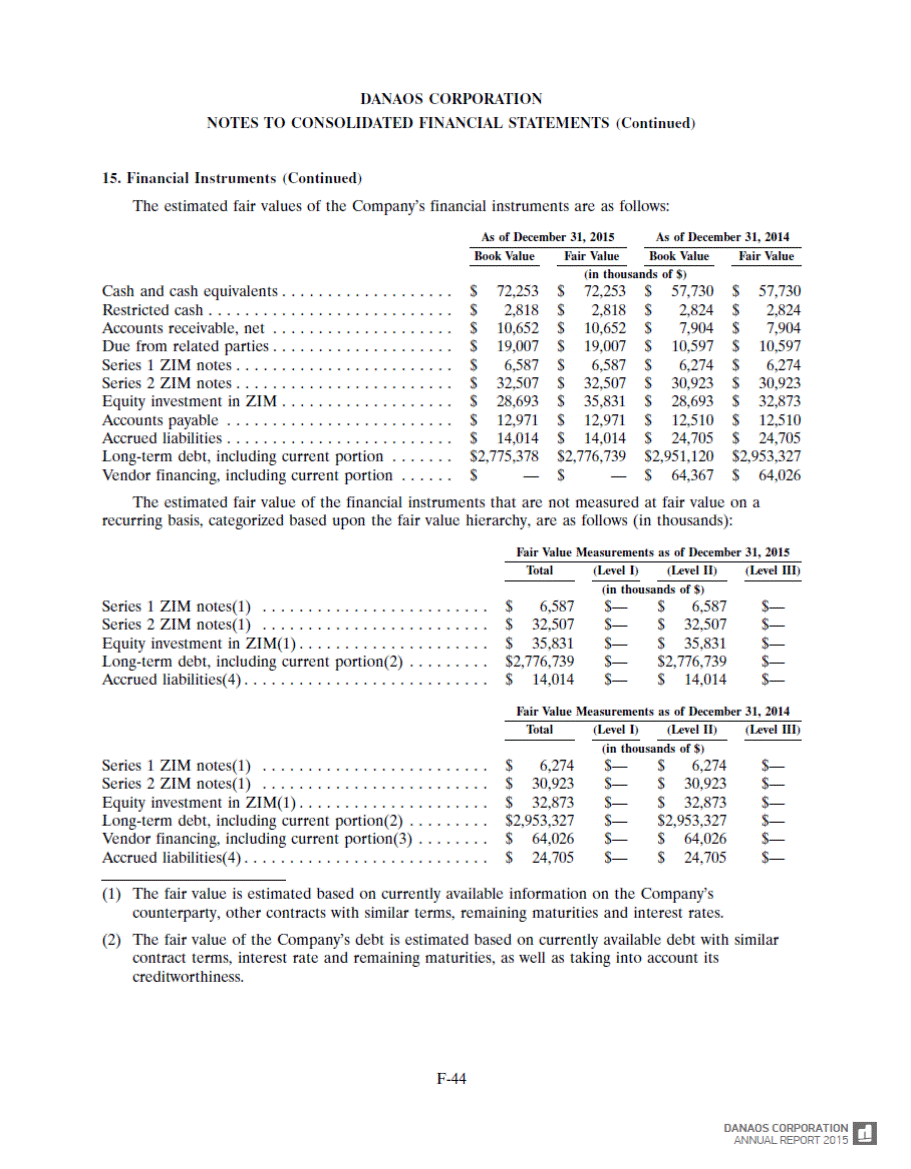
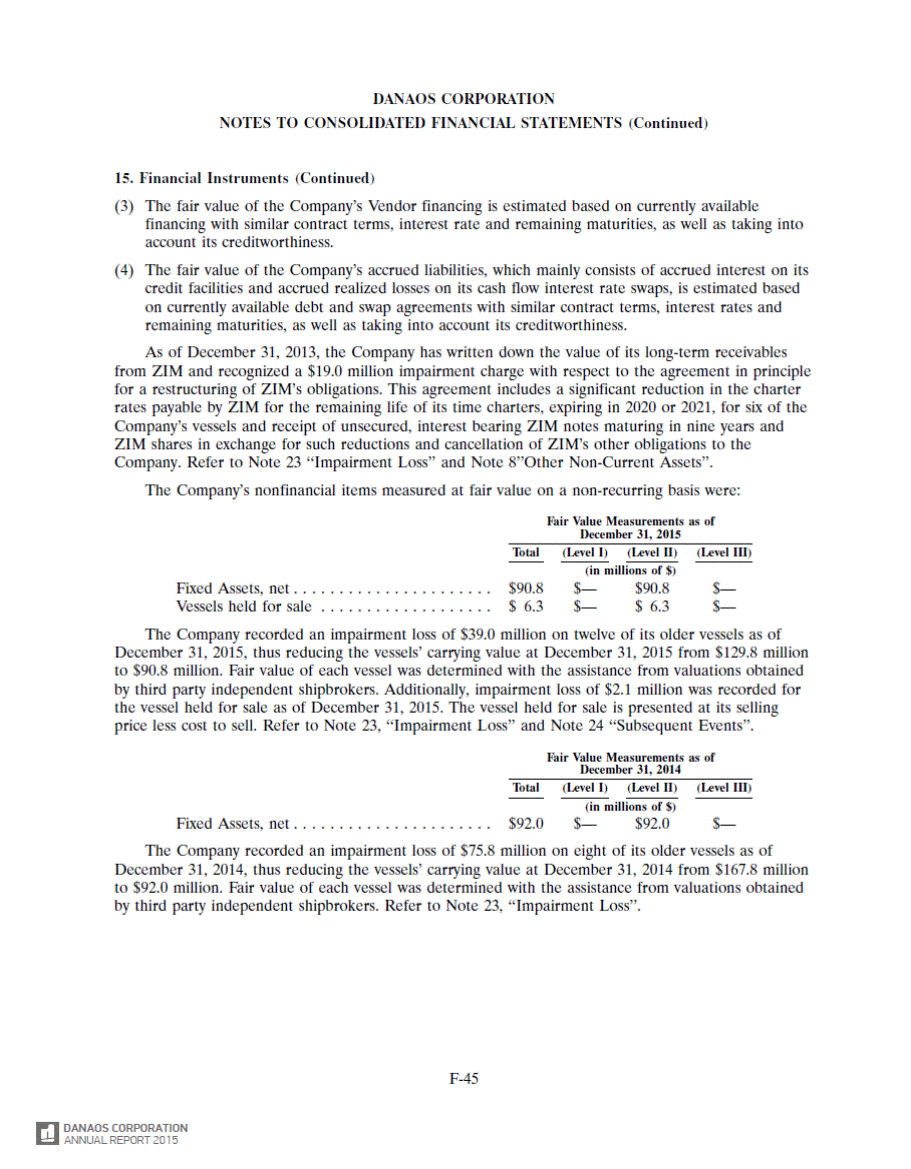
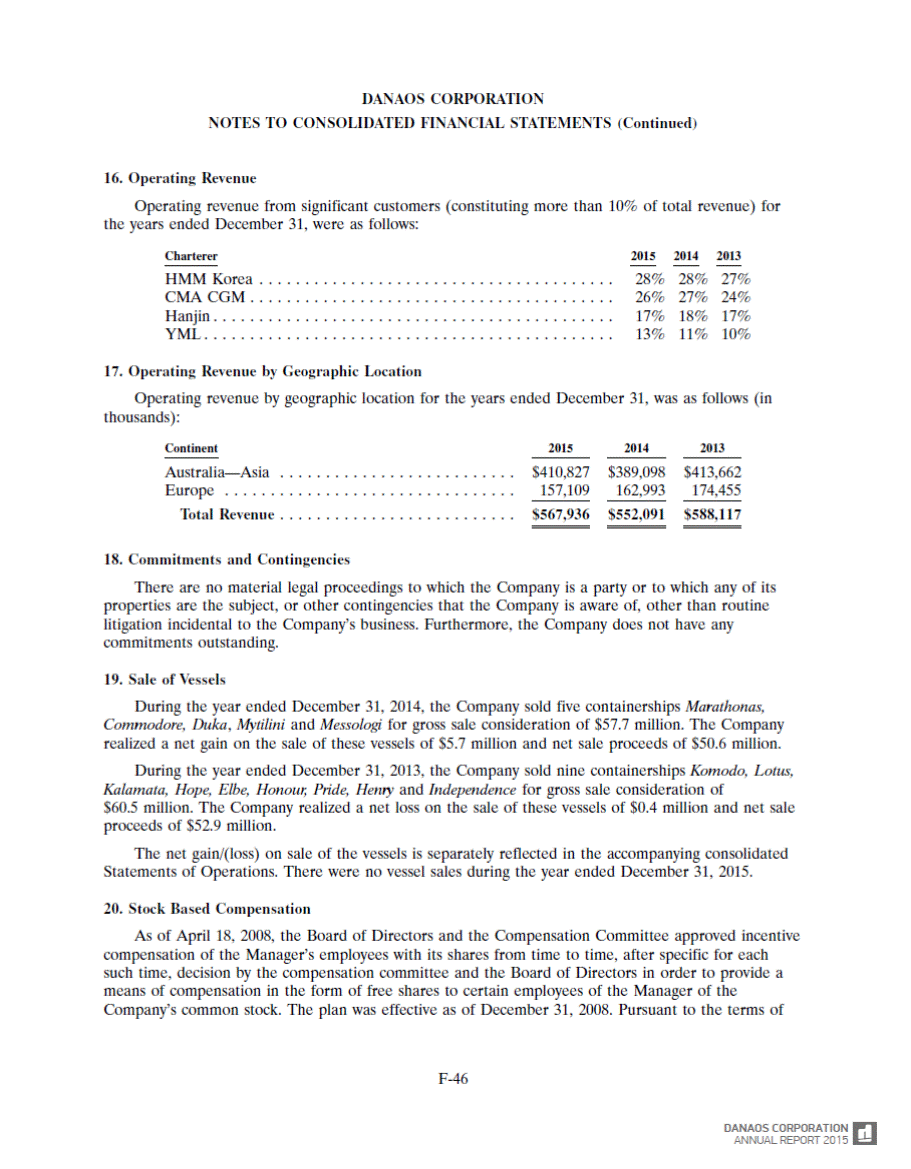
consolidated balance sheets at December 31, 2015 and 2014, together with the notes thereto, are included in ‘‘Item 18. Financial Statements’’ and should be read in their entirety. Year Ended December 31, 2015 2014 2013 2012 2011 In thousands, except per share amounts and other data STATEMENT OF OPERATIONS Operating revenues . . . . . . . . . . . . . . . . . . . . Voyage expenses . . . . . . . . . . . . . . . . . . . . . . Vessel operating expenses . . . . . . . . . . . . . . . . Depreciation . . . . . . . . . . . . . . . . . . . . . . . . Amortization of deferred drydocking and special survey costs . . . . . . . . . . . . . . . . . . . . . . . . Impairment loss . . . . . . . . . . . . . . . . . . . . . . General and administrative expenses . . . . . . . . Gain/(loss) on sale of vessels . . . . . . . . . . . . . . Income from operations . . . . . . . . . . . . . . . Interest income . . . . . . . . . . . . . . . . . . . . . . Interest expense . . . . . . . . . . . . . . . . . . . . . . Other finance expenses . . . . . . . . . . . . . . . . . Equity loss on investments . . . . . . . . . . . . . . . Other (expenses)/income, net . . . . . . . . . . . . . Unrealized and realized losses on derivatives . . . Total other expenses, net . . . . . . . . . . . . . . . . Net income/(loss) . . . . . . . . . . . . . . . . . . . . PER SHARE DATA Basic and diluted net income/(loss) per share of common stock . . . . . . . . . . . . . . . . . . . . . . Basic and diluted weighted average number of shares . . . . . . . . . . . . . . . . . . . . . . . . . . . CASH FLOW DATA Net cash provided by operating activities . . . . . . Net cash (used in)/provided by investing activities . . . . . . . . . . . . . . . . . . . . . . . . . . Net cash (used in)/provided by financing activities . . . . . . . . . . . . . . . . . . . . . . . . . . Net increase/(decrease) in cash and cash equivalents . . . . . . . . . . . . . . . . . . . . . . . . BALANCE SHEET DATA (at year end) Total current assets . . . . . . . . . . . . . . . . . . . . Total assets . . . . . . . . . . . . . . . . . . . . . . . . . Total current liabilities, including current portion of long-term debt . . . . . . . . . . . . . . . . . . . . Current portion of long-term debt . . . . . . . . . . Current portion of Vendor financing . . . . . . . . Long-term debt, net of current portion . . . . . . . Vendor financing, net of current portion . . . . . . Total stockholders’ equity . . . . . . . . . . . . . . . . Common stock (shares outstanding) . . . . . . . . . Common stock at par value . . . . . . . . . . . . . . OTHER DATA Number of vessels at period end . . . . . . . . . . . TEU capacity at period end . . . . . . . . . . . . . . Ownership days . . . . . . . . . . . . . . . . . . . . . . Operating days . . . . . . . . . . . . . . . . . . . . . . . $ 567,936 (12,284) (112,736) (131,783) $ 552,091 (12,974) (113,755) (137,061) $ 588,117 (11,770) (122,074) (137,414) $ 589,009 (13,503) (123,356) (143,938) $ 468,101 (10,765) (119,127) (106,178) (3,845) (41,080) (21,831) — (4,387) (75,776) (21,442) 5,709 (5,482) (19,004) (19,458) (449) (6,070) (129,630) (20,379) 830 (5,800) — (21,028) — 244,377 192,405 272,466 152,963 205,203 3,419 (70,397) (18,696) (1,941) 111 (39,857) 1,703 (79,980) (19,757) 2,210 (91,185) (20,120) 1,642 (87,340) (18,107) 1,304 (55,124) (14,581) 422 (98,713) 302 (126,150) 811 (155,173) (1,986) (121,379) (127,361) (196,325) (234,943) (258,167) (191,766) $ 117,016 $ (3,920) $ 37,523 $ (105,204) $ 13,437 $ 1.07 $ (0.04) $ 0.34 $ (0.96) $ 0.12 109,785 109,676 109,654 109,613 109,045 $ 271,676 $ 192,181 $ 189,025 $ 166,558 $ 59,492 (13,292) 11,437 6,087 (369,789) (644,593) (243,861) (214,041) (182,587) 207,497 406,628 14,523 (10,423) 12,525 4,266 (178,473) $ 127,570 3,697,103 $ 103,073 3,851,192 $ 126,866 4,066,552 $ 98,673 4,212,045 $ 93,291 3,988,104 312,145 269,979 — 2,505,399 — 841,914 109,782 1,098 328,082 178,116 46,530 2,773,004 17,837 688,149 109,669 1,097 369,888 146,462 57,388 2,965,641 64,367 598,476 109,653 1,097 365,252 125,076 57,388 3,097,472 121,754 440,304 109,604 1,096 231,693 41,959 10,857 2,960,288 54,288 442,535 109,564 1,096 56 334,239 20,440 20,239 56 334,239 20,406 19,905 59 345,179 22,257 20,784 64 363,049 22,910 21,297 59 291,149 20,053 19,576 In the first quarter of 2009, our board of directors decided to suspend the payment of further cash dividends as a result of market conditions in the international shipping industry. Our payment of dividends is subject to the discretion of our Board of Directors. Our loan agreements and the 3 DANAOS CORPORATION ANNUAL REPORT 2015
