 Sagent Pharmaceuticals 32 nd Annual J.P. Morgan Healthcare Conference January 15, 2014 A Global Pharmaceutical Company Exhibit 99.1 |
 2 Disclaimer The following information contains, or may be deemed to contain, “forward-looking statements” (as defined in and made pursuant to the safe harbor provisions of the U.S. Private Securities Litigation Reform Act of 1995). Most forward-looking statements contain words that identify them as forward-looking, such as “may”, “plan”, “seek”, “will”, “expect”, “intend”, “estimate”, “anticipate”, “believe”, “project”, “opportunity”, “target”, and “continue” or other words that relate to future events, as opposed to past or current events. By their nature, forward-looking statements are not statements of historical facts and involve risks and uncertainties because they relate to events and depend on circumstances that may or may not occur in the future. These statements give our current expectation of future events or our future performance and do not relate directly to historical or current events or our historical performance. As such, our future results may vary from any expectations or targets expressed in, or implied by, the forward looking statements included in this presentation, possibly to a material degree. We cannot assure you that the assumptions made in preparing any of the forward-looking statements will prove accurate or that any performance targets will be realized. We expect that there will be differences, which could be significant, between performance targets and actual results. All forward-looking statements included in this presentation speak only as of the date made, and we undertake no obligation to update or revise publicly any such forward-looking statements, whether as a result of new information, future events, or otherwise. In particular, we caution investors not to place undue weight on certain forward-looking statements pertaining to potential growth opportunities or performance targets set forth herein. Actual results may vary significantly from these statements. For a discussion of some of the important factors that could cause our results to differ materially from those expressed in, or implied by, the forward-looking statements included in this presentation, investors should refer to our risk factors, as they may be amended from time to time, set forth in our Quarterly Report on Form 10-Q filed with the SEC on August 6, 2013. This presentation includes a discussion of certain non-GAAP financial measures. Please refer to the appendix to this presentation for further definition of these measures and a of such non-GAAP measures to the most closely comparable GAAP measures. |
 3 Investment Highlights • Fastest growing Generic Injectable company in U.S. Market , a consolidating industry with high barriers to entry • Extensive global partner network with state-of-the-art facilities enabling accelerated growth relative to conventional start-ups • Solid relationships at all levels of the supply chain enhance responsiveness to industry demands • Vertical integration through acquisition of SCP complements partnering model, as well as provides additional growth opportunities and a footprint in China • Exceptional quality and safety track record; global excellence in manufacturing • Strong sequential margin and revenue growth driven by diverse and deep product portfolio • Experienced management team with great track record, has delivered on product approvals and financial performance |
 4 Track Record of Success • Jeffrey Yordon, Founder, CEO and Chairman – Formerly COO and President of APP; held senior positions with LyphoMed, YorPharm, Gensia and Faulding – Expert in China and India pharmaceutical industries – 43 years experience in injectable pharmaceuticals; including leading four successful injectable start-ups Unique Business Model with Strong Track Record Sagent Pharmaceuticals has revolutionized the way injectable generic drugs are produced and delivered. Our ground-breaking business model is changing the industry dynamic and providing access to a wide range of critical drugs when and how our customers need it most. As a result, we can satisfy the demands of today and anticipate the needs of tomorrow. Key Highlights • Track record of strong performance on product launches, ANDA approvals and ANDA submissions • Extensive pipeline with 69 ANDAs pending approval or launch (1) • 53 marketed products, 144 presentations (1) • Indications: anti-infective, oncolytic and critical care • Presentations: single and multi-dose vials, pre-filled ready-to-use syringes and premix bags (1) As of December 31, 2013 |
 5 Corporate Evolution Company founded in 2006 • Built upon long-standing expertise and experience in Generic Injectables • Virtual model based upon global network of strong partner relationships • Product development focused on high volume, low margin opportunities to build scale 2006 2010 Sales of $74 million in 2010, including addressing the market shortage in Heparin 2011 2012 Launched 16 new products, driving nearly break-even operating performance in the fourth quarter 2013 Completed a successful IPO and listed on NASDAQ in April 2011 2014 Formal guidance to be provided Mid February, 2014 • Estimated launch of 10 - 15 products • Continued investment in SCP to support product development initiatives and capacity expansion • Market consolidation driving increased partnering opportunities and accelerated investment in product development • FDA timelines impact approval timelines Revised revenue guidance of $230MM - $250MM • YTD reported adjusted margins exceed long-term targets, validating P&L leverage • Vertical Integration capabilities supplementing virtual base model via consolidation of SCP facility • Launched 12 new products, including Zoledronic Acid at market formation • Completed a successful secondary offering in September 2013 to support SCP investment, pipeline development and business development activity |
 6 Extensive Global Partner Network Sagent’s Fundamental Initiative with Partners • Quality – Facility Support, cGMP training, audit assistance and integration of Sagent System • Regulatory – Submission and Compliance Expertise and become Regulatory Agent for partner • Sales/Marketing/Distribution – Ability to navigate the complex US distribution network and in the future others Industry Consolidation has accelerated the rate of partnering opportunities to a level never experienced in our history |
 Sagent Pharmaceuticals Strategic Growth Drivers A Global Pharmaceutical Company |
 8 Drivers of Long-Term Growth Strong Industry Dynamics Deep Development Pipeline Investing For the Future Growing Product Portfolio Industry Leading Sales Organization |
 9 New Significant Initiative Strong Industry Dynamics Several significant macro economic and industry factors are driving demand and shaping opportunity for Sagent Pharmaceuticals Drug Shortage Crisis • U.S has had as many as 300 drug shortages annually – 82% of hospitals have delayed patient treatment as a result of a shortage – 63% of hospitals were unable to provide recommended treatment • The vast majority of these shortages are injectable products • Reasons contributing to shortages – 2003 Medicare Act – Limited global capacity, with a dated domestic platform – Industry consolidation – Hoarding – API • Sagent’s Commitment to shortage reduction – Product selection – SCP objectives – Broad global network, providing supply alternatives: Sodium Bicarbonate Generic Market Growth • Generic market to increase by $100 Billion in 5 years – Global market to hit $231 billion by 2017 – Largest opportunity in injectable drugs with annual growth rate 10% Not Price • Growth Statistics per Frost & Sullivan GPOs Hospitals Wholesalers Distributors • Industry consolidation creating vast opportunities • Huge potential in China, India, Russia, Brazil, Turkey and S. Korea – current footprint and business partners |
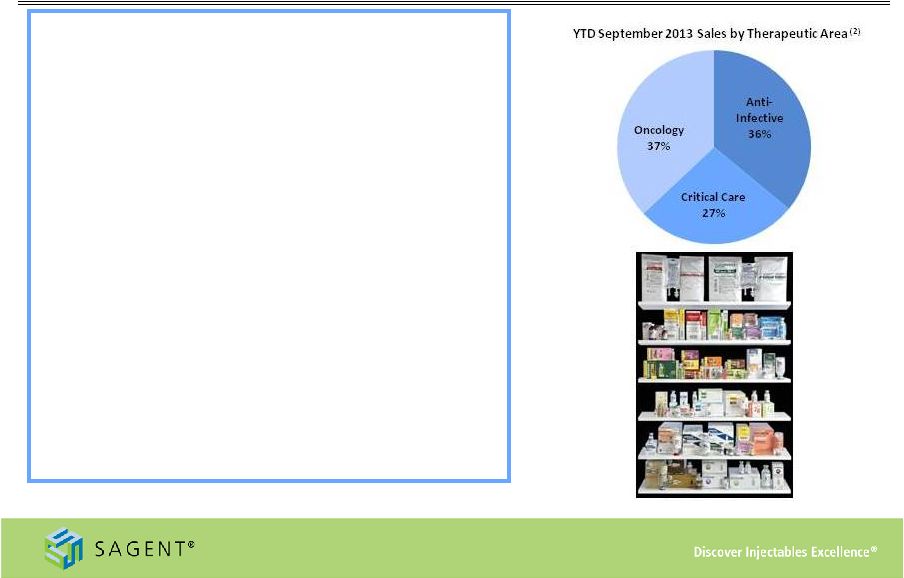 10 Growing Product Portfolio • Diverse marketed products - 53 products/144 SKUs (1) • Key indication areas and products include: – Oncology: Calcium Leucovorin, Docetaxel, Fludarabine, Gemcitabine, Oxaliplatin, Topotecan, Zoledronic Acid – Anti-Infective: Azithromycin, Cefepime, Fluconazole, Levofloxacin, Nafcillin, Oxacillin – Critical Care: Adenosine, Heparin, Propofol, Rocuronium – Filed an additional 12 products in 2013 (2) As of September 30, 2013 (1) As of December 31, 2013 More than 25% of our product portfolio holds the #1 or #2 market position |
 11 Growing Product Portfolio Approximately $6 billion of potential IMS market value in planned launches from 2013 through 2016 |
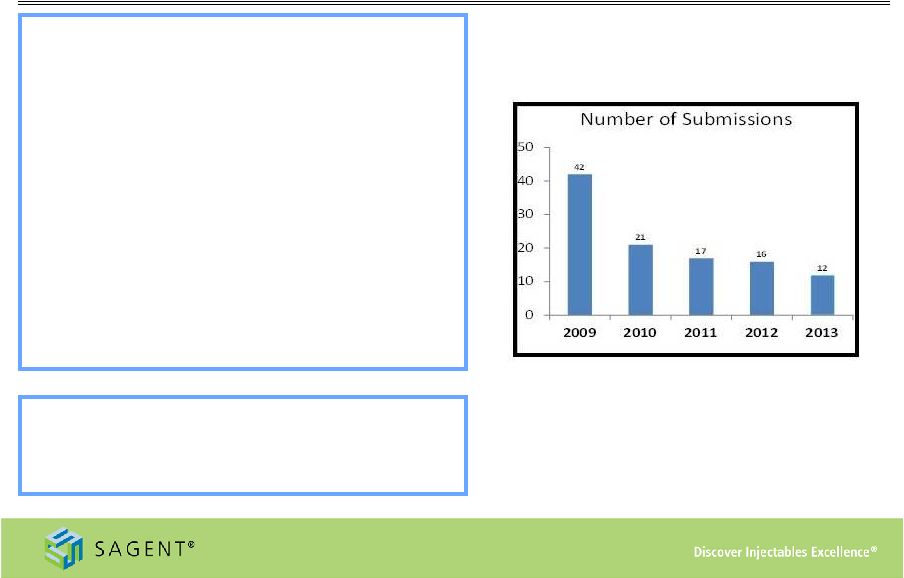 12 Deep Development Pipeline • New product pipeline includes 39 products, represented by 69 ANDAs (1) • Sagent currently has two approved products represented by seven ANDAs pending commercial launch (1) • 10 to 15 product launches expected in FY’14 (1) As of December 31, 2013 Sagent’s ANDA Submission Rate An additional 24 products represented by 41 ANDAs under initial development (1) |
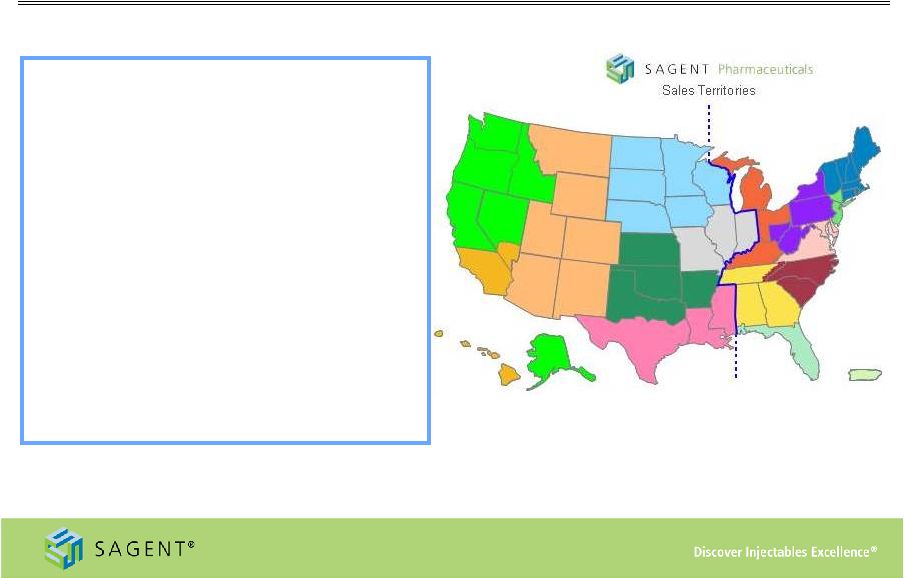 13 Industry Leading Sales Organization • 34 person sales and marketing team – Average tenure of sales representatives is about 25 years in same geographic location – Contracting professionals have an average of approximately 30 years experience • Customer relationships are a key strength – Management and key executives hold long-standing relationships with key GPO, distributor and wholesaler decision-makers |
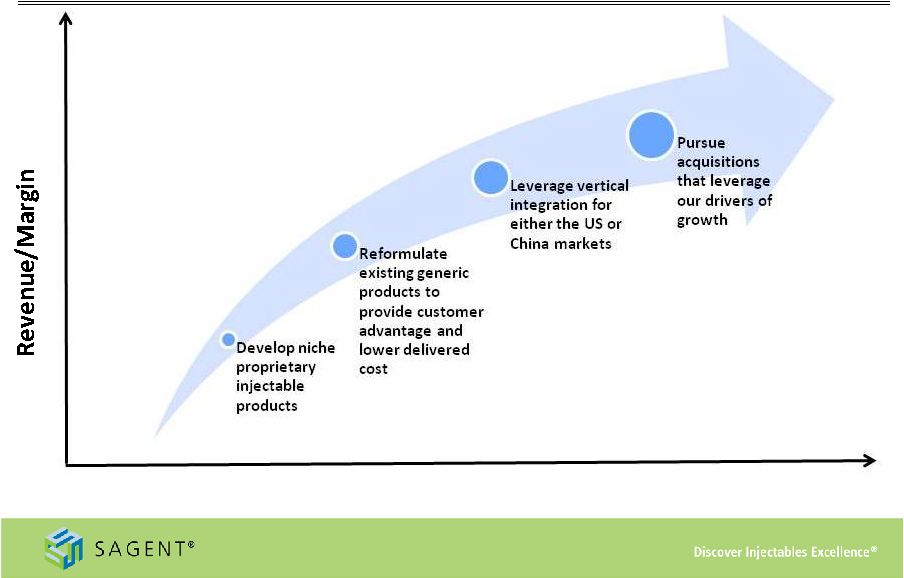 14 Investing for the Future Portfolio Breadth |
 Sagent Pharmaceuticals Recent Developments A Global Pharmaceutical Company |
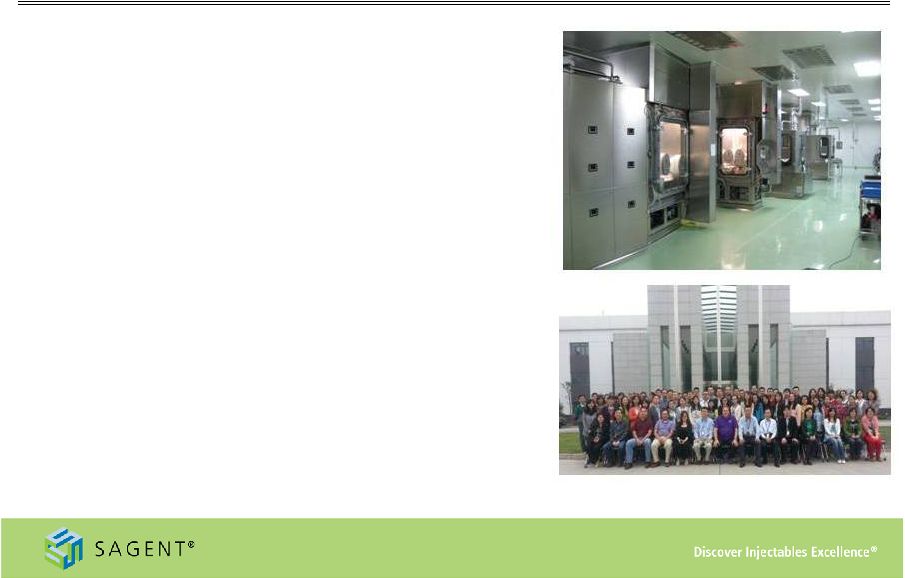 16 Sagent China Pharmaceuticals (SCP) Vertical Integration • Completed the acquisition of our partner’s 50% interest in KSCP for $25 million, in June of 2013. Payable in installments through September 2015 – State-of-the-art isolation technology for aseptic filing – FDA and current Good Manufacturing Practices compliant facility – Facility received EIR in the first half of 2013; first product launched in November – Multiple products developed and filed from SCP in 2013 • Provides for increased responsiveness to drug shortages: SGNT controls its own products • Pursuing additional investment in product development and capacity expansion – $12 - $16 million annual operating costs – $30 - $35 million capital expansion in final stages of development, high speed isolator technology |
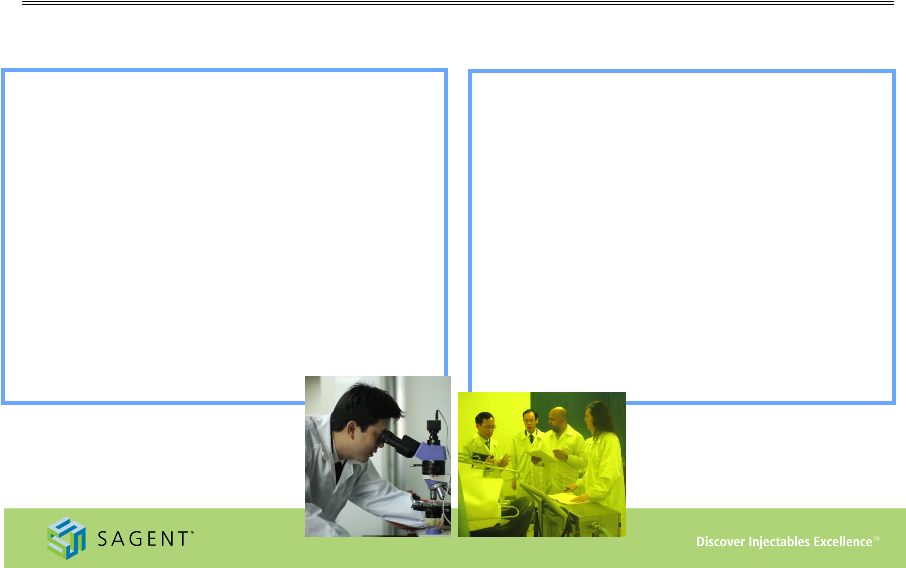 Sagent China Pharmaceuticals (SCP) Key Initiatives • Develop injectable formulations for the US and domestic Chinese markets • Focus on developing and formulating niche products and complex molecules • Housed in a leading Science and Technology Center in Chengdu, China • Positions SCP as a local thought leader and long-term positioning to enter domestic market • Expected to be 2 largest pharmaceutical market by 2015 • Market growth driven by increasing demand in cities and counties and growth of the middle class • Demand for high quality drugs growing and price is aligning with developed markets • Regulatory pathway evolving Global Development Center China Pharma Market nd |
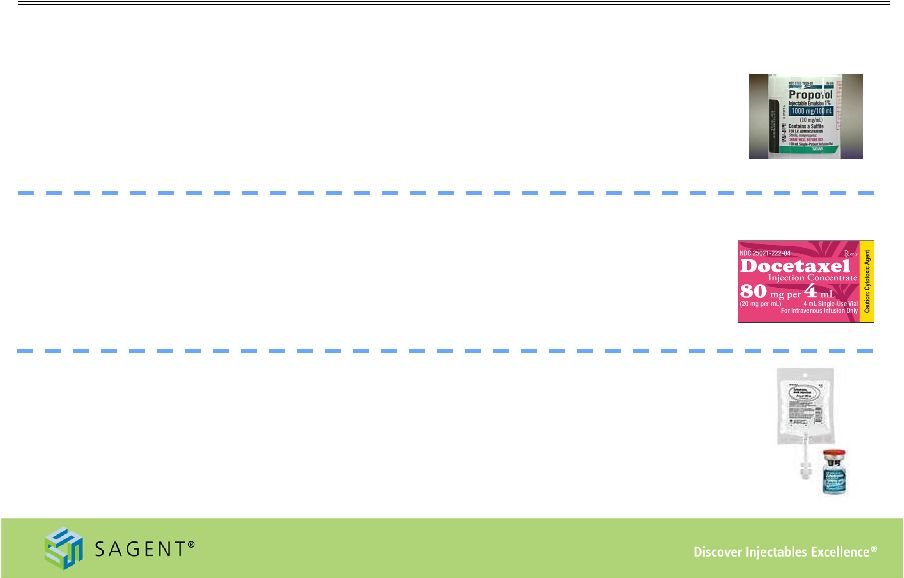 18 Key Products Driving Growth Recent launches • Propofol – Launched three single-dose, single-patient vial presentations in 2013 in 20mL, 50 mL and 100mL sizes – Market is approximately $230 million, based on IMS data, with limited number of competitors – Product is highly valued by our customers and has experienced intermittent shortages over the last few years • Docetaxel – Launched in August 2013 – Market is approximately $330 million, based upon November 2013 IMS data, with limited number of competitors – Received early FDA approval in anticipation of potential market shortages driven by API supply issues • Zoledronic Acid – Launched vials in March 2013 at market formation, followed by 4mg and 5mg pre-mixed bags in second half 2013 – Market is approximately $600 million, based upon November 2013 IMS data with continued price erosion – Multiple presentation strategy demonstrates the strength of Sagent’s model |
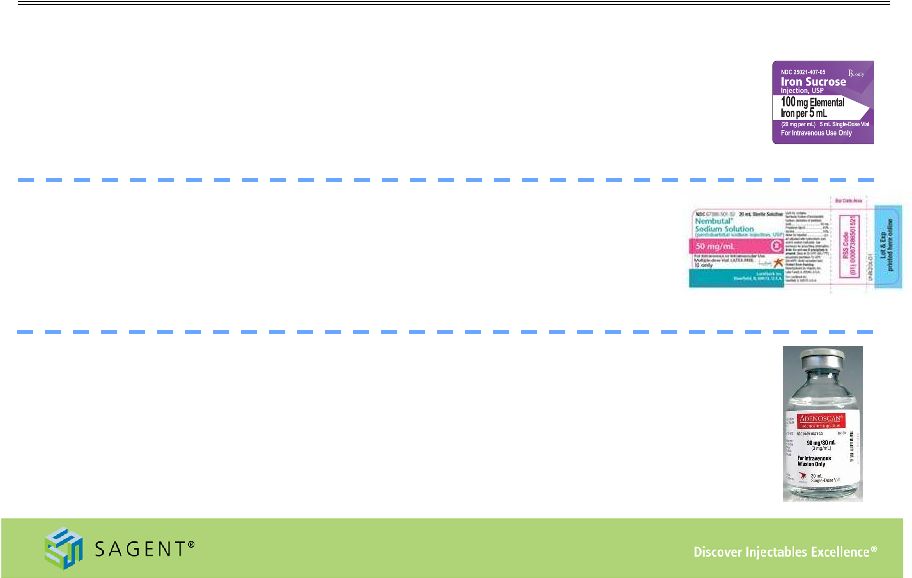 19 Key Products Driving Growth Future launches • Iron Sucrose – Generic form of Venofer® – High barrier to entry for generic manufacturing – Received FDA Complete Response Letter, December 2013. Currently developing comprehensive response, which should be filed first half 2014, 2014 approval unlikely. – Market is approximately $325 million based on November 2013 IMS data • Pentobarbital – Generic form of Nembutal® – High barrier to entry for generic manufacturing, Sagent will be first generic – Anticipate approval in first half of 2014 – Market estimated to be approximately $30 million • Adenosine Injection – Generic form of Adenoscan® – Approved ANDA, launch pending first to file 6 month exclusivity to expire March 2014 – Market is approximately $55 million based on November 2013 IMS data – Sagent sales organization has extensive historical experience with the product |
 20 Strong & Experienced Management Team Excel Rx, Premier, VA Albert Patterson EVP, Nat’l Accts & Corp Dev Michael Logerfo EVP Legal APP, Fujisawa, LyphoMed APP, Fujisawa Landauer, Cardinal Health, KPMG Nanolnk, Ovation Pharmaceuticals, NeoPharm, Physican Quality Care, Bristol Myers Squibb APP, LyphoMed, YorPharm, Gensia, Faulding Jeffrey Yordon CEO and Chairman James Hussey President Jonathon Singer EVP and CFO Lorin Drake Corp VP Sales Ravi Malhotra CSO Flavine Holding Co, Attorney |
 Sagent Pharmaceuticals Financial Highlights A Global Pharmaceutical Company |
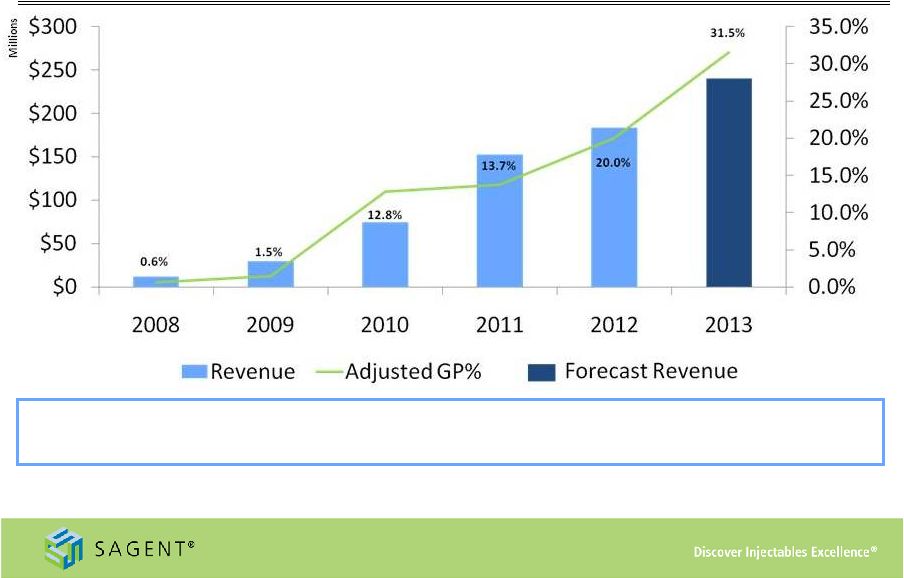 22 Sequential Growth Heparin Topotecan Levofloxacin Gemcitabine Cefepime Azithromycin Oxaliplatin Oxacillin Leucovorin Key Launches •Indicates mid-point of 2013 revenue guidance range; 2013 Adjusted Gross Margin is the midpoint of the guidance range, both as reported in the third quarter earnings release, dated November 5, 2013 •Adjusted Gross Profit is a non-GAAP measure. Please refer to slide #26: Appendix – Non GAAP Reconciliation for further detail. Zoledronic Acid Docetaxel |
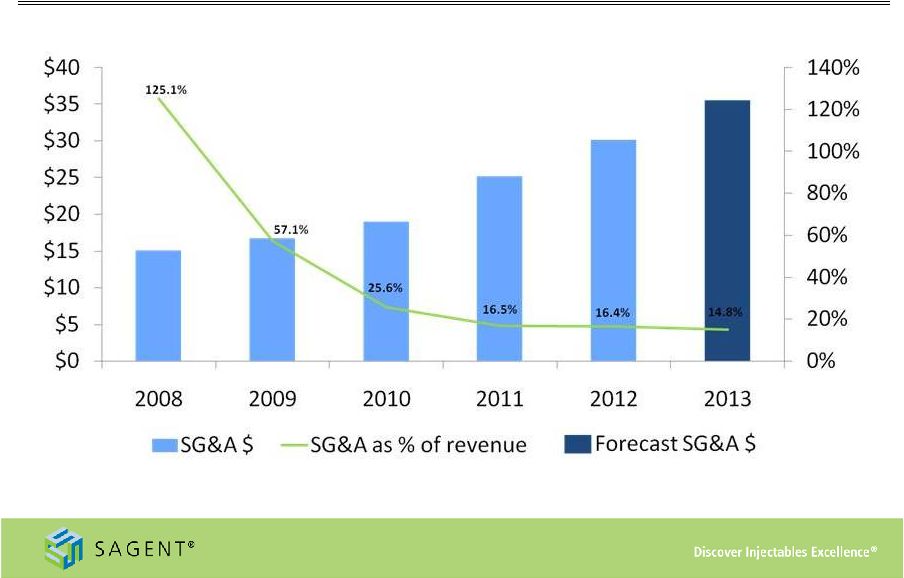 23 SG&A Spending * Midpoint of expected 2013 SG&A Expense and Revenue as reported in the third quarter earnings release, dated November 5, 2013 |
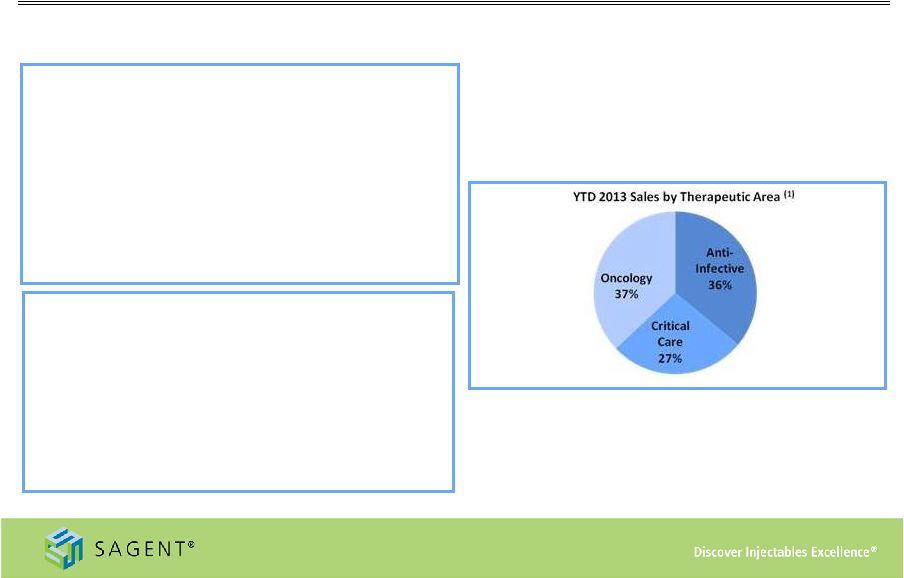 24 YTD 2013 Financial Performance New product launches drive increases in revenue and record earnings Key Developments in 2013 • Successful secondary stock offering • Acquired remaining 50% interest in SCP • Launch of Zoledronic acid at market formation • James Hussey joined as President • Amended supply agreement with Actavis • Approval and launch of first product from SCP facility Operating Performance • Net revenue of $180.6 million, 38% increase from first nine months of 2012 • Adjusted gross profit (2) of $62.2 million, or 34% of net revenue – Increase from $23.6 million, or 18% of net revenue in 2012 • Net income of $26.0 million, compared to net loss of $16.8 million in first nine months of 2012 – Diluted EPS of $0.90 per share in first nine months of 2013 (1) As of September 30, 2013 (2) Adjusted Gross Profit is a non-GAAP measure. Please refer to slide #26: Appendix – Non GAAP Reconciliation for further detail |
 25 Investment Highlights • Fastest growing Generic Injectable company in U.S. Market , a consolidating industry with high barriers to entry • Extensive global partner network with state-of-the-art facilities enabling accelerated growth relative to conventional start-ups • Solid relationships at all levels of the supply chain enhance responsiveness to industry demands • Vertical integration through acquisition of SCP complements partnering model, as well as provides additional growth opportunities and a footprint in China • Exceptional quality and safety track record; global excellence in manufacturing • Strong sequential margin and revenue growth driven by diverse and deep product portfolio • Experienced management team with great track record, has delivered on product approvals and financial performance |
 Appendix – Non-GAAP Reconciliation Nine months ended Nine months ended September 30, September 30, 2008 2009 2010 2011 2012 2013 2008 2009 2010 2011 2012 2013 Adjusted Gross Profit 73 $ 435 $ 9,460 $ 20,833 $ 36,746 $ 62,172 $ 0.6% 1.5% 12.8% 13.7% 20.0% 34.4% Sagent portion of gross profit earned by Sagent Agila joint venture - (2) 417 2,064 5,639 1,909 0.0% 0.0% 0.6% 1.4% 3.1% 1.1% Gross Profit 73 $ 437 $ 9,043 $ 18,769 $ 31,107 $ 60,263 $ 0.6% 1.5% 12.2% 12.3% 16.9% 33.4% Reconciliation of GAAP to non-GAAP Information (in thousands) Sagent Pharmaceuticals, Inc. Year ended December 31, Year ended December 31, Percentage of net revenues We use the non-GAAP financial measure “Adjusted Gross Profit” and corresponding ratios. We define Adjusted Gross Profit as gross profit plus our share of the gross profit earned through our Sagent Agila joint venture which is included in the Equity in net (income) loss of joint ventures line on the Consolidated Statements of Operations. We believe that Adjusted Gross Profit is relevant and useful supplemental information for our investors. Our management believes that the presentation of this non-GAAP financial measure, when considered together with our GAAP financial measures and the reconciliation to the most directly comparable GAAP financial measure, provides a more complete understanding of the factors and trends affecting Sagent than could be obtained absent these disclosures. Management uses Adjusted Gross Profit and corresponding ratios to make operating and strategic decisions and evaluate our performance. We have disclosed this non-GAAP financial measure so that our investors have the same financial data that management uses with the intention of assisting you in making comparisons to our historical operating results and analyzing our underlying performance. Our management believes that Adjusted Gross Profit provides a useful supplemental tool to consistently evaluate the profitability of our products that have profit sharing arrangements. The limitation of this measure is that it includes an item that does not have an impact on gross profit reported in accordance with GAAP. The best way that this limitation can be addressed is by using Adjusted Gross Profit in combination with our GAAP reported gross profit. Because Adjusted Gross Profit calculations may vary among other companies, the Adjusted Gross Profit figures presented below may not be comparable to similarly titled measures used by other companies. Our use of Adjusted Gross Profit is not meant to and should not be considered in isolation or as a substitute for, or superior to, any GAAP financial measure. You should carefully evaluate the following table reconciling Adjusted Gross Profit to our GAAP reported gross profit for the period presented (dollars in thousands). Adjusted Gross Profit 26 |
 |