Exhibit 99.2
China Biologic Products Holdings, Inc. (NASDAQ: CBPO) 36 th Annual J.P . Morgan Healthcare Conference January 2018 Creating Miracles in Life
Safe Harbor Statement This presentation contains forward - looking statements, including statements about the business outlook, strategy and market opportunity of China Biologic Products Holdings, Inc . (the “Company” or “we”), and statements that may suggest trends for its business . Such forward - looking statements can be identified by the use of forward - looking terminology such as “anticipate,” “believe,” “could,” “estimate,” “expect,” “intend,” “may,” “plan,” “potential,” “should,” “will,” “would,” and similar expressions, or the negatives thereof . These statements are individually and collectively forward - looking statements within the meaning of Section 27 A of the Securities Act and Section 21 E of the Securities Exchange Act of 1934 . These forward - looking statements are made only as of the date of this presentation and are based on estimates and information available to the Company at the time of this presentation . These statements are not guarantees of future performance and are subject to certain risks, uncertainties and assumptions that are difficult to predict and may be beyond the Company’s control . Therefore, the Company cautions that actual results may differ materially from those set forth in any forward - looking statements herein, and are subject to numerous assumptions, risks, uncertainties and other factors, including those discussed under “Risk Factors” in the Company’s annual report on Form 10 - K filed with the SEC for the year ended December 31 , 2016 . In light of these risks and uncertainties, there can be no assurance that the forward - looking statements made during this presentation will in fact be realized . Any forward - looking statements and projections made by others in this presentation are not adopted by the Company and the Company is not responsible for the forward - looking statements and projections of others . Except as otherwise required by applicable securities laws, the Company disclaims any intention or obligation to publicly update or revise forward - looking statements, whether as a result of new information, future events or otherwise . In evaluating our business, we use certain non - GAAP measures as supplemental measures to review and assess our operating performance . These non - GAAP financial measures have limitations as analytical tools and investors should not consider them in isolation, or as a substitute for net income attributable to Company or other consolidated statement of comprehensive income data prepared in accordance with U . S . GAAP . 01
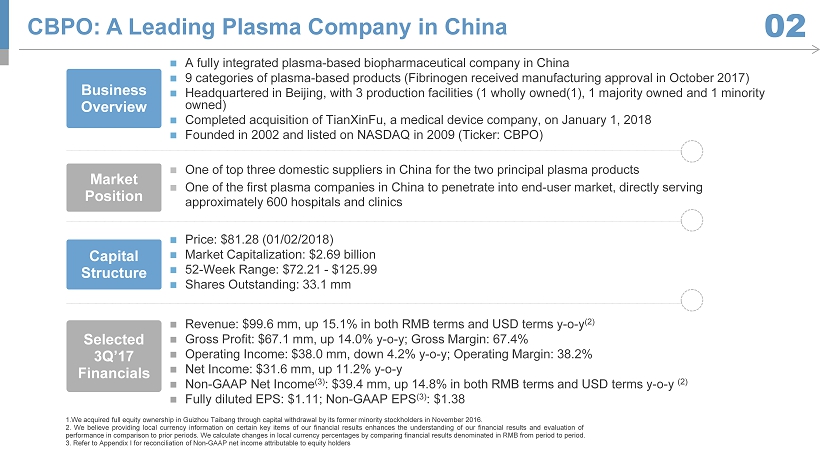
Capital Structure ; Price: $81.28 (01/02/2018) ; Market Capitalization: $2.69 billion ; 52 - Week Range: $72.21 - $ 125.99 ; Shares Outstanding: 33.1 mm Selected 3Q’17 Financials ; Revenue : $99.6 mm, up 15.1% in both RMB terms and USD terms y - o - y (2 ) ; Gross Profit: $67.1 mm, up 14.0% y - o - y; Gross Margin: 67.4% ; Operating Income: $38.0 mm, down 4.2% y - o - y; Operating Margin: 38.2% ; Net Income: $31.6 mm, up 11.2% y - o - y ; Non - GAAP Net Income (3) : $39.4 mm, up 14.8% in both RMB terms and USD terms y - o - y (2 ) ; Fully diluted EPS: $1.11; Non - GAAP EPS (3) : $1.38 Business Overview ; A fully integrated plasma - based biopharmaceutical company in China ; 9 categories of plasma - based products (Fibrinogen received manufacturing approval in October 2017) ; Headquartered in Beijing, with 3 production facilities (1 wholly owned(1), 1 majority owned and 1 minority owned ) ; Completed acquisition of TianXinFu , a medical device company, on January 1, 2018 ; Founded in 2002 and listed on NASDAQ in 2009 (Ticker: CBPO) Market Position ; One of top three domestic suppliers in China for the two principal plasma products ; One of the first plasma companies in China to penetrate into end - user market, directly serving approximately 600 hospitals and clinics CBPO: A Leading Plasma Company in China 02 1 . We acquired full equity ownership in Guizhou Taibang through capital withdrawal by its former minority stockholders in November 2016 . 2 . We believe providing local currency information on certain key items of our financial results enhances the understanding of our financial results and evaluation of performance in comparison to prior periods . We calculate changes in local currency percentages by comparing financial results denominated in RMB from period to period . 3 . Refer to Appendix I for reconciliation of Non - GAAP net income attributable to equity holders
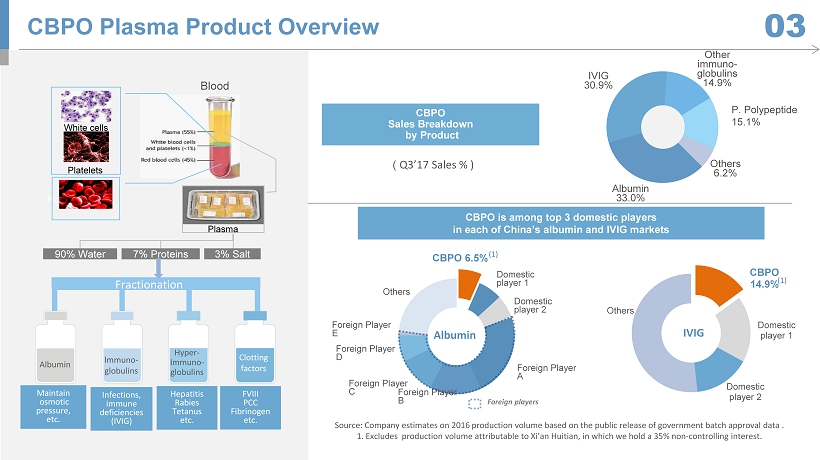
CBPO 14.9% Domestic player 1 Domestic player 2 Others Hepatitis Rabies Tetanus etc. FVIII PCC Fibrinogen etc. Fractionation lmmuno - globulins Hyper - Immuno - g lobulins Clotting f actors A lbumin Maintain osmotic pressure, etc. Infections , immune deficiencies (IVIG) CBPO Plasma Product Overview 03 Red cells ( Q3’17 Sales % ) CBPO Sales Breakdown by Product Albumin 33.0% IVIG 30.9% Other immuno - globulins 14.9% P. Polypeptide 15.1% Others 6.2% CBPO 6.5% Domestic player 1 Domestic player 2 Foreign Player A Foreign Player B Foreign Player C Foreign Player D Foreign Player E Others CBPO is among top 3 domestic players in each of China’s albumin and IVIG markets Source: Company estimates on 2016 production volume based on the public release of government batch approval data . 1. Excludes production volume attributable to Xi’an Huitian , in which we hold a 35% non - controlling interest. F oreign players 90% Water 7% Proteins 3% Salt Blood White cells Platelets Plasma Albumin IVIG (1) (1) P. Polypeptide 15.1%

Industry Overview China Biologic Products, Inc. China Biologic Products Holdings, Inc.
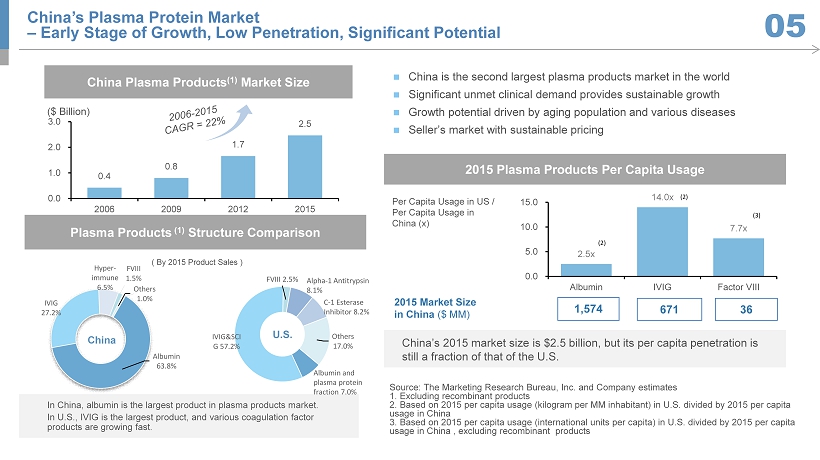
IVIG&SCI G 57.2% FVIII 2.5% Others 17.0% Per Capita Usage in US / Per Capita Usage in China (x ) 2015 Market Size in China ($ MM) 2015 Plasma Products Per Capita Usage China’s 2015 market size is $2.5 billion, but its per capita penetration is still a fraction of that of the U.S. 1,574 671 36 2.5x 14.0x 7.7x 0.0 5.0 10.0 15.0 Albumin IVIG Factor VIII (2) (2) (3) China’s Plasma Protein Market – Early Stage of Growth, Low Penetration, Significant Potential 05 0.4 0.8 1.7 2.5 0.0 1.0 2.0 3.0 2006 2009 2012 2015 China Plasma Products (1) Market Size ($ Billion) Source: The Marketing Research Bureau, Inc. and Company estimates 1. Excluding recombinant products 2. Based on 2015 per capita usage (kilogram per MM inhabitant) in U.S. divided by 2015 per capita usage in China 3. Based on 2015 per capita usage (international units per capita) in U.S. divided by 2015 per capita usage in China , excluding recombinant products ; China is the second largest plasma products market in the world ; Significant unmet clinical demand provides sustainable growth ; Growth potential driven by aging population and various diseases ; Seller’s m arket with sustainable pricing ( By 2015 Product Sales ) Plasma Products (1) Structure Comparison Albumin 63.8% IVIG 27.2% Hyper - immune 6.5% FVIII 1.5% Others 1.0% China U.S. In China, albumin is the largest product in plasma products market. In U.S., IVIG is the largest product, and various coagulation factor products are growing fast. Albumin and plasma protein fraction 7.0 % C - 1 Esterase Inhibitor 8.2% Alpha - 1 Antitrypsin 8.1%
; Regulatory framework in China has evolved into one of the most stringent globally due to crises of tainted plasma products over the past decade ; Fractionators permitted to process self - collected plasma only as required by law ; New plasma collection licenses are difficult to obtain ; New plasma fractionation licenses ceased to be granted since 2001 ; 28 licensed manufacturers of plasma products are currently in operation ; Since 1986 , all imported blood products have been banned except for human albumin and recombinant factor VIII products ; In December 2016 , a new guideline was released, which included granting more licenses for new plasma collection stations preferably to larger companies that can improve plasma quality and safety controls China will continue to maintain stringent regulations for the plasma product industry as it is critical to China's public health security High Barriers to Entry Benefit Established Players 06
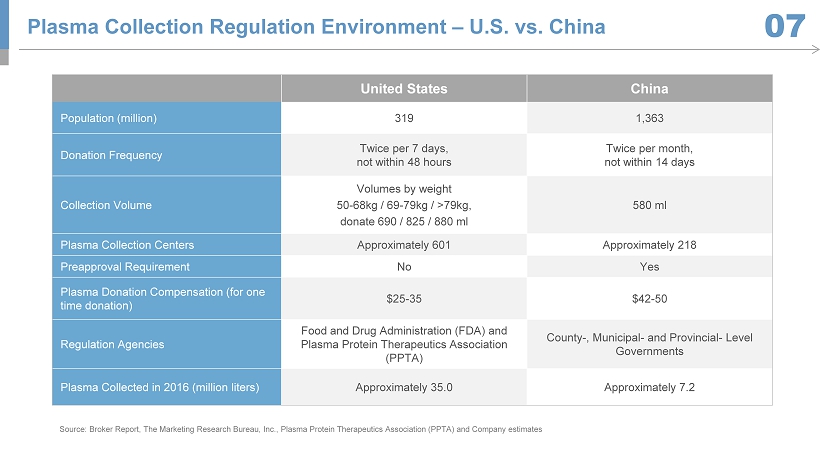
United States China Population (million) 319 1,363 Donation Frequency Twice per 7 days, not within 48 hours Twice per month, not within 14 days Collection Volume Volumes by weight 50 - 68kg / 69 - 79kg / >79kg, donate 690 / 825 / 880 ml 580 ml Plasma Collection Centers Approximately 601 Approximately 218 Preapproval Requirement No Yes Plasma Donation Compensation (for one time donation) $25 - 35 $42 - 50 Regulation Agencies Food and Drug Administration (FDA) and Plasma Protein Therapeutics Association (PPTA) County - , Municipal - and Provincial - Level Governments Plasma Collected in 2016 (million liters) Approximately 35.0 Approximately 7.2 Source: Broker Report, The Marketing Research Bureau, Inc., Plasma Protein Therapeutics Association (PPTA) and Company estima tes Plasma Collection Regulation Environment – U.S. vs. China 07
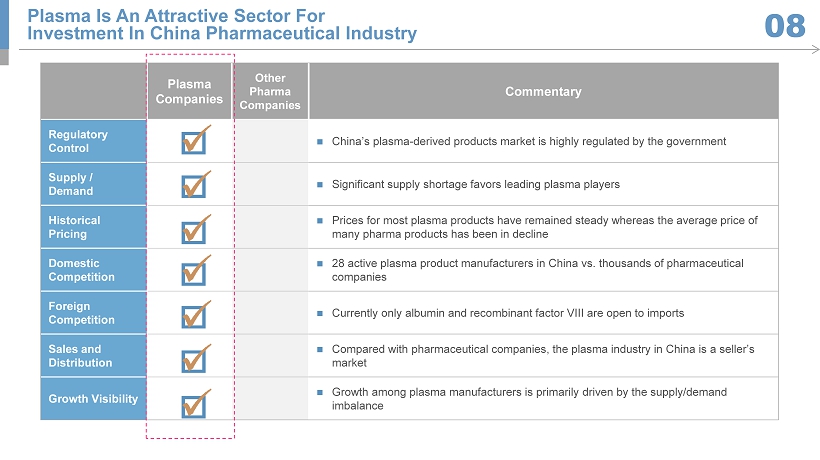
Plasma Companies Other Pharma Companies Commentary Regulatory Control ; China’s plasma - derived products market is highly regulated by the government Supply / Demand ; Significant supply shortage favors leading plasma players Historical Pricing ; Prices for most plasma products have remained steady whereas the average price of many pharma products has been in decline Domestic Competition ; 28 active plasma product manufacturers in China vs. thousands of pharmaceutical companies Foreign Competition ; Currently only albumin and recombinant factor VIII are open to imports Sales and Distribution ; Compared with pharmaceutical companies, the plasma industry in China is a seller’s market Growth Visibility ; Growth among plasma manufacturers is primarily driven by the supply/demand imbalance Plasma Is An Attractive Sector For Investment In China Pharmaceutical Industry 08
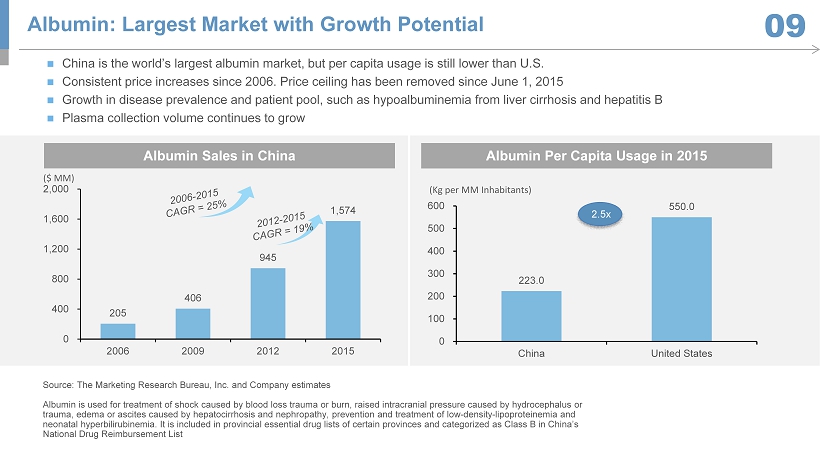
205 406 945 1,574 0 400 800 1,200 1,600 2,000 2006 2009 2012 2015 223.0 550.0 0 100 200 300 400 500 600 China United States ; China is the world’s largest albumin market, but per capita usage is still lower than U.S . ; Consistent price increases since 2006. Price ceiling has been removed since June 1, 2015 ; Growth in disease prevalence and patient pool, such as hypoalbuminemia from liver cirrhosis and hepatitis B ; Plasma collection volume continues to grow ($ MM) (Kg per MM Inhabitants) Albumin Sales in China Albumin Per Capita Usage in 2015 Source: The Marketing Research Bureau, Inc. and Company estimates Albumin is used for treatment of shock caused by blood loss trauma or burn, raised intracranial pressure caused by hydrocepha lus or trauma, edema or ascites caused by hepatocirrhosis and nephropathy, prevention and treatment of low - density - lipoproteinemia and neonatal hyperbilirubinemia. It is included in provincial essential drug lists of certain provinces and categorized as Class B i n China’s National Drug Reimbursement List Albumin: Largest Market with Growth Potential 09 2.5x
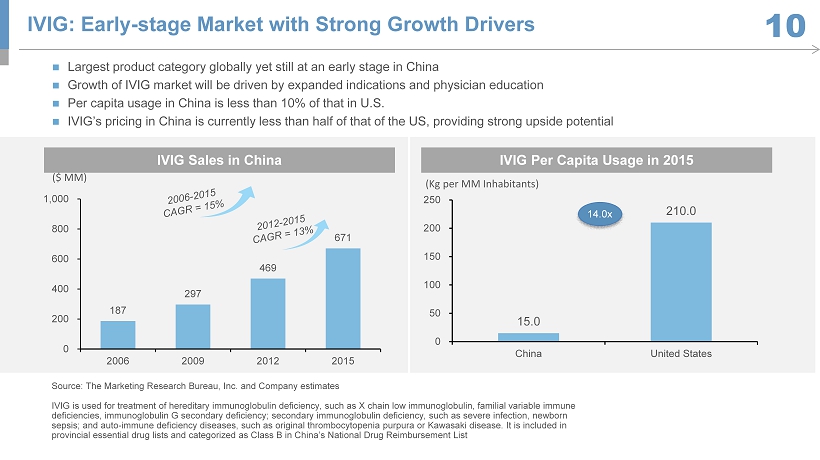
IVIG Sales in China IVIG Per Capita Usage in 2015 15.0 210.0 0 50 100 150 200 250 China United States ($ MM) (Kg per MM Inhabitants) Source: The Marketing Research Bureau, Inc. and Company estimates IVIG is used for treatment of hereditary immunoglobulin deficiency, such as X chain low immunoglobulin, familial variable imm une deficiencies, immunoglobulin G secondary deficiency; secondary immunoglobulin deficiency, such as severe infection, newborn sepsis; and auto - immune deficiency diseases, such as original thrombocytopenia purpura or Kawasaki disease. It is included in provincial essential drug lists and categorized as Class B in China’s National Drug Reimbursement List IVIG: Early - stage Market with Strong Growth Drivers 10 ; Largest product category globally yet still at an early stage in China ; Growth of IVIG market will be driven by expanded indications and physician education ; Per capita usage in China is less than 10% of that in U.S. ; IVIG’s pricing in China is currently less than half of that of the US, providing strong upside potential 187 297 469 671 0 200 400 600 800 1,000 2006 2009 2012 2015 14.0x
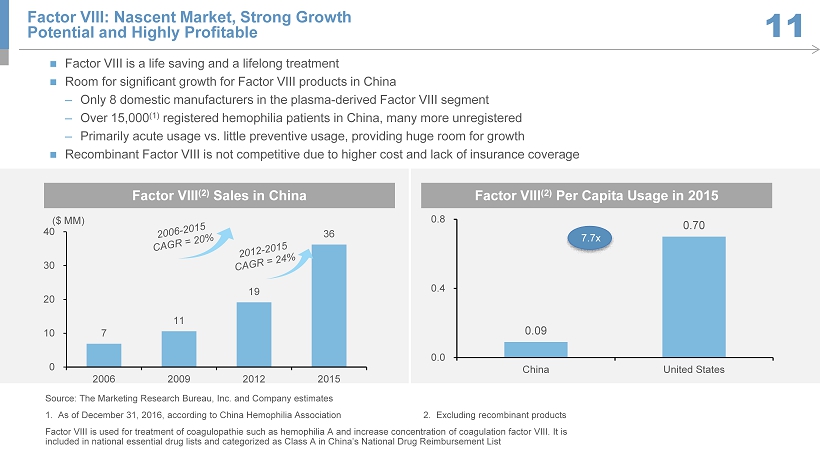
Source: The Marketing Research Bureau, Inc. and Company estimates 1 . As of December 31, 2016, according to China Hemophilia Association 2. Excluding recombinant products Factor VIII is used for treatment of coagulopathie such as hemophilia A and increase concentration of coagulation factor VIII . I t is included in national essential drug lists and categorized as Class A in China’s National Drug Reimbursement List Factor VIII: Nascent Market, Strong Growth Potential and Highly Profitable 11 ; Factor VIII is a life saving and a lifelong treatment ; Room for significant growth for Factor VIII products in China ‒ Only 8 domestic manufacturers in the plasma - derived Factor VIII segment ‒ Over 15,000 (1) registered hemophilia patients in China, many more unregistered ‒ Primarily acute usage vs. little preventive usage, providing huge room for growth ; Recombinant Factor VIII is not competitive due to higher cost and lack of insurance coverage 0.09 0.70 0.0 0.4 0.8 China United States (International Units per Inhabitant) Factor VIII (2) Sales in China Factor VIII (2) Per Capita Usage in 2015 7.7x 7 11 19 36 0 10 20 30 40 2006 2009 2012 2015 ($ MM)
Company Overview China Biologic Products Holdings, Inc.
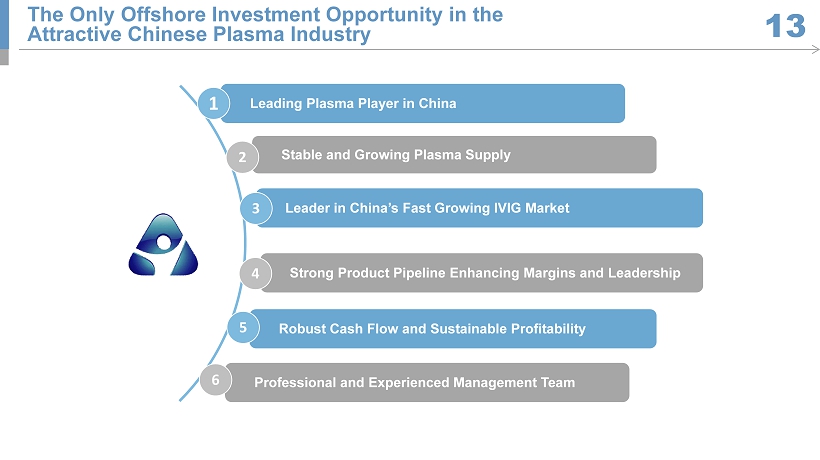
Strong Product Pipeline Enhancing Margins and Leadership 4 Stable and Growing Plasma Supply 2 Robust Cash Flow and Sustainable Profitability 5 Leading Plasma Player in China 1 Leader in China’s Fast Growing IVIG Market 3 Professional and Experienced Management Team 6 The Only Offshore Investment Opportunity in the Attractive Chinese Plasma Industry 13
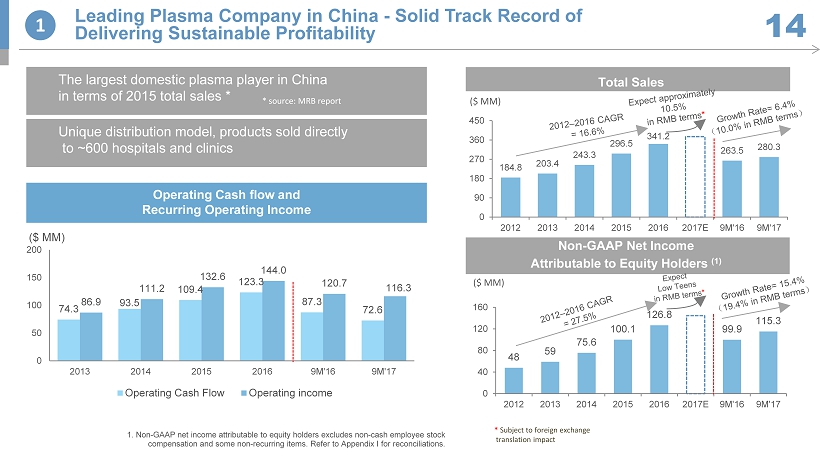
74.3 93.5 109.4 123.3 87.3 72.6 86.9 111.2 132.6 144.0 120.7 116.3 0 50 100 150 200 2013 2014 2015 2016 9M'16 9M'17 Operating Cash Flow Operating income Unique distribution model, products sold directly to ~600 hospitals and clinics Non - GAAP Net Income Attributable to Equity Holders ( 1) ($ MM) 184.8 203.4 243.3 296.5 341.2 263.5 280.3 0 90 180 270 360 450 2012 2013 2014 2015 2016 2017E 9M'16 9M'17 48 59 75.6 100.1 126.8 99.9 115.3 0 40 80 120 160 2012 2013 2014 2015 2016 2017E 9M'16 9M'17 ($ MM) 1 Leading Plasma Company in China - Solid Track Record of Delivering Sustainable Profitability 14 Total Sales 1. Non - GAAP net income attributable to equity holders excludes non - cash employee stock compensation and some non - recurring items. Refer to Appendix I for reconciliations. Operating Cash flow and Recurring Operating Income ($ MM) The largest domestic plasma player in China in terms of 2015 total sales * * source: MRB report * Subject to foreign exchange translation impact
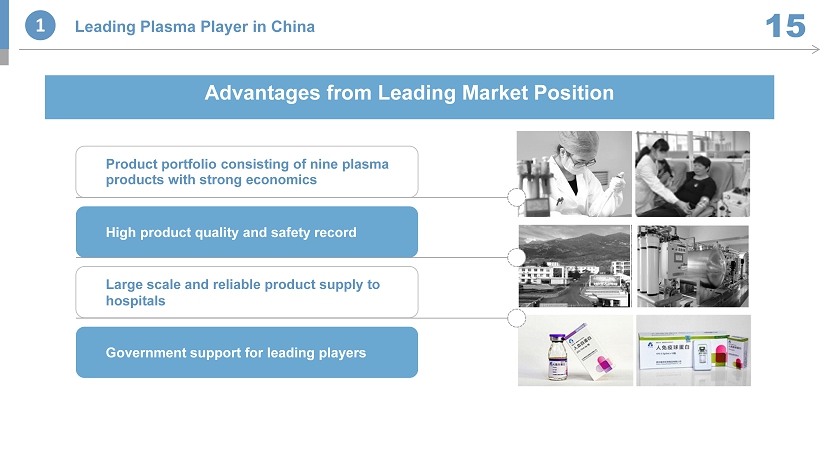
Product portfolio consisting of nine plasma products with strong economics High product quality and safety record Large scale and reliable product supply to hospitals Government support for leading players Advantages from Leading Market Position 1 Leading Plasma Player in China 15
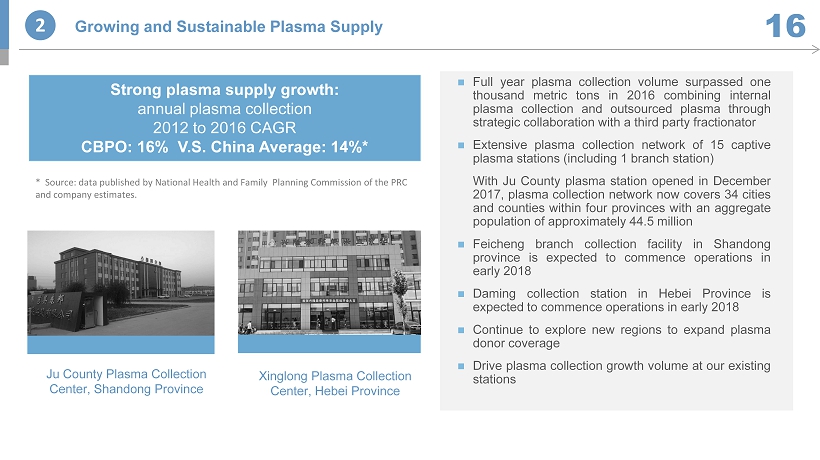
; Full year plasma collection volume surpassed one thousand metric tons in 2016 combining internal plasma collection and outsourced plasma through strategic collaboration with a third party fractionator ; Extensive plasma collection network of 15 captive plasma stations (including 1 branch station) With Ju County plasma station opened in December 2017 , plasma collection network now covers 34 cities and counties within four provinces with an aggregate population of approximately 44 . 5 million ; Feicheng branch collection facility in Shandong province is expected to commence operations in early 2018 ; Daming collection station in Hebei Province is expected to commence operations in early 2018 ; Continue to explore new regions to expand plasma donor coverage ; Drive plasma collection growth volume at our existing stations Xinglong Plasma Collection Center, Hebei Province Strong plasma supply growth: annual plasma collection 2012 to 2016 CAGR CBPO: 16% V.S. China Average: 14%* * Source: data published by National Health and Family Planning Commission of the PRC and company estimates. 2 Growing and Sustainable Plasma Supply 16 Ju County Plasma Collection Center, Shandong Province
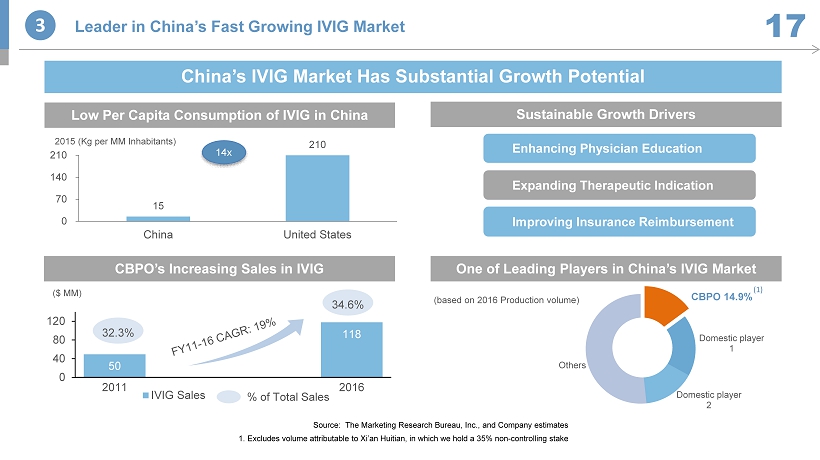
3 Leader in China’s Fast Growing IVIG Market 1 7 CBPO 14.9% Domestic player 1 Domestic player 2 Others 50 118 0 40 80 120 2011 2016 IVIG Sales 32.3% ($ MM) % of Total Sales (based on 2016 Production volume) CBPO’s Increasing S ales in IVIG One of Leading Players in China’s IVIG Market Source: The Marketing Research Bureau, Inc., and Company estimates 1. Excludes volume attributable to Xi’an Huitian , in which we hold a 35% non - controlling stak e 210 15 0 70 140 210 United States China 2015 (Kg per MM Inhabitants) China’s IVIG Market Has Substantial Growth Potential Enhancing Physician Education Expanding Therapeutic Indication Improving Insurance Reimbursement Low Per C apita Consumption of IVIG in China Sustainable Growth Drivers 14x 34.6% (1)
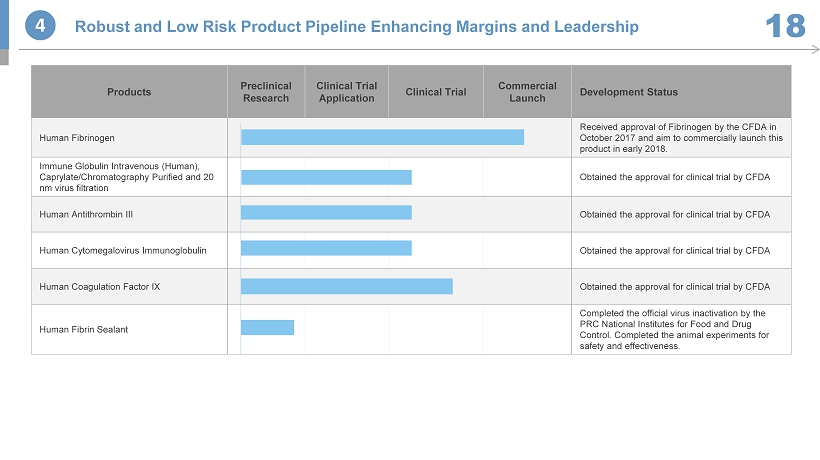
Products Preclinical Research Clinical Trial Application Clinical Trial Commercial Launch Development Status Human Fibrinogen Received approval of Fibrinogen by the CFDA in October 2017 and aim to commercially launch this product in early 2018. Immune Globulin Intravenous (Human), Caprylate /Chromatography Purified and 20 nm virus filtration Obtained the approval for clinical trial by CFDA Human Antithrombin III Obtained the approval for clinical trial by CFDA Human Cytomegalovirus Immunoglobulin Obtained the approval for clinical trial by CFDA Human Coagulation Factor IX Obtained the approval for clinical trial by CFDA Human Fibrin Sealant Completed the official virus inactivation by the PRC National Institutes for Food and Drug Control. Completed the animal experiments for safety and effectiveness. 4 Robust and Low Risk Product Pipeline Enhancing Margins and Leadership 18
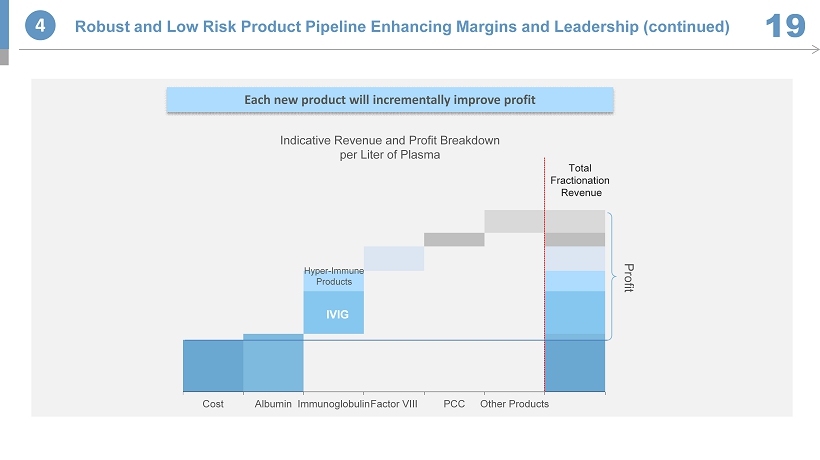
Cost Albumin Immunoglobulin Factor VIII PCC Other Products Total Fractionation Revenue Profit Hyper - Immune Products IVIG Indicative Revenue and Profit Breakdown per Liter of Plasma Each new product will incrementally improve profit 4 Robust and Low Risk Product Pipeline Enhancing Margins and Leadership (continued) 19
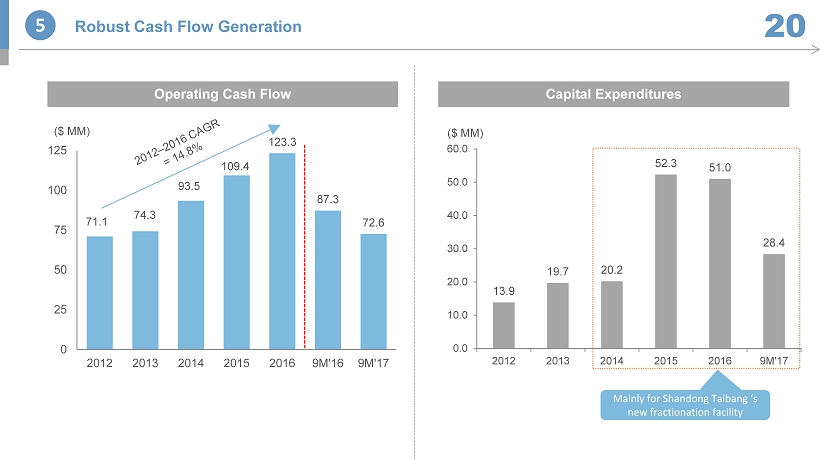
71.1 74.3 93.5 109.4 123.3 87.3 72.6 0 25 50 75 100 125 2012 2013 2014 2015 2016 9M'16 9M'17 5 Robust Cash Flow Generation 20 ($ MM) Operating Cash Flow 13.9 19.7 20.2 52.3 51.0 28.4 0.0 10.0 20.0 30.0 40.0 50.0 60.0 2012 2013 2014 2015 2016 9M'17 ($ MM) Capital Expenditures M ainly for Shandong Taibang ‘s new fractionation facility
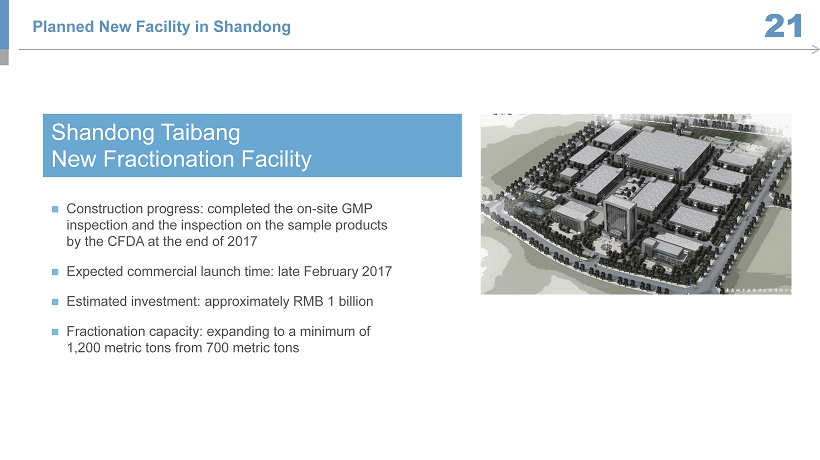
Planned New Facility in Shandong 21 ; Construction progress: completed the on - site GMP inspection and the inspection on the sample products by the CFDA at the end of 2017 ; Expected commercial launch time: late February 2017 ; Estimated investment: approximately RMB 1 billion ; Fractionation capacity: expanding to a minimum of 1,200 metric tons from 700 metric tons Shandong Taibang New Fractionation Facility

Mr. David (Xiaoying) Gao, Chairman & Chief Executive Officer Mr. Ming Yang, Chief Financial Officer ; CEO since May 2012 , Chairman of the Board since March 2012 and Director since 2011 ; Over 20 years of experience in corporate governance and management, especially in healthcare and technology sectors ; Previously served as CEO & Director of BMP Sunstone Corporation and integration advisor post acquisition by Sanofi in 2011 ; Former member of board of Asia - Pacific operations, Motorola ; M . B . A . from Massachusetts Institute of Technology, M . S . in Mechanical Engineering from Hanover University, Germany, and B . S . in Mechanical Engineering from Beijing Institute of Technology ; CFO since August 2012 and VP - Finance & Compliance and Treasurer between March 2012 and August 2012 ; 6 years in financial management and 11 years of audit experience in accounting firms including audit senior manager at KPMG ; C . P . A . in China ; Senior Corporate Vice President since August 2012 , joined in 2008 ; 12 years of financial management experience and 7 years of investor relations experience ; C . F . A . Professional and Experienced Management Team 22 6 01 02 03 Mr. Ming Yin, Senior Vice President
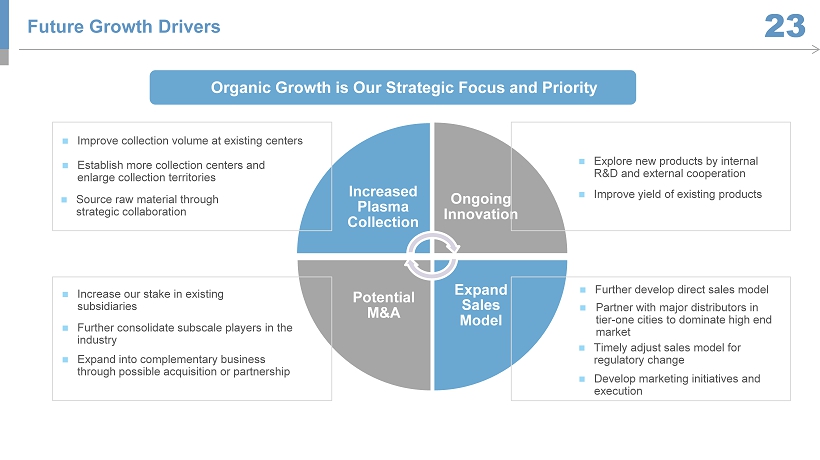
Increased Plasma Collection Ongoing Innovation Expand Sales Model Potential M&A ; Improve collection volume at existing centers ; Establish more collection centers and enlarge collection territories ; Increase our stake in existing subsidiaries ; Further consolidate subscale players in the i ndustry ; Explore new products by internal R&D and external cooperation ; Improve yield of existing products ; Partner with major distributors in tier - one cities to dominate high end market ; Source raw material through strategic collaboration Organic Growth is O ur Strategic Focus and Priority ; Further develop direct sales model ; Develop marketing initiatives and execution ; Expand into complementary business through possible acquisition or partnership Future Growth Drivers 23 ; Timely adjust sales model for regulatory change
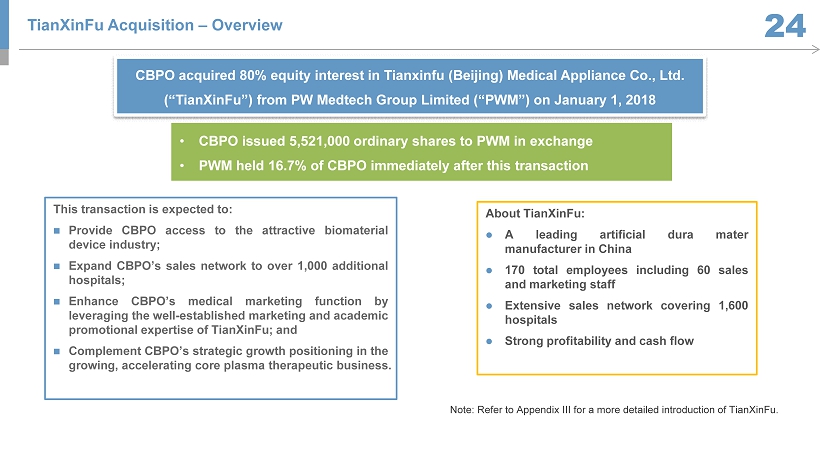
24 • CBPO issued 5,521,000 ordinary shares to PWM in exchange • PWM held 16.7% of CBPO immediately after this transaction This transaction is expected to: ; Provide CBPO access to the attractive biomaterial device industry ; ; Expand CBPO’s sales network to over 1 , 000 additional hospitals ; ; Enhance CBPO’s medical marketing function by leveraging the well - established marketing and academic promotional expertise of TianXinFu ; and ; Complement CBPO’s strategic growth positioning in the growing, accelerating core plasma therapeutic business . About TianXinFu : ; A leading artificial dura mater manufacturer in China ; 170 total employees including 60 sales and marketing staff ; Extensive sales network covering 1 , 600 hospitals ; Strong profitability and cash flow CBPO acquired 80% equity interest in Tianxinfu (Beijing) Medical Appliance Co., Ltd. (“ TianXinFu ”) from PW Medtech Group Limited (“PWM”) on January 1, 2018 TianXinFu Acquisition – Overview Note: Refer to Appendix III for a more detailed introduction of TianXinFu .
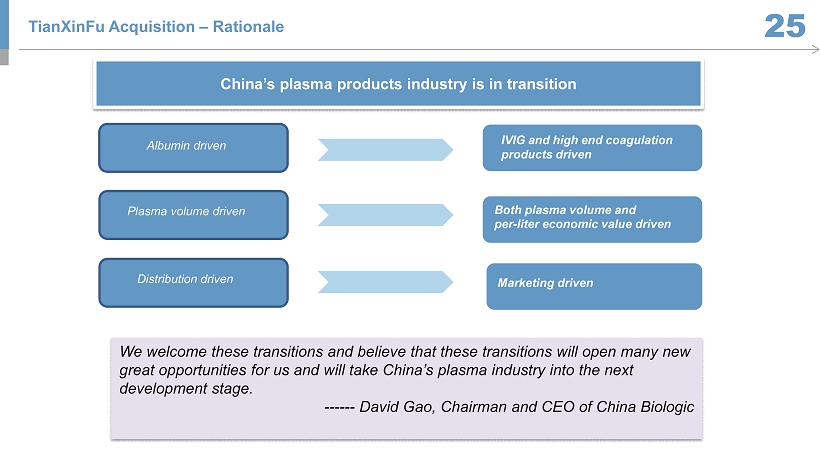
25 Albumin driven We welcome these transitions and believe that these transitions will open many new great opportunities for us and will take China’s plasma industry into the next development stage. ------ David Gao, Chairman and CEO of China Biologic Plasma volume driven Distribution driven IVIG and high end coagulation products driven Both plasma volume and per - liter economic value driven Marketing driven China’s plasma products industry is in transition TianXinFu Acquisition – Rationale
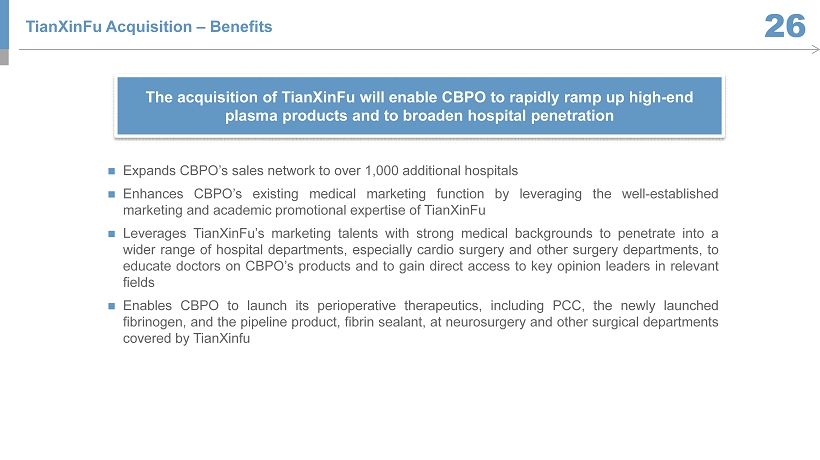
26 ; Expands CBPO’s sales network to over 1 , 000 additional hospitals ; Enhances CBPO’s existing medical marketing function by leveraging the well - established marketing and academic promotional expertise of TianXinFu ; Leverages TianXinFu’s marketing talents with strong medical backgrounds to penetrate into a wider range of hospital departments, especially cardio surgery and other surgery departments, to educate doctors on CBPO’s products and to gain direct access to key opinion leaders in relevant fields ; Enables CBPO to launch its perioperative therapeutics, including PCC, the newly launched fibrinogen, and the pipeline product, fibrin sealant, at neurosurgery and other surgical departments covered by TianXinfu The acquisition of TianXinFu will enable CBPO to rapidly ramp up high - end plasma products and to broaden hospital penetration TianXinFu Acquisition – Benefits
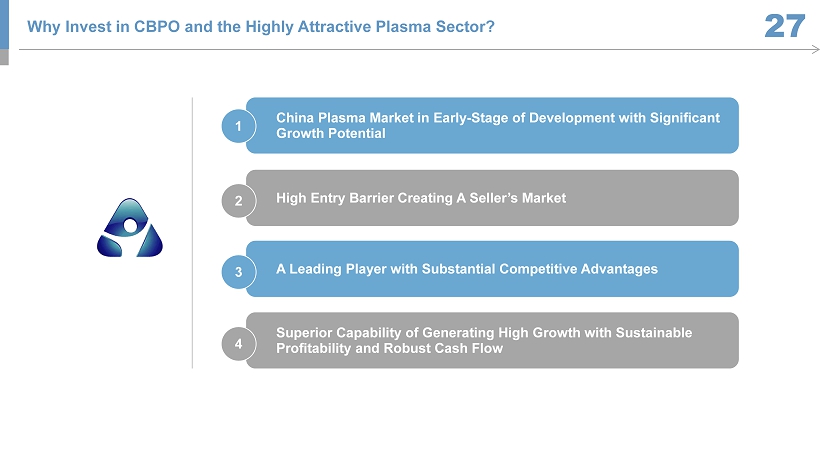
Superior Capability of Generating H igh Growth with Sustainable Profitability and Robust Cash Flow China Plasma Market in Early - Stage of Development with Significant Growth Potential High Entry Barrier Creating A Seller’s Market A Leading Player with Substantial Competitive Advantages 3 4 1 2 Why Invest in CBPO and the Highly Attractive Plasma Sector? 27
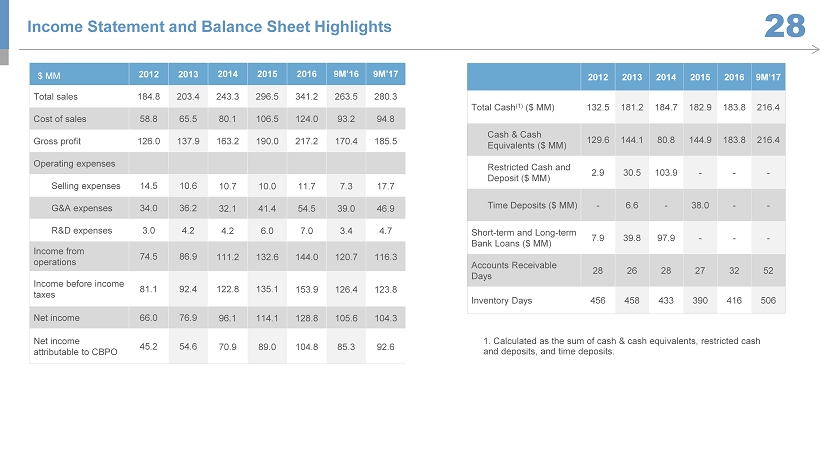
$ MM 2012 2013 2014 2015 2016 9M’16 9M’17 Total sales 184.8 203.4 243.3 296.5 341.2 263.5 280.3 Cost of sales 58.8 65.5 80.1 106.5 124.0 93.2 94.8 Gross profit 126.0 137.9 163.2 190.0 217.2 170.4 185.5 Operating expenses Selling expenses 14.5 10.6 10.7 10.0 11.7 7.3 17.7 G&A expenses 34.0 36.2 32.1 41.4 54.5 39.0 46.9 R&D expenses 3.0 4.2 4.2 6.0 7.0 3.4 4.7 Income from operations 74.5 86.9 111.2 132.6 144.0 120.7 116.3 Income before income taxes 81.1 92.4 122.8 135.1 153.9 126.4 123.8 Net income 66.0 76.9 96.1 114.1 128.8 105.6 104.3 Net income attributable to CBPO 45.2 54.6 70.9 89.0 104.8 85.3 92.6 2012 2013 2014 2015 2016 9M’17 Total Cash (1) ($ MM) 132.5 181.2 184.7 182.9 183.8 216.4 Cash & Cash Equivalents ($ MM) 129.6 144.1 80.8 144.9 183.8 216.4 Restricted Cash and Deposit ($ MM) 2.9 30.5 103.9 - - - Time Deposits ($ MM) - 6.6 - 38.0 - - Short - term and Long - term Bank Loans ($ MM) 7.9 39.8 97.9 - - - Accounts Receivable Days 28 26 28 27 32 52 Inventory Days 456 458 433 390 416 506 1. Calculated as the sum of cash & cash equivalents, restricted cash and deposits, and time deposits. Income Statement and Balance Sheet Highlights 28
Appendix China Biologic Products Holdings, Inc.
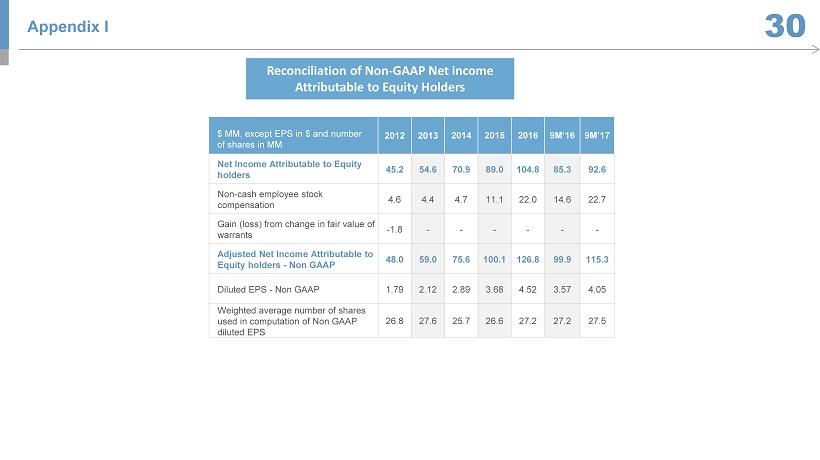
Reconciliation of Non - GAAP Net income Attributable to Equity Holders Appendix I 30 $ MM, except EPS in $ and number of shares in MM 2012 2013 2014 2015 2016 9M’16 9M’17 Net Income Attributable to Equity holders 45.2 54.6 70.9 89.0 104.8 85.3 92.6 Non - cash employee stock compensation 4.6 4.4 4.7 11.1 22.0 14.6 22.7 Gain (loss) from change in fair value of warrants - 1.8 - - - - - - Adjusted Net Income Attributable to Equity holders - Non GAAP 48.0 59.0 75.6 100.1 126.8 99.9 115.3 Diluted EPS - Non GAAP 1.79 2.12 2.89 3.68 4.52 3.57 4.05 Weighted average number of shares used in computation of Non GAAP diluted EPS 26.8 27.6 25.7 26.6 27.2 27.2 27.5

Appendix II - Plasma Donor Management 31 Five steps to assure safe plasma from healthy donors II. Five times fingerprint identification III. ID card identification system I. Facial identification V. Fully - automatic plasma collection machine; fully enclosed and disposable medical instruments IV . Physical examination before donating plasma to assure up to standards for HBsAg, HCV , HIV, ALT, and syphilis China Biologic Products Holdings’ Fuping Plasma Collection Center in Shaanxi
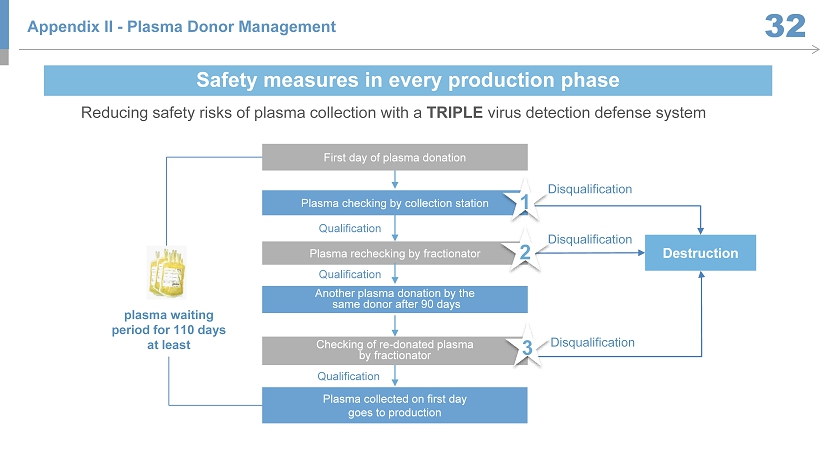
Disqualification Qualification Appendix II - Plasma Donor Management 32 Safety measures in every production phase Plasma checking by collection station Plasma rechecking by fractionator Another plasma donation by the same donor after 90 days Checking of re - donated plasma by fractionator Plasma collected on first day goes to production Destruction Qualification Qualification Disqualification plasma waiting period for 110 days at least First day of plasma donation Disqualification Reducing safety risks of plasma collection with a TRIPLE virus detection defense system 2 3 1
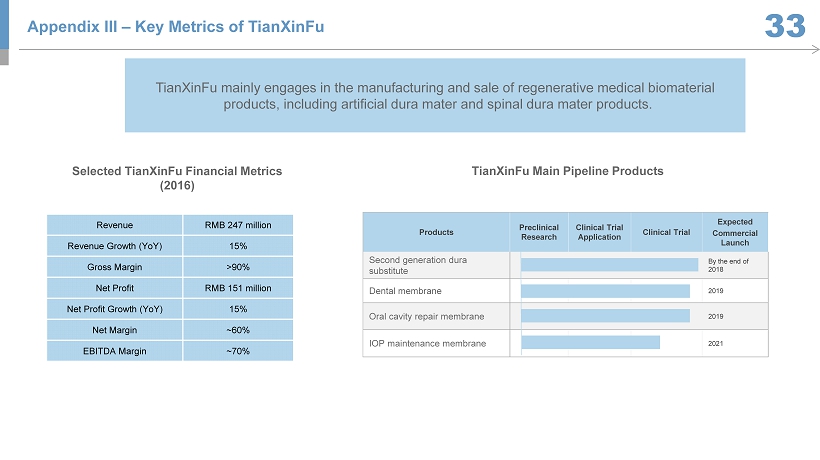
33 Revenue RMB 247 million Revenue Growth (YoY) 15% Gross Margin >90% Net Profit RMB 151 million Net Profit Growth (YoY) 15% Net Margin ~60% EBITDA Margin ~70% Selected TianXinFu Financial Metrics (2016) Products Preclinical Research Clinical Trial Application Clinical Trial Expected Commercial Launch Second generation dura substitute By the end of 2018 Dental membrane 2019 Oral cavity repair membrane 2019 IOP maintenance membrane 2021 TianXinFu Main Pipeline Products TianXinFu mainly engages in the manufacturing and sale of regenerative medical biomaterial products, including artificial dura mater and spinal dura mater products. Appendix III – Key Metrics of TianXinFu
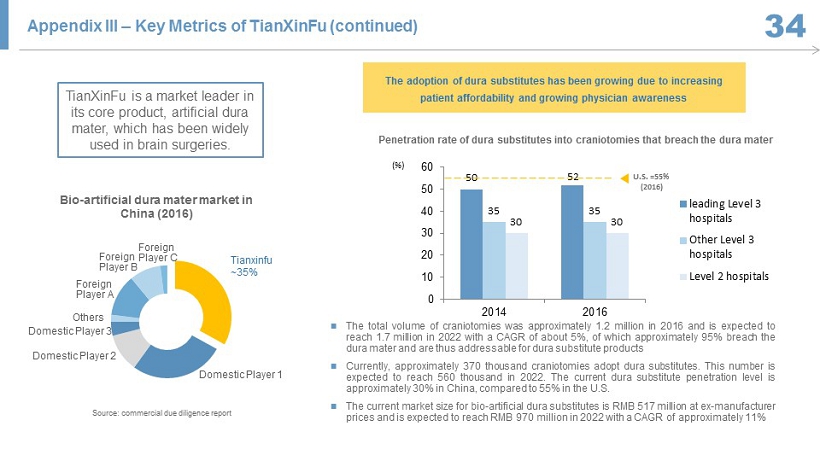
34 TianXinFu 33.0% Domestic … Domestic … Domestic … Others Foreign Player A Foreign Player B Foreign Player C Bio - artificial dura mater market in China (2016) ; The total volume of craniotomies was approximately 1 . 2 million in 2016 and is expected to reach 1 . 7 million in 2022 with a CAGR of about 5 % , of which approximately 95 % breach the dura mater and are thus addressable for dura substitute products ; Currently, approximately 370 thousand craniotomies adopt dura substitutes . This number is expected to reach 560 thousand in 2022 . The current dura substitute penetration level is approximately 30 % in China, compared to 55 % in the U . S . ; The current market size for bio - artificial dura substitutes is RMB 517 million at ex - manufacturer prices and is expected to reach RMB 970 million in 2022 with a CAGR of approximately 11 % The adoption of dura substitutes has been growing due to increasing patient affordability and growing physician awareness 50 52 35 35 30 30 0 10 20 30 40 50 60 2014 2016 leading Level 3 hospitals Other Level 3 hospitals Level 2 hospitals Penetration rate of dura substitutes into craniotomies that breach the dura mater U.S. =55% (2016) (%) TianXinFu is a market leader in its core product, artificial dura mater, which has been widely used in brain surgeries. Source: commercial due diligence report Tianxinfu ~35% Appendix III – Key Metrics of TianXinFu (continued)
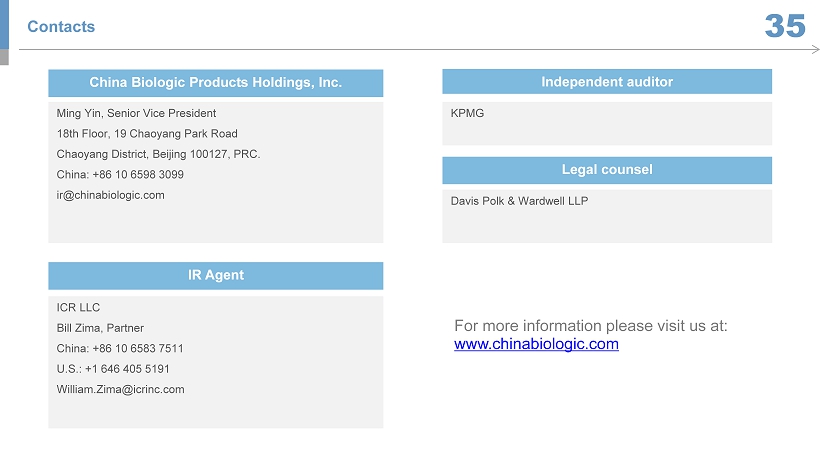
KPMG China Biologic Products Holdings, Inc. Ming Yin, Senior Vice President 18th Floor , 19 Chaoyang Park Road Chaoyang District, Beijing 100127, PRC. China: +86 10 6598 3099 ir@chinabiologic.com IR Agent ICR LLC Bill Zima, Partner China: +86 10 6583 7511 U.S.: +1 646 405 5191 William.Zima@icrinc.com Legal counsel Davis Polk & Wardwell LLP Independent auditor For more information please visit us at : www.chinabiologic.com Contacts 35
THANK YOU