UNITED STATES
SECURITIES AND EXCHANGE COMMISSION
Washington, D.C. 20549
FORM N-CSR
CERTIFIED SHAREHOLDER REPORT OF REGISTERED
MANAGEMENTINVESTMENT COMPANIES
Investment Company Act file number:811-21934
RiverNorth Funds
(Exact name of registrant as specified in charter)
325 North LaSalle Street, Suite 645, Chicago, IL 60654
(Address of principal executive offices) (Zip code)
Marc L. Collins
325 North LaSalle Street, Suite 645
Chicago, IL 60654
(Name and address of agent for service)
Registrant's telephone number, including area code:312-832-1440
Date of fiscal year end:09/30
Date of reporting period:03/31/2020
| Item 1. | Reports to Stockholders. |
| RiverNorth Funds | Table of Contents |
| Opportunistic Closed-End Fund Strategies | |
| Portfolio Update | 2 |
| RiverNorth Core Opportunity Fund | 2 |
| RiverNorth/DoubleLine Strategic Income Fund | 5 |
| RiverNorth/Oaktree High Income Fund | 8 |
| RiverNorth Funds Schedule of Investments and Financial Statements | |
| Disclosure of Fund Expenses | 11 |
| Schedule of Investments | |
| RiverNorth Core Opportunity Fund | 13 |
| RiverNorth/DoubleLine Strategic Income Fund | 17 |
| RiverNorth/Oaktree High Income Fund | 61 |
| Statement of Assets and Liabilities | |
| RiverNorth Core Opportunity Fund | 79 |
| RiverNorth/DoubleLine Strategic Income Fund | 80 |
| RiverNorth/Oaktree High Income Fund | 81 |
| Statement of Operations | |
| RiverNorth Core Opportunity Fund | 82 |
| RiverNorth/DoubleLine Strategic Income Fund | 83 |
| RiverNorth/Oaktree High Income Fund | 84 |
| Statements of Changes in Net Assets | |
| RiverNorth Core Opportunity Fund | 85 |
| RiverNorth/DoubleLine Strategic Income Fund | 87 |
| RiverNorth/Oaktree High Income Fund | 89 |
| Financial Highlights | |
| RiverNorth Core Opportunity Fund | 92 |
| RiverNorth/DoubleLine Strategic Income Fund | 100 |
| RiverNorth/Oaktree High Income Fund | 108 |
| Notes to Financial Statements | 115 |
| Additional Information | 136 |
| Board Considerations Regarding Approval of Investment Advisory and Sub-Advisory Agreements | 137 |
| RiverNorth Funds | Portfolio Update |
March 31, 2020 (Unaudited)
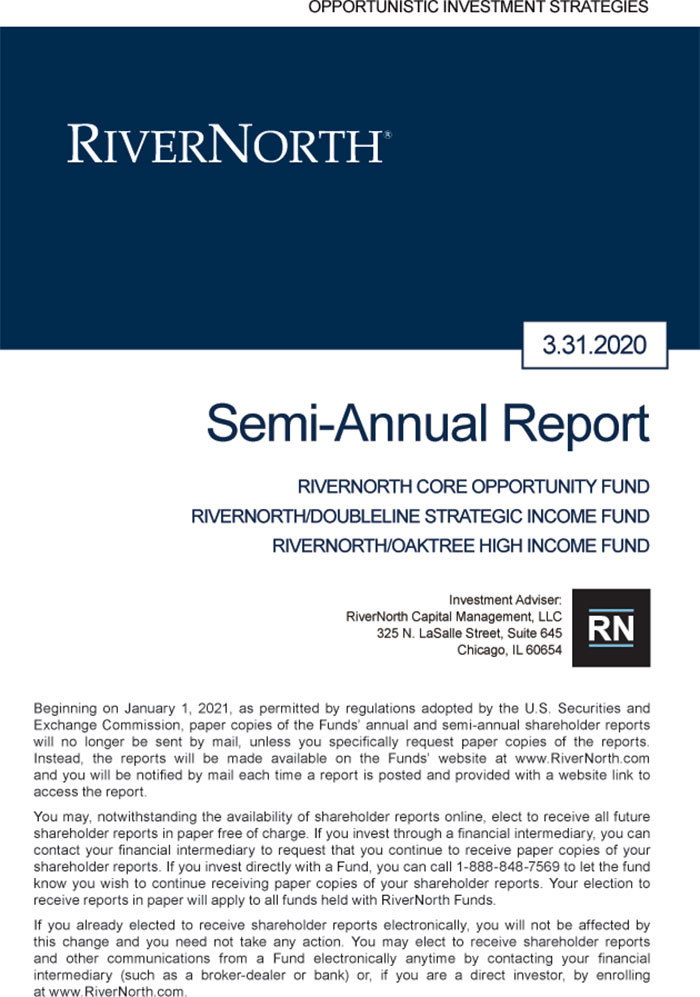
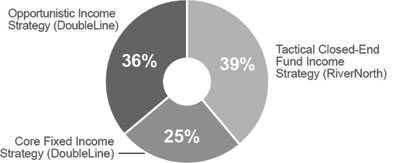
RiverNorth Core Opportunity Fund
The classifications and breakouts of the Fund’s portfolio shown below are made by the Adviser as of March 31, 2020.
Investment Vehicle Allocation(1)(percentages are based on net assets)
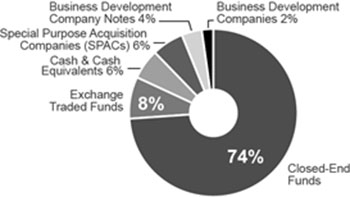
Asset Class Allocation(1)(percentages are based on net assets)
The allocation does not add up to 100% as it reflects the estimated leverage utilized by the underlying funds.
| 2 | (888) 848-7569 | www.rivernorth.com |
RiverNorth Funds | Portfolio Update |
March 31, 2020 (Unaudited)
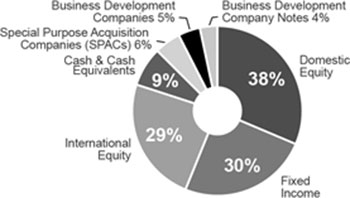
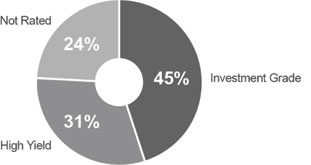
Fixed Income Allocation(1)(2) (percentages are based on net assets)
The allocation does not add up to 100% due to rounding.
| (1) | Borrowing Risk – borrowings increase fund expenses and are subject to repayment, possibly at inopportune times. Closed-End Fund Risk – closed-end funds are exchange traded and may trade at a discount to their net asset values and may deploy leverage. Convertible Security Risk – the market value of convertible securities adjusts with interest rates and the value of the underlying stock. Correlation Risk – the fund allocates its investments among different asset classes. Cyber Security Risk – operational and information security risks resulting from breaches in cyber security. Derivatives Risk – derivatives are subject to counterparty risk. Economic and Market Events Risk – events in certain sectors may result in an unusually high degree of volatility in the financial markets. Equity Risk – equity securities may experience volatility and the value of equity securities may move in opposite directions from each other and from other equity markets generally. Exchange-Traded Fund (“ETF”) Risk – ETFs do not sell individual shares directly to investors and only issue their shares in large blocks known as “creation units.” The investor purchasing a creation unit may sell the individual shares on a secondary market. Exchange Traded Note Risk – exchange traded notes represent unsecured debt of the issuer and may be influenced by interest rates, credit ratings of the issuer or changes in value of the reference index. Fixed Income Risk – the market value of fixed income securities adjusts with interest rates and the securities are subject to issuer default. Foreign/Emerging Market Risk – foreign securities may be subject to inefficient or volatile markets, different regulatory regimes or different tax policies. These risks may be enhanced in emerging markets. Investment Style Risk – investment strategies may come in and out of favor with investors and may underperform or outperform at times. Large Shareholder Purchase and Redemption Risk – The Fund may experience adverse effects when certain large shareholders purchase or redeem large amounts of shares of the Fund. LIBOR Risk –A transition away from the London Interbank Offered Rate (“LIBOR”) may lead to increased volatility and illiquidity in markets that are tied to LIBOR, reduced values of LIBOR-related investments, and reduced effectiveness of hedging strategies, adversely affecting the Fund’s performance or net asset value. Liquidity Risk – when there is little or no active trading market for specific types of securities, it can become more difficult to sell the securities in a timely manner at or near their perceived value. Management Risk – there is no guarantee that the adviser’s investment decisions will produce the desired results. Market Risk – economic conditions, interest rates and political events may affect the securities markets. Preferred Stock Risk – preferred stocks generally pay dividends, but may be less liquid than common stocks, have less priority than debt instruments and may be subject to redemption by the issuer. Real Estate Investment Trust (“REIT”) Risk – the value of REITs changes with the value of the underlying properties and changes in interest rates and are subject to additional fees. Security Risk – the value of the Fund may decrease in response to the activities and financial prospects of individual securities in the Fund’s portfolio. Short Sale Risk – short positions are speculative, are subject to transaction costs and are riskier than long positions in securities. Small-Cap Risk – small-cap companies are more susceptible to failure, are often thinly traded and have more volatile stock prices. Special Purpose Acquisition Companies (“SPACs”) Risk – investments in SPACs may be illiquid and/or be subject to restrictions on resale. Structured Notes Risk – because of the imbedded derivative feature, structured notes are subject to more risk than investing in a simple note or bond. Swap Risk – swap agreements are subject to counterparty default risk and may not perform as intended. Tax Risk – new federal or state governmental action could adversely affect the tax-exempt status of securities held by the Fund, resulting in higher tax liability for shareholders and potentially hurting Fund performance as well. Underlying Fund Risk – underlying funds have additional fees, may utilize leverage, may not correlate to an intended index and may trade at a discount to their net asset values. |
Semi-Annual Report | March 31, 2020 | 3 |
RiverNorth Funds | Portfolio Update |
March 31, 2020 (Unaudited)
| (2) | Credit quality allocation reflects a fixed-income portfolio weighted average of the credit breakdown of each closed-end fund as provided by the adviser of said closed-end fund. If a credit breakdown is not provided by the adviser, Bloomberg is used. Investment grade refers to a bond rated BBB- or higher by S&P Global Ratings (“S&P”) or Baa3 or higher by Moody’s Investors Service, Inc. (“Moody’s”). High yield refers to a bond rated lower than investment grade. For more information about securities ratings, please see the Fund’s Statement of Additional information at www.rivernorth.com. |
4 | (888) 848-7569 | www.rivernorth.com |
RiverNorth Funds | Portfolio Update |
March 31, 2020 (Unaudited)
RiverNorth/DoubleLine Strategic Income Fund
The classifications and breakouts of the Fund’s portfolio shown below are made by the Adviser as of March 31, 2020.
Strategy (“Sleeve”) Allocation
Credit Quality Distribution(1)(2) (percentages are based on net assets)
Semi-Annual Report | March 31, 2020 | 5 |
RiverNorth Funds | Portfolio Update |
March 31, 2020 (Unaudited)
Sector Breakdown(1) (percentages are based on net assets)
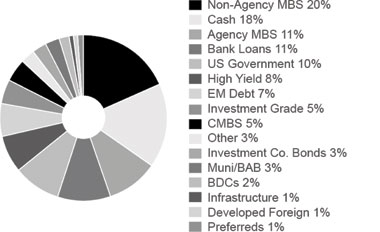
The allocation does not add up to 100% as it reflects the estimated leverage utilized by the underlying funds.
| (1) | Asset-Backed Security Risk – the risk that the value of the underlying assets will impair the value of the security. Borrowing Risk – borrowings increase fund expenses and are subject to repayment, possibly at inopportune times. Closed-End Fund Risk – closed-end funds are exchange traded and may trade at a discount to their net asset values and may deploy leverage. Convertible Security Risk – the market value of convertible securities adjusts with interest rates and the value of the underlying stock. Currency Risk – foreign currencies will rise or decline relative to the U.S. dollar. Defaulted Securities Risk – defaulted securities carry the risk of uncertainty of repayment. Derivatives Risk – derivatives are subject to counterparty risk. Economic and Market Events Risk – events in certain sectors may result in an unusually high degree of volatility in the financial markets. Equity Risk – equity securities may experience volatility and the value of equity securities may move in opposite directions from each other and from other equity markets generally. Exchange Traded Note Risk – exchange traded notes represent unsecured debt of the issuer and may be influenced by interest rates, credit ratings of the issuer or changes in value of the reference index. Fixed Income Risk – the market value of fixed income securities adjusts with interest rates and the securities are subject to issuer default. Foreign/Emerging Market Risk – foreign securities may be subject to inefficient or volatile markets, different regulatory regimes or different tax policies. These risks may be enhanced in emerging markets. Investment Style Risk – investment strategies may come in and out of favor with investors and may underperform or outperform at times. Large Shareholder Purchase and Redemption Risk – The Fund may experience adverse effects when certain large shareholders purchase or redeem large amounts of shares of the Fund. LIBOR Risk – A transition away from the London Interbank Offered Rate (“LIBOR”) may lead to increased volatility and illiquidity in markets that are tied to LIBOR, reduced values of LIBOR-related investments, and reduced effectiveness of hedging strategies, adversely affecting the Fund’s performance or net asset value. Liquidity Risk – illiquid investments may be difficult or impossible to sell. Management Risk – there is no guarantee that the adviser’s or sub-adviser’s investment decisions will produce the desired results. Market Risk –economic conditions, interest rates and political events may affect the securities markets. Mortgage-Backed Security Risk –mortgage backed securities are subject to credit risk, pre-payment risk and devaluation of the underlying collateral. Preferred Stock Risk – preferred stocks generally pay dividends, but may be less liquid than common stocks, have less priority than debt instruments and may be subject to redemption by the issuer. Rating Agency Risk – rating agencies may change their ratings or ratings may not accurately reflect a debt issuer’s creditworthiness. REIT Risk – the value of REITs changes with the value of the underlying properties and changes in interest rates and are subject to additional fees. Security Risk – The value of the Fund may decrease in response to the activities and financial prospects of individual securities in the Fund’s portfolio. Special Purpose Acquisition Companies Risk – Investments in SPACs may be illiquid and/or be subject to restrictions on resale. Structured Notes Risk – because of the imbedded derivative feature, structured notes are subject to more risk than investing in a simple note or bond. Swap Risk – swap agreements are subject to counterparty default risk and may not perform as intended. Tax Risk – new federal or state governmental action could adversely affect the tax-exempt status of securities held by the Fund, resulting in higher tax liability for shareholders and potentially hurting Fund performance as well. Underlying Fund Risk – underlying funds have additional fees, may utilize leverage, may not correlate to an intended index and may trade at a discount to their net asset values. Unrated Security Risk – Unrated securities determined by the sub-adviser to be of comparable quality to rated securities which the Fund may purchase may pay a higher interest rate than such rated securities and be subject to a greater risk of illiquidity or price changes. U.S. Government Securities Risk – There is a risk that the U.S. government will not provide financial support to its agencies, instrumentalities or sponsored enterprises if it is not obligated to do so by law. Valuation Risk – Loans and fixed-income securities are traded “over the counter” and because there is no centralized information regarding trading, the valuation of loans and fixed-income securities may vary. |
6 | (888) 848-7569 | www.rivernorth.com |
RiverNorth Funds | Portfolio Update |
March 31, 2020 (Unaudited)
| (2) | For the sleeve managed by RiverNorth Capital Management, LLC (“RiverNorth”), credit quality allocation reflects a fixed-income portfolio weighted average of the credit breakdown of each closed-end fund as provided by the advisor of said closed-end fund. If a credit breakdown is not provided by the advisor, Bloomberg is used. For the sleeves managed by DoubleLine Capital LP (“DoubleLine”), credit quality allocation is determined from the highest available credit rating from any Nationally Recognized Statistical Rating Organization (S&P, Moody’s and Fitch Ratings (“Fitch”)). Investment grade refers to a bond rated BBB- or higher by S&P or Baa3 or higher by Moody’s. High yield refers to a bond rated lower than investment grade. For more information about securities ratings, please see the Fund’s Statement of Additional Information at www.rivernorth.com. |
Semi-Annual Report | March 31, 2020 | 7 |
RiverNorth Funds | Portfolio Update |
March 31, 2020 (Unaudited)
RiverNorth/Oaktree High Income Fund
The classifications and breakouts of the Fund’s portfolio shown below are made by the Adviser as of March 31, 2020.
Strategy Allocation

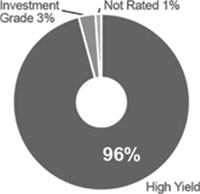
Credit Quality Distribution(1)(2) (percentages are based on net assets)
Sector Breakdown(1) (percentages are based on net assets)
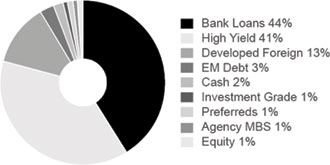
The allocation does not add up to 100% as it reflects the leverage utilized by the underlying funds.
8 | (888) 848-7569 | www.rivernorth.com |
RiverNorth Funds | Portfolio Update |
March 31, 2020 (Unaudited)
| (1) | Borrowing Risk – borrowings increase fund expenses and are subject to repayment, possibly at inopportune times. Closed-End Fund Risk – closed-end funds are exchange traded, may trade at a discount to their net asset values and may deploy leverage. Convertible Security Risk – the market value of convertible securities adjusts with interest rates and the value of the underlying stock. Credit Derivatives Risk – the use of credit derivatives is highly specialized, involves default, counterparty and liquidity risks and may not perfectly correlate to the underlying asset or liability being hedged. Currency Risk – foreign currencies will rise or decline relative to the U.S. dollar. Derivatives Risk – derivatives are subject to counterparty risk. Distressed and Defaulted Securities Risk – defaulted securities carry the risk of uncertainty of repayment. Economic and Market Events Risk – events in certain sectors may result in an unusually high degree of volatility in the financial markets. Equity Risk – equity securities may experience volatility and the value of equity securities may move in opposite directions from each other and from other equity markets generally. Exchange Traded Note Risk – exchange traded notes represent unsecured debt of the issuer and may be influenced by interest rates, credit ratings of the issuer or changes in value of the reference index. Fixed Income Risk – the market value of fixed income securities adjusts with interest rates and the securities are subject to issuer default. Floating Interest Rate Risk – loans pay interest based on the London Interbank Offered Rate (LIBOR) and a decline in LIBOR could negatively impact the Fund’s return. Foreign/Emerging Market Risk – foreign securities may be subject to inefficient or volatile markets, different regulatory regimes or different tax policies. These risks may be enhanced in emerging markets. High Portfolio Turnover Risk – May increase the Fund’s brokerage commission costs, which would reduce performance. Investment Style Risk – investment strategies may come in and out of favor with investors and may underperform or outperform at times. Large Shareholder Purchase and Redemption Risk – The Fund may experience adverse effects when certain large shareholders purchase or redeem large amounts of shares of the Fund. LIBOR Risk – A transition away from LIBOR may lead to increased volatility and illiquidity in markets that are tied to LIBOR, reduced values of LIBOR-related investments, and reduced effectiveness of hedging strategies, adversely affecting the Fund’s performance or net asset value. Liquidity Risk – illiquid investments may be difficult or impossible to sell. Loans Risk – loans may be unrated or rated below investment grade and the pledged collateral may lose value. Secondary trading in loans is not fully-developed and may result in illiquidity. Management Risk – there is no guarantee that the adviser’s or sub-adviser’s investment decisions will produce the desired results. Market Risk – economic conditions, interest rates and political events may affect the securities markets. Preferred Stock Risk – preferred stocks generally pay dividends, but may be less liquid than common stocks, have less priority than debt instruments and may be subject to redemption by the issuer. REIT Risk – the value of REITs changes with the value of the underlying properties and changes in interest rates and are subject to additional fees. Security Risk – the value of the Fund may increase or decrease in response to the prospects of the issuers of securities and loans held in the Fund. Settlement Risk – Transactions in loans may settle on a delayed basis and the proceeds from the sale of loans may not be readily available to make additional investments or to meet the Fund’s redemption obligations. Special Purpose Acquisition Companies Risk – Investments in SPACs may be illiquid and/or be subject to restrictions on resale. Swap Risk – swap agreements are subject to counterparty default risk and may not perform as intended. Tax Risk – new federal or state governmental action could adversely affect the tax-exempt status of securities held by the Fund, resulting in higher tax liability for shareholders and potentially hurting Fund performance as well. Underlying Fund Risk – underlying funds have additional fees, may utilize leverage, may not correlate to an intended index and may trade at a discount to their net asset values. Valuation Risk – Loans and fixed-income securities are traded “over the counter” and because there is no centralized information regarding trading, the valuation of loans and fixed-income securities may vary. |
Semi-Annual Report | March 31, 2020 | 9 |
RiverNorth Funds | Portfolio Update |
March 31, 2020 (Unaudited)
| (2) | For the sleeve managed by RiverNorth, credit quality allocation reflects a fixed-income portfolio weighted average of the credit breakdown of each closed-end fund as provided by the advisor of said closed-end fund. If a credit breakdown is not provided by the advisor, Bloomberg is used. For the sleeves managed by Oaktree Capital Management, L.P. (“Oaktree”), the sub-adviser uses a proprietary credit scoring matrix to rank potential investments. This process offers a systematic way of reviewing the key quantitative and qualitative variables impacting credit quality for each investment. Investment grade refers to a bond rated BBB- or higher by S&P or Baa3 or higher by Moody’s. High yield refers to a bond rated lower than investment grade. For more information about securities ratings, please see the Fund’s Statement of Additional Information at www.rivernorth.com. |
10 | (888) 848-7569 | www.rivernorth.com |
RiverNorth Funds | Disclosure of Fund Expenses |
March 31, 2020 (Unaudited)
Expense Example
As a shareholder of the RiverNorth Funds (the “Trust” or “Funds”), you incur two types of costs: (1) transaction costs; and (2) ongoing costs, including management fees, distribution and service (12b-1) fees and other Fund expenses. This example is intended to help you understand your ongoing costs (in dollars) of investing in the Funds and to compare these costs with the ongoing costs of investing in other mutual funds. The Example is based on an investment of $1,000 invested at the beginning of the period, October 1, 2019, and held for the six months ended March 31, 2020.
Actual Expenses
The first line of the table below provides information about actual account values and actual expenses. You may use the information in this line, together with the amount you invested, to estimate the expenses that you paid over the period. Simply divide your variable account value by $1,000 (for example, an $8,600 account value divided by $1,000 = 8.6), then multiply the result by the number in the first line under the heading entitled “Expenses Paid During Period” to estimate the expenses you paid on your account during this period.
Hypothetical Example for Comparison Purposes
The second line of the table below provides information about hypothetical account values and hypothetical expenses based on each Fund’s actual expense ratio and an assumed rate of return of 5% per year before expenses, which is not each Fund’s actual return. The hypothetical account values and expenses may not be used to estimate the actual ending account balance or expenses you paid for the period. You may use this information to compare the ongoing costs of investing in each Fund and other funds. To do so, compare these 5% hypothetical examples with the 5% hypothetical examples that appear in the shareholder reports of other funds.
Please note that the expenses shown in the table below are meant to highlight your ongoing costs only and do not reflect any transactional costs, such as redemption fees. Therefore, the second line for each share class of each Fund within the table is useful in comparing ongoing costs only, and will not help you determine the relative total costs of owning different funds. If these transactional costs were included, your costs would have been higher.
Semi-Annual Report | March 31, 2020 | 11 |
RiverNorth Funds | Disclosure of Fund Expenses |
March 31, 2020 (Unaudited)
| Beginning
Account Value
10/01/2019 | Ending
Account Value
03/31/2020 | Expense
Ratio(a) | Expenses
Paid During
Period(b) |
RiverNorth Core Opportunity Fund | | | | |
Class I Shares | | | | |
Actual | $1,000.00 | $793.70 | 1.26% | $5.65 |
Hypothetical (5% return before expenses) | $1,000.00 | $1,018.70 | 1.26% | $6.36 |
Class R Shares | | | | |
Actual | $1,000.00 | $793.00 | 1.51% | $6.77 |
Hypothetical (5% return before expenses) | $1,000.00 | $1,017.45 | 1.51% | $7.62 |
RiverNorth/DoubleLine Strategic Income Fund | | | | |
Class I Shares | | | | |
Actual | $1,000.00 | $937.70 | 0.86% | $4.17 |
Hypothetical (5% return before expenses) | $1,000.00 | $1,020.70 | 0.86% | $4.34 |
Class R Shares | | | | |
Actual | $1,000.00 | $936.60 | 1.11% | $5.37 |
Hypothetical (5% return before expenses) | $1,000.00 | $1,019.45 | 1.11% | $5.60 |
RiverNorth/Oaktree High Income Fund | | | | |
Class I Shares | | | | |
Actual | $1,000.00 | $883.30 | 1.35% | $6.36 |
Hypothetical (5% return before expenses) | $1,000.00 | $1,018.25 | 1.35% | $6.81 |
Class R Shares | | | | |
Actual | $1,000.00 | $882.10 | 1.60% | $7.53 |
Hypothetical (5% return before expenses) | $1,000.00 | $1,017.00 | 1.60% | $8.07 |
| (a) | Annualized, based on the Fund’s most recent fiscal half-year expenses. |
| (b) | Expenses are equal to the Fund’s annualized expense ratio multiplied by the average account value over the period, multiplied by the number of days in the most recent fiscal half year (183), then divided by 366. Note this expense example is typically based on a six-month period. |
12 | (888) 848-7569 | www.rivernorth.com |
RiverNorth Core Opportunity Fund | Schedule of Investments |
March 31, 2020 (Unaudited)
Shares/Description | | Value |
CLOSED-END FUNDS - 73.12% | | | | |
378,618 | | | Aberdeen Emerging Markets Equity Income Fund, Inc. | | $ | 1,961,241 | |
836,327 | | | Aberdeen Total Dynamic Dividend Fund | | | 5,503,032 | |
584,521 | | | AllianzGI NFJ Dividend Interest & Premium Strategy Fund | | | 5,617,247 | |
36,137 | | | Alpine Global Dynamic Dividend Fund | | | 265,246 | |
7,670 | | | Barings Global Short Duration High Yield Fund | | | 85,367 | |
1,042 | | | BlackRock 2022 Global Income Opportunity Trust | | | 7,898 | |
64,802 | | | BlackRock Floating Rate Income Trust | | | 635,708 | |
288,832 | | | BlackRock Global Opportunities Equity Trust | | | 2,394,417 | |
284,551 | | | BlackRock International Growth | | | 1,280,479 | |
257,187 | | | BlackRock Resources & Commodities Strategy Trust | | | 1,296,222 | |
107,813 | | | BrandywineGLOBAL -Global Income Opportunities Fund, Inc. | | | 1,136,349 | |
47,862 | | | Clough Global Equity Fund | | | 423,579 | |
312,721 | | | Clough Global Opportunities Fund | | | 2,242,210 | |
150,823 | | | Cohen & Steers Quality Income Realty Fund, Inc. | | | 1,363,440 | |
152,537 | | | Eagle Growth & Income Opportunities Fund | | | 1,616,892 | |
140,647 | | | Eaton Vance Limited Duration Income Fund | | | 1,486,639 | |
53,071 | | | Highland Global Allocation Fund | | | 230,859 | |
145,923 | | | Highland Income Fund | | | 1,244,723 | |
43,659 | | | Invesco Dynamic Credit Opportunities Fund | | | 348,399 | |
169,448 | | | Kayne Anderson MLP/Midstream Investment Co. | | | 615,096 | |
75,332 | | | NexPoint Credit Strategies Fund | | | 622,242 | |
159,825 | | | Nuveen Credit Strategies Income Fund | | | 906,208 | |
15,896 | | | Nuveen Intermediate Duration Quality Municipal Term Fund | | | 211,894 | |
63,888 | | | PGIM Global High Yield Fund, Inc. | | | 706,601 | |
102,192 | | | PIMCO Energy & Tactical Credit Opportunities Fund | | | 548,771 | |
185,750 | | | Royce Micro-Cap Trust, Inc. | | | 1,032,770 | |
161,805 | | | Royce Value Trust, Inc. | | | 1,564,654 | |
86,508 | | | Source Capital, Inc. | | | 2,654,931 | |
630,724 | | | Sprott Focus Trust, Inc. | | | 3,178,849 | |
26,457 | | | Templeton Emerging Markets Fund | | | 294,996 | |
127,596 | | | Templeton Global Income Fund | | | 682,639 | |
107,003 | | | Voya Emerging Markets High Income Dividend Equity Fund | | | 623,827 | |
754,382 | | | Voya Global Equity Dividend and Premium Opportunity Fund | | | 3,439,982 | |
276 | | | Voya International High Dividend Equity Income Fund | | | 1,057 | |
34,680 | | | Western Asset Emerging Markets Debt Fund, Inc. | | | 365,180 | |
110,309 | | | Western Asset Global High Income Fund, Inc. | | | 825,111 | |
197,652 | | | Western Asset High Income Opportunity Fund, Inc. | | | 832,115 | |
2,219 | | | Western Asset Variable Rate Strategic Fund, Inc. | | | 30,644 | |
| | | | | | | |
TOTAL CLOSED-END FUNDS | | | |
(Cost $65,465,753) | | 48,277,514 | |
| | | |
BUSINESS DEVELOPMENT COMPANIES -2.23% | | | | |
27,100 | | | Ares Capital Corp. | | | 292,138 | |
See Notes to Financial Statements.
Semi-Annual Report | March 31, 2020 | 13 |
RiverNorth Core Opportunity Fund | Schedule of Investments |
March 31, 2020 (Unaudited)
Shares/Description | | Value |
157,820 | | | Barings BDC, Inc. | | | $ | 1,180,494 | |
| | | | | | | | |
TOTAL BUSINESS DEVELOPMENT COMPANIES | | | |
(Cost $1,820,903) | | 1,472,632 | |
| | | |
COMMON STOCKS - 4.83% | | | |
13,110 | | | Agba Acquisition, Ltd.(a) | | | | 129,789 | |
6,581 | | | Amplitude Healthcare Acquisition Corp.(a) | | | | 64,165 | |
29,944 | | | Churchill Capital Corp. II(a) | | | | 302,434 | |
2,646 | | | CIIG Merger Corp.(a) | | | | 25,931 | |
9,711 | | | Far Point Acquisition Corp., Class A(a) | | | | 98,275 | |
75,837 | | | Gordon Pointe Acquisition Corp.(a) | | | | 803,872 | |
9,077 | | | Greenvision Acquisition Corp.(a) | | | | 86,232 | |
1,323 | | | Healthcare Merger Corp.(a) | | | | 13,627 | |
9,409 | | | InterPrivate Acquisition Corp.(a) | | | | 93,055 | |
5,163 | | | Landcadia Holdings II, Inc.(a) | | | | 50,597 | |
41,843 | | | Leisure Acquisition Corp.(a) | | | | 456,507 | |
12,752 | | | LF Capital Acquisition Corp., Class A(a) | | | | 130,708 | |
10,614 | | | LIV Capital Acquisition Corp.(a) | | | | 104,017 | |
10,753 | | | Merida Merger Corp. I(a) | | | | 104,197 | |
32,602 | | | Pure Acquisition Corp.(a) | | | | 338,735 | |
19,571 | | | South Mountain Merger Corp.(a) | | | | 194,731 | |
18,162 | | | VectoIQ Acquisition Corp.(a) | | | | 193,244 | |
| | | | | | | | |
TOTAL COMMON STOCKS | | | |
(Cost $2,995,578) | | 3,190,116 | |
| | | |
EXCHANGE TRADED FUNDS -7.73% | | | |
178,753 | | | Invesco FTSE RAFI Emerging Markets Portfolio | | | | 2,758,159 | |
70,000 | | | Vanguard® FTSE Emerging Markets ETF | | | | 2,348,500 | |
| | | | | | | | |
TOTAL EXCHANGE TRADED FUNDS | | | |
(Cost $6,435,885) | | 5,106,659 | |
| | | |
PREFERRED STOCKS - 1.16% | | | |
42,535 | | | PennantPark Investment Corp., 5.500%, 10/15/2024 | | | | 765,630 | |
| | | | | | | | |
TOTAL PREFERRED STOCKS | | | |
(Cost $1,062,582) | | 765,630 | |
Shares/Description | | Rate | | | Maturity | | | Value | |
BUSINESS DEVELOPMENT COMPANY NOTES -1.35% | | | | | | |
United States - 1.35% | | | | | | | | | |
4,420 | | | Monroe Capital Corp. | | | | 5.75% | | | 10/31/2023 | | | 87,527 | |
8,145 | | | Portman Ridge Finance Corp. | | | | 6.13% | | | 09/30/2022 | | | 181,634 | |
See Notes to Financial Statements.
14 | (888) 848-7569 | www.rivernorth.com |
RiverNorth Core Opportunity Fund | Schedule of Investments |
March 31, 2020 (Unaudited)
Shares/Description | | Rate | | | Maturity | | | Value | |
4,687 | | | THL Credit, Inc. | | | | 6.75% | | | 12/30/2022 | | $ | 98,427 | |
24,155 | | | TriplePoint Venture Growth BDC Corp. | | | | 5.75% | | | 07/15/2022 | | | 525,371 | |
| | | | | | | | | | | | | 892,959 | |
| | | | | | |
TOTAL BUSINESS DEVELOPMENT COMPANY NOTES | | | | | | |
(Cost $972,160) | | | | | | | | 892,959 | |
Principal Amount/Description | | | Rate | | Maturity | | Value | |
CONVERTIBLE CORPORATE BONDS -1.33% | | | | | | | | | | | |
$ | 500,000 | | | New Mountain Finance Corp. | | | | 5.75% | | | 08/15/2023 | | | 410,052 | |
500,000 | | | TPG Specialty Lending, Inc. | | | | 4.50% | | | 08/01/2022 | | | 465,035 | |
| | | | | | | | | | | |
TOTAL CONVERTIBLE CORPORATE BONDS | | | | | | | | | | | |
(Cost $892,546) | | | | | | | | | | 875,087 | |
Shares/Description | | Value |
RIGHTS - 0.02%(a) | | | |
35,274 | | | Big Rock Partners Acquisition Corp., Strike Price 11.50, Expires 12/31/2049 | | | | 3,210 | |
56,421 | | | Pensare Acquisition Corp., Strike Price 11.50, Expires 08/08/2022 | | | | 7,899 | |
| | | |
TOTAL RIGHTS | | | |
(Cost $35,880) | | 11,109 | |
| | | |
WARRANTS - 0.23%(a) | | | |
17,637 | | | Big Rock Partners Acquisition Corp., Strike Price 11.50, Expires 12/01/2022 | | | | 1,145 | |
18,195 | | | Brooge Holdings, Ltd., Strike Price 11.50, Expires 07/14/2023 | | | | 14,556 | |
3,237 | | | Far Point Acquisition Corp., Strike Price 11.50, Expires 06/03/2025 | | | | 1,748 | |
75,837 | | | Gordon Pointe Acquisition Corp., Strike Price 11.50, Expires 07/30/2024 | | | | 10,617 | |
14,758 | | | Immunovant, Inc., Strike Price 11.50, Expires 12/18/2024 | | | | 35,419 | |
37,631 | | | International General Insurance Holdings, Ltd., Strike Price 11.50, Expires 03/17/2025 | | | | 15,805 | |
26,164 | | | Legacy Acquisition Corp., Strike Price 11.50, Expires 12/01/2022 | | | | 6,541 | |
20,922 | | | Leisure Acquisition Corp., Strike Price 11.50, Expires 12/28/2022 | | | | 1,883 | |
12,752 | | | LF Capital Acquisition Corp., Strike Price 11.50, Expires 06/28/2023 | | | | 2,321 | |
5,376 | | | Merida Merger Corp. I, Strike Price 11.50, Expires 11/07/2026 | | | | 2,688 | |
82,651 | | | Opes Acquisition Corp., Strike Price 11.50, Expires 01/16/2023 | | | | 4,132 | |
28,195 | | | Pensare Acquisition Corp., Strike Price 11.50, Expires 08/08/2022 | | | | 1,410 | |
16,301 | | | Pure Acquisition Corp., Strike Price 11.50, Expires 04/17/2023 | | | | 16,138 | |
19,178 | | | Trident Acquisitions Corp., Strike Price 11.50, Expires 06/14/2021 | | | | 1,822 | |
See Notes to Financial Statements.
Semi-Annual Report | March 31, 2020 | 15 |
RiverNorth Core Opportunity Fund | Schedule of Investments |
March 31, 2020 (Unaudited)
Shares/Description | | Value | |
18,162 | | | VectoIQ Acquisition Corp., Strike Price 11.50, Expires 06/12/2023 | | | $ | 35,416 | |
| | | |
TOTAL WARRANTS | | | |
(Cost $215,915) | | 151,641 | |
| | | |
SHORT-TERM INVESTMENTS -4.99% | | | |
Money Market Fund - 4.99% | | | |
3,297,015 | | | State Street Institutional Trust (7 Day Yield 0.61%) | | 3,297,015 | |
| | | |
TOTAL SHORT-TERM INVESTMENTS | | | |
(Cost $3,297,015) | | 3,297,015 | |
| | | |
TOTAL INVESTMENTS - 96.99% | | | |
(Cost $83,194,217) | | 64,040,362 | |
OTHER ASSETS IN EXCESS OF LIABILITIES -3.01% | | 1,985,032 | |
NET ASSETS - 100.00% | $ | 66,025,394 | |
(a) | Non-income producing security. |
See Notes to Financial Statements.
16 | (888) 848-7569 | www.rivernorth.com |
RiverNorth/DoubleLine Strategic Income Fund | Schedule of Investments |
March 31, 2020 (Unaudited)
Shares/Description | | Value |
CLOSED-END FUNDS - 20.77% | | | |
715,694 | | | Aberdeen Asia-Pacific Income Fund, Inc. | | | $ | 2,419,046 | |
359,764 | | | Advent Convertible and Income | | | | 3,827,889 | |
1,313,394 | | | AllianceBernstein Global High Income Fund, Inc. | | | | 12,162,028 | |
465,207 | | | Ares Dynamic Credit Allocation Fund, Inc. | | | | 5,019,584 | |
167,281 | | | BlackRock Corporate High Yield Fund, Inc. | | | | 1,472,073 | |
1,299,457 | | | BlackRock Credit Allocation Income Trust | | | | 15,151,669 | |
1,444,674 | | | BlackRock Debt Strategies Fund, Inc. | | | | 12,207,495 | |
382,671 | | | BlackRock Floating Rate Income Strategies Fund, Inc. | | | | 3,830,537 | |
85,914 | | | BlackRock Limited Duration Income Trust | | | | 1,084,235 | |
78,154 | | | BlackRock Multi-Sector Income Trust | | | | 943,319 | |
179,567 | | | BlackRock Municipal 2020 Term Trust | | | | 2,634,248 | |
778,874 | | | BrandywineGLOBAL -Global Income Opportunities Fund, Inc. | | | | 8,209,332 | |
457,859 | | | Eaton Vance Floating-Rate Income Trust | | | | 4,693,055 | |
2,729,979 | | | Eaton Vance Limited Duration Income Fund | | | | 28,855,878 | |
775,258 | | | Eaton Vance Senior Income Trust | | | | 3,573,939 | |
687,031 | | | First Trust High Income Long/Short Fund | | | | 8,361,167 | |
835,840 | | | Highland Income Fund | | | | 7,129,715 | |
1,472,092 | | | Invesco Dynamic Credit Opportunities Fund | | | | 11,747,294 | |
2,024,713 | | | Invesco Senior Income Trust | | | | 6,519,576 | |
1,013,845 | | | Morgan Stanley Emerging Markets Domestic Debt Fund, Inc. | | | | 5,282,132 | |
125,214 | | | Nuveen AMT-Free Quality Municipal Income Fund | | | | 1,695,398 | |
2,499,497 | | | Nuveen Credit Strategies Income Fund | | | | 14,172,148 | |
378,750 | | | Nuveen Dividend Advantage Municipal Income Fund | | | | 5,560,050 | |
354,427 | | | Nuveen Floating Rate Income Fund | | | | 2,675,924 | |
468,233 | | | Nuveen Floating Rate Income Opportunity Fund | | | | 3,478,971 | |
610,577 | | | Nuveen Global High Income Fund | | | | 6,826,251 | |
1,445,261 | | | Nuveen Quality Municipal Income Fund | | | | 19,857,886 | |
892,908 | | | PGIM Global High Yield Fund, Inc. | | | | 9,875,562 | |
718,731 | | | PGIM High Yield Bond Fund, Inc. | | | | 8,322,905 | |
32,273 | | | PIMCO Dynamic Credit Income Fund | | | | 542,832 | |
127,614 | | | Putnam Municipal Opportunities Trust | | | | 1,522,435 | |
626,072 | | | Templeton Emerging Markets Income Fund | | | | 4,683,019 | |
3,550,669 | | | Templeton Global Income Fund | | | | 18,996,079 | |
320,802 | | | Voya Prime Rate Trust | | | | 1,190,175 | |
1,290,767 | | | Western Asset Emerging Markets Debt Fund, Inc. | | | | 13,591,776 | |
1,580,589 | | | Western Asset Global High Income Fund, Inc. | | | | 11,822,806 | |
1,158,997 | | | Western Asset High Income Fund II, Inc. | | | | 5,806,575 | |
7,319,433 | | | Western Asset High Income Opportunity Fund, Inc. | | | | 30,814,813 | |
158,316 | | | Western Asset High Yield Defined Opportunity Fund, Inc. | | | | 1,952,036 | |
4,861,299 | | | Western Asset Inflation-Linked Opportunities & Income Fund | | | | 46,474,018 | |
| | | |
TOTAL CLOSED-END FUNDS | | | |
(Cost $413,778,459) | | 354,985,870 | |
See Notes to Financial Statements.
Semi-Annual Report | March 31, 2020 | 17 |
RiverNorth/DoubleLine Strategic Income Fund | Schedule of Investments |
March 31, 2020 (Unaudited)
Shares/Description | | | Value | |
BUSINESS DEVELOPMENT COMPANIES -0.70% | | | | | |
793,073 | | | Ares Capital Corp. | | | $ | 8,549,327 | |
450,876 | | | Barings BDC, Inc. | | | | 3,372,552 | |
| | | | | |
TOTAL BUSINESS DEVELOPMENT COMPANIES | | | | | |
(Cost $12,173,501) | | | | 11,921,879 | |
| | | | | | | | |
COMMON STOCKS - 0.35% | | | | | |
12,164 | | | Frontera Energy Corp. | | | | 30,045 | |
469,471 | | | Golub Capital BDC, Inc. | | | | 5,896,556 | |
1,662 | | | McDermott International, Inc.(a)(b) | | | | – | |
| | | | | |
TOTAL COMMON STOCKS | | | | | |
(Cost $6,363,478) | | | | 5,926,601 | |
| | | | | | | | |
OPEN-END FUNDS - 1.55% | | | | | |
3,235,981 | | | RiverNorth/Oaktree High Income Fund, Class I(c) | | | | 26,520,160 | |
| | | | | |
TOTAL OPEN-END FUNDS | | | | | |
(Cost $31,572,406) | | | | 26,520,160 | |
| | | | | | | | |
PREFERRED STOCKS - 1.42% | | | | | |
333,397 | | | Allianzgi Convertible & Income Fund, Series A, 5.625%(d) | | | | 8,264,912 | |
316,636 | | | Hercules Capital, Inc., 5.250%, 04/30/2025 | | | | 7,757,582 | |
188,696 | | | New Mountain Finance Corp., 5.750%, 10/01/2023 | | | | 4,055,077 | |
233,620 | | | PennantPark Investment Corp., 5.500%, 10/15/2024 | | | | 4,205,160 | |
| | | | | |
TOTAL PREFERRED STOCKS | | | | | |
(Cost $26,341,718) | | | | 24,282,731 | |
Shares/Description | | Rate | | | Maturity | | | Value |
BUSINESS DEVELOPMENT COMPANY NOTES -1.02% | | | | | | | |
United States - 1.02% | | | | | | | | | | |
194,239 | | | Portman Ridge Finance Corp. | | | | 6.13% | | | 09/30/2022 | | | | 4,331,530 | |
179,152 | | | THL Credit, Inc. | | | | 6.75% | | | 12/30/2022 | | | | 3,762,192 | |
208,354 | | | THL Credit, Inc. | | | | 6.13% | | | 10/30/2023 | | | | 4,192,103 | |
237,249 | | | TriplePoint Venture Growth BDC Corp. | | | | 5.75% | | | 07/15/2022 | | | | 5,160,166 | |
| | | | | | | | | | | | | | 17,445,991 | |
| | | | | | | |
TOTAL BUSINESS DEVELOPMENT COMPANY NOTES | | | | | | | |
(Cost $19,904,219) | | | | | | | | | 17,445,991 | |
See Notes to Financial Statements.
18 | (888) 848-7569 | www.rivernorth.com |
| RiverNorth/DoubleLine Strategic Income Fund | Schedule of Investments |
March 31, 2020 (Unaudited)
| Principal Amount/Description | | Rate | | Maturity | | Value | |
| FOREIGN CORPORATE BONDS -4.63% | | | | | | | | |
| Argentina - 0.12% | | | | | | | | |
| $ | 150,000 | | AES Argentina Generacion SA(e) | | 7.75% | | 02/02/2024 | | $ | 85,838 | |
| | 750,000 | | Banco Macro SA(e)(f) | | 6.75% | | 11/04/2026 | | | 457,508 | |
| | 150,000 | | Capex SA(e) | | 6.88% | | 05/15/2024 | | | 100,313 | |
| | 650,000 | | Cia General de Combustibles SA(e) | | 9.50% | | 11/07/2021 | | | 460,655 | |
| | 150,000 | | Pampa Energia SA(g) | | 9.13% | | 04/15/2029 | | | 101,033 | |
| | 150,000 | | Pampa Energia SA(e) | | 7.50% | | 01/24/2027 | | | 101,200 | |
| | 450,000 | | Pampa Energia SA(e) | | 9.13% | | 04/15/2029 | | | 303,098 | |
| | 575,629 | | Stoneway Capital Corp.(e) | | 10.00% | | 03/01/2027 | | | 86,350 | |
| | 100,000 | | YPF SA(g) | | 8.50% | | 06/27/2029 | | | 52,854 | |
| | 450,000 | | YPF SA(e) | | 8.50% | | 07/28/2025 | | | 236,135 | |
| | 200,000 | | YPF SA(e) | | 6.95% | | 07/21/2027 | | | 104,769 | |
| | | | | | | | | | | 2,089,753 | |
| Australia - 0.22% | | | | | | | | |
| | 1,000,000 | | APT Pipelines, Ltd.(g) | | 4.25% | | 07/15/2027 | | | 1,043,472 | |
| | 850,000 | | Commonwealth Bank of Australia(g) | | 4.32% | | 01/10/2048 | | | 837,917 | |
| | 110,000 | | Macquarie Group, Ltd.(f)(g) | | 3M US L + 1.02% | | 11/28/2023 | | | 112,889 | |
| | 705,000 | | Macquarie Group, Ltd.(f)(g) | | 3M US L + 1.33% | | 03/27/2024 | | | 738,613 | |
| | 500,000 | | Sydney Airport Finance Co. Pty, Ltd.(g) | | 3.38% | | 04/30/2025 | | | 496,285 | |
| | 500,000 | | Sydney Airport Finance Co. Pty, Ltd.(g) | | 3.63% | | 04/28/2026 | | | 537,057 | |
| | | | | | | | | | | 3,766,233 | |
| Austria - 0.04% | | | | | | | | |
| | 200,000 | | JBS Investments II GmbH(g) | | 7.00% | | 01/15/2026 | | | 200,408 | |
| | 600,000 | | Klabin Austria GmbH(e) | | 7.00% | | 04/03/2049 | | | 554,400 | |
| | | | | | | | | | | 754,808 | |
| Brazil - 0.17% | | | | | | | | |
| | 1,450,000 | | Banco do Brasil SA(d)(e)(f) | | 6.25% | | Perpetual Maturity | | | 1,145,863 | |
| | 1,050,000 | | CSN Islands XII Corp.(d)(e) | | 7.00% | | Perpetual Maturity | | | 630,320 | |
| | 300,000 | | CSN Resources SA(g) | | 7.63% | | 04/17/2026 | | | 197,026 | |
| | 200,000 | | Globo Comunicacao e Participacoes SA(g) | | 4.88% | | 01/22/2030 | | | 171,950 | |
| | 200,000 | | Globo Comunicacao e Participacoes SA(e) | | 4.84% | | 06/08/2025 | | | 183,051 | |
| | 200,000 | | Nexa Resources SA(e) | | 5.38% | | 05/04/2027 | | | 155,712 | |
| | 600,000 | | Oi SA(h) | | 10.00% (4.00%) | | 07/27/2025 | | | 414,747 | |
| | | | | | | | | | | 2,898,669 | |
| British Virgin Islands - 0.07% | | | | | | | | |
| | 300,000 | | C10 Capital SPV, Ltd.(d)(e)(f) | | 3M US L + 4.71% | | Perpetual Maturity | | | 237,750 | |
See Notes to Financial Statements.
| Semi-Annual Report | March 31, 2020 | 19 |
| RiverNorth/DoubleLine Strategic Income Fund | Schedule of Investments |
March 31, 2020 (Unaudited)
| Principal Amount/Description | | Rate | | Maturity | | Value | |
| | | | | | | | | | | | |
| $ | 100,000 | | C10 Capital SPV, Ltd.(d)(e)(f) | | 3M US L + 4.71% | | Perpetual Maturity | | $ | 79,250 | |
| | 200,000 | | C5 Capital SPV, Ltd.(d)(e)(f) | | 3M US L + 4.28% | | Perpetual Maturity | | | 158,500 | |
| | 800,000 | | Radiant Access, Ltd.(d) | | 4.60% | | Perpetual Maturity | | | 751,400 | |
| | | | | | | | | | | 1,226,900 | |
| Canada - 0.29% | | | | | | | | |
| | 675,000 | | Bank of Montreal(f) | | 3.80% | | 12/15/2032 | | | 656,181 | |
| | 140,000 | | Bombardier, Inc.(g) | | 6.00% | | 10/15/2022 | | | 106,050 | |
| | 1,500,000 | | Canacol Energy, Ltd.(e) | | 7.25% | | 05/03/2025 | | | 1,303,133 | |
| | 165,000 | | Garda World Security Corp.(g) | | 8.75% | | 05/15/2025 | | | 153,033 | |
| | 185,000 | | GFL Environmental, Inc.(g) | | 5.13% | | 12/15/2026 | | | 181,762 | |
| | 72,000 | | GFL Environmental, Inc.(g) | | 8.50% | | 05/01/2027 | | | 72,738 | |
| | 600,000 | | Gran Tierra Energy, Inc.(g) | | 7.75% | | 05/23/2027 | | | 156,750 | |
| | 175,000 | | Kronos Acquisition Holdings, Inc.(g) | | 9.00% | | 08/15/2023 | | | 145,030 | |
| | 205,000 | | Mattamy Group Corp.(g) | | 4.63% | | 03/01/2030 | | | 177,453 | |
| | 51,000 | | MEG Energy Corp.(g) | | 7.00% | | 03/31/2024 | | | 23,843 | |
| | 265,000 | | MEG Energy Corp.(g) | | 7.13% | | 02/01/2027 | | | 133,825 | |
| | 570,000 | | Nutrien, Ltd. | | 4.20% | | 04/01/2029 | | | 605,043 | |
| | 145,000 | | Parkland Fuel Corp.(g) | | 5.88% | | 07/15/2027 | | | 136,728 | |
| | 55,000 | | Telesat Canada / Telesat LLC(g) | | 6.50% | | 10/15/2027 | | | 53,105 | |
| | 280,000 | | Tervita Corp.(g) | | 7.63% | | 12/01/2021 | | | 197,890 | |
| | 750,000 | | TransCanada PipeLines, Ltd. | | 4.25% | | 05/15/2028 | | | 767,657 | |
| | | | | | | | | | | 4,870,221 | |
| Cayman Islands - 0.42% | | | | | | | | |
| | 200,000 | | Banco Bradesco SA(e) | | 5.75% | | 03/01/2022 | | | 202,937 | |
| | 910,000 | | Banco BTG Pactual SA(f)(g) | | 7.75% | | 02/15/2029 | | | 782,600 | |
| | 600,000 | | Banco BTG Pactual SA(e)(f) | | 7.75% | | 02/15/2029 | | | 519,000 | |
| | 200,000 | | Banco Mercantil del Norte SA/Grand Cayman(d)(f)(g) | | 7.50% | | Perpetual Maturity | | | 152,752 | |
| | 1,650,000 | | Banco Mercantil del Norte SA/Grand Cayman(d)(e)(f) | | 7.63% | | Perpetual Maturity | | | 1,266,911 | |
| | 1,000,000 | | CK Hutchison Capital Securities 17, Ltd.(d)(e)(f) | | 4.00% | | Perpetual Maturity | | | 952,492 | |
| | 600,000 | | CSN Islands XI Corp.(g) | | 6.75% | | 01/28/2028 | | | 386,994 | |
| | 200,000 | | Global Aircraft Leasing Co., Ltd.(g)(h) | | 6.50% (7.25%) | | 09/15/2024 | | | 130,300 | |
| | 624,000 | | Gran Tierra Energy International Holdings, Ltd.(e) | | 6.25% | | 02/15/2025 | | | 161,460 | |
| | 200,000 | | Grupo Aval, Ltd.(g) | | 4.38% | | 02/04/2030 | | | 161,250 | |
| | 879,868 | | Interoceanica IV Finance, Ltd.(e)(i) | | 0.00% | | 11/30/2025 | | | 798,480 | |
| | 700,000 | | Itau Unibanco Holding SA Island(d)(f)(g) | | 4.63% | | Perpetual Maturity | | | 574,350 | |
| | 200,000 | | Latam Finance, Ltd.(g) | | 7.00% | | 03/01/2026 | | | 92,205 | |
| | 200,000 | | Latam Finance, Ltd.(e) | | 6.88% | | 04/11/2024 | | | 90,161 | |
See Notes to Financial Statements.
| 20 | (888) 848-7569 | www.rivernorth.com |
| RiverNorth/DoubleLine Strategic Income Fund | Schedule of Investments |
March 31, 2020 (Unaudited)
| Principal Amount/Description | | Rate | | Maturity | | Value | |
| $ | 900,000 | | Latam Finance, Ltd.(e) | | 7.00% | | 03/01/2026 | | $ | 414,923 | |
| | 163,298 | | Lima Metro Line 2 Finance, Ltd.(g) | | 5.88% | | 07/05/2034 | | | 175,717 | |
| | 66,800 | | Transocean Guardian, Ltd.(g) | | 5.88% | | 01/15/2024 | | | 53,939 | |
| | 210,000 | | Transocean Poseidon, Ltd.(g) | | 6.88% | | 02/01/2027 | | | 171,563 | |
| | | | | | | | | | | 7,088,034 | |
| Chile - 0.43% | | | | | | | | |
| | 600,000 | | AES Gener SA(f)(g) | | 6.35% | | 10/07/2079 | | | 458,700 | |
| | 200,000 | | AES Gener SA(e)(f) | | 7.13% | | 03/26/2079 | | | 157,625 | |
| | 300,000 | | AES Gener SA(e)(f) | | 6.35% | | 10/07/2079 | | | 229,350 | |
| | 200,000 | | Colbun SA(e) | | 3.95% | | 10/11/2027 | | | 192,775 | |
| | 900,000 | | Empresa de Transporte de Pasajeros Metro SA(g) | | 5.00% | | 01/25/2047 | | | 909,274 | |
| | 700,000 | | Empresa Electrica Guacolda SA(e) | | 4.56% | | 04/30/2025 | | | 497,410 | |
| | 300,000 | | Empresa Nacional de Telecomunicaciones SA(e) | | 4.88% | | 10/30/2024 | | | 289,379 | |
| | 200,000 | | Engie Energia Chile SA(e) | | 4.50% | | 01/29/2025 | | | 197,955 | |
| | 1,400,000 | | Geopark, Ltd.(e) | | 6.50% | | 09/21/2024 | | | 806,743 | |
| | 650,000 | | GNL Quintero SA(e) | | 4.63% | | 07/31/2029 | | | 623,053 | |
| | 200,000 | | Inversiones CMPC SA(e) | | 4.75% | | 09/15/2024 | | | 194,133 | |
| | 200,000 | | Sociedad Quimica y Minera de Chile SA(e) | | 4.38% | | 01/28/2025 | | | 193,051 | |
| | 200,000 | | Transelec SA(e) | | 4.63% | | 07/26/2023 | | | 203,801 | |
| | 200,000 | | Transelec SA(e) | | 4.25% | | 01/14/2025 | | | 191,749 | |
| | 750,000 | | Transelec SA(e) | | 3.88% | | 01/12/2029 | | | 681,977 | |
| | 200,000 | | VTR Finance BV(g) | | 6.88% | | 01/15/2024 | | | 187,000 | |
| | 1,400,000 | | VTR Finance BV(e) | | 6.88% | | 01/15/2024 | | �� | 1,309,000 | |
| | | | | | | | | | | 7,322,975 | |
| China - 0.04% | | | | | | | | |
| | 200,000 | | Agile Group Holdings, Ltd.(d)(f) | | 6.88% | | Perpetual Maturity | | | 166,990 | |
| | 295,000 | | Agile Group Holdings, Ltd.(d)(f) | | 7.75% | | Perpetual Maturity | | | 230,846 | |
| | 350,000 | | Yuzhou Properties Co., Ltd. | | 8.30% | | 05/27/2025 | | | 292,139 | |
| | | | | | | | | | | 689,975 | |
| Colombia - 0.18% | | | | | | | | |
| | 450,000 | | Banco Bilbao Vizcaya Argentaria Colombia SA(e) | | 4.88% | | 04/21/2025 | | | 428,402 | |
| | 200,000 | | Banco de Bogota SA(e) | | 5.38% | | 02/19/2023 | | | 195,751 | |
| | 200,000 | | Bancolombia SA | | 3.00% | | 01/29/2025 | | | 179,952 | |
| | 800,000 | | Bancolombia SA(f) | | 4.63% | | 12/18/2029 | | | 706,000 | |
| | 350,000 | | Credivalores-Crediservicios SAS(g) | | 8.88% | | 02/07/2025 | | | 264,075 | |
| | 100,000 | | Ecopetrol SA | | 5.88% | | 09/18/2023 | | | 98,625 | |
| | 150,000 | | Gilex Holding Sarl(g) | | 8.50% | | 05/02/2023 | | | 128,887 | |
| | 750,000 | | Gilex Holding Sarl(e) | | 8.50% | | 05/02/2023 | | | 644,434 | |
| | 200,000 | | SURA Asset Management SA(e) | | 4.88% | | 04/17/2024 | | | 197,249 | |
See Notes to Financial Statements.
| Semi-Annual Report | March 31, 2020 | 21 |
| RiverNorth/DoubleLine Strategic Income Fund | Schedule of Investments |
March 31, 2020 (Unaudited)
| Principal Amount/Description | | Rate | | Maturity | | Value | |
| $ | 200,000 | | Tecnoglass, Inc.(e) | | 8.20% | | 01/31/2022 | | $ | 169,675 | |
| | | | | | | | | | | 3,013,050 | |
| Dominican Republic - 0.04% | | | | | | | | |
| | 600,000 | | Aeropuertos Dominicanos Siglo XXI SA(e) | | 6.75% | | 03/30/2029 | | | 426,000 | |
| | 300,000 | | Banco de Reservas de la Republica Dominicana(g) | | 7.00% | | 02/01/2023 | | | 287,250 | |
| | | | | | | | | | | 713,250 | |
| Great Britain- 0.36% | | | | | | | | |
| | 710,000 | | Anglo American Capital PLC(g) | | 4.50% | | 03/15/2028 | | | 705,544 | |
| | 625,000 | | AstraZeneca PLC | | 6.45% | | 09/15/2037 | | | 898,416 | |
| | 790,000 | | Barclays PLC(f) | | 3M US L + 1.38% | | 05/16/2024 | | | 696,131 | |
| | 760,000 | | Credit Agricole SA/London(g) | | 3.75% | | 04/24/2023 | | | 775,500 | |
| | 1,230,000 | | HSBC Holdings PLC(f) | | 3M US L + 1.38% | | 09/12/2026 | | | 1,171,905 | |
| | 350,000 | | Imperial Brands Finance PLC(g) | | 3.50% | | 07/26/2026 | | | 323,829 | |
| | 730,000 | | Lloyds Banking Group PLC(f) | | 3M US L + 1.21% | | 11/07/2028 | | | 725,905 | |
| | 200,000 | | MARB BondCo PLC(e) | | 7.00% | | 03/15/2024 | | | 179,749 | |
| | 455,000 | | Royal Bank of Scotland Group PLC(f) | | 3M US L + 1.48% | | 05/15/2023 | | | 449,627 | |
| | 450,000 | | Vedanta Resources Finance II PLC(g) | | 9.25% | | 04/23/2026 | | | 191,250 | |
| | 200,000 | | Vedanta Resources Finance II PLC(e) | | 9.25% | | 04/23/2026 | | | 85,000 | |
| | | | | | | | | | | 6,202,856 | |
| Guatemala - 0.05% | | | | | | | | |
| | 200,000 | | Energuate Trust(g) | | 5.88% | | 05/03/2027 | | | 200,002 | |
| | 600,000 | | Energuate Trust(e) | | 5.88% | | 05/03/2027 | | | 600,006 | |
| | | | | | | | | | | 800,008 | |
| Hong Kong - 0.04% | | | | | | | | |
| | 200,000 | | CNOOC Finance 2013, Ltd. | | 3.00% | | 05/09/2023 | | | 204,240 | |
| | 200,000 | | RKP Overseas Finance, Ltd.(d) | | 7.95% | | Perpetual Maturity | | | 173,996 | |
| | 400,000 | | RKPF Overseas, Ltd.(d)(f) | | 7.75% | | Perpetual Maturity | | | 374,002 | |
| | | | | | | | | | | 752,238 | |
| India - 0.11% | | | | | | | | |
| | 400,000 | | Adani Ports & Special Economic Zone, Ltd.(e) | | 3.95% | | 01/19/2022 | | | 369,992 | |
| | 200,000 | | Adani Ports & Special Economic Zone, Ltd.(e) | | 3.38% | | 07/24/2024 | | | 172,070 | |
| | 200,000 | | Indian Oil Corp., Ltd. | | 5.75% | | 08/01/2023 | | | 196,693 | |
| | 950,000 | | Network i2i, Ltd.(d)(f)(g) | | 5.65% | | Perpetual Maturity | | | 769,025 | |
| | 800,000 | | Vedanta Resources, Ltd.(e) | | 6.13% | | 08/09/2024 | | | 303,410 | |
| | | | | | | | | | | 1,811,190 | |
| Indonesia - 0.13% | | | | | | | | |
| | 1,000,000 | | Perusahaan Listrik Negara PT(e) | | 5.50% | | 11/22/2021 | | | 1,013,700 | |
See Notes to Financial Statements.
| 22 | (888) 848-7569 | www.rivernorth.com |
| RiverNorth/DoubleLine Strategic Income Fund | Schedule of Investments |
March 31, 2020 (Unaudited)
| Principal Amount/Description | | Rate | | Maturity | | Value | |
| $ | 1,334,000 | | Star Energy Geothermal Wayang Windu, Ltd.(e) | | 6.75% | | 04/24/2033 | | $ | 1,212,878 | |
| | | | | | | | | | | 2,226,578 | |
| Ireland - 0.13% | | | | | | | | |
| | 760,000 | | AerCap Ireland Capital DAC / AerCap Global Aviation Trust | | 3.50% | | 01/15/2025 | | | 646,922 | |
| | 200,000 | | C&W Senior Financing DAC(g) | | 7.50% | | 10/15/2026 | | | 184,606 | |
| | 600,000 | | C&W Senior Financing DAC(e) | | 6.88% | | 09/15/2027 | | | 521,681 | |
| | 865,000 | | Shire Acquisitions Investments Ireland DAC | | 2.88% | | 09/23/2023 | | | 884,168 | |
| | | | | | | | | | | 2,237,377 | |
| Isle Of Man - 0.04% | | | | | | | | |
| | 800,000 | | Gohl Capital, Ltd. | | 4.25% | | 01/24/2027 | | | 664,058 | |
| | | | | | | | | | | | |
| Israel - 0.08% | | | | | | | | |
| | 100,000 | | Delek & Avner Tamar Bond, Ltd.(g) | | 5.08% | | 12/30/2023 | | | 98,070 | |
| | 100,000 | | Delek & Avner Tamar Bond, Ltd.(g) | | 5.41% | | 12/30/2025 | | | 95,768 | |
| | 1,100,000 | | Israel Electric Corp., Ltd.(g) | | 5.00% | | 11/12/2024 | | | 1,155,006 | |
| | | | | | | | | | | 1,348,844 | |
| Jamaica - 0.00%(j) | | | | | | | | |
| | 608,591 | | Digicel Group Two, Ltd.(g)(h) | | 7.13% (2.00%) | | 04/01/2024 | | | 65,983 | |
| | | | | | | | | | | | |
| Japan - 0.11% | | | | | | | | |
| | 805,000 | | Mitsubishi UFJ Financial Group, Inc.(f) | | 3M US L + 0.74% | | 03/02/2023 | | | 765,608 | |
| | 1,325,000 | | Sumitomo Mitsui Financial Group, Inc.(f) | | 3M US L + 0.74% | | 01/17/2023 | | | 1,189,529 | |
| | | | | | | | | | | 1,955,137 | |
| Luxembourg- 0.16% | | | | | | | | |
| | 1,200,000 | | JSL Europe SA(e) | | 7.75% | | 07/26/2024 | | | 873,054 | |
| | 200,000 | | Millicom International Cellular SA(g) | | 6.63% | | 10/15/2026 | | | 190,890 | |
| | 550,000 | | Millicom International Cellular SA(e) | | 6.25% | | 03/25/2029 | | | 495,303 | |
| | 200,000 | | Minerva Luxembourg SA(e) | | 6.50% | | 09/20/2026 | | | 183,791 | |
| | 1,050,000 | | Minerva Luxembourg SA(e) | | 5.88% | | 01/19/2028 | | | 928,148 | |
| | | | | | | | | | | 2,671,186 | |
| Malaysia - 0.08% | | | | | | | | |
| | 200,000 | | CIMB Bank Bhd(f) | | 3M US L + 0.78% | | 10/09/2024 | | | 191,595 | |
| | 400,000 | | Malayan Banking Bhd(f) | | 3M US L + 0.80% | | 08/16/2024 | | | 382,156 | |
| | 600,000 | | Malayan Banking Bhd(f) | | 3.91% | | 10/29/2026 | | | 610,200 | |
| | 200,000 | | TNB Global Ventures Capital Bhd | | 3.24% | | 10/19/2026 | | | 205,168 | |
| | | | | | | | | | | 1,389,119 | |
| Mauritius - 0.02% | | | | | | | | |
| | 400,000 | | UPL Corp., Ltd.(e) | | 3.25% | | 10/13/2021 | | | 369,990 | |
See Notes to Financial Statements.
| Semi-Annual Report | March 31, 2020 | 23 |
| RiverNorth/DoubleLine Strategic Income Fund | Schedule of Investments |
March 31, 2020 (Unaudited)
| Principal Amount/Description | | Rate | | Maturity | | Value | |
| Mexico - 0.49% | | | | | | | |
| $ | 700,000 | | | Alpha Holding SA de CV(g) | | 9.00% | | 02/10/2025 | | $ | 488,250 | |
| | 200,000 | | | Banco Santander Mexico SA Institucion de Banca Multiple Grupo Financiero Santand(f)(g) | | 5.95% | | 10/01/2028 | | | 186,291 | |
| | 500,000 | | | Banco Santander Mexico SA Institucion de Banca Multiple Grupo Financiero Santand(d)(f) | | 8.50% | | Perpetual Maturity | | | 517,500 | |
| | 1,450,000 | | | BBVA Bancomer SA(e)(f) | | 5.13% | | 01/18/2033 | | | 1,211,584 | |
| | 650,000 | | | Braskem Idesa SAPI(g) | | 7.45% | | 11/15/2029 | | | 461,006 | |
| | 200,000 | | | Cemex SAB de CV(e) | | 6.13% | | 05/05/2025 | | | 178,749 | |
| | 400,000 | | | Cemex SAB de CV(e) | | 7.75% | | 04/16/2026 | | | 360,224 | |
| | 1,453,500 | | | Cometa Energia SA de CV(e) | | 6.38% | | 04/24/2035 | | | 1,357,206 | |
| | 1,200,000 | | | Credito Real SAB de CV SOFOM ER(d)(e)(f) | | 9.13% | | Perpetual Maturity | | | 924,378 | |
| | 301,619 | | | Fermaca Enterprises S RL(e) | | 6.38% | | 03/30/2038 | | | 300,019 | |
| | 600,000 | | | Financiera Independencia SAB de CV SOFOM ENR(e) | | 8.00% | | 07/19/2024 | | | 366,753 | |
| | 800,000 | | | Mexarrend SAPI de CV(g) | | 10.25% | | 07/24/2024 | | | 551,004 | |
| | 750,000 | | | Operadora de Servicios Mega SA de CV Sofom ER(g) | | 8.25% | | 02/11/2025 | | | 516,562 | |
| | 200,000 | | | TV Azteca SAB de CV | | 8.25% | | 08/09/2024 | | | 141,951 | |
| | 1,400,000 | | | Unifin Financiera SAB de CV(d)(e)(f) | | 8.88% | | Perpetual Maturity | | | 853,328 | |
| | | | | | | | | | | | 8,414,805 | |
| Netherlands - 0.19% | | | | | | | | |
| | 400,000 | | | AES Andres BV / Dominican Power Partners / Empresa Generadora de Electricidad It(g) | | 7.95% | | 05/11/2026 | | | 374,600 | |
| | 345,000 | | | AES Andres BV / Dominican Power Partners / Empresa Generadora de Electricidad It(e) | | 7.95% | | 05/11/2026 | | | 308,775 | |
| | 200,000 | | | Metinvest BV(e) | | 7.75% | | 10/17/2029 | | | 135,000 | |
| | 600,000 | | | Minejesa Capital BV(e) | | 4.63% | | 08/10/2030 | | | 540,874 | |
| | 335,000 | | | NXP BV / NXP Funding LLC / NXP USA, Inc.(g) | | 3.88% | | 06/18/2026 | | | 326,537 | |
| | 950,000 | | | Petrobras Global Finance BV | | 6.90% | | 03/19/2049 | | | 931,214 | |
| | 200,000 | | | Syngenta Finance NV | | 4.38% | | 03/28/2042 | | | 150,410 | |
| | 600,000 | | | Syngenta Finance NV(e) | | 5.68% | | 04/24/2048 | | | 484,368 | |
| | | | | | | | | | | | 3,251,778 | |
| New Zealand - 0.06% | | | | | | | | |
| | 895,000 | | | Bank of New Zealand(g) | | 3.50% | | 02/20/2024 | | | 940,652 | |
See Notes to Financial Statements.
| 24 | (888) 848-7569 | www.rivernorth.com |
| RiverNorth/DoubleLine Strategic Income Fund | Schedule of Investments |
March 31, 2020 (Unaudited)
| Principal Amount/Description | | Rate | | Maturity | | Value | |
| Panama - 0.06% | | | | | | | |
| $ | 200,000 | | | Aeropuerto Internacional de Tocumen SA(e) | | 5.63% | | 05/18/2036 | | $ | 205,002 | |
| | 200,000 | | | Cable Onda SA(g) | | 4.50% | | 01/30/2030 | | | 177,110 | |
| | 400,000 | | | Empresa de Transmision Electrica SA(g) | | 5.13% | | 05/02/2049 | | | 408,122 | |
| | 300,000 | | | Global Bank Corp.(f)(g) | | 3M US L + 3.30% | | 04/16/2029 | | | 292,500 | |
| | | | | | | | | | | | 1,082,734 | |
| Peru - 0.06% | | | | | | | | |
| | 100,000 | | | Banco BBVA Peru SA(e) | | 5.00% | | 08/26/2022 | | | 99,845 | |
| | 300,000 | | | Camposol SA(g) | | 6.00% | | 02/03/2027 | | | 238,875 | |
| | 400,000 | | | Inkia Energy, Ltd.(e) | | 5.88% | | 11/09/2027 | | | 354,000 | |
| | 200,000 | | | Orazul Energy Egenor SCA(e) | | 5.63% | | 04/28/2027 | | | 177,708 | |
| | 130,000 | | | Scotiabank Peru SAA(e)(f) | | 3M US L + 3.86% | | 12/13/2027 | | | 123,312 | |
| | | | | | | | | | | | 993,740 | |
| Philippines - 0.06% | | | | | | | | |
| | 600,000 | | | BDO Unibank, Inc. | | 2.95% | | 03/06/2023 | | | 595,500 | |
| | 400,000 | | | Union Bank of the Philippines | | 3.37% | | 11/29/2022 | | | 396,899 | |
| | | | | | | | | | | | 992,399 | |
| Singapore - 0.24% | | | | | | | | |
| | 715,000 | | | BOC Aviation, Ltd.(f)(g) | | 3M US L + 1.13% | | 09/26/2023 | | | 712,909 | |
| | 1,200,000 | | | DBS Group Holdings, Ltd.(d)(f) | | 3.60% | | Perpetual Maturity | | | 1,113,000 | |
| | 192,260 | | | LLPL Capital Pte, Ltd.(g) | | 6.88% | | 02/04/2039 | | | 189,194 | |
| | 400,000 | | | Medco Bell Pte, Ltd.(g) | | 6.38% | | 01/30/2027 | | | 236,998 | |
| | 600,000 | | | Medco Oak Tree Pte, Ltd.(e) | | 7.38% | | 05/14/2026 | | | 381,650 | |
| | 400,000 | | | ONGC Videsh Vankorneft Pte, Ltd. | | 3.75% | | 07/27/2026 | | | 360,799 | |
| | 400,000 | | | United Overseas Bank, Ltd.(f) | | 2.88% | | 03/08/2027 | | | 394,436 | |
| | 750,000 | | | United Overseas Bank, Ltd.(d)(f) | | 3.88% | | Perpetual Maturity | | | 715,274 | |
| | | | | | | | | | | | 4,104,260 | |
| South Korea - 0.03% | | | | | | | | |
| | 550,000 | | | Korea Expressway Corp.(f)(g) | | 3M US L + 0.70% | | 04/20/2020 | | | 550,306 | |
| Spain - 0.06% | | | | | | | | |
| | 350,000 | | | AI Candelaria Spain SLU(e) | | 7.50% | | 12/15/2028 | | | 261,990 | |
| | 800,000 | | | Banco Santander SA(f) | | 3M US L + 1.09% | | 02/23/2023 | | | 758,190 | |
| | | | | | | | | | | | 1,020,180 | |
| Switzerland - 0.05% | | | | | | | | |
| | 750,000 | | | Credit Suisse Group AG(f)(g) | | 3M US L + 1.24% | | 06/12/2024 | | | 662,979 | |
See Notes to Financial Statements.
| Semi-Annual Report | March 31, 2020 | 25 |
| RiverNorth/DoubleLine Strategic Income Fund | Schedule of Investments |
March 31, 2020 (Unaudited)
| Principal Amount/Description | | Rate | | Maturity | | Value | |
| $ | 250,000 | | | Walnut Bidco PLC(e) | | 9.13% | | 08/01/2024 | | $ | 198,750 | |
| | | | | | | | | | | | 861,729 | |
| | | | | | | | | | | | | |
| TOTAL FOREIGN CORPORATE BONDS | | | | | | | | |
| (Cost $92,784,771) | | | | | | | 79,141,015 | |
| | | | | | | | | | | | | |
| U.S. CORPORATE BONDS - 4.77% | | | | | | | | |
| Advertising - 0.03% | | | | | | | | |
| | 560,000 | | | Interpublic Group of Cos., Inc. | | 5.40% | | 10/01/2048 | | | 590,793 | |
| Aerospace/Defense - 0.03% | | | | | | | | |
| | 220,000 | | | TransDigm, Inc.(g) | | 6.25% | | 03/15/2026 | | | 220,137 | |
| | 75,000 | | | TransDigm, Inc. | | 6.38% | | 06/15/2026 | | | 72,229 | |
| | 135,000 | | | TransDigm, Inc.(g) | | 5.50% | | 11/15/2027 | | | 121,912 | |
| | 105,000 | | | Triumph Group, Inc. | | 7.75% | | 08/15/2025 | | | 75,468 | |
| | | | | | | | | | | | 489,746 | |
| Agriculture - 0.13% | | | | | | | | |
| | 795,000 | | | Altria Group, Inc. | | 4.80% | | 02/14/2029 | | | 833,592 | |
| | 1,270,000 | | | BAT Capital Corp. | | 3.46% | | 09/06/2029 | | | 1,183,068 | |
| | 315,000 | | | Pyxus International, Inc.(g) | | 8.50% | | 04/15/2021 | | | 283,500 | |
| | | | | | | | | | | | 2,300,160 | |
| Airlines - 0.05% | | | | | | | | |
| | 840,000 | | | Delta Air Lines, Inc. | | 3.80% | | 04/19/2023 | | | 791,065 | |
| Auto Manufacturers - 0.16% | | | | | | | | |
| | 185,000 | | | General Motors Co.(f) | | 3M US L + 0.80% | | 08/07/2020 | | | 181,831 | |
| | 865,000 | | | General Motors Financial Co., Inc.(f) | | 3M US L + 0.99% | | 01/05/2023 | | | 700,552 | |
| | 225,000 | | | General Motors Financial Co., Inc. | | 3.95% | | 04/13/2024 | | | 204,294 | |
| | 810,000 | | | Hyundai Capital America(g) | | 2.65% | | 02/10/2025 | | | 774,449 | |
| | 955,000 | | | Volkswagen Group of America Finance LLC(g) | | 4.25% | | 11/13/2023 | | | 945,289 | |
| | | | | | | | | | | | 2,806,415 | |
| Auto Parts & Equipment - 0.01% | | | | | | | | |
| | 105,000 | | | Panther BF Aggregator 2 LP / Panther Finance Co., Inc.(g) | | 6.25% | | 05/15/2026 | | | 99,815 | |
| Banks - 0.25% | | | | | | | | |
| | 300,000 | | | BBVA Bancomer SA(e)(f) | | 5.40% | | 11/12/2029 | | | 275,563 | |
| | 1,245,000 | | | Citigroup, Inc.(f) | | 3M US L + 1.10% | | 05/17/2024 | | | 1,189,929 | |
| | 1,120,000 | | | Goldman Sachs Group, Inc.(f) | | 3M US L + 1.17% | | 05/15/2026 | | | 1,030,402 | |
| | 750,000 | | | Morgan Stanley(f) | | 3M US L + 1.34% | | 07/22/2028 | | | 787,576 | |
| | 470,000 | | | Wells Fargo & Co.(f) | | 3M US L + 1.17% | | 06/17/2027 | | | 484,914 | |
| | 490,000 | | | Wells Fargo & Co.(f) | | 3M US L + 1.17% | | 10/30/2030 | | | 486,909 | |
| | | | | | | | | | | | 4,255,293 | |
| Beverages - 0.05% | | | | | | | | |
| | 140,000 | | | Anheuser-Busch InBev Worldwide, Inc. | | 4.90% | | 02/01/2046 | | | 153,498 | |
See Notes to Financial Statements.
| 26 | (888) 848-7569 | www.rivernorth.com |
| RiverNorth/DoubleLine Strategic Income Fund | Schedule of Investments |
March 31, 2020 (Unaudited)
| Principal Amount/Description | | Rate | | Maturity | | Value | |
| $ | 550,000 | | | Anheuser-Busch InBev Worldwide, Inc. | | 4.60% | | 04/15/2048 | | $ | 585,416 | |
| | 115,000 | | | Constellation Brands, Inc. | | 3.15% | | 08/01/2029 | | | 107,861 | |
| | | | | | | | | | | | 846,775 | |
| Building Materials - 0.06% | | | | | | | | |
| | 140,000 | | | Builders FirstSource, Inc.(g) | | 5.00% | | 03/01/2030 | | | 126,787 | |
| | 510,000 | | | Carrier Global Corp.(g) | | 3.38% | | 04/05/2040 | | | 452,383 | |
| | 130,000 | | | Griffon Corp.(g) | | 5.75% | | 03/01/2028 | | | 122,931 | |
| | 375,000 | | | Owens Corning | | 4.40% | | 01/30/2048 | | | 321,776 | |
| | | | | | | | | | | | 1,023,877 | |
| Chemicals - 0.02% | | | | | | | | |
| | 340,000 | | | DuPont de Nemours, Inc. | | 5.42% | | 11/15/2048 | | | 375,959 | |
| Coal - 0.01% | | | | | | | | |
| | 110,000 | | | Peabody Energy Corp.(g) | | 6.00% | | 03/31/2022 | | | 75,625 | |
| | 170,000 | | | SunCoke Energy Partners LP /SunCoke Energy Partners Finance Corp.(g) | | 7.50% | | 06/15/2025 | | | 123,670 | |
| | | | | | | | | | | | 199,295 | |
| Commercial Services - 0.06% | | | | | | | | |
| | 140,000 | | | Allied Universal Holdco LLC / Allied Universal Finance Corp.(g) | | 6.63% | | 07/15/2026 | | | 137,813 | |
| | 160,000 | | | Allied Universal Holdco LLC / Allied Universal Finance Corp.(g) | | 9.75% | | 07/15/2027 | | | 151,899 | |
| | 195,000 | | | MPH Acquisition Holdings LLC(g) | | 7.13% | | 06/01/2024 | | | 171,118 | |
| | 125,000 | | | United Rentals North America, Inc. | | 6.50% | | 12/15/2026 | | | 127,569 | |
| | 160,000 | | | United Rentals North America, Inc. | | 5.25% | | 01/15/2030 | | | 160,840 | |
| | 197,000 | | | Verscend Escrow Corp.(g) | | 9.75% | | 08/15/2026 | | | 198,122 | |
| | | | | | | | | | | | 947,361 | |
| Computers - 0.04% | | | | | | | | |
| | 780,000 | | | Flexential Intermediate Corp.(g) | | 11.25% | | 08/01/2024 | | | 715,650 | |
| Distribution/Wholesale - 0.01% | | | | | | | | |
| | 160,000 | | | Performance Food Group, Inc.(g) | | 5.50% | | 10/15/2027 | | | 149,612 | |
| Diversified Financial Services - 0.30% | | | | | | | | |
| | 813,000 | | | Air Lease Corp. | | 3.75% | | 02/01/2022 | | | 752,795 | |
| | 760,000 | | | American Express Co. | | 2.50% | | 08/01/2022 | | | 774,147 | |
| | 220,000 | | | Capital One Financial Corp.(f) | | 3M US L + 0.72% | | 01/30/2023 | | | 205,709 | |
| | 690,000 | | | Charles Schwab Corp. | | 3.55% | | 02/01/2024 | | | 725,967 | |
| | 1,055,000 | | | Discover Financial Services | | 4.10% | | 02/09/2027 | | | 1,017,241 | |
| | 140,000 | | | Nationstar Mortgage Holdings, Inc.(g) | | 8.13% | | 07/15/2023 | | | 137,768 | |
| | 95,000 | | | Navient Corp. | | 5.00% | | 03/15/2027 | | | 82,384 | |
| | 265,000 | | | NFP Corp.(g) | | 6.88% | | 07/15/2025 | | | 263,004 | |
| | 165,000 | | | Springleaf Finance Corp. | | 6.63% | | 01/15/2028 | | | 155,422 | |
| | 75,000 | | | Springleaf Finance Corp. | | 5.38% | | 11/15/2029 | | | 69,080 | |
| | 745,000 | | | Synchrony Financial | | 3.95% | | 12/01/2027 | | | 664,075 | |
See Notes to Financial Statements.
| Semi-Annual Report | March 31, 2020 | 27 |
| RiverNorth/DoubleLine Strategic Income Fund | Schedule of Investments |
March 31, 2020 (Unaudited)
| Principal Amount/Description | | Rate | | Maturity | | Value | |
| $ | 265,000 | | | Tempo Acquisition LLC / Tempo Acquisition Finance Corp.(g) | | 6.75% | | 06/01/2025 | | $ | 244,470 | |
| | | | | | | | | | | | 5,092,062 | |
| Electric - 0.28% | | | | | | | | |
| | 155,000 | | | Calpine Corp.(g) | | 5.13% | | 03/15/2028 | | | 143,763 | |
| | 55,000 | | | Duke Energy Corp. | | 3.75% | | 09/01/2046 | | | 52,985 | |
| | 485,000 | | | Duke Energy Corp. | | 3.95% | | 08/15/2047 | | | 470,285 | |
| | 535,000 | | | Duke Energy Progress LLC | | 4.15% | | 12/01/2044 | | | 606,278 | |
| | 315,000 | | | General Electric Co. | | 5.88% | | 01/14/2038 | | | 370,821 | |
| | 715,000 | | | Georgia Power Co. | | 2.20% | | 09/15/2024 | | | 672,072 | |
| | 1,100,000 | | | ITC Holdings Corp. | | 3.25% | | 06/30/2026 | | | 1,120,416 | |
| | 275,000 | | | Monongahela Power Co.(g) | | 5.40% | | 12/15/2043 | | | 308,161 | |
| | 1,000,000 | | | Virginia Electric & Power Co. | | 3.50% | | 03/15/2027 | | | 1,049,278 | |
| | | | | | | | | | | | 4,794,059 | |
| Electronics - 0.02% | | | | | | | | |
| | 390,000 | | | Arrow Electronics, Inc. | | 3.88% | | 01/12/2028 | | | 374,789 | |
| Engineering & Construction - 0.03% | | | | | | | | |
| | 215,000 | | | AECOM | | 5.13% | | 03/15/2027 | | | 195,337 | |
| | 400,000 | | | SBA Tower Trust(g) | | 3.17% | | 04/11/2022 | | | 398,100 | |
| | | | | | | | | | | | 593,437 | |
| Entertainment - 0.05% | | | | | | | | |
| | 150,000 | | | Cedar Fair LP(g) | | 5.25% | | 07/15/2029 | | | 127,582 | |
| | 160,000 | | | Eldorado Resorts, Inc. | | 6.00% | | 04/01/2025 | | | 145,001 | |
| | 210,000 | | | Lions Gate Capital Holdings LLC(g) | | 6.38% | | 02/01/2024 | | | 186,369 | |
| | 220,000 | | | Live Nation Entertainment, Inc.(g) | | 4.75% | | 10/15/2027 | | | 198,121 | |
| | 135,000 | | | Scientific Games International, Inc.(g) | | 7.25% | | 11/15/2029 | | | 84,301 | |
| | 180,000 | | | Twin River Worldwide Holdings, Inc.(g) | | 6.75% | | 06/01/2027 | | | 136,537 | |
| | | | | | | | | | | | 877,911 | |
| Environmental Control - 0.05% | | | | | | | | |
| | 130,000 | | | Clean Harbors, Inc.(g) | | 4.88% | | 07/15/2027 | | | 127,979 | |
| | 610,000 | | | Waste Management, Inc. | | 4.00% | | 07/15/2039 | | | 665,797 | |
| | | | | | | | | | | | 793,776 | |
| Food - 0.26% | | | | | | | | |
| | 160,000 | | | Albertsons Cos. Inc / Safeway, Inc. /New Albertsons LP / Albertsons LLC(g) | | 4.63% | | 01/15/2027 | | | 160,088 | |
| | 100,000 | | | B&G Foods, Inc. | | 5.25% | | 04/01/2025 | | | 98,191 | |
| | 80,000 | | | B&G Foods, Inc. | | 5.25% | | 09/15/2027 | | | 78,300 | |
| | 40,000 | | | JBS USA LUX SA / JBS USA Finance, Inc.(g) | | 5.88% | | 07/15/2024 | | | 40,650 | |
| | 25,000 | | | JBS USA LUX SA / JBS USA Finance, Inc.(g) | | 5.75% | | 06/15/2025 | | | 25,468 | |
| | 230,000 | | | JBS USA LUX SA / JBS USA Finance, Inc.(g) | | 6.75% | | 02/15/2028 | | | 246,801 | |
See Notes to Financial Statements.
| 28 | (888) 848-7569 | www.rivernorth.com |
| RiverNorth/DoubleLine Strategic Income Fund | Schedule of Investments |
March 31, 2020 (Unaudited)
| Principal Amount/Description | | Rate | | Maturity | | Value | |
| $ | 100,000 | | | Kraft Heinz Foods Co. | | 3.95% | | 07/15/2025 | | $ | 98,502 | |
| | 75,000 | | | Kraft Heinz Foods Co. | | 5.00% | | 07/15/2035 | | | 75,068 | |
| | 205,000 | | | Kraft Heinz Foods Co. | | 5.20% | | 07/15/2045 | | | 198,260 | |
| | 825,000 | | | Kroger Co. | | 3.40% | | 04/15/2022 | | | 844,975 | |
| | 850,000 | | | NBM US Holdings, Inc.(g) | | 7.00% | | 05/14/2026 | | | 777,425 | |
| | 210,000 | | | Pilgrim's Pride Corp.(g) | | 5.88% | | 09/30/2027 | | | 210,409 | |
| | 180,000 | | | Post Holdings, Inc.(g) | | 4.63% | | 04/15/2030 | | | 173,700 | |
| | 859,000 | | | Smithfield Foods, Inc.(g) | | 4.25% | | 02/01/2027 | | | 801,594 | |
| | 465,000 | | | Sysco Corp. | | 3.30% | | 02/15/2050 | | | 341,483 | |
| | 200,000 | | | Sysco Corp. | | 6.60% | | 04/01/2050 | | | 218,058 | |
| | | | | | | | | | | | 4,388,972 | |
| Healthcare-Products - 0.03% | | | | | | | | |
| | 505,000 | | | Ortho-Clinical Diagnostics, Inc. / Ortho-Clinical Diagnostics SA(g) | | 7.25% | | 02/01/2028 | | | 438,037 | |
| Healthcare-Services - 0.10% | | | | | | | | |
| | 70,000 | | | Centene Corp.(g) | | 4.25% | | 12/15/2027 | | | 70,521 | |
| | 125,000 | | | Centene Corp.(g) | | 3.38% | | 02/15/2030 | | | 116,719 | |
| | 235,000 | | | HCA, Inc. | | 5.38% | | 09/01/2026 | | | 243,830 | |
| | 145,000 | | | LifePoint Health, Inc.(g) | | 4.38% | | 02/15/2027 | | | 137,678 | |
| | 935,000 | | | Radiology Partners, Inc.(g) | | 9.25% | | 02/01/2028 | | | 816,488 | |
| | 155,000 | | | Select Medical Corp.(g) | | 6.25% | | 08/15/2026 | | | 155,853 | |
| | 130,000 | | | West Street Merger Sub, Inc.(g) | | 6.38% | | 09/01/2025 | | | 114,292 | |
| | | | | | | | | | | | 1,655,381 | |
| Insurance - 0.25% | | | | | | | | |
| | 125,000 | | | Alliant Holdings Intermediate LLC / Alliant Holdings Co.-Issuer(g) | | 6.75% | | 10/15/2027 | | | 117,744 | |
| | 890,000 | | | Athene Global Funding(g) | | 3.00% | | 07/01/2022 | | | 876,891 | |
| | 785,000 | | | Equitable Holdings, Inc. | | 3.90% | | 04/20/2023 | | | 783,194 | |
| | 160,000 | | | GTCR AP Finance, Inc.(g) | | 8.00% | | 05/15/2027 | | | 148,567 | |
| | 1,190,000 | | | Liberty Mutual Group, Inc.(g) | | 3.95% | | 10/15/2050 | | | 1,109,441 | |
| | 340,000 | | | Prudential Financial, Inc. | | 3.91% | | 12/07/2047 | | | 330,154 | |
| | 835,000 | | | Willis North America, Inc. | | 4.50% | | 09/15/2028 | | | 918,619 | |
| | | | | | | | | | | | 4,284,610 | |
| Internet - 0.04% | | | | | | | | |
| | 350,000 | | | Expedia Group, Inc. | | 3.80% | | 02/15/2028 | | | 303,511 | |
| | 235,000 | | | Netflix, Inc.(g) | | 4.88% | | 06/15/2030 | | | 239,864 | |
| | 125,000 | | | Uber Technologies, Inc.(g) | | 7.50% | | 09/15/2027 | | | 124,347 | |
| | | | | | | | | | | | 667,722 | |
| Investment Companies - 0.58% | | | | | | | | |
| | 5,000,000 | | | Business Development Corp. of America(g) | | 5.38% | | 05/30/2023 | | | 5,177,614 | |
| | 5,000,000 | | | FS KKR Capital Corp. | | 4.75% | | 05/15/2022 | | | 4,619,799 | |
See Notes to Financial Statements.
| Semi-Annual Report | March 31, 2020 | 29 |
| RiverNorth/DoubleLine Strategic Income Fund | Schedule of Investments |
March 31, 2020 (Unaudited)
| Principal Amount/Description | Rate | | Maturity | | Value | |
| $ | 180,000 | | | Icahn Enterprises LP / Icahn Enterprises Finance Corp. | | 5.25% | | 05/15/2027 | | $ | 167,625 | |
| | | | | | | | | | | | 9,965,038 | |
| Leisure Time - 0.02% | | | | | | | | |
| | 175,000 | | | Royal Caribbean Cruises, Ltd. | | 3.70% | | 03/15/2028 | | | 110,460 | |
| | 370,000 | | | Viking Cruises, Ltd.(g) | | 5.88% | | 09/15/2027 | | | 218,544 | |
| | | | | | | | | | | | 329,004 | |
| Lodging - 0.01% | | | | | | | | |
| | 200,000 | | | Boyd Gaming Corp.(g) | | 4.75% | | 12/01/2027 | | | 166,110 | |
| Machinery-Diversified - 0.02% | | | | | | | | |
| | 390,000 | | | John Deere Capital Corp. | | 3.45% | | 01/10/2024 | | | 412,090 | |
| Manufactured Goods - 0.01% | | | | | | | | |
| | 105,000 | | | Gates Global LLC / Gates Corp.(g) | | 6.25% | | 01/15/2026 | | | 93,503 | |
| Media - 0.15% | | | | | | | | |
| | 300,000 | | | CCO Holdings LLC / CCO Holdings Capital Corp.(g) | | 5.75% | | 02/15/2026 | | | 304,785 | |
| | 105,000 | | | Cengage Learning, Inc.(g) | | 9.50% | | 06/15/2024 | | | 78,618 | |
| | 735,000 | | | Charter Communications Operating LLC / Charter Communications Operating Capital | | 4.91% | | 07/23/2025 | | | 793,225 | |
| | 165,000 | | | Clear Channel Worldwide Holdings, Inc.(g) | | 5.13% | | 08/15/2027 | | | 155,422 | |
| | 390,000 | | | CSC Holdings LLC | | 5.25% | | 06/01/2024 | | | 393,411 | |
| | 135,000 | | | Diamond Sports Group LLC / Diamond Sports Finance Co.(g) | | 5.38% | | 08/15/2026 | | | 110,449 | |
| | 245,000 | | | Gray Television, Inc.(g) | | 7.00% | | 05/15/2027 | | | 245,135 | |
| | 35,000 | | | iHeartCommunications, Inc. | | 8.38% | | 05/01/2027 | | | 29,993 | |
| | 90,000 | | | Nexstar Broadcasting, Inc.(g) | | 5.63% | | 07/15/2027 | | | 88,474 | |
| | 130,000 | | | Scripps Escrow, Inc.(g) | | 5.88% | | 07/15/2027 | | | 115,121 | |
| | 255,000 | | | Sirius XM Radio, Inc.(g) | | 5.38% | | 07/15/2026 | | | 260,043 | |
| | | | | | | | | | | | 2,574,676 | |
| Mining - 0.10% | | | | | | | | |
| | 195,000 | | | Arconic Corp.(g) | | 6.13% | | 02/15/2028 | | | 200,850 | |
| | 450,000 | | | Freeport-McMoRan, Inc. | | 5.40% | | 11/14/2034 | | | 419,385 | |
| | 1,200,000 | | | Freeport-McMoRan, Inc. | | 5.45% | | 03/15/2043 | | | 1,083,360 | |
| | 80,000 | | | Novelis Corp.(g) | | 4.75% | | 01/30/2030 | | | 71,650 | |
| | | | | | | | | | | | 1,775,245 | |
| Oil & Gas - 0.20% | | | | | | | | |
| | 715,000 | | | Brooklyn Union Gas Co.(g) | | 4.49% | | 03/04/2049 | | | 762,249 | |
| | 715,000 | | | CNOOC Finance 2015 USA, LLC | | 3.75% | | 05/02/2023 | | | 748,093 | |
| | 175,000 | | | Gulfport Energy Corp. | | 6.38% | | 05/15/2025 | | | 43,968 | |
| | 430,000 | | | Halliburton Co. | | 2.92% | | 03/01/2030 | | | 337,479 | |
| | 140,000 | | | Hilcorp Energy I LP / Hilcorp Finance Co.(g) | | 6.25% | | 11/01/2028 | | | 62,796 | |
See Notes to Financial Statements.
| 30 | (888) 848-7569 | www.rivernorth.com |
| RiverNorth/DoubleLine Strategic Income Fund | Schedule of Investments |
March 31, 2020 (Unaudited)
| Principal Amount/Description | | Rate | | Maturity | | Value | |
| $ | 65,000 | | | Indigo Natural Resources LLC(g) | | 6.88% | | 02/15/2026 | | $ | 43,392 | |
| | 780,000 | | | Marathon Petroleum Corp. | | 5.13% | | 12/15/2026 | | | 774,127 | |
| | 170,000 | | | Oasis Petroleum, Inc. | | 6.88% | | 03/15/2022 | | | 34,850 | |
| | 145,000 | | | Parsley Energy LLC / Parsley Finance Corp.(g) | | 5.63% | | 10/15/2027 | | | 103,030 | |
| | 140,000 | | | QEP Resources, Inc. | | 5.63% | | 03/01/2026 | | | 52,161 | |
| | 110,000 | | | Sunoco LP / Sunoco Finance Corp. | | 6.00% | | 04/15/2027 | | | 95,366 | |
| | 135,000 | | | Transocean, Inc.(g) | | 8.00% | | 02/01/2027 | | | 64,631 | |
| | 295,000 | | | USA Compression Partners LP / USA Compression Finance Corp. | | 6.88% | | 09/01/2027 | | | 184,537 | |
| | 160,000 | | | WPX Energy, Inc. | | 4.50% | | 01/15/2030 | | | 87,480 | |
| | | | | | | | | | | | 3,394,159 | |
| Packaging & Containers - 0.06% | | | | | | | | |
| | 185,000 | | | Flex Acquisition Co., Inc.(g) | | 6.88% | | 01/15/2025 | | | 174,357 | |
| | 80,000 | | | Silgan Holdings, Inc.(g) | | 4.13% | | 02/01/2028 | | | 74,400 | |
| | 776,000 | | | WRKCo, Inc. | | 3.75% | | 03/15/2025 | | | 781,584 | |
| | | | | | | | | | | | 1,030,341 | |
| Pharmaceuticals - 0.20% | | | | | | | | |
| | 125,000 | | | Bausch Health Cos., Inc.(g) | | 7.00% | | 03/15/2024 | | | 128,907 | |
| | 155,000 | | | Bausch Health Cos., Inc.(g) | | 7.00% | | 01/15/2028 | | | 161,595 | |
| | 155,000 | | | Bausch Health Cos., Inc.(g) | | 7.25% | | 05/30/2029 | | | 161,719 | |
| | 125,000 | | | Bausch Health Cos., Inc.(g) | | 5.25% | | 01/30/2030 | | | 117,813 | |
| | 1,260,000 | | | Becton Dickinson and Co. | | 2.89% | | 06/06/2022 | | | 1,262,056 | |
| | 720,000 | | | Bristol-Myers Squibb Co.(g) | | 4.35% | | 11/15/2047 | | | 908,273 | |
| | 355,000 | | | Cigna Corp.(f) | | 3M US L + 0.89% | | 07/15/2023 | | | 330,289 | |
| | 340,000 | | | Cigna Corp. | | 4.90% | | 12/15/2048 | | | 412,990 | |
| | | | | | | | | | | | 3,483,642 | |
| Pipelines - 0.17% | | | | | | | | |
| | 73,000 | | | Antero Midstream Partners LP / Antero Midstream Finance Corp.(g) | | 5.75% | | 03/01/2027 | | | 47,273 | |
| | 175,000 | | | Cheniere Energy Partners LP | | 5.25% | | 10/01/2025 | | | 164,057 | |
| | 130,000 | | | Cheniere Energy Partners LP | | 5.63% | | 10/01/2026 | | | 121,631 | |
| | 435,000 | | | Enable Midstream Partners LP | | 4.40% | | 03/15/2027 | | | 211,361 | |
| | 775,000 | | | Energy Transfer Operating LP | | 4.75% | | 01/15/2026 | | | 686,316 | |
| | 180,000 | | | Hess Midstream Operations LP(g) | | 5.13% | | 06/15/2028 | | | 127,179 | |
| | 598,000 | | | Kinder Morgan Energy Partners LP | | 6.95% | | 01/15/2038 | | | 624,105 | |
| | 180,000 | | | ONEOK, Inc. | | 3.40% | | 09/01/2029 | | | 135,277 | |
| | 735,000 | | | Sabine Pass Liquefaction LLC | | 5.00% | | 03/15/2027 | | | 626,421 | |
| | 265,000 | | | Targa Resources Partners LP / Targa Resources Partners Finance Corp.(g) | | 5.50% | | 03/01/2030 | | | 207,031 | |
| | | | | | | | | | | | 2,950,651 | |
| REITS - 0.33% | | | | | | | | |
| | 555,000 | | | Alexandria Real Estate Equities, Inc. | | 4.00% | | 01/15/2024 | | | 568,094 | |
See Notes to Financial Statements.
| Semi-Annual Report | March 31, 2020 | 31 |
| RiverNorth/DoubleLine Strategic Income Fund | Schedule of Investments |
March 31, 2020 (Unaudited)
| Principal Amount/Description | | Rate | | Maturity | | Value | |
| $ | 705,000 | | | American Tower Corp. | | 3.60% | | 01/15/2028 | | $ | 706,219 | |
| | 885,000 | | | Boston Properties LP | | 3.40% | | 06/21/2029 | | | 920,963 | |
| | 800,000 | | | Crown Castle International Corp. | | 3.70% | | 06/15/2026 | | | 811,653 | |
| | 200,000 | | | Crown Castle International Corp. | | 3.65% | | 09/01/2027 | | | 199,712 | |
| | 198,000 | | | ESH Hospitality, Inc.(g) | | 5.25% | | 05/01/2025 | | | 167,559 | |
| | 165,000 | | | Iron Mountain, Inc.(g) | | 4.88% | | 09/15/2029 | | | 156,147 | |
| | 265,000 | | | MPT Operating Partnership LP / MPT Finance Corp. | | 5.25% | | 08/01/2026 | | | 265,521 | |
| | 190,000 | | | National Retail Properties, Inc. | | 2.50% | | 04/15/2030 | | | 169,905 | |
| | 785,000 | | | Public Storage | | 3.39% | | 05/01/2029 | | | 789,524 | |
| | 75,000 | | | Simon Property Group LP | | 2.45% | | 09/13/2029 | | | 69,429 | |
| | 25,000 | | | VICI Properties LP / VICI Note Co., Inc.(g) | | 3.75% | | 02/15/2027 | | | 23,703 | |
| | 30,000 | | | VICI Properties LP / VICI Note Co., Inc.(g) | | 4.13% | | 08/15/2030 | | | 28,594 | |
| | 795,000 | | | Welltower, Inc. | | 3.95% | | 09/01/2023 | | | 788,840 | |
| | | | | | | | | | | | 5,665,863 | |
| Retail - 0.11% | | | | | | | | |
| | 27,000 | | | Asbury Automotive Group, Inc.(g) | | 4.50% | | 03/01/2028 | | | 23,152 | |
| | 27,000 | | | Asbury Automotive Group, Inc.(g) | | 4.75% | | 03/01/2030 | | | 23,153 | |
| | 235,000 | | | Beacon Roofing Supply, Inc.(g) | | 4.88% | | 11/01/2025 | | | 213,557 | |
| | 60,000 | | | Carvana Co.(g) | | 8.88% | | 10/01/2023 | | | 57,148 | |
| | 235,000 | | | Golden Nugget, Inc.(g) | | 6.75% | | 10/15/2024 | | | 149,780 | |
| | 335,000 | | | Home Depot, Inc. | | 3.90% | | 06/15/2047 | | | 378,371 | |
| | 195,000 | | | IRB Holding Corp.(g) | | 6.75% | | 02/15/2026 | | | 155,309 | |
| | 325,000 | | | McDonald's Corp. | | 4.45% | | 03/01/2047 | | | 353,382 | |
| | 190,000 | | | PetSmart, Inc.(g) | | 7.13% | | 03/15/2023 | | | 180,405 | |
| | 66,000 | | | PetSmart, Inc.(g) | | 5.88% | | 06/01/2025 | | | 65,505 | |
| | 185,000 | | | Staples, Inc.(g) | | 7.50% | | 04/15/2026 | | | 162,916 | |
| | 55,000 | | | Yum! Brands, Inc.(g) | | 7.75% | | 04/01/2025 | | | 57,888 | |
| | | | | | | | | | | | 1,820,566 | |
| Semiconductors - 0.05% | | | | | | | | |
| | 820,000 | | | Marvell Technology Group, Ltd. | | 4.20% | | 06/22/2023 | | | 839,752 | |
| Software - 0.05% | | | | | | | | |
| | 20,000 | | | CDK Global, Inc.(g) | | 5.25% | | 05/15/2029 | | | 20,475 | |
| | 155,000 | | | Dun & Bradstreet Corp.(g) | | 6.88% | | 08/15/2026 | | | 162,072 | |
| | 190,000 | | | Genesys Telecommunications Laboratories, Inc./Greeneden Lux 3 Sarl/Greeneden US Ho(g) | | 10.00% | | 11/30/2024 | | | 195,518 | |
| | 435,000 | | | Oracle Corp. | | 3.85% | | 04/01/2060 | | | 439,865 | |
| | | | | | | | | | | | 817,930 | |
| Special Purpose Banks - 0.01% | | | | | | | | |
| | 160,000 | | | Caesars Resort Collection LLC / CRC Finco, Inc.(g) | | 5.25% | | 10/15/2025 | | | 116,752 | |
See Notes to Financial Statements.
| 32 | (888) 848-7569 | www.rivernorth.com |
| RiverNorth/DoubleLine Strategic Income Fund | Schedule of Investments |
March 31, 2020 (Unaudited)
| Principal Amount/Description | | Rate | | Maturity | | Value | |
| Telecommunications - 0.29% | | | | | | | |
| $ | 1,140,000 | | | AT&T, Inc. | | 5.25% | | 03/01/2037 | | $ | 1,331,764 | |
| | 160,000 | | | CenturyLink, Inc.(g) | | 5.13% | | 12/15/2026 | | | 160,400 | |
| | 145,000 | | | CenturyLink, Inc.(g) | | 4.00% | | 02/15/2027 | | | 139,562 | |
| | 120,000 | | | CommScope, Inc.(g) | | 5.50% | | 03/01/2024 | | | 122,190 | |
| | 30,000 | | | CommScope, Inc.(g) | | 6.00% | | 03/01/2026 | | | 30,124 | |
| | 345,000 | | | Corning, Inc. | | 4.38% | | 11/15/2057 | | | 360,344 | |
| | 155,000 | | | Front Range BidCo, Inc.(g) | | 4.00% | | 03/01/2027 | | | 149,187 | |
| | 85,000 | | | Front Range BidCo, Inc.(g) | | 6.13% | | 03/01/2028 | | | 81,228 | |
| | 155,000 | | | Frontier Communications Corp.(g) | | 8.00% | | 04/01/2027 | | | 153,734 | |
| | 120,000 | | | Gogo Intermediate Holdings LLC / Gogo Finance Co., Inc.(g) | | 9.88% | | 05/01/2024 | | | 95,551 | |
| | 100,000 | | | GTT Communications, Inc.(g) | | 7.88% | | 12/31/2024 | | | 65,250 | |
| | 1,245,000 | | | Intelsat Jackson Holdings SA(g) | | 8.50% | | 10/15/2024 | | | 791,764 | |
| | 260,000 | | | Level 3 Financing, Inc. | | 5.38% | | 01/15/2024 | | | 262,274 | |
| | 180,000 | | | Level 3 Financing, Inc.(g) | | 4.63% | | 09/15/2027 | | | 179,901 | |
| | 200,000 | | | Sprint Corp. | | 7.13% | | 06/15/2024 | | | 220,997 | |
| | 720,000 | | | Verizon Communications, Inc. | | 4.40% | | 11/01/2034 | | | 845,670 | |
| | | | | | | | | | | | 4,989,940 | |
| Transportation - 0.07% | | | | | | | | |
| | 815,000 | | | CSX Corp. | | 3.80% | | 11/01/2046 | | | 823,163 | |
| | 330,000 | | | FedEx Corp. | | 4.75% | | 11/15/2045 | | | 318,213 | |
| | 30,000 | | | Kenan Advantage Group, Inc.(g) | | 7.88% | | 07/31/2023 | | | 25,444 | |
| | | | | | | | | | | | 1,166,820 | |
| Trucking & Leasing - 0.02% | | | | | | | | |
| | 405,000 | | | Penske Truck Leasing Co. LP / PTL Finance Corp.(g) | | 4.20% | | 04/01/2027 | | | 417,177 | |
| | | | | | | | | | | | | |
| TOTAL U.S. CORPORATE BONDS | | | | | | | | |
| (Cost $85,322,842) | | | | | | | 81,561,831 | |
| | | | | | | | | | | | | |
| CONVERTIBLE CORPORATE BONDS -0.55% | | | | | | | | |
| $ | 5,000,000 | | | BlackRock TCP Capital Corp. | | 4.63% | | 03/01/2022 | | | 4,487,500 | |
| | 6,000,000 | | | New Mountain Finance Corp. | | 5.75% | | 08/15/2023 | | | 4,920,626 | |
| | | | | | | | | | | | | |
| TOTAL CONVERTIBLE CORPORATE BONDS | | | | | | | | |
| (Cost $10,310,341) | | | | | | | 9,408,126 | |
| | | | | | | | | | | | | |
| FOREIGN GOVERNMENT BONDS AND NOTES, SUPRANATIONALS AND FOREIGN AGENCIES - 0.17% | | | | |
| | 400,000 | | | Dominican Republic International Bond(g) | | 4.50% | | 01/30/2030 | | | 349,800 | |
| | 800,000 | | | Dominican Republic International Bond | | 6.40% | | 06/05/2049 | | | 712,244 | |
See Notes to Financial Statements.
| Semi-Annual Report | March 31, 2020 | 33 |
| RiverNorth/DoubleLine Strategic Income Fund | Schedule of Investments |
March 31, 2020 (Unaudited)
| Principal Amount/Description | | Rate | | Maturity | | Value | |
| $ | 600,000 | | | Export Import Bank of Thailand(f) | | 3M US L + 0.90% | | 11/20/2023 | | $ | 595,707 | |
| | 285,000 | | | Mexico Government International Bond | | 4.15% | | 03/28/2027 | | | 292,552 | |
| | 875,000 | | | Mexico Government International Bond | | 3.75% | | 01/11/2028 | | | 874,353 | |
| | | | | | | | | | | | | |
| TOTAL FOREIGN GOVERNMENT BONDS AND NOTES, SUPRANATIONALS AND FOREIGN AGENCIES | | | | |
| (Cost $2,975,724) | | | | | | | 2,824,656 | |
| | | | | | | | | | | | | |
| BANK LOANS - 1.14%(f) | | | | | | | | |
| Canada - 0.02% | | | | | | | | |
| | 415,000 | | | Kronos Acquisition Intermediate, Inc., First Lien - Initial Term Loan | | 1M US L + 4.00%, 1.00% Floor | | 05/15/2023 | | | 375,403 | |
| | | | | | | | | | | | | |
| Ireland - 0.03% | | | | | | | | |
| | 523,664 | | | ION Trading Technologies S.A.R.L., First Lien - 2018 Initial Dollar Term Loan | | 3M US L + 4.00%, 1.00% Floor | | 11/21/2024 | | | 436,388 | |
| | | | | | | | | | | | | |
| Luxembourg - 0.02% | | | | | | | | |
| | 578,550 | | | Travelport Finance Luxembourg Sarl, First Lien - Initial Term Loan | | 3M US L + 5.00% | | 05/29/2026 | | | 379,529 | |
| | | | | | | | | | | | | |
| United Kingdom - 0.01% | | | | | | | | |
| | 250,000 | | | Connect Finco SARL, First Lien - Initial Term Loan | | 1M US L + 4.50%, 1.00% Floor | | 12/11/2026 | | | 201,562 | |
| | | | | | | | | | | | | |
| United States - 1.06% | | | | | | | | |
| | 474,473 | | | Acrisure LLC, First Lien -2020 Term Loan | | 3M US L + 3.50% | | 02/15/2027 | | | 424,654 | |
| | 1,273,737 | | | Air Methods Corp., First Lien -Initial Term Loan | | 3M US L + 3.50%, 1.00% Floor | | 04/22/2024 | | | 910,015 | |
| | 1,213,896 | | | American Tire Distributors, Inc., First Lien - Initial Term Loan | | 1M US L + 7.50%, 1.00% Floor | | 09/02/2024 | | | 819,380 | |
| | 287,825 | | | Athenahealth, Inc., First Lien -B Term Loan | | 3M US L + 4.50% | | 02/11/2026 | | | 270,555 | |
| | 560,000 | | | Avaya, Inc., First Lien -Tranche B Term Loan | | 1M US L + 4.25% | | 12/15/2024 | | | 483,000 | |
| | 49,201 | | | Aventiv Technologies LLC, First Lien - Initial Term Loan | | 3M US L + 4.50%, 1.00% Floor | | 11/01/2024 | | | 39,115 | |
| | 295,000 | | | BellRing Brands LLC, First Lien -B Term Loan | | 1M US L + 5.00%, 1.00% Floor | | 10/21/2024 | | | 278,037 | |
| | 892,734 | | | BI-LO LLC, First Lien -Initial Term Loan | | 3M US L + 8.00%, 1.00% Floor | | 05/31/2024 | | | 733,827 | |
See Notes to Financial Statements.
| 34 | (888) 848-7569 | www.rivernorth.com |
| RiverNorth/DoubleLine Strategic Income Fund | Schedule of Investments |
March 31, 2020 (Unaudited)
| Principal Amount/Description | | Rate | | Maturity | | Value | |
| $ | 1,024,691 | | | Cengage Learning, Inc., First Lien - 2016 Refinancing Term Loan | | 1M US L + 4.25%, 1.00% Floor | | 06/07/2023 | | $ | 840,246 | |
| | 489,693 | | | Cvent, Inc., First Lien Term Loan | | 1M US L + 3.75%, 1.00% Floor | | 11/29/2024 | | | 356,661 | |
| | 113,633 | | | Dhanani Group, Inc., First Lien Term Loan | | 1M US L + 3.75% | | 07/20/2025 | | | 96,020 | |
| | 425,646 | | | Equinox Holdings, Inc., First Lien - Incremental B-1 Term Loan | | 3M US L + 3.00%, 1.00% Floor | | 03/08/2024 | | | 316,176 | |
| | 700,000 | | | Flex Acquisition Co., Inc., First Lien - Incremental B-2018 Term Loan | | 3M US L + 3.25% | | 06/29/2025 | | | 644,000 | |
| | 1,069,222 | | | Forterra Finance LLC, First Lien - Replacement Term Loan | | 1M US L + 3.00%, 1.00% Floor | | 10/25/2023 | | | 894,580 | |
| | 458,830 | | | Global Medical Response, Inc., First Lien - 2018 New Term Loan | | 3M US L + 4.25%, 1.00% Floor | | 03/14/2025 | | | 414,094 | |
| | 478,800 | | | Granite US Holdings Corp., First Lien - B Term Loan | | 3M US L + 5.25% | | 09/30/2026 | | | 347,130 | |
| | 1,378,055 | | | Gulf Finance LLC, First Lien - Tranche B Term Loan | | 1M US L + 5.25%, 1.00% Floor | | 08/25/2023 | | | 717,967 | |
| | 467,280 | | | Hayward Industries, Inc., First Lien - Initial Term Loan | | 1M US L + 3.50% | | 08/05/2024 | | | 373,824 | |
| | 472,142 | | | Hyland Software, Inc., First Lien - 2018 Refinancing Term Loan | | 1M US L + 3.25%, 0.75% Floor | | 07/01/2024 | | | 443,223 | |
| | 329,158 | | | Klockner Pentaplast of America, Inc., First Lien - Dollar Term Loan | | 1M US L + 4.25%, 1.00% Floor | | 06/30/2022 | | | 233,064 | |
| | 303,475 | | | Lower Cadence Holdings LLC, First Lien - Initial Term Loan | | 1M US L + 4.00% | | 05/22/2026 | | | 185,120 | |
| | 437,633 | | | McDermott International, Inc., First Lien Term Loan | | 3M US L + 4.00%, 1.00% Floor | | 05/09/2025 | | | 134,693 | |
| | 46,341 | | | McDermott Technology , Inc., First Lien - Facility (Superpriority DIP) Term Loan | | 3M US L + 9.00%, 1.00% Floor | | 10/21/2020 | | | 42,541 | |
| | 112,090 | | | McDermott Technology Americas, Inc., First Lien - Roll-Up DIP Term Loan | | 3M US L + 9.00% | | 10/23/2020 | | | 102,899 | |
| | 1,144,236 | | | Minotaur Acquisition, Inc., First Lien - B Term Loan | | 1M US L + 5.00% | | 03/27/2026 | | | 970,689 | |
| | 496,984 | | | Misys, Ltd., First Lien -Dollar Term Loan | | 3M US L + 3.50%, 1.00% Floor | | 06/13/2024 | | | 429,476 | |
| | 217,236 | | | Mitchell International, Inc., First Lien - Initial Term Loan | | 1M US L + 3.25% | | 11/29/2024 | | | 182,478 | |
| | 1,135,000 | | | Mitchell International, Inc., Second Lien - Initial Term Loan | | 1M US L + 7.25% | | 12/01/2025 | | | 892,865 | |
| | 476,426 | | | MLN US HoldCo LLC, First Lien -B Term Loan | | 1M US L + 4.50% | | 11/30/2025 | | | 340,645 | |
| | 1,150,000 | | | MPH Acquisition Holdings LLC, First Lien - Initial Term Loan | | 3M US L + 2.75%, 1.00% Floor | | 06/07/2023 | | | 1,035,000 | |
See Notes to Financial Statements.
| Semi-Annual Report | March 31, 2020 | 35 |
| RiverNorth/DoubleLine Strategic Income Fund | Schedule of Investments |
March 31, 2020 (Unaudited)
| Principal Amount/Description | | Rate | | Maturity | | | Value | |
| $ | 104,703 | | | Parexel International (West Street Merger), First Lien - Initial Term Loan | | 1M US L + 2.75% | | | 09/27/2024 | | | $ | 90,437 | |
| | 1,037,347 | | | Peak 10 Holding Corp., First Lien - Initial Term Loan | | 3M US L + 3.50% | | | 08/01/2024 | | | | 745,593 | |
| | 532,304 | | | Radiology Partners, Inc., First Lien - B Term Loan | | 3M US L + 4.25% | | | 07/09/2025 | | | | 446,071 | |
| | 455,499 | | | Refinitiv US Holdings, Inc., First Lien - Initial Dollar Term Loan | | 1M US L + 3.25% | | | 10/01/2025 | | | | 439,746 | |
| | 563,570 | | | Solenis Holdings LLC, First Lien - Initial Dollar Term Loan | | 3M US L + 4.00% | | | 06/26/2025 | | | | 454,615 | |
| | 230,000 | | | Solenis Holdings LLC, Second Lien - Initial Term Loan | | 3M US L + 8.50% | | | 06/26/2026 | | | | 159,850 | |
| | 992,449 | | | Team Health Holdings, Inc., First Lien - Initial Term Loan | | 1M US L + 2.75%, 1.00% Floor | | | 02/06/2024 | | | | 640,129 | |
| | 260,000 | | | TIBCO Software, Inc., Second Lien | | 1M US L + 7.25% | | | 03/03/2028 | | | | 248,300 | |
| | 488,302 | | | United Natural Foods, Inc., First Lien - Initial Term Loan | | 1M US L + 4.25% | | | 10/22/2025 | | | | 422,992 | |
| | 365,375 | | | Verscend Holding Corp., First Lien - B Term Loan | | 1M US L + 4.50% | | | 08/27/2025 | | | | 347,106 | |
| | 165,000 | | | Zelis Cost Management Buyer, Inc., First Lien - B Term Loan | | 1M US L + 4.75% | | | 09/30/2026 | | | | 153,450 | |
| | | | | | | | | | | | | | 18,100,263 | |
| | | | | | | | | | | | | | | |
| TOTAL BANK LOANS | | | | | | | | | | |
| (Cost $23,472,033) | | | | | | | | | 19,493,145 | |
| | | | | | | | | | | | | | | |
| COLLATERALIZED LOAN OBLIGATIONS - 1.90% | | | | | | | | | | |
| | | | | Adams Mill CLO, Ltd. | | | | | | | | | | |
| | 500,000 | | | Series 2014-1A(f)(g) | | 3M US L + 3.50% | | | 07/15/2026 | | | | 450,066 | |
| | | | | AIMCO CLO | | | | | | | | | | |
| | 500,000 | | | Series 2018-AA(f)(g) | | 3M US L + 2.55% | | | 04/17/2031 | | | | 366,010 | |
| | | | | AIMCO CLO 10, Ltd. | | | | | | | | | | |
| | 1,000,000 | | | Series 2019-10A(f)(g) | | 3.55% - 3M US L | | | 07/22/2032 | | | | 732,838 | |
| | | | | Apidos CLO XII | | | | | | | | | | |
| | 500,000 | | | Series 2018-12A(f)(g) | | 3M US L + 2.60% | | | 04/15/2031 | | | | 377,205 | |
| | | | | Apidos CLO XX | | | | | | | | | | |
| | 500,000 | | | Series 2018-20A(f)(g) | | 3M US L + 2.95% | | | 07/16/2031 | | | | 386,647 | |
| | | | | Apidos CLO XXI | | | | | | | | | | |
| | 500,000 | | | Series 2018-21A(f)(g) | | 3M US L + 2.45% | | | 07/18/2027 | | | | 411,298 | |
| | 1,000,000 | | | Series 2018-21A(f)(g) | | 3M US L + 8.25% | | | 07/18/2027 | | | | 606,649 | |
| | | | | Apidos CLO XXIV | | | | | | | | | | |
| | 1,000,000 | | | Series 2018-24A(f)(g) | | 3M US L + 5.80% | | | 10/20/2030 | | | | 631,045 | |
| | | | | Avery Point VI CLO, Ltd. | | | | | | | | | | |
| | 500,000 | | | Series 2018-6A(f)(g) | | 3M US L + 1.05% | | | 08/05/2027 | | | | 489,250 | |
See Notes to Financial Statements.
| 36 | (888) 848-7569 | www.rivernorth.com |
| RiverNorth/DoubleLine Strategic Income Fund | Schedule of Investments |
March 31, 2020 (Unaudited)
| Principal Amount/Description | | Rate | | Maturity | | Value | |
| | | | Babson CLO, Ltd. | | | | | | | | |
| $ | 500,000 | | Series 2018-IA(f)(g) | | 3M US L + 2.60% | | 01/20/2031 | | $ | 390,000 | |
| | | | Barings CLO, Ltd. | | | | | | | | |
| | 500,000 | | Series 2017-1A(f)(g) | | 3M US L + 3.60% | | 07/18/2029 | | | 412,013 | |
| | 500,000 | | Series 2018-4A(f)(g) | | 3M US L + 5.82% | | 10/15/2030 | | | 315,176 | |
| | 1,000,000 | | Series 2019-1A(f)(g) | | 3M US L + 6.68% | | 04/15/2031 | | | 662,267 | |
| | 500,000 | | Series 2019-2A(f)(g) | | 3.85% - 3M US L | | 04/15/2031 | | | 390,662 | |
| | | | Beechwood Park CLO, Ltd. | | | | | | | | |
| | 500,000 | | Series 2019-1A(f)(g) | | 3M US L + 7.50% | | 01/17/2033 | | | 350,354 | |
| | | | BlueMountain CLO, Ltd. | | | | | | | | |
| | 500,000 | | Series 2018-3A(f)(g) | | 3M US L + 2.60% | | 04/20/2031 | | | 349,296 | |
| | | | Buttermilk Park CLO, Ltd. | | | | | | | | |
| | 1,000,000 | | Series 2018-1A(f)(g) | | 3M US L + 5.75% | | 10/15/2031 | | | 625,159 | |
| | | | Canyon Capital CLO, Ltd. | | | | | | | | |
| | 500,000 | | Series 2017-1A(f)(g) | | 3M US L + 3.60% | | 07/15/2030 | | | 407,524 | |
| | 1,000,000 | | Series 2018-1A(f)(g) | | 3M US L + 2.75% | | 01/30/2031 | | | 744,683 | |
| | 1,500,000 | | Series 2018-1A(f)(g) | | 3M US L + 5.50% | | 01/30/2031 | | | 858,087 | |
| | 1,000,000 | | Series 2018-1A(f)(g) | | 3M US L + 5.75% | | 07/15/2031 | | | 603,980 | |
| | 500,000 | | Series 2018-1A(f)(g) | | 3M US L + 2.80% | | 07/15/2031 | | | 385,653 | |
| | 500,000 | | Series 2018-1RA(f)(g) | | 3M US L + 3.00% | | 07/15/2030 | | | 386,812 | |
| | | | Canyon CLO, Ltd. | | | | | | | | |
| | 500,000 | | Series 2018-1A(f)(g) | | 3M US L + 2.90% | | 07/15/2031 | | | 385,473 | |
| | | | Carlyle Global Market Strategies CLO, Ltd. | | | | | | | | |
| | 1,000,000 | | Series 2018-2RA(f)(g) | | 3M US L + 5.35% | | 05/15/2031 | | | 588,620 | |
| | 500,000 | | Series 2018-3A(f)(g) | | 3M US L + 2.85% | | 07/28/2028 | | | 385,465 | |
| | | | Chenango Park CLO, Ltd. | | | | | | | | |
| | 500,000 | | Series 2018-1A(f)(g) | | 3M US L + 3.00% | | 04/15/2030 | | | 380,374 | |
| | 1,000,000 | | Series 2018-1A(f)(g) | | 3M US L + 5.80% | | 04/15/2030 | | | 629,853 | |
| | | | Cook Park CLO, Ltd. | | | | | | | | |
| | 500,000 | | Series 2018-1A(f)(g) | | 3M US L + 2.60% | | 04/17/2030 | | | 369,913 | |
| | | | Dorchester Park CLO DAC | | | | | | | | |
| | 500,000 | | Series 2018-1A(f)(g) | | 3M US L + 2.40% | | 04/20/2028 | | | 414,389 | |
| | 875,000 | | Series 2018-1A(f)(g) | | 3M US L + 5.00% | | 04/20/2028 | | | 623,922 | |
| | | | Dryden 57 CLO, Ltd. | | | | | | | | |
| | 500,000 | | Series 2018-57A(f)(g) | | 3M US L + 2.55% | | 05/15/2031 | | | 365,489 | |
| | | | Dryden 60 CLO, Ltd. | | | | | | | | |
| | 1,000,000 | | Series 2018-60A(f)(g) | | 3M US L + 3.00% | | 07/15/2031 | | | 758,808 | |
| | | | Elmwood CLO II, Ltd. | | | | | | | | |
| | 1,000,000 | | Series 2019-2A(f)(g) | | 3M US L + 2.10% | | 04/20/2031 | | | 914,606 | |
| | | | Fillmore Park CLO, Ltd. | | | | | | | | |
| | 500,000 | | Series 2018-1A(f)(g) | | 3M US L + 2.90% | | 07/15/2030 | | | 378,036 | |
| | 1,000,000 | | Series 2018-1A(f)(g) | | 3M US L + 5.40% | | 07/15/2030 | | | 613,142 | |
See Notes to Financial Statements.
| Semi-Annual Report | March 31, 2020 | 37 |
| RiverNorth/DoubleLine Strategic Income Fund | Schedule of Investments |
March 31, 2020 (Unaudited)
| Principal Amount/Description | | Rate | | Maturity | | Value | |
| | | | Gilbert Park CLO, Ltd. | | | | | | | | |
| $ | 1,000,000 | | Series 2017-1A(f)(g) | | 3M US L + 6.40% | | 10/15/2030 | | $ | 660,613 | |
| | | | Goldentree Loan Management US CLO, Ltd. | | | | | | | | |
| | 500,000 | | Series 2018-3A(f)(g) | | 3M US L + 2.85% | | 04/20/2030 | | | 377,234 | |
| | | | Myers Park CLO, Ltd. | | | | | | | | |
| | 500,000 | | Series 2018-1A(f)(g) | | 3M US L + 3.05% | | 10/20/2030 | | | 379,165 | |
| | 1,000,000 | | Series 2018-1A(f)(g) | | 3M US L + 5.50% | | 10/20/2030 | | | 610,490 | |
| | | | Neuberger Berman CLO XXIII, Ltd. | | | | | | | | |
| | 1,000,000 | | Series 2018-23A(f)(g) | | 3M US L + 5.75% | | 10/17/2027 | | | 638,129 | |
| | | | PPM CLO 3, Ltd. | | | | | | | | |
| | 1,000,000 | | Series 2019-3A(f)(g) | | 3.70% - 3M US L | | 07/17/2030 | | | 835,749 | |
| | | | Stewart Park CLO, Ltd. | | | | | | | | |
| | 500,000 | | Series 2018-1A(f)(g) | | 3M US L + 2.60% | | 01/15/2030 | | | 372,334 | |
| | | | Symphony CLO XVII, Ltd. | | | | | | | | |
| | 1,500,000 | | Series 2018-17A(f)(g) | | 3M US L + 2.65% | | 04/15/2028 | | | 1,286,145 | |
| | | | Thayer Park CLO, Ltd. | | | | | | | | |
| | 500,000 | | Series 2017-1A(f)(g) | | 3M US L + 6.10% | | 04/20/2029 | | | 318,196 | |
| | | | THL Credit Wind River CLO, Ltd. | | | | | | | | |
| | 500,000 | | Series 2017-1A(f)(g) | | 3M US L + 3.75% | | 04/18/2029 | | | 375,809 | |
| | 500,000 | | Series 2018-1A(f)(g) | | 2.90% - 3M US L | | 07/15/2030 | | | 348,730 | |
| | 2,000,000 | | Series 2018-1A(f)(g) | | 5.50% - 3M US L | | 07/15/2030 | | | 1,148,998 | |
| | 1,000,000 | | Series 2018-1A(f)(g) | | 3M US L + 3.00% | | 07/18/2031 | | | 693,686 | |
| | 1,000,000 | | Series 2018-2A(f)(g) | | 3M US L + 5.75% | | 07/15/2030 | | | 579,079 | |
| | 1,000,000 | | Series 2018-3A(f)(g) | | 3M US L + 6.22% | | 10/22/2031 | | | 567,251 | |
| | | | Tryon Park CLO, Ltd. | | | | | | | | |
| | 1,000,000 | | Series 2018-1A(f)(g) | | 3M US L + 5.95% | | 04/15/2029 | | | 651,129 | |
| | | | VERDE CLO, Ltd. | | | | | | | | |
| | 1,000,000 | | Series 2019-1A(f)(g) | | 3.80% - 3M US L | | 04/15/2032 | | | 721,105 | |
| | | | Voya CLO, Ltd. | | | | | | | | |
| | 500,000 | | Series 2018-1A(f)(g) | | 3M US L + 2.80% | | 04/18/2031 | | | 355,716 | |
| | 1,000,000 | | Series 2018-2A(f)(g) | | 3M US L + 2.75% | | 07/15/2031 | | | 737,693 | |
| | 1,000,000 | | Series 2018-2A(f)(g) | | 3M US L + 5.25% | | 07/15/2031 | | | 607,582 | |
| | 500,000 | | Series 2018-3A(f)(g) | | 3M US L + 6.20% | | 10/20/2031 | | | 320,995 | |
| | 500,000 | | Series 2018-4A(f)(g) | | 3M US L + 5.95% | | 07/14/2031 | | | 299,978 | |
| | | | Webster Park CLO, Ltd. | | | | | | | | |
| | 1,000,000 | | Series 2018-1A(f)(g) | | 5.50% - 3M US L | | 07/20/2030 | | | 574,033 | |
| | | | Westcott Park CLO, Ltd. | | | | | | | | |
| | 1,000,000 | | Series 2019-1A(f)(g) | | 3M US L + 3.25% | | 07/20/2028 | | | 851,611 | |
| | | | | | | | | | | | |
| TOTAL COLLATERALIZED LOAN OBLIGATIONS | | | | | | | | |
| (Cost $46,248,052) | | | | | | | 32,452,214 | |
See Notes to Financial Statements.
| 38 | (888) 848-7569 | www.rivernorth.com |
| RiverNorth/DoubleLine Strategic Income Fund | Schedule of Investments |
March 31, 2020 (Unaudited)
| Principal Amount/Description | | Rate | | Maturity | | Value | |
| EQUITY - LINKED NOTES - 0.00%(j) | | | | | | | | |
| $ | 263,093 | | Inverpamplona SA(i)(k) | | 0.00% | | 12/30/2028 | | $ | 11,250 | |
| | | | | | | | | | | | |
| TOTAL EQUITY - LINKED NOTES | | | | | | | | |
| (Cost $11,250) | | | | | | | 11,250 | |
| | | | | | | | | | | | |
| NON-AGENCY COLLATERALIZED MORTGAGE OBLIGATIONS - 21.07% | | | | |
| | | | Aaset Trust | | | | | | | | |
| | 482,175 | | Series 2019-2(g) | | 3.38% | | 10/16/2026 | | | 345,446 | |
| | | | AASET, Ltd. | | | | | | | | |
| | 584,234 | | Series 2018-1A(g) | | 3.84% | | 09/16/2023 | | | 477,819 | |
| | | | ABFC Trust | | | | | | | | |
| | 3,509,880 | | Series 2007-WMC1(f) | | 1M US L + 1.25% | | 06/25/2037 | | | 2,552,521 | |
| | | | Adjustable Rate Mortgage Trust | | | | | | | | |
| | 371,352 | | Series 2005-1(f) | | 4.12% | | 05/25/2035 | | | 353,491 | |
| | 3,192,982 | | Series 2005-10(f) | | 4.16% | | 01/25/2036 | | | 2,797,185 | |
| | 208,693 | | Series 2005-7(f) | | 4.15% | | 10/25/2035 | | | 173,024 | |
| | | | Alternative Loan Trust | | | | | | | | |
| | 270,188 | | Series 2005-20CB | | 5.50% | | 07/25/2035 | | | 234,304 | |
| | 100,773 | | Series 2005-54CB | | 5.50% | | 11/25/2035 | | | 78,016 | |
| | 507,818 | | Series 2005-6CB | | 5.50% | | 04/25/2035 | | | 482,347 | |
| | 224,773 | | Series 2005-85CB(f) | | 21.63% -3.67 x 1M US L | | 02/25/2036 | | | 314,412 | |
| | 1,064,344 | | Series 2005-85CB(f) | | 1M US L + 1.10% | | 02/25/2036 | | | 826,458 | |
| | 281,153 | | Series 2005-86CB | | 5.50% | | 02/25/2036 | | | 224,374 | |
| | 511,957 | | Series 2005-9CB(f)(l) | | 5.05% - 1M US L | | 05/25/2035 | | | 70,831 | |
| | 288,264 | | Series 2005-9CB(f) | | 1M US L + 0.50% | | 05/25/2035 | | | 238,350 | |
| | 275,450 | | Series 2006-12CB(f) | | 1M US L + 5.75% | | 05/25/2036 | | | 170,060 | |
| | 1,380,616 | | Series 2006-15CB | | 6.50% | | 06/25/2036 | | | 908,396 | |
| | 155,200 | | Series 2006-30T1 | | 6.25% | | 11/25/2036 | | | 125,446 | |
| | 134,488 | | Series 2006-32CB | | 5.50% | | 11/25/2036 | | | 99,523 | |
| | 296,905 | | Series 2006-36T2(f) | | 28.06% -4.6 x 1M US L | | 12/25/2036 | | | 549,346 | |
| | 1,070,831 | | Series 2007-19 | | 6.00% | | 08/25/2037 | | | 755,873 | |
| | 3,744,463 | | Series 2007-20 | | 6.25% | | 08/25/2047 | | | 2,797,421 | |
| | 981,301 | | Series 2007-23CB(f)(l) | | 6.50% - 1M US L | | 09/25/2037 | | | 319,240 | |
| | 1,027,720 | | Series 2007-23CB(f) | | 1M US L + 0.50% | | 09/25/2037 | | | 406,769 | |
| | | | American Home Mortgage Investment Trust | | | | | | | | |
| | 168,158 | | Series 2007-A(g)(m) | | 6.60% | | 01/25/2037 | | | 66,006 | |
| | | | AmeriHome GMSR Issuer Trust | | | | | | | | |
| | 3,100,000 | | Series 2019-GT1(g) | | 4.68% | | 11/25/2026 | | | 3,268,597 | |
See Notes to Financial Statements.
| Semi-Annual Report | March 31, 2020 | 39 |
| RiverNorth/DoubleLine Strategic Income Fund | Schedule of Investments |
March 31, 2020 (Unaudited)
| Principal Amount/Description | | Rate | | Maturity | | Value | |
| | | | Applebee's Funding LLC / IHOP Funding LLC | | | | | | | | |
| $ | 750,000 | | Series 2019-1A(g) | | 4.19% | | 06/05/2024 | | $ | 683,063 | |
| | | | AREIT Trust | | | | | | | | |
| | 1,265,000 | | Series 2019-CRE3(f)(g) | | 1M US L + 2.65% | | 07/14/2022 | | | 899,765 | |
| | | | Atlas Senior Loan Fund X, Ltd. | | | | | | | | |
| | 500,000 | | Series 2018-10A(f)(g) | | 3M US L + 1.09% | | 01/15/2031 | | | 458,776 | |
| | | | Atrium Hotel Portfolio Trust | | | | | | | | |
| | 1,309,000 | | Series 2018-ATRM(f)(g) | | 1M US L + 3.40% | | 06/15/2021 | | | 989,031 | |
| | | | Atrium IX | | | | | | | | |
| | 500,000 | | Series 2017-9A(f)(g) | | 3M US L + 3.60% | | 05/28/2030 | | | 399,855 | |
| | | | Atrium XIII | | | | | | | | |
| | 1,000,000 | | Series 2017-13A(f)(g) | | 3M US L + 6.05% | | 11/21/2030 | | | 643,097 | |
| | | | Atrium XIV LLC | | | | | | | | |
| | 1,000,000 | | Series 2018-14A(f)(g) | | 3M US L + 5.65% | | 08/23/2030 | | | 628,569 | |
| | | | BAMLL Commercial Mortgage Securities Trust | | | | | | | | |
| | 683,000 | | Series 2019-AHT(f)(g) | | 3.20% | | 03/15/2021 | | | 622,404 | |
| | | | Banc of America Funding Corp. | | | | | | | | |
| | 116,217 | | Series 2008-R2(g) | | 6.00% | | 09/25/2037 | | | 117,561 | |
| | | | Banc of America Funding Trust | | | | | | | | |
| | 136,229 | | Series 2006-2 | | 5.50% | | 03/25/2036 | | | 119,437 | |
| | 3,986,243 | | Series 2010-R5(f)(g) | | 6.00% | | 10/26/2037 | | | 3,593,789 | |
| | | | Bancorp Commercial Mortgage Trust | | | | | | | | |
| | 605,000 | | Series 2019-CRE5(f)(g) | | 1M US L + 1.50% | | 01/15/2022 | | | 596,275 | |
| | 1,312,000 | | Series 2019-CRE5(f)(g) | | 1M US L + 2.35% | | 02/15/2022 | | | 1,154,722 | |
| | | | BANK | | | | | | | | |
| | 463,000 | | Series 2018-BN10(f) | | 4.08% | | 01/15/2028 | | | 448,826 | |
| | 10,291,000 | | Series 2018-BN12(f)(g)(l) | | 1.50% | | 05/15/2061 | | | 895,882 | |
| | 463,000 | | Series 2018-BN13(f) | | 4.55% | | 07/15/2028 | | | 464,402 | |
| | | | Barclays Commercial Mortgage Trust | | | | | | | | |
| | 697,000 | | Series 2019-C3 | | 4.10% | | 05/15/2029 | | | 659,965 | |
| | | | BBCMS Trust | | | | | | | | |
| | 3,000,000 | | Series 2018-CBM(f)(g) | | 1M US L + 3.15% | | 07/15/2020 | | | 2,669,045 | |
| | | | BCAP, LLC Trust | | | | | | | | |
| | 134,285 | | Series 2007-AA2(f) | | 7.50% | | 04/25/2037 | | | 105,075 | |
| | 87,126 | | Series 2007-AA2 | | 6.00% | | 04/25/2037 | | | 63,733 | |
| | 6,054,824 | | Series 2010-RR6(f)(g) | | 6.00% | | 07/26/2036 | | | 4,489,900 | |
| | | | Bear Stearns ALT-A Trust | | | | | | | | |
| | 1,086,768 | | Series 2004-11(f) | | 3.59% | | 11/25/2034 | | | 917,293 | |
| | 1,061,493 | | Series 2005-3(f) | | 3.55% | | 04/25/2035 | | | 909,052 | |
| | 8,607,963 | | Series 2006-3(f) | | 3.64% | | 05/25/2036 | | | 6,799,891 | |
See Notes to Financial Statements.
| 40 | (888) 848-7569 | www.rivernorth.com |
| RiverNorth/DoubleLine Strategic Income Fund | Schedule of Investments |
March 31, 2020 (Unaudited)
| Principal Amount/Description | | Rate | | Maturity | | Value | |
| $ | 1,096,554 | | Series 2006-6(f) | | 3.97% | | 11/25/2036 | | $ | 874,943 | |
| | | | Bear Stearns Asset-Backed Securities Trust | | | | | | | | |
| | 2,073,850 | | Series 2006-AC1(m) | | 6.25% | | 02/25/2036 | | | 1,385,690 | |
| | | | Bellemeade Real Estate, Ltd. | | | | | | | | |
| | 3,624,569 | | Series 2019-2A(f)(g) | | 1M US L + 1.45% | | 04/25/2029 | | | 3,610,823 | |
| | | | BF Mortgage Trust | | | | | | | | |
| | 705,000 | | Series 2019-NYT(f)(g) | | 1M US L + 3.00% | | 12/15/2020 | | | 545,205 | |
| | | | BHP Trust | | | | | | | | |
| | 761,000 | | Series 2019-BXHP(f)(g) | | 1M US L + 2.57% | | 08/15/2021 | | | 618,021 | |
| | | | Braemar Hotels & Resorts Trust | | | | | | | | |
| | 688,000 | | Series 2018-PRME(f)(g) | | 1M US L + 2.90% | | 06/15/2035 | | | 522,439 | |
| | | | BX Trust | | | | | | | | |
| | 760,000 | | Series 2019-MMP(f)(g) | | 1M US L + 2.79% | | 08/15/2021 | | | 549,174 | |
| | 2,626,000 | | Series 2019-OC11(f)(g) | | 4.08% | | 12/09/2029 | | | 1,851,716 | |
| | | | CAL Funding III, Ltd. | | | | | | | | |
| | 791,667 | | Series 2018-1A(g) | | 3.96% | | 02/25/2028 | | | 786,035 | |
| | | | Cantor Commercial Real Estate Lending | | | | | | | | |
| | 652,000 | | Series 2019-CF1(f)(g) | | 4.12% | | 04/15/2024 | | | 525,683 | |
| | | | Carbon Capital VI Commercial Mortgage Trust | | | | | | | | |
| | 680,000 | | Series 2019-FL2(f)(g) | | 1M US L + 2.85% | | 11/15/2021 | | | 589,254 | |
| | | | Carrington Mortgage Loan Trust | | | | | | | | |
| | 1,871,742 | | Series 2006-NC4(f) | | 1M US L + 0.16% | | 10/25/2036 | | | 1,674,118 | |
| | | | Cascade MH Asset Trust | | | | | | | | |
| | 4,601,000 | | Series 2019-MH1(f)(g) | | 5.99% | | 11/25/2044 | | | 4,199,563 | |
| | | | Castlelake Aircraft Securitization Trust | | | | | | | | |
| | 2,869,061 | | Series 2018-1(g) | | 6.63% | | 06/15/2025 | | | 2,073,820 | |
| | | | Castlelake Aircraft Structured Trust | | | | | | | | |
| | 650,970 | | Series 2019-1A(g) | | 3.97% | | 04/15/2026 | | | 461,661 | |
| | 2,750,000 | | Series 2019-1A(g) | | 0.00% | | 04/15/2039 | | | 1,441,641 | |
| | | | CF Trust | | | | | | | | |
| | 1,518,000 | | Series 2019-MF1(f)(g) | | 1M US L + 2.95% | | 08/21/2021 | | | 1,202,228 | |
| | | | Chase Mortgage Finance Trust | | | | | | | | |
| | 13,055,444 | | Series 2007-S2 | | 6.00% | | 03/25/2037 | | | 9,554,850 | |
| | 431,106 | | Series 2007-S3 | | 5.50% | | 05/25/2037 | | | 102,446 | |
| | | | CIM Trust | | | | | | | | |
| | 12,000,000 | | Series 2016-1RR(f)(g) | | 6.96% | | 07/26/2055 | | | 10,989,876 | |
| | 12,000,000 | | Series 2016-2RR B2(f)(g) | | 7.57% | | 02/25/2056 | | | 11,107,320 | |
| | 12,000,000 | | Series 2016-3RR B2(f)(g) | | 7.97% | | 02/27/2056 | | | 11,038,320 | |
| | 11,430,000 | | Series 2016-3RR B2(f)(g) | | 10.50% | | 01/27/2057 | | | 11,258,550 | |
See Notes to Financial Statements.
| Semi-Annual Report | March 31, 2020 | 41 |
RiverNorth/DoubleLine Strategic Income Fund | Schedule of Investments |
March 31, 2020 (Unaudited)
| Principal Amount/Description | | Rate | | Maturity | | Value |
| | | | Citicorp Mortgage Securities Trust | | | | | | | | |
| $ | 539,484 | | Series 2007-1 | | 6.00% | | 01/25/2037 | | $ | 504,437 | |
| | 1,919 | | Series 2007-2 | | 5.50% | | 02/25/2037 | | | 1,920 | |
| | | | Citigroup Commercial Mortgage Trust | | | | | | | | |
| | 3,788,550 | | Series 2014-GC25(f)(l) | | 0.99% | | 10/10/2047 | | | 142,024 | |
| | 866,000 | | Series 2015-GC27(f)(g) | | 4.42% | | 01/10/2025 | | | 725,506 | |
| | 400,000 | | Series 2015-GC31(f) | | 4.06% | | 06/10/2025 | | | 345,235 | |
| | 420,000 | | Series 2015-GC35(f) | | 4.50% | | 11/10/2025 | | | 365,529 | |
| | 5,366,762 | | Series 2015-GC35(f)(l) | | 0.85% | | 11/10/2048 | | | 162,017 | |
| | 480,000 | | Series 2016-GC36(g) | | 2.85% | | 01/10/2026 | | | 341,138 | |
| | 464,000 | | Series 2017-C4(f) | | 4.10% | | 10/12/2027 | | | 446,565 | |
| | 463,000 | | Series 2018-B2(f) | | 4.28% | | 03/10/2028 | | | 449,131 | |
| | 515,000 | | Series 2018-C5(f) | | 4.72% | | 06/10/2028 | | | 429,539 | |
| | 901,000 | | Series 2019-SST2(f)(g) | | 1M US L + 1.60% | | 02/15/2022 | | | 872,453 | |
| | 901,000 | | Series 2019-SST2(f)(g) | | 1M US L + 2.00% | | 02/15/2022 | | | 873,575 | |
| | 1,433,000 | | Series 2020-555(g) | | 3.62% | | 12/10/2029 | | | 796,570 | |
| | | | Citigroup Mortgage Loan Trust | | | | | | | | |
| | 802,594 | | Series 2006-WF1(m) | | 4.86% | | 03/25/2036 | | | 486,633 | |
| | 1,250,234 | | Series 2007-OPX1(m) | | 6.33% | | 01/25/2037 | | | 567,498 | |
| | 346,906 | | Series 2008-AR4(f)(g) | | 4.26% | | 11/25/2038 | | | 343,124 | |
| | | | CitiMortgage Alternative Loan Trust | | | | | | | | |
| | 573,466 | | Series 2007-A1 | | 6.00% | | 01/25/2037 | | | 529,713 | |
| | 112,958 | | Series 2007-A1(f)(l) | | 5.40% - 1M US L | | 01/25/2037 | | | 19,777 | |
| | 81,900 | | Series 2007-A3(f) | | 6.00% | | 03/25/2037 | | | 78,454 | |
| | 188,478 | | Series 2007-A3(f)(l) | | 5.40% - 1M US L | | 03/25/2037 | | | 39,079 | |
| | 649,823 | | Series 2007-A4 | | 5.75% | | 04/25/2037 | | | 583,429 | |
| | 591,127 | | Series 2007-A6 | | 5.50% | | 06/25/2037 | | | 511,089 | |
| | | | CLI Funding VI LLC | | | | | | | | |
| | 918,773 | | Series 2019-1A(g) | | 3.71% | | 05/18/2029 | | | 861,757 | |
| | | | COMM Mortgage Trust | | | | | | | | |
| | 887,000 | | Series 2013-CR11(f) | | 5.12% | | 09/10/2023 | | | 914,829 | |
| | 500,000 | | Series 2016-GCT(f)(g) | | 3.46% | | 08/10/2021 | | | 446,018 | |
| | | | Commercial Mortgage Pass-Through Certificates | | | | | | | | |
| | 242,400 | | Series 2014-CR19(f) | | 4.73% | | 08/10/2024 | | | 220,708 | |
| | 8,629,084 | | Series 2014-UBS4(g) | | 3.75% | | 08/10/2024 | | | 1,250,079 | |
| | 11,000 | | Series 2014-UBS4(f)(g) | | 0.00% | | 08/10/2047 | | | 1 | |
| | 3,295,565 | | Series 2015-CR22(f)(l) | | 0.90% | | 03/10/2025 | | | 106,791 | |
| | 4,670,937 | | Series 2015-CR26(f)(l) | | 0.95% | | 09/10/2025 | | | 193,683 | |
| | 419,000 | | Series 2015-LC23(f) | | 4.65% | | 10/10/2025 | | | 367,763 | |
| | | | Commercial Mortgage Trust | | | | | | | | |
| | 659,000 | | Series 2012-CR4(f)(g) | | 4.59% | | 11/15/2022 | | | 246,565 | |
See Notes to Financial Statements.
42 | (888) 848-7569 | www.rivernorth.com |
RiverNorth/DoubleLine Strategic Income Fund | Schedule of Investments |
March 31, 2020 (Unaudited)
| Principal Amount/Description | | Rate | | Maturity | | Value |
| | | | CORE Mortgage Trust | | | | | | | | |
| $ | 540,000 | | Series 2019-CORE(f)(g) | | 1M US L + 1.90% | | 12/15/2020 | | $ | 422,835 | |
| | 540,000 | | Series 2019-CORE(f)(g) | | 1M US L + 2.35% | | 12/15/2020 | | | 402,345 | |
| | | | Countrywide Home Loan Mortgage Pass-Through Trust | | | | | | | | |
| | 2,364,478 | | Series 2005-HYB7(f) | | 3.42% | | 11/20/2035 | | | 1,821,386 | |
| | 40,891 | | Series 2005-J4 | | 5.50% | | 11/25/2035 | | | 37,378 | |
| | 2,010,946 | | Series 2006-18 | | 6.00% | | 12/25/2036 | | | 1,573,419 | |
| | 312,729 | | Series 2007-17 | | 6.00% | | 10/25/2037 | | | 264,703 | |
| | 319,888 | | Series 2007-3 | | 6.00% | | 04/25/2037 | | | 238,947 | |
| | 344,234 | | Series 2007-7 | | 5.75% | | 06/25/2037 | | | 257,940 | |
| | | | Credit Suisse First Boston Mortgage Securities Corp. | | | | | | | | |
| | 74,054 | | Series 2005-10 | | 5.50% | | 11/25/2035 | | | 62,596 | |
| | 2,056,132 | | Series 2005-11 | | 6.00% | | 12/25/2035 | | | 1,813,728 | |
| | 68,505 | | Series 2005-8 | | 5.50% | | 08/25/2025 | | | 65,987 | |
| | 4,565,779 | | Series 2005-9 | | 6.00% | | 10/25/2035 | | | 2,055,303 | |
| | | | Credit Suisse Mortgage Capital Certificates | | | | | | | | |
| | 3,414,374 | | Series 2006-2 | | 5.75% | | 03/25/2036 | | | 2,628,504 | |
| | | | CSAB Mortgage-Backed Trust | | | | | | | | |
| | 8,781,274 | | Series 2006-2(m) | | 5.70% | | 09/25/2036 | | | 997,960 | |
| | 143,785 | | Series 2007-1(f) | | 5.90% | | 05/25/2037 | | | 52,225 | |
| | | | CSAIL Commercial Mortgage Trust | | | | | | | | |
| | 5,336,921 | | Series 2015-C1(f)(l) | | 0.84% | | 01/15/2025 | | | 177,395 | |
| | 419,000 | | Series 2015-C4(f) | | 4.58% | | 11/15/2025 | | | 366,617 | |
| | 214,000 | | Series 2018-C14(f) | | 4.89% | | 10/15/2028 | | | 178,529 | |
| | | | CSMC Mortgage-Backed Trust | | | | | | | | |
| | 177,611 | | Series 2006-1 | | 6.00% | | 02/25/2036 | | | 99,754 | |
| | 24,015 | | Series 2006-4 | | 5.50% | | 05/25/2021 | | | 20,210 | |
| | 793,798 | | Series 2006-5 | | 6.25% | | 06/25/2036 | | | 278,799 | |
| | 99,694 | | Series 2006-9 | | 6.00% | | 11/25/2036 | | | 72,660 | |
| | 2,121,917 | | Series 2007-1 | | 6.00% | | 02/25/2037 | | | 1,638,748 | |
| | 10,595 | | Series 2007-2 | | 5.00% | | 03/25/2037 | | | 9,671 | |
| | 537,995 | | Series 2007-3(f) | | 5.84% | | 04/25/2037 | | | 199,127 | |
| | 30,537 | | Series 2007-4 | | 6.00% | | 06/25/2037 | | | 24,070 | |
| | 604,000 | | Series 2017-CALI(f)(g) | | 3.78% | | 11/10/2024 | | | 556,376 | |
| | 253,000 | | Series 2017-CHOP(f)(g) | | 1M US L + 1.90% | | 07/15/2032 | | | 208,605 | |
| | 253,000 | | Series 2017-CHOP(f)(g) | | 1M US L + 3.30% | | 07/15/2032 | | | 216,938 | |
| | 798,637 | | Series 2018-RPL2(g)(m) | | 4.03% | | 08/25/2062 | | | 742,880 | |
| | | | DB Master Finance LLC | | | | | | | | |
| | 992,500 | | Series 2019-1A(g) | | 3.79% | | 02/20/2024 | | | 974,912 | |
See Notes to Financial Statements.
Semi-Annual Report | March 31, 2020 | 43 |
RiverNorth/DoubleLine Strategic Income Fund | Schedule of Investments |
March 31, 2020 (Unaudited)
| Principal Amount/Description | | Rate | | Maturity | | Value |
| | | | Deutsche Alt-A Securities, Inc. Mortgage Loan Trust | | | | | | | | |
| $ | 305,408 | | Series 2005-6(f)(l) | | 5.08% - 1M US L | | 12/25/2035 | | $ | 57,179 | |
| | 133,862 | | Series 2005-6(f) | | 1M US L + 1.40% | | 12/25/2035 | | | 90,814 | |
| | | | Deutsche Mortgage Securities, Inc. Mortgage Loan Trust | | | | | | | | |
| | 164,333 | | Series 2006-PR1(f)(g) | | 12.12% - 1M US L | | 04/15/2036 | | | 162,410 | |
| | | | Dryden 38 Senior Loan Fund | | | | | | | | |
| | 1,000,000 | | Series 2018-38A(f)(g) | | 3M US L + 5.60% | | 07/15/2030 | | | 611,355 | |
| | | | Dryden 40 Senior Loan Fund | | | | | | | | |
| | 1,000,000 | | Series 2018-40A(f)(g) | | 3M US L + 5.75% | | 08/15/2031 | | | 575,116 | |
| | 500,000 | | Series 2018-40A(f)(g) | | 3M US L + 3.10% | | 08/15/2031 | | | 381,120 | |
| | | | Earnest Student Loan Program | | | | | | | | |
| | 35,000 | | Series 2016-D(g) | | 0.00% | | 05/25/2025 | | | 610,951 | |
| | | | Ellington Financial Mortgage Trust | | | | | | | | |
| | 880,025 | | Series 2018-1(f)(g) | | 4.39% | | 10/25/2058 | | | 873,031 | |
| | | | First Horizon Alternative Mortgage Securities Trust | | | | | | | | |
| | 842,328 | | Series 2005-FA6 | | 5.50% | | 09/25/2035 | | | 646,895 | |
| | 134,620 | | Series 2007-FA2 | | 6.00% | | 04/25/2037 | | | 81,917 | |
| | | | First Horizon Mortgage Pass- Through Trust | | | | | | | | |
| | 1,181,359 | | Series 2007-AR3(f) | | 4.13% | | 11/25/2037 | | | 877,384 | |
| | | | Fontainebleau Miami Beach Trust | | | | | | | | |
| | 2,748,000 | | Series 2019-FBLU(f)(g) | | 4.10% | | 12/10/2024 | | | 1,730,127 | |
| | | | GAIA Aviation, Ltd. | | | | | | | | |
| | 642,393 | | Series 2019-1(g)(m) | | 3.97% | | 12/15/2026 | | | 431,945 | |
| | 426,597 | | Series 2019-1(g)(m) | | 7.00% | | 12/15/2026 | | | 276,815 | |
| | | | Global SC Finance IV, Ltd. | | | | | | | | |
| | 403,850 | | Series 2018-1A(g) | | 4.29% | | 05/17/2028 | | | 393,598 | |
| | | | Great Wolf Trust | | | | | | | | |
| | 3,084,000 | | Series 2019-WOLF(f)(g) | | 1M US L + 3.13% | | 12/15/2024 | | | 2,093,815 | |
| | | | GS Mortgage Securities Trust | | | | | | | | |
| | 293,171 | | Series 2011-GC3(f)(g)(l) | | 0.66% | | 03/10/2021 | | | 812 | |
| | 2,210,213 | | Series 2011-GC5(f)(g)(l) | | 1.33% | | 08/10/2044 | | | 26,655 | |
| | 3,986,000 | | Series 2014-GC26(f)(g) | | 4.51% | | 11/10/2047 | | | 3,012,901 | |
| | 438,000 | | Series 2015-GC34 | | 2.98% | | 10/10/2025 | | | 305,448 | |
| | 7,211,675 | | Series 2015-GS1(f)(l) | | 0.78% | | 11/10/2025 | | | 265,952 | |
| | 1,954,000 | | Series 2018-TWR(f)(g) | | 1M US L + 3.92% | | 07/15/2021 | | | 1,463,668 | |
| | 636,000 | | Series 2020-GC45 | | 3.41% | | 12/13/2029 | | | 569,336 | |
| | | | GSAA Home Equity Trust | | | | | | | | |
| | 2,389,962 | | Series 2006-13(f) | | 6.04% | | 07/25/2036 | | | 1,077,289 | |
| | 547,699 | | Series 2006-18(m) | | 5.68% | | 11/25/2036 | | | 196,816 | |
| | 170,999 | | Series 2006-6(f) | | 5.69% | | 03/25/2036 | | | 69,652 | |
See Notes to Financial Statements.
44 | (888) 848-7569 | www.rivernorth.com |
RiverNorth/DoubleLine Strategic Income Fund | Schedule of Investments |
March 31, 2020 (Unaudited)
| Principal Amount/Description | | Rate | | Maturity | | Value |
| $ | 932,189 | | Series 2007-2(m) | | 6.10% | | 03/25/2037 | | $ | 320,265 | |
| | | | GSCG Trust | | | | | | | | |
| | 628,000 | | Series 2019-600C(g) | | 3.76% | | 09/06/2024 | | | 564,016 | |
| | 1,303,000 | | Series 2019-600C(f)(g) | | 4.12% | | 09/06/2024 | | | 978,825 | |
| | | | GSR Mortgage Loan Trust | | | | | | | | |
| | 267,604 | | Series 2005-AR4(f) | | 4.66% | | 07/25/2035 | | | 231,088 | |
| | 1,495,075 | | Series 2006-2F | | 5.25% | | 02/25/2036 | | | 1,011,904 | |
| | 413,376 | | Series 2007-2F | | 5.75% | | 02/25/2037 | | | 719,078 | |
| | 2,818,727 | | Series 2007-2F | | 6.00% | | 03/25/2037 | | | 2,223,970 | |
| | 1,149,202 | | Series 2007-AR2(f) | | 4.10% | | 05/25/2037 | | | 847,458 | |
| | | | Halcyon Loan Advisors Funding, Ltd. | | | | | | | | |
| | 250,000 | | Series 2013-2A(f)(g) | | 3M US L + 2.70% | | 08/01/2025 | | | 240,743 | |
| | | | Harley Marine Financing LLC | | | | | | | | |
| | 939,473 | | Series 2018-1A(g) | | 5.68% | | 05/15/2022 | | | 847,094 | |
| | | | Hawaii Hotel Trust | | | | | | | | |
| | 1,391,000 | | Series 2019-MAUI(f)(g) | | 1M US L + 2.75% | | 05/15/2021 | | | 995,191 | |
| | | | Hayfin Kingsland X, Ltd. | | | | | | | | |
| | 500,000 | | Series 2019-1A(f)(g) | | 3M US L + 2.25% | | 04/28/2031 | | | 461,134 | |
| | | | Helios Issuer, LLC Series | | | | | | | | |
| | 1,290,723 | | Series 2017-1A(g) | | 4.94% | | 09/20/2023 | | | 1,220,530 | |
| | | | Highbridge Loan Management, Ltd. | | | | | | | | |
| | 500,000 | | Series 2017-2A(f)(g) | | 3M US L + 6.60% | | 10/20/2029 | | | 325,073 | |
| | 1,000,000 | | Series 2018-2015(f)(g) | | 3M US L + 5.10% | | 02/05/2031 | | | 545,094 | |
| | 500,000 | | Series 2018-2016(f)(g) | | 3M US L + 2.90% | | 07/20/2030 | | | 358,356 | |
| | | | Horizon Aircraft Finance III, Ltd. | | | | | | | | |
| | 976,191 | | Series 2019-2(g) | | 3.43% | | 11/15/2026 | | | 645,909 | |
| | | | HPLY Trust | | | | | | | | |
| | 603,972 | | Series 2019-HIT(f)(g) | | 1M US L + 3.15% | | 11/15/2021 | | | 361,818 | |
| | 1,203,618 | | Series 2019-HIT(f)(g) | | 1M US L + 3.90% | | 11/15/2021 | | | 583,209 | |
| | | | HSI Asset Loan Obligation Trust | | | | | | | | |
| | 5,030 | | Series 2007-2 | | 5.50% | | 09/25/2037 | | | 4,330 | |
| | | | HSI Asset Securitization Corp. Trust | | | | | | | | |
| | 9,629,519 | | Series 2006-HE1(f) | | 1M US L + 0.14% | | 10/25/2036 | | | 3,828,616 | |
| | | | IMT Trust | | | | | | | | |
| | 325,349 | | Series 2017-APTS(f)(g) | | 1M US L + 1.10% | | 06/15/2034 | | | 284,877 | |
| | | | IndyMac IMJA Mortgage Loan Trust | | | | | | | | |
| | 1,214,413 | | Series 2007-A1 | | 6.00% | | 08/25/2037 | | | 736,649 | |
| | | | IndyMac IMSC Mortgage Loan Trust | | | | | | | | |
| | 4,748,522 | | Series 2007-F2 | | 6.50% | | 07/25/2037 | | | 2,351,551 | |
| | | | IndyMac Index Mortgage Loan Trust | | | | | | | | |
| | 1,843,856 | | Series 2005-AR31(f) | | 3.61% | | 01/25/2036 | | | 1,595,995 | |
| | 1,084,106 | | Series 2005-AR35(f) | | 3.39% | | 02/25/2036 | | | 904,169 | |
| | 2,573,537 | | Series 2006-AR25(f) | | 3.45% | | 09/25/2036 | | | 2,119,704 | |
See Notes to Financial Statements.
Semi-Annual Report | March 31, 2020 | 45 |
| RiverNorth/DoubleLine Strategic Income Fund | Schedule of Investments |
March 31, 2020 (Unaudited)
| Principal Amount/Description | | Rate | | | Maturity | | | Value | |
| | | | | Invitation Homes | | | | | | | | | | |
| $ | 995,000 | | | Series 2018-SFR1(f)(g) | | 1M US L + 1.25% | | | 03/17/2037 | | | $ | 880,749 | |
| | 650,000 | | | Series 2018-SFR1(f)(g) | | 1M US L + 1.45% | | | 03/17/2037 | | | | 558,595 | |
| | | | | JOL Air, Ltd. | | | | | | | | | | |
| | 911,072 | | | Series 2019-1(g) | | 3.97% | | | 04/15/2026 | | | | 657,000 | |
| | | | | JP Morgan Alternative Loan Trust | | | | | | | | | | |
| | 275,306 | | | Series 2005-S1 | | 6.00% | | | 12/25/2035 | | | | 237,055 | |
| | 2,825 | | | Series 2006-S1 | | 5.00% | | | 02/25/2021 | | | | 2,746 | |
| | 150,215 | | | Series 2006-S3(m) | | 6.12% | | | 08/25/2036 | | | | 138,063 | |
| | | | | JP Morgan BB Commercial Mortgage Securities Trust | | | | | | | | | | |
| | 400,000 | | | Series 2014-C21(f) | | 4.66% | | | 07/15/2024 | | | | 363,536 | |
| | 2,086,000 | | | Series 2014-C23(f)(g) | | 3.36% | | | 10/15/2024 | | | | 1,494,517 | |
| | 388,000 | | | Series 2014-C26(f) | | 4.38% | | | 12/15/2024 | | | | 344,720 | |
| | 5,027,448 | | | Series 2015-C28(f)(l) | | 1.06% | | | 03/15/2025 | | | | 170,617 | |
| | 542,000 | | | Series 2015-C28 | | 3.99% | | | 03/15/2025 | | | | 534,892 | |
| | 8,910,620 | | | Series 2015-C30(f)(l) | | 0.52% | | | 07/15/2025 | | | | 203,524 | |
| | 3,709,170 | | | Series 2015-C31(f)(l) | | 0.88% | | | 08/15/2025 | | | | 129,914 | |
| | | | | JP Morgan Chase Commercial Mortgage Securities Trust | | | | | | | | | | |
| | 59,370 | | | Series 2006-LDP8(f)(l) | | 0.29% | | | 05/15/2045 | | | | 9 | |
| | 4,000,000 | | | Series 2007-CH1(m) | | 4.89% | | | 11/25/2036 | | | | 3,969,103 | |
| | 1,157,000 | | | Series 2011-C3(f)(g) | | 5.66% | | | 03/15/2021 | | | | 1,095,047 | |
| | 2,363,165 | | | Series 2012-C8(f)(l) | | 1.78% | | | 09/15/2022 | | | | 84,430 | |
| | 1,919,000 | | | Series 2014-C20(f)(g) | | 4.60% | | | 06/15/2024 | | | | 1,540,900 | |
| | 1,010,000 | | | Series 2018-WPT(g) | | 5.54% | | | 07/05/2023 | | | | 778,211 | |
| | 887,000 | | | Series 2019-COR4(f) | | 4.44% | | | 12/10/2028 | | | | 871,042 | |
| | 704,000 | | | Series 2019-MFP(f)(g) | | 1M US L + 3.00% | | | 07/15/2021 | | | | 436,279 | |
| | 235,000 | | | Series 2019-UES(g) | | 4.34% | | | 05/05/2024 | | | | 207,783 | |
| | 1,135,000 | | | Series 2019-UES(f)(g) | | 4.45% | | | 05/05/2024 | | | | 893,334 | |
| | | | | JP Morgan Mortgage Acquisition Corp. | | | | | | | | | | |
| | 280,582 | | | Series 2006-CH2(m) | | 5.46% | | | 09/25/2029 | | | | 215,569 | |
| | | | | JP Morgan Mortgage Trust | | | | | | | | | | |
| | 1,099,349 | | | Series 2007-S3 | | 6.00% | | | 07/25/2037 | | | | 787,089 | |
| | | | | JP Morgan Resecuritization Trust | | | | | | | | | | |
| | 1,210,978 | | | Series 2011-1(f)(g) | | 6.00% | | | 06/26/2037 | | | | 1,016,831 | |
| | | | | LB-UBS Commercial Mortgage Trust | | | | | | | | | | |
| | 424,495 | | | Series 2006-C7(f)(g)(l) | | 0.60% | | | 11/15/2038 | | | | 103 | |
| | | | | LCM 28, Ltd. | | | | | | | | | | |
| | 1,000,000 | | | Series 2018-28A(f)(g) | | 3M US L + 5.75% | | | 10/20/2030 | | | | 588,949 | |
| | | | | LCM Loan Income Fund I Income Note Issuer, Ltd. | | | | | | | | | | |
| | 500,000 | | | Series 2018-27A(f)(g) | | 3M US L + 5.60% | | | 07/16/2031 | | | | 294,381 | |
See Notes to Financial Statements.
| 46 | (888) 848-7569 | www.rivernorth.com |
| RiverNorth/DoubleLine Strategic Income Fund | Schedule of Investments |
March 31, 2020 (Unaudited)
| Principal Amount/Description | | Rate | | Maturity | | | Value | |
| | | | | LCM XIV LP | | | | | | | | | |
| $ | 1,000,000 | | | Series 2018-14A(f)(g) | | 3M US L + 2.75% | | 07/20/2031 | | | $ | 676,113 | |
| | 750,000 | | | Series 2018-14A(f)(g) | | 3M US L + 5.50% | | 07/20/2031 | | | | 412,004 | |
| | | | | LCM XVII LP | | | | | | | | | |
| | 1,000,000 | | | Series 2018-17A(f)(g) | | 3M US L + 6.00% | | 10/15/2031 | | | | 586,849 | |
| | | | | LCM XX LP | | | | | | | | | |
| | 1,000,000 | | | Series 2018-20A(f)(g) | | 3M US L + 5.45% | | 10/20/2027 | | | | 614,068 | |
| | | | | Legacy Mortgage Asset Trust | | | | | | | | | |
| | 13,400,000 | | | Series 2019-GS3(g)(m) | | 4.25% | | 04/25/2059 | | | | 13,206,804 | |
| | | | | Lehman Mortgage Trust | | | | | | | | | |
| | 4,921,080 | | | Series 2006-1(f) | | 5.31% | | 02/25/2036 | | | | 4,657,148 | |
| | 583,927 | | | Series 2006-6 | | 5.50% | | 10/25/2036 | | | | 443,501 | |
| | 3,891,419 | | | Series 2006-7(f) | | 1M US L + 0.25% | | 11/25/2036 | | | | 131,933 | |
| | 3,891,419 | | | Series 2006-7(f)(l) | | 7.75% - 1M US L | | 11/25/2036 | | | | 749,103 | |
| | 1,413,147 | | | Series 2006-8(f) | | 1M US L + 0.42% | | 12/25/2036 | | | | 325,455 | |
| | 1,413,147 | | | Series 2006-8(f)(l) | | 6.58% - 1M US L | | 12/25/2036 | | | | 417,260 | |
| | 697,132 | | | Series 2007-10 | | 6.00% | | 01/25/2038 | | | | 675,502 | |
| | 322,666 | | | Series 2007-10 | | 6.50% | | 01/25/2038 | | | | 179,925 | |
| | | | | Lehman XS Trust | | | | | | | | | |
| | 58,685 | | | Series 2006-5(m) | | 5.89% | | 04/25/2036 | | | | 56,220 | |
| | | | | LoanCore Issuer, Ltd. | | | | | | | | | |
| | 1,193,000 | | | Series 2019-CRE3(f)(g) | | 1M US L + 2.50% | | 04/15/2024 | | | | 890,924 | |
| | | | | MACH 1 Cayman, Ltd. | | | | | | | | | |
| | 1,451,172 | | | Series 2019-1(g) | | 3.47% | | 08/15/2026 | | | | 969,582 | |
| | | | | Madison Park Funding XIV, Ltd. | | | | | | | | | |
| | 1,000,000 | | | Series 2018-14A(f)(g) | | 3M US L + 2.95% | | 10/22/2030 | | | | 745,883 | |
| | 1,000,000 | | | Series 2018-14A(f)(g) | | 3M US L + 5.80% | | 10/22/2030 | | | | 607,507 | |
| | | | | MBRT 2019-MBR | | | | | | | | | |
| | 584,000 | | | Series 2019-MBR(f)(g) | | 1M US L + 2.55% | | 11/25/2021 | | | | 472,915 | |
| | 1,406,000 | | | Series 2019-MBR(f)(g) | | 1M US L + 2.90% | | 11/25/2021 | | | | 893,211 | |
| | | | | Mello Warehouse Securitization Trust | | | | | | | | | |
| | 2,500,000 | | | Series 2019-1(f)(g) | | 1M US L + 5.50% | | 05/14/2021 | | | | 2,417,480 | |
| | | | | Merrill Lynch Alternative Note Asset Trust | | | | | | | | | |
| | 741,130 | | | Series 2007-F1 | | 6.00% | | 03/25/2037 | | | | 197,668 | |
| | | | | MFT Trust 2020-ABC | | | | | | | | | |
| | 2,010,000 | | | Series 2020-ABC(f)(g) | | 3.48% | | 02/06/2030 | | | | 886,392 | |
| | | | | MKT Mortgage Trust | | | | | | | | | |
| | 250,000 | | | Series 2020-525M(f)(g) | | 2.94% | | 02/12/2030 | | | | 134,020 | |
| | | | | Morgan Stanley Bank of America Merrill Lynch Trust | | | | | | | | | |
| | 3,155,681 | | | Series 2012-C5(f)(g)(l) | | 1.43% | | 07/15/2022 | | | | 80,548 | |
| | 350,000 | | | Series 2015-C27(f) | | 4.53% | | 11/15/2025 | | | | 305,456 | |
See Notes to Financial Statements.
| Semi-Annual Report | March 31, 2020 | 47 |
| RiverNorth/DoubleLine Strategic Income Fund | Schedule of Investments |
March 31, 2020 (Unaudited)
| Principal Amount/Description | | Rate | | | Maturity | | | Value | |
| | | | | Morgan Stanley Capital I Trust | | | | | | | | | | |
| $ | 1,177,000 | | | Series 2007-IQ15(f)(g) | | 6.13% | | | 06/11/2049 | | | $ | 1,206,875 | |
| | 1,090,560 | | | Series 2011-C1(f)(g)(l) | | 0.34% | | | 09/15/2020 | | | | 1,754 | |
| | 1,368,400 | | | Series 2016-UB11 XA(f)(l) | | 1.61% | | | 08/15/2026 | | | | 94,332 | |
| | 1,000,000 | | | Series 2018-SUN(f)(g) | | 1M US L + 3.05% | | | 07/15/2020 | | | | 751,883 | |
| | | | | Morgan Stanley Mortgage Loan Trust | | | | | | | | | | |
| | 2,020,876 | | | Series 2005-3AR(f) | | 3.88% | | | 07/25/2035 | | | | 1,680,069 | |
| | 3,501,607 | | | Series 2006-11 | | 6.00% | | | 08/25/2036 | | | | 2,928,191 | |
| | 929,892 | | | Series 2006-7(f) | | 5.03% | | | 06/25/2036 | | | | 719,542 | |
| | 1,022,529 | | | Series 2006-7 | | 6.00% | | | 06/25/2036 | | | | 784,172 | |
| | 417,375 | | | Series 2007-3XS(m) | | 5.70% | | | 01/25/2047 | | | | 207,095 | |
| | | | | Morgan Stanley Re-REMIC Trust | | | | | | | | | | |
| | 255,521 | | | Series 2011-R1(f)(g) | | 5.94% | | | 02/26/2037 | | | | 262,354 | |
| | | | | Mosaic Solar Loan Trust | | | | | | | | | | |
| | 132,841 | | | Series 2017-1A(g) | | 4.45% | | | 06/20/2042 | | | | 130,920 | |
| | 493,875 | | | Series 2018-1A(g) | | 4.01% | | | 08/20/2030 | | | | 474,816 | |
| | | | | MSCG Trust | | | | | | | | | | |
| | 2,154,000 | | | Series 2018-SELF(f)(g) | | 1M US L + 3.05% | | | 10/15/2020 | | | | 1,621,978 | |
| | | | | Navient Private Education Refi Loan Trust | | | | | | | | | | |
| | 500,000 | | | Series 2018-A(g) | | 3.68% | | | 11/17/2025 | | | | 517,030 | |
| | | | | Nomura Asset Acceptance Corp. Alternative Loan Trust | | | | | | | | | | |
| | 1,197,400 | | | Series 2005-AP3(f) | | 5.32% | | | 08/25/2035 | | | | 697,529 | |
| | | | | Ocagon Investment Partners 20-R, Ltd. | | | | | | | | | | |
| | 1,500,000 | | | Series 2019-4A(f)(g) | | 3M US L + 6.80% | | | 05/12/2031 | | | | 971,913 | |
| | | | | Octagon Investment Partners 26, Ltd. | | | | | | | | | | |
| | 1,000,000 | | | Series 2018-1A(f)(g) | | 3M US L + 8.09% | | | 07/15/2030 | | | | 486,429 | |
| | | | | Octagon Investment Partners 29, Ltd. | | | | | | | | | | |
| | 2,000,000 | | | Series 2020-1A(f)(g) | | 3M US L + 7.25% | | | 01/24/2033 | | | | 1,359,140 | |
| | | | | Octagon Investment Partners 37, Ltd. | | | | | | | | | | |
| | 500,000 | | | Series 2018-2A(f)(g) | | 3M US L + 2.85% | | | 07/25/2030 | | | | 354,515 | |
| | | | | Octagon Investment Partners XVI, Ltd. | | | | | | | | | | |
| | 500,000 | | | Series 2018-1A(f)(g) | | 3M US L + 3.00% | | | 07/17/2030 | | | | 366,965 | |
| | 1,000,000 | | | Series 2018-1A(f)(g) | | 3M US L + 5.75% | | | 07/17/2030 | | | | 609,709 | |
| | | | | Octagon Investment Partners XXI, Ltd. | | | | | | | | | | |
| | 1,000,000 | | | Series 2019-1A(f)(g) | | 3M US L + 7.00% | | | 02/14/2031 | | | | 690,716 | |
See Notes to Financial Statements.
| 48 | (888) 848-7569 | www.rivernorth.com |
| RiverNorth/DoubleLine Strategic Income Fund | Schedule of Investments |
March 31, 2020 (Unaudited)
| Principal Amount/Description | | Rate | | | Maturity | | | Value | |
| | | | | Octagon Investment Partners XXII, Ltd. | | | | | | | | | | |
| $ | 500,000 | | | Series 2018-1A(f)(g) | | 3M US L + 5.45% | | | 01/22/2030 | | | $ | 295,207 | |
| | | | | OHA Credit Funding 1, Ltd. | | | | | | | | | | |
| | 500,000 | | | Series 2018-1A(f)(g) | | 3M US L + 3.05% | | | 10/20/2030 | | | | 379,618 | |
| | | | | OHA Credit Funding 3, Ltd. | | | | | | | | | | |
| | 1,000,000 | | | Series 2019-3A(f)(g) | | 3.55% - 3M US L | | | 07/20/2032 | | | | 773,038 | |
| | | | | OHA Credit Funding 5, Ltd. | | | | | | | | | | |
| | 2,000,000 | | | Series 2020-5A(f)(g) | | 3M US L + 6.25% | | | 04/18/2033 | | | | 1,174,600 | |
| | | | | One Market Plaza Trust | | | | | | | | | | |
| | 688,000 | | | Series 2017-1MKT(g) | | 4.14% | | | 02/10/2024 | | | | 569,733 | |
| | | | | PHH Alternative Mortgage Trust | | | | | | | | | | |
| | 1,000,824 | | | Series 2007-2 | | 6.00% | | | 05/25/2037 | | | | 860,250 | |
| | | | | PR Mortgage Loan Trust | | | | | | | | | | |
| | 10,311,103 | | | Series 2014-1(f)(g) | | 5.91% | | | 09/25/2047 | | | | 10,257,547 | |
| | | | | Pretium Mortgage Credit Partners I LLC | | | | | | | | | | |
| | 608,845 | | | Series 2019-NPL2(g)(m) | | 3.84% | | | 12/25/2058 | | | | 528,643 | |
| | | | | Prime Mortgage Trust | | | | | | | | | | |
| | 42,928 | | | Series 2006-1 | | 5.50% | | | 06/25/2036 | | | | 43,252 | |
| | 83,838 | | | Series 2006-DR1(g) | | 5.50% | | | 05/25/2035 | | | | 48,540 | |
| | | | | Primose Funding LLC | | | | | | | | | | |
| | 997,500 | | | Series 2019-1A(g) | | 4.48% | | | 07/30/2026 | | | | 921,103 | |
| | | | | PRPM LLC | | | | | | | | | | |
| | 13,000,000 | | | Series 2020-1A(g)(m) | | 3.97% | | | 02/25/2023 | | | | 7,533,305 | |
| | | | | RBSGC Structured Trust | | | | | | | | | | |
| | 197,086 | | | Series 2008-B(g) | | 6.00% | | | 06/25/2037 | | | | 186,412 | |
| | | | | Residential Accredit Loans, Inc. | | | | | | | | | | |
| | 1,623,143 | | | Series 2005-QS17 | | 6.00% | | | 12/25/2035 | | | | 1,469,381 | |
| | 4,340,930 | | | Series 2006-QA5(f) | | 1M US L + 0.22% | | | 07/25/2036 | | | | 2,394,929 | |
| | 2,324,689 | | | Series 2006-QS10 | | 6.50% | | | 08/25/2036 | | | | 2,133,700 | |
| | 866,068 | | | Series 2006-QS4 | | 6.00% | | | 04/25/2036 | | | | 772,415 | |
| | 1,365,374 | | | Series 2006-QS6 | | 6.00% | | | 06/25/2036 | | | | 1,200,905 | |
| | 1,485,862 | | | Series 2006-QS7 | | 6.00% | | | 06/25/2036 | | | | 1,287,627 | |
| | 78,115 | | | Series 2006-QS7(f) | | 1M US L + 0.40% | | | 06/25/2036 | | | | 54,600 | |
| | 234,344 | | | Series 2006-QS7(f)(l) | | 5.60% - 1M US L | | | 06/25/2036 | | | | 40,077 | |
| | 98,898 | | | Series 2006-QS8(f) | | 1M US L + 0.45% | | | 08/25/2036 | | | | 70,752 | |
| | 296,695 | | | Series 2006-QS8(f)(l) | | 5.55% - 1M US L | | | 08/25/2036 | | | | 48,295 | |
| | 2,156,318 | | | Series 2007-QS3 | | 6.50% | | | 02/25/2037 | | | | 1,864,562 | |
| | 63,733 | | | Series 2007-QS6 | | 6.25% | | | 04/25/2037 | | | | 56,303 | |
| | | | | | | 55.00% -8.33 x | | | | | | | | |
| | 8,980 | | | Series 2007-QS6(f) | | 1M US L | | | 04/25/2037 | | | | 21,419 | |
| | 3,111,425 | | | Series 2007-QS9 | | 6.50% | | | 07/25/2037 | | | | 2,799,193 | |
| | 328,277 | | | Series 2008-QR1 | | 6.00% | | | 08/25/2036 | | | | 258,784 | |
See Notes to Financial Statements.
| Semi-Annual Report | March 31, 2020 | 49 |
| RiverNorth/DoubleLine Strategic Income Fund | Schedule of Investments |
March 31, 2020 (Unaudited)
| Principal Amount/Description | | Rate | | | Maturity | | | Value | |
| | | | | Residential Asset Securitization Trust | | | | | | | | | | |
| $ | 484,943 | | | Series 2006-A1 | | 6.00% | | | 04/25/2036 | | | $ | 338,853 | |
| | 1,026,877 | | | Series 2006-A2 | | 6.00% | | | 05/25/2036 | | | | 646,352 | |
| | 893,951 | | | Series 2006-A6 | | 6.50% | | | 07/25/2036 | | | | 357,412 | |
| | 357,976 | | | Series 2006-A8 | | 6.00% | | | 08/25/2036 | | | | 279,881 | |
| | 153,928 | | | Series 2006-A8 | | 6.50% | | | 08/25/2036 | | | | 68,340 | |
| | 325,907 | | | Series 2006-A8(f)(l) | | 5.90% - 1M US L | | | 08/25/2036 | | | | 91,893 | |
| | 1,488,019 | | | Series 2007-A1 | | 6.00% | | | 03/25/2037 | | | | 787,300 | |
| | 76,868 | | | Series 2007-A6 | | 6.00% | | | 06/25/2037 | | | | 58,842 | |
| | 2,719,351 | | | Series 2007-A7 | | 6.00% | | | 07/25/2037 | | | | 1,441,063 | |
| | | | | Residential Funding Mortgage Securities I Trust | | | | | | | | | | |
| | 852,646 | | | Series 2006-S3 | | 5.50% | | | 03/25/2036 | | | | 759,687 | |
| | 1,535,214 | | | Series 2006-S6 | | 6.00% | | | 07/25/2036 | | | | 1,403,305 | |
| | 345,966 | | | Series 2007-S3 | | 6.00% | | | 03/25/2037 | | | | 293,939 | |
| | 269,482 | | | Series 2007-S6 | | 6.00% | | | 06/25/2037 | | | | 242,771 | |
| | | | | Sapphire Aviation Finance II, Ltd. | | | | | | | | | | |
| | 500,000 | | | Series 2020-1A(g) | | 3.23% | | | 03/15/2027 | | | | 315,057 | |
| | | | | Sequoia Mortgage Trust | | | | | | | | | | |
| | 1,917,905 | | | Series 2007-3(f) | | 3.98% | | | 07/20/2037 | | | | 1,576,419 | |
| | | | | SLIDE | | | | | | | | | | |
| | 3,125,846 | | | Series 2018-FUN(f)(g) | | 1M US L + 3.00% | | | 06/15/2021 | | | | 2,668,198 | |
| | | | | SMB Private Education Loan Trust | | | | | | | | | | |
| | 489,344 | | | Series 2018-B(f)(g) | | 1M US L + 0.72% | | | 08/15/2027 | | | | 439,864 | |
| | | | | SoFi Consumer Loan Program, LLC | | | | | | | | | | |
| | 29,995 | | | Series 2017-2(g) | | 3.28% | | | 02/25/2026 | | | | 29,889 | |
| | | | | SoFi Professional Loan Program Trust | | | | | | | | | | |
| | 50,000 | | | Series 2020-A(g) | | 0.00% | | | 05/15/2046 | | | | 2,764,647 | |
| | | | | Sofi Professional Loan Program, LLC | | | | | | | | | | |
| | 32,412 | | | Series 2018-A(g) | | 0.00% | | | 02/25/2042 | | | | 1,931,578 | |
| | | | | SoFi Professional Loan Program, LLC | | | | | | | | | | |
| | 300,000 | | | Series 2017-D(g) | | 3.61% | | | 09/25/2040 | | | | 306,254 | |
| | 56,760 | | | Series 2019-B(g) | | 0.00% | | | 08/17/2048 | | | | 2,081,471 | |
| | | | | Sprite, Ltd. | | | | | | | | | | |
| | 334,089 | | | Series 2017-1(g) | | 4.25% | | | 12/15/2024 | | | | 234,368 | |
| | | | | Stack Infrastructure Issuer LLC | | | | | | | | | | |
| | 989,167 | | | Series 2019-1A(g) | | 4.54% | | | 02/26/2024 | | | | 993,730 | |
| | 750,000 | | | Series 2019-2A(g) | | 3.08% | | | 10/25/2024 | | | | 713,161 | |
| | | | | Start, Ltd. | | | | | | | | | | |
| | 732,159 | | | Series 2018-1(g) | | 4.09% | | | 05/15/2025 | | | | 528,769 | |
| | 1,160,714 | | | Series 2019-1(g) | | 4.09% | | | 03/15/2026 | | | | 791,397 | |
See Notes to Financial Statements.
| 50 | (888) 848-7569 | www.rivernorth.com |
| RiverNorth/DoubleLine Strategic Income Fund | Schedule of Investments |
March 31, 2020 (Unaudited)
| Principal Amount/Description | | Rate | | | Maturity | | | Value | |
| | | | | Structured Adjustable Rate Mortgage Loan Trust | | | | | | | | | | |
| $ | 762,594 | | | Series 2005-15(f) | | 3.76% | | | 07/25/2035 | | | $ | 524,652 | |
| | | | | Structured Asset Securities Corp. | | | | | | | | | | |
| | 210,068 | | | Series 2005-RF1(f)(g) | | 1M US L + 0.35% | | | 03/25/2035 | | | | 171,837 | |
| | 211,288 | | | Series 2005-RF1(f)(g)(l) | | 3.26% | | | 03/25/2035 | | | | 36,681 | |
| | | | | Sunnova Sol Issuer LLC | | | | | | | | | | |
| | 1,000,000 | | | Series 2020-1A(g) | | 3.35% | | | 01/30/2030 | | | | 741,918 | |
| | | | | Sunrun Atlas Issuer LLC | | | | | | | | | | |
| | 1,242,228 | | | Series 2019-2(g) | | 3.61% | | | 10/30/2027 | | | | 1,093,233 | |
| | | | | TAL Advantage, LLC | | | | | | | | | | |
| | 703,509 | | | Series 17-1A(g) | | 4.50% | | | 04/20/2042 | | | | 683,477 | |
| | | | | TBW Mortgage-Backed Trust | | | | | | | | | | |
| | 1,368,694 | | | Series 2006-2 | | 7.00% | | | 07/25/2036 | | | | 355,290 | |
| | | | | Textainer Marine Containers V, Ltd. | | | | | | | | | | |
| | 738,148 | | | Series 2017-1A(g) | | 3.72% | | | 01/20/2026 | | | | 668,383 | |
| | | | | Textainer Marine Containers VII, Ltd. | | | | | | | | | | |
| | 463,333 | | | Series 2019-1A(g) | | 3.96% | | | 10/20/2026 | | | | 436,432 | |
| | | | | Thunderbolt II Aircraft Lease, Ltd. | | | | | | | | | | |
| | 4,464,286 | | | Series 2018-A(g)(m) | | 5.07% | | | 09/15/2038 | | | | 2,793,464 | |
| | | | | TRIP Rail Master Funding, LLC | | | | | | | | | | |
| | 221,185 | | | Series 2017-1A(g) | | 2.71% | | | 07/15/2021 | | | | 219,027 | |
| | | | | UBS Commercial Mortgage Trust | | | | | | | | | | |
| | 464,000 | | | Series 2017-C6(f) | | 4.15% | | | 12/15/2027 | | | | 450,333 | |
| | | | | UBS-Barclays Commercial Mortgage Trust | | | | | | | | | | |
| | 989,000 | | | Series 2013-C5(f)(g) | | 4.10% | | | 02/10/2023 | | | | 854,351 | |
| | | | | Vantage Data Centers Issuer, LLC | | | | | | | | | | |
| | 734,375 | | | Series 2018-1A(g) | | 4.07% | | | 02/15/2023 | | | | 732,531 | |
| | | | | VB-S1 Issuer, LLC | | | | | | | | | | |
| | 3,000,000 | | | Series 2018-1A(g) | | 5.25% | | | 02/15/2023 | | | | 2,995,785 | |
| | | | | Velocity Commercial Capital Loan Trust | | | | | | | | | | |
| | 702,598 | | | Series 2018-2(f)(g) | | 4.05% | | | 09/25/2024 | | | | 710,815 | |
| | 1,335,650 | | | Series 2019-1(f)(g) | | 3.94% | | | 01/25/2027 | | | | 1,268,397 | |
| | 397,711 | | | Series 2019-1(f)(g) | | 4.01% | | | 07/25/2027 | | | | 343,907 | |
| | 394,913 | | | Series 2019-1(f)(g) | | 4.12% | | | 11/25/2027 | | | | 329,223 | |
| | | | | Wachovia Bank Commercial Mortgage Trust | | | | | | | | | | |
| | 39,378 | | | Series 2006-C29(a)(f)(l) | | 0.12% | | | 11/15/2048 | | | | 0 | |
| | | | | Wachovia Mortgage Loan Trust, LLC Series Trust | | | | | | | | | | |
| | 751,328 | | | Series 2005-B(f) | | 4.25% | | | 10/20/2035 | | | | 680,384 | |
See Notes to Financial Statements.
| Semi-Annual Report | March 31, 2020 | 51 |
| RiverNorth/DoubleLine Strategic Income Fund | Schedule of Investments |
March 31, 2020 (Unaudited)
| Principal Amount/Description | | Rate | | | Maturity | | | Value | |
| | | | | Washington Mutual Alternative Mortgage Pass-Through Certificates | | | | | | | | | | |
| $ | 1,401,562 | | | Series 2005-1 | | 6.00% | | | 03/25/2035 | | | $ | 1,344,775 | |
| | 60,510 | | | Series 2005-9 | | 5.50% | | | 11/25/2035 | | | | 50,864 | |
| | 456,901 | | | Series 2006-5 | | 6.00% | | | 07/25/2036 | | | | 376,551 | |
| | | | | Washington Mutual Mortgage Pass-Through Certificates Trust | | | | | | | | | | |
| | 864,583 | | | Series 2006-2 | | 6.00% | | | 03/25/2036 | | | | 824,639 | |
| | | | | WAVE LLC | | | | | | | | | | |
| | 964,300 | | | Series 2019-1(g) | | 3.60% | | | 09/15/2027 | | | | 619,271 | |
| | 937,500 | | | Series 2019-1(g) | | 6.41% | | | 09/15/2027 | | | | 582,763 | |
| | | | | Wells Fargo Alternative Loan Trust | | | | | | | | | | |
| | 507,683 | | | Series 2007-PA2(f) | | 1M US L + 0.43% | | | 06/25/2037 | | | | 382,428 | |
| | 507,683 | | | Series 2007-PA2(f)(l) | | 6.07% - 1M US L | | | 06/25/2037 | | | | 64,816 | |
| | 184,436 | | | Series 2007-PA3 | | 5.75% | | | 07/25/2037 | | | | 160,820 | |
| | 672,522 | | | Series 2007-PA3 | | 6.25% | | | 07/25/2037 | | | | 621,945 | |
| | 3,415,103 | | | Series 2007-PA5 | | 6.25% | | | 11/25/2037 | | | | 3,205,951 | |
| | | | | Wells Fargo Commercial Mortgage Trust | | | | | | | | | | |
| | 158,000 | | | Series 2014-LC16(g) | | 3.94% | | | 06/15/2024 | | | | 97,947 | |
| | 420,000 | | | Series 2015-NXS4(f) | | 4.67% | | | 11/15/2025 | | | | 369,872 | |
| | 655,000 | | | Series 2015-SG1 | | 4.05% | | | 08/15/2025 | | | | 685,988 | |
| | 1,000,000 | | | Series 2016-C33(g) | | 3.12% | | | 03/15/2059 | | | | 739,058 | |
| | 5,628,945 | | | Series 2016-C37(f)(g)(l) | | 1.60% | | | 12/15/2049 | | | | 413,641 | |
| | 695,000 | | | Series 2016-LC25(f) | | 4.42% | | | 11/15/2026 | | | | 698,427 | |
| | 518,000 | | | Series 2018-C45 | | 4.73% | | | 06/15/2028 | | | | 427,220 | |
| | 523,000 | | | Series 2018-C47(f) | | 4.94% | | | 10/15/2028 | | | | 436,838 | |
| | 436,000 | | | Series 2018-C48(f) | | 5.12% | | | 12/15/2028 | | | | 368,558 | |
| | 901,000 | | | Series 2019-C49 | | 4.55% | | | 02/15/2029 | | | | 883,809 | |
| | | | | WF-RBS Commercial Mortgage Trust | | | | | | | | | | |
| | 2,027,402 | | | Series 2012-C9(f)(g)(l) | | 1.89% | | | 11/15/2045 | | | | 77,138 | |
| | 3,578,333 | | | Series 2014-C21(f)(l) | | 1.04% | | | 08/15/2047 | | | | 126,364 | |
| | 4,336,311 | | | Series 2014-C22(f)(l) | | 0.81% | | | 09/15/2057 | | | | 122,063 | |
| | 636,000 | | | Series 2014-C23(f)(g) | | 4.00% | | | 10/15/2057 | | | | 528,648 | |
| | | | | Willis Engine Structured Trust V | | | | | | | | | | |
| | 1,000,000 | | | Series 2020-A(g) | | 3.23% | | | 03/15/2028 | | | | 565,940 | |
| | 2,471,346 | | | Zephyrus Capital Aviation Tl | | 4.61% | | | 10/15/2038 | | | | 2,024,445 | |
| | | | | | | | | | | | | | | |
| TOTAL NON AGENCY COLLATERALIZED MORTGAGE OBLIGATIONS | | | | | | | | | | |
| (Cost $423,157,168) | | | | | | | | | 360,026,777 | |
| | | | | | | | | | | | | | | |
| U.S. GOVERNMENT BONDS AND NOTES - 5.91% | | | | | | | | | | |
| | 6,005,000 | | | U.S. Treasury Bonds | | 2.25% | | | 08/15/2027 | | | | 6,742,020 | |
See Notes to Financial Statements.
| 52 | (888) 848-7569 | www.rivernorth.com |
| RiverNorth/DoubleLine Strategic Income Fund | Schedule of Investments |
March 31, 2020 (Unaudited)
| Principal Amount/Description | | Rate | | Maturity | | Value | |
| $ | 8,800,000 | | | U.S. Treasury Bonds | | 2.25% | | 11/15/2027 | | $ | 9,901,719 | |
| | 1,695,740 | | | U.S. Treasury Bonds | | 0.88% | | 01/15/2029 | | | 1,844,531 | |
| | 630,000 | | | U.S. Treasury Bonds | | 2.75% | | 11/15/2042 | | | 814,053 | |
| | 4,600,000 | | | U.S. Treasury Bonds | | 3.13% | | 02/15/2043 | | | 6,292,656 | |
| | 3,000,000 | | | U.S. Treasury Bonds | | 3.75% | | 11/15/2043 | | | 4,511,719 | |
| | 6,500,000 | | | U.S. Treasury Bonds | | 2.75% | | 11/15/2047 | | | 8,605,645 | |
| | 270,000 | | | U.S. Treasury Bonds | | 2.00% | | 02/15/2050 | | | 313,743 | |
| | 885,000 | | | U.S. Treasury Notes | | 1.75% | | 11/30/2021 | | | 907,713 | |
| | 5,680,000 | | | U.S. Treasury Notes | | 1.38% | | 01/31/2022 | | | 5,800,145 | |
| | 5,000,000 | | | U.S. Treasury Notes | | 0.38% | | 03/31/2022 | | | 5,013,770 | |
| | 5,960,000 | | | U.S. Treasury Notes | | 2.63% | | 02/28/2023 | | | 6,366,491 | |
| | 3,490,000 | | | U.S. Treasury Notes | | 2.50% | | 03/31/2023 | | | 3,721,212 | |
| | 5,140,000 | | | U.S. Treasury Notes | | 2.75% | | 04/30/2023 | | | 5,529,516 | |
| | 4,420,000 | | | U.S. Treasury Notes | | 1.63% | | 05/31/2023 | | | 4,604,224 | |
| | 4,520,000 | | | U.S. Treasury Notes | | 2.13% | | 09/30/2024 | | | 4,876,656 | |
| | 845,000 | | | U.S. Treasury Notes | | 2.25% | | 10/31/2024 | | | 917,353 | |
| | 1,180,000 | | | U.S. Treasury Notes | | 2.75% | | 02/28/2025 | | | 1,315,884 | |
| | 2,850,000 | | | U.S. Treasury Notes | | 0.50% | | 03/31/2025 | | | 2,868,313 | |
| | 8,610,000 | | | U.S. Treasury Notes | | 3.00% | | 09/30/2025 | | | 9,798,584 | |
| | 1,070,000 | | | U.S. Treasury Notes | | 2.63% | | 01/31/2026 | | | 1,202,371 | |
| | 1,600,000 | | | U.S. Treasury Notes | | 1.50% | | 02/15/2030 | | | 1,725,094 | |
| | 7,278,734 | | | United States Treasury Inflation Indexed Bonds | | 0.13% | | 10/15/2024 | | | 7,368,853 | |
| | | | | | | | | | | | | |
| TOTAL U.S. GOVERNMENT BONDS AND NOTES | | | | | | | | |
| (Cost $93,099,794) | | | | | | | 101,042,265 | |
| | | | | | | | | | | | | |
| MUNICIPALBONDS - 0.02% | | | | | | | | |
| | 120,000 | | | Missouri Highway & Transportation Commission, Revenue Bonds | | 5.06% | | 05/01/2024 | | | 136,167 | |
| | 165,000 | | | State of California, General Obligation Bonds | | 7.55% | | 04/01/2039 | | | 268,392 | |
| | | | | | | | | | | | | |
| TOTAL MUNICIPAL BONDS | | | | | | | | |
| (Cost $367,553) | | | | | | | 404,559 | |
| | | | | | | | | | | | | |
| U.S. GOVERNMENT / AGENCY MORTGAGE BACKED SECURITIES -15.01% |
| | | | | Banc of America Funding | | | | | | | | |
| | 3,469,553 | | | Series 2007-A(f) | | 1M US L + 0.21% | | 02/20/2047 | | | 2,828,669 | |
| | | | | Chase Mortgage Finance Trust | | | | | | | | |
| | 5,814,961 | | | Series 2007-S4 | | 6.00% | | 06/25/2037 | | | 3,944,941 | |
| | | | | ChaseFlex Trust Series | | | | | | | | |
| | 5,822,365 | | | Series 2007-M1(f) | | 1M US L + 0.23% | | 08/25/2037 | | | 4,682,553 | |
See Notes to Financial Statements.
| Semi-Annual Report | March 31, 2020 | 53 |
| RiverNorth/DoubleLine Strategic Income Fund | Schedule of Investments |
March 31, 2020 (Unaudited)
| Principal Amount/Description | | Rate | | Maturity | | Value | |
| | | | | Citigroup Mortgage Loan Trust | | | | | | | | |
| $ | 9,590,900 | | | Series 2018-A(f)(g) | | 4.25% | | 01/25/2068 | | $ | 7,551,075 | |
| | | | | Connecticut Avenue Securities Trust | | | | | | | | |
| | 5,000,000 | | | Series 2019-R05(f)(g) | | 1M US L + 4.10% | | 07/25/2039 | | | 2,456,295 | |
| | | | | Deephaven Residential Mortgage Trust | | | | | | | | |
| | 6,613,000 | | | Series 2020-1(f)(g) | | 3.66% | | 03/25/2024 | | | 5,826,437 | |
| | 4,000,000 | | | Series 2020-1(f)(g) | | 4.54% | | 03/25/2024 | | | 3,518,868 | |
| | | | | Fannie Mae Interest Strip | | | | | | | | |
| | 13,256,572 | | | Series 2014-419(l) | | 3.50% | | 04/25/2044 | | | 1,915,915 | |
| | | | | Fannie Mae Pool | | | | | | | | |
| | 3,000,000 | | | Series Pool #BL4424 | | 2.14% | | 10/01/2029 | | | 3,169,789 | |
| | 3,000,000 | | | Series Pool #BL5156 | | 2.37% | | 12/01/2029 | | | 3,235,974 | |
| | | | | Fannie Mae REMICS | | | | | | | | |
| | 12,614,016 | | | Series 2014-1(f)(l) | | 5.90% - 1M US L | | 02/25/2044 | | | 2,169,128 | |
| | | | | Federal Home Loan Mortgage Corp. Multifamily Structured Pass-Through Certificates | | | | | | | | |
| | 11,050,742 | | | Series 2013-K713(g)(l) | | 0.10% | | 05/20/2020 | | | 110 | |
| | 7,400,000 | | | Series 2013-K713(g)(i) | | 0.00% | | 05/25/2020 | | | 7,290,310 | |
| | | | | Federal Home Loan Mortgage Corp. Pool | | | | | | | | |
| | 245,030 | | | Series Pool #G01840 | | 5.00% | | 07/01/2035 | | | 272,197 | |
| | 91,463 | | | Series Pool #G04817 | | 5.00% | | 09/01/2038 | | | 101,957 | |
| | | | | Federal Home Loan Mortgage Corp. REMICS | | | | | | | | |
| | 1,208,278 | | | Series 2003-2722(f) | | 9.89% - 1M US L | | 12/15/2033 | | | 1,565,184 | |
| | 228,829 | | | Series 2005-R003 | | 5.50% | | 10/15/2035 | | | 272,785 | |
| | 1,646,948 | | | Series 2006-3244(f)(l) | | 6.66% - 1M US L | | 11/15/2036 | | | 380,088 | |
| | 80,704 | | | Series 2007-3261(f)(l) | | 6.43% - 1M US L | | 01/15/2037 | | | 17,925 | |
| | 172,689 | | | Series 2007-3262(f)(l) | | 6.40% - 1M US L | | 01/15/2037 | | | 26,758 | |
| | 764,310 | | | Series 2007-3301(f)(l) | | 6.10% - 1M US L | | 04/15/2037 | | | 155,486 | |
| | 543,860 | | | Series 2007-3303(f)(l) | | 6.10% - 1M US L | | 04/15/2037 | | | 116,603 | |
| | 176,455 | | | Series 2007-3382(f)(l) | | 6.00% - 1M US L | | 11/15/2037 | | | 24,130 | |
| | 456,013 | | | Series 2007-3384(f)(l) | | 6.31% - 1M US L | | 08/15/2036 | | | 95,800 | |
| | 187,278 | | | Series 2007-3384(f)(l) | | 6.39% - 1M US L | | 11/15/2037 | | | 28,459 | |
| | 212,083 | | | Series 2008-3417(f)(l) | | 6.18% - 1M US L | | 02/15/2038 | | | 24,682 | |
| | 4,266,309 | | | Series 2008-3423(f)(l) | | 6.00% - 1M US L | | 03/15/2038 | | | 31,861 | |
| | 220,410 | | | Series 2008-3423(f)(l) | | 5.65% - 1M US L | | 03/15/2038 | | | 23,957 | |
| | 1,630,842 | | | Series 2009-3510(f) | | 6.75% - 1M US L | | 02/15/2037 | | | 344,754 | |
| | 398,410 | | | Series 2009-3523(f)(l) | | 6.00% - 1M US L | | 04/15/2039 | | | 72,523 | |
| | 79,147 | | | Series 2009-3524 | | 3.59% | | 06/15/2038 | | | 84,782 | |
| | 14,247 | | | Series 2009-3549(f)(l) | | 5.80% - 1M US L | | 07/15/2039 | | | 1,881 | |
| | 931,754 | | | Series 2009-3560(f) | | 6.40% - 1M US L | | 11/15/2036 | | | 138,909 | |
See Notes to Financial Statements.
| 54 | (888) 848-7569 | www.rivernorth.com |
| RiverNorth/DoubleLine Strategic Income Fund | Schedule of Investments |
March 31, 2020 (Unaudited)
| Principal Amount/Description | | Rate | | Maturity | | Value | |
| $ | 370,745 | | | Series 2010-3641 | | 4.50% | | 03/15/2040 | | $ | 421,064 | |
| | 466,340 | | | Series 2010-3726(f)(l) | | 6.05% - 1M US L | | 09/15/2040 | | | 83,132 | |
| | 2,352,568 | | | Series 2010-3728(f)(l) | | 4.45% - 1M US L | | 09/15/2040 | | | 271,278 | |
| | 750,000 | | | Series 2010-3779 | | 3.50% | | 12/15/2030 | | | 814,417 | |
| | 145,815 | | | Series 2010-3779 | | 4.00% | | 12/15/2030 | | | 159,949 | |
| | 478,835 | | | Series 2010-3779 | | 4.50% | | 12/15/2040 | | | 512,366 | |
| | 78,997 | | | Series 2011-3786(f) | | 9.50% - 1M US L | | 01/15/2041 | | | 103,221 | |
| | 1,177,166 | | | Series 2011-3795 | | 4.00% | | 01/15/2041 | | | 1,305,321 | |
| | 69,792 | | | Series 2011-3798(f) | | 9.50% - 1M US L | | 11/15/2040 | | | 88,928 | |
| | 487,729 | | | Series 2011-3808 | | 3.50% | | 02/15/2031 | | | 522,817 | |
| | 39,198 | | | Series 2011-3809(f) | | 9.50% - 1M US L | | 02/15/2041 | | | 52,305 | |
| | 850,827 | | | Series 2011-3815(f)(l) | | 5.85% - 1M US L | | 02/15/2041 | | | 164,959 | |
| | 405,669 | | | Series 2011-3824 | | 3.50% | | 03/15/2031 | | | 437,773 | |
| | 467,041 | | | Series 2011-3824(f) | | 7.10% - 1M US L | | 08/15/2036 | | | 110,499 | |
| | 527,477 | | | Series 2011-3863 | | 5.50% | | 08/15/2034 | | | 599,782 | |
| | 646,114 | | | Series 2011-3864(f) | | 9.20% - 1M US L | | 05/15/2041 | | | 825,524 | |
| | 591,143 | | | Series 2011-3871 | | 5.50% | | 06/15/2041 | | | 687,816 | |
| | 566,793 | | | Series 2011-3872(f)(l) | | 5.95% - 1M US L | | 06/15/2041 | | | 93,152 | |
| | 3,011,825 | | | Series 2011-3910 | | 5.00% | | 08/15/2041 | | | 3,555,188 | |
| | 2,639,089 | | | Series 2011-3924(f)(l) | | 6.00% - 1M US L | | 09/15/2041 | | | 481,377 | |
| | 235,279 | | | Series 2011-3925(l) | | 3.00% | | 09/15/2021 | | | 3,417 | |
| | 3,588,709 | | | Series 2012-3(f)(l) | | 5.95% - 1M US L | | 02/25/2042 | | | 626,962 | |
| | 3,533,543 | | | Series 2013-4170(f) | | 4.05% - 1M US L | | 01/15/2033 | | | 3,709,479 | |
| | 10,652,547 | | | Series 2013-4218 | | 2.50% | | 02/15/2043 | | | 11,710,549 | |
| | 6,986,462 | | | Series 2013-4239(i) | | 0.00% | | 07/15/2043 | | | 6,556,983 | |
| | 4,819,592 | | | Series 2014-4413 | | 3.50% | | 11/15/2044 | | | 5,174,312 | |
| | 3,493,562 | | | Series 2015-4434 | | 3.00% | | 02/15/2045 | | | 3,612,316 | |
| | 3,406,085 | | | Series 2015-4440 | | 2.50% | | 02/15/2045 | | | 3,601,226 | |
| | | | | Federal Home Loan Mortgage Corp. Strips | | | | | | | | |
| | 2,501,936 | | | Series 2017-358 | | 3.00% | | 10/15/2047 | | | 2,695,223 | |
| | | | | Federal National Mortgage Association Pool | | | | | | | | |
| | 67,739 | | | Series Pool #555743 | | 5.00% | | 09/01/2033 | | | 75,230 | |
| | 81,732 | | | Series Pool #735382 | | 5.00% | | 04/01/2035 | | | 90,942 | |
| | 221,892 | | | Series Pool #735383 | | 5.00% | | 04/01/2035 | | | 246,785 | |
| | 149,723 | | | Series Pool #735484 | | 5.00% | | 05/01/2035 | | | 166,700 | |
| | 72,063 | | | Series Pool #AH4437 | | 4.00% | | 01/01/2041 | | | 76,833 | |
| | | | | Federal National Mortgage Association REMICS | | | | | | | | |
| | 76,310 | | | Series 2004-46(f)(l) | | 6.00% - 1M US L | | 03/25/2034 | | | 8,410 | |
| | 263,764 | | | Series 2006-101(f)(l) | | 6.58% - 1M US L | | 10/25/2036 | | | 57,372 | |
| | 772,757 | | | Series 2006-123(f)(l) | | 6.32% - 1M US L | | 01/25/2037 | | | 164,159 | |
| | 3,751,748 | | | Series 2006-92(f)(l) | | 6.58% - 1M US L | | 10/25/2036 | | | 766,070 | |
See Notes to Financial Statements.
| Semi-Annual Report | March 31, 2020 | 55 |
| RiverNorth/DoubleLine Strategic Income Fund | Schedule of Investments |
March 31, 2020 (Unaudited)
| Principal Amount/Description | | Rate | | Maturity | | Value | |
| $ | 90,104 | | | Series 2007-102(f)(l) | | 6.40% - 1M US L | | 11/25/2037 | | $ | 17,135 | |
| | 82,058 | | | Series 2007-108(f)(l) | | 6.36% - 1M US L | | 12/25/2037 | | | 10,830 | |
| | 16,912 | | | Series 2007-30(f)(l) | | 6.11% - 1M US L | | 04/25/2037 | | | 2,490 | |
| | 376,361 | | | Series 2007-38(f)(l) | | 6.08% - 1M US L | | 05/25/2037 | | | 48,805 | |
| | 11,689 | | | Series 2007-51(f)(l) | | 6.10% - 1M US L | | 06/25/2037 | | | 1,384 | |
| | 38,781 | | | Series 2007-53(f)(l) | | 6.10% - 1M US L | | 06/25/2037 | | | 5,267 | |
| | 521,740 | | | Series 2007-57(f)(l) | | 6.62% - 1M US L | | 10/25/2036 | | | 98,798 | |
| | 93,600 | | | Series 2007-68(f)(l) | | 6.65% - 1M US L | | 07/25/2037 | | | 13,689 | |
| | 611,278 | | | Series 2008-3(f)(l) | | 6.46% - 1M US L | | 02/25/2038 | | | 133,280 | |
| | 225,889 | | | Series 2008-56(f)(l) | | 6.06% - 1M US L | | 07/25/2038 | | | 33,266 | |
| | 35,583 | | | Series 2008-81 | | 5.50% | | 09/25/2038 | | | 39,990 | |
| | 337,743 | | | Series 2009-111 | | 5.00% | | 01/25/2040 | | | 384,529 | |
| | 161,154 | | | Series 2009-111(f)(l) | | 6.25% - 1M US L | | 01/25/2040 | | | 23,225 | |
| | 962,115 | | | Series 2009-12(f)(l) | | 6.60% - 1M US L | | 03/25/2036 | | | 174,502 | |
| | 33,444 | | | Series 2009-28(f) | | 6.00% - 1M US L | | 04/25/2037 | | | 4,551 | |
| | 416,449 | | | Series 2009-41 | | 4.50% | | 06/25/2039 | | | 457,788 | |
| | 88,145 | | | Series 2009-42(f)(l) | | 6.00% - 1M US L | | 06/25/2039 | | | 14,212 | |
| | 211,615 | | | Series 2009-47(f)(l) | | 6.10% - 1M US L | | 07/25/2039 | | | 20,320 | |
| | 114,419 | | | Series 2009-62(f)(l) | | 6.10% - 1M US L | | 08/25/2039 | | | 13,668 | |
| | 63,325 | | | Series 2009-66(f) | | 5.80% - 1M US L | | 02/25/2038 | | | 9,575 | |
| | 48,320 | | | Series 2009-68(f)(l) | | 5.25% - 1M US L | | 09/25/2039 | | | 5,066 | |
| | 265,752 | | | Series 2010-11(f)(l) | | 4.80% - 1M US L | | 02/25/2040 | | | 29,837 | |
| | 38,053 | | | Series 2010-111(f)(l) | | 6.00% - 1M US L | | 10/25/2040 | | | 4,825 | |
| | 130,383 | | | Series 2010-112 | | 4.00% | | 10/25/2040 | | | 137,317 | |
| | 138,459 | | | Series 2010-115(f) | | 6.60% - 1M US L | | 11/25/2039 | | | 16,122 | |
| | 1,965,043 | | | Series 2010-115(f)(l) | | 6.00% - 1M US L | | 10/25/2040 | | | 413,310 | |
| | 4,553,052 | | | Series 2010-123(f)(l) | | 6.05% - 1M US L | | 11/25/2040 | | | 874,143 | |
| | 759,678 | | | Series 2010-15(f)(l) | | 4.95% - 1M US L | | 03/25/2040 | | | 112,109 | |
| | 113,124 | | | Series 2010-34(f)(l) | | 4.93% - 1M US L | | 04/25/2040 | | | 12,531 | |
| | 66,886 | | | Series 2010-4(f)(l) | | 6.23% - 1M US L | | 02/25/2040 | | | 12,273 | |
| | 93,303 | | | Series 2010-58(f) | | 12.47% - 1M US L | | 06/25/2040 | | | 118,216 | |
| | 3,067,476 | | | Series 2010-75 | | 4.50% | | 07/25/2040 | | | 3,431,547 | |
| | 239,418 | | | Series 2010-9(f)(l) | | 4.75% - 1M US L | | 02/25/2040 | | | 24,337 | |
| | 55,528 | | | Series 2010-9(f)(l) | | 5.30% - 1M US L | | 02/25/2040 | | | 7,965 | |
| | 14,537 | | | Series 2010-90(f)(l) | | 6.00% - 1M US LMarch | | 08/25/2040 | | | 1,955 | |
| | 411,261 | | | Series 2011-16 | | 3.50% | | 03/25/2031 | | | 443,113 | |
| | 619,643 | | | Series 2011-25 | | 3.00% | | 04/25/2026 | | | 644,793 | |
| | 429,217 | | | Series 2011-29 | | 3.50% | | 04/25/2031 | | | 458,657 | |
| | 228,294 | | | Series 2011-48(f) | | 9.20% - 1M US L | | 06/25/2041 | | | 283,759 | |
| | 450,719 | | | Series 2011-5(f) | | 6.40% - 1M US L | | 11/25/2040 | | | 40,809 | |
| | 3,604,914 | | | Series 2012-106(f)(l) | | 6.16% - 1M US L | | 10/25/2042 | | | 729,204 | |
| | 1,194,654 | | | Series 2012-124(f) | | 7.79% - 1M US L | | 11/25/2042 | | | 1,474,325 | |
| | 9,795,601 | | | Series 2012-128(f) | | 6.00% - 1M US L | | 11/25/2042 | | | 11,433,631 | |
| | 222,004 | | | Series 2012-29(f)(l) | | 6.00% - 1M US L | | 04/25/2042 | | | 32,412 | |
See Notes to Financial Statements.
| 56 | (888) 848-7569 | www.rivernorth.com |
| RiverNorth/DoubleLine Strategic Income Fund | Schedule of Investments |
March 31, 2020 (Unaudited)
| Principal Amount/Description | | Rate | | Maturity | | Value | |
| $ | 825,891 | | | Series 2012-32(l) | | 5.00% | | 04/25/2042 | | $ | 133,110 | |
| | 3,707,113 | | | Series 2012-65(f)(l) | | 5.98% - 1M US L | | 06/25/2042 | | | 629,229 | |
| | 3,290,061 | | | Series 2013-19(f) | | 5.40% - 1M US L | | 03/25/2043 | | | 3,496,348 | |
| | 9,646,208 | | | Series 2013-51(f) | | 5.40% - 1M US L | | 04/25/2043 | | | 10,001,439 | |
| | 1,914,233 | | | Series 2015-59 | | 3.00% | | 06/25/2041 | | | 1,974,324 | |
| | 10,368,845 | | | Series 2015-79 | | 3.00% | | 11/25/2045 | | | 10,664,849 | |
| | 1,710,257 | | | Series 2015-9 | | 3.00% | | 01/25/2045 | | | 1,821,406 | |
| | 17,199,700 | | | Series 2016-72 | | 3.00% | | 10/25/2046 | | | 17,293,083 | |
| | 3,128,801 | | | Series 2018-21(i) | | 0.00% | | 04/25/2048 | | | 2,905,777 | |
| | 2,374,459 | | | Series 2018-27 | | 3.00% | | 12/25/2047 | | | 2,519,095 | |
| | 2,719,602 | | | Series 2018-36 | | 3.00% | | 06/25/2048 | | | 2,860,722 | |
| | 4,213,944 | | | Series 2019-12 | | 3.00% | | 04/25/2049 | | | 4,485,991 | |
| | | | | Figure Line of Credit Trust | | | | | | | | |
| | 95,364 | | | Series 2020-1(f)(g) | | 4.04% | | 09/25/2049 | | | 90,878 | |
| | | | | FMC GMSR Issuer Trust | | | | | | | | |
| | 500,000 | | | Series 2019-GT1(f)(g) | | 5.66% | | 05/25/2024 | | | 507,511 | |
| | 5,000,000 | | | Series 2019-GT2(f)(g) | | 4.72% | | 09/25/2024 | | | 2,888,021 | |
| | | | | Freddie Mac Pool | | | | | | | | |
| | 2,943,989 | | | Series Pool #RB5022 | | 3.00% | | 11/01/2039 | | | 3,093,900 | |
| | | | | Freddie Mac REMICS | | | | | | | | |
| | 5,358,503 | | | Series 2011-3972(f)(l) | | 5.90% - 1M US L | | 12/15/2041 | | | 936,614 | |
| | | | | Government National Mortgage Association | | | | | | | | |
| | 58,545 | | | Series 2004-83(f)(l) | | 6.08% - 1M US L | | 10/20/2034 | | | 11,528 | |
| | 50,313 | | | Series 2008-6(f)(l) | | 6.46% - 1M US L | | 02/20/2038 | | | 9,904 | |
| | 47,288 | | | Series 2008-67(f)(l) | | 6.00% - 1M US L | | 08/20/2038 | | | 8,461 | |
| | 744,269 | | | Series 2008-69(f)(l) | | 7.63% - 1M US L | | 08/20/2038 | | | 174,765 | |
| | 64,242 | | | Series 2009-10(f)(l) | | 6.65% - 1M US L | | 02/16/2039 | | | 12,078 | |
| | 955,030 | | | Series 2009-35 | | 4.50% | | 05/20/2039 | | | 1,073,844 | |
| | 3,809,290 | | | Series 2009-58(f)(l) | | 6.25% - 1M US L | | 06/20/2039 | | | 631,302 | |
| | 53,638 | | | Series 2009-6(f) | | 5.95% - 1M US L | | 02/20/2038 | | | 6,733 | |
| | 1,787,617 | | | Series 2009-75 | | 5.00% | | 09/20/2039 | | | 2,056,255 | |
| | 4,289,239 | | | Series 2010-121(f)(l) | | 6.00% - 1M US L | | 09/20/2040 | | | 842,365 | |
| | 73,303 | | | Series 2010-61(f)(l) | | 6.55% - 1M US L | | 09/20/2039 | | | 13,075 | |
| | 134,120 | | | Series 2010-98(f) | | 5.68% | | 03/20/2039 | | | 15,053 | |
| | 2,695,275 | | | Series 2011-148 | | 3.50% | | 11/16/2041 | | | 2,919,406 | |
| | 608,240 | | | Series 2011-69(i) | | 0.00% | | 05/20/2041 | | | 595,156 | |
| | 1,820,212 | | | Series 2011-71 | | 4.50% | | 02/20/2041 | | | 2,024,706 | |
| | 1,178,861 | | | Series 2011-71(f)(l) | | 5.40% - 1M US L | | 05/20/2041 | | | 194,786 | |
| | 369,124 | | | Series 2011-72(f)(l) | | 6.15% - 1M US L | | 05/20/2041 | | | 73,797 | |
| | 1,930,455 | | | Series 2011-89(f)(l) | | 5.45% - 1M US L | | 06/20/2041 | | | 323,376 | |
| | 398,142 | | | Series 2012-105(f)(l) | | 6.20% - 1M US L | | 01/20/2041 | | | 16,671 | |
| | 5,249,137 | | | Series 2013-113(f)(l) | | 6.25% - 1M US L | | 03/20/2043 | | | 784,754 | |
| | 7,098,336 | | | Series 2013-122(f)(l) | | 6.10% - 1M US L | | 08/16/2043 | | | 1,355,575 | |
See Notes to Financial Statements.
| Semi-Annual Report | March 31, 2020 | 57 |
| RiverNorth/DoubleLine Strategic Income Fund | Schedule of Investments |
March 31, 2020 (Unaudited)
| Principal Amount/Description | | Rate | | Maturity | | Value | |
| $ | 4,273,038 | | | Series 2013-148(f)(l) | | 5.68% - 1M US L | | 10/16/2043 | | $ | 812,766 | |
| | 7,562,646 | | | Series 2013-186(f)(l) | | 6.25% - 1M US L | | 02/16/2043 | | | 1,114,782 | |
| | 4,732,392 | | | Series 2014-156(f)(l) | | 6.25% - 1M US L | | 10/20/2044 | | | 811,897 | |
| | 9,492,144 | | | Series 2014-4(f)(l) | | 6.10% - 1M US L | | 01/16/2044 | | | 1,824,690 | |
| | 6,447,793 | | | Series 2014-5(f)(l) | | 6.15% - 1M US L | | 07/20/2043 | | | 941,855 | |
| | 5,934,985 | | | Series 2014-95(f)(l) | | 6.25% - 1M US L | | 06/16/2044 | | | 1,257,138 | |
| | 17,981,809 | | | Series 2018-97(f)(l) | | 6.20% - 1M US L | | 07/20/2048 | | | 2,965,544 | |
| | 19,145,655 | | | Series 2019-92(f)(l) | | 6.10% - 1M US L | | 07/20/2049 | | | 2,892,853 | |
| | | | | JP Morgan Resecuritization Trust | | | | | | | | |
| | 3,128,486 | | | Series 2014-6(f)(g) | | 1M US L + 0.21% | | 07/27/2046 | | | 2,550,829 | |
| | | | | Legacy Mortgage Asset Trust | | | | | | | | |
| | 13,310,000 | | | Series 2019-GS7(g)(m) | | 4.50% | | 11/25/2059 | | | 14,290,612 | |
| | | | | LHOME Mortgage Trust | | | | | | | | |
| | 4,250,000 | | | Series 2020-RTL1(g)(m) | | 3.72% | | 10/25/2022 | | | 4,108,602 | |
| | 3,750,000 | | | Series 2020-RTL1(g)(m) | | 4.95% | | 10/25/2022 | | | 3,495,488 | |
| | | | | Mello Warehouse Securitization Trust | | | | | | | | |
| | 3,500,000 | | | Series 2019-1(f)(g) | | 1M US L + 3.50% | | 05/14/2021 | | | 3,383,061 | |
| | 5,680,000 | | | Series 2019-2(f)(g) | | 1M US L + 3.25% | | 10/25/2021 | | | 5,456,948 | |
| | | | | Residential Mortgage Loan Trust | | | | | | | | |
| | 3,250,000 | | | Series 2020-1(f)(g) | | 4.67% | | 02/25/2024 | | | 2,765,023 | |
| | | | | Toorak Mortgage Corp., Ltd. | | | | | | | | |
| | 3,500,000 | | | Series 2019-2(m) | | 4.21% | | 09/25/2022 | | | 3,120,621 | |
| | | | | | | | | | | | | |
| TOTAL U.S. GOVERNMENT / AGENCY MORTGAGE BACKED SECURITIES | | | | | | | | |
| (Cost $306,302,690) | | | | | | | 256,492,777 | |
| Shares/Description | | | | | | | Value | |
| WARRANTS - 0.00%(b) | | | | | | | | |
| | 219,520 | | | Oas SA, Strike Price 1.00, Expires 05/16/2039(k) | | | | | | | 0 | |
| | | | | | | | | | | | | |
| TOTAL WARRANTS | | | | | | | | |
| (Cost $0) | | | | | | | 0 | |
| | | | | | | | | | | | | |
| SHORT-TERM INVESTMENTS -17.09% | | | | | | | | |
| Money Market Fund - 17.08% | | | | | | | | |
| | 291,935,795 | | | State Street Institutional Trust (7 Day Yield 0.61%) | | | | | | | 291,935,795 | |
See Notes to Financial Statements.
| 58 | (888) 848-7569 | www.rivernorth.com |
| RiverNorth/DoubleLine Strategic Income Fund | Schedule of Investments |
March 31, 2020 (Unaudited)
| Principal Amount/Description | | Rate | | Maturity | | Value | |
| U.S. Treasury - 0.01% | | | | | | | | |
| $ | 185,000 | | United States Treasury Bill(n) | | 1.54% | | 11/05/2020 | | $ | 184,890 | |
| | | | | | | | | |
| TOTAL SHORT-TERM INVESTMENTS | | | | | | | | |
| (Cost $292,119,075) | | | | | | | 292,120,685 | |
| | | | | | | | | |
| TOTAL INVESTMENTS - 98.07% | | | | | | | | |
| (Cost $1,886,305,074) | | | | | | $ | 1,676,062,532 | |
| OTHER ASSETS IN EXCESS OF LIABILITIES -1.93% | | | | | | | 33,061,344 | |
| NET ASSETS - 100.00% | | | | | | $ | 1,709,123,876 | |
Investment Abbreviations:
LIBOR - London Interbank Offered Rate
Libor Rates:
1M US L - 1 Month LIBOR as of March 31, 2020 was 0.99%
3M US L - 3 Month LIBOR as of March 31, 2020 was 1.45%
| (a) | Security does not have a market value or rate. Security will not be entitled to distributions in respect of principal or interest other than excess interest paid with respect to the mortgage loans. |
| (b) | Non-income producing security. |
| (c) | Affiliated company. See Note 9 to Notes to Financial Statements. |
| (d) | Security has no contractual maturity date, is not redeemable and contractually pays an indefinite stream of interest. |
| (e) | Securities were purchased pursuant to Regulation S under the Securities Act of 1933, which exempts securities offered and sold outside of the United States from registration. Such securities cannot be sold in the United States without either an effective registration statement filed pursuant to the Securities Act of 1933, or pursuant to an exemption from registration. These securities have been deemed liquid under procedures approved by the Fund's Board of Trustees (The “Board”). As of March 31, 2020, the aggregate fair value of those securities was $34,727,552, representing 2.03% of net assets. |
| (f) | Variable rate investment. Interest rates reset periodically. Interest rate shown reflects the rate in effect at March 31, 2020. For securities based on a published reference rate and spread, the reference rate and spread are indicated in the description above. Certain variable rate securities are not based on a published reference rate and spread but are determined by the issuer or agent and are based on current market conditions. These securities do not indicate a reference rate and spread in their description above. |
| (g) | Security exempt from registration under Rule 144A of the Securities Act of 1933. These securities have been deemed liquid under procedures approved by the Fund's Board of Trustees and may normally be sold to qualified institutional buyers in transactions exempt from registration. Total fair value of Rule 144A securities amounts to $366,650,337, which represents approximately 21.45% of net assets as of March 31, 2020. |
| (h) | Pay-in-kind securities - Rate paid in-kind is shown in parenthesis. |
See Notes to Financial Statements.
| Semi-Annual Report | March 31, 2020 | 59 |
| RiverNorth/DoubleLine Strategic Income Fund | Schedule of Investments |
March 31, 2020 (Unaudited)
| (i) | Issued with a zero coupon. Income is recognized through the accretion of discount. |
| (k) | The Level 3 assets were a result of unavailable quoted prices from an active market or the unavailability of other significant observable inputs. |
| (l) | Interest only securities. |
| (m) | Step up bond. Coupon changes periodically based upon a predetermined schedule. Interest rate disclosed is that which is in effect at March 31, 2020. |
| (n) | Rate shown represents the bond equivalent yield to maturity at date of purchase. |
See Notes to Financial Statements.
| 60 | (888) 848-7569 | www.rivernorth.com |
| RiverNorth/Oaktree High Income Fund | Schedule of Investments |
March 31, 2020 (Unaudited)
| Shares/Description | | | Value | |
| CLOSED-END FUNDS - 12.56% | | | | |
| | 35,617 | | | BlackRock Debt Strategies Fund, Inc. | | $ | 300,964 | |
| | 38,451 | | | BrandywineGLOBAL -Global Income Opportunities Fund, Inc. | | | 405,274 | |
| | 50,612 | | | Eaton Vance Limited Duration Income Fund | | | 534,969 | |
| | 61,831 | | | Highland Income Fund | | | 527,418 | |
| | 44,738 | | | Invesco Dynamic Credit Opportunities Fund | | | 357,009 | |
| | 215,950 | | | Invesco Senior Income Trust | | | 695,359 | |
| | 15,529 | | | NexPoint Credit Strategies Fund | | | 128,270 | |
| | 54,847 | | | PGIM Global High Yield Fund, Inc. | | | 606,608 | |
| | 32,911 | | | PGIM High Yield Bond Fund, Inc. | | | 381,109 | |
| | 18,070 | | | Western Asset Emerging Markets Debt Fund, Inc. | | | 190,277 | |
| | 61,469 | | | Western Asset Global High Income Fund, Inc. | | | 459,788 | |
| | 19,628 | | | Western Asset High Income Fund II, Inc. | | | 98,336 | |
| | 128,787 | | | Western Asset High Income Opportunity Fund, Inc. | | | 542,193 | |
| | | | | | | | | |
| TOTAL CLOSED-END FUNDS | | | | |
| (Cost $6,676,027) | | | 5,227,574 | |
| | | | | | | | | |
| COMMON STOCKS - 0.04% | | | | |
| | 947 | | | DBI Investors, Inc.(a)(b) | | | 2,690 | |
| | 2,675 | | | PHI Group, Inc.(a)(b) | | | 10,700 | |
| | 629 | | | Phi, Inc.(a)(b) | | | 2,516 | |
| | 3,002 | | | Ultra Petroleum Corp.(b) | | | 210 | |
| | | | | | | | | |
| TOTAL COMMON STOCKS | | | | |
| (Cost $265,094) | | | 16,116 | |
| | | | | | | | | |
| PREFERRED STOCKS - 0.23% | | | | |
| | 116 | | | DBI Investors Inc., 10.000%(a)(b)(c)(d) | | | 60 | |
| | 98 | | | Sequa Corp., 7.000%(a)(b)(c) | | | 95,146 | |
| | | | | | | | | |
| TOTAL PREFERRED STOCKS | | | | |
| (Cost $109,039) | | | 95,206 | |
| Principal Amount/Description | | Rate | | Maturity | | | Value | |
| BANK LOANS - 36.71% | | | | | | | | |
| Canada - 0.55% | | | | | | | | | |
| $ | 235,932 | | | GFL Environmental, Inc., First Lien -Effective Date Incremental Term Loan(e) | | 1M US L + 3.00%, 1.00% Floor | | 05/30/2025 | | | 229,936 | |
| | | | | | | | | | | | | |
| Denmark - 0.76% | | | | | | | | |
| | 229,305 | | | Nets Holdco 4 ApS, First Lien -Facility B1E Term Loan(e) | | 3M EUR L + 3.25% | | 02/06/2025 | | | 230,456 | |
See Notes to Financial Statements.
| Semi-Annual Report | March 31, 2020 | 61 |
| RiverNorth/Oaktree High Income Fund | Schedule of Investments |
March 31, 2020 (Unaudited)
| Principal Amount/Description | | Rate | | Maturity | | Value | |
| $ | 81,941 | | | TDC A/S, First Lien -Facility B3 Term Loan(e) | | 1M EUR L + 3.00% | | 06/04/2025 | | $ | 85,741 | |
| | | | | | | | | | | | 316,197 | |
| Finland - 0.19% | | | | | | | | |
| | 100,000 | | | Mascot Bidco Oy, First Lien -Facility B Term Loan(e) | | 6M EUR L + 4.50% | | 03/30/2026 | | | 78,471 | |
| | | | | | | | | | | | | |
| France - 1.62% | | | | | | | | |
| | 98,750 | | | Altice France S.A., First Lien -USD TLB- 13 Incremental Term Loan(e) | | 1M US L + 4.00% | | 08/14/2026 | | | 94,553 | |
| | 100,000 | | | CAB, First Lien - Facility B Term Loan(e) | | 3M EUR L + 3.75% | | 04/25/2026 | | | 95,511 | |
| | 300,000 | | | Constantin Investissement 4 S.A.S., First Lien - Facility B Term Loan(e) | | 3M EUR L + 2.75% | | 04/22/2024 | | | 304,675 | |
| | 194,500 | | | Numericable U.S. LLC, First Lien -USD TLB-11 Term Loan(e) | | 1M US L + 2.75% | | 07/31/2025 | | | 180,399 | |
| | | | | | | | | | | | 675,138 | |
| Germany - 0.87% | | | | | | | | |
| | 190,000 | | | Alpha Group, SARL, First Lien -Facility B Term Loan(e) | | 3M EUR L + 3.75% | | 01/31/2025 | | | 137,256 | |
| | 157,130 | | | CTC AcquiCo GmbH, First Lien -Facility B2 Term Loan(e) | | 3M US L + 2.75% | | 03/07/2025 | | | 125,704 | |
| | 100,000 | | | Marcel Lux IV SARL, First Lien -Facility B2 (EUR) Term Loan(e) | | 3M EUR L + 3.50% | | 03/16/2026 | | | 98,710 | |
| | | | | | | | | | | | 361,670 | |
| Great Britain - 2.34% | | | | | | | | |
| | 98,746 | | | EG Group, Ltd., First Lien -Facility B (EUR) Term Loan(e) | | 3M US L + 4.00% | | 02/07/2025 | | | 86,363 | |
| | 175,772 | | | Formula One Management, Ltd., First Lien - Facility B3 Term Loan(e) | | 1M US L + 2.50%, 1.00% Floor | | 02/01/2024 | | | 158,697 | |
| | 210,000 | | | Franklin UK Midco, Ltd., First Lien - Facility B1 Term Loan(e) | | 6M EUR L + 3.50% | | 12/18/2024 | | | 193,104 | |
| | 222,078 | | | Genesis Specialist Care Finance UK, Ltd., First Lien - Facility B2 Term Loan(e) | | 3M EUR L + 3.00% | | 10/30/2025 | | | 211,457 | |
| | 181,182 | | | Lernen Bidco, Ltd., First Lien -Facility B1 (EUR) Term Loan(e) | | 6M EUR L + 4.25% | | 10/25/2025 | | | 166,105 | |
| | 149,837 | | | Richmond UK Holdco, Ltd., First Lien - Facility B Term Loan(e) | | 6M US L + 4.25% | | 03/03/2024 | | | 156,800 | |
| | | | | | | | | | | | 972,526 | |
| Luxembourg - 1.44% | | | | | | | | |
| | 250,000 | | | AI Convoy S.a r.l., First Lien -Facility B Term Loan(e)(f) | | L + 3.50%, 1.00% Floor | | 01/18/2027 | | | 224,375 | |
| | 146,625 | | | Altice Financing S.A., First Lien - October 2017 USD Term Loan(e) | | 1M US L + 2.75% | | 01/31/2026 | | | 134,895 | |
See Notes to Financial Statements.
| 62 | (888) 848-7569 | www.rivernorth.com |
| RiverNorth/Oaktree High Income Fund | Schedule of Investments |
March 31, 2020 (Unaudited)
| Principal Amount/Description | | Rate | | Maturity | | Value | |
| $ | 250,000 | | | Camelot U.S. Acquisition 1 Co., First Lien - Initial Term Loan(e)(f) | | L + 3.25% | | 10/30/2026 | | $ | 238,750 | |
| | | | | | | | | | | | 598,020 | |
| Netherlands - 1.41% | | | | | | | | |
| | 39,600 | | | NEP Group, Inc., First Lien -Initial Euro Term Loan(e) | | 3M EUR L + 3.50% | | 10/20/2025 | | | 28,679 | |
| | 283,418 | | | Peer Holdings III B.V., First Lien - Facility B Term Loan(e) | | 6M EUR L + 3.25% | | 03/07/2025 | | | 264,757 | |
| | 250,000 | | | Sigma Holdco B.V., First Lien -Facility B4 (GBP) Term Loan(e) | | 1M US L + 4.00% | | 07/02/2025 | | | 276,109 | |
| | 18,000 | | | Sunshine Investments B.V., First Lien - Facility B3 Term Loan(e) | | L + 3.25% | | 03/28/2025 | | | 16,650 | |
| | | | | | | | | | | | 586,195 | |
| Sweden - 0.50% | | | | | | | | |
| | 200,000 | | | Verisure Holding AB, First Lien - Facility B1F Term Loan(e) | | 3M EUR L + 3.50% | | 10/21/2022 | | | 210,103 | |
| | | | | | | | | | | | | |
| United States - 27.03% | | | | | | | | |
| | 245,832 | | | Access CIG LLC, First Lien -B Term Loan(e) | | 3M US L + 3.75% | | 02/27/2025 | | | 202,505 | |
| | 335,380 | | | Acuity Specialty Products, Inc., First Lien - Initial Term Loan(e) | | 3M US L + 4.00%, 1.00% Floor | | 08/12/2024 | | | 226,382 | |
| | 147,750 | | | Adtalem Global Education, Inc., First Lien - B Term Loan(e) | | 1M US L + 3.00% | | 04/11/2025 | | | 133,960 | |
| | 38,800 | | | AI Aqua Merger Sub, Inc., First Lien - Tranche B-1 Term Loan(e) | | 3M US L + 3.25%, 1.00% Floor | | 12/13/2023 | | | 33,368 | |
| | 242,451 | | | American Renal Holdings, Inc., First Lien - B Term Loan(e) | | 1M US L + 5.00% | | 06/21/2024 | | | 210,326 | |
| | 237,727 | | | American Rock Salt Co. LLC, First Lien - Initial Term Loan(e) | | 1M US L + 3.75%, 1.00% Floor | | 03/21/2025 | | | 206,822 | |
| | 147,750 | | | Amynta Agency Borrower, Inc., First Lien - B Term Loan(e) | | 1M US L + 4.50% | | 02/28/2025 | | | 120,417 | |
| | 146,666 | | | Applied Systems, Inc., First Lien - Closing Date Term Loan(e) | | 3M US L + 3.25%, 1.00% Floor | | 09/19/2024 | | | 136,644 | |
| | 143,788 | | | Asurion LLC, First Lien -Amendment No. 14 Replacement B-4 Term Loan(e) | | 1M US L + 3.00% | | 08/04/2022 | | | 137,797 | |
| | 247,500 | | | Atlantic Aviation FBO, Inc., First Lien - B Term Loan(e) | | 1M US L + 3.75% | | 12/06/2025 | | | 237,600 | |
| | 167,109 | | | Aveanna Healthcare LLC, First Lien - Initial Term Loan(e) | | 3M US L + 4.25%, 1.00% Floor | | 03/18/2024 | | | 129,509 | |
| | 180,255 | | | BCP Renaissance Parent LLC, First Lien - Initial Term Loan(e) | | 3M US L + 3.50%, 1.00% Floor | | 10/31/2024 | | | 92,831 | |
| | 196,500 | | | Beacon Roofing Supply, Inc., First Lien - Initial Term Loan(e) | | 1M US L + 2.25% | | 01/02/2025 | | | 179,552 | |
See Notes to Financial Statements.
| Semi-Annual Report | March 31, 2020 | 63 |
| RiverNorth/Oaktree High Income Fund | Schedule of Investments |
March 31, 2020 (Unaudited)
| Principal Amount/Description | | Rate | | Maturity | | Value | |
| $ | 147,000 | | | Belron Finance US LLC, First Lien - Initial B Term Loan(e) | | 3M US L + 2.25% | | 11/07/2024 | | $ | 139,650 | |
| | 97,750 | | | Big River Steel LLC, First Lien -Closing Date Term Loan(e) | | 3M US L + 5.00%, 1.00% Floor | | 08/23/2023 | | | 93,840 | |
| | 245,011 | | | Boing US Holdco, Inc., First Lien -B Term Loan(e) | | 1M US L + 3.25%, 1.00% Floor | | 10/03/2024 | | | 194,171 | |
| | 61,041 | | | Boyd Gaming Corp., First Lien - Refinancing B Term Loan(e) | | 1W US L + 2.25% | | 09/15/2023 | | | 53,506 | |
| | 246,875 | | | Bracket Intermediate Holding Corp., First Lien - Initial Term Loan(e) | | 3M US L + 4.25% | | 09/05/2025 | | | 203,672 | |
| | 247,500 | | | Brookfield WEC Holdings, Inc., First Lien - Initial (2020) Term Loan(e) | | 1M US L + 3.00%, 0.75% Floor | | 08/01/2025 | | | 236,053 | |
| | 15,000 | | | Castle US Holding Corp., First Lien - Initial Euro Term Loan(e)(f) | | E + 3.75% | | 01/29/2027 | | | 13,698 | |
| | 204,087 | | | Cengage Learning, Inc., First Lien - 2016 Refinancing Term Loan(e) | | 1M US L + 4.25%, 1.00% Floor | | 06/07/2023 | | | 167,352 | |
| | 247,500 | | | CentralSquare Technologies LLC, First Lien - Initial Term Loan(e) | | 3M US L + 3.75% | | 08/29/2025 | | | 199,485 | |
| | 500,000 | | | CenturyLink, Inc., First Lien -B Term Loan(e) | | L + 2.25% | | 03/15/2027 | | | 469,690 | |
| | 103,319 | | | CEOC LLC, First Lien - B Term Loan(e) | | 1M US L + 2.00% | | 10/07/2024 | | | 85,238 | |
| | 245,011 | | | Charter Communications Operating LLC, First Lien - B-2 Term Loan(e) | | 1M US L + 1.75% | | 02/01/2027 | | | 236,436 | |
| | 98,237 | | | Charter NEX US, Inc., First Lien -Initial Term Loan(e) | | 1M US L + 3.00%, 1.00% Floor | | 05/16/2024 | | | 84,852 | |
| | 147,367 | | | Cogeco Communications II LP, First Lien - B Term Loan(e) | | 1M US L + 2.00% | | 01/03/2025 | | | 139,753 | |
| | 246,250 | | | Covia Holdings Corp., First Lien -Initial Term Loan(e) | | 3M US L + 4.00%, 1.00% Floor | | 06/01/2025 | | | 116,554 | |
| | 172,987 | | | Cypress Intermediate Holdings III, Inc., First Lien - Initial Term Loan(e) | | 1M US L + 2.75%, 1.00% Floor | | 04/29/2024 | | | 159,827 | |
| | 147,376 | | | EG Group, Ltd., First Lien -Additional Facility Term Loan(e) | | 6M US L + 4.00% | | 02/07/2025 | | | 109,648 | |
| | 97,003 | | | ExamWorks Group, Inc., First Lien -B- 1 Term Loan(e) | | 3M US L + 3.25%, 1.00% Floor | | 07/27/2023 | | | 88,030 | |
| | 246,250 | | | Flynn Restaurant Group LP, First Lien - Initial Term Loan(e) | | 1M US L + 3.50% | | 06/27/2025 | | | 195,769 | |
| | 125,000 | | | Flynn Restaurant Group LP, Second Lien - Initial Term Loan(e) | | 1M US L + 7.00% | | 06/29/2026 | | | 90,625 | |
| | 246,875 | | | Franklin Square Holdings LP, First Lien - Initial Term Loan(e) | | 1M US L + 2.25% | | 08/01/2025 | | | 228,359 | |
| | 250,000 | | | Froneri International, Ltd., First Lien - Facility B2 Term Loan(e) | | L + 2.25% | | 01/29/2027 | | | 240,000 | |
| | 136,988 | | | Gentiva Health Services, Inc., First Lien - B Term Loan(e) | | 1M US L + 3.25% | | 07/02/2025 | | | 129,453 | |
| | 195,006 | | | Global Medical Response, Inc., First Lien - 2018 Term Loan(e) | | 2M US L + 3.25%, 1.00% Floor | | 04/28/2022 | | | 182,331 | |
See Notes to Financial Statements.
| 64 | (888) 848-7569 | www.rivernorth.com |
| RiverNorth/Oaktree High Income Fund | Schedule of Investments |
March 31, 2020 (Unaudited)
| Principal Amount/Description | | Rate | | Maturity | | Value | |
| $ | 216,055 | | | Globallogic Holdings, Inc., First Lien - Initial Term Loan(e) | | 1M US L + 2.75% | | 08/01/2025 | | $ | 205,252 | |
| | 200,165 | | | Golden Nugget, Inc., First Lien -Initial B Term Loan(e) | | 1M US L + 2.50%, 0.75% Floor | | 10/04/2023 | | | 157,130 | |
| | 115,737 | | | Graftech International, Ltd., First Lien - Initial Term Loan(e) | | 1M US L + 3.50%, 1.00% Floor | | 02/12/2025 | | | 101,270 | |
| | 161,346 | | | Greeneden U.S. Holdings I LLC, First Lien - Tranche B-3 Dollar Term Loan(e) | | 1M US L + 3.25% | | 12/01/2023 | | | 152,472 | |
| | 98,000 | | | Greenrock Finance, Inc., First Lien - Initial USD B Term Loan(e) | | 3M US L + 3.50%, 1.00% Floor | | 06/28/2024 | | | 84,995 | |
| | 147,750 | | | Hub International, Ltd., First Lien - Initial Term Loan(e) | | 3M US L + 2.75% | | 04/25/2025 | | | 139,180 | |
| | 655,807 | | | Jaguar Holding Co. I LLC, First Lien - 2018 Term Loan(e) | | 1M US L + 2.50%, 1.00% Floor | | 08/18/2022 | | | 631,683 | |
| | 99,250 | | | JBS USA Lux S.A., First Lien -New Term Loan(e) | | 3M US L + 2.00% | | 05/01/2026 | | | 93,649 | |
| | 77,600 | | | Learfield Communications LLC, First Lien - Initial Term Loan(e) | | 1M US L + 3.25%, 1.00% Floor | | 12/01/2023 | | | 52,897 | |
| | 229,558 | | | Life Time Fitness, Inc., First Lien -2017 Refinancing Term Loan(e) | | 3M US L + 2.75%, 1.00% Floor | | 06/10/2022 | | | 172,743 | |
| | 290,002 | | | McAfee LLC, First Lien -B USD Term Loan(e) | | 1M US L + 3.75% | | 09/30/2024 | | | 274,052 | |
| | 250,000 | | | NASCAR Holdings LLC, First Lien - Initial Term Loan(e) | | L + 2.75% | | 10/19/2026 | | | 222,500 | |
| | 495,000 | | | Natgasoline LLC, First Lien -Initial Term Loan(e) | | 3M US L + 3.50% | | 11/14/2025 | | | 433,125 | |
| | 10,000 | | | Navicure, Inc., First Lien -Initial Term Loan(e) | | L + 4.00% | | 10/22/2026 | | | 9,275 | |
| | 97,250 | | | Onvoy LLC, First Lien -Initial Term Loan(e) | | 1M US L + 4.50%, 1.00% Floor | | 02/10/2024 | | | 77,071 | |
| | 147,601 | | | PetVet Care Centers LLC, First Lien - Initial Term Loan(e) | | 1M US L + 2.75% | | 02/14/2025 | | | 123,494 | |
| | 97,503 | | | Playa Resorts Holding B.V., First Lien - Initial Term Loan(e) | | 1M US L + 2.75%, 1.00% Floor | | 04/29/2024 | | | 67,862 | |
| | 250,000 | | | Pug LLC, First Lien -USD B Term Loan(e) | | L + 3.50% | | 02/12/2027 | | | 217,500 | |
| | 235,297 | | | Recess Holdings, Inc., First Lien -Initial Term Loan(e) | | 3M US L + 3.75%, 1.00% Floor | | 09/30/2024 | | | 194,120 | |
| | 250,000 | | | Recorded Books, Inc., First Lien -Initial Term Loan(e)(f) | | L + 4.25% | | 08/29/2025 | | | 221,250 | |
| | 99,000 | | | Refinitiv US Holdings, Inc., First Lien - Initial Euro Term Loan(e) | | 3M EUR L + 3.25% | | 10/01/2025 | | | 104,869 | |
| | 194,150 | | | Ring Container Technologies Group LLC, First Lien - Initial Term Loan(e) | | 1M US L + 2.75% | | 10/31/2024 | | | 169,881 | |
| | 222,492 | | | St. George's University Scholastic Services LLC, First Lien (e) | | 1M US L + 3.25% | | 07/17/2025 | | | 215,818 | |
See Notes to Financial Statements.
| Semi-Annual Report | March 31, 2020 | 65 |
| RiverNorth/Oaktree High Income Fund | Schedule of Investments |
March 31, 2020 (Unaudited)
| Principal Amount/Description | | Rate | | Maturity | | Value | |
| $ | 83 | | | Toys R Us Tl1(d) | | 7.75% (8.75%) | | 03/08/2023 | | $ | 83 | |
| | 238 | | | Toys R Us Tl2(d) | | 9.50% (12.50%) | | 03/08/2024 | | | 220 | |
| | 85,456 | | | Trans Union LLC, First Lien -2019 Replacement B-5 Term Loan(e) | | 1M US L + 1.75% | | 11/16/2026 | | | 82,380 | |
| | 438,989 | | | TransDigm, Inc., First Lien -Tranche E Refinancing Term Loan(e) | | 1M US L + 2.25% | | 05/30/2025 | | | 404,600 | |
| | 248,125 | | | Tunnel Hill Partners LP, First Lien - Initial Term Loan(e) | | 1M US L + 3.50% | | 02/06/2026 | | | 214,628 | |
| | 35,761 | | | Vestcom Parent Holdings, Inc., First Lien - L/C Collaterilized Term Loan(e) | | 3M US L + 4.00%, 1.00% Floor | | 12/19/2023 | | | 28,787 | |
| | 227,681 | | | Windstream Services Tl(e) | | L + 4.00% | | 12/31/2049 | | | 143,439 | |
| | 132,344 | | | YI LLC, First Lien - Initial Term Loan(e) | | 3M US L + 4.00%, 1.00% Floor | | 11/07/2024 | | | 104,221 | |
| | 250,000 | | | Zayo Group Holdings, Inc., First Lien - Initial Dollar Term Loan(e) | | L + 3.00% | | 03/09/2027 | | | 237,500 | |
| | | | | | | | | | | | 11,243,651 | |
| | | | | | | | | | | | | |
| TOTAL BANK LOANS | | | | | | | | |
| (Cost $17,741,677) | | | | | | | 15,271,907 | |
| | | | | | | | | | | | | |
| HIGH YIELD DEBT- 48.75% | | | | | | | | |
| Australia -0.35% | | | | | | | | |
| | 40,000 | | | Mineral Resources, Ltd.(g) | | 8.13% | | 05/01/2027 | | | 37,754 | |
| | 120,000 | | | Nufarm Australia, Ltd. / Nufarm Americas, Inc.(g) | | 5.75% | | 04/30/2026 | | | 105,844 | |
| | | | | | | | | | | | 143,598 | |
| Canada - 1.65% | | | | | | | | |
| | 80,000 | | | 1011778 BC ULC / New Red Finance, Inc.(g) | | 4.38% | | 01/15/2028 | | | 74,356 | |
| | 5,000 | | | Baytex Energy Corp.(g) | | 5.63% | | 06/01/2024 | | | 1,894 | |
| | 25,000 | | | Baytex Energy Corp.(g) | | 8.75% | | 04/01/2027 | | | 9,725 | |
| | 55,000 | | | Bombardier, Inc.(g) | | 6.13% | | 01/15/2023 | | | 39,119 | |
| | 36,000 | | | Cascades, Inc.(g) | | 5.75% | | 07/15/2023 | | | 35,145 | |
| | 35,000 | | | Cascades, Inc./Cascades USA, Inc.(g) | | 5.13% | | 01/15/2026 | | | 34,125 | |
| | 65,000 | | | Cascades, Inc./Cascades USA, Inc.(g) | | 5.38% | | 01/15/2028 | | | 62,562 | |
| | 45,000 | | | Eldorado Gold Corp.(g) | | 9.50% | | 06/01/2024 | | | 44,719 | |
| | 25,000 | | | First Quantum Minerals, Ltd.(g) | | 7.25% | | 05/15/2022 | | | 22,384 | |
| | 20,000 | | | First Quantum Minerals, Ltd.(g) | | 7.25% | | 04/01/2023 | | | 17,250 | |
| | 85,000 | | | GFL Environmental, Inc.(g) | | 5.13% | | 12/15/2026 | | | 83,512 | |
| | 60,000 | | | goeasy, Ltd.(g) | | 5.38% | | 12/01/2024 | | | 56,307 | |
| | 50,000 | | | Mattamy Group Corp.(g) | | 4.63% | | 03/01/2030 | | | 43,281 | |
| | 45,000 | | | MEG Energy Corp.(g) | | 7.00% | | 03/31/2024 | | | 21,038 | |
| | 45,000 | | | MEG Energy Corp.(g) | | 7.13% | | 02/01/2027 | | | 22,725 | |
| | 35,000 | | | Precision Drilling Corp. | | 7.75% | | 12/15/2023 | | | 14,306 | |
| | 15,000 | | | Precision Drilling Corp.(g) | | 7.13% | | 01/15/2026 | | | 5,078 | |
See Notes to Financial Statements.
| 66 | (888) 848-7569 | www.rivernorth.com |
RiverNorth/Oaktree High Income Fund | Schedule of Investments |
March 31, 2020 (Unaudited)
Principal Amount/Description | | Rate | | Maturity | | Value | |
$ | 70,000 | | Telesat Canada / Telesat LLC(g) | | 4.88% | | 06/01/2027 | | $ | 67,361 | |
| 50,000 | | Vermilion Energy, Inc.(g) | | 5.63% | | 03/15/2025 | | | 31,437 | |
| | | | | | | | | | 686,324 | |
Cayman Islands - 0.26% | | | | | | | | |
| 105,000 | | Global Aircraft Leasing Co., Ltd.(d)(g) | | 6.50% (7.25%) | | 09/15/2024 | | | 68,408 | |
| 20,875 | | Transocean Guardian, Ltd.(g) | | 5.88% | | 01/15/2024 | | | 16,856 | |
| 30,000 | | Transocean Poseidon, Ltd.(g) | | 6.88% | | 02/01/2027 | | | 24,509 | |
| | | | | | | | | �� | 109,773 | |
Denmark -0.24% | | | | | | | | |
| 100,000 | | DKT Finance ApS(h) | | 7.00% | | 06/17/2023 | | | 100,143 | |
| | | | | | | | | | | | |
Finland - 0.09% | | | | | | | | |
| 40,000 | | Nokia Oyj | | 4.38% | | 06/12/2027 | | | 39,022 | |
| | | | | | | | | | | | |
France - 1.03% | | | | | | | | |
| 100,000 | | Altice France SA(h) | | 5.88% | | 02/01/2027 | | | 112,634 | |
| 120,000 | | Altice France SA(g) | | 5.50% | | 01/15/2028 | | | 113,022 | |
| 100,000 | | Banijay Entertainment SASU(g) | | 3.50% | | 03/01/2025 | | | 100,048 | |
| 100,000 | | Constantin Investissement 3 SASU(h) | | 5.38% | | 04/15/2025 | | | 100,971 | |
| | | | | | | | | | 426,675 | |
Germany -0.76% | | | | | | | | |
| 120,000 | | Nidda Healthcare Holding GmbH(h) | | 3.50% | | 09/30/2024 | | | 123,023 | |
| 100,000 | | Techem Verwaltungsgesellschaft 674 mbH(h) | | 6.00% | | 07/30/2026 | | | 102,570 | |
| 100,000 | | Tele Columbus AG(h) | | 3.88% | | 05/02/2025 | | | 92,032 | |
| | | | | | | | | | 317,625 | |
Great Britain - 1.05% | | | | | | | | |
| 100,000 | | Arqiva Broadcast Finance PLC | | 6.75% | | 09/30/2023 | | | 125,117 | |
| 100,000 | | Connect Finco SARL / Connect US Finco LLC(g) | | 6.75% | | 10/01/2026 | | | 83,000 | |
| 100,000 | | Heathrow Finance PLC | | 4.13% | | 09/01/2029 | | | 106,883 | |
| 100,000 | | Nomad Foods Bondco PLC(h) | | 3.25% | | 05/15/2024 | | | 104,913 | |
| 20,000 | | Tronox Finance PLC(g) | | 5.75% | | 10/01/2025 | | | 18,025 | |
| | | | | | | | | | 437,938 | |
Ireland - 0.81% | | | | | | | | |
| 200,000 | | Ardagh Packaging Finance PLC / Ardagh Holdings USA, Inc.(g) | | 5.25% | | 08/15/2027 | | | 206,110 | |
| 10,000 | | Avolon Holdings Funding, Ltd.(g) | | 5.50% | | 01/15/2023 | | | 8,988 | |
| 100,000 | | Virgin Media Receivables Financing Notes I DAC(h) | | 5.50% | | 09/15/2024 | | | 120,955 | |
| | | | | | | | | | 336,053 | |
Isle Of Man - 0.21% | | | | | | | | |
| 100,000 | | Playtech PLC | | 3.75% | | 10/12/2023 | | | 87,485 | |
See Notes to Financial Statements.
Semi-Annual Report | March 31, 2020 | 67 |
RiverNorth/Oaktree High Income Fund | Schedule of Investments |
March 31, 2020 (Unaudited)
Principal Amount/Description | | Rate | | Maturity | | Value | |
Italy - 1.21% | | | | | | | |
$ | 100,000 | | Bormioli Pharma Bidco SpA(e)(h) | | 3M EUR L + 3.50% | | 11/15/2024 | | $ | 90,438 | |
| 100,000 | | Guala Closures SpA(e)(g) | | 3M EUR L + 3.50% | | 04/15/2024 | | | 98,792 | |
| 100,000 | | LKQ Italia Bondco SpA(h) | | 3.88% | | 04/01/2024 | | | 109,953 | |
| 200,000 | | Telecom Italia SpA(g) | | 5.30% | | 05/30/2024 | | | 202,506 | |
| | | | | | | | | | 501,689 | |
Jersey - 0.47% | | | | | | | | |
| 100,000 | | CPUK Finance, Ltd.(h) | | 4.25% | | 08/28/2022 | | | 101,631 | |
| 100,000 | | LHC3 PLC(d)(g) | | 4.13% (9.00%) | | 08/15/2024 | | | 92,944 | |
| | | | | | | | | | 194,575 | |
Luxembourg - 2.30% | | | | | | | | |
| 100,000 | | Altice Financing SA(g) | | 3.00% | | 01/15/2028 | | | 97,921 | |
| 100,000 | | ARD Finance SA(d)(g) | | 5.00% (5.75%) | | 06/30/2027 | | | 86,001 | |
| 100,000 | | Cirsa Finance International Sarl(h) | | 4.75% | | 05/22/2025 | | | 68,279 | |
| 85,000 | | Dana Financing Luxembourg Sarl(g) | | 5.75% | | 04/15/2025 | | | 74,693 | |
| 100,000 | | Lincoln Financing SARL(h) | | 3.63% | | 04/01/2024 | | | 92,021 | |
| 100,000 | | Monitchem HoldCo 3 SA | | 5.25% | | 03/15/2025 | | | 92,412 | |
| 100,000 | | SES SA(c)(e) | | 5.63% | | Perpetual Maturity | | | 103,014 | |
| 100,000 | | Summer BC Holdco B SARL(h) | | 5.75% | | 10/31/2026 | | | 92,750 | |
| 100,000 | | Swissport Financing Sarl(h) | | 9.00% | | 02/15/2025 | | | 54,263 | |
| 100,000 | | Telenet Finance Luxembourg Notes Sarl(h) | | 3.50% | | 03/01/2028 | | | 104,224 | |
| 100,000 | | Ypso Finance Bis SA(g) | | 4.00% | | 02/15/2028 | | | 91,816 | |
| | | | | | | | | | 957,394 | |
Netherlands - 2.40% | | | | | | | | |
| 100,000 | | Intertrust Group BV(h) | | 3.38% | | 11/15/2025 | | | 106,192 | |
| 100,000 | | Sigma Holdco BV(h) | | 5.75% | | 05/15/2026 | | | 101,329 | |
| 100,000 | | Sunshine Mid BV(h) | | 6.50% | | 05/15/2026 | | | 104,224 | |
| 100,000 | | Telefonica Europe BV(c)(e) | | 4.38% | | Perpetual Maturity | | | 107,929 | |
| 100,000 | | Trivium Packaging Finance BV(g) | | 3.75% | | 08/15/2026 | | | 101,186 | |
| 200,000 | | UPC Holding BV(g) | | 5.50% | | 01/15/2028 | | | 189,110 | |
| 45,000 | | Ziggo Bond Co. BV(g) | | 5.13% | | 02/28/2030 | | | 44,353 | |
| 245,000 | | Ziggo Bond Co. BV(g) | | 3.38% | | 02/28/2030 | | | 243,450 | |
| | | | | | | | | | 997,773 | |
Sweden - 0.42% | | | | | | | | |
| 100,000 | | Intrum AB(h) | | 3.00% | | 09/15/2027 | | | 79,089 | |
| 100,000 | | Verisure Midholding AB(h) | | 5.75% | | 12/01/2023 | | | 97,065 | |
| | | | | | | | | | 176,154 | |
United States - 35.50% | | | | | | | | |
| 65,000 | | Acadia Healthcare Co., Inc. | | 5.13% | | 07/01/2022 | | | 62,502 | |
| 55,000 | | Acadia Healthcare Co., Inc. | | 6.50% | | 03/01/2024 | | | 53,969 | |
| 50,000 | | ACCO Brands Corp.(g) | | 5.25% | | 12/15/2024 | | | 48,437 | |
See Notes to Financial Statements.
68 | (888) 848-7569 | www.rivernorth.com |
RiverNorth/Oaktree High Income Fund | Schedule of Investments |
March 31, 2020 (Unaudited)
Principal Amount/Description | | Rate | | Maturity | | Value | |
$ | 20,000 | | Acrisure LLC / Acrisure Finance, Inc.(g) | | 8.13% | | 02/15/2024 | | $ | 19,593 | |
| 75,000 | | Acrisure LLC / Acrisure Finance, Inc.(g) | | 10.13% | | 08/01/2026 | | | 70,284 | |
| 60,000 | | Adient US LLC(g) | | 7.00% | | 05/15/2026 | | | 55,837 | |
| 80,000 | | AES Corp. | | 6.00% | | 05/15/2026 | | | 79,244 | |
| 105,000 | | Albertsons Cos. Inc / Safeway, Inc. / New Albertsons LP / Albertsons LLC(g) | | 4.63% | | 01/15/2027 | | | 105,058 | |
| 45,000 | | Albertsons Cos. Inc / Safeway, Inc. / New Albertsons LP / Albertsons LLC(g) | | 5.88% | | 02/15/2028 | | | 46,051 | |
| 55,000 | | Albertsons Cos. Inc / Safeway, Inc. / New Albertsons LP / Albertsons LLC(g) | | 4.88% | | 02/15/2030 | | | 54,862 | |
| 105,000 | | Allied Universal Holdco LLC / Allied Universal Finance Corp.(g) | | 6.63% | | 07/15/2026 | | | 103,360 | |
| 15,000 | | Allied Universal Holdco LLC / Allied Universal Finance Corp.(g) | | 9.75% | | 07/15/2027 | | | 14,240 | |
| 85,000 | | AmeriGas Partners LP / AmeriGas Finance Corp. | | 5.63% | | 05/20/2024 | | | 79,791 | |
| 65,000 | | Amsted Industries, Inc.(g) | | 4.63% | | 05/15/2030 | | | 58,500 | |
| 30,000 | | Apergy Corp. | | 6.38% | | 05/01/2026 | | | 23,356 | |
| 65,000 | | APX Group, Inc.(g) | | 6.75% | | 02/15/2027 | | | 54,316 | |
| 30,000 | | Aramark Services, Inc.(g) | | 5.00% | | 02/01/2028 | | | 28,085 | |
| 40,000 | | Archrock Partners LP / Archrock Partners Finance Corp.(g) | | 6.88% | | 04/01/2027 | | | 28,683 | |
| 20,000 | | Archrock Partners LP / Archrock Partners Finance Corp.(g) | | 6.25% | | 04/01/2028 | | | 13,950 | |
| 100,000 | | Arconic Corp.(g) | | 6.13% | | 02/15/2028 | | | 103,000 | |
| 11,000 | | Asbury Automotive Group, Inc.(g) | | 4.50% | | 03/01/2028 | | | 9,432 | |
| 13,000 | | Asbury Automotive Group, Inc.(g) | | 4.75% | | 03/01/2030 | | | 11,148 | |
| 30,000 | | Ascent Resources Utica Holdings LLC / ARU Finance Corp.(g) | | 7.00% | | 11/01/2026 | | | 8,881 | |
| 55,000 | | ASGN, Inc.(g) | | 4.63% | | 05/15/2028 | | | 51,868 | |
| 30,000 | | Avis Budget Car Rental LLC / Avis Budget Finance, Inc. | | 5.50% | | 04/01/2023 | | | 25,762 | |
| 100,000 | | Axalta Coating Systems LLC(h) | | 4.25% | | 08/15/2024 | | | 100,763 | |
| 70,000 | | B&G Foods, Inc. | | 5.25% | | 04/01/2025 | | | 68,734 | |
| 197,000 | | Bausch Health Cos., Inc.(g) | | 6.13% | | 04/15/2025 | | | 195,277 | |
| 55,000 | | Bausch Health Cos., Inc.(g) | | 7.00% | | 01/15/2028 | | | 57,340 | |
| 195,000 | | Bausch Health Cos., Inc.(g) | | 5.00% | | 01/30/2028 | | | 186,069 | |
| 40,000 | | Bausch Health Cos., Inc.(g) | | 5.25% | | 01/30/2030 | | | 37,700 | |
| 85,000 | | Berry Global, Inc.(g) | | 4.50% | | 02/15/2026 | | | 83,236 | |
| 30,000 | | Berry Petroleum Co. LLC(g) | | 7.00% | | 02/15/2026 | | | 12,256 | |
| 35,000 | | Block Communications, Inc.(g) | | 4.88% | | 03/01/2028 | | | 32,747 | |
| 20,000 | | BMC East LLC(g) | | 5.50% | | 10/01/2024 | | | 19,475 | |
See Notes to Financial Statements.
Semi-Annual Report | March 31, 2020 | 69 |
RiverNorth/Oaktree High Income Fund | Schedule of Investments |
March 31, 2020 (Unaudited)
Principal Amount/Description | | Rate | | Maturity | | Value | |
$ | 65,000 | | Boyd Gaming Corp. | | 6.38% | | 04/01/2026 | | $ | 56,586 | |
| 10,000 | | Boyd Gaming Corp. | | 6.00% | | 08/15/2026 | | | 8,685 | |
| 65,000 | | Boyd Gaming Corp.(g) | | 4.75% | | 12/01/2027 | | | 53,986 | |
| 35,000 | | Buckeye Partners LP(g) | | 4.13% | | 03/01/2025 | | | 29,767 | |
| 45,000 | | Buckeye Partners LP(g) | | 4.50% | | 03/01/2028 | | | 37,238 | |
| 5,000 | | Callon Petroleum Co. | | 6.13% | | 10/01/2024 | | | 925 | |
| 45,000 | | Callon Petroleum Co. | | 6.38% | | 07/01/2026 | | | 7,584 | |
| 80,000 | | Calpine Corp.(g) | | 4.50% | | 02/15/2028 | | | 77,840 | |
| 45,000 | | Calpine Corp.(g) | | 5.13% | | 03/15/2028 | | | 41,737 | |
| 90,000 | | Cardtronics, Inc. / Cardtronics USA, Inc.(g) | | 5.50% | | 05/01/2025 | | | 86,287 | |
| 55,000 | | Carriage Services, Inc.(g) | | 6.63% | | 06/01/2026 | | | 54,507 | |
| 100,000 | | Catalent Pharma Solutions, Inc.(g) | | 2.38% | | 03/01/2028 | | | 102,522 | |
| 30,000 | | CCO Holdings LLC / CCO Holdings Capital Corp.(g) | | 5.88% | | 04/01/2024 | | | 30,863 | |
| 100,000 | | CCO Holdings LLC / CCO Holdings Capital Corp.(g) | | 5.50% | | 05/01/2026 | | | 101,957 | |
| 25,000 | | CCO Holdings LLC / CCO Holdings Capital Corp.(g) | | 5.00% | | 02/01/2028 | | | 25,239 | |
| 15,000 | | CCO Holdings LLC / CCO Holdings Capital Corp.(g) | | 5.38% | | 06/01/2029 | | | 15,497 | |
| 125,000 | | CCO Holdings LLC / CCO Holdings Capital Corp.(g) | | 4.75% | | 03/01/2030 | | | 125,381 | |
| 130,000 | | Cedar Fair LP(g) | | 5.25% | | 07/15/2029 | | | 110,571 | |
| 25,000 | | Centene Corp.(g) | | 5.38% | | 06/01/2026 | | | 25,891 | |
| 65,000 | | Central Garden & Pet Co. | | 5.13% | | 02/01/2028 | | | 60,680 | |
| 165,000 | | CenturyLink, Inc.(g) | | 5.13% | | 12/15/2026 | | | 165,413 | |
| 25,000 | | CF Industries, Inc. | | 5.15% | | 03/15/2034 | | | 25,520 | |
| 40,000 | | Change Healthcare Holdings LLC / Change Healthcare Finance, Inc.(g) | | 5.75% | | 03/01/2025 | | | 37,299 | |
| 33,000 | | Chaparral Energy, Inc.(g) | | 8.75% | | 07/15/2023 | | | 2,327 | |
| 30,000 | | Cheniere Energy Partners LP | | 5.25% | | 10/01/2025 | | | 28,124 | |
| 35,000 | | Cheniere Energy Partners LP(g) | | 4.50% | | 10/01/2029 | | | 31,344 | |
| 65,000 | | Churchill Downs, Inc.(g) | | 5.50% | | 04/01/2027 | | | 61,623 | |
| 10,000 | | Citgo Holding, Inc.(g) | | 9.25% | | 08/01/2024 | | | 8,225 | |
| 150,000 | | CITGO Petroleum Corp.(g) | | 6.25% | | 08/15/2022 | | | 139,878 | |
| 30,000 | | Clean Harbors, Inc.(g) | | 5.13% | | 07/15/2029 | | | 28,156 | |
| 35,000 | | Clearway Energy Operating LLC | | 5.00% | | 09/15/2026 | | | 34,161 | |
| 100,000 | | Clearway Energy Operating LLC(g) | | 4.75% | | 03/15/2028 | | | 93,125 | |
| 50,000 | | Cleveland-Cliffs, Inc.(g) | | 6.75% | | 03/15/2026 | | | 44,469 | |
| 40,000 | | CommScope Technologies LLC(g) | | 6.00% | | 06/15/2025 | | | 36,908 | |
| 135,000 | | CommScope Technologies LLC(g) | | 5.00% | | 03/15/2027 | | | 118,135 | |
| 70,000 | | CommScope, Inc.(g) | | 5.50% | | 03/01/2024 | | | 71,278 | |
| 40,000 | | CommScope, Inc.(g) | | 5.50% | | 06/15/2024 | | | 37,239 | |
| 30,000 | | CommScope, Inc.(g) | | 6.00% | | 03/01/2026 | | | 30,123 | |
See Notes to Financial Statements.
70 | (888) 848-7569 | www.rivernorth.com |
RiverNorth/Oaktree High Income Fund | Schedule of Investments |
March 31, 2020 (Unaudited)
Principal Amount/Description | | Rate | | Maturity | | Value | |
$ | 50,000 | | Comstock Resources, Inc. | | 9.75% | | 08/15/2026 | | $ | 35,856 | |
| 130,000 | | Covanta Holding Corp. | | 6.00% | | 01/01/2027 | | | 109,389 | |
| 95,000 | | CrownRock LP / CrownRock Finance, Inc.(g) | | 5.63% | | 10/15/2025 | | | 50,110 | |
| 115,000 | | CSC Holdings LLC(g) | | 5.75% | | 01/15/2030 | | | 116,404 | |
| 20,000 | | CVR Energy, Inc.(g) | | 5.75% | | 02/15/2028 | | | 15,100 | |
| 20,000 | | Dana, Inc. | | 5.38% | | 11/15/2027 | | | 16,350 | |
| 85,000 | | DaVita, Inc. | | 5.13% | | 07/15/2024 | | | 85,277 | |
| 100,000 | | Diamond BC BV(h) | | 5.63% | | 08/15/2025 | | | 67,939 | |
| 25,000 | | Diamond Sports Group LLC / Diamond Sports Finance Co.(g) | | 6.63% | | 08/15/2027 | | | 16,858 | |
| 35,000 | | DISH DBS Corp. | | 7.75% | | 07/01/2026 | | | 36,157 | |
| 105,000 | | Eldorado Resorts, Inc. | | 6.00% | | 04/01/2025 | | | 95,157 | |
| 90,000 | | Encompass Health Corp. | | 4.50% | | 02/01/2028 | | | 88,767 | |
| 100,000 | | Energizer Gamma Acquisition BV(h) | | 4.63% | | 07/15/2026 | | | 100,446 | |
| 85,000 | | EnerSys(g) | | 4.38% | | 12/15/2027 | | | 80,538 | |
| 100,000 | | ESH Hospitality, Inc.(g) | | 5.25% | | 05/01/2025 | | | 84,626 | |
| 55,000 | | ESH Hospitality, Inc.(g) | | 4.63% | | 10/01/2027 | | | 43,205 | |
| 50,000 | | Extraction Oil & Gas, Inc.(g) | | 7.38% | | 05/15/2024 | | | 9,312 | |
| 20,000 | | Ford Motor Credit Co. LLC | | 3.34% | | 03/18/2021 | | | 19,200 | |
| 25,000 | | Ford Motor Credit Co. LLC | | 5.60% | | 01/07/2022 | | | 24,313 | |
| 30,000 | | Ford Motor Credit Co. LLC | | 3.34% | | 03/28/2022 | | | 28,059 | |
| 50,000 | | Ford Motor Credit Co. LLC | | 4.25% | | 09/20/2022 | | | 47,110 | |
| 135,000 | | Frontier Communications Corp.(g) | | 8.00% | | 04/01/2027 | | | 133,897 | |
| 35,000 | | Go Daddy Operating Co. LLC / GD Finance Co, Inc.(g) | | 5.25% | | 12/01/2027 | | | 35,516 | |
| 115,000 | | Golden Nugget, Inc.(g) | | 6.75% | | 10/15/2024 | | | 73,296 | |
| 100,000 | | Greystar Real Estate Partners LLC(g) | | 5.75% | | 12/01/2025 | | | 91,253 | |
| 55,000 | | Grinding Media, Inc. / Moly-Cop AltaSteel, Ltd.(g) | | 7.38% | | 12/15/2023 | | | 51,715 | |
| 45,000 | | Gulfport Energy Corp. | | 6.63% | | 05/01/2023 | | | 12,979 | |
| 95,000 | | H&E Equipment Services, Inc. | | 5.63% | | 09/01/2025 | | | 88,707 | |
| 125,000 | | Herc Holdings, Inc.(g) | | 5.50% | | 07/15/2027 | | | 117,197 | |
| 75,000 | | Hess Midstream Operations LP(g) | | 5.63% | | 02/15/2026 | | | 53,478 | |
| 55,000 | | Hess Midstream Operations LP(g) | | 5.13% | | 06/15/2028 | | | 38,860 | |
| 60,000 | | HUB International, Ltd.(g) | | 7.00% | | 05/01/2026 | | | 59,855 | |
| 105,000 | | Hunt Cos., Inc.(g) | | 6.25% | | 02/15/2026 | | | 79,219 | |
| 40,000 | | IAA, Inc.(g) | | 5.50% | | 06/15/2027 | | | 38,922 | |
| 110,000 | | iHeartCommunications, Inc. | | 8.38% | | 05/01/2027 | | | 94,264 | |
| 110,000 | | iHeartCommunications, Inc.(g) | | 5.25% | | 08/15/2027 | | | 96,465 | |
| 35,000 | | Ingles Markets, Inc. | | 5.75% | | 06/15/2023 | | | 35,086 | |
| 185,000 | | Intelsat Jackson Holdings SA(g) | | 8.00% | | 02/15/2024 | | | 179,912 | |
| 100,000 | | International Game Technology PLC(h) | | 2.38% | | 04/15/2028 | | | 82,718 | |
| 55,000 | | Iron Mountain, Inc.(g) | | 5.25% | | 03/15/2028 | | | 54,634 | |
See Notes to Financial Statements.
Semi-Annual Report | March 31, 2020 | 71 |
RiverNorth/Oaktree High Income Fund | Schedule of Investments |
March 31, 2020 (Unaudited)
Principal Amount/Description | Rate | | Maturity | | Value | |
$ | 105,000 | | Iron Mountain, Inc.(g) | | 4.88% | | 09/15/2029 | | $ | 99,367 | |
| 30,000 | | Itron, Inc.(g) | | 5.00% | | 01/15/2026 | | | 28,756 | |
| 80,000 | | Jaguar Holding Co. II / Pharmaceutical Product Development LLC(g) | | 6.38% | | 08/01/2023 | | | 81,998 | |
| 25,000 | | JBS USA LUX SA / JBS USA Finance, Inc.(g) | | 6.50% | | 04/15/2029 | | | 26,956 | |
| 55,000 | | JBS USA LUX SA / JBS USA Food Co. / JBS USA Finance, Inc.(g) | | 5.50% | | 01/15/2030 | | | 57,093 | |
| 90,000 | | KAR Auction Services, Inc.(g) | | 5.13% | | 06/01/2025 | | | 86,513 | |
| 45,000 | | Kennedy-Wilson, Inc. | | 5.88% | | 04/01/2024 | | | 40,598 | |
| 20,000 | | Korn Ferry(g) | | 4.63% | | 12/15/2027 | | | 17,525 | |
| 90,000 | | Kraft Heinz Foods Co. | | 6.88% | | 01/26/2039 | | | 103,578 | |
| 125,000 | | Kraft Heinz Foods Co. | | 6.50% | | 02/09/2040 | | | 137,260 | |
| 95,000 | | Kraton Polymers, LLC / Kraton Polymers Capital Corp.(g) | | 7.00% | | 04/15/2025 | | | 84,876 | |
| 105,000 | | L Brands, Inc. | | 7.50% | | 06/15/2029 | | | 83,417 | |
| 25,000 | | L Brands, Inc. | | 6.95% | | 03/01/2033 | | | 15,214 | |
| 75,000 | | Lamar Media Corp. | | 5.75% | | 02/01/2026 | | | 77,156 | |
| 20,000 | | Lamar Media Corp.(g) | | 4.00% | | 02/15/2030 | | | 18,750 | |
| 125,000 | | Laredo Petroleum, Inc. | | 9.50% | | 01/15/2025 | | | 50,469 | |
| 4,000 | | Level 3 Financing, Inc. | | 5.38% | | 08/15/2022 | | | 4,023 | |
| 75,000 | | Level 3 Financing, Inc. | | 5.25% | | 03/15/2026 | | | 75,370 | |
| 65,000 | | Level 3 Financing, Inc.(g) | | 4.63% | | 09/15/2027 | | | 64,964 | |
| 65,000 | | Live Nation Entertainment, Inc.(g) | | 4.75% | | 10/15/2027 | | | 58,536 | |
| 60,000 | | Masonite International Corp.(g) | | 5.38% | | 02/01/2028 | | | 59,301 | |
| 140,000 | | Mauser Packaging Solutions Holding Co.(g) | | 5.50% | | 04/15/2024 | | | 129,846 | |
| 5,000 | | MEDNAX, Inc.(g) | | 5.25% | | 12/01/2023 | | | 4,106 | |
| 80,000 | | MEDNAX, Inc.(g) | | 6.25% | | 01/15/2027 | | | 64,806 | |
| 75,000 | | Mercer International, Inc. | | 7.38% | | 01/15/2025 | | | 63,094 | |
| 60,000 | | Mercer International, Inc. | | 5.50% | | 01/15/2026 | | | 46,046 | |
| 63,000 | | MGM Resorts International | | 5.50% | | 04/15/2027 | | | 57,680 | |
| 70,000 | | MPH Acquisition Holdings LLC(g) | | 7.13% | | 06/01/2024 | | | 61,427 | |
| 30,000 | | MPT Operating Partnership LP / MPT Finance Corp. | | 5.50% | | 05/01/2024 | | | 29,288 | |
| 80,000 | | MTS Systems Corp.(g) | | 5.75% | | 08/15/2027 | | | 74,883 | |
| 45,000 | | Murphy Oil Corp. | | 5.88% | | 12/01/2027 | | | 23,695 | |
| 30,000 | | Nabors Industries, Ltd.(g) | | 7.25% | | 01/15/2026 | | | 10,425 | |
| 30,000 | | Nabors Industries, Ltd.(g) | | 7.50% | | 01/15/2028 | | | 9,825 | |
| 135,000 | | Nationstar Mortgage Holdings, Inc.(g) | | 6.00% | | 01/15/2027 | | | 115,509 | |
| 70,000 | | NCR Corp. | | 6.38% | | 12/15/2023 | | | 69,562 | |
| 50,000 | | NCR Corp.(g) | | 5.75% | | 09/01/2027 | | | 45,849 | |
| 80,000 | | NCR Corp.(g) | | 6.13% | | 09/01/2029 | | | 75,156 | |
| 55,000 | | New Enterprise Stone & Lime Co., Inc.(g) | | 6.25% | | 03/15/2026 | | | 51,070 | |
See Notes to Financial Statements.
72 | (888) 848-7569 | www.rivernorth.com |
RiverNorth/Oaktree High Income Fund | Schedule of Investments |
March 31, 2020 (Unaudited)
Principal Amount/Description | | Rate | | Maturity | | Value | |
$ | 130,000 | | Nexstar Broadcasting, Inc.(g) | | 5.63% | | 07/15/2027 | | $ | 127,797 | |
| 165,000 | | Nielsen Finance LLC / Nielsen Finance Co.(g) | | 5.00% | | 04/15/2022 | | | 152,981 | |
| 35,000 | | Northern Oil and Gas, Inc.(d) | | 8.50% (9.50%) | | 05/15/2023 | | | 24,063 | |
| 40,000 | | Novelis Corp.(g) | | 5.88% | | 09/30/2026 | | | 39,533 | |
| 45,000 | | Oasis Petroleum, Inc. | | 6.88% | | 01/15/2023 | | | 9,563 | |
| 40,000 | | Oceaneering International, Inc. | | 6.00% | | 02/01/2028 | | | 15,658 | |
| 20,000 | | Olin Corp. | | 5.63% | | 08/01/2029 | | | 18,516 | |
| 105,000 | | Olin Corp. | | 5.00% | | 02/01/2030 | | | 90,767 | |
| 105,000 | | Open Text Holdings, Inc.(g) | | 4.13% | | 02/15/2030 | | | 99,317 | |
| 50,000 | | Ortho-Clinical Diagnostics, Inc. / Ortho- Clinical Diagnostics SA(g) | | 7.25% | | 02/01/2028 | | | 43,370 | |
| 40,000 | | Outfront Media Capital LLC / Outfront Media Capital Corp. | | 5.63% | | 02/15/2024 | | | 39,850 | |
| 20,000 | | Outfront Media Capital LLC / Outfront Media Capital Corp.(g) | | 5.00% | | 08/15/2027 | | | 18,511 | |
| 20,000 | | Outfront Media Capital LLC / Outfront Media Capital Corp.(g) | | 4.63% | | 03/15/2030 | | | 17,911 | |
| 55,000 | | Par Pharmaceutical, Inc.(g) | | 7.50% | | 04/01/2027 | | | 55,142 | |
| 30,000 | | PDC Energy, Inc. | | 6.13% | | 09/15/2024 | | | 16,275 | |
| 40,000 | | PDC Energy, Inc. | | 5.75% | | 05/15/2026 | | | 22,669 | |
| 40,000 | | Performance Food Group, Inc.(g) | | 5.50% | | 06/01/2024 | | | 37,550 | |
| 55,000 | | Performance Food Group, Inc.(g) | | 5.50% | | 10/15/2027 | | | 51,429 | |
| 55,000 | | Pilgrim’s Pride Corp.(g) | | 5.75% | | 03/15/2025 | | | 55,619 | |
| 100,000 | | Plantronics, Inc.(g) | | 5.50% | | 05/31/2023 | | | 73,497 | |
| 60,000 | | Platform Specialty Products Corp.(g) | | 5.88% | | 12/01/2025 | | | 59,248 | |
| 10,000 | | Post Holdings, Inc.(g) | | 5.00% | | 08/15/2026 | | | 10,347 | |
| 15,000 | | Post Holdings, Inc.(g) | | 5.75% | | 03/01/2027 | | | 15,475 | |
| 180,000 | | Post Holdings, Inc.(g) | | 4.63% | | 04/15/2030 | | | 173,700 | |
| 85,000 | | PQ Corp.(g) | | 6.75% | | 11/15/2022 | | | 86,064 | |
| 40,000 | | PQ Corp.(g) | | 5.75% | | 12/15/2025 | | | 36,350 | |
| 40,000 | | Prestige Brands, Inc.(g) | | 6.38% | | 03/01/2024 | | | 41,250 | |
| 10,000 | | Prestige Brands, Inc.(g) | | 5.13% | | 01/15/2028 | | | 9,978 | |
| 150,000 | | Prime Security Services Borrower LLC / Prime Finance, Inc.(g) | | 5.75% | | 04/15/2026 | | | 147,843 | |
| 90,000 | | Prime Security Services Borrower LLC / Prime Finance, Inc.(g) | | 6.25% | | 01/15/2028 | | | 78,300 | |
| 100,000 | | Primo Water Corp.(h) | | 5.50% | | 07/01/2024 | | | 109,562 | |
| 55,000 | | PTC, Inc.(g) | | 4.00% | | 02/15/2028 | | | 53,229 | |
| 40,000 | | QEP Resources, Inc. | | 5.38% | | 10/01/2022 | | | 19,137 | |
| 35,000 | | Quicken Loans, Inc.(g) | | 5.75% | | 05/01/2025 | | | 35,044 | |
| 85,000 | | Quicken Loans, Inc.(g) | | 5.25% | | 01/15/2028 | | | 83,705 | |
| 45,000 | | QVC, Inc. | | 4.75% | | 02/15/2027 | | | 40,005 | |
| 100,000 | | Refinitiv US Holdings, Inc.(g) | | 4.50% | | 05/15/2026 | | | 110,185 | |
See Notes to Financial Statements.
Semi-Annual Report | March 31, 2020 | 73 |
RiverNorth/Oaktree High Income Fund | Schedule of Investments |
March 31, 2020 (Unaudited)
Principal Amount/Description | | Rate | | Maturity | | Value | |
$ | 70,000 | | Reynolds Group Issuer, Inc. / Reynolds Group Issuer LLC / Reynolds Group Issuer Lu(g) | | 7.00% | | 07/15/2024 | | $ | 71,531 | |
| 25,000 | | Reynolds Group Issuer, Inc. / Reynolds Group Issuer, LLC(g) | | 5.13% | | 07/15/2023 | | | 24,969 | |
| 25,000 | | Rite Aid Corp.(g) | | 6.13% | | 04/01/2023 | | | 21,688 | |
| 95,000 | | Ryman Hospitality Properties, Inc.(g) | | 4.75% | | 10/15/2027 | | | 71,777 | |
| 120,000 | | Scientific Games International, Inc.(h) | | 3.38% | | 02/15/2026 | | | 103,093 | |
| 55,000 | | Scotts Miracle-Gro Co.(g) | | 4.50% | | 10/15/2029 | | | 52,804 | |
| 35,000 | | Signature Aviation US Holdings, Inc.(g) | | 5.38% | | 05/01/2026 | | | 34,106 | |
| 100,000 | | Silgan Holdings, Inc. | | 3.25% | | 03/15/2025 | | | 108,091 | |
| 30,000 | | Sirius XM Radio, Inc.(g) | | 4.63% | | 07/15/2024 | | | 30,635 | |
| 35,000 | | Sirius XM Radio, Inc.(g) | | 5.38% | | 04/15/2025 | | | 35,569 | |
| 5,000 | | Sirius XM Radio, Inc.(g) | | 5.50% | | 07/01/2029 | | | 5,128 | |
| 25,000 | | Six Flags Entertainment Corp.(g) | | 5.50% | | 04/15/2027 | | | 21,201 | |
| 30,000 | | SM Energy Co. | | 5.00% | | 01/15/2024 | | | 9,112 | |
| 30,000 | | SM Energy Co. | | 5.63% | | 06/01/2025 | | | 8,438 | |
| 50,000 | | Sonic Automotive, Inc. | | 6.13% | | 03/15/2027 | | | 44,427 | |
| 10,000 | | Southwestern Energy Co. | | 6.20% | | 01/23/2025 | | | 6,884 | |
| 20,000 | | Southwestern Energy Co. | | 7.75% | | 10/01/2027 | | | 13,302 | |
| 100,000 | | Spectrum Brands, Inc.(g) | | 5.00% | | 10/01/2029 | | | 85,854 | |
| 75,000 | | Sprint Communications, Inc. | | 11.50% | | 11/15/2021 | | | 83,097 | |
| 100,000 | | Sprint Communications, Inc. | | 6.00% | | 11/15/2022 | | | 104,594 | |
| 80,000 | | Sprint Corp. | | 7.88% | | 09/15/2023 | | | 88,691 | |
| 50,000 | | Sprint Corp. | | 7.13% | | 06/15/2024 | | | 55,249 | |
| 75,000 | | Sprint Corp.(g) | | 7.25% | | 02/01/2028 | | | 75,656 | |
| 140,000 | | SS&C Technologies, Inc.(g) | | 5.50% | | 09/30/2027 | | | 145,163 | |
| 20,000 | | Standard Industries, Inc.(g) | | 5.50% | | 02/15/2023 | | | 19,449 | |
| 110,000 | | Station Casinos LLC(g) | | 4.50% | | 02/15/2028 | | | 89,925 | |
| 40,000 | | Stevens Holding Co., Inc.(g) | | 6.13% | | 10/01/2026 | | | 39,858 | |
| 110,000 | | Suburban Propane Partners LP/Suburban Energy Finance Corp. | | 5.75% | | 03/01/2025 | | | 102,712 | |
| 40,000 | | Suburban Propane Partners LP/Suburban Energy Finance Corp. | | 5.88% | | 03/01/2027 | | | 37,192 | |
| 65,000 | | Summit Materials LLC / Summit Materials Finance Corp. | | 6.13% | | 07/15/2023 | | | 64,594 | |
| 30,000 | | Summit Materials LLC / Summit Materials Finance Corp.(g) | | 5.13% | | 06/01/2025 | | | 28,162 | |
| 60,000 | | SunCoke Energy Partners LP / SunCoke Energy Partners Finance Corp.(g) | | 7.50% | | 06/15/2025 | | | 43,648 | |
| 50,000 | | Tallgrass Energy Partners LP / Tallgrass Energy Finance Corp.(g) | | 6.00% | | 03/01/2027 | | | 26,875 | |
| 35,000 | | Targa Resources Partners LP / Targa Resources Partners Finance Corp. | | 5.88% | | 04/15/2026 | | | 29,334 | |
See Notes to Financial Statements.
74 | (888) 848-7569 | www.rivernorth.com |
RiverNorth/Oaktree High Income Fund | Schedule of Investments |
March 31, 2020 (Unaudited)
Principal Amount/Description | | Rate | | Maturity | | Value | |
$ | 100,000 | | Targa Resources Partners LP / Targa Resources Partners Finance Corp. | | 5.38% | | 02/01/2027 | | $ | 82,855 | |
| 20,000 | | Targa Resources Partners LP / Targa Resources Partners Finance Corp. | | 5.00% | | 01/15/2028 | | | 16,261 | |
| 100,000 | | Targa Resources Partners LP / Targa Resources Partners Finance Corp.(g) | | 5.50% | | 03/01/2030 | | | 78,125 | |
| 70,000 | | Tenet Healthcare Corp. | | 6.75% | | 06/15/2023 | | | 65,013 | |
| 135,000 | | Tenet Healthcare Corp. | | 5.13% | | 05/01/2025 | | | 128,588 | |
| 140,000 | | Tenet Healthcare Corp.(g) | | 6.25% | | 02/01/2027 | | | 137,025 | |
| 15,000 | | Tenet Healthcare Corp.(g) | | 5.13% | | 11/01/2027 | | | 14,381 | |
| 75,000 | | Tennant Co. | | 5.63% | | 05/01/2025 | | | 72,843 | |
| 50,000 | | Tenneco, Inc. | | 5.38% | | 12/15/2024 | | | 28,437 | |
| 35,000 | | T-Mobile USA, Inc. | | 6.00% | | 04/15/2024 | | | 35,786 | |
| 55,000 | | Tms International Holding Corp.(g) | | 7.25% | | 08/15/2025 | | | 49,981 | |
| 90,000 | | TPC Group, Inc.(g) | | 10.50% | | 08/01/2024 | | | 74,273 | |
| 20,000 | | TransDigm, Inc. | | 6.50% | | 07/15/2024 | | | 19,168 | |
| 35,000 | | TransDigm, Inc. | | 6.50% | | 05/15/2025 | | | 33,469 | |
| 70,000 | | TransDigm, Inc.(g) | | 6.25% | | 03/15/2026 | | | 70,043 | |
| 75,000 | | TransDigm, Inc.(g) | | 5.50% | | 11/15/2027 | | | 67,729 | |
| 1,000 | | TreeHouse Foods, Inc.(g) | | 6.00% | | 02/15/2024 | | | 999 | |
| 40,000 | | TriMas Corp.(g) | | 4.88% | | 10/15/2025 | | | 37,975 | |
| 45,000 | | Tronox, Inc.(g) | | 6.50% | | 04/15/2026 | | | 40,841 | |
| 100,000 | | UGI International LLC(g) | | 3.25% | | 11/01/2025 | | | 106,981 | |
| 10,214 | | Ultra Resources, Inc.(d) | | 11.00% (11.00%) | | 07/12/2024 | | | 664 | |
| 15,000 | | United Rentals North America, Inc. | | 6.50% | | 12/15/2026 | | | 15,308 | |
| 105,000 | | United Rentals North America, Inc. | | 4.88% | | 01/15/2028 | | | 102,433 | |
| 65,000 | | Univar Solutions USA, Inc./Washington(g) | | 5.13% | | 12/01/2027 | | | 59,511 | |
| 105,000 | | Univision Communications, Inc.(g) | | 5.13% | | 05/15/2023 | | | 93,713 | |
| 63,000 | | USA Compression Partners LP / USA Compression Finance Corp. | | 6.88% | | 04/01/2026 | | | 39,729 | |
| 30,000 | | USA Compression Partners LP / USA Compression Finance Corp. | | 6.88% | | 09/01/2027 | | | 18,767 | |
| 85,000 | | ViaSat, Inc.(g) | | 5.63% | | 09/15/2025 | | | 79,998 | |
| 20,000 | | VICI Properties LP / VICI Note Co., Inc.(g) | | 4.25% | | 12/01/2026 | | | 18,460 | |
| 20,000 | | VICI Properties LP / VICI Note Co., Inc.(g) | | 4.63% | | 12/01/2029 | | | 18,311 | |
| 60,000 | | VICI Properties LP / VICI Note Co., Inc.(g) | | 4.13% | | 08/15/2030 | | | 57,188 | |
| 105,000 | | Watco Cos. LLC / Watco Finance Corp.(g) | | 6.38% | | 04/01/2023 | | | 103,293 | |
| 30,000 | | Weatherford International, Ltd.(g) | | 11.00% | | 12/01/2024 | | | 18,315 | |
| 35,000 | | William Carter Co.(g) | | 5.63% | | 03/15/2027 | | | 33,794 | |
| 108,000 | | WMG Acquisition Corp.(g) | | 4.13% | | 11/01/2024 | | | 119,979 | |
See Notes to Financial Statements.
Semi-Annual Report | March 31, 2020 | 75 |
| RiverNorth/Oaktree High Income Fund | Schedule of Investments |
March 31, 2020 (Unaudited)
| Principal Amount/Description | | Rate | | Maturity | | | Value | |
| $ | 90,000 | | Wynn Resorts Finance LLC / Wynn Resorts Capital Corp.(g) | | 5.13% | | | 10/01/2029 | | | $ | 82,406 | |
| | | | | | | | | | | | | 14,767,919 | |
| | | | | | | | | | | | | | |
| TOTAL HIGH YIELD DEBT | | | | | | | | | |
| (Cost $23,127,902) | | | | | | | | 20,280,140 | |
| Shares/Description | | | | | Value | |
| RIGHTS - 0.00%(b)(i) | | | |
| 198 | | | DBI Investors, Inc., Strike Price 0.01, Expires 12/31/2049(a) | | | 198 | |
| | | | | | | | |
| TOTAL RIGHTS | | | | |
| (Cost $11,231) | | | 198 | |
| | | | | | | | |
| WARRANTS - 0.00%(b)(i) | | | | |
| 394 | | | David's Bridal, Strike Price 219.47, Expires 01/18/2024(a) | | | – | |
| 210 | | | Ultra Petroleum Corp, Strike Price 0.01, Expires 07/14/2025 | | | 2 | |
| | | | | | | | |
| TOTAL WARRANTS | | | | |
| (Cost $650) | | | 2 | |
| | | | | | | | |
| SHORT-TERM INVESTMENTS -2.69% | | | | |
| 1,119,238 | | | State Street Institutional Trust (7 Day Yield 0.61%) | | | 1,119,238 | |
| | | | | | | | |
| TOTAL SHORT-TERM INVESTMENTS | | | | |
| (Cost $1,119,238) | | | 1,119,238 | |
| | | | | | | | |
| TOTAL INVESTMENTS - 100.98% | | | 42,010,381 | |
| (Cost $49,050,858) | | | | |
| CASH SEGREGATED AT CUSTODIAN FOR FORWARD FOREIGN CURRENCY CONTRACTS - 0.12% | | | 50,000 | |
| LIABILITIES IN EXCESS OF OTHER ASSETS - (1.10)% | | | (457,903 | ) |
| NET ASSETS - 100.00% | | $ | 41,602,478 | |
Investment Abbreviations:
EURIBOR - Euro Interbank Offered Rate
LIBOR - London Interbank Offered Rate
Libor Rates:
1W US L - 1 Week LIBOR as of March 31, 2020 was 0.49%
1M US L - 1 Month LIBOR as of March 31, 2020 was 0.99%
2M US L - 2 Month LIBOR as of March 31, 2020 was 1.26%
3M US L - 3 Month LIBOR as of March 31, 2020 was 1.45%
See Notes to Financial Statements.
| 76 | (888) 848-7569 | www.rivernorth.com |
| RiverNorth/Oaktree High Income Fund | Schedule of Investments |
March 31, 2020 (Unaudited)
6M US L - 6 Month LIBOR as of March 31, 2020 was 1.18%
1M EUR L - 1 Month EURIBOR as of March 31, 2020 was -0.39%
3M EUR L - 3 Month EURIBOR as of March 31, 2020 was -0.25%
6M EUR L - 6 Month EURIBOR as of March 31, 2020 was -0.20%
| (a) | The Level 3 assets were a result of unavailable quoted prices from an active market or the unavailability of other significant observable inputs. |
| (b) | Non-income producing security. |
| (c) | Security has no contractual maturity date, is not redeemable and contractually pays an indefinite stream of interest. |
| (d) | Pay-in-kind securities - Rate paid in-kind is shown in parenthesis. |
| (e) | Variable rate investment. Interest rates reset periodically. Interest rate shown reflects the rate in effect at March 31, 2020. For securities based on a published reference rate and spread, the reference rate and spread are indicated in the description above. Certain variable rate securities are not based on a published reference rate and spread but are determined by the issuer or agent and are based on current market conditions. These securities do not indicate a reference rate and spread in their description above. |
| (f) | All or a portion of this position has not settled as of March 31, 2020. The interest rate shown represents the stated spread over the London Interbank Offered Rate (“LIBOR” or “L”) or the Euro Interbank Offered Rate (“EURIBOR” or “E”) or the applicable LIBOR/EURIBOR floor; the Fund will not accrue interest until the settlement date, at which point LIBOR/EURIBOR will be established. |
| (g) | Security exempt from registration under Rule 144A of the Securities Act of 1933. These securities have been deemed liquid under procedures approved by the Fund's Board of Trustees and may normally be sold to qualified institutional buyers in transactions exempt from registration. Total fair value of Rule 144A securities amounts to $12,960,467, which represents approximately 31.15% of net assets as of March 31, 2020. |
| (h) | Securities were purchased pursuant to Regulation S under the Securities Act of 1933, which exempts securities offered and sold outside of the United States from registration. Such securities cannot be sold in the United States without either an effective registration statement filed pursuant to the Securities Act of 1933, or pursuant to an exemption from registration. These securities have been deemed liquid under procedures approved by the Fund's Board of Trustees (The “Board”). As of March 31, 2020, the aggregate fair value of those securities was $2,623,220, representing 6.31% of net assets. |
See Notes to Financial Statements.
| Semi-Annual Report | March 31, 2020 | 77 |
| RiverNorth/Oaktree High Income Fund | Schedule of Investments |
March 31, 2020 (Unaudited)
OUTSTANDING FORWARD FOREIGN CURRENCY CONTRACTS
| Counterparty | | Settlement
Date | | Fund
Receiving | | | U.S. $ Value
at March 31,
2020 | | | Fund
Delivering | | | U.S. $ Value
at March 31,
2020 | | | Unrealized
Appreciation/
(Depreciation) | |
| State Street Boston | | 4/3/2020 | | EUR | | | | 1,445,107 | | | USD | | | | 1,416,741 | | | $ | 28,367 | |
| State Street Boston | | 4/3/2020 | | USD | | | | 2,815,524 | | | EUR | | | | 2,781,658 | | | | 33,866 | |
| State Street Boston | | 4/3/2020 | | USD | | | | 4,702,098 | | | EUR | | | | 4,645,539 | | | | 56,559 | |
| State Street Boston | | 4/3/2020 | | USD | | | | 373,125 | | | EUR | | | | 359,446 | | | | 13,679 | |
| State Street Boston | | 4/3/2020 | | USD | | | | 540,969 | | | GBP | | | | 525,109 | | | | 15,860 | |
| State Street Boston | | 4/3/2020 | | USD | | | | 510,084 | | | GBP | | | | 495,129 | | | | 14,955 | |
| | | | | | | | | | | | | | | | | | | $ | 163,286 | |
| State Street Boston | | 4/3/2020 | | EUR | | | | 83,376 | | | USD | | | | 83,773 | | | $ | (397 | ) |
| State Street Boston | | 4/3/2020 | | EUR | | | | 244,089 | | | USD | | | | 245,252 | | | | (1,163 | ) |
| State Street Boston | | 4/3/2020 | | GBP | | | | 21,750 | | | USD | | | | 21,912 | | | | (162 | ) |
| State Street Boston | | 4/3/2020 | | USD | | | | 24,832 | | | GBP | | | | 26,524 | | | | (1,692 | ) |
| State Street Boston | | 4/3/2020 | | USD | | | | 68,668 | | | EUR | | | | 70,040 | | | | (1,372 | ) |
| State Street Boston | | 4/3/2020 | | USD | | | | 130,817 | | | EUR | | | | 130,860 | | | | (43 | ) |
| State Street Boston | | 4/3/2020 | | USD | | | | 7,968 | | | GBP | | | | 8,155 | | | | (187 | ) |
| State Street Boston | | 4/3/2020 | | USD | | | | 77,652 | | | EUR | | | | 77,678 | | | | (26 | ) |
| State Street Boston | | 4/3/2020 | | USD | | | | 11,072 | | | GBP | | | | 11,331 | | | | (259 | ) |
| State Street Boston | | 4/3/2020 | | USD | | | | 110,349 | | | EUR | | | | 110,447 | | | | (98 | ) |
| | | | | | | | | | | | | | | | | | | $ | (5,399 | ) |
See Notes to Financial Statements.
| 78 | (888) 848-7569 | www.rivernorth.com |
RiverNorth Core Opportunity Fund
| Statement of Assets and Liabilities | March 31, 2020 (Unaudited) |
| | | | |
| ASSETS: | | | |
| Investment in securities: | | | | |
| At cost | | $ | 83,194,217 | |
| At value | | $ | 64,040,362 | |
| Receivable for fund investments sold | | | 2,060,319 | |
| Receivable for fund shares sold | | | 1,280,583 | |
| Dividends receivable | | | 89,438 | |
| Interest receivable | | | 3,802 | |
| Prepaid expenses and other assets | | | 21,151 | |
| Total Assets | | | 67,495,655 | |
| LIABILITIES: | | | | |
| Payable to custodian due to overdraft | | | 1,000 | |
| Facility loan fee payable | | | 2,962 | |
| Payable for fund investments purchased | | | 759,435 | |
| Payable for fund shares redeemed | | | 604,255 | |
| Payable to Adviser | | | 61,569 | |
| Payable for fund accounting and administration fees | | | 8,531 | |
| Payable for shareholder servicing | | | 5,826 | |
| Payable for custodian fees | | | 8,587 | |
| Payable for audit fees | | | 12,568 | |
| Payable to transfer agent | | | 4,145 | |
| Payable to Chief Compliance Officer | | | 299 | |
| Other accrued expenses | | | 1,084 | |
| Total Liabilities | | | 1,470,261 | |
| Net Assets | | $ | 66,025,394 | |
| NET ASSETS CONSIST OF: | | | | |
| Paid-in capital | | $ | 80,304,252 | |
| Total distributable earnings/(accumulated deficit) | | | (14,278,858 | ) |
| Net Assets | | $ | 66,025,394 | |
| PRICING OF SHARES: | | | | |
| Class I Shares | | | | |
| Net Assets | | $ | 38,446,517 | |
| Shares of common stock outstanding (unlimited number of shares, no par value) | | | 6,159,110 | |
| Net Asset Value Per Share, Offering and Redemption Price Per Share | | $ | 6.24 | |
| Class R Shares | | | | |
| Net Assets | | $ | 27,578,877 | |
| Shares of common stock outstanding (unlimited number of shares, no par value) | | | 4,412,893 | |
| Net Asset Value Per Share, Offering and Redemption Price Per Share | | $ | 6.25 | |
See Notes to Financial Statements.
| Semi-Annual Report | March 31, 2020 | 79 |
RiverNorth/DoubleLine Strategic Income Fund
| Statement of Assets and Liabilities | March 31, 2020 (Unaudited) |
| ASSETS: | | | |
| Investment in securities: | | | | |
| At cost | | $ | 1,854,732,668 | |
| At value | | $ | 1,649,542,372 | |
| | | | | |
| Investment in affiliates: | | | | |
| At cost | | | 31,572,406 | |
| At value | | | 26,520,160 | |
| Cash | | | 399 | |
| Receivable for fund investments sold | | | 35,116,856 | |
| Receivable for fund shares sold | | | 10,575,470 | |
| Interest receivable | | | 6,397,348 | |
| Dividends receivable | | | 1,181,180 | |
| Prepaid expenses and other assets | | | 47,053 | |
| Total Assets | | | 1,729,380,838 | |
| LIABILITIES: | | | | |
| Facility loan fee payable | | | 58,133 | |
| Payable for fund investments purchased | | | 15,118,578 | |
| Payable for fund shares redeemed | | | 3,478,222 | |
| Payable to Adviser | | | 1,190,514 | |
| Payable for fund accounting and administration fees | | | 291,829 | |
| Payable for shareholder servicing | | | 30,530 | |
| Payable for custodian fees | | | 41,009 | |
| Payable for audit fees | | | 20,477 | |
| Payable to transfer agent | | | 20,811 | |
| Payable to Chief Compliance Officer | | | 90 | |
| Payable to Trustees | | | 414 | |
| Other accrued expenses | | | 6,355 | |
| Total Liabilities | | | 20,256,962 | |
| Net Assets | | $ | 1,709,123,876 | |
| NET ASSETS CONSIST OF: | | | | |
| Paid-in capital | | $ | 1,978,259,967 | |
| Total distributable earnings/(accumulated deficit) | | | (269,136,091 | ) |
| Net Assets | | $ | 1,709,123,876 | |
| PRICING OF SHARES: | | | | |
| Class I Shares | | | | |
| Net Assets | | $ | 1,583,218,316 | |
| Shares of common stock outstanding (unlimited number of shares, no par value) | | | 167,386,373 | |
| Net Asset Value Per Share, Offering and Redemption Price Per Share | | $ | 9.46 | |
| Class R Shares | | | | |
| Net Assets | | $ | 125,905,560 | |
| Shares of common stock outstanding (unlimited number of shares, no par value) | | | 13,286,974 | |
| Net Asset Value Per Share, Offering and Redemption Price Per Share | | $ | 9.48 | |
See Notes to Financial Statements.
| 80 | (888) 848-7569 | www.rivernorth.com |
RiverNorth/Oaktree High Income Fund
| Statement of Assets and Liabilities | March 31, 2020 (Unaudited) |
| ASSETS: | | | |
| Investment in securities: | | | | |
| At cost | | $ | 49,050,858 | |
| At value | | $ | 42,010,381 | |
| | | | | |
| Foreign currency, at value (Cost 57,093) | | | 56,613 | |
| Receivable for fund investments sold | | | 373,827 | |
| Interest receivable | | | 362,855 | |
| Unrealized appreciation on forward foreign currency contracts | | | 163,286 | |
| Cash segregated at custodian for forward foreign currency contracts | | | 50,000 | |
| Dividends receivable | | | 21,736 | |
| Receivable for fund shares sold | | | 742 | |
| Prepaid expenses and other assets | | | 20,919 | |
| Total Assets | | | 43,060,359 | |
| LIABILITIES: | | | | |
| Payable to custodian due to overdraft | | | 498,740 | |
| Facility loan fee payable | | | 1,427 | |
| Payable for fund investments purchased | | | 855,010 | |
| Payable for fund shares redeemed | | | 6,085 | |
| Unrealized depreciation on forward foreign currency contracts | | | 5,399 | |
| Payable to Adviser | | | 458 | |
| Payable for fund accounting and administration fees | | | 62,342 | |
| Payable for shareholder servicing | | | 1,098 | |
| Payable for custodian fees | | | 8,194 | |
| Payable for audit fees | | | 15,622 | |
| Payable to transfer agent | | | 2,808 | |
| Payable to Chief Compliance Officer | | | 138 | |
| Other accrued expenses | | | 560 | |
| Total Liabilities | | | 1,457,881 | |
| Net Assets | | $ | 41,602,478 | |
| NET ASSETS CONSIST OF: | | | | |
| Paid-in capital | | $ | 53,455,344 | |
| Total distributable earnings/(accumulated deficit) | | | (11,852,866 | ) |
| Net Assets | | $ | 41,602,478 | |
| PRICING OF SHARES: | | | | |
| Class I Shares | | | | |
| Net Assets | | $ | 36,696,646 | |
| Shares of common stock outstanding (unlimited number of shares, no par value) | | | 4,477,257 | |
| Net Asset Value Per Share, Offering and Redemption Price Per Share | | $ | 8.20 | |
| Class R Shares | | | | |
| Net Assets | | $ | 4,905,832 | |
| Shares of common stock outstanding (unlimited number of shares, no par value) | | | 599,149 | |
| Net Asset Value Per Share, Offering and Redemption Price Per Share | | $ | 8.19 | |
See Notes to Financial Statements.
| Semi-Annual Report | March 31, 2020 | 81 |
RiverNorth Core Opportunity Fund
| Statement of Operations | For the Six Months Ended March 31, 2020 (Unaudited) |
| INVESTMENT INCOME: | | | |
| Dividend income | | $ | 2,948,240 | |
| Interest income | | | 13,883 | |
| Other income | | | 24,845 | |
| Total Investment Income | | | 2,986,968 | |
| | | | | |
| EXPENSES: | | | | |
| Investment Adviser fee | | | 500,512 | |
| 12b-1 fees - Class R Shares | | | 45,638 | |
| Accounting and administration fee | | | 23,389 | |
| Transfer agent expenses | | | 22,093 | |
| Registration expenses | | | 19,906 | |
| Chief compliance officer | | | 16,535 | |
| Audit expenses | | | 13,070 | |
| Printing expenses | | | 8,216 | |
| Custodian expenses | | | 7,344 | |
| Facility loan fee | | | 6,212 | |
| Trustee expenses | | | 4,258 | |
| Legal expenses | | | 3,017 | |
| Insurance expenses | | | 1,171 | |
| Miscellaneous expenses | | | 5,124 | |
| Total Expenses | | | 676,485 | |
| Net Investment Income | | | 2,310,483 | |
| | | | | |
| REALIZED AND UNREALIZED GAIN/(LOSS): | | | | |
| Net realized gain/(loss) on: | | | | |
| Investments | | | 5,488,931 | |
| Net realized gain | | | 5,488,931 | |
| Net change in unrealized appreciation/depreciation on: | | | | |
| Investments | | | (24,606,066 | ) |
| Net change in unrealized appreciation/depreciation | | | (24,606,066 | ) |
| Net Realized and Unrealized Loss on Investments | | | (19,117,135 | ) |
| Net Decrease in Net Assets Resulting from Operations | | $ | (16,806,652 | ) |
See Notes to Financial Statements.
| 82 | (888) 848-7569 | www.rivernorth.com |
RiverNorth/DoubleLine Strategic Income Fund
| Statement of Operations | For the Six Months Ended March 31, 2020 (Unaudited) |
| INVESTMENT INCOME: | | | |
| Dividend income | | $ | 20,480,831 | |
| Dividend income from affiliated securities | | | 841,907 | |
| Interest income | | | 33,522,461 | |
| Other income | | | 5,870 | |
| Foreign taxes withheld | | | 1,216 | |
| Total Investment Income | | | 54,852,285 | |
| | | | | |
| EXPENSES: | | | | |
| Investment Adviser fee | | | 7,528,230 | |
| Accounting and administration fee | | | 470,603 | |
| 12b-1 fees - Class R Shares | | | 203,098 | |
| Chief compliance officer | | | 156,743 | |
| Facility loan fee | | | 117,959 | |
| Transfer agent expenses | | | 89,937 | |
| Trustee expenses | | | 85,064 | |
| Printing expenses | | | 68,738 | |
| Legal expenses | | | 57,334 | |
| Registration expenses | | | 43,365 | |
| Custodian expenses | | | 35,467 | |
| Audit expenses | | | 20,979 | |
| Insurance expenses | | | 20,423 | |
| Miscellaneous expenses | | | 56,957 | |
| Total Expenses | | | 8,954,897 | |
| Net Investment Income | | | 45,897,388 | |
| | | | | |
| REALIZED AND UNREALIZED GAIN/(LOSS): | | | | |
| Net realized gain/(loss) on: | | | | |
| Investments | | | 12,619,147 | |
| Net realized gain | | | 12,619,147 | |
| Net change in unrealized appreciation/depreciation on: | | | | |
| Investments | | | (176,778,619 | ) |
| Affiliated Investments | | | (5,284,957 | ) |
| Net change in unrealized appreciation/depreciation | | | (182,063,576 | ) |
| Net Realized and Unrealized Loss on Investments | | | (169,444,429 | ) |
| Net Decrease in Net Assets Resulting from Operations | | $ | (123,547,041 | ) |
See Notes to Financial Statements.
| Semi-Annual Report | March 31, 2020 | 83 |
RiverNorth/Oaktree High Income Fund
| Statement of Operations | For the Six Months Ended March 31, 2020 (Unaudited) |
| INVESTMENT INCOME: | | | |
| Dividend income | | $ | 439,413 | |
| Interest income | | | 901,891 | |
| Other income | | | 7,328 | |
| Foreign taxes withheld | | | (2,542 | ) |
| Total Investment Income | | | 1,346,090 | |
| | | | | |
| EXPENSES: | | | | |
| Investment Adviser fee | | | 250,532 | |
| Accounting and administration fee | | | 54,394 | |
| Legal expenses | | | 26,825 | |
| Registration expenses | | | 18,924 | |
| Transfer agent expenses | | | 16,571 | |
| Audit expenses | | | 16,124 | |
| Chief compliance officer | | | 12,457 | |
| 12b-1 fees - Class R Shares | | | 7,256 | |
| Custodian expenses | | | 7,057 | |
| Printing expenses | | | 4,222 | |
| Facility loan fee | | | 2,935 | |
| Trustee expenses | | | 2,021 | |
| Insurance expenses | | | 518 | |
| Miscellaneous expenses | | | 4,782 | |
| Total expenses | | | 424,618 | |
| Less fees waived/reimbursed by Investment Adviser: | | | | |
| Class I Shares | | | (70,207 | ) |
| Class R Shares | | | (9,303 | ) |
| Net Expenses | | | 345,108 | |
| Net Investment Income | | | 1,000,982 | |
| | | | | |
| REALIZED AND UNREALIZED GAIN/(LOSS): | | | | |
| Net realized gain/(loss) on: | | | | |
| Investments | | | (601,890 | ) |
| Forward Foreign Currency Contracts | | | (41,904 | ) |
| Translation of assets and liabilities denominated in foreign currencies | | | (5,291 | ) |
| Net realized loss | | | (649,085 | ) |
| Net change in unrealized appreciation/depreciation on: | | | | |
| Investments | | | (6,357,439 | ) |
| Forward Foreign Currency Contracts | | | 56,170 | |
| Translation of assets and liabilities denominated in foreign currencies | | | 3,100 | |
| Net change in unrealized appreciation/depreciation | | | (6,298,169 | ) |
| Net Realized and Unrealized Loss on Investments, translation of assets and liabilities denominated in foreign currencies and forward foreign currency contracts | | | (6,947,254 | ) |
| Net Decrease in Net Assets Resulting from Operations | | $ | (5,946,272 | ) |
See Notes to Financial Statements.
| 84 | (888) 848-7569 | www.rivernorth.com |
RiverNorth Core Opportunity Fund
Statements of Changes in Net Assets
| | | For the Six
Months Ended
March 31, 2020
(Unaudited) | | | For the
Year Ended
September 30, 2019 | |
| NET INCREASE/(DECREASE) IN NET ASSETS FROM OPERATIONS: | | | | | | | | |
| Net investment income | | $ | 2,310,483 | | | $ | 3,409,960 | |
| Net realized gain | | | 5,488,931 | | | | 1,887,614 | |
| Long-term capital gains from other investment companies | | | – | | | | 1,209,202 | |
| Net change in unrealized appreciation/depreciation on investments | | | (24,606,066 | ) | | | (2,628,004 | ) |
| Net increase/(decrease) in net assets resulting from operations | | | (16,806,652 | ) | | | 3,878,772 | |
| | | | | | | | | |
| DISTRIBUTIONS TO SHAREHOLDERS: | | | | | | | | |
| Class I shares | | | (1,406,915 | ) | | | (17,381,143 | ) |
| Class R shares | | | (789,370 | ) | | | (15,707,897 | ) |
| Net decrease in net assets from distributions to shareholders | | | (2,196,285 | ) | | | (33,089,040 | ) |
| | | | | | | | | |
| CAPITAL SHARE TRANSACTIONS: | | | | | | | | |
| Class I Shares | | | | | | | | |
| Proceeds from shares sold | | | 8,757,453 | | | | 42,934,744 | |
| Reinvestment of distributions | | | 1,204,822 | | | | 11,770,344 | |
| Cost of shares redeemed | | | (26,267,036 | ) | | | (39,179,988 | ) |
| Redemption fees(a) | | | – | | | | 1,733 | |
| Net increase/(decrease) in net assets from capital share transactions | | | (16,304,761 | ) | | | 15,526,833 | |
| Class R Shares | | | | | | | | |
| Proceeds from shares sold | | | 3,680,156 | | | | 9,464,344 | |
| Reinvestment of distributions | | | 767,080 | | | | 15,268,961 | |
| Cost of shares redeemed | | | (10,119,664 | ) | | | (36,835,297 | ) |
| Redemption fees(a) | | | – | | | | 184 | |
| Net decrease in net assets from capital share transactions | | | (5,672,428 | ) | | | (12,101,808 | ) |
| Net Decrease in Net Assets | | | (40,980,126 | ) | | | (25,785,243 | ) |
| | | | | | | | | |
| NET ASSETS: | | | | | | | | |
| Beginning of period/year | | $ | 107,005,520 | | | $ | 132,790,763 | |
| End of period/year | | | 66,025,394 | | | | 107,005,520 | |
See Notes to Financial Statements.
| Semi-Annual Report | March 31, 2020 | 85 |
RiverNorth Core Opportunity Fund
Statements of Changes in Net Assets
| | | For the Six
Months Ended
March 31, 2020
(Unaudited) | | | For the
Year Ended
September 30, 2019 | |
| OTHER INFORMATION: | | | | | | | | |
| Share Transactions: | | | | | | | | |
| Class I Shares | | | | | | | | |
| Shares sold | | | 1,217,447 | | | | 5,361,367 | |
| Shares issued in reinvestment of distributions | | | 153,916 | | | | 1,595,372 | |
| Shares redeemed | | | (3,489,516 | ) | | | (4,705,712 | ) |
| Net increase/(decrease) from share transactions | | | (2,118,153 | ) | | | 2,251,027 | |
| | | | | | | | | |
| Class R Shares | | | | | | | | |
| Shares sold | | | 583,158 | | | | 1,202,806 | |
| Shares issued in reinvestment of distributions | | | 99,029 | | | | 2,084,044 | |
| Shares redeemed | | | (1,273,040 | ) | | | (4,453,626 | ) |
| Net decrease from share transactions | | | (590,853 | ) | | | (1,166,776 | ) |
| (a) | The Fund imposed a 2.00% redemption fee on shares redeemed within 90 days of purchase. The redemption fee was eliminated on March 4, 2019. |
See Notes to Financial Statements.
| 86 | (888) 848-7569 | www.rivernorth.com |
RiverNorth/DoubleLine Strategic Income Fund
Statements of Changes in Net Assets
| | | For the Six
Months Ended
March 31, 2020
(Unaudited) | | | For the
Year Ended
September 30, 2019 | |
| NET INCREASE/(DECREASE) IN NET ASSETS FROM OPERATIONS: | | | | | | | | |
| Net investment income | | $ | 45,897,388 | | | $ | 96,084,073 | |
| Net realized gain/(loss) | | | 12,619,147 | | | | (50,206,791 | ) |
| Long-term capital gains from other investment companies | | | – | | | | 188,448 | |
| Net change in unrealized appreciation/depreciation on investments | | | (182,063,576 | ) | | | 96,457,160 | |
| Net increase/(decrease) in net assets resulting from operations | | | (123,547,041 | ) | | | 142,522,890 | |
| | | | | | | | | |
| DISTRIBUTIONS TO SHAREHOLDERS: | | | | | | | | |
| Class I shares | | | (43,236,700 | ) | | | (92,689,814 | ) |
| Class R shares | | | (3,520,293 | ) | | | (8,384,063 | ) |
| Net decrease in net assets from distributions to shareholders | | | (46,756,993 | ) | | | (101,073,877 | ) |
| | | | | | | | | |
| CAPITAL SHARE TRANSACTIONS: | | | | | | | | |
| Class I Shares | | | | | | | | |
| Proceeds from shares sold | | | 280,826,479 | | | | 860,449,587 | |
| Reinvestment of distributions | | | 35,002,017 | | | | 73,340,573 | |
| Cost of shares redeemed | | | (433,491,181 | ) | | | (828,839,766 | ) |
| Redemption fees(a) | | | – | | | | 67,075 | |
| Net increase/(decrease) in net assets from capital share transactions | | | (117,662,685 | ) | | | 105,017,469 | |
| Class R Shares | | | | | | | | |
| Proceeds from shares sold | | | 23,758,828 | | | | 53,658,489 | |
| Reinvestment of distributions | | | 3,351,484 | | | | 8,047,792 | |
| Cost of shares redeemed | | | (55,264,478 | ) | | | (63,914,017 | ) |
| Redemption fees(a) | | | – | | | | 19,243 | |
| Net decrease in net assets from capital share transactions | | | (28,154,166 | ) | | | (2,188,493 | ) |
| Net Increase/(Decrease) in Net Assets | | | (316,120,885 | ) | | | 144,277,989 | |
| | | | | | | | | |
| NET ASSETS: | | | | | | | | |
| Beginning of period/year | | $ | 2,025,244,761 | | | $ | 1,880,966,772 | |
| End of period/year | | | 1,709,123,876 | | | | 2,025,244,761 | |
See Notes to Financial Statements.
| Semi-Annual Report | March 31, 2020 | 87 |
RiverNorth/DoubleLine Strategic Income Fund
Statements of Changes in Net Assets
| | | For the Six
Months Ended
March 31, 2020
(Unaudited) | | | For the
Year Ended
September 30, 2019 | |
| OTHER INFORMATION: | | | | | | | | |
| Share Transactions: | | | | | | | | |
| Class I Shares | | | | | | | | |
| Shares sold | | | 27,597,535 | | | | 85,244,983 | |
| Shares issued in reinvestment of distributions | | | 3,437,840 | | | | 7,258,179 | |
| Shares redeemed | | | (43,567,512 | ) | | | (82,788,383 | ) |
| Net increase/(decrease) from share transactions | | | (12,532,137 | ) | | | 9,714,779 | |
| | | | | | | | | |
| Class R Shares | | | | | | | | |
| Shares sold | | | 2,319,697 | | | | 5,301,831 | |
| Shares issued in reinvestment of distributions | | | 328,178 | | | | 795,933 | |
| Shares redeemed | | | (5,516,206 | ) | | | (6,334,432 | ) |
| Net decrease from share transactions | | | (2,868,331 | ) | | | (236,668 | ) |
| (a) | The Fund imposed a 2.00% redemption fee on shares redeemed within 90 days of purchase. The redemption fee was eliminated on March 4, 2019. |
See Notes to Financial Statements.
| 88 | (888) 848-7569 | www.rivernorth.com |
RiverNorth/Oaktree High Income Fund
Statements of Changes in Net Assets
| | | For the Six
Months Ended
March 31, 2020
(Unaudited) | | | For the
Year Ended
September 30, 2019 | |
| NET INCREASE/(DECREASE) IN NET ASSETS FROM OPERATIONS: | | | | | | | | |
| Net investment income | | $ | 1,000,982 | | | $ | 2,129,809 | |
| Net realized gain/(loss) | | | (649,085 | ) | | | 210,728 | |
| Long-term capital gain distributions from other investment companies | | | – | | | | 2,473 | |
| Net change in unrealized appreciation/depreciation | | | (6,298,169 | ) | | | (23,037 | ) |
| Net increase/(decrease) in net assets resulting from operations | | | (5,946,272 | ) | | | 2,319,973 | |
| | | | | | | | | |
| DISTRIBUTIONS TO SHAREHOLDERS: | | | | | | | | |
| Class I Shares | | | (1,235,570 | ) | | | (2,340,774 | ) |
| Class R Shares | | | (154,559 | ) | | | (295,137 | ) |
| Net decrease in net assets from distributions to shareholders | | | (1,390,129 | ) | | | (2,635,911 | ) |
| | | | | | | | | |
| CAPITAL SHARE TRANSACTIONS: | | | | | | | | |
| Class I Shares | | | | | | | | |
| Proceeds from shares sold | | | 272,677 | | | | 1,386,595 | |
| Reinvestment of distributions | | | 1,228,700 | | | | 2,297,811 | |
| Cost of shares redeemed | | | (3,606,938 | ) | | | (7,975,638 | ) |
| Redemption fees(a) | | | – | | | | 16,396 | |
| Net decrease in net assets from capital share transactions | | | (2,105,561 | ) | | | (4,274,836 | ) |
| | | | | | | | | |
| Class R Shares | | | | | | | | |
| Proceeds from shares sold | | | 438,416 | | | | 687,413 | |
| Reinvestment of distributions | | | 149,611 | | | | 287,836 | |
| Cost of shares redeemed | | | (786,915 | ) | | | (1,755,228 | ) |
| Redemption fees(a) | | | – | | | | 129 | |
| Net decrease in net assets from capital share transactions | | | (198,888 | ) | | | (779,850 | ) |
| | | | | | | | | |
| Net Decrease in Net Assets | | | (9,640,850 | ) | | | (5,370,624 | ) |
| | | | | | | | | |
| NET ASSETS: | | | | | | | | |
| Beginning of period/year | | $ | 51,243,328 | | | $ | 56,613,952 | |
| End of period/year | | | 41,602,478 | | | | 51,243,328 | |
See Notes to Financial Statements.
| Semi-Annual Report | March 31, 2020 | 89 |
RiverNorth/Oaktree High Income Fund
Statements of Changes in Net Assets
| | | For the Six
Months Ended
March 31, 2020
(Unaudited) | | | For the
Year Ended
September 30, 2019 | |
| OTHER INFORMATION: | | | | | | | | |
| Share Transactions: | | | | | | | | |
| Class I Shares | | | | | | | | |
| Shares sold | | | 33,512 | | | | 146,904 | |
| Shares issued in reinvestment of distributions | | | 132,328 | | | | 244,757 | |
| Shares redeemed | | | (434,616 | ) | | | (847,134 | ) |
| Net decrease from share transactions | | | (268,776 | ) | | | (455,473 | ) |
| | | | | | | | | |
| Class R Shares | | | | | | | | |
| Shares sold | | | 46,248 | | | | 73,019 | |
| Shares issued in reinvestment of distributions | | | 16,134 | | | | 30,715 | |
| Shares redeemed | | | (85,796 | ) | | | (186,885 | ) |
| Net decrease from share transactions | | | (23,414 | ) | | | (83,151 | ) |
| (a) | The Fund imposed a 2.00% redemption fee on shares redeemed within 90 days of purchase. The redemption fee was eliminated on March 4, 2019. |
See Notes to Financial Statements.
| 90 | (888) 848-7569 | www.rivernorth.com |
Intentionally Left Blank
| RiverNorth Core Opportunity Fund | Class I |
Financial Highlights
| Net asset value - beginning of period |
| Income/(Loss) from investment operations: |
| Net investment income(a) |
| Net realized and unrealized gain/(loss) on investments |
| Total income/(loss) from investment operations |
| Less distributions: |
| From net investment income |
| From net realized gain on investments |
| From tax return of capital |
| Total distributions |
| Paid-in capital from redemption fees(a) |
| Net increase/(decrease) in net asset value |
| Net asset value - end of period |
| Total Return(d) |
| Ratios/Supplemental Data: |
| Net assets, end of period (in thousands) |
| Ratios to Average Net Assets (including interest expense): |
| |
| Ratio of expenses to average net assets excluding fee waivers and reimbursements(f) |
| |
| Ratio of expenses to average net assets including fee waivers and reimbursements(f) |
| Ratio of net investment income to average net assets excluding fee waivers and reimbursements(f) |
| Ratio of net investment income to average net assets including fee waivers and reimbursements(f) |
| Ratios to Average Net Assets (excluding interest expense): |
| |
| Ratio of expenses to average net assets excluding fee waivers and reimbursements(f) |
| |
| Ratio of expenses to average net assets including fee waivers and reimbursements(f) |
| Ratio of net investment income to average net assets excluding fee waivers and reimbursements(f) |
| Ratio of net investment income to average net assets including fee waivers and reimbursements(f) |
| Portfolio turnover rate |
See Notes to Financial Statements.
| 92 | (888) 848-7569 | www.rivernorth.com |
For a share outstanding throughout the periods presented
For the
Six Months
Ended
March 31, 2020
(Unaudited) | | | For the
Year Ended
September 30,
2019 | | | For the
Year Ended
September 30,
2018 | | | For the
Year Ended
September 30,
2017 | | | For the
Year Ended
September 30,
2016 | | | For the
Year Ended
September 30,
2015 | |
| $ | 8.05 | | | $ | 10.88 | | | $ | 12.37 | | | $ | 11.33 | | | $ | 10.74 | | | $ | 13.06 | |
| | | | | | | | | | | | | | | | | | | | | | | |
| | 0.19 | | | | 0.24 | | | | 0.27 | | | | 0.17 | | | | 0.23 | | | | 0.44 | |
| | (1.82 | ) | | | (0.25 | )(b) | | | 0.42 | | | | 1.45 | | | | 1.33 | | | | (1.30 | ) |
| | (1.63 | ) | | | (0.01 | ) | | | 0.69 | | | | 1.62 | | | | 1.56 | | | | (0.86 | ) |
| | | | | | | | | | | | | | | | | | | | | | | |
| | (0.18 | ) | | | (0.18 | ) | | | (0.40 | ) | | | (0.30 | ) | | | (0.42 | ) | | | (0.60 | ) |
| | – | | | | (2.64 | ) | | | (1.78 | ) | | | (0.28 | ) | | | (0.45 | ) | | | (0.86 | ) |
| | – | | | | – | | | | – | | | | – | | | | (0.10 | ) | | | – | |
| | (0.18 | ) | | | (2.82 | ) | | | (2.18 | ) | | | (0.58 | ) | | | (0.97 | ) | | | (1.46 | ) |
| | – | | | | 0.00 | (c) | | | 0.00 | (c) | | | 0.00 | (c) | | | 0.00 | (c) | | | 0.00 | (c) |
| | (1.81 | ) | | | (2.83 | ) | | | (1.49 | ) | | | 1.04 | | | | 0.59 | | | | (2.32 | ) |
| $ | 6.24 | | | $ | 8.05 | | | $ | 10.88 | | | $ | 12.37 | | | $ | 11.33 | | | $ | 10.74 | |
| | (20.63 | %)(e) | | | 3.51 | % | | | 5.92 | % | | | 14.71 | % | | | 15.35 | % | | | (7.50 | %) |
| | | | | | | | | | | | | | | | | | | | | | | |
| $ | 38,447 | | | $ | 66,662 | | | $ | 65,592 | | | $ | 109,627 | | | $ | 201,712 | | | $ | 166,905 | |
| | | | | | | | | | | | | | | | | | | | | | | |
| | | | | | | | | | | | | | | | | | | | | | | |
| | 1.26 | %(g) | | | 1.22 | % | | | N/A | | | | 1.12 | % | | | N/A | | | | N/A | |
| | | | | | | | | | | | | | | | | | | | | | | |
| | 1.26 | %(g) | | | 1.22 | % | | | N/A | | | | 1.12 | % | | | N/A | | | | N/A | |
| | | | | | | | | | | | | | | | | | | | | | | |
| | 4.67 | %(g) | | | 2.88 | % | | | N/A | | | | 1.45 | % | | | N/A | | | | N/A | |
| | | | | | | | | | | | | | | | | | | | | | | |
| | 4.67 | %(g) | | | 2.88 | % | | | N/A | | | | 1.45 | % | | | N/A | | | | N/A | |
| | | | | | | | | | | | | | | | | | | | | | | |
| | | | | | | | | | | | | | | | | | | | | | | |
| | 1.26 | %(g) | | | 1.22 | % | | | 1.17 | % | | | 1.12 | % | | | 1.11 | % | | | 1.11 | % |
| | | | | | | | | | | | | | | | | | | | | | | |
| | 1.26 | %(g) | | | 1.22 | % | | | 1.17 | % | | | 1.12 | % | | | 1.11 | % | | | 1.11 | % |
| | | | | | | | | | | | | | | | | | | | | | | |
| | 4.67 | %(g) | | | 2.88 | % | | | 2.37 | % | | | 1.45 | % | | | 2.11 | % | | | 3.62 | % |
| | | | | | | | | | | | | | | | | | | | | | | |
| | 4.67 | %(g) | | | 2.88 | % | | | 2.37 | % | | | 1.45 | % | | | 2.11 | % | | | 3.62 | % |
| | 55 | %(e) | | | 36 | % | | | 58 | %(h) | | | 39 | %(h) | | | 19 | % | | | 23 | % |
| Semi-Annual Report | March 31, 2020 | 93 |
| RiverNorth Core Opportunity Fund | Class I |
| Financial Highlights | For a share outstanding throughout the periods presented |
| (a) | Based on average shares outstanding during the period. |
| (b) | Realized and unrealized gains and losses per share in this caption are balancing amounts necessary to reconcile the change in net asset value per share for the period, and may not reconcile with the aggregate gains and losses in the Statement of Operations due to share transactions for the period. |
| (c) | Less than $0.005 per share. |
| (d) | Total return in the above table represents the rate that the investor would have earned or lost on an investment in the Fund, assuming reinvestment of dividends. |
| (f) | The ratios exclude the impact of expenses of the underlying funds in which the Fund invests as represented in the Schedule of Investments. |
| (h) | Portfolio turnover does not include redemptions in-kind. |
See Notes to Financial Statements.
| 94 | (888) 848-7569 | www.rivernorth.com |
Intentionally Left Blank
RiverNorth Core Opportunity Fund | Class R |
Financial Highlights
| Net asset value - beginning of period |
| Income/(Loss) from investment operations: |
| Net investment income(a) |
| Net realized and unrealized gain/(loss) on investments |
| Total income/(loss) from investment operations |
| Less distributions: |
| From net investment income |
| From net realized gain on investments |
| From tax return of capital |
| Total distributions |
| Paid-in capital from redemption fees(a) |
| Net increase/ (decrease) in net asset value |
| Net asset value - end of period |
| |
| Total Return(d) |
| |
| Ratios/Supplemental Data: |
| Net assets, end of period (in thousands) |
| Ratios to Average Net Assets (including interest expense): |
| Ratio of expenses to average net assets excluding fee waivers and reimbursements(f) |
| Ratio of expenses to average net assets including fee waivers and reimbursements(f) |
| Ratio of net investment income to average net assets excluding fee waivers and reimbursements(f) |
| |
| Ratio of net investment income to average net assets including fee waivers and reimbursements(f) |
| Ratios to Average Net Assets (excluding interest expense): |
| Ratio of expenses to average net assets excluding fee waivers and reimbursements(f) |
| Ratio of expenses to average net assets including fee waivers and reimbursements(f) |
| |
| Ratio of net investment income to average net assets excluding fee waivers and reimbursements(f) |
| |
| Ratio of net investment income to average net assets including fee waivers and reimbursements(f) |
| Portfolio turnover rate |
See Notes to Financial Statements.
96 | (888) 848-7569 | www.rivernorth.com |
For a share outstanding throughout the periods presented
For the Six Months Ended March 31, 2020 (Unaudited) | | | | For the Year Ended September 30, 2019 | | | | For the Year Ended September 30, 2018 | | | | For the Year Ended September 30, 2017 | | | | For the Year Ended September 30, 2016 | | | | For the Year Ended September 30, 2015 | |
| $ | 8.06 | | | $ | 10.89 | | | $ | 12.37 | | | $ | 11.32 | | | $ | 10.74 | | | $ | 13.05 | |
| | | | | | | | | | | | | | | | | | | | | | | |
| | 0.18 | | | | 0.22 | | | | 0.23 | | | | 0.16 | | | | 0.20 | | | | 0.39 | |
| | (1.82 | ) | | | (0.26 | )(b) | | | 0.44 | | | | 1.44 | | | | 1.32 | | | | (1.27 | ) |
| | (1.64 | ) | | | (0.04 | ) | | | 0.67 | | | | 1.60 | | | | 1.52 | | | | (0.88 | ) |
| | | | | | | | | | | | | | | | | | | | | | | |
| | (0.17 | ) | | | (0.17 | ) | | | (0.37 | ) | | | (0.27 | ) | | | (0.40 | ) | | | (0.57 | ) |
| | – | | | | (2.62 | ) | | | (1.78 | ) | | | (0.28 | ) | | | (0.45 | ) | | | (0.86 | ) |
| | – | | | | – | | | | – | | | | – | | | | (0.09 | ) | | | – | |
| | (0.17 | ) | | | (2.79 | ) | | | (2.15 | ) | | | (0.55 | ) | | | (0.94 | ) | | | (1.43 | ) |
| | – | | | | 0.00 | (c) | | | 0.00 | (c) | | | 0.00 | (c) | | | 0.00 | (c) | | �� | 0.00 | (c) |
| | (1.81 | ) | | | (2.83 | ) | | | (1.48 | ) | | | 1.05 | | | | 0.58 | | | | (2.31 | ) |
| $ | 6.25 | | | $ | 8.06 | | | $ | 10.89 | | | $ | 12.37 | | | $ | 11.32 | | | $ | 10.74 | |
| | (20.70 | %)(e) | | | 3.23 | % | | | 5.70 | % | | | 14.51 | % | | | 14.98 | % | | | (7.67 | %) |
| | | | | | | | | | | | | | | | | | | | | | | |
| $ | 27,579 | | | $ | 40,344 | | | $ | 67,199 | | | $ | 213,737 | | | $ | 568,198 | | | $ | 538,689 | |
| | | | | | | | | | | | | | | | | | | | | | | |
| | 1.51 | %(g) | | | 1.48 | % | | | N/A | | | | 1.37 | % | | | N/A | | | | N/A | |
| | 1.51 | %(g) | | | 1.48 | % | | | N/A | | | | 1.37 | % | | | N/A | | | | N/A | |
| | | | | | | | | | | | | | | | | | | | | | | |
| | 4.54 | %(g) | | | 2.62 | % | | | N/A | | | | 1.38 | % | | | N/A | | | | N/A | |
| | | | | | | | | | | | | | | | | | | | | | | |
| | 4.54 | %(g) | | | 2.62 | % | | | N/A | | | | 1.38 | % | | | N/A | | | | N/A | |
| | | | | | | | | | | | | | | | | | | | | | | |
| | 1.51 | %(g) | | | 1.48 | % | | | 1.41 | % | | | 1.37 | % | | | 1.36 | % | | | 1.35 | % |
| | 1.51 | %(g) | | | 1.48 | % | | | 1.41 | % | | | 1.37 | % | | | 1.36 | % | | | 1.35 | % |
| | | | | | | | | | | | | | | | | | | | | | | |
| | 4.54 | %(g) | | | 2.62 | % | | | 2.02 | % | | | 1.38 | % | | | 1.90 | % | | | 3.16 | % |
| | | | | | | | | | | | | | | | | | | | | | | |
| | 4.54 | %(g) | | | 2.62 | % | | | 2.02 | % | | | 1.38 | % | | | 1.90 | % | | | 3.16 | % |
| | 55 | %(e) | | | 36 | % | | | 58 | %(h) | | | 39 | %(h) | | | 19 | % | | | 23 | % |
Semi-Annual Report | March 31, 2020 | 97 |
RiverNorth Core Opportunity Fund | Class R |
Financial Highlights | For a share outstanding throughout the periods presented |
| (a) | Based on average shares outstanding during the period. |
| (b) | Realized and unrealized gains and losses per share in this caption are balancing amounts necessary to reconcile the change in net asset value per share for the period, and may not reconcile with the aggregate gains and losses in the Statement of Operations due to share transactions for the period. |
| (c) | Less than $0.005 per share. |
| (d) | Total return in the above table represents the rate that the investor would have earned or lost on an investment in the Fund, assuming reinvestment of dividends. |
| (f) | The ratios exclude the impact of expenses of the underlying funds in which the Fund invests as represented in the Schedule of Investments. |
| (h) | Portfolio turnover does not include redemptions in-kind. |
See Notes to Financial Statements.
98 | (888) 848-7569 | www.rivernorth.com |
Intentionally Left Blank
RiverNorth/DoubleLine Strategic Income Fund | Class I |
Financial Highlights
| Net asset value - beginning of period |
| Income/(loss) from investment operations: |
| Net investment income(a) |
| Net realized and unrealized gain/(loss) on investments |
| Total income/(loss) from investment operations |
| |
| Less distributions: |
| From net investment income |
| From net realized gain on investments |
| From tax return of capital |
| Total distributions |
| Paid-in capital from redemption fees(a) |
| Net increase/(decrease) in net asset value |
| Net asset value - end of period |
| |
| Total Return(c) |
| |
| Ratios/Supplemental Data: |
| Net assets, end of period (in thousands) |
| Ratios to Average Net Assets (including interest expense): |
| Ratio of expenses to average net assets excluding fee waivers and reimbursements(e) |
| Ratio of expenses to average net assets including fee waivers and reimbursements(e) |
| |
| Ratio of net investment income to average net assets excluding fee waivers and reimbursements(e) |
| |
| Ratio of net investment income to average net assets including fee waivers and reimbursements(e) |
| Ratios to Average Net Assets (excluding interest expense): |
| Ratio of expenses to average net assets excluding fee waivers and reimbursements(e) |
| Ratio of expenses to average net assets including fee waivers and reimbursements(e) |
| |
| Ratio of net investment income to average net assets excluding fee waivers and reimbursements(e) |
| |
| Ratio of net investment income to average net assets including fee waivers and reimbursements(e) |
| Portfolio turnover rate |
See Notes to Financial Statements.
100 | (888) 848-7569 | www.rivernorth.com |
For a share outstanding throughout the periods presented
For the Six Months Ended March 31, 2020 (Unaudited) | | | | For the Year Ended September 30, 2019 | | | | For the Year Ended September 30, 2018 | | | | For the Year Ended September 30, 2017 | | | | For the Year Ended September 30, 2016 | | | For the Year Ended September 30, 2015 | |
| $ | 10.33 | | | $ | 10.08 | | | $ | 10.61 | | | $ | 10.61 | | | $ | 10.37 | | | $ | 10.88 | |
| | | | | | | | | | | | | | | | | | | | | | | |
| | 0.23 | | | | 0.52 | | | | 0.47 | | | | 0.40 | | | | 0.51 | | | | 0.56 | |
| | (0.86 | ) | | | 0.28 | | | | (0.44 | ) | | | 0.08 | | | | 0.39 | | | | (0.55 | ) |
| | (0.63 | ) | | | 0.80 | | | | 0.03 | | | | 0.48 | | | | 0.90 | | | | 0.01 | |
| | | | | | | | | | | | | | | | | | | | | | | |
| | | | | | | | | | | | | | | | | | | | | | | |
| | (0.24 | ) | | | (0.55 | ) | | | (0.51 | ) | | | (0.45 | ) | | | (0.64 | ) | | | (0.52 | ) |
| | – | | | | – | | | | (0.04 | ) | | | (0.03 | ) | | | – | | | | – | |
| | – | | | | – | | | | (0.01 | ) | | | – | | | | (0.02 | ) | | | – | |
| | (0.24 | ) | | | (0.55 | ) | | | (0.56 | ) | | | (0.48 | ) | | | (0.66 | ) | | | (0.52 | ) |
| | – | | | | 0.00 | (b) | | | 0.00 | (b) | | | 0.00 | (b) | | | 0.00 | (b) | | | 0.00 | (b) |
| | (0.87 | ) | | | 0.25 | | | | (0.53 | ) | | | – | | | | 0.24 | | | | (0.51 | ) |
| $ | 9.46 | | | $ | 10.33 | | | $ | 10.08 | | | $ | 10.61 | | | $ | 10.61 | | | $ | 10.37 | |
| | | | | | | | | | | | | | | | | | | | | | | |
| | (6.23 | %)(d) | | | 8.21 | % | | | 0.33 | % | | | 4.67 | % | | | 9.00 | % | | | 0.04 | % |
| | | | | | | | | | | | | | | | | | | | | | | |
| | | | | | | | | | | | | | | | | | | | | | | |
| $ | 1,583,218 | | | $ | 1,858,103 | | | $ | 1,715,495 | | | $ | 2,024,142 | | | $ | 1,822,874 | | | $ | 1,735,108 | |
| | | | | | | | | | | | | | | | | | | | | | | |
| | 0.86 | %(f) | | | 0.86 | % | | | N/A | | | | N/A | | | | N/A | | | | N/A | |
| | 0.86 | %(f) | | | 0.86 | % | | | N/A | | | | N/A | | | | N/A | | | | N/A | |
| | | | | | | | | | | | | | | | | | | | | | | |
| | 4.54 | %(f) | | | 5.13 | % | | | N/A | | | | N/A | | | | N/A | | | | N/A | |
| | | | | | | | | | | | | | | | | | | | | | | |
| | 4.54 | %(f) | | | 5.13 | % | | | N/A | | | | N/A | | | | N/A | | | | N/A | |
| | | | | | | | | | | | | | | | | | | | | | | |
| | 0.86 | %(f) | | | 0.86 | % | | | 0.86 | % | | | 0.85 | % | | | 0.86 | % | | | 0.86 | % |
| | 0.86 | %(f) | | | 0.86 | % | | | 0.86 | % | | | 0.85 | % | | | 0.86 | % | | | 0.86 | % |
| | | | | | | | | | | | | | | | | | | | | | | |
| | 4.54 | %(f) | | | 5.13 | % | | | 4.60 | % | | | 3.80 | % | | | 4.92 | % | | | 5.24 | % |
| | | | | | | | | | | | | | | | | | | | | | | |
| | 4.54 | %(f) | | | 5.13 | % | | | 4.60 | % | | | 3.80 | % | | | 4.92 | % | | | 5.24 | % |
| | 36 | %(d) | | | 60 | % | | | 37 | % | | | 50 | % | | | 36 | % | | | 29 | % |
Semi-Annual Report | March 31, 2020 | 101 |
RiverNorth/DoubleLine Strategic Income Fund | Class I |
Financial Highlights | For a share outstanding throughout the periods presented |
| (a) | Based on average shares outstanding during the period. |
| (b) | Less than $0.005 per share. |
| (c) | Total return in the above table represents the rate that the investor would have earned or lost on an investment in the Fund, assuming reinvestment of dividends. |
| (e) | The ratios exclude the impact of expenses of the underlying funds in which the Fund invests as represented in the Schedule of Investments. |
See Notes to Financial Statements.
102 | (888) 848-7569 | www.rivernorth.com |
Intentionally Left Blank
| RiverNorth/DoubleLine Strategic Income Fund | Class R |
Financial Highlights
| Net asset value - beginning of period |
| Income/(loss) from investment operations: |
| Net investment income(a) |
| Net realized and unrealized gain/(loss) on investments |
| Total income/(loss) from investment operations |
| |
| Less distributions: |
| From net investment income |
| From net realized gain on investments |
| From tax return of capital |
| Total distributions |
| Paid-in capital from redemption fees(a) |
| Net increase/(decrease) in net asset value |
| Net asset value - end of period |
| |
| Total Return(c) |
| |
| Ratios/Supplemental Data: |
| Net assets, end of period (in thousands) |
| Ratios to Average Net Assets (including interest expense): |
| Ratio of expenses to average net assets excluding fee waivers and reimbursements(e) |
| Ratio of expenses to average net assets including fee waivers and reimbursements(e) |
| |
| Ratio of net investment income to average net assets excluding fee waivers and reimbursements(e) |
| |
| Ratio of net investment income to average net assets including fee waivers and reimbursements(e) |
| Ratios to Average Net Assets (excluding interest expense): |
| Ratio of expenses to average net assets excluding fee waivers and reimbursements(e) |
| Ratio of expenses to average net assets including fee waivers and reimbursements(e) |
| |
| Ratio of net investment income to average net assets excluding fee waivers and reimbursements(e) |
| |
| Ratio of net investment income to average net assets including fee waivers and reimbursements(e) |
| Portfolio turnover rate |
See Notes to Financial Statements.
| 104 | (888) 848-7569 | www.rivernorth.com |
For a share outstanding throughout the periods presented
For the
Six Months
Ended
March 31, 2020
(Unaudited) | | | For the
Year Ended
September 30,
2019 | | | For the
Year Ended
September 30,
2018 | | | For the
Year Ended
September 30,
2017 | | | For the
Year Ended
September 30,
2016 | | | For the
Year Ended
September 30,
2015 | |
| $ | 10.35 | | | $ | 10.09 | | | $ | 10.62 | | | $ | 10.62 | | | $ | 10.39 | | | $ | 10.89 | |
| | | | | | | | | | | | | | | | | | | | | | | |
| | 0.22 | | | | 0.50 | | | | 0.45 | | | | 0.38 | | | | 0.49 | | | | 0.54 | |
| | (0.86 | ) | | | 0.28 | | | | (0.45 | ) | | | 0.08 | | | | 0.37 | | | | (0.55 | ) |
| | (0.64 | ) | | | 0.78 | | | | – | | | | 0.46 | | | | 0.86 | | | | (0.01 | ) |
| | | | | | | | | | | | | | | | | | | | | | | |
| | | | | | | | | | | | | | | | | | | | | | | |
| | (0.23 | ) | | | (0.52 | ) | | | (0.48 | ) | | | (0.43 | ) | | | (0.61 | ) | | | (0.49 | ) |
| | – | | | | – | | | | (0.04 | ) | | | (0.03 | ) | | | – | | | | – | |
| | – | | | | – | | | | (0.01 | ) | | | – | | | | (0.02 | ) | | | – | |
| | (0.23 | ) | | | (0.52 | ) | | | (0.53 | ) | | | (0.46 | ) | | | (0.63 | ) | | | (0.49 | ) |
| | – | | | | 0.00 | (b) | | | 0.00 | (b) | | | 0.00 | (b) | | | 0.00 | (b) | | | 0.00 | (b) |
| | (0.87 | ) | | | 0.26 | | | | (0.53 | ) | | | – | | | | 0.23 | | | | (0.50 | ) |
| $ | 9.48 | | | $ | 10.35 | | | $ | 10.09 | | | $ | 10.62 | | | $ | 10.62 | | | $ | 10.39 | |
| | | | | | | | | | | | | | | | | | | | | | | |
| | (6.34 | %)(d) | | | 8.03 | % | | | 0.07 | % | | | 4.40 | % | | | 8.62 | % | | | (0.12 | %) |
| | | | | | | | | | | | | | | | | | | | | | | |
| | | | | | | | | | | | | | | | | | | | | | | |
| $ | 125,906 | | | $ | 167,141 | | | $ | 165,472 | | | $ | 208,143 | | | $ | 230,953 | | | $ | 233,319 | |
| | | | | | | | | | | | | | | | | | | | | | | |
| | 1.11 | %(f) | | | 1.11 | % | | | N/A | | | | N/A | | | | N/A | | | | N/A | |
| | 1.11 | %(f) | | | 1.11 | % | | | N/A | | | | N/A | | | | N/A | | | | N/A | |
| | | | | | | | | | | | | | | | | | | | | | | |
| | 4.29 | %(f) | | | 4.90 | % | | | N/A | | | | N/A | | | | N/A | | | | N/A | |
| | | | | | | | | | | | | | | | | | | | | | | |
| | 4.29 | %(f) | | | 4.90 | % | | | N/A | | | | N/A | | | | N/A | | | | N/A | |
| | | | | | | | | | | | | | | | | | | | | | | |
| | 1.11 | %(f) | | | 1.11 | % | | | 1.11 | % | | | 1.10 | % | | | 1.11 | % | | | 1.11 | % |
| | 1.11 | %(f) | | | 1.11 | % | | | 1.11 | % | | | 1.10 | % | | | 1.11 | % | | | 1.11 | % |
| | | | | | | | | | | | | | | | | | | | | | | |
| | 4.29 | %(f) | | | 4.90 | % | | | 4.34 | % | | | 3.56 | % | | | 4.67 | % | | | 4.97 | % |
| | | | | | | | | | | | | | | | | | | | | | | |
| | 4.29 | %(f) | | | 4.90 | % | | | 4.34 | % | | | 3.56 | % | | | 4.67 | % | | | 4.97 | % |
| | 36 | %(d) | | | 60 | % | | | 37 | % | | | 50 | % | | | 36 | % | | | 29 | % |
| Semi-Annual Report | March 31, 2020 | 105 |
| RiverNorth/DoubleLine Strategic Income Fund | Class R |
| Financial Highlights | For a share outstanding throughout the periods presented |
| (a) | Based on average shares outstanding during the period. |
| (b) | Less than $0.005 per share. |
| (c) | Total return in the above table represents the rate that the investor would have earned or lost on an investment in the Fund, assuming reinvestment of dividends. |
| (e) | The ratios exclude the impact of expenses of the underlying funds in which the Fund invests as represented in the Schedule of Investments. |
See Notes to Financial Statements.
| 106 | (888) 848-7569 | www.rivernorth.com |
Intentionally Left Blank
| RiverNorth/Oaktree High Income Fund | Class I |
Financial Highlights
| Net asset value - beginning of period |
| Income/(loss) from investment operations: |
| Net investment income(a) |
| Net realized and unrealized gain/(loss) on investments |
| Total income/(loss) from investment operations |
| |
| Less distributions: |
| From net investment income |
| From net realized gain on investments |
| From tax return of capital |
| Total distributions |
| Paid-in capital from redemption fees(a) |
| Net increase/(decrease) in net asset value |
| Net asset value - end of period |
| |
| Total Return(c) |
| |
| Supplemental Data: |
| Net assets, end of period (in thousands) |
| Ratios to Average Net Assets (including interest expense) |
| Ratio of expenses to average net assets excluding fee waivers and reimbursements(e) |
| Ratio of expenses to average net assets including fee waivers and reimbursements(e) |
| |
| Ratio of net investment income to average net assets excluding fee waivers and reimbursements(e) |
| |
| Ratio of net investment income to average net assets including fee waivers and reimbursements(e) |
| |
| Ratios to Average Net Assets (excluding interest expense) |
| Ratio of expenses to average net assets excluding fee waivers and reimbursements(e) |
| Ratio of expenses to average net assets including fee waivers and reimbursements(e) |
| |
| Ratio of net investment income to average net assets excluding fee waivers and reimbursements(e) |
| |
| Ratio of net investment income to average net assets including fee waivers and reimbursements(e) |
| Portfolio turnover rate |
See Notes to Financial Statements.
| 108 | (888) 848-7569 | www.rivernorth.com |
For a share outstanding throughout the periods presented
For the
Six Months
Ended
March 31, 2020
(Unaudited) | | | For the
Year Ended
September 30,
2019 | | | For the
Year Ended
September 30,
2018 | | | For the
Year Ended
September 30,
2017 | | | For the
Year Ended
September 30,
2016 | | | For the
Year Ended
September 30,
2015 | |
| $ | 9.55 | | | $ | 9.58 | | | $ | 9.73 | | | $ | 9.48 | | | $ | 9.18 | | | $ | 10.25 | |
| | | | | | | | | | | | | | | | | | | | | | | |
| | 0.19 | | | | 0.38 | | | | 0.39 | | | | 0.35 | | | | 0.44 | | | | 0.43 | |
| | (1.28 | ) | | | 0.07 | | | | (0.18 | ) | | | 0.31 | | | | 0.44 | | | | (0.77 | ) |
| | (1.09 | ) | | | 0.45 | | | | 0.21 | | | | 0.66 | | | | 0.88 | | | | (0.34 | ) |
| | | | | | | | | | | | | | | | | | | | | | | |
| | | | | | | | | | | | | | | | | | | | | | | |
| | (0.26 | ) | | | (0.48 | ) | | | (0.24 | ) | | | (0.38 | ) | | | (0.55 | ) | | | (0.53 | ) |
| | – | | | | – | | | | – | | | | – | | | | – | | | | (0.20 | ) |
| | – | | | | – | | | | (0.12 | ) | | | (0.03 | ) | | | (0.03 | ) | | | – | |
| | (0.26 | ) | | | (0.48 | ) | | | (0.36 | ) | | | (0.41 | ) | | | (0.58 | ) | | | (0.73 | ) |
| | – | | | | 0.00 | (b) | | | 0.00 | (b) | | | 0.00 | (b) | | | 0.00 | (b) | | | 0.00 | (b) |
| | (1.35 | ) | | | (0.03 | ) | | | (0.15 | ) | | | 0.25 | | | | 0.30 | | | | (1.07 | ) |
| $ | 8.20 | | | $ | 9.55 | | | $ | 9.58 | | | $ | 9.73 | | | $ | 9.48 | | | $ | 9.18 | |
| | | | | | | | | | | | | | | | | | | | | | | |
| | (11.67 | %)(d) | | | 4.85 | % | | | 2.22 | % | | | 7.11 | % | | | 10.09 | % | | | (3.50 | %) |
| | | | | | | | | | | | | | | | | | | | | | | |
| $ | 36,697 | | | $ | 45,306 | | | $ | 49,856 | | | $ | 63,842 | | | $ | 73,580 | | | $ | 88,360 | |
| | | | | | | | | | | | | | | | | | | | | | | |
| | 1.67 | %(f)(g) | | | 1.58 | %(g) | | | 1.54 | %(g) | | | 1.35 | %(g) | | | 1.34 | %(g) | | | 1.36 | %(g) |
| | 1.35 | %(f)(g) | | | 1.36 | %(g) | | | 1.36 | %(g) | | | 1.35 | %(g) | | | 1.34 | %(g) | | | 1.36 | %(g) |
| | | | | | | | | | | | | | | | | | | | | | | |
| | 3.71 | %(f)(g) | | | 3.83 | %(g) | | | 3.84 | %(g) | | | 3.59 | %(g) | | | 4.86 | %(g) | | | 4.40 | %(g) |
| | | | | | | | | | | | | | | | | | | | | | | |
| | 4.03 | %(f)(g) | | | 4.05 | %(g) | | | 4.02 | %(g) | | | 3.59 | %(g) | | | 4.86 | %(g) | | | 4.40 | %(g) |
| | | | | | | | | | | | | | | | | | | | | | | |
| | | | | | | | | | | | | | | | | | | | | | | |
| | 1.67 | %(f)(g) | | | 1.57 | %(g) | | | 1.53 | %(g) | | | 1.35 | %(g) | | | 1.34 | %(g) | | | 1.35 | %(g) |
| | 1.35 | %(f)(g) | | | 1.35 | %(g) | | | 1.35 | %(g) | | | 1.35 | %(g) | | | 1.34 | %(g) | | | 1.35 | %(g) |
| | | | | | | | | | | | | | | | | | | | | | | |
| | 3.71 | %(f)(g) | | | 3.84 | %(g) | | | 3.83 | %(g) | | | 3.59 | %(g) | | | 4.86 | %(g) | | | 4.41 | %(g) |
| | | | | | | | | | | | | | | | | | | | | | | |
| | 4.03 | %(f)(g) | | | 4.06 | %(g) | | | 4.01 | %(g) | | | 3.59 | %(g) | | | 4.86 | %(g) | | | 4.41 | %(g) |
| | 42 | %(d) | | | 52 | % | | | 76 | % | | | 121 | % | | | 40 | % | | | 70 | % |
| Semi-Annual Report | March 31, 2020 | 109 |
| RiverNorth/Oaktree High Income Fund | Class I |
| Financial Highlights | For a share outstanding throughout the periods presented |
| (a) | Based on average shares outstanding during the period. |
| (b) | Less than $0.005 per share. |
| (c) | Total return in the above table represents the rate that the investor would have earned or lost on an investment in the Fund, assuming reinvestment of dividends. |
| (e) | The ratios exclude the impact of expenses of the underlying funds in which the Fund invests as represented in the Schedule of Investments. |
| (g) | The portion of the ratios attributable to recoupments for the periods ended March 31, 2020, September 30, 2019, September 30, 2018, September 30, 2017, September 30, 2016, and September 30, 2015 were 0.00%, 0.00% 0.00%, 0.00%, 0.00% and 0.06%, respectively. |
See Notes to Financial Statements.
| 110 | (888) 848-7569 | www.rivernorth.com |
Intentionally Left Blank
| RiverNorth/Oaktree High Income Fund | Class R |
Financial Highlights
| |
| |
| Net asset value - beginning of period |
| Income/(loss) from investment operations: |
| Net investment income(a) |
| Net realized and unrealized gain/(loss) on investments |
| Total income/(loss) from investment operations |
| |
| Less distributions: |
| From net investment income |
| From net realized gain on investments |
| From tax return of capital |
| Total distributions |
| Paid-in capital from redemption fees(a) |
| Net increase/(decrease) in net asset value |
| Net asset value - end of period |
| Total Return(c) |
| |
| Supplemental Data: |
| Net assets, end of period (in thousands) |
| Ratios to Average Net Assets (including interest expense) |
| Ratio of expenses to average net assets excluding fee waivers and reimbursements(e) |
| Ratio of expenses to average net assets including fee waivers and reimbursements(e) |
| |
| Ratio of net investment income to average net assets excluding fee waivers and reimbursements(e) |
| |
| Ratio of net investment income to average net assets including fee waivers and reimbursements(e) |
| |
| Ratios to Average Net Assets (excluding interest expense) |
| Ratio of expenses to average net assets excluding fee waivers and reimbursements(e) |
| Ratio of expenses to average net assets including fee waivers and reimbursements(e) |
| |
| Ratio of net investment income to average net assets excluding fee waivers and reimbursements(e) |
| |
| Ratio of net investment income to average net assets including fee waivers and reimbursements(e) |
| Portfolio turnover rate |
See Notes to Financial Statements.
| 112 | (888) 848-7569 | www.rivernorth.com |
For a share outstanding throughout the periods presented
For the
Six Months
Ended
March 31, 2020
(Unaudited) | | | For the
Year Ended
September 30,
2019 | | | For the
Year Ended
September 30,
2018 | | | For the
Year Ended
September 30,
2017 | | | For the
Year Ended
September 30,
2016 | | | For the
Year Ended
September 30,
2015 | |
| $ | 9.54 | | | $ | 9.58 | | | $ | 9.72 | | | $ | 9.47 | | | $ | 9.17 | | | $ | 10.24 | |
| | | | | | | | | | | | | | | | | | | | | | | |
| | 0.18 | | | | 0.36 | | | | 0.36 | | | | 0.32 | | | | 0.43 | | | | 0.41 | |
| | (1.28 | ) | | | 0.05 | | | | (0.16 | ) | | | 0.32 | | | | 0.43 | | | | (0.77 | ) |
| | (1.10 | ) | | | 0.41 | | | | 0.20 | | | | 0.64 | | | | 0.86 | | | | (0.36 | ) |
| | | | | | | | | | | | | | | | | | | | | | | |
| | | | | | | | | | | | | | | | | | | | | | | |
| | (0.25 | ) | | | (0.45 | ) | | | (0.23 | ) | | | (0.36 | ) | | | (0.54 | ) | | | (0.51 | ) |
| | – | | | | – | | | | – | | | | – | | | | – | | | | (0.20 | ) |
| | – | | | | – | | | | (0.11 | ) | | | (0.03 | ) | | | (0.02 | ) | | | – | |
| | (0.25 | ) | | | (0.45 | ) | | | (0.34 | ) | | | (0.39 | ) | | | (0.56 | ) | | | (0.71 | ) |
| | – | | | | 0.00 | (b) | | | 0.00 | (b) | | | 0.00 | (b) | | | 0.00 | (b) | | | 0.00 | (b) |
| | (1.35 | ) | | | (0.04 | ) | | | (0.14 | ) | | | 0.25 | | | | 0.30 | | | | (1.07 | ) |
| $ | 8.19 | | | $ | 9.54 | | | $ | 9.58 | | | $ | 9.72 | | | $ | 9.47 | | | $ | 9.17 | |
| | | | | | | | | | | | | | | | | | | | | | | |
| | (11.79% | )(d) | | | 4.48% | | | | 2.07% | | | | 6.83% | | | | 9.83% | | | | (3.76% | ) |
| | | | | | | | | | | | | | | | | | | | | | | |
| $ | 4,906 | | | $ | 5,937 | | | $ | 6,758 | | | $ | 7,635 | | | $ | 7,203 | | | $ | 10,368 | |
| | | | | | | | | | | | | | | | | | | | | | | |
| | 1.92% | (f)(g) | | | 1.83% | (g) | | | 1.79% | (g) | | | 1.63% | (g) | | | 1.62% | (g) | | | 1.61% | (g) |
| | 1.60% | (f)(g) | | | 1.61% | (g) | | | 1.61% | (g) | | | 1.60% | (g) | | | 1.60% | (g) | | | 1.61% | (g) |
| | | | | | | | | | | | | | | | | | | | | | | |
| | 3.46% | (f)(g) | | | 3.58% | (g) | | | 3.60% | (g) | | | 3.29% | (g) | | | 4.69% | (g) | | | 4.14% | (g) |
| | | | | | | | | | | | | | | | | | | | | | | |
| | 3.78% | (f)(g) | | | 3.80% | (g) | | | 3.78% | (g) | | | 3.33% | (g) | | | 4.71% | (g) | | | 4.14% | (g) |
| | | | | | | | | | | | | | | | | | | | | | | |
| | | | | | | | | | | | | | | | | | | | | | | |
| | 1.92% | (f)(g) | | | 1.82% | (g) | | | 1.78% | (g) | | | 1.63% | (g) | | | 1.62% | (g) | | | 1.60% | (g) |
| | 1.60% | (f)(g) | | | 1.60% | (g) | | | 1.60% | (g) | | | 1.60% | (g) | | | 1.60% | (g) | | | 1.60% | (g) |
| | | | | | | | | | | | | | | | | | | | | | | |
| | 3.46% | (f)(g) | | | 3.59% | (g) | | | 3.59% | (g) | | | 3.29% | (g) | | | 4.69% | (g) | | | 4.15% | (g) |
| | | | | | | | | | | | | | | | | | | | | | | |
| | 3.78% | (f)(g) | | | 3.81% | (g) | | | 3.77% | (g) | | | 3.33% | (g) | | | 4.71% | (g) | | | 4.15% | (g) |
| | 42% | (d) | | | 52% | | | | 76% | | | | 121% | | | | 40% | | | | 70% | |
| Semi-Annual Report | March 31, 2020 | 113 |
| RiverNorth/Oaktree High Income Fund | Class R |
| Financial Highlights | For a share outstanding throughout the periods presented |
| (a) | Based on average shares outstanding during the period. |
| (b) | Less than $0.005 per share. |
| (c) | Total return in the above table represents the rate that the investor would have earned or lost on an investment in the Fund, assuming reinvestment of dividends. |
| (e) | The ratios exclude the impact of expenses of the underlying funds in which the Fund invests as represented in the Schedule of Investments. |
| (g) | The portion of the ratios attributable to recoupments for the periods ended March 31, 2020, September 30, 2019, September 30, 2018, September 30, 2017, September 30, 2016, and September 30, 2015 were 0.00%, 0.00% 0.00%, 0.00%, 0.01% and 0.07%, respectively. |
See Notes to Financial Statements.
| 114 | (888) 848-7569 | www.rivernorth.com |
| RiverNorth Funds | Notes to Financial Statements |
March 31, 2020 (Unaudited)
1. ORGANIZATION
The RiverNorth Funds (the “Trust” or “Funds”) was established under the laws of Ohio by an Agreement and Declaration of Trust dated July 18, 2006 (the “Trust Agreement”). The Trust is an open-end management investment company registered under the Investment Company Act of 1940, as amended (the “1940 Act”). The Trust Agreement permits the Board of Trustees (the “Board” or “Trustees”) to authorize and issue an unlimited number of shares of beneficial interest of a separate series without par value. All classes of shares for each of the Funds have identical rights to earnings, assets and voting privileges, except for class-specific expenses and exclusive rights to vote on matters affecting only individual classes. The Funds are considered investment companies and therefore follow the Investment Company accounting and reporting guidance of the Financial Accounting Standards Board (“FASB”) Accounting Standards Codification Topic 946 Financial Services Investment Companies.
The RiverNorth Core Opportunity Fund (the “Core Opportunity Fund”) was organized as a diversified series of the Trust on July 18, 2006 and commenced investment operations on December 27, 2006. The Core Opportunity Fund offers two classes of shares, Class I Shares (inception date of August 11, 2014) and Class R Shares (inception date of December 27, 2006). The investment adviser to the Core Opportunity Fund is RiverNorth Capital Management, LLC (“RiverNorth” or the “Adviser”). The investment objective of the Core Opportunity Fund is to seek long-term capital appreciation and income.
The RiverNorth/DoubleLine Strategic Income Fund (the “Strategic Income Fund”) is a diversified series of the Trust and commenced investment operations on December 30, 2010. The Strategic Income Fund offers two classes of shares, Class I Shares and Class R Shares. The investment adviser to the Strategic Income Fund is RiverNorth. The Strategic Income Fund’s sub-adviser is DoubleLine Capital, LP (“DoubleLine”). The investment objective of the Strategic Income Fund is current income and overall total return.
The RiverNorth/Oaktree High Income Fund (the “High Income Fund”) is a diversified series of the Trust and commenced investment operations on December 28, 2012. The High Income Fund offers two classes of shares, Class I Shares and Class R Shares. The investment adviser to the High Income Fund is RiverNorth. The High Income Fund’s sub-adviser is Oaktree Capital Management, L.P. (“Oaktree Capital,” and with DoubleLine, each a “Sub-Adviser” or collectively, the “Sub-Advisers”). The investment objective of the High Income Fund is overall total return consisting of long-term capital appreciation and income.
2. SIGNIFICANT ACCOUNTING POLICIES
The following is a summary of significant accounting policies followed by the Funds. These policies are in conformity with generally accepted accounting principles in the United States of America (“GAAP”). The financial statements are prepared in accordance with GAAP, which requires management to make estimates and assumptions that affect the reported amounts and disclosures, including the disclosure of contingent assets and liabilities, in the financial statements during the reporting period. Management believes the estimates and security valuations are appropriate; however, actual results may differ from those estimates, and the security valuations reflected in the financial statements may differ from the value the Funds ultimately realize uponsale of the securities. The financial statements have been prepared as of the close of the New York Stock Exchange (“NYSE”) on the fiscal period end of the Funds.
| Semi-Annual Report | March 31, 2020 | 115 |
| RiverNorth Funds | Notes to Financial Statements |
March 31, 2020 (Unaudited)
Security Valuation: The Funds’ assets and other financial instruments are recorded at their estimated fair value as described in Note 3.
Security Transactions and Related Income: The Funds follow industry practice and record security transactions on the trade date basis. The specific identification method is used for determining gains or losses for financial statements and income tax purposes. Dividend income is recorded on the ex-dividend date or for certain foreign securities, when the information becomes available to the Funds, and interest income and expenses are recorded on an accrual basis. Discounts and premiums on securities purchased are amortized or accreted using the effective interest method. Withholding taxes on foreign dividends have been provided for in accordance with the Funds’ understanding of the applicable country’s tax rules and rates. The ability of issuers of debt securities held by the Funds to meet their obligations may be affected by economic and political developments in a specific country or region. Settlement on bank loans transactions may be in excess of seven business days. Interest only stripped mortgage backed securities (“IO Strips”) are securities that receive only interest payments from a pool of mortgage loans. Little to no principal will be received by the Funds upon maturity of an IO Strip. Periodic adjustments are recorded to reduce the cost of the security until maturity, which are included in interest income.
Foreign Currency Translation: The books and records of the Funds are maintained in U.S. dollars. Investment valuations and other assets and liabilities initially expressed in foreign currencies are converted each business day into U.S. dollars based upon current exchange rates. Prevailing foreign exchange rates may generally be obtained at the close of the NYSE (normally, 4:00 p.m. Eastern time). The portion of realized and unrealized gains or losses on investments due to fluctuations in foreign currency exchange rates is not separately disclosed and is included in realized and unrealized gains or losses on investments, when applicable.
Foreign Securities: The Funds may directly purchase securities of foreign issuers. Investing in securities of foreign issuers involves special risks not typically associated with investing in securities of U.S. issuers. The risks include possible revaluation of currencies, the ability to repatriate funds, less complete financial information about companies and possible future adverse political and economic developments. Moreover, securities of many foreign issuers and their markets may be less liquid and their prices more volatile than those of securities of comparable U.S. issuers.
Certain foreign countries impose a capital gains tax which is accrued by the Funds based on the unrealized appreciation, if any, on affected securities. Any accrual would reduce a Fund’s net asset value (“NAV”). The tax is paid when the gain is realized and is included in capital gains tax in the Statements of Operations.
Other:The Funds hold certain investments which pay dividends to their shareholders based upon available funds from operations. It is possible for these dividends to exceed the underlying investments’ taxable earnings and profits resulting in the excess portion of such dividends being designated as a return of capital. Distributions received from investments in securities that represent a return of capital or capital gains are recorded as a reduction of the cost of investments or as a realized gain, respectively.
| 116 | (888) 848-7569 | www.rivernorth.com |
| RiverNorth Funds | Notes to Financial Statements |
March 31, 2020 (Unaudited)
Principal Investment Risks: All mutual funds carry a certain amount of risk. For more information on the related risks of investing in the Funds please refer to the prospectus of each Fund.
Share Valuation: The NAV is generally calculated as of the close of trading on the NYSE (normally 4:00 p.m. Eastern Time) every day the Exchange is open. The NAV is calculated by taking the total value of each Fund’s or class’ assets, subtracting its liabilities, and then dividing by the total number of shares outstanding, rounded to the nearest cent. The offering price and redemption price per share is equal to the NAV per share, except that shares of each Fund were subject to a redemption fee of 2% if redeemed within 90 days of purchase until March 4, 2019 when the redemption fee was eliminated.
Expenses:Some expenses of the Trust can be directly attributed to a Fund or a Fund specific share class. Expenses which cannot be directly attributed are apportioned among all Funds and Fund series classes in the Trust based on average net assets or another method approved by the Board.
Federal Income Taxes: The Funds make no provision for federal income tax. Each Fund intends to qualify each year as a “regulated investment company” under subchapter M of the Internal Revenue Code of 1986, as amended, by distributing substantially all of its taxable income. If the required amount of net investment income is not distributed, the Funds could incur a tax expense.
As of and during the six months ended March 31, 2020, the Funds did not have a liability for any unrecognized tax benefits. The Funds file U.S. federal, state, and local tax returns as required. The Funds’ tax returns are subject to examination by the relevant tax authorities until expiration of the applicable statute of limitations which is generally three years after the filing of the tax return for federal purposes and four years for most state returns. Tax returns for open years have incorporated no uncertain tax positions that require a provision for income taxes.
The Funds recognize interest and penalties, if any, related to unrecognized tax benefits as income tax expenses in the Statements of Operations. During the six months ended March 31, 2020, the Funds did not incur any interest or penalties.
Distributions to Shareholders: Distributions to shareholders, which are determined in accordance with income tax regulations, are recorded on the ex-dividend date. The treatment for financial reporting purposes of distributions made to shareholders during the year from net investment income or net realized capital gains may differ from their ultimate treatment for federal income tax purposes. These differences are caused primarily by differences in the timing of recognition of certain components of income, expense, or realized capital gain for federal income tax purposes. Where such differences are permanent in nature, they are reclassified in the components of the net assets based on their ultimate characterization for federal income tax purposes. Any such reclassification will have no effect on net assets, results of operations or net asset values per share of the Funds.
| Semi-Annual Report | March 31, 2020 | 117 |
| RiverNorth Funds | Notes to Financial Statements |
March 31, 2020 (Unaudited)
3. SECURITIES VALUATION AND FAIR VALUE MEASUREMENTS
Fair value is defined as the price that a Fund might reasonably expect to receive upon selling an investment in a timely transaction to an independent buyer in the principal or most advantageous market of the investment. GAAP establishes a three-tier hierarchy to maximize the use of observable market data and minimize the use of unobservable inputs and to establish classification of fair value measurements for disclosure purposes.
Inputs refer broadly to the assumptions that market participants would use in pricing the asset or liability, including assumptions about risk, for example, the risk inherent in a particular valuation technique used to measure fair value including using such a pricing model and/or the risk inherent in the inputs to the valuation technique. Inputs may be observable or unobservable. Observable inputs are inputs that reflect the assumptions market participants would use in pricing the asset or liability developed based on market data obtained from sources independent of the reporting entity. Unobservable inputs are inputs that reflect the reporting entity’s own assumptions about the assumptions market participants would use in pricing the asset or liability developed based on the best information available in the circumstances.
Various inputs are used in determining the value of the Funds’ investments. These inputs are summarized in the three broad levels listed below.
| | ● | Level 1 – Unadjusted quoted prices in active markets for identical, unrestricted assets or liabilities that a Fund has the ability to access at the measurement date; |
| | ● | Level 2 – Quoted prices which are not active, quoted prices for similar assets or liabilities in active markets or inputs other than quoted prices that are observable (either directly or indirectly) for substantially the full term of the asset or liability; and |
| | ● | Level 3 – Significant unobservable prices or inputs (including the Funds’ own assumptions in determining the fair value of investments) where there is little or no market activity for the asset or liability at the measurement date. |
The inputs used to measure fair value may fall into different levels of the fair value hierarchy. In such cases, for disclosure purposes, the level in the fair value hierarchy within which the fair value measurement falls in its entirety is determined based on the lowest level input that is significant to the fair value measurement in its entirety.
Equity securities, including common stocks, rights and warrants, closed-end funds, exchange-traded funds, preferred stocks and business development companies are generally valued by using market quotations, but may be valued on the basis of prices furnished by a pricing service when the Adviser or a Sub-Adviser believes such prices more accurately reflect the fair market value of such securities. Securities that are traded on any stock exchange are generally valued by the pricing service at the last quoted sale price. Lacking a last sale price, an exchange traded security is generally valued by the pricing service at its last bid price. Securities traded in the NASDAQ over-the-counter market are generally valued by the pricing service at the NASDAQ Official Closing Price. When using the market quotations or close prices provided by the pricing service and when the market is considered active, the security will be classified as a Level 1 security. Sometimes, an equity security owned by the Funds will be valued by the pricing service with factors other than market quotations or when the market is considered inactive. When this happens, the security will be classified as a Level 2 security. When market quotations are not readily available, when the Adviser or a Sub-Adviser determines that the market quotation or the price provided by the pricing service does not accurately reflect the current fair value, or when restricted or illiquid securities are being valued, such securities are valued as determined in good faith by the Adviser, Sub-Adviser, or valuation committee in conformity with guidelines adopted by and subject to review by the Board. These securities will be categorized as Level 3 securities.
| 118 | (888) 848-7569 | www.rivernorth.com |
| RiverNorth Funds | Notes to Financial Statements |
March 31, 2020 (Unaudited)
Investments in mutual funds, including short-term investments and open-end funds, are generally priced at the ending NAV provided by the service agent of the funds. These securities will be categorized as Level 1 securities.
Domestic and foreign fixed income securities, including foreign and U.S. corporate bonds, convertible corporate bonds, U.S. Government bonds and notes, foreign government bonds and notes, supranationals and foreign agencies, non-agency collateralized mortgage obligations, U.S. Government/Agency mortgage backed securities, business development company notes, bank loans, collateralized loan obligations, municipal bonds, and high yield debt, as well as non-exchange traded derivatives, including forward foreign currency contracts, are normally valued on the basis of quotes obtained from brokers and dealers or independent pricing services. Foreign currency positions, including forward foreign currency contracts, are priced at the mean between the closing bid and asked prices at 4:00 p.m. Eastern Time. Prices obtained from independent pricing services typically use information provided by market makers or estimates of market values obtained from yield data relating to investments or securities with similar characteristics. Data used to establish quotes includes analysis of cash flows, pre-payment speeds, default rates, delinquency assumptions and assumptions regarding collateral and loss assumptions. These securities will be classified as Level 2 securities.
Short-term investments in fixed income securities, with maturities of less than 60 days when acquired, or which subsequently are within 60 days of maturity, are valued by using the amortized cost method of valuation, which the Board has determined will represent fair value. These securities will be classified as Level 2 securities.
In accordance with the Funds’ good faith pricing guidelines, the Adviser, Sub-Adviser, or valuation committee is required to consider all appropriate factors relevant to the value of securities for which it has determined other pricing sources are not available or reliable as described above. No single standard exists for determining fair value, because fair value depends upon the circumstances of each individual case. As a general principle, the current fair value of an issue of securities being valued by the Adviser, Sub-Adviser, or valuation committee would appear to be the amount which the owner might reasonably expect to receive for them upon their current sale. Methods which are in accordance with this principle may, for example, be based on (i) a multiple of earnings; (ii) discounted cash flow models; (iii) weighted average cost or weighted average price; (iv) a discount from market of a similar freely traded security (including a derivative security or a basket of securities traded on other markets, exchanges or among dealers); or (v) yield to maturity with respect to debt issues, or a combination of these and other methods. Good faith pricing is permitted if, in the Adviser’s, a Sub-Adviser’s, or the valuation committee’s opinion, the validity of market quotations appears to be questionable based on factors such as evidence of a thin market in the security based on a small number of quotations, a significant event occurs after the close of a market but before a Fund’s NAV calculation that may affect a security’s value, or the Adviser or a Sub-Adviser is aware of any other data that calls into question the reliability of market quotations.
| Semi-Annual Report | March 31, 2020 | 119 |
| RiverNorth Funds | Notes to Financial Statements |
March 31, 2020 (Unaudited)
Good faith pricing may also be used in instances when the bonds in which the Funds invest default or otherwise cease to have market quotations readily available. Investments in foreign securities, junk bonds, or other thinly traded securities are more likely to trigger good faith pricing than other securities.
The following is a summary of the inputs used at March 31, 2020 in valuing the Funds’ assets and liabilities:
Core Opportunity Fund
| | | Valuation Inputs | | | | |
| Investments in Securities at Value* | | Level 1 | | | Level 2 | | | Level 3 | | | Total | |
| Closed-End Funds | | $ | 48,277,514 | | | $ | – | | | $ | – | | | $ | 48,277,514 | |
| Business Development Companies | | | 1,472,632 | | | | – | | | | – | | | | 1,472,632 | |
| Common Stocks | | | 3,190,116 | | | | – | | | | – | | | | 3,190,116 | |
| Exchange Traded Funds | | | 5,106,659 | | | | – | | | | – | | | | 5,106,659 | |
| Preferred Stocks | | | 765,630 | | | | – | | | | – | | | | 765,630 | |
| Business Development Company Notes | | | 892,959 | | | | – | | | | – | | | | 892,959 | |
| Convertible Corporate Bonds | | | – | | | | 875,087 | | | | – | | | | 875,087 | |
| Rights | | | 11,109 | | | | – | | | | – | | | | 11,109 | |
| Warrants | | | 151,641 | | | | – | | | | – | | | | 151,641 | |
| Short-Term Investments | | | 3,297,015 | | | | – | | | | – | | | | 3,297,015 | |
| Total | | $ | 63,165,275 | | | $ | 875,087 | | | $ | – | | | $ | 64,040,362 | |
| 120 | (888) 848-7569 | www.rivernorth.com |
| RiverNorth Funds | Notes to Financial Statements |
March 31, 2020 (Unaudited)
Strategic Income Fund
| | | Valuation Inputs | | | | |
| Investments in Securities at Value* | | Level 1 | | | Level 2 | | | Level 3 | | | Total | |
| Closed-End Funds | | $ | 354,985,870 | | | $ | – | | | $ | – | | | $ | 354,985,870 | |
| Business Development Companies | | | 11,921,879 | | | | – | | | | – | | | | 11,921,879 | |
| Common Stocks | | | 5,926,601 | | | | – | | | | – | | | | 5,926,601 | |
| Open-End Funds | | | 26,520,160 | | | | – | | | | – | | | | 26,520,160 | |
| Preferred Stocks | | | 24,282,731 | | | | – | | | | – | | | | 24,282,731 | |
| Business Development Company Notes | | | 17,445,991 | | | | – | | | | – | | | | 17,445,991 | |
| Foreign Corporate Bonds | | | – | | | | 79,141,015 | | | | – | | | | 79,141,015 | |
| U.S. Corporate Bonds | | | – | | | | 81,561,831 | | | | – | | | | 81,561,831 | |
| Convertible Corporate Bonds | | | – | | | | 9,408,126 | | | | – | | | | 9,408,126 | |
| Foreign Government Bonds and Notes, Supranationals and Foreign Agencies | | | – | | | | 2,824,656 | | | | – | | | | 2,824,656 | |
| Bank Loans | | | – | | | | 19,493,145 | | | | – | | | | 19,493,145 | |
| Collateralized Loan Obligations | | | – | | | | 32,452,214 | | | | – | | | | 32,452,214 | |
| Equity - Linked Notes | | | – | | | | – | | | | 11,250 | | | | 11,250 | |
| Non-Agency Collateralized Mortgage Obligations | | | – | | | | 360,026,777 | | | | – | | | | 360,026,777 | |
| U.S. Government Bonds and Notes | | | – | | | | 101,042,265 | | | | – | | | | 101,042,265 | |
| Municipal Bonds | | | – | | | | 404,559 | | | | – | | | | 404,559 | |
| U.S. Government / Agency Mortgage Backed Securities | | | – | | | | 256,492,777 | | | | – | | | | 256,492,777 | |
| Warrants | | | – | | | | – | | | | – | | | | – | |
| Short-Term Investments | | | 291,935,795 | | | | 184,890 | | | | – | | | | 292,120,685 | |
| Total | | $ | 733,019,027 | | | $ | 943,032,255 | | | $ | 11,250 | | | $ | 1,676,062,532 | |
| Semi-Annual Report | March 31, 2020 | 121 |
| RiverNorth Funds | Notes to Financial Statements |
March 31, 2020 (Unaudited)
High Income Fund
| | | Valuation Inputs | | | | |
| Investments in Securities at Value* | | Level 1 | | | Level 2 | | | Level 3 | | | Total | |
| Closed-End Funds | | $ | 5,227,574 | | | $ | – | | | $ | – | | | $ | 5,227,574 | |
| Common Stocks | | | 210 | | | | – | | | | 15,906 | | | | 16,116 | |
| Preferred Stocks | | | – | | | | – | | | | 95,206 | | | | 95,206 | |
| Bank Loans | | | – | | | | 15,271,907 | | | | – | | | | 15,271,907 | |
| High Yield Debt | | | – | | | | 20,280,140 | | | | – | | | | 20,280,140 | |
| Rights | | | – | | | | – | | | | 198 | | | | 198 | |
| Warrants | | | 2 | | | | – | | | | – | | | | 2 | |
| Short-Term Investments | | | 1,119,238 | | | | – | | | | – | | | | 1,119,238 | |
| Total | | $ | 6,347,024 | | | $ | 35,552,047 | | | $ | 111,310 | | | $ | 42,010,381 | |
| | | Valuation Inputs | | | | |
| Other Financial Instruments** | | Level 1 | | | Level 2 | | | Level 3 | | | Total | |
| Assets | | | | | | | | | | | | |
| Forward Foreign Currency Contracts | | $ | – | | | $ | 163,286 | | | $ | – | | | $ | 163,286 | |
| Liabilities | | | | | | | | | | | | | | | | |
| Forward Foreign Currency Contracts | | $ | – | | | $ | (5,399 | ) | | $ | – | | | $ | (5,399 | ) |
| Total | | $ | – | | | $ | 157,887 | | | $ | – | | | $ | 157,887 | |
| * | Refer to each Fund’s Schedule of Investments for a listing of securities by type. |
| ** | Other financial instruments are derivative instruments reflected in the Schedule of Investments. |
| 122 | (888) 848-7569 | www.rivernorth.com |
| RiverNorth Funds | Notes to Financial Statements |
March 31, 2020 (Unaudited)
The changes of the fair value of investments for which the Funds have used Level 3 inputs to determine the fair value are as follows:
| Asset Type | | Balance
as of
September
30, 2019 | | | Accrued
Discount/
premium | | | Realized
Gain/
(Loss) | | | Change in
Unrealized
Appreciation/
Deperciation | | | Purchases | | | Sales
Proceeds | | | Transfer
into
Level 3 | | | Transfer
Out of
Level 3 | | | Balance
as of
March 31,
2020 | | | Net change in unrealized
appreciation/ (depreciation)
included in the Statements
of Operations attributable
to Level 3 investments held
at March 31, 2020 | |
| Strategic Income Fund | | | | | | | | | | | | | | | | | | | | | | | | | | | | | | |
| U.S. Corporate Bonds | | $ | 5,050,000 | | | $ | 2,583 | | | $ | – | | | $ | 125,031 | | | $ | – | | | $ | – | | | $ | – | | | $ | (5,177,614 | ) | | $ | – | | | $ | – | |
| Equity-Linked Notes | | | 11,250 | | | | – | | | | – | | | | – | | | | – | | | | – | | | | – | | | | – | | | | 11,250 | | | | – | |
| | | $ | 5,061,250 | | | $ | 2,583 | | | $ | – | | | $ | 125,031 | | | $ | – | | | $ | – | | | $ | – | | | $ | (5,177,614 | ) | | $ | 11,250 | | | $ | – | |
| | | | | | | | | | | | | | | | | | | | | | | | | | | | | | | | | | | | | | | | | |
| High Income Fund | | | | | | | | | | | | | | | | | | | | | | | | | | | | | | | | | | | | | | | | |
| Preferred Stocks | | $ | 92,000 | | | $ | – | | | $ | – | | | $ | (13,775 | ) | | $ | 16,981 | | | $ | – | | | $ | – | | | $ | – | | | $ | 95,206 | | | $ | (13,775 | ) |
| Bank Loans | | | 20,361 | | | | (443 | ) | | | – | | | | 46,908 | | | | – | | | | (66,826 | ) | | | – | | | | – | | | | – | | | | – | |
| Common Stocks | | | 30,185 | | | | – | | | | 620 | | | | (166,179 | ) | | | 152,982 | | | | (1,702 | ) | | | – | | | | – | | | | 15,906 | | | | (166,179 | ) |
| High Yield Debt | | | – | | | | 2,463 | | | | (45,531 | ) | | | 43,295 | | | | – | | | | (227 | ) | | | – | | | | – | | | | – | | | | – | |
| Warrants | | | 3,714 | | | | – | | | | 1,352 | | | | (1,352 | ) | | | – | | | | (3,714 | ) | | | – | | | | – | | | | – | | | | (28,912 | ) |
| Rights | | | – | | | | – | | | | – | | | | (11,033 | ) | | | 11,231 | | | | – | | | | – | | | | – | | | | 198 | | | | (11,033 | ) |
| | | $ | 146,260 | | | $ | 2,020 | | | $ | (43,559 | ) | | $ | (102,136 | ) | | $ | 181,194 | | | $ | (72,469 | ) | | $ | – | | | $ | – | | | $ | 111,310 | | | $ | (219,899 | ) |
The table below provides additional information about the Level 3 Fair Value Measurements as of March 31, 2020:
Quantitative Information about Level 3 Fair Value Measurements
Strategic Income Fund
| Asset Class | Fair Value (USD) | ValuationTechnique | Unobservable Inputs(a) | Value/Range (Weighted Average) |
| Equity-Linked Note | 11,250 | Vendor Price | Broker Quote | N/A |
High Income Fund
| Asset Class | Fair Value (USD) | Valuation
Technique | Unobservable Inputs(a) | Value/Range
(Weighted Average) |
| Preferred Stocks | $95,206 | Last Transaction Price | Transaction Price | N/A |
| Common Stocks | 15,906 | Vendor Price | Broker Quote | N/A |
| Rights | 198 | Vendor Price | Broker Quote | N/A |
| (a) | A change to the unobservable input may result in a significant change to the value of the investment as follows: |
| Unobservable Inputs | Impact to Value if Input Increases | Impact to Value if Input Decreases |
| Broker Quote | Increase | Decrease |
| Transaction Price | Increase | Decrease |
| Semi-Annual Report | March 31, 2020 | 123 |
| RiverNorth Funds | Notes to Financial Statements |
March 31, 2020 (Unaudited)
4. DERIVATIVE FINANCIAL INSTRUMENTS
The following discloses the Funds’ use of derivative instruments. The Funds’ investment objectives not only permit the Funds to purchase investment securities, they also allow the Funds to enter into various types of derivative contracts such as forward foreign currency contracts. In doing so, the Funds will employ strategies in differing combinations to permit them to increase, decrease, or change the level or types of exposure to market factors. Central to those strategies are features inherent to derivatives that make them more attractive for this purpose than equity or debt securities; they require little or no initial cash investment, they can focus exposure on only certain selected risk factors, and they may not require the ultimate receipt or delivery of the underlying security (or securities) to the contract. This may allow the Funds to pursue their objectives more quickly and efficiently than if they were to make direct purchases or sales of securities capable of affecting a similar response to market factors.
Market Risk Factors: In pursuit of their investment objectives, the Funds may seek to use derivatives to increase or decrease their exposure to the following market risk factors:
Foreign Exchange Rate Risk: Foreign exchange rate risk relates to the change in the U.S. dollar value of a security held that is denominated in a foreign currency. The value of a foreign currency denominated security will decrease as the dollar appreciates against the currency, while the value of the foreign currency denominated security will increase as the dollar depreciates against the currency.
Risk of Investing in Derivatives
The Funds’ use of derivatives can result in losses due to unanticipated changes in the market risk factors and the overall market. Derivatives may have little or no initial cash investment relative to their market value exposure and therefore can produce significant gains or losses in excess of their cost. This use of embedded leverage allows the Funds to increase their market value exposure relative to their net assets and can substantially increase the volatility of the Funds’ performance.
Additional associated risks from investing in derivatives also exist and potentially could have significant effects on the valuation of the derivative and the Funds. Typically, the associated risks are not the risks that the Funds are attempting to increase or decrease exposure to, per their investment objectives, but are the additional risks from investing in derivatives.
Examples of these associated risks are liquidity risk, which is the risk that the Funds will not be able to sell the derivative in the open market in a timely manner, and counterparty credit risk, which is the risk that the counterparty will not fulfill its obligation to the Funds.
Forward Foreign Currency Contracts
The Funds may engage in currency transactions with counterparties to hedge the value of portfolio securities denominated in particular currencies against fluctuations in relative value, to gain or reduce exposure to certain currencies, or to generate income or gains. A forward foreign currency contract is an agreement between two parties to buy and sell a currency at a set price on a future date. During the six months ended March 31, 2020, the High Income Fund engaged in forward foreign currency contracts. The contracts are marked-to-market daily and the change in value is recorded by the High Income Fund as an unrealized gain or loss. When a forward foreign currency contract is extinguished, through either delivery or offset by entering into another forward foreign currency contract, the High Income Fund records a realized gain or loss equal to the difference between the value of the contract at the time it was opened and the value of the contract at the time it was extinguished.
| 124 | (888) 848-7569 | www.rivernorth.com |
| RiverNorth Funds | Notes to Financial Statements |
March 31, 2020 (Unaudited)
Forward foreign currency contracts involve elements of market risk in excess of the amounts reflected in the Statement of Assets and Liabilities. The High Income Fund bears the risk of an unfavorable change in the foreign exchange rate underlying the forward foreign currency contract. Risks may also arise upon entering into these contracts from the potential inability of the counterparties to meet the terms of their contracts.
If required by the forward foreign currency contracts, the High Income Fund has segregated sufficient assets as collateral to satisfy the current obligations with respect to forward foreign currency contracts, and this is reflected as Cash segregated at custodian for forward foreign currency contracts on the High Income Fund’s Statement of Assets and Liabilities.
The effect of derivatives instruments on each Fund's Statement of Assets and Liabilities as of March 31, 2020:
| | | | | Asset Derivatives | |
| Fund | | Risk Exposure | | Statement of Assets
and Liabilities Location | | | Fair Value | |
| High Income Fund | | Foreign exchange rate risk (Forward foreign currency contracts) | | Unrealized appreciation on forward foreign currency contracts | | $ | 163,286 | |
| | | | | Liabilities Derivatives | |
| Fund | | Risk Exposure | | Statement of Assets
and Liabilities Location | | | Fair Value | |
| High Income Fund | | Foreign exchange rate risk (Forward foreign currency contracts) | | Unrealized depreciation on forward foreign currency contracts | | $ | (5,399 | ) |
| Semi-Annual Report | March 31, 2020 | 125 |
| RiverNorth Funds | Notes to Financial Statements |
March 31, 2020 (Unaudited)
The effect of derivatives instruments on each Fund's Statement of Operations for the six months ended March 31, 2020:
| Fund | | | Risk Exposure | | Statement of Operations
Location | | Realized
Gain/(Loss)
on
Derivatives
Recognized
in Income | | | Change in
Unrealized
Appreciation/
(Depreciation)
on Derivatives
Recognized in
Income | |
| High Income Fund | | | Foreign exchange rate risk (Forward foreign currency contracts) | | Net realized gain/(loss) on Forward Foreign Currency Contracts/ Net change in unrealized appreciation/ depreciation on Forward Foreign Currency Contracts | | $ | (41,904 | ) | | $ | 56,170 | |
The forward currency contracts average notional amount during the six months ended March 31, 2020, is noted below.
| Fund | | Average Notional Amount of Forward
Foreign Currency Contracts | |
| High Income Fund | | $ | 7,523,099 | |
Offsetting Arrangements: Certain derivative contracts are executed under standardized netting agreements. A derivative netting arrangement creates an enforceable right of set-off that becomes effective, and affects the realization of settlement on individual assets, liabilities and collateral amounts, only following a specified event of default or early termination. Default events may include the failure to make payments or deliver securities timely, material adverse changes in financial condition or insolvency, the breach of minimum regulatory capital requirements, or loss of license, charter or other legal authorization necessary to perform under the contract. These agreements mitigate counterparty credit risk by providing for a single net settlement with a counterparty of all financial transactions covered by the agreement in an event of default as defined under such agreement.
| 126 | (888) 848-7569 | www.rivernorth.com |
| RiverNorth Funds | Notes to Financial Statements |
March 31, 2020 (Unaudited)
The following table presents derivative financial instruments that are subject to enforceable netting arrangements, collateral arrangements or other similar agreements as of March 31, 2020.
Offsetting of Derivatives Asset
| | | | | | | | | | | | Gross
Amounts Not
Offset in the
Statements
of Assets
and
Liabilities | |
| | | Gross
Amounts of
Recognized
Assets | | | Gross
Amounts
Offset in the
Statements
of Assets
and
Liabilities | | | Net Amounts
Presented in
the
Statements
of Assets
and
Liabilities | | | Financial
Instruments
Available for
Offset(a) | | | Cash
Collateral
Received(a) | | | Net Amount | |
| High Income Fund | | | | | | | | | | | | | | | | | | |
| Forward Foreign Currency Contracts | | $ | 163,286 | | | $ | – | | | $ | 163,286 | | | $ | (5,399 | ) | | $ | – | | | $ | 157,887 | |
| Total | | $ | 163,286 | | | $ | – | | | $ | 163,286 | | | $ | (5,399 | ) | | $ | – | | | $ | 157,887 | |
Offsetting of Derivatives Liability
| | | | | | | | | | | | Gross
Amounts Not
Offset in the
Statement of
Assets and
Liabilities | |
| | | Gross
Amounts of
Recognized
Liabilities | | | Gross
Amounts
Offset in the
Statement
of Assets
and
Liabilities | | | Net Amounts
Presented in
the
Statement of
Assets and
Liabilities | | | Financial
Instruments
Available for
Offset(a) | | | Cash
Collateral
Pledged(a) | | | Net Amount | |
| High Income Fund | | | | | | | | | | | | | | | | | | |
| Forward Foreign Currency Contracts | | $ | 5,399 | | | | | | | $ | 5,399 | | | $ | (5,399 | ) | | $ | – | | | $ | – | |
| Total | | $ | 5,399 | | | $ | – | | | $ | 5,399 | | | $ | (5,399 | ) | | $ | – | | | $ | – | |
| (a) | These amounts are limited to the derivatives asset/liability balance and, accordingly, do not include excess collateral received/pledged. |
| Semi-Annual Report | March 31, 2020 | 127 |
| RiverNorth Funds | Notes to Financial Statements |
March 31, 2020 (Unaudited)
5. LOAN PARTICIPATIONS AND ASSIGNMENTS
The Strategic Income Fund and High Income Fund may each invest in direct debt instruments which are interests in amounts owed to lenders or lending syndicates by corporate, governmental, or other borrowers. The Strategic Income Fund and High Income Fund will normally invest in corporate debt issuers in North America and Europe. The Strategic Income Fund’s and High Income Fund’s investments in loans may be in the form of participations in loans or assignments of all or a portion of loans from third parties. A loan is often administered by a bank or other financial institution (the “lender”) that acts as agent for all holders. The agent administers the terms of the loan, as specified in the loan agreement. The Strategic Income Fund and High Income Fund may each invest in multiple series or tranches of a loan, which may have varying terms and carry different associated risks. The Strategic Income Fund and High Income Fund will generally purchase assignments of these loans, in which case they will typically become lenders for purposes of the relevant loan agreement with direct contractual rights against the borrower, including the right to receive payments of principal and interest. When purchasing participation interests in a loan, the Strategic Income Fund and High Income Fund generally have no right to enforce compliance with the terms of the loan agreement with the borrower. As a result, the Strategic Income Fund and High Income Fund may each be subject to the credit risk of both the borrower and the lender that is selling the loan agreement. The Strategic Income Fund and High Income Fund may each enter into unfunded loan commitments, which are contractual obligations for future funding. Unfunded loan commitments represent a future obligation in full, even though a percentage of the notional loan amounts may not be utilized by the borrower. When investing in a loan participation, the Strategic Income Fund and High Income Fund have the right to receive payments of principal, interest and any fees to which they are entitled only from the lender selling the loan agreement and only upon receipt of payments by the lender from the borrower. The Strategic Income Fund and High Income Fund may each receive a commitment fee based on the undrawn portion of the underlying line of credit portion of a floating rate loan. In certain circumstances, the Strategic Income Fund and High Income Fund may each receive a penalty fee upon the prepayment of a floating rate loan by a borrower. Fees earned are recorded as a component of interest income or interest expense, respectively, on the Statements of Operations. At March 31, 2020, the High Income Fund had $764,584 in unsettled domestic and foreign loan commitments.
6. ADVISORY FEES, TRUSTEE FEES AND OTHER AGREEMENTS
The Adviser serves as the investment adviser to the Funds. Under the terms of the management agreement (the “Agreement”), the Adviser, subject to the supervision of the Board, provides or arranges to be provided to the Funds such investment advice as it deems advisable and will furnish or arrange to be furnished a continuous investment program for the Funds consistent with the Funds’ investment objectives and policies. As compensation for its management services, the Funds are obligated to pay the Adviser a fee computed and accrued daily and paid monthly in arrears at an annual rate of the average daily net assets of the Funds.
The Chief Compliance Officer (“CCO”) of the Funds is an affiliate of the Funds. For the six months ended March 31, 2020, the total related amounts paid by the Funds for CCO fees are included in Compliance expenses on each Fund’s Statement of Operations.
| 128 | (888) 848-7569 | www.rivernorth.com |
| RiverNorth Funds | Notes to Financial Statements |
March 31, 2020 (Unaudited)
The following table reflects the Funds’ contractual management fee rates (expressed as an annual rate).
| Fund | Contractual Management Fee |
| Core Opportunity Fund | 1.00% |
| Strategic Income Fund | 0.75% |
| High Income Fund | 1.00% |
The Adviser has contractually agreed to waive the High Income Fund’s management fees and/or reimburse expenses (excluding brokerage fees and commissions; borrowing costs such as (a) interest and (b) dividends on securities sold short; taxes; indirect expenses incurred by the underlying funds in which the Fund invests; and extraordinary expenses) of the High Income Fund until at least January 31, 2021 in order to maintain the Total Annual Fund Operating Expenses After Fee Deferral and/or Reimbursement at 1.60% and 1.35% for the Class R shares and Class I shares, respectively. This agreement may be terminated by the Board on 60 days’ written notice to the Adviser. Any waiver or reimbursement is subject to repayment by the High Income Fund within three years following the fiscal year in which the expenses occurred if the Fund is able to make the repayment without exceeding its current expense limitation and the repayment is approved by the Board.
As of the year ended September 30, 2019, reimbursed expenses for the High Income Fund subject to potential recovery by year of expiration are as follows:
| | Expiring September 30, | |
| | 2021 | | | 2022 | | | 2023 | |
| High Income Fund | | | | | | | | | |
| Class I | | $ | 98,502 | | | $ | 104,992 | | | $ | 70,207 | |
| Class R | | $ | 13,126 | | | $ | 13,864 | | | $ | 9,303 | |
| Total | | $ | 111,628 | | | $ | 111,856 | | | $ | 79,510 | |
For the six months ended March 31, 2020, the Adviser waived $87,122 in management fees attributable to the Strategic Income Fund related to the Fund’s investment in an affiliate fund, the High Income Fund. The Investment Adviser Fee disclosed on the Strategic Income Fund’s Statement of Operations is reflective of this waiver of affiliated management fees.
DoubleLine is the investment sub-adviser to the Strategic Income Fund. Oaktree Capital is the investment sub-adviser to the High Income Fund. Under the terms of the sub-advisory agreements, the Sub-Advisers, subject to the supervision of the Adviser and the Board of Trustees, provide to the Strategic Income Fund and the High Income Fund such investment advice as deemed advisable and will furnish a continuous investment program for the portion of assets managed in the respective Fund consistent with the respective Fund’s investment objective and policies. As compensation for its sub-advisory services, the Adviser, out of its own fee, is obligated to pay each Sub-Adviser a fee computed and accrued daily and paid monthly in arrears based on an annual rate of the average daily net assets of the Strategic Income Fund and the High Income Fund.
| Semi-Annual Report | March 31, 2020 | 129 |
| RiverNorth Funds | Notes to Financial Statements |
March 31, 2020 (Unaudited)
ALPS Fund Services, Inc. (“ALPS”) provides the Funds with fund administration and fund accounting services. ALPS also serves as transfer agent, dividend paying and shareholder servicing agent for the Funds (“Transfer Agent”).
State Street Bank & Trust, Co. serves as the Funds’ custodian.
The Funds have adopted a plan pursuant to Rule 12b-1 under the 1940 Act (the “Plan”). The Plan permits the Funds to pay the Adviser for distribution and promotion expenses related to marketing shares of the Funds. The amount payable annually by the Class R shares of the Core Opportunity Fund, the Class R Shares of the Strategic Income Fund, and the Class R Shares of the High Income Fund is 0.25% of the average daily net assets. Under the Plan the Trust may engage in any activities related to the distribution of Fund shares. The expenses of the Funds’ Plan are reflected as 12b-1 fees in the Statements of Operations.
The Funds have entered into a Distribution Agreement with ALPS Distributors, Inc. (“the Distributor”), an affiliate of ALPS, to provide distribution services to the Funds. The Distributor serves as underwriter/distributor of shares of the Funds.
Officers of the Trust and Trustees who are “interested persons” of the Trust or the Adviser received no salary or fees from the Trust. Each Trustee who is not an “interested person” receives a fee of $36,000 per year, plus $1,500 per meeting attended from the Trust. In addition, the chair of the audit committee receives $500 annually and the lead independent Trustee receives $250 annually. The Trust reimburses each Trustee and Officer for his or her travel and other expenses relating to attendance at such meetings. The Trustees are also compensated for their services as independent directors of other funds within the fund complex.1
A Trustee and certain Officers of the Trust are also employees of the Adviser, the Distributor or ALPS.
| 1 | The Fund Complex consists of the RiverNorth Core Opportunity Fund, the RiverNorth/DoubleLine Strategic Income Fund, and the RiverNorth/Oaktree High Income Fund, each a series of RiverNorth Funds, and the RiverNorth Opportunities Fund, Inc., RiverNorth/DoubleLine Strategic Opportunity Fund, Inc., the RiverNorth Specialty Finance Corporation, RiverNorth Opportunistic Municipal Income Fund, Inc., RiverNorth Managed Duration Municipal Income Fund, Inc., and RiverNorth Flexible Municipal Income Fund, Inc. |
7. TAX BASIS INFORMATION
Tax Basis of Distributions to Shareholders:The character of distributions made during the year from net investment income or net realized gains may differ from its ultimate characterization for federal income tax purposes. Also, due to the timing of dividend distributions, the fiscal year in which amounts are distributed may differ from the fiscal year in which the income or realized gain were recorded by a Fund.
| 130 | (888) 848-7569 | www.rivernorth.com |
| RiverNorth Funds | Notes to Financial Statements |
March 31, 2020 (Unaudited)
The tax character of distributions paid by the Funds during the fiscal year ended September 30, 2019, was as follows:
| | | Ordinary Income | | | Tax-Exempt Income | | | Distributions paid from Long-Term Capital Gain | | | Return of Capital | | | Total | |
| Core Opportunity Fund | | $ | 5,255,331 | | | $ | 189,479 | | | $ | 27,644,230 | | | $ | – | | | $ | 33,089,040 | |
| Strategic Income Fund | | | 101,073,877 | | | | – | | | | – | | | | – | | | | 101,073,877 | |
| High Income Fund | | | 2,635,911 | | | | – | | | | – | | | | – | | | | 2,635,911 | |
Components of Distributable Earnings on a Tax Basis:The tax components of distributable earnings are determined in accordance with income tax regulations which may differ from the composition of net assets reported under GAAP. Accordingly, for the year ended September 30, 2019, certain differences were reclassified. The amounts reclassified did not affect net assets. The reclassifications were as follows:
| | | | Paid-in Capital | | | Total Distributable Earnings | |
| Core Opportunity Fund | | | $ | (46,875 | ) | | $ | 46,875 | |
| Strategic Income Fund | | | | (362,739 | ) | | | 362,739 | |
| High Income Fund | | | | (25,002 | ) | | | 25,002 | |
At September 30, 2019, the components of distributable earnings on a tax basis for the Funds were as follows:
| | | Undistributed Ordinary Income | | | Accumulated Capital Gains/(Losses) | | | Net Unrealized Appreciation/ (Depreciation) | | | Other Cumulative Effect of Timing Differences | | | Total | |
| Core Opportunity Fund | | $ | 176,274 | | | $ | – | | | $ | 4,547,805 | | | $ | – | | | $ | 4,724,079 | |
| Strategic Income Fund | | | 229,488 | | | | (69,035,490 | ) | | | (30,026,055 | ) | | | – | | | | (98,832,057 | ) |
| High Income Fund | | | 365,328 | | | | (4,145,544 | ) | | | (634,532 | ) | | | (101,717 | ) | | | (4,516,465 | ) |
Capital Losses:As of March 31, 2020, the following Funds had capital loss carryforwards which may reduce the applicable Fund’s taxable income arising from future net realized gains on investments, if any, to the extent permitted by the Code and thus may reduce the amount of the distributions to shareholders which would otherwise be necessary to relieve the Funds of any liability for federal tax pursuant to the Code. The capital loss carryforwards may be carried forward indefinitely.
| Semi-Annual Report | March 31, 2020 | 131 |
| RiverNorth Funds | Notes to Financial Statements |
March 31, 2020 (Unaudited)
Capital losses carried forward were as follows:
| Fund | | Non-Expiring
Short-Term | | | Non-Expiring
Long-Term | |
| Strategic Income Fund | | $ | 1,501,663 | | | $ | 8,076,781 | |
| High Income Fund | | | 813,679 | | | | 2,785,464 | |
The Strategic Income Fund and the High Income Fund have elected to defer to the year ending September 30, 2020, capital losses recognized during the period November 1, 2018 to September 30, 2019, in the amount of $59,457,046 and $546,401.
Unrealized Appreciation and Depreciation on Investments:The amount of net unrealized appreciation/(depreciation) and the cost of investment securities for tax purposes, including short- term securities at March 31, 2020, were as follows:
| Fund | | | Gross Appreciation (excess of value over tax) | | | Gross Depreciation (excess of tax cost over value) | | | Net Unrealized Appreciation/ (Depreciation) | | | Cost of Investments for Income Tax Purposes | |
| Core Opportunity Fund* | | | $ | 1,440,521 | | | $ | (21,306,917 | ) | | $ | (19,866,396 | ) | | $ | 83,906,758 | |
| Strategic Income Fund* | | | | 53,394,657 | | | | (268,309,473 | ) | | | (214,914,816 | ) | | | 1,890,977,348 | |
| High Income Fund* | | | | 273,060 | | | | (7,173,378 | ) | | | (6,900,318 | ) | | | 49,068,586 | |
| * | The difference between book and tax basis unrealized appreciation/(depreciation) for the Funds is attributable primarily to passive foreign investment companies, wash sales, forward contract mark to market, and tax treatment of certain other investments. |
8. INVESTMENT TRANSACTIONS
Investment transactions for the six months ended March 31, 2020, excluding U.S. Government Obligations and short-term investments, were as follows:
| Fund | | | Purchases of Securities | | | Proceeds from Sales of Securities | |
| Core Opportunity Fund | | | $ | 49,746,823 | | | $ | 71,475,956 | |
| Strategic Income Fund | | | | 515,612,978 | | | | 632,876,007 | |
| High Income Fund | | | | 20,763,804 | | | | 18,874,009 | |
Investment Transactions in long term U.S. Government Obligations for the six months ended March 31, 2020 were as follows:
| Fund | | | Purchases of Securities | | | Proceeds from Sales of Securities | |
| Strategic Income Fund | | | | 81,426,339 | | | | 259,150,062 | |
| 132 | (888) 848-7569 | www.rivernorth.com |
| RiverNorth Funds | Notes to Financial Statements |
March 31, 2020 (Unaudited)
9. INVESTMENTS IN AFFILIATED COMPANIES
The Funds may invest in certain securities that are considered securities issued by affiliated companies. As defined by the 1940 Act, an affiliated person, including an affiliated company, is one in which a Fund owns 5% or more of the outstanding voting securities, or a company which is under common ownership or control with the Fund. The purchases, sales, dividend income, capital gains, shares and value of investment in affiliated companies for the six months ended March 31, 2020 were as follows:
Strategic Income Fund
| Security Name | | Market Value
as of
September
30, 2019 | | Purchases | | Sales | | Realized
Gain/Loss | | Change in
Unrealized
Gain (Loss) | | Market
Value as of
March 31,
2020 | | Share
Balance as
of March 31,
2020 | | Dividends |
| RiverNorth/Oaktree High Income Fund | | $ | 30,156,442 | | | $ | 728,680 | | | $ | – | | | $ | – | | | $ | (4,364,962 | ) | | $ | 26,520,160 | | | | 3,235,981 | | | $ | 841,907 | |
| | | | | | | | | | | | | | | | | | | | | | | $ | 26,520,160 | | | | 3,235,981 | | | $ | 841,907 | |
10. REVOLVING LINE OF CREDIT
On April 8, 2014, the Funds entered into a $100,000,000 committed, unsecured Revolving Credit Agreement with State Street Bank & Trust, Co. The Revolving Credit Agreement was amended on April 17, 2015, April 5, 2016, April 4, 2017, April 3, 2018, April 2, 2019 and on March 31, 2020. The Revolving Credit Agreement expires on March 30, 2021. Borrowings under this arrangement bear interest at the higher of the Federal Funds Rate and the One-Month LIBOR Rate in effect on the day the loan is made plus 1.25%, which is 1.42% at March 31, 2020. From October 1, 2019 through March 31, 2020, the Funds paid a facility fee on unloaned balances equal to the product of $100,000,000 less the principal amount of loans outstanding and 0.25%.
For the six months ended March 31, 2020, the Funds had no borrowings under the Revolving Credit Agreement.
| Semi-Annual Report | March 31, 2020 | 133 |
| RiverNorth Funds | Notes to Financial Statements |
March 31, 2020 (Unaudited)
11. BENEFICIAL OWNERSHIP
On March 31, 2020, there were an unlimited number of no par value shares of beneficial interest authorized for each Fund. Transactions in shares of beneficial interest are shown in the Statements of Changes in Net Assets.
The beneficial ownership, either directly or indirectly, of more than 25% of the voting securities of a fund creates a presumption of control of the fund, under Section 2(a)(9) of the Investment Company Act of 1940. Beneficial owners owning more than 25% of the voting securities for the benefit of their customers of each class of each Fund, as of March 31, 2020, are listed below:
| Fund | Shareholder Name | Percentage Interest |
| Core Opportunity Fund – Class I | Pershing | 27.88% |
| Core Opportunity Fund – Class R | Charles Schwab & Company, Inc. | 37.31% |
| Strategic Income Fund – Class I | Charles Schwab & Company, Inc. | 38.54% |
| Strategic Income Fund – Class R | Charles Schwab & Company, Inc. | 42.90% |
| High Income Fund – Class I | RiverNorth/DoubleLine Strategic Income Fund | 72.58% |
| High Income Fund – Class R | Charles Schwab & Company, Inc. | 54.39% |
12. INDEMNIFICATIONS
Under the Trust’s organizational documents, its officers and Trustees are indemnified against certain liability arising out of the performance of their duties to the Trust. Additionally, in the normal course of business, the Trust enters into contracts with service providers that may contain general indemnification clauses. The Trust’s maximum exposure under these arrangements is unknown, as this would involve future claims that may be made against the Trust that have not yet occurred.
13. LIBOR TRANSITION
Certain of the Funds’ investments, payment obligations and financing terms may be based on floating rates, such as LIBOR, Euro Interbank Offered Rate and other similar types of reference rates (each, a “Reference Rate”). On July 27, 2017, the Chief Executive of the UK Financial Conduct Authority (“FCA”), which regulates LIBOR, announced that the FCA will no longer persuade nor compel banks to submit rates for the calculation of LIBOR and certain other Reference Rates after 2021. Such announcement indicates that the continuation of LIBOR and other Reference Rates on the current basis cannot and will not be guaranteed after 2021. The transition away from Reference Rates may lead to increased volatility and illiquidity in markets that are tied to such Reference Rates and reduced values of Reference Rate-related instruments. This announcement and any additional regulatory or market changes that occur as a result of the transition away from Reference Rates may have an adverse impact on a Fund’s investments, performance or financial condition.
| 134 | (888) 848-7569 | www.rivernorth.com |
| RiverNorth Funds | Notes to Financial Statements |
March 31, 2020 (Unaudited)
14. CORONAVIRUS (COVID-19) PANDEMIC
A recent outbreak of respiratory disease caused by a novel coronavirus was first detected in December 2019 and has spread internationally. The outbreak and efforts to contain its spread have resulted in closing borders and quarantines, restricting international and domestic travel, enhanced health screenings, cancelations, disrupted supply chains and customer activity, responses by businesses (including changes to operations and reducing staff), and have produced general concern and uncertainty. The impact of the coronavirus pandemic, and other epidemics and pandemics that may arise in the future could adversely affect national and global economies, individual companies and the market in general in a manner and for a period of time that cannot be foreseen at the present time and may adversely affect the value, volatility and liquidity of dividend and interest paying securities. In the event of a pandemic or an outbreak, there can be no assurance that the Funds and their service providers will be able to maintain normal business operations for an extended period of time or will not lose the services of key personnel on a temporary or long-term basis due to illness or other reasons, and could otherwise disrupt the ability of the Funds’ service providers to perform essential services. Certain economic and market conditions arising out of a pandemic or outbreak could result in a Fund’s inability to achieve its investment objectives, cause the postponement of reconstitution or rebalance dates for benchmark indices, adversely affect the prices and liquidity of the securities and other instruments in which a Fund invests, negatively impact a Fund’s performance, and cause losses on your investment in a Fund. Management is monitoring the development of the pandemic, which was ongoing as of the date of the financial statements, and is evaluating its impact on the financial position and operating results of the Funds.
15. SUBSEQUENT EVENTS
On April 6, 2020, the Board approved a change to the initial minimum investment amount for the Institutional Share Class for the RiverNorth Core Opportunity Fund. Effective on April 24, 2020, the minimum initial investment amount for the Fund’s Institutional Share Class was reduced from $5,000,000 to $100,000.
The Funds have performed an evaluation of subsequent events through the date the financial statements were issued and has determined that no additional items require recognition or disclosure.
| Semi-Annual Report | March 31, 2020 | 135 |
| RiverNorth Funds | Notes to Financial Statements |
March 31, 2020 (Unaudited)
PROXY VOTING GUIDELINES
A description of the policies and procedures that the Funds used to determine how to vote proxies relating to portfolio securities and information regarding how the Funds voted proxies during the most recent 12-month period ended June 30, are available without charge upon request by (1) calling the Funds at (888) 848-7569 and (2) from Form N-PX filed by the Funds with the Securities and Exchange Commission (“SEC”) on the SEC’s website at www.sec.gov.
PORTFOLIO HOLDINGS DISCLOSURE POLICY
The Funds file a complete schedule of investments with the SEC for the first and third quarter of each fiscal year on Part F of N-PORT. The Funds’ first and third fiscal quarters end on December 31 and June 30. The Form N-PORT (and its predecessor Form, Form N-Q) must be made within 60 days of the end of the quarter. The Funds’ Form N-PORT is available on the SEC’s website at www.sec.gov. You may also obtain copies by calling the Funds at 1-888-848-7569.
| 136 | (888) 848-7569 | www.rivernorth.com |
| RiverNorth Funds | Board Considerations Regarding Approval of
Investment Advisory and Sub-Advisory Agreements |
March 31, 2020 (Unaudited)
RENEWAL OF MANAGEMENT AGREEMENT AND SUB-ADVISORY AGREEMENTS
Consideration and Renewal of Investment Advisory Agreements with RiverNorth Capital Management, LLC
At an in-person meeting of the Board, held on November 13, 2019 and called expressly for that purpose, the Board, including a majority of the Trustees who are not “interested persons” (as defined in the 1940 Act (the “Independent Trustees”)), considered the renewal of the Management Agreement between the RiverNorth Capital Management, LLC (“RiverNorth” or the “Adviser”) and the Trust. The Board received materials compiled by the Adviser and the Funds’ administrator, including a copy of the Management Agreement, the Adviser’s response to a questionnaire regarding the Adviser’s profitability, management and operations, a copy of the Adviser’s Form ADV, certifications regarding the Adviser’s compliance programs and information regarding the performance of Funds’ benchmark indices and peer funds. Prior to the in-person Board meeting held on November 13, 2019, the Independent Trustees held a special meeting via teleconference to discuss the materials.
The Renewal Materials included a copy of the Management Agreement, the Adviser’s response to a questionnaire regarding the Adviser’s profitability, management and operations, the Adviser’s Form ADV and a third party comparison report regarding the Funds’ performance and fees compared to benchmark indices and peer funds. Counsel referred the Trustees to the Renewal Materials and reviewed a memorandum from Counsel regarding the Trustees’ duties in considering the approval of advisory agreements. The Board considered the following factors, among others, in reaching its determination to renew the Management Agreement: (i) the investment performance of the Funds and the investment performance of the Adviser, (ii) the nature, extent and quality of the services provided by the Adviser to the Funds, (iii) the experience and qualifications of the personnel providing such services (iv) the costs of the services provided and the profits to be realized by the Adviser and any of its affiliates from the relationship with each Fund, (v) the extent to which economies of scale will be realized by each Fund as it grows, and (vi) whether each Fund’s fee levels reflected the economies of scale to the benefit of the Fund’s shareholders.
Performance, Fees and Expenses
Core Opportunity Fund
Regarding the Core Opportunity Fund, the Board reviewed the performance of the Fund’s Retail Class shares for the three months, one-year, three-years, five-years, ten-years and since inception periods. These returns were compared to the returns of mutual funds in FUSE Research Network, LLC’s (“FUSE”) Allocation-50% to 70% Equity fund universe and to a peer group of similar funds selected by FUSE. The Board observed that the performance varied across periods, lagging the peer group medians for the one-year, and five-year periods, but comparing favorably for the three month, three-year, ten-year and since inception periods. The Board further observed that the Fund lagged the universe medians for the one-year and five-year periods, but comparing favorably for the three-moth, three-year, ten-year and since inception periods. It was noted that that for the since inception period, the performance of the Fund’s Retail Class shares was ranked in the top 3 of all 50 funds in the universe. The Board agreed that performance was more appropriately reviewed over a long-term timeline given the Fund’s strategy. The Board also reviewed the Fund’s performance relative to other funds managed by the Adviser. In consideration of each item noted, the Board agreed that it was satisfied with the Fund’s performance.
| Semi-Annual Report | March 31, 2020 | 137 |
| RiverNorth Funds | Board Considerations Regarding Approval of
Investment Advisory and Sub-Advisory Agreements |
March 31, 2020 (Unaudited)
As to the comparative fees and expenses, the Trustees considered the management and the other fees paid by the Fund and compared those to the management and other fees paid by funds in the relative peer group determined by FUSE and the Allocation-50% to 70% Equity fund universe. The Board noted that the Core Opportunity Fund’s Class Retail shares’ annual net expense ratio of 1.40% was equal to the median of the peer group and higher than the median of the universe. The Board also noted that the annual net expense ratio placed the Core Opportunity Fund in the lowest quartile for the universe. Differences in strategies as compared to both the funds in the peer group and universe were recalled, as well as the fact that certain peer funds did not have a similar share class as the Fund’s Retail Class shares.
The Board also noted that the annual management fee of 1.00% for the Fund was above the median paid by the peer funds, but within the range of the peers. The Board noted the differences in strategies between the Fund and the peer funds, highlighting the active management of the Fund’s portfolio. The Trustees also reviewed the Fund’s fees relative to other funds managed by the Adviser. The Board, including the Independent Trustees, determined that although fees were above the median relative to the Fund’s peers, the fees were reasonable given the unique investment characteristics of the Fund and the nature of the services provided by the Adviser.
Strategic Income Fund
Regarding the Strategic Income Fund, the Board reviewed the performance of the Fund for the three months, one-year, three-year, five-year and since inception periods. The Board noted that the Strategic Income Fund outperformed the median of FUSE’s Multisector Bond fund universe for the three months, one-year, five-year and since inception periods, but underperformed the universe for three-year period. In comparison to the peer funds, the Fund outperformed the median for the three months, one-year, five-years and since inception periods. The Board also reviewed the Fund’s performance relative to other funds managed by the Adviser. The Board concluded that the Fund’s overall performance was satisfactory.
As to the comparative fees and expenses, the Trustees considered the management and the other fees paid by the Fund and compared those to the management and other fees paid by funds in the relative peer group determined by FUSE and the Multisector Bond fund universe. The Board noted that the Strategic Income Fund’s Class I shares annual net expense ratio of 0.85% was slightly higher but in-line with the median of the peer group and higher than the median of the universe. The Board also noted that the annual management fee of 0.75% for the Fund was higher than the median of the peer group and Multisector Bond fund universe. The Trustees noted the fact that the active strategy of the Fund required the Adviser to pay part of the Fund’s management fee to DoubleLine as well as actively manage a portion of the Fund’s portfolio. The Board also reviewed the Fund’s fees relative to other funds managed by the Adviser. The Board, including the Independent Trustees, determined that the fees were reasonable given the nature of the Fund’s investment strategy, the capabilities of the Adviser and the Sub-Adviser, and the nature of the services provided to the Fund.
| 138 | (888) 848-7569 | www.rivernorth.com |
| RiverNorth Funds | Board Considerations Regarding Approval of
Investment Advisory and Sub-Advisory Agreements |
March 31, 2020 (Unaudited)
High Income Fund
Regarding the High Income Fund, the Board reviewed the performance of the Fund’s Class I shares for the three months, one-year, three-year, five year and since inception periods. The Board noted that the High Income Fund underperformed the median in FUSE’s High Yield Bond fund universe for each period and underperformed the median of the peer group funds in all but the three- month period. The Board also reviewed the Fund’s performance relative to other funds managed by the Adviser. The Trustees acknowledged the fact that the Fund’s split strategy between CEF, and high-yield and senior loans differed from the funds in each group.
As to the comparative fees and expenses, the Trustees considered the management and the other fees paid by the Fund and compared those to the management and other fees paid by funds in the relative peer group determined by FUSE and FUSE’s High Yield Bond fund universe. The Board noted that the High Income Fund’s Class I shares annual gross management fee of 1.00% and annual net expense ratio of 1.34% was higher than the median of the peer funds in both categories. The Board also noted that the annual gross management fee of 1.00% and annual net expense ratio placed the High Income Fund in the highest quartile for the universe of funds as well. The Board recalled that most of the funds in FUSE’s High Yield Bond fund universe and peer group funds follow a simpler high yield strategy than that of the High Yield Fund and would lead to relatively lower fees. The Trustees also reviewed the Fund’s fees relative to other funds managed by the Adviser. After discussion, the Board, including the Independent Trustees, determined that the fees were adequate in comparison to the Fund’s peers, and the fees were reasonable given the nature of the Fund’s investment strategy, and the nature of the services to be provided to the Fund by the Adviser and Oaktree.
Nature, Extent and Quality of Services
As to the nature, extent and quality of the services to be provided by the Adviser to the Funds, the Board considered that under the terms of the Management Agreement, the Adviser would be subject to the supervision of the Board, provide or arrange to be provided to the Fund such investment advice as the Adviser, in its discretion, deems advisable and will furnish or arrange to be furnished a continuous investment program for the Funds consistent with each Fund’s investment objective and policies. The Board reviewed the Adviser’s Form ADV, which was previously provided to the Board and which provided details regarding the experience of each of the Adviser’s personnel. The Adviser also provided additional information regarding its experience managing other investment accounts. Based on the foregoing information, the Board, including the Independent Trustees concluded that the Adviser had provided quality services and would continue to do so for the Funds.
Profitability and Other Benefits
As to the cost of the services to be provided and to the profits to be realized by the Adviser, the Board reviewed the Adviser’s estimates of its profitability and its financial condition. The Board reviewed the Adviser’s financial statements and noted the Adviser’s financial condition is stable as income from its asset management operations have contributed to higher revenues for the Adviser. The Board acknowledged that the Adviser’s management fees were comparable to those charged to other mutual funds to which the Adviser provides advisory or sub-advisory services. The Board, including the Independent Trustees, determined that the Management Agreement, with respect to the Core Opportunity Fund, Strategic Income Fund and High Income Fund was not overly profitable to the Adviser and the financial condition of the Adviser was adequate.
| Semi-Annual Report | March 31, 2020 | 139 |
| RiverNorth Funds | Board Considerations Regarding Approval of
Investment Advisory and Sub-Advisory Agreements |
March 31, 2020 (Unaudited)
The Board noted that the Adviser has no affiliations with the Funds’ transfer agent, fund accountant, administrator, custodian, or distributor and therefore does not derive any benefits from the relationships these parties may have with the Trust. The Board also noted each Fund’s liquidity status and its ability to meet redemptions.
Based upon such information as they considered necessary to the exercise of their reasonable business judgment, the Trustees, including all of the Independent Trustees, concluded that it was in the best interests of each of the Funds to continue the Management Agreement with the Adviser for an additional one-year period.
Consideration and Renewal of Investment Sub-Advisory Agreement with DoubleLine Capital, LP with respect to the Strategic Income Fund
At an in-person meeting of the Board, held on November 13, 2019 and called expressly for that purpose, the Board, including the Independent Trustees, considered the renewal of the sub- advisory agreement (the “DoubleLine Agreement”) between the Adviser and DoubleLine Capital, LP (“DoubleLine” or “Sub-Adviser”) related to the Strategic Income Fund. Prior to the in-person Board meeting held on November 13, 2019, the Independent Trustees held a special meeting via teleconference to discuss the materials.
The Board received materials compiled by the Sub-Adviser and the Adviser, including a copy of the DoubleLine Agreement, the Sub-Adviser’s response to a questionnaire regarding its profitability, management and operations, a copy of each Sub-Adviser’s Form ADV and information regarding the performance of the Fund’s benchmark indices and peer funds (“Renewal Materials”). The Board had reviewed and discussed the Renewal Materials at the Special Meeting relating to the Sub-Adviser and the DoubleLine Agreement. The Board considered the following factors, among others, in reaching its determination to renew the DoubleLine Agreement: (i) the investment performance of the Fund and the investment performance of DoubleLine, (ii) the nature, extent and quality of the services provided by DoubleLine, (iii) the experience and qualifications of the personnel providing such services, (iv) the costs of the services provided and the profits to be realized by DoubleLine and any of its affiliates from the relationship with the Fund, (v) the extent to which economies of scale will be realized by the Fund and DoubleLine as the Fund grows, and (vi) whether the fee levels of the Fund reflected the economies of scale to the benefit of the Fund’s shareholders.
As to the comparative fees and expenses, the Board considered the management fee paid by the Strategic Income Fund to the Adviser, and noted that the Adviser pays DoubleLine from its fee, which the Board had previously determined was reasonable. The Board noted that the sub- advisory fee paid by the Adviser to the Sub-Adviser was reasonable, given the fees that the Sub- Adviser charges other clients to manage similar strategies.
As to the nature, extent and quality of the services to be provided by DoubleLine, the Board considered that under the terms of the DoubleLine Agreement, the Sub-Adviser would, subject to the supervision of the Board, provide to the Strategic Income Fund such investment advice as the Sub-Adviser, in its discretion, deemed advisable and would furnish or arrange to be furnished a continuous investment program for the Fund consistent with the Fund’s investment objective and policies. The Board reviewed the Form ADV of DoubleLine, which provided details regarding the experience of the Sub-Adviser’s investment personnel. DoubleLine also provided additional information regarding its operations and experience managing other investment accounts. The Board noted that RiverNorth was satisfied with DoubleLine’s work with the Strategic Income Fund. Based on the foregoing information, the Board, including the Independent Trustees, concluded that DoubleLine had provided quality services and could be expected to continue to do so for the Strategic Income Fund.
| 140 | (888) 848-7569 | www.rivernorth.com |
| RiverNorth Funds | Board Considerations Regarding Approval of
Investment Advisory and Sub-Advisory Agreements |
March 31, 2020 (Unaudited)
As to the cost of the services to be provided and to the profits to be realized by the Sub-Adviser, the Board reviewed DoubleLine’s financial condition. The Board noted that the financial condition of DoubleLine was stable. The Board, including the Independent Trustees determined that the DoubleLine Agreement and the compensation to DoubleLine was reasonable and the financial condition of DoubleLine was adequate. The Board noted that DoubleLine has no affiliations with the Fund’s transfer agent, administrator, fund accountant, custodian, or distributor and therefore does not derive any benefits from the relationships these parties may have with the Trust.
Based upon such information as they considered necessary to the exercise of their reasonable business judgment, the Trustees, including all of the Independent Trustees, concluded that it was in the best interests of the Strategic Income Fund to continue the DoubleLine Agreements between the Adviser and the respective Fund’s Sub-Adviser for an additional one-year period.
| Semi-Annual Report | March 31, 2020 | 141 |
Intentionally Left Blank
RiverNorth Funds
RiverNorth Core Opportunity Fund
RiverNorth/DoubleLine Strategic Income Fund
RiverNorth/Oaktree High Income Fund
Board of Trustees
Patrick W. Galley, CFA, Chairman
James G. Kelley
John S. Oakes
David M. Swanson
John K. Carter
Investment Adviser
RiverNorth Capital Management, LLC
Sub Advisers
DoubleLine Capital LP
Oaktree Capital Management, L.P.
Transfer Agent, Administrator and
Dividend Disbursing Agent
ALPS Fund Services, Inc.
Distributor
ALPS Distributors, Inc.
Custodian
State Street Bank & Trust
Independent Registered
Public Accounting Firm
Cohen & Company, Ltd.
This report is provided for the general information of the shareholders of the RiverNorth Funds. This report is not intended for distribution to prospective investors in the Funds, unless preceded or accompanied by an effective prospectus.
Not Applicable
| Item 3. | Audit Committee Financial Expert. |
Not Applicable
| Item 4. | Principal Accountant Fees and Services. |
Not Applicable
| Item 5. | Audit Committee of Listed Companies. |
Not Applicable
| Item 6. | Schedule of Investments. |
The schedules of investments is included as part of the Reports to Shareholders filed under Item 1 of this report.
| Item 7. | Disclosure of Proxy Voting Policies and Procedures for Closed-End Funds. |
Not Applicable
| Item 8. | Portfolio Managers of Closed-End Management Investment Companies. |
Not Applicable
| Item 9. | Purchases of Equity Securities by Closed-End Management Investment Companies and Affiliated Purchasers. |
Not Applicable
| Item 10. | Submission of Matters to a Vote of Security Holders. |
Not Applicable
| Item 11. | Controls and Procedures. |
(a) Based on an evaluation of the registrant's disclosure controls and procedures (as defined in Rule 30a-3(c) under the Investment Company Act of 1940) as of a date within 90 days of the filing date of this Form N-CSR, the disclosure controls and procedures are reasonably designed to ensure that the information required in filings on Forms N-CSR is recorded, processed, summarized, and reported on a timely basis.
(b) There were no significant changes in the registrant’s internal control over financial reporting that occurred during the registrant’s second fiscal quarter that have materially affected, or are reasonably likely to materially affect, the registrant’s internal control over financial reporting.
SIGNATURES
Pursuant to the requirements of the Securities Exchange Act of 1934 and the Investment Company Act of 1940, the registrant has duly caused this report to be signed on its behalf by the undersigned, thereunto duly authorized.
Registrant:RiverNorth Funds
| By: | /s/ Patrick W. Galley | |
| Name: | Patrick W. Galley | |
| Title: | President | |
| | | |
| Date: | June 8, 2020 | |
Pursuant to the requirements of the Securities Exchange Act of 1934 and the Investment Company Act of 1940, this report has been signed below by the following persons on behalf of the registrant and in the capacities and on the dates indicated.
| By: | /s/ Patrick W. Galley | |
| Name: | Patrick W. Galley | |
| Title: | President & Chief Executive Officer | |
| | | |
| Date: | June 8, 2020 | |
| By: | /s/ Jonathan M. Mohrhardt | |
| Name: | Jonathan M. Mohrhardt | |
| Title: | Treasurer & Chief Financial Officer | |
| | | |
| Date: | June 8, 2020 | |