Exhibit 99.1

FIRST CALIFORNIA
FINANCIAL GROUP, INC.
An Emerging Force
In Southern California Banking

Safe Harbor Statement
This presentation contains certain forward-looking information about First California that is intended to be covered by the safe harbor for “forward-looking statements” provided by the Private Securities Litigation Reform Act of 1995. All statements other than statements of historical fact are forward-looking statements, and include statements related to the ongoing integration of the bank’s people and culture, implementation of First California’s new marketing and brand development strategy, potential acquisitions, the expansion in services and products offered to First California customers, the creation of operating efficiencies adding new branch locations, strategy for attracting and retaining employees and long-term growth plans. Such statements involve inherent risks and uncertainties, many of which are difficult to predict and are generally beyond the control of First California. First California cautions that a number of important factors could cause actual results to differ materially from those expressed in, or implied or projected by, such forward-looking statements. Risks and uncertainties include, but are not limited to, the impact of the current national and regional economy on small business loan demand in Southern California, loan delinquency rates, the ability of First California and First California Bank to retain customers, interest rate fluctuations and the impact on margins, demographic changes, demand for the products and services of First California and First California Bank, as well as their ability to attract and retain qualified people and competition with other banks and financial institutions. If any of these risks or uncertainties materialize or if any of the assumptions underlying such forward-looking statements prove to be incorrect, First California’s results could differ materially from those expressed in, or implied or projected by such forward-looking statements. First California assumes no obligation to update such forward-looking statements. For a more complete discussion of risks and uncertainties, investors and security holders are urged to read the section titled “Risk Factors” in First California’s Annual Report on Form 10-K and any other reports filed by it with the Securities and Exchange
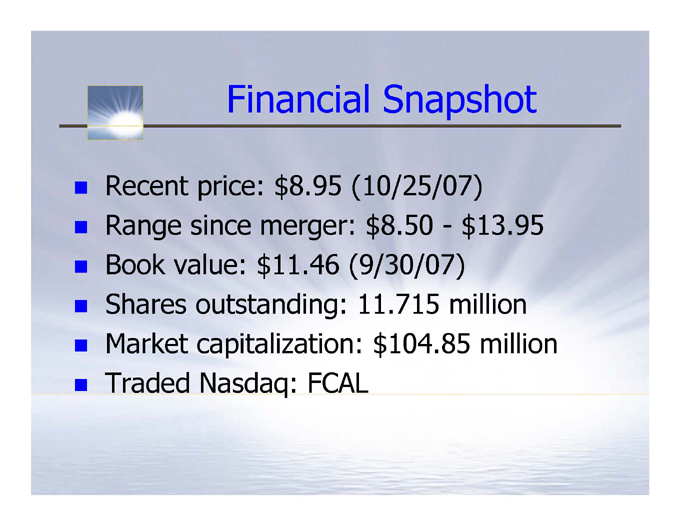
Financial Snapshot
Recent price: $8.95 (10/25/07)
Range since merger: $8.50—$13.95
Book value: $11.46 (9/30/07)
Shares outstanding: 11.715 million
Market capitalization: $104.85 million
Traded Nasdaq: FCAL
Our Company and Market
A Merger of Equals
2 | | holding companies with 3 fast growing banks merged to form FCAL in March 2007 |
More than $1 billion in assets
12 branches serving vibrant Los Angeles, Orange and Ventura counties
Complementary products and locations
Benefits of the Merger
Absence of mainstream midsize Southern California banks
Critical mass
Economies of scale
Resources to fuel growth-capital & talent
Larger lending limits
Well-Positioned to Grow
Well-capitalized
Access to capital markets
Growth strategy in place
Commitment to growth
Plan to establish more branches
M & A opportunities in Southern California
Experienced acquisition / integration team
Merger Integration
Conversion completed on schedule
Employee outreach smoothes transition
Consolidated back office operations
All merger & integration costs addressed
Commenced First California Bank branding
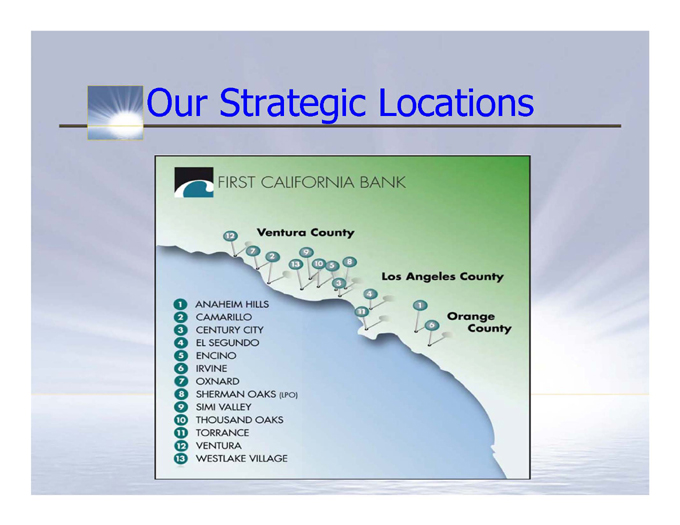
Our Strategic Locations
Our Strategic Locations
12 branches, 1 LPO
Strong presence in:
101 Freeway and 405 Freeway Corridors
Ventura through San Fernando Valley
West LA, South Bay, Orange County
Growing business markets
Ideal platform for expansion
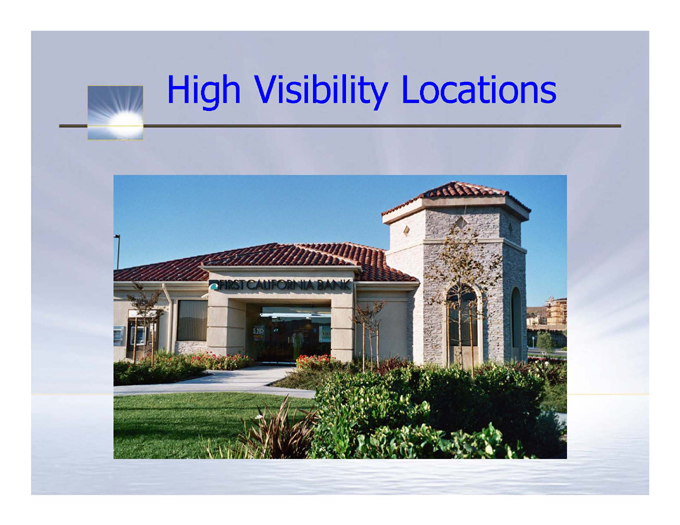
High Visibility Locations
Focused on Business Banking
Nearly 400,000 companies located in service area
Dynamic business climate
Specialty: small and medium-sized businesses
Our Range of Services
Business lending
Commercial real estate lending
Construction, SBA & entertainment lending
Checking, savings & time deposits
Cash management
Online banking
Our Culture
Service
Committed to high service standards
Client-centric
People
Attract service-oriented professionals
Enhanced advancement/reward opportunities
Ongoing education/training for 200+ employees
Our Vibrant Marketplace
Diversified economy in manufacturing, trade, tourism, technology, entertainment
Market area of more than 14 million people
Market area includes 38% of California’s population
Executive Management
C. G. Kum President, Chief Executive Officer
Romolo C. Santarosa EVP, Chief Financial Officer
Walter Duchanin EVP, Chief Credit Officer
Thomas E. Anthony EVP, Manager Commercial
Banking, Northern Region
Cheryl L. Knight EVP, Chief Risk Officer
Expanded Board of Directors
Robert E. Gipson John W. Birchfield
Chairman Vice Chairman
Richard D. Aldridge Donald E. Benson
Joseph N. Cohen W. Douglas Hile
Antoinette T. Hubenette, M.D. C. G. Kum
Syble R. Roberts Thomas Tignino
Our Performance
Quality Loan Portfolio
Conservative credit culture
Strong credit administration
Diversified & granular loan portfolio
Low non-performing loan level
No exposure to sub-prime loans
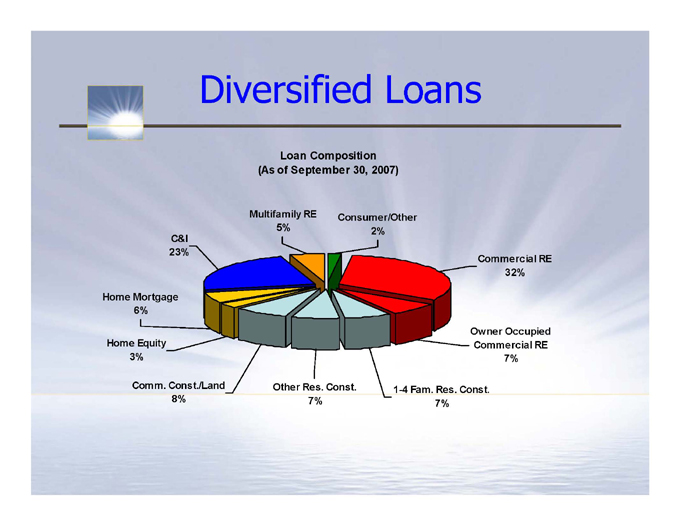
Diversified Loans
Loan Composition (As of September 30, 2007)
Multifamily RE
5%
Consumer/Other 2%
Commercial RE
32%
Owner Occupied Commercial RE
7%
1-4 Fam. Res. Const.
7%
Other Res. Const.
7%
Comm. Const./Land 8%
Home Equity 3%
Home Mortgage 6%
C&I 23%
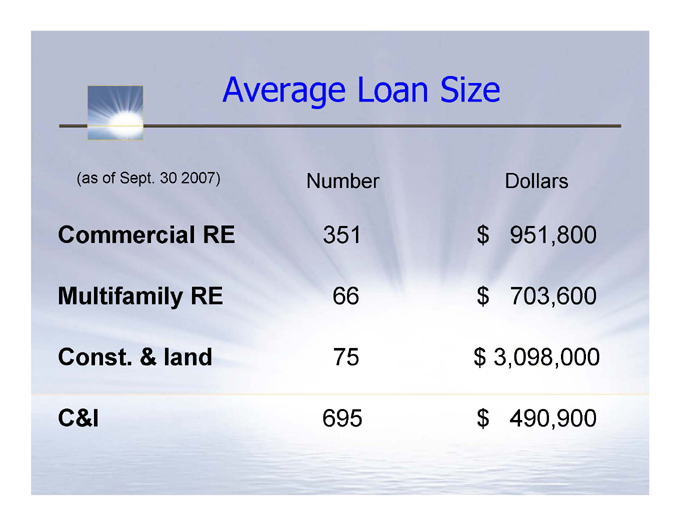
Average Loan Size
(as of Sept. 30 2007) Number Dollars
Commercial RE 351 $ 951,800
Multifamily RE 66 $ 703,600
Const. & land 75 $ 3,098,000
C&I 695 $ 490,900
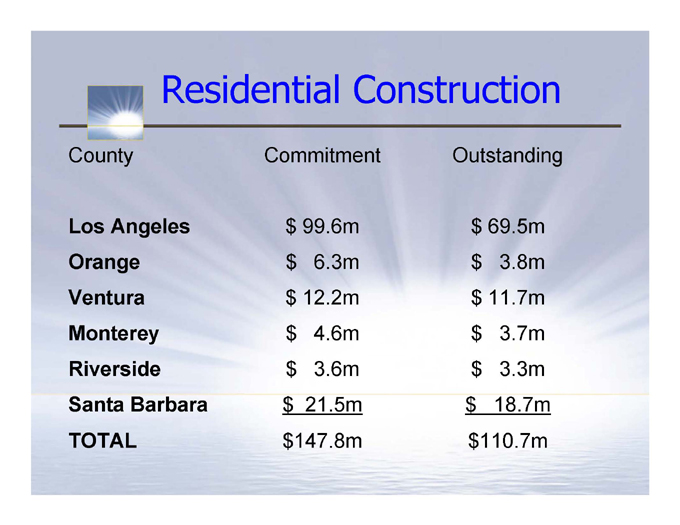
Residential Construction
County Commitment Outstanding
Los Angeles $ 99.6m $ 69.5m
Orange $ 6.3m $ 3.8m
Ventura $ 12.2m $ 11.7m
Monterey $ 4.6m $ 3.7m
Riverside $ 3.6m $ 3.3m
Santa Barbara $ 21.5m $ 18.7m
TOTAL $ 147.8m $ 110.7m
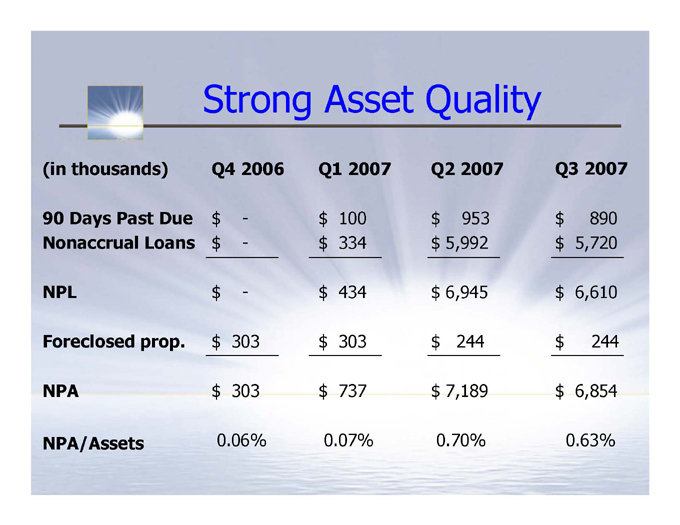
Strong Asset Quality
(in thousands) Q4 2006 Q1 2007 Q2 2007 Q3 2007
90 Days Past Due $—$ 100 $ 953 $ 890
Nonaccrual Loans $—$ 334 $ 5,992 $ 5,720
NPL $—$ 434 $ 6,945 $ 6,610
Foreclosed prop. $ 303 $ 303 $ 244 $ 244
NPA $ 303 $ 737 $ 7,189 $ 6,854
NPA/Assets 0.06% 0.07% 0.70% 0.63%
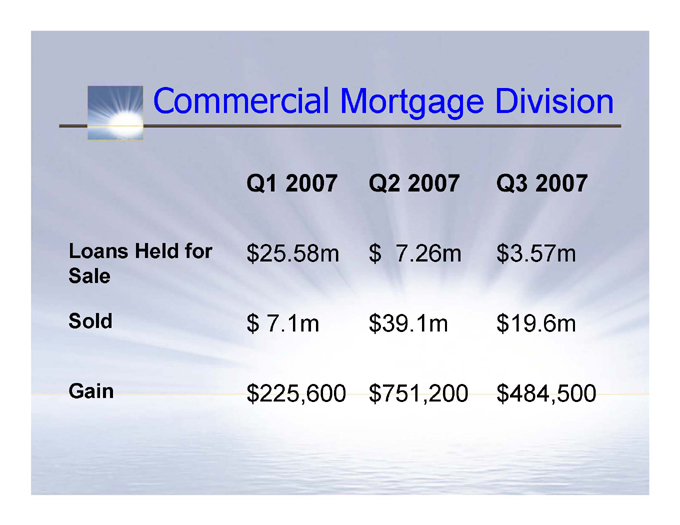
Commercial Mortgage Division
Q1 2007 Q2 2007 Q3 2007
Loans Held for Sale $25.58m $ 7.26m $3.57m
Sold $ 7.1m $39.1m $19.6m
Gain $ 225,600 $ 751,200 $ 484,500
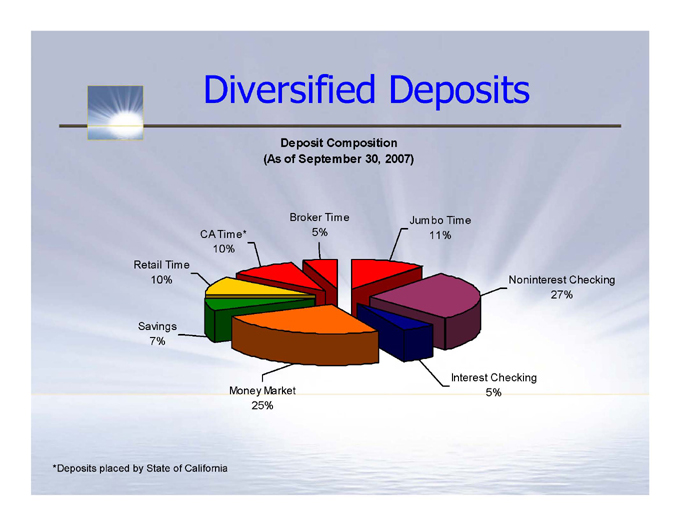
Diversified Deposits
Deposit Composition (As of September 30, 2007)
Broker Time 5%
Jumbo Time 11%
Noninterest Checking 27%
Interest Checking 5%
Money Market 25%
Savings 7%
Retail Time 10%
CA Time* 10%
*Deposits placed by State of California
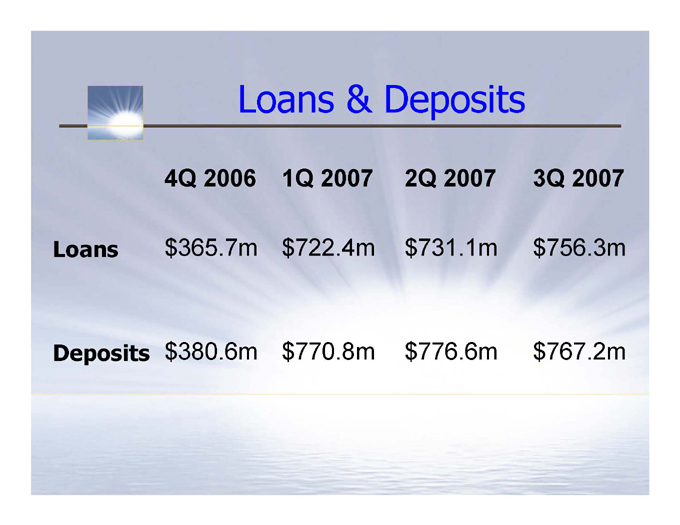
Loans & Deposits
4Q 2006 1Q 2007 2Q 2007 3Q 2007
Loans $365.7m $722.4m $731.1m $756.3m
Deposits $380.6m $770.8m $776.6m $767.2m
Results Overview
2006 and prior results are legacy MBLA
New First California begins March 12, 2007
Q1 2007 includes only 19 days of combined operations
2007 results include impact of merger & integration
Q3 2007 Overview
Net income of $2.4 million versus $1.8 million in 3Q 2006
Loan volume up sharply in September
Operating expenses lowered from Q2 2007
No loan loss provision
Tangible book value up 9.7% from Q1 2007
Well capitalized
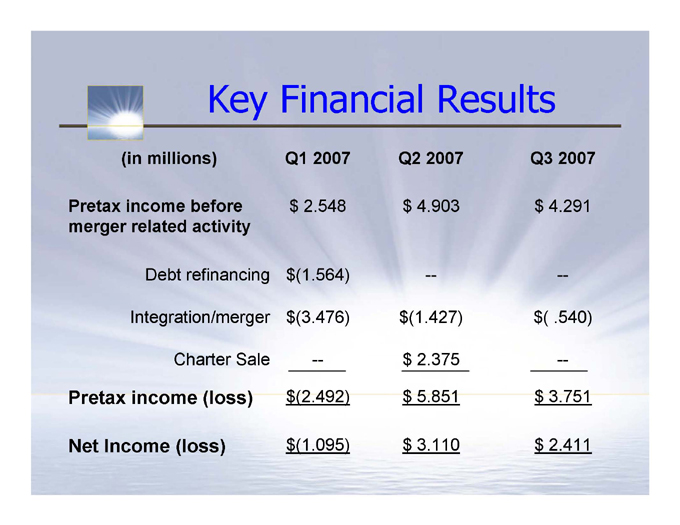
Key Financial Results
(in millions) Q1 2007 Q2 2007 Q3 2007
Pretax income before merger related activity $ 2.548 $ 4.903 $ 4.291
Debt refinancing $ (1.564) — —
Integration/merger $ (3.476) $ (1.427) $( .540)
Charter Sale — $ 2.375 —
Pretax income (loss) $ (2.492) $ 5.851 $ 3.751
Net Income (loss) $ (1.095) $ 3.110 $ 2.411

Our Goals / Outlook
Our Goals
Be a dominant bank of choice in So. California for small & middle market businesses
Excel in broader service based culture
Attract and retain the best staff
Increase profitability
Enhance long-term franchise value

Our Outlook
We expect to gain momentum
Enhance shareholder value
Stock price as a multiple of book value
Deliver on our promises for growth and performance
FIRST CALIFORNIA
FINANCIAL GROUP, INC.
An Emerging Force
In Southern California Banking