Company Overview
Investor Presentation
Dean Goodermote
Chairman, CEO, and President
May 2010
www.doubletake.com

Safe Harbor Statement
Statements made in this presentation regarding Double-Take that are not
historical facts are forward-looking statements based on our current
expectations, assumptions, estimates and projections about Double-Take
and our industry. These forward-looking statements are subject to risks and
uncertainties that could cause actual future events or results to differ
materially from such statements. These forward-looking statements include,
without limitation, statements about our market opportunities, our strategy,
our products and product developments, our competition, our projected
revenues, margins and expense levels and other measures of financial
performance and the adequacy of our available cash resources. You should
not place undue reliance on any of the forward-looking statements made in
this presentation. Our actual results could differ materially from those
expressed or implied by these forward-looking statements as a result of
various factors, including the various risks described in, or incorporated by
reference in, the documents and reports that we file with the Securities and
Exchange Commission, including in Item 1A. “Risk Factors” of our Form 10-K
for the year ended December 31, 2009, as updated by any more recent
filings. We undertake no obligation to update publicly any forward-looking
statements for any reason, even if new information becomes available or
other events occur in the future.
2

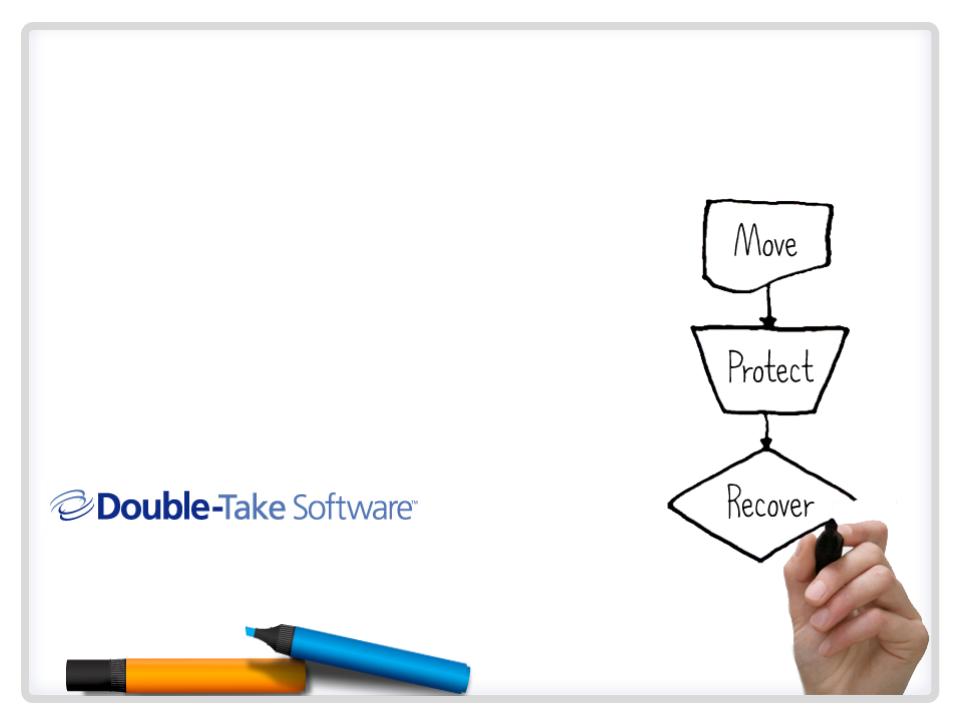
What We Do
Provide affordable software to move, protect and recover
workloads, thereby minimizing downtime and data loss for our
customers.
workloads, thereby minimizing downtime and data loss for our
customers.
3
Highlights
• Virtual + Physical + Cloud
• New Innovative Growth Areas
• Application and Hardware Independent
• Leader in Windows Host Based Recovery
• Leveraged, Blue Chip & Broad Distribution
• Strong Brand, Promotional Customer Base
• Unique System State Continuous Replication
• Strong Balance Sheet and Cash Flow Potential
5
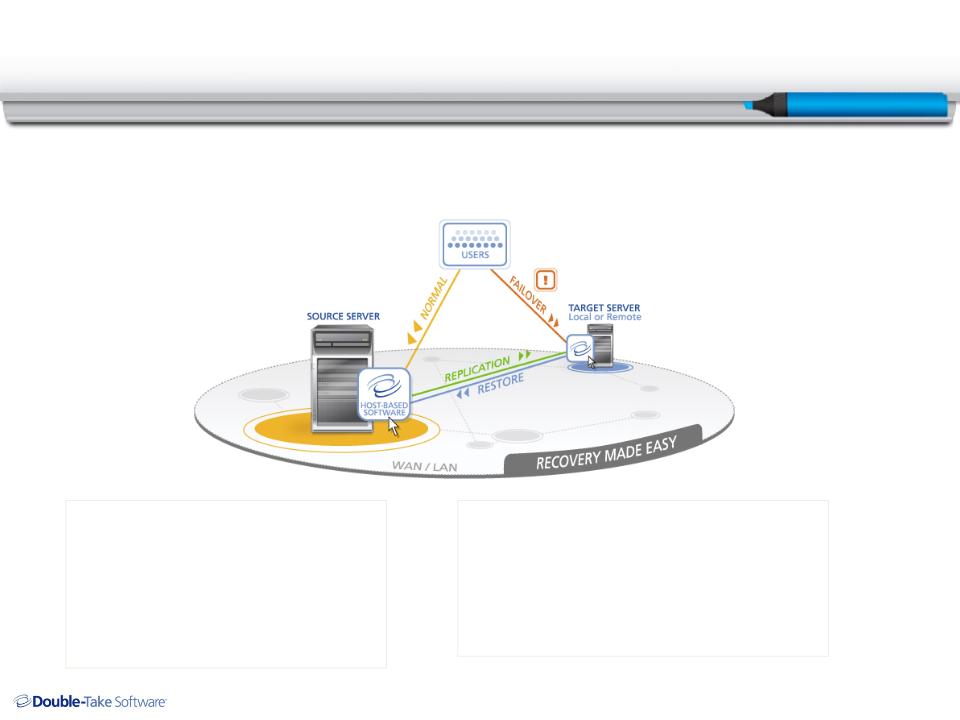
What We Are Known For Today
Off-Site Disaster Recovery & High Availability
Off-Site Disaster Recovery & High Availability
A focus on business critical systems based upon Microsoft, VMware, & Linux
server platforms
server platforms
High Availability
Provide LAN or WAN failover
Maximize user productivity and minimize data loss
Data Protection
Real-time asynchronous replication
Byte level bandwidth friendly data movement
P2V protection
Recovery Options
Automated monitoring / failover
P2V provisioning
Application Independent
Provide failover for ALL windows applications
Application specific module for Exchange, SQL, Sharepoint, BES
and File/Print servers.
and File/Print servers.
Hardware Independent
Replicate and failover between dissimilar hardware
Replicate and failover between dissimilar storage
Cost Effective
Rapid ROI
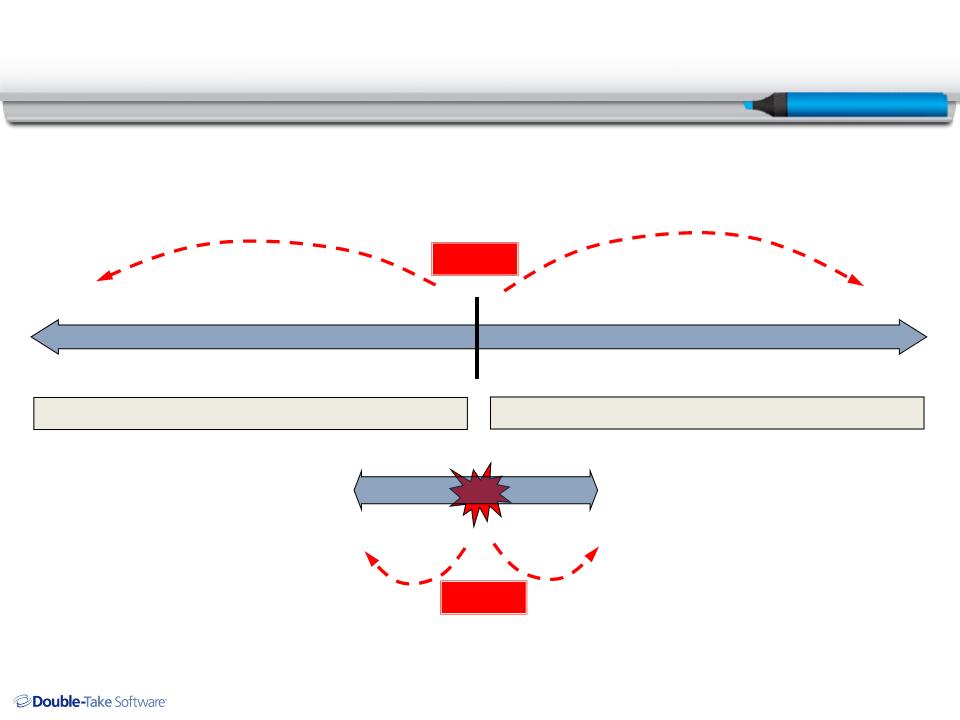
The Problems We Solve
6
How to shrink the recovery point and recovery time
• Hours
• Days
• Weeks
• Hours
• Days
• Weeks
Recovery Point = Time of last data backup
Recovery Time = Time to re-deploy apps
• Minutes
• Seconds
Failure
Failure
7
4
Park Community Federal Credit Union
• Full service financial institution with offices in Kentucky, Alabama and
Georgia
Georgia
• Selected to provide HA protection for Exchange, SQL Servers, and other
servers.
servers.
• Allowed Park Community to replicate data on 30-plus virtual servers
• Tried other solutions, none of which could replicate in real-time without
failing
failing
• Through DR testing, recovered seamlessly within their RTO and RPO
requirements
requirements
“We originally intended to protect only 5-6 highly critical servers.
However, because Double-Take Availability is affordable and didn’t
require additional bandwidth, we were able to implement this DR
solution across our entire server environment all within budget.” Eric
Hubbard, Network Engineer for Park Community FCU
However, because Double-Take Availability is affordable and didn’t
require additional bandwidth, we were able to implement this DR
solution across our entire server environment all within budget.” Eric
Hubbard, Network Engineer for Park Community FCU
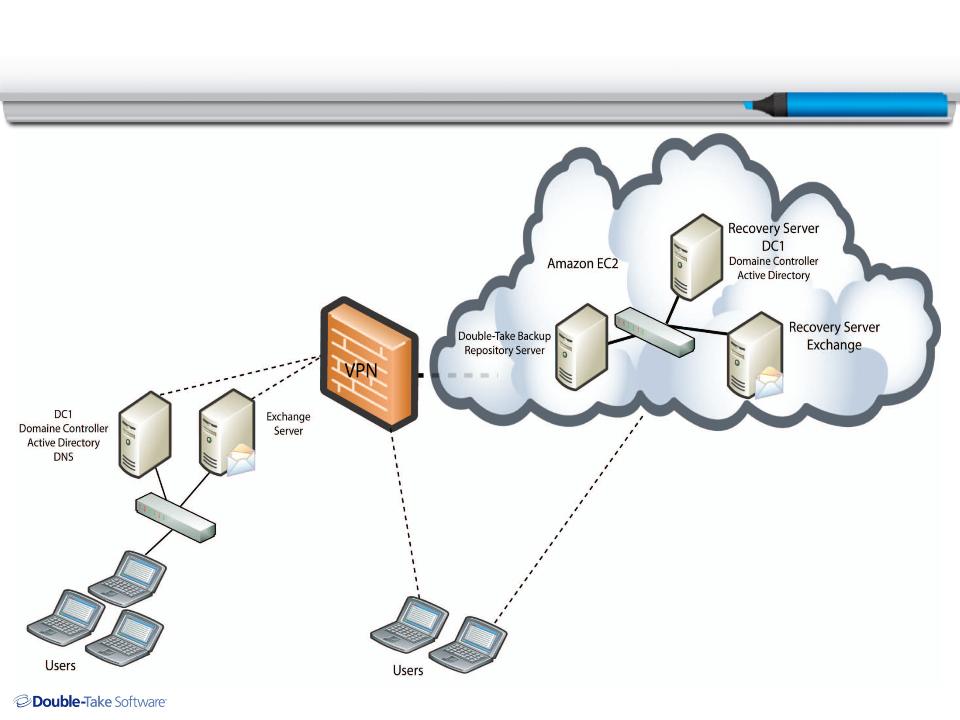
Innovation - Double-Take Cloud
8
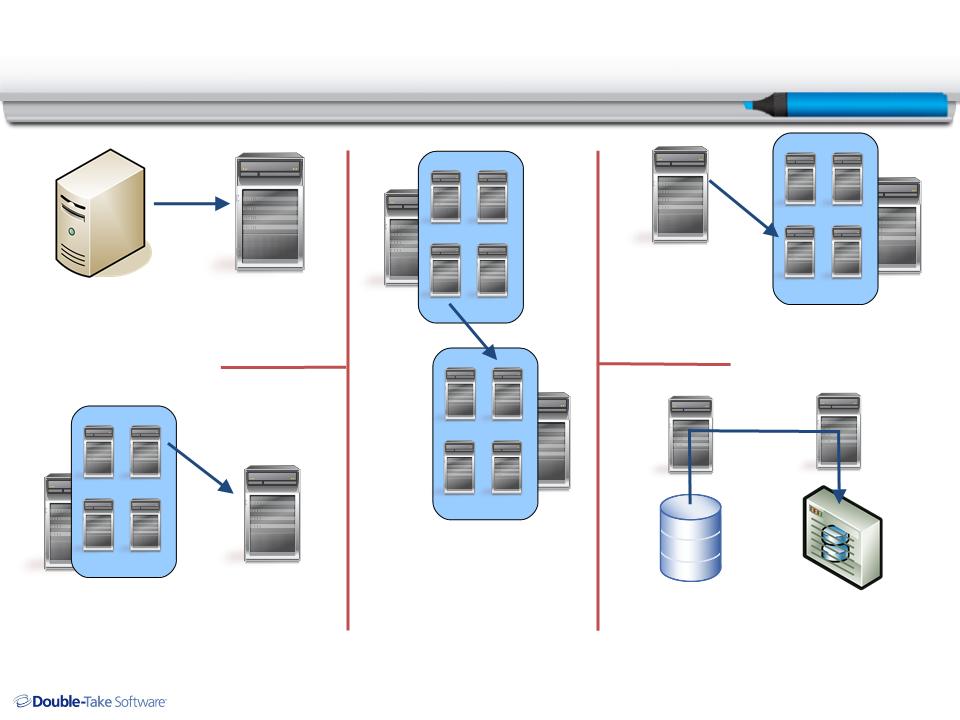
Innovation - Double-Take Move
9
Physical to Physical
Physical to Virtual
Virtual to Physical
Virtual to Virtual
Storage to Storage

Market Growth
Impact of The Global Recession
Impact of The Global Recession
10
10
September ’08 Forecast
September ’09 Forecast
51%
4.8%
(US$ in millions)
(US$ in millions)
Windows Storage Replication Software Market (IDC)
(1)
(1) 2007 figure is from February 2009 IDC forecast update.

11
Trends Driving Growth
• Increasingly high cost of downtime and data loss
• Focus on protecting business-critical and apps
• Cost containment in data center
• Growth in data creation and collection
• Increased availability of low cost storage
• Pervasive industry and federal regulations
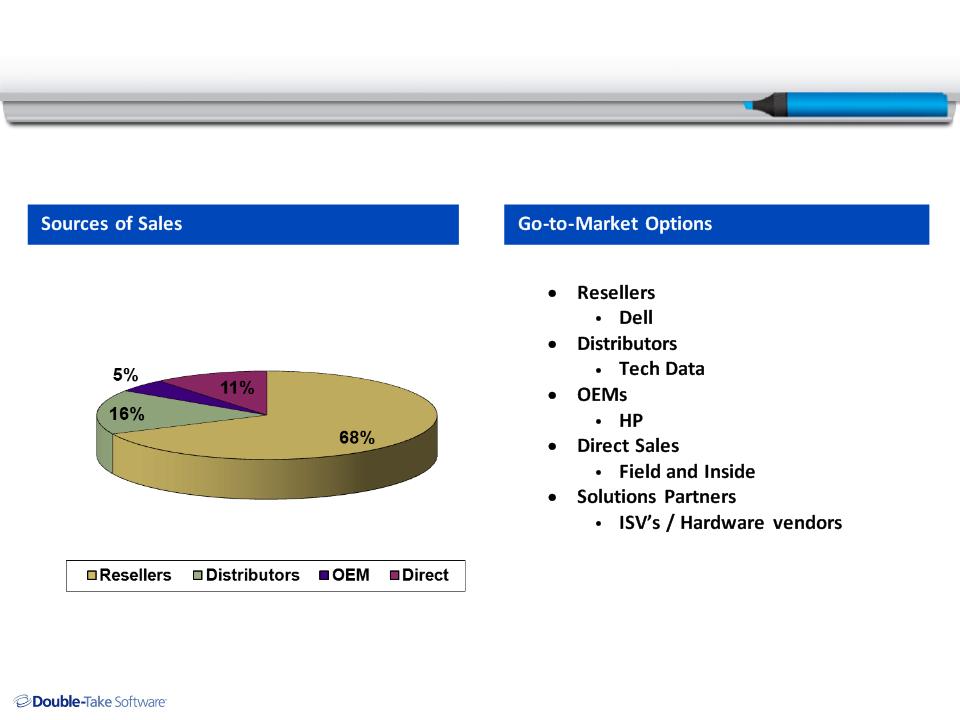
Go-to-Market - An “Overlay” Approach
12
2009
13
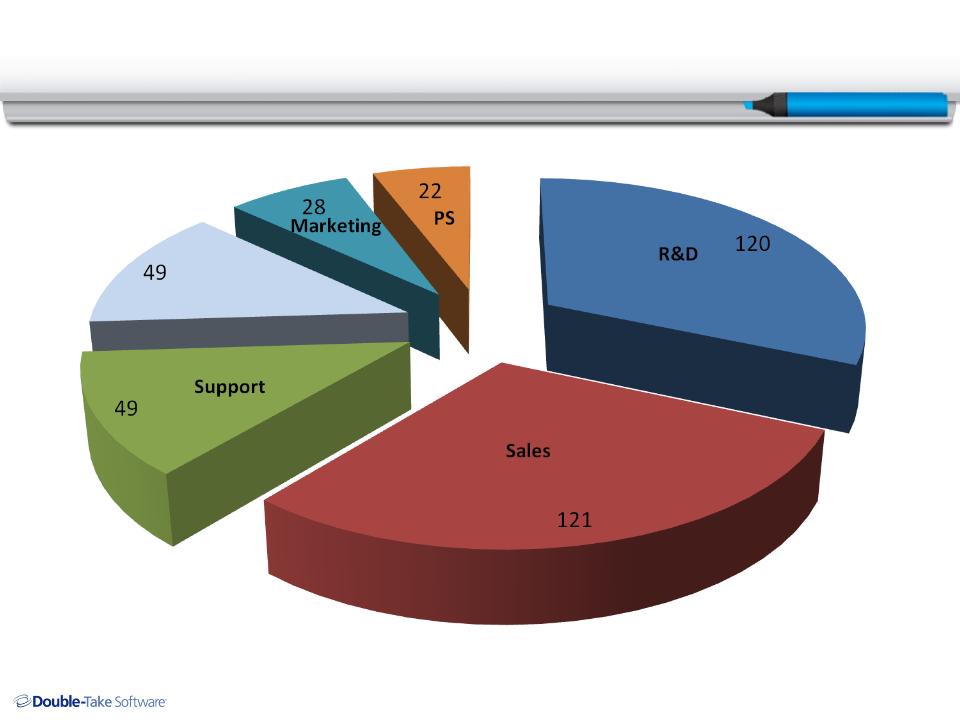
Employee Distribution
G&A
389 Total - December 2009
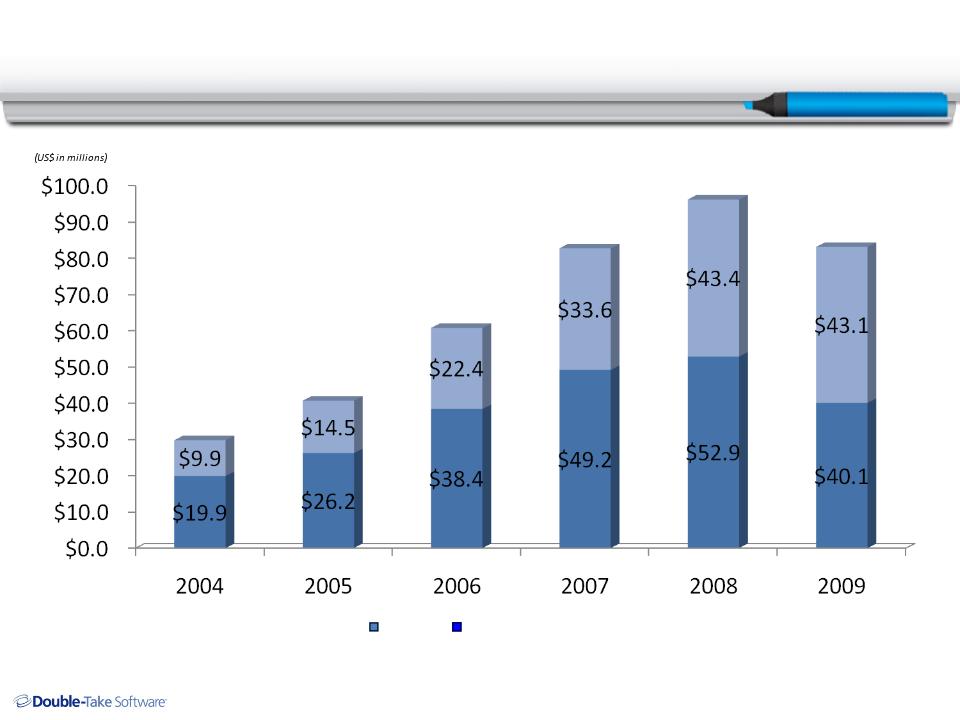
Revenue
14
www.doubletake.com
Software
Maintenance & Service
$29.8
$40.7
$60.8
$82.8
$96.3
$83.2
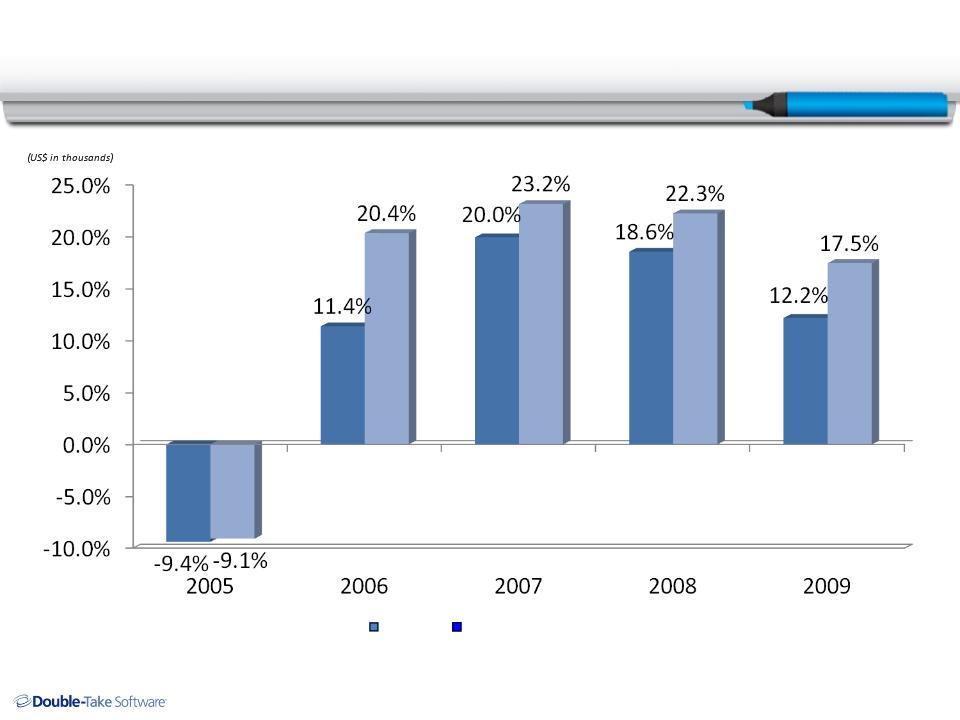
Annual Operating Margin
15
www.doubletake.com
GAAP
Non-GAAP*
*Non-GAAP Operating Margin excludes stock based compensation of $119k in 2005; $5,457k 2006;
$2,621k in 2007; $3,648k in 2008 and $4,429k in 2009.
$2,621k in 2007; $3,648k in 2008 and $4,429k in 2009.
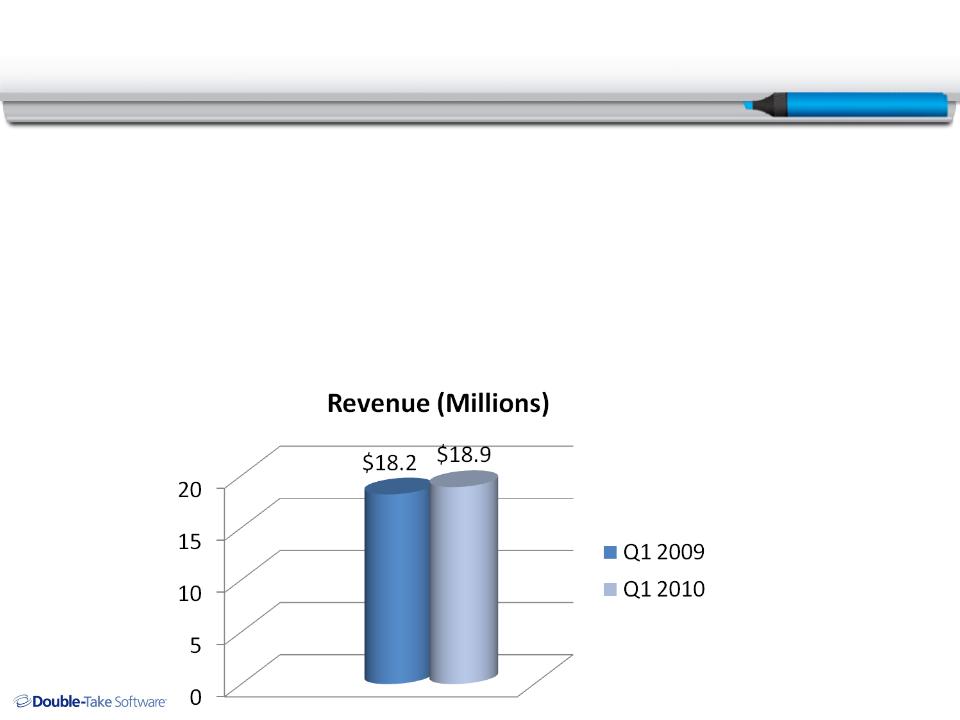
Q1 -2010
• Revenue Growth 4% Y/Y
• Software License Growth 7% Y/Y
• Americas License Growth 13% Y/Y
• Renewal Rates Approximately 85%
• Cash and Short Term Investments $89 million
16

Highlights
• Virtual + Physical + Cloud
• New Innovative Growth Areas
• Application and Hardware Independent
• Leader in Windows Host Based Recovery
• Leveraged, Blue Chip & Broad Distribution
• Strong Brand, Promotional Customer Base
• Unique System State Continuous Replication
• Strong Balance Sheet and Cash Flow Potential