|
Exhibit 99.4 
|
Vedanta Limited Q2 FY2018 Results 2 November 2017 Elements for a Sustainable Future VEDANTALIMITED – OIL&GAS ZINC POWER ALUMINIUM IRONORE COPPER
|
 |
Cautionary Statement and Disclaimer The views expressed here may contain information derived from publicly available sources that have not been independently verified. No representation or warranty is made as to the accuracy, completeness, reasonableness or reliability of this information. Any forward looking information in this presentation including, without limitation, any tables, charts and/or graphs, has been prepared on the basis of a number of assumptions which may prove to be incorrect. This presentation should not be relied upon as a recommendation or forecast by Vedanta Resources plc and Vedanta Limited and any of their subsidiaries. Past performance of Vedanta Resources plc and Vedanta Limited and any of their subsidiaries cannot be relied upon as a guide to future performance. This presentation contains ‘forward- looking statements’ – that is, statements related to future, not past, events. In this context, forward- looking statements often address our expected future business and financial performance, and often contain words such as ‘expects,’ ‘anticipates,’ ‘intends,’ ‘plans,’ ‘believes,’ ‘seeks,’ or ‘will.’ Forward–looking statements by their nature address matters that are, to different degrees, uncertain. For us, uncertainties arise from the behaviour of financial and metals markets including the London Metal Exchange, fluctuations in interest and or exchange rates and metal prices; from future integration of acquired businesses; and from numerous other matters of national, regional and global scale, including those of a environmental, climatic, natural, political, economic, business, competitive or regulatory nature. These uncertainties may cause our actual future results to be materially different that those expressed in our forward- looking statements. We do not undertake to update our forward- looking statements. We caution you that reliance on any forward- looking statement involves risk and uncertainties, and that, although we believe that the assumption on which our forward- looking statements are based are reasonable, any of those assumptions could prove to be inaccurate and, as a result, the forward- looking statement based on those assumptions could be materially incorrect. This presentation is not intended, and does not, constitute or form part of any offer, invitation or the solicitation of an offer to purchase, otherwise acquire, subscribe for, sell or otherwise dispose of, any securities in Vedanta Resources plc and Vedanta Limited and any of their subsidiaries or undertakings or any other invitation or inducement to engage in investment activities, nor shall this presentation (or any part of it) nor the fact of its distribution form the basis of, or be relied on in connection with, any contract or investment decision. VEDANTA LIMITED – Q2 FY2018 RESULTS PRESENTATION 2
|
 |
Contents Section Presenter Page Strategic Update Kuldip Kaura, CEO 4 Financial Update Arun Kumar, CFO 9 Kuldip Kaura, CEO Business Review 17 Sudhir Mathur, Acting CEO— Cairn Oil & Gas Appendix 26 VEDANTA LIMITED – Q2 FY2018 RESULTS PRESENTATION 3
Vedanta Limited Q2 FY2018 Results 2 November 2017 Strategic Update Kuldip Kaura Chief Executive Officer Value Creation
|
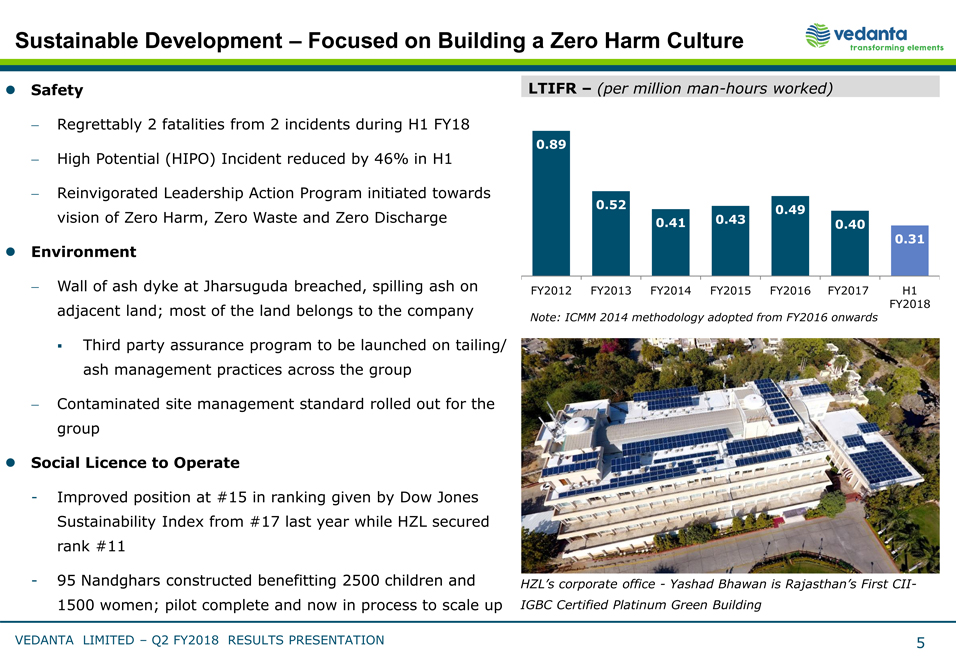 |
Sustainable Development – Focused on Building a Zero Harm Culture Safety Regrettably 2 fatalities from 2 incidents during H1 FY18 High Potential (HIPO) Incident reduced by 46% in H1 Reinvigorated Leadership Action Program initiated towards vision of Zero Harm, Zero Waste and Zero Discharge Environment Wall of ash dyke at Jharsuguda breached, spilling ash on adjacent land; most of the land belongs to the company Third party assurance program to be launched on tailing/ ash management practices across the group Contaminated site management standard rolled out for the group Social Licence to Operate— Improved position at #15 in ranking given by Dow Jones Sustainability Index from #17 last year while HZL secured rank #11— 95 Nandghars constructed benefitting 2500 children and 1500 women; pilot complete and now in process to scale up LTIFR – (per millionman- hours worked) 0.89 0.52 0.49 0.41 0.43 0.40 0.31 FY2012 FY2013 FY2014 FY2015 FY2016 FY2017 H1 FY2018 Note: ICMM 2014 methodology adopted from FY2016 onwards HZL’s corporate office— Yashad Bhawan is Rajasthan’s FirstCII- IGBC Certified Platinum Green Building VEDANTA LIMITED – Q2 FY2018 RESULTS PRESENTATION 5
|
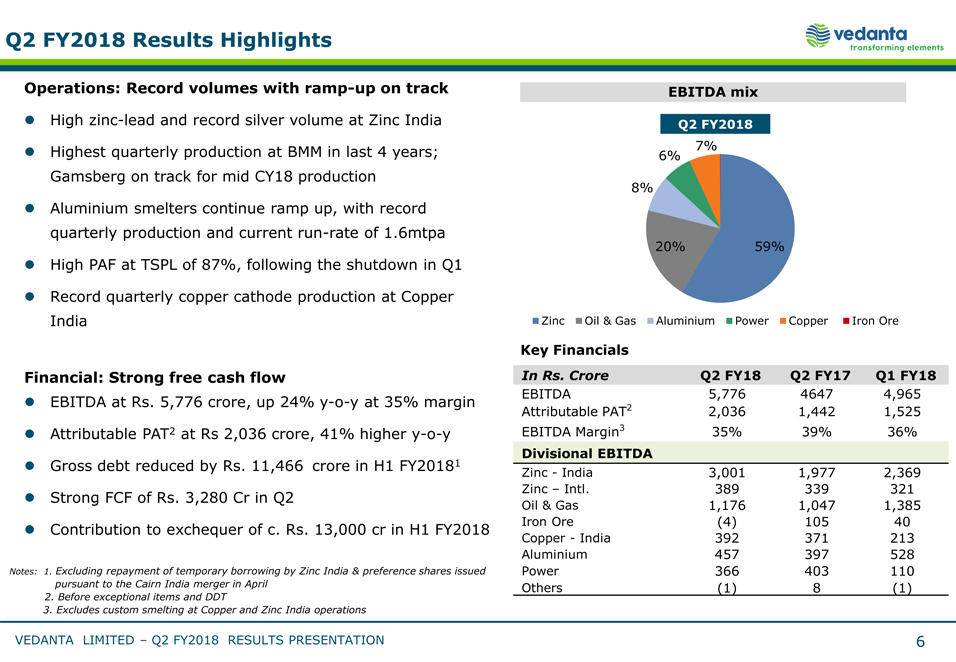 |
Q2 FY2018 Results Highlights Operations: Record volumes with ramp- up on track High zinc- lead and record silver volume at Zinc India Highest quarterly production at BMM in last 4 years; Gamsberg on track for mid CY18 production Aluminium smelters continue ramp up, with record quarterly production and current run- rate of 1.6mtpa High PAF at TSPL of 87%, following the shutdown in Q1 Record quarterly copper cathode production at Copper India Financial: Strong free cash flow EBITDA at Rs. 5,776 crore, up 24% y- o- y at 35% margin Attributable PAT2 at Rs 2,036 crore, 41% higher y- o- y Gross debt reduced by Rs. 11,466 crore in H1 FY20181 Strong FCF of Rs. 3,280 Cr in Q2 Contribution to exchequer of c. Rs. 13,000 cr in H1 FY2018 Notes: 1. Excluding repayment of temporary borrowing by Zinc India & preference shares issued pursuant to the Cairn India merger in April Before exceptional items and DDT Excludes custom smelting at Copper and Zinc India operations EBITDA mix Q2 FY2018 7% 6% 8% 20% 59% Zinc Oil & Gas Aluminium Power Copper Iron Ore Key Financials In Rs. Crore Q2 FY18 Q2 FY17 Q1 FY18 EBITDA 5,776 4647 4,965 Attributable PAT2 2,036 1,442 1,525 EBITDA Margin3 35% 39% 36% Divisional EBITDA Zinc - India 3,001 1,977 2,369 Zinc – Intl. 389 339 321 Oil & Gas 1,176 1,047 1,385 Iron Ore (4) 105 40 Copper - India 392 371 213 Aluminium 457 397 528 Power 366 403 110 Others (1) 8 (1) VEDANTA LIMITED – Q2 FY2018 RESULTS PRESENTATION 6
|
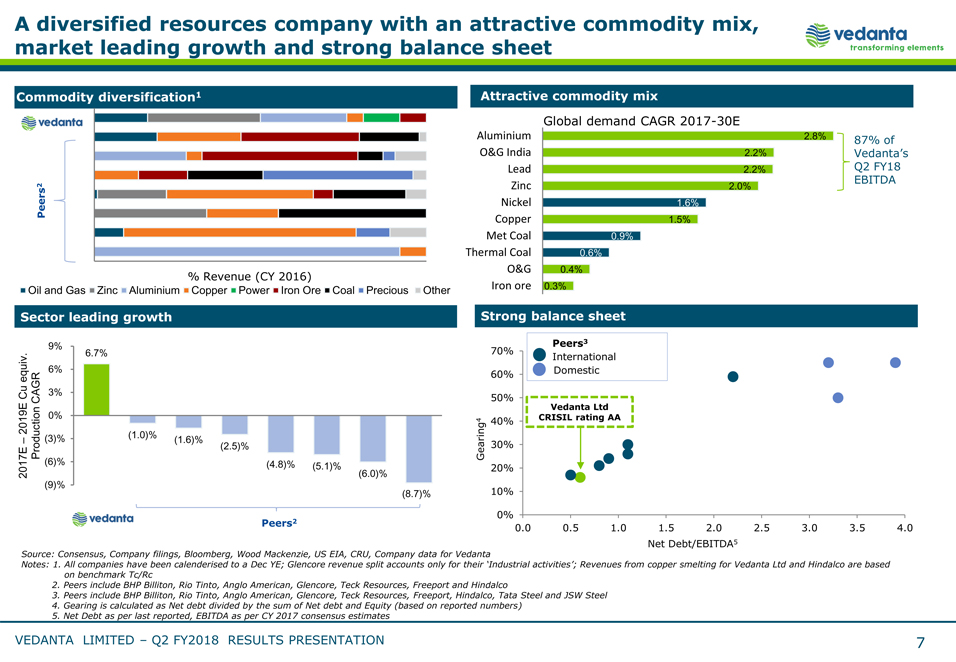 |
A diversified resources company with an attractive commodity mix, market leading growth and strong balance sheet Commodity diversification1 Attractive commodity mix Global demand CAGR 2017- 30E Aluminium 2.8% 87% of O&G India 2.2% Vedanta’s Lead 2.2% Q2 FY18 EBITDA 2 Zinc 2.0% Peers Nickel 1.6% Copper 1.5% Met Coal 0.9% Thermal Coal 0.6% % Revenue (CY 2016) O&G 0.4% Oil and Gas Zinc Aluminium Copper Power Iron Ore Coal Precious Other Iron ore 0.3% Sector leading growth Strong balance sheet 9% Peers3 . 6.7% 70% International equiv 6% 60% Domestic Cu CAGR 3% 50% Vedanta Ltd 2019E 0% 4 40% CRISIL rating AA – (3)% (1.0)% (1.6)% Production (2.5)% Gearing 30% 2017E (6)% (4.8)% (5.1)% (6.0)% 20% (9)% (8.7)% 10% 0% Peers2 0.0 0.5 1.0 1.5 2.0 2.5 3.0 3.5 4.0 Net Debt/EBITDA5 Source: Consensus, Company filings, Bloomberg, Wood Mackenzie, US EIA, CRU, Company data for Vedanta Notes: 1. All companies have been calenderised to a Dec YE; Glencore revenue split accounts only for their ‘Industrial activities’; Revenues from copper smelting for Vedanta Ltd and Hindalco are based on benchmark Tc/Rc Peers include BHP Billiton, Rio Tinto, Anglo American, Glencore, Teck Resources, Freeport and Hindalco Peers include BHP Billiton, Rio Tinto, Anglo American, Glencore, Teck Resources, Freeport, Hindalco, Tata Steel and JSW Steel Gearing is calculated as Net debt divided by the sum of Net debt and Equity (based on reported numbers) Net Debt as per last reported, EBITDA as per CY 2017 consensus estimates VEDANTA LIMITED – Q2 FY2018 RESULTS PRESENTATION 7
|
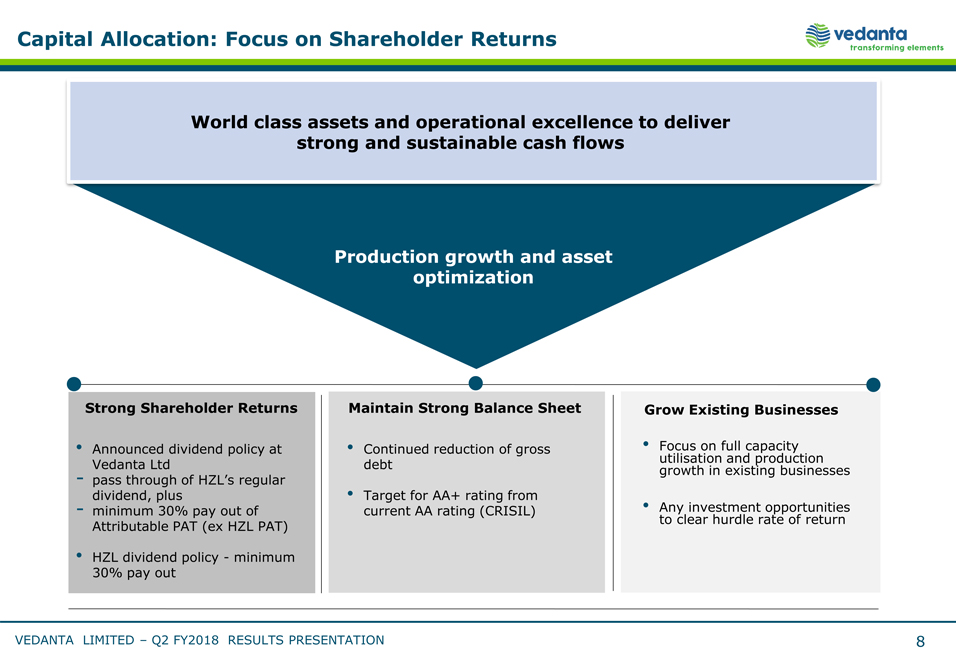 |
Capital Allocation: Focus on Shareholder Returns World class assets and operational excellence to deliver strong and sustainable cash flows Production growth and asset optimization Strong Shareholder Returns Maintain Strong Balance Sheet Grow Existing Businesses Announced dividend policy at Continued reduction of gross Focus on full capacity Vedanta Ltd debt utilisation and production - pass through of HZL’s regular growth in existing businesses dividend, plus Target for AA+ rating from - minimum 30% pay out of current AA rating (CRISIL) Any investment opportunities Attributable PAT (ex HZL PAT) to clear hurdle rate of return HZL dividend policy - minimum 30% pay out
VEDANTA LIMITED – Q2 FY2018 RESULTS PRESENTATION 8 CAPITAL MARKETS DAY, MARCH 2015 Vedanta Limited Q2 FY2018 Results 2 November 2017 Financial Update Arun Kumar Chief Financial Officer Empowering Growth
|
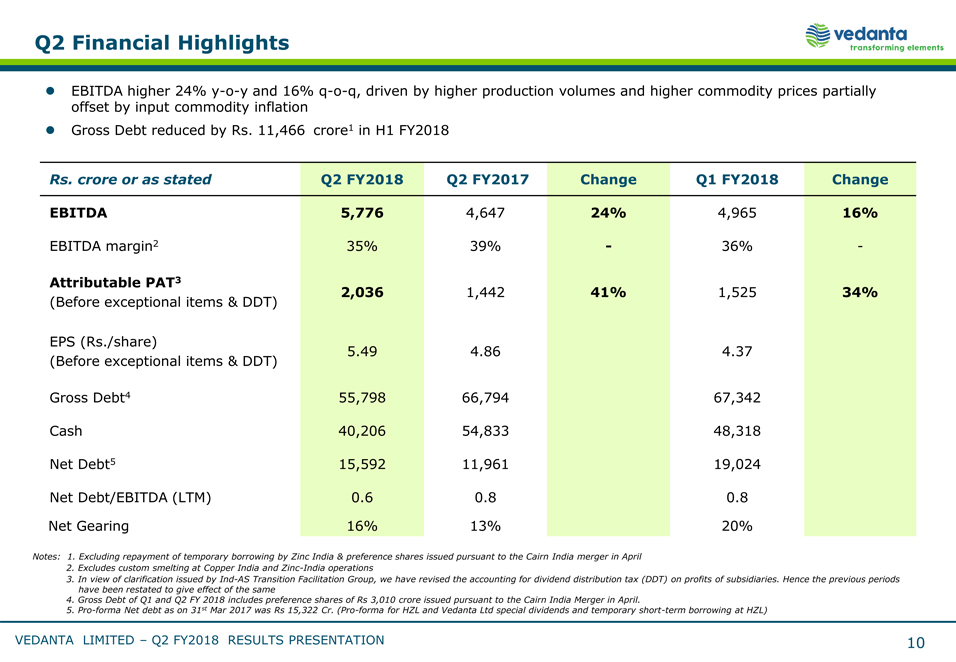 |
Q2 Financial Highlights EBITDA higher 24% y- o- y and 16% q- o- q, driven by higher production volumes and higher commodity prices partially offset by input commodity inflation Gross Debt reduced by Rs. 11,466 crore1 in H1 FY2018 Rs. crore or as stated Q2 FY2018 Q2 FY2017 Change Q1 FY2018 Change EBITDA 5,776 4,647 24% 4,965 16% EBITDA margin2 35% 39% - 36% - Attributable PAT3 (Before exceptional items & DDT) 2,036 1,442 41% 1,525 34% EPS (Rs./share) 5.49 4.86 4.37 (Before exceptional items & DDT) Gross Debt4 55,798 66,794 67,342 Cash 40,206 54,833 48,318 Net Debt5 15,592 11,961 19,024 Net Debt/EBITDA (LTM) 0.6 0.8 0.8 Net Gearing 16% 13% 20% Notes: 1. Excluding repayment of temporary borrowing by Zinc India & preference shares issued pursuant to the Cairn India merger in April Excludes custom smelting at Copper India and Zinc- India operations In view of clarification issued by Ind- AS Transition Facilitation Group, we have revised the accounting for dividend distribution tax (DDT) on profits of subsidiaries. Hence the previous periods have been restated to give effect of the same Gross Debt of Q1 and Q2 FY 2018 includes preference shares of Rs 3,010 crore issued pursuant to the Cairn India Merger in April. Pro- forma Net debt as on 31st Mar 2017 was Rs 15,322 Cr. (Pro- forma for HZL and Vedanta Ltd special dividends and temporary short- term borrowing at HZL) VEDANTA LIMITED – Q2 FY2018 RESULTS PRESENTATION 10
|
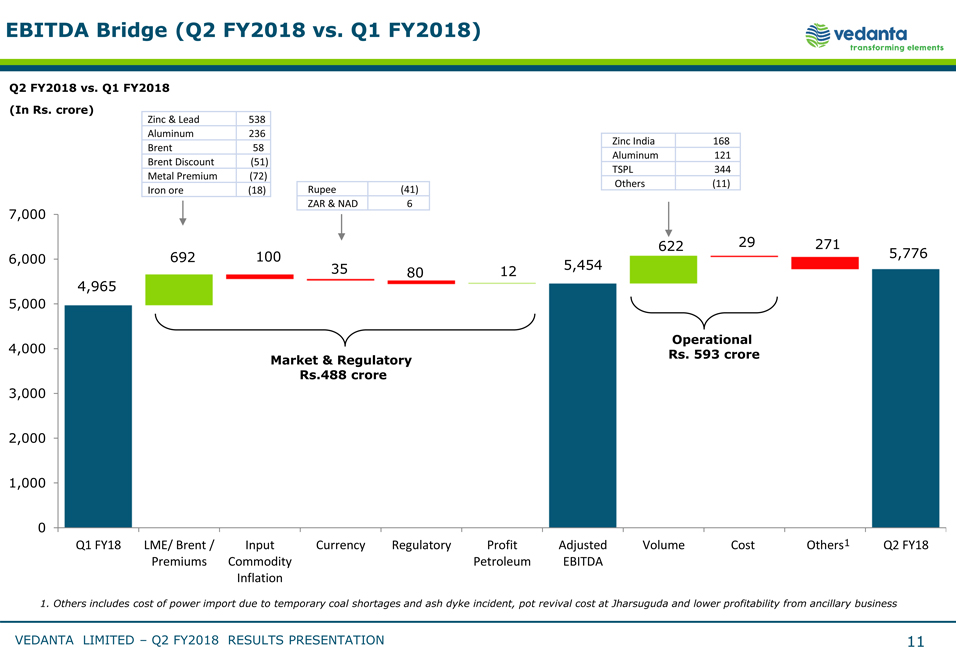 |
EBITDA Bridge (Q2 FY2018 vs. Q1 FY2018) Q2 FY2018 vs. Q1 FY2018 (In Rs. crore) Zinc & Lead 538 Aluminum 236 Zinc India 168 Brent 58 Aluminum 121 Brent Discount (51) TSPL 344 Metal Premium (72) Iron ore (18) Rupee (41) Others (11) ZAR & NAD 6 7,000 622 29 271 6,000 692 100 5,776 35 80 12 5,454 4,965 5,000 Operational 4,000 Market & Regulatory Rs. 593 crore Rs.488 crore 3,000 2,000 1,000 0 Q1 FY18 LME/ Brent / Input Currency Regulatory Profit Adjusted Volume Cost Others1 Q2 FY18 Premiums Commodity Petroleum EBITDA Inflation 1. Others includes cost of power import due to temporary coal shortages and ash dyke incident, pot revival cost at Jharsuguda and lower profitability from ancillary business VEDANTA LIMITED – Q2 FY2018 RESULTS PRESENTATION 11
|
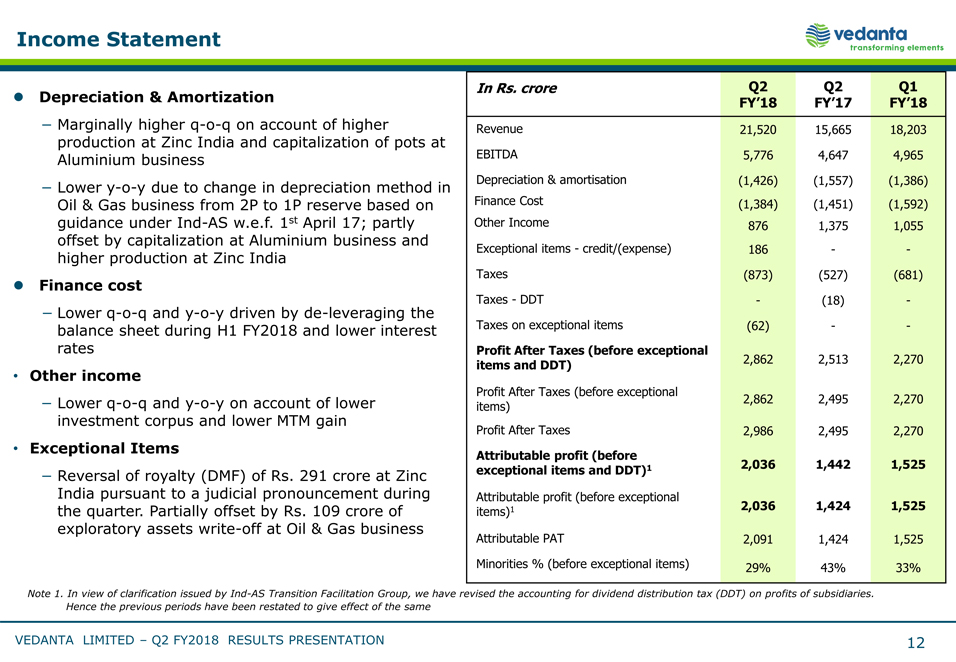 |
Income Statement Depreciation & Amortization Marginally higher q- o- q on account of higher production at Zinc India and capitalization of pots at Aluminium business Lower y- o- y due to change in depreciation method in Oil & Gas business from 2P to 1P reserve based on guidance under Ind- AS w.e.f. 1st April 17; partly offset by capitalization at Aluminium business and higher production at Zinc India Finance cost Lower q- o- q and y- o- y driven by de- leveraging the balance sheet during H1 FY2018 and lower interest rates Other income Lower q- o- q and y- o- y on account of lower investment corpus and lower MTM gain Exceptional Items Reversal of royalty (DMF) of Rs. 291 crore at Zinc India pursuant to a judicial pronouncement during the quarter. Partially offset by Rs. 109 crore of exploratory assets write- off at Oil & Gas business In Rs. crore Q2 Q2 Q1 FY’18 FY’17 FY’18 Revenue EBITDA Depreciation & amortisation Finance Cost Other Income Exceptional items - credit/(expense) Taxes Taxes - DDT Taxes on exceptional items Profit After Taxes (before exceptional items and DDT) Profit After Taxes (before exceptional items) Profit After Taxes Attributable profit (before exceptional items and DDT)1 Attributable profit (before exceptional items)1 Attributable PAT Minorities % (before exceptional items) 21,520 15,665 18,203 5,776 4,647 4,965 (1,426) (1,557) (1,386) (1,384) (1,451) (1,592) 876 1,375 1,055 186 - - (873) (527) (681) - (18) - (62) - - 2,862 2,513 2,270 2,862 2,495 2,270 2,986 2,495 2,270 2,036 1,442 1,525 2,036 1,424 1,525 2,091 1,424 1,525 29% 43% 33% Note 1. In view of clarification issued by Ind- AS Transition Facilitation Group, we have revised the accounting for dividend distribution tax (DDT) on profits of subsidiaries. Hence the previous periods have been restated to give effect of the same VEDANTA LIMITED – Q2 FY2018 RESULTS PRESENTATION 12
|
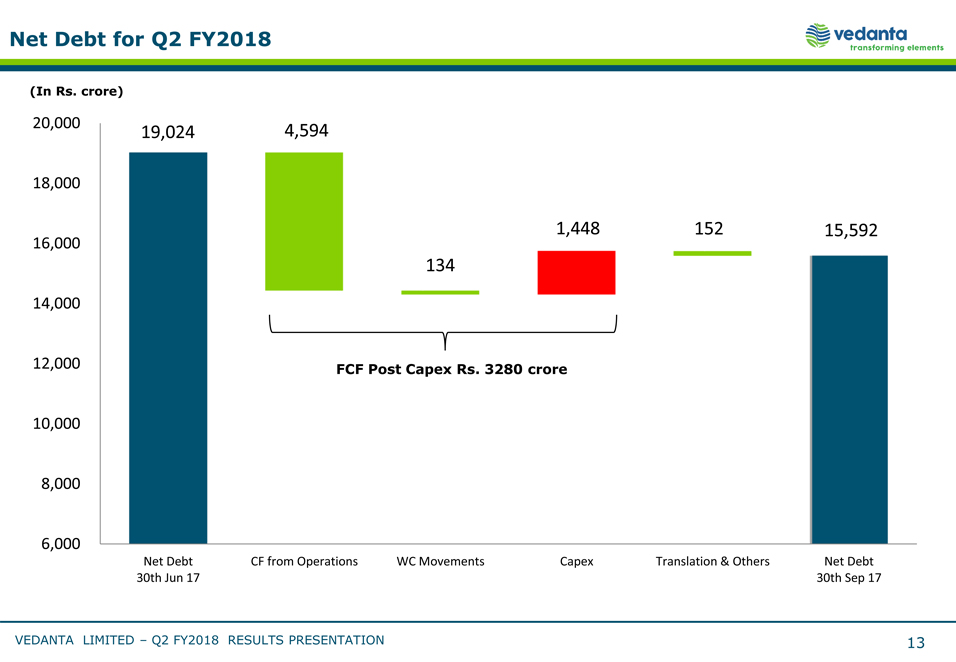 |
Net Debt for Q2 FY2018 (In Rs. crore) 20,000 19,024 4,594 18,000 1,448 152 15,592 16,000 134 14,000 12,000 FCF Post Capex Rs. 3280 crore 10,000 8,000 6,000 Net Debt CF from Operations WC Movements Capex Translation & Others Net Debt 30th Jun 17 30th Sep 17 VEDANTA LIMITED – Q2 FY2018 RESULTS PRESENTATION 13
|
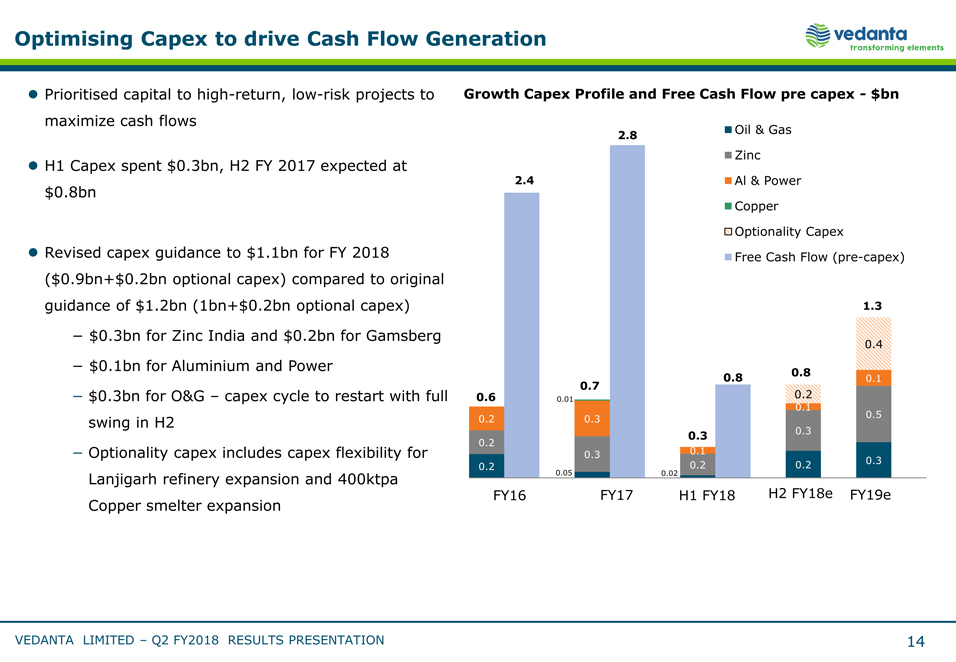 |
Optimising Capex to drive Cash Flow Generation Prioritised capital to high- return, low- risk projects to maximize cash flows H1 Capex spent $0.3bn, H2 FY 2017 expected at $0.8bn Revised capex guidance to $1.1bn for FY 2018 ($0.9bn+$0.2bn optional capex) compared to original guidance of $1.2bn (1bn+$0.2bn optional capex) $0.3bn for Zinc India and $0.2bn for Gamsberg $0.1bn for Aluminium and Power $0.3bn for O&G – capex cycle to restart with full swing in H2 Optionality capex includes capex flexibility for Lanjigarh refinery expansion and 400ktpa Copper smelter expansion Growth Capex Profile and Free Cash Flow pre capex - $bn 2.8 Oil & Gas Zinc 2.4 Al & Power Copper Optionality Capex Free Cash Flow (pre- capex) 1.3 0.4 0.8 0.8 0.1 0.7 0.6 0.01 0.2 0.1 0.2 0.3 0.5 0.3 0.3 0.2 0.3 0.1 0.3 0.2 0.05 0.02 0.2 0.2 FY16 FY17 H1 FY18 H2 FY18e FY19e VEDANTA LIMITED – Q2 FY2018 RESULTS PRESENTATION 14
|
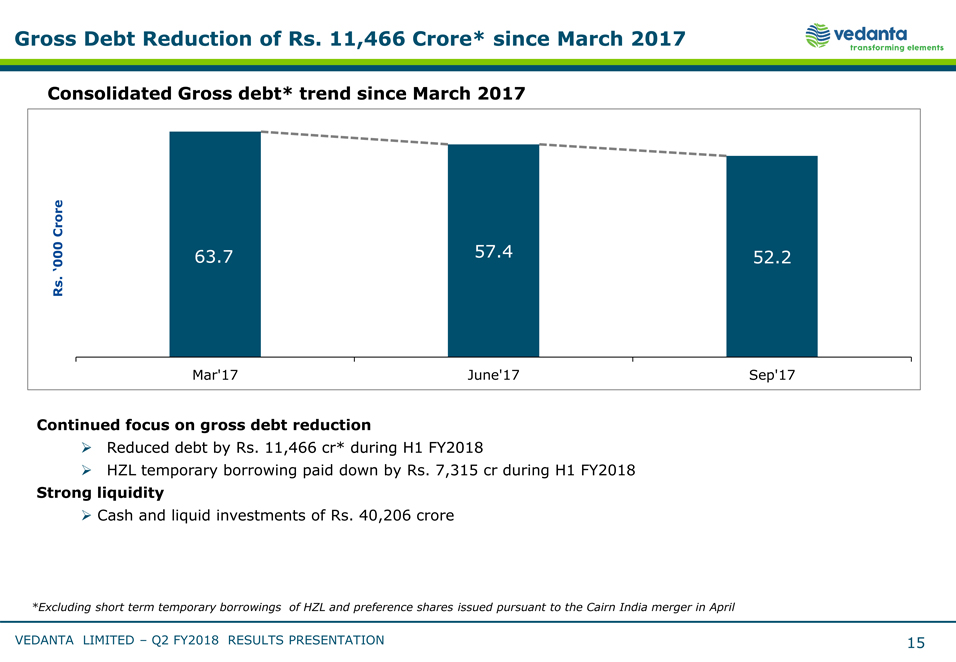 |
Gross Debt Reduction of Rs. 11,466 Crore* since March 2017 Consolidated Gross debt* trend since March 2017 Crore ‘000 63.7 57.4 52.2 . Rs Mar’17 June’17 Sep’17 Continued focus on gross debt reduction Reduced debt by Rs. 11,466 cr* during H1 FY2018 HZL temporary borrowing paid down by Rs. 7,315 cr during H1 FY2018 Strong liquidity Cash and liquid investments of Rs. 40,206 crore *Excluding short term temporary borrowings of HZL and preference shares issued pursuant to the Cairn India merger in April VEDANTA LIMITED – Q2 FY2018 RESULTS PRESENTATION 15
|
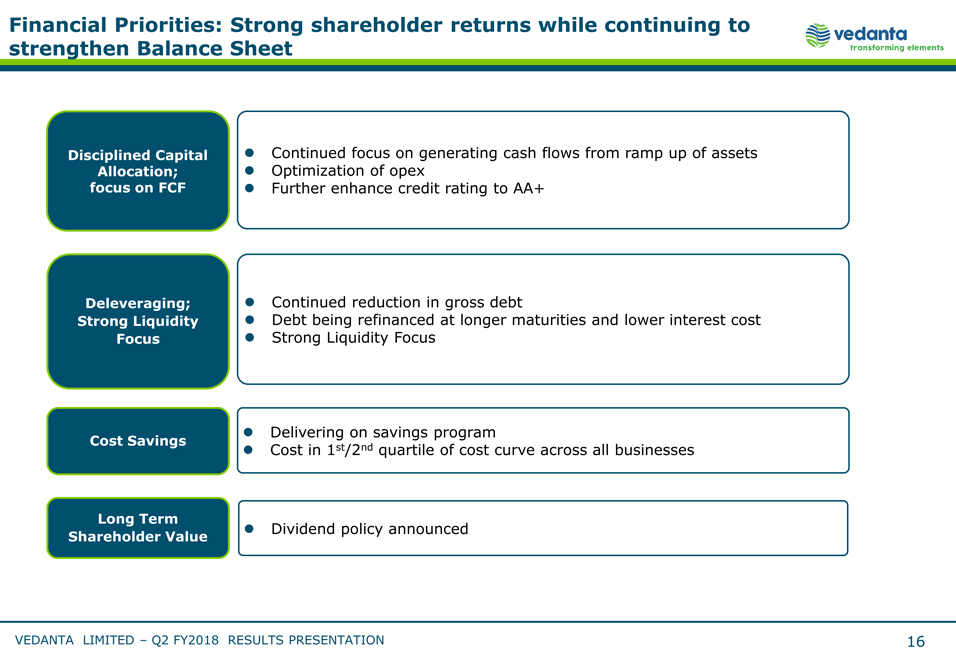 |
Financial Priorities: Strong shareholder returns while continuing to strengthen Balance Sheet Disciplined Capital Allocation; focus on FCF Deleveraging; Strong Liquidity Focus Cost Savings Long Term Shareholder Value Continued focus on generating cash flows from ramp up of assets Optimization of opex Further enhance credit rating to AA+ Continued reduction in gross debt Debt being refinanced at longer maturities and lower interest cost Strong Liquidity Focus Delivering on savings program Cost in 1st/2nd quartile of cost curve across all businesses Dividend policy announced VEDANTA LIMITED – Q2 FY2018 RESULTS PRESENTATION 16
Vedanta Limited Q2 FY2018 Results 2 November 2017 Business Review Kuldip Kaura, Chief Executive Officer Sudhir Mathur, Acting CEO – Cairn Oil & Gas Operational Excellence
|
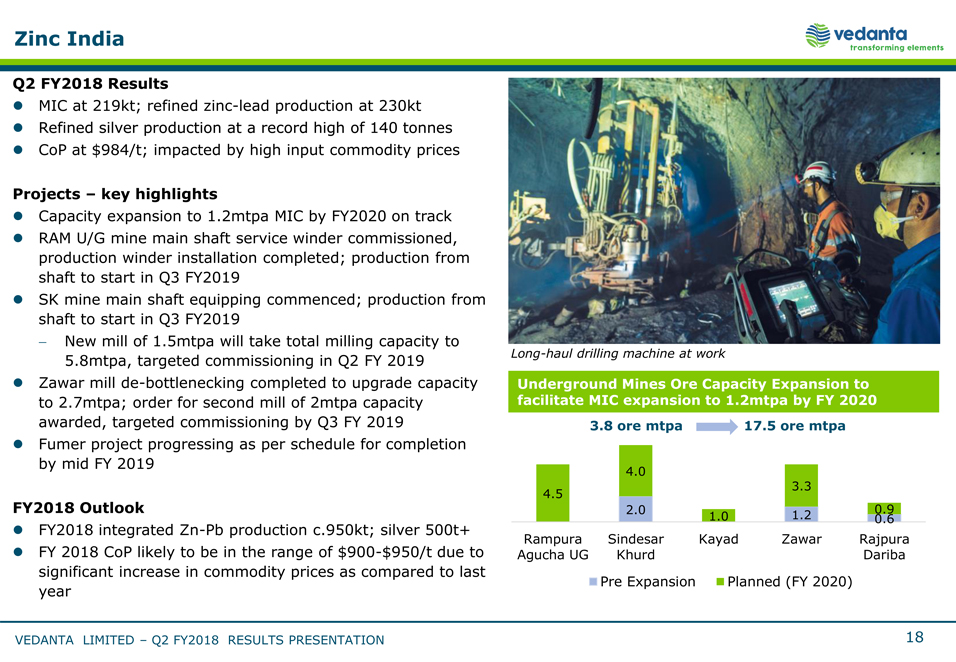 |
Zinc India Q2 FY2018 Results MIC at 219kt; refined zinc- lead production at 230kt Refined silver production at a record high of 140 tonnes CoP at $984/t; impacted by high input commodity prices Projects – key highlights Capacity expansion to 1.2mtpa MIC by FY2020 on track RAM U/G mine main shaft service winder commissioned, production winder installation completed; production from shaft to start in Q3 FY2019 SK mine main shaft equipping commenced; production from shaft to start in Q3 FY2019 New mill of 1.5mtpa will take total milling capacity to 5.8mtpa, targeted commissioning in Q2 FY 2019 Zawar mill de- bottlenecking completed to upgrade capacity to 2.7mtpa; order for second mill of 2mtpa capacity awarded, targeted commissioning by Q3 FY 2019 Fumer project progressing as per schedule for completion by mid FY 2019 FY2018 Outlook FY2018 integrated Zn- Pb production c.950kt; silver 500t+ FY 2018 CoP likely to be in the range of $900- $950/t due to significant increase in commodity prices as compared to last year [Graphic Appears Here] Rampura Sindesar Kayad Zawar Rajpura Agucha UG Khurd Dariba Pre Expansion Planned (FY 2020) VEDANTA LIMITED – Q2 FY2018 RESULTS PRESENTATION 18
|
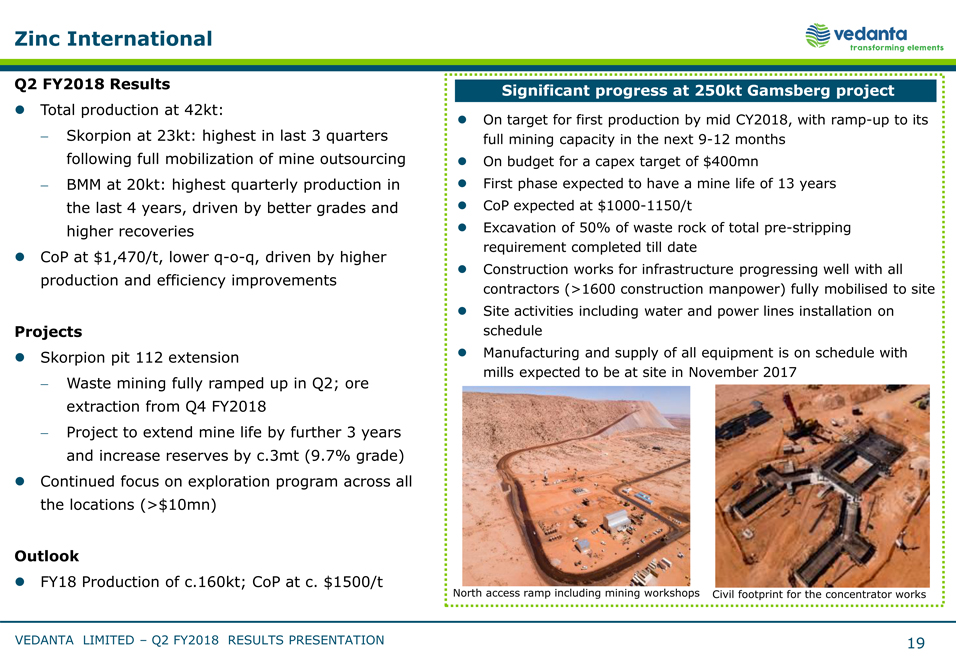 |
Zinc International Q2 FY2018 Results Significant progress at 250kt Gamsberg project Total production at 42kt: On target for first production by mid CY2018, with ramp- up to its Skorpion at 23kt: highest in last 3 quarters full mining capacity in the next 9- 12 months following full mobilization of mine outsourcing On budget for a capex target of $400mn BMM at 20kt: highest quarterly production in First phase expected to have a mine life of 13 years the last 4 years, driven by better grades and CoP Contractor expected at Camp $1000- 1150/t higher recoveries Excavation of 50% of waste rock of total pre- stripping CoP at $1,470/t, lower q- o- q, driven by higher requirement completed till date Construction works for infrastructure progressing well with all production and efficiency improvements contractors (>1600 construction manpower) fully mobilised to site Site activities including water and power lines installation on Projects schedule Skorpion pit 112 extension Manufacturing and supply of all equipment is on schedule with mills expected to be at site in November 2017 Waste mining fully ramped up in Q2; ore extraction from Q4 FY2018 Project to extend mine life by further 3 years and increase reserves by c.3mt (9.7% grade) Continued focus on exploration program across all the locations (>$10mn) Outlook FY18 Production of c.160kt; CoP at c. $1500/t North access ramp including mining workshops Civil footprint for the concentrator works VEDANTA LIMITED – Q2 FY2018 RESULTS PRESENTATION 19
|
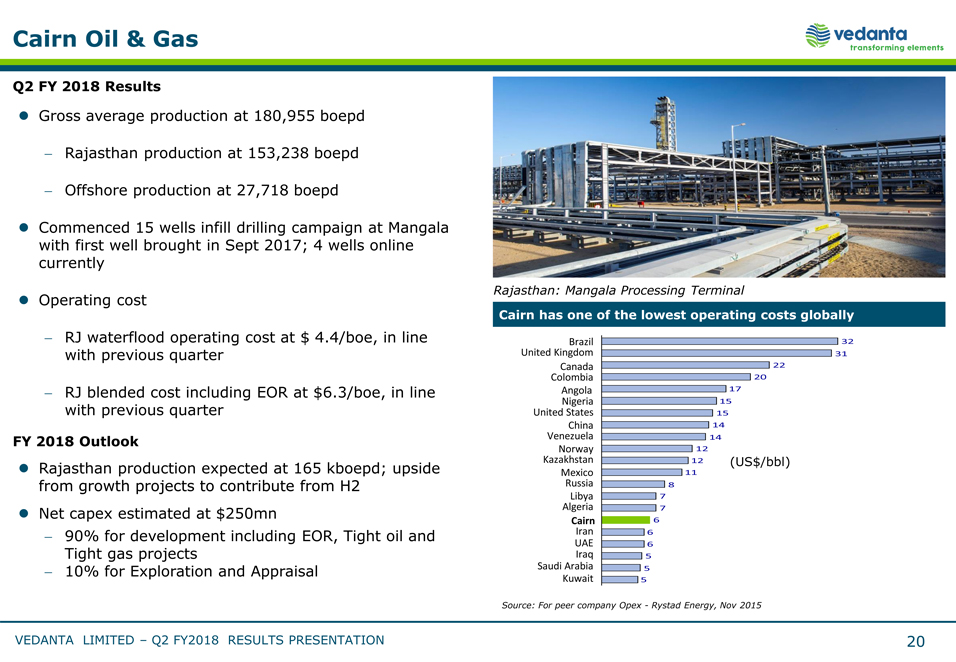 |
Cairn Oil & Gas Q2 FY 2018 Results Gross average production at 180,955 boepd Rajasthan production at 153,238 boepd Offshore production at 27,718 boepd Commenced 15 wells infill drilling campaign at Mangala with first well brought in Sept 2017; 4 wells online currently Operating cost RJ waterflood operating cost at $ 4.4/boe, in line with previous quarter RJ blended cost including EOR at $6.3/boe, in line with previous quarter FY 2018 Outlook Rajasthan production expected at 165 kboepd; upside from growth projects to contribute from H2 Net capex estimated at $250mn 90% for development including EOR, Tight oil and Tight gas projects 10% for Exploration and Appraisal Source: For peer company Opex - Rystad Energy, Nov 2015 VEDANTA LIMITED – Q2 FY2018 RESULTS PRESENTATION 20
|
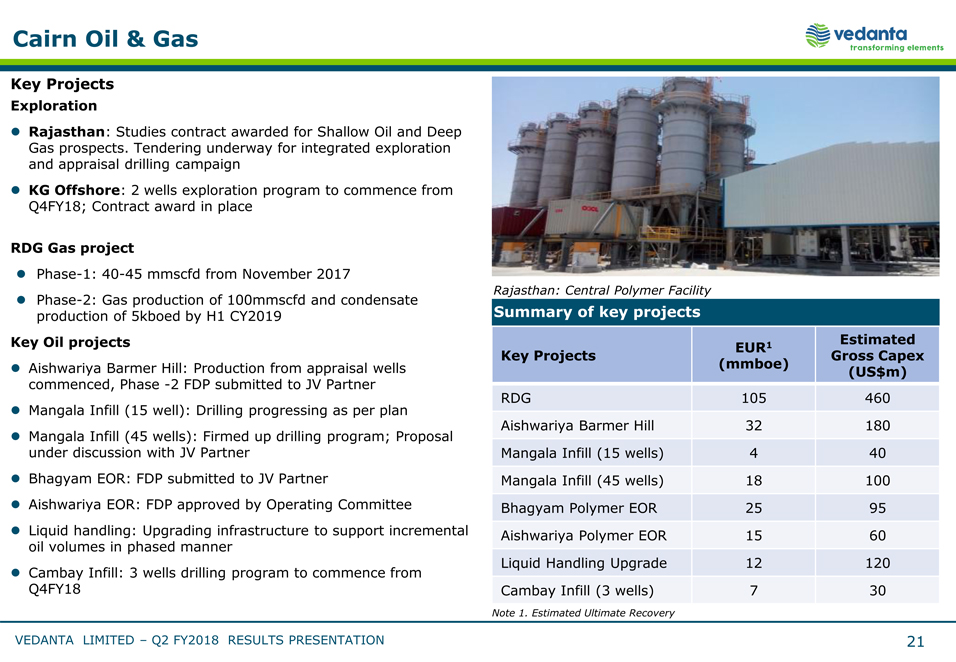 |
Rajasthan: Mangala Processing Terminal Cairn has one of the lowest operating costs globally Brazil 32 United Kingdom 31 Canada 22 Colombia MPT: 20 Facility modifications Angola 17 Nigeria 15 United States 15 China 14 Venezuela 14 Norway 12 Kazakhstan 12 (US$/bbl) Mexico 11 Russia 8 Libya 7 Algeria 7 Cairn 6 Iran 6 UAE 6 Iraq 5 Saudi Arabia 5 Kuwait 5 Cairn Oil & Gas Key Projects Exploration Rajasthan: Studies contract awarded for Shallow Oil and Deep Gas prospects. Tendering underway for integrated exploration and appraisal drilling campaign KG Offshore: 2 wells exploration program to commence from Q4FY18; Contract award in place RDG Gas project Phase- 1: 40- 45 mmscfd from November 2017 Phase- 2: Gas production of 100mmscfd and condensate production of 5kboed by H1 CY2019 Key Oil projects Aishwariya Barmer Hill: Production from appraisal wells commenced, Phase - 2 FDP submitted to JV Partner Mangala Infill (15 well): Drilling progressing as per plan Mangala Infill (45 wells): Firmed up drilling program; Proposal under discussion with JV Partner Bhagyam EOR: FDP submitted to JV Partner Aishwariya EOR: FDP approved by Operating Committee Liquid handling: Upgrading infrastructure to support incremental oil volumes in phased manner Cambay Infill: 3 wells drilling program to commence from Q4FY18 Rajasthan: Central Polymer Facility Summary of key projects EUR1 Estimated Key Projects Gross Capex (mmboe) (US$m) RDG 105 460 Aishwariya Barmer Hill 32 180 Mangala Infill (15 wells) 4 40 Mangala Infill (45 wells) 18 100 Bhagyam Polymer EOR 25 95 Aishwariya Polymer EOR 15 60 Liquid Handling Upgrade 12 120 Cambay Infill (3 wells) 7 30 Note 1. Estimated Ultimate Recovery VEDANTA LIMITED – Q2 FY2018 RESULTS PRESENTATION 21
|
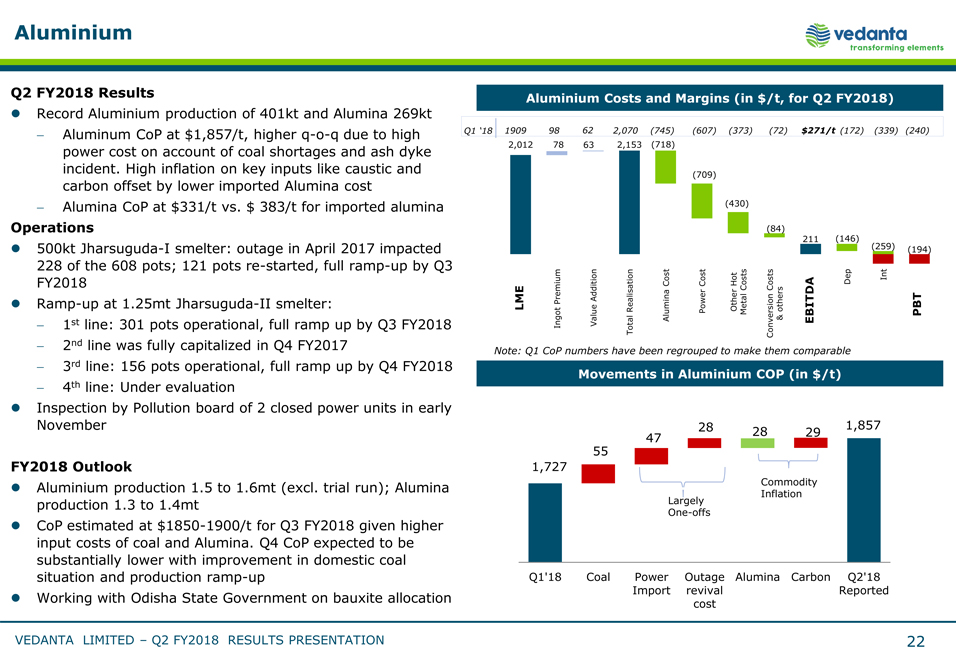 |
Aluminium Q2 FY2018 Results Record Aluminium production of 401kt and Alumina 269kt Aluminum CoP at $1,857/t, higher q- o- q due to high power cost on account of coal shortages and ash dyke incident. High inflation on key inputs like caustic and carbon offset by lower imported Alumina cost Alumina CoP at $331/t vs. $ 383/t for imported alumina Operations 500kt Jharsuguda- I smelter: outage in April 2017 impacted 228 of the 608 pots; 121 pots re- started, full ramp- up by Q3 FY2018 Ramp- up at 1.25mt Jharsuguda- II smelter: 1st line: 301 pots operational, full ramp up by Q3 FY2018 2nd line was fully capitalized in Q4 FY2017 3rd line: 156 pots operational, full ramp up by Q4 FY2018 4th line: Under evaluation Inspection by Pollution board of 2 closed power units in early November FY2018 Outlook Aluminium production 1.5 to 1.6mt (excl. trial run); Alumina production 1.3 to 1.4mt CoP estimated at $1850- 1900/t for Q3 FY2018 given higher input costs of coal and Alumina. Q4 CoP expected to be substantially lower with improvement in domestic coal situation and production ramp- up Working with Odisha State Government on bauxite allocation Aluminium Costs and Margins (in $/t, for Q2 FY2018) Q1 ‘18 1909 98 62 2,070 (745) (607) (373) (72) $271/t (172) (339) (240) 2,012 78 63 2,153 (718) (709) (430) (84) 211 (146) (259) (194) Cost Cost Hot Dep Int Costs Costs Addition EBITDA LMEPremium Realisation Power Other others Ingot Value Alumina Metal & EBITDA PBT Total Conversion Note: Q1 CoP numbers have been regrouped to make them comparable Movements in Aluminium COP (in $/t) 28 1,857 28 29 47 55 1,727 Commodity Inflation Largely One- offs Q1’18 Coal Power Outage Alumina Carbon Q2’18 Import revival Reported cost VEDANTA LIMITED – Q2 FY2018 RESULTS PRESENTATION 22
|
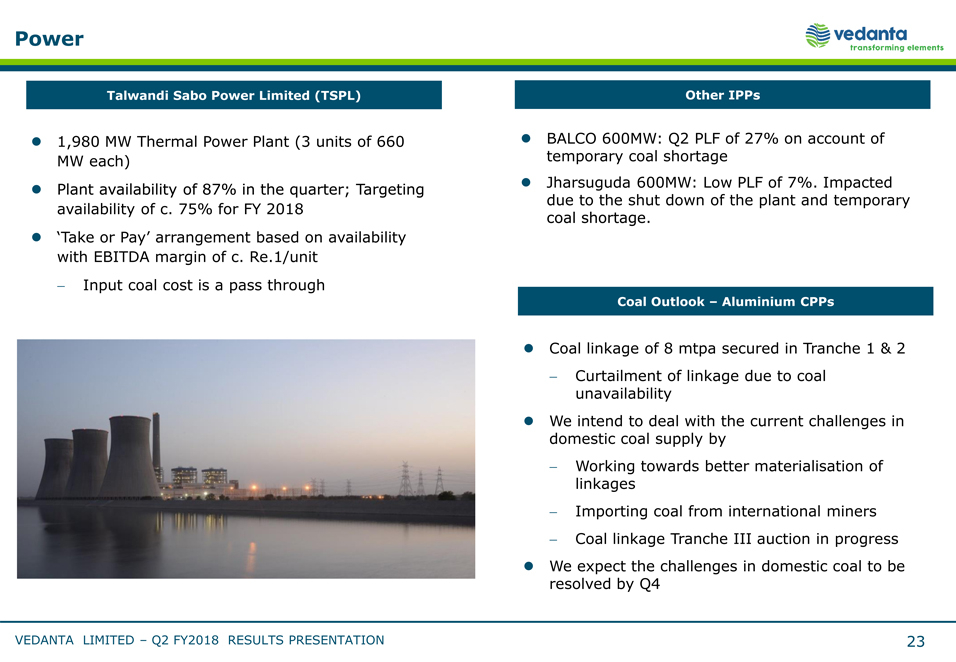 |
Power Talwandi Sabo Power Limited (TSPL) 1,980 MW Thermal Power Plant (3 units of 660 MW each) Plant availability of 87% in the quarter; Targeting availability of c. 75% for FY 2018 ‘Take or Pay’ arrangement based on availability with EBITDA margin of c. Re.1/unit Input coal cost is a pass through [Graphic Appears Here] Other IPPs BALCO 600MW: Q2 PLF of 27% on account of temporary coal shortage Jharsuguda 600MW: Low PLF of 7%. Impacted due to the shut down of the plant and temporary coal shortage. Coal Outlook – Aluminium CPPs Coal linkage of 8 mtpa secured in Tranche 1 & 2 Curtailment of linkage due to coal unavailability We intend to deal with the current challenges in domestic coal supply by Working towards better materialisation of linkages Importing coal from international miners Coal linkage Tranche III auction in progress We expect the challenges in domestic coal to be resolved by Q4 VEDANTA LIMITED – Q2 FY2018 RESULTS PRESENTATION 23
|
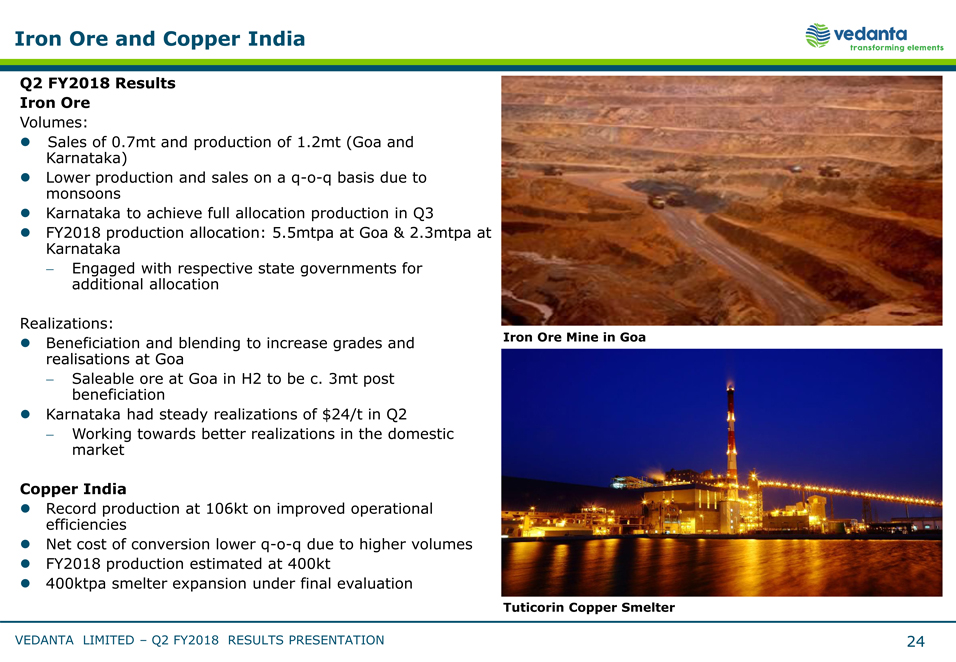 |
Iron Ore and Copper India Q2 FY2018 Results Iron Ore Volumes: Sales of 0.7mt and production of 1.2mt (Goa and Karnataka) Lower production and sales on a q- o- q basis due to monsoons Karnataka to achieve full allocation production in Q3 FY2018 production allocation: 5.5mtpa at Goa & 2.3mtpa at Karnataka Engaged with respective state governments for additional allocation Realizations: Beneficiation and blending to increase grades and Iron Ore Mine in Goa realisations at Goa Saleable ore at Goa in H2 to be c. 3mt post beneficiation Karnataka had steady realizations of $24/t in Q2 Working towards better realizations in the domestic market Copper India Record production at 106kt on improved operational efficiencies Net cost of conversion lower q- o- q due to higher volumes FY2018 production estimated at 400kt 400ktpa smelter expansion under final evaluation Tuticorin Copper Smelter VEDANTA LIMITED – Q2 FY2018 RESULTS PRESENTATION 24
|
 |
Strategic Priorities Production Growth and Asset optimisation Optimise Capital Allocation and Maintain Strong Balance Sheet Protect and preserve our License to Operate Identify next generation of Resources VEDANTA LIMITED – Q2 FY2018 RESULTS PRESENTATION 25
Vedanta Limited Q2 FY2018 Results 2 November 2017 Appendix
|
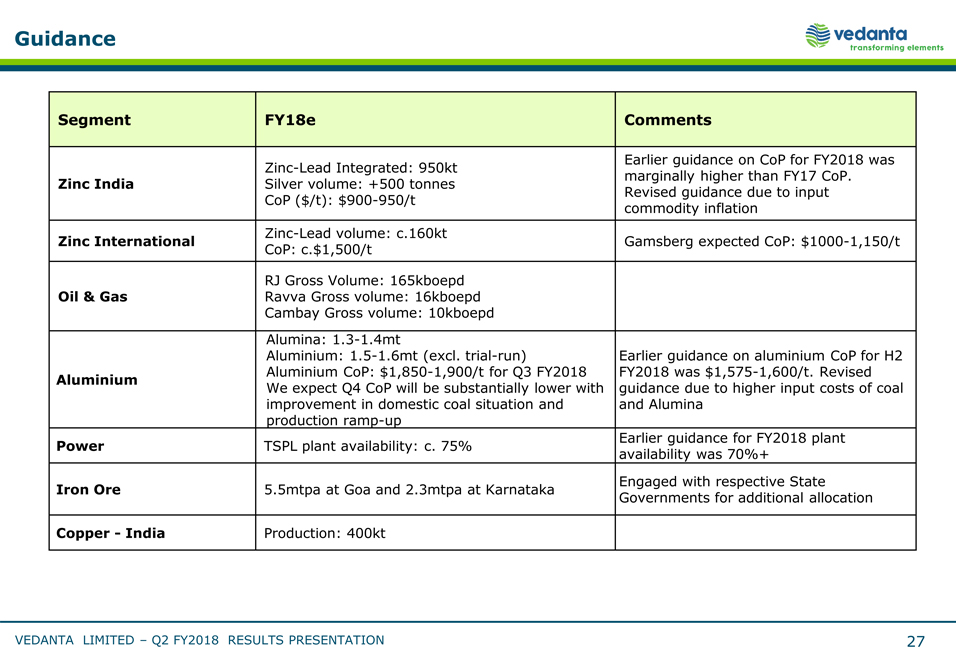 |
Guidance Segment FY18e Comments Zinc- Lead Integrated: 950kt Earlier guidance on CoP for FY2018 was Zinc India Silver volume: +500 tonnes marginally higher than FY17 CoP. CoP ($/t): $900- 950/t Revised guidance due to input commodity inflation Zinc- Lead volume: c.160kt Zinc International Gamsberg expected CoP: $1000- 1,150/t CoP: c.$1,500/t RJ Gross Volume: 165kboepd Oil & Gas Ravva Gross volume: 16kboepd Cambay Gross volume: 10kboepd Alumina: 1.3- 1.4mt Aluminium: 1.5- 1.6mt (excl. trial- run) Earlier guidance on aluminium CoP for H2 Aluminium Aluminium CoP: $1,850- 1,900/t for Q3 FY2018 FY2018 was $1,575- 1,600/t. Revised We expect Q4 CoP will be substantially lower with guidance due to higher input costs of coal improvement in domestic coal situation and and Alumina production ramp- up Power TSPL plant availability: c. 75% Earlier guidance for FY2018 plant availability was 70%+ Engaged with respective State Iron Ore 5.5mtpa at Goa and 2.3mtpa at Karnataka Governments for additional allocation Copper - India Production: 400kt VEDANTA LIMITED – Q2 FY2018 RESULTS PRESENTATION 27
|
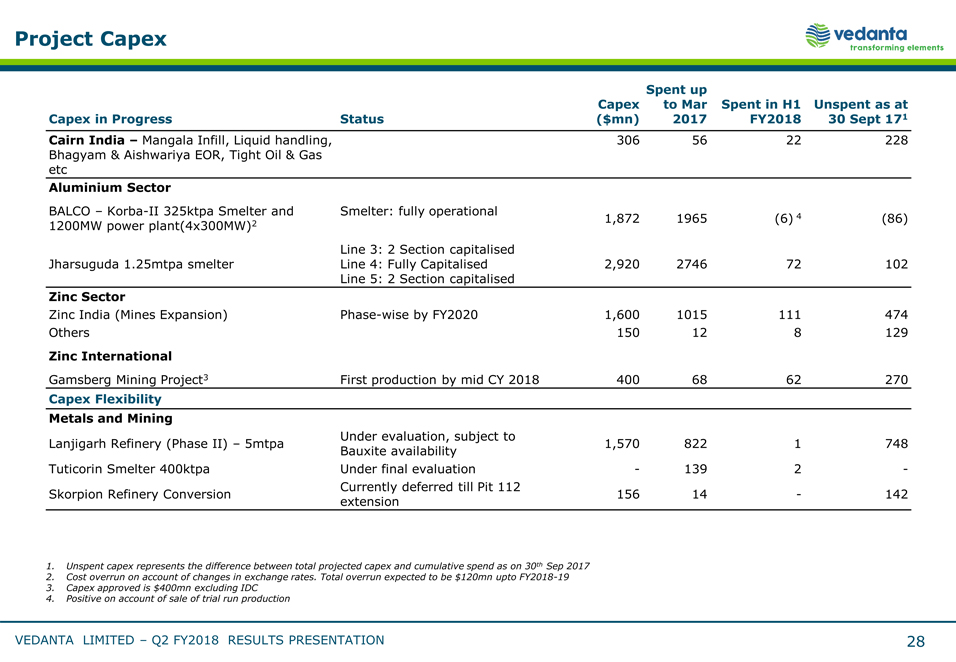 |
Project Capex Spent up Capex to Mar Spent in H1 Unspent as at Capex in Progress Status ($mn) 2017 FY2018 30 Sept 171 Cairn India – Mangala Infill, Liquid handling, 306 56 22 228 Bhagyam & Aishwariya EOR, Tight Oil & Gas etc Aluminium Sector BALCO – Korba- II 325ktpa Smelter and Smelter: fully operational 1,872 1965 (6) 4 (86) 1200MW power plant(4x300MW)2 Line 3: 2 Section capitalised Jharsuguda 1.25mtpa smelter Line 4: Fully Capitalised 2,920 2746 72 102 Line 5: 2 Section capitalised Zinc Sector Zinc India (Mines Expansion) Phase- wise by FY2020 1,600 1015 111 474 Others 150 12 8 129 Zinc International Gamsberg Mining Project3 First production by mid CY 2018 400 68 62 270 Capex Flexibility Metals and Mining Under evaluation, subject to Lanjigarh Refinery (Phase II) – 5mtpa 1,570 822 1 748 Bauxite availability Tuticorin Smelter 400ktpa Under final evaluation - 139 2 - Currently deferred till Pit 112 Skorpion Refinery Conversion 156 14 - 142 extension Unspent capex represents the difference between total projected capex and cumulative spend as on 30th Sep 2017 Cost overrun on account of changes in exchange rates. Total overrun expected to be $120mn upto FY2018- 19 Capex approved is $400mn excluding IDC Positive on account of sale of trial run production VEDANTA LIMITED – Q2 FY2018 RESULTS PRESENTATION 28
|
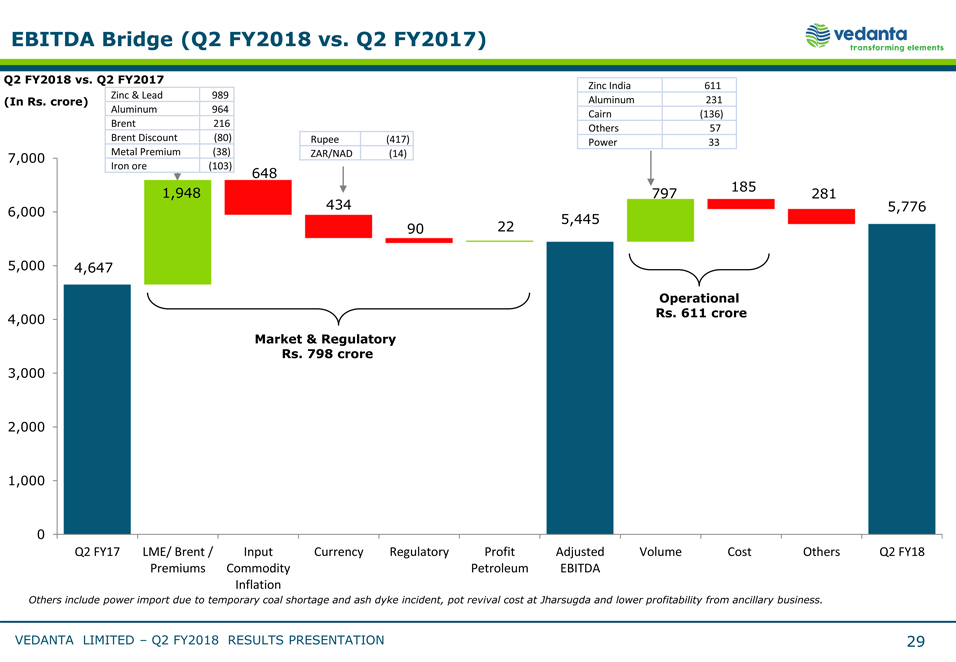 |
EBITDA Bridge (Q2 FY2018 vs. Q2 FY2017) Q2 FY2018 vs. Q2 FY2017 Zinc India 611 Zinc & Lead 989 (In Rs. crore) Aluminum 231 Aluminum 964 Cairn (136) Brent 216 Others 57 Brent Discount (80) Rupee (417) Power 33 7,000 Metal Premium (38) ZAR/NAD (14) Iron ore (103) 648 1,948 797 185 281 6,000 434 5,776 90 22 5,445 5,000 4,647 Operational 4,000 Rs. 611 crore Market & Regulatory Rs. 798 crore 3,000 2,000 1,000 0 Q2 FY17 LME/ Brent / Input Currency Regulatory Profit Adjusted Volume Cost Others Q2 FY18 Premiums Commodity Petroleum EBITDA Inflation Others include power import due to temporary coal shortage and ash dyke incident, pot revival cost at Jharsugda and lower profitability from ancillary business. VEDANTA LIMITED – Q2 FY2018 RESULTS PRESENTATION 29
|
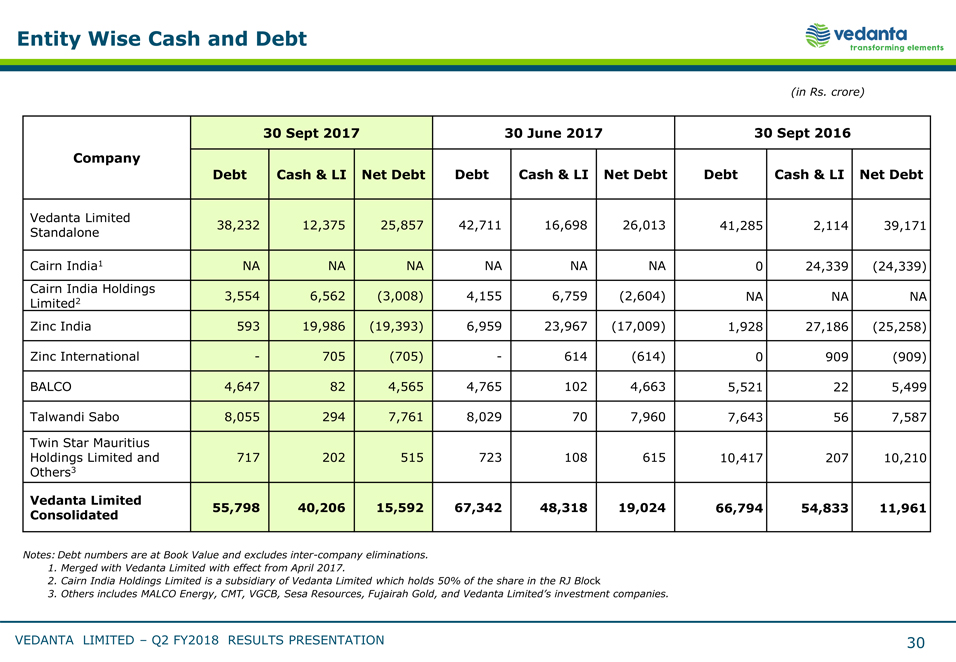 |
Entity Wise Cash and Debt (in Rs. crore) 30 Sept 2017 30 June 2017 30 Sept 2016 Company Debt Cash & LI Net Debt Debt Cash & LI Net Debt Debt Cash & LI Net Debt Vedanta Limited Standalone 38,232 12,375 25,857 42,711 16,698 26,013 41,285 2,114 39,171 Cairn India1 NA NA NA NA NA NA 0 24,339 (24,339) Cairn India Holdings Limited2 3,554 6,562 (3,008) 4,155 6,759 (2,604) NA NA NA Zinc India 593 19,986 (19,393) 6,959 23,967 (17,009) 1,928 27,186 (25,258) Zinc International - 705 (705) - 614 (614) 0 909 (909) BALCO 4,647 82 4,565 4,765 102 4,663 5,521 22 5,499 Talwandi Sabo 8,055 294 7,761 8,029 70 7,960 7,643 56 7,587 Twin Star Mauritius Holdings Limited and 717 202 515 723 108 615 10,417 207 10,210 Others3 Vedanta Limited Consolidated 55,798 40,206 15,592 67,342 48,318 19,024 66,794 54,833 11,961 Notes: Debt numbers are at Book Value and excludes inter- company eliminations. Merged with Vedanta Limited with effect from April 2017. Cairn India Holdings Limited is a subsidiary of Vedanta Limited which holds 50% of the share in the RJ Block Others includes MALCO Energy, CMT, VGCB, Sesa Resources, Fujairah Gold, and Vedanta Limited’s investment companies. VEDANTA LIMITED – Q2 FY2018 RESULTS PRESENTATION 30
|
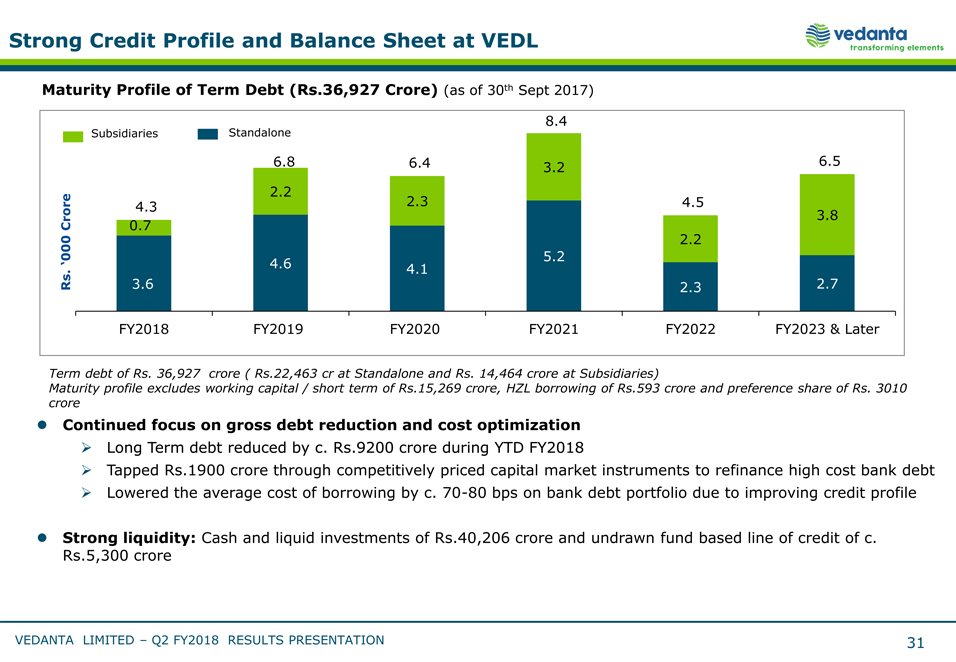 |
Strong Credit Profile and Balance Sheet at VEDL Maturity Profile of Term Debt (Rs.36,927 Crore) (as of 30th Sept 2017) 8.4 Subsidiaries Standalone 6.8 6.4 3.2 6.5 2.2 4.3 2.3 4.5 Crore 0.7 3.8 2.2 ‘000 5.2 4.6 4.1 . Rs 3.6 2.3 2.7 FY2018 FY2019 FY2020 FY2021 FY2022 FY2023 & Later Term debt of Rs. 36,927 crore ( Rs.22,463 cr at Standalone and Rs. 14,464 crore at Subsidiaries) Maturity profile excludes working capital / short term of Rs.15,269 crore, HZL borrowing of Rs.593 crore and preference share of Rs. 3010 crore Continued focus on gross debt reduction and cost optimization Long Term debt reduced by c. Rs.9200 crore during YTD FY2018 Tapped Rs.1900 crore through competitively priced capital market instruments to refinance high cost bank debt Lowered the average cost of borrowing by c. 70- 80 bps on bank debt portfolio due to improving credit profile Strong liquidity: Cash and liquid investments of Rs.40,206 crore and undrawn fund based line of credit of c. Rs.5,300 crore VEDANTA LIMITED – Q2 FY2018 RESULTS PRESENTATION 31
|
 |
Debt Breakdown & Funding Sources Diversified Funding Sources for Term Debt of $5.7bn (as of 30th Sept 2017) 1% [Graphic Appears Here] Term debt of $ 3.4bn at Standalone and $2.3bn at Subsidiaries, total consolidated $5.7bn Note: USD–INR: Rs. 65.3552 at 30 Sep 2017 Debt Breakdown (as of 30 Sept 2017) Debt breakdown as of 30 Sep (in $bn) 2017 Term debt 5.7 Working capital 0.1 Short term borrowing 2.1 Short term borrowing at HZL 0.1 Preference shares issued pursuant 0.5 to merger Total consolidated debt 8.5 Cash and Liquid Investments 6.2 Net Debt 2.4 Debt breakup ($8.5bn) - INR Debt 91% - USD Debt 9% VEDANTA LIMITED – Q2 FY2018 RESULTS PRESENTATION 32
|
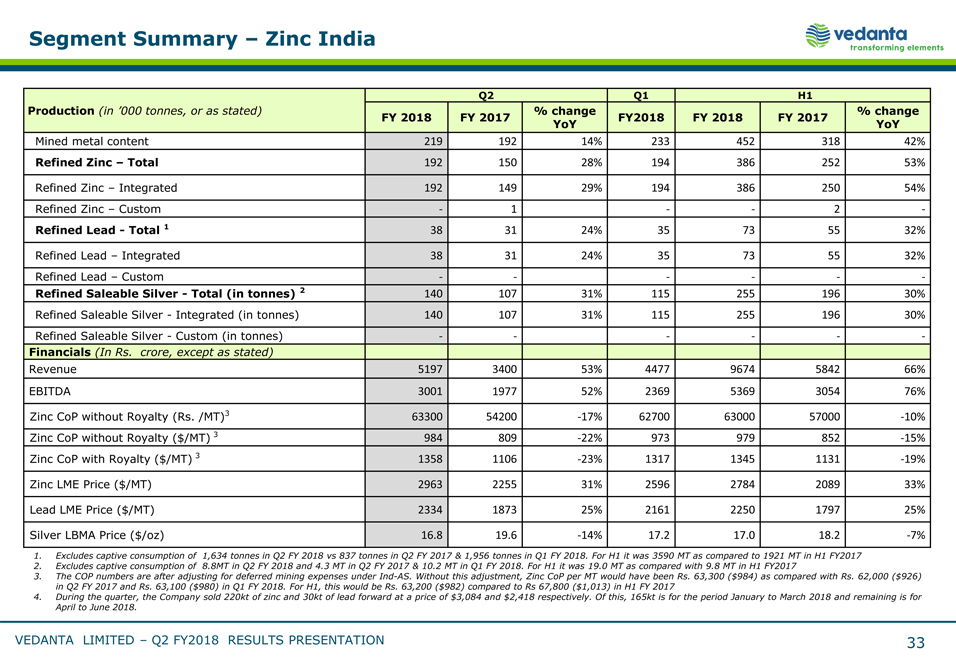 |
Segment Summary – Zinc India Q2 Q1 H1 Production (in ‘000 tonnes, or as stated) % change % change FY 2018 FY 2017 FY2018 FY 2018 FY 2017 YoY YoY Mined metal content 219 192 14% 233 452 318 42% Refined Zinc – Total 192 150 28% 194 386 252 53% Refined Zinc – Integrated 192 149 29% 194 386 250 54% Refined Zinc – Custom - 1 - - 2 - Refined Lead - Total 1 38 31 24% 35 73 55 32% Refined Lead – Integrated 38 31 24% 35 73 55 32% Refined Lead – Custom - - - - - - Refined Saleable Silver - Total (in tonnes) 2 140 107 31% 115 255 196 30% Refined Saleable Silver - Integrated (in tonnes) 140 107 31% 115 255 196 30% Refined Saleable Silver - Custom (in tonnes) - - - - - - Financials (In Rs. crore, except as stated) Revenue 5197 3400 53% 4477 9674 5842 66% EBITDA 3001 1977 52% 2369 5369 3054 76% Zinc CoP without Royalty (Rs. /MT)3 63300 54200 - 17% 62700 63000 57000 - 10% Zinc CoP without Royalty ($/MT) 3 984 809 - 22% 973 979 852 - 15% Zinc CoP with Royalty ($/MT) 3 1358 1106 - 23% 1317 1345 1131 - 19% Zinc LME Price ($/MT) 2963 2255 31% 2596 2784 2089 33% Lead LME Price ($/MT) 2334 1873 25% 2161 2250 1797 25% Silver LBMA Price ($/oz) 16.8 19.6 - 14% 17.2 17.0 18.2 - 7% Excludes captive consumption of 1,634 tonnes in Q2 FY 2018 vs 837 tonnes in Q2 FY 2017 & 1,956 tonnes in Q1 FY 2018. For H1 it was 3590 MT as compared to 1921 MT in H1 FY2017 Excludes captive consumption of 8.8MT in Q2 FY 2018 and 4.3 MT in Q2 FY 2017 & 10.2 MT in Q1 FY 2018. For H1 it was 19.0 MT as compared with 9.8 MT in H1 FY2017 The COP numbers are after adjusting for deferred mining expenses under Ind- AS. Without this adjustment, Zinc CoP per MT would have been Rs. 63,300 ($984) as compared with Rs. 62,000 ($926) in Q2 FY 2017 and Rs. 63,100 ($980) in Q1 FY 2018. For H1, this would be Rs. 63,200 ($982) compared to Rs 67,800 ($1,013) in H1 FY 2017 During the quarter, the Company sold 220kt of zinc and 30kt of lead forward at a price of $3,084 and $2,418 respectively. Of this, 165kt is for the period January to March 2018 and remaining is for April to June 2018. VEDANTA LIMITED – Q2 FY2018 RESULTS PRESENTATION 33
|
 |
Segment Summary – Zinc International Q2 Q1 H1 Production (in’000 tonnes, or as stated) % change % change FY 2018 FY 2017 FY2018 FY 2018 FY 2017 YoY YoY Refined Zinc – Skorpion 23 23 0% 14 36 47 - 22% Mined metal content- BMM 20 16 23% 18 38 35 8% Mined metal content- Lisheen - - - - - - - Total 42 39 13% 32 74 82 - 9% Financials (In Rs. Crore, except as stated) Revenue 853 685 25% 801 1654 1138 45% EBITDA 389 339 15% 321 710 590 20% CoP – ($/MT) 1470 1446 - 2% 1690 1564 1331 18% Zinc LME Price ($/MT) 2963 2255 31% 2596 2784 2089 33% Lead LME Price ($/MT) 2334 1873 25% 2161 2250 1797 25% VEDANTA LIMITED – Q2 FY2018 RESULTS PRESENTATION 34
|
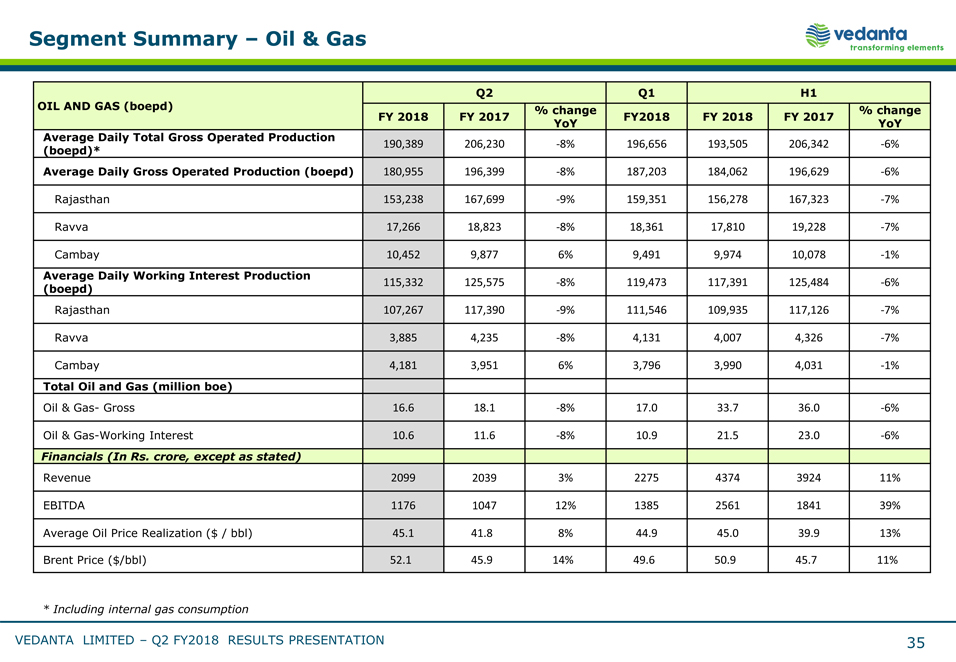 |
Segment Summary – Oil & Gas Q2 Q1 H1 OIL AND GAS (boepd) FY 2018 FY 2017 % change FY2018 FY 2018 FY 2017 % change YoY YoY Average Daily Total Gross Operated Production 190,389 206,230 - 8% 196,656 193,505 206,342 - 6% (boepd)* Average Daily Gross Operated Production (boepd) 180,955 196,399 - 8% 187,203 184,062 196,629 - 6% Rajasthan 153,238 167,699 - 9% 159,351 156,278 167,323 - 7% Ravva 17,266 18,823 - 8% 18,361 17,810 19,228 - 7% Cambay 10,452 9,877 6% 9,491 9,974 10,078 - 1% Average Daily Working Interest Production 115,332 125,575 - 8% 119,473 117,391 125,484 - 6% (boepd) Rajasthan 107,267 117,390 - 9% 111,546 109,935 117,126 - 7% Ravva 3,885 4,235 - 8% 4,131 4,007 4,326 - 7% Cambay 4,181 3,951 6% 3,796 3,990 4,031 - 1% Total Oil and Gas (million boe) Oil & Gas- Gross 16.6 18.1 - 8% 17.0 33.7 36.0 - 6% Oil & Gas- Working Interest 10.6 11.6 - 8% 10.9 21.5 23.0 - 6% Financials (In Rs. crore, except as stated) Revenue 2099 2039 3% 2275 4374 3924 11% EBITDA 1176 1047 12% 1385 2561 1841 39% Average Oil Price Realization ($ / bbl) 45.1 41.8 8% 44.9 45.0 39.9 13% Brent Price ($/bbl) 52.1 45.9 14% 49.6 50.9 45.7 11% * Including internal gas consumption VEDANTA LIMITED – Q2 FY2018 RESULTS PRESENTATION 35
|
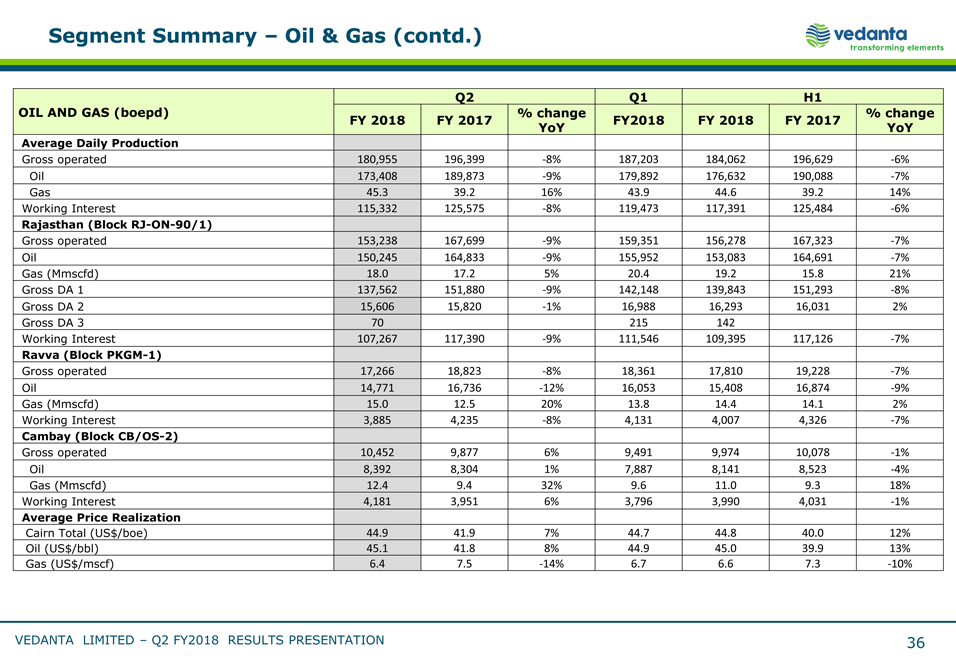 |
Segment Summary – Oil & Gas (contd.) Q2 Q1 H1 OIL AND GAS (boepd) % change % change FY 2018 FY 2017 FY2018 FY 2018 FY 2017 YoY YoY Average Daily Production Gross operated 180,955 196,399 - 8% 187,203 184,062 196,629 - 6% Oil 173,408 189,873 - 9% 179,892 176,632 190,088 - 7% Gas 45.3 39.2 16% 43.9 44.6 39.2 14% Working Interest 115,332 125,575 - 8% 119,473 117,391 125,484 - 6% Rajasthan (Block RJ- ON- 90/1) Gross operated 153,238 167,699 - 9% 159,351 156,278 167,323 - 7% Oil 150,245 164,833 - 9% 155,952 153,083 164,691 - 7% Gas (Mmscfd) 18.0 17.2 5% 20.4 19.2 15.8 21% Gross DA 1 137,562 151,880 - 9% 142,148 139,843 151,293 - 8% Gross DA 2 15,606 15,820 - 1% 16,988 16,293 16,031 2% Gross DA 3 70 215 142 Working Interest 107,267 117,390 - 9% 111,546 109,395 117,126 - 7% Ravva (Block PKGM- 1) Gross operated 17,266 18,823 - 8% 18,361 17,810 19,228 - 7% Oil 14,771 16,736 - 12% 16,053 15,408 16,874 - 9% Gas (Mmscfd) 15.0 12.5 20% 13.8 14.4 14.1 2% Working Interest 3,885 4,235 - 8% 4,131 4,007 4,326 - 7% Cambay (Block CB/OS- 2) Gross operated 10,452 9,877 6% 9,491 9,974 10,078 - 1% Oil 8,392 8,304 1% 7,887 8,141 8,523 - 4% Gas (Mmscfd) 12.4 9.4 32% 9.6 11.0 9.3 18% Working Interest 4,181 3,951 6% 3,796 3,990 4,031 - 1% Average Price Realization Cairn Total (US$/boe) 44.9 41.9 7% 44.7 44.8 40.0 12% Oil (US$/bbl) 45.1 41.8 8% 44.9 45.0 39.9 13% Gas (US$/mscf) 6.4 7.5 - 14% 6.7 6.6 7.3 - 10% VEDANTA LIMITED – Q2 FY2018 RESULTS PRESENTATION 36
|
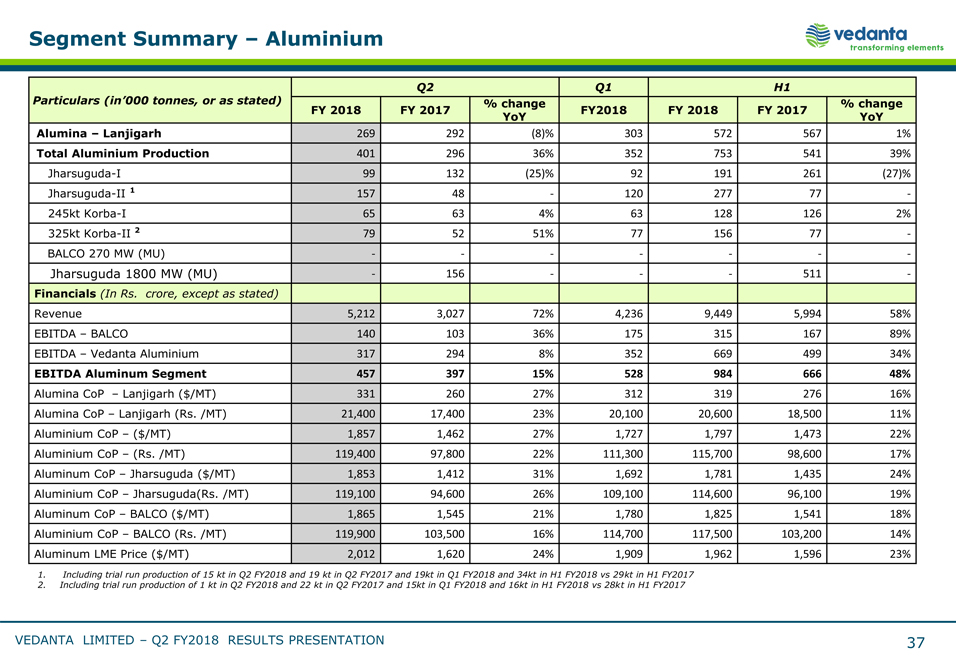 |
Segment Summary – Aluminium Q2 Q1 H1 Particulars (in’000 tonnes, or as stated) % change % change FY 2018 FY 2017 FY2018 FY 2018 FY 2017 YoY YoY Alumina – Lanjigarh 269 292 (8)% 303 572 567 1% Total Aluminium Production 401 296 36% 352 753 541 39% Jharsuguda- I 99 132 (25)% 92 191 261 (27)% Jharsuguda- II 1 157 48 - 120 277 77 - 245kt Korba- I 65 63 4% 63 128 126 2% 325kt Korba- II 2 79 52 51% 77 156 77 - BALCO 270 MW (MU) - - - - - - - Jharsuguda 1800 MW (MU) - 156 - - - 511 - Financials (In Rs. crore, except as stated) Revenue 5,212 3,027 72% 4,236 9,449 5,994 58% EBITDA – BALCO 140 103 36% 175 315 167 89% EBITDA – Vedanta Aluminium 317 294 8% 352 669 499 34% EBITDA Aluminum Segment 457 397 15% 528 984 666 48% Alumina CoP – Lanjigarh ($/MT) 331 260 27% 312 319 276 16% Alumina CoP – Lanjigarh (Rs. /MT) 21,400 17,400 23% 20,100 20,600 18,500 11% Aluminium CoP – ($/MT) 1,857 1,462 27% 1,727 1,797 1,473 22% Aluminium CoP – (Rs. /MT) 119,400 97,800 22% 111,300 115,700 98,600 17% Aluminum CoP – Jharsuguda ($/MT) 1,853 1,412 31% 1,692 1,781 1,435 24% Aluminium CoP – Jharsuguda(Rs. /MT) 119,100 94,600 26% 109,100 114,600 96,100 19% Aluminum CoP – BALCO ($/MT) 1,865 1,545 21% 1,780 1,825 1,541 18% Aluminium CoP – BALCO (Rs. /MT) 119,900 103,500 16% 114,700 117,500 103,200 14% Aluminum LME Price ($/MT) 2,012 1,620 24% 1,909 1,962 1,596 23% Including trial run production of 15 kt in Q2 FY2018 and 19 kt in Q2 FY2017 and 19kt in Q1 FY2018 and 34kt in H1 FY2018 vs 29kt in H1 FY2017 Including trial run production of 1 kt in Q2 FY2018 and 22 kt in Q2 FY2017 and 15kt in Q1 FY2018 and 16kt in H1 FY2018 vs 28kt in H1 FY2017 VEDANTA LIMITED – Q2 FY2018 RESULTS PRESENTATION 37
|
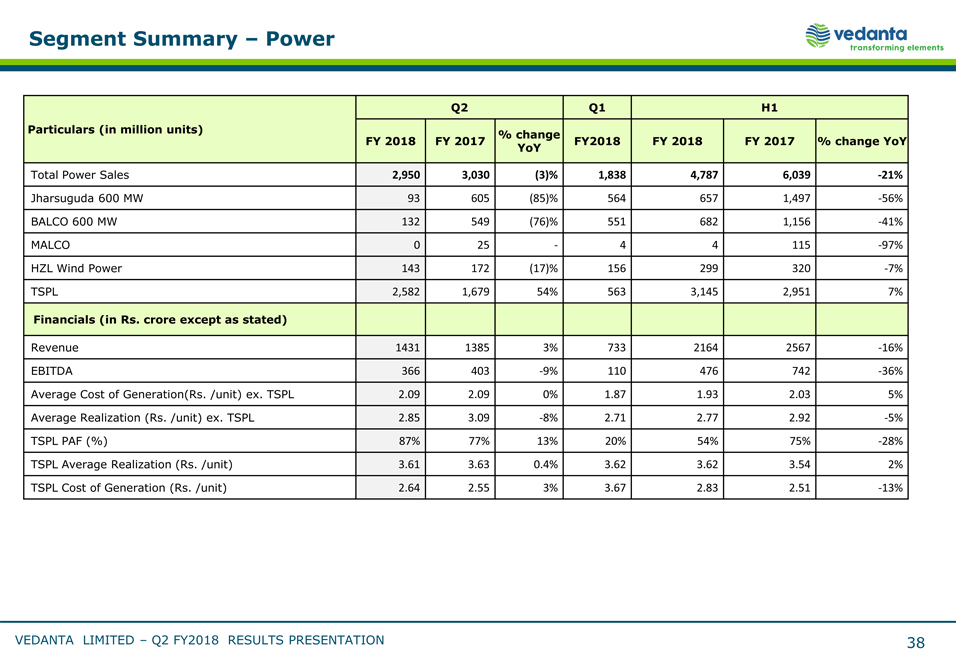 |
Segment Summary – Power Q2 Q1 H1 Particulars (in million units) FY 2018 FY 2017 % change FY2018 FY 2018 FY 2017 % change YoY YoY Total Power Sales 2,950 3,030 (3)% 1,838 4,787 6,039 - 21% Jharsuguda 600 MW 93 605 (85)% 564 657 1,497 - 56% BALCO 600 MW 132 549 (76)% 551 682 1,156 - 41% MALCO 0 25 - 4 4 115 - 97% HZL Wind Power 143 172 (17)% 156 299 320 - 7% TSPL 2,582 1,679 54% 563 3,145 2,951 7% Financials (in Rs. crore except as stated) Revenue 1431 1385 3% 733 2164 2567 - 16% EBITDA 366 403 - 9% 110 476 742 - 36% Average Cost of Generation(Rs. /unit) ex. TSPL 2.09 2.09 0% 1.87 1.93 2.03 5% Average Realization (Rs. /unit) ex. TSPL 2.85 3.09 - 8% 2.71 2.77 2.92 - 5% TSPL PAF (%) 87% 77% 13% 20% 54% 75% - 28% TSPL Average Realization (Rs. /unit) 3.61 3.63 0.4% 3.62 3.62 3.54 2% TSPL Cost of Generation (Rs. /unit) 2.64 2.55 3% 3.67 2.83 2.51 - 13% VEDANTA LIMITED – Q2 FY2018 RESULTS PRESENTATION 38
|
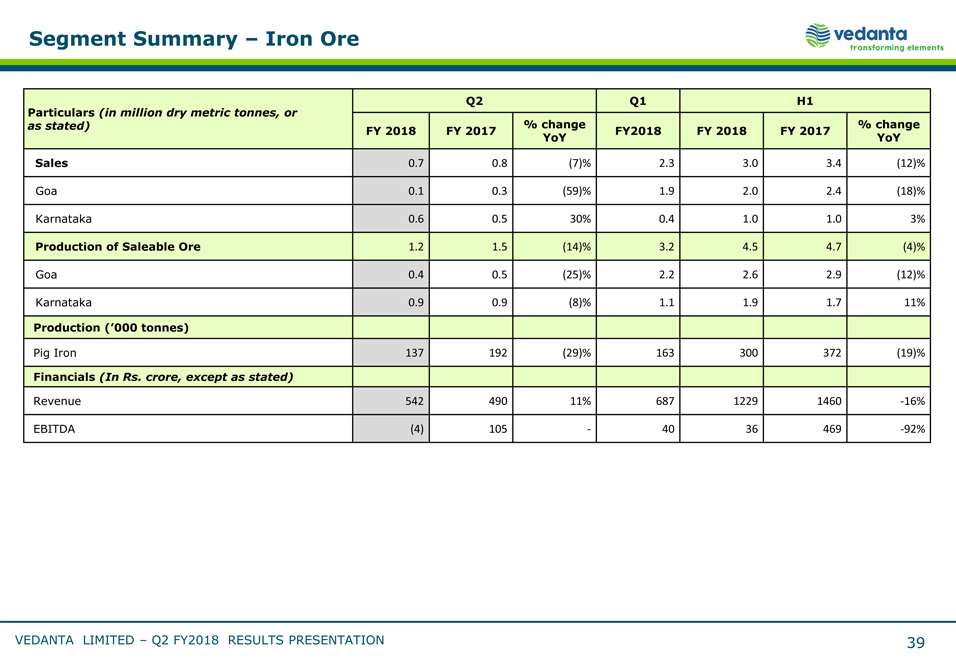 |
Segment Summary – Iron Ore Particulars (in million dry metric tonnes, or Q2 Q1 H1 as stated) % change % change FY 2018 FY 2017 FY2018 FY 2018 FY 2017 YoY YoY Sales 0.7 0.8 (7)% 2.3 3.0 3.4 (12)% Goa 0.1 0.3 (59)% 1.9 2.0 2.4 (18)% Karnataka 0.6 0.5 30% 0.4 1.0 1.0 3% Production of Saleable Ore 1.2 1.5 (14)% 3.2 4.5 4.7 (4)% Goa 0.4 0.5 (25)% 2.2 2.6 2.9 (12)% Karnataka 0.9 0.9 (8)% 1.1 1.9 1.7 11% Production (‘000 tonnes) Pig Iron 137 192 (29)% 163 300 372 (19)% Financials (In Rs. crore, except as stated) Revenue 542 490 11% 687 1229 1460 - 16% EBITDA (4) 105 - 40 36 469 - 92% VEDANTA LIMITED – Q2 FY2018 RESULTS PRESENTATION 39
|
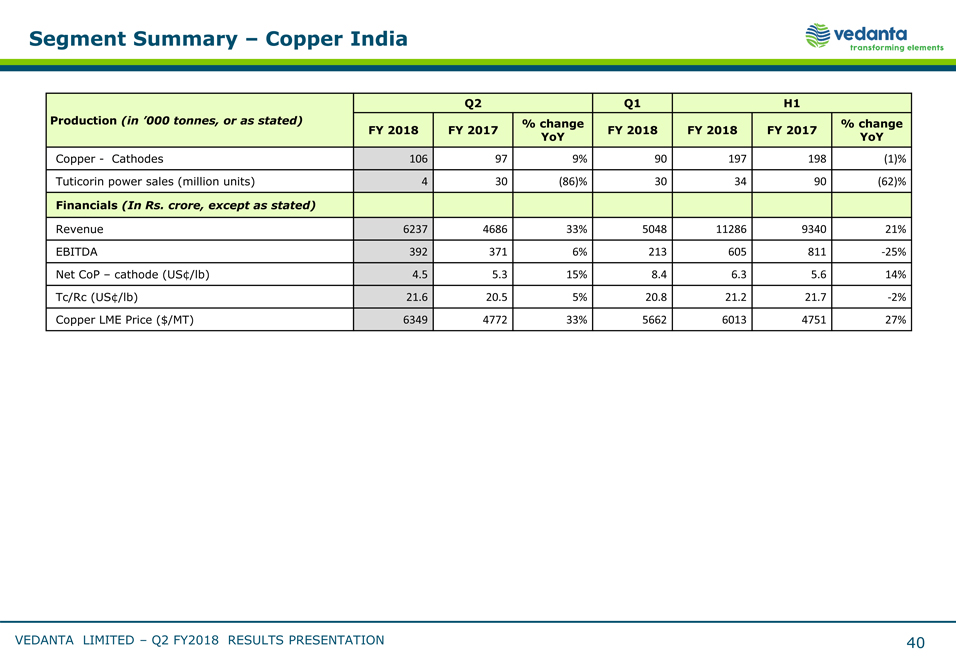 |
Segment Summary – Copper India Q2 Q1 H1 Production (in ‘000 tonnes, or as stated) % change % change FY 2018 FY 2017 FY 2018 FY 2018 FY 2017 YoY YoY Copper - Cathodes 106 97 9% 90 197 198 (1)% Tuticorin power sales (million units) 4 30 (86)% 30 34 90 (62)% Financials (In Rs. crore, except as stated) Revenue 6237 4686 33% 5048 11286 9340 21% EBITDA 392 371 6% 213 605 811 - 25% Net CoP – cathode (US¢/lb) 4.5 5.3 15% 8.4 6.3 5.6 14% Tc/Rc (US¢/lb) 21.6 20.5 5% 20.8 21.2 21.7 - 2% Copper LME Price ($/MT) 6349 4772 33% 5662 6013 4751 27% VEDANTA LIMITED – Q2 FY2018 RESULTS PRESENTATION 40
|
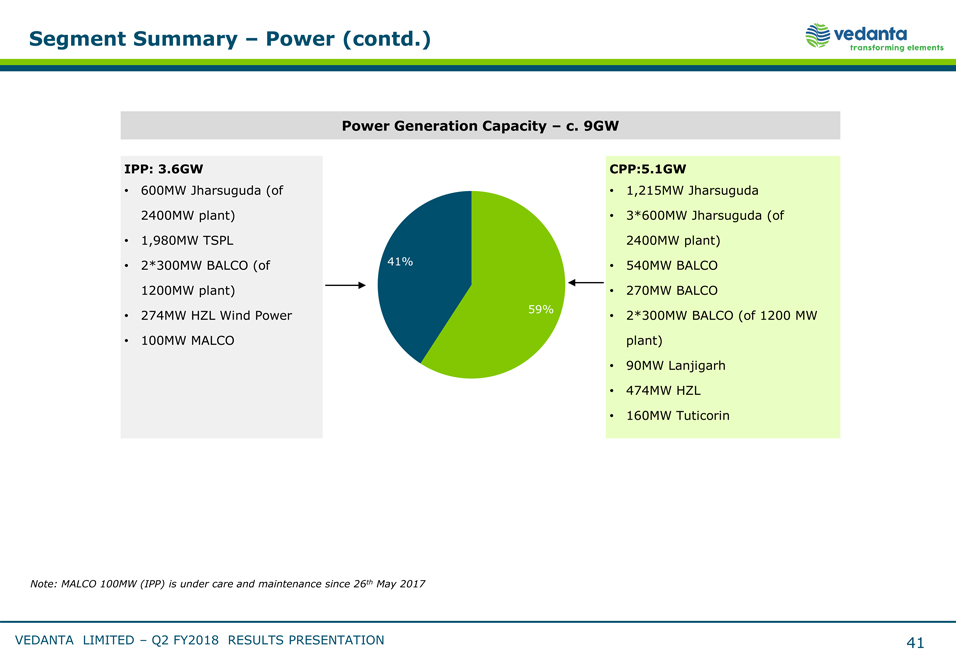 |
Segment Summary – Power (contd.) Power Generation Capacity – c. 9GW IPP: 3.6GW CPP:5.1GW 600MW Jharsuguda (of 1,215MW Jharsuguda 2400MW plant) 3*600MW Jharsuguda (of 1,980MW TSPL 2400MW plant) 2*300MW BALCO (of 41% 540MW BALCO 1200MW plant) 270MW BALCO 274MW HZL Wind Power 59% 2*300MW BALCO (of 1200 MW 100MW MALCO plant) 90MW Lanjigarh 474MW HZL 160MW Tuticorin Note: MALCO 100MW (IPP) is under care and maintenance since 26th May 2017 VEDANTA LIMITED – Q2 FY2018 RESULTS PRESENTATION 41
|
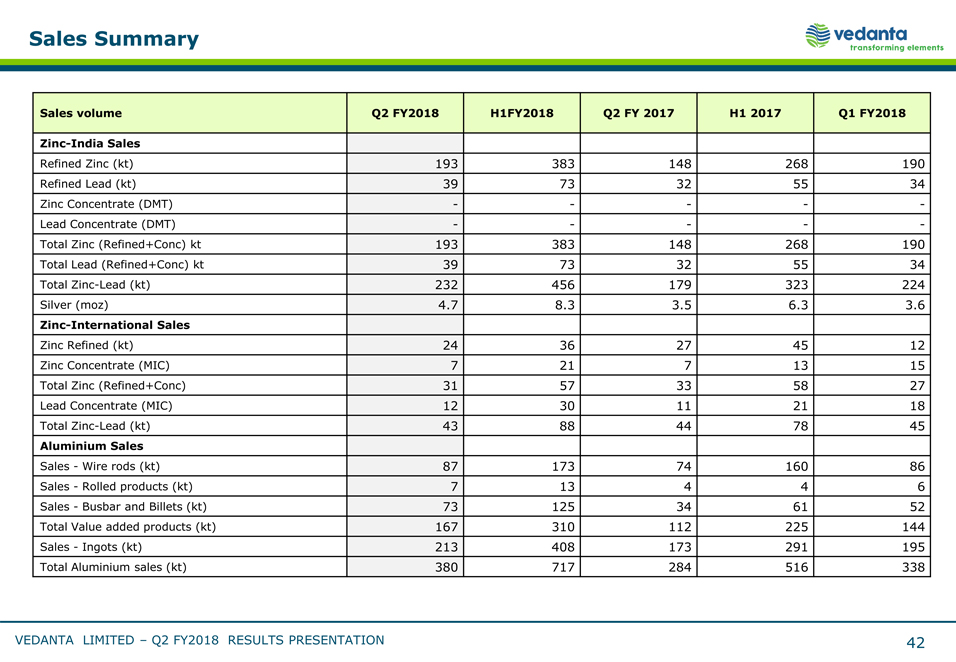 |
Sales Summary Sales volume Q2 FY2018 H1FY2018 Q2 FY 2017 H1 2017 Q1 FY2018 Zinc- India Sales Refined Zinc (kt) 193 383 148 268 190 Refined Lead (kt) 39 73 32 55 34 Zinc Concentrate (DMT) - - - - - Lead Concentrate (DMT) - - - - - Total Zinc (Refined+Conc) kt 193 383 148 268 190 Total Lead (Refined+Conc) kt 39 73 32 55 34 Total Zinc- Lead (kt) 232 456 179 323 224 Silver (moz) 4.7 8.3 3.5 6.3 3.6 Zinc- International Sales Zinc Refined (kt) 24 36 27 45 12 Zinc Concentrate (MIC) 7 21 7 13 15 Total Zinc (Refined+Conc) 31 57 33 58 27 Lead Concentrate (MIC) 12 30 11 21 18 Total Zinc- Lead (kt) 43 88 44 78 45 Aluminium Sales Sales - Wire rods (kt) 87 173 74 160 86 Sales - Rolled products (kt) 7 13 4 4 6 Sales - Busbar and Billets (kt) 73 125 34 61 52 Total Value added products (kt) 167 310 112 225 144 Sales - Ingots (kt) 213 408 173 291 195 Total Aluminium sales (kt) 380 717 284 516 338 VEDANTA LIMITED – Q2 FY2018 RESULTS PRESENTATION 42
|
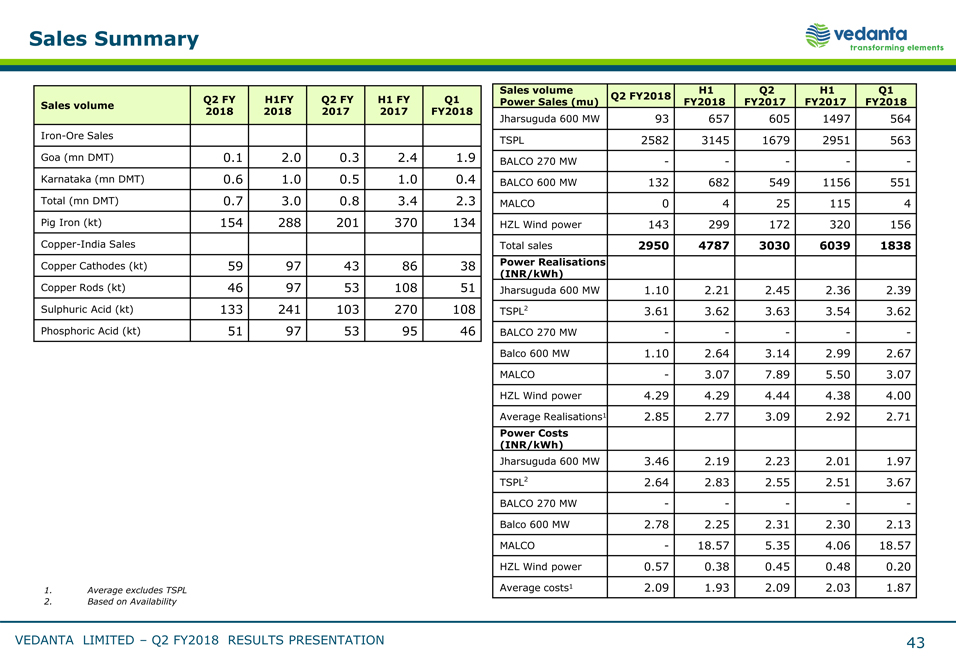 |
Sales Summary Sales volume Q2 FY H1FY Q2 FY H1 FY Q1 2018 2018 2017 2017 FY2018 Iron- Ore Sales Goa (mn DMT) 0.1 2.0 0.3 2.4 1.9 Karnataka (mn DMT) 0.6 1.0 0.5 1.0 0.4 Total (mn DMT) 0.7 3.0 0.8 3.4 2.3 Pig Iron (kt) 154 288 201 370 134 Copper- India Sales Copper Cathodes (kt) 59 97 43 86 38 Copper Rods (kt) 46 97 53 108 51 Sulphuric Acid (kt) 133 241 103 270 108 Phosphoric Acid (kt) 51 97 53 95 46 Average excludes TSPL Based on Availability Sales volume H1 Q2 H1 Q1 Q2 FY2018 Power Sales (mu) FY2018 FY2017 FY2017 FY2018 Jharsuguda 600 MW 93 657 605 1497 564 TSPL 2582 3145 1679 2951 563 BALCO 270 MW - - - - - BALCO 600 MW 132 682 549 1156 551 MALCO 0 4 25 115 4 HZL Wind power 143 299 172 320 156 Total sales 2950 4787 3030 6039 1838 Power Realisations (INR/kWh) Jharsuguda 600 MW 1.10 2.21 2.45 2.36 2.39 TSPL2 3.61 3.62 3.63 3.54 3.62 BALCO 270 MW - - - - - Balco 600 MW 1.10 2.64 3.14 2.99 2.67 MALCO - 3.07 7.89 5.50 3.07 HZL Wind power 4.29 4.29 4.44 4.38 4.00 Average Realisations1 2.85 2.77 3.09 2.92 2.71 Power Costs (INR/kWh) Jharsuguda 600 MW 3.46 2.19 2.23 2.01 1.97 TSPL2 2.64 2.83 2.55 2.51 3.67 BALCO 270 MW - - - - - Balco 600 MW 2.78 2.25 2.31 2.30 2.13 MALCO - 18.57 5.35 4.06 18.57 HZL Wind power 0.57 0.38 0.45 0.48 0.20 Average costs1 2.09 1.93 2.09 2.03 1.87 VEDANTA LIMITED – Q2 FY2018 RESULTS PRESENTATION 43
|
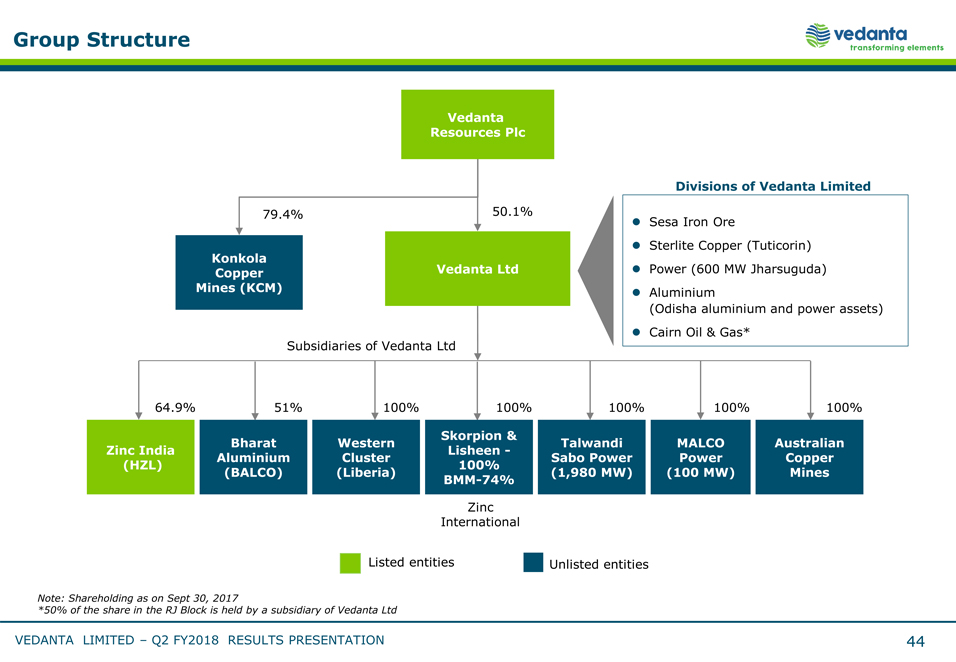 |
Group Structure Vedanta Resources Plc 79.4% 50.1% Konkola Copper Vedanta Ltd Mines (KCM) Subsidiaries of Vedanta Ltd Divisions of Vedanta Limited [Graphic Appears Here] Sesa Iron Ore Sterlite Copper (Tuticorin) Power (600 MW Jharsuguda) Aluminium (Odisha aluminium and power assets) Cairn Oil & Gas* 64.9% 51% 100% 100% 100% 100% 100% Skorpion & Bharat Western Talwandi MALCO Australian Zinc India Lisheen - Aluminium Cluster Sabo Power Power Copper (HZL) 100% (BALCO) (Liberia) (1,980 MW) (100 MW) Mines BMM- 74% Zinc International Listed entities Unlisted entities Note: Shareholding as on Sept 30, 2017 *50% of the share in the RJ Block is held by a subsidiary of Vedanta Ltd VEDANTA LIMITED – Q2 FY2018 RESULTS PRESENTATION 44
|
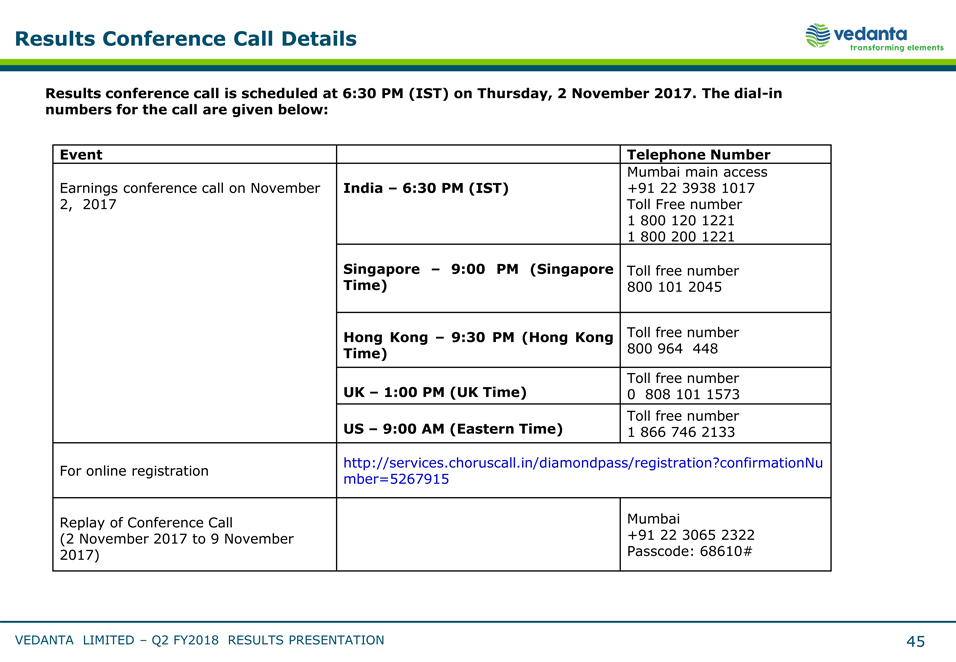 |
Results Conference Call Details Results conference call is scheduled at 6:30 PM (IST) on Thursday, 2 November 2017. The dial- in numbers for the call are given below: Event Telephone Number Mumbai main access Earnings conference call on November India – 6:30 PM (IST) +91 22 3938 1017 2, 2017 Toll Free number 1 800 120 1221 1 800 200 1221 Singapore – 9:00 PM (Singapore Toll free number Time) 800 101 2045 Hong Kong – 9:30 PM (Hong Kong Toll free number Time) 800 964 448 UK – 1:00 PM (UK Time) Toll free number 0 808 101 1573 Toll free number US – 9:00 AM (Eastern Time) 1 866 746 2133 http://services.choruscall.in/diamondpass/registration?confirmationNu For online registration mber=5267915 Replay of Conference Call Mumbai (2 November 2017 to 9 November +91 22 3065 2322 2017) Passcode: 68610# VEDANTA LIMITED – Q2 FY2018 RESULTS PRESENTATION 45