Exhibit 99.1
Resourcing India’s rise Responsibly
INTEGRATED REPORT AND ANNUAL ACCOUNTS 2020-2021
Resourcing India’s rise
Responsibly
India is a land of abundant resources. Resources that help our economy grow, and create sustainable livelihoods for millions of people. At Vedanta, we continue to foster long life, structurally low cost and diverse assets with excellent potential, which drive our growth ambitions.
Our investments in smarter processes, industry-leading efficiencies, empowerment of our people, and strong corporate
governance help us address the nation’s growing needs for metals and minerals.
Our strategic decisions are supported by robust cashflows, disciplined capital allocation and emphasis on sustainability in everything we do. With a resilient and responsible business model, we are ideally positioned to partner India’s journey towards greater self-reliance.
ABOUT VEDANTA LIMITED
Vedanta Limited (VEDL), a subsidiary of Vedanta Resources Limited is one of the world’s leading natural resources companies with interests in zinc-lead-silver, oil & gas, aluminium, power, iron ore, steel and copper, operating across India, South Africa and Australia. We believe that large-scale environment conservation and community empowerment make our business intrinsically strong and future ready.
VEDL REPORTING SUITE
Vedanta Limited Sustainability Report (SR) 2019-20
Information coverage: Disclosures on triple bottom line performance
Standards/guidelines used: Global Reporting Initiative (GRI) Standards
Vedanta Limited Tax Transparency Report (TTR) 2019-20
Information coverage: Voluntary disclosure of profits made and taxes paid (only Indian Company to publish a TTR)
Standards/guidelines used: Indian Accounting Standards (Ind AS)
Vedanta Limited Integrated Report (IR) and Annual Accounts 2019-20
Information coverage: Holistic disclosure of performance and strategy
Standards/guidelines used: International; Integrated Reporting <IR> Framework,
Indian Accounting Standards (Ind AS), Indian Secretarial Standards
Vedanta Limited TCFD Report 2020
Information coverage: Climate-related financial disclosures
Standards/guidelines used: Approach to climate action, climate strategy and climate risk management
CONTENTS
Integrated Report | ||
| see pages 02-163 | ||
| 03 | Integrated thinking at Vedanta | |
| 04 | Highlights FY2021 | |
INTRODUCTION | ||
| 08 | Vedanta at a Glance | |
| 10 | Asset Overview | |
| 12 | Investment case | |
| 16 | Chairman’s statement | |
| 20 | CEO’s statement | |
| 24 | Key performance indicators | |
| 28 | Case studies | |
VALUE CREATION AND STRATEGY | ||
| 38 | Value creation model | |
| 40 | Our strategic framework | |
| 46 | Opportunity landscape | |
| 50 | Risk Management | |
OUR BOARD AND MANAGEMENT | ||
| 62 | Board of Directors | |
| 66 | Management Committee | |
| 68 | Executive Committee | |
SUSTAINABILITY AND ESG | ||
| 76 | Sustainability, Environmental, Social and People | |
| 98 | Governance | |
| 100 | Business Responsibility Report Mapping | |
| 108 | Awards | |
MANAGEMENT DISCUSSION AND ANALYSIS | ||
| 114 | Market Review | |
| 118 | Segment Review | |
| 124 | Finance Review | |
| 128 | Operational Review | |
Statutory Reports | ||
| see pages 164-265 | ||
| 164 | Directors’ report | |
| 214 | Report on Corporate Governance | |
Marching ahead and contributing to aatmanirbhar bharat | ||
| see pages 28 | ||
Taking digital transformation to the next level | ||
| see pages 32 | ||
Financial Statements | ||
| see pages 266-499 | ||
| 266 | Standalone financials | |
| 372 | Consolidated financials | |
Read more online | ||
at vedantalimited.com | ||
Powering the wheels of the automotive industry | ||
| see pages 30 | ||
Cairn pushes the digital envelope farther | ||
see pages 34 | ||
ABOUT THE REPORT
Inspired by our values, we remain committed to disclosing relevant information pertaining to our material issues, with highest standards of transparency and integrity. It is towards this end that we continue to communicate our annual performance and future strategy through Integrated Reporting <IR>. This is our fourth such report, prepared in accordance with the International Integrated Reporting <IR> Framework, outlined by the International Integrated Reporting Council (IIRC).
Our <IR> journey commenced in FY2018 and we were one of the very first natural resources companies in India to publish an integrated report. These reports are prepared to assist our stakeholders, primarily the providers of financial capital, to make an informed assessment of our ability to create value over the short, medium and long term. They strive to demonstrate our confidence, capacity to grow and our ability to deliver on set strategies that can drive significant financial and non-financial value for everyone.
SCOPE AND BOUNDARY
This report covers the reporting period from 1 Apr 2020 to 31 Mar 2021 and provides 360o information on Vedanta Limited (Vedanta, VEDL), a subsidiary of Vedanta Resources limited.
It provides an overview of operations across our business units, namely, zinc-lead-silver, oil & gas, aluminium, power, iron ore, steel
and copper. Our assets are spread across India, South Africa and Namibia, and across the value chain comprising exploration, asset development, extraction, processing and value accretion activities.
This report aims to provide a concise explanation of VEDL’s performance, strategy, operating model, business outputs and outcomes using a multi- capital approach. It includes measures of engagement with identified material stakeholder groups and outlines the organisation’s governance framework, together with our risk-mitigation strategy.
APPROACH TO MATERIALITY
This report contains information that we believe is of interest to our stakeholders and presents a discussion around matters that can impact our ability to create value over the short, medium and long term.
APPROACH TO STAKEHOLDER ENGAGEMENT
Our stakeholders are those individuals or organisations who have an interest in, and/or whose actions impact our ability to execute our strategy. We periodically engage with different stakeholder groups and actively respond to their concerns and issues.
ANNUAL ACCOUNTS
This report should be read in conjunction with the annual accounts (page 266 to 499) to gain a complete picture of VEDL’s financial performance. The consolidated and standalone financial statements in our report have been prepared in accordance with the Indian Accounting Standards (Ind AS) notified under the Companies (Indian Accounting Standards) Rules, 2015 (as amended from time to time) and have been independently audited by S.R. Batliboi & Co. LLP. The Independent Auditors’ Report for both consolidated and standalone financials can be found on page 266 and 373 respectively.
BOARD AND MANAGEMENT ASSURANCE
The Board of Directors and the Company’s management acknowledge their responsibility to ensure the integrity of information covered in this report. They believe, to the best of their knowledge, that this report addresses all material issues and presents the integrated performance of VEDL and its impact in a fair and accurate manner. The report has therefore been authorised for release on 13 May 2021.
02
| < BACK TO CONTENTS | Integrated Report | Statutory reports | Financial statements |
INTEGRATED THINKING AT VEDANTA
At Vedanta, we are led by an integrated thought process that powers our decision-making and enables our consistent market success.
| We are led by | Mission | Values | ||||||||||
| To create a leading global natural resource Company | Trust | Entrepreneurship | Innovation | Excellence | Integrity | Care | Respect | |||||||||||
| Capitals | ||||||||||||
| Building on | Financial capital | Natural capital | Intellectual capital | Manufactured capital | Social and relationship capital | Human capital | ||||||
| 38 | ||||||||||||
| Material issues | ||||||||||||
| Focusing on | M1 M2 M3 M4 M5 M6 M7 M8 M9 M10 M11 M12 M13 | |||||||||||
| 77 | M Material issue | |||||||||||
| Strategic focus | ||||||||||
| Enabled by | Continue to focus on world-class ESG performance | Augment our reserves and resource base | Operational excellence | Optimise capital allocation and maintain strong balance sheet | Delivering on growth opportunities | |||||
| 40 | ||||||||||
| Top risks | Megatrends and opportunities | |||||||||
| With a constant eye on | R1 R2 R3 R4 R5 R6 R7 R8 R9 R10 R11 R12 R13 | T1 T2 T3 T4 T5 T6 T7 T8 T9 T10 | ||||||||
| 50 | R Risk | 46 | T Trend | |||||||
| Creating consistent value | For shareholders, investors and lenders | For local communities | For employees | |||||||||
| For industry | For governments | For civil societies | ||||||||||
VEDANTA LIMITED | INTEGRATED REPORT AND ANNUAL ACCOUNTS 2020-21 | 03
HIGHLIGHTS FY2021
Financial
04
| < BACK TO CONTENTS | Integrated Report | Statutory reports | Financial statements |
VEDANTA LIMITED | INTEGRATED REPORT AND ANNUAL ACCOUNTS 2020-21 | 05
VEDANTA AT A GLANCE
Vedanta Limited is one of the world’s foremost natural resources conglomerates, with primary interests in zinc-lead-silver, iron ore, steel, copper, aluminium, power, oil and gas. With world-class, low-cost, long-life strategic assets based in India and Africa, we are rightly positioned to create long-term value with superior cash flows.
| 70,000+ | Largest | Ranked #2 | ||
| Direct and indirect employment | Natural resources company in India | By DJSI in Asia Pacific in the metal & mining sector |
06
| < BACK TO CONTENTS |
| 2,300+ | ~13.6 million | ~₹2,74,000 crore | ||
| Nand Ghars created for social welfare | tCO2e in avoided emissions from 2012 baseline | Total contribution to the national exchequer in the past 10 years |
VEDANTA LIMITED | INTEGRATED REPORT AND ANNUAL ACCOUNTS 2020-21 | 07
VEDANTA AT A GLANCE
Enabling resource sufficiency at scale
We cater to diverse consumer markets for their primary materials needs and are leaders in the segments we operate in. Through our activities that generate economic, human, and social value, we responsibly support India in its journey towards self-sufficiency.
| VEDANTA IS POISED TO LEVERAGE INDIA’S LARGE-SCALE RESOURCE PIPELINE | ||||
| 10 mn tonnes | 5.5 bn tonnes | |||
| Zinc reserves | Iron ore reserves | |||
| 5.2 bn boe | 600 mn tonnes | |||
| Oil & gas reserves | Bauxite reserves | |||
OUR VALUE CHAIN
Exploration
We have consistently added more to our Reserves and Resources (‘R&R’) through brownfield and greenfield activities. This helps us to extend the lives of our existing mines and oilfields.
Asset Development
We have a strong track record of executing projects on time and within budget. We take special care to develop the resource base to optimise production and increase the life of the resource. We also strategically develop processing facilities.
Extraction
Our operations are focused on exploring and producing metals, extracting oil & gas and generating power. We extract zinc-lead- silver, iron ore, steel, copper and aluminium. We have three operating blocks in India producing oil & gas.
Processing
We produce refined metals by processing and smelting extracted minerals at our zinc, lead, silver, copper, and aluminium smelters, and other processing facilities in India and Africa. For this purpose, we generate captive power as a best practice measure and sell any surplus power.
Value Addition
We meet market requirements by converting the primary metals produced into value added products such as sheets, rods, bars, rolled products, etc. at our zinc, aluminium and copper businesses.
08
| < BACK TO CONTENTS | Integrated Report | Statutory reports | Financial statements |
OUR CORE VALUES
Our Core Values underpin everything we do at Vedanta. These are universal values, which guide our behaviour, as we expand into new markets and countries.
| Trust | Entrepreneurship | Innovation | Excellence | Integrity | Care | Respect |
A STRUCTURE THAT SUPPORTS RESPONSIBLE, VALUE-ACCRETIVE GROWTH
VEDANTA LIMITED | INTEGRATED REPORT AND ANNUAL ACCOUNTS 2020-21 | 09
VEDANTA AT A GLANCE CONTINUED...
ASSET OVERVIEW
Vedanta is India’s largest natural resources conglomerate with leading positions in seven key business segments.
| ZINC-LEAD-SILVER | OIL & GAS | ALUMINIUM | ||||
~80% Market share in India’s primary zinc market (Hindustan Zinc Limited) | Operates ~25% of India’s crude oil production | Largest primary aluminium producer in India | ||||
| Business: | Business: | Business: | ||||
| Zinc India (HZL) Zinc International | Cairn India | Aluminium smelters at Jharsuguda & Korba (BALCO) | ||||
| Alumina refinery at Lanjigarh | ||||||
| Production Volume: | Production Volume: | Volume: | ||||
Zinc India (HZL) 715 kt Zinc | 706 t Silver | 162 kboepd Average Daily Gross Operated Production | 1,969 kt Aluminium
1,841 kt | |||
214 kt Lead | Zinc International 203 kt | Alumina | ||||
| EBITDA (In ₹cr.) | EBITDA (In ₹cr.) | EBITDA (In ₹cr.) | ||||
12,431 Zinc India (HZL) 11,620 | Zinc International 811 | 3,206 | 7,751 | |||
| Asset highlights: | Asset highlights: | Asset highlights: | ||||
World’s largest fully integrated zinc-lead producer World’s largest underground zinc- lead mine at Rampura Agucha, India 6th largest silver producer in the world Zinc India has R&R of 448 million tonnes with mine life of 25+ years Zinc International has R&R of more than 566.4 million tonnes supporting mine life in excess of 30 years HZL- Low-cost zinc producer, which lies in the first decile of the global zinc cost curve (2020) | World’s longest continuously heated pipeline from Barmer to Gujarat Coast (~670 kms) Till FY2021, to deliver the capex project, 256 wells have been drilled and 149 wells hooked up New gas processing terminal construction completed; commissioning underway expected to add ~100 mmscfd Early drilling opportunities being evaluated in OALP - Rajasthan, Assam & Cambay regions First well KW-2-Udip drilled in Rajasthan Largest private sector oil & gas producer in India Executed one of the largest polymer EOR projects in the world Footprint over a total acreage of ~65,000 sq km Gross proved and probable reserves and resources of 1,229 mmboe | Largest aluminium installed capacity in India at 2.3 mtpa Integrated 5.7GW Power and 2 mtpa alumina refinery ~47% market share in India among primary aluminium producers Diverse product portfolio – ingots, wire rods, primary foundry alloy, rolled products, billet and slab | ||||
| Application areas: | Application areas: | Application areas: | ||||
Galvanising for infrastructure and construction sectors Die-casting alloys, brass, oxides and chemicals | Crude oil is used by hydrocarbon refineries Natural gas is mainly used by the fertiliser sector | Power systems, automotive sector, aerospace, building and construction, packaging | ||||
10
| < BACK TO CONTENTS | Integrated Report | Statutory reports | Financial statements |
| POWER | IRON ORE | STEEL | COPPER | |||||||
~9 GW Power portfolio | One of the largest merchant iron ore miners in India and one of the largest producers and exporters of merchant pig iron in India | 2.5 mtpa Design capacity | One of the largest copper producers in India | |||||||
| Business: |
|
|
| |||||||
| Power assets at Talwandi Sabo, Jharsuguda, Korba & Lanjigarh | Business: Iron Ore India | Business: Electrosteel India | Business: Copper India | |||||||
| Volume: | Volume: | Production Volume: | Production Volume: | |||||||
| 11,261 | 5 mn dmt | 1,187 kt | 101 kt | |||||||
| million units | Iron ore | Steel | Cathod | |||||||
| Power Sales | ||||||||||
| 596 kt | ||||||||||
| Pig Iron | ||||||||||
| EBITDA (In ₹cr.) | EBITDA (In ₹cr.) | EBITDA (In ₹cr.) | EBITDA (In ₹cr.) | |||||||
| 1,407 | 1,804 | 871 | (177) | |||||||
| Asset highlights: | Asset highlights: | Asset highlights: | Asset highlights: | |||||||
One of the largest power producers in the country in the private sector* Energy efficient, super critical 1,980 MW power plant at Talwandi Sabo | Karnataka iron ore mine with reserves of 76 million tonnes, and life of 11 years Value added business: 3 blast furnaces (0.8 mtpa), 2 coke oven batteries (0.5 mtpa) and 2 power plants (60 MW) and one merchant coke plant of capacity 0.1 mtpa | Design capacity of 2.5 mtpa Largely long steel product | Tuticorin smelter and refinery currently not operational | |||||||
| Application areas: | Application areas: | Application areas: | Application areas: | |||||||
2.9 GW (~37%) commercial power backed by Power Purchase Agreements 4.8 GW (~63%) captive use | Essential for steel making Used in construction, infrastructure and automotive sectors | Construction, infrastructure, transport, energy, packaging, appliances and industry Product portfolio includes pig iron, billets, TMT bars, wire rods and ductile iron pipes | Used for making cables, transformers, castings, motors and castings, and alloy-based products | |||||||
| * | including captive power generation |
VEDANTA LIMITED | INTEGRATED REPORT AND ANNUAL ACCOUNTS 2020-21 | 11
INVESTMENT CASE
Built to deliver sustainable value
Natural resources represent an important growth engine for the Indian economy, which is poised to grow attractively in the foreseeable future. As India’s only diversified natural resources company, we are well placed to make a significant contribution to the nation’s growth. Our investment strategy is focused on delivering sustainable, long-term returns to our shareholders and creating value for our wider stakeholder fraternity.
Large, low-cost, long-life and diversified asset base with an attractive commodity mix
Large-scale, diversified asset portfolio, with an attractive cost position in many core businesses, positions us to deliver strong margins and free cash flows through the commodity cycle
An attractive commodity mix, with strong fundamentals and promising demand growth; key focus on base metals and oil
While commodity markets suffered during the first half of 2020 due to COVID-19, with the base metals sector experiencing reduced demand from manufacturing, and oil price suffering from severe demand weakness owing to travel restrictions and prolonged factory shutdowns, the second half of the year saw recovery, particularly in Vedanta’s core commodities (zinc, aluminium and oil & gas). In 2021, various efforts to stimulate economic growth by governments, central banks and international institutions, together with faster vaccine rollout are likely to strengthen the recovery in these commodity markets.
Source: Wood Mackenzie
Note: Oil demand CAGR shown for 2018-2030 period
12
| < BACK TO CONTENTS | Integrated Report | Statutory reports | Financial statements |
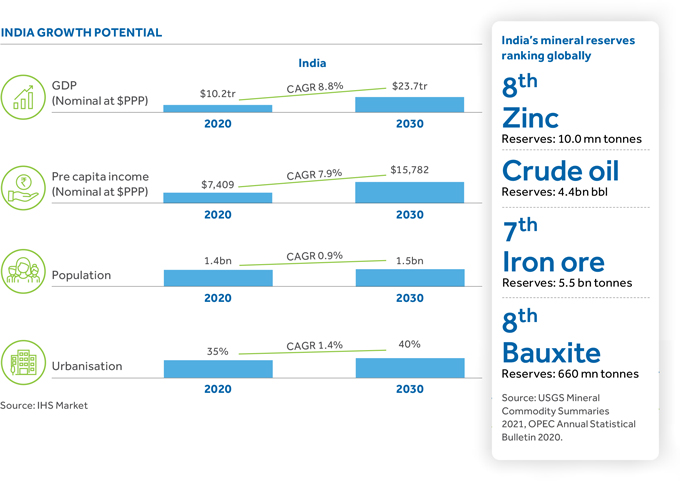
Ideally positioned to capitalise on India’s growth and natural resources potential
India’s (US$2.7 trillion economy) per capita metal consumption is significantly lower than the global average, indicating significant headroom for growth
The government’s continued focus on infrastructure, urbanisation, and affordable housing (supported by low interest rates regime driven by the RBI’s accommodative monetary policy) will help the economy recover faster from the COVID-induced shock and generate strong demand for natural resources
VEDANTA’S COMPETITIVE ADVANTAGE IN INDIA
A diversified portfolio of established operations in India
A strong market position as India’s largest base metals producer and largest private sector oil producer
An operating team with an extensive track record of successful project execution
ALUMINIUM CONSUMPTION (KG/CAPITA) | COPPER CONSUMPTION (KG/CAPITA) | ZINC CONSUMPTION (KG/CAPITA) | OIL CONSUMPTION (BOE/CAPITA) | |||
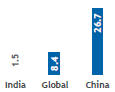 | 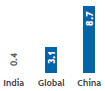 | 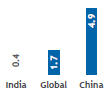 | 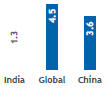 | |||
Source : Wood Mackenzie, IMF, IHS Markit, BMI, BP Energy outlook 2020
Note : All commodities demand correspond to primary demand; figures are for 2021
INDIA GROWTH POTENTIAL
VEDANTA LIMITED | INTEGRATED REPORT AND ANNUAL ACCOUNTS 2020-21 | 13
INVESTMENT CASE CONTINUED...
World-class natural resources powerhouse with proven track record
Our Management team has a diverse and extensive range of sectoral and global experience. They ensure that operations run efficiently and responsibly, drawing from key insights | 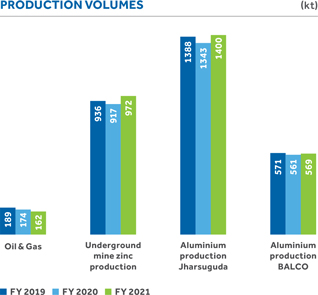 | |
Disciplined approach to development, growing our production steadily across our operations with focus on operational efficiency and cost savings | ||
Since our listing in 2003, our assets have delivered a phenomenal production growth | ||
| Well-invested assets driving free cash flow growth |
| |
Completed a significant proportion of our medium-term capital expenditure programme; and we are now ramping up production to take advantage of our expanded capacity | ||
Seeing positive outcomes of our investments, with Zinc India and aluminium delivering robust production in the past year; and we expect Zinc International, particularly the Gamsberg project, to provide further impetus to our Zinc business, going forward
In the Oil & Gas business, we have begun to implement our growth projects with a gross capex of US$3.2+ billion, enabling us to grow our volumes in the near term. These increases in production are leading to a strong cashflow generation | ||
| Operational excellence and technology driving efficiency and sustainability | 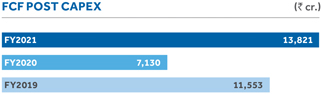 | |
Eliminating inefficiencies across every aspect of operations | ||
Leveraging advanced technologies to roll out a wide range of innovation | ||
Rationalising the cost structure to build a leaner operating model | ||
Ensuring sustainable operations and delivering a positive result for all our stakeholders and society | ||
14
| < BACK TO CONTENTS | Integrated Report | Statutory reports | Financial statements |
Strong financial profile
| Our operating performance, coupled with optimisation of capital allocation, has helped strengthen our financials. | 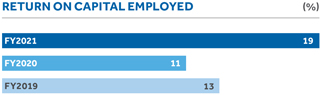 | |
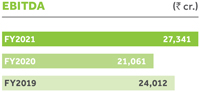
Revenues of ₹86,863 crore and EBITDA of ₹27,341 crore | ||
Strong ROCE of ~19 % | ||
Deleveraging and extending our debt maturities through proactive liability management exercises | ||
Strong and robust FCF of ₹13,821 crore | ||
Cash and liquid investments of ₹32,614 crore | ||
A strong balance sheet, with respect to Net Debt/ EBITDA (0.9x) and gearing, compared to our global diversified peers | ||
Interim dividend of ~₹3,500 crore paid in FY2021 | ||
| Committed to the highest standards of ESG | ||
Committed to be the lowest cost producer in a sustainable manner | 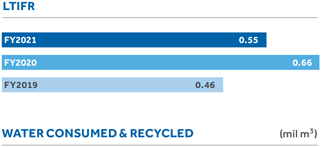 | |
Aligned to our Group objective of ₹Zero Harm, Zero Waste and Zero Discharge’, we worked dedicatedly to set up a framework, aligned to global best practices | ||
Focusing on key material areas of occupational health, safety, environment, carbon, social performance and governance | ||
Key future programmes comprise the following: achieve highest safety level, manage zero net environmental damage, support global carbon neutrality targets and work with all stakeholders in harmony | 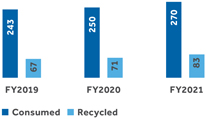 | |
| We have made significant improvements in our investigation quality to avoid repeat accidents and promote higher reporting for all incidents. We are also duly progressing towards achieving our water and waste targets set for the year. | ||
VEDANTA LIMITED | INTEGRATED REPORT AND ANNUAL ACCOUNTS 2020-21 | 15
CHAIRMAN’S STATEMENT
Strength meets responsibility
DEAR STAKEHOLDERS,
The year 2020 was a very unusual year for all of us. A year that was challenging on multiple fronts, but what stood out was the extraordinary resilience and adaptability of individuals and enterprises. There was a tectonic shift in the way we live or conduct our businesses, and Vedanta was no different. As a large natural resources company, we have had our fair share of challenges. However, we were quick to adapt to the emerging realties, backed by the relentless support of our dynamic workforce.
We extended our support to the nation’s fight against COVID-19 during its first wave through contributions to the PM CARES Fund and undertaking initiatives that positively impacted the lives of over 15 lakh people. We have now pledged ₹150 crore to help the country in its fight against the second wave of COVID-19 along with setting up 1,000 specialty beds in 10 locations across India. Sterlite Copper, which has a capacity to produce 1,000 tonnes of oxygen at Tuticorin, is catering to the needs of COVID-19 patients in the region.
A YEAR OF CONTINUED EXCELLENCE AND LEARNING
Vedanta Limited is one of the world’s largest suppliers of natural resources, with primary operations in zinc-lead-silver, iron ore, steel, copper, aluminium, power, oil & gas. Our portfolio of world-class, low- cost, scalable assets consistently generate strong profitability and deliver robust cash flows. We are actively deleveraging our balance sheet and are raising the bar in operational excellence across our wide canvas of operations.
During FY2021, Vedanta continued to live up to its promises to its stakeholders and operated a resilient and responsible business that
Anil Agarwal,
Chairman
16
| < BACK TO CONTENTS | Integrated Report | Statutory reports | Financial statements |
₹150 crore
Pledged by Vedanta to support India during the second wave of COVID-19
contributed to a self-reliant India. Even as temporary disruptions materialised, we were able to bounce back strongly with industry-leading EBITDA margins and exceptional quarters for key businesses.
We continued to deliver on all strategic levers, building on our strengths and commitment to operational excellence. We remained cash flow positive; and maintained liquidity at comfortable levels.
It also gives me great pleasure to inform you that we performed exceedingly well on key environmental, social and governance (ESG) aspects during the year. This is validated by our ranking in the Dow Jones Sustainability Index, which improved nine places to 12th globally in our industry. It’s a true reflection of our belief that business and sustainability are synergistic in nature.
While we have reasons to celebrate, we mourn the passing of eight of our colleagues. We are grieved by their irreplaceable loss and are supporting the bereaved families. At Vedanta, we accord paramount importance to occupational safety and employee well-being and continue to nurture a safety culture that results in zero harm. However, there is always room for improvement, and collective action and behavioural change alone can help bring transformational outcomes. Aligned to this, we are conducting a Group-wide review of permit to work and isolation procedure and are instating a safety alert dashboard to improve implementation of fatality learnings. Cross business safety audits and piloting of critical risk management are other supplementary initiatives supporting this.
OPERATING IN A THRIVING ECONOMY
After an outlier year, India is now back on the growth trajectory, and is poised to grow by 11.5% in FY2022, according to the International Monetary Fund. The rebound is clearly evidenced by the uptick in consumption, manufacturing activity and bank credit. India is experiencing a V-shaped recovery. Global agencies such as the World Bank have acknowledged the fact that this recovery is phenomenal, given how the country has now opened up, and is organising large-scale vaccination drives on priority.
VEDANTA LIMITED | INTEGRATED REPORT AND ANNUAL ACCOUNTS 2020-21 | 17
CHAIRMAN’S STATEMENT CONTINUED...
The government is also playing a key role in facilitating the economy’s return to the growth path. This is clearly reflected in the Union Budget 2021-22, which lays extended focus on economic enablers such as infrastructure and socially important sectors such as health.Among others, the proposals to create a Development Financial Institution (DFI), monetise assets, set up new economic corridors and increase the ambit of the National Infrastructure Pipeline (NIP) are promising. These measures, in conjunction with a conducive policy environment, are expected to increase the demand for basic materials in which we specialise. The relevance of metals and mining are more pronounced today than ever, and at Vedanta, we are rightly positioned to cater to the growing needs. The clarion call for ‘Aatmanirbharta’ is very well founded, and we are perfectly aligned to the government’s vision of a self-reliant nation. In line with this, we have augmented our positioning to ‘Desh Ki Zarooraton Ke Liye, Aatmanirbhar Bharat Ke Liye.’
GROWING IN A VITAL INDUSTRY
There is a definite focus on India’s natural resources sector as a key enabler in supporting the nation’s development. Apart from being a contributor to GDP, it underpins the supply of raw materials to the nation’s burgeoning manufacturing sector. Development of this sector thus holds the key to the nation’s ambition of becoming fully self-reliant.
In recognition of this, India is turning a new leaf with the introduction of the Mines and Minerals (Development and Regulation) Amendment (MMRDA) Bill, 2021. A welcome move, its passage will significantly boost India’s metals and mining industry, by inviting private participation in the exploration of key resources such as coal and gold. It is set to redefine the norms of exploration of mineral blocks and adequately utilise India’s unused mineral reserves. Currently, natural resources contribute 1.75% to India’s GDP, whereas in countries with similar reserves, the contribution is 7-7.5%. The MMRDA Bill is a gamechanger in this context and is expected to significantly improve the share of the sector in the national economy. It will contribute to the creation of over five million jobs and will considerably reduce India’s import dependence for basic materials.
BEING THE DEVELOPER OF CHOICE
Over the years, Vedanta has built one of the most recognised and impactful CSR programmes in India. As a natural resources player, we are inextricably linked to the communities near our operations, and have become an inalienable part of their livelihood.
From here stems our deep sense of responsibility and extended obligation beyond what is mandatory.
During FY2021, we spent over ₹331 crore on social development activities, spread across our core impact areas of education, health, sustainable livelihoods, women empowerment, sports and culture, environment and community development. Each Group company played its part by executing the respective CSR agenda, in line with the Group guidelines.
This year, supporting communities during the COVID-19 crisis also assumed precedence, with the distribution of nearly 25 lakh meal and ration kits, and over 7 lakh health and hygiene kits.
18
| < BACK TO CONTENTS | Integrated Report | Statutory reports | Financial statements |
~9.23 mn m3
Water savings achieved
over the past four years
~52,000
Women benefited through
Nand Ghar initiative
~65,000
Children benefited through
the Nand Ghar initiative
As we stand today, our flagship CSR initiative for women and children has touched a new milestone, with the setting up of 2,300+ Nand Ghars in 11 states. It continues to pave the way for the model Anganwadi movement across the country and till date, we have positively touched the lives of ~52,000 women and ~65,000 children through the initiative.
BEING NATURALLY RESPONSIBLE
As the largest natural resources company of India, we are well aware of the responsibility that rests on our shoulders. It’s in this context that we have a target-oriented environmental programme. We believe that good ecology is good business and strive our best to give back more than we take. Consequently, over the past four years, we have achieved water savings of ~9.23 million m3 and have implemented an active plastic protocol in three of our business units. We have also seen 100%+ fly ash utilisation.
With regards to GHG emissions, we have a vision to substantially de-carbonise our operations by 2050, and towards this extent, we have built a Group-wide carbon forum with CEO-level engagement.
I’m also proud of the fact that we are among the 24 Indian companies who, in late 2020, signed the declaration towards carbon neutrality. Today, we have achieved ~13.6 million tCO2e in avoided emissions compared to our 2012 baseline.
BEING THE EMPLOYER OF CHOICE
Vedanta is home to thousands of skilled professionals, who seek to develop their careers aligned to our culture and facilitated by an employee-friendly, diverse, and meritocratic environment. Their efforts have been instrumental in taking Vedanta to its current stature, and their contribution to ensuring business continuity has been phenomenal at the height of the pandemic.
The safety, well-being and happiness of our employees is of utmost importance to us, and we are taking every measure to ensure the same. Towards this, we rolled out health programmes for our employees and business partners during the year. We also focused on telemedicine, promotion of mental health and health monitoring so that our people remained safe and secure during these trying times.
We constantly engage with best-in-class service and technology providers to ensure the highest level of safety for our employees and have managed to achieve a zero-fatality year at our largest business - Hindustan Zinc.
AHEAD WITH INDIA
As I look forward, I see an opportunity of a lifetime ahead of us. Our economy has regained its growth momentum and we are operating in an industry that complements this growth curve. With India’s young energy, consistent governance, strong consumption, and a thriving private sector, I’m positive that the best for the nation is yet to come. At Vedanta, we are cognisant of the immense growth potential and will invest in opportunities that create value for all stakeholders. As we power ahead, we stand in solidarity with India, its ambition of being Aatmanirbhar and creating a 5 trillion-dollar economy.
Best regards,
Anil Agarwal
VEDANTA LIMITED | INTEGRATED REPORT AND ANNUAL ACCOUNTS 2020-21 | 19
CEO’S STATEMENT
Spirit of consistent delivery and growth
DEAR STAKEHOLDERS,
I am happy to report that our intrinsic spirit to do more and serve more helped us navigate the crisis with confidence in FY2021, which truly tested our mettle. In a year abound with changes and challenges, our performance was exemplary by any measure. Further, the year also saw us strategically augment our business model with larger integration and a digital-first approach. The entire Vedanta family deserves a huge round of applause for this achievement.
RESILIENCE MEETS PRUDENCE
I can say with reasonable confidence that we delivered on all major strategic priority areas, with positive outcomes across key performance indicators. We maintained our leadership in most of our businesses and improved on our sustainability metrics. We also supported our people, partners and communities during the testing times of the pandemic and continue to do so. Safety and health continue to be our 24X7 priority. It is a commitment that strengthens our culture, guides our decisions and drives our long-term success.
₹32,614 crore
Cash and cash equivalents
~19%
ROCE
Sunil Duggal,
Chief Executive Officer
20
| < BACK TO CONTENTS | Integrated Report | Statutory reports | Financial statements |
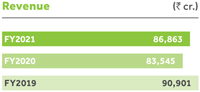
Our revenues touched ₹86,863 crore during the year, and we recorded a Net Profit of ₹15,032 crore. We were also able to achieve industry-leading operating margins. This is a testament to the high-performance culture that we have been able to successfully build over the years. Coupled with a conducive macro environment, we were able to maximise earnings to cash conversion and allocate capital prudently, while pursuing high-return organic growth projects across businesses. Cost optimisation also remained high on our radar to ensure healthy cashflows.
Our liquidity position remains robust with cash and cash equivalents of ₹32,614 crore, with a conservative debt exposure. We have been able to maintain a low Net Debt/EBITDA of 0.9x. Our focus on shareholder value creation remains unwavering, evidenced by a strong ROCE of ~19%.
From a resources standpoint, Vedanta continues to foster long life, structurally low cost and diverse assets with excellent potential, which aligns with our growth ambitions. Together with our strengths in technology, people, and governance, we are ready to cater to the nation’s growing needs for metals and minerals.
A PARAMOUNT FOCUS ON SAFETY
In FY2021, we sharpened our focus on fostering a safe and healthy working environment for our people and partners. However, it is with deep regret that I report the demise of eight of our colleagues. We are doing everything we can to ensure that such incidents do not occur in the future. At Vedanta, we accord paramount importance to occupational safety and employee well-being and continue to nurture a safety culture that results in zero harm.
However, there is always room for improvement, and collective action and behavioural change alone can usher in transformational outcomes. Aligned to this, we are conducting a Group-wide review of permit to work and isolation procedure and are instating a safety alert dashboard to improve implementation of fatality learnings. Cross business safety audits and piloting of critical risk management are other supplementary initiatives supporting this.
SUSTAINABILITY AS AN IMPERATIVE
I’m proud to say that today more than ever, we are striving to contribute better to the world. Our focus on decarbonisation and the commitments we have made in lieu of the same are proactive steps that we are taking in doing our part. Similarly, compared to a baseline from a decade ago, we are much better placed in terms of water savings and emissions. Going forward, we will continue to work on our announced targets and ensure that our operations maintain a greener footprint.
VEDANTA LIMITED | INTEGRATED REPORT AND ANNUAL ACCOUNTS 2020-21 | 21
CEO’S STATEMENT CONTINUED...
OPERATIONAL REVIEW
FY2021 saw us achieve some of our best quarters in zinc and steel while we sustained low-cost production of aluminium. We also ramped up our natural gas production. Here’s a brief update on each of our businesses:
Aluminium
In FY2021, we achieved record aluminium production of 1,969 kt at our aluminium smelters, and record alumina production from our Lanjigarh facility. We were also able to sustain our low-cost advantage by engaging structural measures to attain US$1,347 per tonne cost of production in FY2021. We have also achieved an EBITDA margin of 27%. While we have optimised our coal and bauxite source mix, we have also continued our journey towards improving our operational efficiencies and debottlenecking our assets for improved capacity utilisation. Similarly, Lanjigarh capacity expansion from 2 mtpa to 5 mtpa has been initiated.
Zinc
For Zinc India operations, we completed 1.2 MnT mined metal project activities and sustained production post-transition to a fully underground mining company. We will be actively adding to our R&R in sync with high production, going forward. We are also achieving strong momentum in silver production and aim to be among the top three producers of silver, globally. For Zinc International, our performance ramp-up continues, achieving highest ever production till date at Gamsberg, along with sustained cost reduction.
Oil & Gas
We continued delivering on growth projects such as the commissioning of the new gas facility, ramp up of polymer injection, and upgradation of the liquid handing capacity by 30%, major facility systems commissioned. We added 10 new blocks in OLAP II & III, bringing the total to 58 blocks. Early drilling opportunities are being evaluated in Rajasthan, Assam and Cambay regions. Till FY2021, to deliver on the capex project, 256 wells have been drilled and 149 wells hooked up. Our average gross production during the year stood at 162 kboepd; which was mainly impacted by COVID-19.
Iron ore
Following the upcyle in the metal sector, we were able to swiftly mobilise inventory, and realise value owing to firm market prices. The production in Karnataka has significantly improved at a y-o-y level.
Steel
For our ESL business, FY2021 proved to be the best till date, since acquisition. We achieved a hot metal production of 1,286 kt, with 19% margin. This was led by a significant contribution from our value-added products sales, whose mix in the portfolio has touched 72%.
FACOR
With respect to Ferro Alloys Corporation Limited (FACOR), we were able to more than double the margins since acquisition, and considerably improved our total market share. Our current ore production stands at 147 kt.
BUILDING A DIGITAL-FIRST ENTERPRISE
At Vedanta, we have laid a significant focus on leveraging technology and adopting Industry 4.0 practices. Under the ‘Pratham’ initiative, we have introduced several measures, such as smart manufacturing and advance process control in order to improve volumes and optimise asset utilisation. Project Disha, which leverages the wealth of data that the organisation has for decision-making, has started showing its results, owing to advanced analytics capabilities.
22
| < BACK TO CONTENTS | Integrated Report | Statutory reports | Financial statements |
At a process level, to achieve Group-level salience and unification, we harmonised our people and HSE functions, which will lead to measurably better outcomes. The digitalisation drive has also led to enhanced automation and control in our supply chain and logistics. This will lead to better cost rationalisations and higher transparency across all aspects of operations.
We have realised that the change needed for digital adoption is more human-led as much as systems-led. It is with this intention that we have introduced Vedanta Spark, which is a global start-up platform that builds the innovation culture and mindset change, strengthening Group-wide digital capabilities.
INNOVATING INTEGRATED APPROACHES
We have augmented our business model by integrating our procurement and marketing functions. This will result in better economies of scale, lower process redundancies, and take us closer to our customers. Today, Vedanta has a single window for the selling of key commodities, enabled by digital platforms. It will also increase cross-selling opportunities and add on to market growth and new product development.
WINNING THE FUTURE
Our focus remains on generating robust cash flows, capital discipline, proactive liability management and maintaining a strong balance sheet. Also, we will continue to review all our strategic decisions, based on the evolving industry realities.
Capitalising on a favourable macro-economic environment, we are committed to helping build a more self-reliant India, and relentlessly contributing to its progress. I thank our esteemed Board, employees, investors, communities and all other stakeholders who have put their precious faith in our vision and capabilities and seek their continued support.
Best regards,
Sunil Duggal
At a process level, to achieve Group-level salience and unification, we harmonised our people and HSE functions, which will lead to measurably better outcomes.
VEDANTA LIMITED | INTEGRATED REPORT AND ANNUAL ACCOUNTS 2020-21 | 23
KEY PERFORMANCE INDICATORS
Delivering on all fronts
GROWTH
Description: Revenue represents the value of goods sold and services provided to third parties during the year.
Commentary: In FY2021, consolidated revenue was at ₹86,863 crore compared to ₹83,545 crore in FY2020. This was primarily driven by higher commodity
prices, higher volumes at Zinc India, Copper, Iron Ore and Aluminium business, inclusion of FACOR in FY2021 and rupee depreciation, partially offset by lower power sales at TSPL, lower volume at Oil & Gas, Skorpion, and lower cost recovery at Oil & Gas business in FY2021.
Description: Earnings before interest, tax, depreciation and amortisation (EBITDA) is a factor of volume, prices and cost of production. This measure is calculated by adjusting operating profit for special items and adding depreciation and amortisation.
Commentary: EBITDA for FY2021 was at ₹27,341 crore, 30% higher y-o-y. This
was mainly driven by higher commodity prices, higher sales realisation from Iron ore and Steel business, increased volumes at Zinc India and Aluminium business, lower cost of production at Zinc, Aluminium and Oil & Gas business, and rupee depreciation, partially offset by lower brent realisation and lower cost recovery at Oil & Gas business.
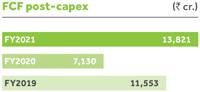
Description: This represents net cash flow from operations after investing in growth projects. This measure ensures that profit generated by our assets is reflected by cash flow, in order to de-lever or maintain future growth or shareholder returns.
Commentary: We generated FCF of ₹13,821 crore in FY2021, driven by strong cash flow from operations and lower sustaining and project capital expenditure.
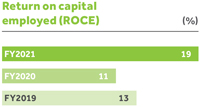
Description: This is calculated on the basis of operating profit before special items and net of tax outflow, as a ratio of average capital employed. The objective is to earn a post-tax return consistently above the weighted average cost of capital.
Commentary: Strong ROCE ~19% in FY2021 (FY2020: 11.2%), primarily due to strong operating and financial performance coupled with lower depreciation due to impairment in Oil & Gas business in FY2020.
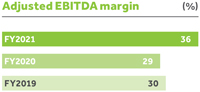
Description: Calculated as EBITDA margin excluding EBITDA and turnover from custom smelting of Copper India and Zinc India businesses
Commentary: Adjusted EBITDA margin for FY2021 was 36% (FY2020: 29%).
24
| < BACK TO CONTENTS | Integrated Report | Statutory reports | Financial statements |
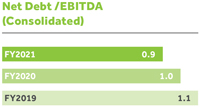
Description: This ratio represents the level of leverage of the Company. It represents the strength of the balance sheet of Vedanta Limited. Net debt is calculated in the manner as defined in Note 16(c) of the consolidated financial statements.
Commentary: Net debt/EBITDA ratio as at 31 March 2021 was at 0.9x, compared to 1x as at 31 March 2020.
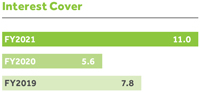
Description: The ratio is a representation of the ability of the Company to service its debt. It is computed as a ratio of EBITDA divided by gross finance costs (including capitalised interest) less investment revenue.
Commentary: The interest cover for the Company was at ~11.0x, higher y-o-y on account of higher EBITDA.
OTHER KEY FINANCIAL RATIOS
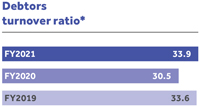
Description: The debtors’ turnover ratio is an accounting measure used to quantify the Company’s effectiveness in collecting its receivables. This is calculated as a ratio of revenue from operation to average trade receivables.
Commentary: The debtors turnover ratio was at 33.9x, higher y-o-y primarily on account of higher revenue from operations.
*Excluding power business
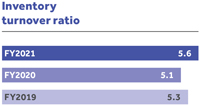
Description: The inventory turnover ratio is an efficiency ratio that shows how effectively inventory is managed. This is calculated as a ratio of cost of goods sold to average inventory.
Commentary: The inventory turnover ratio for the Company was at 5.6x in FY2021 as compared to 5.1x in FY2020.
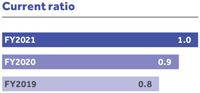
Description: The current ratio is a liquidity ratio that measures the Company’s ability to pay short-term obligations or those due within one year. This is calculated as a ratio of current assests to current liabilities.
Commentary: The current ratio of the Company remained flat at ~1.0x.
VEDANTA LIMITED | INTEGRATED REPORT AND ANNUAL ACCOUNTS 2020-21 | 25
KEY PERFORMANCE INDICATORS CONTINUED...
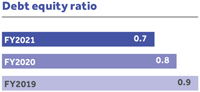
Description: It is a financial ratio indicating the relative proportion of shareholders’ equity and debt used to finance a company’s assets. This is calculated as a ratio of total external borrowing to total equity (share capital + reserves + minority).
Commentary: The ratio has decreased to 0.7x in FY2021 primarily because of decrease in gross debt due to the repayment of debt at Vedanta Standalone partially offset by increase in borrowing at Zinc India business and BALCO and increase in equity.
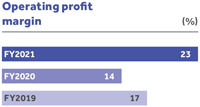
Description: Operating profit margin is a profitability or performance ratio used to calculate the percentage of profit the Company produces from its operations. This is calculated as a ratio of operating profit (EBITDA less depreciation) to revenue from operations.
Commentary: The operating profit margin was higher in FY2021 as compared to FY2020, primarily due to higher EBITDA and lower depreciation in the current year.
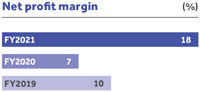
Description: It is a measure of the profitability of the Company. This is calculated as a ratio of net profit (before exceptional items) to revenue from operations.
Commentary: The net profit margin was higher in FY2021 as compared to FY2020, primarily due to robust EBITDA and lower depreciation in the current year.
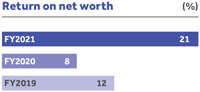
Description: It is a measure of the profitability of the Company. This is calculated as a ratio of net profit (before exceptional items) to average net worth (share capital + reserves + minority).
Commentary: The return on net worth has increased, mainly on account of increase in EBITDA during the year.
LONG-TERM VALUE
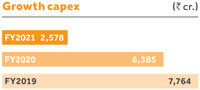
Description: This represents the amount invested in our organic growth programme during the year.
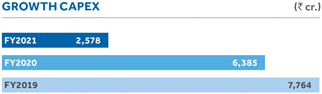
Commentary: Our stated strategy is of disciplined capital allocation on high- return, low-risk projects. Expansion capital expenditure during the year stood at ₹2,578 crore.
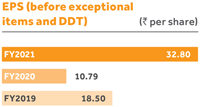
Description: This represents the net profit attributable to equity shareholders and is stated before exceptional items and dividend distribution tax (net of tax and minority interest impacts).
Commentary: In FY2020, EPS before exceptional items was at ₹32.80 per share. This mainly reflects the impact of lower depreciation charges and higher EBITDA.
26
| < BACK TO CONTENTS | Integrated Report | Statutory reports | Financial statements |
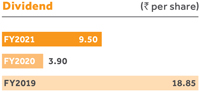
Description: Dividend per share is the total of the final dividend recommended by the Board in relation to the year, and the interim dividend paid out during the year.
Commentary: The Board has recommended a total interim dividend of ₹9.50 per share this year compared with ₹3.90 per share in the previous year.
Reserves and Resources (R&R)
Description: Reserves and resources are based on specified guidelines for each commodity and region.
Commentary:
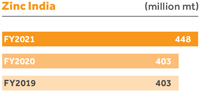
Zinc India: During the year, gross additions of 45 million tonnes were made to R&R, prior to depletion of 15 million tonnes. Overall mine life continues to be more than 25 years.
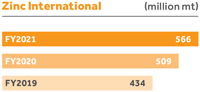
Zinc International: During the year, mineral R&R at Zinc International increased by 8% to 566.4 mt containing
30.3 mt of metal. Gross additions to R&R, after depletion, amounted to 41.3 mt of ore and 1.8 mt of metal. Despite depletion, reserve levels were successfully maintained at the same level as 2020, and amounted to 139.7 mt containing 8.3 mt of metal. The most significant contributor to the addition of
metal in resources was the declaration of a maiden resource at Gamsberg South (23.2 mt @ 7.1% Zn and 0.6% Pb). Overall mine life is more than 30 years.
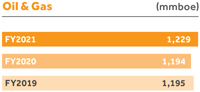
Oil & Gas: During FY2021, the gross proven and probable R&R increased by 35 mmboe during the year.
SUSTAINABLE DEVELOPMENT
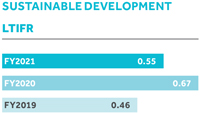
Description: The lost time injury frequency rate (LTIFR) is the number of lost-time injuries per million man-hours worked. This includes our employees and contractors working in our operations and projects.
Commentary: This year the LTIFR was 0.55. Safety remains the key focus across businesses.
Description: The percentage of women in the total permanent employee workforce.
Commentary: We provide equal opportunities to men and women. During the year, the ratio of female employees was 11% of total employees.
Description: The total number of beneficiaries through our community development programmes across all our operations.
Commentary: We benefited around 42 million people this year through our community development projects comprising community health, nutrition, education, water and sanitation, sustainable livelihood, women empowerment and bio-investment. This year our large-scale COVID-19 outreach programme has further augmented the metric.
VEDANTA LIMITED | INTEGRATED REPORT AND ANNUAL ACCOUNTS 2020-21 | 27
Marching ahead and contributing to
AATMANIRBHAR BHARAT
Hindustan Zinc Limited (HZL) is aggressively pursuing the Government of India’s mega drive towards Aatmanirbhar Bharat, and developing value-added zinc products for India’s steel, auto and alloy industries. Many success stories have been meticulously crafted through the collective grit and relentless innovation focus by Team HZL.
One such successful project is Continuous Galvanising Grade (CGG), a zinc-aluminium alloy that was co-developed with leading domestic steel manufacturers. The benefits of this value-added product comprise significantly low energy costs and better coating finish owing to the use of aluminium.
Electro Plating Grade (EPG) products
A successful HZL story
Another value-added product is Hindustan Zinc Die-cast Alloy (HZDA), which is now being used by the domestic auto components manufacturing industry. HZL offers two variants (HZDA-3 and HZDA-5) of the product to cater to the needs of alloy makers. Earlier, Die-cast alloys were imported, hence this make-in-India initiative will lead to foreign exchange savings for the country. Its wide availability is another big advantage for auto components manufacturing companies.
Yet another success story for HZL is Electro Plating Grade (EPG) products. The Company has set up a digital shop to quickly address the requirements of various customers seamlessly. Indian Micro Small and Medium Industries (MSMEs) can easily have access to the products
from the Company’s warehouses, with real-time prices benchmarked to the London Metal Exchange (LME).
The Company’s future plan is to develop zinc dust, which will cater to the requirements of the paints, pharma and fertiliser industries.
28
| < BACK TO CONTENTS |
HZL offers two variants
HZDA-3 and
HZDA-5
Possibilities on the horizon
Partnering for self-reliance
Aligned with the mission for a self- reliant India, HZL envisages several opportunities in the near and long term and is already capitalising on many of them. HZL is now partnering with leading Indian corporates for Aatmanirbhar Bharat. The partnership with Tata Steel is a remarkable step in this direction. Tata Steel made an exception to their Two-Supplier policy by giving 100% of their annual requirement to HZL last year. HZL is providing vendor managed inventory services to Tata Steel’s plants to help them rationalise their costs.
Collaborating with academia
HZL is also partnering with IIT Bombay for Continuous Galvanized Rebar (CGR) benefits. IIT Bombay has published a paper that demonstrates the benefits of CGR vs epoxy-coated vs non-galvanized rebars, along with cost implications. The life of all coastal infrastructure can increase manifold at an almost equal cost compared to other options for EPC contractors.
Capitalising on strong tailwinds
Given the gradual migration from fossil fuel to renewables throughout the world, major investments in battery technology involving zinc are expected to come to India. This indicates that the horizon of opportunities for HZL is growing. The Company is fully equipped to take advantage of these tailwinds to grow its business and partner a self-reliant India.
VEDANTA LIMITED | INTEGRATED REPORT AND ANNUAL ACCOUNTS 2020-21 | 29
Powering the wheels of
AUTOMOTIVE INDUSTRY
Aluminium’s versatility makes it the metal of choice for a wide range of industries. These are aviation, aerospace, automobiles and electric vehicles, transportation, building & construction, defence, electrical distribution, and many more. As India’s largest aluminium producer, our quest for product excellence stems from a mission to serve our customers better. This is centred around developing value-additions that tap into the metal’s superior inherent properties to cater to the evolving market requirements.
INDIGENOUS CAPABILITIES FOR AN IMPORT-DEPENDENT INDUSTRY
India’s auto sector consumes about 4% aluminium, vis-à-vis 11% in the US and 14% in Europe, indicating a huge growth headroom. The country’s foundry market for automotive components is small (only 10% of the total foundry market) compared to that of the US. With increasing focus on higher performance with better safety and lower emission, this gap is going to shrink progressively.
We, at Vedanta, have tapped into the opportunity are developing indigenous capabilities to meet aluminium’s growing demand. Our Aluminium business was the first in India to supply Primary Foundry Alloys (PFA) to the import-dependent domestic auto sector for the manufacture of alloy wheels.
PFA’s domestic market was ~250 kt in FY2020, of which 65 kt was being imported as wheels from China and other duty-free nations and ~20 kt was being supplied from BALCO. In FY2020, 160 kt PFA was imported into India, which later reduced to 98 kt in FY2021 following the capacity ramp-up in BALCO’s foundry alloy line.
Our aluminium smelters across Odisha and Chhattisgarh have advanced technology-enabled cast houses. Best-in-class engineering technologies, intelligent automation, smart solutions, environmental safeguards and sustainability-focused operating procedures are integrated to create lasting value. Equipped with in-line metal treatment facilities consisting of degassing and metal filtration unit and continuous casting technology, this ensures that our customers get the best-in-quality PFA.
A HAWK-EYED FOCUS ON QUALITY
Our foundry alloy ingots exceed the most stringent quality requirements such as the standards set by the International Automotive Task Force (IATF). We have received IATF-16949 certification, one of the most widely used international standards trusted by leading global automakers. We are now India’s only TS-16949 and IATF-16949 accredited primary smelter. Our Centre of Quality Excellence, stringent quality assessment of raw materials and finished products have made us one of the most preferred aluminium suppliers to developed markets. Our Customer Technical Services (CTS) team has become more advanced and intuitive in ensuring complete customer fulfilment. With state-of-the-art infrastructure, engineering prowess, global technology partnerships and R&D capability to develop solutions, Vedanta is poised to bring fundamental change in India’s automotive and auto-ancillary markets to help build the future of mobility.
30
| < BACK TO CONTENTS |
At Vedanta, we are relentlessly exploring the capabilities of aluminium as the
‘Green Metal of the Future’
A NATURAL GROWTH PARTNER FOR INDIA’S AUTOMOTIVE SECTOR
Expanding our foundry alloy product line, we have recently launched the Aluminium Cylinder Head Alloy. This alloy was entirely being imported into India (25 kt in FY2021). The Cylinder Head Alloy leverages material design to help automakers increase efficiency of internal combustion engines for improved performance on emission control, in line with BS-VI and CAFE (Corporate Average Fuel Efficiency/ Economy) norms.
The first Indian emission regulations were idle emission limits, which have become more stringent over time following the implementation of Bharat Standards, the latest of which is BS-VI, implemented on 1 April 2020. With tighter norms and compliance to control emission of sulphur oxide, nitrogen oxide and carbon dioxide, automakers are
looking for fundamental solutions such as improving the efficiency of internal combustion engines. This is where Vedanta’s Aluminium Cylinder Head Alloy is helping automakers adhere to emission norms.
India’s auto component sector is among the fastest growing but lags in contribution to manufacturing turnover. The country’s auto component industry’s aspirations of having a significant share of the global trade, calls for a renewed focus on localisation on every business front, particularly with respect to sourcing raw materials. As India’s leading producer of a vast array of globally acclaimed metals and value-added products, Vedanta is a natural partner for the automotive and auto ancillary industry, across their entire value chain, from large players to MSMEs for the nation’s growth.
VEDANTA LIMITED | INTEGRATED REPORT AND ANNUAL ACCOUNTS 2020-21 | 31
Taking digital transformation to
THE NEXT LEVEL
“Vedanta is focused on applying smart manufacturing technologies aimed at significantly improving HSE, driving up production volumes, reducing operating cost, improving stakeholder experiences, and enhancing ease of doing business. We are transforming into an organisation that is embracing new agile ways of working and we are making digital a way of life”
Anand Laxshmivarahan R,
Interim Group Chief Digital Officer, Vedanta
Traditional businesses, which were largely looked upon as brick-and-mortar companies, were slow to transform. However, they are recognising the need for faster digitalisation to expedite integration across divisions and verticals, stepping up efficiency, and reaching out to more customers and stakeholders. Besides, digitalisation has not only improved business gains, but has also enhanced safety standards. At Vedanta, we are relentlessly building on our digital backbone across all our businesses as an investment for the future.
3D VISUALISATION TO REDUCE
RAMP JAM
With the extensive use of 3D visualisation module of OptiMine to track machines in the Rampura Agucha underground mine, we have achieved significant improvement (9-10%) in the reduction of ramp jams from November 2020 to March 2021. The control room has played a major role in tracking daily operations and critical processes to reduce ramp jams, increasing efficiency and improving average response time to clear the jams.
HAULING CYCLE TIME
REDUCTION IN RA UNDERGROUND MINE
The digitalisation of the underground mine through our WiFi network has been completed at Rampura Agucha mine and the control room setup is fully operational. Traffic awareness is being utilised now for the main decline section spanning 12 km. Traffic congestion and real-time equipment tracking are being utilised to drive operational efficiency. Mobilaris and Eurovac are our key partners in our ongoing digitalisation programme at RAUG.
Low Profile Dump Truck (LPDT) cycle time has reduced by 9-10% with improved visibility and real-time decision-making from control room to equipment.
32
| < BACK TO CONTENTS |
3D
Visualisation
module
of OptiMine to track machines
in the Rampura Agucha
underground mine
SOFT SENSOR FOR ANALYSIS AND PREDICTION FOR REAL TIME P80
A soft sensor for P80 was built by modelling the grinding process in Rampura Stream, using the historical process parameter data from Pi. The model has 97% accuracy, which helps optimise the consumable usage of grinding media and process water addition. The model ensures a consistent P80 to the downstream floatation circuit, which will help the operations team to reduce concentrate grade fluctuation. As the model acts as a soft sensor for Particle Size Analyzer (PSI), the procurement and the operating costs of PSI are reduced. The model helps prevent over- or under- grinding by effective P80 tracking.
Traditional businesses are recognising the need for faster digitalisation to expedite integration across divisions and verticals, stepping up efficiency, and reaching out to more customers and stakeholders
VEDANTA LIMITED | INTEGRATED REPORT AND ANNUAL ACCOUNTS 2020-21 | 33
Cairn pushes the
DIGITAL ENVELOPE FARTHER
Cairn Oil & Gas commenced project ‘Nirman’ in FY2019, which laid out the Company’s digital roadmap and strengthened its foundation. The year FY2021 saw ‘Project Pratham’ embrace the ‘digital first’ approach by accelerating the existing digital projects and unveiling innovative initiatives to add more barrels to the topline, optimise cost per barrel and improve Health, Safety and Environment (HSE) practices.
Through this initiative, Cairn is re-designing itself for quicker digital adoption and building competencies through reskilling and ‘Act-Up’ programmes. The Oil & Gas business has further refined its digital strategy to accomplish the vision of ‘smart oilfield’ that cuts across the exploration and production value chain.
EXPLORATION AND NEW FIELD DEVELOPMENT
Leading to the reduction in time-to- first oil by moving to cloud-based data management and high-performance computing such as seismic data and processing on cloud, log splicing tool, and so on.
DECLINE & RESERVOIR MANAGEMENT
To manage production-related challenges to the ageing fields, we are using traditional first principle- based approaches augmented by new-age data driven techniques in Artificial Intelligence and Machine Learning (AI/ML) such as water flood optimisation in Aishwarya Upper Fatehgarh and polymer optimisation in Mangala fields, well reservoir management job planning and tracking, and so on.
SURFACE AND SUB-SURFACE OPERATIONS
We are focused on reducing unwanted production losses and driving digital-led efficient work processes through programmes such as digital oilfield. Disha – smart interactive reporting and dashboards, model predictive control-based artificial lift system optimisation, satellite fields IoT- based connectivity, production reporting, and others are part of this drive.
34
| < BACK TO CONTENTS |
Improved systems and processes and faster adoption of digital strategy have enabled Cairn Oil & Gas to win several national and international awards in the last few years.
ASSET INTEGRITY AND RELIABILITY
Improvement programmes are driven to have best-in-class equipment availability. The culture is shifting from reactive to proactive maintenance through the adoption of predictive analytics-based apps, asset performance management, drone-based transmission line inspections, control room, field logbooks, among others.
HEALTH, SAFETY AND ENVIRONMENT
HSE practices are supported by digitalisation, leading to Vedanta’s vision of zero harm, zero discharge and zero waste. For example, HSE dashboards, contact tracing mobile app, visible felt leadership app, incident learning app, and so on.
BUSINESS PROCESS IMPROVEMENTS
Digitally enabled supporting functions in the organisation are expected to become more efficient and productive such as HR, procurement, supply chain & logistics, finance, and so on. These functions use technologies such as upgraded ERP platform, BOTS, RPA (Robotic Process Automation), video analytics, and so on.
Digitally optimised artificial lift system
Artificial lift systems are complex pumping systems that drive oil from sub-surface to surface. Digital systems such as advanced process control or model predictive control maximises production without violating any of the surface, sub-surface, well or pump constraints. Additionally, customised artificial lift surveillance digital system helps avoid avoidable trips and shutdowns, thus leading to higher runtime resulting in enhanced production. Moreover, it helps engineers take prudent decisions that improve the run-life of these critical equipment.
VEDANTA LIMITED | INTEGRATED REPORT AND ANNUAL ACCOUNTS 2020-21 | 35
VALUE-CREATION AND STRATEGY
At Vedanta, our sustainability-focused and integrated business model continues to propel our value-creation process, helping deliver better returns for all stakeholders. Our long-term focus is reflected in our key strategic pillars that ingrain ESG as a core facet of business viability.
CREATING VALUE FOR STAKEHOLDERS
Shareholders, investors and lenders
A return on investment
Employees
A safe and inclusive working environment
Governments
Generating economic value for society and delivering sustainable growth
36
| < BACK TO CONTENTS |
Local community and civil society
Investment in health, education and local businesses
Industry (suppliers, customers, peers, media)
Building long-term partnerships
VEDANTA LIMITED | INTEGRATED REPORT AND ANNUAL ACCOUNTS 2020-21 | 37
VALUE CREATION MODEL
Operating a responsible, future-proof model
FINANCIAL CAPITAL
We are focused on optimising capital allocation and maintaining a strong balance sheet while generating strong free cash flows. We also review all investments, taking into account the Group’s financial resources with a view to maximising returns to shareholders.
MANUFACTURED CAPITAL
We invest in best-in-class equipment and machinery to ensure we operate as efficiently and safely as possible, both at our current operations and in our expansion projects. This also supports our strong and sustainable cash flow generation.
INTELLECTUAL CAPITAL
As a relatively young company, we are keen to embrace technological developments and encourage innovation. We motivate our people to nurture and implement innovative ideas, which will lead to operational improvements across our operations.
HUMAN CAPITAL
We have employees drawn from across the world, and their diverse skills and experience contribute to our operations. The mining and plant operations require specialised skills for which we employ qualified technical, engineering and geology experts. In addition, we create a culture which nurtures safety, innovation, creativity and diversity, which helps us to meet our business goals while also enabling our employees to grow personally and professionally.
SOCIAL & RELATIONSHIP CAPITAL
We aim to forge strong partnerships by engaging with our key stakeholders, including shareholders and lenders, suppliers and contractors, employees, governments, communities and civil societies. These relationships help maintain and strengthen our licence to operate.
NATURAL CAPITAL
India and Africa have favourable geology and mineral potential. These regions provide us with world-class mining assets and extensive R&R. Additionally, operating our mines requires a range of resources including water and energy, which we aim to use prudently and sustainably.
| FINANCIAL CAPITAL | ||||
| ₹372 crore | ₹57,028 crore | ₹77,414 crore | ||
| Equity | Gross debt | Net worth | ||
| ₹61,905 crore | ₹32,614 crore | ₹2,578 crore | ||
| Retained earnings | Cash and cash | Capex | ||
| equivalents | ||||
| MANUFACTURED CAPITAL | ||
| ₹106,784 crore | ₹13,880 crore | |
| Plant and Equipment | Capital Work in Progress (WIP) | |
| HUMAN AND INTELLECTUAL CAPITAL INDICATORS | ||||
| 70,089 | 1,481 | |||
| No. of Employees incl contractors | HSE employees incl contractors | |||
| 186 | 8,33,941 | 3,259 | ||
| No. of Geologists including contractors | No. of hours of Safety training | Employees covered under mentoring & support programmes | ||
| SOCIAL AND RELATIONSHIP CAPITAL | ||||||
| ₹331.12 crore | CRISIL & India Ratings | |||||
| Community investment | Rated by two domestic rating agencies | |||||
| 25 | 4 | |||||
| Strong network of | Independent Directors | |||||
| global and domestic relationship banks | ||||||
| NATURAL CAPITAL | ||||||
| 525 mn GJ | 270 mn m3 | 474 mn tonnes | ||||
| Energy consumed | Water consumed | Coal used | ||||
| R&R Zinc India | R&R Zinc International | |||||
| 448 mn tonnes Including 32.9 million tonnes of zinc-lead metal and 914.2 million ounces of silver | 566.4 mn tonnes Including 30.3 million tonnes of metal | |||||
| R&R Oil & Gas | ||||||
1,229 mmboe Gross proved and probable reserves resources | ||||||
38
| < BACK TO CONTENTS | Integrated Report | Statutory reports | Financial statements |
We operate across the mining value chain focusing on long-term and low-cost assets in India and Africa
EXPLORE
We invest selectively in exploration and appraisal to extend mine and reservoir life
DEVELOP
We develop world-class assets, using the latest technology to optimise productivity
EXTRACT
We operate low-cost mines and oil fields, with a clear focus on safety and efficiency
PROCESS
We focus on operational excellence and high asset utilisation to deliver top quartile cost performance and strong cash flow
MARKET
We supply our commodities to customers in a wide range of industry sectors, from automotive to construction, from energy to consumer goods
RESTORE
We manage our long-life assets as effectively as possible and return them to a natural state at the end of their useful life
*before exceptional items
| ₹86,863 crore | ₹27,341 crore | ~₹34,500 crore | ||
| Turnover | EBIDTA | Total contribution to the exchequer | ||
| ₹12,151 crore | ₹32.80/share | ₹9.5/share | ||
| Attributable PAT* | Earnings per share (EPS)* | Dividend paid | ||
| ₹13,821 crore | ~19% | 0.9x | ||
| FCF post-capex | ROCE | Net Debt to EBITDA | ||
Production across various businesses
| ||||
| Zinc India: | Zinc International: | Oil & Gas: | ||
| 1.0 mtpa | 58 kt | 162 kboepd | ||
| Mined metal | BMM | |||
| 706 tonnes | 145 kt | Power: | ||
| Silver | Gamsberg | 11.3 bn kWh | ||
| Aluminium: | Pig Iron: | Steel: | ||
| 1.8 mtpa | 596 kt | 1.2 MnT | ||
| Alumina | ||||
| 2 mtpa | Copper: | |||
| Aluminium | 101 kt | |||
| 6.49% | 0.55 | |||
| Attrition rate | Lost Time Injury Frequency Rate (LTIFR) | |||
| 11.23% | ||||
| Diversity ratio | ||||
| 42 mn | 1,800 | |||
| CSR programme beneficiaries | Operational Nand Ghars | |||
| 2,300+ | 2,193 | |||
| Nand Ghars built | Youth benefited from employment based skills training | |||
| 30.7% | 110% | |||
| Water recycled | Fly Ash utilisation rate | |||
| 2.03 mn m3 | 94% | |||
| Water savings | High Volume Low Toxicity (HVLT) effect waste recycled | |||
| 58.93 mn tCO2e | 1.31 mn tCO2e | |||
| GHG emissions: Scope 1 | GHG emissions: Scope 2 | |||
VEDANTA LIMITED | INTEGRATED REPORT AND ANNUAL ACCOUNTS 2020-21 | 39
STRATEGIC PRIORITIES
Focus areas integral to our decision-making
As part of our long-term roadmap, we have five strategic focus areas along which we determine our progress and deliver consistent stakeholder value. They are intricately linked to our material issues, opportunity landscape and risk management protocol, and hence form a key part of our integrated decision-making process. Progress and outlook across each of these focus areas have been summarised below.
Continue focus on world-class ESG performance
We operate as a responsible business, focusing on achieving ‘zero harm, zero discharge and zero wastage’, and thus minimising our impact on the environment and society.
We promote social inclusion across our operations to promote inclusive growth.
FY2021 update
8 fatalities occurred in the fiscal year; there are programmes put in place to ensure better investigation quality and leadership oversight to avoid repeats
This year we focused on critical risks existing in our business
New standards for business partner management introduced along with uniform monitoring system
LTIFR reported at 0.55
We launched a social performance pilot project at our critical sites
2300+ Nand Ghars established
We conducted self -assessment across all BUs to establish the current capacity
Objectives for FY2025
Zero fatality, with 2 fatality-free years
Stack emissions to be 25% of 2018 levels. All tailing facilities to be audited and actions closed with real-time monitoring
All performance standards to be developed, implemented and part of VSAP
Employee and community exposure monitoring
Mental health programme to be initiated
Achieve zero social non-compliances. Become signatories to and participants in VPSHR. Set up an external SP advisory body
Achieve 20% reduction in GHG emission intensity from a 2012 baseline
Ensure that 40% of all new projects have a carbon rating of 4-star and above
29,000 Nand Ghars to be constructed by 2025
Skilling and employment creation for 60,000 youths
Vision
Our safety vision: Everyone goes home safe
Our environment vision: Zero net environmental impact
Our health vision: No impact on employees, BPs and communities due to our operations
Our social performance vision: To become a developer of choice in our areas of operation
Our carbon vision: To substantially decarbonise by 2050
KPIs
Fatalities
TRIFR
No. of Category 5 social incidents
GHG emission intensity
Number of carbon star rated projects
Compliance tracking
Source emissions tracking
Personal exposure monitoring
CSR footprint
Gender diversity
Risks
| R1 | Health, safety and environment (HSE) |
| R2 | Managing relationship with stakeholders |
| R3 | Tailings dam stability |
| R9 | Regulatory and legal risk |
40
| < BACK TO CONTENTS | Integrated Report | Statutory reports | Financial statements |
Augment our Reserves & Resources (R&R) base
We look at ways to expand our R&R base through targeted and disciplined exploration programmes. Our exploration teams aim to discover mineral and oil deposits in a safe and responsible manner, and to replenish the resources that support our future growth ambitions.
FY2021 update
Zinc India
During the year, gross additions of 45 million tonnes were made to R&R prior to depletion of 15 million tonnes
Combined R&R estimated at 448 million tonnes, containing 32.9 million tonnes of zinc-lead metal and 914.2 million ounces of silver
Overall mine life continues to be more than 25 years
Zinc International
Combined mineral resources and ore reserves estimated at 566.4 million tonnes, containing 30.3 million tonnes of metal
Oil & Gas
Commencement of seismic acquisition and exploration drilling in OALP blocks spread across Rajasthan, Cambay and the Northeast shall enable to unlock the resource potential
Gross proved and probable R&R of 1,229 mmboe
Objectives for FY2022
Oil & Gas: Drilling commenced in Rajasthan, Cambay & North East for OALP blocks
Oil & Gas: Evaluating opportunities to commence drilling campaign of exploration and appraisal wells to build on the resource portfolio in Rajasthan
Metals: Continue to build R&R base and generate new greenfield targets for our commodities/metals
KPIs
Total 2P+2C Reserves & Resources in Oil & Gas
Total R&R in Zinc India & ZI
Risks
| R1 | Health, safety and environment (HSE) |
| R5 | Discovery risk |
| R9 | Regulatory and legal risk |
VEDANTA LIMITED | INTEGRATED REPORT AND ANNUAL ACCOUNTS 2020-21 | 41
STRATEGIC PRIORITIES CONTINUED...
Delivering on growth opportunities
We are focused on growing our operations organically by developing brownfield opportunities in our existing portfolio. Our large, well-diversified low-cost and long-life asset portfolio offers us attractive expansion opportunities, which are evaluated based on our return criteria for long-term value creation for all stakeholders.
FY2021 update
Zinc India
Total mine development increased by 3% to 95 km in FY2021
Environment clearance received for CLZS hydro smelter expansion by 84 kt and Zawar mines expansion by 8 lakh mtpa of ore
Back fill plants were commissioned at Zawarmala and Mochia mines
Zinc International
Significant ramp up in Gamsberg production with 145 kt zinc MIC in FY2021
Oil & Gas
New gas processing terminal construction completed; commissioning underway expected to add ~ 100 mmscfd by Q1 FY2022
Capex growth projects update:
| • | 74 wells hooked up during FY2021 |
| • | Ravva drilling programme completed; ~11 kboepd of incremental volumes |
Implementation of enhanced recovery project in Bhagyam and Aishwariya Fields
Monetisation of Tight Oil fields through execution of Aishwariya Barmer Hill project
ESL
Annual steel production at 1.19 million tonnes, down 4% y-o-y on account of reduced availability of hot metal due to lower production amidst the disruption caused by the pandemic
Objectives for FY2022
Zinc India
Further ramp-up of underground mines towards their design capacity of 1.2 mn mtpa
Combined paste-fill and dry tailing plant at Rajpura Dariba, which will help increase ore production from 1.2 mtpa to 2 mtpa
Setting up 300 ktpa greenfield Zinc smelter at Doswada, Gujarat
Zinc International
Skorpion Refinery Conversion – detailed BOQ generated, feasibility report being updated with latest information, target to get Board approval for execution by Q1 FY2022
Magnetite Project – Feasibility was completed in Q4 FY2021 0.7 mtpa modular plant has been finalised. Project will be put up for approval for start of execution in Q1 FY2022
The feasibility study for Gamsberg Phase 2 was updated. The mine design and the new reserve statement was completed with the Resource to Reserve conversion as scheduled
Oil & Gas
Unlock the potential of the exploration portfolio comprising OALP and PSC blocks
Infill projects across producing fields to add volume in near term
ESL
Embark on the expansion journey from 1.5 mtpa to 3 mtpa
To be a steelmaker amongst the top quadrant EBIDTA percentile group
KPIs
Revenue
ROCE
FCF post-capex
Growth capex
Risks
| R8 | Cairn related challenges |
| R9 | Regulatory and legal risk |
| R12 | Major project delivery |
42
| < BACK TO CONTENTS | Integrated Report | Statutory reports | Financial statements |
Optimise capital allocation and maintain a strong balance sheet
Our focus is on generating strong business cashflows and maintaining stringent capital discipline in investing in profitable high IRR projects. Our aim is to maintain a strong balance sheet through proactive liability management. We also review all investments (organic and acquisitions) based on our stringent capital allocation framework in order to maximise shareholder returns.
FY2021 update
Free cash flow (FCF) improvement from ₹7,130 crore to ₹13,821 crore, up 94% y-o-y
Net Debt (ND) increased from ₹21,426 crore to ₹24,414 crore
Net Debt/EBITDA at 0.9x on a consolidated basis
Dividend worth ₹3,500 crore, ₹9.5/share distributed in VEDL
Objectives for FY2022
Generate healthy free cash flow from our operations
Disciplined capex across projects to generate healthy
ROCE
Improve credit ratings
Reduce working capital
KPIs
FCF post-capex
Net Debt/EBITDA (Consolidated basis)
EPS (before exceptional items)
Interest cover ratio
Dividend
Risks
| R9 | Regulatory and legal risk |
| R10 | Tax related matters |
| R11 | Fluctuation in commodity prices (including oil) and currency exchange rates |
| R13 | Access to capital |
VEDANTA LIMITED | INTEGRATED REPORT AND ANNUAL ACCOUNTS 2020-21 | 43
STRATEGIC PRIORITIES CONTINUED...
Operational excellence
We strive for all-round operational excellence to achieve benchmark performance across our businesses by debottlenecking our assets to enhance production, supported by improved digital and technology solutions. Our efforts are focused on enhancing profitability by optimising our cost and improving realisations through prudent marketing strategies.
FY2021 update
Zinc India
Record ore production of 15.5 million tonnes, despite disruptions on account of COVID-19
Mined metal production of 972 kt and refined zinc-lead production of 930 kt
Zinc International
BMM achieved consistent production in FY2021 (58 kt)
Gamsberg ramped up significantly with 145 kt production in FY2021 and several best demonstrated performances in ore milled tonnes, mill throughput and plant availability.
Production was partly impacted by slope failure in November 2020, but plant continued to operate, backed by healthy ore stockpile
Skorpion remained under ‘Care and Maintenance’ following geotechnical instabilities in the open pit
Oil & Gas
Average gross operated production of 162 kboepd for FY2021, impacted by COVID-19
Liquid handling capacity upgraded by 30%, major facility systems were commissioned
Aishwariya Barmer Hill surface facility commissioned; wells being hooked up progressively
Aluminium & Power
Record aluminium production at the smelters at 1,969 kt, up 3% y-o-y
Highest ever PFA sales, 28% increase y-o-y
New products development in FY2021 such as Aluminium Cylinder Head Alloy, high speed billets, 22 kg and 10 kg ingots
Record alumina production from Lanjigarh refinery at 1,841 kt, up 2% y-o-y due to debottlenecking of the refinery
Locally sourced bauxite of ~3 MnT during the year (56%); alumina cost of production reduced by ~15% y-o-y at US$235 per tonne despite COVID-19 related challenges impacting the businesses
In FY2021, there were no fresh coal imports for our smelters, thereby reducing import dependency by ~3 million tonnes
Won Radhikhapur coal block in first tranche of commercial coal block auction
FY2021 cost of production for aluminium ~US$1,347 per tonne, down by 20% y-o-y
Steel
Increased the EBITDA margin to US$95 per tonne for the year (against US$78 per tonne in FY2020) even at dip in NSR by US$7 per tonne, through better control over costs
Decrease in cost by 6 % y-o-y from US$418 per tonne to US$393 per tonne
Copper and Iron Ore
At Karnataka, production of saleable ore was 5 million tonnes, 15% higher y-o-y
Revenue increased to ₹4,528 crore, 31% higher y-o-y mainly due to twofold increase in sales volume at Goa and improved margin at Goa, Karnataka and VAB during the year
EBITDA increase to ₹1,804 crore compared with ₹878 crore in FY2020 was mainly due to improved margin and higher volume at Goa
Continued engagement with the government and local communities to restart operations at Goa and Tuticorin
44
| < BACK TO CONTENTS | Integrated Report | Statutory reports | Financial statements |
Objectives for FY2022
Zinc India
Sustain cost of production at below US$1,000 per tonne through efficient ore hauling, higher volume and grades and higher productivity through ongoing efforts in automation and digitalisation
Zinc International
Ramp up Gamsberg to design capacity in H1 FY2022
Restart Skorpion post completion of geotechnical studies and feasibility completion of imported zinc oxides
Oil & Gas
Increase near term volumes by commissioning the gas processing terminal and completion of surface facilities for Aishwariya Barmer Hill
Continue to operate at a low cost-base and generate free cash flow post-capex
Aluminium
Production at Lanjigarh refinery of around 1.8-2 million tonnes, with aluminium production at smelters around 2.1-2.2 million tonnes
Hot Metal cost of production between between US$1,475- US$1,575 per tonne
Improve raw material security locally (bauxite and coal)
Increased focus on asset integrity and optimisation, quality, innovation and digitalisation
Copper & Iron ore
Continue engagement with government and relevant authorities to enable restart of operations in Goa and Tuticorin
Increase our footprint in iron ore by continuing to participate in auctions across the country, including Jharkhand
Securing EC for expansion of production capacity of Pig Iron plant by 1.7 ltpa
Advocacy for removal of E-auction/trade barrier in Karnataka
Steel
Ensuring business continuity with greater focus on reliability centred maintenance
Obtain clean Consent to Operate and environmental clearance
Raw material securitisation through long-term contracts; approaching FTA countries for coking coal
KPIs
EBITDA
Adj. EBITDA margin
FCF post-capex
ROCE
Risks
| R1 | Health, safety and environment (HSE) | |
| R3 | Tailings dam stability | |
| R7 | Loss of assets or profit due to natural calamities | |
| R11 | Fluctuation in commodity prices (including oil) and currency exchange rates | |
VEDANTA LIMITED | INTEGRATED REPORT AND ANNUAL ACCOUNTS 2020-21 | 45
OPPORTUNITY LANDSCAPE
Responsive to megatrends
Vedanta operates in a dynamic, regulated, and commoditised environment, and is influenced by megatrends that shape the industry. Key trends* that resonate with us and we respond to in the current environment are provided below.
| T1 | BUILDING RESILIENCE AMID VOLATILITY |
The COVID-19 pandemic has altered business dimensions with uncertainty becoming the order of the day. In this light, businesses have started adapting together and separately, serving the interests of their stakeholders and ensuring business continuity. Scenario planning straddles four hypothetical ones which strategic leaders such as Vedanta can plan for. These include the following:
| a. | A ‘passing storm’ response where the overall healthcare ecosystem is bolstered post the pandemic |
| b. | ‘Good company’ scenario where public-private partnerships will emerge with new ecosystems that would encourage innovation |
| c. | ‘Sunrise in the east’ indicating the shift of power to the eastern side of the world such as China |
| d. | ‘Lone wolves’ where the pandemic situation drags on to engage stricter protocols and government surveillance |
Vedanta’s response: The COVID-19 pandemic is an unprecedented humanitarian and economic crisis. Our metal and mining industry has sought to respond quickly to protect the health of its employees and its communities. These steps are in response to (and often ahead of) emergency measures and lockdowns implemented by governments across the world to control the spread of the pandemic.
During these testing times, our priority is to ensure the health and safety of our employees, contractors, and stakeholders, while ensuring business continuity to the extent possible. At the Group level, we have formulated various controls to prevent the spread of infection and thereby maintain business continuity. We formed a business COVID taskforce formalised from diverse departments whose task is to implement strong controls and SOPs/protocols, audit the respective units so as to ensure complete compliance to COVID-19 protocols to prevent the spread of the infection and to monitor and report the proceedings to the business CEO and Group task force.
Based on ‘Deloitte Insights: Tracking the trends 2021’
| T2 | WINNING BACK INVESTOR CONFIDENCE |
The mining industry lost out on investor confidence owing to the far-reaching downcycle that eroded value post M&A action in the past year. The companies in the sector would now need to find new ways to deliver consistent shareholder returns, enhance their environmental, social, and governance (ESG) performance and improve their capital and operational discipline. The scenario is also becoming increasingly conducive with historical lows now history.
46
| < BACK TO CONTENTS | Integrated Report | Statutory reports | Financial statements |
Vedanta’s response: Our focus during these times has been to ensure that we operate optimally with lowest possible cost of production.
In FY2021, we were able to sustain our low-cost advantage in aluminium by engaging structural measures. While we have optimised our coal and bauxite source mix, we also continued our journey towards improving our operational efficiencies and debottlenecking our assets for improved capacity utilisation. For Zinc India operations, we completed 1.2 MnT mined metal project activities and sustained production post-transition to a fully underground mining company.
As we look forward to the year ahead, we are operationally well positioned to deliver. In Oil & Gas, we are the largest private sector producer of crude oil in India and rank among the world’s lowest cost producer with a pipeline of assets in production, development, and exploration. In Zinc, we are the world’s largest fully integrated zinc-lead producer. In terms of Aluminium, we are India’s largest primary aluminium producer supported by our own captive power generation. We performed exceedingly well on key environmental, social and governance (ESG) aspects during the year. This is validated by our ranking in the Dow Jones Sustainability Index, which improved nine places to 12th globally in our industry.
| T3 | ESG-GETTING SERIOUS ABOUT DECARBONISATION |
Climate change has become an accepted reality in business circles and the risks arising from the phenomenon are increasingly becoming part of their strategic dialogue. The cost of taking action with respect to decarbonisation and renewables is also reaching parity. In this light, the focus from investment houses is now on how companies are moving from strategy to on ground execution that can show tangible results.
Vedanta’s response: Vedanta has an unwavering focus on sustainability, with ESG becoming a core focus. We have a vision to sustainably decarbonise by 2050. To realise specific outcomes, we have institutionalised a separate vertical for ESG. We continuously participate in ESG forums and have a Group-wide carbon forum with CEO level engagement.
VEDANTA LIMITED | INTEGRATED REPORT AND ANNUAL ACCOUNTS 2020-21 | 47
OPPORTUNITY LANDSCAPE CONTINUED...
| T4 | ESG-OVERCOMING THE SOCIAL TRUST DEFICIT |
There is a clear opportunity for miners to create social value that goes beyond compliance. Globally, high-profile disasters have muddled the reputation for mining and there is a tangible trust deficit that many miners experience. In this context, miners should explore creating long-term socioeconomic benefits for the communities in and around their impact zones. Measurement of impact of CSR programmes, for example, also gains prominence in this backdrop.
Vedanta’s response: Vedanta aims to be the developer of choice for communities, and an enabler for better livelihoods. Our Nand Ghar initiative, a novel programme aimed at women and child empowerment, has helped create significant impact in communities around our impact zones.
| T5 | ESG-CORPORATE GOVERNANCE ADDING TO COMPETITIVE ADVANTAGE |
The third pillar of ESG – Governance, is often underrated, but can have heavy repercussions if ignored as a downside risk. However, if managed prudently, good governance can change its role to a competitive advantage. Approach to issues such as human rights, ethical conduct, diversity, cybersecurity, and evolving social norms will need to gain significance in strategy-making and Board discussions.
Vedanta’s response: Vedanta has an illustrious Board with 50% independent members, that guides us in our present and future roadmap. Our corporate behaviour is led by our core values and policies that align to good governance.
| T6 | ESG-CREATING AN AGILE SUPPLY CHAIN |
The pandemic has exposed supply chain risks of mining companies, which were not actively recognised before. This validates a relook at how direct and extended supply chains work, how inventory is managed and how cost structures need to be evaluated. On the mitigation front, companies need to explore alternate supply lines, and reduce risk by creating predictable operations.
Vedanta’s response: Vedanta has an integrated value-chain which helps inherently mitigate supply chain risks to a large extent.
| T7 | THE PATH TOWARDS INTEGRATED OPERATIONS |
The proliferation of technology in mining has unlocked several opportunities in decision-making and achieving cost advantages. Digitalisation-led business integration is a key enabler, and a factor of achieving distinct competitive advantage. It results in predictable outcomes, consequently achieving better stakeholder trust.
Vedanta’s response: Vedanta has been at the forefront of digitalisation in its industry and has invested in technologies that not only results in better efficiencies and integration, but also enhanced safety in operations.
48
| < BACK TO CONTENTS | Integrated Report | Statutory reports | Financial statements |
| T8 | ADVANCING THE FUTURE OF WORK |
While there has been an undercurrent of shifting workplace practices, the pandemic has brought a sea change in the way organisations manage their team, through remote operations and work-from-anywhere models. With the use of Industry 4.0 technologies, activity-heavy operations such as mining can also move to remote models, with minimal human interactions and larger system integration. Conventional ways of working now need to be re-examined and contemporary working practices adapted as the new normal.
Vedanta’s response: Vedanta has been at the forefront of digitalisation and technology. We have various initiatives throughout the Group where remote working is used to analyse real time data.
For example, at Cairn Oil and Gas, a pilot is being conducted to use video analytics to reduce manual monitoring efforts and leverage technology to automate the alert monitoring through business rules.
Similarly, long range ultrasonic testing-based solution is used for the real-time pipeline monitoring.
COVID Marshal is an AI and ML based video analytics application implemented in Vedanta Limited which analyses the video captured through CCTVs and provides the compliance reports. The data is ingested for the compliance dashboard which can be accessed real time by the Management.
In Oil & Gas, a pilot is also being run where drones are used for automating survey of pipeline and rights-of-usage to ascertain erosion, exposed pipe, vegetation overgrowth, encroachments and missing/damaged signs and markers.
At HZL, drones-based technology is leveraged to provide solutions for asset maintenance and sustainability. These solutions provide automated diagnostics from safe and frequent aerial inspections (for transmission lines, pipelines etc.) and real-time, centralised view of remote assets.
| T9 | ON THE ROAD TO ZERO HARM |
The safety focus of mining companies has evolved towards zero harm, and there is a significant improvement in mining safety records. However, there is still room to improve, and companies will likely need to integrate different data pools and systems to effect better results.
Vedanta’s response: Safety is a core priority area for Vedanta, and we have instated processes and practices to enable highest standards of safety for all our people.
| T10 | MEETING DEMAND FOR GREEN AND CRITICAL MINERALS |
With the world moving towards a greener future, the demand for materials that enable cleaner energy is on the rise. This poses a clear opportunity for mining companies, as their portfolios will be shaped in response in the near future.
Vedanta’s response: Vedanta is a core player in unearthing minerals such as zinc and steel, which are not only core inputs in realising renewable infrastructure, but also in contributing to circular economy.
VEDANTA LIMITED | INTEGRATED REPORT AND ANNUAL ACCOUNTS 2020-21 | 49
RISK MANAGEMENT
Managing and mitigating risks in a volatile business scenario
 | As a global natural resources Company operating in multiple geographies, our businesses are exposed to a wide range of risks. Therefore, it is essential to have the necessary systems and a robust governance framework in place to manage risk, while balancing the risk-reward equation expected by stakeholders.
ENTERPRISE RISK MANAGEMENT
The Group has a multi-layered risk-management framework that aims to effectively manage the risks that our businesses are exposed to in the course of their operations, as well as in their strategic actions. We identify risks at the individual business level for existing operations as well as for ongoing projects through a well-crafted methodology. Formal discussion on risk management takes place at business level review meetings at least once in a quarter. Every business division of the Group has evolved its own risk matrix, which gets reviewed by the Business Management Committee. In addition, business divisions have developed their own risk registers. | |||
50
| < BACK TO CONTENTS | Integrated Report | Statutory reports | Financial statements |
Respective businesses review the risks, changes in the nature and extent of major risks since the last assessment, control measures and further action plans. The control measures stated in the risk matrix are also periodically reviewed by the business management teams to verify their effectiveness. These meetings are chaired by the business CEOs and attended by CXOs, senior management and functional heads concerned. The role of risk officers at each business and at the Group level is to create awareness on risks at the senior management level, and to develop and nurture a risk-management culture within the businesses. The Company’s risk-mitigation plans are integral to the KRAs / KPIs of process owners. The governance of risk management framework in the businesses is anchored with the leadership teams.
The Audit & Risk Management Committee aids the Board in the risk management process through identification and assessment of any changes in risk exposure, review of risk-control measures and by approval of remedial actions, wherever appropriate. The Committee is, in turn, supported by the Group Risk Management Committee, which helps the Audit & Risk Management Committee in evaluating the design and operating effectiveness of the risk-mitigation programme and the control systems. The Risk Management Committee meets at least four times annually to discuss risks and mitigation measures. The Committee reviews the robustness of our framework at individual businesses and progress against actions planned for key risks.
Our risk-management framework is simple and consistent and provide clarity on managing and reporting risks to our Board. Together, our management systems, organisational structures, processes, standards and code of conduct and ethics represent the system of internal control that governs how the Group conducts its business and manages the associated risks.
The Board shoulders the ultimate responsibility for the management of risks and for ensuring the effectiveness of internal control systems. It includes the Audit Committee’s report on the risk matrix, significant risks, and mitigating actions that we have put in place. Any systemic weaknesses identified by the review are addressed by enhanced procedures to strengthen the relevant controls, and these are reviewed regularly.
The Audit Committee is, in turn, assisted by the Group-level Risk Management Committee in evaluating the design and effectiveness of the risk-mitigation programme and control systems. The Group Risk Management Committee (GRMC) meets every quarter and comprises the Group Chief Executive Officer, Group Chief Financial Officer and Director- Management Assurance. The Group Head-Health, Safety, Environment & Sustainability is invited to attend these meetings. GRMC discusses key events impacting the risk profile, relevant risks and uncertainties, emerging risks and progress against planned actions.
Since it is critical to the delivery of the Group’s strategic objectives, risk management is embedded in business-critical activities, functions and processes. The risk management framework helps the Company by aligning operating controls with the Group’s objectives. It is designed to manage rather than eliminate the risk of failure to achieve business objectives and provides reasonable and not absolute assurance against material misstatement or loss. Materiality and risk tolerance are key considerations in our decision- making. The responsibility for identifying and managing risks lies with every manager and business leader.
Additionally, other key risk governance and oversight committees in the Group comprise the following:
Committee of Directors (COD) which comprises the Vice Chairman and Group CFO and supports the Board by considering, reviewing and approving all borrowing and investment-related proposals within the overall limits approved by the Board. The invitees to these committee meetings are the CEO, business CFOs, Group Head Treasury and BU Treasury Heads, depending upon the agenda matters
The Sustainability Committee reviews sustainability related risks
VEDANTA LIMITED | INTEGRATED REPORT AND ANNUAL ACCOUNTS 2020-21 | 51
RISK MANAGEMENT CONTINUED...
Additionally, there are various Group level Management Committees (ManComs) such as Procurement ManCom, Sustainability-HSE ManCom, CSR ManCom, and so on which work on identifying risks in those specific areas and mitigating them.
Each business has developed its own risk matrix, which is reviewed by its respective management committee/executive committee, chaired by its CEO. In addition, each business has developed its own risk register depending on the size of its operations and number of SBUs/ locations. Risks across these risk registers are aggregated and evaluated and the Group’s principal risks are identified, and a response mechanism is formulated.
This element is an important component of the overall internal control process from which the Board obtains assurance. The scope of work, authority and resources of the Management Assurance Services (MAS) are regularly reviewed by the Audit Committee. The responsibilities of MAS include recommending improvements in the control environment and reviewing compliance with our philosophy, policies and procedures. The planning of internal audits is approached from a risk perspective. In preparing the internal audit plan, reference is made to the risk matrix, and inputs are sought from senior management, business teams and members of the Audit Committee. In addition, we refer to past audit experience, financial analysis and the prevailing economic and business environment.
Despite COVID-induced disruptions Vedanta’s BUs dealt with its impact extremely well, resulting in an effective response. This was made possible owing to the following:
Our safety-first culture that prioritised people’s health and well-being
Our collaboration with communities, governments, and health experts ensure that leading practices are followed
Focusing on what is critical to operations and communities, while continuing to build longer-term resilience
Consistent response to the pandemic across the Group
Establishment of COVID-19 taskforces under seasoned leaders
Investments in new processes, procedures, protocols, health- testing equipment and support for workforce
As a result, our facilities remained largely operational during the pandemic, despite challenges. Rather, the disruption created an opportunity for us to identify and work on certain transformational aspects for the future. We continue to remain committed to achieving our objectives of zero harm, zero wastage and zero discharge, thus creating sustainable stakeholder value.
The order in which the risks appear in the next section does not necessarily reflect the likelihood of their occurrence or the relative magnitude of their impact on Vedanta’s businesses. The risk direction of each risk has been reviewed based on events, economic conditions, changes in business environment and regulatory changes during the year.
While Vedanta’s risk management framework is designed to help the organisation meet its objectives, there is no guarantee that the Group’s risk-management activities will mitigate or prevent these or other risks from occurring.
52
| < BACK TO CONTENTS | Integrated Report | Statutory reports | Financial statements |
The Board, with the assistance of the management, conducts periodic and robust assessments of principal risks and uncertainties of the Group, and tests the financial plans for each risk and uncertainty mentioned below.
SUSTAINABILITY RISKS
| R1 | Health, safety and environment (HSE) |
| Impact | Mitigation | Direction | ||
The resources sector is subject to extensive health, safety and environmental laws, regulations and standards. Evolving requirements and stakeholder expectations could result in increased cost or litigation or threaten the viability of operations in extreme cases.
Emissions and climate change: Our global presence exposes us to a number of jurisdictions in which regulations or laws have been, or are being, considered to limit or reduce emissions. The likely effect of these changes could be increase in the cost for fossil fuels, levies for emissions in excess of certain permitted levels, and increase in administrative costs for monitoring and reporting. Increasing regulation of greenhouse gas (GHG) emissions, including the progressive introduction of carbon emissions trading mechanisms and tighter emission reduction targets, is likely to raise costs and reduce demand growth. | HSE is a high priority area for Vedanta. Compliance with international and local regulations and standards, protecting our people, communities and the environment from harm and our operations from business interruptions are key focus areas
Policies and standards are in place to mitigate and minimise any HSE-related occurrences. Safety standards issued / continue to be issued to reduce risk level in high-risk areas. Structured monitoring and a review mechanism and system of positive compliance reporting are in place
BU leadership continues to emphasise on three focus areas: visible felt leadership, safety critical tasks and managing business partners
The process to improve learning from incidents is currently being improved with the aim of reducing re-occurrence of similar incidents
A Vedanta Critical Risk Management programme will be launched to identify critical risk controls and to measure, monitor and report the control effectiveness
The Company has implemented a set of standards to align its sustainability framework with international practice. A structured sustainability assurance programme continues to operate in the business divisions covering environment, health, safety, community relations and human rights aspects, and is designed to embed our commitment at the operational level
All businesses have appropriate policies in place for occupational health-related matters, supported by structured processes, controls and technology
To provide incentives for safe behaviour and effective risk management, safety KPIs have been built into performance management of all employees
The carbon forum has been re-constituted with updated terms of reference and representation from all businesses. It has a mandate to develop and recommend to the ExCo and Board the carbon agenda for the Group
Enhanced focus on renewable power obligations
The Group Companies are actively working on reducing the GHG Emissions Intensity of our operations
A task force is formulated to assess end-to-end operational requirement for FGD plant. We continue to engage with various stakeholders on the matter |
|

VEDANTA LIMITED | INTEGRATED REPORT AND ANNUAL ACCOUNTS 2020-21 | 53
RISK MANAGEMENT CONTINUED...
| R2 | Managing relationship with stakeholders |
| Impact | Mitigation | Direction | ||
| The continued success of our existing operations and future projects are in part dependent on the broad support and a healthy relationship with our respective local communities. Failure to identify and manage local concerns and expectations can have a negative impact on relations and therefore affect the organisation’s reputation and social licence to operate and grow. | CSR approach to community programmes is governed by the following key considerations: the needs of the local people and the development plan in line with the new Companies Act in India; CSR guidelines; CSR National Voluntary Guidelines of the Ministry of Corporate Affairs, Government of India; and the UN’s Sustainable Development Goals
Our BU teams are proactively engaging with communities and stakeholders through a proper and structured engagement plan, with the objective of working with them as partners
Business Executive Committees (Excos) factor in these inputs, and then decide upon focus areas of CSR and budgets while also aligning with strategic business priorities
All BUs follow well-laid processes for recording and resolving all community grievances
Every business has a dedicated Community Development Manager, who is a part of the BU Exco. They are supported by dedicated teams of community professionals
Our business leadership teams have periodic engagements with the local communities to build relations based on trust and mutual benefit. Our businesses seek to identify and minimise any potentially negative operational impacts and risks through responsible behaviour-acting transparently and ethically, promoting dialogue and complying with commitments to stakeholders
Stakeholder engagement is driven basis stakeholder engagement plan at each BU by CSR and cross-functional teams. Regular social and environment risk assessment discussions are happening at the BU level
Strategic CSR communication is being worked upon for visibility. Efforts continue to meet with key stakeholders, showcase our state-of-the-art technology, increase organic followers and enhance engagement through social media
CSR communication and engagement with all stakeholders – within and outside communities |
|
| R3 | Tailings dam stability |
| Impact | Mitigation | Direction | ||
| This signifies release of waste material leading to loss of life, injuries, environmental damage, reputational damage, financial costs and production impacts. A tailings dam failure is considered to be a catastrophic risk – i.e. a very high severity but very low frequency event that must be given the highest priority. | The Risk Management Committee included tailings dams on the Group Risk Register with a requirement for annual internal review and three-yearly external review
Operation of tailings dams is executed by suitably experienced personnel within the businesses
Third party has been engaged to review tailings dam operations, including improvement opportunities/remedial works required and the application of Operational Maintenance and Surveillance (OMS) manuals in all operations. This is an oversight role in addition to technical design and guidance arranged by respective business units. Technical guidelines are also being developed
Vedanta Tailings Management Standard has been reviewed, augmented and reissued including an annual, independent review of every dam and half-yearly CEO sign-off that dams continue to be managed within design parameters and in accordance with the last surveillance audit. Move towards dry tailings facilities has commenced
|
| ||
Those responsible for dam management received training from third party and will receive on-going support and coaching from international consultants
Management standards implemented with business involvement
BUs are expected to ensure ongoing management of all tailings facilities with Exco oversight with independent third-party assessment on Golder recommendations implementation status y-o-y
Digitalisation of tailings monitoring facilities is being carried out at the BUs
Tailing management standard is updated to include latest best practices in tailing management. UNEP/ICMM Global Tailings Standard has been incorporated into Vedanta Standard during FY2021 |
54
| < BACK TO CONTENTS | Integrated Report | Statutory reports | Financial statements |
OPERATIONAL RISKS
| R4 | Challenges in Aluminium and Power business |
| Impact | Mitigation | Direction | ||
| Our projects have been completed and may be subject to a number of challenges during operationalisation phase. These may also include challenges around sourcing raw materials and infrastructure-related aspects and concerns around Ash utilisation / evacuation. | Improved LME and improved aluminium demand has led to recovery from the fall which happened last year
Alumina refinery expansion from 2 to 5 mtpa being pursued
Continue to pursue new coal linkages to ensure coal security
Inbound and outbound supply chain across rail, road and ocean including manpower are functioning well, with no major risks foreseen
Local sourcing of bauxite and alumina from Odisha
Jharsuguda facilities have ramped up satisfactorily Project teams in place for Ash pond, Red mud, railway infrastructure and FGD
Dedicated teams working towards addressing the issue of new emission norms for power plants
Global technical experts have been inducted to strengthen operational excellence
Continuous focus on plant operating efficiency improvement programme to achieve design parameters, manpower rationalisation, logistics and cost reduction initiatives
Continuous augmentation of power security and infrastructure
Strong management team continues to work towards sustainable low-cost of production, operational excellence and securing key raw material linkages
Talwandi Saboo (TSPL) power plant matters are being addressed structurally by a competent team |
|

| R5 | Discovery risk |
| Impact | Mitigation | Direction | ||
| Increased production rates from our growth-oriented operations place demand on exploration and prospecting initiatives to replace reserves and resources at a pace faster than depletion. A failure in our ability to discover new reserves, enhance existing reserves or develop new operations in sufficient quantities to maintain or grow the current level of our reserves could negatively affect our prospects. There are numerous uncertainties inherent in estimating ore and Oil & Gas reserves, and geological, technical, and economic assumptions that are valid at the time of estimation. These may change significantly when new information becomes available. | Dedicated exploration cell with continuous focus on enhancing exploration capabilities
Appropriate organisation and adequate financial allocation in place for exploration
Strategic priority is to add to our R&R by extending resources at a faster rate than we deplete them, through continuous focus on drilling and exploration programme. Exploration Executive Committee (Exco) has been established to develop and implement strategy and review projects Group-wide
Continue to make applications for new exploration tenements in countries in which we operate under their respective legislative regimes
Exploration-related systems being strengthened, and standardised Group-wide and new technologies being utilised wherever appropriate
International technical experts and agencies are working closely with our exploration teams to enhance our capabilities |
|
VEDANTA LIMITED | INTEGRATED REPORT AND ANNUAL ACCOUNTS 2020-21 | 55
RISK MANAGEMENT CONTINUED...
| R6 | Breaches in IT/cybersecurity |
| Impact | Mitigation | Direction | ||
| Like many global organisations, our reliance on computers and network technology is increasing. These systems could be subject to security breaches resulting in theft, disclosure, or corruption of key/strategic information. Security breaches could also result in misappropriation of funds or disruptions to our business operations. A cybersecurity breach could have an impact on business operations. | Group-level focus on formulating necessary frameworks, policies, and procedures in line with best practices and international standards
Implementation and adoption of various best-in-class tools and technologies for information security to create a robust security posture
Special focus to strengthen the security landscape of plant technical systems (PTS) through various initiatives
Adoption of various international standards relating to Information Security, Disaster Recovery & Business Continuity Management, IT Risk Management and setting up internal IT processes and practices in line with these standards
Work towards ensuring strict adherence to the IT related SOPs so as to improve operating effectiveness and continuous focus on employees to go through mandatory cybersecurity awareness training
Periodic assessment of entire IT system landscapes and governance framework from vulnerability and penetration perspective in association with reputed expert agencies and addressing the identified observations in a time-bound manner |
|
| R7 | Loss of assets or profit due to natural calamities |
| Impact | Mitigation | Direction | ||
| Our operations may be subject to a number of circumstances not wholly within the Group’s control. These include damage to or breakdown of equipment or infrastructure, unexpected geological variations or technical issues, extreme weather conditions and natural disasters – any of which could adversely affect production and/or costs. | Vedanta has taken appropriate Group insurance cover to mitigate this risk and Insurance Council is in place that monitors adequacy of coverage and status of claims
An external agency reviews the risk portfolio and adequacy of this cover and assists us in our insurance portfolio
Our underwriters are reputed institutions and have capacity to underwrite our risk Established mechanism of periodic insurance review in place at all entities. However, any occurrence not fully covered by insurance could have an adverse effect on the Group’s business
Continuous monitoring and periodic review of security function
We continue to focus on capability building within the Group |
|
| R8 | Cairn related challenges |
| Impact | Mitigation | Direction | ||
| Cairn India has 70% participating interest in Rajasthan Block. The production sharing contract (PSC) of Rajasthan Block runs till 2020. The Government of India has granted its approval for ten-year extension at less favourable terms, pursuant to its policy for extension of Pre-NELP Exploration Blocks, subject to certain conditions. Ramp up of production vs envisaged may have impact on profitability. | RJ PSC 2020 extension was issued by the Directorate General of Hydrocarbons (DGH) subject to certain conditions. Ongoing dialogue and communication with the government and relevant stakeholders to address the conditions
The applicability of the Pre-NELP Extension Policy to the RJ Block is currently sub judice
Discussions within teams as well as with partners have been initiated with an objective to optimise cost across all spheres of operations
Constant engagement with vendors / partners to ensure minimal project delay based on the current situation and plan to ramp-up
The growth projects are being implemented through an integrated contracting approach. Contracts have built-in mechanism for risk and reward. Rigorous project reviews with execution partners / contractors to deliver volumes and returns
Project management committee and project operating committee have been set to provide support to the outsourcing partner and address issues on time to enable better quality control as well as timely execution for growth projects |
|
56
| < BACK TO CONTENTS | Integrated Report | Statutory reports | Financial statements |
COMPLIANCE RISKS
| R9 | Regulatory and legal risk |
| Impact | Mitigation | Direction | ||
| We have operations in many countries around the globe. These may be impacted because of legal and regulatory changes in the countries in which we operate resulting in higher operating costs, and restrictions such as the imposition or increase in royalties or taxation rates, export duty, impacts on mining rights/bans, and change in legislation. | The Group and its business divisions monitor regulatory developments on an ongoing basis
Business-level teams identify and meet regulatory obligations and respond to emerging requirements
Focus has been to communicate our responsible mining credentials through representations to government and industry associations
Continue to demonstrate the Group’s commitment to sustainability by proactive environmental, safety and CSR practices. Ongoing engagement with local community/media/NGOs
SOx-complaint subsidiaries
Common compliance monitoring system being implemented in Group companies. Legal requirements and a responsible person for compliance have been mapped in the system
Legal counsels within the Group continue to work on strengthening the compliance and governance framework and the resolution of legal disputes
Competent in-house legal organisation is in place at all the businesses and the legal teams have been strengthened with induction of senior legal professionals across all Group companies
Standard operating procedures (SOPs) have been implemented across our businesses for compliance monitoring
Greater focus for timely closure of key non-compliances
Contract management framework has been strengthened with the issue of boiler plate clauses across the Group which will form part of all contracts. All key contract types have also been standardised
Framework for monitoring performance against anti-bribery and corruption guidelines is also in place |
|
| R10 | Tax related matters |
| Impact | Mitigation | Direction | ||
| Our businesses are in a tax regime and changes in any tax structure or any tax-related litigation may impact our profitability. | Tax Council reviews all key tax litigations and provides advice to the
Group Continue to engage with authorities concerned on tax matters
Robust organisation in place at business and Group-level to handle tax-related matters
Continue to consult and obtain opinion from reputable tax consulting firms on major tax matters to mitigate the tax risks to the Group and its subsidiaries. |
|
VEDANTA LIMITED | INTEGRATED REPORT AND ANNUAL ACCOUNTS 2020-21 | 57
RISK MANAGEMENT CONTINUED...
FINANCIAL RISKS
| R11 | Fluctuation in commodity prices (including oil) and currency exchange rates |
| Impact | Mitigation | Direction | ||
| Prices and demand for the Group’s products may remain volatile/ uncertain and could be influenced by global economic conditions, natural disasters, weather, pandemics, such as the COVID-19 outbreak, political instability, and so on. Volatility in commodity prices and demand may adversely affect our earnings, cash flow and reserves. Our assets, earnings and cash flows are influenced by a variety of currencies due to our multi-geographic operations. Fluctuations in exchange rates of those currencies may have an impact on our financials. | The Group’s well-diversified portfolio acts as a hedge against fluctuations in commodities and delivers cashflows through the cycle
Pursue low-cost production, allowing profitable supply throughout the commodity price cycle
Vedanta considers exposure to commodity price fluctuations to be integral to the Group’s business and its usual policy is to sell its products at prevailing market prices; and not to enter into price hedging arrangements other than for businesses of custom smelting and purchased alumina, where back-to-back hedging is used to mitigate pricing risks. Strategic hedge, if any, is taken after appropriate deliberations and due approval from ExCo
Our forex policy prohibits forex speculation
Robust controls in forex management to hedge currency risk liabilities on a back-to-back basis
Finance Standing Committee reviews all forex and commodity-related risks and suggests necessary courses of action as needed by business divisions
We seek to mitigate the impact of short-term currency movements on the businesses by hedging short-term exposures progressively, based on their maturity. However, large, or prolonged movements in exchange rates may have a material adverse effect on the Group’s businesses, operating results, financial condition and/or prospects
Notes to the financial statements in the Annual Report provide details of the accounting policy followed in calculating the impact of currency translation |
|
| R12 | Major project delivery |
| Impact | Mitigation | Direction | ||
| Shortfall in achievement of expansion projects’ stated objectives leading to challenges in achieving stated business milestones – existing and new growth projects. | Empowered organisation structure has been put in place to drive growth projects. Project management systems have been streamlined to ensure full accountability and value stream mapping
Strong focus on safety aspects in the project
Geo-technical audits are being conducted by independent agencies
Engaged global engineering partner to do complete Life of Mine Planning and Capital Efficiency analysis to ensure that the project objectives are in sync with the BP and growth targets
Standard specifications and SOPs have been developed for all operations to avoid variability. Reputed contractors are engaged to ensure the completion of the project on indicated timelines
Mines are being developed using best-in-class technology and equipment and ensuring the highest level of productivity and safety. Digitalisation and analytics help improve productivity and recovery
Stage gate process to review risks and remedy at multiple stages on the way
Robust quality control procedures have also been implemented to check safety and quality of services / design / actual physical work
Use of reputed international agency for Geotech modelling and technical support, wherever required |
|
58
| < BACK TO CONTENTS | Integrated Report | Statutory reports | Financial statements |
| R13 | Access to capital |
| Impact | Mitigation | Direction | ||
| The Group may not be able to meet its payment obligations when due or may be unable to borrow funds in the market at an acceptable price to fund actual or proposed commitments. A sustained adverse economic downturn and/or suspension of its operation in any business, affecting revenue and free cash flow generation, may cause stress on the Company’s ability to raise financing at competitive terms. | A focused team continues to work on proactive refinancing initiatives with an objective to contain cost and extend tenor
The team is actively building the pipeline for long term funds for near to medium term requirements both for refinancing and growth capex
Track record of good relations with banks, and of raising borrowings in last few years
Regular discussions with rating agencies to build confidence in operating performance
Business teams ensure continued compliance with the Group’s treasury policies that govern our financial risk management practices
CRISIL and India Ratings have revised outlook to ‘Stable’ from ‘Negative’ while affirming the respective ratings |
|
VEDANTA LIMITED | INTEGRATED REPORT AND ANNUAL ACCOUNTS 2020-21 | 59
OUR BOARD AND MANAGEMENT
At Vedanta, we have a three-tier governance framework. This is constituted by our Board of Directors, who set the overall strategic vision for the Company, the Management Committee, which sets our goals and the Executive Committee, which is responsible for running various functions and implementing our priorities.
| 8 | 4 | 20 | ||
| Directors on Board | Management Committee Members | Executive Committee Members |
60
| < BACK TO CONTENTS |
[INTENTINALLY LEFT BLANK THE PAGE]
VEDANTA LIMITED | INTEGRATED REPORT AND ANNUAL ACCOUNTS 2020-21 | 61
BOARD OF DIRECTORS
Our competent and illustrious Board of Directors steers our strategic direction and assumes ultimate responsibility for corporate governance and creating value.
Anil Agarwal
Non-Executive Chairman
Mr. Anil Agarwal, appointed to the Board in May 2003, is the Executive Chairman of Vedanta Resources since March 2005 and chairs the Nominations Committee. He became the Non-Executive Chairman of Vedanta Limited in April 2020. Mr. Agarwal founded the Group in 1976 and has over four decades of entrepreneurial and mining experience. He has led the Group and has helped shape its strategic vision to contribute to a larger purpose towards uplifting communities. Under his leadership, Vedanta has grown from an Indian domestic miner into a global natural resources group with entities listed in a number of markets, with a world-class portfolio of large, diversified, structurally low-cost assets that are capable of generating strong cash flows.
Mr. Agarwal has this year signed the Giving Pledge, a movement of global philanthropists who commit to giving the majority of their wealth to philanthropy or charitable causes. The Anil Agarwal Foundation is committed towards empowering communities, transforming lives and facilitating nation building through sustainable and inclusive growth.
Nand Ghars have been created as model anganwadis which are focused on eradicating child malnutrition, providing education, healthcare, and empowering women with skill development. The Anil Agarwal Foundation has teamed up with the Bill & Melinda Gates Foundation to achieve United Nations Sustainable Development Goal 2, which aims to end all forms of hunger and malnutrition by 2030.
Navin Agarwal
Executive Vice Chairman
Mr. Navin Agarwal has been with the Group since its inception and has four decades of strategic executive experience. Under his stewardship, Vedanta has enjoyed leadership position in all the major sectors in which it operates. Over the years, he has been instrumental in building a highly successful meritocratic organisation, anchored by an extraordinary force of 100,000 employees. He spearheads our strategy through a mix of organic growth and value-generating acquisitions leading to Vedanta’s transformation into a globally diversified natural resources Company.
He is passionate about developing leadership talent and has been responsible for creating a culture of excellence at Vedanta through the application of advanced technologies and global best practices. He drives Vedanta’s unwavering commitment to the highest standards of corporate governance and engagement with key stakeholders. His vision is to gradually unlock the enormous potential of the natural resources sector and make it an engine of growth for India. The overarching vision of empowering the nation by achieving self-sufficiency in the natural resources sector remains close to his heart.
In recognition of his exceptional distinction in the fields of business and entrepreneurship and contribution to the natural resources sector, he was conferred the ‘Industrialist of the Year’ award by the Bombay Management Association in 2018. He is a fervent advocate of sustainable development and is committed to the empowerment of women and the promotion of culture and sports at all levels.
62
| < BACK TO CONTENTS | Integrated Report | Statutory reports | Financial statements |
Padmini Somani
Non-Executive Independent Director
Ms. Padmini Somani has been active in the philanthropy and development space for over 20 years. She is the vision behind Salaam Bombay Foundation that she founded in 2002, working with more than 3 million children across India. She has been recognised for her work in youth education, health, and skilling programmes with the vulnerable and marginalised populations. Having established the largest preventive school-based programme in tobacco control in India, she has also received several awards and recognition including from the World Health Organization, and the Mayor’s citation from Mr. Michael Bloomberg. Ms. Somani holds a Bachelor’s degree in Economics from Sophia College for Women, Mumbai and completed her Master’s in Financial Economics from University of London. She has also been awarded the prestigious Silver Jubilee Pendent and more recently the ‘Distinguish Alumnus’ award by her Alma Mater. She is also an alumnus of the London School of Economics and the London Business School. Ms. Somani serves on various Boards of companies, organisations, charities, and educational institutes.
Dindayal Jalan
Non-Executive Independent Director
Mr. D.D. Jalan is a Chartered Accountant and has over 40 years of extensive experience in managing business and finance of large metal & mining companies.
He is currently an entrepreneur and an Independent Director on the Boards of some prominent companies. In his previous role, before superannuation in 2016, he was the Group CFO of London listed Vedanta Resources Plc. and an Executive Director and CFO of Vedanta Ltd.
Mr. Jalan started his corporate journey in 1978 with Aditya Birla Group’s Hindusthan Gas & Industries Ltd as a management trainee, rising upto the rank of Finance & Commercial head. He was instrumental in transforming the iron ore business and setting up a greenfield SME business for Essel Mining, an associate company.
In 1996, he moved to Birla Copper to lead the Finance
& Commercial function. He was part of the core team instrumental in setting up and operationalising the greenfield Copper Smelting project into a robust operating business. He was responsible for raising finance, building the finance team, putting in place strong business process and systems, negotiating stable sources for long-term raw material supplies, setting up commodity hedging desk and building a robust marketing organisation.
In the year 2001, he moved to Sterlite Industries (now Vedanta Ltd) as CEO of its Copper mining business in Australia for ~5 years. He led the turnaround of the business, working in a multicultural environment. In 2003, he was appointed the CFO of Sterlite Industries. In 2005, he was elevated to CFO of Vedanta Resources PLC, a FTSE 250, London listed company. In this role he provided strategic leadership to the Finance function with a clear focus on enhancing shareholders’ value by improving capital management, governance framework, systems and processes, developing a robust Finance team. He closely worked with the CEO to drive business performance.
VEDANTA LIMITED | INTEGRATED REPORT AND ANNUAL ACCOUNTS 2020-21 | 63
BOARD OF DIRECTORS CONTINUED...
Sunil Duggal
Whole-Time Director & Chief Executive Officer
Mr. Sunil Duggal became the Chief Executive Officer of Vedanta Limited from August 1, 2020. Prior to this, he was the interim Chief Executive Officer of Vedanta Limited from April 6, 2020. He was appointed the Chief Executive Officer and Whole-time Director of Hindustan Zinc Limited (HZL) in 2015. He had been associated with HZL since 2010 as the Executive Director, and thereafter became the Chief Operating Officer in 2012, and subsequently the Deputy Chief Executive Officer in 2014.
In a career spanning over 37 years, he has been a result- oriented professional, leading high-performance teams with confidence, and has spent 20+ years in various leadership roles. His critical ability is to calmly navigate through tough and challenging times, meticulously nurture and grow a business, evaluate opportunities and risks, and successfully drive efficiency and productivity, while reducing costs and inefficiencies and delivering innovative solutions to challenges.
His consistent focus on adopting best-in-class mining and smelting techniques, state-of-the-art environment- friendly technologies, automation and digitalisation has enhanced Vedanta’s industry leadership. Born and brought up in Amritsar, his initial education began from DAV school, Amritsar. He has an Electrical Engineering degree from the Thapar Institute of Engineering and Technology, Patiala. He is an alumnus of the International Institute for Management Development, Lausanne - Switzerland and the Indian Institute of Management, Kolkata, India. Before he joined Vedanta, he was working with Ambuja Cements Limited.
He is serving as the Vice Chairman of International Zinc Association, President of the Federation of Indian Mineral Industries, and President of Indian Lead Zinc Development Association. He has also been appointed as the Chair of Confederation of Indian Industry National Committee on Mining.
Upendra Kumar Sinha
Non-Executive Independent Director
Mr. Sinha has served as the Chairman of Securities and Exchange Board of India (SEBI) from February 2011 to March 2017. He was instrumental in bringing about key capital market reforms. Under his leadership, SEBI introduced significant regulatory amendments to the various acts enhancing corporate governance and disclosure norms. Prior to his role in SEBI, he was the Chairman & MD of UTI Asset Management Company Pvt. Ltd. and has also worked for the Department of Economic Affairs under the Ministry of Finance.
64
| < BACK TO CONTENTS | Integrated Report | Statutory reports | Financial statements |
Mahendra Kumar Sharma
Non-Executive Independent Director
Mr. Sharma retired in May 2007 as the Vice Chairman of Hindustan Unilever Limited. As Vice Chairman he had responsibility for HR, Legal & Secretarial, Corporate Affairs, Corporate Communications, Corporate Real Estate functions and New Ventures, Plantations & Export businesses of the Company.
He displays passion for ensuring the highest standards of corporate governance and adherence to responsible and ethical conduct in all aspects of business operations. He holds a Bachelor’s degree in Arts and Bachelor of Law Degree from Canning College, University of Lucknow, Post Graduate Diploma in Personnel Management from Department of Business Management, University of Delhi and Diploma in Labour Laws from Indian Law Institute, Delhi. In 1999, he was nominated to attend Advanced Management Program at Harvard Business School. He served on the seven-member Committee constituted by the Government of India for redrafting the Companies Act and was also a member of the Naresh Chandra Committee constituted by the Government of India which formulated norms for corporate governance in India.
Priya Agarwal
Non-Executive Non-Independent Director
Ms. Agarwal brings to the Board her experience in Public Relations with Ogilvy & Mather and in Rediffusion Y&R. She has done B.Sc. Psychology with Business Management from the University of Warwick in the UK. She anchors ESG, CSR, PR & Communications for the Group.
VEDANTA LIMITED | INTEGRATED REPORT AND ANNUAL ACCOUNTS 2020-21 | 65
MANAGEMENT COMMITTEE
The Management Committee constitutes our organisational leadership and is responsible for setting targets and goals, and driving key decision-making across focus areas.
Sunil Duggal
Whole-Time Director & Chief Executive Officer
Mr. Duggal became the Chief Executive Officer of Vedanta Limited from August 1, 2020. Prior to this, he was the interim Chief Executive Officer of Vedanta Limited from April 6, 2020. He was appointed the Chief Executive Officer and Whole-time Director of Hindustan Zinc Limited (HZL) in 2015. He had been associated with HZL since 2010 as the Executive Director, and thereafter became the Chief Operating Officer in 2012, and subsequently the Deputy Chief Executive Officer in 2014.
In a career spanning over 37 years, he has been a result-oriented professional, leading high-performance teams with confidence, and has spent 20+ years in various leadership roles. His critical ability is to calmly navigate through tough and challenging times, meticulously nurture and grow a business, evaluate opportunities and risks and successfully drive efficiency and productivity, while reducing costs and inefficiencies and delivering innovative solutions to challenges.
His consistent focus on adopting best-in-class mining and smelting techniques, state-of-the-art environment- friendly technologies, automation and digitalisation has enhanced Vedanta’s industry leadership. Born and brought up in Amritsar, his initial education began from DAV school, Amritsar. He has an Electrical Engineering degree from the Thapar Institute of Engineering and Technology, Patiala. He is an alumnus of the International Institute for Management Development, Lausanne - Switzerland and the Indian Institute of Management, Kolkata, India. Before he joined Vedanta, he was working with Ambuja Cements Limited.
He is serving as the Vice Chairman of International Zinc Association, President of the Federation of Indian Mineral Industries, and President of Indian Lead Zinc Development Association. He has also been appointed as the Chair of Confederation of Indian Industry National Committee on Mining.
Sharad Kumar Gargiya
Group Chief Commercial Officer
Mr. Gargiya has been appointed as the Group Chief Commercial Officer of Vedanta from April 2020. He has been associated with the Vedanta Group since October 1998 and has held key senior leadership roles as Chief Financial Officer and Chief Commercial Officer across the Group companies. He has been integral to the Vedanta Group Executive Committee and the Group Management Committee. He is a member of the Group Ethics Committee since 2016, and a leading member of the Group Insurance Council for over five years.
A versatile leader, with over 22 years of experience, he formulates and executes strategic initiatives, driving business excellence, and cultural transformation. He has contributed significantly to unlocking Vedanta’s business value through his leadership and strategic roles in telecom cable, copper, aluminium, power business and zinc. He is passionate about sustainability and resource productivity. He has always been an early adopter of advanced technologies and processes to increase efficiencies and optimise cost with a focus on building automation and digitalisation of operational activities. He defines ‘personal successes’ as his ability to make ‘others successful’. He is a qualified Chartered Accountant and Bachelor of Commerce. He has attended the General Management Programme at Harvard Business School in 2011.
66
| < BACK TO CONTENTS | Integrated Report | Statutory reports | Financial statements |
Madhu Srivastava
Chief Human Resources Officer
Ms. Srivastava was appointed the Chief Human Resources Officer of the Vedanta Group in December 2018. She has been associated with Vedanta for over eight years, and in her earlier role, she was the Chief Human Resources Officer of Cairn - Oil and Gas business for close to three years. During this time, she was also leading Talent Acquisition and Diversity & Inclusion functions for the Group. Under her leadership, Vedanta has put in place the right HR policies, progressive and globally benchmarked people practices and frameworks for talent acquisition, talent management, performance management and rewards and recognition.
She has over two decades of experience across HR and sales, marketing and operations, spanning the Fast-Moving Consumer Goods (FMCG), Telecom, Information Technology Enabled Service (ITES), Banking, Financial Services and Insurance (BFSI) and natural resources industries. Ms. Srivastava started her professional journey in 1999 with Godrej, where she handled sales in Gujarat and Maharashtra and later moved to the Corporate Sales & Marketing role. Post working with companies such as GE Capital and Reliance in operations and marketing profiles, she started her HR journey in 2006 by joining Genpact as Assistant Vice President, Talent Acquisition where she led middle-management hiring. Subsequently, she went on to lead the recruitments for Citibank’s India operations as Vice President, Human Resource before joining the Vedanta Group in 2012. Ms. Srivastava completed her Post Graduate Diploma in Management (PGDM) in marketing and sales from the Indian Institute of Management Ahmedabad.
Ajay Goel
Deputy Chief Financial Officer
Mr. Goel has been appointed as Deputy Chief Financial Officer of Vedanta Limited, effective March 23, 2021 based at Delhi. As Deputy CFO, Mr. Goel is responsible for Financial Planning & Analysis, Accounting and Consolidation, Controllership, Audit, Tax, Secretarial & Compliance and Risk Management. He is driving business performance monitoring and reporting with a focus on benchmarking and analytics. He brings 21 years of rich experience in global multinational companies in FMCG sector, including General Electric, Nestle, Coca Cola and Diageo. Mr. Goel joins us from Diageo - USL and under his leadership, the company achieved highest standards of Corporate Governance, Reporting, Tax management, Treasury restructuring, Optimization of borrowing costs. Ajay is a national rank holder both as Chartered Accountant and Company Secretary. He earlier completed his B.Com (Hon.) from St. Xavier’s College in Accounting and Business Management.
VEDANTA LIMITED | INTEGRATED REPORT AND ANNUAL ACCOUNTS 2020-21 | 67
EXECUTIVE COMMITTEE
The Executive Committee focuses on implementing key initiatives and interventions and leads strategy execution from the front.
Ajay Goel
Deputy Chief Financial Officer
Mr. Goel has been appointed as Deputy Chief Financial Officer of Vedanta Limited, effective March 23, 2021 based at Delhi. As Deputy CFO, Mr. Goel is responsible for Financial Planning & Analysis, Accounting and Consolidation, Controllership, Audit, Tax, Secretarial & Compliance and Risk Management. He is driving business performance monitoring and reporting with a focus on benchmarking and analytics. He brings 21 years of rich experience in global
multinational companies in FMCG sector, including General Electric, Nestle, Coca Cola and Diageo. Mr. Goel joins us from Diageo - USL and under his leadership, the company achieved highest standards of Corporate Governance, Reporting, Tax management, Treasury restructuring, Optimization of borrowing costs. Ajay is a national rank holder both as Chartered Accountant and Company Secretary. He earlier completed his B.Com (Hon.) from
St. Xavier’s College in Accounting and
Business Management.
Arun Misra
Chief Executive Officer, HZL
Mr. Misra was appointed as the Chief Executive Officer, HZL from August 2020. Prior to this he held the position of Deputy Chief Executive Officer, HZL since joining the company in November 20, 2019. In his previous role, he was associated with TATA Steel Limited as Vice President of raw materials. He has
over three decades of rich and diverse experience in leading various strategic positions within TATA Steel. Mr. Misra holds a BTech in Electrical Engineering from IIT Kharagpur, a diploma in mining and beneficiation from the University of New South Wales Sydney and a diploma in general management from CEDEP, France.
Laxman Shekhawat
Business Head, VZI
Mr. Shekhawat was appointed as the Business Head, anchoring the ManCom of Vedanta’s Zinc International Division and CMT to drive business growth on 24 April 2020. Previously, Mr. Shekhawat held the role of Director - Operations of HZL from February 2019. He holds a BTech in Mining Engineering and has been working with HZL since 1990. With over three decades of experience in mining and
engineering, Mr. Shekhawat has served in various leadership positions in mining and engineering companies for over a decade. He is instrumental in developing and executing strategies to unlock the full potential of HZL mines and bring the best practices in the mining portfolio. In 2017, he was awarded the prestigious National Geoscience Award by the President of India.
Chhavi Nath Singh
Chief Executing Officer, Aluminium - Jharsuguda, Odisha
Mr. Singh is the Chief Executive Officer of our Aluminium business-Jharsuguda, Odisha since July 2019. He joined Vedanta in 2016 as the Chief Operating Officer of Talwandi Sabo Power Ltd. He has a rich 38-year experience in the power industry and has played a pivotal role in the stabilisation of TSPL’s operations. He
has also worked for companies such as the National Thermal Power Corporation Ltd., Essar Power and JSW Energy Ltd. He has a post-graduate degree (PGDBM) from the Management Development Institute, Gurgaon and a Bachelor’s degree in Mechanical Engineering from the Motilal Nehru National Institute of Technology, Allahabad (formerly Motilal Nehru Regional Engineering College).
68
| < BACK TO CONTENTS | Integrated Report | Statutory reports | Financial statements |
Rahul Sharma
Deputy Chief Executive Officer, Aluminium
Mr. Sharma joined the Group in 1998 and is the Deputy Chief Executive Officer of Vedanta’s Aluminium business since 24
November 2020. Before he took up this role, he worked as the Chief Executive
Officer (Acting) of Alumina business from April 2019 and as Director – Corporate Strategy (Aluminium and Power).
Mr. Sharma has a diversified experience of over 25 years and has held leadership positions at Vedanta Limited and Sterlite Technologies Ltd. Before he joined Vedanta, he was the Chief Marketing Officer (Domestic and International) and Business Head - Integrated Management System at Sterlite Technologies Ltd.
He is one of the prominent personalities of India’s Metal & Mining industry and has been playing a significant role in formulating and catalysing various policies and creating a strategic framework for numerous government reforms for the development of exploration, mining and non-ferrous metal sector in the country in the most sustainable manner. He is also the office
bearer of various eminent industry associations, including the current President of Aluminium Association of India (AAI), Chairman of Indian Captive Power Producers Association (ICPPA), and Co-Chair of FICCI’s Mining Committee. In recognition of his exemplary leadership, he has been conferred various awards and accolades including People’s CEO of the Year Award 2020 and Business Leader of the Year Award at the International Conference on Non-Ferrous Metals-2017 for his contribution to India’s Metal and Mining industry. An IIM alumnus (Ahmedabad Executive General Management programme), Mr. Sharma has an MBA in Marketing and a B.E. in Electronics and Communication.
Abhijit Pati,
Chief Executive Officer, BALCO
Mr. Pati was appointed as the Chief Executive Officer of BALCO in July 2019. Prior to this, he was the Chief Executive
Officer of our Aluminium business, Jharsuguda from March 2015. Earlier, he was the President and Chief Operating Officer of our Aluminium and Power business at Odisha since April 2012. He has over three decades of experience in the aluminium industry. Prior to joining us, he was the Vice President at Hindalco Industries Limited. He started his career as an engineer with the Indian Aluminium Company in 1989. He received the
‘Exceptional Contributor Award’ from the Aditya Birla Group Chairman, Mr. Kumar Mangalam Birla for his significant contribution to turn around Hirakud Aluminium Smelter in 2006 and won the prestigious British Sword of Honor for the Hirakud Smelter in 1999.
He is a member of the Bureau of Energy Efficiency under the Ministry of Power, Government of India. He also holds the position of Vice President in Aluminium Association of India and is member of the Governing body. He is a two time gold medallist from esteemed institutes such as the Calcutta University and International Management Institute, New Delhi. Mr. Pati has a first-class honours Bachelor’s degree in Chemical Engineering from the Calcutta
University and a Master’s in Business
Administration from the International Management Institute, New Delhi.
Ajay Kapur
Chief Executive Officer, Aluminium and Power Mr. Kapur was appointed as the Chief Executive Officer, Aluminium and Power in March 2019, and took on an additional role as the Managing Director of Commercial on 24 November 2020. He leads the Aluminium and Power business for Vedanta comprising 2.3 mtpa installed smelter capacity, 8 GW of power and 2 mtpa of alumina refinery. Prior to his appointment at Vedanta Limited, he was the Managing Director and Chief Executive
Officer of Ambuja Cements. He started his career as an Executive Assistant to the founder and then Managing Director. He went on to handle various strategic positions at Ambuja Cements with his last position as the MD and CEO. Mr. Kapur holds a Bachelor’s degree in economics from St. Xavier’s College, Mumbai, MBA from KJ Somaiya Institute, Mumbai and is an alumnus of Wharton’s Advanced
Management Programme.
VEDANTA LIMITED | INTEGRATED REPORT AND ANNUAL ACCOUNTS 2020-21 | 69
EXECUTIVE COMMITTEE CONTINUED...
Vikas Sharma,
Chief Executive Officer, TSPL
Mr. Sharma was appointed as the Chief Executive Officer of TSPL-our Power business in July 2019. He was appointed as the Whole-time Director designated as the CEO and WTD from October 2019. Prior to his stint at TSPL, he was appointed as the Chief Executive Officer and Whole-time Director of BALCO in March 2017. He has experience of 31+ years in various national and multinational companies. He has been with HMT Watches Limited, Su-Raj Diamonds India Private Limited, AMP India Private Limited (now Tyco Electronics), Praxair India Private Limited, Jindal Praxair Oxygen Company Limited
and JSW Steel Limited in various key positions.
Mr. Sharma joined Vedanta Group as the location head of Chanderiya Smelter of HZL in 2012 and was gradually elevated to the Chief Operating Officer of Smelters division of HZL in June 2014. During his tenure at Vedanta, he played an integral role in the Company’s growth and made significant contribution in safety, productivity and people development. He holds a Bachelor’s degree (Hons) in Mechanical Engineering from Engineering College Kota, University of Rajasthan and a Master’s in Business Administration in Marketing from Sikkim Manipal University, Gangtok, India.
Prachur Sah,
Deputy Chief Executive Officer, Cairn Oil & Gas
Mr. Shah joined the Group as Director New Ventures and Reserves of Cairn from 21 August 2018, and was made the Deputy Chief Executive Officer of Cairn Oil & Gas on 19 October 2020. He has since played a key role towards realising Cairn’s broader vision and is responsible for unlocking value through monetisation of our new exploration blocks under OALP. Prior to joining the Group, Mr. Sah had 19 years of rich and diverse
experience at Schlumberger and has worked across geographies including Houston, South America, UAE and India. At Schlumberger, he held various roles in Operations, Transformation and Business Development, and left Schlumberger as the Managing Director for India, Bangladesh and Sri Lanka. Mr. Sah holds a Bachelor’s in Electrical and Electronics from IIT Mumbai and a Master’s in Oil and Gas Management from Heriot Watt University, Edinburgh.
Pankaj Kumar,
Chief Executive Officer (Copper Operations Tuticorin, Silvassa and Fujairah Gold FZC & Director, MEL)
Mr. Kumar was appointed as the Chief Executive Officer of our copper operations in Tuticorin, Silvassa and Fujairah Gold FZC and Director of MEL in March 2019. He is also anchoring the Group’s Quality Assurance. In his career of over three decades, he has worked with large conglomerates such as Tata Steel, Mittal Steel, Adani Ports, Gujarat
Guardian Limited and United Breweries Limited. Prior to joining us at Sterlite Copper as Chief Executive Officer, he was the Chief Operating Officer at Hindustan Zinc Limited. Mr. Kumar holds a BTech (Hons.) in Mechanical Engineering from the Indian Institute of Technology Kharagpur and a post-graduate diploma in Business Management with specialisation in Operations Management and Information Technology from XLRI - Xavier School of Management, Jamshedpur, India.
70
| < BACK TO CONTENTS | Integrated Report | Statutory reports | Financial statements |
Sauvick Mazumdar,
Chief Executive Officer, Sesa Goa
Mr. Mazumdar is the Chief Executive Officer of Sesa Goa and was appointed on 12 July 2019. Prior to this role he was the Deputy Chief Executive Officer of Sesa Goa and Vice President since 1 October 2016. He joined the organisation in 1994; he is a home-grown leader who rose to the ranks from a GET to CEO. He is a well-seasoned executive with 24+ years of extensive experience, having built a reliable reputation for achieving business growth through strategic direction, diverse perspectives and proactive
leadership. He is responsible for the overall operations and expansion projects of the Iron Ore & Ferro Alloys business within India — Goa and Karnataka along with value- added business (pig iron, met coke, and power), Jharkhand, Bellary, overseas projects at Liberia and Ferro Alloys business at FACOR in Odisha. He holds a BTech degree in Mining Engineering from the National Institute of Technology, Surathkal Karnataka and a First-Class Mines Manager’s Certificate of Competency from DGMS, the Government of India, Dhanbad.
Pankaj Malhan,
Chief Executive Officer and Whole-time Director, ESL
Mr. Malhan is the Chief Executive Officer and Whole-time Director of ESL and joined ESL in October 2018. He has over 20 years of industry experience and joined ESL from Tata Steel, where he was the Head of Engineering and Project. He was responsible for leading Tata Steel’s capital expansion programmes. He was associated with the Tata Group since 2000, and has held various senior
management positions at Tata Steel, Tata Blue Scope Steel Limited and Tata Power Limited. Prior to joining the Tata Group, he had worked with Indian Acrylics Limited and Fisher Rosemount Limited. He holds a BTech in Instrumentation and Control from the National Institute of Technology, Jalandhar, India, and also has done post-graduate diploma in Business Management from XLRI – Xavier School of Management, Jamshedpur, India.
Dilip Golani,
Management Assurance Services, Vedanta Group
Mr. Golani now heads the Group’s Management Assurance Services function. He previously headed the Sales and Marketing division for HZL and the Group’s Performance Management function. Prior to joining the Group in April 2000, he was a member of the Unilever corporate audit team responsible for auditing the Unilever group companies in Central Asia, the Middle East and Africa. Prior to that,
he was responsible for managing operations and marketing functions for one of the exports businesses of Unilever India. He has over 31 years of experience and has previously worked with organisations such as Union Carbide India Limited and Ranbaxy Laboratories Limited. He holds a BTech in Mechanical Engineering and has completed his post- graduate studies in Industrial Engineering and Management from the National Institute of Industrial Engineering, Mumbai, India.
Andrew Lewin,
Group Health, Safety, Environment and Sustainability Head
Mr. Lewin joined as the Group Health, Safety, Environment and Sustainability Head in February 2020. He has over 33 years of experience within mining and Oil & Gas industries. He was previously the Managing Director at Spectrum Risk Consulting, Australia. He has also held multiple senior roles at BHP Billiton, Newmont Mining Corporation and other
companies across the US, Australia and UK with responsibility for health, safety, environment and sustainability assurance. He has done PhD in Chemistry from the University of Waterloo and Postgraduate Diploma in Health and Safety from Aston University, England. He also holds an M.Sc. degree in physics from The University of Manchester, and a BSc (Hons) degree in Chemistry from the University of Bristol.
VEDANTA LIMITED | INTEGRATED REPORT AND ANNUAL ACCOUNTS 2020-21 | 71
EXECUTIVE COMMITTEE CONTINUED...
Varun Kapoor,
Director – Investor Relations, Vedanta Group
Mr. Kapoor was appointed as the Director – Investor Relations for the Group on 2 January 2021. Before he took up this role, he was the Chief (Strategy & Business Excellence) of Cairn Oil & Gas business. He is working towards enhancing the quality, depth and diversity of our shareholder base and investors to ensure optimum valuation for the Company. Mr. Kapoor has 18+ years of rich leadership and employee experience, having joined
Cairn in 2008 and has worked in various domains such as Mergers & Acquisitions, Commercial & New Business, Gas SBU Asset Management, Business Strategy, Corporate Planning and Business Excellence. Prior to joining Cairn, Mr. Kapoor had experience in buy-side and sell-side equity research with top-tier funds and banks like Fidelity, Deutsche Bank, S&P Crisil. He holds a PGDM from IIM Calcutta and a Master’s and Bachelor’s degree in Economics from Delhi University.
Roma Balwani,
Senior Director,
Group Communications and Brand
Ms. Balwani was appointed as the Senior Director of Communications and Brand from December 2020. Prior to this role, she was holding the position as the Director of Communications and Brand since October 2019. Earlier she was Sr. Advisor from April 2019. Her prior stint with Vedanta was as the President- Group Communications, Sustainability and Corporate Social Responsibility from April 2014 till August 2017. Prior to joining our Company, she was the Chief Communications Officer at Mahindra and Mahindra Limited. With over three decades of experience, she has won several Indian and international awards and accolades and she speaks at several summits on Sustainable Development
and Communications in India and the overseas. She has the distinction of being included for three consecutive years in the Holmes Global Report, USA, a recognition in the Global Influence 100 listing of In-house Communicators. She is a Director on the Board of John Cockerill, India (formerly CMI FPE Ltd.), the Indian subsidiary of the Belgian company John Cockerill.
Ms. Balwani also chairs the CSR and NR Committees as a Board member. She graduated in Economics from the Mumbai University and completed her post-graduation (Diploma) in marketing management from Sasmira’s Institute of Management Studies and Research, Mumbai and has completed executive management programme at Harvard Business School, Massachusetts, USA.
Anand Laxshmivarahan R,
Interim Group Chief Digital Officer (CDO), Vedanta Limited
Mr. Anand was appointed as the Interim Group Chief Digital Officer (CDO) for Vedanta Limited in June 2020. His responsibilities entail driving digital-led interventions across the business with a focus on achieving the organisation’s goals on enhanced reserves, improved recovery, enhanced Health, Safety, Security and Environment (HSSE), operational and people excellence. He joined Vedanta in 2018 as the Chief Digital Officer in the Oil & Gas business. Mr. Anand is a Digital Transformation Leader with over 21 years of industry experience working with global multinationals in various key business and technical roles. He has two decades
of exposure to systems and technologies within Oil & Gas and Manufacturing domains. His previous experiences include Oil & Gas consulting working with global majors on digital transformation programmes.
Before joining Vedanta, he was with industrial automation companies focusing primarily on process control and automation systems within manufacturing and Oil & Gas segments. He has worked with companies such as Wipro Technologies, Honeywell, General Electric and Siemens. He has completed his BE in Electronics and Telecommunication from Dr. Babasaheb Ambedkar Marathwada University, Maharashtra and Master’s from Indian Institute of Management Bangalore.
72
| < BACK TO CONTENTS | Integrated Report | Statutory reports | Financial statements |
Dhiraj Nayyar,
Director, Economics and Policy, Vedanta Limited
Mr. Nayyar was appointed as the Director, Economics and Policy in October 2019. Prior to this appointment, he was the Chief Economist of Vedanta Limited since October 2018. Before joining Vedanta, he was Officer on Special Duty and Head, Economics, Finance and Commerce at NITI Aayog, Government of India (GOI) from October 2015 till October 2018. He has 15+ years of experience in the realm of economics. In this role, functionally equivalent to Joint Secretary, GoI, he was responsible for all policy matters related to the Departments of Economic Affairs, Revenue, Financial Services, Investment and Public Asset Management and Commerce. He was Secretary of the
Inter-Ministerial Committee on Sick and Loss-Making Public-Sector Enterprises, Member-Secretary of NITI Aayog’s Committee on Strategic Disinvestment and Member, Spices Board. Prior to joining the government, Mr. Nayyar spent several years in the media in senior positions. He was an India columnist at Bloomberg View, Managing Editor at The Quint, Editor-at-large at firstpost.com, Deputy Editor at India Today and Opinion Editor at Financial Express. He did his Bachelor’s in economics from St. Stephen’s College, Delhi University, MA in Philosophy, Politics and Economics from Merton College, Oxford and M. Phil in Development Economics from Trinity College, Cambridge where he also pursued doctoral research in Economics and taught Development Economics.
Leena Verenkar,
Head -Corporate Social
Responsibility, Vedanta
Ms. Verenkar was appointed the Head of Corporate Social responsibility of Vedanta in October 2019. She also holds the additional responsibility of the Department of Chief of Advocacy & Public relations and Head of Corporate Social Responsibility for Sesa Iron Ore Business since 2015. Prior to this role, she was the Head of CSR of Iron Ore, Goa since 2010. Leena started her career with our Company in 1996, in the field of environment management and compliance and led the environment
team for 12 years. She has 25+ years of experience in environment management, community relations, advocacy and public relations. She holds a Master’s degree in Microbiology from the Goa University and in Ecology and Environment from the Bhopal University, India. She has Fulbright Scholarship by the US Foundation in India and LEAD fellowship by Lead India. She was also recognised as the Women Leader of the Year by Economic Times and 100 Most Impacful CSR Leaders (a global listing) by World CSR in 2017. She has been a recipient of Great Manager’s Award in 2019.
Vikash Jain,
Group General Counsel- Legal
Mr. Jain was appointed as the General Counsel for legal matters across the Group in March 2021. He also continues to hold the responsibility as the General Counsel – Oil & Gas Business, Vedanta Limited. He joined our Company in March 2016 as Vice President and General Counsel – Aluminium Business. He has over 25 years of experience in handling complex litigations, contract negotiations, regulatory issues, compliance assurance, mergers and
acquisitions, foreign collaborations, joint ventures, advocacy, investor relations and Taxation (Direct & Indirect) etc. Prior to joining Vedanta, he has had experience working with organisations like Transocean, Jubilant Group, Hindustan Oil Exploration Company Limited, Endurance Group, and so on. A law graduate, he is also a qualified company secretary and an associate member of the Insurance Institute of India. He is also pursuing his Executive MBA from the Indian School of Business, Hyderabad.
VEDANTA LIMITED | INTEGRATED REPORT AND ANNUAL ACCOUNTS 2020-21 | 73
WELL-POSITIONED TO DELIVER SUSTAINABLE SOLUTIONS
At Vedanta, our sustainability approach is driven by the overarching desire to address the expectations of our stakeholders, while delivering strong business performance. As one of the world’s leading diversified natural resource companies with business operations in multiple geographies spanning continents, we are mindful of our commitments to society, our people and the environment.
KEY STATISTICS:
| 42 million | 60 million mt | 8 fatalities | ||
CSR programme beneficiaries (FY2020: 3.26 million) | Carbon footprint (FY2020: 59 million mt) | in FY2021 (FY2020: 7) |
74
| < BACK TO CONTENTS |
1.89 million GJ
Energy conserved
(FY2020: 1.75 million GJ)
~₹331 crore
Community investment
(FY2020: ₹296 crore)
30.7%
Water recycling rate
(FY2020: 29%)
VEDANTA LIMITED | INTEGRATED REPORT AND ANNUAL ACCOUNTS 2020-21 | 75
SUSTAINABILITY AND ESG
A firm sustainability roadmap
Our vision is to become a developer of choice in the areas of our operations and create long-term value for all our stakeholders. To deliver on this promise, we have developed the Vedanta Sustainability Framework that enables our business units to embed sustainable business principles into their systems and procedures.
VEDANTA SUSTAINABILITY FRAMEWORK
Developed in line with global standards from international bodies such as International Council on Mining and Metals (ICMM), International Finance Corporation (IFC), Organisation for Economic Co-operation and Development (OECD), United Nations Global Compact (UNGC) and SDGs, the Framework comprises several policies, standards and guidance notes which facilitate its execution.
8
Policies
Biodiversity, Energy & Carbon, HIV-AIDS, Human Rights, Social, Supplier & Contractor Sustainability Management, Water
87
Standards & Guidance Notes
Covering all the policy subject areas
In line with ICMM, IFC Performance Standards, Global Reporting Initiative (GRI)
Robust monitoring
Annual audit (VSAP) conducted at all Vedanta locations to check compliance with VSF
Monitored by Group ExCo
Please refer to the Sustainable Development Report 2021 for more information
VEDANTA SUSTAINABILITY ASSURANCE PROCESS (VSAP)
VSAP is our sustainability risk assurance tool, which is used to assess the compliance of all our businesses with the Vedanta Sustainability Framework. This meticulously developed assurance process helps embed sustainable development into every activity that we undertake.
VSAP is an annual process with clear tracking of results by the Sustainability Committee, and the Executive Committee, which in turn reports to the Board.
OUR KEY STAKEHOLDERS
At Vedanta, we engage with several stakeholder groups while operating our business and creating measurable social impact. The list below summarises the key stakeholder groups which have a bearing on our operations.
VEDANTA
Local Community
Employees
Shareholders, Investors, & Lenders
Civil Society
Industry (Suppliers, Customers, Peers, Media)
Governments
76
| < BACK TO CONTENTS | Integrated Report | Statutory reports | Financial statements |
OUR ESG MATERIAL ISSUES
We conducted a detailed materiality analysis in FY2020 to identify the most pertinent ESG issues that define our present and future. They are divided into three intervention categories.
High
| M1 | Energy & Climate Change |
| M2 | Water Management |
| M3 | Solid Waste Management |
| M4 | Air Emissions |
| M5 | Biodiversity |
| M6 | Health & Safety |
| M7 | Community Development |
| M8 | Supply Chain Sustainability |
| M9 | Grivance Management |
| M10 | Compliance to Government Regulations |
| M11 | Upholding Rights of Indigenous People |
| M12 | Ethical Business Practices |
| M13 | Diversity & Equal Opportunity |
Act
Medium
| M14 | Noise & Vibration |
| M15 | Tailings Dam Management |
| M16 | Human Rights |
| M17 | Resource Efficiency |
| M18 | Transparent Disclosure |
| M19 | Materials Management |
| M20 | Learning and Development |
| M21 | Use of Recycled Material |
| M22 | Brand Salience |
| M23 | Innovation |
| M24 | Governance for Sustainability |
Manage
Low
| M25 | Land Acquisition & Rehabilitation |
Observe
Read our detailed stakeholder engagement process and progress across ESG material issues update in our Sustainable Development Report 2021
VEDANTA LIMITED | INTEGRATED REPORT AND ANNUAL ACCOUNTS 2020-21 | 77
ENVIRONMENT
A multi-pronged approach to conserve the environment
Our environmental approach is based on improving our existing processes and systems and proactively adopting more efficient processes for new operations. We have developed specific objectives and targets as a part of our environmental commitment and review our performance annually against these priorities.
78
| < BACK TO CONTENTS | Integrated Report | Statutory reports | Financial statements |
Energy management & climate change
As a large consumer of fossil-fuel based power, we recognise the climate-related risks associated with our business activities. We understand the implications of our energy consumption, both in terms of its cost to the natural environment as well as cost to the operations; and are committed to meet our energy demands, while limiting our carbon emissions. We remain fully supportive of the outcomes of the Paris Agreement and have taken on carbon reduction targets in alignment with the Nationally Determined Contributions (NDC) of the Government of India.
UN SDGs and targets linkage
| Goal: SDG 12 – | Goal: SDG 13 – | |
| Responsible production | Climate action | |
| and consumption | Target: 13.2 - Integrate | |
| Target: 12.2 – Achieve | climate change measures | |
| sustainable management | into strategies, polices, | |
| and efficient use of natural | and planning | |
| resources |
Targets & strategies
We had aligned ourselves with the Nationally Determined Contributions (NDC) of the Government of India and had committed to reduce our GHG emissions intensity by 20% by 2025 from a 2012 baseline.
Till FY2021, we have achieved ~13.6 million tonnes of avoided GHG emissions since 2012. Our long-term target is to substantially de-carbonise by 2050 and we are currently on the path to develop a plan.
Performance

VEDANTA LIMITED | INTEGRATED REPORT AND ANNUAL ACCOUNTS 2020-21 | 79
| < BACK TO CONTENTS | Integrated Report | Statutory reports | Financial statements |
ENVIRONMENT CONTINUED...
Waste and tailings management
Waste management in a safe and responsible manner is a crucial priority for our businesses. The hazardous wastes comprise used/spent oil, waste refractories, spent pot lining and residual sludge from smelters. On the other hand, high-volume and low-toxicity wastes constitute the non-hazardous wastes. These are fly ash (from captive and merchant power plants), red mud (aluminium refinery waste), jarofix (from zinc smelting), slag, lime grit (process residues from smelters and aluminium refineries) and phosphogypsum (phosphoric acid plant).
In FY2021, we recycled 94% of the high-volume-low-effect wastes such as fly ash, slag, and jarosite. For the 2nd year in a row, we could reutilise more than 100% of the fly ash generated in the year, by recycling legacy waste.
Tailings dam management
Integral to mining operations, tailings dams (if breached) can cause significant damage to the environment and to the neighbouring communities. The Company oversees 18 active and five inactive, and one closed tailings management facilities (TMFs). Our principal concern is to ensure the safety of the people who live downstream from our dams. All but one1 tailings facilities have undergone an independent audit and assessment in the last 12 months by Golder Associates.
We have also introduced a tailings dam management standard to ensure that our Group companies adhere to standard practices while managing their dam structures.
UN SDGs and target linkage
Goal: SDG 12 – Responsible production and consumption
Target 12.5 - Substantially reduce waste generation through prevention, reduction, recycling and reuse
| 1 | Our facility at Skorpion Zinc underwent an audit in 2016. |
80
| < BACK TO CONTENTS | Integrated Report | Statutory reports | Financial statements |
Water management
While access to a steady water supply is critical for mining and smelting operations, host communities and the natural ecosystem and biodiversity of the area also rely on water. Hence, the responsible use of this shared resource is a critical imperative for us and for all our stakeholders.
Our Group water policy administered through our water management standard is in place and our approach is to keep it as a core factor while making decisions, either for a new project or an existing one. Water-screening assessment to identify sensitive water resources, aquatic habitats and any known or suspected water resource constraints in proximity to each operation, is a must and has been conducted by all our businesses. We have steadily increased our water recycling rate in the last three years.
UN SDGs and target linkage
Goal: SDG 6 - Clean water and sanitation for all
Target: 6.4 - Increase water use efficiency and ensure sustainable withdrawals | Goal: SDG 15 - Life on land
Target: 15.9 - Introduce biodiversity management and planning into development processes |
| Performance |
Total water consumption Water recycled/reused (% Water recycled)
VEDANTA LIMITED | INTEGRATED REPORT AND ANNUAL ACCOUNTS 2020-21 | 81
Air emissions
The impact of emissions on employees, communities and the natural surroundings are closely observed, evaluated and documented for corrective actions and future reference. We use best-in-class technologies to reduce to the minimum any particulate release.
The release of Suspended Particulate Matter (SPM), SOx and NOx are monitored as a part of our consistent efforts to keep the ambient air quality safe. Lead emissions in our zinc operations, fluoride emissions in our copper and aluminium operations, and Polycyclic Aromatic Hydrocarbons (PAHs) in our aluminium operations are also checked regularly to adhere to our Environmental Management Standard.
| Performance |
82
| < BACK TO CONTENTS | Integrated Report | Statutory reports | Financial statements |
CASE STUDY
Responsible tailings utilisation: all round benefits
One of the key aspects of mine sustainability is its post-mining restoration. Typically, to maintain structural stability of the mines, miners undertake the process of backfilling material into underground voids created by their activity. Backfilling is usually conducted using cementitious material such as concrete. However, this can prove to be a costly affair, with larger negative environmental footprint.
At Hindustan Zinc, Vedanta’s zinc division, we took up an innovative and contemporary approach to backfilling. In exploring economically viable mixtures to execute backfilling, we found an opportunity to use mine tailings (leftover material after ore separation). This played out to be beneficial in more ways than one, where we could utilise waste material to fill the void, offsetting the need for new disposal land for tailings. It resulted in economic benefits, reduction of cycle time, generating employment and above all, environmental utility as industrial waste could find alternative and sustainable use.
Infrastructure, technology and process
We executed this by following the paste back fill system, setting up two paste fill plants each in Sindesar Khurd (SK) and Rampura Agucha (RA) mines and one in the Zawar mine. In fact, HZL is credited with the installation of the first paste fill plant in India. These plants help in thickening the mill tailings, mixing with
the binder to prepare the paste for the underground distribution system. This process avoids any air emissions, and we use recycled water for the activity. The plants in SK have a combined capacity of 6 mtpa, RA at 5 mtpa and Zawar at 1 mtpa.
Employing the latest technology with emergency preparedness plans and digitisation, this initiative dovetails into Vedanta’s policy of ‘Zero Harm, Zero Waste, Zero Discharge’.
Key outcomes
Since deployment, we have achieved up to 39% of tailings utilisation, continual reduction of cement utilisation in the mix and 14% and 37% reduction in specific water consumption in the RA and SK mines, respectively. The capital cost of the plant deployment has been paid back within three months across locations and has resulted in continuous profit contribution.
Way forward
Going forward, we intend to utilise 55% of tailings and maximise fly ash utilisation within the next one year. Focus will be on increased backfilling and safety.
Since 2018, we utilised 7.4 million tonnes of tailings in backfilling to avoid land disposal
VEDANTA LIMITED | INTEGRATED REPORT AND ANNUAL ACCOUNTS 2020-21 | 83
Waste to Wealth, the Vedanta-Runaya Partnership
The world produces ~65 million tonnes of aluminium annually, but nearly 1 million tonne of the material is lost in the form of a by-product, aluminium dross. In India alone, about 60,000 tonnes of dross are produced every year. A classified hazardous waste, unscientific disposal of dross can have detrimental impacts on people and the environment. Currently, aluminium manufacturers send the waste to authorised recyclers who process the waste as per the CPCB guidelines, most of which end up in landfills.
A key aspect of dross is that it contains valuable material and compounds such as aluminium,
aluminium nitrides and oxides, spinel, dimagnesium silicate, gupeiite, and sodium titanate. However, traditional recyclers were only able to recover limited amount of material from cold dross, with about 10% recovery rate being the industry benchmark.
At Vedanta’s facility in Jharsuguda, where India’s largest aluminium smelter is housed, we have turned this around in partnership with Runaya, who are licensed to use Taha’s patented dross technology. This ensures a significantly higher recovery rate, while also creating energy savings to the tune of 800,000 GJ and reducing CO2 emissions in excess of 260,000 tonnes, annually.
84
| < BACK TO CONTENTS | Integrated Report | Statutory reports | Financial statements |
Runaya process
35% | 5% | 60% | 100% | |||||||||
STAGE 1 | + | STAGE 2 | + | STAGE 3 | = | OUTPUT |
| Hot dross | Cold dross | Steel slag | Briquettes used in | |||
| processing | processing | conditioner production | steel industry |
Depleted dross is used to manufacture briquettes that are used in secondary refining of steel, with significant reduction in power consumption and increased refractory life, thus improving sustainability. This circular, end-to-end approach to manufacturing and waste management aligns with our philosophy of ‘zero waste, zero discharge’, preventing landfills and ensuring better utilisation of waste material. Vedanta Jharsuguda is now a zero hazardous waste smelter, and with BALCO also announcing a partnership with Runaya, Vedanta is well on track to becoming the first zero hazardous waste company by FY2022.
C.N. Singh, CEO,
Vedanta Ltd., Jharsuguda
Circularity in business is the need of the hour, and I’m proud of the ‘zero waste, zero discharge smelter’ feat our Jharsuguda team has achieved with Runaya’s support. Furthermore, Runaya has broken the mould in manufacturing with a highly diverse workforce, with nearly 50% women running the facility.
Abhijit Pati, CEO & Director,
BALCO
Vedanta’s ethos of ‘Zero Harm, Zero Waste and Zero Discharge’ continues to guide our environmental and social performance. We at BALCO are aligning our energies to stand tall towards ecosystem restoration and nurturing environment conservation efforts across all our areas of operations.
Annanya Agarwal,
CEO & Co-Founder, Runaya
Runaya is firmly committed to disrupting the linear economy model currently existing in the industry and ushering in a circular economy model by deploying cutting edge technology and innovation in the resources sector with focus on sustainability solutions. We are extremely proud to partner Vedanta Jharsuguda, India’s largest aluminium smelter, on their journey towards becoming a zero hazardous waste smelter.
VEDANTA LIMITED | INTEGRATED REPORT AND ANNUAL ACCOUNTS 2018-19 85
SOCIAL
Together we help uplift communities
We are the primary economic driver for the communities, where we operate. We shoulder this responsibility seriously and endeavour to fulfil our role in a manner that upholds the dignity of all our stakeholders and allows us to live up to our deeply cherished values.
86
| < BACK TO CONTENTS | Integrated Report | Statutory reports | Financial statements |
The Vedanta Sustainability Framework and its associated standards and policies guide our work on social performance. In areas with indigenous populations, we are committed to following the principles of Free, Prior, Informed Consent (FPIC). With its genesis in the UN Declaration of Rights of Indigenous Peoples, it has been adopted as a best practice by the IFC and ICMM.
Our CSR Council, led by a senior business leader, and including CSR Heads and CSR Executives from all business units, meets every month and reviews the performance, spends and outcome of CSR programmes across units. Governed by our in-house CSR Policy and Sustainability Framework, the Council is responsible for governance, synergy and cross-learning across the Group’s CSR efforts.
The Board CSR Committee comprising senior Independent Directors, apart from providing strategic direction for CSR activities, also approves its plans and budgets, and reviews the progress of the initiatives.
SOCIAL PERFORMANCE & SOCIAL LICENCE TO OPERATE
Securing and retaining one’s social licence to operate is an outcome resulting from a company’s ability to garner the trust of the communities where it operates. Social performance frameworks are a good mechanism to measure, manage, and monitor this aspect of the business.
With a view to evaluate Vedanta’s social performance and impact, our senior leadership commissioned a study conducted by independent, globally renowned experts. This study spanned four sites, post which the reports were submitted to the Vedanta ExCo for its consideration. The reports made a clear case for a reboot of our social performance practices.
Based on the findings of the report, a Group-wide self-assessment drive with all units was conducted in FY2021. These led to the formation of Social Performance Steering Committees, with cross functional participation. The primary intent was to explain to our internal stakeholders that social performance and licence to operate go beyond the ambit of an organisation’s CSR activities and are closely related to its operations, HR practices and other activities.
This awareness initiative resulted in the formation of Social Performance Management Committees (SPMC) at each unit, development of standard and guidance note and its implementation through VSAP.
Through proactive and targeted initiatives, we are progressing towards our objective of becoming a developer of choice in our areas of operation.
Following the success of the initiative, we are engaging the third-party consultants again to reinstate the project through the means of pilot to be conducted at two BUs - Lanjigarh and HZL. With the initial formalities complete along with senior management approvals, FY2022 will see these two BUs undertake pilot projects including social risk assessment and grievance mechanism tracking, among others.
Through such proactive and targeted initiatives, we are progressing towards our objective of becoming a developer of choice in our areas of operation.
VEDANTA LIMITED | INTEGRATED REPORT AND ANNUAL ACCOUNTS 2020-21 | 87
SOCIAL CONTINUED...
COMMUNITY EMPOWERMENT INITIATIVES
Community provides us the critical support to grow sustainably with all stakeholders. We have evolved one of the most elaborate community empowerment initiatives in our industry, and we regularly garner inputs and insights from stakeholders to improve our programmes.
In FY2021, ~₹331.12 crore was spent to help communities elevate their quality of life through various interventions. An overview of these programmes is provided below.
| Children’s well-being and education | ||||
| Key features | ||||
90+ Initiatives across our Group companies
~39 million Children benefit from these programmes | Types of interventions:
Anganwadis and child-care centres; public school infrastructure support (including sanitation); scholarships and teacher training; digital classrooms and computer aided learning centres; libraries; Vedanta- run schools; exam preparation counselling; career counselling science fairs | |||
| Healthcare | ||||
60+ Initiatives across our Group companies
~2.4 million People benefit from these programmes | Types of interventions:
Support to primary health centres; HIV/AIDS awareness programmes; health camps; mobile health vans; specialist doctor support; nutrition programmes; Vedanta-run hospitals; health awareness drives | |||
| Women’s empowerment | ||||
15+ Initiatives across our Group companies
3,300+ SHGs formed
300+ Micro-enterprises formed
32,000+ Women benefit from these programmes | Types of interventions:
Self Help Groups; Women’s co-operatives; Micro-enterprises | |||
| Drinking water & sanitation | ||||
35+ Initiatives across our Group companies
250,000+ People benefit from these programmes | Types of interventions:
Provision of drinking water; construction of toilets; RO plant set up; digging of borewells; handpump repair/installation; sanitation drives | |||
88
| < BACK TO CONTENTS | Integrated Report | Statutory reports | Financial statements |
| Upskilling youth | Key features 20 Initiatives across our Group companies
2,000+ Youth trained |
Types of interventions:
Sewing centres; vocational training centres; technical & computer literacy programmes; traditional crafts and painting training | ||
| Community infrastructure | ||||
40+ Initiatives across our Group companies
360,000+ People and
3,000+ Families benefit from these programmes | Types of interventions:
Tube-wells/open-wells/borewells; check-dams; roads; parks; public education infrastructure; community centres; health centres; village walls and gates; renovation of sports complexes; temples, irrigation channels; drains; bus stands; street lights; ponds; public CCTV installations | |||
| Agriculture & animal husbandry | ||||
50+ Initiatives across our Group companies
62,000+ Farmers benefited | Types of interventions:
Climate change adaptation; Wadi-based agriculture; water-shed rejuvenation; agriculture-based natural resource management; dairy and livestock development; farmer training; SHGs; co-operatives; veterinary care; irrigation channel maintenance | |||
| Sports & culture | ||||
30+ Initiatives across our Group companies
43,000+ Sportspersons and culture enthusiasts benefited | Types of interventions:
Rural sports; sponsorship for: para-athletes; marathons; sports tournaments; music festivals; football and archery training academies | |||
| Environmental restoration & protection | ||||
96,000+ Saplings planted and are under maintenance | Types of interventions:
Sapling plantation and greenbelt management; water conservation structures; pond desilting | |||
VEDANTA LIMITED | INTEGRATED REPORT AND ANNUAL ACCOUNTS 2020-21 | 89
SOCIAL CONTINUED...
COMMUNITY OUTREACH DURING COVID-19
In addition to the execution of our long-term social development agenda, we were also among the foremost Indian companies which stood in solidarity with the larger community during these challenging times. We have pledged ₹150 crore to help the country in its fight against the second wave of COVID-19 and we are undertaking several initiatives, as summarised below.
Health and medical support
Set up 10 field hospitals with 1,000 critical care beds for COVID patients, across Rajasthan, Delhi/NCR, Chattisgarh, Odisha, Karnataka, Jharkhand and Tamil Nadu
Vedanta’s business units have been supporting 1,000 beds for COVID-19 patients across business locations
Cairn Oil & Gas has set up a 100-bed COVID Care Centre in Barmer along with the district administration
Vedanta Aluminium, Jharsuguda & BALCO, Korba have set up COVID Care Centres with a capacity of 100 beds each
Vedanta Sesa Goa has added 100 critical care beds with oxygen and ventilator support at Goa Medical College
Oxygen supply
HZL is supplying 8 tonnes of oxygen to local hospitals, while Sesa Goa is providing 3 tonnes of Liquid Medical Oxygen on a daily basis. ESL has also committed to supplying up to 10 tonnes of oxygen daily
HZL runs an oxygen bottling plant with capacity of up to 500 cylinders per day, and is setting up a 1,200 cylinders per day bottling plant
In order to facilitate on-time oxygen transportation to hospitals in Rajasthan, Cairn Oil & Gas has provided 11 tankers
Sterlite Copper is initiating the operation of its oxygen plant at Tuticorin, with a capacity to produce 1,000 tonnes of oxygen per day
UN SDGs and target linkage
Goal: SDG 2 - Zero Hunger
Target: 2.1 - End hunger and ensure access to safe, nutritious, and sufficient food, all year round
Target: 2.2 - End all forms of malnutrition
Goal: SDG 4 - Ensure inclusive and equitable quality education and promote lifelong learning opportunities for all
Target: 4.4 - Increase the number of youth and adults who have relevant skills, including technical and vocational skills, for employment, decent jobs and entrepreneurship
Goal: SDG 6 - Clean water & sanitation
Target: 6.6 - Protect and restore water-related eco- systems
Goal: SDG 8 - Economic Growth & Decent work for all
Target: 8.6 - Reduce youth unemployment, illiteracy, unproductivity
90
| < BACK TO CONTENTS | Integrated Report | Statutory reports | Financial statements |
CASE STUDY
Making inclusive progress an everyday reality
Caste-based discrimination across many parts of India continues to be a deep-rooted social taboo. Take the example of 50-year-old Dinesh Kumar, a resident of Dangiyo ki Dhani, Dewra, Chitalwana, Jalore district. A father of three children, Dinesh has always believed in casteism, until he became a part of Cairn’s Dairy Development & Animal Husbandry initiative.
The DD&AH initiative provides the community with a platform to enhance their income through improved ways of livestock management. The programme includes doorstep delivery of medical care for livestock, regular awareness and capacity-building sessions on cattle upkeep, skill development on allied activities, linkage with
government initiatives and so on. Dinesh was desperate to increase his family income, but he could never convince himself to be a part of the project, because the village dairy committee’s secretary belonged to a scheduled caste.
Cairn, in partnership with SURE Sansthan (non-profit partner of the programme), helped him change his views on casteism. Today, Dinesh is an active member of the committee, and has expanded his business by being a regular supplier of cattle milk to the dairy. Besides, his knowledge on green fodder production, animal
husbandry, and other livelihood allied activities now helps his family earn a decent income. His wife too is a part of the women’s group, doing tailoring activities for additional income.
Dinesh has a progressive worldview today, and his children are receiving decent education. He has many plans for the future, and he knows for sure that Cairn will always support his ambition in letter and spirit.
CASE STUDY
Bringing smile to the last mile
We, at Cairn, think that small outreach initiatives for the community goes a long way towards empowerment at the grassroots. This conviction has inspired us to set up community helpdesks across six villages of our operations across Gujarat. Our role is to conduct a detailed mapping of villages to identify areas where intervention is required and act as a bridge to connect the last-mile citizens like Sadhu Manhulabe Farshurambhai with government schemes and support measures.
Farshurambhai, 65, of Hansalpur village, was finding it difficult to make ends meet after her husband, who was the only breadwinner of the family, died. Her failing health made matters worse for her. The Cairn HelpDesk team provided her with information regarding the benefits of multiple government schemes and how to take advantage of those. Today Manhulaben is a beneficiary of ‘Vidhva Sahay Yojana’ which provides direct cash transfers to the underprivileged.
The financial assistance from the government, she says, is a security blanket to fall back on in times of stress. We have so far helped 1,500+ community members across our intervention areas, and this is just the beginning.
VEDANTA LIMITED | INTEGRATED REPORT AND ANNUAL ACCOUNTS 2020-21 | 91
SAFETY
Ensuring the safety of our workforce
During FY2021, we lost eight colleagues to work-related accidents. It is a stark reminder for us to strengthen and improve our safety management systems, as one life lost is one too many.
This was a matter of grave concern because within the same period, we had invested heavily in several systems and standards, which were introduced to ensure a safe, injury-free workplace. To understand the rationale behind this anomaly, the Group ExCo along with our Group HSE teams went on to analyse the situation and developed a way forward.
As a part of our continuing safety initiatives, the following three areas deserve mention:
Proactive leadership
Continuous interaction between leaders and support personnel on safety issues, leading to hands-on safety interventions.
Delegation of safety-critical tasks
Safety-critical responsibilities are identified and delegated with proper monitoring mechanism in place.
Safety engagement with partners
Long-standing business partners are properly informed about safety initiatives undertaken by Vedanta, and project-specific business partners are managed through efficient supervisors.
92
| < BACK TO CONTENTS | Integrated Report | Statutory reports | Financial statements |
UN SDGs and target linkage
Goal: SDG 8 - Economic growth & decent work for all
Target: 8.8 - Protect labor rights and provide safe work conditions for all
VEDANTA LIMITED | INTEGRATED REPORT AND ANNUAL ACCOUNTS 2020-21 | 93
| < BACK TO CONTENTS | Integrated Report | Statutory reports | Financial statements |
PEOPLE AND CULTURE
An enriching culture of caring and sharing
Giving back to the community, society and country in various ways is part of Vedanta’s larger purpose. We are committed to working for the greater good, towards national prosperity and for sustainable growth. During the pandemic Vedanta was among the few companies who rose to the occasion and supported the nation through various initiatives such as distributing food packets for daily wage earners, manufacturing of masks and PPEs, food for animals, and so on.
Ensuring health, safety, environment and sustainability continue to be our core focus area. To combat the pandemic-induced health and security concerns of our people, we created a central COVID taskforce with a mix of passionate young leaders and experienced senior leaders. The taskforce is focused on implementing strong control measures across the Group, which includes the launching of Apollo 24*7 healthcare helpline, digital portal for tracking the cases across the Group, wellness webinars and regular communication on precautions and preventive measures with all our people through the Vedanta Cares initiative.
We also introduced the Vedanta Term Life Insurance Policy (providing financial protection equivalent to five times of annual salary) with world-wide coverage of all our executives across the Group. Amid the pandemic, this was the most important initiative launched for our employees. This benefit is over and above the Mediclaim and Group Personal Accident Insurance Policies currently being provided by the Company to support the employees in emergencies.
Our employees also receive consistent recognition from our Management and Board for their extra mile efforts. These include the Chairman Individual Awards, Chairman Awards for COVID-19 efforts, Chairman Award for Business Partner and Best Performing ManCom and Chairman Discretionary Award.
STREAMLINED MANAGEMENT
Management Committee:
Vedanta introduced the concept of Management Committee (ManCom) for the organisation’s apex leadership. Our businesses are now being run by a Group of 6-8 people of the Management Committee comprising the CEO, CFO, CHRO, CCO, CMO and other key leaders. Our ManComs work as a cohesive team and are the top decision-making body for the respective businesses, functions, and the Group, while ExCos (Executive Committee) serve as a review body. Currently, we have one Group ManCom which is the central decision-making body with eight members and ten Business ManComs. The SBUs are still managed by their respective ExCos. The same concept has been extended to functions as well with
13 Functional ManComs in place and each function is divided into verticals with a vertical head identified to ensure accountability and delivery.
Integrated Commercial and Marketing Organisation:
At Vedanta, we continuously assess our organisational structure to ensure right Management in Place (MIP). We redesigned the way we look at our commercial and marketing functions and created an Integrated Commercial and Marketing Organisation under the leadership of the Group Chief Commercial Officer and anchored by the Managing Director Commercial & CEO Aluminium & Power.
We embarked on a series of Commercial & Marketing Workshops to identify 100+ leaders in the largest ever talent identification exercise through a series of structured Vice Chairman’s Internal Growth Workshops. The new team will work with a clear objective of enhanced margin protection, build category expertise, benchmarking and data-driven decision-making, backed by technology and digitisation. The focus will be on buying and selling within the Indian subcontinent to foster national growth.
94
| < BACK TO CONTENTS | Integrated Report | Statutory reports | Financial statements |
Project organisation design:
We have a large number of high-impact brownfield projects that are being implemented across the Group to significantly drive volume, unlock value and accelerate growth. This is also part of our endeavour to help our nation revive the economy and infrastructure development, capex spending and foreign direct investment (FDI). To drive this
transformational agenda, we have embarked on a series of Project Leadership Workshops to identify the next set of project leaders. These workshops have helped us identify 16 heads of various key projects across the Group, who have taken up enhanced roles to drive our growth vision.
DIVERSITY AND INCLUSION GO HAND IN HAND
Diversity is a business imperative, as much as it is about fairness and the right thing to do. The Group benefits significantly from the skills, experience, and perspectives of the wide range of people who work with us. Our objective is to achieve gender parity across all levels, starting from our Board to ManComs / ExCos and all decision-making bodies. We constantly review our organisation design and talent mix to ensure a healthy representation of women at all levels in the organisation.
CASE STUDY
Empowering women for an empowered tomorrow
At Vedanta, we have put in place a comprehensive, time-bound process to develop a robust Operations, suchasHSE, AO pipeline of women leaders across programme (V-lead) underlines the Group’s strong commitment to diversity and inclusion.
As part of the initiative, a Group of promising young women will be identified, nurtured, and promoted to adopt greater responsibilities in CXO positions
in future, spanning operational and enabling roles at Vedanta’s business units in India and the overseas. The entire programme is likely to be completed between six and 18 months, as the broader objective is to elevate and retain talent.
Our journey commenced with 55 women leaders, out of 1,000 women employees in various business units and functions across 10 businesses and operations. This includes an interesting mix of women leaders from enabling functions such as Commercial, Marketing, Finance, HR, IT, PR/CSR, Legal & Strategy and Operations, such as HSE, AO, Security, and Core Operations. The eligibility criteria comprised the following:
| a) | Performance and potential |
| b) | Educational background |
| c) | Projects handled |
| d) | Passion for technology |
Following their selection, the Vice Chairman had a detailed interaction with these aspiring leaders. These women are being trained to take on higher CXO roles as part of Top 200 leaders in the Group. The idea is to ensure that they represent a part of the decision-making bodies of the Vedanta Group, namely ManCom and ExCo.
A minimum of five women will be given higher roles and responsibilities on a quarterly basis.
This will ensure higher visibility, exposure and fast-track career progression through their enhanced and elevated roles. Anchoring the programme are senior leaders of the Group and each anchor has been assigned five to six women leaders as mentees.
We will continue to implement more such programmes to encourage women to demonstrate their grit and talent and take on larger responsibilities.
VEDANTA LIMITED | INTEGRATED REPORT AND ANNUAL ACCOUNTS 2020-21 | 95
PEOPLE AND CULTURE CONTINUED...
TRANSFORMATIONAL INITIATIVES
Vice-Chairman’s SBU engagement workshops:
The key idea behind this transformational initiative was to connect with SBU Heads / ExCos to engage, energise and generate ideas / suggestions around key themes such as Management in Place and Business Vision, Volume & Cost, HSE, CSR and Community Relations, People Development, Technology & Digitalisation, Innovation & Benchmarking, Quality, Security & Housekeeping etc. Through this structured initiative, we have covered 16 SBUs and have engaged with 1,200+ executives. The businesses have acknowledged that the Vice Chairman’s Engagement Workshop helped them in: a) moving in the right direction; (b) each SBU has already started working on the key action points which emerged from the engagement; (c) since the workshops happened during the current COVID times, it helped build
employees morale and performance focus; (d) engagement with business partners helped in quality assessment.
Leadership succession planning:
We concluded the largest ever exercise of Leadership Succession Planning. The initiative aims to create a three-level succession slate for the COOs for key businesses in the Group. The objective was to identify 10 COOs and 30 three level successors for each COO through internal job posting (IJP) and handpicking high-quality leaders. This is a continuous process, as we continue to identify successors for other CXO positions such as deputy for CHRO and CFO positions for each business.
360-degree feedback mechanism:
This initiative was launched to get a comprehensive assessment of the organisation’s key leaders. It will help the leaders in identifying strengths and improvement areas for effective leadership and address the improvement areas
through a comprehensive developmental plan. The key leaders from Group ManCom to ManCom and ExCo members of each business will undergo the same leadership development journey.
ONBOARDING TALENT
As part of our overarching initiative to onboard talent through campus hiring from esteemed institutions, we inducted 1,000+ young professionals in India with focus on diversity. We have put special focus to induct talent from the North-East, J&K region and minority communities. As a proactive measure, we have introduced premium salary for rank holders in few categories, and they will be offered front-line decision-making roles. We are also inducting specialised talent from new-age programmes such as digital, data science & analytics, quality, R&D, sustainability, forensics, and so on.
96
| < BACK TO CONTENTS | Integrated Report | Statutory reports | Financial statements |
We are promoting campus hiring with focus on gender diversity, upliftment of minority communities and adequate representation of all regions and demographics in India.
Vedanta Leadership Development Programme:
Continuing our practice of hiring young talent and developing them to take up higher roles and responsibilities in the organisation, we started the Vedanta Leadership Development Programme (VLDP) for hiring from top IITs and IIMs. Over the preceding four years, we have hired 100+ management trainees from top three IIMs and XLRI and graduate engineer trainees from top six IITs.
Our high-potential talent is provided with high-impact frontline roles. At the end of these workshops, we rotated them into elevated cross-functional roles to provide them with maximum exposure and train them to take up CXO roles at our businesses within the next six-eight years.
LEADERSHIP DEVELOPMENT
As part of Vedanta’s DNA, we focus on continuous identification and talent development. Over 1,000 leaders were identified through workshops, V-Reach, IJP and Act-Up programmes.
FACOR Leadership ACT UP:
FACOR (Ferro Alloys Corporation Limited) which was recently acquired, comprises of chrome mines along with a fully integrated processing and captive power plant. FACOR is one of the largest producers of ferro alloys, an essential ingredient to produce stainless steel and specialty steel. FACOR has tremendous potential to generate significant value in the
growing market. A 2-day ACT UP (Accelerated Competency Tracking and Up-gradation Programme) Workshop was organised with the objective to identify and elevate the internal talent at FACOR to leadership role in order to strengthen FACOR leadership backbone and impart Vedanta’s culture and values for alignment. A structured process was designed to shortlist participants from a pool of 600+ employees for the 2-day Workshop which comprised Group activities, presentations, and case studies. 50+ new leaders were identified and elevated to significantly higher roles across the three verticals of Captive Power Plant (CPP), FACOR Power Limited (FPL) and Mines. Cross functional teams were formed to foster learning across verticals and solve complex problems. A new CSR vertical was established to stand firm on our values of giving back to the society.
V-Reach: Graduate Development Programme:
We have a strong and unwavering focus on identifying and developing talent from within. We have a 5,000+ strong talent pool who joined us as graduates, who represent the backbone of our businesses. V-Reach was launched in three phases to identify top 500 talent from the graduate talent pool and provide them elevated roles and opportunities for fast-track career growth within the Group. This identified talent will progressively take up enhanced roles for adding fresh perspective and value to various businesses. We are also developing a digital solution to continuously track the progress of this talent through technology implementation as we continue to identify additional set of talent under this category.
Digital Organisation:
Vedanta has embarked on an aspirational digital transformation journey and our vision is to become a technology-driven company.
With this vision, Digital Act-up was conducted to identify young high potential leaders across various units and functions through the structured ACT UP Workshop model and give them significantly elevated roles and responsibilities and thereby induct the required skillset to provide a digital steer to our organisation.
V-Tech 1.0:
To identify talented engineers and elevate them to significantly higher roles, V Tech 1.0 was launched. Over 550 employees spanning the Group with focus on ensuring diversity will undergo online psychometric assessment to result in shortlisting of top 300 basis the assessment and 360 DF. These leaders will drive high-impact projects and innovations, take up leadership roles across the organisation, leverage their potential and become brand ambassadors of Vedanta.
Young Leaders’ Taskforce:
At Vedanta, young leaders are given a wide plethora of growth opportunities. We have created a team of livewire professionals hailing from diverse backgrounds with focus on innovation. Their innovative ideas help us steadily grow volumes, optimise costs and identify other key drivers to make the organisation more agile to protect our margins, despite market variations.
UN SDGs and target linkage
Goal: SDG 5 - Achieve gender equality and empower all women and girls
Target: 5.5 - Ensure full and equal participation of women in all decision-making in the political, economic, and public life.
Target 5.9 - Adopt and enforce policies and legislation on gender equality
VEDANTA LIMITED | INTEGRATED REPORT AND ANNUAL ACCOUNTS 2020-21 | 97
GOVERNANCE
Good governance creates value for everyone
Good corporate governance protects shareholder value while overseeing sustainable progress for everyone. At Vedanta, we undertake our business with a strict adherence to ethical management and responsible operations, and constantly strive to go beyond compliance to create positive impact.
Our governance philosophy stems from our values of Trust, Entrepreneurship, Innovation, Excellence, Integrity, Respect and Care.
COMPOSITION OF THE BOARD
At Vedanta, we have an illustrious Board, comprising members from various professional backgrounds. With 50% Independent Directors and 25% women Directors, our Board composition is consciously prudent and enables the protection of all stakeholder interests.
As on 6 May 2021, the Board comprises of eight members as listed below.
| Name | Designation | Gender | Age (as on | |||
Mr. Anil Agarwal | Non-Executive Chairman | Male | 68 | |||
Mr. Navin Agarwal | Executive Vice Chairman | Male | 60 | |||
Ms. Padmini Somani(1) | Non-Executive Independent Director | Female | 45 | |||
Mr. Dindayal Jalan(2) | Non-Executive Independent Director | Male | 64 | |||
Mr. Upendra Kumar Sinha | Non-Executive Independent Director | Male | 69 | |||
Mr. Mahendra Kumar Sharma | Non-Executive Independent Director | Male | 73 | |||
Mr. Sunil Duggal(3) | Whole-Time Director & Chief Executive Officer | Male | 58 | |||
Ms. Priya Agarwal | Non-Executive Director | Female | 31 |
| (1) | Ms. Padmini Somani has been appointed as an Additional Director designated as the Non-Executive Independent Director of the Company effective from 5 February 2021. |
| (2) | Mr. Dindayal Jalan has been appointed as an Additional Director designated as the Non-Executive Independent Director of the Company effective from 1 April 2021. |
| (3) | Mr. Sunil Duggal has been appointed as an Additional Director designated as the Whole-Time Director & Chief Executive Officer of the Company effective from 25 April 2021. |
| (4) | Mr. K Venkataramanan ceased to be the Non-Executive Independent Director of the Company effective from close of business hours on 31 March 2021 pursuant to completion of term. |
| (5) | Mr. G.R. Arun resigned from the position of Whole-Time Director & Chief Financial Officer of the Company and was relieved effective from close of business hours on 24 April, 2021. |
| Number of Directors | ||||||||||
| 50% | 0 | 2 | 6 | 6 | 2 | |||||
| Independent | Less than | Between | Above | Male | Female | |||||
| Directors on Board | 30 years | 30-50 years | 50 years |
98
| < BACK TO CONTENTS | Integrated Report | Statutory reports | Financial statements |
Our Board provides strategic perspective and steers the business in line with the commitments made to various stakeholders and sustainable growth. The Board is supported by
| Established | Sustainable | Vedanta Sustainability | Code of Business | |||
| committees | development team | Framework and VSAP | Conduct and Ethics | |||
| and varied other | ||||||
| policies & practices | ||||||
| adopted by the Group |
EXECUTIVE COMMITTEE
Mr. Sunil Duggal
Chaired by Chief Executive Officer
The Committee meets monthly and is responsible for implementing strategic plans formulated by the Board, allocating resources in line with delegated authorities and monitoring the operational and financial performance of the Group.
GROUP MANAGEMENT COMMITTEE
Effective 1 April 2020, a Group Management Committee has been formed comprising Chief Financial Officer, Chief Executive Officer, Chief Human Resource Officer Head and Chief Commercial Officer. The Committee is collectively responsible for all key decisions, taken under the guidance of the Chairman and Board. This Committee drives all important initiatives and is empowered by the Board.
By overseeing the conduct of business with strict adherence to ethics and responsibility, the structure enhances the prosperity and long-term viability of the Company.
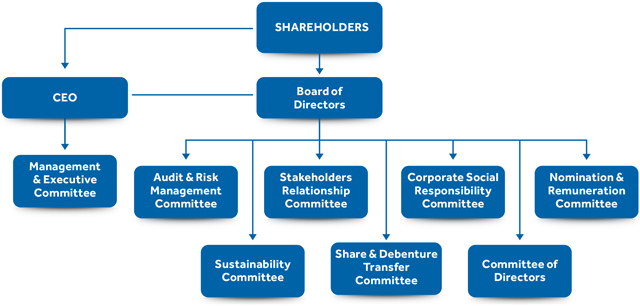
Notes-
| * | The Finance Standing Committee of Directors has been consolidated with the Committee of Directors effective from 16 May 2020. |
| ** | The Risk Management Committee has been consolidated with the Audit Committee and renamed as the Audit & Risk Management Committee effective from 6 June 2020. |
VEDANTA LIMITED | INTEGRATED REPORT AND ANNUAL ACCOUNTS 2020-21 | 99
BUSINESS RESPONSIBILITY REPORT MAPPING
Mapping of Integrated Report for FY2021 (IR) with Securities and Exchange Board of India Business Responsibility Report (SEBI BRR) framework.
| BRR Section | BRR Framework | Section/Page Number in Integrated Report | ||
| Section A: General Disclosures | ||||
| Our Approach to Reporting | Page 2 | |||
| General Information about the company | A1, A2, A3, A4, A5, | The information can be assessed in the | ||
| A7, A8, A9, A10 | Annual Return, uploaded in the website of the company | |||
| https://www.vedantalimited.com/ Pages/AnnualReports.aspx | ||||
| Financial Year Reported | A6 | 2020-21 | ||
| Section B: Financial Details of the Company | ||||
| Paid up Capital (INR) | B1 | Page 182 | ||
| Total Turnover (INR) | B2 | Page 277 | ||
| Total Profit After Taxes (INR) | B3 | Page 277 | ||
| Total spending on corporate social responsibility (CSR) (INR) | B4 | Page 198 | ||
| List of activities in which expenditure in B4 above has been incurred. | B5 | Community Development Activities Page 199-209 | ||
| Section C: Other Details | ||||
| Does the Company have any Subsidiary Company / Companies? | C1 | Yes | ||
| Do the Subsidiary Company / Companies participate in the BR Initiatives of the parent company? If yes, then indicate the number of such subsidiary company(s) | C2 | Yes. Vedanta Ltd. has 8 subsidiaries HZL, BALCO, MEL, Cairn India, Western clusters, Zinc International and CMT (Copper Mines of Tasmania) | ||
| Do any other entity/entities (e.g. suppliers, distributors, etc.) that the Company does business with participate in the BR initiatives of the Company? If yes, then indicate the percentage of such entity/entities. [Less than 30%, 30-60%, More than 60%] | C3 | Our suppliers are not directly involved with the ‘Responsible Business’ initiatives. However, our contracts address areas like HSE, Ethics, and Human Rights that our suppliers are obliged to adhere to strictly. | ||
| Section D: BR Information | ||||
| Details of Director/Directors responsible for BR | D1 | Page 197 | ||
100
| < BACK TO CONTENTS | Integrated Report | Statutory reports | Financial statements |
2. Principle-wise (as per NVGs) BR Policy/policies (Reply in Y/N)
| S. No. | Questions | P1 | P2 | P3 | P4 | P5 | P6 | P7 | P8 | P9 | ||||||||||
| Do you have a policy/policies for: | Y | N | Y | Y | Y | Y | Y | Y | Y | |||||||||||
| 1 | Has the policy been formulated in consultation with the relevant stakeholders? | Y | NA | Y | Y | Y | Y | Y | Y | Y | ||||||||||
| 2 | Does the policy conform to any national/ international standards? If yes, specify. (50 words) | Y | NA | Y | Y | Y | Y | Y | Y | Y | ||||||||||
| 3 | Has the policy been approved by the Board? Has it been signed by MD/Owner/CEO/ Appropriate Board Director? | Y | NA | Y | Y | Y | Y | Y | Y | Y | ||||||||||
| 4 | Does the Company have a specified committee of the Board/ Director/Official to oversee the implementation of the policy? | Y | NA | Y | Y | Y | Y | Y | Y | Y | ||||||||||
| 5 | Indicate the link for the policy to be viewed online? | https://www.vedantalimited.com/Pages/ | ||||||||||||||||||
| CorporateGovernance.aspx?type=inv | ||||||||||||||||||||
| 6 | Has the policy been formally communicated to all relevant internal and external stakeholders? | Y | NA | Y | Y | Y | Y | Y | Y | Y | ||||||||||
| 7 | Does the Company have in-house structure to implement the policy/policies? | Y | NA | Y | Y | Y | Y | Y | Y | Y | ||||||||||
| 8 | Does the Company have a grievance redressal mechanism related to the policy/ policies to address stakeholders’ grievances related to the policy/ policies? | Y | NA | Y | Y | Y | Y | Y | Y | Y | ||||||||||
| 9 | Has the Company carried out independent audit/ evaluation of the working of this policy by an internal or external agency? |
Each year, the Company undertakes an audit exercise, conducted by an external agency to evaluate the workings of these policies. This audit is known as the Vedanta Sustainability Assurance Protocol (VSAP) audit. The VSAP audit is conducted across all of our significant sites. | ||||||||||||||||||
NA = Not Applicable
| BRR | ||||
| BRR Section | Framework | Section/Page Number in Integrated Report | ||
| 3. Governance related to BR | ||||
| Indicate the frequency with which the Board of Directors, Committee of the Board or CEO to assess the BR performance of the Company. Within 3 months, 3-6 months, Annually, More than 1 year | D3 | Sustainability and ESG Page 77, 98-99 | ||
| Does the Company publish a BR or a Sustainability Report? What is the hyperlink for viewing this report? How frequently it is published? | D3 | Sustainability and BRR performance are detailed in the Vedanta Ltd. Annual Report. We also publish an annual Sustainability Report based on GRI Standards. Our Sustainability Reports can be found at: http://www.vedantalimited.com. | ||
VEDANTA LIMITED | INTEGRATED REPORT AND ANNUAL ACCOUNTS 2020-21 | 101
BUSINESS RESPONSIBILITY REPORT MAPPING CONTINUED...
| BRR | ||||
| BRR Section | Framework | Section/Page Number in Integrated Report | ||
| Section E - Principle-wise Disclosures | ||||
| Principle 1 - Conduct, Governance, Ethics, Transparency and Accountability | ||||
1. Does the policy relating to ethics, bribery and corruption cover only the company? Yes/ No. Does it extend to the Group/Joint Ventures/ Suppliers/Contractors/NGOs /Others? | P1-1 | No. The Business Code of Conduct and Ethics applies to all Directors, officers and employees of the Company and its subsidiaries Page 182 | ||
2. How many stakeholder complaints have been received in the past financial year and what percent was satisfactorily resolved by the management? If so, provide details thereof, in about 50 words or so | P2-1 | Standalone numbers: Open complaints at 1 April 2021: 04
Number of whistle-blower cases received in FY2021: 102
Number of whistle-blower cases upheld and found correct in FY2021: 32
Number of whistle-blower cases closed in FY2021:100 | ||
| Principle 2 - Safety and Optimal Resource Utilisation across Product Lifecycle | ||||
1. List up to 3 of your products or services whose design has incorporated social or environmental concerns, risks and/or opportunities. | P2-1 | Cairn case study – Bringing smile to the last mile; Page 91
HZL paste fill plant case study; Page 83 | ||
2. For each such product, provide the following details in respect of resource use (energy, water, raw material etc.) per unit of product(optional): | P2-2 | 1. Cairn has set up “Community helpdesks” across six villages to provide voice to the underprivileged. This is an awareness cum educational initiative. This project has helped more than 1,500 lives.
2. HZL has set up paste fill plants across its mining operations. It is the first such plant in India. The implantation leads to reduced environmental foot print by utilising tailings and fly ash and leading to a reduction in use of cement. 39% tailing utilisation and 244 kg m3 reduction in cement use. | ||
102
| < BACK TO CONTENTS | Integrated Report | Statutory reports | Financial statements |
| BRR Section | BRR Framework | Section/Page Number in Integrated Report | ||
3. Does the company have procedures in place for sustainable sourcing (including transportation)? If yes, what percentage of your inputs was sourced sustainably? Also, provide details thereof in 50 words or so. | P2-3 | The Company includes sustainable sourcing practices by intrinsically building the clauses in the contract. | ||
4. Has the company taken any steps to procure goods and services from local & small producers, including communities surrounding their place of work? If yes, what steps have been taken to improve their capacity and capability of local and small vendors? | P2-4 | In view of retaining quality, the Company sources its major inputs from OEMs and large national and international manufacturers. Goods and services procured by businesses locally are of consumable nature where feasible. | ||
5. Does the company have a mechanism to recycle products and waste? If yes, what is the percentage of recycling of products and waste (separately as <5%, 5-10%, >10%). Also, provide details thereof, in about 50 words or so. | P2-5 | Yes
Find the waste recycling numbers:
Fly ash – 110%
Jarosite – 25%
Page 78-85 | ||
| Principle 3: Employee Well-being | ||||
1. Please indicate the Total number of employees | P3-1 | 17047, full time employees | ||
2. Please indicate the total number of employees hired on temporary/ contractual/casual basis | P3-2 | 52,747 as on 31 March. (This doesn’t include 243 Retainers/Fixed term Contract employees) | ||
3. Please indicate the number of permanent women employees | P3-3 | 1911 Full-time female employees | ||
4. Please indicate the Number of permanent employees with disabilities | P3-4 | Not tracked | ||
5. Do you have an employee association that is recognised by management? | P3-5 | Yes, we have recognized employee association at IOB, HZL & BALCO | ||
6. What percentage of your permanent employees are members of this recognised employee association? | P3-6 | We have recognised employee associations at IOB, HZL & BALCO. Coverage of permanent employees is as below: | ||
| 73.8% at IOB | ||||
| 31% at HZL | ||||
| 51% at BALCO | ||||
7. Please indicate the Number of complaints relating to child labour, forced labour, involuntary labour, sexual harassment in the last financial year and pending, as on the end of the financial year. | P3-7 | Child labour/ forced labour/involuntary labour – Nil
Sexual harassment cases - 8*; All cases are closed
*Represents consolidated number | ||
8. What number of your under mentioned employees were given safety & skill up-gradation training in the last year? | P3-8 | The total safety & skills-up gradation training given to employees, contract workers and third-party visitors is given as below: | ||
| Employees: 70,460 hours | ||||
| Contract employees - 9,45,953 hours | ||||
| Third party: 10,614 hours | ||||
VEDANTA LIMITED | INTEGRATED REPORT AND ANNUAL ACCOUNTS 2020-21 | 103
BUSINESS RESPONSIBILITY REPORT MAPPING CONTINUED...
| BRR Section | BRR Framework | Section/Page Number in Integrated Report | ||
| Principle 4: Engaging Stakeholders - Sustaining Value | ||||
1. Has the company mapped its internal and external stakeholders? Yes/No | P4-1 | Yes | ||
2. Out of the above, has the company identified the disadvantaged, vulnerable & marginalised stakeholders. | P4-2 | Yes | ||
3. Are there any special initiatives taken by the company to engage with the disadvantaged, vulnerable and marginalised stakeholders. If so, provide details thereof in 50 words or so. | P4-3 | Together we help uplift communities
Making inclusive progress an everyday reality Page 86-91 | ||
| Principle 5: Promoting Human Rights | ||||
1. Does the policy of the company on human rights cover only the company or extend to the Group/ Joint Ventures/ Suppliers/ Contractors/ NGOs/ Others? | P5-1 | Yes | ||
2. How many stakeholder complaints have been received in the past financial year and what percent was satisfactorily resolved by the management? | P5-2 | No complaints with respect to human rights were reported. | ||
| Principle 6: Nurturing the Environment | ||||
1. Does the policy related to Principle 6 cover only the company or extends to the Group/Joint Ventures/Suppliers/ Contractors/NGOs/others. | P6-1 | Yes | ||
2. Does the company have strategies/ initiatives to address global environmental issues such as climate change, global warming, etc? Y/N. If yes, please give hyperlink for webpage etc. | P6-2 | Yes. Energy Management & Climate Change; Page 78-79 | ||
3. Does the company identify and assess potential environmental risks? Y/N | P6-3 | Yes | ||
4. Does the company have any project related to Clean Development Mechanism? If so, provide details thereof, in about 50 words or so. Also, if Yes, whether any environmental compliance report is filed? | P6-4 | No | ||
5. Has the company undertaken any other initiatives on – clean technology, energy efficiency, renewable energy, etc. Y/N. If yes, please give hyperlink for web page etc. | P6-5 | Yes. Energy Management & Climate Change; Page 78-79 | ||
6. Are the Emissions/Waste generated by the company within the permissible limits given by CPCB/SPCB for the financial year being reported? | P6-6 | Yes | ||
7. Number of show cause/ legal notices received from CPCB/SPCB which are pending (i.e. not resolved to satisfaction) as on end of Financial Year | P6-7 | |||
104
| < BACK TO CONTENTS | Integrated Report | Statutory reports | Financial statements |
| BRR Section | BRR Framework | Section/Page Number in Integrated Report | ||
| Principle 7: Responsible Policy Advocacy | ||||
1. Is your company a member of any trade and chamber or association? If Yes, Name only those major ones that your business deals with. | P7-1 | Our business and subsidiary companies are members of trade and industry bodies like the Federation of Indian Mining Industries, Confederation of Indian Industry, Indian Institute of Metal, Federation of Indian Chambers of Commerce & Industry and The Energy Resources Institute, India, where they actively participate in their Management Committees. | ||
2. Have you advocated/lobbied through above associations for the advancement or improvement of public good? Yes/No; if yes specify the broad areas (Governance and Administration, Economic Reforms, Inclusive Development Policies, Energy security, Water, Food Security, Sustainable Business Principles, Others) | P7-2 | We are working to directly and indirectly support government authorities to catalyse sustainable development of the metals & mining sector. For example, in recent years, we have worked with the national authorities on various campaigns like “Make In India”, resumption of mining in Goa, reduction of iron ore and export duty among others. | ||
VEDANTA LIMITED | INTEGRATED REPORT AND ANNUAL ACCOUNTS 2020-21 | 105
BUSINESS RESPONSIBILITY REPORT MAPPING CONTINUED...
| BRR Section | BRR Framework | Section/Page Number in Integrated Report | ||
| Principle 8: Support Inclusive Development | ||||
1. Does the company have specified programmes/ initiatives/projects in pursuit of the policy related to Principle 8? If yes details thereof | P8-1 | Community Empowerment Initiatives; Page 88-91 | ||
2. Are the programmes/projects undertaken through in-house team/own foundation/ external NGO/government structures/any other organisation? | P8-2 | We implement our programmes through all the following modes - directly through our Corporate Social Responsibility team and in partnership with government and civil society organisations. We also actively encourage our own employees to contribute towards these social initiatives. | ||
3. Have you done any impact assessment of your initiative? | P8-3 | Yes | ||
4. What is your company’s direct contribution to community development projects- Amount in INR and the details of the projects undertaken. | P8-4 | Annexure B; Page 197 | ||
5. Have you taken steps to ensure that this community development initiative is successfully adopted by the community? Please explain in 50 words or so. | P8-5 | Most of our programmes emerge from a community needs assessment and are delivered in close partnership with them. Several of our initiatives, such as women’s self-help groups, are now completely run and managed by the community members themselves. Our role is chiefly that of a catalyst in the whole process. | ||
106
| < BACK TO CONTENTS | Integrated Report | Statutory reports | Financial statements |
| BRR Section | BRR Framework | Section/Page Number in Integrated Report | ||
| Principle 9: Providing Customer Value | ||||
1. What percentage of customer complaints/ consumer cases are pending as on the end of financial year. | P9-1 | Nil | ||
2. Does the company display product information on the product label, over and above what is mandated as per local laws? Yes/No/N.A. / Remarks (additional information) | P9-2 | Yes. Our copper cathodes, aluminium are all internationally known brands registered with the LME (London Metal Exchange). LME standards signify highest product quality, uniform physical characteristics and consistency of products. Our products meet all necessary and benchmark national and global regulations, standards and guidelines. This re-emphasises our capability and commitment to meet world-class standards. For continuous quality improvement, Quality Management Systems are in place, which comply with the ISO 9001:2008 standard requirements. | ||
3. Is there any case filed by any stakeholder against the company regarding unfair trade practices, irresponsible advertising and/or anti-competitive behaviour during the last five years and pending as on end of financial year. If so, provide details thereof, in about 50 words or so | P9-3 | Nil | ||
4. Did your company carry out any consumer survey/ consumer satisfaction trends? | P9-3 | Yes | ||
VEDANTA LIMITED | INTEGRATED REPORT AND ANNUAL ACCOUNTS 2020-21 | 107
AWARD
Recognised for our excellence
Health and safety
| Sl. No | Name of Awards | Category/ Recognition | Recipient (Business Unit) | |||
| 1. | Finest India Skills & Talent (FIST) Awards 2020 by Fire & Security Association of India | ‘Safe & Secure High Hazard Facility’ | Cairn Oil & Gas- Suvali | |||
| 2. | Indian Chamber of Commerce National Occupational Health & Safety Awards 2020 | Vedanta - Value-Added business selected for Gold Award for Manufacturing and Engineering Sector in Large Enterprise Category | Iron Ore | |||
| 3. | British Safety Council (BSC) | Cairn Oil & Gas midstream has won the “Sword of Honor” for outstanding HSE management system. The Mid-stream managed to achieve 94.4% with five-star rating during BSC assessment audit | Cairn Oil & Gas | |||
| 4. | Indian Chamber of Commerce National Occupational Health & safety Awards for the Year 2020 | For Manufacturing and Engineering sector in Large Enterprise Category | Iron Ore | |||
| 5. | ‘Challenger Award’ and ‘Safety Excellence Award’ | HSE - Frost & Sullivan Sustainability Awards | Pantnagar - HZL | |||
| 6. | APEX India Occupational Health and Safety Award 2020 | APEX India Foundation | Vedanta Ltd., Jharsuguda | |||
Environmental and social
| Sl. No | Name of Awards | Category/ Recognition | Recipient (Business Unit) | |||
| 1. | 2020 edition of Sustainability 4.0 Award | Under the mega large business category, it was awarded The Leaders Award. | Cairn Oil & Gas | |||
| 2. | CDP ‘A List’ | For efforts to tackle climate change | HZL | |||
| 3. | The Dow Jones Sustainability Index 2020 | Ranked 1st in Asia-Pacific and 2nd Globally in ‘Environment’ | HZL | |||
| 4. | Identified as ‘Responsible business of the Year’& awarded with Grant Thornton SABERA Award 2020. | Community Development | HZL | |||
| 5. | CII – ITC Sustainability Awards 2020 | Commendation for Significant Achievement | HZL | |||
| 6. | Apex India Green Leaf Awards | ‘Gold’ award in the category of ‘Energy Efficiency’ | HZL | |||
| 7. | CII National Awards | HZL’s Sindesar Khurd Mine wins for Excellence in Water Management | HZL | |||
| 8. | FAME Excellence Awards | CPP at Dariba Smelting Complex wins Gold for Energy Efficiency and Water Stewardship | HZL | |||
108
| < BACK TO CONTENTS | Integrated Report | Statutory reports | Financial statements |
Sl. No | Name of Awards | Category/ Recognition | Recipient (Business Unit) | |||
| 9. | Apex India Foundation Green Leaf Platinum Award 2019 | Sustainability | Aluminium & Power - Jharsuguda | |||
| 10. | CII National Award | Excellence in Water Management 2020 under ‘Within the Fence’ category | Aluminium & Power - Lanjigarh | |||
| 11. | Green Tech Foundations’ CSR Award | ‘Project Unnati: Empowering Women and Making Women Financially Independent’ | BALCO | |||
| 12. | CII-ITC Sustainability Awards 2020 | ‘Commendation for Significant Achievement - CSR’ | BALCO | |||
| 13. | 15th CII ITC Sustainability Award 2020 | ‘Excellence in Corporate Social Responsibility’ category | Cairn Oil & Gas | |||
| 14. | 14th edition of CII-National Awards for Excellence in water management 2020 | MBA (Mangala, Bhagyam, Aishwariya) operation under the ‘Within Fence’ category. | Cairn Oil & Gas | |||
| 15. | Brand India Excellence Award 2020 | For Most Innovative CSR Program of the Year | ESL | |||
| 16. | CII Environmental Best Practices Award 2020 | HSE - ‘Most Innovative Environmental Project’ category | HZL | |||
| 17. | 14th ICC Environment Excellence Award (2020) | From the Indian Chamber of Commerce in the Large Enterprise category at the 14th Environment Partnership E-Summit | ZSD - HZL | |||
| 18. | Sustainability 4.0 Awards | The leaders awards under the mega large business category and the first runner-up award under the Jury Special Mention Award on ‘Recycling of Produced Water for Injection Purpose’ | Cairn Oil & Gas, Vedanta ltd | |||
| 19. | Mahatma Award 2021 | Social Award | BALCO | |||
VEDANTA LIMITED | INTEGRATED REPORT AND ANNUAL ACCOUNTS 2020-21 | 109
AWARDS CONTINUED...
People
Sl. No | Name of Awards | Category/ Recognition | Recipient (Business Unit) | |||
| 1. | Company with Great Managers 2020 | People Business in association with the Economic Times | HZL | |||
| 2. | Asian Business Leaders Award 2020-21 | Abhijit Pati, CEO BALCO, awarded Most Promising Business Leader of Asia 2020-21 | BALCO | |||
| 3. | SHE (Safety, Health & Environment) Excellence Award | Large Scale Manufacturing Sector category | ESL | |||
| 4. | 11th CII National HR Excellence Award 2020-21 | People’s CEO of the Year Award’ to Mr. Rahul Sharma, Dy. CEO–Aluminium Business | Vedanta Ltd., Lanjigarh | |||
| 5. | CEO Insights | Mr. Deepak Prasad recognised as TOP 20 Chief Operating Officer 2020 | BALCO | |||
Operational and business excellence
| Sl. No | Name of Awards | Category/ Recognition | Recipient (Business Unit) | |||
| 1. | Annual BS 1000 (By total revenue) | Ranked 14 (3rd in the sector rankings of Metals, Mining & Minerals) | Vedanta Limited | |||
| 2. | 26th Bhamashah Award | HZL’s five units - Chanderiya Smelting Complex, Rajpura Dariba Complex, Zawar Mines, Rampura Agucha Mines and Kayad Mine | HZL | |||
| 3. | Certified “FIVE-S Workplace Management System” by Quality Circle Forum of India (QCFI). | Central Polymer Facility, Bhagyam Operations and Satellite Field and Unloading Bay -SFON Operations received the award | Cairn Oil & Gas | |||
| 4. | LACP (League of American Communications Professionals) Awards | HZL’s First Integrated Annual Report (FY2019-20) - theme “Smart Mining for a Sustainable Future” received inspiring recognitions and included in top 100 publications of 2020 | HZL | |||
| 5. | SAP Ace Award 2020 | For HZL’s ‘EVOLVE’ and ‘CONFLUENCE’ platforms | HZL | |||
| 6. | Bangladesh Society for Total Quality Management (BSTQM) | Platinum Award at International Convention on Quality Control Circles (ICQCC) 2020 | Aluminium & Power - Lanjigarh | |||
| 7. | Manufacturing Sector CII 5S Excellence Award | Diamond Rating and emerged as Runner up | BALCO | |||
| 8. | Association of Business Communicators in India (ABCI) | PR and Communications won Bronze Award for ‘BALCO Today’ | BALCO | |||
| 9. | 45th International Convention on Quality Circles | Cairn Oil & Gas’s RJ Gas SBU secures platinum award in 5S for workplace management at the international level round | Cairn Oil & Gas | |||
| 10. | 8th FICCI Quality Systems Excellence Awards | For Industry 2020 for Good Practices in Quality Systems | ESL | |||
110
| < BACK TO CONTENTS | Integrated Report | Statutory reports | Financial statements |
| Sl. No | Name of Awards | Category/ Recognition | Recipient (Business Unit) | |||
| 11. | National Energy Conservation Award | Bureau of Energy Efficiency, Govt. of India | Vedanta Ltd., Lanjigarh | |||
| 12. | Kalinga Safety Excellence ‘Gold’ Award | Institute of Quality & Environment Management Services (IQEMS) | TPP, Vedanta Ltd., Jharsuguda | |||
| 13. | IMC Ramakrishna Bajaj National Quality (RBNQ) Award | IMC Chamber of Commerce & Industry | Vedanta Ltd., Jharsuguda | |||
| 14. | State Level CCQC ‘Gold’ Award 2020 | Quality Circle Forum of India, Rourkela Chapter | Vedanta Ltd., Jharsuguda | |||
| 15. | Golden Peacock Award for Sustainability | Operational Excellence | BALCO | |||
| 16. | National Awards for Manufacturing Competitiveness (NAMC) 19-20 | Gold Medal | BALCO | |||
| 17. | Most Trusted Brands Of India 2021 | CNBC TV18 | BALCO | |||
Digitalisation
| Sl. No | Name of Awards | Category/ Recognition | Recipient (Business Unit) | |||
| 1. | Inflection Award for Procurement Automation Project, 2021 | Singapore Institute of Materials Management & Council of Supply Chain Management Professionals | Vedanta Ltd., Jharsuguda | |||
| 2. | TechCircle Business Transformation Awards 2020. | Excellence in Digital Execution for Quality Transformation for the ‘Next Generation Workplace - Office 365’ | Cairn Oil & Gas | |||
| 3. | CII - Centre for Digital Transformation | Most innovative Best Practice Digital Transformation Award | Aluminium & Power - Jharsuguda | |||
| 4. | CII’s Digital Transformation (DX) Summit & Awards 2020. | Innovative Best Practice Award bagged for the Copper Buddy project | Sterlite Copper | |||
VEDANTA LIMITED | INTEGRATED REPORT AND ANNUAL ACCOUNTS 2020-21 | 111
MANAGEMENT DISCUSSION AND ANALYSIS
We recorded strong operational and financial performance in FY2021 amidst the challenges faced due to the pandemic. At VEDL, we continue to focus on controllable factors such as resetting cost base through diverse cost optimisation initiatives, disciplined capital investments, working capital initiatives, marketing initiatives and volume with strong control measures to ensure safe operations across businesses within framed government and corporate guidelines amidst the pandemic.
| KEY STATISTICS: | ||||
₹86,863 crore | ₹27,341 crore | 36% | ||
| Revenue | EBITDA | EBITDA Margin |
112
| < BACK TO CONTENTS |
₹13,880 crore | ₹32.80 | ₹9.50 | ||
| Capital work-in-progress | EPS (before exceptional items) | Per share interim dividend | ||
| (FY2020: ₹10.79 per share) |
VEDANTA LIMITED | INTEGRATED REPORT AND ANNUAL ACCOUNTS 2020-21 | 113
MANAGEMENT DISCUSSION AND ANALYSIS
Market review
GLOBAL ECONOMY AND COMMODITY MARKETS
The COVID-19 pandemic and the widespread lockdowns imposed by countries in 2020 triggered the worst peacetime global contraction since the Great Depression in 1929. The subsequent and gradual easing of containment measures during the second half of the year, initially caused a strong rebound. This initial spurt in economic activity, however, lost momentum in some regions of the world towards the end of the year due to a renewed rise in infections. The recession and the pandemic-related restrictions also caused global trade to contract substantially, which hampered growth further, particularly in export-dependent economies.
The US economy suffered a major drop in the first half of the year, accompanied by a huge surge in unemployment. Owing to a vast array of monetary and fiscal measures, as well as the comparatively moderate government restrictions, the economy recovered in the second half of the year. In the first half of 2020, the pandemic and the associated containment measures also caused the economies of Eurozone to plunge into a deep recession that affected the manufacturing and services sectors equally. However, this decline varied greatly among different member states.
Although China was the epicentre of the outbreak, the country imposed one of the most stringent lockdowns to flatten the curve and bring the economy back on track. The result is that the annual industrial production in the Chinese economy declined to -13.5% during January - February 2020 but reached 7.3% in December.
Most of the economies faced major contraction in GDP in Q2 of 2020, except for the Chinese economy, which grew 3.2% y-o-y.
IMF has reported that the global pandemic-related fiscal actions of US$146 trillion, comprising US$10 trillion in additional spending and forgone revenue and US$6 trillion government loans, guarantees, and capital injections, mitigated the contraction in economic activity
114
| < BACK TO CONTENTS | Integrated Report | Statutory reports | Financial statements |
Several fiscal measures were announced by the US as relief package and stimulus to the US economy under CARES Act (estimated US$2.3 trillion or ~11% of GDP), Paycheck Protection Program and Health Care Enhancement Act (US$483 billion), Consolidated Appropriations Act of 2021 (US$868 billion or about 4.1% of GDP), American Rescue Plan (estimated US$1,844 billion or about 8.8% of GDP) etc. Such stimulus packages were primarily focused on direct stimulus payments to individuals, unemployment benefits, tax rebate, food safety, assistance to families, communities and businesses, corporate bankruptcy prevention, healthcare, international assistance etc. The federal funds rate was lowered by 150bp in March to 0-0.25bp to facilitate credit flow and relieve the stress in the economy. Federal Reserve also introduced facilities to support credit flow, in some cases backed by the treasury using funds appropriated under the CARES Act.
The package of €540 billion provided by the European Commission was targeted towards Pandemic Crisis Support, government guarantees to European Investment Banks, and job protection. EU also finalised the agreement on the Next Generation EU (NGEU) recovery fund which will provide €750 billion through borrowing at the EU level. The European Central Bank (ECB) also introduced new and extended existing monetary policy supports.
The Government of China announced a stimulus of RMB 4.8 trillion (4.7% of GDP) for spending on epidemic prevention and control, production of medical equipment, unemployment mitigation, tax relief, and additional public investments. The stimulus packages injected by the economies helped accelerate GDP growth that had faced a significant decline in the initial quarters.
Following the vaccine rollout and backed by stimulus packages, CY2021 GDP growth is likely to be high (chart IMF GDP growth of major economies). However, the recovery is not even and varies widely among advanced economies, emerging economies and developing economies. Government support also brings about elevated debt levels.
With over 136 million confirmed cases of COVID-19 and 2.9 million deaths worldwide reported by WHO till 13 April 2021, the world is still facing a crisis to contain the virus and resume economic activities. Policy measures COVAX, convened by WHO and CEPI GAVI have been initiated to support homogeneous vaccination worldwide.
Source: IMF
Opportunities for Vedanta - Global
Globally, monetary, and fiscal policies have been targeted to mitigate the adverse effect of the pandemic. Initiatives were taken to encourage private sector investments, which will subsequently spur the commodity demand worldwide. With metal prices going back to the pre-COVID level and the recovery of the manufacturing industries, Vedanta has a positive outlook to benefit from the commodity market revival.
The revival of the Chinese economy, driven by the improvement in the infrastructure sector has been a major contributor to bring back the price level of the metals and minerals market. Upcoming infrastructure plans to become the global leader in high-tech and innovative industries will drive the domestic primary metal demand, creating export opportunity for producers. Vedanta, with a substantial share in the export market, is looking forward to fulfilling the global demand.
As the economy gradually regains its pre-COVID momentum and as mobility increases, oil demand is expected to surge. This is likely to revive by the latter half of the year due to the ongoing lockdown in certain regions. The widespread vaccination initiatives will further encourage economic activities to normalise by the end of the year, accelerating the bounce-back of the Oil & Gas market.
Our diversified commodity portfolio and emphasis on cost and digital implementation position us well to take advantage of the expected demand revival, and the resulting improvement in commodity prices.
VEDANTA LIMITED | INTEGRATED REPORT AND ANNUAL ACCOUNTS 2020-21 | 115
MANAGEMENT DISCUSSION AND ANALYSIS CONTINUED...
INDIAN ECONOMY
India continues to be Vedanta’s primary market, and the V-shaped recovery of the economic performance of India in FY2021 is positive for us. COVID-19 was particularly challenging for the Indian economy with a prior slow growth rate, declining exports, rising inflation, and a downturn in manufacturing output. The index of industrial production (IIP) declined drastically to -57.3% in April 2020 following nationwide stringent lockdown across India, halting economic activities. The country’s GDP growth also spun into negative territory, declining by 24.4% in the Q1FY2021.
To prevent the country’s GDP from contracting further and to bring it back into positive territory, the Government of India took bold, swift and unconventional initiatives. It announced a special economic and comprehensive package under ‘AatmaNirbhar Bharat Abhiyaan’ of ₹20 lakh crore - equivalent to 10% of India’s GDP - to combat the pandemic-induced stress.
Complementing the government’s fiscal measures, the RBI adopted proactive steps to inject liquidity into the economy and to provide relief to COVID-hit sectors. It reduced the repo rates to 4% and reverse repo rates to 3.35% and implemented a moratorium on the payment of term loans.
The Micro, Small and Medium Enterprises (MSME) sector was hardest hit by the pandemic. Two major schemes such as the Emergency Credit Line Guarantee Scheme (ECLGS) and the Credit Guarantee Scheme for Subordinate Debt (CGSSD) were introduced by the Government of India to provide emergency relief. These initiatives were complemented by various
monetary and regulatory measures by the RBI in the form of interest rate cuts, higher structural and durable liquidity, moratorium on debt servicing, asset classification standstill, loan restructuring package and Cash Reserve Ratio (CRR) exemptions on credit disbursed to first-time MSME borrowers.
In the concluding months of FY2021, growth in e-way bills, railway freight, steel consumption, automobile sales and electricity generation were observed. This indicates V-shaped recovery of the economy. The necessary interventions by the government helped the economy revive from the low of Q1FY2021 to register a small positive growth of
0.4% in GDP in Q3FY2021.
India has rolled out the world’s largest vaccination drive to inoculate close to 1.4 billion people. Accelerated vaccination will help resume the suspended economic activities and will improve the affected industries in the country. The success of the vaccination drive will also create a positive outlook for the economy, going forward.
Outlook
The IMF has projected an impressive 12.5% growth rate for India in 2021. This suggests that India’s GDP growth rate is likely to be the fastest in the world among the major economies in 2021. The large-scale capital expenditure announced by the Government of India in the Union Budget 2021-22 will support economic activity and investment. The capex cycle, triggered by the government, is likely to crowd in private investment, which is expected to drive economic growth, and consequently, more opportunities for business and employment generation. However, the recent surge in COVID-19 cases in India may pose some constraints in the growth prospect of India.
Opportunities for Vedanta - India
The country’s economic growth is supported by a sound fiscal policy framework, strong regulatory mechanism, and wide-ranging structural reforms undertaken by the Government of India and states
116
| < BACK TO CONTENTS | Integrated Report | Statutory reports | Financial statements |
The Government of India’s emphasis on self-sufficiency (Aatmanirbhar Bharat), will strengthen the country’s demand for commodities. Concrete steps towards decarbonisation and promotion of electric mobility will accelerate the initiation of new energy-based models and innovation in value chains
Given that India’s per capita consumption of all metals including steel, aluminium, copper, and zinc is much below the world average, there is significant headroom for growth
India is the world’s third-largest oil consumer, but in per-capita terms, it is only about one-third of the world’s average. The country’s growing energy needs and increased dependence on crude oil imports offer an attractive opportunity for domestic oil producers
Policy support
Aatmanirbhar Bharat Package
As a part of the economic package under ‘AatmaNirbhar Bharat Abhiyaan’ several structural reforms were announced by the Hon’ble Finance Minister, including mineral and coal sectors. Some of the major focus areas relating to the mineral and coal sectors are highlighted below:
Seamless composite exploration- cum-mining-cum-production regime
500 mining blocks to be auctioned transparently
Removal of distinction between captive and non-captive mines to allow the transfer of mining leases and sale of surplus unused minerals
Introduction of Joint Auction of bauxite and coal mineral blocks to enhance Aluminium Industry’s competitiveness
Development of Mineral Index for different minerals
Rationalisation of stamp duty payable at the time of award of mining leases
Exploration-cum-production regime for partially explored coal blocks
Incentivisation through rebate in revenue-share for production of coal earlier than scheduled
Coal evacuation infrastructure development of ₹50,000 crore
Commercial coal mining - In a major policy reform, the Hon’ble Prime
Minister launched the auctioning of commercial coal mining. This was aimed at fully opening the coal and mining sectors for competition, capital, participation, and technology to make the coal mining sector self-reliant. This will have a positive impact on coal-consuming sectors such as steel, aluminium, fertilisers, and cement. Salient features of this reform include revenue sharing- based auction methodology from earlier fixed rupees per tonne-based auction of coal blocks, permission for commercial exploitation of coal bed methane, rebates in revenue share payments in the event of early production of coal from the coal mine, and so on. Vedanta is advocating for similar incentives to be provided for other minerals.
Iron & steel, aluminium and copper identified as key sectors for exports - The Government of India has identified 20 sectors in which India can meet domestic demand as well as become a ‘global factory of the world’ by growing exports and reining in costly imports. Iron & steel, aluminium and copper are included in this list. The Ministry of Commerce
& Industry will conduct further study on these sectors to look into areas to enhance export competitiveness.
Production - Linked Incentive (PLI) Scheme - To bolster investments in domestic manufacturing, the Union Cabinet of India has unveiled the PLI Scheme in 10 key sectors. This is also a part of India’s endeavour towards self-reliance through enhancing
India’s manufacturing capabilities and increasing exports. The ten sectors are - (1) Advance Chemistry Cell (ACC) Battery, (2) Electronic/Technology Products, (3) Automobiles & Auto Components, (4) Pharmaceuticals drugs, (5) Telecom & Networking Products, (6) Textile Products, (7) Food Products, (8) Solar PV Modules,
(9) White Goods (ACs & LED) and (10) Specialty Steel. The scheme has approved financial outlay of ₹1,45,980 crore over a five-year period. This is apart from already notified PLI schemes in the mobile manufacturing and pharmaceutical sector with a financial outlay of ₹51,311 crore.
Although non-ferrous base metal manufacturing sector has not been considered for the PLI scheme, the sector will indirectly benefit from higher metal demand from increased manufacturing of battery, automobile, solar PV module, white goods, and specialty steel.
Marketing freedom for natural gas - Taking a significant step towards gas-based economy with the objective of increasing domestic production of natural gas, the Cabinet Committee on Economic Affairs has approved ‘Natural Gas Marketing Reforms’.
Union Budget for 2021-22 - The Union Budget has proposed ₹5.54 lakh crore for capital expenditure for 2021-22 which is 34.5% more than the BE (Budget Estimate) of 2020-21, which will increase demand for products made with metals and minerals as key raw material. Proposal to set up Development Financial Institution (DFI) for infrastructure financing for a lending portfolio of at least ₹5 lakh crore in three years’ time is a big boost for infrastructure development which will augment demand for metals and minerals.
The increased allocation to several schemes such as Road Transport, Jal Jeevan Mission, Metro Projects, Strengthening of Power Systems, and New and Renewable Energy will drive the demand for commodities.
The Government of India’s roadmap on disinvestment of public sector enterprises in all non-strategic and strategic sectors along with monetisation of non-core assets of PSEs provides investment opportunities to private sector in good quality assets.
VEDANTA LIMITED | INTEGRATED REPORT AND ANNUAL ACCOUNTS 2020-21 | 117
MANAGEMENT DISCUSSION AND ANALYSIS CONTINUED...
Segment review
Zinc
Overview
Starting FY2021 below US$1,900/ tonne, zinc prices started soaring and touched the US$2,800/tonne mark. This can be attributed to the disruption of global zinc mine supply affected by the pandemic. Mine closures in Peru and Mexico in particular have played a major role in the recovery of prices.
But as restrictions started to ease and the world resumed operations, both demand and supply started to align with pre-COVID levels in Q3 and Q4 of FY2021. This helped the players maintain a steady price of around US$2,700/tonne. At a supply level, refined zinc metal production increased by 1.2% y-o-y to 13.64 mt in 2020 with a 2.9% growth.
Market drivers
Despite the effects of the pandemic, governments and institutions are likely to continue their efforts to try and support economies. As a result, zinc consumption is expected to grow by 4%, marking the first annual increase in zinc consumption in the past three years.
In the Indian construction sector, to help mitigate corrosion loss, Corrosion Protection Rebars have recently been adopted by few domestic rebar manufacturers, who are working in collaboration with the International Zinc Association (IZA) to bring Continuous Galvanized Rebar Plant to India. Indian Railways, considering the safety and longevity of rail tracks, are working on different mechanisms to protect the web area of rail from corrosion. Zinc Thermal Metallisation which has been considered globally as the best method to prevent corrosion of railway tracks, is expected to soon adapted in India.
Galvanising has been the key driving force of zinc demand mainly in construction and infrastructure, and automobiles. The ₹1,18,101 lakh crore allotment for the Ministry of Road Transport and Highways
will boost zinc consumption, led by the development of road crash barriers and galvanised steel bridges. Also the 100% electrification of Broad-Gauge Railway routes are to be completed by December, 2023, which will further contribute towards zinc demand in India, led by electrification in railways.
Products and customers
Hindustan Zinc Limited (HZL) is the largest primary zinc producer in India, with an expected 77% market share in 2021. Around 70% of the refined zinc produced by HZL’s smelters is sold in the domestic market, and the rest is being exported to South-East Asian and Middle Eastern markets. Over 70% of the Indian zinc demand comes from galvanising steel, predominantly used in the construction and infrastructure sectors. HZL also produces Continuous Galvanizing Grade (CGG), EPG (Electro Plating Grade) and two grades of zinc for use in die-casting alloys. The Company is working closely with its customers to increase the proportion of value- added products (VAP) in its zinc portfolio. It strives to increase the supply of VAP to 25% of total zinc sales in FY2022, from 16% in FY2021.
Lead
Overview
Rising from the pandemic-induced stupor, sustained rally in base metals increased lead’s value by one-third from its low point, before sliding only a little at the end of the year. There has been a significant drawdown in concentrate stocks in 2020. This helped global primary refined lead
output to increase by 1% despite an 8% decrease in mine production.
Demand for lead acid batteries, which drive more than 80% demand for lead, was muted for Q1 due to the lockdown, but we witnessed a marginal improvement in the lead acid battery (LAB) segment, driven by the upsurge in aftermarket demand for replacement of old and discharged products. As per internal estimates, the LAB segment’s revenue was approximately ₹33,000 crore in FY2021, driven by an aftermarket volume growth of 14% in two-wheelers and 6% in other vehicular batteries.
Market drivers
Automotive original equipment is impacted in the short and medium term, although heightened replacement demand provided an effect offset; industrial batteries hold opportunities for growth, although motive power will be hit by reduced goods handling while global trade recovers, but stationary batteries have proved their strength for stand-by power and hold excellent prospects for future energy storage systems.
118
| < BACK TO CONTENTS | Integrated Report | Statutory reports | Financial statements |
Few key factors that could affect the lead markets in 2022 are:
The post-pandemic green energy transition and the push for EVs
Short-term demand
Elevated mine disruption
Smelter rationalisation
The Nordenham question
This is based on the base case assumption of rollout of vaccination programmes for COVID-19 which will bring the effects under control.
Products and customers
India’s refined lead market is about 1.1 mt, including both primary and secondary markets. The primary lead market, which is approximately 280 kt in size, remained stagnant in 2020. Vedanta has increased its domestic share in the primary market by 17% in Q3 & Q4 of FY2021. We expect to close at the same rate
and 85% of our production will be consumed by the domestic market and the rest will be exported to the South-East Asian market. Next year, we are expecting to increase our sales by 3-4% through new customer acquisition enabled by our e-commerce platform (Evolve), and by introducing lead alloys in our product portfolio. In the current year, a total of 38 new customers have been added through conventional and digital channels.
Silver
Overview
Silver recorded a sterling performance in FY2021. Silver capitalised on its ‘safe haven’ appeal in March and April; and subsequently was bolstered by growing industrial demand. Reaching a seven-year high in August of US$28.32 per ounce after sinking to an 11-year-low of US$11.59, highlights silver’s ability to outperform gold. From its lowest to highest point in 2020, silver price grew 137%, vis-à-vis gold’s 38%.
Market drivers
FY2022 is forecast to see a strong recovery, and the outlook beyond 2021 is promising as the Indian economy improves, coupled with rising consumer confidence and as the market increasingly embraces purer sterling silver jewellery.
With the onset of the COVID-19 pandemic, the market saw an increasing number of countries introduce accommodative monetary policies. This has helped drive down real interest rates and, together with a rotation in favour of safe-haven
assets, encouraged investors to buy into silver and other precious metals.
A bullish mood for silver has been witnessed in the opening weeks of 2021. In early February, a jump in retail investor appetite for silver, spurred on by social media platforms, pushed the price to an 8-year high of US$31.10, while the gold: silver ratio fell to 62, a 7-year low.
Going forward, the outlook for the silver price in remaining 2021 and FY2022 remains exceptionally encouraging and we expect silver to comfortably outperform gold this year, with silver demand forecast expected to rise by 11% in FY2022.
Products and customers
Hindustan Zinc is India’s only primary silver producer and ranks 6th globally among the top silver producing companies. Exclusively catering to the domestic market, HZL’s production is consumed by the industrial (electrical contacts, solder and alloys, and pharmaceuticals), jewellery and silverware sectors. Last year, the Company started spot sales of silver through an e-auction to reduce manual intervention, providing equal opportunity to all buyers to compete, while ensuring complete price transparency during the process.
VEDANTA LIMITED | INTEGRATED REPORT AND ANNUAL ACCOUNTS 2020-21 | 119
MANAGEMENT DISCUSSION AND ANALYSIS CONTINUED...
Oil and gas
Overview
The oil price war between Saudi Arabia and Russia during the height of the first virus wave in April 2020 triggered WTI oil futures to move into negative territory for the first time in the commodity’s history. The shift in position by Saudi Arabia and decisive action by OPEC and its allies ensured that oil prices not only bounced back to more ‘reasonable’ levels, but the price rebound was also durable. Production cuts were successful, with Brent Crude back above US$70 a barrel and WTI not far behind.
Market drivers
The oil market suffered a historic shock in CY2020, because of the pandemic-induced socio-economic crisis. However, there is room for relief as the contraction in the global economy in CY2020 has been restricted after the better-than- expected actual performance by key economies in H2 CY2020. Additional stimulus measures in the US and an accelerating recovery in Asian economies are expected to push oil demand further.
World oil demand in CY2020 shows a contraction of 9.6 mb/d, to stand at 90.4 mb/d. OECD oil demand contracted by 5.6 mb/d, while non-OECD demand declined by 4 mb/d. For 2021, world oil demand is expected to stand at 96.3 mb/d.
India is the world’s third largest oil consumer, the fourth largest refiner, and a net exporter of refined products. The country currently meets 84% of its oil consumption and 54% of its gas consumption through imports.
The Government of India aims to increase the share of natural gas in the country’s energy mix to 15% by 2030, from the current 6%. To improve energy security, the government has prioritised the reduction of oil and gas imports, increasing domestic upstream activities, diversifying its supply sources, and increasing Indian investments in overseas oil fields.
Vedanta has a world-class resource base, with 58 blocks in India. With a strengthened growth pipeline in exploration and development, the Company is well positioned to contribute significantly more to the country’s domestic crude oil production in the coming years.
Products and customers
Vedanta is the largest private sector producer of crude oil in India.
The Company’s crude is sold to hydrocarbon refineries and our natural gas is used by the fertiliser industry and the city gas sector in India.
Aluminium
Overview
India’s aluminium demand (Q1 & Q2 FY2021) remained muted following the COVID-induced lockdown. However, export demand (~50-55% of total primary aluminium production) remained robust. Domestic demand partially recovered in Q2, and exports improved marginally.
Imports declined 28%, adversely impacted by lower domestic demand in Q1. However, domestic demand
rebounded in September 2020 quarter, driven by strong demand from the auto segment and higher extrusion demand. After declining y-o-y for six consecutive months (March to August 2020) imports grew by 27.8%, 8.8% and 46.6% y-o-y in September and October and November 2020, respectively. This trend reflected a strong revival in domestic demand. The industry’s capacity utilisation rate dipped to 83% in the Q1FY2021. However, the utilisation rate improved to 86% in Q2, and reached pre-COVID level (93%) in the December 2020 quarter.
Market drivers
The long-term fundamentals of the Indian economy continue to be sound. The country’s market is likely to have robust growth, supported primarily by increased industrial activity and government focus on
infrastructure sector and domestic manufacturing in the country.
Several government initiatives like Aatmanirbhar Bharat, Make in India, Production Linked Incentive (PLI) for domestic manufacturing, National Infrastructure Pipeline and National Rail Plan have been rolled out by the Government of India. These tailwinds will help the economy recover faster in the coming quarters. Taking these macro drivers into cognizance, Vedanta continues to expand its value-added product portfolio in line with the evolving market demand.
Products and customers
With an annual installed capacity of 2.3 million tonnes, Vedanta is India’s largest primary aluminium producer. It leads the segment with a domestic market share of ~47% among Indian primary producers.
120
| < BACK TO CONTENTS | Integrated Report | Statutory reports | Financial statements |
Vedanta’s product portfolio includes aluminium ingots, primary foundry alloys, wire rods, billets, slabs, and rolled products. These products cater to varied industries globally such as power, transportation, construction & packaging to name a few. As much as 37% of Vedanta’s
total aluminium sales globally were high quality value-added products.
Our major focus area is the domestic market. In FY2021, domestic sales volume was marginally improved by ~1% y-o-y. The sales growth was bolstered by increased demand in the
electrical, construction & transport sectors. Value-added products accounted for ~60% of the domestic sales. Vedanta’s international sales volume increased by ~8% y-o-y to 1.36 million tonnes.
Power
Overview
India is the third largest electricity producer in the world. The electricity generation target for conventional sources for FY2021 has been fixed at 1,330 billion units (BU), 6.33% higher y-o-y. Between FY2016 and FY2019, the country’s electricity generation grew at
3% CAGR, driven by government initiatives and schemes to increase rural electrification and provide round-the-clock power supply.
Market drivers
India’s power demand is likely to touch 1894.70 TWh by FY2022 (7% CAGR) from 2007 baseline, driven predominantly by multiple factors (expansion in industrial activities, growing population, rising per capita income, policy support and increasing electricity penetration).
The Government of India and state governments have also been supportive of the growth in the power sector, delicensing the electrical machinery industry and allowing 100% Foreign Direct Investment (FDI). In addition, policy support (Saubhagya, IPDS, DDUGJY, UJALA, R-APDRP, UDAY, NIP, and many others) have provided much-needed impetus to the sector. The country’s power sector is likely to attract an investment of US$128.24 billion-US$135.37 billion between FY2019 and FY2023.
Energy sector projects accounted for the highest share (24%) in the US$1.4 trillion NIP between FY2020
and FY2025 (Source: Economic Survey). The Government of India has recently opened the coal sector for commercial mining, which is expected to ease any coal availability hassles.
As of February 2021, India had total installed capacity of 379 GW (379.130 GW), of which thermal constituted 233 GW, nuclear 7 GW, hydro 46 GW and renewables at 91 GW.
Vedanta’s power portfolio is well positioned to capitalise on India’s growing demand for power.
Products and customers
Vedanta Power business operates over 9 GW power portfolio in India. Of Vedanta’s power portfolio in Aluminium and Power business, 37% is used for commercial power while 63% is meant for captive use. The power generated for commercial purposes is backed by long-term Power Purchase Agreements with state distribution companies such as Punjab, Tamil Nadu, Kerala, Chhattisgarh, and Odisha.
VEDANTA LIMITED | INTEGRATED REPORT AND ANNUAL ACCOUNTS 2020-21 | 121
MANAGEMENT DISCUSSION AND ANALYSIS CONTINUED...
Iron ore
Overview
Karnataka’s iron ore industry remained subdued in Q1FY2020, as the demand remained tepid, and the utilisation level of dependent steel units was less than 50%. There was gradual improvement from the demand side in Q2 with relaxation of lockdown guidelines. This resulted in stable prices in Q2 vis-à-vis Q1, which was volatile because of uncertainties. The Q3 and Q4 were driven by strong demand from the steel market, clearly indicating market recovery. International
market prices remained robust throughout the year post market recovery in May 2020.
Market drivers
Iron ore prices are expected to stay high in 2021. The primary drivers of high iron ore prices are expected to hold throughout 2021. Although Vale has announced plans to expand its capacity significantly, much of the resulting output is not expected to reach seaborne markets for at least two to three years. BHP and Rio Tinto are bringing new mines to production in the Pilbara region of Western Australia, but much of the resulting output will substitute for depleting mines in the same area. Consequently, overall output growth is not expected to occur at a pace which reduces prices significantly.
A range of factors could put downward pressure on prices over the coming months. Some price falls are expected, as Vale’s Brazilian
operations steadily return to output levels prior to the January 2019 Brumadinho dam collapse. Overall, Brazilian output is expected to recover to normal levels by the end of 2021. Chinese government’s stimulus measures could also be phased down in the second half of 2021, reducing the imperative for rapid purchases of iron ore to meet production schedules and allowing some build-up of iron ore at ports.
Products and customers
Iron ore, a key ingredient in steelmaking, is used in the construction, infrastructure, and automotive sectors. Our iron ore mining operations ceased in Goa from March 2018, pursuant to the Supreme Court order. Meanwhile, the permitted mining capacity at Karnataka has recently been increased from the previous 4.5 million tonnes in FY2020 to 5.6 million tonnes.
Steel
Overview
India’s steel industry saw a sharp demand plunge after lockdowns disrupted economic activities globally. As it was gradually lifted,
steel demand began to rise. As construction activity returned to pre-COVID levels, the industry became bullish on steel price. Strong domestic demand, along with good exports, aided the steel industry’s production and sales growth in Q4 2020-21 sequentially. Revenues of steel companies improved (vis-à-vis FY2020) on higher realisation and rising demand, led by a recovery in capital expenditure of states, auto production, white goods production, and construction activity.
Market drivers
Global steel demand is expected to grow by 5-7% in CY2021. The demand from China will remain firm, owing to government-led infrastructure boost, particularly in railways and airports. Globally, a lower base and active initiatives for economic revival by governments will aid recovery of steel demand to 5-7% in CY2021.
122
| < BACK TO CONTENTS | Integrated Report | Statutory reports | Financial statements |
FY2022 will see a steel demand growth of 10-12% with infrastructure and housing as key drivers. The Union Budget 2021-22 provides a major boost to the infrastructure sector with high focus on developing highways and economic corridors. Some of the flagship corridors and important projects would see considerable activity from 2021-24 and is expected to create major steel demand in the country for the next 3-4 years. The robust demand forecast will aid domestic producers in increasing their capacity utilisation and expediting growth projects.
Infrastructure, which accounts for 25-30% of domestic demand, will see the government push to steer the economy back with expectations of 10-12% growth next year. However, a large part of this would be on the back of ongoing projects as new awarding remains lukewarm.
Auto production is expected to revive next year with forecasts of double-digit growth. This shall enable around 11% growth in
FY2022, even as volumes remain lower than FY2019 levels, implying a ~5% CAGR.
Products and customers
Vedanta completed the acquisition of Electrosteel Steels Limited (ESL), along with its integrated steel plant on June 4, 2018. ESL primarily caters to the construction, infrastructure, and automotive sectors in India, with its wire rod, TMT, and DI pipe products.
Copper
Overview
COVID-19 triggered a shutdown of copper mines in 2020, disrupting global production. The International Copper Study Group (ICSG) estimates that mine production contracted by 1% in the first nine months of 2020. This is because mine supply is largely concentrated in Latin America, a region hard-hit by the pandemic.
Despite temporary shutdowns copper prices recovered gradually and in Q4FY2021, three-month copper futures on the LME touched US$8,238 per tonne. Although a rebound in the US dollar has dented copper’s price rise, it enjoyed an explosive first week in 2021, as investors seemed optimistic about a vaccine-powered global economic recovery.
On the supply side, India faced a crunch in the availability of refined copper due to Vedanta’s Tuticorin smelter closure.
Market drivers
Copper consumption in India and China is expected to increase by 19% and 0.9%, respectively in CY2021. With manufacturing industries in both the countries ramping up production volumes following the easing of lockdown restrictions, copper consumption is set to rise.
India’s biggest consumption engine continues to be its burgeoning population (which is predominantly young) with growing disposable income, fast urbanisation, and availability of a wide range of financial services to the last-mile citizen. Growing electric vehicles market supported by government measures will further drive copper consumption.
Copper demand fundamentals in the last quarter of CY2020 were bolstered by developments around the vaccine rollout. On a positive note, manufacturing activity demonstrated resilience during
this period, amid a weak economic environment.
On the supply side in 2021, Chinese smelters remain strong, and copper commenced the year on a positive note with prices rallying to hit their highest level in eight years in early January. Due to the easing of lockdown restrictions around the world, an increasing trend is observed in smelter production in 2021.
Our ability to take advantage of these opportunities is largely dependent on the re-opening of our smelter at Tuticorin.
Products and customers
Refined copper is predominantly used in the manufacture of cables, transformers and motors as well as castings and alloy-based products. The Tuticorin smelter closure affected our production in India. We have produced 101 kt of cathode in FY2021.
VEDANTA LIMITED | INTEGRATED REPORT AND ANNUAL ACCOUNTS 2020-21 | 123
MANAGEMENT DISCUSSION AND ANALYSIS CONTINUED...
Finance review
Executive summary:
We had a strong operational and financial performance in FY2021 amidst the challenges faced due to the pandemic. The Company continues to focus on controllable factors such as resetting cost base through diverse cost optimisation initiatives, disciplined capital investments, working capital initiatives, marketing initiatives and volume with strong control measures to ensure safe operations across businesses within framed government and corporate guidelines amidst the pandemic.
In FY2021, we recorded an EBITDA of ₹27,341 crore, 30% higher y-o-y and robust adjusted EBITDA margin of 36%. (FY2020: ₹21,061 crore, margin 29%).
Higher sales volumes resulted in increase in EBITDA by ₹907 crore, driven by higher volumes at Zinc India, Iron ore, Aluminium and Steel business. However, this was partially offset by lower sales volume at Oil & Gas business and lower power sales at TSPL.
Market factors resulted in increase in EBITDA by ₹4,917 crore compared to FY2020. This was primarily driven by increase in the commodity prices, softening of input commodity prices, rupee depreciation, partially offset by lower brent realisation at Oil & Gas business and lower capex recovery at Oil & Gas business.
Gross debt as on 31 March 2021 was ₹57,028 crore, a decrease of ₹2,159 crore since 31 March 2020. This was mainly due to the repayment of debt at Vedanta Standalone, partially offset by increase in borrowing at Zinc India business and BALCO.
Net debt as on 31 March 2021 was ₹24,414 crore, increased by ₹2,988 crore since 31 March 2010 (FY2020: ₹21,426 crore), primarily driven by dividend payment during the year, inter-company loan(ICL) to VRL, increase in working capital, partially offset by strong cash flow from operations.
The balance sheet of Vedanta Limited continues to remain strong with cash and cash equivalents, of ₹32,614 crore and Net Debt to EBITDA ratio at 0.9x (FY2020: 1.0x)
Consolidated EBITDA
EBITDA increased by 30% in FY2021 to ₹27,341 crore. This was mainly driven by higher commodity prices, higher sales realisation from Iron ore and Steel business, increased volumes at Zinc India and Aluminium business, lower cost of production at Zinc, Aluminium and Oil & Gas business, and rupee depreciation, partially offset by lower brent realisation and lower cost recovery at Oil & Gas business.
| (₹ ‘crore, unless stated) | ||||||||||||
| Consolidated EBITDA | FY2021 | FY2020 | % change | |||||||||
Zinc | 12,431 | 9,094 | 37 | |||||||||
- India | 11,620 | 8,714 | 33 | |||||||||
- International | 811 | 380 | — | |||||||||
Oil & Gas | 3,206 | 7,271 | (56 | ) | ||||||||
Aluminium | 7,751 | 1,998 | — | |||||||||
Power | 1,407 | 1,649 | (15 | ) | ||||||||
Iron Ore | 1,804 | 878 | — | |||||||||
Steel | 871 | 588 | 48 | |||||||||
Copper India | (177 | ) | (300 | ) | — | |||||||
Others | 47 | (118 | ) | — | ||||||||
Total EBITDA | 27,341 | 21,061 | 30 | |||||||||
| (₹ crore unless stated) | ||||
EBITDA for FY2020 | 21,061 | |||
Market and regulatory: ₹ 4,917 crore a) Prices, premium / discount | 1,072 | |||
b) Direct raw material inflation | 1,646 | |||
c) Foreign exchange movement | 2,091 | |||
d) Profit petroleum to GOI at Oil & Gas | (636 | ) | ||
e) Regulatory changes | 744 | |||
Operational: ₹ 1,364 crore | ||||
f) Volume | 907 | |||
g) Cost and marketing | 1,243 | |||
h) Others | (786 | ) | ||
EBITDA for FY2021 | 27,341 | |||
124
| < BACK TO CONTENTS | Integrated Report | Statutory reports | Financial statements |
| a) | Prices, premium/discount |
Commodity price fluctuations have a significant impact on the Group’s business. During FY2021, we saw a net positive impact of ₹1,072 crore on EBITDA due to commodity price fluctuations.
Zinc, lead and silver: Average zinc LME prices during FY2021 marginally increased to US$2,422 per tonne, up 1% y-o-y; lead LME prices decreased to US$1,868 per tonne, down 4% y-o-y; and silver prices increased to US$22.9 per ounce, up 38% y-o-y. The cumulative impact of these price fluctuations increased EBITDA by ₹1,243 crore.
Aluminium: Average aluminium LME prices increased to US$1,805 per tonne in FY2021, up 3% y o y, this had a positive impact of ₹923 crore on EBITDA.
Oil & Gas: The average Brent price for the year was US$44.3 per barrel, lower by 27% compared with US$60.9 per barrel during FY2020. This had negative impact on EBITDA by ₹1,632 crore.
| b) | Direct raw material inflation |
Prices of key raw materials such as imported alumina, thermal coal, carbon and caustic have reduced significantly in FY2021, improving EBITDA by ₹1,646 crore, mainly at Aluminium and Zinc business.
| c) | Foreign exchange fluctuation |
INR and SA Rand depreciated against the US dollar during FY2021. Stronger dollar is favourable to the Group’s EBITDA, given the local cost base and predominantly US dollar-linked pricing. The favourable currency movements positively impacted EBITDA by ₹2,091 crore.
Key exchange rates against the US dollar:
| Average year ended | Average year ended | As at | As at | |||||||||||||||||
| 31 March 2021 | 31 March 2020 | % change | 31 March 2021 | 31 March 2020 | ||||||||||||||||
Indian rupee | 74.11 | 70.86 | 4.6 | 73.30 | 74.81 | |||||||||||||||
South African rand | 16.37 | 14.78 | 10.8 | 14.83 | 17.89 | |||||||||||||||
| d) | Profit petroleum to GOI at Oil & Gas |
The profit petroleum outflow to the Government of India (GOI), as per the production sharing contract (PSC), increased by ₹636 crore. The increase in outflow was primarily due to the lower recovery of capital expenditure in FY2021.
| e) | Regulatory |
During FY2021, changes in regulatory levies such as Renewable Power Obligation etc. had a cumulative positive impact on the Group EBITDA of ₹744 crore.
| f) | Volumes |
Higher volume led to increase in EBITDA by ₹907 crore by following businesses:
Zinc India (positive ₹1,170 crore)
Higher zinc & lead sales (higher by 6% and 20% respectively) & higher sliver sales (~25%), had a cumulative positive impact on EBITDA of ₹1,170 crore.
Oil & Gas (negative ₹499 crore)
Oil & Gas business achieved WI sales of 40.27 mmboe, down by 8% y-o-y. This had negative impact on EBITDA of ₹499 crore.
Iron Ore (positive ₹251 crore)
Sales volumes at iron ore business increased significantly having a positive impact on EBITDA of ₹251 crore.
Steel business (positive ₹28 crore)
ESL achieved metal sales of 1,231 KT, up 4% y-o-y. This sales volume increase had a positive impact on EBITDA of ₹28 crore.
Aluminium (positive ₹108 crore)
In FY2021, the Aluminium business achieved metal sales of 1.96 million tonnes, up 2% y-o-y. This volume increase had a positive impact on EBITDA of ₹108 crore.
| g) | Cost and marketing |
Improved costs resulted in an increase in EBITDA by ₹1,857 crore over FY2021, primarily due to improved cost at Aluminium business driven by better coal rate and mix and lower alumina imports. This was partially offset by lower premia realizations at Aluminium and Zinc business, impacting EBITDA negatively by ₹566 crore.
VEDANTA LIMITED | INTEGRATED REPORT AND ANNUAL ACCOUNTS 2020-21 | 125
MANAGEMENT DISCUSSION AND ANALYSIS CONTINUED...
| h) | Others |
This primarily includes the impact of past exploration cost recovery at Oil & Gas business during FY2020 and change in Profit Petroleum (PP) tranche partially offset by higher power EBITDA, inventory and foreign exchange adjustments, impacting EBITDA negatively by ₹786 crore.
Income statement
(₹ crore, unless stated) | ||||||||||||
| Particulars | FY 2021 | FY 2020 | % Change | |||||||||
Net Sales/Income from Operations | 86,863 | 83,545 | 4 | |||||||||
Other Operating Income | 1,158 | 902 | 28 | |||||||||
EBITDA | 27,341 | 21,061 | 30 | |||||||||
EBITDA margin1 (%) | 36 | % | 29 | % | — | |||||||
Finance Cost | 5,210 | 4,977 | 5 | |||||||||
Investment Income | 3,269 | 2,443 | 34 | |||||||||
Exchange Gain /(Loss) | 129 | (306 | ) | — | ||||||||
Profit before Depreciation and Taxes | 25,528 | 18,220 | 40 | |||||||||
Depreciation and Amortisation | 7,638 | 9,093 | (16 | ) | ||||||||
Profit before Exceptional items | 17,891 | 9,127 | 96 | |||||||||
Exceptional items2 : credit/(expense) | (678 | ) | (17,386 | ) | (96 | ) | ||||||
Taxes3 | 2,180 | (3,516 | ) | — | ||||||||
Profit after Taxes | 15,032 | (4,743 | ) | — | ||||||||
Profit after Taxes (before Exceptional Items) | 15,557 | 6,122 | — | |||||||||
Minority interest | 3,429 | 1,920 | 79 | |||||||||
Attributable PAT after exceptional items | 11,602 | (6,664 | ) | — | ||||||||
Attributable PAT (before exceptional items) | 12,151 | 3,995 | — | |||||||||
Basic earnings per share (₹/share) | 31.32 | (18.00 | ) | — | ||||||||
Basic EPS before exceptional items (₹/share) | 32.80 | 10.79 | — | |||||||||
Exchange Rate (₹/US$) - Average | 74.11 | 70.86 | 5 | |||||||||
Exchange Rate (₹/US$) - Closing | 73.30 | 74.81 | (2 | ) | ||||||||
| 1. | Excludes custom smelting at Copper India and Zinc India Operations |
| 2. | Exceptional Items gross of tax |
| 3. | Tax includes tax gain on exceptional items of ₹54 crore on special items in FY2021 (FY2020: tax gain of ₹6,521 crore) |
| 4. | Previous period figures have been regrouped/rearranged wherever necessary to conform to current period presentation |
REVENUE
Revenue for the year was ₹86,863 crore, higher 4% y-o-y. This was driven by higher commodity prices, higher volumes at Zinc India, Copper, Iron Ore and Aluminium business, inclusion of FACOR in FY2021, rupee depreciation, partially offset by lower power sales at TSPL, lower volume at Oil & Gas, Skorpion, and lower cost recovery in FY2021.
EBITDA AND EBITDA MARGIN
EBITDA for the year was ₹27,341 crore, 30% higher y-o-y. This was mainly on account of higher commodity prices, higher sales realisation at Steel and Iron ore business, higher volumes at Zinc India and Aluminium business, aided by cost reduction at Zinc, Aluminium and Oil & Gas business, higher RPO MTM gains at Aluminium business and rupee depreciation. This was partially offset by lower brent realisation and lower cost recovery in Oil & Gas business.
We maintained a robust adjusted EBITDA margin1 of 36% for the year (FY2020: 29%)
126
| < BACK TO CONTENTS | Integrated Report | Statutory reports | Financial statements |
DEPRECIATION AND AMORTISATIONS
Depreciation for the year was ₹7,638 crore compared to ₹9,093 crore in FY2020, lower by 16%, primarily on account of lower charge at Oil & Gas business due to impairment of asset in Q4 FY2020, and Skorpion mine put under maintenance and care at the start of the financial year.
NET INTEREST
The blended cost of borrowings was 7.7% for FY2021 compared to with 7.9% in FY2020.
Finance cost for FY2021 was ₹5,210 crore, 5% higher y-o-y compared to ₹4,977 crore in FY2020 mainly on account of increase in average borrowing, decrease in interest capitalisation at Aluminium and Oil & Gas business, partially offset by lower blended cost of borrowings.
Investment income for FY2021 stood at ₹3,269 crore, 34% higher y-o-y compared to ₹2,443 crore in FY 2020.This was mainly due to interest on the inter-company loan to VRL, partially offset by decrease in average investments and mark-to-market (MTM) movement at Zinc India.
EXCEPTIONAL ITEMS
The exceptional items for FY2021 was at ₹(678) crore, mainly on account of loss relating to certain items of capital work-in-progress (CWIP) at the Aluminium and Steel business, provision on receivables subject to litigation, revision of Renewable Purchase Obligation (RPO) pursuant to the Odisha Electricity Regulatory Commission notification, compliance cost for environment clearance at Steel business and settlement of structured investment.
[For more information, refer note [34] set out in P&L notes of the financial statement on exceptional items].
TAXATION
Tax expense for FY2021 stood at ₹2,180 crore (FY2020: credit of c. ₹3,516 crore). The normalised ETR for FY2021 is at 27% (excluding tax on exceptional items, tax on intra Group dividend and deferred tax asset of ₹3,111 crore recognised on losses in ESL) compared to 34% in FY2020, majorly on account of change in profit mix.
ATTRIBUTABLE PROFIT AFTER TAX (BEFORE EXCEPTIONAL ITEMS)
Attributable PAT before exceptional items was
₹12,151 crore in FY2021 compared to ₹3,995 in FY2020.
EARNINGS PER SHARE
Earnings per share before exceptional items for FY2021 were ₹32.80 per share as compared to ₹10.79 per share in FY2020.
DIVIDEND
Board has declared interim dividend of ₹9.50 per share during the year.
SHAREHOLDERS FUND
Total shareholders fund as on 31 March 2021 aggregated to ₹62,277 crore as compared to ₹54,635 crore as of 31 March 2020. This was primarily net profit attributable to equity holders earned during the year partially offset by dividend paid during the year.
NET FIXED ASSETS
The net fixed assets as on 31 March 2021 were ₹106,784 crore. This comprises of ₹13,880 crore as capital work-in-progress as on 31 March 2021.
BALANCE SHEET
Our financial position remains strong with cash and liquid investments of ₹32,614 crore.
The Company follows a Board approved investment policy and invests in high quality debt instruments with mutual funds, bonds and fixed deposits with banks. The portfolio is rated by CRISIL which has assigned a rating of “Tier I” (meaning highest safety) to our portfolio Further, the Company has undrawn fund based committed facilities of ₹7,800 crore as on 31 March 2021.
Gross debt as on 31 March 2021 was ₹57,028 crore, a decrease of ₹2,159 crore since 31 March 2020. This was mainly due to the repayment of debt at Vedanta Standalone partially offset by increase in borrowing at Zinc India business and BALCO.
Gross Debt comprises term debt of ₹53,000 crore and short-term working capital loans of ₹4,000 crore. The loan in INR currency is 89% and balance 11% in foreign currency. Average debt maturity of term debt is c. 3.2 years as of 31 March 2021.
CRISIL and India Ratings revised the rating of Vedanta from AA to AA- with Stable outlook in FY2021.
VEDANTA LIMITED | INTEGRATED REPORT AND ANNUAL ACCOUNTS 2020-21 | 127
MANAGEMENT DISCUSSION AND ANALYSIS CONTINUED...
Operational review
Zinc India
THE YEAR IN BRIEF
Our mine production gradually improved during the year with ore production for the full year, up by 7% y-o-y, to deliver a record production of 15.5 million tonnes. This was supported by robust production growth at Zawar mines and Rampura Agucha mine, up by 21% and 9%, respectively. Our operations were halted on account of the pandemic-induced lockdown from 22 March 2020 onwards, impacting 3-4 weeks of equivalent production. Mined metal production was up by 6% y-o-y to 972 kt, primarily on account of higher ore production, with overall grades remaining at the same levels.
128
| < BACK TO CONTENTS | Integrated Report | Statutory reports | Financial statements |
OCCUPATIONAL HEALTH & SAFETY
Lost time injury frequency rate (LTIFR) for the last quarter was
0.92 vis-à-vis 1.23 in Q4FY21, driven by several safety awareness, investigation and prevention initiatives. Compared to a year ago, the number of LTIs declined from 18 to 13 in the fourth quarter. LTIFR for the year was 0.98 (total 51 LTIs). There has been greater management focus to bring a cultural shift via felt leadership programmes, safety town halls, enabling tools such as safety whistle-blower as well as reward and recognition for near-miss reporting.
In view of the COVID-19 health emergency, an advisory was issued for the precautionary measures, along with awareness campaigns and drive for disinfecting facilities across the Company. The Company’s operations were halted during the lockdown and employees were asked to work from home barring some employees, who attended call for duty to keep production assets safe. To ensure business continuity, a committee of COVID-19 Response ‘War Room’ was organised to identify and implement urgent business decisions. We also engaged the Self-Help Group (SHG) women in our communities to stitch and distribute cloth masks among the villagers, police and administration officials. Our teams also worked with the civil administration to ensure that food reached the vulnerable population.
During the year we commissioned an underground Occupational Health Centre at Rampura Agucha Mine which significantly improves the response time in emergency cases. Senior management visits to shop floors and Gemba walks at contractor operated sites reiterated the focus on felt leadership in the organisation. ‘Sameeksha’ was conducted with six business partners to discuss the details of their serious LTI with CEO, HZL chairing the session.
ENVIRONMENT
Zinc India was certified as 2.41x water positive company, defined as a ratio of Water Credit and Water Debit. The assessment was carried by DNV GL, a globally renowned risk management and quality assurance company. Initiatives like rainwater harvesting, recharge to ground water and use of treated sewage water have enabled us to achieve this distinction.
Zinc India management has finalised Sustainability Goals 2025 by undertaking the following targets:
Zero work-related fatalities and 50% reduction in TRIFR
Achieve 0.5 million tonnes of CO2e GHG emission savings in our operations from the base year 2017
Become a 5x water positive company and achieve 25% reduction in fresh-water consumption
Achieve 3x increase in gainful utilisation of smelting process waste
Protecting and enhancing biodiversity throughout the life cycle Positively impacting 1 million lives through social, economic and environmental outcomes
Inclusive and diverse workplace with 30% diversity
100% responsible sourcing in supply chain
VEDANTA LIMITED | INTEGRATED REPORT AND ANNUAL ACCOUNTS 2020-21 | 129
MANAGEMENT DISCUSSION AND ANALYSIS CONTINUED
Operational review
Zinc India
Zinc India’s 22 MW solar power project at RAM was registered under the Gold Standard during the year. DSC Zinc successfully commissioned a 4,500 mtpa FPT (Freeze Precipitation Technology) plant to recover sodium sulphate from the final multi-stage RO rejects which will cater to 1/3rd of DSC Hydro smelter’s input salt requirements to support our circular economy goal. The CPP Team conducted an innovative in- house recycling of the bottom ash to convert it into fly ash (saleable product) improving value realisation and lowering the environment footprint. Zinc India’s Udaipur Sewage Treatment Plants expanded to 55 MLD, translating into over 90% treatment of the city’s sewage.
Zinc India led an endorsement for ‘UNGC (United Nations Global Compact) CEO Water Mandate’ giving our commitment towards water stewardship and initiating our journey to follow the six principles laid out by UNGC. As part of our commitment towards biodiversity conservation, the Company is now a member of IUCN ‘Leader for Nature India’ initiative. HZL actively participated in the 3rd meeting of ‘Business Leaders Group COP26’ and actively engaged in shaping the agenda for COP26, to be held at Glasgow (UK) in November 2021.
Our sustainability initiatives received several endorsements during the year including the selection in ‘Sustainability Yearbook 2021’ as Member for the fourth consecutive year, Supplier Engagement Rating ‘A’ received from CDP, first position in the Asia Pacific region in metal and mining sector in Dow Jones Sustainability Indices and 7th Globally and CII-ITC Corporate Excellence Sustainability Award 2020. Zinc India (HZL) was featured among the first Indian companies to be featured in CDP India Annual Report and was rated ‘A’ in Climate Change CDP 2020. Hindustan Zinc is the first company in India to respond to CDP’s Forests questionnaire.
PRODUCTION PERFORMANCE
Production (kt) | FY2021 | FY2020 | % change | |||||||||
Total mined metal | 972 | 917 | 6 | |||||||||
Refinery metal production | 930 | 870 | 7 | |||||||||
Refined zinc – integrated | 715 | 688 | 4 | |||||||||
Refined lead – integrated1 | 214 | 182 | 18 | |||||||||
Production – silver (in tonnes)2 | 706 | 610 | 16 | |||||||||
| 1. | Excluding captive consumption of 6,424 tonnes in FY2021 vs. 7,088 tonnes in FY2020. |
| 2. | Excluding captive consumption of 34.6 tonnes in FY2021 vs. 36.7 tonnes in FY2020. |
OPERATIONS
For the full-year, ore production was up 7% y-o-y to 15.5 million tonnes on account of strong production growth at Rampura Agucha and Zawar mines, which were up by 9% and 21% respectively. Zinc India’s mined metal production for FY2021 was 971,976 tonnes compared to 917,101 tonnes in the previous year in line with higher ore production. For the full year, metal production was up 7% to 930 kt in line with higher MIC availability, while silver production strengthened by 16% to a record 706 mt in line with higher lead production and better grades at SK. These record numbers were delivered despite losing 3-4 weeks equivalent of production days in the year due to COVID induced disruptions.
130
| < BACK TO CONTENTS | Integrated Report | Statutory reports | Financial statements |
PRICES
| Particulars | FY2021 | FY2020 | % change | |||||||||
Average zinc LME cash settlement prices US$ per tonne | 2,422 | 2,402 | 1 | |||||||||
Average lead LME cash settlement prices US$ per tonne | 1,868 | 1,952 | (4 | ) | ||||||||
Average silver prices US$/ ounce | 22.9 | 16.5 | 38 | |||||||||
LME Zinc prices averaged US$2,750 per mt in Q4FY21, up 29% y-o-y and 5% q-o-q. Investor interests in base metals is set to be sustained with the roll out of vaccination programmes globally. The recovery in international trade has not been uniform. In comparison to December 2020, the bulk of the growth can be attributed to the growth of imports and exports in China and developed Asian nations. There was marginal growth from the European Union and the rest of Asia, and a modest decline for the US and UK. Wood Mackenzie estimates zinc LME prices to average US$2,800 per mt in 2021.
The ongoing vaccination programmes and relatively better manufacturing activity are providing positive cues to investors. As for the premiums in South East Asia, a combination of improving demand and smelters directing shipments to China have tightened the market, helping premiums to shift to the upper end of a US$90-110 per tonne range. Global exchange stocks ended at 389 kt in March, marginally higher than in February, but remain at 10 days in terms of days of global consumption.
ZINC DEMAND - SUPPLY
| Zinc Global | CY | CY | CY | |||||||||
Balance In kt | 2019 | 2020 | 2021 E | |||||||||
Mine | 13,363 | 12,491 | 13,171 | |||||||||
Production | ||||||||||||
Smelter | 13,601 | 13,731 | 13,938 | |||||||||
Production | ||||||||||||
Consumption | 13.924 | 13,228 | 13,755 | |||||||||
Source: Wood Mackenzie, March STO |
| |||||||||||
Last year, the largest supply changes were attributed to Chinese mines, primarily from Inner Mongolia, Hunan and Sichuan. This reflects the poor performance of the small mine sector, where several mines in these provinces failed to restart. Hunan was most affected. The 2021 global mine production estimate of Wood Mackenzie is 13.2 mt, a 5.47% increase vis-à-vis 2020. The Chinese spot TCs declined from US$85 in December to US$70 in March in favour of miners.
After hitting a low of 27.4 in April 2020, the manufacturing Purchasing Managers Index (PMI) hit 54.6 in September and has averaged 57 in the four months through to February 2021. This is pointing to a robust pace of expansion for the country’s manufacturing sector. The strength of the rebound in activity has driven a rapid recovery in the
Indian steel production with crude steel production hitting 9.7 mt in December, its highest since the record high of just over 10 Mt in March 2019. With India’s economic growth entering positive territory, the strong performance of India’s steel sector seen in the latter part of 2020 should be sustained into 2021.
UNIT COSTS
Particulars | FY2021 | FY2020 | % change | |||||||
Unit costs (US$ per tonne) Zinc(including royalty) | 1,286 | 1,371 | (6 | ) | ||||||
Zinc (excluding royalty) | 954 | 1,047 | (9 | ) | ||||||
For the full year, zinc COP excluding royalty was US$954, lower by 9% y-o-y. The COP decrease reflects lower spend on consumables, lower coal and coke consumption, digitisation led operational efficiency, which was partly offset by higher R&M expense, other mining and manufacturing expenses.
VEDANTA LIMITED | INTEGRATED REPORT AND ANNUAL ACCOUNTS 2020-21 | 131
MANAGEMENT DISCUSSION AND ANALYSIS CONTINUED...
Operational review
Zinc India
FINANCIAL PERFORMANCE
| (₹crore, unless stated) | ||||||||||||
| Particulars | FY2021 | FY2020 | % change | |||||||||
Revenue | 21,932 | 18,159 | 21 | |||||||||
EBITDA | 11,620 | 8,714 | 33 | |||||||||
EBITDA margin (%) | 53 | % | 48 | % | — | |||||||
Revenue from operations for the year was ₹21,932 crore, up 21% y-o-y, primarily on account of higher metal production partly offset by lower sulphuric acid and lower domestic sales of zinc.
EBITDA in FY2021 increased to ₹11,620 crore, up 33% y-o-y. The increase was primarily driven by higher revenue and lower cost of production.
PROJECTS
We commissioned a 10 MLD STP plant in Udaipur and another 5 MLD STP (Sewage Treatment Plant) is in its last leg of commissioning, which will take the total STP capacity set up by us to 60 MLD. This will treat almost the entire sewage of Udaipur city and the recycled water will be used by our plants, significantly reducing our freshwater intake.
During the year, our graphite floatation system was commissioned at Mill 3 of Sindesar Khurd Mines, which will enhance the smelter throughput and bolster recovery.
During the quarter, backfill plants were commissioned at Zawarmala and Mochia mines. These plants will derisk operations and provide an opportunity to mine left-out high- grade ore in pillars. On similar lines, we have also commenced activities for a combined paste-fill and dry tailing plant at Rajpura Dariba. This will help increase ore production
from 1.2 mtpa to 2 mtpa; also facilitating additional utilisation of tails by ~20% for back filling and will reduce stope turnaround time.
The development of North Decline (ND1) was completed at Rampura Agucha (RA) mine. This improves the accessibility of the shaft section, alternate emergency evacuation, ease in mine equipment deployment at lower mine levels, face charging with emulsion explosives, face drilling with long feed jumbo, and so on.
We have commenced operations in RKD circuit (component of overall Fumer project) to treat Raw Zinc Oxide (RZO). COVID-19 restrictions including stringent visa guidelines for Chinese nationals continued during the year, which resulted in delay in commissioning of Fumer plant at Chanderiya. We are following up with government authorities to find a solution. Two back-fill plants in Zawar were also commissioned during the year.
132
| < BACK TO CONTENTS | Integrated Report | Statutory reports | Financial statements |
EXPLORATION
The Company has put in place an aggressive exploration programme focusing on delineating and upgrading Reserves and Resources (R&R) within its licence areas. Technology adoption and innovation play a key role in enhancing exploration success.
The Company’s deposits remain ‘open’ and exploration identified a number of new targets for mining leases with the potential to increase R&R over the next 12 months. Across all the sites, the Company increased its surface drilling to assist in upgrading resources to reserves. In line with previous years, the mineral resource is reported on an exclusive basis to the Ore Reserve and all statements have been independently audited by SRK (UK).
Total Ore Reserves increased significantly from 114.7 million tonnes at the end of FY2020 to 150.3 million tonnes at the end of FY2021 due to heightened focus on resource to reserve conversion during the year. Exclusive Mineral Resource totalled 297.6 million tonnes. Total R&R increased to 448 million tonnes as we added more resource than that was consumed during the year.
Total contained metal in Ore Reserves is 9.16 million tonnes of zinc, 2.55 million tonnes of lead and 295.5 million ounces of silver and the Mineral Resource contains 14.9 million tonnes of zinc, 6.3 million tonnes of lead and 618.7 million ounces of silver. At current mining rates, the R&R underpins metal production for more than 25 years.
STRATEGIC PRIORITIES & OUTLOOK
Our primary objective remains to concentrate on enhancing overall output, cost efficiency of our operations and disciplined capital expenditure. While the current economic environment remains uncertain, our goals over the medium term are unchanged.
Our key strategic priorities include:
Further ramp-up of underground mines towards their design capacity, deliver increased silver output in line with communicated strategy
Sustain cost of production to below US$1,000 per tonne through efficient ore hauling, higher volume and grades and incremental productivity through ongoing efforts in automation and digitisation
Disciplined capital investments in minor metal recovery to enhance profitability
Increase R&R through higher exploration activity and new mining tenements, as well as upgradation of resource to reserve
VEDANTA LIMITED | INTEGRATED REPORT AND ANNUAL ACCOUNTS 2020-21 | 133
MANAGEMENT DISCUSSION AND ANALYSIS CONTINUED...
Operational review
Zinc International
THE YEAR IN BRIEF
During FY2021, Zinc International continued to ramp up production from its flagship project Gamsberg mine and achieved production of 145 kt. Several best demonstrated performances on throughput, milled tonnes and improved recoveries were achieved in Q4FY21.
Black Mountain continued to have a stable production of 58 kt, slightly lower than FY2020 due to lower head grades and mining challenges due to unplanned equipment breakdowns. A new product line of recovering magnetite from tailings was established in FY2021.
In spite of COVID-19, robust mitigation measures were put in place to ensure minimal impact on production.
Skorpion Zinc has been under Care and Maintenance since the start of May 2020, following cessation of mining activities due to geotechnical instabilities in the open pit. Activities to restart the mine are progressing well.
Significant reduction in cost was achieved in FY2021 through increased volumes, cost containment measures, consumption efficiencies and exchange rate depreciation.
134
| < BACK TO CONTENTS | Integrated Report | Statutory reports | Financial statements |
SAFETY
Gamsberg mine recorded a slope failure in the South Pit on 17 November 2020. One fatality was recorded and efforts to locate the one missing employee of our business partner remains a priority. A dedicated team has been constituted to undertake the recovery efforts. Gamsberg LTIFR improved from 1.10 in FY2020 to 1.08 in FY2021.
Black Mountain Mine had a fatality free year and saw a reduction in high potential risk incidents. Employee engagement is integral to our safety strategy and both Visible Felt Leadership Interactions and Planned Task Observations are conducted regularly by leaders and front-line supervisors to coach and address behavioural issues.
Both Black Mountain and Gamsberg Mines are embarking on a Critical Control Management programme to ensure that all the fatal risk protocols are in place and understood by all the employees.
Leadership remains key to the success of our safety improvement programme. Our leaders have recently undergone legal compliance training and plans are in place to provide risk-management training and improve risk management interventions and decision-making.
0.65 m3/tonne
Water consumption at
Gamsberg, Zinc International
OCCUPATIONAL HEALTH
At Vedanta Zinc International, we take the health and safety of our employees and stakeholders very seriously and we remain committed to communicating timely and transparently to all stakeholders. Since the outbreak of the pandemic, we have recorded 227 positive cases, 222 recoveries, 3 active cases and 2 deceased. We have put stringent protocols to mitigate the spread and we have rolled out awareness initiatives to assist communities in which we operate.
Airborne particulate management remains a key focus in reducing lead and silica dust exposures of employees. Black Mountain Mine has reduced blood lead withdrawals from 12 in FY2020 to 6 in FY2021. As a part of our Employee Wellness Programme, we are focusing on increased participation of employees and communities in VCT for AIDS / HIV, blood donation and wellness; 2,172 employees were screened for tuberculosis during the year.
VEDANTA LIMITED | INTEGRATED REPORT AND ANNUAL ACCOUNTS 2020-21 | 135
MANAGEMENT DISCUSSION AND ANALYSIS CONTINUED...
Operational review
Zinc International
ENVIRONMENT
Gamsberg successfully reduced water consumption in the plant to 0.65 m3/tonne and reduced the levels of the Tailings Storage Facility return water dam to prevent future overflows from the dam. During a recent ISO 14001; 2015 recertification, audit Black Mountain Mining successfully retained the certification with no major non-conformances.
The draft Gamsberg Nature Reserve Strategic Management Plan has been prepared and submitted for public comments. The final Management Plan will be submitted to MEC for approval. BMM is in negotiations to secure additional farms to be included in the Gamsberg Nature Reserve to ensure compliance to the Biodiversity Offset Agreement.
PRODUCTION PERFORMANCE
Particulars | FY2021 | FY2020 | % change | |||||||||
Total production (kt) | 203 | 240 | (16 | ) | ||||||||
Production–mined metal (kt) | ||||||||||||
BMM | 58 | 66 | (12 | ) | ||||||||
Gamsberg | 145 | 108 | 34 | |||||||||
Refined metal | - | * | 67 | — | ||||||||
Skorpion | ||||||||||||
| * | Skorpion produced 0.6 kt in April 2020 before moving into Care and Maintenance for the rest of the year |
OPERATIONS
During FY2021, our total production stood at 203,000 tonnes, 16% lower y-o-y. This was primarily due to Skorpion Zinc going into Care and Maintenance, and BMM mining challenges which were partly offset by higher production at Gamsberg.
At BMM, production was 58,000 tonnes, 12% lower y-o-y. This was mainly due to lower grade of lead (2.3% vs 2.9%) and hence lead lower recoveries (84.1% vs 85.6%) and 6% lower throughput resulting from lower mining performance.
Gamsberg’s production was at 1,45,000 tonnes as the operation continues to ramp up with improved performance every quarter – Q1 FY2021 at 25,000 tonnes, Q2 at 35,000 tonnes, Q3 at 43,000 tonnes and Q4 at 41,000 tonnes (Q4 FY21 performance slightly impacted by lower mine grades). Our plant operations were partially impacted in November due to the slope failure incident. While mining only started in phases in December and January 2021, plant continued to run on healthy ROM stockpile.
At Skorpion Zinc, engagement with technical experts to explore opportunities of safely extracting the remaining ore is ongoing. The pit optimisation work is complete. The business is currently evaluating options to restart mining. Further there is significant progress made to make the Skorpion Refinery Conversion Project economically feasible. Previously completed feasibility study is being updated. We target to start the on-ground execution by H1 FY2022.
At both BMM and Gamsberg, production was also slightly impacted by the COVD-19 lockdown during Q1FY21.
UNIT COSTS
Particulars | FY2021 | FY2020 | % change | |||||||
Zinc (US$ per tonne) unit cost | 1,307 | 1,665 | (22 | ) | ||||||
The unit cost of production decreased by 22% to US$1,307 per tonne, from US$1,665 per tonne in the previous year. This was mainly driven by the Company’s strong focus to reduce the cost, along with reduction through higher production at Gamsberg, local currency depreciation, optimising consumables usage, higher copper credit offset by higher TCRCs and annual inflation.
FINANCIAL PERFORMANCE
| (₹crore, unless stated) | ||||||||||
Particulars | FY2021 | FY2020 | % change | |||||||
Revenue | 2,729 | 3,128 | (13 | ) | ||||||
EBITDA | 811 | 380 | — | |||||||
EBITDA margin | 30% | 12 | % | — | ||||||
During the year, revenue decreased by 13% to ₹2,729 crore, driven by lower volumes compared to FY2020 due to Skorpion Zinc going under Care and Maintenance, partially offset by higher price realisations. EBITDA increased significantly to ₹811 crore, from ₹380 crore in FY2020 mainly on account of higher price realisation and improved cost.
136
| < BACK TO CONTENTS | Integrated Report | Statutory reports | Financial statements |
PROJECTS
Refinery conversion – A substantial progress has been made on Skorpion Zinc Refinery conversion project with the FEED completion, feasibility study, tendering activities and techno-commercial adjudication. All regulatory approval is in place to start project execution. Previously completed feasibility study is being updated. With power tariffs being very critical for the viability of the project, discussions are ongoing with the state power utility and the option of renewable power is also being explored. We can start the on- ground execution by H1 2022 subject to the confirmation of power tariff and approval from the Board.
Swartberg Phase 2 – Based on the completed feasibility study, the finalised mine design and environmental authorisation has been received in Q3FY21. Based on the proposed integration schedule with BMM, the underground operations project is planned to be executed in FY2023.
Gamsberg Phase 2-54 mt reserves have been added post completion of feasibility study for expansion which can result in additional 200 ktpa MIC production over and above current production. The mine design and the new reserve statement was completed with the Resource to Reserve conversion as scheduled. The project is currently split into two distinctive sections, one focused on increasing the mining to 9 mtpa and the second focused on construction of a duplicate concentrator plant, effectively doubling the capacity.
Gamsberg Smelter – We have received the environmental approval for bulk water pipeline construction and outcome of ESIA for Gamsberg Smelter is also expected in April 2021. The SEZ application process has progressed well. We are engaging with the Government of South Africa on critical success factors like SEZ, power price, sulphuric acid offtake, logistics infrastructure and other regulatory approvals.
Black Mountain Magnetite project –
This is a project to recover iron ore/ magnetite from the BMM tailings. The feasibility was completed and pilot plant of 60 ktpa capacity was started in Q4FY21. To fast track the project and take advantage of the current favourable market conditions a quick start modular 0.7 mtpa plant was decided, based on treating current fresh tailings. This project will be put up for approval to start the execution in H1 FY2022 with target of completion by end of FY2022.
EXPLORATION
Certified Mineral Reserves and Resources at Zinc International increased by 8% to 566.4 mt containing 30.3 mt of metal. Gross additions to reserves and resources, after depletion, amounted to 41.3 mt of ore and 1.8 mt of metal. Despite depletion, reserve levels were successfully maintained at the same level as 2020, and amounted to 139.7 mt containing 8.3 mt of metal. The most significant contributor to the addition of metal in resources was the declaration of a maiden resource at Gamsberg South (23.2 mt @ 7.1% Zn and 0.6% Pb).
STRATEGIC PRIORITIES & OUTLOOK
Zinc International continues to remain focused to improve its production by sweating its current
assets beyond its design capacity, debottlenecking the existing capacity, and adding capacity through growth projects.
Our priority is to ramp up the performance of our Gamsberg Plant at designed capacity and simultaneously develop the debottlenecking plan to increase plant capacity by 10% to 4.4 mt ore throughput. Likewise, BMM continues to deliver stable production performance and the focus is to debottleneck its ore volumes from 1.6 mt to 1.8 mt.
Skorpion is expected to remain in ‘Care and Maintenance’ for H1 FY2022, while the management is assessing feasible and safe mining methods to extract ore from pit 112. Zinc International continues to drive the cost reduction programme to place Gamsberg operations on the 1st quartile of global cost curve with the production cost less than US$1,000 per tonne.
Additionally, core growth strategic priorities include:
Complete approval process and commence project activities of Skorpion Refinery Conversion Project and Magnetite Project in FY2022
Continue to improvise business case of Gamsberg Phase II and Gamsberg Smelter Project through government intervention, capex and opex reduction
VEDANTA LIMITED | INTEGRATED REPORT AND ANNUAL ACCOUNTS 2020-21 | 137
MANAGEMENT DISCUSSION AND ANALYSIS CONTINUED...
Operational review
Oil & Gas
THE YEAR IN BRIEF
During FY2021, Oil & Gas business delivered gross operated production of 162 kboepd, lower by 6% y-o-y. This was mainly due to delay in execution of growth projects owing to the implementation of nationwide lockdown imposed by the Government of India to curb the spread of COVID-19 and natural reservoir decline at the MBA fields.
The decline was partially offset by the addition of wells brought online as a part of Mangala Infill, MPT Upgrade, Aishwarya and Bhagyam Polymer and ABH. Business continues to drive all efforts towards volume growth through capacity additions, new wells and surface facilities. During FY2021, 74 wells were hooked up across all assets.
In OALP blocks, the initial phase of seismic acquisition programme has been completed in Assam, Cambay, Rajasthan and Offshore GS-GK region. Second phase is ongoing in Rajasthan and Cambay.
Early drilling opportunities have been identified based on reprocessing and interpretation of vintage data in Rajasthan, Assam and Cambay regions. First well KW-2-Udip has been drilled in Rajasthan. Drilling and related preparation activities are ongoing in Cambay and the North East.
138
| < BACK TO CONTENTS | Integrated Report | Statutory reports | Financial statements |
OCCUPATIONAL HEALTH & SAFETY
There are six lost time injuries (LTIs) in FY2021. The frequency rate stood at 0.16 per million- man hours (FY2020: 0.3 per million-man hours) amidst increased development activities. Unfortunately, there was also a fatality in one of the projects during the FY2021.
Our focus remains on strengthening our safety philosophy and management systems. We were recognised with awards conferred by external bodies:
Leaders Award in Sustainability 4.0 Award 2020 jointly instituted by Frost & Sullivan and TERI under Mega Large Business, Process Sector
‘Sword of Honour’ and ‘5 Star’ by British Safety Council for excellence in HSE Management for Pipeline Operation CII National Award for Excellence in Water Management 2020’ ‘within fence’ category and noteworthy contribution under
‘CII National Award for Excellence in Water Management 2020’ ‘beyond fence category
Cairn Oil & Gas has taken various initiatives to prevent exposure to COVID-19:
Awareness on COVID-19 based on MOHFW (Ministry of Health and Family Welfare), ICMR (Indian Council of Medical Research) and National Disaster Management Guidelines
Tied up with Apollo and Mahatma Gandhi Hospital, Jaipur for handling of COVID patients Established Apollo Telemedicine
Centre in Barmer and ‘Isolation / Quarantine Accommodation’ at camp sites
Weekly Health Awareness Sessions by Specialists from various prestigious hospitals
SOPs for travel, office duty, construction & operations and COVID-19 test requirement
Daily Health Monitoring of Personnel on parameters - temperature, cold and cough
Launched ‘Your Dost’, an Online Emotional Wellness Platform providing 24x7 guidance from 900+ experts
VEDANTA LIMITED | INTEGRATED REPORT AND ANNUAL ACCOUNTS 2020-21 | 139
MANAGEMENT DISCUSSION AND ANALYSIS CONTINUED...
Operational review
Oil & Gas
ENVIRONMENT
Our Oil & Gas business is committed to protect the environment, minimise resource consumption and drive towards our goal of ‘zero discharge’. We have secured first runner-up position in Jury Special Mention Award on ‘Recycling of Produced Water for
Injection Purpose’ under Sustainability 4.0 Award 2020 jointly instituted by Frost & Sullivan and TERI.
Highlights for FY2021 are:
Recycling and reusing of produced water resulting in reduced water abstraction: 99.55% at Mangala, Bhagyam and Aishwariya
Natural gas was adopted at Raageshwari Gas Terminal for power generation, eliminating the flaring of gas and reduction in GHG emissions
Waste oil disposal to registered recyclers: 6,390 bbls in FY2021
Energy conservation by the replacement of conventional lights with energy-efficient lightings (LED): ~150,000 units in FY2021
Commissioning of GEG’s at Rajasthan North field for power generation, reduction in GHG emissions of ~9,200 tons of CO2e/annum
Biodiversity Conservation:
| • | Conservation and proliferation of indigenous species: ~1,500 seed balls and 10,000 saplings of indigenous species developed at Mangala Processing Terminal |
| • | Carbon sequestration—plantation in Ravva field: ~17,959 tons of CO2e |
| • | Conservation of Fishing Cat at Coringa Wildlife Sanctuary at Godavari delta. MoU signed with Andhra Pradesh Forest Department and Wildlife Institute of India |
| • | Published ‘Know your Flora-A Glimpse of Thar Ecosystem’, capturing information about 57 local floral species (26 trees, 17 shrubs and 14 herbs) growing in the vicinity of Rajasthan |
PRODUCTION PERFORMANCE
| Unit | FY2021 | FY2020 | % change | |||||||||||
Gross operated production | Boepd | 162,104 | 172,971 | (6 | ) | |||||||||
Rajasthan | Boepd | 132,599 | 144,260 | (8 | ) | |||||||||
Ravva | Boepd | 19,177 | 14,232 | 35 | ||||||||||
Cambay | Boepd | 10,329 | 14,479 | (29 | ) | |||||||||
Oil | Bopd | 140,353 | 154,677 | (9 | ) | |||||||||
Gas | Mmscfd | 130.5 | 109.8 | 19 | ||||||||||
Net production – working interest | Boepd | 101,706 | 110,459 | (8 | ) | |||||||||
Oil* | Bopd | 88,923 | 99,709 | (11 | ) | |||||||||
Gas | Mmscfd | 76.7 | 64.5 | 19 | ||||||||||
Gross operated production | Mmboe | 59.2 | 63.3 | (7 | ) | |||||||||
Net production – working interest | Mmboe | 37.1 | 40.4 | (8 | ) | |||||||||
| * | Includes net production of 441 boepd in FY2021 and 483 boepd in FY2020 from KG-ONN block, which is operated by ONGC. Cairn holds a 49% stake. |
OPERATIONS
Average gross operated production across our assets was 6% lower y-o-y at 162,104 boepd. The Company’s production from the Rajasthan block was 132,599 boepd, 8% lower y-o-y. The decrease was primarily due to the delay in execution of growth projects due to COVID-19 restrictions and natural reservoir decline at the MBA fields. The decline was partially offset by the addition of wells brought online as a part of Mangala Infill, MPT Upgrade, Aishwarya and Bhagyam Polymer and ABH. Production from the offshore assets, was at 29,505 boepd, 3% higher y-o-y, supported by
production from new wells drilled through Ravva drilling campaign and production optimisation activities.
The production details by block are summarised below.
Rajasthan block
Gross production from the Rajasthan block averaged 132,599 boepd, 8% lower y-o-y. This decrease was primarily due to the delay in execution of growth projects due to implementation of the nationwide lockdown imposed by the Government of India to curb the spread of COVID-19 and natural reservoir decline at the MBA fields.
140
| < BACK TO CONTENTS | Integrated Report | Statutory reports | Financial statements |
As part of the growth projects in Rajasthan 248 wells have been drilled. Of these 143 wells have been hooked up till date.
Gas production from Raageshwari Deep Gas (RDG) averaged 124 million standard cubic feet per day (mmscfd) in FY2021, with gas sales, post captive consumption, at 96 mmscfd.
On 26 October 2018, the Government of India, acting through the Directorate General of Hydrocarbons (DGH), Ministry of Petroleum and Natural Gas, granted its approval for a 10-year extension of the PSC for the Rajasthan block, RJ-ON-90/1, subject to certain conditions, with effect from 15 May 2020. In May 2018 the single judge had passed the order in our favour allowing extension of Rajasthan PSC on same terms. The GoI had appealed against the said order before the division bench of the Delhi High Court. Vide order dated 26 March 2021, the High Court has allowed the appeal of GoI against the single judge order.
We have served notice of arbitration on the Government of India (GoI) in respect of the audit demand raised by DGH based on PSC provisions. The government has accepted it and the arbitration tribunal stands constituted. It is our position that there is no liability arising under the PSC owing to these purported audited exceptions. The audit exceptions do not constitute demand and hence shall be resolved as per the PSC provisions.
The tribunal had a first procedural hearing on 24 October on which Vedanta also filed its application for interim relief. The interim relief application was heard by the tribunal on 15 December 2020, wherein it was directed that the GoI should not take any coercive action to recover the disputed amount of audit exceptions which is in arbitration and that during the arbitration period, the GoI should continue to extend the tenure of the PSC on terms of current extension.
The GoI has challenged the said order before the Delhi High court which is now listed on 20 May 2021.
Further, on 23 September 2020, the GoI filed an application for interim relief before Delhi High Court seeking payment of all disputed dues. The bench has not been inclined to pass any ex-parte orders and the matter is now listed for hearing on 20 May 2021.
Further to above stated letter from GoI on 26 October 2018, in view of pending non-finalisation of the Addendum to PSC, the GoI granted permission to the Oil & Gas business to continue petroleum operations in Rajasthan block, till the execution of the Addendum to PSC or 30 April 2021, whichever is earlier.
Ravva block
The Ravva block produced at an average rate of 19,177 boepd, higher by 35% y-o-y. This was primarily due to new wells bought online through Ravva drilling campaign which was successfully completed during the year.
Cambay block
The Cambay block produced at an average rate of 10,329 boepd, lower by 29% y-o-y. This was primarily due to natural field decline partially offset by production optimisation measures.
PRICES
Particulars | FY2021 | FY2020 | % change | |||||||||
Average | 44.3 | 60.9 | (27 | ) | ||||||||
Brent prices – US$/barrel | ||||||||||||
Crude oil price averaged US$44.3 per barrel, compared to US$60.9 per barrel in the previous year driven by multiple reasons shifting the world from the era of supply disruption to plenty. Global economic indicators continued to be adversely impacted due to the COVID-19 pandemic.
Early in the year, oil prices declined drastically as the markets struggled with a rapidly filling storage capacity and massive crude oil glut amid a demand collapse caused by the virus outbreak.
Prices continued extending gains from the second quarter, climbing to a six-month high as physical market fundamentals continued to recover, rollout of COVID-19 vaccines and the surplus in the market eased, which was reflected in the decline in crude oil stocks, and recovery in refinery operations and utilisation rates in the major economies.
Continued efforts by OPEC to accelerate production cuts including voluntary adjustments and weather- related energy crisis in the US later in the year caused a sharp decline in oil production. This temporarily disrupted at least a fifth of the US refining output, and a million barrels of crude production led to a steady rally in crude prices.
VEDANTA LIMITED | INTEGRATED REPORT AND ANNUAL ACCOUNTS 2020-21 | 141
MANAGEMENT DISCUSSION AND ANALYSIS CONTINUED...
Operational review
Oil & Gas
FINANCIAL PERFORMANCE
| (₹crore, unless stated) | ||||||||||||
Particulars | FY2021 | FY2020 | % change | |||||||||
Revenue | 7,531 | 12,661 | (41 | ) | ||||||||
EBITDA | 3,206 | 7,271 | (56 | ) | ||||||||
EBITDA margin | 43 | % | 57 | % | — | |||||||
Revenue for FY2021 was 41% lower y-o-y at ₹7,531 crore (after profit petroleum and royalty sharing with the Government of India), owing to fall in oil price realisation and lower volumes. EBITDA of FY2021 was at ₹3,206 crore, lower by 56% y-o-y in line with the lower revenue.
The Rajasthan operating cost was US$7.7 per barrel in FY2021 compared to US$8.7 per barrel in the previous year, primarily driven by cost optimisation initiatives and lower maintenance activities due to COVID-19 early in the year.
| A. | Growth projects development |
The Oil & Gas business has a robust portfolio of infill development and enhanced oil recovery projects to add volumes in the near term and manage natural field decline. Some of key projects are:
Mangala infill, Bhagyam & Aishwariya Enhanced oil recovery (EOR) and FM3/5 Infill
Mangala is currently under full field polymer injection. In addition, to increase the ultimate oil recovery and support production volumes, we are executing a 45-well infill drilling campaign in Mangala field. Drilling and hook up of the 45 well campaign have been completed during FY2021.
The polymer’s success enhanced oil recovery at Mangala and is being replicated at Bhagyam and Aishwariya fields to increase recovery rates. Drilling and hook-up of 42 well campaign have been completed during fiscal year 2021. Surface facility development for polymer implementation has been
completed and polymer injection has been ramped up to its design capacity.
Based on the success of the FM3 infill drilling campaign, Cairn has identified opportunities to further accelerate production by drilling four horizontal wells in FM3 and FM5 sands. The project also entails drilling of few deviated wells for FM2/3 sands and conversion of three wells to polymer injector. The approved field development plan is being executed and the drilling is expected to commence during the first half of the fiscal year 2022.
Tight oil and gas projects
Tight oil: Aishwariya Barmer Hill (ABH) Aishwariya Barmer Hill (ABH) is the first tight oil project to monetise the Barmer hill potential. All 39 wells have been drilled, of which 27 wells are hooked up. They are being progressively hooked up to ramp up volumes. Surface facility construction is completed and commissioned. Aishwariya Barmer hill stage II drilling programme enabled to establish the confidence in reservoir understanding of ABH. Based on the success of it,
drilling of 5 additional wells were conceptualised and drilling is expected to commence during third quarter of fiscal year 2022.
Tight gas: Raageshwari deep gas (RDG) development Gas development in the Raageshwari Deep Gas field continues to be a strategic priority. Early production facility has been commissioned and ramped up to its designed capacity of 90 mmscfd.
Further construction of gas terminal through integrated contract is completed and under commissioning. This shall lead to incremental sales of ~100 mmscfd.
In order to realise the full potential of the gas reservoir, drilling of 42 wells is nearing completion. 41 wells have been drilled, of which 23 wells are online as of 31 March 2021. They are being progressively hooked up to ramp up volumes.
Other projects
Surface facility upgradation The Mangala processing terminal facility upgradation is nearing completion and all the major sub-systems of liquid handling are under operation. Intra-field pipeline augmentation project has been completed. The project will lead to increasing liquid handling capacity by 30% at the Mangala processing terminal.
142
| < BACK TO CONTENTS | Integrated Report | Statutory reports | Financial statements |
Ravva development
An integrated development campaign which was commenced in Q3FY20 got completed in FY2021. Seven well drilling programmes resulted in ~11 kboepd of incremental volumes from Ravva Block.
B. Exploration and appraisal
Rajasthan - (BLOCK RJ- ON-90/1)
Rajasthan exploration
The Rajasthan portfolio provide access to multiple play types with oil in high permeability reservoirs, tight oil and tight gas. We are evaluating opportunities to drill low to medium risk and medium to high reward exploration wells to build on the resource portfolio.
Tight oil appraisal The appraisal programme of four fields (Vijaya and Vandana, Mangala Barmer Hill, DP and Shakti) entails the drilling and extended testing of 10 new wells with multi-stage hydraulic fracturing. Till 31 March 2021, 8 wells have been drilled.
Open Acreage Licensing Policy (OALP)
Under the Open Acreage Licensing Policy (OALP), revenue-sharing contracts have been signed for 51 blocks located primarily in established basins, including some optimally close to existing infrastructure.
Full Tensor Gravity Gradiometry™ (FTG) airborne survey implemented to prioritise area of hydrocarbon prospectivity has been completed in Assam, Cambay, Rajasthan and Kutch region. The exploration prospect maturation process is digitalised to fastrack the decision to drill.
The initial phase of seismic acquisition programme has been completed in Assam, Cambay and Offshore GS-GK region. The second phase is ongoing in Rajasthan and Cambay.
Early drilling opportunities have been identified, based on reprocessing and interpretation of vintage data in Rajasthan, Assam and Cambay region. We are planning to utilise modular production facilities Extended Well Test (EWT), Quick Production Facility (QPF) to fastrack production.
The first well KW-2 Udip has been drilled in Rajasthan. Drilling and related preparation activities are ongoing in Cambay and North East.
STRATEGIC PRIORITIES AND OUTLOOK
Vedanta’s Oil & Gas business has a robust portfolio mix comprising exploration prospects spread across basins in India, development projects in the prolific producing blocks and stable operations which generate robust cash flows.
The key priority for us is to deliver on our commitments from our world-class resources with ‘zero harm, zero waste and zero discharge’:
Increase in near-term volumes by commissioning the gas processing terminal and surface facilities for Aishwariya Barmer Hill
Infill projects across producing fields to add volume in near term
Unlock the potential of the exploration portfolio comprising OALP and PSC blocks
Continue to operate at a low cost-base and generate free cash flow post-capex
VEDANTA LIMITED | INTEGRATED REPORT AND ANNUAL ACCOUNTS 2020-21 | 143
MANAGEMENT DISCUSSION AND ANALYSIS CONTINUED...
Operational review
Aluminium
THE YEAR IN BRIEF
In FY2021, the aluminium smelters achieved India’s highest production of 1.97 million tonnes (including trial run). It has been a remarkable year in our cost reduction journey on all operational fronts. Structural reforms and continued focus on operational excellence, coupled with lower input commodity prices, provided us a long-term cost advantage. Our efforts towards optimising our bauxite and coal mix and improved asset capacity utilisation across refinery, smelters and power plants supported the cost reduction journey. We started and continued a structural cost reduction programme called Vijaypath with focus on optimising our controllable costs and improving our price realisation to improve profitability in a sustainable manner. The hot metal cost of production for FY2021 stood at US$ 1,347 per tonne. We also achieved record production of 1.84 million tonnes at the alumina refinery through continued debottlenecking.
144
| < BACK TO CONTENTS | Integrated Report | Statutory reports | Financial statements |
OCCUPATIONAL HEALTH & SAFETY
We report with deep regret, two fatalities during the year, one at our operations in Lanjigarh during unloading of bauxite and another at the power plant in BALCO. We investigated both incidents thoroughly and shared the lessons learned across all our businesses.
This year, we experienced total 19 Lost Time Injuries (LTIs) at our operations with a LTIFR of 0.27.
To enhance competencies of our executives, engineers, and supervisors of business partners, we have launched the Safety Booster programme at our sites. We conducted safety stand-downs across the sites to communicate the learnings from safety incidents and prevent repeated future incidents. Also, our safety leadership regularly engages with the business partner site in-charges and their safety officers for their capability development and strengthening the culture of safety at our sites. Our operations commenced a monthly theme initiative where cross-functional audits and awareness programmes were carried out based on one high hazard work area each month such as confined space, vehicle driving and working at height.
Moreover, to sensitise our employees towards our core values of ‘Care’, we regularly carry out programmes such as ‘Suraksha ki Goth’ and ’Suraksha Charcha’.
The worldwide outbreak of COVID-19 has not impacted our operations in FY2021. As part of our Corporate Social Responsibility, our business units worked with the government and stakeholders, including local community to provide relief measures. Our
mobile health units were used for creating awareness with a clear emphasis on the importance of social-distancing and maintaining personal hygiene. Our business units provided support to the district and state health services in terms of medical equipment, including hand sanitisers, medicines, reagents and PPEs such as surgical masks, gloves, gowns and personnel (housekeeping staff, security personnel, medical personnel and so on, in addition to the contribution to the government’s relief fund for COVID-19).
The SHGs associated with our facilities were involved in preparing masks, thereby creating livelihood while helping reduce the COVID-19 impact. Fire brigades at the facilities have been deployed to sanitise the premise and in the core villages near our facilities. The facilities provide food to migrant workers, identified community groups, police personnel and so on, as part of our social responsibility initiatives.
ENVIRONMENT
Jharsuguda has recycled 14.67% of the water used in FY2021, while BALCO has recycled 12.49%. One of our smelters at Jharsuguda has achieved Specific Water Consumption of 0.28 m3/mt of aluminium, a benchmark in India. There has been a significant improvement in our water consumption of 0.59 m3/mt (FY2020: 0.69 m3/mt) at BALCO. We are consistently focusing on improving the recycled water percentage.
The management of hazardous waste such as spent Pot line, aluminium dross, fly ash, and so on are material waste management issues for the aluminium business. Our BALCO and Jharsuguda units disposed of 25,949 mt spent pot lining and 14,736 mt of aluminium dross this year, to recyclers authorised by respective state pollution control boards. Our operations were able to dispose 100% of fly ash generated at the units. At our Lanjigarh operations, 92% of lime grit has been utilised in FY2021 vis-à-vis 98.4% in FY2020.
VEDANTA LIMITED | INTEGRATED REPORT AND ANNUAL ACCOUNTS 2020-21 | 145
MANAGEMENT DISCUSSION AND ANALYSIS CONTINUED...
Operational review
Aluminium
PRODUCTION PERFORMANCE
| Particulars | FY2021 | FY2020 | % change | |||||||||
Production (kt) | ||||||||||||
Alumina – Lanjigarh | 1,841 | 1,811 | 2 | |||||||||
Total | 1,969 | 1,904 | 3 | |||||||||
aluminium production Jharsuguda I | 533 | 543 | (2 | ) | ||||||||
Jharsuguda II1 | 867 | 800 | 8 | |||||||||
BALCO I | 265 | 256 | 4 | |||||||||
BALCO II | 304 | 305 | — | |||||||||
| (1) | Including trial run production of 27 kt in FY2021 vs. nil in FY2020 |
ALUMINA REFINERY: LANJIGARH
At Lanjigarh, production was 2% higher y-o-y at 1.84 million tonnes, primarily through continued plant debottlenecking and improved capacity utilisation.
ALUMINIUM SMELTERS
We ended the year with production of 1.97 million tonnes (including trial run). Our smelter at BALCO continued to show consistent performance. Jharsuguda smelter ramped-up its production from 1.3 mtpa in FY2020 to 1.4 mtpa in FY2021, 4% up y-o-y.
COAL SECURITY
We continue to focus on the long- term security of our coal supply at competitive prices. We added Jamkhani and Radhikapur (West) coal mines through competitive bidding process by GOI. The Radhikapur Coal Block has a capacity of 6 mtpa, as per current approved mine plan and Jamkhani coal block is currently rated at 2.6 mtpa. These acquisitions will substantially improve our coal security. We also look forward to continuing our participation in linkage coal auctions and secure coal at competitive rates.
PRICES
| Particulars | FY2021 | FY2020 | % change | |||||||||
Average | 1,805 | 1,749 | 3 | |||||||||
LME cash settlement prices (US$ per tonne) | ||||||||||||
Average LME prices for aluminium in FY2021 stood at US$ 1,805 per tonne, 3% higher y-o-y. LME prices were bearish for the first two quarters due to pandemic-induced disruption in the global economic activity and seemed bullish in the last two quarters, driven by increase in demand in the second half of FY2021. The prices showed a sharp increase in the concluding months of FY2021.
UNIT COSTS
| (US$ per tonne) | ||||||||||||
| Particulars | FY2021 | FY2020 | % change | |||||||||
Alumina cost (ex-Lanjigarh) | 235 | 275 | (15 | ) | ||||||||
Aluminium hot metal production cost | 1,347 | 1,690 | (20 | ) | ||||||||
Jharsuguda CoP | 1,304 | 1,686 | (23 | ) | ||||||||
BALCO CoP | 1,450 | 1,700 | (15 | ) | ||||||||
During FY2021, the cost of production (CoP) of alumina improved to US$ 235 per tonne, due to benefits from increase in locally sourced bauxite, continued debottlenecking, improved capacity utilisation and plant operating parameters. This was further backed by reduced input commodity prices (mainly caustic soda and HFO).
In FY2021, the total bauxite requirement of about 5.3 million tonnes was met by Odisha (56%) and imports (44%). In the previous year, the bauxite supply mix was captive mines (9%), Odisha (49%) and imports (42%).
146
| < BACK TO CONTENTS | Integrated Report | Statutory reports | Financial statements |
In FY2021, the CoP of hot metal at Jharsuguda was US$1,304 per tonne, down by 23% from US$1,686 in FY2020. The hot metal CoP at BALCO fell to US$1,450 per tonne, down by 15% from US$1,700 per tonne in FY2020. This was primarily driven by improved materialisation of domestic coal from Coal India Limited (CIL) with lower auction premiums and structural reduction in Renewable Purchase Obligation rates. Improved production and lower cost of Lanjigarh Alumina along with subdued input commodity prices in first nine months supported our cost reduction journey.
FINANCIAL PERFORMANCE
| (₹crore, unless stated) | ||||||||||||
| Particulars | FY2021 | FY2020 | % change | |||||||||
Revenue | 28,644 | 26,577 | 8 | |||||||||
EBITDA | 7,751 | 1,998 | — | |||||||||
EBITDA margin | 27% | 8% | — | |||||||||
During the year, revenue increased by 8% to ₹28,644 crore, driven primarily by rising LME aluminium prices and higher production volumes. EBITDA was significantly up at ₹7,751 crore (FY2020: ₹1,998 crore), mainly due to improved hot metal cost of production and increased sales realisation.
STRATEGIC PRIORITIES & OUTLOOK
With the increasing primary aluminium demand, the outlook for FY2022 is strong. Regional ingot and value-added product premiums are rapidly increasing, reflecting a combination of low ordering for 2021 and stronger than expected demand.
The input commodity prices across carbon are moving on a higher side driven by continued demand increases. We are looking at ways to continuously optimise our costs, while also increasing the price realisation to improve profitability sustainably.
India’s market is expected to have robust growth, supported primarily by growing industrial activity and government focus on infrastructure sector and domestic manufacturing in the country. Several government initiatives (Make in India, Production-linked Incentive for domestic manufacturing, National Infrastructure Pipeline and National Rail Plan) will enhance aluminium demand, going forward.
Vedanta continues to expand its value-added product portfolio in line with evolving market demand, making it poised to grow in the Indian aluminium market.
At our power plants, we are also working towards reducing gross calorific value (GCV) losses in coal as well as improving plant operating parameters which should deliver higher plant load factors (PLFs) and a reduction in non-coal costs. Vedanta is working out a plan to expedite operationalisation of Radhikapur and Jamkhani coal mines.
Whilst the current market outlook remains bullish, our core strategic priorities include:
Focus on the health & safety of our employees, business partners, customers and community
Deliver alumina and aluminium production through structured asset optimisation framework
Enhance our raw material security of bauxite and alumina Improve coal linkage security, better materialisation
Expedite operationalisation of Radhikapur and Jamkhani coal block
Zero slippage in raw material and finished goods quality
Improve our plant operating parameters across locations
Improve realisations by enhancing our value-added product portfolio
VEDANTA LIMITED | INTEGRATED REPORT AND ANNUAL ACCOUNTS 2020-21 | 147
MANAGEMENT DISCUSSION AND ANALYSIS CONTINUED...
Operational review
Power
THE YEAR IN BRIEF
In FY2021, TSPL’s (Talwandi Sabo Power Limited) plant availability was 81% and Plant Load Factor (PLF) was 40%, primarily on account of COVID-19 related demand disruption in H1 FY2021.
148
| < BACK TO CONTENTS | Integrated Report | Statutory reports | Financial statements |
OCCUPATIONAL HEALTH & SAFETY
We reported 1 fatality at TSPL in FY2021. The accident was thoroughly investigated and learnings have been propagated across our employees, business partners and across the group.
We continue to strengthen the ’Visible Felt Leadership‘ through the on-ground presence of senior management, improvement in reporting
across all risk and verification of on-ground critical controls. We also continue to build safety assisting infrastructure development through the construction of pedestrian pathways, dedicated route for bulkers, creation of secondary containment for hazardous chemicals and other infra development across sites.
VEDANTA LIMITED | INTEGRATED REPORT AND ANNUAL ACCOUNTS 2020-21 | 149
MANAGEMENT DISCUSSION AND ANALYSIS CONTINUED...
Operational review
Power
ENVIRONMENT
One of the main environmental challenges for power plants is the management and recycling of fly ash. At all our operations, we have a managed to utilise more than 100% of generated fly ash and 60% in TSPL. The reduction in ash utilisation is due to COVID-19 related demand disruption and national/ local lockdowns affecting traffic movement, particularly in H1.
TSPL has implemented all the recommendations given by M/s Golder associates for ash dyke. Additional review done by dyke designer and assurance was also taken from third party (M/s TSE) regarding ash dyke stability. TSPL has recycled 18.5% of the water used. We are further working to sustain the recycled water percentage through measures planned during FY2022.
PRODUCTION PERFORMANCE
| Particulars | FY2021 | FY2020 | % change | |||||||||
Total power sales (MU) | 11,261 | 11,162 | 1 | |||||||||
Jharsuguda 600 MW | 2,835 | 776 | — | |||||||||
BALCO 300 MW* | 1,596 | 1,726 | (7 | ) | ||||||||
MALCO# | — | — | — | |||||||||
HZL wind power | 351 | 437 | (20 | ) | ||||||||
TSPL | 6,479 | 8,223 | (21 | ) | ||||||||
TSPL – availability | 81 | % | 91 | % | — | |||||||
| # | continues to be under care and maintenance since 26 May 2017 due to low demand in Southern India. |
| * | we have received an order dated 01 Jan 2019 from CSERC for Conversion of 300MW IPP to CPP w.e.f. 01 April 2017. During the Q4 FY2019, 184 units were sold externally from this plant. |
OPERATIONS
During FY2020, power sales were 11,261 million units, 1% higher y-o-y. Power sales at TSPL were 6,479 million units with 81% availability in FY2021. At TSPL, the Power Purchase Agreement with the Punjab State Electricity Board compensates us based on the availability of the plant.
The 600MW Jharsuguda power plant operated at a lower plant load factor (PLF) of 58% in FY2021.
The 300 MW BALCO IPP operated at a PLF of 66% in FY2021.
The MALCO plant continues to be under care and maintenance, effective from 26 May 2017, due to low demand in Southern India.
UNIT SALES AND COSTS
| Particulars | FY2021 | FY2020 | % change | |||||||||
Sales realisation (₹/kWh)1 | 3.1 | 3.6 | (14 | ) | ||||||||
Cost of production (₹/ kWh)1 | 2.3 | 2.5 | (8 | ) | ||||||||
TSPL sales realisation (₹/kWh)2 | 3.0 | 3.7 | (19 | ) | ||||||||
TSPL cost of production (₹/kWh)2 | 2.1 | 2.7 | (22 | ) | ||||||||
| (1) | Power generation excluding TSPL |
| (2) | TSPL sales realisation and cost of production is considered above, based on availability declared during the respective period |
150
| < BACK TO CONTENTS | Integrated Report | Statutory reports | Financial statements |
100%+
Utilisation of generated fly ash at all operations
6,479
million units
Power sales at TSPL in FY2021
Average power sale prices, excluding TSPL, decreased by 14% to ₹3.1 per kWh and the average generation cost was lower at ₹2.3 per kWh (FY2020: ₹2.5 per kWh), driven mainly by decrease in coal prices and improved linkage materialisation.
In FY2021, TSPL’s average sales price was lower at ₹3.0 per kWh (FY2020: ₹3.7 per kWh), and power generation cost was lower at ₹2.1 per kWh (FY2020: ₹2.7 per kWh).
FINANCIAL PERFORMANCE
| (₹crore, unless stated) | ||||||||||||
| % | ||||||||||||
| Particulars | FY2021 | FY2020 | change | |||||||||
Revenue | 5,375 | 5,860 | (8 | ) | ||||||||
EBITDA | 1,407 | 1,649 | (15 | ) | ||||||||
EBITDA margin | 26 | % | 28 | % | — | |||||||
| * | Excluding one-offs |
EBITDA for the year was 15% lower y-o-y at ₹1,407 crore mainly due to low capacity charges as PPA at TSPL, BALCO and Zinc India and lower realisation at TSPL, partially offset by increase in power sales at Aluminium business.
STRATEGIC PRIORIES & OUTLOOK
During FY2022, we will remain focused on maintaining the plant availability of TSPL and achieving higher plant load factors at the BALCO and Jharsuguda IPPs.
Our focus and priorities will be to:
Resolve pending legal issues and recover aged power debtors
Achieve higher PLFs for the Jharsuguda and BALCO IPP
Improve power plant operating parameters to deliver higher PLFs/availability and reduce the non-coal cost
Ensuring safe operations, energy and carbon management
VEDANTA LIMITED | INTEGRATED REPORT AND ANNUAL ACCOUNTS 2020-21 | 151
MANAGEMENT DISCUSSION AND ANALYSIS CONTINUED...
Operational review
Iron Ore
THE YEAR IN BRIEF
Production of Crude ore at Karnataka stood at 5.60 wet million tons. With the order of Central Empowered Committee (Supreme Court appointed body) on 21 March 2020, our annual mining capacity has been increased up to 5.89 mtpa. In line with this, the Government of Karnataka on February 2021 has allocated the production quantity of 5.60 wet million tons for FY2021 to maintain the Supreme Court allocated district cap.
Meanwhile, operations in Goa remained in suspension in FY2021 due to a state-wide directive from the Supreme Court. However, we continue to engage with the government to secure a resumption of mining operations.
152
| < BACK TO CONTENTS | Integrated Report | Statutory reports | Financial statements |
OCCUPATIONAL HEALTH & SAFETY
In-spite of our best efforts towards the vision of zero harm, we are very sorry to inform that we lost one of our business partner colleagues at our Karnataka operations in a fatal accident at the mobile screening plant. This has appalled the entire management and we thus undertook to review all our activities for the risk perception and on ground implementation of controls. Our Lost Time Injury Frequency Rate (LTIFR) has increased to 0.56 (FY 2020:0.45).
We engaged a third-party consultant to identify the hidden risk in our operations
and further strengthened our grid owner systems with focus on implementation of Vedanta Safety performance standard on ground. We have a robust top-down approach with more than 95% month on month compliance for Visible Felt Leadership rounds including the ExCo. Collective efforts of our enthusiastic business partners, grid owners and line managers has been effective in ensuring critical controls in place for all identified Critical Activities.
IOB has implemented more focused initiatives to improve vehicle and driving safety. At Iron ore Karnataka all our drivers working in mining are trained by OEMs, and at VAB, we have developed internal trainers
for vehicle and driving safety with greater focus given on one way-traffic, pedestrian walkways, discipline parking of trucks and HEMM, pre-start inspection etc.
Our one of its kind Grid Owners Scheme has proved to be the essence for inculcating and percolating the true values of Safety leadership at site level. With each grid owner working as a responsible steward, our BUs have seen commendable positivity and enthusiasm towards compliance with not just safety standards but also green belt development, waste segregation, UA/UC reporting, critical task management, etc.
With the wholehearted involvement of our line managers, we had run a theme-based safety campaign on “Line of Fire at Workplace” which included site rounds, on-site trainings, awareness sessions, online sessions, online quiz, poster and slogan competitions, daily mailers and screensavers. The campaign helped us to identify and control situations and conditions of line of fire across all BUs. Post this successful and well-accepted campaign, we will be organising similar theme-based campaigns every quarter to strengthen the safety culture of our business.
VEDANTA LIMITED | INTEGRATED REPORT AND ANNUAL ACCOUNTS 2020-21 | 153
MANAGEMENT DISCUSSION AND ANALYSIS CONTINUED
Operational review
Iron Ore
Grid Owners Scheme
One-of-its-kind programme implemented to encourage Safety leadership With the persistent pandemic of COVID-19 across the nation, top management team of IOB has been driving continual efforts to restrict spread of the COVID-19 among our employees and business partners. After a small duration of shutdown due to ‘Janata curfew’ and nation-wide lockdown in the month of April 2020, we were able to restart majority of our operations by the last week of April. Till date we have tested up to 1,400 staff, workmen and business partner employees under travel and contact tracing guidelines. We have had 318 persons who were found positive.
Our IOB COVID-19 taskforce, under the guidance of our CEO and unit wise cross functional teams, for implementation of all the preventive and precautionary measures, is engaged in prevention and control of the virus. Controls like cold fumigation for common areas, mandatory screening, social distancing, usage of masks, contact tracing, work from home, etc. proved effective and steered us to maintain our business continuity. Also, our state-of-the-art video analytics system called COVID Marshall which was rolled out by our Security and IT team, gave us an edge to ensure compliance of social distancing, mask compliance, etc. The solution was extended to other group companies as a best practice. One of the major milestones achieved during this phase was that we were able complete the BF#3 re-lining project at VAB with zero outbreaks of COVID-19 among project workers and employees which was an outcome of testing at source and destination for the project workmen and strict controls on site.
Our focus for the upcoming year would be on strengthening the controls of critical activities, business partner safety management, centralisation, and standardisation of HSE trainings, upgrade of incident investigation methods and digital transformation in HSE functions for effective management.
ENVIRONMENT
At our Value-Added Business we recycle and reuse almost all the wastewater. Only the non-contact type condenser cooling water of the power plant is cooled and treated for pH adjustment and discharged back into the Mandovi river, which is a consented activity by the authorities.
We have further strengthened our dust control system by installing new bag houses systems with advanced design at our Blast furnace 2 and Coke screening plant 1 & 2.
At Iron ore Karnataka, continuing with its best practices, the Company has constructed 38 check dams, 7 settling ponds and 2 harvesting pits having a rainwater harvesting potential of 2,75,805 m3/annum. Additionally, the Company de-silted 10 nearby village ponds increasing their rainwater harvesting potential by 75,629 m3/annum.
In FY2021, around 5 Ha of mining dump slope was covered with biodegradable geotextiles to prevent soil erosion and 41,000 native species saplings were planted. Various latest technologies like use of fog guns; environmentally-friendly dust suppressants mixed with
water were adopted on the mines to reduce water consumption for dust suppression without affecting the effectiveness of the measures.
AWARDS AND ACCOLADES
Value-Added Business achieved 2 Green Triangle Society Safety Awards. PID 2 has won the 1st prize, Gomant Sarvocha Suraksha Puraskar and PP 1 won the 2nd prize, Gomant Suraksha Puraskar in the event organised by Green Triangle Society under the aegis of Goa Inspectorate of Factories and Boilers
The business received the Indian Chamber of Commerce - National OHS Gold award for excellence in Occupation Safety and Health Practices
VAB Won CII National Energy Efficiency Circle Competition 2020’
154
| < BACK TO CONTENTS | Integrated Report | Statutory reports | Financial statements |
IOK Won FIMI’s Subh Karan Sarwangi Award IOK won Grow Care India Environment Gold Award Vizag General Cargo Berth (VGCB) won 3-star award in ‘EHS Excellence Award’ at the 13th edition of CII-South Region EHS Excellence Awards 2020 in recognition of the outstanding performance in various EHS categories
VGCB Won Greentech Safety and Environment Award under Safety & Environment Excellence category
VGCB Won Apex India Safety Gold Award 2020 under Safe Workplace Category
PRODUCTION PERFORMANCE
| (₹crore, unless stated) | ||||||||||||
| % | ||||||||||||
| Particulars | FY2021 | FY2020 | change | |||||||||
Production (dmt) | ||||||||||||
Saleable ore | 5.0 | 4.4 | 15 | |||||||||
Goa | — | — | — | |||||||||
Karnataka | 5.0 | 4.4 | 15 | |||||||||
Pig iron (kt) | 596 | 681 | (12 | ) | ||||||||
Sales (dmt) | ||||||||||||
Iron ore | 6.5 | 6.6 | (2 | ) | ||||||||
Goa | 2.1 | 0.9 | — | |||||||||
Karnataka | 4.4 | 5.8 | (24 | ) | ||||||||
Pig iron (kt) | 609 | 666 | (8 | ) | ||||||||
OPERATIONS
At Karnataka, production was 5 million tonnes, 15% higher y-o-y. Sales in FY2021 were 4.4 million tonnes, 24% lower y-o-y due to COVID-19 impact. Production of pig iron was 596,197 tonnes in FY2021, down by 12% y-o-y due to COVID-19 impact and shut down of plant for two months due to planned relining activity.
At Goa, mining was brought to a halt pursuant to the Supreme Court judgement dated 7 February 2018 directing all companies in Goa to stop mining operations with effect from 16 March 2018. We continue to engage with the government for the resumption of mining operations.
We bought low grade iron ore in auctions held by Goa Government in Auction No -23 & 24. This ore along with opening stock of ore purchased in 22nd auction and fresh royalty paid on ore moved out of mines post the Supreme Court order, was exported which further helped us to cover our fixed cost. Some ore was used to cater to the requirement of our pig iron plat at Amona.
FINANCIAL PERFORMANCE
| (₹crore, unless stated) | ||||||||||||
| % | ||||||||||||
| Particulars | FY2021 | FY2020 | change | |||||||||
Revenue | 4,528 | 3,463 | 31 | |||||||||
EBITDA | 1,804 | 878 | — | |||||||||
EBITDA margin | 40 | % | 25 | % | — | |||||||
In FY2021, revenue increased to ₹4,528 crore, 31% higher y-o-y mainly due twofold increase in sales volume at Goa and improved margin at Goa, Karnataka and VAB during the year. EBITDA increase to ₹1,804 crore compared with
₹878 crore in FY2020 was mainly due to improved margin and higher volume at Goa.
STRATEGIC PRIORITIES & OUTLOOK
Our near-term priorities comprise:
Resume mining operations in Goa through continuous engagement with the government and the judiciary
Realign and revamp resources, assets, HEMMs for starting the mine’s operation
Grow our footprint in iron ore by continuing to participate in auctions across the country, including Jharkhand
Securing EC for the expansion of production capacity of pig iron plant by 1.7 ltpa
Advocacy for removal of E-auction/trade barrier in Karnataka
VEDANTA LIMITED | INTEGRATED REPORT AND ANNUAL ACCOUNTS 2020-21 | 155
MANAGEMENT DISCUSSION AND ANALYSIS CONTINUED...
Operational review
Steel
THE YEAR IN BRIEF
ESL is an integrated steel plant (ISP) in Bokaro, Jharkhand, with a design capacity of 2.5 mtpa. Its current operating capacity is 1.5 mtpa with a diversified product mix of wire rod, rebar, DI pipe and pig iron.
In FY2021, ESL Steel Limited (ESL) has achieved lowest ever cost during the year since acquisition resulting in higher EBITDA margin vis-à-vis previous period (US$ 95 per tonne v/s US$ 78 per tonne).
156
| < BACK TO CONTENTS | Integrated Report | Statutory reports | Financial statements |
OCCUPATIONAL HEALTH & SAFETY
We had one unfortunate incident on the road inside the plant on
29 July 2020, wherein the driver while standing on the road in front of the truck was struck by a payloader. The vehicle was coming from the opposite direction and resulted in fatality. Actions were undertaken as per the detailed investigation to avoid such incidents in future. Currently, our LTIFR is 0.38.
Capability development of our employees and business partners continue to be our priority. We have engaged various external agencies in providing specialised trainings such as rescue training, training for signalman and riggers, defensive driving training, Vedanta Safety Standard requirements, MBRD sessions, and so on.
As a part of our 24x7 safety culture, we have commenced monthly shutdowns, continuous engagement with all team members, in which the senior leadership visits the shopfloors and communicates with workers on lessons learnt from recent incidents. Our safety alerts are also available in local languages and displayed at all strategic locations.
External studies have been conducted on ergonomics, hygiene study (qualitative) illumination, noise and arc flash assessment. We have also strengthened our firefighting capability both in terms of
72%
Of VAP sales in FY2021 maintained by ESL Steel
manpower and infrastructure. On people engagement we have organised the National Safety Month celebrations and Road Safety Month celebrations with various competitions for employees and business partners.
We have also organised our first-ever Safety Summit to discuss ways and means to enhance our safety performance as a business unit.
We have won two external recognition CII HSE Excellence Award (Certificate of Appreciation) and Greentech Safety Award.
We have also implemented the COVID protocol/SOP formulated to ensure business continuity by ensuring minimum footfall and mitigating COVID-19 risk. This includes staggered shift schedules, zero touch auto sanitising facilities, daily sanitisation of workplace, vaccination for frontline warriors, SOP and handbook on COVID-19, PPE, compliances through automation, Cardinal COVID rules, etc.
VEDANTA LIMITED | INTEGRATED REPORT AND ANNUAL ACCOUNTS 2020-21 | 157
MANAGEMENT DISCUSSION AND ANALYSIS CONTINUED
Operational review
Steel
ENVIRONMENT
In Waste Management system, 100% utilisation of blast furnace granulated slag, sale of fly ash to cement industries through long-term contracts and brick manufacturers, disposal of LD slag, disposal of biomedical waste to through Common Bio-medical Waste Treatment Facility (CBWTF), sale of used oil and zinc dust to recyclers authorised by the Pollution Control Board and re-processors are being ensured. E-waste and battery waste are also sent to authorised recyclers and re-processors and our membership with Treatment, Storage and Disposal Facility (TSDF) is helping the disposal of hazardous waste.
In Water Management, treatment of 4,500 kl of effluent daily in the Effluent Treatment Plant is done and it is being reutilised in several processes such as coke quenching, BF slag granulation, in greenbelt development, fire fighting, dust suppression and in operations of lime and Dolo, DIP and others. Recycling percentage has increased from 12% to 26 %.
In Energy Management, the usage of waste heat from coke oven flue gas for generation of steam, which ultimately helps in power generation, reduction in auxiliary power consumption from 12 % to 8% through improvement in station heat rate are carried out.
We are using LP steam in blast furnace to minimise the fuel requirement, LD gas and BF gas in several operations such as reheating furnace of rolling mills, blast furnace, DIP and lime and Dolo to reduce the fuel consumption, and running TG through steam generated from waste heat recovery.
In Air Emission Management, we are revamping Oxygen Convertor Gas Recovery (OG) system in Steel Melting Shop (SMS) to reduce fugitive emission, upgrading equipment to meet the norms stipulated by the regulatory authorities, revamping ESP of Sinter Plant, installing fixed sprinklers all along the roads and dry fog system in all the closed conveyors and deploying mechanical sweepers for road sweeping.
PRODUCTION PERFORMANCE
| % | ||||||||||||
Particulars | FY2021 | FY2020 | change | |||||||||
Production (kt) | 1,187 | 1,231 | (4 | ) | ||||||||
Pig iron | 189 | 167 | 13 | |||||||||
Billet | 165 | 27 | — | |||||||||
TMT bar | 338 | 468 | (28 | ) | ||||||||
Wire rod | 361 | 413 | (13 | ) | ||||||||
Ductile iron pipes | 135 | 155 | (13 | ) | ||||||||
OPERATIONS
There have been significant gains in operational efficiencies, such as optimisation of the coal mix in coke ovens and iron ore blending. Improved yields of the converters and finishing mills also added to the efficiency.
During FY2021, we produced 11,87,310 tonnes of saleable product, down 4% y-o-y on account of reduced availability of hot metal due to lower production amidst the disruption caused by the pandemic.
The priority remains to enhance production of value-added products (VAPs), i.e., TMT Bar, Wire Rod and DI Pipe. ESL maintained 72% of VAP sales, in line with priority.
Our Consent to Operate (CTO) for the steel plant at Bokaro, which was valid until December 2017, was not renewed by the Jharkhand State Pollution Control Board (JSPCB). This was followed by the Ministry of Environment, Forests and Climate Change (MoEF&CC) revoking the Environmental Clearance (EC) dated 21 February 2018. MoEF&CC, on 25 August 2020, has granted a Terms of Reference to ESL for 3 mtpa plant with conditions like fresh EIA/EMP reports and public hearing. The Honorable High Court of Jharkhand had extended the interim protection granted in the pending writ petitions till 16 September 2020. Hon’ble High Court on that date pronounced and revoked the interim stay for plant continuity w.e.f 23 September 2020. ESL filed a SLP before Hon’ble Supreme Court against the 16 September 2020 order for grant of interim status quo order and plant continuity. Vide order dated 22 September 2020, Hon’ble Supreme Court issued notice and allowed plant operations to continue till further orders. Public hearing has been concluded on 16 December 2020, and ESL has applied for grant of Environment Clearance to MoEF & CC on 11 January 2021 on Parivesh Portal of MoEF & CC and presented before EAC on 11 Febuary 2021.
158
| < BACK TO CONTENTS | Integrated Report | Statutory reports | Financial statements |
The revised proposal has been submitted on 14 March 2021 post inputs from 11 Febuary 2021 meeting.
PRICES
| (US$ per tonne) | ||||||||||||
| % | ||||||||||||
| Particulars | FY2021 | FY2020 | change | |||||||||
Pig Iron | 382 | 354 | 8 | |||||||||
Billet | 336 | 418 | (20 | ) | ||||||||
TMT | 539 | 494 | 9 | |||||||||
Wire rod | 537 | 519 | 3 | |||||||||
DI pipe | 544 | 602 | (10 | ) | ||||||||
Average steel price (US$ per tonne) | 488 | 495 | (1 | ) | ||||||||
Average sales realisation decreased 1% y-o-y from US$495 per tonne in FY2020 to US$488 per tonne in FY2021. Prices of iron and steel are influenced by several macro- economic factors. These include global economic slowdown, US- China trade war, supply chain destocking, government expenditure on infrastructure, the emphasis on developmental projects, demand-
supply dynamics, the Purchasing
Managers’ Index (PMI) in India and production and inventory levels across the globe, especially in China. Even though the NSR dipped by US$7 per tonne, we were able to increase our EBITDA margin to US$95 per tonne for the year (against US$78 per tonne in FY2020) through better control over costs.
UNIT COSTS
| % | ||||||||||||
| Particulars | FY2021 | FY2020 | change | |||||||||
Steel (US$ per tonne) | 393 | 418 | (6 | ) | ||||||||
Cost has decreased by 6 % y-o-y from US$ 418 per tonne to US$ 393 per tonne in FY2021, primarily on account of softening of coking coal price during the year and operational efficiencies which was managed through improvement in key operational metrics.
FINANCIAL PERFORMANCE
| (₹crore, unless stated) | ||||||||||||
| % | ||||||||||||
| Particulars | FY2021 | FY2020 | change | |||||||||
Revenue | 4668 | 4,283 | 9 | |||||||||
EBITDA | 871 | 588 | 48 | |||||||||
EBITDA margin | 19 | % | 14 | % | — | |||||||
Revenue increased by 9% to ₹4,668 crore (FY2020: ₹4,283 crore), primarily due to higher volume. EBITDA increased by 48% to ₹871 crore in line with higher sales and improved cost of production.
STRATEGIC PRIORITIES AND OUTLOOK
Steel demand is expected to surge owing to the gradual recovery in economic activities across the world, and the emphasis of governments to ramp up infrastructure spend. The focus is to operate with the highest Environment, Health and Safety standards, while improving efficiencies and unit costs.
The focus areas comprise:
Ensuring business continuity
Greater focus on reliability centred maintenance
Obtain clean ‘Consent to Operate’ and environmental clearances
Raw material securitisation through long-term contracts approaching FTA countries for coking coal
Ensure zero harm and zero discharge, fostering a 24x7 safety culture
VEDANTA LIMITED | INTEGRATED REPORT AND ANNUAL ACCOUNTS 2020-21 | 159
MANAGEMENT DISCUSSION AND ANALYSIS CONTINUED...
Operational review
Copper – India / Australia
THE YEAR IN BRIEF
Tuticorin’s copper smelter plant was shut down for FY2021. We continue to engage with the Government of India and relevant authorities to enable the restart of operations at Copper India. We continued to operate our refinery and rod plant at Silvassa, catering to the domestic market.
160
| < BACK TO CONTENTS | Integrated Report | Statutory reports | Financial statements |
OCCUPATIONAL HEALTH AND SAFETY
The lost time injury frequency rate (LTIFR) was zero till March 2021 (FY2020: 0).
ENVIRONMENT
Copper Mines of Tasmania continued in care and maintenance awaiting a decision on restart. Meanwhile, a small, dedicated team is maintaining the site and there were no significant safety or environmental incidents during the year.
The site retained its ISO accreditation in safety, environment and quality management systems and the opportunity of a production lull was used to review and further improve these systems.
PRODUCTION PERFORMANCE
| % | ||||||||||||
Particulars | FY2021 | FY2020 | change | |||||||||
Production (kt) India – cathode | 101 | 77 | 31 | |||||||||
OPERATIONS
The Tamil Nadu Pollution Control Board (TNPCB) vide order, dated 9 April 2018, rejected the consent renewal application of Vedanta Limited for its copper smelter plant at Tuticorin. It directed Vedanta not to resume production operations without formal approval/consent (vide order dated 12 April 2018), and directed the closure of the plant and the disconnection of electricity (vide order dated 23 May 2018).
The Government of Tamil Nadu also issued an order dated 28 May 2018 directing the TNPCB to permanently close and seal the existing copper smelter at Tuticorin; this was followed by the TNPCB on 28 May 2018. Vedanta Limited filed a composite appeal before the National Green Tribunal (NGT) against all the above orders passed by the TNPCB and the Government of Tamil Nadu. In December 2018, NGT set aside the impugned orders and directed the TNPCB to renew the CTO. The order passed by the NGT was challenged by the Tamil Nadu State Government in the Hon’ble Supreme Court.
The Company had filed a writ petition before the Madras High Court challenging various orders passed against the Company in 2018 and 2013. On 18 August 2020, the Madras High Court delivered the judgement wherein it dismissed all the writ petitions filed by the Company.
20%
Increase in y-o-y revenue achieved by Sterlite Copper
VEDANTA LIMITED | INTEGRATED REPORT AND ANNUAL ACCOUNTS 2020-21 | 161
MANAGEMENT DISCUSSION AND ANALYSIS CONTINUED...
Operational review
Copper – India / Australia
The Company has approached the Supreme Court and challenged the said High Court order by way of a Special Leave Petition (SLP) to Appeal and also filed an interim relief for care and maintenance of the plant. The matter was then listed on 2 December 2020 before the Supreme Court Bench. The Bench, after having heard both the sides, concluded that at this stage the interim relief in terms of trial run could not be allowed. Further, considering the voluminous nature of documents and pleadings, the matter shall be finally heard on merits. Besides, Hon’ble Supreme Court held that the case will be listed once physical hearing resumes in
the Supreme Court. The matter was again mentioned before the Bench on 17 March 2021, wherein the matter was posted for hearing on 17 August 2021.
Meanwhile, the Company’s Silvassa refinery and rod plant continues to operate as usual, enabling us to cater to the domestic market.
Our copper mine in Australia has remained under extended care and maintenance since 2013. However, we continue to evaluate various options for its profitable restart, given the government’s current favourable support and prices.
PRICES
| (₹crore, unless stated) | ||||||||||||
| % | ||||||||||||
| Particulars | FY2021 | FY2020 | change | |||||||||
Average LME cash settlement prices (US$ per tonne) | 6,897 | 5,855 | 18 | |||||||||
Average LME copper prices increased by 18% compared with FY2020.
162
| < BACK TO CONTENTS | Integrated Report | Statutory reports | Financial statements |
FINANCIAL PERFORMANCE
| (₹crore, unless stated) | ||||||||||||
| % | ||||||||||||
| Particulars | FY2021 | FY2020 | change | |||||||||
Revenue | 10,890 | 9,053 | 20 | |||||||||
EBITDA | (177 | ) | (300 | ) | — | |||||||
EBITDA margin | (2 | )% | (3 | )% | — | |||||||
During the year, EBITDA was ₹(177) crore and revenue was ₹10,890 crore, an increase of 20% on the previous year’s revenue of ₹9,053 crore. The increase in revenue was mainly due to higher Copper LME prices and higher volume. EBITDA loss decreased to ₹177 crore on account of increase in sales realisations by 20%.
STRATEGIC PRIORITIES & OUTLOOK
Over the following year our focus and priorities will be to:
Engage with the government and relevant authorities to enable the restart of operations at Copper India
Sustain operating efficiencies, reducing our cost profile
Upgrade technology to ensure high-quality products and services that sustain market leadership and exceeds customer expectations
PORT BUSINESS
Vizag General Cargo Berth (VGCB)
During FY2021, VGCB operations showed a decline of 29% in discharge and 25% in dispatch compared to FY2020. This drop was mainly due to worldwide lockdown during the pandemic and Government of India’s initiatives towards curtailing import coal volumes and encouraging domestic coal production or consumption. This has resulted in ~26% reduction of import coal volumes in the Vizag region and ~12% across India on a y-o-y basis.
VEDANTA LIMITED | INTEGRATED REPORT AND ANNUAL ACCOUNTS 2020-21 | 163
VEDANTA LIMITED
1st Floor, ‘C’ wing, Unit 103, Corporate Avenue, Atul Projects,
Chakala, Andheri (E), Mumbai - 400 093, Maharashtra
CIN: L13209MH1065PLC291394 | www. vedantalimited.com
Directors’ Report
DEAR MEMBERS,
Your Directors take pleasure in presenting the 4th Integrated Report (prepared as per the framework set forth by the International Integrated Reporting Council) and the Annual Standalone as well as Consolidated Financial Statements for the financial year ended March 31, 2021 of Vedanta Limited (‘Company’).
KEY BUSINESS, FINANCIAL AND OPERATIONAL HIGHLIGHTS
Company Overview
Vedanta Limited, a subsidiary of Vedanta Resources Limited, is one of the world’s largest suppliers of natural resources, with primary operations in Oil & Gas, Zinc, Lead, Silver, Copper, Iron Ore, Steel, and Aluminium & Power across India, South Africa, Namibia, and Australia. The Company’s strategic capabilities and alliances are singularly focused on creating and preserving value for its esteemed clients and the wider stakeholder fraternity. The Company is among the top private sector contributors to the exchequer with contribution of ~₹ 34,500 crores in FY 2021.
Vedanta is committed to delivering sustainable and responsible growth, and are committed to sustainability in mining practices, health & safety practices, wellbeing of employees and development of the local communities. The Company has been conferred the CII – ITC Sustainability Awards, Bhamashah Award and certified as FIVE-S Workplace Management System. Vedanta Limited is listed on the BSE Limited and the National Stock Exchange of India Limited and has American Depository Shares (ADS) listed on the New York Stock Exchange.
COVID Strategy
The COVID-19 pandemic is an unprecedented humanitarian and economic crisis. Our metal and mining industry has sought to respond quickly to protect the health of its employees and its communities. These steps are in response to (and often ahead of) emergency measures and lockdowns implemented by governments across the world to control the spread of the pandemic.
During these testing times our priority is to ensure the health and safety of our employees, contractors, and stakeholders, while ensuring the business continuity to the extent possible. At Group level, we have formulated various controls to prevent the spread of infection and thereby maintaining business continuity. We have formalised a Group level COVID task force spearheaded by Ms. Priya Agarwal (Non-Executive Director), Group HSE Head, Comm. Head, HR head, CMO and CEO Nand Ghar. There are business COVID taskforce formalised from diverse departments whose tasks is to implement strong controls and SOPs/protocols, audit the respective units to ensure complete compliance to COVID protocols to prevent the spread of the infection and to monitor and report the proceedings to the business CEO and Group task force.
Even with temporary disruptions we continue building on our strengths and commitment to operational excellence.
Company Performance
Vedanta has a portfolio of world-class, low-cost, scalable assets that consistently generate strong profitability and deliver robust cash flows. We continue to consolidate our position as one of the largest diversified natural resources businesses in the world. We are positioned in the commodities market that have a growing demand in one of the largest and fastest growing economy in the world with a key focus on operational delivery. Asset planning, operational excellence, cost control, productivity enhancement, improvement in realisation, risk mitigation coupled with increasing use of technology, more innovation and digitisation has helped us to enhance the delivery from our assets. Our key priority is to focus on ethics, governance, and social licence to operate, while we continue our journey towards zero harm, zero waste and zero discharge.
The year gone by was challenging, with tremendous uncertainties in the macro environment with the advent of novel coronavirus (COVID-19). However, we were quick to adapt to the emerging realties, backed by the relentless support of our dynamic workforce.
In FY 2021, we saw us achieving some of our best quarters for our three large businesses: zinc, oil & gas, and aluminium. In FY 2021, we were able to sustain our low-cost advantage in aluminium by engaging structural measures. While we have optimised our coal and bauxite source mix, we also continued our journey towards improving on operational efficiencies and debottlenecking our assets for improved capacity utilisation. For Zinc India operations, we completed 1.2 MnT mined metal project activities and sustained production post-transition to a fully underground mining company. We are also achieving strong momentum in silver production and aim to be among the top 3 producers of silver, globally. For Zinc International, our performance ramp-up continues, achieving highest ever production till date at Gamsberg, along with sustained cost reduction. In Oil & Gas we continued delivering on growth projects such as the commissioning of the new gas facility, ramp up of polymer injection, and upgradation of the liquid handing capacity.
As we look forward to the year ahead, we are operationally well positioned to deliver. In Oil & Gas, we are the largest private sector producer of crude oil in India and rank among the world’s lowest cost producer with a pipeline of assets in production, development, and exploration. In Zinc, we are the world’s largest fully integrated zinc-lead producer. In terms of Aluminium, we are India’s largest primary aluminium producer supported by our own captive power generation. We performed exceedingly well on key environmental, social and governance (ESG) aspects during the year. This is validated by our ranking in the Dow Jones Sustainability Index, which improved nine places to 12th globally in our industry.
164
| < BACK TO CONTENTS | Integrated Report | Statutory reports | Financial statements |
The strengths of our diverse portfolio, together with our focused growth strategy expanding our reserves and resource base, a strong balance sheet, strong talent base, technology, and modernisation initiatives, all combine to create a truly inspirational Company.
FINANCIAL HIGHLIGHTS
EBITDA at
₹27,341 crores 30%
higher y-o-y
(FY 2020: ₹21,061 crore)
Free cash flow
(FCF) post-capex of
₹13,821 crores
(FY 2020: ₹7,130 crores)
Net Debt at
₹24,414 crores
increased by
₹2,988 crores
compared to March 31, 2020
Robust adjusted
EBITDA margin1 of
36%
(FY 2020: 29%)
Interim dividend of
₹9.5
per share declared during FY 2021
Contribution to the exchequer of
c. ₹34,500 crores
in FY 2021 (FY 2020: ₹32,400 crores)
Profit Attributable to equity holders (before exceptional items) at ₹12,151 crores
(FY 2020: ₹3,995 crores)
Cash & liquid investments of ₹32,614 crores
VEDANTA LIMITED | INTEGRATED REPORT AND ANNUAL ACCOUNTS 2020-21 | 165
DIRECTORS REPORT CONTINUED...
The standalone and consolidated financial statements of the Company for the financial year ended March 31, 2021 prepared as per Indian Accounting Standards (Ind AS) and in accordance with the provisions of the Companies Act, 2013 and SEBI (Listing Obligations and Disclosure Requirements) Regulations, 2015 (Listing Regulations) forms part of this Annual Report.
Operational Highlights
Business highlights
Zinc India
| • | Highest ever ore production of 15.5 million tonnes despite disruptions on account of the pandemic |
| • | Highest ever mined metal production of 972 kt, up 6% y-o-y |
| • | Refined zinc-lead production of 930 kt, up 7% y-o-y |
Zinc International
| • | Cost of production at US$1,307 per tonne, down 22% y-o-y |
| • | Increase in Gamsberg production volume from 108kt in FY 2020 to 145kt in FY 2021 |
| • | BMM started a new product line of recovering magnetite through its tailings with potential capacity of 0.7 million tonnes of production per annum |
Steel
| • | Annual steel production at 1.19 million tonnes for FY 2021 |
| • | Robust margin of US$131 per tonne during the last quarter (~22% EBITDA Margin) |
Oil & Gas
| • | Average gross operated production of 162 kboepd, down 6% y-o-y due to impact of the pandemic on growth projects completion and natural field decline |
| • | Key growth projects update: |
| - | New gas processing terminal construction completed; commissioning underway expected to add ~100 mmscfd by Q1 FY 2022 |
| - | Liquid handing capacity upgraded by 30%, major facility systems commissioned |
| - | Enhanced Oil Recovery project implemented in Bhagyam and Aishwariya Fields |
| - | Aishwariya Barmer Hill surface facility commissioned; wells being hooked up progressively |
| • | Drilling activities across the portfolio in Rajasthan, North East & Cambay regions. First well KW-2-Udip drilled in Rajasthan |
| • | Capex growth projects update: |
| - | 74 wells hooked up during FY 2021 |
| - | Ravva drilling programme completed; ~11 kboepd of incremental volumes |
Copper India
| • | Due legal process being followed to achieve a sustainable restart of the operations |
Aluminium
| • | Highest ever aluminium production at 1,969 kt, retaining our position as the largest aluminium producer in the country |
| • | Highest ever alumina production from Lanjigarh refinery at 1,841 kt, up 2% y-o-y |
| • | Lowest ever hot metal cost of production at US$1,347 per tonne, 20% lower y-o-y |
Power
| • | Lowest ever APC of 7.19% at the 1,980 MW TSPL plant in FY 2021 |
| • | Sustained operations with zero import coal in FY 21 through coal substitution scheme of GoI (Government of India) |
Iron Ore
| • | Goa operations remains suspended during the year due to state-wide directive from the Hon’ble Supreme Court, continuous engagement with the stakeholders for a resumption of mining operations |
| • | Production of saleable ore at Karnataka at 5 million tonnes, up 15% y-o-y |
| • | Iron Ore Sales at Goa at 2.1 million tonnes |
| • | Value Added Business achieved highest ever EBITDA Margin of $104/T supported by strengthening steel prices |
The details of the business, results of operations and the significant developments have been further elucidated in Management Discussion & Analysis section of the Annual Report.
166
| < BACK TO CONTENTS | Integrated Report | Statutory reports | Financial statements |
Key events during the year
Delisting
With respect to the voluntary delisting offer of equity shares of the Company from BSE Limited and National Stock Exchange of India Limited made by Vedanta Resources Limited (‘VRL’), one of the members of the promoter and promoter group of the Company, the total number of Offer Shares validly tendered by the Public Shareholders in the Delisting Offer was less than the minimum number of Offer Shares required to be accepted by the Acquirers in order for the Delisting Offer to be successful in terms of Regulation 17(1)(a) of the Delisting Regulations. Thus, the Delisting Offer is deemed to have failed in terms of Regulation 19(1) of the Delisting Regulations.
The complete details can be accessed at www.vedantalimited.com.
Voluntary Open Offer
Pursuant to the Voluntary Open Offer made by Vedanta Resources Limited (“Acquirer”) together with Twin Star Holdings Limited, Vedanta Holdings Mauritius Limited and Vedanta Holdings Mauritius II Limited, as persons acting in concert with the Acquirer (“PACs”), to the public shareholders of the Company during the year, in accordance with the Securities and Exchange Board of India (Substantial Acquisition of Shares and Takeovers) Regulations, 2011, the Acquirer and PACs have acquired 374,231,161 equity shares of the Company representing 10.07% of fully diluted voting share capital, thereby increasing acquirer’s indirect shareholding in the Company from 55.1% to 65.18%.
The complete details can be accessed at www.vedantalimited.com
Acquisition
Vedanta Limited acquired the control over Ferro Alloys Corporation Limited (FACOR), with effect from the closing date, i.e. September 21,2020, in accordance with the terms of Approved Resolution Plan and as replaced by a new board of directors constituted with adequate representation of the persons appointed by Vedanta Limited and independent directors in compliance with applicable laws. Vedanta Limited holds 100% shareholding in FACOR.
In March 2021, the Company participated and was declared as the successful bidder in the Liquidation process for Sale of Assets of Bhachau and Khambhalia coke manufacturing units of Gujarat NRE Coke Limited, which was under liquidation under Bankruptcy Code. The total capacity of Bhachau and Khambalia plants is 594 KTPA and 358 KTPA respectively. The acquisition will complement our existing Iron Ore business via backward integration through provision of the Met Coke Requirement to our existing facilities.
Projects and Expansion Plan
Projects are key driving factor of our Group as our aspirations for growth are very different from any of the peers globally. In HZL, we have successfully completed the development of North Decline (ND1) at Rampura Agucha mine. This marked the completion of most awaited shaft integration and liberated RA shaft from statutory compliance of secondary outlet. This improves the accessibility of shaft section, alternate emergency evacuation, ease in mine equipment deployment at lower levels of mine, face charging with emulsion explosives, face drilling with long feed jumbo, etc. Also 650 kW ventilation fan was installed and commissioned at SK Mine with an objective to improve ventilation in underground by 100 Cum/sec in SKA6 lens. All major projects envisaged for 1.25 mtpa MIC have been commissioned (except RD). Order placed for detail feasibility study for expansion of zinc & lead smelting capacity.
In VZI, the Gamsberg mine and processing facilities are stabilizing, which will set the stage for Gamsberg Phase 2 expansion. This expansion which would see a double in the production capacity. A smelter enhancement to the Black Mountain Complex (BMC) operations would allow for refining our concentrate product to produce metal. In Cairn, we are still focussed on the journey to produce India’s 50% Oil & Gas production. GAS volumes are up in Q4 and further ramping up as project is fully commissioned now. The seismic acquisition programme and satellite-based prospecting has commenced in Open Acreage Licensing Policy (OALP). In Aluminium, Lanjigarh expansion is the key expansion project and coal block execution will be critical to deliver more value from this sector.
We are set to deliver tremendous value to all our stakeholders once we successfully execute these projects of across the group.
Dividend Distribution Policy and Dividend
In terms of the provisions of Regulation 43A of the Listing Regulations, the Company has adopted Dividend Distribution Policy to determine the distribution of dividends in accordance with the applicable provisions. The policy can be accessed on the website of the Company at www.vedantalimited.com.
With consistent dividend as a healthy sign of our sustained growth, our firm belief in percolating the benefits of our business progress for widespread socioeconomic welfare facilitates the equitable sharing of our economic value generated. Attaining steady operational performance and a harmonised market environment in continuation of the historical trends helped us to reaffirm the realisation of competent numbers for FY 2021.
VEDANTA LIMITED | INTEGRATED REPORT AND ANNUAL ACCOUNTS 2020-21 | 167
DIRECTORS REPORT CONTINUED...
The Company has declared interim dividend during the year in compliance with the Dividend Distribution Policy:
Particulars | FY 2020-21 | |||
Interim Dividend | 1 | st | ||
Record Date | October 31, 2020 | |||
Date of Declaration | October 24, 2020 | |||
Rate of Dividend per share | ₹ | 9.50 | ||
(Face Value of ₹ 1 per share) | ||||
% | 950 | |||
Total Payout (₹ in crores) | ₹ | 3,531.63 |
Pursuant to the Finance Act, 2020, dividend is taxable in the hands of the shareholders with effective from April 1, 2020 and tax has been deducted at source on the Dividend at prevailing tax rates inclusive of applicable surcharge and cess based on information received by the Registrar & Share Transfer Agent and the Company from the Depositories.
The Directors do not recommend any final dividend for financial year ended March 31, 2021.
Credit Rating
Your Company is rated by CRISIL and India Rating and Research Private Limited on its various debt instruments. The details of ratings provided by the agencies is stipulated in the Corporate Governance Report.
Economic Responsibility
Vedanta strives to be a responsible corporate citizen and to make a positive contribution to the communities in which we operate. Payment to exchequer viz. taxes, royalty, dividend etc. is a vital part of our contribution to national economies and people’s lives. Vedanta supports the principles of greater transparency that increases understanding of tax systems and build public trust.
With these values being ingrained in Vedanta’s DNA, we are proud to share that we have contributed ~₹ 34,500 crores to the public exchequer of the various countries where we operate.
Your Company publishes Tax Transparency Report which provides an overview of the tax strategy, governance and tax contributions made by the Company.
The report is available on the website at www.vedantalimited.com
SUSTAINABILITY AND SOCIAL RESPONSIBILITY
Environmental, Social and Governance (ESG) Approach
Driven by the sincere approach to achieve larger good, at Vedanta, our Environmental, Social and Governance (ESG) priorities are well-aligned to our enterprise goals and towards this end, we continue to work with a target-based strategy focused on fostering an inclusive and sustainable future for all.
Our ESG vision is strongly driven by the growing need to address the expectations of our stakeholders while delivering resilient business performance. As a responsible corporate citizen, we are attuned to both local and global expectations and endeavour to contribute to the fulfilment of UN Sustainable Development Goals (SDGs) and global frameworks such as ICMM and IFC performance standards. The Vedanta Sustainability Framework (VSF) as elucidated below provides the cornerstone to our ESG approach.
168
| < BACK TO CONTENTS | Integrated Report | Statutory reports | Financial statements |
Each pillar of our ESG vision is elaborated below for further insights into the Company practices.
Environment
With the key objective of “Zero Harm, Zero Waste and Zero Discharge” across all our operations, we continue to manage our environmental impact through associated programmes on water management, energy and climate change, carbon footprint reduction, solid waste management with recycling of our high-volume-low-effect wastes such as fly ash, tailings dam management, GHG emissions intensity reduction, and biodiversity. We strive to set ourselves with aggressive targets believing that our sustainable future depends on responsible and eco-friendly operations.
Social
Guided by our aspirational goals, our priority areas towards social development remain to become a developer of choice in our areas of operations. We have defined a social performance framework to secure our social licence to operate assessing the maturity of our business in the context and driving community activities across multiple spheres such as child education, combating malnutrition, medical infrastructure development, women empowerment, and sports engagement, among others.
Our community development programmes are designed and developed to suit the requirements of our immediate communities and country at large with specific emphasis on criticalities. While we embark on the journey to improve skilling, set up Nand Ghars and cater to larger people needs through our CSR pillars, we are also focused to ensure that we create a positive relationship with the communities about our operations and aim to have all our stakeholders as champions of our responsible practices.
Governance
As a pre-requisite for protecting shareholder value as well as delivering sustainable growth, good corporate governance underpins the delivery of our strategic objectives and the outcomes produced thereafter. Our governance philosophy with prudent and robust risk management frameworks; internal controls; and strong functional processes; stems from our core values of Trust, Integrity, Care, Entrepreneurship, Innovation, Respect, and Excellence. By overseeing the business conduct with strict adherence to responsibility and ethics, the entire structure, cascading from the Board of Directors and Sustainability Committee at the top, supported by policies and frameworks, enhances the prosperity, long-term viability, and sustainability of the Company.
Thus, as the world renews its consensus around the crucial role of ESG factors in assessment of all forms of businesses, we believe that our ESG approach is certain to reap meaningful returns over time.
Sustainability and Business Responsibility Report
Sustainable Development is integral to Vedanta’s core business strategy. We continue to be a transparent and responsible corporate citizen; committed to a ‘social license to operate’ and partner with communities, local governments and academic institutions to help catalyse socio-economic development in the areas where we operate.
The Company reaffirms its core values of Trust, Entrepreneurship, Innovation, Excellence, Integrity, Respect and Care, which are the basis of our Sustainable Development Model.
The model continues to be centreed on the four strategic pillars: Responsible Stewardship; Building Strong Relationships; Adding and Sharing Value; and Strategic Communications.
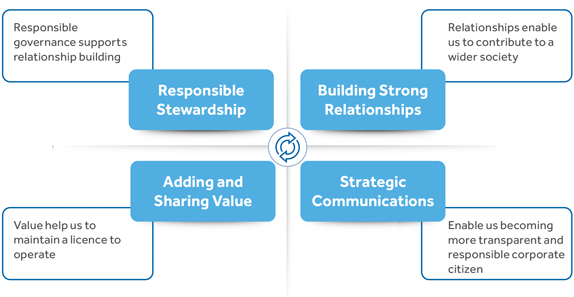
These four pillars are critical to ensuring the long-term successful future of our business – meeting our strategic goals of growth, long-term value and sustainability.
VEDANTA LIMITED | INTEGRATED REPORT AND ANNUAL ACCOUNTS 2020-21 | 169
DIRECTORS REPORT CONTINUED...
A separate detailed report on Company’s Sustainability Development also forms part of the Annual Report.
Recognising sustainable development as a core requirement to strategically improve the value of our business, the Board of Directors constituted a Sustainability Committee effective April 01, 2019 to provide oversight and assistance in building an approach towards sustainability which mirrors our prevailing business ethos of achieving excellence through continuous improvement in our processes and outcomes, while also benchmarking ourselves against our global peers.
Details of the composition of the committee, its terms and reference and the meetings held during FY 2021 is elucidated in the Corporate Governance Report.
Your Company publishes an annual Sustainability Report prepared in accordance with the Global Reporting Initiative (GRI) Standards; mapped to the United Nations Global Compact (UNGC); and aligned to Sustainable Development Goals (SDGs). It reports our approach and disclosure towards triple bottom line principles – People, Planet and Profit.
| Community | Environment | Safety | Occupational Health | Reporting & | ||||
| Relations & Social | Communication | |||||||
| Performance |
As per SEBI directives on Integrated Reporting (IR), the Company has followed the <IR> framework of the International Integrated Reporting Council to report on all the six capitals that are used to create long-term stakeholder value and also provided the requisite mapping of principles between the Integrated Report, the Global Reporting Initiative (‘GRI’) and the Business Responsibility Report (BRR). Hence, a separate BRR is not being published by the Company this year. The Sustainability Report of the Company can be accessed at www.vedantalimited.com.
Energy Conservation, Technology Absorption and Foreign Exchange Earnings & Outgo
The information on conservation of energy, technology absorption stipulated under Section 134(3)(m) of the Act read with Rule 8 of the Companies (Accounts) Rules, 2014, is annexed herewith as ‘Annexure A’.
The details of the Foreign Exchange Earnings and Outgo are as follows:
| (₹ in crore) | ||||||||
| Year ended | Year ended | |||||||
| Particulars | 31 March, 2021 | 31 March, 2020 | ||||||
Expenditure in foreign currency | 1,251 | 1,357 | ||||||
Earnings in foreign currency | 17,706 | 16,462 | ||||||
CIF Value of Imports | 16,447 | 13,512 | ||||||
Corporate Social Responsibility
The year 2020-21 posed an immense challenge in front of the entire Humanity, a new virus emerged and ensured that all things which are otherwise considered normal; comes to a standstill. COVID –19 has affected all spheres of life in the country and the world at large. Despite of all difficulties, Vedanta committed itself to the
planned programmes and reached out to communities across India to fulfill their immediate needs in terms of meals, dry ration, preventive health care etc. The year 2020-21 brought lot of laurels in the hats of Vedanta Group. The group companies have been recognised for Socio-economic impact it has created in the communities through its large-scale CSR Program, receiving of more than 16 National and International awards is a testimony to that. Companies won CII ITC Sustainability Award, IHW Council Health Impact Award, Grant Thornton SABERA Award 2020, ICC Social Impact award 2021 to name a few.
For almost all our programmes, a bottom-up community engagement approach is non-negotiable. This collaborative approach ensures community ownership, suitable project design, effective delivery and post project sustainability.
Our development initiatives are governed by the needs of the communities where we operate. Needs assessment studies form the basis of the course of action undertaken by the BU CSR teams. These actions enable us to create a positive social impact where we operate. All our community development programmes are governed by the Vedanta CSR Policy, and Corporate Technical Standards that are part of the Vedanta Sustainability Framework. Further, to benefit from diverse perspectives, and in keeping with a culture of collective leadership, Vedanta has formed a Group CSR ManCom and Group CSR EXCO.
Vedanta has a strong Board CSR Committee including senior Independent Directors. The Committee provides strategic direction for CSR programmes, and approves its plans and budgets. It also reviews progress and guides the CSR teams towards running well-governed and impactful community programmes.
170
| < BACK TO CONTENTS | Integrated Report | Statutory reports | Financial statements |
An overview of CSR initiatives is provided in earlier section of this Annual Report and report on CSR activities for FY 2020-21 as per Section 135 of Companies Act, 2013 and rules made thereunder forms part of this Directors Report and is annexed hereto as Annexure B. The policy may be viewed at www.vedantalimited.com.
Vedanta’s Efforts to Combat COVID-19 Pandemic
Vedanta, which has been at the forefront of the battle to combat the COVID-19 pandemic, has reached out to communities across 9 states in India to provide them with preventive healthcare and distribute free meals. As part of the Meals for Free programme, the Company has so far provided ~11.46 lakhs meals to daily wage earners across the country. In addition, dry packet rations have been provided to more than 13,500 families from the marginalised sections of the society. On their part, the business units have also distributed more than 49,650 dry ration packets to the local communities.
Vedanta has pledged 10 lakh meals to daily wage earners, and has set up a ₹ 100 crores corpus for daily workers, preventive healthcare and welfare of employees and contract partners. The Company has also contributed ₹ 101 crores to PM-CARES Fund to join forces with the government in fighting the pandemic.
Keeping in mind the poor condition of stray animals, the Company has fed more than 50,000 stray animals every day. The Company has so far provided more than 12.70 lakhs feedings to stray animals in Delhi, Mumbai and Patna.
In a bid to strengthen preventive healthcare, Vedanta has distributed more than 4.5 lakhs masks. The Company has handed over another 2 lakhs N95 masks to the Ministry of Health and Family Welfare. So far, the Company has provided more than 26,000 surgical masks and 75,000 surgical gloves to district hospitals across the country.
Vedanta has also collaborated with the Ministry of Textiles to import 23 machines for indigenously Personal Protective Equipment (PPEs). The imported machines, which are now operational, able to produce 50,000 PPEs per day. The Company has distributed more than 1 lakhs soaps and sanitisers across communities.
BALCO Hospital has set up isolation wards. A 100-bed hospital has been commissioned at Korba in Chhattisgarh. Jharsuguda unit supported District Administration for District Covid Hospital by providing 110 bedded hospital including 10 ICUs, 10 ventilators etc. The Cairn Centre of Excellence (CCoE) in Jodhpur has been handed over to district administration as a quarantine facility with a 120-bed capacity, with meals provided three times a day for 150 people. More than 10 mobile health vans have been made available to district administration for use as ambulances and for distribution of essential commodities by Business Units and Nand Ghars.
More than 1,100 women SHG members were engaged in the stitching of masks and distributing same among
communities. They also contributed more than 10 ton grains to grain banks created for supporting needy families during lockdown. As an act of solidarity with the state governments, Vedanta has contributed ₹ 32.3 crores to different State’s Chief Minister Relief fund COVID-19 Mitigation Fund. Your Company has also procured PPE kits for the Government of Odisha and also arranged food packets, sanitiser kits to migrant workers travelling back to their home states.
Employees have donated one day’s salary, which was contributed by the Company for the relief funds. Vedanta, in collaboration with Apollo Hospitals, has established a 24x7 general helpline for the employees to ensure timely healthcare advice during the lockdown. The services are open for all employees and their families.
Digitalisation initiatives – CSR
Vedanta is committed towards bringing innovation & creating shared values by managing our stakeholders through different community development initiatives in various thematic areas and automation in CSR Governance. It has developed first of its kind (in-house) application – called NIVAARAN for CSR function to manage the community request, needs or grievances and address them on time across Vedanta. Besides this, an in-house, Power BI application was launched across Vedanta in 2020 – CSR DISHA App to monitor the CSR projects of Vedanta across all BUs.
COVID-19 led to the disruption of education for millions of children. eKaksha – in collaboration with the Government of Rajasthan was launched to provide subject and chapter wise learning videos to all students free of cost. One of the biggest engagements was the virtual 5th Cairn Pink City Half Marathon 2020, involving over 40,000 participants from 23 countries, earning a special place as India’s biggest virtual marathon in the Book of Records, UK.
Impact Assessment
The Vedanta Group has been at the very forefront of India’s battle to combat COVID-19, and has made substantial commitments across key regions, communities and markets the group operates various businesses in. A study was carried out through Weber Shandwick to assess and benchmark key initiatives the Group has undertaken to combat COVID-19 pandemic across nine states in India, covering more than 600 respondents across different categories of stakeholders.
| • | Most respondents (~90 %) are happy with the Group’s COVID-19 initiatives. |
| • | 93% of the respondents have rated highly on the quality of assistance provided by the group. |
| • | The reach and efficacy of most initiatives have been rated highly, with distribution of masks and engaging rural SHG women initiatives leading with almost 59% respondents giving an ‘exceptional’ rating to the same. |
The rural beneficiary community has responded well; and is largely happy with most initiatives.
VEDANTA LIMITED | INTEGRATED REPORT AND ANNUAL ACCOUNTS 2020-21 | 171
DIRECTORS REPORT CONTINUED...
HUMAN RESOURCES MANAGEMENT
People and Culture
Your Company has always aspired to build a culture that demonstrates world-class standards in safety, environment and sustainability. People are our most valuable asset and we are committed to provide all our employees with a safe and healthy work environment.
An update on People & Culture detailing the Company’s initiatives, recruitment strategy, hiring projects and talent management and development is elucidated in the Sustainability and ESG Section of the Annual Report.
Employee Stock Option Scheme
Employee stock options is a conditional share plan for rewarding performance on pre-determined performance criteria and continued employment with the Company. It provides a much better line-of-sight to all the employees.
Your Company has established a share incentive schemes viz. ‘Vedanta Limited Employee Stock Option Scheme 2016’ (“the Scheme”). The Scheme was framed with a view to reward employees for their contribution in successful operation of the Company with wealth creation opportunities, encouraging high-growth performance and reinforcing employee pride.
The Scheme was launched after obtaining statutory approvals, including shareholders’ approval by way of postal ballot on December 12, 2016.
On March 31, 2021, the Nomination & Remuneration Committee approved the grant of Employee Stock Options 2020 to Vedanta employees covering 38% of eligible population. In-order to align the scheme with the best-in-class reward practices globally and pertinent Indian peers, as well as to emphasise on our value system of ‘CARE’ for employees and culture of ‘Pay for Performance’ the ESOS 2020 plan has undergone significant transformation. The grant under the ESOS 2020 is completely driven by Business and Individual performance.
The new design has made our scheme even more robust with an objective to place greater prominance on superior individual performance thereby recognise high performing talent while keeping them accountable for business delivery. It has been ensured that the scheme fulfills its motive of wealth creation for employees to fulfill their financial goals and gives them the sense of ownership.
To give prime importance to business delivery, ESG and Carbon footprint have been added as additional parameters to measure business performance. To ensure that we operate sustainably in line with our motto of ‘zero harm, zero waste and zero discharge’, multiplier based on fatalities has also been included as a performance parameter for vesting.
The Scheme is currently administered through Vedanta Limited ESOS Trust (ESOS Trust) which is authorised by the Shareholders to acquire the Company’s shares from secondary market from time to time, for implementation
of the Scheme. The details of the trustees are provided can be accessed at www.vedantalimited.com.
No employee has been issued stock options during the year, equal to or exceeding one percent of the issued capital of the Company at the time of grant.
During the year, the acquisition by the trust does not exceeded 2% of the paid-up capital of the Company. Further, the total acquisition by trust at no time exceeded 5% of the paid-up equity capital of the Company.
Pursuant to the provisions of SEBI (Share Based Employee Benefits), Regulations, 2014 (“Employee Benefits Regulations”), disclosure with respect to the ESOS Scheme of the Company as on March 31, 2021 is available on the website of the Company at www.vedantalimited.com.
The Company confirms that the Scheme complies with the SEBI Employee Benefits Regulations and there have been no material changes to the plan during the financial year.
A certificate from M/s SR Batliboi & Co. LLP, Chartered Accountants, Statutory Auditors, with respect to the implementation of the Company’s ESOS schemes, would be placed before the shareholders at the ensuing Annual General Meeting (AGM). A copy of same is available for inspection by Members through Electronic Mode.
Managerial Remuneration, Employee Information and Related Disclosures
The remuneration paid to Directors, Key Managerial Personnel, and Senior Management Personnel during FY 2020-21 was in accordance with the Nomination and Remuneration Policy of the Company.
Disclosures under Section 197 of the Act and Rule 5(1) of the Companies (Appointment and Remuneration of Managerial Personnel) Rules, 2014 (“Rules”) relating to the remuneration and other details as required is appended as Annexure C to the Report.
In terms of provision of Section 136 of the Act and Rule 5(2), the Report and the Financial Statements are being sent to the Members of the Company excluding the statement of particulars of employees as prescribed under Rule 5(2) of the Rules. The said information is available for inspection through electronic mode. Any member interested in obtaining a copy of the said statement may write to the Company Secretary and the same will be furnished upon such request.
Compensation Governance Practices at Vedanta
Vedanta has been built on a strong foundation of governance where the Board, Key Executives and Compliance Officer have been vigilant and committed to ensure structural integrity, soundness and highest standards of compensation practices. Over the last few years we have matured many of our reward practices as an attempt to continue to raise the bar.
| • | The composition of Nomination and Remuneration Committee (NRC) is in compliance with the Listing Regulations and majority of the members are Independent Directors. The Chairman of the committee is an Independent Director. |
172
| < BACK TO CONTENTS | Integrated Report | Statutory reports | Financial statements |
| • | The members of the NRC together bring out the rich expertise, diverse perspectives and independence in decision-making on all matters of remuneration for Directors, Key Managerial Personnel (KMP) & Senior Management Personnel (SMP). The Independent Directors are actively engaged throughout the year as members of the NRC in various people matters even beyond remuneration. |
| • | A board charter appoints and sets our primary responsibilities of NRC which includes selecting, compensating, monitoring and, when necessary, replacing key executives and overseeing succession planning. |
| • | Best-in-class independent consultants are engaged to advise and support the committee on matters of board evaluation and leading reward practices in the industry. |
| • | The Executive Compensation Philosophy is well established and benchmarked across relevant industry comparators which enables us to differentiate people on the basis of performance, potential and criticality in-order to provide a competitive advantage in the industry. |
| • | The Total Reward Philosophy at Vedanta is built on the core objective of driving ‘Pay for Performance’ culture. The appropriate mix of components of the Executive Compensation aim to drive the short as well as long-term interests of the Company and its shareholders through strong emphasis on operational / financial fundamentals, social license to operate and business sustainability, strategic objectives of resource and reserve creation and wealth creation for stakeholders. |
| • | Timely risk assessment of compensation practices is done in addition to review of all components of compensation for consistency with stated compensation philosophy: |
| • | Financial analysis & simulation of the long- term cost of reward plans and their Return on Investments (ROI). |
| • | Provision of claw back clause as part of the ground rules of our long-term incentive scheme for all our leaders. |
| • | Upper limits and caps defined on incentive pay-outs in the event of over-achievement of targets to avoid windfall gains. |
| • | We do not encourage provision of excessive perks or special clauses as part of employee contract such as: |
| • | No provision of Severance Pay in Employment contracts of Whole-Time Directors (WTD), KMP & SMP. |
| • | No Tax Gross up done for executives except for expatriates as part of tax equalisation |
| • | No provision of unearned Incentives/unvested Stock or Cash Options |
Any benefit provided to Key Executives are available to all the employees of the Company as per the defined Company policy.
| • | Voice of the employee: We ensure the involvement of bright minds from diverse functions in the organisation and well-known external partners in designing and driving the major incentive schemes in the organisation. Our policies are transparent and informed to employees in a timely manner confirming that the employees have a say in all our practices. |
We continue to corroborate the Internal Pay Equity Principles, sustained attention to equity grant practices and maintain checks & balances to confirm that the practices are legally and ethically compliant with International, national and state/regional laws.
Prevention of Sexual Harassment at Workplace
The Company has zero tolerance for sexual harassment at workplace and has adopted a Policy on Prevention, Prohibition and Redressal of Sexual Harassment at Workplace in line with the provisions of the Sexual Harassment of Women at Workplace (Prevention, Prohibition and Redressal) Act, 2013 and the Rules thereunder for prevention and redressal of complaints of sexual harassment at workplace.
As part of Vedanta Group, your Company is an equal opportunity employer and believes in providing opportunity and key positions to women professionals. The Group has endeavoured to encourage women professionals by creating proper policies to tackle issues relating to safe and proper working conditions and create and maintain a healthy and conducive work environment that is free from discrimination. This includes discrimination on any basis, including gender, as well as any form of sexual harassment. During the period under review, three complaints were received and resolved. Your Company has constituted Internal Complaints Committee (ICC) for various business divisions and offices, as per the requirements of the Sexual Harassment of Women at Workplace (Prevention, Prohibition and Redressal) Act, 2013.
RISK MANAGEMENT
Risk Management
The businesses are exposed to a variety of risks, which are inherent to a global natural resources organisation. The effective management of risk is critical to support the delivery of the Group’s strategic objectives. Risk management is embedded in the organisation’s processes and the risk framework helps the organisation meet its objectives by aligning operating controls with the mission and vision of the Group set by the Board.
As part of our governance philosophy, the Board has a Risk Management Committee to ensure a robust risk management system. The details of Committee and its terms of reference are set out in the Corporate Governance Report, which forms part of this Annual Report.
VEDANTA LIMITED | INTEGRATED REPORT AND ANNUAL ACCOUNTS 2020-21 | 173
DIRECTORS REPORT CONTINUED...
With effect from June 6, 2020, the Risk Management Committee has been consolidated with the Audit Committee comprising of only Independent Directors ensuring robust risk management systems in place with valued feedback of Independent Directors being on the Committee.
Our risk-management framework is designed to be simple, consistent and clear for managing and reporting risks from the Group’s businesses to the Board. Our management systems, organisational structures, processes, standards and code of conduct together form the system of internal controls that govern how we conduct business and manage associated risks. We have a multi-layered risk management framework to effectively mitigate the various risks, which our businesses are exposed to in the course of their operations.
The Audit & Risk Management Committee aids the Board in the risk management process by identification and assessment of any changes in risk exposure, review of risk control measures and by approval of remedial actions, where appropriate. The Committee is in turn supported by the Group Risk Management Committee which helps the Audit & Risk Management Committee in evaluating the design and operating effectiveness of the risk mitigation programme and the control systems.
Major risks identified by businesses and functions are systematically addressed through mitigating actions. Risk officers have also been formally nominated at operating businesses, as well as at Group level, to develop the risk-management culture within the businesses.
The Risk Management Policy of the Company revised in 2019 covers cyber security as well.
For a detailed risk analysis, you may like to refer to the risk section in the Management Discussion and Analysis Report which forms part of this Annual Report.
Cyber Security
The Group has a structured framework for cyber security. Each of the Business Units has a CIO (Chief Information Officer) with suitable experience in Information / Cyber security. Every year, cyber security review is carried out by IT experts (belonging to IT practices of Big-4 firms). Vulnerability Assessment and Penetration Testing (VAPT) review is also carried out by cyber experts. This practice has been in place for several years now and has helped in strengthening the cyber security environment in the group. At the same time, the external environment on cyber security is continuously evolving. The respective CIOs are responsible for ensuring appropriate controls are in place to address the emerging cyber risks.
Internal Financial Controls
Your Board has devised systems, policies and procedures/ frameworks, which are currently operational within the Company for ensuring the orderly and efficient conduct of its business, which includes adherence to policies, safeguarding its assets, prevention and detection of frauds and errors, accuracy and completeness of the accounting records and timely preparation of reliable
financial information. In line with best practices, the Audit & Risk Management Committee and the Board reviews these internal control systems to ensure they remain effective and are achieving their intended purpose. Where weaknesses, if any, are identified as a result of the reviews, new procedures are put in place to strengthen controls. These controls are in turn reviewed at regular intervals.
The systems/frameworks include proper delegation of authority, operating philosophies, policies and procedures, effective IT systems aligned to business requirements, an internal audit framework, an ethics framework, a risk management framework and adequate segregation of duties to ensure an acceptable level of risk. Documented controls are in place for business processes and IT general controls. Key controls are tested by entities to assure that these are operating effectively. Besides, the Company has also adopted an SAP GRC (Governance, Risk and Compliance) framework to strengthen the internal control and segregation of duties/ access.
The Company has documented Standard Operating Procedures (SOP) for procurement, project/expansion management capital expenditure, human resources, sales and marketing, finance, treasury, compliance, Safety, Health and Environment (SHE), and manufacturing.
The Group’s internal audit activity is managed through the Management Assurance Services (‘MAS’) function. It is an important element of the overall process by which the Audit & Risk Management Committee and the Board obtains the assurance on the effectiveness of relevant internal controls.
The scope of work, authority and resources of MAS are regularly reviewed by the Audit & Risk Management Committee. Besides, its work is supported by the services of leading international accountancy firms.
The Company’s system of internal audit includes covering monthly physical verification of inventory, a monthly review of accounts and a quarterly review of critical business processes. To enhance internal controls, the internal audit follows a stringent grading mechanism, focusing on the implementation of recommendations of internal auditors. The internal auditors make periodic presentations on audit observations, including the status of follow-up to the Audit & Risk Management Committee.
The Company is also required to comply with the Sarbanes Oxley Act Sec 404, which pertains to Internal Controls over Financial Reporting (ICOFR). Through the SOX 404 compliance programme, which is aligned to the Committee of Sponsoring Organizations of the Treadway Commission (COSO) framework, the Audit & Risk Management Committee and the Board also gains assurance from the management on the adequacy and effectiveness of ICOFR.
174
| < BACK TO CONTENTS | Integrated Report | Statutory reports | Financial statements |
In addition, as part of their role, the Board and its Committees routinely monitor the Group’s material business risks. Due to the limitations inherent in any risk management system, the process for identifying, evaluating, and managing the material business risks is designed to manage, rather than eliminate risk. Besides it created to provide reasonable, but not absolute assurance against material misstatement or loss.
Since the Company has strong internal control systems which are further strengthened by periodic reviews as required under the Listing Regulations and SOX compliance by the Statutory Auditors, the CEO and CFO recommend to the Board continued strong internal financial controls.
There have been no significant changes in the Company’s internal financial controls during the year that have materially affected or are reasonably likely to materially affect its internal financial controls, other than as mentioned in the “Audit Report and Auditors” section to this report.
There are inherent limitations to the effectiveness of any system of disclosure controls and procedures, including the possibility of human error and the circumvention or overriding of the controls and procedures. Accordingly, even effective disclosure controls and procedures can only provide reasonable assurance of achieving their objectives. Moreover, in the design and evaluation of the Company’s disclosure controls and procedures, the management was required to apply its judgement in evaluating the cost-benefit relationship of possible controls and procedures.
Further, the Audit & Risk Management Committee annually evaluates the internal financial controls for ensuring that the Company has implemented robust systems/framework of internal financial controls viz. the policies and procedures adopted by the Company for ensuring the orderly and efficient conduct of its business, including adherence to Company’s policies, the safeguarding of its assets, the prevention and detection of frauds and errors, the accuracy and completeness of the accounting records, and the timely preparation of reliable financial information.
Vigil Mechanism
The Company has in place a robust vigil mechanism for reporting genuine concerns through the Company’s
Whistle-Blower Policy. As per the Policy adopted by various businesses in the Group, all complaints are reported to the Director – Management Assurance, who is independent of operating management and the businesses. In line with global practices, dedicated e-mail IDs, a centralised database, a 24X7 whistle-blower hotline and a web-based portal have been created to facilitate receipt of complaints. All employees and stakeholders can register their integrity related concerns either by calling the toll-free number or by writing on the web-based portal which is managed by an independent third party. The hotline provides multiple local language options. All cases reported as part of whistle-blower mechanism are taken to their logical conclusion within a reasonable timeframe. After the investigation, established cases are brought to the Group Ethics Committee for decision-making. All Whistle-Blower cases are periodically presented and reported to the Company’s Audit & Risk Management Committee. The details of this
process are also provided in the Corporate Governance Report and the Whistle-Blower Policy is available on the Company’s website at www.vedantalimited.com.
Management Discussion and Analysis
The Management Discussion and Analysis Report for the year under review, as specified under Regulation 34 read with Schedule V of Listing Regulations is presented in a separate section, forming part of this Annual Report.
INNOVATION, DIGITALISATION AND TECHNOLOGY
Innovation, Digitalisation & Technology
As Vedanta looks to continue to build on its strategic vision-the Group and senior leadership have crafted an aggressive plan to instill Digital innovation in all aspects of the business. It is the group’s ambition to leverage cutting edge technology and partners to drive best in class operations and sustainability. In this connection-your Company has greenlit multiple flagship programmes to not only drive the overall transformation journey, but also to build the internal “Digital muscle” to sustain the gains of the transformation.
At Vedanta we are going for a group-wide digital transformation, Project Pratham with the vision of transforming Vedanta Group into a truly digital-first organisation and making digital the new way of working. Project Pratham is delivering digital transformation across our Mining & Metals and Oil & Gas business with a focus on driving asset optimisation, production volume growth, operating cost reductions, enhanced safety and improve ease of doing business. The objective of the programme is to deliver a combination of tangible value in the form of EBITDA increase and other intangible gains such as enhanced safety and security, sustainability, better governance, and improved employee productivity. To sustain this change, a clear roadmap is also drawn for augmenting capabilities in the areas of Digital, Smart Manufacturing, Analytics, Automation and Cyber security.
To engage with innovative start-ups and leverage their technological capabilities and agility-Vedanta Spark programme was launched in Oct’ 20. The programme has attracted 1,300 startups with more than a million impressions across social media platforms. With the objective of solving key problems across business units, Vedanta is looking to partner with top digital and core tech startups.
In addition, the Company has launched group-wide idea generation competition-Pratham Digtial Olympics, to incentivise grass-root level innovations and bring digital cultural change.
Policy and Advocacy
Vedanta believes in sustainable and equitable development of natural resource sector. While engaging in public policy and regulatory matters, our Advocacy efforts evolve around our core values. Our Company participates in stakeholder consultations on economic reforms, raw material & energy security, taxation, environmental development, business continuity, ease of doing business, sustainable business practices and other policy and regulatory matters which are related to our business in a responsible manner. We are associated with various industry associations and chambers for submission of our representations to relevant ministries, government departments and regulatory bodies both at the Centre and State levels.
VEDANTA LIMITED | INTEGRATED REPORT AND ANNUAL ACCOUNTS 2020-21 | 175
DIRECTORS REPORT CONTINUED...
Research and Development
Vedanta has been an aggressive leader in terms of adopting new technologies and improving processes and standards. Hindustan Zinc Limited’s (HZL) Technology centre works in the interface between science and business that offers opportunity to process innovative ideas to technology. Principal focus area includes process improvements, development work for future growth, new technology development and adaptation, minor metal recovery and waste to wealth initiatives. R&D team has implemented/finalised projects on recovery improvement, cost reduction, process optimisation and evaluation of advance technologies. Some of the key projects at mills are: alternative non-hazardous and cost effective reagent for nigrosine, improvement in Zawar recovery by process audits & individual ore type characterisation, Geo-Metallurgy study for SK Mine and RA Mine on advance Drill Cores for Metallurgical characterization and completed feasibility study for 3% Pb-Ag recovery improvement by Pb regrinding at RAM & Derrick screen at Zawar.
Hindustan Zinc achieved a big milestone, being granted two US patents for two technologies developed in-house by state of art R&D centre-Zntech. The two patents are:
| 1. | Technology for manufacturing paver blocks from process waste material. |
| 2. | Method for production of potassium antimony tartrate by utilising antimony residues of smelter. |
In Aluminium and Power Business, Vedanta has entered into the partnership with three research institutes namely CSIR-National Metallurgical Laboratory (NML), Jamshedpur, Institute of Minerals and Materials Technology (IMMT), Bhubaneswar, and Jawaharlal Nehru Aluminium Research, Development & Design Centre (JNARDDC), Nagpur. As part of this, all three research institutes shall work together to develop technologies for bauxite residue utilisation, like red mud beneficiation for REE enrichment, recovery of alumina values, recovery of iron values and process for extraction and separation of Titanium and REEs (La, Ce, Y, Sc).
Vedanta Aluminium has one of the finest and best-in-class R&D setups among peers in the aluminium value chain. We are already collaborating with customers in the auto industry to develop customised aluminium alloys and products, catering to their objective of achieving desired light weighting for EVs and hybrids of the future. Case in point, Vedanta pioneered PFAs (Primary Foundry Alloys) for the Indian market. We were the first in India to supply PFA to the domestic auto sector and until we did so, the country’s entire PFA demand was being met through imports, even though India has the world’s second-largest aluminium production capacity.
In Cairn, we continue to operate our fields in a digital manner through unmanned well pads with remote access which drastically reduces human exposure to risk and increases operational efficiency. Centralised control rooms, remotely activated surface facilities and digital surveillance platform (BabelFish) has allowed high uptime in operation of Mangala Processing Terminal, over 500 wells spread across many acres, centralised polymer processing farm and the world’s largest continuously heated pipeline. Our other businesses also continue to lead the industry in terms of R&D. Copper for example has created Pure Tellurium Extraction to produce copper anodes (99.5% pure) and Ferric Sulphate Extraction from Copper Slag which is our by-product. In Iron Ore Business, Value Added Business team had developed a customised product, Sesa Special Grade (SSG) for a niche segment (otherwise being imported by customers) by producing high purity pig iron through blast furnace route. The Value Added Business team had also come up with an innovative idea of producing Foundry Grade Pig Iron outside the blast furnace using Ferro Silicon which otherwise normally gets produced in blast furnace by compromising on productivity & high fuel rate. Some other examples are automation of the charging plate insertion mechanism, employee care applications, automatic trip counting and dynamic allocation of hauling units and GPS controlled speed tracking system in dispatch trucks. Our businesses continue their tremendous work in these areas to make the group more sustainable.
INVESTOR RELATIONS
Your Company has an active Investor Relations (IR) function which continuously strives for excellence by engaging with international and domestic investors. Your Company benchmarks global IR standards and aims at exceeding them. The Company proactively seek feedback from all stakeholders throughout the year.
Shareholder engagement
The Investor Relations team takes both formal and informal approach to engage with shareholders. The team interacts with investors at various platforms demonstrating consistent and clear communication between internal and external parties. Some of these forums include quarterly earnings calls, hosting Investor/Analyst Day, site visits for key businesses, one-on-one as well as group meetings and participation in sell-side conferences. The leadership teams from various businesses along with promoters of the Company as well as senior management consisting of the CEO and the CFO are also invited as required for some of these engagements. These proactive investor engagement activities and openness of senior leaders to interact with investors and analysts is well appreciated by all stakeholders.
Shareholder communication
Shareholders can contact us any time through our Investor Relations team, with contact details available online at www.vedantalimited.com. Shareholder and analyst feedbacks are shared in a timely and structured manner with the Board through the Chairman, the Senior Independent Director, the CEO, the CFO, and the Company Secretary. Ongoing communication with our stakeholders keeps the board and senior management abreast of their views and helps to gain insight.
176
| < BACK TO CONTENTS | Integrated Report | Statutory reports | Financial statements |
Shareholder disclosures
Vedanta has set standards through the detailed and transparent disclosures on the Company’s operational and financial performance. Your Company had created its first Integrated Report (for Financial Year 2018) and continued thereafter. The Company has also been conferred with the prestigious LACP and ICAI award for its FY 2020 Integrated report. Having a diverse shareholder base and multiple business verticals, demands enormous efforts from an IR function to manage investors, sell-side analysts as well as ensuring a timely and complete business update is provided to all. As a key milestone in this continuing endeavour, your Company created a digital interactive microsite on the corporate website to provide an interactive experience beyond what is available in the annual and quarterly results materials.
Key Initiatives with respect to various stakeholders
As a diligent driver of all-encompassing stakeholder growth, the Company undertakes significant initiatives with respect to its employees, shareholders, investors, lenders, suppliers, customers, civil society, local community, and Government authorities striving to accelerate its focus on HSE and sustainability. These initiatives are enlisted with detailed specifics in the Integrated Report section of the Annual Report. Along with the Integrated Report, the Company also publishes the Sustainability Report which details the Company’s initiatives in the ESG space for a holistic overview to investors.
CORPORATE GOVERNANCE
Report on Corporate Governance
Your Company is committed to maintaining the highest standards of corporate governance in the management of its affairs and ensuring its activities reflect the culture we wish to nurture with our colleagues and other stakeholders.
As part of commitment to the various stakeholders, the Company follows global best practices. To meet its obligations towards its shareholders and other stakeholders, the Company has a corporate culture of conscience and consciousness; integrity, transparency and accountability for efficient and ethical conduct of business.
Our continued focus on improving the corporate governance mechanisms and on enhancing the efficiency curve, transparency and accountability of our operations will enable us to lead the way for the industry.
Our disclosures seek to attain the best practices in international corporate governance and we constantly endeavour to enhance long-term shareholder value. Our Corporate governance report for fiscal 2021 forms part of this Annual Report.
Directorate, Key Managerial Personnel and Senior Management Personnel
The Board of Directors of the Company provide entrepreneurial leadership and plays a crucial role in providing strategic supervision, overseeing the management performance, and long-term success of the Company while ensuring sustainable shareholder value. Driven by its guiding principles of Corporate Governance, the Board’s actions endeavour to work in best interest of the Company.
The Directors hold a fiduciary position, exercises independent judgement and plays a vital role in the oversight of the Company’s affairs. Our Board represents a tapestry of complementary skills, attributes, perspectives and includes individuals with financial experience and a diverse background.
In line with the recommendation of SEBI and our relentless endeavour to adhere to the global best practices, the Company is chaired by Mr. Anil Agarwal, Non-Executive Chairman effective April 1, 2020.
During the year, your Company welcomed Ms. Padmini Somani and Mr. Dindayal Jalan as an Independent Director of the Company effective February 5, 2021 and April 1, 2021 respectively. In the opinion of the Board:
| • | Ms. Somani has rich experience in the philanthropy and development space for over 20 years and holds highest standards of integrity and has also been recognised for her work in youth education, health and skilling programmes with vulnerable and marginalised populations. Based on Ms. Somani’s prolific skill set and experience in corporate social responsibility, your Board believes that Ms. Somani will be an incredible asset to the Board as we remain committed to reinvest in the social good of our neighbourhood communities and nation; and |
| • | Mr. Dindayal Jalan has rich and diverse experience of over 40 years in business operations, financial management, corporate negotiations, financial control, business planning, due diligence, business development, treasury, capital raising, business restructuring, investor relations, commercial, taxation, people development and strategic planning and is a person of integrity. With bringing good blend of technical and financial experience, your Board believes that Mr. Jalan’s induction will broaden the Board’s experience, bringing in complementary skills and expertise in diverse areas. |
Accompanying Ms. Somani’s and Mr. Jalan’s detailed profile provided in the earlier section of the Annual Report, this statement forms a part of the Directors’ Report in accordance with the Companies (Accounts) Amendment Rules, 2019 notified to hold effect from December 1, 2019.
VEDANTA LIMITED | INTEGRATED REPORT AND ANNUAL ACCOUNTS 2020-21 | 177
DIRECTORS REPORT CONTINUED...
Mr. Sunil Duggal, appointed as Interim Chief Executive Officer and Key Managerial Personnel of the Company effective April 06, 2020 and CEO of the Company for a fixed term of 3 years w.e.f. August 01, 2020 has been appointed as Whole-Time Director & CEO and KMP of the Company effective from April 25, 2021 till July 31, 2023. Mr. Duggal brings with him over 36 years of experience of leading high-performance teams and more than 20+ years in leadership positions. He is known for his ability to calmly navigate through tough and challenging times, nurture and grow a business, evaluate opportunities & risks and successfully drive efficiency & productivity whilst reducing costs & inefficiencies and deliver innovative solutions to challenges. Brief Profile of Mr. Duggal is provided in earlier section of this Annual Report and can be accessed at www.vedantalimited.com.
The Key Managerial Personnel and Senior Management Personnel, similarly, comprises of multifarious leaders with each member bringing in their key proficiency in different areas aligned with our business and strategy.
A comprehensive update on the change in the Directorate, Key Managerial Personnel and Senior Management Personnel of the Company along with the directorships held in other Companies, their skills and expertise have been explicated in the Corporate Governance report forming part of this Annual Report.
Director Retiring by Rotation
As per the provisions of Companies Act, 2013, Mr. Anil Agarwal (DIN: 00010883), Non-Executive Director designated as Chairman of the Company, is liable to retire by rotation at the ensuing AGM and being eligible, offers himself for re-appointment. Based on the performance evaluation and recommendation of the Nomination & Remuneration Committee, Board recommends his re-appointment.
Brief Profile and other related information seeking re-appointment is provided in the AGM Notice.
Board and Committees
The Board has overall responsibility for establishing the Company’s purpose, values and strategy to deliver the long-term sustainable success of the Company and generate value for shareholders. The Board places great importance on ensuring these key themes continue to be appropriate for the businesses and markets in which we operate around the world, while being aligned with our culture.
The Board is supported by the activities of each of the Board Committees which ensure the right level of attention and consideration are given to specific matters. Accordingly, the Board has established Committees to assist it in exercising its authority.
Each of the Committees has terms of reference under which authority is delegated by the Board.
At present, the Company has the following Board Committees which ensures greater focus on specific aspects of Corporate Governance and expeditious resolution of issues of governance as and when they arise.
An all-embracing update on the Board, its committees, their composition, terms and reference, meetings held during FY 2021 and the attendance of each member is detailed in the Corporate Governance Report.
178
| < BACK TO CONTENTS | Integrated Report | Statutory reports | Financial statements |
Statutory Board Committees
| Audit & Risk | Nomination & | Corporate Social | Stakeholders | |||
| Management | Remuneration | Responsibility | Relationship | |||
| Committee | Committee | Committee | Committee |
Other Committees
| Sustainability | Share and Debenture | Committee of | ||||
| Committee | Transfer Committee | Directors |
| 1. | With effect from June 6, 2020, the Risk Management Committee has been consolidated with the Audit Committee comprising of only Independent Directors. |
| 2. | Effective May 16, 2020, Finance Standing Committee has been consolidated with the Committee of Directors. |
Board Effectiveness
Familiarization Program for Board Members
Your Company has developed comprehensive induction processes for our new Board members which aim to provide a broad introduction to the Group and enable new directors to contribute to the Board’s deliberations from the outset. The details of the familiarization programme and process followed are provided in the Corporate Governance Report forming part of this Annual Report and can also be accessed on the website of the Company at www.vedantalimited. com.
Annual Board Evaluation
The Board is committed to transparency in assessing the performance of Directors. The Board conducts annual evaluations of its performance, the performance of its Committees, the Chair, CEO, Directors and the governance processes that support the Board’s work.
As a part of governance practice, the Company, had engaged a leading consultancy firm, to conduct the Board Evaluation Process which was facilitated through an online secured module ensuring transparent, effective and independent of the management.
The evaluation parameters and the process have been explained in the Corporate Governance Report.
Board Diversity and Inclusion
The Board sets the tone for inclusion and diversity across the Group and believes it is important to have an appropriate balance of skills, knowledge, experience and diversity on the Board and at senior management level to ensure good decision-making. It recognises the need to create conditions that foster talent and encourage all colleagues to achieve their full potential. A diverse Board with a range of views enhances decision-making which is beneficial to the Company’s long-term success and in the interests of Vedanta’s stakeholders.
Additional Details on the Board Diversity and the key attributes of the Board Members are explicated in the Corporate Governance Report forming part of this Annual Report.
Policy on Directors’ Appointment & Remuneration
The Nomination & Remuneration Policy adopted by the Board on the recommendation of the Nomination &
Remuneration Committee enumerates the criteria for assessment and appointment/re-appointment of Directors, Key Managerial Personnel (KMP) and Senior Management Personnel (SMP) on the basis of their qualifications, knowledge, skill, industrial orientation, independence, professional and functional expertise among other parameters with no bias on the grounds of ethnicity, nationality, gender or race or any other such discriminatory factor.
VEDANTA LIMITED | INTEGRATED REPORT AND ANNUAL ACCOUNTS 2020-21 | 179
DIRECTORS REPORT CONTINUED...
The Policy also sets out the guiding principles for the compensation to be paid to the Directors, KMP and SMP; and undertakes effective implementation of Board familiarisation, diversity, evaluation and succession planning for cohesive leadership management.
With your Company continuing to comply with the Policy in true letter and spirit, the complete Policy is reproduced in full on our website at www.vedantalimited.com and a snapshot of the Policy is elucidated in the Corporate Governance Report.
Observance of the Secretarial Standards
The Directors state that proper systems have been devised to ensure compliance with the applicable laws. Your company adheres and complies with the applicable Secretarial Standards issued by the Institute of Companies Secretaries of India (ICSI).
Independent Directors Statement
The Company has received declaration from all the Independent Directors that they continue to meet the criteria of independence as provided under the Companies Act and Listing Regulations and comply with the Code for Independent Directors as specified under Schedule IV of the Act.
The Directors have also confirmed that they are not aware of any circumstance or situation, which exists or may be reasonably anticipated, that could impair or impact their ability to discharge their duties with an objective independent judgement and without any external influence.
Further, in compliance with Rule 6(1) and 6(2) of the Companies (Appointment and Qualification of Directors) Rules, 2014, all Independent Directors of the Company have registered themselves with the Indian Institute of Corporate Affairs (IICA).
Annual Return
In terms of provisions of Section 92, 134(3)(a) of the Companies Act, 2013 read with Rule 12 of Companies (Management and Administration) Rules, 2014, the Annual Return in Form MGT-7 for the financial year ended March 31, 2021 is put up on the Company’s website and can be accessed at www.vedantalimited.com.
Audit Reports and Auditors
Audit Reports
| • | The Statutory Auditors have issued unmodified opinion on the financial statements of the Company as of and for the year ended March 31, 2021. Their |
report on the Internal Financial Controls, contains a qualification, related to the effectiveness of the Company’s internal financial controls over financial reporting as at March 31, 2021 with respect to benchmarking the terms and authorisation of loans and guarantees between itself or its subsidiaries with controlling shareholders and their affiliates. In the said report, the Statutory Auditors have considered the material weakness identified in determining the nature, timing and extent of audit tests applied in their audit of the March 31, 2021, financial statements of the Company, and concluded that the material weakness does not affect their opinion on the financial statements of the Company. |
The management’s response is as follows:
During the year, the Company has updated its policies regarding benchmarking the terms and authorisations for such related party transactions. The Board will continue to monitor compliance with such policies. However, the material weakness described above did not result in material misstatements to the financial statements.
The Statutory Auditors’ report for FY 2020-21 does not contain any other qualification, reservation or adverse remarks which calls for any explanation from the Board of Directors. The Auditors’ report is enclosed with the financial statements in the Annual Report.
| • | The Secretarial Auditors’ Report for FY 2020-21 does not contain any qualification, reservation or adverse remark. The report in form MR-3 along with Annual Secretarial Compliance Report is enclosed as Annexure D to the Directors’ Report. |
Auditors Certificates
| • | As per the Listing Regulations, the auditors’ certificate on corporate governance is enclosed as an Annexure to the Corporate Governance Report forming part of the Annual Report. The Certificate does not contain any other qualification, reservation or adverse remark except as mentioned in the report. |
| • | A certificate from Company Secretary in Practice certifying that none of the directors on the Board of the Company have been debarred or disqualified from being appointed or continuing as directors of companies by the SEBI / Ministry of Corporate Affairs or any such statutory authority forms part of the Corporate Governance Report. |
180
| < BACK TO CONTENTS | Integrated Report | Statutory reports | Financial statements |
| Auditors | ||||
| Statutory Auditors | • M/s S.R. Batliboi & Co. LLP, Chartered Accountants (Firm Registration No. 301003E / E300005) had been appointed as the Statutory Auditors of the Company till the conclusion of 56th Annual General Meeting, to be held in calendar year 2021. | |||
• The Auditors have confirmed that they are not disqualified from being re-appointed as Statutory Auditors of the Company. | ||||
• The report of the Statutory Auditors along with notes to financial statements is enclosed to this Report. The Notes on financial statements referred to in the Auditors’ Report are self-explanatory and do not call for any further comments. | ||||
• The auditors have also furnished a declaration confirming their independence as well as their arm’s length relationship with the Company. The Audit & Risk Management Committee reviews the independence and objectivity of the auditors and the effectiveness of the audit process. | ||||
• The Statutory Auditors were present at the last AGM of the Company. | ||||
| Secretarial Auditors | • M/s Chandrasekaran & Associates (Firm Registration No. 002500), Practicing Company Secretaries had been appointed by the Board to conduct the secretarial audit of the Company for financial year 2020-21. | |||
• The Company had received a certificate confirming their eligibility and consent to act as the Auditors. | ||||
• The Secretarial Audit Report for the financial year ended March 31, 2021 forms part of this report and confirms that the Company has complied with the provisions of the Act, Rules, Regulations and Guidelines and that there were no deviations or non-compliances. | ||||
• Pursuant to SEBI circular no. CIR/CFD/CMO1/27/2019 dated February 8, 2019, the Company has also undertaken an audit for all applicable compliances as per the Listing Regulations and circular guidelines issued thereunder. The Annual Secretarial Compliance Report for the financial year 2020-21 has also been submitted to the Stock Exchanges within the stipulated timeline. | ||||
• The Secretarial Auditors were also present at the last AGM of the Company. | ||||
| Cost Auditors | • M/s Shome and Banerjee and M/s Ramnath Iyer & Co., Cost Accountants, had been appointed by the Board to conduct the audit of cost records of the Oil & Gas Business and other Business segments of the Company respectively for the financial year 2020-21. | |||
• M/s Ramnath Iyer & Co., Cost Accountants were nominated as the Lead Cost Auditors. | ||||
• The Company had received a certificate confirming their eligibility and consent to act as the Auditors. | ||||
• The cost accounts and records of the Company are duly prepared and maintained by the Company as required under Section 148(1) of the Act pertaining to cost audit. | ||||
| Internal Auditors | • M/s Deloitte Haskins & Sells, LLP had been appointed as the Internal Auditors of the Company for Financial Year 2020-21 to conduct the Internal Audit on the basis of detailed Internal Audit Plan. | |||
• The Company has an independent in-house Management Assurance Services (MAS) team to manage the group’s internal audit activity and that functionally reports to the Audit & Risk Management Committee. | ||||
VEDANTA LIMITED | INTEGRATED REPORT AND ANNUAL ACCOUNTS 2020-21 | 181
DIRECTORS REPORT CONTINUED...
Reporting of Fraud by Auditors
During the reporting year, under Section 143(12) of Companies Act, 2013, none of the Auditors of the Company have reported to the Audit & Risk Management Committee of the Board any instances of fraud committed against the Company by its officers or employees.
Legal, Compliance, Ethics and Governance Function
Through its concerted efforts to generate value while keeping integrity at the forefront, the Legal function of your Company is a valued partner in providing regulatory support and gauging the viability of strategic assistance for business partnership and expansion. It ensures advisory and compliance services pertaining to existing regulations and legislative developments for facilitating business agenda in the areas of effective claims and contract management, mergers and acquisitions, dispute resolution, litigation and adherence to competition, business ethics and governance.
With the aim to ensure smooth operations and safeguard interests of your Company for business growth and sustenance in an evolving, ambiguous and complex environment, the function continues to focus on presenting areas of opportunities; mitigating risks; providing proactive assistance to other functions and departments; and bringing about policy changes based on persistent interaction with various Government bodies and industrial associations like CII and FICCI.
As newer technologies continue to transform the market, your Company ensures adeptness in mechanisms to safeguard the data security and privacy of our stakeholders with enhanced legal and security standards. Simultaneously, to meet the growing business needs, the Legal function continues to seek and identify technological opportunities while harnessing existing know-how to streamline compliance frameworks, litigation management and conduct online ethics awareness training.
Our organisational values and principles are made applicable to all our employees through our Code of Business Conduct and Ethics. In a bid to create a better understanding of its practical implications, the Legal function conducts an annual online ethics training module to necessitate all employees to mandatorily embrace the values and principles embodied as a part of the afore-mentioned Code. Additionally, the function drives an Ethics Compliance Month initiative for raising awareness by conduct of employee trainings in areas of ethical concern such as insider trading, prevention of sexual harassment, anti-bribery, anti-corruption and anti-trust laws through use of interactive learning tools.
Through our Supplier Code of Conduct, we also ensure that third parties, including their employees, agents and representatives who have a business relationship with your Company, are bound by industry standards as well as applicable statutory requirements concerning labour and human rights; health, safety and environment; and business integrity.
OTHER DISCLOSURES
Related Party Transactions
Your Company has in place a Policy on Related Party Transaction (RPT) (RPT Policy) formulated in line with the provision of the Companies Act and Listing Regulations. The Policy may be accessed at www.vedantalimited.com.
The Policy sets out the philosophy and processes to be followed for approval and review of transactions with Related Party and intends to ensure that proper reporting, approval and disclosure processes are in place for all transactions with Related Parties.
A detailed landscape of all RPTs specifying the nature, value, and terms and conditions of the transaction is presented to the Audit & Risk Management Committee. Also, a Related Party Transactions Manual-Standard Operating Procedures has been formulated to identify and monitor all such transactions.
During the fiscal 2020-21, all the contracts/ arrangements/ transactions entered into by the Company with the related parties were in the ordinary course of business and on an arm’s length basis and were in compliance with the provisions of the Companies Act and Listing Regulations other than those mentioned in the Annexure IV of the Report on Corporate Governance forming part of the Annual Report.
All Related Party Transactions are subjected to independent review by a reputed accounting firm to establish compliance with the requirements of Related Party Transactions under the Companies Act, 2013 and Listing Regulations.
Further, there have been no materially significant RPTs during the year pursuant to the provisions of the Companies Act and Listing Regulations. Accordingly, the disclosure required u/s 134(3)(h) of the Act in Form AOC-2 is not applicable to your Company.
Share Capital and its Evolution
The Authorised Share Capital of the Company is ₹74,120,100,000 divided into 44,020,100,000 number of equity shares of ₹1/- each and 3,010,000,000 Preference Shares of ₹ 10/- each. There was no change in the capital structure of the Company during the period under review.
The details of share capital as on March 31, 2021 is provided below:
| Particulars | Amount (D) | |||
Authorised Share Capital | 74,120,100,000 | |||
Paid-up Capital | 3,717,504,871 | |||
Listed Capital | 3,717,196,639 | |||
Shares under Abeyance pending allotment | 3,08,232 | |||
| * | Out of the total paid-up capital of 3,717,504,871 equity shares, 308,232 equity shares are pending for allotment and listing and hence kept under abeyance since they are sub-judice and further 160,903,244 equity shares are held in the form of 40,225,811 ADSs as on March 31, 2021. |
182
| < BACK TO CONTENTS | Integrated Report | Statutory reports | Financial statements |
The details of the Capital Evolution has been provided on the Company’s website and can be accessed at www.vedantalimited.com.
Subsidiaries, Joint Ventures and Associate Companies
Your Company has 49 subsidiaries (16 direct and
33 indirect) as at March 31, 2021, as disclosed in the notes to accounts.
During the year and till date the following changes have taken place in subsidiary companies:
| • | The name of a Subsidiary Company changed from Electrosteel Steels Limited to “ESL Steel Limited” with effect from September 26, 2020. |
| • | The Company acquired Ferro Alloys Corporation Limited (FACOR) on September 21, 2020 under IBC as wholly-owned subsidiary. |
| • | Consequent to acquisition of FACOR, subsidiaries of FACOR - Facor Power Limited (FPL) and Facor Realty and Infrastructure Limited (FRIL) become indirect subsidiaries of the Company. |
| • | Australia Subsidiary - Cairn Energy India Pty Limited got deregistered w.e.f. August 26, 2020. |
| • | Scotland subsidiaries - Cairn Energy Discovery Limited and Carin Exploration (No. 2) Limited dissolved w.e.f. September 22, 2020. |
| • | Application for voluntary liquidation filled for Mauritius entities - CIG Mauritius Holdings Private Limited and CIG Mauritius Private Limited, confirmation awaited. |
| • | Cairn South Africa (Pty) Ltd has been deregistered effective from April 06, 2021 and the deregistration of tax registration of the entity is under process. |
| • | Sterlite (USA) Inc. is under process of dissolution. |
| • | Killoran Lisheen Finance Limited and Vedanta Exploration Ireland Limited have been voluntarily struck off w.e.f. March 02, 2021. |
There has been no material change in the nature of the business of the subsidiaries.
As at March 31, 2021, the Company has 8 associate companies and joint ventures.
Associate Companies and Joint Ventures:
| • | Gaurav Overseas Private Limited |
| • | RoshSkor Township (Pty) Ltd |
| • | Raykal Aluminium Company Private Limited |
| • | Goa Maritime Private Limited |
| • | Madanpur South Coal Company Limited |
| • | Rampia Coal Mines and Energy Private Limited |
| • | Rosh Pinah Health Care (Proprietary) Limited |
| • | Gergarub Exploration and Mining (Pty) Limited |
As required under Listing Regulations, the Consolidated Financial Statement of the Company and its subsidiaries and joint ventures, prepared in accordance with Ind AS 110 issued by the Institute of Chartered Accountants of India, form part of the Annual Report and are reflected in the Consolidated Financial Statement of the Company.
During the year, the Board of Directors have reviewed the affairs of the subsidiaries. Pursuant to Section 129(3) of the Companies Act, 2013 (the Act), a statement containing the salient features of the financial statement of the subsidiary and associate companies is attached to the financial statement in Form AOC-1. The statement also provides details of performance and financial position of each of the subsidiaries and their contribution to the overall performance of the Company.
In accordance with Section 136 of the Act, the audited Standalone and Consolidated financial statements of the Company along with relevant notes and separate audited accounts of subsidiaries are available on the website of the Company at www.vedantalimited.com. Copies of the financial statements of the Company and of the subsidiary companies shall be made available upon request by any member of the Company. Additionally, these financial statements shall also be available for inspection by members on all working days during business hours at the Registered Office of the Company.
Material Subsidiaries
The Company has adopted a policy on determination of material subsidiaries in line with the Listing Regulations. The policy aims to determine the Material Subsidiaries and Material Unlisted Indian Subsidiaries of the Company and to provide the governance framework for such subsidiaries. The policy may be accessed at www.vedantalimited.com.
In accordance with Regulation 16(1)(c) of the Listing Regulations, your Company has the following material subsidiary companies during the financial year 2020-21:
| • | Hindustan Zinc Limited (HZL), a listed subsidiary of the Company; |
| • | Cairn India Holdings Limited (CIHL), an unlisted subsidiary; and |
| • | Cairn Energy Hydrocarbons Limited, an unlisted subsidiary. |
The Company is in compliance with the applicable requirements of the Listing Regulations for its subsidiary companies during the financial year 2020-21.
VEDANTA LIMITED | INTEGRATED REPORT AND ANNUAL ACCOUNTS 2020-21 | 183
DIRECTORS REPORT CONTINUED...
Debentures
During the financial year 2020-21, your Company raised ₹ 500 crores through issuance of Secured, Rated,
Redeemable, Non-Cumulative, Non-Convertible Debentures (NCDs) of face value of ₹ 1,000,000 each on private placement basis as per the following details:
| Coupon Rate | Date of Allotment | No. of NCDs | Total Amount (in D) | Tenor | Maturity Date | |||||
| 7.50% Secured Rated Listed | February 17, 2021 | 5,000 | 500 crores | 1 year and | March 17, 2022 | |||||
| Redeemable Non-Convertible | 1 month | |||||||||
| Debentures | ||||||||||
The aforesaid debentures are listed on BSE Limited.
Further, the details of NCDs outstanding debentures as of March 31, 2021 have been detailed in the Corporate Governance Report.
Commercial Papers
The Commercial Papers (CPs) issued by the Company had been listed on National Stock Exchange of India Limited and have been duly redeemed on timely basis. As on March 31, 2021, there are nil outstanding CPs. Further details have been provided in the Corporate Governance Report.
Unclaimed Shares
Pursuant to the SEBI Circular and Regulation 39 of Listing Regulations regarding the procedure to be adopted for unclaimed shares issued in physical form in public issue or otherwise, the Company has a separate demat account in the title of ‘Vedanta Limited - Unclaimed Suspense Account’ with HDFC Bank Limited*.
The details of shares lying in the unclaimed suspense account are provided below:
| Description | No. of shareholders | No. of Equity shares of E 1/- each | ||||||
Aggregate number of shareholders and the outstanding shares in the suspense account lying at the beginning of the year | 776 | 934,859 | ||||||
Number of shares transferred to the unclaimed suspense account during the year | — | — | ||||||
Number of shareholders who approached issuer for transfer of shares from suspense account during the year | 4 | 107,008 | ||||||
Number of shareholders to whom shares were transferred from suspense account during the year | — | — | ||||||
Number of shares transferred to IEPF account pursuant to Investor Education and Protection Fund Authority (Accounting, Audit, Transfer and Refund) Rules, 2016 read with Amendment Rules, 2017 | 154 | 122,039 | ||||||
Aggregate number of shareholders and the outstanding shares in the suspense account lying at the end of the year. The voting rights on these shares shall remain frozen till the rightful owner of such shares claims the shares | 618 | 705,812 | ||||||
| * | During the year, the unclaimed suspense account maintained by the Company with Karvy Stock Broking Limited has been closed and securities transferred to a separate demat account opened with HDFC Bank Limited. |
Transfer of unpaid and unclaimed amounts to Investor Education and Protection Fund (IEPF)
In accordance with the provisions of Companies Act, 2013 and Investor Education and Protection Fund (Accounting, Audit, Transfer and Refund) Rules, 2016 (IEPF Rules), the Company is required to transfer the following to IEPF:
| • | Dividend amount that remains unpaid/unclaimed for a period of seven (7) years; and |
| • | Shares on which the dividend has not been paid/claimed for seven (7) consecutive years or more. |
Your Company, in its various communications to the shareholders from time to time, requests them to claim the unpaid/unclaimed amount of dividend and shares due for transfer to IEPF established by Central Government. Further, in compliance with IEPF Rules including statutory modifications thereof, the Company publishes notices in newspapers and also sends specific letters to all the shareholders, whose shares are due to be transferred to IEPF, to enable them to claim their rightful dues.
184
| < BACK TO CONTENTS | Integrated Report | Statutory reports | Financial statements |
Dividend and other amounts transferred/credited to IEPF during 2020-21
The details of dividend and other unpaid/unclaimed amounts transferred to IEPF during the year are provided below:
| Dividend and other unpaid/unclaimed amounts transferred to IEPF during the year | ||||||||||
Financial | Type of Amount | Date of | Amount transferred to IEPF (in D) | Date of transfer | ||||||
2012-13 | Interim Dividend (2nd) | April 29, 2013 | 7,014,639.00 | June 10, 2020 | ||||||
2012-13 | Final Dividend | June 06, 2013 | 1,846,935.00 | August 19, 2020 | ||||||
2012-13 | Final Dividend | June 27, 2013 | 718,433.00 | August 21, 2020 | ||||||
2012-13 | Final Dividend | July 24, 2013 | 5,998,486.00 | September 08, 2020 | ||||||
2012-13 | Sale Proceeds of Fractional Shares arising out of Amalgamation Scheme 2013 | August 18, 2013 | 243,595.00 | October 14, 2020 | ||||||
2013-14 | Interim Dividend | October 22, 2013 | 4,277,100.00 | December 09, 2020 | ||||||
2013-14 | Interim Dividend | October 31, 2013 | 13,637,440.00 | December 22, 2020 | ||||||
Total | 33,736,628.00 | |||||||||
In view of specific order of court/ tribunal/ statutory authority restraining transfer of shares and dividend thereon, such shares and unpaid dividend have not been transferred to IEPF pursuant to Section 124 of Companies Act, 2013 and Rule 6 of IEPF Rules including statutory modifications or re-enactments thereof.
The details of dividend declared during the year on shares already transferred to IEPF are provided below:
| Dividend declared during 2020-21 on shares already transferred to IEPF | ||||||||||||||||
Financial Year | Type of Amount | Date of Declaration | Amount transferred to IEPF (in D) | Date of transfer to IEPF | ||||||||||||
2020-21 | Interim Dividend | (1st) | October 24, 2020 | 38,227,812.50 | November 11, 2020 | |||||||||||
Total | 38,227,812.50 | |||||||||||||||
Shares transferred/credited to IEPF during 2020-21
During the year, the Company transferred 458,317 equity shares of ₹ 1/- each comprising of 1,367 shareholders to IEPF.
The Company has also uploaded the details of unpaid and unclaimed amounts lying with the Company as on September 30, 2020 (the date of last Annual General Meeting) on the website of the Company at www.vedantalimited.com. Further, the details of equity shares transferred are also made available on the website of the Company at www.vedantalimited.com.
The shareholders whose shares/dividends have been transferred to IEPF can claim the same from IEPF in accordance with the prescribed procedure and on submission of such documents as prescribed under the IEPF Rules. The process for claiming the unpaid shares/ dividends out of IEPF can be accessed on the IEPF website at www.iepf.gov.in and on the website of the Company at www.vedantalimited.com.
Dividend due to be transferred to IEPF during 2021-22
The dates on which unclaimed dividend and their corresponding shares would become due to be transferred to IEPF during the financial year 2021-22 are provided below:
| Dividend due to be transferred to IEPF during 2021-22 | ||||||||||||
Particulars | Date of Declaration | Date of completion of seven years | Due date for transfer to IEPF | Amount as on March 31, 2021 (in D) | ||||||||
Final Dividend 2013-14 | July 11, 2014 | August 15, 2021 | September 14, 2021 | 14,311,444.00 | ||||||||
Final Dividend 2013-14 | July 23, 2014 | August 27, 2021 | September 26, 2021 | 4,180,676.50 | ||||||||
Interim Dividend 2014-15 | September 17, 2014 | October 22, 2021 | November 21, 2021 | 3,693,990.00 | ||||||||
Interim Dividend 2014-15 | October 29, 2014 | December 03, 2021 | January 02, 2022 | 14,501,971.75 | ||||||||
Total | 36,688,082.25 | |||||||||||
Ms. Prerna Halwasiya, the Company Secretary & Compliance Officer of the Company is designated as the Nodal Officer under the provisions of IEPF. The contact details can be accessed on the website of the Company at www.vedantalimited.com.
Transfer to Reserves
The Company proposes Nil transfer to General Reserve out of its total profit of ₹ 10,503 crores for the financial year.
Particulars of Loans, Guarantees or Investments
The particulars of loans given, investments made, guarantees given and securities provided along with the purpose for which the loan or guarantee or security is proposed to be utilised as per the provisions of Section 186 of the Act are provided in the standalone financial statements. (Please refer to Notes to the standalone financial statements).
VEDANTA LIMITED | INTEGRATED REPORT AND ANNUAL ACCOUNTS 2020-21 | 185
DIRECTORS REPORT CONTINUED...
Fixed Deposits
As at March 31, 2021, deposits amounting to ₹ 54,000 remain unclaimed. Since the matter is sub judice, the Company is maintaining status quo.
Public Deposits
The Company has not accepted any deposits falling under the ambit of Section 73 of the Companies Act, 2013
(‘Act’) and the Rules framed thereunder during the year under review.
Material changes affecting the financial position of the Company
No material changes and commitments have occurred subsequent to the close of the financial year till the date of this Report which may affect the financial position of the Company.
Significant & Material orders passed by the regulators or Courts or Tribunals
Provided below are the significant and material orders which have been passed by any regulators or courts or tribunals against the Company impacting the going concern status and Company’s operations in future.
Iron-Ore Division – Goa Operations
Supreme Court (SC) in the Goa Mining matter in 2014 declared that the deemed mining leases of the lessees in Goa expired on November 22, 1987 and the maximum of 20 years renewal period of the deemed mining leases in Goa under the Mines and Minerals (Development and Regulation) (MMDR) Act had also expired on November 22, 2007 and directed state to grant fresh mining leases. Thereafter, various mining leases were renewed by the state government before and on the date the MMDR Amendment Ordinance 2015 came into effect
(i.e. January 12, 2015).
These renewal of mining leases were challenged before the SC by Goa Foundation and others in 2015 as being arbitrary and against the judgement of the SC in the earlier Goa mining matter. The SC passed the judgement in the matters on February 7, 2018 wherein it set aside the second renewal of the mining leases granted by the State of Goa. The court directed all lease holders operating under a second renewal to stop all mining operations with effect from March 16, 2018 until fresh mining leases (not fresh renewals or other renewals) in accordance with the provisions of the MMDR Act, 1957 and fresh environmental clearances are granted.
Subsequently, mining lessees and other mining stakeholder have filed applications in the pending Abolition Act matter for resumption of mining in the State. The Central Government has also filed an early hearing application in the long pending abolition matter.
We have now filed Special Leave Petition in the Supreme Court in appeal from the HC order against a non-consideration of our representation seeking an amendment of the mining lease till 2037 based on the provisions on the MMDR Amendment Act, 2015. This will be heard in due course. SC has on February 10, 2020 allowed the impediment of Goa foundation and another
impleader. The matter will be listed in due course. Separately, we also filed a review petition against the Supreme Court judgement dated February 7, 2018 before the Supreme Court. The review petition was heard in chambers and the order in relation to it is expected in due course. Vedanta’s special leave petition will be listed for hearing in due course.
Copper Division
Copper division of Vedanta Limited has received an order from Tamil Nadu Pollution Control Board (TNPCB) on April 09, 2018 whereby they have rejected the Company’s application for renewal of Consent to Operate (CTO) for the 400,000 Metric Tonnes Per Annum (MTPA) Copper Smelter plant in Tuticorin. In furtherance to the order of TNPCB rejecting the Company’s application, the Company decided to shut its Copper smelting operations at Tuticorin and has filed an appeal with TNPCB Appellate authority against the order. During the pendency of the appeal the TNPCB vide its order dated May 23, 2018 ordered disconnection of electricity supply and closure of the Company’s Copper Smelter plant. Post this, the Govt of Tamil Nadu on May 28, 2018 ordered the permanent closure of the plant. The Company challenged the same in the National Green Tribunal (NGT) which passed a favorable order for reopening of the plant. The order was appealed by the TNPCB and the State of Tamil Nadu in the Supreme Court. The Supreme Court passed an order upholding the appeal and directing the Company to approach the Madras High Court for relied. On August 18, 2020, the Division Bench of Madras High Court dismissed all the writ petitions filed by the Company. Vedanta Limited subsequently filed a special leave petition to appeal against the Madras High Court decision before the Supreme Court. The application for interim relief under the special leave petition was heard on December 2, 2020 and the Supreme Court had rejected such application for interim relief. The main matter of the special leave petition will be heard for its final merits in due course. Next date of hearing is currently August 17, 2021. On April 27, 2021, in line with the decision of the TN State Govt, the Supreme Court passed an order for permitting the operation of our oxygen plant on a standalone basis, under the oversight of a committee nominated by the State Govt. The power for operation of the oxygen plant is to be provided by the State Govt. We have since sent tankers with liquid oxygen that have been dispatched to Government Medical Colleges in Thoothukudi, Thirunelveli and Kanyakumari as well.
In the meantime, the Madurai Bench of the High Court of Madras in a public interest litigation filed against Vedanta Fathima Babu held through its order dated May 23, 2018, that the application for renewal of the environmental clearance for the expansion project shall be processed after a mandatory public hearing and the said application shall be decided by the competent authority on or before September 23, 2018. In the interim, the High Court ordered Vedanta to cease construction and all other activities on site for the proposed expansion project with immediate effect. Currently, the Ministry of Environment, Forest and Climate Change (“MoEF”) has updated on its website that Vedanta Limited’s environmental clearance for expansion project will be considered for ToR either upon verdict of the NGT case or upon filing of a Report from the State Government/ District Collector, Thoothukudi. Separately, SIPCOT through its letter dated May 29, 2018, cancelled 342.22 acres of the land allotted to Vedanta Limited for the proposed expansion project. Further, the TNPCB issued orders on June 7, 2018, directing the withdrawal of the consent to establish for the expansion project, which is valid until December 31, 2022. In a writ filed before Madras High Court Madurai Bench challenging the lease cancellation order, Madras High Court through order dated October 3, 2018 has granted an interim stay in favour of the Company cancelling on the cancellation of 342.22 acres of the land allotted.
186
| < BACK TO CONTENTS | Integrated Report | Statutory reports | Financial statements |
Further, on June 07, 2018, TNPCB withdrew the CTE granted for expansion project for a period of five years. The Company has filed Appeals before the TNPCB Appellate Authority challenging withdrawal of CTE by the TNPCB and the matter will be listed for hearing in due course.
Change in nature of business of Company
There is no change in the nature of business of your Company during the year under review.
Failure to implement any corporate action
There were no instances where the Company failed to implement any corporate action within the specified time limit.
AWARDS AND RECOGNITION
In its constant quest for growth and excellence, your Company continues to be committed towards maintaining the highest standards of corporate governance and sustainable practices. As a recognition for our unconventional innovations and significant contributions towards stakeholders and the society as a whole, your Company has been winning an array of accolades at various forums while securing plaudits as the recipient of numerous prestigious awards for demonstrating its business ethos.
These acknowledgements render a testament to the Company’s progress and its diligent efforts towards delivering value for all its stakeholders.
The details of the key recognitions bestowed upon the Company have been highlighted in a separate section in the Annual Report.
DIRECTORS’ RESPONSIBILITY STATEMENT
As stipulated in Section 134 of the Companies Act, 2013, your Directors subscribe to the “Directors’ Responsibility Statement” and to the best of their knowledge and ability, hereby confirms that:
| (a) | in the preparation of the annual accounts, the applicableaccountingstandardshavebeenfollowedand there are no material departures from the same; |
| (b) | they have selected such accounting policies and applied them consistently and made judgements and estimates that are reasonable and prudent so as to give a true and fair view of the state of affairs of the Company at the end of the financial year, i.e. March 31, 2021 and of the profit and loss of the Company for that period; |
| (c) | they have taken proper and sufficient care for the maintenance of adequate accounting records in accordance with the provisions of the Companies Act, 2013 for safeguarding the Company’s assets and for preventing and detecting fraud and other irregularities; |
| (d) | the annual accounts have been prepared on a going concern basis; |
| (e) | they have laid down internal financial controls to be followed by the Company and that such internal financial controls are adequate and are operating effectively. However, certain controls relating to benchmarking the terms and authorisations for transactions with related parties were required to be enhanced, which have since been strengthened; and |
| (f) | proper systems have been devised to ensure compliance with the provisions of all applicable laws and that such systems were adequate and operating effectively. |
APPRECIATION
Your Directors wish to place on record, their sincere appreciation to the Central and State Government Authorities, Bankers, Stock Exchanges, Financial Institutions, Analysts, Advisors, Local Communities, Customers, Vendors, Business Partners, Shareholders and Investors forming part of the Vedanta family for their continued support, assistance and encouragement extended to us during the year.
VEDANTA LIMITED | INTEGRATED REPORT AND ANNUAL ACCOUNTS 2020-21 | 187
DIRECTORS REPORT CONTINUED...
Our business was built with a simple mission envisioned by the Group’s Chairman, Mr. Anil Agarwal, “To create a leading global natural resource company.” In a bid to accomplish the mission, the Company is deftly managed by an adroit set of leaders with global and diverse experience in the sector. The professionally equipped and technically sound management has set progressive policies and objectives, follows global practices, all with a pragmatic vision to take the Company ahead to the next level.
We would also like to take this opportunity to extend our earnest regard to all our employees for their zealous enthusiasm and interminable efforts directed towards lodging significant contributions to the growth of the Company.
We further undertake to express our heartiest gratitude to all our stakeholders for their unflinching faith in their Company.
We look forward for bestowal of your support as we diligently strive to deliver sustained value for our stakeholders and inscribe on the footprints of nation
building for one of the fastest growing economies of the world.
We regret the loss of life due to COVID-19 pandemic and are deeply grateful and have immense respect for every person who risked their life and safety to fight this pandemic.
We look forward for your continued support in future.
For and on behalf of the Board of Directors
Anil Agarwal
Non-Executive Chairman
DIN: 00010883
Place: London
Date: May 13, 2021
188
| < BACK TO CONTENTS | Integrated Report | Statutory reports | Financial statements |
Annexure A
CONSERVATION OF ENERGY AND TECHNOLOGY ABSORPTION
| (A) | CONSERVATION OF ENERGY |
Conservation of natural resources continues to be the key focus area of your Company. Some of the important steps taken in this direction follow.
Oil & Gas Business
Rajasthan Operations
| i. | Utilization of associated natural gas by commissioning of 2*1.1 MW & 1*0.8 MW GEGs at Rajasthan North satellite field (NI-02) for power generation and thereby reducing GHG emission by avoiding flaring. Cumulative GHG reduction potential of ~9,200 tonnes of CO2e/ annum. |
| ii. | Energy conservation by replacement of conventional lights with energy efficient lightings (LED) at MBA. Approx. 264,000 KWH equivalent to 950 GJ saved in FY 2020-21. |
| iii. | Installation of Solar roof top of 15 KW at AGI 18 & 19. Renewable power generation potential of 36,000 KWH/annum. |
| iv. | Avoidance of GHG emission by renewable power generation (solar): 522,603 KWH for RJ operations and 37,334 KWH from midstream in FY 2020-21. |
Ravva Operations
| i. | Flare Gas Recovery from degasser using LP compressor for achieving Zero flaring. Recovery of 7,000 scmd has been achieved (equivalent to 15,000 BOE/annum). The activity has reduced the gas flaring, avoiding almost 6,636 Tons/annum GHG emissions. |
| ii. | LP flare blower VFD for power optimisation has been commissioned. |
| iii. | Installation of Joule Thomson Pressure Control valve to achieve retro grade condensation has been completed. Reduction in fuel gas consumption by 1,300 scm. |
| iv. | Replaced fluorescent and HPSV lights with LED. There is a saving potential of 15,330 KWH. |
Cambay Operations
| i. | Optimised heat tracing operation with revised temperature settings. |
| ii. | Raw water pump 30 min run timer has been configured in DCS to avoid unnecessary running of pump and minimise water wastage. |
| iii. | Optimised propane level to achieve energy saving in HCDP compressors’ operation. |
Copper Business
| i. | High mast LED lights Installation – Electric energy reduction (Upto 35,478 KWH/Year reduction). |
| ii. | Boiler Oxygen trimmer installation– Reduction in Furnace Oil Consumption (Up to 12.36 MT/ Year). |
| iii. | Replacement of Existing Boiler with High Efficient Boiler – Reduction in Furnace Oil Consumption (Upto 301.02 MT/Year). |
| iv. | Capacitor bank installation for 35TPH CCR – Electric energy reduction (Up to 484,486 KWH/ Year reduction). |
| v. | Setup of 100 KW solar power plant – Electric energy reduction (Up to 65,700 KWH/Year reduction). |
| vi. | Saving in Vaporiser power by using PNG in place of LPG – Electric energy reduction (Up to 1,576,800 KWH/Year reduction). |
Iron Ore Business
VAB
| i. | Production of foundry grade pig iron outside the blast furnace (Qty. 84,782 T) by using Ferro-silicon compound resulting in saving of 40Kg/THM coke consumption. |
| ii. | Sinter plant main exhaust fan duct & wind box leakage arresting, achieving power saving of 1,008,000 KWH/annum. |
| iii. | Conducted STG overhauling along with condenser chemical cleaning to reduce specific steam consumption by 0.5 TPH. (Increased generation by 1,008,000 KWH/annum). |
| iv. | Optimised compressor usage by removing non-necessary points, and arresting leakage, thus, reducing running from 3 to 2 compressors in PID-2 (Saving – 369,600 KWH/annum). |
| v. | Conducting Compressed air leakage audit and arresting leaking points in MCD and PP (Saving - 168,000 KWH/annum). |
| vi. | Conversion of 20% of conventional lamps with LED lamps (Saving – 175,200 KWH/annum). |
| vii. | Provided lighting with PLC automation/timer to eliminate wastage when not required. (Saving – 43,800 KWH/annum). |
| viii. | Replacing cooling tower fan shaft from SS shaft to composite fiber shaft (Saving – 16,800 KWH/annum). |
VEDANTA LIMITED | INTEGRATED REPORT AND ANNUAL ACCOUNTS 2020-21 | 189
DIRECTORS REPORT CONTINUED...
IOK
| i. | Installation of Haul road lighting automation panels – 4 Nos (Saving – 12.393MWh/annum). |
| ii. | Replacement of mercury vapor lamps in high old high mast lights of BBH railway siding. Reduced the no of lights from 8 to 4 and replaced with 300W LED lights. (Savings – 23.76MWh). |
Power Business
2,400 MW Jharsuguda
| i. | Replacement of Air preheater basket & seals for Unit#3 units to reduce the high flue gas exit temperature to design level saving 1 kcal/ KWH in heat rate and 1,506 KWH in PA fans consumption. |
| ii. | Unit#4 flue gas duct leakages rectification and bag filter replacement to reduce ID fans consumption by 1,992 KWH. |
| iii. | U#1,3,4 vacuum pump suction line modification done which caused vacuum to improve and we were able to save 35 kcal/KWH, 18.2 kcal/ KWH & 16.8 kcal/KWH of heat rate in U#1, 3 & 4 respectively. |
| iv. | Unit#4 air preheater seals rectification to reduced PA & FD fans consumption by 200 KWH. |
| v. | Unit#3 condenser chemical cleaning to reduce losses due to low vacuum by 38 kcal/KWH. |
| vi. | Unit#4 condenser hydro jet cleaning to reduce losses due to low vacuum by 14 kcal/KWH. |
| vii. | Replaced timer-based drain valves with level sensor based drain valves in instrument air tanks/receivers and ESP bag filter SOV passing rectification to reduce compressor power consumption by 350 KWH. |
| viii. | CW pump running optimisation at partial loads and transition ambient situations. |
| ix. | Mill Liner Replacement (6 mills), Ball segregation & Top-up in 12 Mill which resulted into Mill Output to increase from 68 TPH to 85 TPH to reduce the power consumption of Mills by 1,600 KWH. |
CPP 1,215 MW Jharsuguda
| i. | Replacement of Air preheater basket for 2 units (Unit 5,6) to reduce the very high flue gas exit temperature to design level saving 3 kcal/KWH in heat rate and 450 KWH in PA consumption for the station. |
| ii. | Turbine Overhauling in Unit#5&6 to improve HP cylinder efficiency resulted into saving of 4 kcal/ KWH in heat rate for the Station. |
| iii. | Replacement of Air preheater seals and bag filters replacement along with reduction in external air ingress by flue gas duct repairing for 4 units (Unit#2, 7, 5 & 6) to reduce ID and PA fans consumption by 2,100 KWH. |
| iv. | Cooling tower fills replacement done in Unit#6 to save 25 kcal/KWH of heat rate in unit. |
| v. | Unit#1 & 2 Cooling tower blade angle adjustment to increase cooling tower performance caused vacuum losses to reduce by 2 kcal/KWH each for Unit#1&2. |
| vi. | Chemical cleaning of cooling tower fills done for Unit#5 to increase air flow across tower and reduce vacuum losses. |
| vii. | Condenser bullet cleaning done in Unit#5 & 6 to save in heat rate by 20 kcal/KWH for both the units combined. |
| viii. | 6 out of 9 units able to run at 104% PLF after maintenance work. |
Aluminium Business
Smelter Plant Jharsuguda
Smelter Plant 1
Electrical Energy
DC Energy saving
| i. | 100% graphitised cathode pot implementation. |
| ii. | Improvement in Pot Voltage drops by bolt and clamp drop reduction. |
| iii. | Current efficiency improvement in Potline. |
AC auxiliary Energy saving
| i. | Installation of rubber belts instead of rubber mats in furnace areas to stop air leakages in building 1 & 2. |
| ii. | Compressor intercooler replacement for two compressor. |
| iii. | Dryer Auto Drain Valve installation. |
| iv. | Replacement of conventional lights with LED lights in office and MCC area. |
| v. | Energy Efficient Motor installation. |
| vi. | No. of operating shift reduction in rodding plant from 54 to 52 shift. |
| vii. | Cold well pump current optimisation in pump house. |
| viii. | Individual Air Pipeline for Cast House to reduce compressor power consumption. |
Smelter Plant 2
Electrical Energy
DC Energy saving
| i. | 100% graphitised cathode pot implementation. |
| ii. | Current efficiency improvement. |
AC auxiliary Energy saving
| i. | Replacement of conventional lights with LED lights in office, MCC area, Streetlights and Highmasts. |
| ii. | Interconnection of cold well pump line & filter feed pump line in rectifier pump house and Reduction compressor pump house. |
| iii. | VFD installation in thimble cleaning tumbler. |
190
| < BACK TO CONTENTS | Integrated Report | Statutory reports | Financial statements |
| iv. | Elimination of idle running of rodding shop bag filters ID fans. |
| v. | RB-26, RB-188 idle running elimination in bakeoven. |
| vi. | Bag chamber DP normalisation between FTP-3&4 of bakeoven. |
| vii. | Elimination of DC3 and DC5 Screw conveyor and RAL idle running. |
| viii. | Potline ID Fan damper optimisation based on hooding & Flow measurement. |
| ix. | Optimization of Running of GAP Belt conveyor by reducing idle running time. |
Lanjigarh – Refinery
The following major energy conservation measures are taken at Lanjigarh:
| i. | Installation of two numbers 45KW VFD for drinking water pump motor. |
| ii. | Installation of two numbers 45KW VFD for lime transfer pump at MOL. |
| iii. | Replacement of 3000 numbers of conventional lights with LED. Annual saving of 7 lakhs unit of electrical energy. |
| iv. | Improvement of 33KV P.F at Substation-4 by adding 1MVAR capacitor bank from 0.87 to 0.91. |
| v. | Installation of 22KW VFD for HST area sump pump motor. |
| vi. | Installation of 55KW VFD for coarse seed area agitator. |
Lanjigarh – CGPP
| i. | Reduction of 0.3T/MW of steam consumption through turbine (saving of 6.9 lakhs unit). |
| ii. | Energy saving through optimisation of running hour of make-up pump (saving of 0.73 lakhs unit). |
| (B) | ADDITIONAL INVESTMENTS AND PROPOSALS, IF ANY, BEING IMPLEMENTED FOR REDUCTION OF CONSUMPTION OF ENERGY |
Oil & Gas Business
Rajasthan Operations
| i. | Installation of gas compressor & pipeline from Raag Oil to RGT to avoid the flaring at Wellpad and recovery of Gas for sale. GHG reduction potential of approx. 40,000 tonnes of CO2e/annum. |
| ii. | Solar panel at Radhanpur Terminal and RDT LQ. |
| iii. | Solar rooftop of 15KW each at 10 Above ground installations AGIs. |
| iv. | Feasibility study for CO2 sequestration for Aishwariya Field (ABH + Fatehgarh) through CCS based on Geo mechanics. |
| v. | Proposal for Installation of Microturbine to generate up to 8MWH power utilising Medium Pressure Steam currently available in the system as spare. |
| vi. | Proposal for installation of Solar Panel of 20MWH nearby MPT. |
Ravva Operations
| i. | Installation of PCV in Contract-2 Gas Treatment plant has been completed to reduce power consumption for propane system. |
| ii. | LP flare blower VFD for power optimisation has commissioned. |
| iii. | Installation of LED lights at Ravva Plant LQ Corridor. |
Cambay Operations
| i. | Installation of LED lights in few more areas inside plant premises. |
| ii. | Installation of 20 Nos. solar lights on perimeter. |
Copper Business
| i. | VFD installation for RCW Pumps in 35TPH CCR – Project. |
| ii. | Setup of 825KW solar power plant. |
| iii. | Replacement of existing roof lights with LED lights in ACP, CCPC & CCPP. |
| iv. | Using PNG instead of FO for Boiler. |
| v. | Reduction in FO consumption by using Bio mega additive. |
Iron Ore Business
VAB
| i. | Replacement of various pumps in VAB with energy efficient pumps. |
| ii. | Providing variable fluid coupling for fans and pumps. |
| iii. | Implementing various energy saving measures suggested by TERI during the energy audit. |
IOK
| iv. | In house fabrication of 9m tall towers for using them as lighting towers in 5 different locations in mines. The portable lighting towers which were running on diesel are now eliminated resulting in the savings of 14,000 ‘/Month/DG. |
| v. | Electrification of TUP-2 plant by elimination of 40kVA DG by reconditioning of the power lines and providing supply from Govt. supply resulting in cost savings of 1.5L/Month. |
Power Business
2,400 MW Jharsuguda Proposals:
| i. | MOC upgradation in platen RH. |
| ii. | Installation of VFD in CEPs. |
1,215 MW Jharsuguda Proposals:
| i. | Turbine overhauling for 5 units. |
| ii. | Chemical cleaning of Cooling tower fills. |
VEDANTA LIMITED | INTEGRATED REPORT AND ANNUAL ACCOUNTS 2020-21 | 191
DIRECTORS REPORT CONTINUED...
Aluminium Business
Smelter Plant Jharsuguda:
| i. | Advanced pot controller & Pot technology upgradation. |
| ii. | Use of MV drive in ID fans. |
| iii. | Installation solar system. |
| iv. | Centralisation of pump house SCADA for optimisation of pump power consumption. |
| v. | Replacement of old motors with Energy efficient motor. |
| vi. | 100% LED conversion. |
| vii. | HFO SCADA level-2 upgradation. |
Plant-2
| i. | 100% Graphitized cathode pot implementation. |
| ii. | Use of RUC copper inserted collector bar for pot cathode. |
| iii. | Advanced pot controller & Pot technology upgradation. |
| iv. | Replacement of conventional lights with LED lights. |
| v. | VFD installation in Cold well pumps, CT fans. |
Refinery
| Sr. | Estimated | |||||
No. | Project | Target Area | Savings | |||
| (KWH) | ||||||
| 1 | Replacement or Maintenance of Faulty Steam traps | DIG, EVAP, White 1, Red 2 | 1,359,000 | |||
| 2 | Installation of VFD in Raw water drinking pump motor | RWTP | 87,600 | |||
| 3 | Improvement in refinery power factor from 0.88 to 0.95 | Refinery | 1,052,631 | |||
| 4 | Efficiency improvement in HT motors by replacement of highly efficient TEFC motor | Refinery | 368,421 | |||
| 5 | Energy management system and SCADA implementation in entire refinery | Refinery | NA | |||
| 6 | Use of blowers instead of compressed air in Sump pumps | PDS, DIG | 7,455 | |||
| 7 | Replacement of 3000 conventional lights by LED lights | Refinery & CGPP | 459,900 |
| (C) | IMPACT OF ABOVE MEASURES IN (A) AND (B) FOR REDUCTION OF ENERGY CONSUMPTION AND CONSEQUENT IMPACT OF COST OF PRODUCTION OF GOODS |
Oil & Gas Business
Rajasthan Operations
| i. | Utilization of Associated gas for power and thereby avoiding flaring/GHG emission. |
| ii. | Conservation of diesel energy by installation of GEGs at satellite fields. |
| iii. | Renewable power generation resulting in reduction in electricity and diesel saving. |
Ravva Operations
| i. | Gas recovery from degasser has resulted in net annual savings equivalent to ~₹ 2.8 crore. |
| ii. | Installed PCV in Gas Treatment plant to achieve Joule Thomson effect and provide TOR to gas treatment. Fuel gas consumption reduced by 1,300 scm/day by stopping one Propane compressor in Contract-2- and ~₹ 40 lakh per annum. |
| iii. | Total Savings from replacement of lights: 15 MWH/annum (~100,000 ₹ per annum). |
Iron Ore Business
VAB
| i. | The Energy Conservation measures undertaken in various areas in 2020-21 have an annual saving potential of 2,820 MWh of Electricity per annum for VAB. |
IOK
| ii. | The Energy Conservation measures undertaken in various areas in 2020-21 have an annual saving potential of 37.752 KL of Diesel & 36.15 MWh of Electricity for IOK. |
Power Business
2,400 MW Jharsuguda
| I. | Station APC reduced from 8.34% to 7.99% in FY’21 and Unit#1 having potential for reduction by 1.4% which is already planned for correction by 10 days shutdown. |
| II. | Reduction in Specific coal consumption by 7 gms /KWH on annual basis (1800 MW). |
1,215 MW Jharsuguda
| I. | 0.9 % reduction in Forced outages. |
Aluminium Business
Plant 1
| i. | Specific energy consumption reduction by 94.66 KWH/ton. |
| ii. | HFO saving 0.61 KG/MT of anode. |
Plant 2
| i. | Specific energy consumption reduction by 62.897 KWH/ton. |
| ii. | HFO saving 0.54 KG/MT of anode. |
192
| < BACK TO CONTENTS | Integrated Report | Statutory reports | Financial statements |
Refinery
| I. | Reduction of Specific Electrical energy from 235KWH/T to 216KWH/T. |
| II. | Reduction of specific FO consumption from 71.23Kg/T to 70.59Kg/T. |
| (D) | THE STEPS TAKEN BY THE COMPANY FOR UTILISING ALTERNATE SOURCES OF ENERGY |
Copper Business
| i. | Initiated 825KW Solar power Project. |
| ii. | Planning to setup Sewage treatment plant to treat Municipal sewage to generate fresh water for plant & nearby villages’ usage. |
| iii. | Planning to setup a Natural gas terminal for Boiler as alternative to FO & LPG. |
| iv. | Planning to setup Desalination plant to self-sustain on the water requirement. |
Form of disclosure of particulars with respect to technology absorption research and development (R & D)
Specific areas in which R&D carried out by the Company.
Copper Business
| i. | Recovering of copper sulphate from the electrolyte. |
| ii. | Introduction of 4th generation Induction Lighting system. |
| iii. | Waste Heat Recovery using Furnace Flue Gas. |
Power Business:
2,400 MW Jharsuguda
| i. | MOC upgradation in platen RH. |
| ii. | ECO coil design change to plane tube. |
VEDANTA LIMITED | INTEGRATED REPORT AND ANNUAL ACCOUNTS 2020-21 | 193
DIRECTORS REPORT CONTINUED...
| Technology Absorption, Adaptation and Innovation | ||||||||
| Efforts in brief made | Oil & Gas Business | |||||||
| towards technology | Rajasthan Operations | |||||||
| absorption, adaptation and innovation | Cairn Oil and Gas commenced exploratory drilling in its OALP blocks based on early prospects matured. 1 well in Rajasthan is drilled and an oil discovery has been notified to MoPNG. Well drilling commenced in Cambay and in Assam. Airborne FTG surveys completed with advanced processing in progress and Seismic surveys continued across multiple blocks to delineate viable prospects for exploratory drilling.
Iron Ore Business | |||||||
| VAB | ||||||||
| a) | Pulverised coal injection in blast furnace – 1 & 2. | |||||||
| b) | Oxygen enrichment in Sinter Plant and Blast furnace – 1 & 2. | |||||||
| c) | Hydraulic compacting station in Met coke division. | |||||||
| Aluminium Business | ||||||||
| Smelter Plant – 1 & 2 | ||||||||
| i. | Individual Air Pipeline for Cast House to reduce compressor power consumption. | |||||||
| ii. | Interconnection of cold well pump line & filter feed pump line in rectifier pump house and Reduction compressor pump house. | |||||||
| Benefits derived as | Iron Ore Business | |||||||
| a result of above | VAB | |||||||
| efforts e.g. product | a) | Reduction in coke rate resulting reduced COP. | ||||||
| improvement, cost | b) | Increase in productivity and reduction in coke rate. | ||||||
| reduction, product | c) | Improvement in coke oven productivity. | ||||||
| development, import substitution | d) | Reduction in fines generation. | ||||||
| Power Business | ||||||||
| 2,400 MW Jharsuguda | ||||||||
| ● | Power cost reduction by 224 $/ton (for 1,800 MW) | |||||||
| ● | Increase in station availability and PLF by 17%. | |||||||
| 1,215 MW Jharsuguda: | ||||||||
| ● | Power cost reduction by 190 $/ton | |||||||
| ● | Reduction in forced outage time by 0.9%. | |||||||
| ● | Increase in station availability and PLF by 1%. (ever highest in FY’21- 95%) | |||||||
| In case of imported technology (imported during the last 5 years reckoned from the beginning of the financial year), the | ||||||||
| following information may be furnished: | ||||||||
| Technology imported | Year of import | Has technology been fully absorbed | ||||||
| Oil & Gas Business | No | |||||||
| Copper Division | No | |||||||
| Iron Ore – Value | Hydraulic compacting | 2018-19 [MCD] | ||||||
| Addition Business: | station in MCD | |||||||
| Battery-1 and Battery-2 | ||||||||
| Yes | ||||||||
| Pulverized coal | 2017 [PID-1] | |||||||
| injection in Blast | ||||||||
| furnace 1& 2. | ||||||||
| Power Business | No | |||||||
| Aluminium Business | No | |||||||
194
| < BACK TO CONTENTS | Integrated Report | Statutory reports | Financial statements |
Disclosure of particulars with respect to conservation of energy
Particulars | Unit | Year ended March 31, 2021 | Year ended March 31, 2020 | Year ended March 31, 2021 | Year ended March 31, 2020 | Year ended March 31, 2021 | Year ended March 31, 2021 | Year ended March 31, 2021 | Year ended March 31, 2021 | Year ended March 31, 2021 | Year ended March 31, 2020 | Year ended March 31, 2020 | Year ended March 31, 2020 | Year ended March 31, 2020 | Year ended March 31, 2020 | Year ended March 31, 2021 | Year ended March 31, 2020 | Year ended March 31, 2021 | Year ended March 31, 2020 | Year ended March 31, 2021 | Year ended March 31, 2020 | |||||||||||||||||||||||||||||||||||||||||||||||||||||||||||||
| Oil & Gas | Copper | Iron-Ore | Power | Aluminium | ||||||||||||||||||||||||||||||||||||||||||||||||||||||||||||||||||||||||||||||
Business | Met Coke Division | Pig Iron Division | Power Plant (WHR) | Mining Goa | Mining Karnataka | Met Coke Division | Pig Iron Division | Power Plant (WHR) | Mining Goa | Mining Karnataka | Lanjigarh | Jharsuguda | ||||||||||||||||||||||||||||||||||||||||||||||||||||||||||||||||||||||
| A. Power and Fuel Consumption | ||||||||||||||||||||||||||||||||||||||||||||||||||||||||||||||||||||||||||||||||||
| Electricity | ||||||||||||||||||||||||||||||||||||||||||||||||||||||||||||||||||||||||||||||||||
Purchase Unit | MWH | 186,623.10 | 162,353.31 | 80,065.28 | 59,348.72 | 8,523.08 | 153,439.12 | 1,650.08 | 15,507 | 387.2 | 7,608.3 | 172,569.9 | 766.5 | 1,886.9 | 338.0 | 3,176.4 | 311,856 | 8,042 | 1,942 | 643,298 | 968,624 | |||||||||||||||||||||||||||||||||||||||||||||||||||||||||||||
Total Amount (Exc Demand Chgs) | ₹ crores | 148.09 | 115.02 | 39.62 | 35.63 | 0.7 | 10.6 | 0.7 | 3.1 | 0.3 | 0.4 | 8.8 | 0.4 | 0.9 | 0.3 | 0.8 | 141.05 | 4.82 | 1.12 | 141.05 | 503.56 | |||||||||||||||||||||||||||||||||||||||||||||||||||||||||||||
Rate/Unit | ₹ /KWH | 7.93 | 7.08 | 4.95 | 6.00 | 0.9 | 0.7 | 4.5 | 2.0 | 9.2 | 0.6 | 0.5 | 5.4 | 4.8 | 9.2 | 2.0 | 4.52 | 6 | 6 | 4.52 | 5 | |||||||||||||||||||||||||||||||||||||||||||||||||||||||||||||
Own generation Unit* | MWH | 561,047.52 | 506,212.58 | 50.20 | 157.00 | 0.02 | 46.46 | 362,965.4 | NA | NA | 0.1 | 94.0 | 390,581.6 | NA | 3,033,780 | 781,505 | 485,193 | 489,655 | 21,407,841.17 | 20,408,216.00 | ||||||||||||||||||||||||||||||||||||||||||||||||||||||||||||||
Unit per unit of fuel | ₹ /Unit, gms/ Unit, Lit/Unit | 0.46 | 0.35 | 821.43 | 810 | 3 | 3 | 801.42 | 802 | |||||||||||||||||||||||||||||||||||||||||||||||||||||||||||||||||||||||||
Cost/Unit | ₹ / MWH, ₹ / KWH | 30.53 | 21.13 | 12.6 | 11.6 | 0.0 | 0.0 | NA | 17.3 | 13.7 | 0.0 | NA | 2.5 | 4.28 | 3.36 | 3.58 | 2.49 | 3.27 | ||||||||||||||||||||||||||||||||||||||||||||||||||||||||||||||||
Furnace Oil | ||||||||||||||||||||||||||||||||||||||||||||||||||||||||||||||||||||||||||||||||||
Quantity** | KL | 6,213.00 | 5,479.88 | Nil | Nil | Nil | Nil | NA | Nil | Nil | Nil | Nil | NA | 116,734.25 | 128,519.04 | |||||||||||||||||||||||||||||||||||||||||||||||||||||||||||||||||||
Total Amount | ₹ crores | 17.41 | 17.09 | NA | NA | NA | NA | NA | NA | NA | NA | NA | NA | 328.14 | 412.00 | |||||||||||||||||||||||||||||||||||||||||||||||||||||||||||||||||||
Average Cost per litre | ₹ /Lit | 28.02 | 31.19 | NA | NA | NA | NA | NA | NA | NA | NA | NA | NA | 28.11 | 32.06 | |||||||||||||||||||||||||||||||||||||||||||||||||||||||||||||||||||
Diesel Oil | ||||||||||||||||||||||||||||||||||||||||||||||||||||||||||||||||||||||||||||||||||
Quantity | KL | 5,761.88 | 4,220.00 | 25.64 | 54.67 | 0.0 | 78.9 | Nil | 9,956 | 7,730.5 | 13.0 | 50.2 | Nil | 3,817.2 | 6,786.0 | 588.95 | 511.00 | 1,952.54 | 169.63 | 3,476.65 | 2,855.67 | |||||||||||||||||||||||||||||||||||||||||||||||||||||||||||||
Total Amount | ₹ crores | 34.92 | 21.97 | 0.17 | 0.34 | 0.0 | 0.4 | NA | 67.5 | 46.0 | 0.1 | 0.3 | NA | 21.8 | 37.4 | 2.09 | 2.74 | 11.52 | 0.71 | 12.19 | 12.23 | |||||||||||||||||||||||||||||||||||||||||||||||||||||||||||||
Average Cost per litre / | ₹ / Lit | 60.61 | 52.07 | 61.39 | 63.09 | 56.5 | 56.5 | NA | 67.74 | 59.4 | 61.8 | 62.6 | NA | 57.0 | 55.1 | 34.97 | 54.00 | 59.00 | 41.79 | 34.97 | 42.83 | |||||||||||||||||||||||||||||||||||||||||||||||||||||||||||||
Unit per litre of Oil | ||||||||||||||||||||||||||||||||||||||||||||||||||||||||||||||||||||||||||||||||||
Cost per Unit | ||||||||||||||||||||||||||||||||||||||||||||||||||||||||||||||||||||||||||||||||||
L.P.G./LNG/Propane/IPA | ||||||||||||||||||||||||||||||||||||||||||||||||||||||||||||||||||||||||||||||||||
Quantity-(LPG) | MT | 8,855.18 | 7,191.22 | NIL | 59.3 | NIL | NIL | NA | NIL | 55.3 | NIL | NIL | NA | |||||||||||||||||||||||||||||||||||||||||||||||||||||||||||||||||||||
Total Amount | ₹ crores | 30.30 | 28.31 | NIL | 0.3 | NIL | NIL | NA | NIL | 0.3 | NIL | NIL | NA | |||||||||||||||||||||||||||||||||||||||||||||||||||||||||||||||||||||
Average Cost per Kg | ₹ /Kg | 34.22 | 39.36 | NIL | 50.0 | NIL | NIL | NA | NIL | 49.3 | NIL | NIL | NA | |||||||||||||||||||||||||||||||||||||||||||||||||||||||||||||||||||||
L.P.G./LNG/Propane/IPA | ||||||||||||||||||||||||||||||||||||||||||||||||||||||||||||||||||||||||||||||||||
Quantity-(PNG) | MT | 466.26 | 0.00 | |||||||||||||||||||||||||||||||||||||||||||||||||||||||||||||||||||||||||||||||
Total Amount | ₹ crores | 1.76 | 0.00 | |||||||||||||||||||||||||||||||||||||||||||||||||||||||||||||||||||||||||||||||
Average Cost per Kg | ₹ /Kg | 37.75 | 0.00 | |||||||||||||||||||||||||||||||||||||||||||||||||||||||||||||||||||||||||||||||
L.P.G./LNG/Propane/IPA | ||||||||||||||||||||||||||||||||||||||||||||||||||||||||||||||||||||||||||||||||||
Quantity-(LNG) | MT | 0.00 | 0.00 | Nil | Nil | Nil | Nil | NA | Nil | Nil | Nil | Nil | NA | |||||||||||||||||||||||||||||||||||||||||||||||||||||||||||||||||||||
Total Amount | ₹ crores | 0.00 | 0.00 | NA | NA | NA | NA | NA | NA | NA | NA | NA | NA | |||||||||||||||||||||||||||||||||||||||||||||||||||||||||||||||||||||
Average Cost per MT | ₹ | 0.00 | 0.00 | NA | NA | NA | NA | NA | NA | NA | NA | NA | NA | |||||||||||||||||||||||||||||||||||||||||||||||||||||||||||||||||||||
L.P.G./LNG/Propane/IPA | ||||||||||||||||||||||||||||||||||||||||||||||||||||||||||||||||||||||||||||||||||
Quantity-(IPA) | MT | 0.00 | 0.00 | |||||||||||||||||||||||||||||||||||||||||||||||||||||||||||||||||||||||||||||||
Total Amount | ₹ crores | 0.00 | 0.00 | |||||||||||||||||||||||||||||||||||||||||||||||||||||||||||||||||||||||||||||||
Average Cost per Kg | ₹ /Kg | 0.00 | 0.00 | |||||||||||||||||||||||||||||||||||||||||||||||||||||||||||||||||||||||||||||||
VEDANTA LIMITED | INTEGRATED REPORT AND ANNUAL ACCOUNTS 2020-21 | 195
DIRECTORS REPORT CONTINUED...
Particulars | Unit | Year ended March 31, 2021 | Year ended March 31, 2020 | Year ended March 31, 2021 | Year ended March 31, 2020 | Year ended March 31, 2021 | Year ended March 31, 2021 | Year ended March 31, 2021 | Year ended March 31, 2021 | Year ended March 31, 2021 | Year ended March 31, 2020 | Year ended March 31, 2020 | Year ended March 31, 2020 | Year ended March 31, 2020 | Year ended March 31, 2020 | Year ended March 31, 2021 | Year ended March 31, 2020 | Year ended March 31, 2021 | Year ended March 31, 2020 | Year ended March 31, 2021 | Year ended March 31, 2020 | |||||||||||||||||||||||||||||||||||||||||||||||||||||||||||||||
| Oil & Gas | Copper | Iron-Ore | Power | Aluminium | ||||||||||||||||||||||||||||||||||||||||||||||||||||||||||||||||||||||||||||||||
Business | Met Coke Division | Pig Iron Division | Power Plant (WHR) | Mining Goa | Mining Karnataka | Met Coke Division | Pig Iron Division | Power Plant (WHR) | Mining Goa | Mining Karnataka | Lanjigarh | Jharsuguda | ||||||||||||||||||||||||||||||||||||||||||||||||||||||||||||||||||||||||
| A. Power and Fuel Consumption | ||||||||||||||||||||||||||||||||||||||||||||||||||||||||||||||||||||||||||||||||||||
Natural Briqutte/ Coal | ||||||||||||||||||||||||||||||||||||||||||||||||||||||||||||||||||||||||||||||||||||
Quantity | MT | 0.00 | 0.00 | Nil | Nil | Nil | Nil | NA | Nil | Nil | Nil | Nil | NA | 2,356,739.44 | 880,992.60 | 871,917.17 | 16,499,243.89 | 14,357,641.00 | ||||||||||||||||||||||||||||||||||||||||||||||||||||||||||||||||||
Total Amount | ₹ crores | 0.00 | 0.00 | NA | NA | NA | NA | NA | NA | NA | NA | NA | NA | 553.80 | 323.40 | 352.94 | 3,871 | 4,932.55 | ||||||||||||||||||||||||||||||||||||||||||||||||||||||||||||||||||
Average Cost per MT | ₹ | 0.00 | 0.00 | NA | NA | NA | NA | NA | NA | NA | NA | NA | NA | 2,350.00 | 3,670.86 | 4,047.90 | 2,350 | 3,435.49 | ||||||||||||||||||||||||||||||||||||||||||||||||||||||||||||||||||
B. Consumption per MT of Production | ||||||||||||||||||||||||||||||||||||||||||||||||||||||||||||||||||||||||||||||||||||
Continuous Copper Rod / Iron -Ore | ||||||||||||||||||||||||||||||||||||||||||||||||||||||||||||||||||||||||||||||||||||
Electricity | MWH/MT | 0.68 | 0.52 | 0.0 | 0.3 | 0.1 | NA | 0.0 | 0.0 | 0.3 | 0.1 | NA | 0.0 | |||||||||||||||||||||||||||||||||||||||||||||||||||||||||||||||||||||||
Furnace Oil | KL/MT | 0.05 | 0.05 | Nil | Nil | Nil | Nil | NA | Nil | Nil | Nil | Nil | NA | |||||||||||||||||||||||||||||||||||||||||||||||||||||||||||||||||||||||
Diesel | KL/MT | 0.0002 | 0.0005 | 0.0 | 0.0 | 0.0 | 0.0 | 0.0 | 0.0 | 0.0 | 0.0 | 0.0 | 0.0 | |||||||||||||||||||||||||||||||||||||||||||||||||||||||||||||||||||||||
L.P.G./Propane/IPA | MT/MT | 0.079 | 0.063 | NA | NA | NA | NA | NA | NA | NA | NA | NA | NA | |||||||||||||||||||||||||||||||||||||||||||||||||||||||||||||||||||||||
Production of Rod | MT | 118,257.00 | 114,916.00 | NA | NA | NA | NA | NA | NA | NA | NA | NA | NA | |||||||||||||||||||||||||||||||||||||||||||||||||||||||||||||||||||||||
Alumina | ||||||||||||||||||||||||||||||||||||||||||||||||||||||||||||||||||||||||||||||||||||
Electricity | KWH/MT | NA | NA | NA | NA | NA | NA | NA | NA | NA | NA | 215.7 | 216.8 | |||||||||||||||||||||||||||||||||||||||||||||||||||||||||||||||||||||||
Coal for Steam | MT/MT | NA | NA | NA | NA | NA | NA | NA | NA | 0.26 | 0.26 | |||||||||||||||||||||||||||||||||||||||||||||||||||||||||||||||||||||||||
Furnance Oil for Calcinaton | Kg/MT | NA | NA | NA | NA | NA | NA | NA | NA | NA | NA | 71.1 | 70.6 | |||||||||||||||||||||||||||||||||||||||||||||||||||||||||||||||||||||||
Hot Metal | ||||||||||||||||||||||||||||||||||||||||||||||||||||||||||||||||||||||||||||||||||||
Electricity (Total AC for electrolysis and auxillary energy) | KWH/MT | NA | NA | NA | NA | NA | NA | NA | NA | NA | NA | 14,084.69 | 14,090.45 | |||||||||||||||||||||||||||||||||||||||||||||||||||||||||||||||||||||||
Billet (including alloy rods) | ||||||||||||||||||||||||||||||||||||||||||||||||||||||||||||||||||||||||||||||||||||
Electricity | KWH/MT | NA | NA | NA | NA | NA | NA | NA | NA | NA | NA | 320.22 | 351.66 | |||||||||||||||||||||||||||||||||||||||||||||||||||||||||||||||||||||||
Furnace Oil | KL | NA | NA | NA | NA | NA | NA | NA | NA | NA | NA | |||||||||||||||||||||||||||||||||||||||||||||||||||||||||||||||||||||||||
Ingots | ||||||||||||||||||||||||||||||||||||||||||||||||||||||||||||||||||||||||||||||||||||
Electricity | KWH/MT | NA | NA | NA | NA | NA | NA | NA | NA | NA | NA | 25.39 | 34.22 | |||||||||||||||||||||||||||||||||||||||||||||||||||||||||||||||||||||||
Furnace Oil | KL | NA | NA | NA | NA | NA | NA | NA | NA | NA | NA | |||||||||||||||||||||||||||||||||||||||||||||||||||||||||||||||||||||||||
Wire Rods | ||||||||||||||||||||||||||||||||||||||||||||||||||||||||||||||||||||||||||||||||||||
Electricity | KWH/MT | NA | NA | NA | NA | NA | NA | NA | NA | NA | NA | 108.44 | 136.40 | |||||||||||||||||||||||||||||||||||||||||||||||||||||||||||||||||||||||
Furnace Oil | KL | NA | NA | NA | NA | NA | NA | NA | NA | NA | NA | |||||||||||||||||||||||||||||||||||||||||||||||||||||||||||||||||||||||||
SOW cast | ||||||||||||||||||||||||||||||||||||||||||||||||||||||||||||||||||||||||||||||||||||
Electricity | KWH/MT | 46.78 | ||||||||||||||||||||||||||||||||||||||||||||||||||||||||||||||||||||||||||||||||||
Alloy CastBar | ||||||||||||||||||||||||||||||||||||||||||||||||||||||||||||||||||||||||||||||||||||
Electricity | KWH/MT | 193.77 | ||||||||||||||||||||||||||||||||||||||||||||||||||||||||||||||||||||||||||||||||||
| * | This includes the WHRB Generation also. |
| ** | This includes the FO consumed in CPP also. |
| *** | This includes Generation from DG Set also. |
196
| < BACK TO CONTENTS | Integrated Report | Statutory reports | Financial statements |
Annexure B
ANNUAL REPORT ON CORPORATE SOCIAL RESPONSIBILITY ACTIVITIES FOR FY 2020-21
| 1 | Brief Outline on CSR Policy of the Company |
| A. | Policy Objective |
Vedanta Limited (‘VEDL’ or ‘the Company’) is committed to conduct its business in a socially responsible, ethical and environment friendly manner and to continuously work towards improving quality of life of the communities in and around its operational areas. This Policy provides guidance in achieving the above objective and ensures that the Company operates on a consistent and compliant basis.
| B. | VEDL CSR Philosophy |
We at Vedanta Limited have a well-established history and commitment to reinvest in the social good of our neighbourhood communities and nation.
CSR Vision
“Empowering communities, transforming lives and facilitating nation building through sustainable and inclusive growth.”
We believe, that
| • | we can positively impact and contribute to the realisation of integrated and inclusive development of the country, in partnership with National and State Government as well as local, national and international partners; |
| • | sustainable development of our businesses is dependent on sustainable, long lasting and mutually beneficial relationships with our stakeholders, especially the communities we work with; |
| • | partnerships with government, corporates and civil societies/community institutions, offer a strong multiplier for complementing efforts, resources and for building sustainable solutions; |
| • | our employees have the potential to contribute not just to our business, but also towards building strong communities. |
| C. | Thematic Focus Areas |
Our programmes focus on poverty alleviation programmes, especially integrated development, which impacts the overall socio-economic growth and empowerment of people, in line with the national and international development agendas. The major thrust areas will be –
| a) | Children’s Well-being & Education |
| b) | Women’s Empowerment |
| c) | Health Care |
| d) | Drinking Water & Sanitation |
| e) | Sustainable Agriculture & Animal Welfare |
| f) | Market-linked Skilling of the Youth |
| g) | Environment Protection & Restoration |
| h) | Sports & Culture |
| i) | Development of Community Infrastructure |
| j) | Participate in programmes of national importance including but not limited to disaster mitigation, rescue, relief and rehabilitation |
The CSR activities are aligned to the specified activities in Schedule VII of the Companies Act. The above may be modified from time to time, as per recommendations of the CSR Committee of the Company.
| 2 | Composition of CSR Committee: |
| Sr. | Number of meetings of | Number of meetings of CSR | ||||||
| No. | Name of Director | Designation/Nature of Directorship | CSR Committee held | Committee attended during | ||||
| during the year | the year | |||||||
| 1 | Mr. Mahendra Kumar Sharma | Chairperson, Independent Director | 2 | 2 | ||||
| 2 | Ms. Priya Agarwal | Member, Non-Executive Director | 2 | 2 | ||||
| 3 | Mr. UK Sinha | Member, Independent Director | 2 | 2 | ||||
| 4 | Mr. K Venkataramanan | Member, Independent Director | 2 | 2 | ||||
| 5 | Ms. Padmini Somani | Member, Independent Director | 2 | NA | ||||
| (Entitled to attend:0) |
| 3 | Provide the web-link where Composition of CSR Committee, CSR Policy and CSR projects approved by the board are disclosed on the website of the Company. |
CSR Committee: www.vedantalimited.com
CSR Policy: www.vedantalimited.com
CSR Projects: www.vedantalimited.com
VEDANTA LIMITED | INTEGRATED REPORT AND ANNUAL ACCOUNTS 2020-21 | 197
DIRECTORS REPORT CONTINUED...
| 4 | Provide the details of Impact assessment of CSR projects carried out in pursuance of sub-rule (3) of rule 8 of the Companies (Corporate Social Responsibility Policy) Rules, 2014, if applicable (attach the report). |
Impact assesment planned in FY 22
| 5 | Details of the amount available for set off in pursuance of sub-rule (3) of rule 7 of the Companies (Corporate Social responsibility Policy) Rules, 2014 and amount required for set off for the financial year, if any |
NA
| 6 | Average net profit of the Company as per Section 135(5) |
₹ 831.02 Crore
| (₹ in crore) | ||||||||
| 7 | (a | ) | Two percent of average net profit of the Company as per Section 135(5) | 16.62 | ||||
| ||||||||
| (b | ) | Surplus arising out of the CSR projects or programmes or activities of the previous financial years. | 0.00 | |||||
| ||||||||
| (c | ) | Amount required to be set off for the financial year, if any | ||||||
| (d | ) | Total CSR obligation for the financial year (7a+7b-7c) | 16.62 | |||||
| ||||||||
| 8 | (a) | CSR amount spent or unspent for the financial year: | ||||||||||||||
| Total Amount Spent | Amount Unspent (in D crores) | |||||||||||||||
| for the | Total Amount transferred to Unspent CSR | Amount transferred to any fund specified under | ||||||||||||||
| Financial Year | Account as per Section 135(6) | Schedule VII as per second proviso to Section 135(5) | ||||||||||||||
| (in E crores) | Amount | Date of Transfer | Name of the Fund | Amount | Date of Transfer | |||||||||||
| 38.86 | 0 | NA | NA | NA | NA | |||||||||||
| (b) | Details of CSR amount spent against ongoing projects for the financial year: | Refer ‘table 8b’ | ||||||||||||||
| (c) | Details of CSR amount spent against other than ongoing projects for the financial year: | Refer ‘table 8c | ||||||||||||||
| (d) | Amount spent in Administrative Overheads (E in crores) | 1.41 | ||||||||||||||
| (e) | Amount spent on Impact Assessment, if applicable (E in crores) | 0 | ||||||||||||||
| (f) | Total amount spent for the Financial Year (8b+8c+8d+8e) (E in crores) | 38.86 | ||||||||||||||
| (g) | Excess amount for set off, if any (E in crores) | 22.24 | ||||||||||||||
| Sl. No Particular | Amount (in ₹ crores) | |||||||||||||||
| (i) | Two percent of average net profit of the Company as per Section 135(5) | 16.62 | ||||||||||||||
| (ii) | Total amount spent for the Financial Year | 38.86 | ||||||||||||||
| (iii) | Excess amount spent for the financial year [(ii)-(i)] | 22.24 | ||||||||||||||
| (iv) | Surplus arising out of the CSR projects or programmes or activities of the previous financial years, if any | 0 | ||||||||||||||
| (v) | Amount available for set off in succeeding financial years [(iii)-(iv)] | 22.24 | ||||||||||||||
| 9 | (a) | Details of Unspent CSR amount for the preceding three financial years: | ||||||||||||||
| Nil | ||||||||||||||||
| (b) | Details of CSR amount spent in the financial year for ongoing projects of the preceding financial year(s): | |||||||||||||||
| Refer ‘table 9b’ | ||||||||||||||||
| 10 | In case of creation or acquisition of capital asset, furnish the details relating to the asset so created or acquired through CSR spent in the financial year (asset-wise details). | |||||||||||||||
| (a) | Date of creation or acquisition of the capital asset(s). | Nil | ||||||||||||||
| (b) | Amount of CSR spent for creation or acquisition of capital asset. | Nil | ||||||||||||||
| (c) | Details of the entity or public authority or beneficiary under whose name such capital asset is registered, their address etc. | NA | ||||||||||||||
| (d) | Provide details of the capital asset(s) created or acquired (including complete address and location of the capital asset). | NA | ||||||||||||||
| 11 | Specify the reason(s), if the Company has failed to spend two per cent of the average net profit as per Section 135(5). | |||||||||||||||
| NA | ||||||||||||||||
| Sd/- | Sd/- | |
| Sunil Duggal | MK Sharma | |
| Whole-time Director & Chief Executive Officer | Non-Executive Independent Director | |
| (Chairman - CSR Committee) |
198
| < BACK TO CONTENTS | Integrated Report | Statutory reports | Financial statements |
REPORT ON CSR ACTIVITIES - TABLE 8b)(
| 1 | 2 | 3 | 4 | 5 | 6 | 7 | 8 | 9 | 10 | 11 | ||||||||||||||||||||||
| Amount | Mode of Implementation - | |||||||||||||||||||||||||||||||
| transferred | Through Implementing Agency | |||||||||||||||||||||||||||||||
Sl. No. | Name of the Project | Item from the list of activities in | Local area | State | Location of the project District | Project duration | Amount allocated for the project (in E) | Amount spent in the current financial Year (in E) | to Unspent CSR Account for the project as per Section 135(6) (in E) | Mode of Implementations- Direct (Yes/No) | Name | CSR Registration number | ||||||||||||||||||||
Oil & Gas | ||||||||||||||||||||||||||||||||
1 | Barmer Unnati Project Phase -2 | (iv) ensuring environmental sustainability; | Yes | Rajasthan | Barmer & Jalore | 2022-23 | 15,000,000.00 | 8,800,000.00 | — | No | Sheghal Foundation | CSR00000262 | ||||||||||||||||||||
2 | Dairy Development and Animal Husbandry | Yes | Rajasthan | Barmer & Jalore | 2019-21 | 5,760,000.00 | 6,944,000.00 | — | No | Society For Upliftment of Rural Economy (SURE) | CSR00003156 | |||||||||||||||||||||
3 | Nandghar Project - O&M of Greenfields | (i) Eradicating hunger, poverty and malnutrition, promoting health care | Yes | Rajasthan | Barmer & Jalore | 2019-22 | 8,000,000.00 | 8,357,000.00 | — | No | CHETNA | CSR00001034 | ||||||||||||||||||||
4 | Anganwadi project | (ii) promoting education, (iii) Promoting gender equality, empowering women | Yes | Gujarat | Surat, Dwarka, Ahmedabad, Surendarnagar, Banaskantha | 2019-21 | 1,000,000.00 | 5,781,000.00 | — | No | GCSRA | CSR00002979 | ||||||||||||||||||||
5 | Establishing Smart Classrooms & infrastructure upgradation | (ii) promoting education; | Yes | Rajasthan & Gujarat | Barmer & Jalore - RJ Viramgam, Patan, Banskantha, Rajkot, Dwarka, Jamnagar, Randhanpur, Surendarnagar - GJ | 2017-21 | 2,500,000.00 | 17,539,000.00 | — | No | Yuva Unstoppable | CSR00000473 | ||||||||||||||||||||
6 | Project E-Kaksha (E-Learning) | (ii) promoting education; | Yes | Rajasthan | Pan Rajasthan - all 33 districts | 2020-22 | 5,000,000.00 | 6,453,000.00 | — | No | LG Charitable Trust/Bodh | CSR00005686 | ||||||||||||||||||||
7 | Barmer Smart and Green city development | (iv) ensuring environmental sustainability; | Yes | Rajasthan | Barmer | 2017-2021 | 2,120,000.00 | 2,125,000.00 | — | No | Anil Construction | NA | ||||||||||||||||||||
8 | Microlevel intervention | (x) rural development projects | Yes | Rajasthan | Barmer & Jalore | 2021-22 | 1,000,000.00 | 1,751,000.00 | — | No | Navrachna Mahila vikas trust | CSR00003662 | ||||||||||||||||||||
| Yes | Gujarat | Across 8 districts of GJ | 2020-21 | 2,000,000.00 | 300,000.00 | — | No | CEDRA | CSR0000191 | |||||||||||||||||||||||
| Yes | Assam | Jorath | 2020-21 | 4,000,000.00 | 3,655,000.00 | — | Yes | NA | NA | |||||||||||||||||||||||
VEDANTA LIMITED | INTEGRATED REPORT AND ANNUAL ACCOUNTS 2020-21 | 199
DIRECTORS REPORT CONTINUED...
| 1 | 2 | 3 | 4 | 5 | 6 | 7 | 8 | 9 | 10 | 11 | ||||||||||||||||||||
| Amount | Mode of Implementation - | |||||||||||||||||||||||||||||
| transferred | Through Implementing Agency | |||||||||||||||||||||||||||||
Sl. No. | Name of the Project | Item from the list of activities in Schedule VII to | Local area (Yes/No) | State | Location of the project District | Project | Amount allocated for the project (in E) | Amount spent in the current financial Year (in E) | to Unspent CSR Account for the project as per Section 135(6) (in E) | Mode of Implementations- Direct (Yes/No) | Name | CSR Registration number | ||||||||||||||||||
9 | Community Infrastructure Development | Yes | Rajasthan | Barmer & Jalore | NA | 3,000,000.00 | 1,200,000.00 | — | Yes | NA | NA | |||||||||||||||||||
10 | O&M of Old 32 RO Plants O&M of Old 92 RO Plants | (i) making available safe drinking water | Yes | Rajasthan | Barmer & Jalore | 2018-21 | 6,300,000.00 | 3,179,000.00 | — | No | Swajal Pvt Ltd | NA | ||||||||||||||||||
| Yes | Rajasthan | Barmer & Jalore | 2020-21 | 9,560,000.00 | 7,443,000.00 | — | No | RDO | CSR00001586 | |||||||||||||||||||||
11 | Establishing Community RO plant - AP | Yes | Assam | East Godavari | 2021-22 | — | 350,000.00 | — | No | Vodalife | NA | |||||||||||||||||||
12 | O&M of Solar plants in Adarsh Schools | (ii) promotion of education; | Yes | Rajasthan | Barmer | 2019-22 | 500,000.00 | — | — | No | Sun Sakti | NA | ||||||||||||||||||
13 | Specialist Doctor - District Hospital, Barmer Hospital Sanitation -Clean Barmer Green Barmer | (i) promoting health care including preventinve health care and sanitation | Yes | Rajasthan | Barmer | 2015-22 | 8,950,000.00 | 9,620,000.00 | — | No | Barmer Jan Sewa Samiti | CSR00002129 | ||||||||||||||||||
| Yes | Rajasthan | Barmer | 2014-22 | 10,000,000.00 | 10,698,000.00 | — | No | Barmer Jan Sewa Samiti | CSR00002129 | |||||||||||||||||||||
14 | Mobile Health Van | Yes | Rajasthan | Barmer | 2016-20 | 3,790,000.00 | 1,662,000.00 | — | No | Wockhardt | CSR00000161 | |||||||||||||||||||
| Foundation | ||||||||||||||||||||||||||||||
| Yes | Rajasthan & Gujarat | Barmer, Gudamalani - for RJ Radhanpur and Dwarka - GJ | 2010-21 | 11,933,000.00 | 11,568,000.00 | — | No | HelpAge India | CSR00000901 | |||||||||||||||||||||
| Yes | Rajasthan & Gujarat | Barmer and Sanchore - RJ Tharad and Virnamgam - GJ | 2018-21 | 8,650,000.00 | 7,154,000.00 | — | No | Dhara Sansthan | CSR00001421 | |||||||||||||||||||||
15 | Community Helpdesk to link communities to Govt schemes | (ii) promotion of education | Yes | Gujarat | Viranmgam | 2019-22 | 1,500,000.00 | 2,572,000.00 | — | No | GCSRA | CSR00002979 | ||||||||||||||||||
16 | Skill Training Programs in CEC Barmer | (ii) employment enhancing | Yes | Rajasthan | Barmer & Jalore | 2016-21 | 16,500,000.00 | 9,683,000.00 | — | No | Seeds, | CSR00000657 | ||||||||||||||||||
| Infra upgradation of CEC | vocational skills | Yes | Rajasthan | Barmer | 2020-21 | 3,000,000.00 | 4,183,000.00 | — | No | Charbhuja Filling station | NA | |||||||||||||||||||
200
| < BACK TO CONTENTS | Integrated Report | Statutory reports | Financial statements |
| 1 | 2 | 3 | 4 | 5 | 6 | 7 | 8 | 9 | 10 | 11 | ||||||||||||||||||||
| Amount | Mode of Implementation - | |||||||||||||||||||||||||||||
| transferred | Through Implementing Agency | |||||||||||||||||||||||||||||
Sl. No. | Name of the Project | Item from the list of activities in Schedule VII to | Local area (Yes/No) | State | Location of the project District | Project | Amount allocated for the project (in E) | Amount spent in the current financial Year (in E) | to Unspent CSR Account for the project as per Section 135(6) (in E) | Mode of Implementations- Direct (Yes/No) | Name | CSR Registration number | ||||||||||||||||||
17 | Civil Revamp Works, Electrical, IT, CCTV, F&G, Security, electricity, Insurance for CCoE Skill Training Programs in CCOE Barmer | (ii) employment enhancing vocational skills | Yes | Rajasthan | Jodhpur | 2017-20 | 4,000,000.00 | 2,340,000.00 | — | NA | MECC/ JVVNL | NA | ||||||||||||||||||
| Yes | Rajasthan | Jodhpur | NA | 6,000,000.00 | — | — | NA | TBD | NA | |||||||||||||||||||||
18 | Support to Para Athletes | (vii) Promoting sports and paralympic sports | Yes | Rajasthan & Gujarat | All districts | 2017-21 | 4,000,000.00 | 4,623,000.00 | — | NA | Paralympic Committee of India | NA | ||||||||||||||||||
|
|
|
| |||||||||||||||||||||||||||
Oil & Gas Sub-Total A | 144,063,000.00 | 137,980,000.00 | — | |||||||||||||||||||||||||||
|
|
|
| |||||||||||||||||||||||||||
Copper | ||||||||||||||||||||||||||||||
19 | Tamira Surabhi | (i) promoting health care including preventinve health care and sanitation | Yes | Tamil Nadu | Thoothukudi | 2019-22 | 10,895,000.00 | 7,915,367.00 | — | No | Vijay Enterprises, SDR Drinking Water. | NA | ||||||||||||||||||
20 | Pasumai Thoothukudi | (iv) ensuring environmental sustainability | Yes | Tamil Nadu | Thoothukudi | 2019-22 | 37,069,263.00 | 36,124,263.00 | — | No | APM, Sakthi Nursery garden, LN S Thyagarajan | NA | ||||||||||||||||||
21 | Scholarship | (ii) promoting education | Yes | Tamil Nadu | Thoothukudi | 2019-21 | 1,000,000.00 | 995,215.00 | — | Yes | — | NA | ||||||||||||||||||
22 | Health on wheels | (i) promoting health care including preventinve health care | Yes | Tamil Nadu | Thoothukudi | 2019-22 | 2,116,400.00 | 1,947,846.00 | — | Yes | — | NA | ||||||||||||||||||
23 | Woman Resource Centre | (ii) employment enhancing vocation skills among women (iii) promoting gender equality, empowering women | Yes | Tamil Nadu | Thoothukudi | 2019-22 | 3,402,752.00 | 3,292,300.00 | — | No | Thulasi social trust/Bell education and women empowerment society/ Dhaayagam social welfare trust) | NA | ||||||||||||||||||
24 | School & Hospital Project | (i) promoting health care including preventinve health care (ii) promoting education | Yes | Tamil Nadu | Thoothukudi | 2019-22 | 3,340,703.00 | 3,340,703.00 | — | Yes | — | NA | ||||||||||||||||||
|
|
|
| |||||||||||||||||||||||||||
Copper Sub-Total B | 57,824,118.00 | 53,615,694.00 | — | — | ||||||||||||||||||||||||||
|
|
|
| |||||||||||||||||||||||||||
VEDANTA LIMITED | INTEGRATED REPORT AND ANNUAL ACCOUNTS 2020-21 | 201
DIRECTORS REPORT CONTINUED...
| 1 | 2 | 3 | 4 | 5 | 6 | 7 | 8 | 9 | 10 | 11 | ||||||||||||||||||||
| Amount | Mode of Implementation - | |||||||||||||||||||||||||||||
| transferred | Through Implementing Agency | |||||||||||||||||||||||||||||
Sl. No. | Name of the Project | Item from the list of activities in Schedule VII to | Local area (Yes/No) | State | Location of the project District | Project | Amount allocated for the project (in E) | Amount spent in the current financial Year (in E) | to Unspent CSR Account for the project as per Section 135(6) (in E) | Mode of Implementations- Direct (Yes/No) | Name | CSR Registration number | ||||||||||||||||||
Iron Ore | ||||||||||||||||||||||||||||||
25 | Alternative Livelihood Opportunities Project | (ii) livelihood enhancement projects. | Yes | Karnataka | Chitradurga | 2020-2025 | 3,700,000.00 | 7,467,000.00 | — | No | BAIF | CSR00000259 | ||||||||||||||||||
(iii) promoting gender equality, empowering women | ||||||||||||||||||||||||||||||
(iv) ensuring environmental sustainability | ||||||||||||||||||||||||||||||
26 | Community Medical centre & Mobile health unit | (i) promoting health care including preventinve health care | Yes | Goa, Jharkhand | North Goa, West Singhbum | 2014-2022 | 6,100,000.00 | 3,855,947.00 | — | No | 1. Voluntary Health Association of Goa(VHAG) 2. Sevamob | 1. VHAG- NA 2. Sevamob - CSR00001153 | ||||||||||||||||||
|
|
|
| |||||||||||||||||||||||||||
Iron Ore Sub-Total C | 9,800,000.00 | 11,322,947.00 | — | |||||||||||||||||||||||||||
|
|
|
| |||||||||||||||||||||||||||
Aluminium - Jharsuguda | ||||||||||||||||||||||||||||||
27 | Mobile Health Unit | (i) Promoting health care including preventinve health care | Yes | Odisha | Jharsuguda | 2010-2022 | 2,957,000.00 | 3,398,677.35 | 0 | No | Wockhardt Foundation; | Wockhardt Foundation- CSR00000161 | ||||||||||||||||||
28 | Project Jagruti: Prevention of HIV/ AIDS | (i) promoting health care including preventinve health care | Yes | Odisha | Jharsuguda | 2015-2022 | 0 | No | Wockhardt Foundation | CSR00000161 | ||||||||||||||||||||
29 | Village cleanliness drive | (i) promoting health care including preventinve health care and sanitation | Yes | Odisha | Jharsuguda | 2013-2022 | 2,797,000.00 | 2,493,800.00 | 0 | Yes | NA | |||||||||||||||||||
30 | Vedanta DAV School fees program | (ii) promoting education, | Yes | Odisha | Jharsuguda | 2009-2026 | 6,000,000.00 | 4,582,408.24 | 0 | Yes | NA | |||||||||||||||||||
31 | Other Educational Initiatives : VVVY Project/ Additional teacher/ Tutorial Classes/Bridge school/ Competitive exam preparation classes | (ii) promoting education, | Yes | Odisha | Jharsuguda | 2009-2020 | 620,000.00 | 868,230.00 | 0 | Yes | NA | NA | ||||||||||||||||||
202
| < BACK TO CONTENTS | Integrated Report | Statutory reports | Financial statements |
| 1 | 2 | 3 | 4 | 5 | 6 | 7 | 8 | 9 | 10 | 11 | ||||||||||||||||||||
| Amount | Mode of Implementation - | |||||||||||||||||||||||||||||
| transferred | Through Implementing Agency | |||||||||||||||||||||||||||||
Sl. No. | Name of the Project | Item from the list of activities in Schedule VII to | Local area (Yes/No) | State | Location of the project District | Project | Amount allocated for the project (in E) | Amount spent in the current financial Year (in E) | to Unspent CSR Account for the project as per Section 135(6) (in E) | Mode of Implementations- Direct (Yes/No) | Name | CSR Registration number | ||||||||||||||||||
32 | Computer Literacy around periphery villages | (ii) promoting education, including special education and employment enhancing vocation skills | Yes | Odisha | Jharsuguda | 2013-2021 | 430,000.00 | 568,549.00 | 0 | No | Vedanta Foundation | CSR00001617 | ||||||||||||||||||
33 | Vedanta Mini-Science Centre in 5 Odiya medium school | (ii) promoting education, including | Yes | Odisha | Jharsuguda | 2019-2022 | 100,000.00 | 41,096.92 | 0 | No | Stem Learning Private Limited | NA | ||||||||||||||||||
34 | Women Empowerment: Subhalaxmi Co-op, Capacity Building, Micro Enterprises | (iii) promoting gender equality, empowering women, | Yes | Odisha | Jharsuguda | 2008-2022 | 400,000.00 | 245,170.77 | 0 | No | Subhalaxmi Bahumukhee Mahila Samabaya Samiti Limited | NA | ||||||||||||||||||
35 | Farm Activity: Project Jeevika Samridhhi & other initiative | (iv) ensuring environmental sustainability | Yes | Odisha | Jharsuguda | 2017-2022 | 1,400,000.00 | 1,765,155.45 | 0 | No | Social Education for Women’s Awareness | CSR00006927 | ||||||||||||||||||
36 | Supporting Sports | (vii) training to promote rural sports | Yes | Odisha | Jharsuguda | 2010-2022 | 150,000.00 | 90,960.00 | 0 | Yes | NA | |||||||||||||||||||
37 | Plantation & Maintenance | (iv) ensuring environmental sustainability, ecological balance | Yes | Odisha | Jharsuguda | 2010-2022 | 1,800,000.00 | 1,577,949.72 | 0 | Yes | NA | |||||||||||||||||||
38 | BIOMASS energy production | (iv) ensuring environmental sustainability, | Yes | Odisha | Jharsuguda | 2020-2023 | 500,000.00 | — | 0 | NA | NA | |||||||||||||||||||
|
|
|
| |||||||||||||||||||||||||||
Aluminium - Jharsuguda Sub-Total D | 17,154,000.00 | 15,631,997.45 | — | |||||||||||||||||||||||||||
|
|
|
| |||||||||||||||||||||||||||
Aluminium-Lanjigarh | ||||||||||||||||||||||||||||||
39 | Vedanta Hospital | (i) promoting health care including preventinve health care | Yes | Odisha | Kalahandi | 2019-2025 | 32,500,000.00 | 31,431,000.00 | — | No | Punaruthan Voluntary Organisation | CSR00000650 | ||||||||||||||||||
40 | Maa Santoshi Jan Kalyan, Bankakundru | (i) promoting health care including preventinve health care | Yes | Odisha | Kalahandi | 2019-2025 | 1,358,000.00 | 1,211,000.00 | — | No | Maa Santoshi Jankalyan Foundation | CSR00010453 | ||||||||||||||||||
VEDANTA LIMITED | INTEGRATED REPORT AND ANNUAL ACCOUNTS 2020-21 | 203
DIRECTORS REPORT CONTINUED...
| 1 | 2 | 3 | 4 | 5 | 6 | 7 | 8 | 9 | 10 | 11 | ||||||||||||||||||||
| Amount | Mode of Implementation - | |||||||||||||||||||||||||||||
| transferred | Through Implementing Agency | |||||||||||||||||||||||||||||
Sl. No. | Name of the Project | Item from the list of activities in Schedule VII to | Local area (Yes/No) | State | Location of the project District | Project | Amount allocated for the project (in E) | Amount spent in the current financial Year (in E) | to Unspent CSR Account for the project as per Section 135(6) (in E) | Mode of Implementations- Direct (Yes/No) | Name | CSR Registration number | ||||||||||||||||||
41 | Child Care Centre | (ii) promoting education | Yes | Odisha | Kalahandi | 2019-2025 | 4,360,000.00 | 3,157,000.00 | — | No | Forum for Integrated Development & Research | CSR00003638 | ||||||||||||||||||
42 | Support to School | (ii) promoting education | Yes | Odisha | Kalahandi | 2019-2025 | 1,108,000.00 | — | — | No | Forum for Integrated Development & Research | CSR00003638 | ||||||||||||||||||
43 | Women empowerment | (iii) promoting gender equality, empowering women | Yes | Odisha | Kalahandi | 2019-2025 | 2,000,000.00 | 1,924,000.00 | — | No | Mahashakti Foundation | CSR00002561 | ||||||||||||||||||
44 | Farm & Non-farm livelihood | (ii) livelihood enhancement projects | Yes | Odisha | Kalahandi | 2019-2025 | 10,000,000.00 | 539,000.00 | — | Yes | NA | NA | ||||||||||||||||||
|
|
|
| |||||||||||||||||||||||||||
Aluminium - Lanjigarh Sub-Total E | 51,326,000.00 | 38,262,000.00 | — | |||||||||||||||||||||||||||
|
|
|
| |||||||||||||||||||||||||||
Total (A+B+C+D+E) | 280,167,118.00 | 256,812,638.45 | — | |||||||||||||||||||||||||||
|
|
|
| |||||||||||||||||||||||||||
204
| < BACK TO CONTENTS | Integrated Report | Statutory reports | Financial statements |
REPORT ON CSR ACTIVITIES - TABLE 8c)(
| 1 | 2 | 3 | 4 | 5 | 6 | 7 | 8 | |||||||||||||||
| Location of the project | Mode of implementation - through implementing agency | |||||||||||||||||||||
Sl. No. | Name of the Project. | Item from the list of activities in schedule VII to the Act | Local area (Yes/ No) | State | District | Amount spent for the project (in E) | Mode of implemen- tation - Direct (Yes/No) | Name | CSR Registration number | |||||||||||||
Oil & Gas | ||||||||||||||||||||||
1 | Project Sanjeevani - a CSR initiative in context of COVID-19 | (i) promoting health care including preventinve health care | Yes | Rajasthan, Gujarat, Assam and Andhra Pradesh | Barmer & Jalore - RJ Viramgam, Patan, Banskantha, Rajkot, Dwarka, Jamnagar, Randhanpur, Surendarnagar - GJ East Godavari - Andhra Pradesh Jorath - Assam | |||||||||||||||||
(xii) disaster management, including relief | 10,655,495.00 | Yes | NA | NA | ||||||||||||||||||
2 | Awareness drive on “COVID Vaccine” | (i) promoting health care including preventinve health care | Yes | Rajasthan, Delhi, Gujarat, Assam and Andhra Pradesh | Barmer & Jalore - RJ Viramgam, Patan, Banskantha, Rajkot, Dwarka, Jamnagar, Randhanpur, Surendarnagar - GJ East Godavari - Andhra Pradesh Jorath - Assam | 2,200,000.00 | No | Dhara Sansthan | CSR0000142 | |||||||||||||
3 | Providing Desk bags | (ii) promoting education | Yes | Rajasthan | Barmer & Jalore | 2,000,000.00 | No | Power2SME | NA | |||||||||||||
4 | Support to District Hospital - equipment support | (ii) promoting education | Yes | Rajasthan | Barmer | 4,500,000.00 | NA | BJSS | CSR00002129 | |||||||||||||
5 | CSR Program admin | CSR Administration | Yes | Rajasthan | NA | 7,320,000.00 | NA | |||||||||||||||
|
| |||||||||||||||||||||
Oil & Gas Sub-Total A | 26,675,495.00 | |||||||||||||||||||||
|
| |||||||||||||||||||||
Copper | ||||||||||||||||||||||
6 | CSR Audit, Need assessment Study and Others | CSR Administration | Yes | Tamilnadu | Thoothukudi | 1,141,042.00 | Yes | NA | NA | |||||||||||||
7 | Community & Infra Development | (x) Rural Development | Yes | Tamilnadu | Thoothukudi | 973,575.00 | Yes | NA | NA | |||||||||||||
8 | COVID relief | (i) promoting health care including preventinve health care | Yes | Tamilnadu | Thoothukudi | 10,006,929.00 | Yes | NA | NA | |||||||||||||
|
| |||||||||||||||||||||
Copper Sub-Total B | 12,121,546.00 | |||||||||||||||||||||
|
| |||||||||||||||||||||
VEDANTA LIMITED | INTEGRATED REPORT AND ANNUAL ACCOUNTS 2020-21 | 205
DIRECTORS REPORT CONTINUED...
| 1 | 2 | 3 | 4 | 5 | 6 | 7 | 8 | |||||||||||||||
| Location of the project | Mode of implementation through implementing agency | |||||||||||||||||||||
Sl. No. | Name of the Project. | Item from the list of activities in schedule VII to the Act | Local area (Yes/ No) | State | District | Amount spent for the project (in E) | Mode of implemen- tation - Direct (Yes/No) | Name | CSR Registration number | |||||||||||||
Iron Ore | ||||||||||||||||||||||
9 | GramNirman | (iii) empowering women (iv) ensuring environmental sustainability | Yes | Goa | North Goa | 305,788.00 | No | Vanrai | CSR00001205 | |||||||||||||
10 | Back to Farming | (iv) ensuring environmental sustainability, ecological balance, animal welfare, | Y | Goa | North Goa & South Goa | 2,469,295.00 | Yes | NA | NA | |||||||||||||
11 | Scholarship & Support to schools | (ii) promoting education | Y | Goa | North Goa & South Goa | 1,414,044.00 | Yes | NA | NA | |||||||||||||
12 | Study centres | (ii) promoting education | Y | Jharkhand | West Singhbum | 905,955.00 | Yes | NA | NA | |||||||||||||
13 | Rural infra projects | (x) rural development projects | Y | Goa, Jharkhand | North Goa, South Goa, West Singhbum | 1,807,163.00 | Yes | NA | NA | |||||||||||||
14 | COVID-19 | (i) promoting health care including preventinve health care | Y | Goa, Karnataka, Maharashtra | North Goa, South Goa, Chitradurga, Sindhudurg | 9,387,346.00 | Yes | NA | NA | |||||||||||||
15 | Sanitation units | (i) promoting health care including preventinve health care and sanitation | Y | Goa, Karnataka | North Goa Chitradurga | 1,150,720.00 | Yes | NA | NA | |||||||||||||
16 | Drinking water Supply | (i) making available safe drinking water | Y | Goa | North Goa | 985,723.00 | Yes | NA | NA | |||||||||||||
17 | Specialised health campaign | (i) promoting health care including preventinve health care | Y | Goa | North Goa | 59,600.00 | Yes | NA | NA | |||||||||||||
18 | Skilling of youths | (ii) employment enhancing vocation skills | Y | Goa Karnataka | North Goa, Chitradurga | 122,152.00 | Yes | NA | NA | |||||||||||||
19 | CSR programme admin | CSR Administration | Y | Goa | North Goa | 124,860.00 | Yes | NA | NA | |||||||||||||
|
| |||||||||||||||||||||
Iron Ore Sub-Total C | 18,732,646.00 | |||||||||||||||||||||
|
| |||||||||||||||||||||
Aluminium - Jharsuguda | ||||||||||||||||||||||
20 | Social Infrastructure Projects | (x) rural development projects | Y | Odisha | Jharsuguda | 12,199,724.93 | Yes | NA | NA | |||||||||||||
21 | Disaster Relief -FANI, COVID-19 response | (xii) disaster management, including relief | Y | Odisha | Jharsuguda | 27,105,403.92 | Yes | NA | NA | |||||||||||||
206
| < BACK TO CONTENTS | Integrated Report | Statutory reports | Financial statements |
| 1 | 2 | 3 | 4 | 5 | 6 | 7 | 8 | |||||||||||||
| Location of the project | Mode of implementation - through implementing agency | |||||||||||||||||||
Sl. No. | Name of the Project. | Item from the list of activities in schedule VII to the Act | Local area (Yes/ No) | State | District | Amount spent for the project (in E) | Mode of implemen- tation - Direct (Yes/No) | Name | CSR Registration number | |||||||||||
22 | CSR Study, Audit, Travels, etc. | CSR Administration | Yes | Odisha | Jharsuguda | 2,713,857.03 | No | Social Education for Women’s Awareness; Indian Institute of Corporate Affairs Subhash Mittal & Associates | NA | |||||||||||
|
| |||||||||||||||||||
Aluminium - Jharsuguda Sub-Total D | 42,018,985.88 | |||||||||||||||||||
|
| |||||||||||||||||||
Aluminium - Lanjigarh | ||||||||||||||||||||
23 | Aspirational District Program (NITI Aayog) | (i) promoting health care including preventinve health care | Yes | Odisha | Kalahandi | 230,000.00 | No | Janasahajya | CSR00001642 | |||||||||||
(ii) promoting education | ||||||||||||||||||||
(iii) promoting gender equality, empowering women | ||||||||||||||||||||
(ii) livelihood enhancement projects | ||||||||||||||||||||
(x) rural development projects | ||||||||||||||||||||
24 | Sustainability | (iv) ensuring environmental sustainability | Yes | Odisha | Kalahandi | 228,000.00 | Yes | NA | ||||||||||||
25 | COVID-19 | (i) promoting health care including preventinve health care and sanitation | Yes | Odisha | Kalahandi | 26,773,000.00 | No | Punaruthan Voluntary Organisation | CSR00000650 | |||||||||||
(xii) Disaster management | ||||||||||||||||||||
26 | Ambulance | (i) promoting health care including preventinve health care | Yes | Odisha | Kalahandi | 1,579,000.00 | Yes | NA | NA | |||||||||||
27 | Community Infrastructure | (x) rural development projects | Yes | Odisha | Kalahandi | 584,000.00 | Yes | NA | NA | |||||||||||
28 | Program & Admin | CSR Admin | Yes | Odisha | Kalahandi | 2,800,000.00 | No | NA | NA | |||||||||||
|
| |||||||||||||||||||
Aluminium - Lanjigarh Sub-Total E | 32,194,000.00 | |||||||||||||||||||
|
| |||||||||||||||||||
Total (A+B+C+D+E) | 131,742,672.88 | |||||||||||||||||||
|
| |||||||||||||||||||
VEDANTA LIMITED | INTEGRATED REPORT AND ANNUAL ACCOUNTS 2020-21 | 207
DIRECTORS REPORT CONTINUED...
REPORT ON CSR ACTIVITIES - TABLE 9(B)
(B) DETAILS OF CSR AMOUNT SPENT IN THE FINANCIAL YEAR FOR ONGOING PROJECTS OF THE PRECEDING FINANCIAL YEAR(S):
| 1 | 2 | 3 | 4 | 5 | 6 | 7 | 8 | 9 | ||||||||||||||||||||
Sr. | Project | Name of the Project | Financial Year in which the project was commenced | Project duration | Total amount allocated for the project (in E) | Amount spent on the project in the reporting Financial Year (in E) | Cumulative amount spent at the end of reporting Financial Year (in lakhs) | Status of the project - Completed/ Ongoing | ||||||||||||||||||||
Oil & Gas | ||||||||||||||||||||||||||||
1 | NA | Barmer Unnati Project Phase -2 | 2013 | 10 Yrs | 20,299,000.00 | 8,800,000.00 | 14,768,099.00 | On-going | ||||||||||||||||||||
2 | NA | Dairy Development and Animal Husbandry | 2007 | 14 Yrs | 6,547,000.00 | 6,944,000.00 | 17,817,990.00 | On-going | ||||||||||||||||||||
3 | NA | Nandghar Project - O&M of Greenfields | 2019 | 3 Yrs | 13,300,000.00 | 8,357,000.00 | 22,224,635.00 | On-going | ||||||||||||||||||||
4 | NA | Anganwadi project | 2019 | 2 Yrs | 20,709,000.00 | 5,781,000.00 | 19,081,000.00 | On-going | ||||||||||||||||||||
5 | NA | Establishing Smart Classrooms & infrastructure upgradation - RJ & GJ | 2017 | 4 Yrs | 33,899,666.00 | 17,539,000.00 | 43,833,000.00 | On-going | ||||||||||||||||||||
6 | NA | Project E-Kaksha (E-Learning) | 2019 | 3 Yrs | 16,180,000.00 | 6,453,000.00 | 20,637,000.00 | On-going | ||||||||||||||||||||
7 | NA | Barmer Smart and Green city development | 2017 | 4 Yrs | 1,860,000.00 | 2,125,000.00 | 12,815,561.00 | On-going | ||||||||||||||||||||
8 | NA | O&M of Old 32 RO Plants | 2018 | 3 Yrs | 16,125,000.00 | 3,179,000.00 | 65,463,000.00 | On-going | ||||||||||||||||||||
9 | NA | O&M of Old 92 RO Plants | 2016 | 5 Yrs | 12,066,000.00 | 7,443,000.00 | 7,443,000.00 | On-going | ||||||||||||||||||||
10 | NA | O&M of Solar plants in Adarsh Schools | 2019 | 2 Yrs | 500,000.00 | — | 9,285,900.00 | On-going | ||||||||||||||||||||
11 | NA | Specialist Doctor - District Hospital, Barmer | 2015 | 7 Yrs | 10,659,000.00 | 9,620,000.00 | 46,882,656.00 | On-going | ||||||||||||||||||||
12 | NA | Hospital Sanitation - Clean Barmer Green Barmer | 2014 | 8 Yrs | 10,298,000.00 | 10,698,000.00 | 30,378,099.00 | On-going | ||||||||||||||||||||
13 | NA | Mobile Health Van - RJ | 2016 | 4 Yrs | 7,200,000.00 | 1,662,000.00 | 101,534,544.00 | On-going | ||||||||||||||||||||
| NA | Mobile Health Van - RJ & GJ | 2010 | 11 Yrs | 10,400,000.00 | 11,568,000.00 | On-going | ||||||||||||||||||||||
| NA | Mobile Health Van - RJ & GJ | 2016 | 5 Yrs | 7,200,000.00 | 7,154,000.00 | On-going | ||||||||||||||||||||||
14 | NA | Support to Primary Health Centre (S’yanam) - Support of medical staffs | 2018 | 2 Yrs | 2,560,000.00 | — | 4,735,000.00 | Completed | ||||||||||||||||||||
15 | NA | Community Helpdesk to link communities to Govt schemes | 2019 | 2 Yrs | 5,990,919.00 | 2,572,000.00 | 6,335,000.00 | On-going | ||||||||||||||||||||
16 | NA | Skill Training Programs in CEC Barmer | 2016 | 5 Yrs | 18,800,000.00 | 9,683,000.00 | 72,653,260.00 | On-going | ||||||||||||||||||||
17 | NA | Infra-upgradation at CCOE - Civil Revamp Works, Electrical, IT, CCTV, F&G, Security, electricity, Insurance for CCOE | 2018 | 3 Yrs | 10,014,000.00 | 2,340,000.00 | 27,032,797.00 | On-going | ||||||||||||||||||||
18 | NA | Skill Training Programs in CCOE Barmer | 2014 | 5 Yrs | 1,780,000.00 | — | 42,442,628.00 | On-going | ||||||||||||||||||||
19 | NA | Support to Para Athletes | 2017 | 4 Yrs | 3,600,000.00 | 4,623,000.00 | 11,464,180.00 | On-going | ||||||||||||||||||||
20 | NA | Cairn Pink City Half Marathon: theme-(#WearAMaskSaveALife) | 2017 | 3 Yrs | 4,950,000.00 | — | 10,250,000.00 | On-going | ||||||||||||||||||||
|
|
|
|
|
| |||||||||||||||||||||||
Oil & Gas Total A | 234,937,585.00 | 126,541,000.00 | 587,077,349.00 | |||||||||||||||||||||||||
|
|
|
|
|
| |||||||||||||||||||||||
Copper | ||||||||||||||||||||||||||||
21 | NA | Tamira Surabhi | 2019 | Continous | 23,895,000.00 | 7,915,367.00 | 16,915,367.00 | Ongoing | ||||||||||||||||||||
22 | NA | Pasumai Thoothukudi | 2019 | 10 Yrs | 77,069,263.00 | 36,124,263.00 | 80,524,263.00 | Ongoing | ||||||||||||||||||||
208
| < BACK TO CONTENTS | Integrated Report | Statutory reports | Financial statements |
| 1 | 2 | 3 | 4 | 5 | 6 | 7 | 8 | 9 | ||||||||||||||||||||
Sr. | Project | Name of the Project | Financial Year in which the project was commenced | Project duration | Total amount allocated for the project (in E) | Amount spent on the project in the reporting Financial Year (in E) | Cumulative amount spent at the end of reporting Financial Year (in lakhs) | Status of the project - Completed/ Ongoing | ||||||||||||||||||||
23 | NA | Scholarship | 2019 | 2 Yrs | 54,000,000.00 | 995,215.00 | 44,245,215.00 | Completed | ||||||||||||||||||||
24 | NA | Health | 2019 | Continous | 16,716,400.00 | 1,947,846.00 | 5,962,846.00 | Ongoing | ||||||||||||||||||||
25 | NA | Woman Resource Centre | 2019 | Continous | 40,602,752.00 | 3,292,300.00 | 6,712,300.00 | Ongoing | ||||||||||||||||||||
26 | NA | School & Hospital | 2019 | 2 Yrs | 4,690,703.00 | 3,340,703.00 | 4,690,703.00 | Ongoing | ||||||||||||||||||||
|
|
|
|
|
| |||||||||||||||||||||||
Copper Total B | 216,974,118.00 | 53,615,694.00 | 159,050,694.00 | |||||||||||||||||||||||||
|
|
|
|
|
| |||||||||||||||||||||||
Iron Ore | ||||||||||||||||||||||||||||
27 | NA | Community Medical Centre (CMC)& Mobile health unit (MHU) | | CMC- 2006 MHU 2011 | | Continous | 32,900,000.00 | 3,855,947.00 | 19,500,000.00 | Ongoing | ||||||||||||||||||
|
|
|
|
|
| |||||||||||||||||||||||
Iron Ore Total C | 32,900,000.00 | 3,855,947.00 | 19,500,000.00 | |||||||||||||||||||||||||
|
|
|
|
|
| |||||||||||||||||||||||
Aluminium - Jharsuguda | ||||||||||||||||||||||||||||
28 | NA | Vedanta DAV Scholarship Program | 2009 | 2009-2026 | 69,931,000.00 | 4,583,622.35 | 60,556,167.83 | Ongoing | ||||||||||||||||||||
29 | NA | VVVY Project/ Additional Teacher/ Tutorial Classes/Career | 2009 | 2009-2020 | 9,120,000.00 | 868,230.00 | 14,144,388.98 | Completed | ||||||||||||||||||||
| Counseling/Competitive exam preparation classes | ||||||||||||||||||||||||||||
30 | NA | Computer Literacy Program | 2013 | 2013-2021 | 4,130,000.00 | 568,549.00 | 2,006,395.70 | Ongoing | ||||||||||||||||||||
31 | NA | Vedanta Mini-Science Centre in 5 Odiya medium school | 2019 | 2019-2022 | 2,900,000.00 | 41,096.92 | 2,179,480.92 | Ongoing | ||||||||||||||||||||
32 | NA | Women Empowerment: Subhalaxmi Co-op, Capacity Buidling, Micro Enterprises | 2008 | 2008-2022 | 44,500,000.00 | 245,170.77 | 30,514,055.70 | Ongoing | ||||||||||||||||||||
33 | NA | Mobile Health Unit | 2010 | 2010-2022 | 67,334,000.00 | 3,398,677.35 | 51,301,740.90 | Ongoing | ||||||||||||||||||||
34 | NA | Project Jagruti: Prevention of HIV/ AIDS | 2015 | 2015-2022 | 2,100,000.00 | — | 266,890.92 | Ongoing | ||||||||||||||||||||
35 | NA | Village cleanliness drive | 2013 | 2013-2022 | 18,857,000.00 | 2,493,800.00 | 20,897,814.96 | |||||||||||||||||||||
36 | NA | Water Supply & other water-sanitation facility | 2011 | 2011-2022 | 18,300,000.00 | — | 64,652,984.20 | Ongoing | ||||||||||||||||||||
37 | NA | Farm Activity: Project Jeevika Samridhhi & other initiative | 2017 | 2017-2022 | 11,800,000.00 | 1,765,155.45 | 4,514,342.65 | Ongoing | ||||||||||||||||||||
38 | NA | Plantation & Maintenance | 2010 | 2010-2022 | 37,302,000.00 | 1,577,949.72 | 25,320,974.35 | Ongoing | ||||||||||||||||||||
39 | NA | Supporting Sports & cultural events | 2010 | 2010-2022 | 9,540,000.00 | 90,960.00 | 4,783,397.00 | Ongoing | ||||||||||||||||||||
40 | NA | Disaster Relief | 2019 | 2019-2023 | 27,122,000.00 | 27,105,403.92 | 33,539,343.55 | Ongoing | ||||||||||||||||||||
41 | NA | Community Asset creation | 2010 | 2010-2021 | 32,03,95,000.00 | 1,21,99,724.93 | 29,97,12,292.61 | Ongoing | ||||||||||||||||||||
|
|
|
|
|
| |||||||||||||||||||||||
Aluminium - Jharsuguda Total D | 643,331,000.00 | 54,938,340.41 | 614,390,270.27 | |||||||||||||||||||||||||
|
|
|
|
|
| |||||||||||||||||||||||
Aluminium - Lanjigarh | ||||||||||||||||||||||||||||
42 | NA | Health | 2010 | 2019-2025 | 118,587,000.00 | 32,642,000.00 | 111,741,000.00 | Ongoing | ||||||||||||||||||||
43 | NA | Education | 2005 | 2019-2025 | 23,514,000.00 | 3,156,509.85 | 19,653,000.00 | Ongoing | ||||||||||||||||||||
44 | NA | Livelihood | 2015 | 2019-2025 | 23,649,000.00 | 2,463,394.00 | 26,063,000.00 | Ongoing | ||||||||||||||||||||
45 | NA | Infrastructure | 2015 | 2019-2025 | 25,715,000.00 | 583,998.74 | 15,568,000.00 | Ongoing | ||||||||||||||||||||
|
|
|
|
|
| |||||||||||||||||||||||
Aluminium - Lanjigarh Total E | 191,465,000.00 | 38,845,902.59 | 173,025,000.00 | |||||||||||||||||||||||||
|
|
|
|
|
| |||||||||||||||||||||||
Total (A+B+C+D+E) | 1,319,607,703.00 | 277,796,884.00 | 1,553,043,313.27 | |||||||||||||||||||||||||
|
|
|
|
|
| |||||||||||||||||||||||
VEDANTA LIMITED | INTEGRATED REPORT AND ANNUAL ACCOUNTS 2020-21 | 209
DIRECTORS REPORT CONTINUED...
Annexure C
Disclosure in Board’s report as per provisions of Section 197 of the Companies Act, 2013 read with Rule 5(1) of the Companies (Appointment and Remuneration of Managerial Personnel) Rules, 2019
Sr. No. | Requirement | Disclosure Name of the Director | Category | Ratio | ||||||
1 | Ratio of the remuneration of each director to the median remuneration of the employees of the company for the financial year | Navin Agarwal (1) | Executive Vice-Chairman | 205.37 | ||||||
| Srinivasan Venkatakrishnan(2) | Whole-Time Director & Chief Executive Officer | — | ||||||||
| Sunil Duggal(3) | Whole-Time Director & Chief Executive Officer | 97.24 | ||||||||
| GR Arun Kumar(4) | Whole-Time Director & Chief Financial Officer | 76.01 | ||||||||
| Ratio of the Fee for attending board/ committee Meetings & Comission of each director to the median remuneration of the employees of the company for the financial year | Anil Agarwal | Non-Executive Chairman | 1.18 | |||||||
| Aman Mehta(5) | Independent Director | 1.52 | ||||||||
| K Venkataramanan(6) | Independent Director | 12.21 | ||||||||
| Lalita D Gupte(7) | Independent Director | 7.45 | ||||||||
| Mahendra Kumar Sharma | Independent Director | 12.56 | ||||||||
| UK Sinha | Independent Director | 12.83 | ||||||||
| Padmini Somani(8) | Independent Director | 1.85 | ||||||||
| Priya Agarwal | Non Executive Director | 14.78 | ||||||||
Name | Category | Increment Percentage | ||||||||
2 | Percentage increase in remuneration of each director, Chief Financial Officer, Chief Executive Officer, Company Secretary or Manager, if any, in the financial year | Navin Agarwal | Executive Vice-Chairman | NIL | ||||||
| Srinivasan Venkatakrishnan | Whole-Time Director & | NIL | ||||||||
| Chief Executive Officer | ||||||||||
| Sunil Duggal | Whole-Time Director & | 30 | % | |||||||
| Chief Executive Officer | ||||||||||
| GR Arun Kumar | Whole-Time Director & | NIL | ||||||||
| Chief Financial Officer | ||||||||||
| Prerna Halwasiya | Company Secretary & | NIL | ||||||||
| Compliance Officer | ||||||||||
3 | Percentage increase in the median remuneration of employees in the financial year | The median remuneration of the employees in the financial year was increased by 11.2 % | ||||||||
4 | Number of permanent employees on the rolls of company | There were 8,550 employees of Vedanta Limited as on March 31, 2021 | ||||||||
5 | Average percentile increase already made in the salaries of employees other than the managerial personnel in the last financial year and its comparison with the percentile increase in the managerial remuneration and justification thereof and point out if there are any exceptional circumstances for increase in the managerial remuneration | NIL increment; as the increment FY 20 was put on hold due to Global Pandemic | ||||||||
6 | Affirmation that the remuneration is as per Yes the remuneration policy of the Company | |||||||||
Notes:
| 1. | For Mr. Navin Agarwal, the ratio inclusive of remuneration received from Vedanta Resources Limited, UK, the Holding Company, is 216.69 |
| 2. | For Mr. Srinivasan Venkatakrishnan, the ratio of remuneration received from Vedanta Resources Limited, UK, the Holding Company, is 25.40. Mr. Venkatarakrishnan ceased to be Whole-Time Director and Chief Executive Officer of the Company effective close of business hours on April 5, 2020. |
| 3. | Mr. Sunil Duggal was appointed as Interim CEO of Vedanta Limited effective April 6, 2020 and subsequently CEO effective August 1, 2020 and Whole-Time Director effective April 25, 2021. During the period when he was operating as Interim CEO, his 50% of remuneration was allocated to VEDL which is reported above. |
| 4. | Mr. GR Arun Kumar ceased to be Whole-Time Director and Chief Financial Officer of the Company effective close of business hours on April 24, 2021. |
| 5. | Mr. Aman Mehta ceased to be Independent Director of the Company effective close of business hours on May 16, 2020. |
| 6. | Mr. K Venkataramanan ceased to be Independent Director of the Company effective close of business hours on March 31, 2021. |
| 7. | Ms. Lalita Gupte ceased to be Independent Director of the Company effective close of business hours on November 6, 2020. |
| 8. | Ms. Padmini Somani was appointed as an Additional Director designated as Independent Director of the Company effective February 5, 2021. |
210
| < BACK TO CONTENTS | Integrated Report | Statutory reports | Financial statements |
Annexure D
SECRETARIAL AUDIT REPORT
for the financial year ended March 31, 2021
To,
The Members
Vedanta Limited
1st Floor, C wing,
Unit 103, Corporate Avenue Atul Projects,
Chakala, Andheri (East),
Mumbai – 400 093, Maharashtra
We have conducted the Secretarial Audit of the compliance of applicable statutory provisions and the adherence to good corporate governance practices by Vedanta Limited (hereinafter called the “Company”). Secretarial Audit was conducted in a manner that provided us a reasonable basis for evaluating the corporate conducts/statutory compliances and expressing our opinion thereon.
Based on our verification of the Company’s books, papers, minute books, forms and returns filed and other records maintained by the Company and also the information provided by the Company, its officers, agents and authorised representatives during the conduct of secretarial audit, we hereby report that in our opinion, the Company has, during the audit period covering the financial year ended on March 31, 2021 complied with the statutory provisions listed hereunder and also that the Company has proper Board-processes and compliance- mechanism in place to the extent, in the manner and subject to the reporting made hereinafter:
We have examined the books, papers, minute books, forms and returns filed and other records maintained by the Company for the Financial Year ended on March 31, 2021 according to the provisions of:
| (i) | The Companies Act, 2013 (the “Act”) and the rules made thereunder; |
| (ii) | The Securities Contracts (Regulation) Act, 1956 (”SCRA’) and the rules made thereunder; |
| (iii) | The Depositories Act, 1996 and the Regulations and Bye-laws framed thereunder to the extent of Regulation 76 of Securities and Exchange Board of India (Depositories and Participants) Regulations, 2018; |
| (iv) | Foreign Exchange Management Act, 1999 and the rules and regulations made thereunder to the extent of Foreign Direct Investment, Overseas Direct Investment and External Commercial Borrowings; |
| (v) | The following Regulations and Guidelines prescribed under the Securities and Exchange Board of India Act, 1992 (‘SEBI Act”):- |
| (a) | The Securities and Exchange Board of India (Substantial Acquisition of Shares and Takeovers) Regulations, 2011; |
| (b) | The Securities and Exchange Board of India (Prohibition of Insider Trading) Regulations, 2015; |
| (c) | The Securities and Exchange Board of India (Issue of Capital and Disclosure Requirements) Regulations, 2018; |
| (d) | The Securities and Exchange Board of India (Share Based Employee Benefits) Regulations, 2014; |
| (e) | The Securities and Exchange Board of India (Issue and Listing of Debt Securities) Regulations, 2008; |
| (f) | The Securities and Exchange Board of India (Registrars to an Issue and Share Transfer Agents) Regulations, 1993 regarding the Companies Act and dealing with client to the extent of securities issued; |
| (g) | The Securities and Exchange Board of India (Delisting of Equity Shares) Regulations, 2009; |
| (h) | The Securities and Exchange Board of India (Buyback of Securities) Regulations, 1998; Not Applicable during the period |
| (vi) | The Management has identified and confirmed the following laws as being specifically applicable to the Company: |
| (a) | The Mines and Minerals (Development and Regulation) Act, 2015 and the rules and regulations made thereunder. |
| (b) | Indian Boilers Act, 1923 and rules and regulations made thereunder. |
| (c) | Manufacture, Storage, and Import of Hazardous Chemical Rule, 1989. |
We have also examined compliance with the applicable clauses/Regulations of the following:
| (i) | Secretarial Standards issued by The Institute of Company Secretaries of India and notified by Ministry of Corporate of Affairs. |
| (ii) | Securities and Exchange Board of India (Listing Obligations and Disclosure Requirements) Regulations, 2015 (“Listing Regulations”). |
VEDANTA LIMITED | INTEGRATED REPORT AND ANNUAL ACCOUNTS 2020-21 | 211
DIRECTORS REPORT CONTINUED...
During the period under review, the Company has substantially complied with the provisions of the Act, Rules, Regulations, Guidelines, Standards, etc. mentioned above except written as under:
| (i) | Pursuant to regulation 33 of Listing Regulations read with SEBI circular no SEBI/HO/CFD/CMD1/ CIR/P/2020/140, dated July 29, 2020, Financial Results for the Quarter ended June 30, 2020 were required to be approved by September 15, 2020 however the same have been approved by the board of directors at its meeting held on October 03, 2020 and the Company has received notice(s) from BSE Limited & National Stock Exchange of India Limited (Stock Exchanges) for delay in approval and submission of financial results for the quarter ended June 30, 2020 and a fine of ₹ 1,06,200/- (inclusive of GST @ 18 %) has been imposed by each of the stock exchange(s). As confirmed by the management of the Company the same has been paid within the prescribed timeline. |
| (ii) | The Company had delayed submission of intimation under regulation 29(2) of Listing Regulations with each of the Stock Exchange(s) with regard to the meeting of the Board of Directors held on October 3, 2020 to consider the financial results of the Company for Quarter ended June 30, 2020 and a fine of ₹ 11,800/- (inclusive of GST @ 18%) has been imposed by each of the stock exchange(s). As confirmed by the management of the Company the same has been paid within the prescribed timeline. |
| (iii) | The Company had submitted the outcome of the board meeting held on October 03, 2020 for the approval of financial results for the Quarter ended June 30, 2020 beyond the prescribed timeline under Para A of Part A of schedule III of Listing Regulations. |
We further report that:
The Board of Directors of the Company is duly constituted with proper balance of Executive Directors, Non-Executive Directors, and Independent Directors. The changes in the composition of the Board of Directors that took place during the period under review were carried out in compliance with the provisions of the Act. The Company had made an application in form MR-2 with the Ministry of Corporate Affairs, to obtain the approval of Central Government for the appointment of Mr. Srinivasan Venkatakrishnan, a foreign national, as Whole-Time Director (“WTD”) designated as CEO of the Company with effect from March 01, 2019 in terms of
Section 196, 197 read with Schedule V of the Companies Act, 2013 and the same was rejected by the Ministry vide its e-mail dated June 9, 2020, for delay in filing of the form. In this regard, the Company filed an application for condonation of delay in filing of form MR-2 including justification for delay with Ministry, in Form CG-1 and post approval of the form CG-1 by the Ministry vide its order dated August 25, 2020, the Company again filed the application to reconsider form MR-2 and the same was pending for approval before the Ministry as on the closure of financial year ended March 31, 2021. Further Mr. S Venkatakrishnan has resigned from the position of WTD designated as CEO w.e.f. April 05, 2020.
Adequate notice is given to all directors to schedule the Board/Committee Meetings. Agenda and detailed notes on agenda were sent atleast seven days in advance except in case where meetings were convened at shorter notice. A system exists for seeking and obtaining further information and clarifications on the agenda items before the meeting and for meaningful participation at the meeting.
All decisions at Board Meetings and Committee Meetings are carried out unanimously as recorded in the minutes of the meetings of the Board of Directors or Committee of the Board, as the case may be.
We further report that there are adequate systems and processes in the Company commensurate with the size and operations of the Company to monitor and ensure compliance with applicable laws, rules, regulations and guidelines.
We further report that during the audit period, following major events have happened which are deemed to have major bearing on the Company’s affairs in pursuance of the above referred laws, rules, regulations, guidelines, standards, etc.
| (i) | The Company has issued and allotted Non-Convertible Debentures of ₹ 500 crores during the period under review. |
| (ii) | The Company has redeemed Non-Convertible Debentures of ₹ 2,600 crores during the period under review. |
212
| < BACK TO CONTENTS | Integrated Report | Statutory reports | Financial statements |
| (iii) | The Company had received a letter dated May 12, 2020 from one of the members of the promoter and promoter group of the Company (“Promoter Group”) namely, Vedanta Resources Limited (“Vedanta”) wherein Vedanta has expressed its intention to, either individually or along with one or more subsidiaries, acquire all fully paid-up equity shares of the Company (“Equity Shares”) that are held by the public shareholders of the Company and consequently voluntarily delist the Equity Shares from the Stock Exchanges where the Equity Shares are listed, in accordance with the Delisting Regulations. The Company took all the requisite approvals required under the said regulations. But delisting offer deemed to have failed in terms of Regulation 19(1) of the Delisting Regulations. |
| (iv) | Vedanta Resources Limited (VRL), along with persons acting in concert with it (PACs), had announced a voluntary open offer in accordance with Securities and Exchange Board of India (Substantial |
Acquisition of Shares and Takeovers) Regulations, 2011. Subsequently, 374,231,161 equity shares of the Company have been validly tendered in this Voluntary Open Offer. |
| For Chandrasekaran Associates | ||
| Company Secretaries | ||
| Dr. S Chandrasekaran | ||
| Senior Partner | ||
| Membership No. A1644 | ||
| Date: May 7, 2021 | Certificate of Practice No. 715 | |
| Place: New Delhi | UDIN: F001644C000253159 | |
Notes:
| i. | This report is to be read with our letter of even date which is annexed as Annexure-A and forms an integral part of this report. |
| ii. | Due to restricted movement amid COVID-19 pandemic, we conducted the secretarial audit by examining the Secretarial Records including Minutes, Documents, Registers and other records etc., and some of them received by way of electronic mode from the Company and could not be verified from the original records. The management has confirmed that the records submitted to us are the true and correct. This Report is limited to the Statutory Compliances on laws/ regulations/ guidelines listed in our report of which, the due date has been ended/ expired on or before March 31, 2021 pertaining to Financial Year 2020-21. |
ANNEXURE-A TO SECRETARIAL AUDIT REPORT
To,
The Members
Vedanta Limited
1st Floor, C wing,
Unit 103, Corporate Avenue Atul Projects,
Chakala, Andheri (East),
Mumbai – 400 093, Maharashtra
| 1. | Maintenance of secretarial record is the responsibility of the Management of the Company. Our responsibility is to express an opinion on these secretarial records based on our audit. |
| 2. | We have followed the audit practices and processes as were appropriate to obtain reasonable assurance about the correctness of the contents of the secretarial records. The verification was done on the random test basis to ensure that correct facts are reflected in secretarial records. We believe that the processes and practices, we followed provide a reasonable basis for our opinion. |
| 3. | We have not verified the correctness and appropriateness of financial records and Books of Accounts of the Company. |
| 4. | Whenever required, we have obtained the Management representation about the compliance of laws, rules and regulations and happening of events etc. |
| 5. | The compliance of the provisions of Corporate and other applicable laws, rules, regulations, standards is the responsibility of Management. Our examination was limited to the verification of procedures on random test basis. |
| 6. | The Secretarial Audit report is neither an assurance as to the future viability of the Company nor of the efficacy or effectiveness with which the Management has conducted the affairs of the Company. |
| For Chandrasekaran Associates | ||
| Company Secretaries | ||
| Dr. S Chandrasekaran | ||
| Senior Partner | ||
| Membership No. A1644 | ||
| Date: May 7, 2021 | Certificate of Practice No. 715 | |
| Place: New Delhi | UDIN: F001644C000253159 | |
VEDANTA LIMITED | INTEGRATED REPORT AND ANNUAL ACCOUNTS 2020-21 | 213
Report on Corporate Governance
Vedanta believes in working towards ‘Desh Ki Zarooraton Ke Liye’ – ascertaining that everything above the Earth comes from below the Earth. We, being a responsible globally diversified natural resources company, trust in unearthing and harnessing the infinite potential of natural resources in the most sustainable way to power the nation’s progress. Vedanta, providing vital commodities needed for everyday life, endeavours to bring these blessings of the earth to you.
COMPANY’S PHILOSOPHY ON CODE OF GOVERNANCE
Our Corporate Governance reflects the values, vision, mission and seven pillars of the Company. To perpetually ensure utmost trust and confidence of our stakeholders in us, transparency, accountability, excellence, veracity, safety and professionalism form an integral part of our functioning and practices.
The success of the Company is in consonance with the value generation for its shareholders. Vedanta, hence, believes that by ensuring highest standards of Corporate Governance and following global best practices, it is continuously evolving its performance goals and optimising sustainable yield for its shareholders.
| SEVEN PILLARS OF VEDANTA | ||||||||||||
| Sustainability, Health, Safety & Environment | People | Values, Ethics & Governance | Digitalisation, Innovation, Technology & Excellence | Quality | Growth | Giving back to Community/ Society | ||||||
| GUIDING PRINCIPLES | ||||||||||
| Transparency and Accountability | Policies & Regulatory Framework | Management/ Board and Committees | Values & Ethics | Monitoring & Internal Control | Executing Strategy & Managing Risk | |||||
214
| < BACK TO CONTENTS | Integrated Report | Statutory reports | Financial statements |
Compliance with Global Guidelines and Best Practices
Your Company has been at the forefront in complying with global best practices in Corporate Governance.
During the year, in an attempt to recognise and honor the exemplary commitment of your Company in the area of Corporate Governance and Sustainable Development, Vedanta Limited was bestowed with the prestigious Corporate Governance Award conferred by the Indian Chamber of Commerce (ICC).
| 1. | Corporate Governance Award conferred by the Indian Chamber of Commerce. |
| 2. | SILVER Award for Integrated Report 2019- 20 under the LACP Spotlight Awards. |
The Award duly acknowledged and rewarded the positive steps undertaken by your Company in the field of Corporate Governance in order to measure and manage its economic, environmental & social impacts and performance, and to integrate sustainability into its core business models while nurturing innovation. This, in turn, marks as a significant milestone in our growth journey to highlight our leading example and inspire others to adopt similar sustainable policies and practices whilst communicating on their performance with transparency and integrity.
Vedanta Limited has also received the SILVER Award for its Integrated Report 2019-20 under the LACP Spotlight
Award Category as the only Indian Integrated Report (Revenue $10bn+) to win in this category.
LACP (League of American Communications Professionals) is highly regarded for corporate reporting and communications. With the 2020 Spotlight Awards Global Communications Competition drawing one of the largest submissions ever representing a broad range of industries and organisational sizes globally, in the category criteria, LACP judging panel accorded the Integrated Report of Vedanta for 2019-20 with a score of 97/100 across aspects of content, creativity, messaging and presentation. Your Company has been continuing to apply and win this award in different categories since the past five consecutive years.
Vedanta has maintained the highest standards of corporate governance all through its operations. Our sustainable development journey continues to create value for our stakeholders. We have invested our time and resources in introspecting our actions; we have achieved our targets and formulated ambitious new ones; we have adopted global best practices and taken innovative leaps; we have aligned our standards with industry benchmarks and charted some of our own. We have done all this and will continue to do it with a singular agenda: ensuring long-term growth of all stakeholders.
In addition to complying with the statutory guidelines, the Company has voluntarily adopted and evolved various practices of governance conforming to utmost ethical and responsible standards of business. These practices reflect the way business is conducted and value is generated.
INTEGRATED REPORTING
Since its inception, Vedanta Limited has taken conscious efforts to operate in a manner responsible to all stakeholders. Every decision and action at the Company is taken after considering the impact they may have on the Company’s relevant stakeholder groups. This is a true reflection of the organisation’s integrated thinking, which takes into account all the resources and relationships that affect Company’s ability to create sustained value. These resources and relationships, termed ‘Capitals’, are stocks of value enabling Company’s operations.
SEBI vide circular no. SEBI/HO/CFD/CMD/CIR/P/2017/10 dated February 06, 2017 had recommended voluntary adoption of ‘Integrated Reporting’ (IR) from 2017 - 2018 by the top 500 listed companies in India.
While operating, your Company actively considers its external environment, the opportunities and challenges, the organisational strategy to respond to these externalities and the outputs and outcomes it produces basis its business activities. Starting FY 2017-18, the Company has proactively commenced reporting its annual performance and strategy using an integrated report, using the content elements and the guiding principles outlined in the International Integrated Reporting framework. The organisation has continued its Integrated Reporting journey and its FY 2020-21 performance and forward-looking strategy have been elucidated in the current Integrated Annual Report. The report takes into account the following six capitals while reporting:
VEDANTA LIMITED | INTEGRATED REPORT AND ANNUAL ACCOUNTS 2020-21 | 215
REPORT ON CORPORATE GOVERNANCE CONTINUED...
FINANCIAL CAPITAL
The Company is focused on optimising capital allocation and maintaining a strong balance sheet while generating strong FCFs. It also reviews all investments, taking into account the Group’s financial resources with a view to maximising returns to shareholders.
NATURAL CAPITAL
India and Africa have favourable geology and mineral potential and these regions provide the Company with world-class mining assets, which are structurally at low cost and have extensive R&R. Additionally, operating the Company’s mines requires a range of resources, including water and energy, which the Company aims to use prudently and sustainably.
HUMAN CAPITAL
The Company has employees from across the world and it is committed to provide them with a safe and healthy work environment. In addition, by creating a culture that nurtures innovation, creativity and diversity, it enables them to grow personally and professionally while also helping to meet our business goals.
INTELLECTUAL CAPITAL
As a relatively young Company, the Company is keen to embrace technological developments. The Company is setting up a centre of technological excellence in South Africa, enabling them to nurture and implement innovative ideas across the business, which lead to operational improvements.
SOCIAL & RELATIONSHIP CAPITAL
The Company aims to forge strong partnerships by engaging with its key stakeholders, including shareholders and lenders, suppliers and contractors, employees, governments, communities and the society in general. These relationships help maintain and strengthen Vedanta’s licence to operate.
MANUFACTURED CAPITAL
The Company invests in assets including best-in-class equipment and machinery to ensure it operates as efficiently and safely as possible, both at its current operations and in its expansion projects. This also supports its strong and sustainable cash flow generation.
SUSTAINABILITY REPORTING JOURNEY AT VEDANTA
More than twelve years ago, Vedanta embarked upon a journey to transform how it does business. We committed to not only become the lowest cost metal producer in the world, but to do so in the most sustainable way possible. To achieve this, we established policies and standards in line with global best practices. We then began the journey of meticulously embedding them across our business operations. Ever since, we have embraced sustainability as a comprehensive, integrated business practice that involves collaboration, innovation, and a course of action.
We see sustainable development as a core requirement to strategically improve the value of our business, both by managing risk and improving our operating standards. Our approach to sustainability mirrors our prevailing business ethos of achieving excellence through continuous improvement in processes and outcomes while also benchmarking ourselves against global peers. On the sustainability roadmap, we keep achieving our goals and formulating new ones with continuous progress towards lasting growth.
In line with the keystone of our sustainability journey to ensure long-term growth for all stakeholders, we have
been building our sustainable development agenda on transparent and credible reporting practices.
Your Company has been publishing the Sustainable Development Report for more than a decade now. The Report is prepared in accordance with the Global Reporting Initiative (GRI) Standards: Core option and is also mapped to the United Nations Global Compact (UNGC) and aligns to Sustainable Development Goals (SDGs). It should be considered as our Communication of Progress (COP) which reports our approach and disclosure towards triple bottom line principles - people, planet, and profit.
Vedanta applies its sustainability performance reporting criteria based on GRI Standards including the Mining
& Metals and Oil & Gas Sector Disclosures; National Voluntary Guidelines on Social, Environmental & Economic Responsibilities of Business (NVG) framed by the Ministry of Corporate Affairs, Government of India; United Nations Global Compact (UNGC) principles; and standards set by International Council on Mining & Metals (ICMM), International Finance Corporation (IFC), Organisation for Economic Co-operation & Development (OECD) and Sustainable Development Goal frameworks for the Company.
216
| < BACK TO CONTENTS | Integrated Report | Statutory reports | Financial statements |
For further insights into the sustainability practices adopted by your Company, the Sustainability Report can be accessed at www.vedantalimited.com.
TAX TRANSPARENCY REPORTING
We have a long-standing commitment to transparency and are proud of the value we generate and how this contributes to building trust with the communities in which we operate.
The Tax Governance and Strategy of the Company includes the following:
| • | Substance, Transparency and Arm’s Length Principle; |
| • | Tax Risk Management; |
| • | Dynamic Tax Environment; |
| • | Relationship with Tax Authorities and Dispute Resolution. |
The Company has been publishing Tax Transparency Report (TTR) for providing an overview of the tax strategy, governance and tax contributions made by the Company and for ensuring greater transparency and disclosure of profits made, and taxes paid. We consider this as an important part of our social license to operate. TTR is a voluntary initiative to ensure proactive transparency in tax reporting and greater accountability towards stakeholders which helps in getting detailed information about the overall economic contribution of Vedanta to the government of countries where it operates.
The report for the FY 2021 is available on the website at www.vedantalimited.com.
GOVERNANCE FRAMEWORK
Your Company has always been a front runner in adopting best governance practices and endeavours to embed and sustain a culture of highest ethical standards, personal and professional integrity and upholding its core values of Trust, Entrepreneurship, Innovation, Excellence, Integrity, Respect and Care.
The governance framework of the Company is underpinned through its resounding core values with the strength of leading vision, strategic mission, and the primary objective of delivering sustainable growth.
With a strong governance philosophy, we have a multi-tier governance structure with defined roles and responsibilities of every constituent of the governance system.
Corporate
Governance
Framwork
BOARD OF DIRECTORS
The Board of Directors of the Company provide entrepreneurial leadership and play a crucial role in providing strategic supervision, overseeing the management performance, and long-term success of the Company while ensuring sustainable shareholder value.
Driven by its guiding principles of Corporate Governance, the Board’s actions endeavour to work in best interest of the Company.
The Directors hold a fiduciary position, exercise independent judgement and play a vital role in the oversight of the Company’s affairs. Our Board represents a tapestry of complementary skills, attributes, perspectives and includes individuals with financial experience and a diverse background.
In line with the recommendation of SEBI and our relentless endeavour to adhere to the global best practices, the Company is chaired by Mr. Anil Agarwal, Non-Executive Chairman effective April 1, 2020.
With a view to effectively discharge its obligations, the Board has delegated certain responsibilities to its various committees. Each of the committees have a clearly defined charter and is entrusted with discharging its duties, roles and responsibilities. The details about these committees have been discussed in detail in subsequent sections in this report.
VEDANTA LIMITED | INTEGRATED REPORT AND ANNUAL ACCOUNTS 2020-21 | 217
REPORT ON CORPORATE GOVERNANCE CONTINUED...
Role & Responsibilities
Chairman
| • | Leading the Board and ensure that it discharges its responsibilities effectively; |
| • | Develops succession plan for Board appointments for approval by the Board; |
| • | Identifies strategic priorities and new business opportunities to enhance shareholder value; |
| • | Promotes the highest standards of integrity, probity and governance; |
| • | Chairs the board meeting and facilitates active engagement of all Directors; |
| • | Oversees the Director’s induction, performance and ongoing development; and |
| • | Engages with Company’s stakeholders to ensure that an appropriate balance is maintained between various interests. |
Vice-Chairman
| • | Supports the Non-Executive Chairman in executing the overall vision and strategy of the Group; |
| • | Enhances and sustains the Group’s overall HSE, people, digital and technology, ethics and compliance practices at global standards; |
| • | Oversees stakeholder engagement in India and globally; |
| • | Ensures effective execution of growth projects to deliver value; and |
| • | Provides mentoring to some of the key corporate functions like the people function, management assurance and investor relations including key leadership development. |
Chief Executive Officer
| • | Leading the management team; |
| • | Developing & executing the corporate strategy in conjunction with the Board; |
| • | Implementing the decisions of the Board and its Committees; |
| • | Developing Group policies and ensuring effective implementation; and |
| • | Enhancing shareholder value and implementing the organisation’s vision, mission, and overall direction. |
Senior Management
| • | Developing and executing business strategy; and |
| • | Management of the day-to-day decisions and ensuring that decisions are in parity with the long-term objectives and policies of the Company. |
218
| < BACK TO CONTENTS | Integrated Report | Statutory reports | Financial statements |
Separate role of Chairman & CEO
There is clear demarcation of the roles and responsibilities of the Chairman of the Board and the Chief Executive Officer (CEO) as the positions are held by separate individuals. Further, as on March 31, 2021, the Company also had a separately designated Chief Financial Officer and Company Secretary & Compliance Officer.
The reporting structure, as shown below, between the Board, Board Committees and Management Committees forms the backbone of the Group’s Corporate Governance framework.
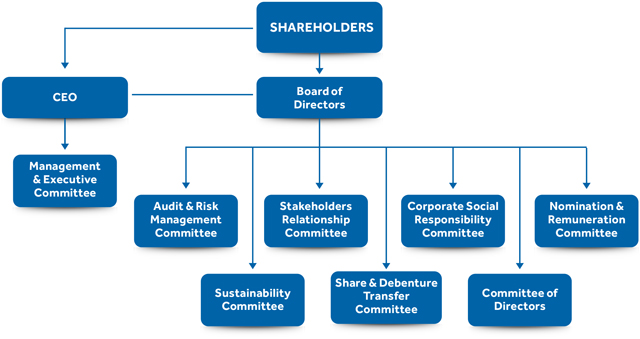
Changes in the position of Directors / Key Managerial Personnel (KMPs) of the Company:
| Director | Designation | Change (Appointment/ Re-designation/ Resignation) | Date of appointment/ Re-designation | Tenure Till | ||||
| Anil Agarwal | Non-Executive Chairman | Appointment | April 1, 2020 | — | ||||
| Navin Agarwal | Executive Vice-Chairman | Re-designation | April 1, 2020 | July 31, 2023 | ||||
| S Venkatakrishnan | Whole-Time Director & CEO | Resignation | April 6, 2020 | NA | ||||
| Aman Mehta | Independent Director | Cessation | May 17, 2020* | NA | ||||
| Priya Agarwal | Non-Executive Director | Re-appointment | May 17, 2020 | May 16, 2023 | ||||
| Tarun Jain | Non-Executive Director | Cessation | April 1, 2020* | NA | ||||
| Lalita D. Gupte | Independent Director | Resignation | November 7, 2020 | NA | ||||
| Padmini Somani | Independent Director | Appointment | February 5, 2021 | February 4, 2023 | ||||
| K Venkataramanan | Independent Director | Cessation | April 1, 2021* | — | ||||
| Sunil Duggal | Interim CEO | Appointment | April 6, 2020 | |||||
| CEO | Re-designation | August 1, 2020 | July 31, 2023 | |||||
* Ceased to be a director consequent to completion of tenure. | ||||||||
| Changes post FY 2020-21 till date of report: | ||||||||
| Director | Designation | Change (Appointment/ Re-designation/ Resignation) | Date of appointment/ Cessation/ Re-designation | Tenure Till | ||||
| Dindayal Jalan | Independent Director | Appointment | April 1, 2021 | March 31, 2023 | ||||
| GR Arun Kumar | Whole-Time Director & CFO | Resignation | April 25, 2021 | — | ||||
| Sunil Duggal | Whole-Time Director & CEO | Appointment | April 25, 2021 | July 31, 2023 | ||||
| The Board of Directors places on record their deep appreciation for the contributions made by the Outgoing Directors during their association with the Company. | ||||||||
VEDANTA LIMITED | INTEGRATED REPORT AND ANNUAL ACCOUNTS 2020-21 | 219
REPORT ON CORPORATE GOVERNANCE CONTINUED...
Size, Composition and Board Refreshments
The Board comprises of an optimum mix of Executive, Non-Executive and Independent Directors from diverse backgrounds possessing considerable experience and expertise to promote shareholder interests and govern the Company effectively by providing effective oversight and insightful strategic guidance.
As on March 31, 2021, the Board comprised of 8 members, consisting of a Non-Executive Chairman, an Executive Vice Chairman, an Executive Director, a Non-Executive Woman Director and four Non-Executive Independent Directors including one Woman Director. Each of the Board Committees including Audit & Risk Management
Committee, Nomination & Remuneration Committee, Stakeholders Relationship Committee, Corporate Social Responsibility Committee and Sustainability Committee are chaired by an independent director. The composition is in conformity with the provisions of SEBI Listing Regulations and Companies Act and in line with global best practices.
Diversity and inclusion
Your organisation recognises and embraces board diversity as an indispensable component in upholding a competitive advantage. The Board comprises of two (2) woman directors including one Independent Director.
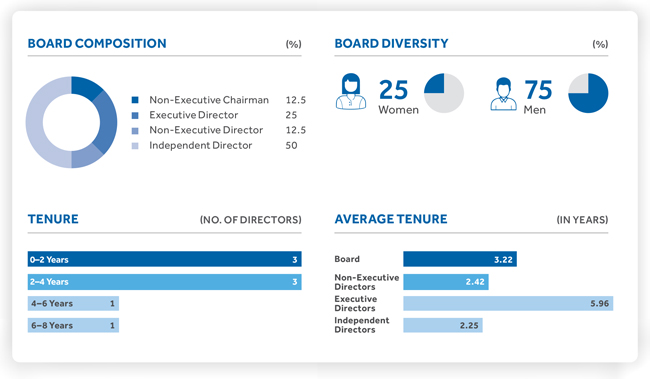
220
| < BACK TO CONTENTS | Integrated Report | Statutory reports | Financial statements |
The table below encapsulates the key qualifications, skills and attributes which are taken into consideration while nominating to serve on the Board. While all the Board members possess the identified skill, their domain of core expertise is given in the table Board of Directors.
BUSINESS LEADERSHIP
Sustainable success in business at a senior executive level
FINANCIAL EXPERTISE
Proficiency in financial accounting and reporting, corporate finance and internal controls, corporate funding, and associated risks
NATURAL RESOURCES
Senior executive experience in a large, global mining & oil & gas organisations involved in the discovery, acquisition, development and marketing of natural resources
CAPITAL PROJECTS
Experience working in an industry with projects involving large-scale long-cycle capital outlays
GLOBAL EXPERIENCE
Experience in multiple global locations, exposed to a range of political, cultural, regulatory and business environments
ESG
Familiarity with issues associated with workplace health and safety, asset integrity, environment and social responsibility, and communities
CORPORATE GOVERNANCE
Experience with a major organisation that demonstrates rigorous governance standards
MERGERS & ACQUISITION
Experience in corporate transactions and actions and joint ventures
GOVERNMENT & INTERNATIONAL RELATIONS
Interaction with government and regulators and involvement in public policy decisions
TECHNOLOGY / DIGITAL
A strong understanding of technology and innovation, and the development and implementation of initiatives to enhance production
VEDANTA LIMITED | INTEGRATED REPORT AND ANNUAL ACCOUNTS 2020-21 | 221
REPORT ON CORPORATE GOVERNANCE CONTINUED...
BOARD OF DIRECTORS
| Age | 68 years | |||||||||
| Date of Appointment | April 1, 2020 | |||||||||
| Tenure till March 31, 2021 | 1 year | |||||||||
| Shareholding | Nil | |||||||||
| Anil Agarwal | Board Membership - Other Indian Listed Companies | |||||||||
| Non-Executive Chairman | Sterlite Technologies Limited | Non-Executive Chairman | ||||||||
| No. of Directorships in Public Limited Companies | 2 | |||||||||
| Membership/Chairmanship in Committee | Member | : Nil | ||||||||
| Chairperson | : Nil | |||||||||
| Area of Expertise | ||||||||||
Business Leadership | Financial expertise | Natural Resources | Capital projects | Global Experience | ||||||
| ESG | Corporate Governance | Mergers & Acquisition | Government & relations | Technology / Digital | ||||||
| Age | 60 years | |||||||||
| Initial Date of Appointment | August 17, 2013 | |||||||||
| Date of Appointment | August 1, 2018 | |||||||||
| Tenure as on March 31, 2021 | 7.6 years | |||||||||
| Navin Agarwal | Tenure Till | July 31, 2023 | ||||||||
| Executive Vice Chairman | ||||||||||
| Shareholding | Nil | |||||||||
| Board Membership - Other Indian Listed Companies | ||||||||||
| Hindustan Zinc Limited | Director | |||||||||
| No. of Directorships in Public Limited Companies | 2 | |||||||||
| Membership/Chairmanship in Committee | Member | : Nil | ||||||||
| Chairperson | : Nil | |||||||||
| Area of Expertise | ||||||||||
Business Leadership | Financial expertise | Natural Resources | Capital projects | Global Experience | ||||||
| ESG | Corporate Governance | Mergers & Acquisition | Government & International relations | Technology / Digital | ||||||
Profile available at www.vedantalimited.com.
222
| < BACK TO CONTENTS | Integrated Report | Statutory reports | Financial statements |
| Age | 74 years | |||||||||
| Initial Date of Appointment | June 1, 2019 | |||||||||
| Tenure Till | May 3, 2022 | |||||||||
| Tenure as on March 31, 2021 | 1.8 years | |||||||||
| MK Sharma | Shareholding | Nil | ||||||||
| Independent Director | Board Membership - Other Indian Listed Companies | |||||||||
| Wipro Limited | Independent Director | |||||||||
| Asian Paints Limited | Independent Director | |||||||||
| United Spirtis Limited | Chairperson & Independent Director | |||||||||
| Ambuja Cements Limited | Non-Executive | |||||||||
| Non-Independent Director | ||||||||||
| No. of Directorships in Public Limited Companies | 7 | |||||||||
| Membership/Chairmanship in Committee | Member | : 8 | ||||||||
| Chairperson | : 5 | |||||||||
| Area of Expertise | ||||||||||
| Business | Financial | ESG | Corporate | Mergers & | ||||||
| Leadership | expertise | Governance | Acquisition | |||||||
| Age | 45 years | |||||||||
| Initial Date of Appointment | February 5, 2021 | |||||||||
| Tenure Till | February 4, 2023 | |||||||||
| Tenure as on March 31, 2021 | 0.2 years | |||||||||
| Padmini Somani | Shareholding | Nil | ||||||||
| Independent Director | ||||||||||
| Board Membership - Other Indian Listed Companies | ||||||||||
| Everest Industries Limited | Non-Executive | |||||||||
| Non- Independent Director | ||||||||||
| No. of Directorships in Public Limited Companies | 2 | |||||||||
| Membership/Chairmanship in Committee | Member | : 1 | ||||||||
| Chairperson | : Nil | |||||||||
| Area of Expertise | ||||||||||
Business Leadership | Financial expertise | Natural Resources | Capital projects | Global Experience | ||||||
| ESG | Corporate Governance | Mergers & Acquisition | Government & International relations | Technology / Digital | ||||||
| Profile available at www.vedantalimited.com. | ||||||||||
VEDANTA LIMITED | INTEGRATED REPORT AND ANNUAL ACCOUNTS 2020-21 | 223
REPORT ON CORPORATE GOVERNANCE CONTINUED...
| Age | 69 years | |||||||||
| Initial Date of Appointment | March 13, 2018 | |||||||||
| Tenure Till | August 10, 2021 | |||||||||
| Tenure as on March 31, 2021 | 3 years | |||||||||
| UK Sinha | Shareholding | Nil | ||||||||
| Independent Director | ||||||||||
| Board Membership - Other Indian Listed Companies | ||||||||||
| Havells India Limited | Independent | Director | ||||||||
| Housing Development Finance Corporation Limited | Independent | Director | ||||||||
| Max Healthcare Institute Limited | Independent | Director | ||||||||
| No. of Directorships in Public Limited Companies | 4 | |||||||||
| Membership/Chairmanship in Committee | Member | : 5 | ||||||||
| Chairperson | : 3 | |||||||||
| Area of Expertise | ||||||||||
Business Leadership | Financial expertise | ESG | Corporate Governance | Government & International relations | ||||||
| Age | 58 years | |||||||||
| Initial Date of Appointment | April 25, 2021 | |||||||||
| Tenure Till | July 31, 2023 | |||||||||
| Shareholding | Nil | |||||||||
| Sunil Duggal | Board Membership - Other Indian Listed Companies | None | ||||||||
| Whole-Time Director & CEO | ||||||||||
| No. of Directorships in Public Limited Companies | 1 | |||||||||
| Membership/Chairmanship in Committee | Member | : Nil | ||||||||
| Chairperson | : Nil | |||||||||
| Area of Expertise | ||||||||||
Business Leadership | Financial expertise | Natural Resources | Capital projects | Global Experience | ||||||
| ESG | Corporate Governance | Mergers & Acquisition | Government & International relations | Technology / Digital | ||||||
| Profile available at www.vedantalimited.com. | ||||||||||
224
| < BACK TO CONTENTS | Integrated Report | Statutory reports | Financial statements |
| Age | 64 years | |||||||||
| Initial Date of Appointment | April 1, 2021 | |||||||||
| Tenure till | March 31, 2023 | |||||||||
| Shareholding | Nil | |||||||||
| Dindayal Jalan | Board Membership - Other Indian Listed Companies | |||||||||
| Independent Director | Gallant Ispat Limited | Independent | Director | |||||||
| Gallant Metal Limited | Independent | Director | ||||||||
| No. of Directorships in Public Limited Companies | 5 | |||||||||
| Membership/Chairmanship in Committee | Member | : 2 | ||||||||
| Chairperson | : 1 | |||||||||
| Area of Expertise | ||||||||||
Business Leadership | Financial expertise | Natural Resources | Capital projects | Global Experience | ||||||
| ESG | Corporate Governance | Mergers & Acquisition | Government & International relations | Technology / Digital | ||||||
| Age | 31 years | |||||||||
| Initial Date of Appointment | May 17, 2017 | |||||||||
| Date of Re-appointment | May 17, 2020 | |||||||||
| Tenure Till | May 16, 2023 | |||||||||
| Priya Agarwal | Tenure till March 31, 2021 | 3.8 years | ||||||||
| Non-Executive Director | Shareholding | Nil | ||||||||
| Board Membership - Other Indian Listed Companies | None | |||||||||
| No. of Directorships in Public Limited Companies | 1 | |||||||||
| Membership/Chairmanship in Committee | Member | : Nil | ||||||||
| Chairperson | : Nil | |||||||||
| Area of Expertise | ||||||||||
Business Leadership | Natural Resources | Global Experience | Corporate Governance | Technology / Digital | ||||||
| Profile available at www.vedantalimited.com | ||||||||||
VEDANTA LIMITED | INTEGRATED REPORT AND ANNUAL ACCOUNTS 2020-21 | 225
REPORT ON CORPORATE GOVERNANCE CONTINUED...
Notes
| • | The no. of directorships in Public Limited companies include Vedanta Limited. |
| • | The no. of Directorships excludes Private Companies, foreign companies and companies under Section 8 of Companies Act, 2013. |
| • | For the membership and chairpersonship in Committees, only Audit Committee and Stakeholder Relationship Committee have been considered as per Regulation 26 of the Listing Regulations. Also, all public limited companies, whether listed or not, have been included and all other companies including private limited companies, foreign companies, and companies under Section 8 of the Companies Act, 2013 have been excluded. |
| • | In the committee details provided, every chairpersonship is also considered as a membership. |
| • | The details of directorship on board of other Indian listed companies, public limited companies and membership/chairmanship in committee details are provided as on March 31, 2021. |
| • | Mr. Anil Agarwal has been appointed as the Non-Executive Director designated as the Chairman of the Board w.e.f. April 1, 2020 pursuant to which Mr. Navin Agarwal has been re-designated as the Executive Vice-Chairman of the Board effective April 1, 2020. |
| • | Mr. S Venkatakrishnan resigned from the position of Whole-Time Director & CEO w.e.f. close of business hours on April 5, 2020. |
| • | Mr. Aman Mehta ceased to be Independent Director of the Company w.e.f. close of business hours on May 16, 2020 consequent to completion of his tenure. |
| • | Ms. Priya Agarwal has been re-appointed as the Non-Executive Director of the Company w.e.f. May 17, 2020 for a term of 3 years. |
| • | Mr. Tarun Jain ceased to be a Director of the Company effective April 1, 2020. |
| • | Ms. Lalita D. Gupte stepped down from post of Independent Director of the Company w.e.f. close of business hours on November 6, 2020 to balance her work and other family commitments. Ms. Gupte has confirmed to the Company that there are no other material reasons for her resignation other than those as disclosed above. |
| • | Mr. GR Arun Kumar resigned from the position of Whole-Time Director & CFO of the Company w.e.f. close of business hours on April 24, 2021. |
| • | Mr. K Venkataramanan ceased to be an Independent Director of the Company w.e.f. close of business hours on March 31, 2021 upon completion of his 2nd and final term. |
| • | Based on the recommendation of the Nomination & Remuneration Committee, the Board appointed the following directors, subject to the approval of the shareholders: |
| (i) | Mr. Dindayal Jalan as an Additional Director designated as Non-Executive Independent Director of the Company for a 1st term of 2 years w.e.f. April 1, 2021 till March 31, 2023. |
| (ii) | Ms. Padmini Somani as an Additional Director designated as Non-Executive Independent Director of the Company for a 1st term of 2 years w.e.f. February 5, 2021 till February 4, 2023. |
| (iii) | Mr. Sunil Duggal, appointed as Interim Chief Executive Officer and Key Managerial Personnel of the Company effective April 06, 2020 and CEO of the Company for a fix term of 3 years w.e.f. August 01, 2020 has been appointed as Whole-Time Director & CEO and KMP of the Company effective from April 25, 2021 till July 31, 2023. |
The notice of 56th Annual General Meeting sets out the details of their appointments.
226
| < BACK TO CONTENTS | Integrated Report | Statutory reports | Financial statements |
Declaration & Confirmations
W.r.t. directorship and membership of the Directors, it is hereby confirmed that:
| 1. | None of the Directors: |
| a) | are Director in more than ten (10) public limited companies in terms of Section 165 of Companies Act, 2013; |
| b) | hold directorship in more than seven (07) listed entities pursuant to Regulation 17A(1) of Listing Regulations; |
| c) | acts as an Independent Director in more than seven (07) listed entities pursuant to Regulation 17A(1) of Listing Regulations; |
| d) | are serving as an Independent Director in more than three (03) listed entities in case they are Whole-Time Director of the Company pursuant to Regulation 17A(2) of Listing Regulations; |
| e) | are members of more than ten (10) board level committees of Indian public limited companies; |
| f) | are Chairperson of more than five (05) committees, across all companies in which they are directors; |
| g) | are related to other Directors except Ms. Priya Agarwal, Mr. Navin Agarwal and Mr. Anil Agarwal. Ms. Priya Agarwal is the daughter of Mr. Anil Agarwal and Mr. Anil Agarwal is the elder brother of Mr. Navin Agarwal; |
| h) | who are serving as a Non-Executive Director, have attained the age of seventy-five years except Mr. K Venkataramanan. In terms of Reg 17(1A) of Listing Regulations, the shareholders through special resolution passed by Postal Ballot on December 06, 2019, approved continuation of directorship of Mr. K Venkataramanan as a Non-Executive Independent Director from the day he attained the age of 75 years i.e. December 11, 2019 till the expiry of his first term till March 31, 2020. Further, Mr. K Venkataramanan was also re-appointed for a 2nd and final term of one year effective from April 01,2020 till March 31, 2021 notwithstanding that he has attained the age of 75 years. |
Mr. Venkataramanan ceased to be an Independent Director of the Company w.e.f. close of business hours on March 31, 2021 consequent upon completion of his tenure.
| 2. | The Company has received declarations from all the Independent Directors of the Company confirming that they meet the criteria of independence prescribed under the Act and the Listing Regulations. |
Process for Board and Senior Management Appointments
The Board, with the support of the Nomination and Remuneration Committee, keeps under constant review the composition of the Board and its Committees, succession planning, diversity, inclusion and remuneration related matters.
It has sought to balance the composition of the Board and its Committees and to refresh them progressively over time. In discharging its responsibilities, the Nomination & Remuneration Committee regularly reviews the
structure, size and composition of the Board and its Committees, including skills, knowledge, independence and diversity, to ensure they are aligned with the Group’s strategy.
The Committee strongly believes that diversity and providing an inclusive culture is a key driver of business success and the Committee is committed to having a diverse and inclusive leadership team which provides a range of perspectives, insights and critical challenge needed to support good decision-making, helping with risk management and strategic planning at the current time of crisis.
| Process for Selection and Appointment of new Directors | ||||||
| Nomination & Remuneration | Upon evaluation, the | The Board members after | The proposal is placed | |||
| Committee is responsible | Committee makes | approval recommend | before shareholders for | |||
| for identification and | recommendation to the | the appointment to | approval | |||
| selection for appointment as a Director | Board for approval | shareholders for approval | ||||
The criteria for nominating a candidate for directorship has been provided for in the NRC policy of the Company which can be accessed at www.vedantalimited.com.
VEDANTA LIMITED | INTEGRATED REPORT AND ANNUAL ACCOUNTS 2020-21 | 227
REPORT ON CORPORATE GOVERNANCE CONTINUED...
Board Familiarization and Induction Program
Your Company has a structured and comprehensive orientation process in place for newly inducted directors which is tailored to their individual needs and intends to provide introduction to the Company’s vision, mission, values, operations, challenges, structure and risks. As a
part of an ongoing familiarisation process, the directors are updated about the about significant regulatory/ industry changes on regular basis through formal reporting process.
Orientation Program upon induction of New Directors
Roles & Responsibilities
Briefing about role, responsibilities, duties and obligations as a member of the Board.
Plant / Site Visits
Visits to plants and business locations are organised periodically to provide an insight into the Company’s operations.
Interactive Sessions
Interactive sessions with senior management, business & functional heads.
Familiarisation Pack
Familiarisation pack is uploaded on a secured online portal which can accessed only by the Board members. The pack includes various documents viz. a viz. Organisational structure, the Company’s history and milestones, Memorandum & Articles of Association, latest Annual Report including Form 20F, Code of Conduct, Investor Presentations, CEO/CFO reports, Minutes of previous meetings, Policies & Charters etc.
Other initiatives to update the Directors on a continual basis
Active Communication Channel
An active communication channel with executive management which allows free flow of communication among directors.
Business & Regulatory Presentations
Presentations on regulatory and business environment, Business Plan, risk management framework, internal audit & controls, cyber security, HSE, compliance reports, tax & treasury reports, key accounting matters, CSR, HR initiatives, Digitalisation & Technology initiatives and Company policies and other relevant issues.
Update on Company’s performance and operations
Update on Company’s and its subsidiaries performance/ operations/ updates/ major developments affecting the business by various reports on quarterly basis along with major stock exchange announcements, press releases etc.
The detailed familiarisation programme can be accessed on the Company’s website at www.vedantalimited.com/CorporateGovernance
Membership Term
The Board regularly evaluates the contribution of members and periodically shares updates with the shareholders about reappointments consistent with the applicable laws.
Succession Planning
Succession Planning is critical to the success of the Company as it ensures continuity and sustainability of corporate performance. It involves a process that recognises, develops and retains top leadership talent and further helps in identifying key roles and mapping out ways to ensure the organisation has the right people with the right blend of skills, aptitude, expertise and experiences, in the right place and at the right time. As per the NRC Policy of the Company, the NRC has laid a succession plan outlining the process for retaining, developing, and/or appointing the Board of Directors, KMPs and SMPs of the Company and it reviews such plans on an annual basis and recommend revisions, if any, to the Board.
The NRC works with the management and follows the following process for effective succession planning:
| 1. | Assessment of potential employees and creation of a leadership pool; |
| 2. | Development of the talent pool through actions such as involvement in strategic meetings, leadership workshops with top management, coaching, anchoring, job rotations, role enhancement, council memberships and involvement in cross function projects etc. |
Directors’/ KMPs/ SMPs conflicts of interest
Your Board has in place a well-defined process w.r.t disclosure of interest and associated matters in accordance with the guidelines prescribed by the Companies Act, 2013 and Listing Regulations. Each Director/ KMP/ SMP promptly discloses actual or potential conflicts and any changes, to the Board which are further noted at forthcoming Board meeting. The Board considers and authorises potential or actual conflicts, as appropriate. Directors with a conflict neither participate in the discussion nor vote on the matter in question.
228
| < BACK TO CONTENTS | Integrated Report | Statutory reports | Financial statements |
Independent Directors
The independent Directors of the Company are in compliance with requirement as prescribed in Companies Act, 2013 and SEBI Listing Regulations in addition to the criteria as laid down in the New York Stock Exchange (NYSE) listed company manual, the Sarbanes-Oxley Act, and US securities laws by virtue of our listing on the NYSE in the US.
Based on the disclosures received from all the independent directors and in the opinion of the Board, the independent directors fulfil the conditions specified in the Companies Act, 2013, the Listing Regulations, NYSE listing manual and are independent of the Management.
Meeting of Independent Directors
During the financial year 2020-21, the independent directors met separately without the management twice on May 30, 2020 and March 31, 2021 which was chaired by Mr. MK Sharma and Mr. UK Sinha respectively. In these meetings, the independent directors discussed among other matters, the performance of the Company and risks faced by it, the flow of information to the Board, project execution, strategy, governance, compliance, Board movements, human resource matters and performance review of the Non-Independent Directors, the Board as whole, including the Chairman and CEO.
Additionally, the Independent Directors also met separately with the Statutory Auditors to discuss matters such as key accounting issues, risks, overall control environment and to invite their overall feedback.
The Audit & Risk Management Committee and the Board are updated by the Independent Directors about the outcome of the meetings and actions, if any, required to be taken by the Company.
Databank registration of the Independent Directors
Pursuant to the Ministry of Corporate Affairs notification dated October 22, 2019, requisite confirmations have been received from all the Independent Directors of the Company w.r.t registration on the Independent Director’s Databank.
Performance Evaluation
Good corporate governance is about implementing the right systems and controls across the Group to facilitate effective management and sound decision-making. The Board works with the Nomination and Remuneration Committee to lay down the evaluation criteria for the performance of the Chairman, the Board, Board committees, and executive/ non-executive/ independent directors through peer evaluation, excluding the director being evaluated.
During the year, an evaluation was carried out by an external agency, one of the largest multinational professional services networks, through a secured online questionnaire platform to capture the views of each Director. The evaluation was carefully structured and pragmatically designed to bring about a genuine debate on issues that were relevant; check on progress against matters identified in the previous evaluation; and assist in identifying any potential for improvement in the Board’s processes, as given below:
| Tailored | Results of the | Outcome and | ||||||
| questionnaires | Secured online | evaluation compiled | feedback discussed | |||||
| prepared by | platform for | by the external | Sharing of evaluation | at the NRC, Separate | ||||
| external agency and | providing the | agency without | results | Meeting of IDs and | ||||
| confrmed with the | responses | involvement of the | Board Meeting and | |||||
| Chairperson of NRC | management | Action Plan agreed |
VEDANTA LIMITED | INTEGRATED REPORT AND ANNUAL ACCOUNTS 2020-21 | 229
REPORT ON CORPORATE GOVERNANCE CONTINUED...
BOARD AS A WHOLE
Assessment of Company as a whole, its performance, its goals and functions of the Board; Composition, structure and quality;
Board Meetings; Board Environment; Relationship with Senior Management; Progress against development areas.
BOARD COMMITTEES
Committee Meeting & Information;
Committee Composition & Operation; Specific Committee responsibilities; Progress against development areas.
INDIVIDUAL DIRECTORS
Preparedness and participation of the Director for the meetings;
Understanding of
Company’s mission, vision, industry, business etc.; Quality of discussions during meetings; Personality and Conduct of Director;
Quality of the value additions made.
CHAIRMAN & VICE-CHAIRMAN
Demonstration of effective Leadership;
Objectivity in discussions; Constructive communication & relationship with other directors;
Contribution in enhancing Company’s image;
Availability and approachability to discuss sensitive matters.
CEO
Company Performance;
Strategy and its execution; Leadership; Team building;
Management Succession.
Results of Performance Evaluation
Individual directors Evaluation
Report shared with the Chairperson, Vice-Chairman and respective individual directors.
Summary of evaluation of Executive Directors shared with the Independent Directors and discussed in the separate meeting of Independent Directors.
Board Self Evaluation
Report shared with all directors.
Results discussed in meeting of NRC and Board and separate meeting of Independent Directors.
Chairman/Vice-Chairman Evaluation
Summary report shared with the Chairperson of Nomination
& Remuneration Committee (NRC).
Evaluation results also discussed in separate meeting of Independent Directors.
Committee Evaluation
Summary report shared with all directors.
Results discussed in meeting of NRC and Board and separate meeting of Independent Directors.
CEO Evaluation
Report shared with the Chairman, Vice-Chairman and Chairperson of NRC.
The evaluation results discussed in separate meeting of Independent Directors.
Outcome of Performance Evaluation
The evaluation concluded that the Board as a whole is functioning as a cohesive body which is well engaged with different perspectives. All Directors continued to demonstrate a collaborative and constructive mindset, creating a conducive environment at Board meetings for participation and challenge. The Committees are functioning well and besides the Committee’s terms of reference as mandated by law, important issues are brought up and discussed in the Committees. The clarity of the strategy together with the understanding of the capabilities for implementing and monitoring it were regarded highly. The effectiveness review identified some opportunities for the Board which will be acted upon going forward.
230
| < BACK TO CONTENTS | Integrated Report | Statutory reports | Financial statements |
| Meetings of the Board & Committees | ||
| Schedule of meetings and agenda matters | • The Board meets at regular intervals to discuss and decide on Company/business policy and strategy in addition to the statutory and other matters. The Board and Committee meetings are pre-scheduled and an annual calendar of the meetings is circulated to all the Directors well in advance to facilitate planning of their schedule and to ensure meaningful participation in the meetings. However, in case of business exigencies/urgencies resolutions are passed through circulation or additional meetings are conducted.
• The Board, the Audit & Risk Management Committee and the Nomination & Remuneration Committee are facilitated with annual agenda plan in advance in order to enable the members to focus on key areas of organisational performance and designing the future strategy. The annual agenda plans are finalised with the inputs from the board members and are approved by the Board. Additional agenda matters are taken up on requirement basis. | |
| Circulation of Agenda | • The agenda is finalized by the Company Secretary in discussion with the CFO, CEO and Chairman.
• All the Agenda papers are disseminated electronically on a real-time basis. The papers are uploaded on a secured online platform specifically designed for this purpose, thereby eliminating circulation of printed agenda papers. The online platform also enables the Board to access the historical agendas, minutes, constitutional documents, committee charters, etc. It enables the participants to make notes and exchange notes amongst each other under a secured environment.
• The Agenda papers other than in nature of Unpublished Price Sensative Information (UPSI) are circulated well in advance as per statutory requirements and those in nature of UPSI are circulated at least 24 hours in advance with the approval of the Board. | |
| Information presented at meetings | • The Board business generally includes consideration of important corporate actions and events including but not limited to:
a) quarterly and annual result announcements; b) oversight of the performance of the business; c) development and approval of overall business strategy; d) Board succession planning; e) review of the functioning of the Committees; f) Review of internal controls and risk management and g) other strategic, transactional and governance matters as required under the Companies Act, 2013, Listing Regulations and other applicable laws. | |
| Conduct and recording of meeting | • Majority of the meetings are conducted as physical meetings, however, at times it may not be possible for each one to be physically present at all meetings. Hence, we provide the facility of video conferencing/telepresence to the Board members and invitees at various locations across the globe.
• During the FY 2020-21, all meetings were held through video conferencing/telepresence considering the pandemic situation.
• All the meetings conducted through telepresence are recorded and stored as per statutory requirements. The Company Secretary records minutes of the meetings of each Board and Committees.
• The respective management teams and functional leaders are invited on a rotational basis to present the performance on key areas such as the Company’s major business segments and their operations, subsidiary performance and other key updates from time to time. | |
| Post Meeting summary/ Follow Up | • Post conclusion of each of the Board/Committee meeting, the Company Secretary circulates the summary of the proceedings of all meetings along with the action points, if any.
• Various decisions taken at Board/Committee meetings are promptly communicated to the concerned departments/divisions.
• Draft minutes and signed minutes are circulated to Board/Committee members within the timelines prescribed under Secretarial Standards.
• The matters arising from the previous meetings are taken up at the respective forthcoming Board/Committee meeting. | |
VEDANTA LIMITED | INTEGRATED REPORT AND ANNUAL ACCOUNTS 2020-21 | 231
REPORT ON CORPORATE GOVERNANCE CONTINUED...
Board & Executive Leadership Remuneration Policy
The Remuneration Policy is significant in ensuring that competitive and impartial rewards are linked to key deliverables and are also in line with market practices and shareholders’ expectations.
The NRC ensures that remuneration policies and practices are framed and intended to attract, retain and encourage the Executive Directors (ED) and the senior management group, while simultaneously meeting the delivery of the Group’s strategic and business objectives. The NRC further ensures the interests of the Executive Directors and the senior management group are aligned with those of shareholders, to build a sustainable performance environment.
Remuneration Components:
The ED remuneration has two components: fixed pay and annual variable pay including stock incentives (performance linked incentive). The fixed component is based upon the industry practice and benchmarks considering the experience, skill, knowledge and job responsibilities. The performance linked incentive is linked to the achievement of the Company and individual performance goals. Such variable compensation is ‘at risk’, and rewards performance and contributions to both short-term and long-term financial performance of
the Company. The remuneration of the EDs is governed by the agreements executed with them, subject to the approval of the Board and of the shareholders in general meetings and such other approvals as may be necessary.
The Non-Executive Independent Directors are paid remuneration by way of commission and sitting fees. The appointment letter detailing the terms and conditions of appointment of Non-Executive Independent Directors is available on the Company’s website www.vedantalimited.com. The Board decides the payment of commission within the limits approved by the members subject to the limit not exceeding 1% of the net profits of the Company. Further, it may be noted that no stock options were issued to the Non-Executive Independent Directors during the year.
Mr. Anil Agarwal, Non-Executive Chairman, voluntarily chose not to receive any commission for his services rendered to the Company.
Directors’ & Officers’ Liability Insurance
In line with the requirements of Regulation 24(10) of the Listing Regulations, the Company has in place a Directors and Officers Insurance policy (’D&O‘) for all its Directors.
The details of remuneration paid/ payable to the Directors during FY 2020-21 are as follows:
Remuneration paid or payable to Directors for the year ended March 31, 2021
Name of the Director | Relationship with | Sitting Fees | Salary and Perquisites(6) | Provident and Superannuation Funds | Commission to Non- Executive Directors / Other payments to Executive Directors(7) | Total | Vedanta Limited ESOS 2018, ESOS 2019 ESOS 2020(8) | |||||||||||||||||||
Non-Executive Chairman |
| |||||||||||||||||||||||||
Anil Agarwal | Refer Note 1 | 850,000.00 | — | — | — | 8,50,000.00 | — | |||||||||||||||||||
Executive Directors | ||||||||||||||||||||||||||
Navin Agarwal(2) | Refer Note 1 | — | 102,152,271.00 | 5,879,400.00 | 40,000,000.00 | 148,031,671.00 | — | |||||||||||||||||||
GR Arun Kumar | None | — | 34,846,173.00 | 2,441,440.00 | 17,500,000.00 | 54,787,613.00 | 294,780.00 | |||||||||||||||||||
|
|
|
|
|
|
|
|
|
|
|
| |||||||||||||||
Total | — | 136,998,444.00 | 8,320,840.00 | 57,500,000.00 | 202,819,284.00 | — | ||||||||||||||||||||
|
|
|
|
|
|
|
|
|
|
|
| |||||||||||||||
Independent Non-Executive Directors |
| |||||||||||||||||||||||||
Aman Mehta(3) | None | 150,000.00 | — | — | 945,205.48 | 1,095,205.48 | — | |||||||||||||||||||
K Venkataramanan | None | 1,300,000.00 | — | — | 7,500,000.00 | 8,800,000.00 | — | |||||||||||||||||||
Lalita D Gupte (4) | None | 850,000.00 | — | — | 4,520,547.95 | 5,370,547.95 | — | |||||||||||||||||||
MK Sharma | None | 1,550,000.00 | — | — | 7,500,000.00 | 9,050,000.00 | — | |||||||||||||||||||
UK Sinha | None | 1,750,000.00 | — | — | 7,500,000.00 | 9,250,000.00 | — | |||||||||||||||||||
Padmini Somani(5) | None | 200,000.00 | — | — | 1,130,136.99 | 1,330,136.99 | — | |||||||||||||||||||
|
|
|
|
|
|
|
|
|
|
|
| |||||||||||||||
Total | 5,800,000.00 | — | — | 29,095,890.42 | 34,895,890.42 | — | ||||||||||||||||||||
|
|
|
|
|
|
|
|
|
|
|
| |||||||||||||||
Non-Independent Non-Executive Directors |
| |||||||||||||||||||||||||
Priya Agarwal | Refer Note 1 | 6,50,000.00 | — | — | 10,000,000.00 | 10,650,000.00 | — | |||||||||||||||||||
|
|
|
|
|
|
|
|
|
|
|
| |||||||||||||||
Total | 6,50,000.00 | — | — | 10,000,000.00 | 10,650,000.00 | — | ||||||||||||||||||||
|
|
|
|
|
|
|
|
|
|
|
| |||||||||||||||
Grand Total | 7,300,000.00 | 136,998,444.00 | 8,320,840.00 | 96,595,890.42 | 249,215,174,42 | 294,780.00 | ||||||||||||||||||||
|
|
|
|
|
|
|
|
|
|
|
| |||||||||||||||
Notes:
| 1. | Ms. Priya Agarwal is the daughter of Mr. Anil Agarwal and Mr. Anil Agarwal is the elder brother of Mr. Navin Agarwal. |
| 2. | Sitting fees and commission paid to Mr. Navin Agarwal from HZL was ₹ 275,000 and ₹ 1,500,000 respectively during the FY 2020-21. Mr. Navin Agarwal has been awarded 435,960 units in FY’19, 513,260 units in FY’20 and 412,444 units in FY’21 under Long-Term Incentive Plan of Vedanta Resources Limited. |
| 3. | Commission paid for a period from April 1, 2020 till May 16, 2020. |
| 4. | Commission paid for a period from April 1, 2020 till November 06, 2020. |
| 5. | Commission paid for a period from February 05, 2021 till March 31, 2021. |
| 6. | Value of Perquisites as per rule u/s 17(2) of Income-tax Act, 1961. Further, as the liabilities for defined benefit plan, i.e. gratuity are provided on accrual basis for the Company as a whole, the amounts pertaining to Key Management Personnel are not included above. |
232
| < BACK TO CONTENTS | Integrated Report | Statutory reports | Financial statements |
| 7. | There was no performance bonus paid for the FY 2020. However, a Discretionary award was paid to all the employees, who relentlessly worked during the pandemic times and supported the organization. The Executive Directors were also covered under this initiative. |
| 8. | The ESOS 2018, Cash Plan 2018 and Vedanta Resources Limited LTIP 2018 options/units will vest/ be exercise after three years from date of grant i.e. on November 1, 2021, based on achievement of performance conditions. |
The ESOS 2019, Cash Plan 2019 and Vedanta Resources Limited LTIP 2019 options/units will vest/ be exercise after three years from date of grant i.e. on November 29, 2022, based on achievement of performance conditions.
The ESOS 2020, Cash Plan 2020 and Vedanta Resources Limited LTIP 2020 options/units will vest/ be exercise after 31 months from date of grant i.e. on November 6, 2023, based on achievement of performance conditions.
| 9. | Mr. S Venkat exited from the organisation at the close of business hours of April 5, 2020, he was based out of UK and was paid remuneration in GBP during the FY 20-21 till exit date, which was paid by Vedanta Resources Limited amounting to ₹ 1,04,85,281 (£ 108,246). |
We hereby confirm that:
| • | The total managerial remuneration payable in FY 2020-21 does not exceed 11% of the net profits of the Company. |
| • | The total remuneration received by Whole-Time Directors and Independent Directors of the Company does not exceed 10% and 1% of the Net Profits of the Company, respectively. |
| • | Mr. Navin Agarwal, Executive Vice-Chairman and member of Promoter Group does not receive remuneration in excess of ₹ 5 crores or 2.5% of the Net Profits of the Company, whichever is higher. |
| • | None of the non-executive directors, have received remuneration exceeding 50% of the total annual remuneration payable to all non-executive directors. |
BOARD COMMITTEES
The Board has constituted various sub-committees with primary objective of maintaining strong business fundamentals and delivering high performance through relentless focus on significant the affairs of the Company across all its geographies. Each committee is set up by the formal approval of the Board and is guided by its respective charter which clearly defines their purpose, roles, and responsibilities. The Chairperson of the respective Committee briefs the Board on the summary of the discussions held in the Committee Meetings. The minutes of all the Committee meetings are placed before the Board for its review and noting. The Company Secretary officiates as the Secretary of these Committees.
Composition of Committees as on March 31, 2021
All the Committees have optimum composition pursuant to the Listing Regulations. Below is the composition of the Committees as on March 31, 2021:
Name of Director | Board | Audit & Risk | Nomination & | Stakeholder | Corporate | Committee of | Sustainability | |||||||
Mr. Anil Agarwal | ||||||||||||||
Mr. Navin Agarwal | ||||||||||||||
Mr. K Venkataramanan | ||||||||||||||
Mr. MK Sharma | ||||||||||||||
Ms. Padmini Somani | ||||||||||||||
Mr. UK Sinha | ||||||||||||||
Ms. Priya Agarwal | ||||||||||||||
Mr. GR Arun Kumar | ||||||||||||||
Member Chairperson | ||||||||||||||
VEDANTA LIMITED | INTEGRATED REPORT AND ANNUAL ACCOUNTS 2020-21 | 233
REPORT ON CORPORATE GOVERNANCE CONTINUED...
Notes:
| * | Effective June 6, 2020, the Risk Management Committee has been consolidated with the Audit Committee comprising of only Independent Directors; |
| 1. | Mr. Venkataramanan ceased to be the member of the Committee w.e.f. close of business hours on March 31, 2021. |
Mr. Dindayal Jalan has been appointed as the Member of the Committee effective April 1, 2021.
| 2. | Mr. Venkataramanan and Mr. GR Arun Kumar ceased to be the Members of the Committee w.e.f. close of business hours on March 31, 2021 and April 24, 2021 respectively. |
Ms. Padmini Somani and Mr. Sunil Duggal have been appointed as the Member of the Committee effective April 1, 2021 and April 25, 2021 respectively.
| 3. | Mr. Venkataramanan ceased to be the member of the Committee w. e.f. close of business hours on March 31, 2021. |
| 4. | Mr. GR Arun Kumar cease to be the Member of the Committee w. e.f. close of business hours on April 24, 2021. |
Mr. Sunil Duggal has been appointed as the Member of the Committee effective April 25, 2021.
| 5. | Mr. Venkataramanan ceased to be the Chairperson of the Committee w.e.f. close of business hours on March 31, 2021. |
Mr. Upendra Kumar Sinha has been designated as the Chairperson of the Committee and Mr. Dindayal Jalan has been appointed as member of the Committee effective April 1, 2021.
Board and Committee Meetings for FY 2020-21
| Board Meeting | Audit & Risk Management Committee* | Nomination & Remuneration Committee | Stakeholders Relationship Committee | Corporate Social Responsibility Committee | Sustainability Committee | Committee of Directors | ||||||||
No. of meetings held | 10 | 09 | 04 | 01 | 02 | 02 | 05 | |||||||
during FY 2020-21 | ||||||||||||||
Date of meetings | April 25, 2020 | May 12, 2020 | June 06, 2020 | November 05, | June 06, 2020 | August 17, 2020 | May 16, 2020 | |||||||
| May 12, 2020 | May 18, 2020 | November 06, 2020 | 2020 | January 28, 2021 | February 25, 2021 | August 04, 2020 | ||||||||
| May 18, 2020 | May 30, 2020 | January 29, 2021 | September 17, 2020 | |||||||||||
| June 06, 2020 | June 06, 2020 | March 31, 2021 | November 24, 2020 | |||||||||||
| October 03, 2020 | September 12, 2020 | February 11, 2021 | ||||||||||||
| October 20, 2020 | October 03, 2020 | |||||||||||||
| November 06, 2020 | November 05, 2020 | |||||||||||||
| January 12, 2021 | January 28, 2021 | |||||||||||||
| January 29, 2021 | March 31, 2021 | |||||||||||||
| March 31, 2021 |
| * | Effective June 06, 2020, the Risk Management Commiiteee has been consolidated with the Audit Committee comprisingof only Independent Directors. |
| • | The board of directors approved twenty matters by passing resolution by circulation. |
| • | The Audit & Risk Management Committee approved ten matters by passing resolution by circulation; |
| • | The Nomination & Remuneration Committee approved two matters by passing resolution by circulation; |
| • | The Committee of Directors approved twenty matters by passing resolution by circulation; |
| • | The maximum interval between any two board meetings did not exceed 120 days, as prescribed in the Companies Act, 2013. |
234
| < BACK TO CONTENTS | Integrated Report | Statutory reports | Financial statements |
Attendance for Board & Committee Meetings held during FY 2020-21
Name of Director | Whether attended | Board Meeting | Audit & Risk Management | NRC | SRC | CSR Committee | Sustainability Committee | COD | Average% | |||||||||||||||||||||||||
AGM on | (Attended/ Entitled) | Committee (Attended/ Entitled) | (Attended/ Entitled) | (Attended/ Entitled) | (Attended/ Entitled) | (Attended/ Entitled) | (Attended/ Entitled) | |||||||||||||||||||||||||||
Mr. Anil Agarwal | Yes | 10/10 | — | 4/4 | — | — | — | — | 100 | % | ||||||||||||||||||||||||
(Appointed as a Director w.e.f. Apr 01, 2020) | ||||||||||||||||||||||||||||||||||
Mr. Navin Agarwal | Yes | 10/10 | — | — | — | — | — | 5/5 | 100 | % | ||||||||||||||||||||||||
Ms. Priya Agarwal | Yes | 9/10 | — | — | — | 2/2 | — | — | 95 | % | ||||||||||||||||||||||||
Mr. UK Sinha | Yes | 10/10 | 9/9 | 4/4 | 1/1 | 2/2 | 2/2 | — | 100 | % | ||||||||||||||||||||||||
Mr. MK Sharma | Yes | 10/10 | 9/9 | 4/4 | — | 2/2 | — | — | 100 | % | ||||||||||||||||||||||||
Ms. Padmini Somani | NA | 1/1 | — | — | — | — | — | — | 100 | % | ||||||||||||||||||||||||
(Appointed as a Director w.e.f. Feb 05, 2021) | ||||||||||||||||||||||||||||||||||
Mr. GR Arun Kumar | Yes | 10/10 | — | — | 1/1 | — | — | 5/5 | 100 | % | ||||||||||||||||||||||||
(Ceased to be a Director w.e.f. close of business hours on Apr 24, 2021) | ||||||||||||||||||||||||||||||||||
Mr. K Venkataramanan | Yes | 10/10 | * | 2/2 | 2/2 | 1/1 | 2/2 | 2/2 | — | 100 | % | |||||||||||||||||||||||
(Ceased to be a Director w.e.f. close of business hours on Mar 31, 2021) | ||||||||||||||||||||||||||||||||||
Ms. Lalita D. Gupte | Yes | 7/7 | 7/7 | 2/2 | 1/1 | — | — | — | 100 | % | ||||||||||||||||||||||||
(Ceased to be a Director w.e.f. close of business hours on Nov 06, 2020) | ||||||||||||||||||||||||||||||||||
Mr. Aman Mehta | NA | 2/2 | 1/1 | — | — | — | — | ��� | 100 | % | ||||||||||||||||||||||||
(Ceased to be a Director w.e.f. close of business hours on May 16, 2020) | ||||||||||||||||||||||||||||||||||
Mr. S Venkatakrishnan | NA | — | — | — | — | — | — | — | ||||||||||||||||||||||||||
(Ceased to be a Director w.e.f. close of business hours on Apr 05, 2020) | ||||||||||||||||||||||||||||||||||
Note:
| * | Mr. K Venkataramanan attended the meeting held on April 25, 2020 through audio call and was not counted for the purpose of quorum. |
AUDIT & RISK MANAGEMENT COMMITTEE
Composition & Attendance for FY 2020-21
| 100% | 100% | 3 | ||
| Independent | Attendance | Members |
Effective June 6, 2020, as part of good governance practice, the Audit Committee and the Risk Management Committee have been consolidated to be called as the Audit & Risk Management Committee, comprising of only Independent Directors. Parallelly, the management team led by the CEO and MAS Head is a sub-set of this Committee and is entrusted with running the existing risk management process. The management team presents a detailed update on risk framework to the Audit & Risk Management Committee twice a year.
A separate section on principal risks and uncertainties governing the business is covered in the Management Discussion and Analysis Report.
The primary function of the Audit & Risk Management Committee includes monitoring and providing effective supervision of the financial reporting; reviewing the efficacy of the risk management systems; and maintaining robustness of internal financial controls and
risk management frameworks including cyber security. The Committee works to fortify the adequacy and effectiveness of the Company’s legal, regulatory, and ethical compliance and governance programmes while monitoring the qualifications, expertise, resources, and independence of both the internal and external auditors; and assessing the auditors’ performance and effectiveness each year.
The members of the Audit & Risk Management Committee possess the requisite qualifications and expertise required to contribute to the meetings of the Committee. In carrying out its oversight responsibilities transparently and efficiently, the Committee majorly relies on the expertise and knowledge of the management, the internal auditors, the Statutory Auditor and also uses external expertise, if required. The management is accountable for the preparation, presentation and integrity of the Company’s financial statements including consolidated statements, accounting, and financial reporting principles; internal control over financial reporting; and all procedures are designed to ensure compliance with accounting standards, applicable laws, and regulations as well as for objectively reviewing and evaluating the adequacy, effectiveness, and quality of the Company’s system of internal controls. M/s SR Batliboi & Co. LLP, Chartered Accountants (FRN: 301003E / E300005), the Company’s Statutory Auditor, is responsible for performing an independent audit of the financial statements and expressing an opinion on the conformity of these financial statements.
VEDANTA LIMITED | INTEGRATED REPORT AND ANNUAL ACCOUNTS 2020-21 | 235
REPORT ON CORPORATE GOVERNANCE CONTINUED...
The Audit & Risk Management Committee covers a wide range of topics for deliberations and discussions in its meetings including standing items that the Committee considers as a matter of course, typically in relation to the quarterly unaudited financial statements, accounting policies and judgements and reporting matters, and an array of significant issues relevant to Vedanta’s control framework. The Chief Executive Officer, the Chief Financial Officer, Group Assurance Head, and the external auditor are invited to attend each meeting. The Business and Operational Heads are invited to the meetings, as and when required. The representatives of Statutory Auditors are permanent invitees to the Committee meetings and the representatives of Executives from several departments including Accounts, Finance, Corporate Secretarial and Internal Audit also participate in the Committee meetings.
The Committee also meets separately with the external auditor without members of management to seek the auditor’s judgement about the quality and applicability of the accounting principles, the reasonableness of significant judgement and the adequacy of disclosures in financial statements.
On a quarterly basis, the Audit & Risk Management Committee reviews the confirmation of independence made by the Auditors, and also approves the fees paid to the Auditors by the Company, or any other company in Vedanta Group as per the Policy for Approval of Audit/ Non-Audit Services to be rendered by the Auditors.
The Committee comprises solely of Independent Directors whose names, details and biographies are set out in the Board and Committees section of this Annual Report. The Committee fulfils the requirements as specified under the provisions of the Companies Act, 2013, SEBI Listing Regulations and NYSE Guidelines with respect to the composition, independence, and financial expertise of its members.
The schedule of Committee meetings held during FY 2020-21 along with its members’ attendance records are detailed in the earlier sections of the Corporate Governance Report.
Performance Review of the Audit & Risk Management Committee
As part of the Board’s annual evaluation of its effectiveness and that of its Committees, as described earlier in the report, the Committee assessed its own effectiveness. The Audit & Risk Management Committee agreed that its overall performance had been effective during the year.
Review of Financial Results for FY 2020-21
The Committee reviewed both Standalone and
Consolidated financial statements for FY 2020-21 and based on this review and discussions with management, the Committee was satisfied that the financial statements were prepared in accordance with applicable accounting standards and fairly presented the Group’s financial position and results for the financial year ended March 31, 2021. The Committee therefore recommended the financial statements for the financial year ended March 31, 2021 for the consideration and approval of the Board.
The Board accepted all the recommendations made by the Audit & Risk Management Committee during FY 2021.
The utilisation of Committee’s time along with its major responsibilities is detailed below:
| (%) | ||||
Oversight of Financial | 40 | |||
Reporting | ||||
Auditors | 10 | |||
Internal Audit, Internal | 40 | |||
financial controls, Risk management | ||||
Governance | 10 | |||
236
| < BACK TO CONTENTS | Integrated Report | Statutory reports | Financial statements |
| Oversight of Financial reporting | • Oversight of the Company’s financial reporting process and disclosure of its financial information to ensure that the financial statements are true, fair, sufficient and credible;
• Discuss and review, with the management and auditors, the annual/quarterly financial statements before submission to the Board;
• Discuss and review earnings press releases and the financial information and guidance provided to analysts and ratings agencies;
• Review of key significant issues, tax & legal reports and management’s report;
• Review of management’s analysis of significant issues in financial reporting and judgements made in preparing the financial statements;
• Discuss with the Management regarding pending technical and regulatory matters that could affect the financial statements, and updates on management’s plans to implement new technical or regulatory guidelines;
• Review of off-balance-sheet structures, if any;
• Review of Draft limited review/audit reports and qualifications, if any, therein;
• Discuss and Review the Form 20F & Japanese Filings. | |
| Auditors | • Appointment of Statutory, internal, secretarial, cost & tax auditors, recommending their fees and reviewing their audit reports;
• Review of the independence of the statutory auditor and the provision of audit/non-audit services including audit/non-audit fees paid to the statutory auditor;
• Independent meetings with statutory auditors. | |
| Internal Audit, Internal financial controls | • Review of internal audit observations and monitoring of implementation of any corrective actions identified;
• Reviewing the internal financial control framework;
• Review of the performance of the internal audit function & internal audit plan;
• Consideration of statutory audit findings and review of significant issues raised;
• Reviewing related party transactions;
• Management discussion and analysis of financial condition and results of operations. | |
| Risk management | • Review of the risk management framework, risk profile, significant risks, risk matrix and resulting action plans;
• Review of the significant audit risks with the statutory auditor during interim review and year- end audit;
• Oversight over the effective implementation of the risk management framework across various businesses;
• Assurance of appropriate measures in the organisation to achieve prudent balance between risk and reward in both ongoing and new business activities;
• Annual review of the risk appetite and risk management policy including cyber security procedures adopted in the Group;
• Analytic validation and recommendation of necessary changes in the risk management policies and frameworks to the Audit & Risk Management Committee/Board, if any;
• Evaluation of significant and critical risk exposures for assessing management’s action to mitigate or manage the exposures in a timely manner. | |
VEDANTA LIMITED | INTEGRATED REPORT AND ANNUAL ACCOUNTS 2020-21 | 237
REPORT ON CORPORATE GOVERNANCE CONTINUED...
| Governance | • Reviewing minutes, summary reports of subsidiary company audit committees;
• Reviewing intercorporate loans, advances, guarantees;
• Reviewing ethics ( whistle-blower, sexual harassment, insider trading) and statutory compliances;
• Review of its own charter and processes;
• Notices received from statutory authorities and the management’s response;
• Regulatory updates;
• Reviewing feedback from the Audit & Risk Management Committee’s performance evaluation. |
NOMINATION AND REMUNERATION COMMITTEE
Composition & Attendance for FY 2020-21
| 75% | 100% | 4 | ||
| Independent | Attendance | Members |
The Nomination & Remuneration Committee (NRC) is accountable for overseeing the key processes through which it can make recommendations to the Board on the structure, size and composition of the Board, KMP & Senior Management; and ensure that the appropriate mix of skills, experience, diversity, and independence is present on the Board and senior level for it to function effectively. The NRC also leads the process for new Board appointments, advises the Board on succession planning arrangements and oversees the development of management talent within the Group.
Another key objective of the Committee is to ensure that competitive and fair awards are linked to key deliverables and are also aligned with market practice and shareholders’ expectations. The Committee ensures that remuneration policies and practices are designed to attract, retain, and motivate the Executive Directors and the senior management group, while focusing on the delivery of the Group’s strategic and business objectives. The Committee is also focused on aligning the interests of the Executive Directors and the senior management group with those of shareholders, to build a sustainable performance culture. When setting remuneration for the Executive Directors, the Committee takes into account the business performance, developments in the natural resources sector and similar information for high-performing Indian companies considering that majority of the Group’s operations are based in India.
The Committee also carries out the entire process of performance evaluation on an annual basis.
As on March 31, 2021, the NRC comprises three Independent Directors and the Non-Executive Chairman of the Company whose names, details and biographies are set out in the Board and Committees section of this Annual Report. The Committee fulfils the composition requirement as required under the provisions of the Companies Act, 2013 and Listing Regulations. In the event of a conflict of interest, the Chairman of the Board abstains from the discussions and other members of the NRC participate and vote. Other Directors, members of the senior management team, representatives from Human Resource department and external advisers may attend meetings at the invitation of the Committee, as appropriate. In respect of each of its meetings, the Chairman of the NRC provides an update to the Board. The schedule of NRC meetings held in FY 2020-21 along with its members’ attendance records are disclosed in the earlier sections of the Corporate Governance Report.
The utilisation of the Committee’s time along with its major responsibilities is detailed below:
| (%) | ||||
Board Composition and Nomination | 40 | |||
Compensation | 25 | |||
Evaluation | 20 | |||
Succession Planning & Governance | 15 | |||
238
| < BACK TO CONTENTS | Integrated Report | Statutory reports | Financial statements |
| Board Composition and Nomination | • Review and recommend the structure, size and composition (including the skills, knowledge, experience and diversity) of the Board and its Committees;
• Formulate the criteria/policy for appointment of Directors, Key Managerial Personnel (KMPs) and Senior Management (as defined by the NRC) in accordance with identified criteria;
• Review and appoint shortlisted candidates as Directors, KMPs and Senior Management (including evaluation of incumbent directors for potential re-nomination) and make recommendations to the Board;
• Evaluate the balance of skills, knowledge, experience and diversity on the Board for description of the role and capabilities, required for an appointment;
• Formulate and recommend to the Board the criteria for determining qualifications, positive attributes and independence of a director. | |
| Compensation | • Recommend to the Board a policy relating to the remuneration of directors (both executive and non-executive directors), KMP and Senior Management Personnel;
• Ensuring that the level and composition of remuneration is reasonable and sufficient to attract, retain and motivate directors of the quality required to run the Company successfully;
• Ensuring relationship of remuneration to performance is clear and meets appropriate performance benchmarks;
• Ensuring remuneration to directors, KMP and senior management involves a balance between fixed and incentive pay reflecting short and long-term performance objectives appropriate to the working of the Company and its goals;
• Determine remuneration based on the Company’s financial position, trends and practices on remuneration prevailing in the industry as considered appropriate by the NRC;
• Review of the Company’s Share Based Employee Benefit Scheme(s), if any, including overseeing the administration of the Scheme(s), formulating the necessary terms and conditions for such Scheme(s) like quantum of options/ rights to be granted, terms of vesting, grant options/ rights to eligible employees, in consultation with management; and allotment of shares/ other securities when options/ rights are exercised etc. and recommend changes as may be necessary. | |
| Evaluation of the board, its Committees and individual directors | • To develop, subject to approval of the Board, a process for an annual self-evaluation of the performance of the Board, its committees and the individual directors in the governance of the Company and to coordinate and oversee this annual self-evaluation;
• To formulate a criterion for evaluation of independent Directors and the Board and carry out evaluation of every Director’s performance and present the results to the Board;
• To review the performance of all the Executive Directors, on the basis of detailed performance parameters set for each of the executive Directors at the beginning of the year and present the results to the Board;
• Action report on suggestions made on evaluation;
• To maintain regular contact with the leadership of the Company. This should include interaction with the Company’s Leadership Institute, review of data from the employee survey and regular review of the results of the annual leadership evaluation process. | |
| Succession Planning & Governance | • Review succession planning for Executive and Non-Executive Directors and other Senior Management;
• Establishing policies and procedures to assess the requirements for induction of new members to the Board;
• To maintain regular interaction and collaborate with the leadership including the HR team to review the overall HR vision and people development strategy of the Company;
• To review and reassess the adequacy of the NRC’s charter as required and recommend changes to the Board;
• To develop and recommend a policy on Board diversity. | |
VEDANTA LIMITED | INTEGRATED REPORT AND ANNUAL ACCOUNTS 2020-21 | 239
REPORT ON CORPORATE GOVERNANCE CONTINUED...
Equal Opportunity Policy
Your Company recognises the value of diverse workforce and has reinforced its approach to diversity and inclusion by adopting Equal Opportunity Policy (“Policy”).
The Policy aims at providing equal employment opportunities, without any discrimination on the grounds of age, colour, disability, marital status, nationality, geography, ethnicity, race, religion, sex, sexual orientation. It is our endeavour to maintain a work environment that is free from any harassment, direct or indirect discrimination based on the above consideration.
CORPORATE SOCIAL RESPONSIBILITY COMMITTEE
Composition & Attendance for FY 2020-21
80% | 100% | 5 | ||||||
Independent | Attendance | Members |
The Company continues to focus on its long-term goal believing that while targeting to produce maximum yield for our shareholders during the year, we also lodge our contributions in furthering our responsibilities towards the society and environment. As a responsible corporate citizen, we recognise that those who reside in our operational areas are our partners in growth and we seek to foster a mutually benefitting relationship with all our stakeholders. It is this integration of business and CSR which provides us the social licence to operate and helps us to usher in a different developmental paradigm towards sustainable change in society. As part of our CSR
policy, we regularly engage with government agencies, development organisations, corporates, civil societies and community-based organisations to carry our durable and meaningful initiatives.
In this regard, the role of CSR Committee of the Company is to formulate and monitor the CSR Policy of the Company along with recommending the CSR Budget.
The schedule of CSR meetings held in FY 2020-21 along with its members’ attendance records are disclosed in the earlier sections of the Corporate Governance Report.
As part of the Board’s annual evaluation of its effectiveness and that of its Committees, as described earlier in the report, the CSR Committee assessed its own effectiveness. The members of the CSR Committee agreed that its overall performance had been effective during the year.
The Board accepted all the recommendations made by the Committee in FY 2020-21.
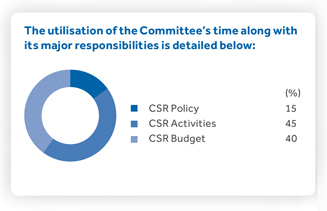
| CSR POLICY | • Formulate and recommend to the Board the CSR Policy and the activities to be undertaken;
• Review the CSR Policy and associated frameworks, processes and practices. | |
| CSR ACTIVITIES | • Identify the areas of CSR activities and projects and to ensure that the Company is taking the appropriate measures to undertake and implement CSR projects successfully;
• Assess the performance and impact of CSR Activities of the Company;
• Evaluate CSR communication plans;
• Set path for implementation and monitoring mechanism and the progress stature to ensure achievement;
• Ensure the value, ethics and principles are upheld in all its activities.
| |
| CSR BUDGET | • Decide and recommend to the Board the amount of expenditure to be incurred on CSR activities;
• Evaluate and monitor expenditure towards CSR Activities in compliance with the Companies Act 2013. | |
240
| < BACK TO CONTENTS | Integrated Report | Statutory reports | Financial statements |
STAKEHOLDERS’ RELATIONSHIP COMMITTEE
Composition & Attendance for FY 2020-21
75% | 100% | 4 | ||
Independent | Attendance | Members |
Vedanta understands and nurtures the value of sustaining continuous and long-term relationships with our stakeholders to secure a mutual understanding of the Company’s strategy, performance, and governance in line with the business objectives.
The Stakeholders’ Relationship Committee (SRC) cohesively supports the Company and its Board in maintaining strong and long-lasting relations with its stakeholders at large. The SRC majorly ensures and oversees the prompt resolution of the grievances of security holders; the implementation of ways to enhance shareholder experience; assessment of performance of Registrar & Transfer Agent; monitoring of shareholding movements etc.
The details of SRC composition and meetings are given in the earlier section of this report. The SRC is chaired by Mr. Upendra Kumar Sinha, Non-Executive Independent Director.
As part of the Board’s annual evaluation of its effectiveness and that of its Committees, as described earlier in the report, the SRC assessed its own effectiveness. The members of the SRC agreed that its overall performance had been effective during the year.
The Board accepted all the recommendations made by the Committee in FY 2020-21.
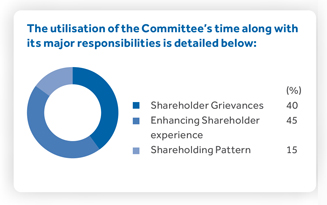
| Shareholder grievances | • Review and timely resolution of the grievances of Security holders related to issue, allotment, transfer/transmission, dematerialisation, rematerialisation etc. of shares and /or other securities of the Company;
• Review and timely redressal of all the Security holders grievances related to non- receipt of information demanded if any, non-receipt of annual report, non-receipt of declared dividend, issue of new/duplicate share certificates, general meeting etc.;
• Review from time to time the shares and dividend that are required to be transferred to the IEPF Authority;
• Review & closure of all Investor cases. | |
| Enhancing shareholder experience/services | • Review of measures taken for effective exercise of voting rights by shareholders.
• Review of the various measures and initiatives taken by the listed entity for reducing the quantum of unclaimed dividends and ensuring timely receipt of dividend warrants/annual reports/statutory notices by the shareholders of the Company;
• Initiatives for registration of e-mail IDs, PAN & Bank Mandates and demat of shares;
• Review reports on shareholder satisfaction surveys, if any;
• Oversight of the performance and services standards of various services being rendered of/by Registrar and Transfer Agent of the Company. | |
| Shareholding pattern | • Review shareholding distribution;
• Review movement in shareholding pattern;
• Comparative details on demat and physical holding. | |
An analysis of investor queries and complaints received and responded/ addressed during the year is provided below:
Investor Complaints
Company’s Registrar & Transfer Agent, KFin Technologies Private Limited (RTA) entertains and resolves investor grievances in consultation with the Compliance Officer.
All grievances can be addressed either to RTA or to the Company directly. An update on the status of complaints is quarterly reported to the Board and is also filed with stock exchanges.
VEDANTA LIMITED | INTEGRATED REPORT AND ANNUAL ACCOUNTS 2020-21 | 241
REPORT ON CORPORATE GOVERNANCE CONTINUED...
The details of shareholders’ complaints during FY 2020-21:
| Sr. | Closing | |||||||||||||
No. | Nature of complaints / letters and correspondence | Received | Replied | Balance | ||||||||||
COMPLAINTS RECEIVED THROUGH STOCK EXCHANGES, SEBI AND MINISTRY OF CORPORATE AFFAIRS | ||||||||||||||
| 1 | Non-receipt of shares | 36 | 36 | 0 | ||||||||||
| 2 | Non-receipt of dividends | 65 | 65 | 0 | ||||||||||
| 3 | Miscellaneous | 112 | 112 | 0 | ||||||||||
| 1 | Letters and correspondence from shareholders | 19,061 | 19,061 | 0 | ||||||||||
|
|
|
|
|
| |||||||||
Total | 19,274 | 19,274 | 0 | |||||||||||
|
|
|
|
|
| |||||||||
Note: The Company received Nil complaints w.r.t. Non-Convertible Debentures.
Investor Grievance Redressal Management
| Reported to Stakeholders’ | ||||||||
| SEBI Scores | Relationship Committee | |||||||
| Stock Exchange(s) | Resolved in a time, | |||||||
| INVESTOR | REQUESTS/ | by the RTA (on behalf | Reported to Stock | |||||
| GRIEVANCES | Registrar & Transfer | of the Company) or | Exchange(s) | |||||
| THROUGH | Agent (RTA) | Company directly. | ||||||
| Reported to Board of | ||||||||
| Directly to Company | Directors | |||||||
Unclaimed shares and transfer of unpaid and unclaimed amounts to Investor Education and Protection Fund (IEPF)
The details of Unclaimed Suspense Account and IEPF are forming part of the Directors’ Report in this Annual Report.
SUSTAINABILITY COMMITTEE
Composition & Attendance for FY 2020-21
66.7% | 100% | 3 | ||||||
Independent | Attendance | Members |
At Vedanta, we believe that with our thrust and focus on sustainability approach and high-performance strategy, we can advance both our business outcome and those of people, host communities and environment surrounding us.
While embarking utmost emphasis on ensuring zero harm, zero waste and zero discharge; prioritised health and safety management; responsible environmental impact; and support to all communities, we continue to embed a standardised culture across all our businesses with sustainability as one of our core values and the well-being and security of our people, the community, and the environment at the forefront and at the heart of our business strategy.
In our endeavour to follow the global best practices in sustainability governance frameworks, the Board has constituted a Sustainability Committee effective April 01, 2019 to support the Board in:
| Overseeing | Advising the Board | Ensuring effective | Outlining | Evaluating | Advising the | |||||
| the Company’s | on sustainability | implementation | initiatives required | emerging | Board to enable | |||||
| sustainability | policies and | of governance, | to institutionalise | sustainability | it to discharge its | |||||
| performance | management | advocacy and | a sustainability | risks in terms | responsibilities, | |||||
| and ensuring | systems, clearly | public relation | culture through | of intensity and | having regard | |||||
| adequacy of | setting out the | mechanisms and | involvement of the | impact, in turn, | to the law and | |||||
| the Company’s | commitments of | practices related | employees at all | guiding the | the expected | |||||
| Sustainability | the Company to | to sustainability. | levels. | management | international | |||||
| Framework | manage matters | on reasonable | standards of | |||||||
| in line with | of sustainable | avoidance of | sustainability | |||||||
| international | development | adversities likely | and stakeholder | |||||||
| standards. | effectively. | to pose a threat to | governance | |||||||
| sustained growth. |
The details of Committee composition and meetings are provided in the earlier section of this report.
242
| < BACK TO CONTENTS | Integrated Report | Statutory reports | Financial statements |
OTHER COMMITTEES
In line with constant endeavour for adopting best governance practices and ensuring smooth functioning of the board, the board has constituted various sub-committees and delegated certain roles and responsibilities to ensure prompt and timely decision- making on significant matters of the Company. The minutes of the meeting of each committee are placed before the Board for its noting.
The Board also formulates several project specific sub- committees from time to time in order to secure speedy implementation and execution of the projects to meet business needs. The Board is duly kept abreast of each of the meetings of sub-committees as well.
As on March 31, 2021, the internal Board committees of the Company have been elucidated below:
COMMITTEE OF DIRECTORS
The Committee of Directors (COD) supports the Board by considering, reviewing and approving all borrowing, investments, finance, banking and treasury related proposals, within the overall limits approved by the Board from time to time. The COD enables seamless flow of procedures and assists the Board by catering to various routine requirements.
Effective May 16, 2020, Finance Standing Committee has been consolidated with the Committee of Directors by enhancing the scope of the Committee of Directors to include considering and approving matters related to finance, investment, banking, treasury etc. within the overall limits approved by the Board.
The details of composition of the COD and its meetings are given in the earlier section to this report.
| Financial Matters | • Review and approve all policies related to the financial matters of the Company inter alia Investment policy, Foreign Exchange Policy, Commodity Hedging Policy, Banking Authorization Policy. | |
| Investment | • Review and approve inter-corporate loans, issuance of Corporate Guarantees, Letter of Comfort to and on behalf of Company/ Wholly-Owned Subsidiaries/ Subsidiaries/ Associate Companies in relation to loans and facilities availed by them.
• Purchase, acquire, subscribe, transfer, sell, redeem or otherwise deal in the shares/ securities of other Company/ body corporate or any other entity(s) other than for the purpose of trading; | |
| Treasury | • Consider, review and approve all the borrowing proposals including financing proposals within the overall limits approved by the Board from time to time and to create security/ charge(s) on all or any of the assets of the Company as may be required for the purpose of the said borrowings and to do such other incidental and ancillary activities as may be deemed necessary for execution;
• Assess and allocate the working capital limits to business units;
• Consider, review and approve treasury related proposals within the overall limit approved by the Board. | |
| Security related proposals | • Review, consider and approve securities related proposals including allotment of securities, issuance of duplicate share certificates upon split, consolidation, renewal, remat;
• Consider and review the proposals for buyback of debentures/ bonds issued by the Company from time. | |
| General Authorisation | • Nominate and appoint nominee directors on subsidiary, joint ventures, associate companies;
• Authorisation w.r.t. account operation including opening, closing and operation of bank account, demat account etc.;
• Subsidiary Governance and oversight. | |
VEDANTA LIMITED | INTEGRATED REPORT AND ANNUAL ACCOUNTS 2020-21 | 243
REPORT ON CORPORATE GOVERNANCE CONTINUED...
SHARE & DEBENTURE TRANSFER COMMITTEE
The Share & Debenture Transfer Committee is primarily entrusted with the following responsibilities:
| • | Allotment of shares, debentures, or any other securities; and |
| • | Review and approval of transfer, transmission, deletion and transposition of shares, debentures, or any other securities. |
The composition details of the Committee as on March 31, 2021 is provided below:
Name of Member | Designation | |
| GR Arun Kumar* | Whole-Time Director & Chief | |
| Financial Officer (Chairperson) | ||
| Anup Agarwal* | SVP Corporate Finance (Member) | |
| Jagdeep Singh | Senior Corporate Counsel (Member) |
| * | Mr. GR Arun Kumar and Mr. Anup Agarwal ceased to be the Chairperson and member of the Committee effective close of business hours on April 24, 2021 and March 31, 2021 respectively pursuant to their resignation. |
Mr. Ajay Goel, Dy. CFO and Mr. Dindayal Jalan, Non-Executive Independent Director have been appointed as the member and Chairperson of the Committee effective April 1, 2021 and April 25, 2021, respectively.
GROUP EXECUTIVE COMMITTEE
The Executive Committee (EXCO) is responsible for day-to-day running of the Company and meets on a monthly basis. It is entrusted with executing the strategy adopted by the Board; allocating resources in line with
delegated authorities; managing risk; and monitoring the operational and financial performance of the Company. Authority is delegated by the Executive Committee to the respective Chief Executive Officers of each of the businesses. The Group Chief Executive Officer keeps the Board informed of the EXCO’s activities through his standing reports placed before the Board.
GROUP MANAGEMENT COMMITTEE
Vedanta continues to embark upon the enriching journey of growth and expansion with best-in-class safety, benchmark technology, and cost-efficient practices. The design and culture of our organisation is cohesively built in a manner which aims to ensure that the Group has the right Management-In-Place (MIP) to drive the business and take the organisation to the next level.
In line with our long-term vision to create value, a fully empowered Group Management Committee has been formed effective April 1, 2020 comprising of the Group Chief Financial Officer, Chief Executive Officer, Chief Human Resource Officer Head and Chief Commercial Officer.
Since its inception, the Management Committee has been instrumental in executing its function as the top-level body collectively responsible for all key decisions taken under the guidance of the Chairman and the Board.
The Committee is entrusted with driving all significant initiatives and empowered by the Board to establish operational efficiency in guiding business strategy and achieving strong performance targets.
GENERAL BODY MEETINGS
Annual General Meetings
The details of the last three years Annual General Meetings/Court Convened Meeting are as follows:
| Year | Location | Date & Time | Special Resolutions passed | Weblink | ||||
| 53RD ANNUAL GENERAL MEETING |
|
|
| |||||
|
| |||||||
| 2017-18 | Rangsharda Auditorium, K.C. Marg, Bandra Reclamation, | August 24, 2018 at 10:30 a.m. | • Re-appointment of Ms. Lalita D. Gupte as an Independent Director for a second and final term. | Notice Outcome Minutes | ||||
| Bandra (West), Mumbai | • Re-appointment of Mr. Ravi Kant as an Independent Director for a second and final term. | |||||||
• Offer or invitation for subscription of Non-Convertible Debenture upto ₹ 20,000 crores on Private Placement basis. | ||||||||
| 54TH ANNUAL GENERAL MEETING |
|
|
| |||||
|
| |||||||
| 2018-19 | Rangsharda Auditorium, K.C. Marg, Bandra Reclamation, | July 11, 2019 at 10:30 a.m. | • Payment of remuneration to Mr. Tarun Jain in excess of limits prescribed under Listing Regulations. | Notice Outcome Minutes | ||||
| Bandra (West), Mumbai | Video | |||||||
55TH ANNUAL GENERAL MEETING |
|
|
| |||||
| 2019-20 | Through Video Conferencing (VC) / Other Audio-Visual | September 30, 2020 at 3:00 p.m. | • No Special resolution was passed | Notice Outcome FAQs | ||||
| Means (OAVM) | ||||||||
244
| < BACK TO CONTENTS | Integrated Report | Statutory reports | Financial statements |
| Postal Ballot | ||||||||||
| Resolution passed through postal ballot during FY 2020-21: | ||||||||||
| Date of Postal Ballot Notice | Voting period | Date of approval | Date of declaration of result | Web Link | ||||||
| May 18, 2020 | May 26, 2020 to | June 24, 2020 | June 25, 2020 | Notice | Outcome | |||||
| June 24, 2020 | ||||||||||
| Resolution 1: | Approval for Voluntary Delisting of Equity Shares of the Company from BSE Limited and National Stock Exchange of India Limited and Withdrawal of ‘Permitted to Trade’ Status on the Metropolitan Stock Exchange of India Ltd. and Voluntary Delisting of the Company’s American Depository Shares from the New York Stock Exchange and De-registration from the Securities & Exchange Commission |
Type of resolution: Special
| VOTING RESULTS | ||||||||||||||||||||||||
| Particulars | Total Forms | % of Total | Shares Held | % of Holding | Shares Voted | % of Voted | ||||||||||||||||||
Assent (Public) | 2,056 | 13.00 | 1,176,162,246 | 33.72 | 1,076,281,682 | 34.17 | ||||||||||||||||||
Assent (Promoters) | 10 | 0.06 | 1,863,618,788 | 53.43 | 1,863,618,788 | 59.17 | ||||||||||||||||||
Sub-Total (1) | 2,066 | 13.06 | 3,039,781,034 | 87.15 | 2,939,900,470 | 93.34 | ||||||||||||||||||
Dissent (Public) | 13,756 | 86.94 | 448,123,827 | 12.85 | 209,701,061 | 6.66 | ||||||||||||||||||
Dissent (Promoters) | 0 | 0 | 0 | 0 | 0 | 0 | ||||||||||||||||||
Sub-Total (2) | 13,756 | 86.94 | 448,123,827 | 12.85 | 209,701,061 | 6.66 | ||||||||||||||||||
Total | 15,822 | 100.00 | 3,487,904,861 | 100.00 | 3,149,601,531 | 100.00 | ||||||||||||||||||
Procedure adopted for Postal Ballot
In compliance with Listing Regulations and Section 108, 110 and other applicable provision of the Companies Act, 2013 and other applicable provisions, read with related Rules and circulars issued by SEBI and MCA in this regard, below is detailed procedure of postal ballot followed by the Company:
| 1. | The postal ballot notice was approved by the Board with the authorisation to the Company Secretary of the Company to sign and issue the same along with explanatory statement and postal ballot form. Voting rights were reckoned by fixing the record date and for ascertaining the members to whom the notice and postal ballot forms shall be sent. Simultaneously, postal ballot notice was also placed on the website. |
| 2. | Mr. Upendra C Shukla, Practicing Company Secretary was appointed as the scrutiniser to conduct the process of the postal ballot in a fair and transparent manner. |
| 3. | Due to difficulty in dispatch of the Notice along with the explanatory statement and postal ballot form by post or courier and as permitted under Circulars issued by SEBI and MCA on account of the threat posed by COVID—19, the Company had sent the Notice in electronic form only. |
| 4. | To facilitate members whose e-mail id was not registered, to receive the Notice electronically and cast their vote, the Company made special arrangement with its Registrar & Transfer Agent, for registration of e-mail addresses in terms of the circulars issued by MCA. |
| 5. | In compliance with Regulation 44 of the Listing Regulations and pursuant to the provisions of Sections 108 and 110 of the Companies Act read with the rules framed thereunder and the MCA Circulars, the Company has extended only the remote e-voting facility for its members, to enable them to cast their votes electronically instead of submitting the postal ballot form. |
| 6. | An advertisement containing prescribed details was published in Financial Express (English-all editions) and Navshakti (Marathi – Mumbai edition) informing about having dispatched the notice electronically. |
| 7. | Based on the scrutiniser’s report, the results of the postal ballot were declared by the Chairman within prescribed timelines. |
| 8. | Subsequently, the results were intimated to the stock exchanges and displayed on the Company’s notice board at its registered office and its corporate office as well. |
VEDANTA LIMITED | INTEGRATED REPORT AND ANNUAL ACCOUNTS 2020-21 | 245
REPORT ON CORPORATE GOVERNANCE CONTINUED...
Proposal for Postal Ballot
There is no immediate proposal for any resolution through postal ballot.
SHAREHOLDERS
Means of Communication
FINANCIAL RESULTS
| • | The quarterly/ half-yearly/ annual results along with audit/ limited review report, press release and investor presentation is filed with the stock exchanges immediately after the approval of the Board. |
| • | The results are also published in at least one prominent national and one regional newspaper having wide circulation viz. a viz. Business Standard, Financial Express, Economic Times and Maharashtra Times, within 48 hours of the conclusion of the meeting, |
| • | Quarterly financial results are sent to shareholders whose e-mail ids are registered with the Registrar & Transfer Agent. |
| • | Financial results are also uploaded on the Company’s website and can be accessed at www.vedantalimited.com |
NEWS RELEASES
| • | Stock exchanges are regularly updated on any developments/ events and the same are simultaneously displayed on the Company’s website as well. |
| • | All the releases can be accessed on the website of the Company at www.vedantalimited.com |
INSITUTIONAL INVESTOR / ANALYSTS PRESENTATION
| • | The schedule of analyst/investor meets are filed with the stock exchanges and the presentations are uploaded on the website of the Company at www.vedantalimited.com. |
| • | With an intent to keep our shareholders abreast with the operational performance, the organic project pipeline and internal developments in a transparent manner from time to time, the Company regularly files Investor Briefs with Stock Exchanges. |
WEBSITE
| • | The Company has a dedicated section on ‘Investor Relation’ on its corporate website www.vedantalimited.com which encompasses all the information for the investors like financial results, policies & codes, stock exchange filings, press releases, annual reports, SEC Filings etc. |
ANNUAL REPORT AND FORM 20F
| • | In compliance with circulars issued by SEBI and MCA on account of COVID-19 pandemic, soft copies of Annual Reports were sent to those shareholders whose e-mail ids were registered with the Company. The Form 20F filed with SEC is also made available on the website of the Company. |
SHAREHOLDER SATISFACTION SURVEY
| • | As a part of our constant endeavour to improve shareholder services, the Company has provided a shareholders’ satisfaction survey on its website for investors. |
| • | The same can be accessed at www.vedantalimited.com. |
CHAIRMAN COMMUNIQUE
| • | At every AGM, the Chairman addresses the shareholders on Company’s operations and performance with his speech. |
| • | Further, Chairman’s statement addressing the shareholders is also published in the Annual Report of the Company. |
246
| < BACK TO CONTENTS | Integrated Report | Statutory reports | Financial statements |
Appeal to shareholders
Updation of PAN Bank Mandate & Contact Details
Shareholders are requested to update their e-mail ids, PAN and Bank Mandate with the Company to ensure faster communication and credit of amounts. Regular reminders are also sent to shareholders in this regard. Facility to update the details is also provided on the website of the Company at www.vedantalimited.com.
Unclaimed Dividend
Reminders are sent to shareholders to encourage them to timely claim their unclaimed dividend and shares before the same is transferred to the IEPF Account.
Demat
Shareholders are also encouraged to open Demat accounts to eliminate bad delivery, saves stamp duty on transfers, ensures faster settlement, eases portfolio management and provides ‘on-line’ access through internet. The Company had provided exclusive facility to its shareholders to open their Demat accounts with Nil annual maintenance charges for first year.
Registration of Nomination
Registration of nomination makes easy for dependents to access your investments and set out the proportion of your benefits to the nominees.
| Correspondence Details | ||
| All the Share Transfer and Dividend Payment | KFin Technologies Private Limited | |
| Requests and Investors Related queries, | Unit: Vedanta Limited | |
| the shareholder can directly contact to our | Selenium Building, Tower-B, Plot No. 31 & 32, | |
| Registrar and Transfer Agent | Financial District, Nanakramguda, | |
| Serilingampally, Hyderabad, Rangareddi, | ||
| Telangana – 500 032, India | ||
| Tel: +91 40 6716 2222 | ||
| Fax: +91 40 2300 1153 | ||
| Email: einward.ris@kfintech.com | ||
| The Shareholders can reach out to the designated persons of any department in case of any query for the matters | ||
| enumerated below: | ||
| Company Secretary and Compliance Officer for queries related to Corporate Governance and Secretarial matters / Details of Nodal Officer | Ms. Prerna Halwasiya Company Secretary & Compliance Officer Vedanta Limited Core 6, 3rd Floor, Scope Complex 7, Lodhi Road, New Delhi – 110 003 | |
| Tel : +91 11 42262300 | ||
| Email: comp.sect@vedanta.co.in | ||
| Queries and Update related to Financial | Mr. Varun Kapoor | |
| Statement of the Company | Head - Investor Relations | |
| Vedanta Limited | ||
| Core 6, 3rd Floor, Scope Complex 7, Lodhi Road, New Delhi – 110 003 | ||
| Tel: +91 11 42262300 | ||
| Email: vedantaltd.ir@vedanta.co.in | ||
| Corporate Communication related matters of | Ms. Roma Balwani | |
| the Company | Senior Director, Corporate Communications & Brand | |
| Vedanta Limited | ||
| 75, Nehru Road, Vile Parle (East), Mumbai – 400 099 | ||
| Tel: +91 22 66461000 | ||
| Email: gc@vedanta.co.in | ||
| Sustainability Related Matters | Mr. Andrew Lewin | |
| Group Head – HSE and Sustainability | ||
| Vedanta Limited | ||
| Core 6, 3rd Floor, Scope Complex 7, Lodhi Road, New Delhi – 110 003 | ||
| Tel: +91 11 42262300 | ||
| Email: sustainability@vedanta.co.in | ||
VEDANTA LIMITED | INTEGRATED REPORT AND ANNUAL ACCOUNTS 2020-21 | 247
| REPORT ON CORPORATE GOVERNANCE CONTINUED... | ||
| Queries and Update on ADS issued by the Company: | Overseas Custodian for ADS: | |
| Citi- Depositary Receipt Services | ||
| 388 Greenwich Street, 6th Floor | ||
| New York, NY 10013 | ||
| Phone: 212-816-6839 | ||
| Website: www.citi.com/dr | ||
| Indian Custodian for ADS: | ||
| Citibank N.A. Custody Services | ||
| FIFC- 11th Floor, G Block | ||
| Plot C-54 and C-55, BKC, | ||
| Bandra—East, Mumbai – 400 098 | ||
| Tel: +91 22 6175 6060 | ||
| Fax: +91 22 2653 2205 | ||
| Queries related to Debenture issued by the Company: | Debenture Trustee: | |
| Axis Trustee Services Limited | ||
| Axis House, 2nd Floor, Wadia International Centre, | ||
| Pandurang Budhkar Marg, Worli, Mumbai – 400 025 | ||
| Tel: +91 22 2425 2525 | ||
| Fax: +91 22 2425 4200 | ||
Annual General Meeting for FY 2020-21
DATE & TIME
| • | August 10, 2021 |
| • | 3:00 pm |
VIRTUAL AGM
Virtual Annual General Meeting with live webcast and facility to participate through Video Conferencing / other audio-visual means for shareholdets for attending the AGM from their respective places. Respected shareholders are requested to kindly join the meeting through VC/OAVM facility by following the instructions provided in the notes to the Notice of the AGM
FAQS
A set of Frequently Asked Questions (FAQs) made available for the shareholders on the Company’s website at www.vedantalimited.com and NSDL website for a seamless participation through VC / OAVM.
ONLINE CHAT FACILITY
Facility to submit suggestions, feedbacks or questions online during the conduct of the Meeting will be provided to the members.
ONLINE SPEAKER REGISTRATION
Members who desire to speak at the AGM can pre-register as speakers by sending request to the Company as per the instructions provided in the Notice convening the Meeting.
Prior to AGM, site testing with the registered speaker shareholders shall be conducted to ensure smooth participation during the AGM.
E-VOTING FACILITY
Remote e-voting facility will be provided to the shareholders before the date of AGM.
The Company will also provide remote e-voting facility to the members during the AGM till 15 minutes post conclusion of the meeting to ensure participation and voting through electronic means.
TRANSCRIPT OF AGM
Recorded transcript of AGM will be made available on the website of the Company.
248
| < BACK TO CONTENTS | Integrated Report | Statutory reports | Financial statements |
Financial Year
The Financial Year of Company commences from April 1 and concludes on March 31 of each year.
Each quarter the Company reviewed and approved its financials. The previous and tentative dates for approval of the financials are as follows:
| Sr. No. Results for the period ended | FY 2020-21 | Tentative Dates for FY 2021-22 | ||||
| 1. | First Quarter | October 03, 2020 | End of July 2021 | |||
| 2. | Second Quarter and Half Year | November 06, 2020 | End of October 2021 | |||
| 3. | Third Quarter | January 29, 2021 | End of January 2022 | |||
| 4. | Fourth Quarter and Year ended | May 13, 2021 | End of April 2022 | |||
Dividend
For the period under review, the Company has declared and paid dividend as detailed below:
| Date of Board Meeting | Type of Dividend | Amount of Dividend | Record Date | |||
| EQUITY SHARES | ||||||
| October 24, 2020 | First Interim Dividend | ₹ 9.50 per share | Saturday, October 31, 2020 |
The payment of the above-mentioned dividend was duly completed within the statutory timelines. Further, the Board has not recommended any final dividend.
| Listing Details | ||||||
| Particular | Scrip Code | ISIN code | ||||
| Indian Stock | BSE Limited (BSE) | 500295 | INE205A01025 | |||
| Exchange | Phiroze Jeejeebhoy Towers, Dalal Street, Mumbai – 400 001 | |||||
| National Stock Exchange of India Limited (NSE) | VEDL | INE205A01025 | ||||
| Exchange Plaza, Plot No. C/1, G-Block, Bandra-Kurla Complex, | ||||||
| Bandra(East), Mumbai – 400 051 | ||||||
| Global Stock | New York Stock Exchange (NYSE) | VEDL | CUSIP No. 92242Y100 | |||
| Exchange | American Depository Shares (ADS) |
Notes:
Non-Convertible Debentures of the Company are also listed on BSE Limited (BSE), details of the same are provided later in this report.
Commercial Papers of the Company were listed on National Stock Exchange of India Limited, details of the same are provided later in this report. Company has paid annual listing fees for the FY 2020-21 to all the Stock Exchanges (Indian & Global), where the securities of the Company are listed.
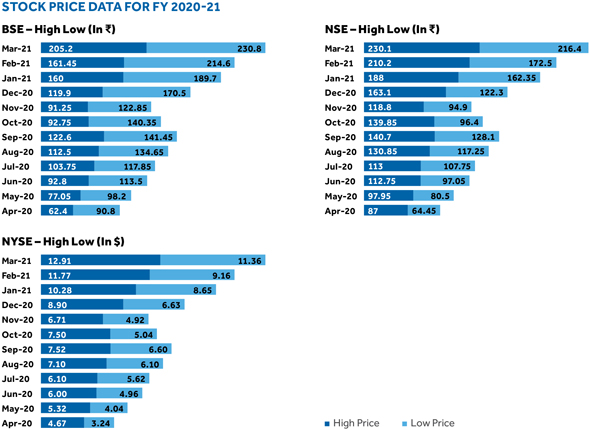
VEDANTA LIMITED | INTEGRATED REPORT AND ANNUAL ACCOUNTS 2020-21 | 249
REPORT ON CORPORATE GOVERNANCE CONTINUED...
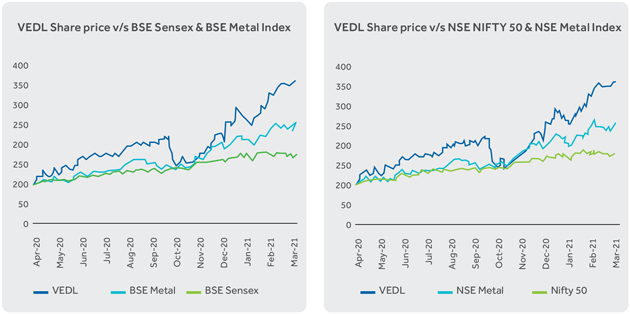
Share Transfer System
As part of the effective shareholder management and grievance redressal processes, various shareholder requests received by the Company through the Registrar and Transfer Agent (RTA) are processed in the following manner:
| Request received by | Document Verification | Approval | Communication to | |||
| RTA | The Company’s RTA, | The Company also | Shareholder | |||
| Requests relating to | KFin Technologies | inspects and confirms the | Post Committee approval, | |||
| transfer, transmission, | Private Limited, verifies | veracity and validity of | RTA completes the process | |||
| transposition, change | the authenticity of | documents; | and communicates to the | |||
| of name, deletion of | documents submitted by | respective shareholders; | ||||
| name are received from | shareholders; | Requests are then | ||||
| shareholders having | approved by the duly | Requests are generally | ||||
| physical shareholding. | RTA thereafter, sends the | constituted Share & | processed within 15 days of | |||
| requests to the Company | Debenture Transfer | receipt of the documents, | ||||
| for processing. | Committee designated | if documents are clear and | ||||
| for the share transfer | found to be in order in all | |||||
| procedures. | respects. |
In addition to the above, a compliance certificate is issued on a half-yearly basis by a Practicing Company Secretary pursuant to Regulation 40(9) of Listing Regulations reiterating due compliance of share transfer formalities by the Company within timelines as required under the applicable provisions.
The Company/RTA has also duly complied with the operational guidelines including cut-off date till March 31, 2021 as provided through SEBI circulars issued during the year with respect to re-lodgement and dematerialisation of share transfer requests which were earlier rejected/returned due to deficiency in documents.
Quarterly audits are also carried out by the Practicing Company Secretary to reconcile the total admitted capital with the depositories confirming that the total issued/paid-up and listed share capital of the Company holds agreement with the aggregate number of shares held in physical and dematerialised forms. The reports for Share Capital Audit Reconciliation and compliance certificates obtained in line with the statutory requirements are meticulously filed with the Stock exchanges on a timely basis.
Capital Evolution
The details of capital evolution of the Company can be accessed on the website of the Company at www.vedantalimited.com.
250
| < BACK TO CONTENTS | Integrated Report | Statutory reports | Financial statements |
Shareholding Distribution
Shareholding according to shareholders class as on March 31, 2021
| Shareholding of Nominal value of E 1/- | No. of shareholders | % of Total shareholders | No. of shares held | Shareholding (%) | ||||||||||||
1-5000 | 596,893 | 98.52 | 156,881,190 | 4.22 | ||||||||||||
5001—10000 | 4,920 | 0.81 | 35,665,082 | 0.96 | ||||||||||||
10001—20000 | 2,047 | 0.34 | 28,936,043 | 0.78 | ||||||||||||
20001—30000 | 576 | 0.10 | 14,150,760 | 0.38 | ||||||||||||
30001—40000 | 247 | 0.04 | 8,572,585 | 0.23 | ||||||||||||
40001—50000 | 167 | 0.03 | 7,701,266 | 0.21 | ||||||||||||
50001—100000 | 323 | 0.05 | 23,699,849 | 0.64 | ||||||||||||
100001 & Above | 652 | 0.11 | 3,441,589,864 | 92.58 | ||||||||||||
Total | 605,825 | 100.00 | 3,717,196,639 | 100.00 | ||||||||||||
| March 31, 2021 | ||||||||||
| No. of | Percentage of | |||||||||
| Sr. | Category | shares held | shareholding | |||||||
| No. | ||||||||||
| Face value E 1/- | ||||||||||
| (a) | Promoter’s holding | |||||||||
Indian promoters | 160,656 | 0.00 | ||||||||
Foreign promoters | 2,048,458,132 | 55.11 | ||||||||
| (b) | Public Shareholding | |||||||||
Banks, Mutual funds, Financial Institutions, Insurance Companies (Central/State Govt. Institutions/Non-Govt. Institutions) | 386,457,791 | 10.40 | ||||||||
FIIs/Foreign Corporate Bodies | 604,826,916 | 16.27 | ||||||||
Body Corporates | 136,396,624 | 3.67 | ||||||||
Indian Public | 279,447,410 | 7.52 | ||||||||
NRIs | 9,296,258 | 0.25 | ||||||||
Trust | 644,821 | 0.02 | ||||||||
H U F | 13,165,845 | 0.35 | ||||||||
Clearing Members | 12,421,553 | 0.33 | ||||||||
Foreign Bodies-DR | 1,343,227 | 0.04 | ||||||||
Foreign Nationals | 1,380 | 0.00 | ||||||||
IEPF | 4,918,437 | 0.13 | ||||||||
NBFCs | 797,913 | 0.02 | ||||||||
QIBs | 41,574,609 | 1.12 | ||||||||
Overseas Corp Bodies | 447,500 | 0.01 | ||||||||
Alternate Investment Funds | 3,741,164 | 0.10 | ||||||||
ESOS Trust | 12,193,159 | 0.33 | ||||||||
(c ) | American Depository Shares | 160,903,244 | 4.33 | |||||||
Grand Total | 3,717,196,639 | 100.00 | ||||||||
| 1. | Twinstar Holdings Limited (Promoter Group) was earlier holding 2,48,23,177 American Depository Shares (ADS) representing 9,92,92,708 equity shares. One (1) ADS represents four (4) equity shares. These ADS have been converted into equity shares. |
| 2. | Twinstar Holdings Limited (Promoter Group) holds four Folio numbers. |
| 3. | Vedanta Holdings Mauritius II Limited (Promoter Group) has purchased 185,000,000 equity shares aggregating to 4.98% of equity share capital of Vedanta Limited, on December 24, 2020. |
| 4. | 3,08,232 shares are under abeyance category, pending for allotment as they are sub judice. |
| 5. | Vedanta Resources Limited (Acquirer) together with Twin Star Holdings Limited (PAC 1), Vedanta Holdings Mauritius Limited (PAC 2) and Vedanta Holdings Mauritius II Limited (PAC 3), as persons acting in concert with the Acquirer (PACs), have acquired 374,231,161 equity shares of the Company (24,14,43,115 equity shares (6.50%) by PAC 1; 10,73,42,705 equity shares (2.89%) by PAC 2 and 2,54,45,341 equity shares (0.68%) by PAC 3) under the voluntary open offer (Open Offer) made to the public shareholders of the Vedanta Limited (Company) in accordance with the Securities and Exchange Board of India (Substantial Acquisition of Shares and Takeovers) Regulations, 2011, thereby increasing acquirer’s indirect shareholding in the Company from 55.1% to 65.18%. |
VEDANTA LIMITED | INTEGRATED REPORT AND ANNUAL ACCOUNTS 2020-21 | 251
| < BACK TO CONTENTS | Integrated Report | Statutory reports | Financial statements |
REPORT ON CORPORATE GOVERNANCE CONTINUED...
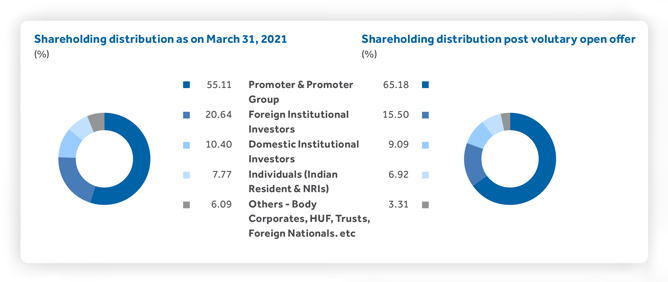
Dematerialisation of Shares and Liquidity
The shares of the Company are compulsorily traded in dematerialised form on the stock exchanges. As on March 31, 2021, ~ 99% shares of the Company are held in dematerialised form.
Pursuant to the amendment in Listing Regulations, post April 1, 2019, except in case of transmission or transposition of securities, requests for effecting transfer of securities shall not be processed unless the securities are held in the dematerialised form with a depository.
The equity shares of the Company are freely tradable in the market and are among the most liquid and actively traded shares in the stock exchanges.
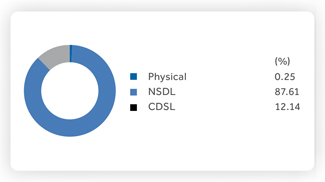
Outstanding ADS
As of March 31, 2021, 3,717,504,871 equity shares, par value ₹ 1 per equity share, were issued and outstanding (including 308,232 equity shares which have been issued but pending allotment), of which 160,903,244 equity shares were held in the form of 40,225,811 ADSs. Each ADSs represents four equity shares and are listed and traded on the New York Stock Exchange (NYSE). As of the year end, there were seven (7) registered holders of the ADS. Citibank N.A., New York acts as the Depository for the ADS / ADR issued by the Company.
252
| < BACK TO CONTENTS | Integrated Report | Statutory reports | Financial statements |
LISTING OF DEBT SECURITIES
Non-Convertible Debentures
The following Secured Redeemable Non-Convertible Debentures (NCDs) are listed with the BSE Limited as on March 31, 2021:
| Sr. | No. of NCDs | Amount | ||||||||||||||||||
| ISIN | Issuance date | Maturity date | Coupon rate | Payment frequency | (Face value of | issued | ||||||||||||||
| No. | E 10 lakhs each) | (in crores) | ||||||||||||||||||
| 1 | INE205A07063 | 07-Oct-2016 | 15-Apr-2021 | 8.75 | % | Interest Compounded Annually and payable at Maturity | 2,500 | 250 | ||||||||||||
| 2 | INE205A07071 | 07-Oct-2016 | 15-Sep-2021 | 8.75 | % | Interest Compounded Annually and payable at Maturity | 2,500 | 250 | ||||||||||||
| 3 | INE205A07139 | 05-Apr-2018 | 05-Apr-2021 | 8.50 | % | Annual | 23,500 | 2,350 | ||||||||||||
| 4 | INE205A07147 | 05-Apr-2018 | 15-Jun-2021 | 8.50 | % | Annual | 16,500 | 1,650 | ||||||||||||
| 5 | INE205A07154 | 04-Jul-2018 | 02-Jul-2021 | 9.18 | % | Annual | 10,000 | 1,000 | ||||||||||||
| 6 | INE205A07162 | 09-Dec-2019 | 09-Dec-2021 | 8.90 | % | Annual | 9,000 | 900 | ||||||||||||
| 7 | INE205A07170 | 09-Dec-2019 | 09-Dec-2022 | 9.20 | % | Annual | 7,500 | 750 | ||||||||||||
| 8 | INE205A07188 | 30-Jan-2020 | 30-Jun-2022 | 8.75 | % | Annual | 12,700 | 1,270 | ||||||||||||
| 9 | INE205A07196 | 25-Feb-2020 | 25-Feb-2030 | 9.20 | % | Annual | 20,000 | 2,000 | ||||||||||||
| 10 | INE205A07204 | 17-Feb-2021 | 17-Mar-2022 | 7.50 | % | Annual (for 1st Interest Payment) and subsequent interest payment on maturity for one month period. | 5,000 | 500 | ||||||||||||
Commercial Papers
As on March 31, 2020, the outstanding Commercial Papers (CPs) listed with the National Stock Exchange of India Limited aggregated to a total of ₹7,575 crores which have been duly redeemed on a timely basis during financial year 2020-21.
In addition, during financial year 2020-21, CPs aggregating to a total of ₹5,160 crores as detailed below have been issued, listed with the National Stock Exchange of India Limited, and duly redeemed on timely basis. As on March 31, 2021, there are nil outstanding CPs.
| Total No. of | Amount Issued | |||||||||||||||||
| S. No. ISIN Number | Issuance date | Maturity date | Face Value (E) | Securities | (in crores) | |||||||||||||
| 1 | INE205A14UT8 | 09-Apr-2020 | 30-Apr-2020 | 500,000 | 5,000 | 250 | ||||||||||||
| 2 | INE205A14VL3 | 11-May-2020 | 10-Jun-2020 | 500,000 | 4,000 | 200 | ||||||||||||
| 3 | INE205A14VJ7 | 06-May-2020 | 19-Jun-2020 | 500,000 | 10,000 | 500 | ||||||||||||
| 4 | INE205A14VK5 | 08-May-2020 | 22-Jun-2020 | 500,000 | 4,000 | 200 | ||||||||||||
| 5 | INE205A14VH1 | 30-Apr-2020 | 29-Jul-2020 | 500,000 | 10,000 | 500 | ||||||||||||
| 6 | INE205A14VF5 | 30-Apr-2020 | 30-Jul-2020 | 500,000 | 8,500 | 425 | ||||||||||||
| 7 | INE205A14VI9 | 05-May-2020 | 31-Jul-2020 | 500,000 | 7,000 | 350 | ||||||||||||
| 8 | INE205A14VG3 | 04-May-2020 | 03-Aug-2020 | 500,000 | 4,700 | 235 | ||||||||||||
| 9 | INE205A14VM1 | 20-May-2020 | 19-Aug-2020 | 500,000 | 3,000 | 150 | ||||||||||||
| 10 | INE205A14VN9 | 30-Jul-2020 | 31-Aug-2020 | 500,000 | 14,000 | 700 | ||||||||||||
| 11 | INE205A14VE8 | 27-Apr-2020 | 27-Oct-2020 | 500,000 | 10,000 | 500 | ||||||||||||
| 12 | INE205A14VD0 | 28-Apr-2020 | 28-Oct-2020 | 500,000 | 10,000 | 500 | ||||||||||||
| 13 | INE205A14VO7 | 27-Oct-2020 | 03-Nov-2020 | 500,000 | 13,000 | 650 | ||||||||||||
VEDANTA LIMITED | INTEGRATED REPORT AND ANNUAL ACCOUNTS 2020-21 | 253
REPORT ON CORPORATE GOVERNANCE CONTINUED...
| Credit Ratings | ||||||||||||
| Status as on | Status as on | Date of Action | ||||||||||
| March 31, 2020 | March 31, 2021 | |||||||||||
| India | India | |||||||||||
| CRISIL | CRISIL | CRISIL | India Ratings | |||||||||
| Ratings | Ratings | |||||||||||
| Bank Loans | CRISIL AA / Outlook Stable | IND AA / Outlook Negative | CRISIL AA-/ Outlook Stable | IND AA-/ Outlook Stable | Outlook Change to ‘Negative’ from ‘Stable’ in April 2020. | Downgrade to IND AA- from IND AA with negative outlook in May 2020. | ||||||
The revision in rating outlook reflected the risk of sharply lower commodity prices, especially of Brent crude, zinc and Aluminium, being sustained in fiscal 2021 in the wake of the Novel Coronavirus (COVID-19) pandemic.
Downgraded to ‘CRISIL AA-’ from ‘CRISIL AA’ and change in outlook to stable from negative in Oct 2020.
CRISIL downgraded its ratings on long-term facilities & NCD’s on the expectation of higher financial leverage and reduced cash surplus at Vedanta over medium-term.
| India Ratings downgraded its ratings on long-term facilities to IND AA- from IND AA with negative outlook on the expectation of deterioration in Vedanta Limited’s credit profile following a substantial decline in economic activity due to the COVID-19–related lockdown, with the balance sheet leverage remaining elevated in FY 21 and FY 22. Change in outlook to Stable from Negative in Feb 2021.
India Ratings changed its outlook to Stable from negative reflecting group’s improved liquidity position, supported by the moderated refinancing risks at VRL. The liquidity improvement resulted from group’s improved operational cashflows in 2HFY21, supported by its enhanced volume performance, cost improvements and a sharp recovery in metal prices.
| |||||||||||
| Working Capital | CRISIL AA | CRISIL AA-/ | Same as above | NA | ||||||||
| Lines | / Outlook | Outlook | ||||||||||
| Stable / | Stable/CRISIL | |||||||||||
| CRISIL A1+ | A1+ | |||||||||||
| Non-Convertible | CRISIL AA | CRISIL AA-/ | Same as above | NA | ||||||||
| Debentures | / Outlook | Outlook Stable | ||||||||||
| Stable | ||||||||||||
| Commercial | CRISIL A1+ | IND A1+ | CRISIL A1+ | IND A+ | No Change | No Change | ||||||
| Paper | ||||||||||||
254
| < BACK TO CONTENTS | Integrated Report | Statutory reports | Financial statements |
| Plant Locations | ||||
| Division | Location | |||
| Copper Anodes (Smelter), Refinery, Continuous Cast Copper Rods | SIPCOT Industrial Complex, Madurai By-pass Road, T.V. Puram PO, Tuticorin Tamil Nadu – 628 002, India. | |||
| Copper Cathodes (Refinery) and Continuous Cast Copper Rods/Wire | 1/1/2 Chinchpada, Silvassa Union Territory of Dadra and Nagar Haveli – 396 230, India. Gat 201, Plot no. 2, 3, 4, 5, 6 and 7 Pune Old Highway, Takwe Khurd. Post Kamshet. Taluka Maval. Dist Pune, Maharashtra – 410 405, India. * | |||
| Continuous Cast Copper Rods | 209-B, Piparia Industrial Estate, Piparia, Silvassa Union Territory of Dadra and | |||
| Nagar Haveli – 396 230, India | ||||
| Ratnagiri – Y 1, R 57 Zaadzadgaon Block, MIDC, Ratnagiri, Maharashtra – 415 639, India. | ||||
| Iron Ore – Mining | Megalahally Office Complex, Megalahally Village, Hireguntanur, Hobli, | |||
| Chitradurga Taluk and district, Karnataka, India. | ||||
| Pig Iron Division 1 | Sy NO 39, 41, 36/1 (p) 37 (P), 42/1 (p) 43/1 (p) Amona, P.O. Marcel, Bicholim, | |||
| Goa – 403 107, India. | ||||
| Metallurgical Coke (Met Coke) | SY No. 205, 207, Navelim, Sankhalim, Bicholim, Goa – 403 505, India. | |||
| SY No 192, 193, Vazare, Dodamarg, Sindhudurg, Maharashtra – 416 512. | ||||
| Pig Iron Division 2 | SY No 177 N 120 (P) Navelim P.O. Sanquelim Bicholim, Goa – 403 505, India. | |||
| Aluminium Smelters | PMO Office, Bhurkahamuda, P.O. Sripura, Dist – Jharsuguda, Odisha – 768 202, India. | |||
| Alumina Refinery | Alumina Refinery Project, At/P.O. Lanjigarh, Via – Viswanathpur, Kalahandi, Lanjigarh, | |||
| Odisha – 766 027, India. | ||||
| Aluminium | Post Box No. 4, Mettur Dam R.S., Salem District, Tamil Nadu – 636 402, India. | |||
| Gat No. 924,925, 926 and 927. Sanaswadi Taluka Shirur. | ||||
| Dist Pune, Maharashtra – 412 208, India.* | ||||
| Power | Bhurkahamunda, P.O. Sripura, Dist. Jharsuguda Odisha, Pin – 768 202. India. | |||
| Power Plant 1, Plot s/y No 44/4 & 44/5, Amona Village, Navellim, | ||||
| Bicholim – Goa—403 107, India. | ||||
| SIPCOT Industrial Complex, Meelavitan, Tuticorin, Tamil Nadu, Pin – 628 002, India. | ||||
| Oil & Gas | Assets | |||
| (a) | RJ-ON-90/1—Barmer Basin – India | |||
| (b) | CB/OS-2—Cambay Basin – India | |||
| (c) | PKGM-1 Ravva—Krishna Godavari Basin – India | |||
| (d) | KG-ONN-2003/1- Krishna Godavari Basin – India | |||
| (e) | KG-OSN-2009/3—Krishna Godavari Basin – India | |||
| (f) | KG/ONDSF/Kaza/2018—Krishna Godavari Basin – India | |||
| Pipeline | ||||
| (a) | Radhanpur Terminal, Patan, Gujarat, India, Pin – 385 340 | |||
| (b) | Viramgam Terminal, Viramgam, Ahmedabad, Gujarat, India, Pin – 382 150 | |||
| (c) | Bhogat Terminal, Bhogat Jam Kalyanpur Devbhumi Dwarka, Gujarat, Pin – 361 315 | |||
| Plant | ||||
| (a) | Mangala Processing Terminal, Barmer, Rajasthan | |||
| Nagana Village, Near Kawas, | ||||
| NH112, Barmer, Rajasthan – 344 035 | ||||
| (b) | Raageshwari Gas Terminal, Rajasthan | |||
| (c) | Suvali Onshore terminal, Gujarat | |||
| Survey No. 232, Suvali, Surat Hazira Road, | ||||
| Surat, Gujarat – 394 510 | ||||
| (d) | Raava Onshare terminal, Andhra Pradesh | |||
| Surasani Yanam, | ||||
| Uppalaguptam Mandal, East Godavari Dist., | ||||
| Andhra Pradesh – 533 213 | ||||
| (e) | Nagayalanka EPS Facility, Andhra Pradesh | |||
| Nagayalanka GGS, Vakkapatlavaripalem Village, | ||||
| Nagayalanka Mandal, Krishna District, | ||||
| Andhra Pradesh – 521 120 | ||||
| Paper* | GIDC Doswada, Ta. Fort Songadh, District Tapi, Gujarat – 394 365, India | |||
* Non-operational unit | ||||
VEDANTA LIMITED | INTEGRATED REPORT AND ANNUAL ACCOUNTS 2020-21 | 255
REPORT ON CORPORATE GOVERNANCE CONTINUED...
Commodity Price Risk or Foreign Exchange Risk and Hedging Activities
Fluctuation in commodity prices
Impact: Prices and demand for the Group’s products are expected to remain volatile/uncertain and strongly influenced by global economic conditions. Volatility in commodity prices and demand may adversely affect our earnings, cash flow and reserves.
Mitigation: Our Group has a well-diversified portfolio, which acts as a hedge against fluctuations in commodities and delivers cash flows through the cycle. We consider exposure to commodity price fluctuations to be an integral part of our Group’s business and its usual policy is to sell its products at prevailing market prices, and not to enter into long-term price hedging arrangements. However, to minimise price risk for finished goods where price of raw material is also determined by same underlying base metal prices (e.g. purchase of alumina, copper concentrate for manufacturing and selling copper and aluminium products, respectively) we employ back-to-back hedging. In exceptional circumstances, we may enter into strategic hedging with prior approval of the Executive Committee. The Group monitors the commodity markets closely to determine the effect of price fluctuations on earnings, capital expenditure and cash flows.
Currency exchange rate fluctuations
Impact: Our assets, earnings and cash flows are influenced by a variety of currencies due to the diversity of the countries in which we operate. Fluctuations in exchange rates of those currencies may have an impact on our financials. Although the majority of the Group’s revenue is tied to commodity prices that are typically priced by reference to the US dollar, a significant part of its expenses are incurred and paid in local currency. Moreover, some of the Group borrowings are denominated in US dollars, while a large percentage of
cash and liquid investments are held in other currencies, mainly in the Indian rupee. Any material fluctuations of these currencies against the US dollar could result in lower profitability or in higher cash outflows towards debt obligations.
Mitigation: We do not speculate in forex. We have developed robust controls in forex management to monitor, measure and hedge currency risk liabilities. The Committee of Directors reviews our forex-related matters periodically and suggests necessary courses of action as may be needed by businesses from time to time, and within the overall framework of our forex policy.
Exposures on foreign currency loans are managed through the Group wide hedging policy, which is reviewed periodically to ensure that the results from fluctuating currency exchange rates are appropriately managed. The Group strives to achieve asset liability offset of foreign currency exposures and only the net position is hedged. The Group uses forward exchange contracts, currency swaps and other derivatives to hedge the effects of movements in exchange rates on foreign currency denominated assets and liabilities. The sources of foreign exchange risk are outstanding amounts payable for imported raw materials, capital goods and other supplies as well as financing transactions and loans denominated in foreign currencies. The Group is also exposed to foreign exchange risk on its net investment in foreign operations. Most of these transactions are denominated in US dollars. Short-term net exposures are hedged progressively based on their maturity. A more conservative approach has been adopted for project expenditures to avoid budget overruns, where cost of the project is calculated taking into account the hedge cost. However, all new long-term borrowing exposures are being hedged. The hedge mechanisms are reviewed periodically to ensure that the risk from fluctuating currency exchange rates is appropriately managed.
| Exposure(2) in INR | Exposure(2) in quantity towards | % of such exposure hedged through commodity derivatives | ||||||||||||||||||||||||||
| Sr. | Commodity | towards the particular Units | the particular | Domestic market | International market | Total | ||||||||||||||||||||||
| No. | Name(1) | commodity | commodity | OTC | Exchange | OTC | Exchange | |||||||||||||||||||||
1 | Aluminium | 19,590 | KT | 1,403 | 0 | % | 0 | % | 0 | % | 30 | % | 30 | % | ||||||||||||||
2 | Oil | 3,742 | mmboe | 12 | 0 | % | 0 | % | 0 | % | 0 | % | 0 | % | ||||||||||||||
3 | Gas | 385 | mmscf | 10,164 | 0 | % | 0 | % | 0 | % | 0 | % | 0 | % | ||||||||||||||
4 | Copper | 13,457 | KT | 293 | 0 | % | 0 | % | 0 | % | 96 | % | 96 | % | ||||||||||||||
5 | Silver | 30 | Oz | 206,388 | 0 | % | 0 | % | 72 | % | 0 | % | 72 | % | ||||||||||||||
6 | Gold | 839 | Oz | 65,508 | 0 | % | 83 | % | 0 | % | 0 | % | 83 | % | ||||||||||||||
| 1. | Commodity means a commodity whose price is fixed by reference to an international benchmark and having a material effect on the financial statements. |
| 2. | Exposure for Aluminium and Oil is based on sales and closing stock and that for Gas is based on sales. |
| 3. | Gold and Silver are sold in the form of anode slime/copper concentrate. Anode slime is the residue formed while refining copper. Exposure for Copper (including Gold and Silver) is based on opening stock, purchases and sales. Percentage of exposure not hedged represents unpriced transactions as at March 31, 2021 as the same will be hedged as per the Company’s policy and contractual terms once price period is fixed. |
256
| < BACK TO CONTENTS | Integrated Report | Statutory reports | Financial statements |
OTHER DISCLOSURES
Total fees for all services on a consolidated basis to the statutory auditor
| Mar-21 | ||||
| Particulars | (In crores) | |||
Audit fees (audit and review of financial statements) | 29 | |||
Audit-related fees (including other miscellaneous audit related certifications) | 0 | |||
Tax fees (tax audit, other certifications and tax advisory services) | 0 | |||
All other fees (certification on corporate governance and advisory services) | 0 | |||
Total | 29 | |||
Framework for monitoring Subsidiary Companies
The details of the material subsidiaries of the Company have been elucidated in the Directors’ Report forming part of Annual Report. The Company has complied with the provision of Listing regulations w.r.t material subsidiary for FY 2020-21.
The Company has in place a policy on Determining Material Subsidiary, duly approved by the Board in conformity with the Listing Regulations. which can be accessed at www.vedantalimited.com.
The subsidiary companies have their separate independent Board of Directors authorised to exercise all the responsibilities, duties and rights for effective monitoring and management of the subsidiaries.
The Company supervises and monitors the performance of subsidiary companies:
| i. | On a quarterly basis, the minutes of each of the Board meetings of the subsidiary companies and a statement of all significant transactions of the subsidiary companies are placed before the Board of Directors for their review and noting; |
| ii. | The minutes of each of the Audit Committee meetings of the subsidiary companies are also placed before the Audit & Risk Management Committee on quarterly basis; |
| iii. | Presentations are made to the Company’s Board on business performance by the senior management of major subsidiaries of the Company; |
| iv. | Certain matters of the subsidiaries are reserved for approval of the Board or Committee of Directors of the Company; |
| v. | Subsidiaries are subject to applicable Statutory Audit and Secretarial Audit. |
Further, appropriate disclosures related to subsidiaries are made in Financial Statements / Directors’ report of the Company as per Companies Act, 2013 and Listing Regulations.
Materially Significant Related Party Transactions
A comprehensive note on related party transaction forms a part of Directors’ Report.
Your Company has in place a policy on Related Party Transactions, which envisages the procedure governing Related Party Transaction entered into by the Company. The said policy was revised in the board meeting held on March 31, 2021 and displayed on the Company’s website at www.vedantalimited.com.
Non-Compliance by the Company, Penalties, Strictures imposed by Stock Exchange or SEBI or any Statutory Authority on any matter related to capital markets during the last three years
No penalty or strictures have been imposed by stock exchange or SEBI or any statutory authority on any matter related to capital markets on your Company during the last three years.
Vigil Mechanism / Whistle-Blower Policy
Vedanta continues to assure utmost commitment towards highest standards of morals and ethics in the conduct of business. The employees have been provided comprehensive access to lodge any complaint against the Company’s accounting practices, internal controls, auditing matters or any such suspected incidents of fraud or violation of the Company’s Code of Conduct that could adversely impact Company operations, business performance and/or reputation.
All the employees of the Company and its subsidiaries are encouraged and expected to raise their concerns. The Audit & Risk Management Committee has laid down the procedure governing the receipt, retention, and treatment of complaints. Your Company has a Whistle- Blower Policy in place as part of the Vigil Mechanism which can be accessed at www.vedantalimited.com. All the complaints are reported to the Director – Management Assurance, who is independent of operating management and the businesses. In line with global practices, dedicated e-mail IDs (sgl.whistleblower@vedanta.co.in), a centralised database, a 24x7 whistle- blower hotline and a web-based portal (www.vedanta. ethicspoint.com) have been created and implemented to facilitate receipt and redressal of complaints.
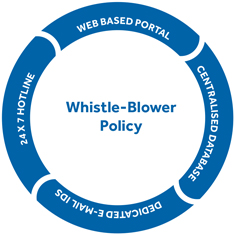
VEDANTA LIMITED | INTEGRATED REPORT AND ANNUAL ACCOUNTS 2020-21 | 257
REPORT ON CORPORATE GOVERNANCE CONTINUED...
Disclosure in relation to the Sexual Harassment of Women at workplace (Prevention, Prohibition and Redressal) Act, 2013
The detailed disclosure forms part of the Directors’ Report.
COMPLIANCES
Discretionary Requirements
| As on March 31, 2021, the Board of the Company is chaired by a Non- Executive Director who maintains the Chairman’s office at the Company’s expense. | Quaterly financial Results were sent to the shareholders whose e-mail Id was registered with the Company. | During the year under review, the Independent Auditors have issued an unmodified opinion on true and fair view of the Company’s financial statements. | The same is reported by briefing the Audit & Risk Management Committee through discussion and presentation of the observations, review, comments and recommendations, amongst others in the Internal Audit presentation by the Company’s Internal Auditor. | The Company has made necessary disclosures in compliance with NYSE Listing Standards and Listed Company Manual and the same have been filed with NYSE and available on Company’s website at www.vedantalimited.com |
Corporate Governance requirements specified in Regulation 17 to 27 and Regulation 46 of Listing Regulations
Your Company has complied with all the mandatory corporate governance requirements under the Listing Regulations. Specifically, your Company confirms compliance with corporate governance requirement specified in Regulation 17 to 27 and clauses (b) to (i) and (t) of Sub-Regulation (2) of Regulation 46 of the Listing Regulations.
Corporate Policies of the Company
Your Company is inclined towards following highest levels of ethical standards in all our business transactions. To ensure the same, the Company has adopted various policies, codes and practices. The policies are reviewed periodically by the Board and are updated in line with amended laws and requirements. The key policies adopted are detailed below:
Category of Policy / Code | Brief summary | Web link | Amendments during FY 2020-21 | |||
| Code of Business Conduct and Ethics | The Code details on uncompromising business ethics which is an integral part of Company’s values and method of conducting business. It’s based on the core values of Trust, Entrepreneurship, Innovation, Excellence, Integrity, Respect and Care.
The Whistle-Blower Policy also forms part of the Code.
The Code also covers areas such as Conflict of Interest, Gift, Competition and Fair dealings, Protection and use of Company Assets etc. | www.vedantalimited.com/ CorporateGovernance | There has been no change in the Code | |||
| Corporate Social Responsibility Policy | The policy ensures that the conduct of Company’s business impacts the society through major thrust areas of education, women empowerment, sport & culture, drinking water & sanitation, agriculture & animal husbandry, community infrastructure, health care and disaster management and rescue and relief operations. | www.vedantalimited.com/ CorporateGovernance | The policy was amended on May 13. 2021 | |||
| Nomination & Remuneration Policy | The policy details the guidelines on identification and appointment of individual as a Director, KMP and Senior Management Personnel including the criterial on their qualification and independence, manner and criteria for effective evaluation of the performance. The Policy also details the compensation principles responsibilities of senior management and succession planning. | www.vedantalimited.com/ CorporateGovernance | There has been no change in the policy | |||
258
| < BACK TO CONTENTS | Integrated Report | Statutory reports | Financial statements |
Category of Policy / Code | Brief summary | Web link | Amendments during FY 2020-21 | |||
| Insider Trading Prohibition Code | The Code lays down the guideline to regulate, monitor and report trading in securities of the Company, Policy & Procedures for inquiry in case of leak of Unpublished Price Sensitive Information and Code of Practices and Procedures for Fair Disclosure & Policy for determination of Legitimate Purpose. | www.vedantalimited.com/ CorporateGovernance | The Code was amended on November 06, 2020 | |||
| Dividend Distribution Policy | The policy details guidelines for dividend distribution for equity shareholders as per the requirements of the Listing Regulations. | www.vedantalimited.com/ CorporateGovernance | There has been no change in the policy | |||
| Related Party Transaction Policy | This Policy sets out the philosophy and processes that is to be followed for approval and review in respect of transactions entered into by the Company with the identified Related Parties. | www.vedantalimited.com/ CorporateGovernance | The Policy was amended on March 31, 2021 | |||
| Determining Material Subsidiary Policy | The policy determines the guidelines for material subsidiaries of the Company and also provides the governance framework for such material subsidiaries. | www.vedantalimited.com/ CorporateGovernance | There has been no change in the policy | |||
| Policy for determination of Materiality for Fair Disclosure of | The policy determines the requirements for disclosing material events including deemed material events for the Company and its subsidiary companies which are in nature of unpublished price sensitive information. | www.vedantalimited.com/ CorporateGovernance | There has been no change in the policy | |||
| Material Events / Unpublished Price Sensitive Information to Stock Exchange(s) and Archival Policy | The policy also lays the guidelines on archival and retention of records of the Company. | |||||
| Policy on Prevention, Prohibition and Redressal of Sexual Harassment at Workplace | The purpose to this policy is to create and maintain a healthy and conducive work environment, free of discrimination. This includes discrimination on any basis, including gender and any form of sexual harassment. | www.vedantalimited.com/ CorporateGovernance | There has been no change in the policy | |||
Awareness Sessions/ Workshops on Governance practices
Vedanta as an organisation strongly supports transparency and openness and believes in zero tolerance for unethical practices. Employees across the Company as well as the group are regularly sensitised about the various policies and governance practices of the Company through various interactive tools.
VEDANTA LIMITED | INTEGRATED REPORT AND ANNUAL ACCOUNTS 2020-21 | 259
REPORT ON CORPORATE GOVERNANCE CONTINUED...
• Company has a robust mechanism in place to prevent insider trading.
• As a step towards digitisation, a web-based portal has been launched for designated employees to enable them to manage and report dealings in securities of the Company and ensure compliance with the Insider Trading Prohibition Code
• Employees are sensitised through various knowledge sharing emails/ updates on a regular basis in order to monitor and prevent any non-compliance.
• Continuing the spirit and reinforcing the vision of “Zero Harm, Zero Waste and Zero Discharge” your Company launched an e-Learning CHESS (Consolidated Health, Environment, Safety and Sustainability) Module aiming at familiarisation of employees and business partners to different aspects of the HSE&S function.
• It is mandatory for all the executives to undertake the module and impart learnings in day to day business. | • The employees can neither accept nor send gifts/ entertainment in exchange of any business/ services/ giving off any confidential information etc. to derive any benefit conflicting with the interest of the Company.
• The Company has in place an online gift declaration portal wherein the employees are required to promptly declare the gifts received by them in compliance with the Gift Policy of the Company forming part of the Code of Business Conduct and Ethics.
• Reinforcing the principles under the Code of Business Conduct and Ethics, the Company has in place an automated training module for mandatory annual training for all employees across the group.
• Further, in order to ensure compliance with the Code of Business Conduct and Ethics (“Code”) of the Company by all the employees, online affirmations w.r.t. compliance with the Code are also taken on an annual basis. | • In order to ensure best in class compliance monitoring and reporting, Company has in place an internal standard operating procedure to manage statutory compliances across all businesses and a top of the line automated compliance management system with regular updates on checklists of all applicable statutory requirements.
• As a best practice, it is mandatory for all CEOs to issue and sign-off on the compliance certificates for their respective businesses for placing it before the Audit & Risk Management Committee and Board.
• Your Company launched its first Climate Change Report in lines with the Taskforce on Climate-related Financial Disclosures (TCFD).
• The report is in alignment with guidelines issued by the Financial Stability Board (FSB) and document’s Vedanta journey to substantially decarbonise its business by 2050.
• The report can be accessed at www.vedantalimited.com |
• Awareness Video Clips - With a firm beleif in zero tolerane for unethical practices, your Company sensitises employees about various unethical practices including POSH, conflict of interest, anti-bribery, corruption etc. through short video clips to make the workplace a better place each day.
• Ethics Quiz - In order to assess the awareness and understanding of awareness principles of employees, a quiz is also conducted on yearly basis.
• Ethics Compliance Month - As part of its special annual initiatives, your Company conducts Compliance Month wherein it conducts awareness and training sessions covering on governance and internal policies such as prevention of insider trading, prevention of sexual harassment, anti-bribery and anti-corruption, anti-trust laws etc. | • Strengthening one of the core value, the Company is promoting and developing innovation culture strategically among the employees including business partners.
• Vedanta 360 - Innovation portal is developed as unique platform to capture all the thoughts across the organisation. People are encouraged to showcase their innovation thoughts, innovative succes stories and they may also seek innovative solutions to the business challenges. This portal has end to end integration from idea to Reward in near future.
• Vedanta Innovation Cafe - a place at workplace are established across the operations to provide conclucive environment to think across business aspects and come out with Innovation ideas.
• Top ideas and success stories are published in Weekly Innovation Wrap across the Company to keep the momentum high and recognise the team efforts across the Group. |
260
| < BACK TO CONTENTS | Integrated Report | Statutory reports | Financial statements |
DECLARATIONS & CERTIFICATIONS
Declaration by CEO on Code of Business Conduct & Ethics
A Declaration by the CEO of the Company, stating that the members of Board of Directors and Senior Management Personnel have affirmed compliance with the Code of Business Conduct and Ethics of the Company in enclosed as Annexure I to this Report.
Compliance Certificate
The Compliance Certificate from the CEO of the Company pursuant to Regulation 17(8) of the Listing Regulations is enclosed as Annexure II to this Report.
Certificate from Company Secretary in Practice
A certificate from Chandrasekaran Associates, Company Secretary in Practice certifying that none of the directors on the Board of the Company have been debarred or disqualified from being appointed or continuing as directors of companies by SEBI / Ministry of Corporate Affairs or any such statutory authority pursuant to Regulation 34(3) and Schedule V Para C clause (10)(i) of the Listing Regulations is enclosed as Annexure III to this Report.
Auditor’s Certificate on Corporate Governance
The auditor’s certificate regarding compliance of conditions of corporate governance pursuant to Listing Regulations is enclosed as Annexure IV to this Report.
Annexure I
Declaration by Chief Executive Officer on Code of Business Conduct and Ethics of the Company
In accordance with the provisions of Securities and Exchange Board of India (Listing Obligations and Disclosure Requirements) Regulations, 2015, I, Sunil Duggal, Whole-Time Director & Chief Executive Officer of Vedanta Limited, hereby declare that all members of the Board and Senior Management Personnel have affirmed compliance with the Code of Business Conduct and Ethics of the Company for FY 2020-21.
| For Vedanta Limited | ||||||
| Sunil Duggal | ||||||
| Date: May 13, 2021 | Whole-Time Director & | |||||
| Chief Executive Officer | ||||||
VEDANTA LIMITED | INTEGRATED REPORT AND ANNUAL ACCOUNTS 2020-21 | 261
REPORT ON CORPORATE GOVERNANCE CONTINUED...
Annexure II
CERTIFICATION
I, Sunil Duggal, Chief Executive Officer, certify that:
| A. | I have reviewed financial statements and the cash flow statement for the year and that to the best of my knowledge and belief: |
| (1) | These statements do not contain any materially untrue statement or omit any material fact or contain statements that might be misleading; |
| (2) | These statements together present a true and fair view of the Company’s affairs and are in compliance with existing accounting standards, applicable laws and regulations. |
| B. | There are, to the best of my knowledge and belief, no transactions entered into by the Company during the year, which are fraudulent, illegal or violative of the Company’s code of conduct. |
| C. | I accept responsibility for establishing and maintaining internal controls for financial reporting. I have evaluated the effectiveness of internal control systems of the Company pertaining to financial reporting, and I have disclosed to the auditors and the Audit Committee, where applicable, deficiencies in the design or operation of such internal controls of which I am aware and the steps I have taken or propose to take to rectify these deficiencies. |
| D. | I have indicated to the Auditors and the Audit Committee, where applicable, |
| (1) | significant changes in internal control over financial reporting during the year; |
| (2) | significant changes in accounting policies during the year and that the same have been disclosed in the notes to the financial statements; and |
| (3) | instances of significant fraud of which I have become aware and the involvement therein, if any, of the management or an employee having a significant role in the Company’s internal control system over financial reporting. |
Sunil Duggal
Chief Executive Officer
DIN: 07291685
Date: May 13, 2021
262
| < BACK TO CONTENTS | Integrated Report | Statutory reports | Financial statements |
Annexure III
CERTIFICATE OF NON-DISQUALIFICATION OF DIRECTORS
(Pursuant to Regulation 34(3) and Schedule V Para C clause (10)(i) of the SEBI (Listing Obligations and Disclosure Requirements) Regulations, 2015)
To,
The Members
Vedanta Limited
1st Floor, C wing, Unit 103,
Corporate Avenue, Atul Projects,
Chakala, Andheri (East), Mumbai – 400 093,
Maharashtra
We have examined the relevant registers, records, forms, returns and disclosures received from the Directors of Vedanta Limited and having CIN L13209MH1965PLC291394 and having Registered office at 1st Floor, C wing, Unit 103, Corporate Avenue, Atul Projects, Chakala, Andheri (East), Mumbai – 400 093, Maharashtra (hereinafter referred to as ‘the Company’), produced before us by the Company for the purpose of issuing this Certificate, in accordance with Regulation 34(3) read with Schedule V Para-C Sub-clause 10(i) of the Securities and Exchange Board of India (Listing Obligations and Disclosure Requirements) Regulations, 2015.
In our opinion and to the best of our information and according to the verifications (including Directors Identification Number (DIN) status at the portal www.mca.gov.in) as considered necessary and explanations furnished to us by the Company & its officers, We hereby certify that none of the Directors on the Board of the Company as stated below for the Financial Year ending on March 31, 2021 have been debarred or disqualified from being appointed or continuing as Directors of companies by the Securities and Exchange Board of India, Ministry of Corporate Affairs or any such other Statutory Authority:
Sr. | Name of director | DIN | Date of appointment in | |||
| 1. | Anil Kumar Agarwal | 00010883 | 01.04.2020 | |||
| 2. | Navin Agarwal | 00006303 | 17.08.2013 | |||
| 3. | Guggilam Rajagopalan Arun Kumar | 01874769 | 22.11.2016 | |||
| 4. | Mahendra Kumar Sharma | 00327684 | 01.06.2019 | |||
| 5. | Krishnamurti Venkataramanan | 00001647 | 01.04.2017 | |||
| 6. | Upendra Kumar Sinha | 00010336 | 13.03.2018 | |||
| 7. | Priya Agarwal | 05162177 | 17.05.2017 | |||
| 8. | Padmini Somani | 00046486 | 05.02.2021 |
| * | Original date of appointment |
Ensuring the eligibility of for the appointment / continuity of every Director on the Board is the responsibility of the management of the Company. Our responsibility is to express an opinion on these based on our verification. This certificate is neither an assurance as to the future viability of the Company nor of the efficiency or effectiveness with which the management has conducted the affairs of the Company.
For Chandrasekaran Associates
Company Secretaries
Dr. S Chandrasekaran
Senior Partner
Membership No. FCS No.: 1644
Certificate of Practice No.: 715
UDIN: F001644C000253225
Date: May 7, 2021
Place: New Delhi
| i. | Due to restricted movement amid COVID-19 pandemic, we have verified the disclosures and declarations received by way of electronic mode from the Company and could not be verified from the original records. The management has confirmed that the records submitted to us are the true and correct. |
VEDANTA LIMITED | INTEGRATED REPORT AND ANNUAL ACCOUNTS 2020-21 | 263
REPORT ON CORPORATE GOVERNANCE CONTINUED...
Annexure IV
Independent Auditor’s Report on compliance with the conditions of Corporate Governance as per provisions of Chapter IV of Securities and Exchange Board of India (Listing Obligations and Disclosure Requirements) Regulations, 2015, as amended
The Members of Vedanta Limited
1st Floor, ‘C’ Wing
Unit 103, Corporate Avenue, Atul Projects
Chakala, Andheri (E), Mumbai
| 1. | The Corporate Governance Report prepared by Vedanta Limited (hereinafter the “Company”), contains details as specified in regulations 17 to 27, clauses (b) to (i) and (t) of sub-regulation (2) of regulation 46 and para C, D, and E of Schedule V of the Securities and Exchange Board of India (Listing Obligations and Disclosure Requirements) Regulations, 2015, as amended (“the Listing Regulations”) (‘Applicable criteria’) for the year ended March 31, 2021 as required by the Company for annual submission to the Stock exchange. |
Management’s Responsibility
| 2. | The preparation of the Corporate Governance Report is the responsibility of the Management of the Company including the preparation and maintenance of all relevant supporting records and documents. This responsibility also includes the design, implementation and maintenance of internal control relevant to the preparation and presentation of the Corporate Governance Report. |
| 3. | The Management along with the Board of Directors are also responsible for ensuring that the Company complies with the conditions of Corporate Governance as stipulated in the Listing Regulations, issued by the Securities and Exchange Board of India. |
Auditor’s Responsibility
| 4. | Pursuant to the requirements of the Listing Regulations, our responsibility is to provide a reasonable assurance in the form of an opinion whether, the Company has complied with the conditions of Corporate Governance as specified in the Listing Regulations. |
| 5. | We conducted our examination of the Corporate Governance Report in accordance with the Guidance Note on Reports or Certificates for Special Purposes and the Guidance Note on Certification of Corporate Governance, both issued by the Institute of Chartered Accountants of India (“ICAI”). The Guidance Note on Reports or Certificates for Special Purposes requires that we comply with the ethical requirements of the Code of Ethics issued by the Institute of Chartered Accountants of India. |
| 6. | We have complied with the relevant applicable requirements of the Standard on Quality Control (SQC) 1, Quality Control for Firms that Perform Audits and Reviews of Historical Financial Information, and Other Assurance and Related Services Engagements. |
| 7. | The procedures selected depend on the auditor’s judgement, including the assessment of the risks associated in compliance of the Corporate Governance Report with the applicable criteria. Summary of procedures performed include: |
| i. | Read and understood the information prepared by the Company and included in its Corporate Governance Report; |
| ii. | Obtained and verified that the composition of the Board of Directors with respect to executive and non- executive directors has been met throughout the reporting period; |
| iii. | Obtained and read the Register of Directors as on March 31, 2021 and verified whether atleast one independent woman director was on the Board of Directors throughout the year; |
| iv. | Obtained and read the minutes of the following committee meetings / other meetings held during April 1, 2020 to March 31, 2021: |
| (a) | Board of Directors; |
| (b) | Audit & Risk Management Committee; |
| (c) | Annual General Meeting (AGM); |
| (d) | Nomination and Remuneration Committee; |
| (e) | Stakeholders Relationship Committee; |
| (f) | Corporate Social Responsibility Committee; |
264
| < BACK TO CONTENTS | Integrated Report | Statutory reports | Financial statements |
| v. | Obtained necessary declarations from the directors of the Company; |
| vi. | Obtained and read the policy adopted by the Company for related party transactions; |
| vii. | Obtained the schedule of related party transactions during the year and balances at the year end. Obtained and read the minutes of the audit committee meeting to verify that all related party transactions have been pre-approved prior by the audit committee; |
| viii. | Performed necessary inquiries with the management and also obtained necessary specific representations from management. |
| 8. | The above-mentioned procedures include examining evidence supporting the particulars in the Corporate |
Governance Report on a test basis. Further, our scope of work under this report did not involve us performing audit tests for the purposes of expressing an opinion on the fairness or accuracy of any of the financial information or the financial statements of the Company taken as a whole.
Basis for Qualified Opinion
| 9. | The Company entered into a transaction for sale of investments aggregating to ₹ 1,407 crores with its subsidiary as part of its treasury operations, for which prior approval from audit committee as stipulated under Regulation 23(2) of the Listing Regulations was not taken. The same was subsequently ratified by the audit committee. |
Qualified Opinion
| 10. | Based on the procedures performed by us, as referred in paragraph 7 above, and according to the information and explanations given to us, except for the matter stated in paragraph 9 above, we are of the opinion that the Company has complied with the conditions of Corporate Governance as specified in the Listing Regulations, as applicable for the year ended March 31, 2021, referred to in paragraph 4 above. |
Other matters and Restriction on Use
| 11. | This report is neither an assurance as to the future viability of the Company nor the efficiency or effectiveness with which the management has conducted the affairs of the Company. |
| 12. | This report is addressed to and provided to the members of the Company solely for the purpose of enabling it to comply with its obligations under the Listing Regulations with reference to compliance with the relevant regulations of Corporate Governance and should not be used by any other person or for any other purpose. Accordingly, we do not accept or assume any liability or any duty of care or for any other purpose or to any other party to whom it is shown or into whose hands it may come without our prior consent in writing. We have no responsibility to update this report for events and circumstances occurring after the date of this report. |
For S.R. Batliboi & Co. LLP
Chartered Accountants ICAI Firm
Registration Number: 301003E/E300005
______________________________
per Sudhir Soni
Partner
Membership Number: 41870
UDIN: 21041870AAAAAR7718
Place of Signature: Mumbai
Date: May 13, 2021
VEDANTA LIMITED | INTEGRATED REPORT AND ANNUAL ACCOUNTS 2020-21 | 265
STANDALONE
Independent Auditor’s Report
To the Members of Vedanta Limited
REPORT ON THE AUDIT OF THE STANDALONE IND AS FINANCIAL STATEMENTS
OPINION
We have audited the accompanying standalone Ind AS financial statements of Vedanta Limited (“the Company”), which comprise the Balance sheet as at March 31, 2021, the Statement of Profit and Loss, including the statement of Other Comprehensive Income, the Cash Flow Statement and the Statement of Changes in Equity for the year then ended, and notes to the standalone Ind AS financial statements, including a summary of significant accounting policies and other explanatory information In our opinion and to the best of our information and according to the explanations given to us, the aforesaid standalone Ind AS financial statements give the information required by the Companies Act, 2013, as amended (“the Act”) in the manner so required and give a true and fair view in conformity with the accounting principles generally accepted in India, of the state of affairs of the Company as at March 31, 2021, its profit including other comprehensive income, its cash flows and the changes in equity for the year ended on that date.
BASIS FOR OPINION
We conducted our audit of the standalone Ind AS financial statements in accordance with the Standards on Auditing (SAs), as specified under section 143(10) of the Act. Our responsibilities under those Standards are further described in the ‘Auditor’s Responsibilities for the Audit of the Standalone Ind AS Financial Statements’ section of our report. We are independent of the Company in accordance with the ‘Code of Ethics’ issued by the
Institute of Chartered Accountants of India together with the ethical requirements that are relevant to our audit of the financial statements under the provisions of the Act and the Rules thereunder, and we have fulfilled our other ethical responsibilities in accordance with these requirements and the Code of Ethics. We believe that the audit evidence we have obtained is sufficient and appropriate to provide a basis for our audit opinion on the standalone Ind AS financial statements.
EMPHASIS OF MATTER
We draw attention to note 3(c)(A)(viii) of the accompanying standalone financial results which describes the uncertainty arising out of the demands that have been raised on the Company, with respect to government’s share of profit oil by the Director General of Hydrocarbons and one of the pre-conditions for the extension of the Production Sharing Contract (PSC) for the Rajasthan oil block is the settlement of these demands. While the Government has granted permission to the Company to continue operations in the block till July 31, 2021 or signing of the PSC addendum, whichever is earlier, the Company, based on external legal advice, believes it is in compliance with the necessary conditions to secure an extension of this PSC and that the demands are untenable and hence no provision is required in respect of these demands. Our opinion is not modified in respect of this matter.
KEY AUDIT MATTERS
Key audit matters are those matters that, in our professional judgment, were of most significance in our audit of the standalone Ind AS financial statements for the financial year ended March 31, 2021. These matters were addressed in the context of our audit of the standalone Ind AS financial statements as a whole, and in forming our opinion thereon, and we do not provide a separate opinion on these matters. For each matter below, our description of how our audit addressed the matter is provided in that context.
We have determined the matters described below to be the key audit matters to be communicated in our report. We have fulfilled the responsibilities described in the Auditor’s responsibilities for the audit of the standalone Ind AS financial statements section of our report, including in relation to these matters. Accordingly, our audit included the performance of procedures designed to respond to our assessment of the risks of material misstatement of the standalone Ind AS financial statements. The results of our audit procedures, including the procedures performed to address the matters below, provide the basis for our audit opinion on the accompanying standalone Ind AS financial statements.
266
| < BACK TO CONTENTS | Integrated Report | Statutory reports | Financial statements |
| Key audit matters | How our audit addressed the key audit matter | |
| Recoverability of carrying value of property plant and equipment at Tuticorin (as described in note 3(c)(A)(vii) of the standalone Ind AS financial statements) | ||
As at March 31, 2021, the Company had significant amounts of property, plant and equipment, capital work in progress, exploration intangible assets under development and investments being carried at cost. We focused our efforts on the Cash Generating Unit (“CGU”) at Tuticorin within the copper segment; as it had impairment indicators and had a total carrying value of ₹ 2,144 crore. Recoverability of property plant and equipment has been identified as a key audit matter due to:
• The significance of the carrying value of assets being assessed.
• The withdrawal of the Company’s licenses to operate the copper plant.
• The fact that the assessment of the recoverable amount of the Company’s CGUs and investments involves significant judgements about the future cash flow forecasts, start date of the plant and the discount rate that is applied.
The key judgements and estimates centered on the likely outcome of the litigations, cash flow forecasts and discount rate assumptions | Our audit procedures included the following:-
• Assessed through an analysis of internal and external factors impacting the Company, whether there were any indicators of impairment in line with Ind AS 36.
• Specifically, in relation to the CGU where impairment indicators were identified, obtained and evaluated the valuation models used to determine the recoverable amount by assessing the key assumptions used by the management including:
• Assessed the basis for estimating the forecasted volumes and the expected start date of the plant.
• Tested the weighted average cost of capital used for discounting the cash flows to their present value.
• Tested the valuation models for arithmetical accuracy.
• Engaged valuation experts to assist in performance of the above procedures.
• Assessed the implications of withdrawal of Company’s license to operate the copper plant including sensitivities of key assumptions. Also, read the court judgments in respect of the case and external legal opinions in respect of the merits of the appeal filed by the Company and assessed management’s position through discussions with the legal counsel to determine the basis of their conclusion.
• Assessed the competence and objectivity of the experts engaged by us.
• Assessed the disclosures made by the Company in this regard. | |
| Evaluation of Going Concern assumption of accounting (as described in note 3(c)(A)(xi) and 3(c)(A)(viii) of the standalone Ind AS financial statements) | ||
| The standalone financial statements of the Company are prepared on the going concern basis of accounting. The evaluation of the appropriateness of adoption of going concern assumption for preparation of these standalone financial statements has been performed by the management of the Company because of uncertainties in the market conditions including future economic outlook on account of the prevailing global pandemic COVID-19 and the uncertainty around the extension of the Production Sharing Contract (PSC) of the Rajasthan oil and gas block. The Company has prepared a cash flow forecast for next eighteen months from year end which involves judgement and estimation of key variables. The above has been considered as a key audit matter as auditing the Company’s going concern assessment as described above is complex and involves a high degree of judgment to assess the reasonableness of the cash flow forecasts, planned refinancing actions and other assumptions used in the Company’s going concern analysis. | Our procedures in relation to evaluation of going concern included the following:
• Obtained an understanding of the process followed by the management and tested the internal controls over the liquidity assessment, compliance with the debt covenants and preparation of the cash flow forecast, and validation of the assumptions and inputs used in the model to estimate the future cash flows.
• Tested the inputs and assumptions used by the management in the cash flow forecast against historical performance, budgets, economic and industry indicators, publicly available information, the Company’s strategic plans and benchmarking of key market related conditions.
• Assessed key assumptions including those pertaining to revenue and the timing of significant payments in the cash flow forecast for the following eighteen months.
• Tested management’s sensitivity analysis on key assumptions like input prices, discount rate and selling prices to determine their impact on the projections of future cash flows also on any possible cash outgo for securing the extension of the Rajasthan oil and gas block.
• Compared the details of the Company’s long-term credit facilities to the supporting documentation.
• Assessed the relationship between the parent company and the Company, including inspection of various financings agreements to examine whether the same were impacted by the affairs of the parent company. Additionally, we assessed whether there are any pre-existing arrangements between the parent and the Company to alleviate the financial difficulties of the parent.
• Assessed the disclosures made by the Company in this regard. | |
VEDANTA LIMITED | INTEGRATED REPORT AND ANNUAL ACCOUNTS 2020-21 | 267
STANDALONE CONTINUED...
| Key audit matters | How our audit addressed the key audit matter | |
| Recoverability of disputed trade receivables in power segment (as described in note 3(c)(B)(ii) and note 7 of the standalone Ind AS financial statements) | ||
As of March 31, 2021 the value of disputed receivables in the power segment aggregated to ₹ 1,323 crore.
Due to disagreements over the quantification or timing of the receivable, the recovery of receivables from GRIDCO, a customer in the power segment, are subject to increased risk. Some of these balances are also subject to litigation. These receivables include long outstanding balances as well and are also subject to counter party credit risk and hence considered as a key audit matter. | Our audit procedures included the following:-
• Examined the underlying power purchase agreements.
• Examined the relevant state regulatory commission, appellate tribunal and court rulings.
• Examined external legal opinions in respect of the merits of the case and assessed management’s position through discussions with the management’s in-house legal team to determine the basis of their conclusion.
• Examined management’s assessment of recoverability of receivables.
• Sought independent external lawyer confirmation from Legal Counsel representing the Company in these cases.
• Assessed the competence and objectivity of the Company’s experts.
• Assessed the disclosures made by the Company in this regard. | |
| Accounting and disclosure of transactions with the parent company and its affiliates (as described in note 37 of the standalone Ind AS financial statements) | ||
The Company has undertaken transactions with Vedanta Resources Limited (‘VRL’), its parent company and its affiliates pertaining to payment of brand and management fee; and obtaining guarantees and payment of commission in consideration thereof.
Accounting and disclosure of such related party transactions has been identified as a key audit matter due to:
• Significance of such related party transactions;
• Risk of such transactions being executed without proper authorizations;
• Risk of material information relating to such transactions not getting disclosed in the financial statements. | Our procedures included the following:
• Obtained and read the Company’s policies, processes and procedures in respect of identification of such related parties, obtaining approval, recording and disclosure of related party transactions.
• Tested such related party transactions and balances with the underlying contracts, confirmation letters and other supporting documents.
• Held discussions and obtained representations from the management in relation to such transactions.
• Examined the approvals of the board and/or audit committee for entering into these transactions.
• Read the disclosures made in this regard in the financial statements to assess whether the relevant and material information have been disclosed. | |
| Claims and exposures relating to taxation and litigation (as described in note 3(c)(A)(viii), 3(c)(B)(i), 36(D), 42 of the standalone Ind AS financial statements) | ||
| The Company is subject to a large number of tax and legal disputes, including objections raised by auditors appointed by the Director General Hydrocarbons in the oil and gas segment, which have been disclosed / provided for in the financial statements based on the facts and circumstances of each case. Taxation and litigation exposures have been identified as a key audit matter due to the complexities involved in these matters, timescales involved for resolution and the potential financial impact of these on the financial statements. Further, significant management judgement is involved in assessing the exposure of each case and thus a higher risk involved on adequacy of provision or disclosure of such cases. | Our audit procedures included the following: -
• Obtained an understanding of the process of identification of claims, litigations and contingent liabilities and identified key controls in the process. For selected controls we have performed tests of controls.
• Obtained the summary of Company’s legal and tax cases and assessed management’s position through discussions with the Legal Counsel, Head of Tax and operational management, on both the probability of success in significant cases, and the magnitude of any potential loss.
• Examined external legal opinions (where considered necessary) and other evidence to corroborate management’s assessment of the legal claims.
• Assessed the competence and objectivity of the Company’s experts.
• Engaged tax specialists to technically appraise the tax positions taken by management with respect to local tax issues.
• Assessed whether management assessment of similar cases is con sistent across the divisions and obtained management’s explanations for differences, if any.
• Assessed the relevant disclosures made within the financial statements to address whether they reflect the facts and circumstances of the respective tax and legal exposures and the requirements of relevant accounting standards. | |
268
| < BACK TO CONTENTS | Integrated Report | Statutory reports | Financial statements |
| Key audit matters | How our audit addressed the key audit matter | |
| Recoverability of unutilized Minimum Alternate Tax (MAT) credits included under deferred tax assets (as described in note 3(c) (A)(vi) and note 33 of the standalone Ind AS financial statements) | ||
| Deferred tax assets as at March 31, 2021 includes MAT | Our audit procedures included the following:- | |
| credits of ₹3,701 crore relating to the Company which is available for utilization against future tax liabilities. Out of the same, ₹340 crore is expected to be utilized in the fourteenth year, fifteen years being the maximum permissible time period to utilize the same. | • Obtained an understanding of the management’s process for estimating the recoverability of deferred tax assets and identified key controls in the process. For selected controls we have performed tests of controls. | |
The analysis of the recoverability of deferred tax assets has been identified as a key audit matter because the assessment process involves judgement regarding the future profitability and the likelihood of the realization of these assets, in particular whether there will be taxable profits in future periods that support the recognition of these assets. This requires assumptions regarding future profitability, which is inherently uncertain. | • Obtained and analysed the future projections of taxable profits estimated by management, assessed key assumptions used, including the analysis of the consistency of the actual results obtained by the various segments with those projected in the previous year. We further obtained evidence of the approval of the budgeted results included in the current year’s projections and the future cash flow projections. | |
• Tested the computation of MAT credits recognized as deferred tax assets. | ||
• Assessed the disclosures made by the management in this regard. | ||
We have determined that there are no other key audit matters to communicate in our report.
INFORMATION OTHER THAN THE FINANCIAL STATEMENTS AND AUDITOR’S REPORT THEREON
The Company’s Board of Directors is responsible for the other information. The other information comprises the information included in the Annual report, but does not include the standalone financial statements and our auditor’s report thereon.
Our opinion on the standalone financial statements does not cover the other information and we do not express any form of assurance conclusion thereon.
In connection with our audit of the standalone financial statements, our responsibility is to read the other information and, in doing so, consider whether such other information is materially inconsistent with the financial statements or our knowledge obtained in the audit or otherwise appears to be materially misstated. If, based on the work we have performed, we conclude that there is a material misstatement of this other information, we are required to report that fact. We have nothing to report in this regard.
RESPONSIBILITIES OF MANAGEMENT AND THOSE CHARGED WITH GOVERNANCE FOR THE STANDALONE IND AS FINANCIAL STATEMENTS
The Company’s Board of Directors is responsible for the matters stated in section 134(5) of the Act with respect to the preparation of these standalone Ind AS financial statements that give a true and fair view of the financial position, financial performance including other comprehensive income, cash flows and changes in equity of the Company in accordance with the accounting principles generally accepted in India, including the Indian Accounting Standards (Ind AS) specified under section 133 of the Act read with the Companies (Indian Accounting Standards) Rules, 2015, as amended. This responsibility also includes maintenance
of adequate accounting records in accordance with the provisions of the Act for safeguarding of the assets of the Company and for preventing and detecting frauds and other irregularities; selection and application of appropriate accounting policies; making judgments and estimates that are reasonable and prudent; and the design, implementation and maintenance of adequate internal financial controls, that were operating effectively for ensuring the accuracy and completeness of the accounting records, relevant to the preparation and presentation of the standalone Ind AS financial statements that give a true and fair view and are free from material misstatement, whether due to fraud or error. In preparing the standalone Ind AS financial statements, management is responsible for assessing the Company’s ability to continue as a going concern, disclosing, as applicable, matters related to going concern and using the going concern basis of accounting unless management either intends to liquidate the Company or to cease operations, or has no realistic alternative but to do so.
Those charged with governance are also responsible for overseeing the Company’s financial reporting process.
AUDITOR’S RESPONSIBILITIES FOR THE AUDIT OF THE STANDALONE IND AS FINANCIAL STATEMENTS
Our objectives are to obtain reasonable assurance about whether the standalone Ind AS financial statements as a whole are free from material misstatement, whether due to fraud or error, and to issue an auditor’s report that includes our opinion. Reasonable assurance is a high level of assurance, but is not a guarantee that an audit conducted in accordance with SAs will always detect a material misstatement when it exists. Misstatements can arise from fraud or error and are considered material if, individually or in the aggregate, they could reasonably be expected to influence the economic decisions of users taken on the basis of these standalone Ind AS financial statements.
VEDANTA LIMITED | INTEGRATED REPORT AND ANNUAL ACCOUNTS 2020-21 | 269
STANDALONE CONTINUED...
As part of an audit in accordance with SAs, we exercise professional judgment and maintain professional skepticism throughout the audit. We also:
| • | Identify and assess the risks of material misstatement of the standalone Ind AS financial statements, whether due to fraud or error, design and perform audit procedures responsive to those risks, and obtain audit evidence that is sufficient and appropriate to provide a basis for our opinion. The risk of not detecting a material misstatement resulting from fraud is higher than for one resulting from error, as fraud may involve collusion, forgery, intentional omissions, misrepresentations, or the override of internal control. |
| • | Obtain an understanding of internal control relevant to the audit in order to design audit procedures that are appropriate in the circumstances. Under section 143(3) (i) of the Act, we are also responsible for expressing our opinion on whether the Company has adequate internal financial controls with reference to financial statements in place and the operating effectiveness of such controls. |
| • | Evaluate the appropriateness of accounting policies used and the reasonableness of accounting estimates and related disclosures made by management. |
| • | Conclude on the appropriateness of management’s use of the going concern basis of accounting and, based on the audit evidence obtained, whether a material uncertainty exists related to events or conditions that may cast significant doubt on the Company’s ability to continue as a going concern. If we conclude that a material uncertainty exists, we are required to draw attention in our auditor’s report to the related disclosures in the financial statements or, if such disclosures are inadequate, to modify our opinion. Our conclusions are based on the audit evidence obtained up to the date of our auditor’s report. However, future events or conditions may cause the Company to cease to continue as a going concern. |
| • | Evaluate the overall presentation, structure and content of the standalone Ind AS financial statements, including the disclosures, and whether the standalone Ind AS financial statements represent the underlying transactions and events in a manner that achieves fair presentation. |
We communicate with those charged with governance regarding, among other matters, the planned scope and timing of the audit and significant audit findings, including any significant deficiencies in internal control that we identify during our audit.
We also provide those charged with governance with a statement that we have complied with relevant ethical requirements regarding independence, and to communicate with them all relationships and other matters that may reasonably be thought to bear on our independence, and where applicable, related safeguards.
From the matters communicated with those charged with governance, we determine those matters that were of
most significance in the audit of the standalone Ind AS financial statements for the financial year ended March 31, 2021 and are therefore the key audit matters. We describe these matters in our auditor’s report unless law or regulation precludes public disclosure about the matter or when, in extremely rare circumstances, we determine that a matter should not be communicated in our report because the adverse consequences of doing so would reasonably be expected to outweigh the public interest benefits of such communication.
OTHER MATTER
We did not audit the financial statements and other financial information, in respect of an unincorporated joint venture not operated by the Company, whose Ind AS financial statements include total assets of ₹115 crore as at March 31, 2021. The Ind AS financial statements and other financial information of the said unincorporated joint venture not operated by the Company have not been audited and such unaudited financial statements and other unaudited financial information have been furnished to us by the management and our report on the Ind AS financial statements of the Company, in so far as it relates to the amounts and disclosures included in respect of the said unincorporated joint venture, is based solely on such unaudited information furnished to us by the management. In our opinion and according to the information and explanations given to us by the Management, these financial statements and other financial information of joint venture, is not material to the Company. Our opinion is not modified in respect of this matter.
REPORT ON OTHER LEGAL AND REGULATORY REQUIREMENTS
1. As required by the Companies (Auditor’s Report) Order, 2016 (“the Order”), issued by the Central Government of India in terms of sub-section (11) of section 143 of the Act, we give in the “Annexure 1” a statement on the matters specified in paragraphs 3 and 4 of the Order.
2. As required by Section 143(3) of the Act, we report that:
(a) We have sought and obtained all the information and explanations which to the best of our knowledge and belief were necessary for the purposes of our audit;
(b) In our opinion, proper books of accounts as required by law have been kept by the Company so far as it appears from our examination of those books
(c) The Balance Sheet, the Statement of Profit and Loss including the Statement of Other Comprehensive Income, the Cash Flow Statement and Statement of Changes in Equity dealt with by this Report are in agreement with the books of account
(d) In our opinion, the aforesaid standalone Ind AS financial statements comply with the Accounting Standards specified under Section 133 of the Act, read with Companies (Indian Accounting Standards) Rules, 2015, as amended;
270
| < BACK TO CONTENTS | Integrated Report | Statutory reports | Financial statements |
(e) On the basis of the written representations received from the directors as on March 31, 2021 taken on record by the Board of Directors, none of the directors is disqualified as on March 31, 2021 from being appointed as a director in terms of Section 164 (2) of the Act;
(f) The matter described in Qualified opinion paragraph in “Annexure 2” to this report, in our opinion, may have an adverse effect on the functioning of the Company;
(g) With respect to the adequacy of the internal financial controls over financial reporting of the Company with reference to these standalone Ind AS financial statements and the operating effectiveness of such controls, refer to our separate Report in “Annexure 2” to this report;
(h) In our opinion, the managerial remuneration for the year ended March 31, 2021 has been paid/ provided by the Company to its directors in accordance with the provisions of section 197 read with Schedule V to the Act;
(i) With respect to the other matters to be included in the Auditor’s Report in accordance with Rule 11 of the Companies (Audit and Auditors) Rules, 2014, as amended in our opinion and to the best of our information and according to the explanations given to us:
i. The Company has disclosed the impact of pending litigations on its financial position in its standalone Ind AS financial statements – Refer Note 3(c)(A)(viii), 36(D), 42 to the standalone Ind AS financial statements;
ii. The Company did not have any material foreseeable losses in long-term contracts including derivative contracts during the year ended March 31, 2021;
iii. There has been no delay in transferring amounts, required to be transferred, to the Investor Education and Protection Fund by the Company.
For S.R. Batliboi & Co. LLP
Chartered Accountants
ICAI Firm Registration Number: 301003E/E300005
| per Sudhir Soni | ||
| Partner | ||
| Place: Mumbai | Membership Number: 41870 | |
| Date: 13 May 2021 | UDIN: 21041870AAAAAP3965 |
VEDANTA LIMITED | INTEGRATED REPORT AND ANNUAL ACCOUNTS 2020-21 | 271
STANDALONE CONTINUED...
Annexure 1 referred to in paragraph 1 under the heading “Report on Other Legal and Regulatory Requirements” of our report of even date
Re: Vedanta Limited (‘the Company’)
(i) (a)The Company has maintained proper records showing full particulars, including quantitative details and situation of fixed assets.
(b) All fixed assets have not been physically verified by the management during the year but there is a regular programme of verification in our opinion is reasonable having regard to the size of the Company and the nature of its assets except for fixed assets aggregating to ₹ 1,337 crore at Tuticorin plant where due to suspension of operations (refer note 3(c)(A)(vii) of the standalone financial statements), management has been unable to perform physical verification which was due in current year. No material discrepancies were noticed wherever such verification was performed.
(c) According to the information and explanations given by the management and audit procedures performed by us, the title deeds of immovable properties included in fixed assets are held in the name of the Company except for the title deeds of immovable properties in oil and gas blocks, jointly owned with other joint venture partners, which are held in the name of the licensee of the block. The written down value of such immovable properties in the accompanying financial statement aggregates to ₹ 50 Crore. (ii) The management has conducted physical verification of inventories at reasonable intervals during the year except for inventories aggregating of ₹ 284 crore lying at Tuticorin plant which is under suspension (refer note 3(c)(A)(vii) of the standalone financial statements). No material discrepancies were noticed on physical verification of inventories, wherever such verifications were carried out. Inventories lying with third parties have been confirmed by them as at March 31, 2021 and no material discrepancies were noticed in respect of such confirmations.
(iii) (a) The Company has granted loans to 7 companies covered in the register maintained under section 189 of the Act. In our opinion and according to the information and explanations given to us, the terms and conditions of the grant of such loans are not prejudicial to the Company’s interest.
(b) The Company has granted loans that are either re-payable on demand or have a schedule for repayment of interest and principal, to companies covered in the register maintained under section 189 of the Act. We are informed that (a) repayment of loan was received as and when the demands were raised, during the year; and (b) loans which had a schedule for repayment were not due during the current year; and thus, there has been no default on the part of the parties to whom the monies have been lent. The payment of interest has been regular in all cases.
(c) There is no amounts of loans granted to companies listed in the register maintained under section 189 of the Act which are overdue for more than ninety days.
(iv) In our opinion and according to the information and explanations given to us, provisions of sections 185 and 186 of the Act in respect of loans to directors including entities in which they are interested and in respect of loans and advances given, investments made and guarantees given have been complied with by the Company. The Company has not granted any security in terms of sections 185 and 186 of the Act.
(v) In our opinion and according to information and explanations given to us, the Company has not accepted any deposit from the public during the year. In respect of unclaimed deposits, the Company has complied with the provisions of sections 73 to 76 of the Act and the Companies (Acceptance of Deposits) Rules, 2014 (as amended).
(vi) We have broadly reviewed the books of account maintained by the Company pursuant to the rules made by the Central Government for the maintenance of cost records under section 148(1) of the Act, related to the manufacture of goods and generation of electricity, and are of the opinion that prima facie, the specified accounts and records have been made and maintained. We have not, however, made a detailed examination of the same.
(vii) (a) The Company is generally regular in depositing with appropriate authorities undisputed statutory dues including provident fund, employees’ state insurance, income-tax, duty of custom, sales tax, value added tax,goods and service tax, cess and other statutory dues applicable to it, except for in case of payment of electricity duty where there have been significant delays. The provisions relating to excise duty and service tax are not applicable to the Company.
(b) According to the information and explanations given to us and audit procedures performed by us, no undisputed amounts payable in respect of provident fund, employees’ state insurance, income-tax, sales tax, value added tax, duty of custom, goods and service tax, cess and other statutory dues were outstanding, at the year end, for a period of more than six months from the date they became payable. The provisions relating to excise duty and service tax are not applicable to the Company.
(c) According to the records of the Company, the dues of income-tax, sales-tax, service tax, customs duty, excise duty and value added tax on account of any dispute, are as follows:
272
| < BACK TO CONTENTS | Integrated Report | Statutory reports | Financial statements |
| Name of the Statute | Nature of the dues | Platform | Period relates to Which amount | (In ₹ Crores) Amount* | ||||||
Central Excise Act, 1944 | Excise Duty | CESTAT/Supreme court | December 2013 to February 2015 | 49.45 | ||||||
Central Excise Act, 1944 | Excise Duty | Assistant Commissioner | 2013-14 | 0.57 | ||||||
Central Excise Act, 1944 | Excise Duty | CESTAT | 1997-98 to 2012-13, 2014-15, 2016 | 151.56 | ||||||
Central Excise Act, 1944 | Excise Duty | Commissioner | 1997-2013 | 29.78 | ||||||
Central Excise Act, 1944 | Excise Duty | Commissioner Appeals | October 2013 to July 2014, 2015-16 | 0.14 | ||||||
Central Excise Act, 1944 | Excise Duty | High Court | 2000-2006, 2017-18 | 98.29 | ||||||
Central Excise Act, 1944 | Excise Duty | Additional Commissioner | November 07 to July 08 | 0.40 | ||||||
Central Sales Tax 1956 | Sales Tax | Additional Commissioner | 2004-13, FY 2013-14 to FY 2019-20 | 27.95 | ||||||
Central Sales Tax 1956 | Sales Tax | Tribunal | FY 2009-10 | 18.00 | ||||||
Central Sales Tax 1956 | Sales Tax | High Court | 1998-1999, 2009-10, 2010-11, 2012-13, 2016-17 | 28.86 | ||||||
Central Sales Tax 1956 | Sales Tax | Joint Commissioner | FY 2018-19 | 5.47 | ||||||
Custom Act, 1962 | Customs Duty | CESTAT | 2004-05 to 2013-14, 2016-17 to 2017-18 | 239.16 | ||||||
Custom Act, 1962 | Customs Duty | Commissioner Appeals | 2012-13, 2014-15 | 8.86 | ||||||
Custom Act, 1962 | Customs Duty | Commissioner | 2004-05 to 2009-10 and 2013-14 and 2012-13 to 2016-17 and 2019-20 | 23.19 | ||||||
Custom Act, 1962 | Customs Duty | Deputy Commissioner | 2012-13 | 8.00 | ||||||
Custom Act, 1962 | Customs Duty | High Court | 2005-06 to 2006-07 | 14.67 | ||||||
Custom Act, 1962 | Customs Duty | Supreme Court | 1996-97, 2005-10, 2015 | 0.18 | ||||||
Custom Act, 1962 | Customs duty on exports | Assistant Commissioner | FY 2015-16, FY 2017-18, FY 2018-19 | 99 | ||||||
Finance Act,1994 | Service Tax | Assistant Commissioner | FY 2015-2016, FY 2016-2017 | 7.10 | ||||||
Finance Act,1994 | Service Tax | CESTAT | 2004-05 to 2015- 2016 | 222.60 | ||||||
Finance Act,1994 | Service Tax | Joint Commissioner | 2007-13 | 0.33 | ||||||
Finance Act,1994 | Service Tax | Commissioner Appeals | 2010-11, 2012-13 to 2015-16 | 1.85 | ||||||
Finance Act,1994 | Service Tax | Commissioner | 2014-15, 2016-17 and | 5.44 | ||||||
| 2017-18 (Till June 30, 2017) | ||||||||||
Finance Act, 1994 | Service Tax | High Court | 2006-07,2007-08, 2016-17 | 5.83 | ||||||
The Goods and Service tax, 2017 | GST | CESTAT | 2018-19 | 0.18 | ||||||
The Goods and Service tax, 2017 | GST | Additional Commissioner | 2017-18 | 40.19 | ||||||
Income tax Act, 1961 | Additional Income Tax demand | CIT Appeals | 2006-07, 2008-09 to 2013-14 and 2016-17 | 1,454.17 | ||||||
Income tax Act, 1961 | Additional Income Tax demand | High Court | 2006-07 to 2013-14 | 1,943.62 | ||||||
Income tax Act, 1961 | Additional Income Tax demand | Assessing Officer | 1999-00, 2008-09, 2009-10 | 30.35 | ||||||
Income tax Act, 1961 | Additional Income Tax | Income Tax Appellate | 2002-03,2004-05 to 2009-10, | 2,832.82 | ||||||
| demand & penalty | Tribunal | 2011-12, 2013-14, 2014-15 | ||||||||
Income tax Act, 1961 | Witholding Tax demand | Income Tax Appellate | 2006-07 | 18,773.89 | ||||||
| Tribunal | ||||||||||
Sales Tax | Sales Tax | Joint Commissioner | 2014-15 and 2015-16 | 0.41 | ||||||
Sales Tax | Sales Tax | Commissioner | 2007-08 to 2014-15 | 19.52 | ||||||
Sales Tax | Sales Tax | High Court | 1998-99 to 2016-17 | 324.78 | ||||||
Sales Tax | Sales Tax | Additional Commissioner | 2014-15 | 5.64 | ||||||
Sales Tax | Sales Tax | Deputy Commissioner | 2012 to 2015 | 0.11 | ||||||
Sales Tax | Sales Tax | Tribunal | 2008-12 | 1.84 | ||||||
| * | Net of amounts paid under protest/ adjusted against refunds. |
(viii) In our opinion and according to the information and explanations given by the management, the Company has not defaulted in repayment of loans or borrowing to bank or government or dues to debenture holders, based on the revised repayment schedules, for some such loans, which has been drawn after taking effects of the moratorium granted by the banks and availed by the Company, in view of the Covid-19 pandemic. The Company did not have any outstanding dues to financial institutions.
(ix) In our opinion and according to the information and explanations given by the management, the Company has utilized the monies raised by way of debt instruments in the nature of debentures and term loans for the purposes for which they were raised. According to the information and explanations given to us and audit procedures performed by us, the Company has not raised monies by way of initial public offer or further public offer.
VEDANTA LIMITED | INTEGRATED REPORT AND ANNUAL ACCOUNTS 2020-21 | 273
STANDALONE CONTINUED...
(x) Based upon the audit procedures performed for the purpose of reporting the true and fair view of the financial statements and according to the information and explanations given by the management, we report that no fraud by the Company or no material fraud on the Company by the officers and employees of the Company has been noticed or reported during the year.
(xi) According to the information and explanations given by the management and audit procedures performed by us, the managerial remuneration has been paid / provided in accordance with the requisite approvals mandated by the provisions of section 197 read with Schedule V to the Act.
(xii) In our opinion, the Company is not a Nidhi Company. Therefore, the provisions of clause 3(xii) of the Order are not applicable to the Company and hence not commented upon.
(xiii) According to the information and explanations given by the management and audit procedures performed by us, transactions with the related parties are in compliance with sections 177 and 188 of the Act where applicable and the details have been disclosed in the notes to the financial statements, as required by the applicable accounting standards.
(xiv) According to the information and explanations given to us and on an overall examination of the balance sheet, the Company has not made any preferential allotment or private placement of shares or fully or partly convertible debentures during the year under review and hence, reporting requirements under clause 3(xiv) of the Order are not applicable to the Company and hence not commented upon.
(xv) According to the information and explanations given by the management and audit procedures performed by us, the Company has not entered into any non-cash transactions with directors or persons connected with them as referred to in section 192 of the Act.
(xvi) According to the information and explanations given to us and audit procedures performed by us, the provisions of section 45-IA of the Reserve Bank of India Act, 1934 are not applicable to the Company.
For S.R. Batliboi & Co. LLP
Chartered Accountants
ICAI Firm Registration Number: 301003E/E300005
| per Sudhir Soni | ||
| Partner | ||
| Place: Mumbai | Membership Number: 41870 | |
| Date: May 13, 2021 | UDIN: 21041870AAAAAP3965 |
Annexure 2 to the Independent Auditor’s Report of even date on the Ind As standalone financial statements of Vedanta Limited
Report on the Internal Financial Controls under Clause (i) of Sub-section 3 of Section 143 of the Companies Act, 2013 (“the Act”)
We have audited the internal financial controls over financial reporting of Vedanta Limited (“the Company”) as of March 31, 2021 in conjunction with our audit of the standalone Ind AS financial statements of the Company for the year ended on that date.
MANAGEMENT’S RESPONSIBILITY FOR INTERNAL FINANCIAL CONTROLS
The Company’s Management is responsible for establishing and maintaining internal financial controls based on the internal control over financial reporting criteria established by the Company considering the essential components of internal control stated in the Committee of Sponsoring Organisations of the Treadway Commission (2013 Framework) (“COSO 2013 Criteria”). These responsibilities include the design, implementation and maintenance of adequate internal financial controls that were operating effectively for ensuring the orderly and efficient conduct of its business, including adherence to the Company’s policies, the safeguarding of its assets, the prevention and detection of frauds and errors, the accuracy and completeness of the accounting records, and the timely preparation of reliable financial information, as required under the Companies Act, 2013.
AUDITOR’S RESPONSIBILITY
Our responsibility is to express an opinion on the Company’s internal financial controls over financial reporting with reference to these standalone financial statements based on our audit. We conducted our audit in accordance with the Guidance Note on Audit of Internal Financial Controls Over Financial Reporting (the “Guidance Note”) and the Standards on Auditing as specified under section 143(10) of the Companies Act, 2013, to the extent applicable to an audit of internal financial controls and, both issued by the Institute of Chartered Accountants of India. Those Standards and the Guidance Note require that we comply with ethical requirements and plan and perform the audit to obtain reasonable assurance about whether adequate internal financial controls over financial reporting with reference to these standalone financial statements was established and maintained and if such controls operated effectively in all material respects.
Our audit involves performing procedures to obtain audit evidence about the adequacy of the internal financial controls over financial reporting with reference to these standalone financial statements and their operating effectiveness. Our audit of internal financial controls over financial reporting included obtaining an understanding of internal financial controls over financial reporting with reference to these standalone financial statements, assessing the risk that a material weakness exists, and testing and evaluating the design and operating effectiveness of internal control based on the assessed risk. The procedures selected depend on the auditor’s judgement, including the assessment of the risks of material misstatement of the financial statements, whether due to fraud or error.
274
| < BACK TO CONTENTS | Integrated Report | Statutory reports | Financial statements |
We believe that the audit evidence we have obtained is sufficient and appropriate to provide a basis for our qualified audit opinion on the internal financial controls over financial reporting with reference to these standalone financial statements.
MEANING OF INTERNAL FINANCIAL CONTROLS OVER FINANCIAL REPORTING WITH REFERENCE TO STANDALONE FINANCIAL STATEMENTS
A company��s internal financial control over financial reporting with reference to these standalone financial statements is a process designed to provide reasonable assurance regarding the reliability of financial reporting and the preparation of financial statements for external purposes in accordance with generally accepted accounting principles. A company’s internal financial control over financial reporting with reference to these standalone financial statements includes those policies and procedures that (1) pertain to the maintenance of records that, in reasonable detail, accurately and fairly reflect the transactions and dispositions of the assets of the company; (2) provide reasonable assurance that transactions are recorded as necessary to permit preparation of financial statements in accordance with generally accepted accounting principles, and that receipts and expenditures of the company are being made only in accordance with authorisations of management and directors of the company; and (3) provide reasonable assurance regarding prevention or timely detection of unauthorised acquisition, use, or disposition of the company’s assets that could have a material effect on the financial statements.
INHERENT LIMITATIONS OF INTERNAL FINANCIAL CONTROLS OVER FINANCIAL REPORTING WITH REFERENCE TO STANDALONE FINANCIAL STATEMENTS
Because of the inherent limitations of internal financial controls over financial reporting with reference to these standalone financial statements, including the possibility of collusion or improper management override of controls, material misstatements due to error or fraud may occur and not be detected. Also, projections of any evaluation of the internal financial controls over financial reporting with reference to these standalone financial statements to future periods are subject to the risk that the internal financial control over financial reporting with reference to these standalone financial statements may become inadequate because of changes in conditions, or that the degree of compliance with the policies or procedures may deteriorate.
QUALIFIED OPINION
According to the information and explanations given to us and based on our audit, the following material weakness has been identified in the effectiveness of the Company’s internal financial controls over financial reporting as at March 31, 2021:
The Company’s internal controls for benchmarking the terms and authorisation of loans and guarantees between itself or its subsidiaries with controlling shareholders and their affiliates were not effective, which could potentially result in loans being advanced and guarantees being issued in a manner which may impact the recognition, measurement and disclosure of such transactions in the financial statements.
A ‘material weakness’ is a deficiency, or a combination of deficiencies, in internal financial control over financial reporting, such that there is a reasonable possibility that a material misstatement of the company’s annual or interim financial statements will not be prevented or detected on a timely basis.
In our opinion, except for the possible effects of the material weakness described above on the achievement of the objectives of the control criteria, the Company has, in all material respects, adequate internal financial controls over financial reporting with reference to these standalone financial statements and such internal financial controls over financial reporting with reference to these standalone financial statements were operating effectively as at March 31, 2021 based on the internal control over financial reporting criteria established by the Company considering the essential components of internal control stated in COSO 2013 criteria.
EXPLANATORY PARAGRAPH
We also have audited, in accordance with the Standards on Auditing issued by the Institute of Chartered Accountants of India, as specified under Section 143(10) of the Act, the standalone financial statements of the Company, which comprise the Balance Sheet as at March 31, 2021, and the related Statement of Profit and Loss including the statement of Other Comprehensive Income, the Cash Flow Statement and the Statement of Changes in Equity for the year then ended, and notes to the standalone financial statements, including a summary of significant accounting policies and other explanatory information. The above stated material weakness was considered in determining the nature, timing and extent of audit tests applied in our audit of the March 31, 2021 standalone financial statements of the Company and this report does not affect our report of even date, which expressed an unmodified opinion on those standalone financial statements.
For S.R. Batliboi & Co. LLP
Chartered Accountants
ICAI Firm Registration Number: 301003E/E300005
| per Sudhir Soni | ||
| Partner | ||
| Place: Mumbai | Membership Number: 41870 | |
| Date: May 13, 2021 | UDIN: 21041870AAAAAP3965 |
VEDANTA LIMITED | INTEGRATED REPORT AND ANNUAL ACCOUNTS 2020-21 | 275
STANDALONE CONTINUED...
Balance Sheet
as at 31 March 2021
| (₹ in Crore) | ||||||||||||
Particulars | Note | As at 31 March 2021 | As at 31 March 2020 | |||||||||
ASSETS | ||||||||||||
Non-current assets | ||||||||||||
Property, Plant and Equipment | 5 | 38,222 | 37,087 | |||||||||
Capital work-in-progress | 5 | 9,096 | 11,027 | |||||||||
Intangible assets | 5 | 27 | 31 | |||||||||
Exploration intangible assets under development | 5 | 1,605 | 1,059 | |||||||||
Financial assets | ||||||||||||
Investments | 6A | 60,887 | 60,787 | |||||||||
Trade receivables | 7 | 1,323 | 1,346 | |||||||||
Loans | 8 | 180 | 183 | |||||||||
Derivatives | 20 | — | 3 | |||||||||
Others | 9 | 1,258 | 1,673 | |||||||||
Deferred tax assets (net) | 33 | 333 | 3,464 | |||||||||
Income tax assets (net) | 33 | 1,787 | 1,682 | |||||||||
Other non-current assets | 10 | 2,371 | 2,272 | |||||||||
|
|
|
| |||||||||
Total non-current assets | 117,089 | 120,614 | ||||||||||
|
|
|
| |||||||||
Current assets | ||||||||||||
Inventories | 11 | 5,555 | 5,689 | |||||||||
Financial assets | ||||||||||||
Investments | 6B | 2,016 | 2,118 | |||||||||
Trade receivables | 7 | 1,136 | 832 | |||||||||
Cash and cash equivalents | 12 | 2,861 | 1,846 | |||||||||
Other bank balances | 13 | 1,475 | 347 | |||||||||
Loans | 8 | 523 | 1,596 | |||||||||
Derivatives | 20 | 66 | 548 | |||||||||
Others | 9 | 5,071 | 3,826 | |||||||||
Other current assets | 10 | 1,939 | 2,034 | |||||||||
|
|
|
| |||||||||
Total current assets | 20,642 | 18,836 | ||||||||||
|
|
|
| |||||||||
Total Assets | 137,731 | 139,450 | ||||||||||
|
|
|
| |||||||||
EQUITY AND LIABILITIES | ||||||||||||
Equity | ||||||||||||
Equity Share Capital | 14 | 372 | 372 | |||||||||
Other Equity | 15 | 76,418 | 69,523 | |||||||||
|
|
|
| |||||||||
Total Equity | 76,790 | 69,895 | ||||||||||
|
|
|
| |||||||||
Liabilities | ||||||||||||
Non-current liabilities | ||||||||||||
Financial liabilities | ||||||||||||
Borrowings | 17A | 20,913 | 21,629 | |||||||||
Derivatives | 20 | 50 | 9 | |||||||||
Other financial liabilities | 19 | 250 | 288 | |||||||||
Provisions | 22 | 1,169 | 1,185 | |||||||||
Other non-current liabilities | 21 | 2,360 | 2,539 | |||||||||
|
|
|
| |||||||||
Total non-current liabilities | 24,742 | 25,650 | ||||||||||
|
|
|
| |||||||||
Current Liabilities | ||||||||||||
Financial liabilities | ||||||||||||
Borrowings | 17B | 1,140 | 10,819 | |||||||||
Operational buyers’ credit / suppliers’ credit | 18B,2 | (c) | 6,029 | 7,129 | ||||||||
Trade payables | 18A,2 | (c) | ||||||||||
(a) Total outstanding dues of micro, small and medium enterprises | 209 | 182 | ||||||||||
(b) Total outstanding dues of creditors other than micro, small and medium enterprises | 3,594 | 3,328 | ||||||||||
Derivatives | 20 | 139 | 38 | |||||||||
Other financial liabilities | 19 | 19,355 | 14,861 | |||||||||
Provisions | 22 | 98 | 95 | |||||||||
Income tax liabilities (net) | 46 | 46 | ||||||||||
Other current liabilities | 21 | 5,589 | 7,407 | |||||||||
|
|
|
| |||||||||
Total current liabilities | 36,199 | 43,905 | ||||||||||
|
|
|
| |||||||||
Total Equity and Liabilities | 137,731 | 139,450 | ||||||||||
|
|
|
| |||||||||
| See accompanying notes to the financial statements | ||||
| As per our report of even date | For and on behalf of the Board of Directors | |||
| For S.R. Batliboi & Co. LLP | Navin Agarwal | Sunil Duggal | ||
| Chartered Accountants | Executive Vice-Chairman and | Whole-Time Director and | ||
| ICAI Firm Registration No. 301003E/E300005 | Whole-Time Director | Chief Executive Officer | ||
| DIN 00006303 | DIN 07291685 | |||
| per Sudhir Soni | Prerna Halwasiya | |||
| Partner | Company Secretary and Compliance Officer | |||
| Membership No: 41870 | ICSI Membership No. A20856 | |||
| Place: Mumbai | Place: New Delhi | |||
| Date: 13 May 2021 | Date: 13 May 2021 | |||
276
| < BACK TO CONTENTS | Integrated Report | Statutory reports | Financial statements |
Statement of Profit and Loss
for the year ended 31 March 2021
| (₹ in crores except otherwise stated) | ||||||||||||
Particulars | Note | Year ended 31 March 2021 | Year ended 31 March 2020 | |||||||||
Revenue from operations | 26 | 37,120 | 35,417 | |||||||||
Other operating income | 27 | 320 | 441 | |||||||||
Other income | 28 | 10,948 | 2,870 | |||||||||
|
|
|
| |||||||||
Total Income | 48,388 | 38,728 | ||||||||||
|
|
|
| |||||||||
EXPENSES: | ||||||||||||
Cost of materials consumed | 13,990 | 12,493 | ||||||||||
Purchases of stock-in-trade | 204 | 227 | ||||||||||
Changes in inventories of finished goods, work-in-progress and stock-in-trade | 29 | 70 | 1,430 | |||||||||
Power and fuel charges | 6,763 | 7,930 | ||||||||||
Employee benefits expense | 24 | 903 | 765 | |||||||||
Finance costs | 30 | 3,193 | 3,328 | |||||||||
Depreciation, depletion and amortisation expense | 5 | 2,519 | 3,264 | |||||||||
Other expenses | 31 | 6,850 | 7,186 | |||||||||
|
|
|
| |||||||||
Total expenses | 34,492 | 36,623 | ||||||||||
|
|
|
| |||||||||
Profit before exceptional items and tax | 13,896 | 2,105 | ||||||||||
Net exceptional loss | 32 | (232 | ) | (12,568 | ) | |||||||
|
|
|
| |||||||||
Profit/ (Loss) before tax | 13,664 | (10,463 | ) | |||||||||
|
|
|
| |||||||||
Tax expense/ (benefit): | 33 | |||||||||||
On other than exceptional items | ||||||||||||
Net current tax expense | 104 | 4 | ||||||||||
Net deferred tax expense/ (benefit) | 3,138 | (592 | ) | |||||||||
On exceptional items | ||||||||||||
Net deferred tax benefit | (81 | ) | (3,143 | ) | ||||||||
Net tax expense/ (benefit) | 3,161 | (3,731 | ) | |||||||||
Net Profit/ (Loss) after tax (A) | 10,503 | (6,732 | ) | |||||||||
Net Profit after tax before exceptional items (net of tax) | 10,654 | 2,693 | ||||||||||
Other Comprehensive (loss)/ income | ||||||||||||
Items that will not be reclassified to profit or loss | ||||||||||||
Re-measurements gain/ (loss) of defined benefit plans | 0 | (11 | ) | |||||||||
Tax (credit)/ expense | (3 | ) | 4 | |||||||||
Gain/ (loss) on FVOCI equity investment | 63 | (74 | ) | |||||||||
|
|
|
| |||||||||
| 60 | (81 | ) | ||||||||||
|
|
|
| |||||||||
Items that will be reclassified to profit or loss | ||||||||||||
Net (loss)/gain on cash flow hedges recognised during the year | (199 | ) | 82 | |||||||||
Tax credit/ (expense) | 69 | (28 | ) | |||||||||
Net gain/ (loss) on cash flow hedges recycled to statement of profit and loss | 174 | (33 | ) | |||||||||
Net tax (credit)/ expense | (61 | ) | 11 | |||||||||
Exchange differences on translation | (66 | ) | 374 | |||||||||
Tax (credit)/ expense | (34 | ) | 59 | |||||||||
|
|
|
| |||||||||
| (117 | ) | 465 | ||||||||||
|
|
|
| |||||||||
Total Other Comprehensive (Loss)/ Income for the year (B) | (57 | ) | 384 | |||||||||
|
|
|
| |||||||||
Total Comprehensive Income/ (Loss) for the year (A+B) | 10,446 | (6,348 | ) | |||||||||
|
|
|
| |||||||||
Earnings/ (Loss) per share (in ₹) | ||||||||||||
- Basic & Diluted | 34 | 28.23 | (18.10 | ) | ||||||||
| See accompanying notes to the financial statements | ||||
| As per our report of even date | For and on behalf of the Board of Directors | |||
| For S.R. Batliboi & Co. LLP | Navin Agarwal | Sunil Duggal | ||
| Chartered Accountants | Executive Vice-Chairman and | Whole-Time Director and | ||
| ICAI Firm Registration No. 301003E/E300005 | Whole-Time Director | Chief Executive Officer | ||
| DIN 00006303 | DIN 07291685 | |||
| per Sudhir Soni | Prerna Halwasiya | |||
| Partner | Company Secretary and Compliance Officer | |||
| Membership No: 41870 | ICSI Membership No. A20856 | |||
| Place: Mumbai | Place: New Delhi | |||
| Date: 13 May 2021 | Date: 13 May 2021 | |||
VEDANTA LIMITED | INTEGRATED REPORT AND ANNUAL ACCOUNTS 2020-21 | 277
STANDALONE CONTINUED...
Statement of Cash Flows
for the year ended 31 March 2021
| (₹ in crores) | ||||||||
Particulars | Year ended 31 March 2021 | Year ended 31 March 2020 | ||||||
CASH FLOWS FROM OPERATING ACTIVITIES | ||||||||
Profit/ (Loss) before taxation | 13,664 | (10,463 | ) | |||||
Adjustments for: | ||||||||
Depreciation, depletion and amortisation | 2,543 | 3,321 | ||||||
Capital work-in-progress written off/ impairment charge | 181 | 12,335 | ||||||
Other exceptional items | 51 | 233 | ||||||
Provision for doubtful debts/ advance/ bad debts written off | 129 | 68 | ||||||
Exploration costs written off | 6 | 1 | ||||||
Fair Value gain on financial assets held at fair value through profit or loss | (93 | ) | (152 | ) | ||||
Loss on sale of property, plant and equipment (net) | 28 | 77 | ||||||
Foreign exchange loss (net) | 80 | 123 | ||||||
Unwinding of discount on decommissioning liability | 23 | 31 | ||||||
Share based payment expense | 36 | 40 | ||||||
Interest and dividend Income | (10,730 | ) | (2,597 | ) | ||||
Interest expenses | 3,170 | 3,297 | ||||||
Deferred government grant | (75 | ) | (74 | ) | ||||
Changes in assets and liabilities | ||||||||
Increase in trade and other receivables | (1,339 | ) | (857 | ) | ||||
Decrease in inventories | 53 | 2,088 | ||||||
Decrease in trade and other payable | (1,452 | ) | (790 | ) | ||||
Cash generated from operations | 6,275 | 6,681 | ||||||
|
|
|
| |||||
Income taxes (paid)/ refund (net) | (228 | ) | 518 | |||||
|
|
|
| |||||
Net cash generated from operating activities | 6,047 | 7,199 | ||||||
|
|
|
| |||||
CASH FLOWS FROM INVESTING ACTIVITIES | ||||||||
Consideration paid for business acquisition (Including transaction cost of ₹3 Crore) | (59 | ) | (33 | ) | ||||
Purchases of property, plant and equipment(including intangibles) | (2,669 | ) | (2,161 | ) | ||||
Proceeds from sale of property, plant and equipment | 18 | 35 | ||||||
Loans given to related parties | (579 | ) | (2,870 | ) | ||||
Loans repaid by related parties | 1,684 | 1,403 | ||||||
Short-term deposits made | (1,441 | ) | (913 | ) | ||||
Proceeds from redemption of short-term deposits | 962 | 547 | ||||||
Short term investments made | (18,468 | ) | (34,231 | ) | ||||
Proceeds from sale of short term investments | 18,628 | 36,580 | ||||||
Interest received | 415 | 404 | ||||||
Dividends received | 10,371 | 2,142 | ||||||
Payment made to site restoration fund | (94 | ) | (16 | ) | ||||
|
|
|
| |||||
Net cash from investing activities | 8,768 | 887 | ||||||
|
|
|
| |||||
CASH FLOWS FROM FINANCING ACTIVITIES | ||||||||
Repayment of short-term borrowings (net) | (8,726 | ) | (7,663 | ) | ||||
Proceeds from current borrowings | 5,499 | 4,457 | ||||||
Repayment of current borrowings | (6,908 | ) | (3,805 | ) | ||||
Proceeds from long-term borrowings | 9,021 | 7,636 | ||||||
Repayment of long-term borrowings | (5,564 | ) | (4,681 | ) | ||||
Interest paid | (3,439 | ) | (3,790 | ) | ||||
Payment of dividends to equity holders of the parent, including dividend distribution tax | (3,519 | ) | (1,444 | ) | ||||
Payment of lease liabilities | (164 | ) | (159 | ) | ||||
|
|
|
| |||||
Net cash used in financing activities | (13,800 | ) | (9,449 | ) | ||||
|
|
|
| |||||
Net increase/ (decrease) in cash and cash equivalents | 1,015 | (1,363 | ) | |||||
Cash and cash equivalents at the beginning of the year | 1,846 | 3,209 | ||||||
|
|
|
| |||||
Cash and cash equivalents at the end of the year (Refer note 12) | 2,861 | 1,846 | ||||||
|
|
|
| |||||
Notes:
| 1. | The figures in parentheses indicate outflow. |
| 2. | The above cash flow has been prepared under the “Indirect Method” as set out in Indian Accounting Standard (Ind AS) 7—statement of cash flows |
| See accompanying notes to the financial statements | ||||
| As per our report of even date | For and on behalf of the Board of Directors | |||
| For S.R. Batliboi & Co. LLP | Navin Agarwal | Sunil Duggal | ||
| Chartered Accountants | Executive Vice-Chairman and | Whole-Time Director and | ||
| ICAI Firm Registration No. 301003E/E300005 | Whole-Time Director | Chief Executive Officer | ||
| DIN 00006303 | DIN 07291685 | |||
| per Sudhir Soni | Prerna Halwasiya | |||
| Partner | Company Secretary and Compliance Officer | |||
| Membership No: 41870 | ICSI Membership No. A20856 | |||
| Place: Mumbai | Place: New Delhi | |||
| Date: 13 May 2021 | Date: 13 May 2021 | |||
278
| < BACK TO CONTENTS | Integrated Report | Statutory reports | Financial statements |
Statement of Changes in Equity
for the year ended 31 March 2021
A. EQUITY SHARE CAPITAL
Equity shares of ₹1 each issued, subscribed and fully paid | Number of shares (in crores) | Amount (₹ in crores) | ||||||
As at 31 March 2021 and 31 March 2020 | 372 | 372 | ||||||
B. OTHER EQUITY
| (₹ in crores) | ||||||||||||||||||||||||||||||||
| Reserves and Surplus | Items of Other comprehensive income |
| ||||||||||||||||||||||||||||||
Particulars | Capital reserve | Securities premium earnings | Retained | Other reserves (Refer below) | Equity instruments through OCI | Hedging reserve | Foreign currency translation reserve | Total other equity | ||||||||||||||||||||||||
Balance as at 01 April 2019 | 26,027 | 19,009 | 13,704 | 17,204 | 104 | (54 | ) | 1,514 | 77,508 | |||||||||||||||||||||||
|
|
|
|
|
|
|
|
|
|
|
|
|
|
|
| |||||||||||||||||
Loss for the year | — | — | (6,732 | ) | — | — | — | — | (6,732 | ) | ||||||||||||||||||||||
Other comprehensive income for the year, net of tax | — | — | (7 | ) | — | (74 | ) | 32 | 433 | 384 | ||||||||||||||||||||||
Total Comprehensive Income for the year | — | — | (6,739 | ) | — | (74 | ) | 32 | 433 | (6,348 | ) | |||||||||||||||||||||
Transfer from debenture redemption reserve (net) | — | — | 180 | (180 | ) | — | — | — | — | |||||||||||||||||||||||
Recognition of share based payment | — | — | — | 75 | — | — | — | 75 | ||||||||||||||||||||||||
Stock options cancelled during the year | — | — | 52 | (52 | ) | — | — | — | — | |||||||||||||||||||||||
Exercise of stock options | — | — | 7 | (23 | ) | — | — | — | (16 | ) | ||||||||||||||||||||||
Dividends including tax (Refer note 35) | — | — | (1,696 | ) | — | — | — | — | (1,696 | ) | ||||||||||||||||||||||
|
|
|
|
|
|
|
|
|
|
|
|
|
|
|
| |||||||||||||||||
Balance as at 31 March 2020 | 26,027 | 19,009 | 5,508 | 17,024 | 30 | (22 | ) | 1,947 | 69,523 | |||||||||||||||||||||||
|
|
|
|
|
|
|
|
|
|
|
|
|
|
|
| |||||||||||||||||
Profit for the year | — | — | 10,503 | — | — | — | — | 10,503 | ||||||||||||||||||||||||
Other comprehensive loss for the year, net of tax | — | — | (3 | ) | — | 63 | (17 | ) | (100 | ) | (57 | ) | ||||||||||||||||||||
Total Comprehensive Income for the year | — | — | 10,500 | — | 63 | (17 | ) | (100 | ) | 10,446 | ||||||||||||||||||||||
Transfer from debenture redemption reserve (net) | — | — | 503 | (503 | ) | — | — | — | — | |||||||||||||||||||||||
Recognition of share based payment | — | — | — | 58 | — | — | — | 58 | ||||||||||||||||||||||||
Stock options cancelled during the year | — | — | 60 | (92 | ) | — | — | — | (32 | ) | ||||||||||||||||||||||
Exercise of stock options | — | — | (14 | ) | (44 | ) | — | — | — | (58 | ) | |||||||||||||||||||||
Dividends (Refer note 35) | — | — | (3,519 | ) | — | — | — | — | (3,519 | ) | ||||||||||||||||||||||
|
|
|
|
|
|
|
|
|
|
|
|
|
|
|
| |||||||||||||||||
Balance as at 31 March 2021 | 26,027 | 19,009 | 13,038 | 16,443 | 93 | (39 | ) | 1,847 | 76,418 | |||||||||||||||||||||||
|
|
|
|
|
|
|
|
|
|
|
|
|
|
|
| |||||||||||||||||
Other reserves comprises:
| (₹ in crores) | ||||||||||||||||||||||||||||
Particulars | Capital redemption reserve | Debenture redemption reserve | Preference share redemption reserve | Amalgamation Reserve | General reserve | Share Based Payment Reserve | Total | |||||||||||||||||||||
Balance as at 01 April 2019 | 38 | 1,240 | 3,087 | 3 | 12,587 | 249 | 17,204 | |||||||||||||||||||||
|
|
|
|
|
|
|
|
|
|
|
|
|
| |||||||||||||||
Transfer to retained earnings | — | (180 | ) | — | — | — | — | (180 | ) | |||||||||||||||||||
Recognition of share based payment | — | — | — | — | — | 75 | 75 | |||||||||||||||||||||
Stock options cancelled during the year | — | — | — | — | — | (52 | ) | (52 | ) | |||||||||||||||||||
Exercise of stock options | — | — | — | — | — | (23 | ) | (23 | ) | |||||||||||||||||||
|
|
|
|
|
|
|
|
|
|
|
|
|
| |||||||||||||||
Balance as at 31 March 2020 | 38 | 1,060 | 3,087 | 3 | 12,587 | 249 | 17,024 | |||||||||||||||||||||
|
|
|
|
|
|
|
|
|
|
|
|
|
| |||||||||||||||
Transfer to retained earnings | — | (503 | ) | — | — | — | — | (503 | ) | |||||||||||||||||||
Recognition of share based payment | — | — | — | — | — | 58 | 58 | |||||||||||||||||||||
Stock options cancelled during the year | — | — | — | — | — | (92 | ) | (92 | ) | |||||||||||||||||||
Exercise of stock options | — | — | — | — | — | (44 | ) | (44 | ) | |||||||||||||||||||
|
|
|
|
|
|
|
|
|
|
|
|
|
| |||||||||||||||
Balance as at 31 March 2021 | 38 | 557 | 3,087 | 3 | 12,587 | 172 | 16,443 | |||||||||||||||||||||
|
|
|
|
|
|
|
|
|
|
|
|
|
| |||||||||||||||
| See accompanying notes to the financial statements | ||||
| As per our report of even date | For and on behalf of the Board of Directors | |||
| For S.R. Batliboi & Co. LLP | Navin Agarwal | Sunil Duggal | ||
| Chartered Accountants | Executive Vice-Chairman and | Whole-Time Director and | ||
| ICAI Firm Registration No. 301003E/E300005 | Whole-Time Director | Chief Executive Officer | ||
| DIN 00006303 | DIN 07291685 | |||
| per Sudhir Soni | Prerna Halwasiya | |||
| Partner | Company Secretary and Compliance Officer | |||
| Membership No: 41870 | ICSI Membership No. A20856 | |||
| Place: Mumbai | Place: New Delhi | |||
| Date: 13 May 2021 | Date: 13 May 2021 | |||
VEDANTA LIMITED | INTEGRATED REPORT AND ANNUAL ACCOUNTS 2020-21 | 279
STANDALONE CONTINUED...
Notes forming part of the financial statements
as at and for the year ended March 31, 2021
1 COMPANY OVERVIEW:
Vedanta Limited (“the Company”) is a diversified natural resource company engaged in exploring, extracting and processing minerals and oil and gas. The Company engages in the exploration, production and sale of oil and gas, aluminium, copper, iron ore and power.
The Company was incorporated on 08 September 1975 under the laws of the Republic of India. The registered office of the Company is situated at 1st Floor, ‘C’ wing, Unit 103, Corporate Avenue, Atul Projects, Chakala, Andheri (East), Mumbai-400092, Maharashtra. The Company’s shares are listed on National Stock Exchange and Bombay Stock Exchange in India. In June 2007, the Company completed its initial public offering of American Depositary Shares, or ADS, each representing four equity shares, and listed its ADSs on the New York Stock Exchange. In July 2009, the Company completed its follow-on offering of an additional 131,906,011 ADSs, each representing four equity shares, which are listed on the New York Stock Exchange.
The Company is majority owned by Twin Star Holdings Limited (“Twin Star”), Finsider International Company Limited (“Finsider”), Vedanta Holdings Mauritius II Limited
(“VHM2L”), West Globe Limited (“West Globe”) and Welter Trading Limited (“Welter”) which are in turn wholly-owned subsidiaries of Vedanta Resources PLC (“VRPLC”), which was a public limited company incorporated in the United Kingdom and listed on the London Stock Exchange (VRPLC has been delisted from London Stock Exchange on 01 October 2018 and is renamed as “Vedanta Resources Limited” (“VRL”) with effect from 29 October 2018). Twin Star, Finsider, VHM2L, West Globe and Welter held 37.1%, 10.8%, 5.0%, 1.2% and 1.0% respectively of the Company’s equity as at 31 March 2021.
Details of Company’s various businesses are as follows:
| • | The Company’s oil and gas business consists of business of exploration and development and production of oil and gas. |
| • | The Company’s iron ore business consists of iron ore exploration, mining and processing of iron ore, pig iron and metallurgical coke. The Company has iron ore mining operations in the States of Goa and Karnataka. Pursuant to Honourable Supreme Court of India order, mining operations in the state of Goa are currently suspended. |
| • | The Company’s copper business is principally one of custom smelting and includes captive power plants at Tuticorin in Southern India. The Company’s copper business in Tamil Nadu, India has received an order from the Tamil Nadu Pollution Control Board (“TNPCB”) on 09 April 2018, rejecting the Company’s |
application for renewal of consent to operate under the Air and Water Acts for the 400,000 tpa copper smelter plant in Tuticorin for want of further clarification and consequently the operations were suspended. The Company has filed an appeal with TNPCB Appellate authority against the said order. During the pendency of the appeal, TNPCB through its order dated 23 May 2018 ordered for disconnection of electricity supply and closure of copper smelter plant. Post such order, the state government on 28 May 2018 ordered the permanent closure of the plant. We continue to engage with the Government of India and relevant authorities to enable the restart of operations at Copper India. |
Further, the Company’s copper business includes refinery and rod plant Silvassa consisting of a 133,000 MT of blister/ secondary material processing plant, a 216,000 tpa copper refinery plant and a copper rod mill with an installed capacity of 258,000 tpa. The plant continues to operate as usual, catering to the domestic market. (Refer note3(c)(A)(vii)).
| • | The Company’s aluminium business include a refinery and captive power plant at Lanjigarh and a smelter and captive power plants at Jharsuguda both situated in the State of Odisha in Eastern India. |
| • | The Company’s power operations include a thermal coal-based commercial power facility of 600 MW at Jharsuguda in the State of Odisha in Eastern India. |
Besides the above the Company has business interest in zinc, lead, silver, iron ore, steel, ferro alloys and other products and services through its subsidiaries in India and overseas.
These are the Company’s separate financial statements. The details of Company’s material subsidiaries, associates and joint ventures is given in note 39.
Delisting of Vedanta Limited
The Company vide letter dated 12 May 2020 had informed the stock exchanges that it has received a letter dated 12 May 2020 from its Holding Company, Vedanta Resources Ltd. (“VRL”), wherein VRL had expressed its intention to, either individually or along with one or more subsidiaries, acquire all fully paid-up equity shares of the Company (“Equity Shares”) that are held by the public shareholders of the Company (as defined under the Delisting Regulations, to be referred to as “Public Shareholders”) and consequently voluntarily delist the Equity Shares from BSE Limited and National Stock Exchange of India Limited, the recognized stock exchanges where the Equity Shares are presently listed (“Stock Exchanges”), in accordance with the Delisting Regulations (“Delisting Proposal”) and if such delisting is
280
| < BACK TO CONTENTS | Integrated Report | Statutory reports | Financial statements |
Notes forming part of the financial statements
as at and for the year ended March 31, 2021
successful, then to also delist the Company’s American Depositary Shares from the New York Stock Exchange (“NYSE”) and deregister the Company from the Securities and Exchange Commission (“SEC”), subject to the requirements of the NYSE and the SEC.
After obtaining due approvals, the Public Shareholders holding Equity Shares were invited to submit Bids pursuant to the reverse book building process conducted through the Stock Exchange Mechanism made available by BSE during the bid period (05 October 2020 to 09 October 2020), in accordance with the Delisting Regulations.
The total number of Offer Shares validly tendered by the Public Shareholders in the Delisting Offer was 1,25,47,16,610 Offer Shares, which was less than the minimum number of Offer Shares required to be accepted by the Acquirers in order for the Delisting Offer to be successful in terms of Regulation 17(1)(a) of the Delisting Regulations. Thus, the Delisting Offer is deemed to have failed in terms of Regulation 19(1) of the Delisting Regulations.
2 BASIS OF PREPARATION AND BASIS OF MEASUREMENT OF FINANCIAL STATEMENTS
(a) Basis of preparation
i) These financial statements have been prepared in accordance with Indian Accounting Standards (Ind AS) notified under the Companies (Indian Accounting Standards) Rules, 2015 and other relevant provisions of the Companies Act, 2013 (the Act) (as amended from time to time) and Guidance Note on Accounting for Oil and Gas Producing Activities issued by the Institute of Chartered Accountants of India.
These financial statements have been prepared in accordance with the accounting policies, set out below and were consistently applied to all periods presented unless otherwise stated.
These financial statements are approved for issue by the Board of Directors on 13 May 2021.
All financial information presented in Indian Rupee has been rounded off to the nearest Crore except when indicated otherwise. Amounts less than ₹0.50 Crore have been presented as “0”.
ii) Certain comparative figures appearing in these financial statements have been regrouped and/or reclassified to better reflect the nature of those items (Refer note 2(c) below).
(b) Basis of measurement
The financial statements have been prepared on a going concern basis using historical cost convention and on an accrual method of accounting, except for certain financial
assets and liabilities which are measured at fair value as explained in the accounting policies below.
(c) Reclassification
On an ongoing basis, the management reviews the changes in the nature of the Company’s operations, selection and application of accounting policies and recent accounting pronouncements to assess appropriateness of presentation or classifications of items in the financial statements. For the year ended 31 March 2021, the Company has revised the presentation of the following items, neither of which has any material impact, individually or in the aggergate, on the financial statement:
i) Fly ash disposal expenses amounting to ₹202 Crore (Year ended 31 March 2021: ₹333 Crore) has been reclassified from ‘Other Expenses’ to ‘Power and Fuel expense’ for the comparative year ended 31 March 2020.
ii) The Company from the current year has decided to present liabilities with respect to operational buyer’s/ suppliers credit and vendor financing (refer note 18(B)) on the face of the balance sheet, which were previously included under trade payables to enhance the understanding of the financial statements. The value of such liabilities as at 01 April 2019 and 01 April 2020 was ₹6,017 Crore and ₹7,129 Crore respectively (As at 31 March 2021: ₹6,029 Crore) crore.
iii) The constituents of cash and cash equivalents for the purpose of cash flow statement to not consider the earmarked unpaid dividend accounts hitherto included in other bank balance. Consequently, such accounts amounting to ₹75 Crore and ₹74 Crore as at 31 March 2019 and 31 March 2020 respectively have been excluded from opening and closing cash and cash equivalents in the statement of cash flows for the comparative year ended 31 March 2020.
3 (a) SIGNIFICANT ACCOUNTING POLICIES
(A) Revenue recognition
• Sale of goods/rendering of services (including revenue from contracts with customers)
The Company’s revenue from contracts with customers is mainly from the sale of oil and gas, aluminium, copper, iron ore and power. Revenue from contracts with customers is recognised when control of the goods or services is transferred to the customer which usually is on delivery of the goods to the shipping agent at an amount that reflects the consideration to which the Company expects to be entitled in exchange for those goods or services. Revenue is recognised net of discounts, volume rebates, outgoing sales taxes/ goods and service tax and other indirect taxes. Revenues from sale of by-products are included in revenue.
VEDANTA LIMITED | INTEGRATED REPORT AND ANNUAL ACCOUNTS 2020-21 | 281
STANDALONE CONTINUED...
Notes forming part of the financial statements
as at and for the year ended March 31, 2021
Certain of the Company’s sales contracts provide for provisional pricing based on the price on the London Metal Exchange (LME) and crude index, as specified in the contract. Revenue in respect of such contracts is recognised when control passes to the customer and is measured at the amount the entity expects to be entitled – being the estimate of the price expected to be received at the end of the measurement period. Post transfer of control of goods, provisional pricing features are accounted in accordance with Ind AS 109 ‘Financial Instruments’ rather than Ind AS 115 Revenue from contracts with customers and therefore the Ind AS 115 rules on variable consideration do not apply. These ‘provisional pricing’ adjustments, i.e. the consideration adjusted post transfer of control are included in total revenue from operations on the face of the statement of profit and loss and disclosed by way of note to the financial statements. Final settlement of the price is based on the applicable price for a specified future period. The Company’s provisionally priced sales are marked to market using the relevant forward prices for the future period specified in the contract and is adjusted in revenue.
Revenue from oil, gas and condensate sales represent the Company’s share in the revenue from sale of such products, by the joint operations, and is recognised as and when control in these products gets transferred to the customers. In computing its share of revenue, the Company excludes government’s share of profit oil which gets accounted for when the obligation in respect of the same arises.
Revenue from sale of power is recognised when delivered and measured based on rates as per bilateral contractual agreements with buyers and at a rate arrived at based on the principles laid down under the relevant Tariff Regulations as notified by the regulatory bodies, as applicable.
A contract asset is the right to consideration in exchange for goods or services transferred to the customer. If the Company performs part of its obligation by transferring goods or services to a customer before the customer pays consideration or before payment is due, a contract asset is recognised for the earned consideration when that right is conditional on the Company’s future performance.
A contract liability is the obligation to transfer goods or services to a customer for which the Company has received consideration from the customer. If a customer pays consideration before the Company transfers goods or services to the customer, a contract liability is recognised when the payment is received. The advance payments received plus a specified rate of return/ discount, at the prevailing market rates, is settled by
supplying respective goods over a period of up to twenty four months under an agreed delivery schedule as per the terms of the respective agreements. As these are contracts that the Company expects, and has the ability, to fulfil through delivery of a non-financial item, these are presented as advance from customers and are recognised as revenue as and when control of respective commodities is transferred to customers under the agreements. The fixed rate of return/discount is treated as finance cost. The portion of the advance where either the Company does not have a unilateral right to defer settlement beyond 12 months or expects settlement within 12 months from the balance sheet date is classified as a current liability.
• Interest income
Interest income from debt instruments is recognised using the effective interest rate method. The effective interest rate is the rate that exactly discounts estimated future cash receipts through the expected life of the financial asset to the gross carrying amount of a financial asset. When calculating the effective interest rate, the Company estimates the expected cash flows by considering all the contractual terms of the financial instrument (for example, prepayment, extension, call and similar options) but does not consider the expected credit losses.
• Dividends
Dividend income is recognised in the statement of profit and loss only when the right to receive payment is established, provided it is probable that the economic benefits associated with the dividend will flow to the Company, and the amount of the dividend can be measured reliably.
(B) Property, plant and equipment
i) Mining properties and leases
When a decision is taken that a mining property is viable for commercial production (i.e. when the Company determines that the mining property will provide sufficient and sustainable return relative to the risks and the Company decided to proceed with the mine development), all further pre-production primary development expenditure other than that on land, buildings, plant, equipment and capital work in progress is capitalized as property, plant and equipment under the heading “Mining properties and leases” together with any amount transferred from “Exploration and evaluation” assets. The costs of mining properties and leases, include the costs of acquiring and developing mining properties and mineral rights.
The stripping cost incurred during the production phase of a surface mine is deferred to the extent the current period stripping cost exceeds the average period stripping cost over the life of mine and recognised as an
282
| < BACK TO CONTENTS | Integrated Report | Statutory reports | Financial statements |
Notes forming part of the financial statements
as at and for the year ended March 31, 2021
asset if such cost provides a benefit in terms of improved access to ore in future periods and certain criteria are met. When the benefit from the stripping costs are realised in the current period, the stripping costs are accounted for as the cost of inventory. If the costs of inventory produced and the stripping activity asset are not separately identifiable, a relevant production measure is used to allocate the production stripping costs between the inventory produced and the stripping activity asset. The Company uses the expected volume of waste compared with the actual volume of waste extracted for a given value of ore/mineral production for the purpose of determining the cost of the stripping activity asset.
Deferred stripping costs are included in mining properties within property, plant and equipment and disclosed as a part of mining properties. After initial recognition, the stripping activity asset is depreciated on a unit of production method over the expected useful life of the identified component of the ore body.
In circumstances where a mining property is abandoned, the cumulative capitalised costs relating to the property are written off in the period in which it occurs i.e. when the Company determines that the mining property will not provide sufficient and sustainable returns relative to the risks and the Company decides not to proceed with the mine development.
Commercial reserves are proved and probable reserves as defined by the ‘JORC’ Code, ‘MORC’ code or ‘SAMREC’ Code. Changes in the commercial reserves affecting unit of production calculations are dealt with prospectively over the revised remaining reserves.
ii) Oil and gas assets- (developing/producing assets)
For oil and gas assets, a “successful efforts” based accounting policy is followed. Costs incurred prior to obtaining the legal rights to explore an area are expensed immediately to the statement of profit and loss.
All costs incurred after the technical feasibility and commercial viability of producing hydrocarbons has been demonstrated are capitalised within property, plant and equipment - development/producing assets on a field- by-field basis. Subsequent expenditure is capitalised only where it either enhances the economic benefits of the development/producing asset or replaces part of the existing development/producing asset. Any remaining costs associated with the part replaced are expensed. Net proceeds from any disposal of development/ producing assets are credited against the previously capitalised cost. A gain or loss on disposal of a development/producing asset is recognised in the statement of profit and loss to the extent that the net
proceeds exceed or are less than the appropriate portion of the net capitalised costs of the asset.
iii) Other property, plant and equipment
The initial cost of property, plant and equipment comprises its purchase price, including import duties and non-refundable purchase taxes, and any directly attributable costs of bringing an asset to working condition and location for its intended use. It also includes the initial estimate of the costs of dismantling and removing the item and restoring the site on which it is located.
Land acquired free of cost or at below market rate from the government is recognized at fair value with corresponding credit to deferred income.
If significant parts of an item of property, plant and equipment have different useful lives, then they are accounted for as separate items (major components) of property, plant and equipment. All other expenses on existing property, plant and equipment, including day- to-day repair and maintenance expenditure and cost of replacing parts, are charged to the statement of profit and loss for the period during which such expenses are incurred.
Gains and losses on disposal of an item of property, plant and equipment computed as the difference between the net disposal proceeds and the carrying amount of the asset is included in the statement of profit and loss when the asset is derecognised. Major inspection and overhaul expenditure is capitalized, if the recognition criteria are met.
iv) Assets under construction
Assets under construction are capitalized in the assets under construction account. At the point when an asset is capable of operating in the manner intended by management, the cost of construction is transferred to the appropriate category of property, plant and equipment. Costs associated with the commissioning of an asset and any obligatory decommissioning costs are capitalised until the period of commissioning has been completed and the asset is ready for its intended use.
v) Depreciation, depletion and amortisation expense
Mining properties and other assets in the course of development or construction and freehold land are not depreciated or amortised.
• Mining properties
The capitalised mining properties are amortised on a unit-of-production basis over the total estimated remaining commercial proved and probable reserves of each property or group of properties and are subject to impairment review. Costs used in the unit of production calculation comprise the net book value of capitalised costs plus the estimated future capital expenditure required to access the commercial reserves. Changes in the estimates of commercial reserves or future capital expenditure are dealt with prospectively.
VEDANTA LIMITED | INTEGRATED REPORT AND ANNUAL ACCOUNTS 2020-21 | 283
STANDALONE CONTINUED...
Notes forming part of the financial statements
as at and for the year ended March 31, 2021
| • | Oil and gas producing facilities |
All expenditures carried within each field are amortised from the commencement of production on a unit of production basis, which is the ratio of oil and gas production in the period to the estimated quantities of depletable reserves at the end of the period plus the production in the period, generally on a field-by-field basis or group of fields which are reliant on common infrastructure.
Depletable reserves are proved reserves for acquisition costs and proved and developed reserves for successful exploratory wells, development wells, processing facilities, distribution assets, estimated future abandonment cost and all other related costs. These assets are depleted within each cost centre. Reserves for this purpose are considered on working interest basis which are reassessed atleast annually. Impact of changes to reserves are accounted for prospectively.
| • | Other assets |
Depreciation on other property, plant and equipment is calculated using the straight-line method (SLM) to allocate their cost, net of their residual values, over their estimated useful lives (determined by the management) as given below.
Management’s assessment takes into account, inter alia, the nature of the assets, the estimated usage of the assets, the operating conditions of the assets, past history of replacement and maintenance support.
Estimated useful lives of assets are as follows:
Asset | Useful life (in years) | |
Buildings (Residential, factory etc.) | 3-60 | |
Plant and equipment | 15-40 | |
Railway siding | 15 | |
Office equipment | 3-6 | |
Furniture and fixture | 8-10 | |
Vehicles | 8-10 |
Major inspection and overhaul costs are depreciated over the estimated life of the economic benefit to be derived from such costs. The carrying amount of the remaining previous overhaul cost is charged to the statement of profit and loss if the next overhaul is undertaken earlier than the previously estimated life of the economic benefit.
The Company reviews the residual value and useful life of an asset at least at each financial year-end and, if expectations differ from previous estimates, the change is accounted for as a change in accounting estimate.
| (C) | Intangible assets |
Intangible assets acquired separately are measured on initial recognition at cost. Subsequently, intangible assets are measured at cost less accumulated amortisation and accumulated impairment losses, if any.
Intangible assets are amortised over their estimated useful life on a straight line basis. Software is amortised over the estimated useful life ranging from 2-5 years. Amounts paid for securing mining rights are amortised over the period of the mining lease ranging from 16-25 years.
Gains or losses arising from derecognition of an intangible asset are measured as the difference between the net disposal proceeds and the carrying amount of the asset and are recognised in the statement of profit and loss when the asset is derecognised.
The amortization period and the amortization method are reviewed at least at each financial year end. If the expected useful life of the asset is different from previous estimates, the change is accounted for prospectively as a change in accounting estimate.
| (D) | Exploration and evaluation intangible assets |
Exploration and evaluation expenditure incurred prior to obtaining the mining right or the legal right to explore are expensed as incurred.
Exploration and evaluation expenditure incurred after obtaining the mining right or the legal right to explore are capitalised as exploration and evaluation assets (intangible assets) and stated at cost less impairment, if any. Exploration and evaluation intangible assets are transferred to the appropriate category of property, plant and equipment when the technical feasibility and commercial viability has been determined. Exploration intangible assets under development are assessed for impairment and impairment loss, if any, is recognised prior to reclassification.
Exploration expenditure includes all direct and allocated indirect expenditure associated with finding specific mineral resources which includes depreciation and applicable operating costs of related support equipment and facilities and other costs of exploration activities:
| • | Acquisition costs - costs associated with acquisition of licenses and rights to explore, including related professional fees. |
| • | General exploration costs - costs of surveys and studies, rights of access to properties to conduct those studies (e.g., costs incurred for environment clearance, defence clearance, etc.), and salaries and other expenses of geologists, geophysical crews and other personnel conducting those studies. |
284
| < BACK TO CONTENTS | Integrated Report | Statutory reports | Financial statements |
Notes forming part of the financial statements
as at and for the year ended March 31, 2021
| • | Costs of exploration drilling and equipping exploration and appraisal wells. |
Exploration expenditure incurred in the process of determining oil and gas exploration targets is capitalised within “Exploration and evaluation assets” (intangible assets) and subsequently allocated to drilling activities. Exploration drilling costs are initially capitalised on a well-by-well basis until the success or otherwise of the well has been established. The success or failure of each exploration effort is judged on a well-by-well basis. Drilling costs are written off on completion of a well unless the results indicate that hydrocarbon reserves exist and there is a reasonable prospect that these reserves are commercial.
Following appraisal of successful exploration wells, if commercial reserves are established and technical feasibility for extraction demonstrated, then the related capitalised exploration costs are transferred into a single field cost centre within property, plant and equipment—development/producing assets (oil and gas properties) after testing for impairment. Where results of exploration drilling indicate the presence of hydrocarbons which are ultimately not considered commercially viable, all related costs are written off to the statement of profit and loss. Expenditure incurred on the acquisition of a license interest is initially capitalised on a license-by-license basis. Costs are held, undepleted, within exploration and evaluation assets until such time as the exploration phase on the license area is complete or commercial reserves have been discovered.
Net proceeds from any disposal of an exploration asset are initially credited against the previously capitalised costs. Any surplus/ deficit is recognised in the statement of profit and loss.
| (E) | Non-current assets held for sale |
Non-current assets and disposal groups are classified as held for sale if their carrying amount will be recovered through a sale transaction rather than through continuing use. This condition is regarded as met only when the sale is highly probable and the asset (or disposal group) is available for immediate sale in its present condition. Management must be committed to the sale which should be expected to qualify for recognition as a completed sale within one year from the date of classification. Non-current assets and disposal groups classified as held for sale are not depreciated and are measured at the lower of carrying amount and fair value less costs to sell. Such assets and disposal groups are presented separately on the face of the balance sheet.
| (F) | Impairment of non-financial assets |
Impairment charges and reversals are assessed at the level of cash-generating units. A cash-generating unit (CGU) is the smallest identifiable group of assets that generate cash inflows that are largely independent of the cash inflows from other assets or group of assets. The Company assesses at each reporting date, whether there is an indication that an asset may be impaired. The Company conducts an internal review of asset values annually, which is used as a source of information to assess for any indications of impairment or reversal of previously recognised impairment losses. Internal and external factors, such as worse economic performance than expected, changes in expected future prices, costs and other market factors are also monitored to assess for indications of impairment or reversal of previously recognised impairment losses.
If any such indication exists then an impairment review is undertaken and the recoverable amount is calculated, as the higher of fair value less costs of disposal and the asset’s value in use.
Fair value less costs of disposal is the price that would be received to sell the asset in an orderly transaction between market participants and does not reflect the effects of factors that may be specific to the company and not applicable to entities in general. Fair value for mineral and oil and gas assets is generally determined as the present value of the estimated future cash flows expected to arise from the continued use of the asset, including any expansion prospects, and its eventual disposal, using assumptions that an independent market participant may take into account. These cash flows are discounted at an appropriate post tax discount rate to arrive at the net present value.
Value in use is determined as the present value of the estimated future cash flows expected to arise from the continued use of the asset in its present form and its eventual disposal. The cash flows are discounted using a pre-tax discount rate that reflects current market assessments of the time value of money and the risks specific to the asset for which estimates of future cash flows have not been adjusted. Value in use is determined by applying assumptions specific to the Company’s continued use and cannot take into account future development. These assumptions are different to those used in calculating fair value and consequently the value in use calculation is likely to give a different result to a fair value calculation.
The carrying amount of the CGU is determined on a basis consistent with the way the recoverable amount of the CGU is determined.
VEDANTA LIMITED | INTEGRATED REPORT AND ANNUAL ACCOUNTS 2020-21 | 285
STANDALONE CONTINUED...
Notes forming part of the financial statements
as at and for the year ended March 31, 2021
If the recoverable amount of an asset or CGU is estimated to be less than its carrying amount, the carrying amount of the asset or CGU is reduced to its recoverable amount. An impairment loss is recognised in the statement of profit and loss.
Any reversal of the previously recognised impairment loss is limited to the extent that the asset’s carrying amount does not exceed the carrying amount that would have been determined if no impairment loss had previously been recognised.
Exploration and evaluation assets:
In assessing whether there is any indication that an exploration and evaluation asset may be impaired, the Company considers, as a minimum, the following indicators:
| • | the period for which the Company has the right to explore in the specific area has expired during the period or will expire in the near future, and is not expected to be renewed; |
| • | substantive expenditure on further exploration for and evaluation of mineral resources in the specific area is neither budgeted nor planned; |
| • | exploration for and evaluation of mineral resources in the specific area have not led to the discovery of commercially viable quantities of mineral resources and the Company has decided to discontinue such activities in the specific area; |
| • | sufficient data exist to indicate that, although a development in the specific area is likely to proceed, the carrying amount of the exploration and evaluation asset is unlikely to be recovered in full from successful development or by sale; and |
| • | reserve information prepared annually by external experts. |
When a potential impairment is identified, an assessment is performed for each area of interest in conjunction with the group of operating assets (representing a cash-generating unit) to which the exploration and evaluation assets is attributed. Exploration areas in which reserves have been discovered but require major capital expenditure before production can begin, are continually evaluated to ensure that commercial quantities of reserves exist or to ensure that additional exploration work is underway or planned. To the extent that capitalised expenditure is no longer expected to be recovered, it is charged to the statement of profit and loss.
| (G) | Financial instruments |
A financial instrument is any contract that gives rise to a financial asset of one entity and a financial liability or equity instrument of another entity.
| (i) | Financial Assets – recognition & subsequent measurement |
All financial assets are recognised initially at fair value plus, in the case of financial assets not recorded at fair value through profit or loss, transaction costs that are attributable to the acquisition of the financial asset. Purchases or sales of financial assets that require delivery of assets within a time frame established by regulation or convention in the market place (regular way trades) are recognised on the trade date, i.e., the date that the Company commits to purchase or sell the asset.
For purposes of subsequent measurement, financial assets are classified in four categories:
| • | Debt instruments at amortised cost |
A ‘debt instrument’ is measured at amortised cost if both the following conditions are met:
| a) | The asset is held within a business model whose objective is to hold assets for collecting contractual cash flows, and |
| b) | Contractual terms of the asset give rise on specified dates to cash flows that are solely payments of principal and interest (SPPI) on the principal amount outstanding. |
After initial measurement, such financial assets are subsequently measured at amortised cost using the Effective Interest Rate (EIR) method. Amortised cost is calculated by taking into account any discount or premium on acquisition and fees or costs that are an integral part of the EIR. The EIR amortisation is included in interest income in the statement of profit and loss. The losses arising from impairment are recognised in the statement of profit and loss.
| • | Debt instruments at fair value through other comprehensive income (FVOCI) |
A ‘debt instrument’ is classified as at FVOCI if both of the following criteria are met:
| a) | The objective of the business model is achieved both by collecting contractual cash flows and selling the financial assets, and |
| b) | The asset’s contractual cash flows represent SPPI. |
Debt instruments included within the FVOCI category are measured initially as well as at each reporting date at fair value. Fair value movements are recognized in other comprehensive income (OCI). However, interest income, impairment losses and reversals and foreign exchange gain or loss are recognised in the statement of profit and loss. On derecognition of the asset, cumulative gain or loss previously recognised in other comprehensive income is reclassified from the equity to statement of profit and loss. Interest earned whilst holding fair value through other comprehensive income debt instrument is reported as interest income using the EIR method.
286
| < BACK TO CONTENTS | Integrated Report | Statutory reports | Financial statements |
Notes forming part of the financial statements
as at and for the year ended March 31, 2021
| • | Debt instruments at fair value through profit or loss (FVTPL) |
FVTPL is a residual category for debt instruments. Any debt instrument, which does not meet the criteria for categorization as at amortized cost or as FVOCI, is classified as at FVTPL.
In addition, the Company may elect to designate a debt instrument, which otherwise meets amortized cost or FVOCI criteria, as at FVTPL. However, such election is allowed only if doing so reduces or eliminates a measurement or recognition inconsistency (referred to as ‘accounting mismatch’). The Company has not designated any debt instrument as at FVTPL.
Debt instruments included within the FVTPL category are measured at fair value with all changes being recognized in statement of profit and loss.
| • | Equity instruments |
All equity investments in the scope of Ind AS 109 are measured at fair value. Equity instruments which are held for trading and contingent consideration recognised by an acquirer in a business combination to which Ind AS 103 applies are classified as at FVTPL. For all other equity instruments, the Company may make an irrevocable election to present in other comprehensive income subsequent changes in the fair value. The Company makes such election on an instrument-by-instrument basis. The classification is made on initial recognition and is irrevocable.
If the Company decides to classify an equity instrument as at FVOCI, then all fair value changes on the instrument, excluding dividends, are recognized in the OCI. There is no recycling of the amounts from OCI to the statement of profit and loss, even on sale of investment. However, the Company may transfer the cumulative gain or loss within equity. For equity instruments which are classified as FVTPL all subsequent fair value changes are recognised in the statement of profit and loss.
| (ii) | Financial Assets - derecognition |
The Company derecognises a financial asset when the contractual rights to the cash flows from the asset expire, or it transfers the rights to receive the contractual cash flows on the financial asset in a transaction in which substantially all the risks and rewards of ownership of the financial asset are transferred.
| (iii) | Impairment of financial assets |
In accordance with Ind AS 109, the Company applies expected credit loss (ECL) model for measurement and recognition of impairment loss on the following financial assets:
| a) | Financial assets that are debt instruments, and are measured at amortised cost e.g., loans, debt securities and deposits |
| b) | Financial assets that are debt instruments and are measured as at FVOCI |
| c) | Trade receivables or any contractual right to receive cash or another financial asset that result from transactions that are within the scope of Ind AS 115. |
The Company follows ‘simplified approach’ for recognition of impairment loss allowance on trade receivables, contract assets and lease receivables. The application of simplified approach does not require the Company to track changes in credit risk. Rather, it recognises impairment loss allowance based on lifetime ECLs at each reporting date, right from its initial recognition.
At each reporting date, for recognition of impairment loss on other financial assets and risk exposure, the Company determines whether there has been a significant increase in the credit risk since initial recognition. If credit risk has not increased significantly, 12-month ECL is used to provide for impairment loss. However, if credit risk has increased significantly, lifetime ECL is used. If, in a subsequent period, credit quality of the instrument improves such that there is no longer a significant increase in credit risk since initial recognition, then the Company reverts to recognising impairment loss allowance based on 12-month ECL.
Lifetime ECL are the expected credit losses resulting from all possible default events over the expected life of a financial instrument. The 12-month ECL is a portion of the lifetime ECL which results from default events that are possible within 12 months after the reporting date. ECL is the difference between all contractual cash flows that are due to the Company in accordance with the contract and all the cash flows that the entity expects to receive, discounted at the original EIR.
ECL impairment loss allowance (or reversal) recognized during the year is recognized as income/ expense in the statement of profit and loss. The balance sheet presentation for various financial instruments is described below:
| a) | Financial assets measured at amortised cost: ECL is presented as an allowance, i.e., as an integral part of the measurement of those assets. The Company does not reduce impairment allowance from the gross carrying amount. |
| b) | Debt instruments measured at FVOCI: Since financial assets are already reflected at fair value, impairment allowance is not further reduced from its value. Rather, ECL amount is presented as ‘accumulated impairment amount’ in the OCI. |
VEDANTA LIMITED | INTEGRATED REPORT AND ANNUAL ACCOUNTS 2020-21 | 287
STANDALONE CONTINUED...
Notes forming part of the financial statements
as at and for the year ended March 31, 2021
For assessing increase in credit risk and impairment loss, the Company combines financial instruments on the basis of shared credit risk characteristics with the objective of facilitating an analysis that is designed to enable significant increases in credit risk to be identified on a timely basis.
The Company does not have any purchased or originated credit-impaired (POCI) financial assets, i.e., financial assets which are credit impaired on purchase/ origination.
| (iv) | Financial liabilities – Recognition & Subsequent measurement |
Financial liabilities are classified, at initial recognition, as financial liabilities at fair value through profit or loss, or as loans, borrowings and payables, or as derivatives designated as hedging instruments in an effective hedge, as appropriate.
All financial liabilities are recognised initially at fair value and, in the case of financial liabilities at amortised cost, net of directly attributable transaction costs.
The Company’s financial liabilities include trade and other payables, loans and borrowings including bank overdrafts, financial guarantee contracts and derivative financial instruments.
The measurement of financial liabilities depends on their classification, as described below:
| • | Financial liabilities at fair value through profit or loss |
Financial liabilities at fair value through profit or loss include financial liabilities held for trading and financial liabilities designated upon initial recognition as at fair value through profit or loss. Financial liabilities are classified as held for trading if they are incurred for the purpose of repurchasing in the near term. This category also includes derivative financial instruments entered into by the Company that are not designated as hedging instruments in hedge relationships as defined by Ind AS 109. Separated embedded derivatives are also classified as held for trading unless they are designated as effective hedging instruments.
Gains or losses on liabilities held for trading are recognised in the statement of profit and loss.
Financial liabilities designated upon initial recognition at fair value through profit or loss are designated as such at the initial date of recognition, and only if the criteria in Ind AS 109 are satisfied. For liabilities designated as FVTPL, fair value gains/ losses attributable to changes in own credit risk are recognized in OCI. These gains/losses are not subsequently transferred to statement of profit and loss. However, the Company may transfer the cumulative gain or loss within equity. All other changes in fair value of such liability are recognised in the statement of profit and loss. The Company has not designated any financial liability as at fair value through profit or loss.
| • | Financial liabilities at amortised cost (Loans & Borrowings and Trade and Other payables) |
After initial recognition, interest-bearing loans and borrowings and trade and other payables are subsequently measured at amortised cost using the EIR method. Gains and losses are recognised in the statement of profit and loss when the liabilities are derecognised as well as through the EIR amortisation process.
Amortised cost is calculated by taking into account any discount or premium on acquisition and fees or costs that are an integral part of the EIR. The EIR amortisation is included as finance costs in the statement of profit and loss
| (v) | Financial liabilities - Derecognition |
A financial liability is derecognised when the obligation under the liability is discharged or cancelled or expires. When an existing financial liability is replaced by another from the same lender on substantially different terms, or the terms of an existing liability are substantially modified, such an exchange or modification is treated as the derecognition of the original liability and the recognition of a new liability. The difference in the respective carrying amounts is recognised in the statement of profit and loss.
| (vi) | Embedded derivatives |
An embedded derivative is a component of a hybrid (combined) instrument that also includes a non- derivative host contract – with the effect that some of the cash flows of the combined instrument vary in a way similar to a stand-alone derivative. An embedded derivative causes some or all of the cash flows that otherwise would be required by the contract to be modified according to a specified interest rate, financial instrument price, commodity price, foreign exchange rate, index of prices or rates, credit rating or credit index, or other variable, provided in the case of a non-financial variable that the variable is not specific to a party to the contract. Reassessment only occurs if there is either a change in the terms of the contract that significantly modifies the cash flows that would otherwise be required or a reclassification of a financial asset out of the fair value through profit or loss.
If the hybrid contract contains a host that is a financial asset within the scope of Ind AS 109, the Company does not separate embedded derivatives. Rather, it applies the classification requirements contained in Ind AS 109 to the entire hybrid contract. Derivatives embedded in all other host contracts are accounted for as separate derivatives and recorded at fair value if their economic characteristics and risks are not closely related to those of the host contracts and the host contracts are not held for trading or designated at fair value though profit or loss. These embedded derivatives are measured at fair value with changes in fair value recognised in statement of profit and loss, unless designated as effective hedging instruments.
288
| < BACK TO CONTENTS | Integrated Report | Statutory reports | Financial statements |
Notes forming part of the financial statements
as at and for the year ended March 31, 2021
| (vii) | Equity instruments |
An equity instrument is any contract that evidences a residual interest in the assets of an entity after deducting all of its liabilities. Equity instruments issued by the Company are recognised at the proceeds received, net of direct issue costs.
| (viii) | Offsetting of financial instruments |
Financial assets and financial liabilities are offset and the net amount is reported in the balance sheet if there is a currently enforceable legal right to offset the recognised amounts and there is an intention to settle on a net basis, or to realise the asset and settle the liability simultaneously.
| (H) | Derivative financial instruments and hedge accounting |
Initial recognition and subsequent measurement
In order to hedge its exposure to foreign exchange, interest rate, and commodity price risks, the Company enters into forward, option, swap contracts and other derivative financial instruments. The Company does not hold derivative financial instruments for speculative purposes.
Such derivative financial instruments are initially recognised at fair value on the date on which a derivative contract is entered into and are subsequently re- measured at fair value. Derivatives are carried as financial assets when the fair value is positive and as financial liabilities when the fair value is negative.
Any gains or losses arising from changes in the fair value of derivatives are taken directly to statement of profit and loss, except for the effective portion of cash flow hedges, which is recognised in OCI and later reclassified to statement of profit and loss when the hedge item affects profit or loss or treated as basis adjustment if a hedged forecast transaction subsequently results in the recognition of a non-financial asset or non-financial liability.
For the purpose of hedge accounting, hedges are classified as:
| • | Fair value hedges when hedging the exposure to changes in the fair value of a recognised asset or liability or an unrecognised firm commitment |
| • | Cash flow hedges when hedging the exposure to variability in cash flows that is either attributable to a particular risk associated with a recognised asset or liability or a highly probable forecast transaction or the foreign currency risk in an unrecognised firm commitment |
| • | Hedges of a net investment in a foreign operation |
At the inception of a hedge relationship, the Company formally designates and documents the hedge relationship to which the Company wishes to apply hedge accounting. The documentation includes the Company’s risk management objective and strategy for undertaking hedge, the hedging/ economic relationship, the hedged item or transaction, the nature of the risk being hedged, hedge ratio and how the entity will assess the effectiveness of changes in the hedging instrument’s fair value in offsetting the exposure to changes in the hedged item’s fair value or cash flows attributable to the hedged risk. Such hedges are expected to be highly effective in achieving offsetting changes in fair value or cash flows and are assessed on an ongoing basis to determine that they actually have been highly effective throughout the financial reporting periods for which they were designated.
Hedges that meet the strict criteria for hedge accounting are accounted for, as described below:
| i) | Fair value hedges |
Changes in the fair value of derivatives that are designated and qualify as fair value hedges are recognised in statement of profit and loss immediately, together with any changes in the fair value of the hedged asset or liability that are attributable to the hedged risk. When an unrecognised firm commitment is designated as a hedged item, the subsequent cumulative change in the fair value of the firm commitment attributable to the hedged risk is recognised as an asset or liability with a corresponding gain or loss recognised in statement of profit and loss. Hedge accounting is discontinued when the Company revokes the hedge relationship, the hedging instrument or hedged item expires or is sold, terminated, or exercised or no longer meets the criteria for hedge accounting.
| ii) | Cash flow hedges |
The effective portion of the gain or loss on the hedging instrument is recognised in OCI in the cash flow hedge reserve, while any ineffective portion is recognised immediately in the statement of profit and loss.
Amounts recognised in OCI are transferred to statement of profit and loss when the hedged transaction affects profit or loss, such as when the hedged financial income or financial expense is recognised or when a forecast sale occurs. When the hedged item is the cost of a non- financial asset or non-financial liability, the amounts recognised in OCI are transferred to the initial carrying amount of the non-financial asset or liability.
VEDANTA LIMITED | INTEGRATED REPORT AND ANNUAL ACCOUNTS 2020-21 | 289
STANDALONE CONTINUED...
Notes forming part of the financial statements
as at and for the year ended March 31, 2021
If the hedging instrument expires or is sold, terminated or exercised without replacement or rollover (as part of the hedging strategy), or if its designation as a hedge is revoked, or when the hedge no longer meets the criteria for hedge accounting, any cumulative gain or loss previously recognised in OCI remains separately in equity until the forecast transaction occurs or the foreign currency firm commitment is met.
| (I) | Leases |
The Company assesses at contract inception, all arrangements to determine whether they are, or contain, a lease. That is, if the contract conveys the right to control the use of an identified asset for a period of time in exchange for consideration.
| (a) | Company as a lessor |
Leases in which the Company does not transfer substantially all the risks and rewards of ownership of an asset are classified as operating leases. Rental income from operating lease is recognised on a straight-line basis over the term of the relevant lease. Initial direct costs incurred in negotiating and arranging an operating lease are added to the carrying amount of the leased asset and recognised over the lease term on the same basis as rental income. Contingent rents are recognised as revenue in the period in which they are earned.
Leases are classified as finance leases when substantially all of the risks and rewards of ownership transfer from the Company to the lessee. Amounts due from lessees under finance leases are recorded as receivables at the Company’s net investment in the leases. Finance lease income is allocated to accounting periods so as to reflect a constant periodic rate of return on the net investment outstanding in respect of the lease.
Company as a lessee |
The Company applies a single recognition and measurement approach for all leases, except for short- term leases and leases of low-value assets. The Company recognises lease liabilities towards future lease payments and right-of-use assets representing the right to use the underlying assets.
| (i) | Right-of-use assets |
The Company recognises right-of-use assets at the commencement date of the lease (i.e., the date when the underlying asset is available for use). Right-of-use assets are measured at cost, less any accumulated depreciation and impairment losses, and adjusted for any remeasurement of lease liabilities. The cost of right-of-use assets includes the amount of lease liabilities recognised, initial direct costs incurred, and lease payments made at or before the commencement date less any lease incentives received. The right-of-use assets are also subject to impairment.
Right-of-use assets are depreciated on a straight-line basis over the shorter of the lease term and the estimated useful lives of the assets as described in ‘B’ above.
| (ii) | Lease liabilities |
At the commencement date of the lease, the Company recognises lease liabilities measured at the present value of lease payments to be made over the lease term. The lease payments include fixed payments (and, in some instances, in-substance fixed payments) less any lease incentives receivable, variable lease payments that depend on an index or a rate, and amounts expected to be paid under residual value guarantees. The lease payments also include the exercise price of a purchase option reasonably certain to be exercised by the Company and payments of penalties for terminating the lease, if the lease term reflects the Company exercising the option to terminate. Variable lease payments that do not depend on an index or a rate are recognised as expenses (unless they are incurred to produce inventories) in the period in which the event or condition that triggers the payment occurs.
In calculating the present value of lease payments, the Company uses its incremental borrowing rate at the lease commencement date because the interest rate implicit in the lease is generally not readily determinable. After the commencement date, the amount of lease liabilities is increased to reflect the accretion of interest and reduced for the lease payments made. In addition, the carrying amount of lease liabilities is remeasured if there is a modification, a change in the lease term, a change in the lease payments (e.g., changes to future payments resulting from a change in an index or rate used to determine such lease payments) or a change in the assessment of an option to purchase the underlying asset.
The Company’s lease liabilities are included in Other Financial Liabilities.
| (iii) | Short-term leases and leases of low-value assets |
The Company applies the short-term lease recognition exemption to its short-term leases of equipment (i.e., those leases that have a lease term of 12 months or less from the commencement date and do not contain a purchase option). It also applies the lease of low- value assets recognition exemption to leases of office equipment that are considered to be low value. Lease payments on short-term leases and leases of low-value assets are recognised as expense on a straight-line basis over the lease term.
| (J) | Inventories |
Inventories and work-in-progress are stated at the lower of cost and net realisable value. Cost is determined on the following basis:
290
| < BACK TO CONTENTS | Integrated Report | Statutory reports | Financial statements |
Notes forming part of the financial statements
as at and for the year ended March 31, 2021
| • | purchased copper concentrate is recorded at cost on a first-in, first-out (“FIFO”) basis; all other materials including stores and spares are valued on a weighted average basis except in Oil and Gas business where stores and spares are valued on FIFO basis; |
| • | finished products are valued at raw material cost plus costs of conversion, comprising labour costs and an attributable proportion of manufacturing overheads based on normal levels of activity and are moved out of inventory on a weighted average basis (except in copper business where FIFO basis is followed) and |
| • | By-products and scrap are valued at net realisable value. |
Net realisable value is determined based on estimated selling price, less further costs expected to be incurred for completion and disposal.
| (K) | Government grants |
Grants and subsidies from the government are recognised when there is reasonable assurance that (i) the Company will comply with the conditions attached to them, and (ii) the grant/subsidy will be received.
When the grant or subsidy relates to revenue, it is recognised as income on a systematic basis in the statement of profit and loss over the periods necessary to match them with the related costs, which they are intended to compensate.
Where the grant relates to an asset, it is recognised as deferred income and released to income in equal amounts over the expected useful life of the related asset and presented within other income.
When the Company receives grants of non-monetary assets, the asset and the grant are recorded at fair value amounts and released to profit or loss over the expected useful life in a pattern of consumption of the benefit of the underlying asset.
When loans or similar assistance are provided by governments or related institutions, with an interest rate below the current applicable market rate, the effect of this favourable interest is regarded as a government grant. The loan or assistance is initially recognised and measured at fair value and the government grant is measured as the difference between the initial carrying value of the loan and the proceeds received. The loan is subsequently measured as per the accounting policy applicable to financial liabilities.
| (L) | Taxation |
Tax expense represents the sum of current tax and deferred tax.
Current tax is provided at amounts expected to be paid (or recovered) using the tax rates and laws that have been
enacted or substantively enacted by the reporting date and includes any adjustment to tax payable in respect of previous years.
Subject to the exceptions below, deferred tax is provided, using the balance sheet method, on all temporary differences at the reporting date between the tax bases of assets and liabilities and their carrying amounts for financial reporting purposes and on carry forward of unused tax credits and unused tax losses;
| • | deferred income tax is not recognised on initial recognition of an asset or liability in a transaction that is not a business combination and, at the time of the transaction, affects neither the accounting profit nor taxable profit(tax loss); and |
| • | deferred tax assets (including MAT credit entitlement) are recognised only to the extent that it is more likely than not that they will be recovered. |
Deferred tax assets and liabilities are measured at the tax rates that are expected to apply to the year when the asset is realized or the liability is settled, based on tax rates (and tax laws) that have been enacted or substantively enacted at the reporting date. Tax relating to items recognized outside statement of profit and loss is recognised outside statement of profit and loss (either in other comprehensive income or equity).
The carrying amount of deferred tax assets (including MAT credit entitlement) is reviewed at each reporting date and is adjusted to the extent that it is no longer probable that sufficient taxable profit will be available to allow all or part of the asset to be recovered.
Deferred tax assets and deferred tax liabilities are offset, if a legally enforceable right exists to set off current income tax assets against current income tax liabilities and the deferred taxes relate to the same taxable entity and the same taxation authority.
Further, management periodically evaluates positions taken in the tax returns with respect to situations in which applicable tax regulations are subject to interpretation and considers whether it is probable that a taxation authority will accept an uncertain tax treatment. The Company shall reflect the effect of uncertainty for each uncertain tax treatment by using either most likely method or expected value method, depending on which method predicts better resolution of the treatment.
| (M) | Retirement benefit schemes |
The Company operates or participates in a number of defined benefits and defined contribution schemes, the assets of which (where funded) are held in separately administered funds. For defined benefit schemes, the cost of providing benefits under the plans is determined by actuarial valuation each year separately for each plan using the projected unit credit method by third party qualified actuaries.
VEDANTA LIMITED | INTEGRATED REPORT AND ANNUAL ACCOUNTS 2020-21 | 291
STANDALONE CONTINUED...
Notes forming part of the financial statements
as at and for the year ended March 31, 2021
Remeasurement including, effects of asset ceiling and return on plan assets (excluding amounts included in interest on the net defined benefit liability) and actuarial gains and losses arising in the year are recognised in full in other comprehensive income and are not recycled to the statement of profit and loss.
Past service costs are recognised in profit or loss on the earlier of:
| • | the date of the plan amendment or curtailment, and |
| • | the date that the Company recognises related restructuring costs |
Net interest is calculated by applying a discount rate to the net defined benefit liability or asset at the beginning of the period. Defined benefit costs are split into current service cost, past service cost, net interest expense or income and remeasurement and gains and losses on curtailments and settlements. Current service cost and past service cost are recognised within employee benefit expense. Net interest expense or income is recognized within finance costs.
For defined contribution schemes, the amount charged to the statement of profit and loss in respect of pension costs and other post retirement benefits is the contributions payable in the year, recognised as and when the employee renders related services.
| (N) | Share-based payments |
Certain employees (including executive directors) of the Company receive part of their remuneration in the form of share-based payment transactions, whereby employees render services in exchange for shares or rights over shares (‘equity-settled transactions’). The cost of equity-settled transactions with employees is measured at fair value of share awards at the date at which they are granted. The fair value of share awards is determined with the assistance of an external valuer and the fair value at the grant date is expensed on a proportionate basis over the vesting period based on the Company’s estimate of shares that will eventually vest. The estimate of the number of awards likely to vest is reviewed at each balance sheet date up to the vesting date at which point the estimate is adjusted to reflect the current expectations.
The resultant increase in equity is recorded in share based payment reserve.
In case of cash-settled transactions, a liability is recognised for the fair value of cash-settled transactions. The fair value is measured initially and at each reporting date up to and including the settlement date, with
changes in fair value recognised in employee benefits expense. The fair value is expensed over the period until the vesting date with recognition of a corresponding liability. The fair value is determined with the assistance of an external valuer.
| (O) | Provisions, contingent liabilities and contingent assets |
The assessments undertaken in recognising provisions and contingencies have been made in accordance with the applicable Ind AS.
Provisions represent liabilities for which the amount or timing is uncertain. Provisions are recognized when the Company has a present obligation (legal or constructive), as a result of past events, and it is probable that an outflow of resources, that can be reliably estimated, will be required to settle such an obligation.
If the effect of the time value of money is material, provisions are determined by discounting the expected future cash flows to net present value using an appropriate pre-tax discount rate that reflects current market assessments of the time value of money and, where appropriate, the risks specific to the liability. Unwinding of the discount is recognized in statement of profit and loss as a finance cost. Provisions are reviewed at each reporting date and are adjusted to reflect the current best estimate.
A contingent liability is a possible obligation that arises from past events whose existence will be confirmed by the occurrence or non-occurrence of one or more uncertain future events beyond the control of the Company or a present obligation that is not recognised because it is not probable that an outflow of resources will be required to settle the obligation. A contingent liability also arises in extremely rare cases where there is a liability that cannot be recognised because it cannot be measured reliably. The Company does not recognize a contingent liability but discloses its existence in the Balance Sheet. Contingent assets are not recognised but disclosed in the financial statements when an inflow of economic benefit is probable.
The Company has significant capital commitments in relation to various capital projects which are not recognised in the balance sheet.
| (P) | Restoration, rehabilitation and environmental costs |
An obligation to incur restoration, rehabilitation and environmental costs arises when environmental disturbance is caused by the development or ongoing production of a mine or oil fields. Such costs, discounted to net present value, are provided for and a corresponding amount is capitalised at the start of each project, as soon as the obligation to incur such costs arises. These costs are charged to the statement of profit and loss over the life of the operation through the depreciation of the asset and the unwinding of the discount on the provision. The cost estimates are reviewed periodically and are adjusted to reflect known developments which may have an impact on the cost estimates or life of operations. The cost of the related asset is adjusted for changes in the provision due to factors such as updated cost estimates, changes to lives of operations, new disturbance and revisions to discount rates. The adjusted cost of the asset is depreciated prospectively over the lives of the assets to which they relate. The unwinding of the discount is shown as finance cost in the statement of profit and loss.
292
| < BACK TO CONTENTS | Integrated Report | Statutory reports | Financial statements |
Notes forming part of the financial statements
as at and for the year ended March 31, 2021
Costs for the restoration of subsequent site damage, which is caused on an ongoing basis during production, are provided for at their net present value and charged to the statement of profit and loss as extraction progresses. Where the costs of site restoration are not anticipated to be material, they are expensed as incurred.
| (Q) | Accounting for foreign currency transactions |
The functional currency of the Company is determined as the currency of the primary economic environment in which it operates. For all principal businesses of the Company, the functional currency is Indian rupee (₹) with an exception of oil and gas business operations which has a US dollar functional currency as that is the currency of the primary economic environment in which it operates. The financial statements are presented in Indian rupee (₹).
In the financial statements of the Company, transactions in currencies other than the functional currency are translated into the functional currency at the exchange rates ruling at the date of the transaction. Monetary assets and liabilities denominated in other currencies are translated into the functional currency at exchange rates prevailing on the reporting date. Non-monetary assets and liabilities denominated in other currencies and measured at historical cost or fair value are translated at the exchange rates prevailing on the dates on which such values were determined.
All exchange differences are included in the statement of profit and loss except those where the monetary item designated as an effective hedging instrument of the currency risk of designated forecasted sales or purchases, which are recognized in the other comprehensive income.
Exchange differences which are regarded as an adjustment to interest costs on foreign currency borrowings, are capitalized as part of borrowing costs in qualifying assets.
The statement of profit and loss of oil and gas business is translated into Indian Rupees (INR) at the average
rates of exchange during the year / exchange rates as on the date of the transaction. The Balance Sheet is translated at the exchange rate as at the reporting date. Exchange difference arising on translation is recognised in other comprehensive income and would be recycled to the statement of profit and loss as and when these operations are disposed off.
The Company had applied paragraph 46A of AS 11 under Previous GAAP. Ind AS 101 gives an option, which has been exercised by the Company, whereby a first time adopter can continue its Indian GAAP policy for accounting for exchange differences arising from translation of long-term foreign currency monetary items recognised in the Indian GAAP financial statements for the period ending immediately before the beginning of the first Ind AS financial reporting period. Hence, foreign exchange gain/loss on long-term foreign currency monetary items recognized upto 31 March 2016 has been deferred/capitalized. Such exchange differences arising on translation/settlement of long-term foreign currency monetary items and pertaining to the acquisition of a depreciable asset are amortised over the remaining useful lives of the assets.
Exchange differences arising on translation/ settlement of long-term foreign currency monetary items, acquired post 01 April 2016, pertaining to the acquisition of a depreciable asset are charged to the statement of profit and loss.
| (R) | Earnings per share |
The Company presents basic and diluted earnings per share (“EPS”) data for its equity shares. Basic EPS is calculated by dividing the profit or loss attributable to equity shareholders of the Company by the weighted average number of equity shares outstanding during the period. Diluted EPS is determined by adjusting the profit or loss attributable to equity shareholders and the weighted average number of equity shares outstanding for the effects of all dilutive potential equity shares.
| (S) | Buyers’ Credit/ Suppliers’ Credit and vendor financing |
The Company enters into arrangements whereby banks and financial institutions make direct payments to suppliers for raw materials and project materials. The banks and financial institutions are subsequently repaid by the Company at a later date providing working capital timing benefits. These are normally settled up to twelve months (for raw materials) and up to 36 months (for project and materials). Where these arrangements are with a maturity of up to twelve months, the economic substance of the transaction is determined to be operating in nature and these are recognised as operational buyers’ credit/ suppliers’ credit and disclosed on the face of the balance sheet (Refer note 2(C)(ii)).
VEDANTA LIMITED | INTEGRATED REPORT AND ANNUAL ACCOUNTS 2020-21 | 293
STANDALONE CONTINUED...
Notes
forming part of the financial statements as at and for the year ended March 31, 2021
Where such arrangements are with a maturity beyond twelve months and up to thirty six months, the economic substance of the transaction is determined to be financing in nature, and these are presented within borrowings in the balance sheet. Payments made to vendors are treated as cash item and disclosed as cash flows from operating/ investing activity depending on the nature of the underlying transaction. Settlement of dues to banks and financial institution are treated as cash flows from financing activity.
(T) Current and non-current classification
The Company presents assets and liabilities in the balance sheet based on current / non-current classification.
An asset is classified as current when it satisfies any of the following criteria:
| • | it is expected to be realized in, or is intended for sale or consumption in, the Company’s normal operating cycle. |
| • | it is held primarily for the purpose of being traded; |
| • | it is expected to be realized within 12 months after the reporting date; or |
| • | it is cash or cash equivalent unless it is restricted from being exchanged or used to settle a liability for at least 12 months after the reporting date. |
All other assets are classified as non-current.
A liability is classified as current when it satisfies any of the following criteria:
| • | it is expected to be settled in the Company’s normal operating cycle; |
| • | it is held primarily for the purpose of being traded; |
| • | it is due to be settled within 12 months after the reporting date; or |
| • | the Company does not have an unconditional right to defer settlement of the liability for at least 12 months after the reporting date. Terms of a liability that could, at the option of the counterparty, result in its settlement by the issue of equity instruments do not affect its classification. |
All other liabilities are classified as non-current. Deferred tax assets and liabilities are classified as non current only.
(U) Borrowing costs
Borrowing cost includes interest expense as per effective interest rate (EIR) and exchange differences arising from foreign currency borrowings to the extent they are regarded as an adjustment to the interest cost.
Borrowing costs directly relating to the acquisition, construction or production of a qualifying capital project under construction are capitalised and added to the project cost during construction until such time that the assets are substantially ready for their intended use, i.e., when they are capable of commercial production.
Where funds are borrowed specifically to finance a qualifying capital project, the amount capitalised represents the actual borrowing costs incurred. Where surplus funds are available out of money borrowed specifically to finance a qualifying capital project, the income generated from such short-term investments is deducted from the total capitalized borrowing cost. If any specific borrowing remains outstanding after the related asset is ready for its intended use or sale, that borrowing then becomes part of general borrowing. Where the funds used to finance a project form part of general borrowings, the amount capitalised is calculated using a weighted average of rates applicable to relevant general borrowings of the Company during the year.
All other borrowing costs are recognised in the statement of profit and loss in the year in which they are incurred.
Capitalisation of interest on borrowings related to construction or development projects is ceased when substantially all the activities that are necessary to make the assets ready for their intended use are complete or when delays occur outside of the normal course of business.
EIR is the rate that exactly discounts the estimated future cash payments or receipts over the expected life of the financial liability or a shorter period, where appropriate, to the amortised cost of a financial liability. When calculating the effective interest rate, the Company estimates the expected cash flows by considering all the contractual terms of the financial instrument (for example, prepayment, extension, call and similar options).
(V) Cash and cash equivalents
Cash and cash equivalents comprise cash at bank and on hand and short-term money market deposits which have a maturity of three months or less from the date of acquisition, that are readily convertible to known amounts of cash and which are subject to an insignificant risk of changes in value.
For the purpose of the statement of cash flows, cash and cash equivalents consist of cash and short-term deposits, as defined above.
294
| < BACK TO CONTENTS | Integrated Report | Statutory reports | Financial statements |
Notes
forming part of the financial statements as at and for the year ended March 31, 2021
(W) Equity investment in subsidiaries, associates and joint ventures
Investments representing equity interest in subsidiaries, associates and joint ventures are carried at cost. A subsidiary is an entity that is controlled by the Company. Control is evidenced where the Company has the power over the investee or exposed, or has rights, to variable returns from its involvement with the investee and has the ability to affect those returns through its power over the investee. Power is demonstrated through existing rights that give the ability to direct relevant activities, which significantly affect the entity returns. An associate is an entity over which the Company has significant influence. Significant influence is the power to participate in the financial and operating policy decisions of the investee, but is not control or joint control over those policies.
Joint Arrangements
A Joint arrangement is an arrangement of which two or more parties have joint control. Joint control is considered when there is contractually agreed sharing of control of an arrangement, which exists only when decisions about the relevant activities require the unanimous consent of the parties sharing control. Investments in joint arrangements are classified as either joint operations or joint venture. The classification depends on the contractual rights and obligations of each investor, rather than the legal structure of the joint arrangement. A joint operation is a joint arrangement whereby the parties that have joint control of the arrangement have rights to the assets, and obligations for the liabilities, relating to the arrangement. A joint venture is a joint arrangement whereby the parties that have joint control of the arrangement have rights to the net assets of the arrangement.
Joint Operations
The Company has joint operations within its Oil and gas segment and participates in several unincorporated joint operations which involve the joint control of assets used in oil and gas exploration and producing activities. The Company accounts for its share of assets and income and expenditure of joint operations in which it holds an interest. Liabilities in unincorporated joint ventures, where the Company is the operator, is accounted for at gross values (including share of other partners) with a corresponding receivable from the venture partners. These have been included in the financial statements under the appropriate headings. [Details of joint operations are set out in note 39(b)].
(X) Common Control transactions
A business combination involving entities or businesses under common control is a business combination in which all of the combining entities or businesses are ultimately controlled by the same party or parties both before
and after the business combination and the control is not transitory. The transactions between entities under common control are specifically covered by Ind AS 103. Such transactions are accounted for using the pooling-of-interest method. The assets and liabilities of the acquired entity are recognised at their carrying amounts recorded in the parent entity’s consolidated financial statements with the exception of certain income tax and deferred tax assets. No adjustments are made to reflect fair values, or recognise any new assets or liabilities. The only adjustments that are made are to harmonise accounting policies. The components of equity of the acquired companies are added to the same components within the Company’s equity. The difference, if any, between the amounts recorded as share capital issued plus any additional consideration in the form of cash or other assets and the amount of share capital of the transferor is transferred to capital reserve. The company’s shares issued in consideration for the acquired companies are recognised at face value from the moment the acquired companies are included in these financial statements and the financial statements of the commonly controlled entities would be combined, retrospectively, as if the transaction had occurred at the beginning of the earliest reporting period presented. However, the prior year comparative information is only adjusted for periods during which entities were under common control.
(Y) Exceptional items
Exceptional items are those items that management considers, by virtue of their size or incidence (including but not limited to impairment charges and acquisition and restructuring related costs), should be disclosed separately to ensure that the financial information allows an understanding of the underlying performance of the business in the year, so as to facilitate comparison with prior periods. Also tax charges related to exceptional items and certain one-time tax effects are considered exceptional. Such items are material by nature or amount to the year’s result and require separate disclosure in accordance with Ind AS.
3(b) APPLICATION OF NEW AND AMENDED STANDARDS
(A) The Company has adopted, with effect from 01 April 2020, the following new and revised standards and interpretations. Their adoption has not had any significant impact on the amounts reported in the financial statements.
| 1. | Amendments to Ind AS 103 regarding definition of a Business |
| 2. | Amendments to Ind AS 107 and 109 regarding Interest Rate Benchmark Reform |
VEDANTA LIMITED | INTEGRATED REPORT AND ANNUAL ACCOUNTS 2020-21 | 295
STANDALONE CONTINUED...
Notes
forming part of the financial statements as at and for the year ended March 31, 2021
| 3. | Amendments to Ind AS 1 and Ind AS 8 regarding definition of Material |
| 4. | Amendments to Ind AS 116 regarding COVID-19 related rent concessions |
Other Amendments
A number of other minor amendments to existing standards also became effective on 01 April 2020 and have been adopted by the Company. The adoption of these new accounting pronouncements did not have a material impact on the accounting policies, methods of computation or presentation applied by the Company.
(B) Standards notified but not yet effective
There are no new standards that are notified, but not yet effective, upto the date of issuance of the Company’s financial statements.
3(c) SIGNIFICANT ACCOUNTING ESTIMATES AND JUDGEMENTS
The preparation of financial statements in conformity with Ind AS requires management to make judgements, estimates and assumptions that affect the application of accounting policies and the reported amounts of assets, liabilities, income, expenses and disclosures of contingent assets and liabilities at the date of these financial statements and the reported amounts of revenues and expenses for the years presented. These judgments and estimates are based on management’s best knowledge of the relevant facts and circumstances, having regard to previous experience, but actual results may differ materially from the amounts included in the financial statements.
Estimates and underlying assumptions are reviewed on an ongoing basis. Revisions to accounting estimates are recognised in the period in which the estimate is revised and future periods affected.
The information about significant areas of estimation uncertainty and critical judgements in applying accounting policies that have the most significant effect on the amounts recognized in the financial statements are as given below:
(A) Significant Estimates
(i) Impact of COVID-19
The outbreak of novel Coronavirus (COVID-19) pandemic globally and in India and the consequent lockdown restrictions imposed by national governments is causing significant disturbance and slowdown of economic activity across the globe. The commodity prices including oil have seen significant volatility with downward price pressures due to major demand centers affected by lockdown.
The Company is in the business of metals and mining, Oil & gas and generation of power which are considered as either essential goods and services or were generally allowed to continue to carry out the operations with adequate safety measures. The Company has taken proactive measures to comply with various regulations/ guidelines issued by the Government and local bodies to ensure safety of its workforce and the society in general.
The Company has considered possible effects of Covid-19 on the recoverability of its investments, property, plant and equipment (PPE), inventories, loans and receivables, etc in accordance with Ind AS. The Company has considered forecast consensus, industry reports, economic indicators and general business conditions to make an assessment of the implications of the Pandemic. The Company has also performed sensitivity analysis on the assumptions used basis the internal and external information/ indicators of future economic condition. Based on the assessment, the Company had recorded necessary adjustments, including impairment to the extent the carrying amount exceeds the recoverable amount and has disclosed the same as exceptional item during the previous year ended 31 March 2020. No such impairments were identified during the current year. The actual effects of COVID-19 could be different from what is presently assessed and would be known only in due course of time, however no further adjustments are considered necessary at this stage.
(ii) Oil and Gas reserves
Significant technical and commercial judgements are required to determine the Company’s estimated oil and natural gas reserves. Reserves considered for computing depletion are proved reserves for acquisition costs and proved and developed reserves for successful exploratory wells, development wells, processing facilities, distribution assets, estimated future abandonment cost and all other related costs. Reserves for this purpose are considered on working interest basis which are reassessed atleast annually. Details of such reserves are given in note 41.
Changes in reserves as a result of change in management assumptions could impact the depreciation rates and the carrying value of assets (refer note 5).
(iii) Carrying value of exploration and evaluation assets
Exploration assets are assessed by comparing the carrying value to higher of fair value less cost of disposal or value in use if impairment indicators, as contained in Ind AS 106, exists. Change to the valuation of exploration assets is an area of judgement. Further details on the Company’s accounting policies on this are set out in accounting policy above. The amounts for exploration and evaluation assets represent active exploration projects. These amounts will be written off to the statement of profit and loss as exploration costs unless commercial reserves are established or the determination process is not completed and there are no indications of impairment. The outcome of ongoing exploration, and therefore whether the carrying value of exploration and evaluation assets will ultimately be recovered, is inherently uncertain.
296
| < BACK TO CONTENTS | Integrated Report | Statutory reports | Financial statements |
Notes
forming part of the financial statements as at and for the year ended March 31, 2021
Details of carrying values are disclosed in note 5.
(iv) Carrying value of developing/producing oil and gas assets
Management performs impairment tests on the Company’s developing/producing oil and gas assets where indicators of impairment or impairment reversal of previously recorded impairment are identified in accordance with Ind AS 36.
In the current year, the management has reviewed the key assumptions i.e. future production, oil prices, discount to price, Production sharing contract (PSC) life, discount rates, etc. for all of its oil and gas assets. Based on analysis of events that have occurred since then, there did not exist any indication that the assets may be impaired or previously recorded impairment charge may reverse. Hence, detailed impairment analysis has not been conducted in the current financial year. However during the year ended 31 March 2020, management had performed impairment tests on the Company’s developing/producing oil and gas assets and the impairment assessments were based on a range of estimates and assumptions, including:
Estimates/ | Basis | |
| Future production | proved and probable reserves, production facilities, resource estimates and expansion projects | |
| Commodity prices | management’s best estimate benchmarked with external sources of information, to ensure they are within the range of available analyst forecast | |
| Discount to price | management’s best estimate based on historical prevailing discount and updated sales contracts | |
| Extension of PSC | granted till 2030 on the expected commercial terms (Refer note 3(c)(A)(viii) | |
| Discount rates | cost of capital risk-adjusted for the risk specific to the asset/ CGU |
Details of carrying values are disclosed in note 5.
(v) Mining properties and leases
The carrying value of mining property and leases is arrived at by depreciating the assets over the life of the mine using the unit of production method based on
proved & developed reserves. The estimate of reserves is subject to assumptions relating to life of the mine and may change when new information becomes available. Changes in reserves as a result of factors such as production cost, recovery rates, grade of reserves or commodity prices could thus impact the carrying values of mining properties and leases and environmental and restoration provisions.
Management performs impairment tests when there is an indication of impairment. The impairment assessments are based on a range of estimates and assumptions, including:
Estimates/ | Basis | |
| Future production | proved and probable reserves, resource estimates (with an appropriate conversion factor) considering the expected permitted mining volumes and, in certain cases, expansion projects | |
| Commodity prices | management’s best estimate benchmarked with external sources of information, to ensure they are within the range of available analyst forecast | |
| Exchange rates | management best estimate benchmarked with external sources of information | |
| Discount rates | cost of capital risk-adjusted for the risk specific to the asset/ CGU |
There is no impairment recognised during the year. For the year ended 31 March 2020, details of impairment charge and the assumptions used and carrying value are disclosed in note 32 and 5 respectively.
(vi) Recoverability of deferred tax and other income tax assets
The Company has carry forward tax losses, unabsorbed depreciation and MAT credit that are available for offset against future taxable profit. Deferred tax assets are recognised only to the extent that it is probable that taxable profit will be available against which the unused tax losses or tax credits can be utilized. This involves an assessment of when those assets are likely to reverse, and a judgement as to whether or not there will be sufficient taxable profits available to offset the assets. This requires assumptions regarding future profitability, which is inherently uncertain. To the extent assumptions regarding future profitability change, there can be an increase or decrease in the amounts recognised in respect of deferred tax assets and consequential impact in the statement of profit and loss.
The total deferred tax assets recognised in these financial statement (Refer note 33) includes MAT credit entitlements of ₹3,701 Crore (31 March 2020: ₹3,600 Crore), of which 340 Crore is expected to be utilised in the fourteenth year (FY 19-20: ₹3,600 Crore was expected to be utilised in fourteenth and fifteenth year), fifteen years being the maximum permissible time period to utilise the MAT credits.
VEDANTA LIMITED | INTEGRATED REPORT AND ANNUAL ACCOUNTS 2020-21 | 297
STANDALONE CONTINUED...
Notes
forming part of the financial statements as at and for the year ended March 31, 2021
Additionally, the Company has tax receivables on account of refund arising on account of past amalgamation and relating to various tax disputes. The recoverability of these receivables involve application of judgement as to the ultimate outcome of the tax assessment and litigations. This pertains to the application of the legislation, which in certain cases is based upon management’s interpretation of country specific tax law, in particular India, and the likelihood of settlement. Management uses in-house and external legal professionals to make informed decision.
(vii) Copper operations in Tamil Nadu, India
In an appeal filed by the Company against the closure order of the Tuticorin Copper smelter by Tamil Nadu
Pollution Control Board (“TNPCB”), the appellate authority National Green Tribunal (“NGT”) passed an interim order on 31 May 2013 allowing the copper smelter to recommence operations and appointed an Expert Committee to submit a report on the plant operations. Post the interim order, the plant recommenced operations on 23 June 2013. Based on Expert Committee’s report on the operations of the plant stating that the plant’s emission were within prescribed standards and based on this report, NGT ruled on 08 August 2013 that the Copper smelter could continue its operations and recommendations made by the Expert Committee be implemented in a time bound manner. The Group has implemented all of the recommendations. TNPCB has filed an appeal against the order of the NGT before the Supreme Court of India.
In the meanwhile, the application for renewal of Consent to Operate (CTO) for existing copper smelter, required as per procedure established by law was rejected by TNPCB in April 2018. Vedanta Limited has filed an appeal before the TNPCB Appellate Authority challenging the Rejection Order. During the pendency of the appeal, there were protests by a section of local community raising environmental concerns and TNPCB vide its order dated 23 May 2018 ordered closure of existing copper smelter plant with immediate effect. Further, the Government of Tamil Nadu, issued orders dated 28 May 2018 with a direction to seal the existing copper smelter plant permanently. The Company believes these actions were not taken in accordance with the procedure prescribed under applicable laws. Subsequently, the Directorate of Industrial Safety and Health passed orders dated 30 May 2018, directing the immediate suspension and revocation of the Factory License and the Registration Certificate for the existing smelter plant.
The Company has appealed this before the National Green Tribunal (NGT). NGT vide its order on December 15, 2018 has set aside the impugned orders and directed the TNPCB to pass fresh orders for renewal of consent and authorization to handle hazardous substances, subject to appropriate conditions for protection of environment in accordance with law.
The State of Tamil Nadu and TNPCB approached Supreme Court in Civil Appeals on 02 January 2019 challenging the judgement of NGT dated 15 December 2018 and the previously passed judgement of NGT dated 08 August 2013. The Supreme Court vide its judgement dated 18 February 2019 set aside the judgements of NGT dated 15 December 2018 and 08 August 2013 solely on the basis of maintainability and directed the Company to file an appeal in High court.
The Company has filed a writ petition before Madras High Court challenging the various orders passed against the Company in 2018 and 2013. On 18 August 2020, the Madras High Court delivered the judgement wherein it dismissed all the Writ Petitions filed by the Company. The Company has approached the Supreme Court and challenged the said High Court order by way of a Special Leave Petition (SLP) to Appeal and also filed an interim relief for care & maintenance of the plant. The matter was then listed on 02 December 2020 before Supreme Court Bench. The Bench after having heard both the sides concluded that at this stage the interim relief in terms of trial run could not be allowed. Further, considering the voluminous nature of documents and pleadings, the matter shall be finally heard on merits. The matter was again mentioned before the bench on 17 March 2021, wherein the matter was posted for hearing on 17 August 2021.
However, subsequent to the year end, the Company approached the Supreme Court offering to supply medical oxygen from the said facility in view of prevailing COVID-19 situation, which was allowed by the Supreme Court, under supervision of a committee constituted by the Government of Tamil Nadu.
As per the Company’s assessment, it is in compliance with the applicable regulations and expects to get the necessary approvals in relation to the existing operations.
The Company has carried out an impairment analysis for existing plant assets during the year ended 31 March 2021 considering the key variables and concluded that there exists no impairment. The Company has done an additional sensitivity analysis with commencement of operations of the existing plant w.e.f 01 April 2024 and noted that the recoverable amount of the assets would still be in excess of their carrying values.
298
| < BACK TO CONTENTS | Integrated Report | Statutory reports | Financial statements |
Notes
forming part of the financial statements as at and for the year ended March 31, 2021
The carrying value of the assets as at 31 March 2020 is ₹2,328 Crore and 31 March 2021 is ₹2,144 Crore.
Expansion Project:
Separately, the Company has filed a fresh application for renewal of the Environmental Clearance for the proposed Copper Smelter Plant 2 (Expansion Project) dated March 12, 2018 before the Expert Appraisal Committee of the Ministry of Environment, Forests and Climate Change (MoEFCC) wherein a sub-committee was directed to visit the Expansion Project site prior to prescribing the Terms of Reference.
In the meantime, the Madurai Bench of the High Court of Madras in a Public Interest Litigation held vide its order dated 23 May 2018 that the application for renewal of the Environmental Clearance for the Expansion Project shall be processed after a mandatory public hearing and in the interim, ordered the Company to cease construction and all other activities on site for the proposed Expansion Project with immediate effect. MoEFCC has delisted the expansion project since the matter is sub-judice. Separately, SIPCOT vide its letter dated 29 May 2018, cancelled 342.22 acres of the land allotted for the proposed Expansion Project. Further, the TNPCB issued orders on 07 June 2018 directing the withdrawal of the Consent to Establish (CTE) which was valid till 31 March 2023.
The Company has approached Madras High Court by way of writ petition challenging the cancellation of lease deeds by SIPCOT pursuant to which an interim stay has been granted. The Company has also filed Appeals before the TNPCB Appellate Authority challenging withdrawal of CTE by the TNPCB, the matter is pending for adjudication. Considering the delay in existing plant matter and accordingly delay in getting the required approval for Expansion Project, management considered to make provision for impairment for expansion project basis fair value less cost of disposal and accordingly made impairment provision of ₹669 Crore in March 2020. During the current period, there are no updates in the expansion matter and impairment provision of ₹669 Crore is adequate and the net carrying value of ₹97 crore as at 31 March 2021 approximates its recoverable value.
Impairment recognised during the year ended 31 March 2020
For the Expansion Project, the project activities are on halt since May 2018. Further, the project EC for the Expansion Project got expired on 31 December 2018 and fresh application is filed before the competent authority. However, the process will start only after reopening of the existing plant and after obtaining all statutory approvals, the timing of which is uncertain.
Keeping in view the above factors and the fact that value in use cannot be reasonably ascertained, the Company has carried out recoverability assessment of the items of property, plant and equipment, capital work in progress (CWIP) and capital advances. Based on the realisable value estimate of ₹288 Crore, the Company had recognised an impairment of ₹669 Crore (comprising of CWIP balances of ₹435 Crore, capital advances of ₹196 Crore and other assets of ₹38 Crore) during the year ended March 21, 2020.
Property, plant and equipment of ₹1,337 Crore and inventories of ₹284 Crore, pertaining to existing and expansion plant, could not be physically verified, anytime during the year, as the access to the plant is presently restricted. However, since operations are suspended and access to the plant restricted, any difference between book and physical quantities is unlikely to be material.
(viii) PSC Extension
Rajasthan Block
The Company operates an oil and gas production facility in Rajasthan under a Production Sharing Contract (“PSC”). The management is of the opinion that the Company is eligible for automatic extension of the PSC for Rajasthan (“RJ”) block on same terms w.e.f. 15 May 2020, while Government of India (“GoI”) in October 2018, accorded its approval for extension of the PSC, under the Pre-NELP Extension policy as per notification dated 07 April 2017 (“Pre-NELP Policy”), for RJ block by a period of 10 years, w.e.f. 15 May 2020. As per the said policy and extension letter, the Company is required to comply with certain conditions and pay an additional 10% profit oil to GoI. The Company had challenged the applicability of Pre NELP Policy to the RJ block. The Division Bench of the Delhi High Court in March 2021 set aside the single judge order of May 2018 which allowed automatic extension of PSC. The Company is studying the order and all available legal remedies are being evaluated for further action as appropriate.
One of the conditions for extension of PSC relates to notification of certain audit exceptions raised for FY 16-17 as per PSC provisions and provides for payment of amounts, if such audit exceptions result into any creation of liability.
VEDANTA LIMITED | INTEGRATED REPORT AND ANNUAL ACCOUNTS 2020-21 | 299
STANDALONE CONTINUED...
Notes
forming part of the financial statements as at and for the year ended March 31, 2021
The Directorate General of Hydrocarbons (“DGH”) in May 2018 raised a demand on the Company and its subsidiary for the period up to 31 March 2017 for Government’s additional share of Profit oil based on its computation of disallowance of costs incurred in excess of the initially approved Field Development Plan (“FDP”) of the pipeline project for ₹1,477 Crore (US$202 million) and retrospective re-allocation of certain common costs between Development Areas (“DAs”) of RJ block aggregating to ₹2,669 Crore (US$364 million). The DGH vide its letter dated 12 May 2020, reiterated its demand only with respect to the retrospective re-allocation of certain common costs between DAs of the RJ block of ₹2,669 Crore (US$364 million towards contractor share for the period upto 31 March 2017. This amount was subsequently revised to ₹3,360 Crore (US$458 million) till March 2018 vide DGH letter dated 24 December 2020. The Company in January 2020 received notifications from the DGH on audit exceptions arising out of its audit for the FY 2017-18, which comprises the consequential effects on profit oil due to the aforesaid matters and certain new matters on cost allowability plus interest aggregating to US$645 million, representing share of the Company and its subsidiary, CEHL (“the Claimants”), which have been suitably responded to by the Company.
The Company believes that it has sufficient as well as reasonable basis pursuant to the PSC provisions and related approvals, supported by legal advice, for having claimed such costs and for allocating common costs between different DAs. In the Company’s opinion, these computations of the aforesaid demand / audit exceptions are not appropriate, and the accounting adjustments sought for issues pertaining to Year 2007 and onwards are based on assumptions that are not in consonance with the approvals already in place. The Company’s view is also supported by independent legal opinion and the Company has been following the process set out in PSC to resolve these aforesaid matters. The Company has also invoked the PSC process for resolution of disputed exceptions and has issued notice for arbitration and the tribunal stands constituted. Further, on 23 September 2020, the GoI had filed an application for interim relief before Delhi High Court seeking payment of all disputed dues. This matter is now scheduled for hearing on 20 May 2021.
Also, on Vedanta’s application under section 17 of the Arbitration and Conciliation Act, 1996, the tribunal in December 2020 ordered that GoI should not take any action to enforce any of the amounts at issue in this arbitration against the Claimants during the arbitral period. The GoI has challenged the said order before the Delhi High Court under the said Act. This matter is also scheduled for hearing on 20 May 2021.
In management’s view, the above mentioned condition on demand raised by the DGH for additional petroleum linked to PSC extension is untenable and has not resulted in creation of any liability and cannot be a ground for non-extension. In addition, all necessary procedures prescribed in the PSC including invocation of arbitration, in respect of the stated audit observation have also been fulfilled. Accordingly, the PSC extension approval granted
vide DGH letter dated 26 October 2018 upholds with all conditions addressed and no material liability would devolve upon the Group.
Simultaneously, the Company is also pursuing with the GoI for executing the RJ PSC addendum at the earliest. In view of extenuating circumstances surrounding COVID-19 and pending signing of the PSC addendum for extension after complying with all stipulated conditions, the GoI has been granting interim permission to the Company to continue Petroleum operations in the RJ block. The latest permission is valid upto 31 July 2021 or signing of the PSC addendum, whichever is earlier.
Ravva Block
The Government of India (GoI) has granted its approval for a ten-year extension of PSC for Ravva Block with effect from 28 October 2019, in terms of the provision of the “Policy on the Grant of the extension to Production Sharing Contract Signed by Government awarding small, medium-sized and discovered field to private joint ventures” dated March 28, 2016. The PSC addendum recording this extension has been executed by all parties. The Ravva Extension Policy, amongst others, provides for an increased share of profit petroleum of 10% for the GoI during the extended term of the Ravva PSC and payment of royalty and cess as per prevailing rate in accordance with the PNG Rules, 1959 and OIDB Act. Under the Ravva PSC, –the Company’s oil and gas business is entitled to recover 100% of cost of production and development from crude oil and natural gas sales before any profit is allocated among the parties. Cost recovery for exploration cost during extension period shall be governed as per the provision of Office Memorandum 2013, 2019 issued by MoPNG on exploration in mining lease area post expiry of the exploration period.
(ix) Impact of Taxation Laws (Amendment) Act, 2019
Pursuant to the introduction of Section 115BAA of the Income Tax Act, 1961 which is effective 01 April 2019, companies in India have the option to pay corporate income tax at the rate of 22% plus applicable surcharge and cess as against the earlier rate of 30% plus applicable surcharge and cess, subject to certain conditions like, the company has to forego all benefits like tax holidays, brought forward losses generated through tax incentives/additional depreciation and outstanding MAT credit. Considering all the provisions under Section 115BAA and based on the expected timing of exercising of the option under Section 115BAA, the Company has re- measured its deferred tax balances as at 31 March 2021. This computation requires assumptions regarding future profitability, which is inherently uncertain. To the extent assumptions regarding future profitability change, there can be increase or decrease in the amounts recognised (Refer note 33).
300
| < BACK TO CONTENTS | Integrated Report | Statutory reports | Financial statements |
Notes
forming part of the financial statements as at and for the year ended March 31, 2021
(x) Assessment of impairment of assets at Aluminium division
During year ended March 31,2020, considering lower sales realisation, an impairment trigger was identified in the aluminium division of the Company. The impairment assessments are based on a range of estimates and assumptions, including:
Estimates/ assumptions | Basis | |
Future production | Production facilities and expansion projects | |
Commodity prices | management’s best estimate benchmarked with external sources of information, to ensure they are within the range of available analyst forecast | |
| Discount to price | management’s best estimate based on historical prevailing discount | |
| Discount rates | cost of capital risk-adjusted for the risk specific to the asset/ CGU | |
During the previous year, the Company had carried out an impairment analysis, based on value in use approach, considering the key variables and concluded that there existed no impairment. The Company had carried out sensitivity analysis on key assumptions including commodity price, discount rate and delay in expansion of refinery. Based on sensitivity analysis, the recoverable amount was expected to exceed the carrying value as at 31 March 2020 of ₹36,992 Crore. No negative developments have occurred since the previous year, while the commodity price have increased. Accordingly, it is not expected that the carrying amount would exceed the recoverable amount and hence the recoverable value for the year ended 31 March 2021 was not re-determined.
(xi) Going Concern
Considering the uncertainties caused due to Covid-19, the Company prepared its cash flow forecasts under various scenarios and has performed additional sensitivities on certain key assumptions. Based on such an analysis and assessment of its ability to raise additional capital, the Company continues to prepare its financial statements on a going concern basis.
(B) Significant Judgement
(i) Contingencies
In the normal course of business, contingent liabilities may arise from litigation, taxation and other claims against the Company. A provision is recognised when the Company has a present obligation as a result of past events and it is probable that the Company will be required to settle that obligation.
Where it is management’s assessment that the outcome cannot be reliably quantified or is uncertain, the claims are disclosed as contingent liabilities unless the likelihood of an adverse outcome is remote. Such liabilities are disclosed in the notes but are not provided for in the financial statements.
When considering the classification of legal or tax cases as probable, possible or remote, there is judgement involved. This pertains to the application of the legislation, which in certain cases is based upon management’s interpretation of country specific applicable law, in particular India, and the likelihood of settlement. Management uses in-house and external legal professionals to make informed decision.
Although there can be no assurance regarding the final outcome of the legal proceedings, the Company does not expect them to have a materially adverse impact on the Company’s financial position or profitability. These are set out in Note 36.
(ii) Revenue recognition and receivable recovery in relation to the power division
In certain cases, the Company’s power customers are disputing various contractual provisions of Power Purchase Agreements (PPA). Significant judgement is required in both assessing the tariff to be charged under the PPA in accordance with Ind AS 115 and to assess the recoverability of withheld revenue currently accounted for as receivables.
In assessing this critical judgment, management considered favourable external legal opinions that the Company has obtained in relation to the claims. In addition, the fact that the contracts are with government owned companies implies the credit risk is low [refer note 7 (c)].
(iii) Exceptional items:
Exceptional items are those items that management considers, by virtue of their size or incidence (including but not limited to impairment charges and acquisition and restructuring related costs), should be disclosed separately to ensure that the financial information allows an understanding of the underlying performance of the business in the year, so as to facilitate comparison with prior periods. Also tax charges related to exceptional items and certain one-time tax effects are considered Exceptional. Such items are material by nature or amount to the year’s result and require separate disclosure in accordance with Ind AS.
VEDANTA LIMITED | INTEGRATED REPORT AND ANNUAL ACCOUNTS 2020-21 | 301
STANDALONE CONTINUED...
Notes
forming part of the financial statements as at and for the year ended March 31, 2021
The determination as to which items should be disclosed separately requires a degree of judgement. The details of exceptional items are set out in note 32.
3(D) BUSINESS COMBINATION AND OTHERS:
| A. | Ferro Alloys Corporation Limited |
On 21 September 2020, the Company acquired control over Ferro Alloys Corporation Limited (“FACOR”). FACOR was admitted under Corporate insolvency resolution process in terms of the Insolvency and Bankruptcy Code, 2016 of India. The National Company Law Tribunal (NCLT) vide its order dated 30 January 2020 approved the resolution plan for acquiring controlling stake in FACOR. Pursuant to the approved resolution plan, FACOR has become a wholly owned subsidiary of the Company. FACOR holds 90% equity in its subsidiary, Facor Power Limited (FPL). The consideration paid for the acquisition of FACOR by the Company includes cash of ₹56 Crore (equity of ₹34 Crore and inter-corporate loan of ₹22 Crore) and zero coupon, secured and unlisted Non- Convertible Debentures of aggregate face value of ₹287 Crore to the Financial Creditors payable equally over 4 years commencing March 2021.
FACOR is in the business of producing Ferro Alloys and owns a Ferro Chrome plant with capacity of 72,000 TPA, two operational Chrome mines and 100 MW of Captive Power Plant through its subsidiary, FACOR Power Limited (FPL). The acquisition will complement the Group’s existing steel business as the vertical integration of ferro manufacturing capabilities has the potential to generate significant efficiencies.
| B. | Global coke - Acquisition of global coke plant |
On 28 July 2019, the Company acquired Sindhudurg plant of Global Coke Limited which was under liquidation as per the Insolvency and Bankruptcy Code 2016 (including all amendments for the time being in force) for a cash consideration of ₹33 Crore. The assets acquired mainly included Land, Building and Plant & Machinery of similar value as the cash consideration and hence no goodwill was recorded. The acquisition complements backward integration opportunity for the Company’s existing pig iron division and also increase Company’s footprint in met coke market in south western part of India. Detailed disclosure of fair value of the identifiable assets and liabilities of Sindhudurg plant has not been provided as the same is not material.
Acquisition costs related to the same were not material.
4 SEGMENT INFORMATION
| A) | Description of segment and principal activities |
The Company is a diversified natural resource company engaged in exploring, extracting and processing minerals and oil and gas. The Company produces oil and gas, aluminium, copper, iron ore and power. The Company has five reportable segments: oil and gas, aluminium, copper, iron ore and power. The management of the Company is organized by its main products: oil and gas, aluminium, copper, iron ore and power. Each of the reportable segments derives its revenues from these main products and hence these have been identified as reportable segments by the Company’s Chief Operating Decision Maker (“CODM”).
Segment Revenue, Results, Assets and Liabilities include the respective amounts identifiable to each of the segments and amount allocated on a reasonable basis. Unallocated expenditure consist of common expenditure incurred for all the segments and expenses incurred at corporate level. The assets and liabilities that cannot be allocated between the segments are shown as unallocated assets and unallocated liabilities respectively.
The accounting policies of the reportable segments are the same as the Company’s accounting policies described in Note 3. Earnings before Interest, Tax and Depreciation & Amortisation (EBITDA) are evaluated regularly by the CODM, in deciding how to allocate resources and in assessing performance. The operating segments reported are the segments of the Company for which separate financial information is available.The Company’s financing (including finance costs and finance income) and income taxes are reviewed on an overall basis and are not allocated to operating segments.
Pricing between operating segments are on an arm’s length basis in a manner similar to transactions with third parties.
The following table presents revenue and profit information and certain assets and liabilities information regarding the Company’s business segments as at and for the year ended 31 March 2021 and 31 March 2020 respectively.
302
| < BACK TO CONTENTS | Integrated Report | Statutory reports | Financial statements |
Notes
forming part of the financial statements as at and for the year ended March 31, 2021
For the year ended 31 March 2021
| (₹ in crores) | ||||||||||||||||||||||||||||
| Business Segments | ||||||||||||||||||||||||||||
Particulars | Oil and Gas | Aluminium | Copper | Iron Ore | Power Eliminations | Total | ||||||||||||||||||||||
Revenue | ||||||||||||||||||||||||||||
External revenue | 4,086 | 20,162 | 7,623 | 4,529 | 720 | — | 37,120 | |||||||||||||||||||||
Inter segment revenue | — | — | — | — | — | — | — | |||||||||||||||||||||
|
|
|
|
|
|
|
|
|
|
|
|
|
| |||||||||||||||
Segment revenue | 4,086 | 20,162 | 7,623 | 4,529 | 720 | — | 37,120 | |||||||||||||||||||||
Results | ||||||||||||||||||||||||||||
EBITDA a | 1,743 | 5,471 | (105 | ) | 1,735 | (55 | ) | — | 8,789 | |||||||||||||||||||
Depreciation, depletion and amortisation expense | 708 | 1,389 | 205 | 89 | 128 | — | 2,519 | |||||||||||||||||||||
Other income b | — | 56 | 2 | 6 | 11 | — | 75 | |||||||||||||||||||||
|
|
|
|
|
|
|
|
|
|
|
|
|
| |||||||||||||||
Segment Results | 1,035 | 4,138 | (308 | ) | 1,652 | (172 | ) | — | 6,345 | |||||||||||||||||||
Less: Unallocated expenses | 79 | |||||||||||||||||||||||||||
Less: Finance costs | 3,193 | |||||||||||||||||||||||||||
Add: Other income (excluding exchange difference and deferred grant) | 10,823 | |||||||||||||||||||||||||||
Add: Net exceptional loss | (232 | ) | ||||||||||||||||||||||||||
Net profit before tax | 13,664 | |||||||||||||||||||||||||||
Other information | ||||||||||||||||||||||||||||
|
|
|
|
|
|
|
|
|
|
|
|
|
| |||||||||||||||
Segment Assets | 13,161 | 42,303 | 5,289 | 2,548 | 3,161 | 66,462 | ||||||||||||||||||||||
Financial asset investments | 62,903 | |||||||||||||||||||||||||||
Deferred tax assets | 333 | |||||||||||||||||||||||||||
Income tax assets (net of provisions) | 1,787 | |||||||||||||||||||||||||||
Cash & cash equivalents (including other bank balances & bank deposits) | 4,395 | |||||||||||||||||||||||||||
Others | 1,851 | |||||||||||||||||||||||||||
Total Assets | 137,731 | |||||||||||||||||||||||||||
|
| |||||||||||||||||||||||||||
Segment Liabilities | 7,403 | 13,508 | 3,895 | 2,301 | 210 | 27,317 | ||||||||||||||||||||||
|
|
|
|
|
|
|
|
|
|
|
|
|
| |||||||||||||||
Borrowings | 32,166 | |||||||||||||||||||||||||||
Income tax liabilities (net) | 46 | |||||||||||||||||||||||||||
Others | 1,412 | |||||||||||||||||||||||||||
Total Liabilities | 60,941 | |||||||||||||||||||||||||||
Capital Expenditure c | 1,082 | 1,517 | 21 | 111 | — | — | 2,733 | |||||||||||||||||||||
Capital work-in-progress written off | — | (181 | ) | — | — | (181 | ) | |||||||||||||||||||||
| a) | EBITDA is a non-GAAP measure |
| b) | Amorisation of duty benefits relating to assets recognised as government grant. |
| c) | Total Capital expenditure includes capital expenditure of ₹2 Crore not allocable to any segment. |
VEDANTA LIMITED | INTEGRATED REPORT AND ANNUAL ACCOUNTS 2020-21 | 303
STANDALONE CONTINUED...
Notes
forming part of the financial statements as at and for the year ended March 31, 2021
For the year ended 31 March 2020
| (₹ in crores) | ||||||||||||||||||||||||||||
| Business Segments | ||||||||||||||||||||||||||||
Particulars | Oil and Gas | Aluminium | Copper | Iron Ore | Power | Eliminations | Total | |||||||||||||||||||||
Revenue | ||||||||||||||||||||||||||||
External revenue | 6,756 | 19,022 | 5,972 | 3,461 | 206 | — | 35,417 | |||||||||||||||||||||
Inter segment revenue | — | — | — | 2 | — | (2 | ) | |||||||||||||||||||||
|
|
|
|
|
|
|
|
|
|
|
|
|
| |||||||||||||||
Segment revenue | 6,756 | 19,022 | 5,972 | 3,463 | 206 | 35,417 | ||||||||||||||||||||||
Results | ||||||||||||||||||||||||||||
EBITDA a | 3,884 | 1,539 | (234 | ) | 925 | (118 | ) | — | 5,996 | |||||||||||||||||||
Depreciation, depletion and amortisation expense | 1,478 | 1,356 | 200 | 101 | 129 | — | 3,264 | |||||||||||||||||||||
Other income b | — | 54 | 2 | 6 | 12 | — | 74 | |||||||||||||||||||||
|
|
|
|
|
|
|
|
|
|
|
|
|
| |||||||||||||||
Segment Results | 2,406 | 237 | (432 | ) | 830 | (235 | ) | — | 2,806 | |||||||||||||||||||
Less: Unallocated expenses | 122 | |||||||||||||||||||||||||||
Less: Finance costs | 3,328 | |||||||||||||||||||||||||||
Add: Other income (excluding exchange difference and deferred grant) | 2,749 | |||||||||||||||||||||||||||
Add: Net exceptional loss | (12,568 | ) | ||||||||||||||||||||||||||
Net loss before tax | (10,463 | ) | ||||||||||||||||||||||||||
Other information | ||||||||||||||||||||||||||||
Segment Assets | 10,900 | 42,792 | 5,865 | 2,549 | 3,342 | — | 65,448 | |||||||||||||||||||||
Financial asset investments | 62,905 | |||||||||||||||||||||||||||
Deferred tax asset | 3,464 | |||||||||||||||||||||||||||
Income tax assets (net of provisions) | 1,682 | |||||||||||||||||||||||||||
Cash & cash equivalents (including other bank balances & bank deposits) | 2,910 | |||||||||||||||||||||||||||
Others | 3,041 | |||||||||||||||||||||||||||
Total Assets | 139,450 | |||||||||||||||||||||||||||
Segment Liabilities | 8,501 | 15,369 | 4,155 | 1,098 | 156 | 29,279 | ||||||||||||||||||||||
Borrowings | 38,937 | |||||||||||||||||||||||||||
Income tax liabilities (net) | 46 | |||||||||||||||||||||||||||
Others | 1,293 | |||||||||||||||||||||||||||
Total Liabilities | 69,555 | |||||||||||||||||||||||||||
Capital Expenditure c | 2,627 | 1,182 | 61 | 102 | 5 | — | 3,980 | |||||||||||||||||||||
|
|
|
|
|
|
|
|
|
|
|
|
|
| |||||||||||||||
Impairment charge - net / provision d | 8,273 | — | 669 | — | — | — | 12,335 | |||||||||||||||||||||
|
|
|
|
|
|
|
|
|
|
|
|
|
| |||||||||||||||
| a) | EBITDA is a non-GAAP measure |
| b) | Amorisation of duty benefits relating to assets recognised as government grant. |
| c) | Total Capital expenditure includes capital expenditure of ₹3 Crore not allocable to any segment. |
| d) | Total of Impairment charge - net / provision includes net impairment charge on investment in subsidiaries of ₹3,393 Crore not allocable to any segment (Refer note 32). |
304
| < BACK TO CONTENTS | Integrated Report | Statutory reports | Financial statements |
Notes
forming part of the financial statements as at and for the year ended March 31, 2021
| B) | Geographical segment analysis |
The following table provides an analysis of the Company’s sales by region in which the customer is located, irrespective of the origin of the goods.
| (₹ in crores) | ||||||||
Geographical Segments | Year ended 31 March 2021 | Year ended 31 March 2020 | ||||||
Revenue by geographical segment | ||||||||
India | 19,328 | 19,013 | ||||||
China | 3,483 | 839 | ||||||
UAE | 49 | 24 | ||||||
Malaysia | 4,209 | 5,341 | ||||||
Others | 10,051 | 10,200 | ||||||
|
|
|
| |||||
Total | 37,120 | 35,417 | ||||||
|
|
|
| |||||
The following is an analysis of the carrying amount of non-current assets, excluding deferred tax assets and financial assets, analysed by the geographical area in which the assets are located:
| (₹ in crores) | ||||||||
Carrying Amount of Segment Assets | As at 31 March 2021 | As at 31 March 2020 | ||||||
India | 53,108 | 53,158 | ||||||
|
|
|
| |||||
Total | 53,108 | 53,158 | ||||||
|
|
|
| |||||
| C) | Information about major customers |
Revenue from one customer amounted to ₹4,932 Crore (31 March 2020: one customer, ₹3,589 Crore), arising from sales made in the Aluminium and Copper segment. No other customer contributed to more than 10% of revenues.
| D) | Disaggregation of revenue |
Below table summarises the disaggregated revenue from contract with customers:
| (₹ in crores) | ||||||||
Particulars | Year ended 31 March 2021 | Year ended 31 March 2020 | ||||||
Oil | 3,491 | 5,853 | ||||||
Gas | 385 | 447 | ||||||
Aluminium products | 19,513 | 18,145 | ||||||
Copper Cathode | 7,084 | 4,291 | ||||||
Iron Ore | 2,173 | 1,482 | ||||||
Metallurgical coke | 297 | 66 | ||||||
Pig Iron | 1,882 | 1,845 | ||||||
Power | 720 | 205 | ||||||
Others | 1,315 | 2,791 | ||||||
Revenue from contracts with customers* | 36,859 | 35,125 | ||||||
Gains/(losses) from provisionally priced contracts under Ind AS 109 | 261 | (346 | ) | |||||
JV partner’s share of the exploration costs approved under the OM (Refer note 26(b)) | — | 638 | ||||||
|
|
|
| |||||
Total Revenue | 37,120 | 35,417 | ||||||
|
|
|
| |||||
| * | includes revenues from sale of services aggregating to ₹101 Crore (FY 2019-20: ₹431 Crore) which is recorded over a period of time and the balance revenue is recognised at a point in time. |
VEDANTA LIMITED | INTEGRATED REPORT AND ANNUAL ACCOUNTS 2020-21 | 305
STANDALONE CONTINUED...
Notes
forming part of the financial statements as at and for the year ended March 31, 2021
| 5 | PROPERTY, PLANT AND EQUIPMENT, INTANGIBLE ASSETS, CAPITAL WORK-IN-PROGRESS AND EXPLORATION INTANGIBLE ASSETS UNDER DEVELOPMENT |
| (₹ in crores) | ||||||||||||||||||||||||||||||||||||||||||||||||||||
Particulars | Freehold Land | Buildings | Plant and equipment | Mining property | Oil & gas producing facilities | Furniture and fixtures | Vehicles | Office equipment | Right of Use assets | Total | Capital work-in- progress (CWIP) | Exploration intangible assets under development | Total including capital work- in-progress and Exploration intangible assets under development | |||||||||||||||||||||||||||||||||||||||
Gross Block | ||||||||||||||||||||||||||||||||||||||||||||||||||||
As at 01 April 2019 | 1,143 | 6,860 | 40,411 | 26 | 44,076 | 178 | 287 | 386 | — | 93,367 | 25,154 | 2,080 | 120,601 | |||||||||||||||||||||||||||||||||||||||
ROU assets as at 01 April 2019 | — | — | — | — | — | — | — | — | 408 | 408 | — | — | 408 | |||||||||||||||||||||||||||||||||||||||
Additions | 7 | 48 | 733 | — | 107 | 6 | 26 | 33 | 463 | 1,423 | 2,450 | 351 | 4,224 | |||||||||||||||||||||||||||||||||||||||
Acquisition through business combination (Refer note 3 (b)) | 12 | 7 | 14 | — | — | — | — | — | — | 33 | — | — | 33 | |||||||||||||||||||||||||||||||||||||||
Transfers / Reclassifications h | (335 | ) | 40 | 847 | — | 778 | 1 | 26 | 4 | — | 1,361 | (1,720 | ) | 9 | (350 | ) | ||||||||||||||||||||||||||||||||||||
Disposals/ Adjustments | (6 | ) | (269 | ) | — | (9 | ) | (1 | ) | (10 | ) | (4 | ) | (224 | ) | (523 | ) | — | — | — | (523 | ) | ||||||||||||||||||||||||||||||
Exploration costs written off (Refer note 31) | — | — | — | — | — | — | — | — | — | — | — | (1 | ) | (1 | ) | |||||||||||||||||||||||||||||||||||||
Exchange differences | 11 | 95 | 524 | — | 3,641 | 7 | 19 | 19 | 4,316 | 1,301 | 190 | 5,807 | ||||||||||||||||||||||||||||||||||||||||
|
|
|
|
|
|
|
|
|
|
|
|
|
|
|
|
|
|
|
|
|
|
|
|
|
| |||||||||||||||||||||||||||
As at 31 March 2020 | 838 | 7,044 | 42,260 | 26 | 48,593 | 191 | 329 | 438 | 666 | 100,385 | 27,185 | 2,629 | 130,199 | |||||||||||||||||||||||||||||||||||||||
|
|
|
|
|
|
|
|
|
|
|
|
|
|
|
|
|
|
|
|
|
|
|
|
|
| |||||||||||||||||||||||||||
Additions | 5 | 46 | 972 | 23 | 23 | 14 | 9 | 1,092 | 1,007 | 576 | 2,675 | |||||||||||||||||||||||||||||||||||||||||
Transfers / Reclassifications | 1 | 10 | 2,387 | — | 567 | 11 | (33 | ) | 1 | 2,944 | (2,949 | ) | 4 | (1 | ) | |||||||||||||||||||||||||||||||||||||
Disposals/ Adjustments | — | — | (202 | ) | — | (4 | ) | (2 | ) | (6 | ) | (5 | ) | — | (219 | ) | — | — | (219 | ) | ||||||||||||||||||||||||||||||||
Exploration costs written off (Refer note 31) | — | — | — | — | — | — | — | — | — | — | — | (6 | ) | (6 | ) | |||||||||||||||||||||||||||||||||||||
Exchange differences | (3 | ) | (26 | ) | (146 | ) | — | (990 | ) | (2 | ) | — | (5 | ) | (8 | ) | (1,180 | ) | (347 | ) | (59 | ) | (1,586 | ) | ||||||||||||||||||||||||||||
|
|
|
|
|
|
|
|
|
|
|
|
|
|
|
|
|
|
|
|
|
|
|
|
|
| |||||||||||||||||||||||||||
As at 31 March 2021 | 841 | 7,074 | 45,271 | 26 | 48,166 | 221 | 313 | 443 | 667 | 103,022 | 24,896 | 3,144 | 131,062 | |||||||||||||||||||||||||||||||||||||||
|
|
|
|
|
|
|
|
|
|
|
|
|
|
|
|
|
|
|
|
|
|
|
|
|
| |||||||||||||||||||||||||||
Accumulated depreciation, depletion, amortisation and impairment | ||||||||||||||||||||||||||||||||||||||||||||||||||||
As at 01 April 2019 | 132 | 2,499 | 10,597 | 26 | 38,595 | 121 | 77 | 348 | — | 52,395 | 11,006 | 497 | 63,898 | |||||||||||||||||||||||||||||||||||||||
ROU assets as at 01 April, 2019 | — | — | — | — | — | — | — | — | — | — | — | — | — | |||||||||||||||||||||||||||||||||||||||
Charge for the year | 5 | 203 | 1,655 | — | 1,291 | 22 | 23 | 27 | 72 | 3,298 | 3,298 | |||||||||||||||||||||||||||||||||||||||||
Disposals / Adjustments | — | — | (48 | ) | — | — | (1 | ) | (7 | ) | (4 | ) | (28 | ) | (88 | ) | — | — | (88 | ) | ||||||||||||||||||||||||||||||||
Impairment charge for the year (note 32) | — | 17 | — | — | 3,615 | — | — | — | 22 | 3,654 | 4,115 | 977 | 8,746 | |||||||||||||||||||||||||||||||||||||||
Transfers / Reclassifications | — | — | (7 | ) | — | — | — | 7 | — | — | — | — | — | — | ||||||||||||||||||||||||||||||||||||||
Exchange differences | 9 | 93 | 480 | — | 3,431 | 6 | 17 | 3 | 4,039 | 1,037 | 96 | 5,172 | ||||||||||||||||||||||||||||||||||||||||
|
|
|
|
|
|
|
|
|
|
|
|
|
|
|
|
|
|
|
|
|
|
|
|
|
| |||||||||||||||||||||||||||
As at 31 March 2020 | 146 | 2,812 | 12,677 | 26 | 46,932 | 148 | 100 | 388 | 69 | 63,298 | 16,158 | 1,570 | 81,026 | |||||||||||||||||||||||||||||||||||||||
|
|
|
|
|
|
|
|
|
|
|
|
|
|
|
|
|
|
|
|
|
|
|
|
|
| |||||||||||||||||||||||||||
Charge for the year | 3 | 184 | 1,731 | — | 475 | 7 | 24 | 26 | 81 | 2,531 | 2,531 | |||||||||||||||||||||||||||||||||||||||||
Disposals / Adjustments | — | (1 | ) | (130 | ) | — | (4 | ) | (1 | ) | (4 | ) | (4 | ) | — | (144 | ) | (144 | ) | |||||||||||||||||||||||||||||||||
Capital work-in-progress/Impairment charge for the year (note 32) | — | — | — | — | — | — | — | — | — | — | 181 | — | 181 | |||||||||||||||||||||||||||||||||||||||
Transfers / Reclassifications | — | — | 8 | — | 241 | — | (7 | ) | (1 | ) | — | 241 | (241 | ) | — | — | ||||||||||||||||||||||||||||||||||||
Exchange differences | (3 | ) | (25 | ) | (131 | ) | — | (959 | ) | (2 | ) | — | (5 | ) | (1 | ) | (1,126 | ) | (298 | ) | (31 | ) | (1,455 | ) | ||||||||||||||||||||||||||||
|
|
|
|
|
|
|
|
|
|
|
|
|
|
|
|
|
|
|
|
|
|
|
|
|
| |||||||||||||||||||||||||||
As at 31 March 2021 | 146 | 2,970 | 14,155 | 26 | 46,685 | 152 | 113 | 404 | 149 | 64,800 | 15,800 | 1,539 | 82,139 | |||||||||||||||||||||||||||||||||||||||
|
|
|
|
|
|
|
|
|
|
|
|
|
|
|
|
|
|
|
|
|
|
|
|
|
| |||||||||||||||||||||||||||
Net Book Value/Carrying amount | ||||||||||||||||||||||||||||||||||||||||||||||||||||
As at 01 April 2019 | 1,011 | 4,361 | 29,814 | 5,481 | 57 | 210 | 38 | — | 40,972 | 14,148 | 1,583 | 56,703 | ||||||||||||||||||||||||||||||||||||||||
As at 31 March 2020 | 692 | 4,232 | 29,583 | — | 1,661 | 43 | 229 | 50 | 597 | 37,087 | 11,027 | 1,059 | 49,173 | |||||||||||||||||||||||||||||||||||||||
|
|
|
|
|
|
|
|
|
|
|
|
|
|
|
|
|
|
|
|
|
|
|
|
|
| |||||||||||||||||||||||||||
As at 31 March 2021 | 695 | 4,104 | 31,116 | — | 1,481 | 69 | 200 | 39 | 518 | 38,222 | 9,096 | 1,605 | 48,923 | |||||||||||||||||||||||||||||||||||||||
|
|
|
|
|
|
|
|
|
|
|
|
|
|
|
|
|
|
|
|
|
|
|
|
|
| |||||||||||||||||||||||||||
306
| < BACK TO CONTENTS | Integrated Report | Statutory reports | Financial statements |
Notes
forming part of the financial statements as at and for the year ended March 31, 2021
Right of Use assets
| ROU Land | ROU Building | ROU Plant and Equipment | Total | |||||||||||||
Gross Block | ||||||||||||||||
As at 01 April 2019 | ||||||||||||||||
ROU asset as at 01 April 2019 | 184 | 224 | — | 408 | ||||||||||||
Additions | 94 | 35 | 334 | 463 | ||||||||||||
Disposals/ Adjustments | — | (224 | ) | — | (224 | ) | ||||||||||
Exchange differences | — | 8 | 11 | 19 | ||||||||||||
|
|
|
|
|
|
|
| |||||||||
As at 31 March 2020 | 278 | 43 | 345 | 666 | ||||||||||||
|
|
|
|
|
|
|
| |||||||||
Additions | 6 | — | 3 | 9 | ||||||||||||
Exchange differences | — | (1 | ) | (7 | ) | (8 | ) | |||||||||
|
|
|
|
|
|
|
| |||||||||
As at 31 March 2021 | 284 | 42 | 341 | 667 | ||||||||||||
|
|
|
|
|
|
|
| |||||||||
Accumulated depreciation and impairment | ||||||||||||||||
As at 01 April 2019 | ||||||||||||||||
ROU balance on 01 April 2019 | — | — | — | — | ||||||||||||
Charge for the year | 20 | 34 | 18 | 72 | ||||||||||||
Impairment charge/(reversal) for the year | 22 | — | — | 22 | ||||||||||||
Disposals/ Adjustments | — | (28 | ) | — | (28 | ) | ||||||||||
Exchange differences | — | 2 | 1 | 3 | ||||||||||||
|
|
|
|
|
|
|
| |||||||||
As at 31 March 2020 | 42 | 8 | 19 | 69 | ||||||||||||
|
|
|
|
|
|
|
| |||||||||
Charge for the year | 12 | 7 | 62 | 81 | ||||||||||||
Exchange differences | — | — | (1 | ) | (1 | ) | ||||||||||
|
|
|
|
|
|
|
| |||||||||
As at 31 March 2021 | 54 | 15 | 80 | 149 | ||||||||||||
|
|
|
|
|
|
|
| |||||||||
Net Book Value/Carrying amount | ||||||||||||||||
As at 01 April 2019 | — | — | — | — | ||||||||||||
As at 31 March 2020 | 236 | 35 | 326 | 597 | ||||||||||||
|
|
|
|
|
|
|
| |||||||||
As at 31 March 2021 | 230 | 27 | 261 | 518 | ||||||||||||
|
|
|
|
|
|
|
| |||||||||
Intangible Assets
| (₹ in crores) | ||||||||||||
Particulars | Software License | Mining Rights | Total | |||||||||
Gross Block | ||||||||||||
As at 01 April 2019 | 266 | 227 | 493 | |||||||||
Additions | 18 | — | 18 | |||||||||
Transfers from Property, Plant and Equipment | 1 | — | 1 | |||||||||
Exchange differences | 15 | — | 15 | |||||||||
|
|
|
|
|
| |||||||
As at 31 March 2020 | 300 | 227 | 527 | |||||||||
|
|
|
|
|
| |||||||
Additions | 8 | — | 8 | |||||||||
Transfers from Property, Plant and Equipment | 1 | — | 1 | |||||||||
Disposals/ Adjustments | (6 | ) | — | (6 | ) | |||||||
Exchange differences | (5 | ) | — | (5 | ) | |||||||
|
|
|
|
|
| |||||||
As at 31 March 2021 | 298 | 227 | 525 | |||||||||
|
|
|
|
|
| |||||||
Accumulated amortisation and impairment | ||||||||||||
As at 01 April 2019 | 240 | 219 | 459 | |||||||||
Charge for the year | 23 | — | 23 | |||||||||
Disposals/ Adjustments | — | — | — | |||||||||
Transfers from Property, Plant and Equipment | — | — | — | |||||||||
Exchange differences | 14 | — | 14 | |||||||||
|
|
|
|
|
| |||||||
As at 31 March 2020 | 277 | 219 | 496 | |||||||||
|
|
|
|
|
| |||||||
VEDANTA LIMITED | INTEGRATED REPORT AND ANNUAL ACCOUNTS 2020-21 | 307
STANDALONE CONTINUED...
Notes
forming part of the financial statements as at and for the year ended March 31, 2021
| (₹ in crores) | ||||||||||||
Particulars | Software License | Mining Rights | Total | |||||||||
Charge for the year | 12 | 0 | 12 | |||||||||
Disposals/ Adjustments | (6 | ) | — | (6 | ) | |||||||
Transfers from Property, Plant and Equipment | — | — | — | |||||||||
Exchange differences | (4 | ) | — | (4 | ) | |||||||
|
|
|
|
|
| |||||||
As at 31 March 2021 | 279 | 219 | 498 | |||||||||
|
|
|
|
|
| |||||||
Net Book Value/Carrying amount | ||||||||||||
As at 01 April 2019 | 26 | 8 | 34 | |||||||||
As at 31 March 2020 | 23 | 8 | 31 | |||||||||
|
|
|
|
|
| |||||||
As at 31 March 2021 | 19 | 8 | 27 | |||||||||
|
|
|
|
|
| |||||||
Notes
| a) | Plant and equipment include refineries, smelters, power plants, railway sidings, ships, aircraft, river fleet and related facilities. |
| b) | During the year ended 31 March 2021, interest capitalised was ₹233 Crore (31 March 2020: ₹673 crore). |
| c) | Certain property, plant and equipment are pledged as collateral against borrowings, the details related to which have been described in Note 17 on “Borrowings”. |
| d) | In accordance with the exemption given under Ind AS 101, which has been exercised by the Company, a first time adopter can continue its previous GAAP policy for accounting for exchange differences arising from translation of long-term foreign currency monetary items recognised in the previous GAAP financial statements for the period ending immediately before the beginning of the first Ind AS financial reporting period, i.e., 01 April 2016. |
Accordingly, foreign currency exchange differences arising on translation/settlement of long-term foreign currency monetary items acquired before 01 April 2016 pertaining to the acquisition of a depreciable asset amounting to ₹40 Crore loss (31 March 2020: ₹13 crore loss) is adjusted to the cost of respective item of property, plant and equipment.
| e) | Property, Plant and Equipment, Capital work-in-progress and exploration and evaluation assets net block includes share of jointly owned assets with the joint venture partners ₹6,510 Crore (31 March 2020: ₹6,229 Crore). |
| f) | Reconciliation of depreciation, depletion and amortisation expense |
| (₹ in crores) | ||||||||
Particulars | For the year ended 31 March 2021 | For the year ended 31 March 2020 | ||||||
Depreciation/Depletion/Amortisation expense on: | ||||||||
Property, Plant and equipment (Including ROU assets) | 2,531 | 3,298 | ||||||
Intangible assets | 12 | 23 | ||||||
As per Property, Plant and Equipment and Intangible assets schedule | 2,543 | 3,321 | ||||||
|
|
|
| |||||
Less: Cost allocated to joint ventures | (24 | ) | (57 | ) | ||||
|
|
|
| |||||
As per Statement of Profit and Loss | 2,519 | 3,264 | ||||||
|
|
|
| |||||
| g) | Freehold Land includes ₹144 Crore (31 March 2020: ₹146 Crore), accumulated amortization of ₹127 Crore (31 March 2020: ₹127 Crore), which is available for use during the lifetime of the Production Sharing Contract of the respective Oil and Gas blocks and the title deed for the same is in the name of the licensee of the block. |
| h) | A parcel of land aggregating to ₹349 Crore relating to Iron Ore business was reclassified during the previous year, due to existence of litigation, to Financial Assets and later impaired (Refer note 32) and during the year ₹1 Crore (31 March 2020: ₹1 Crore) was transferred to intangible assets from Capital Work in Progress. |
308
| < BACK TO CONTENTS | Integrated Report | Statutory reports | Financial statements |
Notes
forming part of the financial statements as at and for the year ended March 31, 2021
| 6 | FINANCIAL ASSETS: INVESTMENTS |
| A) | Non Current Investments |
| As at 31 March 2021 | As at 31 March 2020 | |||||||||||||||||||||||||
Particulars | No. | Amount (₹ in Crore) | No. | Amount (₹ in Crore) | ||||||||||||||||||||||
(a) | Investment in equity shares—at cost/ deemed cost a |
| ||||||||||||||||||||||||
| (fully paid up unless otherwise stated) | ||||||||||||||||||||||||||
| Subsidiary companies | ||||||||||||||||||||||||||
| Quoted | ||||||||||||||||||||||||||
| - Hindustan Zinc Limited, of ₹2/-each b | 2,743,154,310 | 44,398 | 2,743,154,310 | 44,398 | ||||||||||||||||||||||
| Unquoted | ||||||||||||||||||||||||||
| - Bharat Aluminium Company Limited, of ₹10/- each (including 5 shares held jointly with nominees) b | 112,518,495 | 553 | 112,518,495 | 553 | ||||||||||||||||||||||
| - Monte Cello BV, Netherlands, of Euro 453.78 each | 40 | 204 | 40 | 204 | ||||||||||||||||||||||
| Less: Reduction pursuant to merger c | (204 | ) | 0 | (204 | ) | 0 | ||||||||||||||||||||
| - Sterlite (USA) Inc., of US$.01 per share (₹42.77 at each year end) | 100 | 0 | 100 | 0 | ||||||||||||||||||||||
| - Cairn India Holdings Limited (CIHL) of GBP 1 each | 420,810,062 | 28,873 | 420,810,062 | 28,873 | ||||||||||||||||||||||
| Less: Reduction pursuant to merger c | (15,067 | ) | 13,806 | (15,067 | ) | 13,806 | ||||||||||||||||||||
| - Vizag General Cargo Berth Private Limited, of ₹10 each (including 6 shares held jointly with nominees) d | 47,108,000 | 182 | 32,108,000 | 32 | ||||||||||||||||||||||
| - Paradip Multi Cargo Berth Private Limited, of ₹10 each (including 6 shares held jointly with nominees) | 10,000 | 0 | 10,000 | 0 | ||||||||||||||||||||||
| - Sterlite Ports Limited, of ₹2 each (including 6 shares held jointly with nominees) | 250,000 | 0 | 250,000 | 0 | ||||||||||||||||||||||
| - Talwandi Sabo Power Limited, of ₹10 each (including 6 shares held jointly with nominees) | 3,206,609,692 | 3,207 | 3,206,609,692 | 3,207 | ||||||||||||||||||||||
| - Sesa Resources Limited, of ₹10 each c | 1,250,000 | 757 | 1,250,000 | 757 | ||||||||||||||||||||||
| - Bloom Fountain Limited, of US$1 each | 2,201,000,001 | 14,734 | 2,201,000,001 | 14,734 | ||||||||||||||||||||||
| Less: Reduction pursuant to merger c | (14,320 | ) | 414 | (14,320 | ) | 414 | ||||||||||||||||||||
| - MALCO Energy Limited of ₹2 each (including 6 shares held jointly with nominees) | 23,366,406 | 116 | 23,366,406 | 116 | ||||||||||||||||||||||
| Less: Reduction pursuant to merger c | (23 | ) | 93 | (23 | ) | 93 | ||||||||||||||||||||
| - THL Zinc Ventures Limited of US$100 each consisting of 1 ordinary share of US$1 and 1,00,000 Ordinary Shares of US$100 each | 100,001 | 46 | 100,001 | 46 | ||||||||||||||||||||||
| Less: Reduction pursuant to merger c | (46 | ) | 0 | (46 | ) | 0 | ||||||||||||||||||||
| - THL Zinc Holdings BV of EURO 1 each | 3,738,000 | 23 | 3,738,000 | 23 | ||||||||||||||||||||||
| Less: Reduction pursuant to merger c | (23 | ) | 0 | (23 | ) | 0 | ||||||||||||||||||||
| - ESL Steel Limited of ₹10 each (including 6 shares held jointly with nominees) | 1,765,553,040 | 1,770 | 1,765,553,040 | 1,770 | ||||||||||||||||||||||
| -Ferro Alloys Corporation Limited of ₹1 each | 340,000,000 | 37 | — | |||||||||||||||||||||||
| Associate companies - unquoted | ||||||||||||||||||||||||||
| - Gaurav Overseas Private Limited, of ₹10 each | 323,000 | 0 | 323,000 | 0 | ||||||||||||||||||||||
| - Rampia Coal Mines and Energy Private Limited, of ₹1 each | 27,229,539 | 3 | 27,229,539 | 3 | ||||||||||||||||||||||
VEDANTA LIMITED | INTEGRATED REPORT AND ANNUAL ACCOUNTS 2020-21 | 309
STANDALONE CONTINUED...
Notes
forming part of the financial statements as at and for the year ended March 31, 2021
| As at 31 March 2021 | As at 31 March 2020 | |||||||||||||||||||||||||
Particulars | No. | Amount (₹ in Crore) | No. | Amount (₹ in Crore) | ||||||||||||||||||||||
| Investment in equity shares at fair value through other comprehensive income Quoted | |||||||||||||||||||||||||
| - Sterlite Technologies Limited, of ₹2 each ( including 60 shares held jointly with nominees) | 4,764,295 | 92 | 4,764,295 | 30 | ||||||||||||||||||||||
| Unquoted | ||||||||||||||||||||||||||
| - Sterlite Power Transmission Limited, of ₹2 each (including 12 shares held jointly with nominees) | 952,859 | 11 | 952,859 | 11 | ||||||||||||||||||||||
| - Goa Shipyard Limited of ₹5 each | 250,828 | 0 | 250,828 | 0 | ||||||||||||||||||||||
(b) | Investment in preference shares of subsidiary companies - at cost Subsidiary companies – Unquoted | |||||||||||||||||||||||||
| - Bloom Fountain Limited, 0.25% Optionally Convertible Redeemable Preference shares of US$1 each | 1,859,900 | 907 | 1,859,900 | 907 | ||||||||||||||||||||||
| - Bloom Fountain Limited, 0.25% Optionally Convertible Redeemable Preference shares of US$100 each | 360,500 | 215 | 360,500 | 215 | ||||||||||||||||||||||
| - THL Zinc Ventures Limited, 0.25% Optionally Convertible Redeemable Preference shares of US$1 each | 7,000,000 | 3,187 | 7,000,000 | 3,187 | ||||||||||||||||||||||
| Less: Reduction pursuant to merger c | (3,187 | ) | 0 | (3,187 | ) | 0 | ||||||||||||||||||||
| - THL Zinc Holdings BV, 0.25% Optionally Convertible Redeemable Preference shares of EURO 1 each | 5,500,000 | 2,495 | 5,500,000 | 2,495 | ||||||||||||||||||||||
| Less: Reduction pursuant to merger c | (2,495 | ) | 0 | (2,495 | ) | 0 | ||||||||||||||||||||
(c) | Investment in Government or Trust securities at cost / amortised cost | |||||||||||||||||||||||||
| - 7 Years National Savings Certificates (31 March 2021: ₹35,450 31 March 2020: ₹35,450) (Deposit with Sales Tax Authority) | — | 0 | — | 0 | ||||||||||||||||||||||
| - UTI Master gain of ₹10 each (31 March 2021: ₹4,072 31 March 2020: ₹4,072) | 100 | 0 | 100 | 0 | ||||||||||||||||||||||
| - Vedanta Limited ESOS Trust (31 March 2021: ₹5,000 31 March 2020: ₹5,000) | — | 0 | — | 0 | ||||||||||||||||||||||
(d) | Investments in debentures of subsidiary companies at cost / amortised cost | |||||||||||||||||||||||||
| - Vizag General Cargo Berth Private Limited, 0.1% compulsorily convertible debentures of ₹1,000 each d | — | — | 1,500,000 | 149 | ||||||||||||||||||||||
| - MALCO Energy Limited, compulsorily convertible debentures of ₹1,000 each | 61,354,483 | 6,136 | 61,354,483 | 6,136 | ||||||||||||||||||||||
| Less: Reduction pursuant to merger c | (6,118 | ) | 18 | (6,118 | ) | 18 | ||||||||||||||||||||
(e) | Investments in Co-operative societies at fair value through profit and loss | |||||||||||||||||||||||||
| - Sesa Ghor Premises Holders Maintenance Society Limited, of ₹200 each (31 March 2021: ₹8,000 31 March 2020: ₹8,000) | 40 | 0 | 40 | 0 | ||||||||||||||||||||||
310
| < BACK TO CONTENTS | Integrated Report | Statutory reports | Financial statements |
Notes
forming part of the financial statements as at and for the year ended March 31, 2021
| As at 31 March 2021 | As at 31 March 2020 | |||||||||||||||||||||||||
Particulars | No. | Amount (₹ in Crore) | No. | Amount (₹ in Crore) | ||||||||||||||||||||||
| - Sesa Goa Sirsaim Employees Consumers Co- operative Society Limited, of ₹10 each (31 March 2021: ₹2,000 31 March 2020: ₹2,000) | 200 | 0 | 200 | 0 | |||||||||||||||||||||
| - Sesa Goa Sanquelim Employees Consumers Co- operative Society Limited, of ₹10 each (March 31, 2020: ₹2,300 March 31, 2019: ₹2,300) | 230 | 0 | 230 | 0 | ||||||||||||||||||||||
| -Sesa Goa Sonshi Employees Consumers Co- operative Society Limited, of ₹10 each (31 March 2021: ₹4,680 31 March 2020: ₹4,680) | 468 | 0 | 468 | 0 | ||||||||||||||||||||||
| -Sesa Goa Codli Employees Consumers Co- operative Society Limited, of ₹10 each (31 March 2021: ₹4,500 31 March 2020: ₹4,500) | 450 | 0 | 450 | 0 | ||||||||||||||||||||||
| - Sesa Goa Shipyard Employees Consumers Co-operative Society Limited, of ₹10 each (31 March 2021: ₹5,000 31 March 2020: ₹5,000) | 500 | 0 | 500 | 0 | ||||||||||||||||||||||
| - The Mapusa Urban Cooperative Bank Limited, of ₹25 each (31 March 2021: ₹1,000 31 March 2020: ₹1,000) | 40 | 0 | 40 | 0 | ||||||||||||||||||||||
(f) | Investment in Bonds - Unquoted at fair value through profit and loss | |||||||||||||||||||||||||
| - Infrastructure Leasing & Financial Services Limited | 51 | 51 | ||||||||||||||||||||||||
| Less: Provision for diminution in value of investments in: | ||||||||||||||||||||||||||
| Bloom Fountain Limited | (1,536 | ) | (1,536 | ) | ||||||||||||||||||||||
| Sesa Resources Limited (Note 32) | (750 | ) | (750 | ) | ||||||||||||||||||||||
| Rampia Coal Mines and Energy Private Limited | (2 | ) | (2 | ) | ||||||||||||||||||||||
| Cairn India Holdings Limited (CIHL) (Note 32) | (3,339 | ) | (3,339 | ) | ||||||||||||||||||||||
|
|
|
| |||||||||||||||||||||||
| Total | 60,887 | 60,787 | ||||||||||||||||||||||||
|
|
|
| |||||||||||||||||||||||
| Aggregate amount of impairment | (5,627 | ) | (5,627 | ) | ||||||||||||||||||||||
| Aggregate amount of quoted investments | 44,490 | 44,428 | ||||||||||||||||||||||||
| Market value of quoted investments | 74,926 | 42,590 | ||||||||||||||||||||||||
| Aggregate carrying amount of unquoted investments | 16,397 | 16,359 | ||||||||||||||||||||||||
| a. | Carrying value of investment in equity shares of Hindustan Zinc Limited (HZL) is at deemed cost and for all other subsidiaries, it is at the cost of acquisition. |
| b. | Pursuant to the Government of India’s policy of disvestment, the Company in April 2002 acquired 26% equity interest in HZL from the Government of India. Under the terms of the Shareholder’s Agreement (‘SHA’), the Company had two call options to purchase all of the Government of India’s shares in HZL at fair market value. The Company also acquired an additional 20% of the equity capital in HZL through an open offer. The Company exercised the first call option on 29 August 2003 and acquired an additional 18.9% of HZL’s issued |
share capital, increasing its shareholding to 64.9%. The second call option provides the Company the right to acquire the Government of India’s remaining 29.5% share in HZL. This call option is subject to the right of the Government of India to sell 3.5% of HZL shares to HZL employees. The Company exercised the second call option on 21 July 2009. The Government of India disputed the validity of the call option and has refused to act upon the second call option. Consequently, the Company invoked arbitration which is in the early stages. The next date of hearing is to be notified. The Government of India without prejudice to the position on the Put / Call option issue has received approval from the Cabinet for divestment and the Government is looking to divest through the auction route. Meanwhile, the Supreme Court has, in January 2016, directed status quo pertaining to disinvestment of Government of India’s residual shareholding while hearing the public interest petition filed. The Company has filed an early hearing application in Supreme Court which is currently pending and is sub-judice. The hearings in the matter have started and will now be listed for further arguments in due course. |
VEDANTA LIMITED | INTEGRATED REPORT AND ANNUAL ACCOUNTS 2020-21 | 311
STANDALONE CONTINUED...
Notes
forming part of the financial statements as at and for the year ended March 31, 2021
Pursuant to the Government of India’s policy of divestment, the Company in March 2001 acquired 51% equity interest in BALCO from the Government of India. Under the terms of the SHA, the Company has a call option to purchase the Government of India’s remaining ownership interest in BALCO at any point from March 2, 2004. The Company exercised this option on March 19, 2004. However, the Government of India has contested the valuation and validity of the option and contended that the clauses of the SHA violate the (Indian) Companies Act, 1956 by restricting the rights of the Government of India to transfer its shares and that as a result such provisions of the SHA were null and void. In the arbitration filed by the Company, the arbitral tribunal by a majority award rejected the claims of the Company on the grounds that the clauses relating to the call option, the right of first refusal, the “tag-along” rights and the restriction on the transfer of shares violate the erstwhile Companies Act, 1956 and are not enforceable. The Company has challenged the validity of the majority award in the Hon’ble High Court of Delhi and sought for setting aside the arbitration award to the extent that it holds these clauses ineffective and inoperative. The Government of India also filed an application before the High Court of Delhi to partially set aside the arbitral award in respect of certain matters involving valuation. The matter is currently scheduled for hearing by the Delhi High Court. Meanwhile, the
Government of India without prejudice to its position on the Put / Call option issue has received approval from the Cabinet for divestment and the Government is looking to divest through the auction route.
On January 9, 2012, the Company offered to acquire the Government of India’s interests in HZL and BALCO for ₹15,492 Crore and ₹1,782 Crore respectively. This offer was separate from the contested exercise of the call options, and Company proposed to withdraw the ongoing litigations in relation to the contested exercise of the options should the offer be accepted. To date, the offer has not been accepted by the Government of India and therefore, there is no certainty that the acquisition will proceed.
In view of the lack of resolution on the options, the non-response to the exercise and valuation request from the Government of India, the resultant uncertainty surrounding the potential transaction and the valuation of the consideration payable, the Company considers the strike price of the options to be at the fair value, which is effectively nil, and hence the call options have not been recognised in the financial statements.
| c. | Reduction pursuant to merger of Cairn India Limited with Vedanta Limited accounted for in the year ended 31 March 2017. |
| d. | During the year, 15 lakh 0.1% compulsorily convertible debentures of ₹1,000 each held by the Company have been fully converted into 1.5 Crore equity shares of Vizag General Cargo Berth Private Limited of face value of ₹10 each at a premium of ₹90 per share. |
B) Current Investment
| (₹ in crores) | ||||||||
Particulars | As at 31 March 2021 | As at 31 March 2020 | ||||||
Investments carried at fair value through profit and loss | ||||||||
Investment in mutual funds- quoted | — | 81 | ||||||
Investment in mutual funds- unquoted | 2,016 | 589 | ||||||
Investment in bonds - quoted | — | 1,448 | ||||||
Investment in India Grid Trust - quoted | 0 | 0 | ||||||
|
|
|
| |||||
Total | 2,016 | 2,118 | ||||||
|
|
|
| |||||
Aggregate amount of quoted investments, and market value thereof | — | 1,529 | ||||||
Aggregate amount of unquoted investments | 2,016 | 589 | ||||||
312
| < BACK TO CONTENTS | Integrated Report | Statutory reports | Financial statements |
Notes
forming part of the financial statements as at and for the year ended March 31, 2021
| 7 | FINANCIAL ASSETS - TRADE RECEIVABLES |
| (₹ in crores) | ||||||||||||||||||||||||
| As at 31 March 2021 | As at 31 March 2020 | |||||||||||||||||||||||
Particulars | Non-current | Current | Total | Non-current | Current | Total | ||||||||||||||||||
Unsecured | 1,896 | 1,148 | 3,044 | 1,859 | 843 | 2,702 | ||||||||||||||||||
Less: Provision for expected credit loss | (573 | ) | (12 | ) | (585 | ) | (513 | ) | (11 | ) | (524 | ) | ||||||||||||
|
|
|
|
|
|
|
|
|
|
|
| |||||||||||||
Total | 1,323 | 1,136 | 2,459 | 1,346 | 832 | 2,178 | ||||||||||||||||||
|
|
|
|
|
|
|
|
|
|
|
| |||||||||||||
| (a) | The credit period given to customers ranges from zero to 90 days. Also refer note 20(C)(d). |
| (b) | For amounts due and terms and conditions relating to related party receivables see note 37. |
| (c) | As at 31 March 2021, trade receivables amounting to ₹1,323 Crore (31 March 2020: ₹ 1,349 Crore) withheld by GRIDCO (‘GRIDCO’ or ‘the Customer’) on account of certain disputes relating to computation of power tariffs pending adjudication by Appellate Tribunal for Electricity (APTEL), which the Company is confident of recovering fully. The Customer has also raised claims of ₹413 Crore on the Company in respect of short supply of power for which a provision of ₹218 Crore has been made. Various minutes of meetings were signed with the Customer for computing the short supply claims, which were subject to approval of Odisha State Electricity Regulatory Commission (‘OERC’). On 22 June 2020 OERC pronounced its order on computation methodology for short supply claims, basis which both the parties had to recompute the amount of claim and settle the matter in two months from the date of the order. On initial impact assessment of the said Order by the Company, it believes that no further provisioning is required in this regard. |
Further, the Company filed an appeal before APTEL against the OERC Order. The matter is now listed before registrar court on 14 July 2021. The Customer has also sought review of the OERC Order. The matter has been posted for order by OERC in due course. In the meanwhile, power supply to GRIDCO has resumed and GRIDCO has been making regular payments against monthly energy invoices.
(d) The total trade receivables as at 01 April 2019 were ₹3,214 Crore (net of provision for expected credit loss).
| 8 | FINANCIAL ASSETS - LOANS |
| (₹ in crores) | ||||||||||||||||||||||||
| As at 31 March 2021 | As at 31 March 2020 | |||||||||||||||||||||||
Particulars | Non-current | Current | Total | Non-current | Current | Total | ||||||||||||||||||
Unsecured, considered good | ||||||||||||||||||||||||
Loans to related parties (Refer note 37) | 180 | 522 | 702 | 183 | 1,595 | 1,778 | ||||||||||||||||||
Loans and advances to employees | — | 1 | 1 | — | 1 | 1 | ||||||||||||||||||
Unsecured, considered credit impaired | ||||||||||||||||||||||||
Loans to related parties (Refer note 37(e)) | — | 5 | 5 | — | — | — | ||||||||||||||||||
Less: Provision for expected credit loss | — | (5 | ) | (5 | ) | — | — | — | ||||||||||||||||
|
|
|
|
|
|
|
|
|
|
|
| |||||||||||||
Total | 180 | 523 | 703 | 183 | 1,596 | 1,779 | ||||||||||||||||||
|
|
|
|
|
|
|
|
|
|
|
| |||||||||||||
VEDANTA LIMITED | INTEGRATED REPORT AND ANNUAL ACCOUNTS 2020-21 | 313
STANDALONE CONTINUED...
NOTES
forming part of the financial statements as at and for the year ended March 31, 2021
9 FINANCIAL ASSETS - OTHERS
| (₹ in crores) | ||||||||||||||||||||||||
| As at 31 March 2021 | As at 31 March 2020 | |||||||||||||||||||||||
Particulars | Non-current | Current | Total | Non-current | Current | Total | ||||||||||||||||||
Bank Deposits c | 59 | — | 59 | 717 | — | 717 | ||||||||||||||||||
Site restoration asset a | 495 | — | 495 | 411 | — | 411 | ||||||||||||||||||
Unsecured, considered good | ||||||||||||||||||||||||
Security deposits | 70 | 6 | 76 | 76 | 23 | 99 | ||||||||||||||||||
Advance recoverable (Oil and Gas Business) | — | 4,731 | 4,731 | — | 3,038 | 3,038 | ||||||||||||||||||
Others (Refer note 26 (b)) | 634 | 112 | 746 | 469 | 479 | 948 | ||||||||||||||||||
Receivable from related parties (Refer note 37) | — | 222 | 222 | — | 286 | 286 | ||||||||||||||||||
Unsecured, considered credit impaired | ||||||||||||||||||||||||
Security deposits | 15 | 1 | 16 | 15 | 1 | 16 | ||||||||||||||||||
Others b | 450 | 253 | 703 | 391 | 264 | 655 | ||||||||||||||||||
Receivable from related parties (Refer note 37(e)) | — | 11 | 11 | — | — | — | ||||||||||||||||||
Less: Provision for expected credit loss | (465 | ) | (265 | ) | (730 | ) | (406 | ) | (265 | ) | (671 | ) | ||||||||||||
|
|
|
|
|
|
|
|
|
|
|
| |||||||||||||
Total | 1,258 | 5,071 | 6,329 | 1,673 | 3,826 | 5,499 | ||||||||||||||||||
|
|
|
|
|
|
|
|
|
|
|
| |||||||||||||
| (a) | Site restoration asset earns interest at fixed rate based on respective deposit rate. |
| (b) | A parcel of land amounting to ₹ 349 Crore relating to Iron Ore business has been reclassified during the previous year, due to existing litigation, from Property, plant and equipment and was later provided for (Refer note 32). |
| (c) | Bank deposits include margin money of ₹ 4 Crore (31 March 2020: Nil). |
10 OTHER ASSETS
| (₹ in crores) | ||||||||||||||||||||||||
| As at 31 March 2021 | As at 31 March 2020 | |||||||||||||||||||||||
Particulars | Non-current | Current | Total | Non-current | Current | Total | ||||||||||||||||||
Capital advances | 767 | — | 767 | 716 | — | 716 | ||||||||||||||||||
Advances to related party (Refer note 37) | 94 | 166 | 260 | — | — | — | ||||||||||||||||||
Advances for supplies | 42 | 755 | 797 | 95 | 973 | 1,068 | ||||||||||||||||||
Others | ||||||||||||||||||||||||
Balance with government authorities a | 512 | 385 | 897 | 453 | 606 | 1,059 | ||||||||||||||||||
Loan to employee benefit trust | 277 | — | 277 | 334 | — | 334 | ||||||||||||||||||
Others b | 773 | 633 | 1,406 | 674 | 455 | 1,129 | ||||||||||||||||||
Unsecured, considered doubtful | ||||||||||||||||||||||||
Capital advances c | 202 | — | 202 | 202 | — | 202 | ||||||||||||||||||
Balance with government authorities | 3 | — | 3 | 3 | — | 3 | ||||||||||||||||||
Advance for supplies | — | 37 | 37 | — | 37 | 37 | ||||||||||||||||||
Others b | 313 | 4 | 317 | 263 | 4 | 267 | ||||||||||||||||||
Less: Provision for doubtful advances | (518 | ) | (41 | ) | (559 | ) | (468 | ) | (41 | ) | (509 | ) | ||||||||||||
|
|
|
|
|
|
|
|
|
|
|
| |||||||||||||
Total | 2,371 | 1,939 | 4,404 | 2,272 | 2,034 | 4,306 | ||||||||||||||||||
|
|
|
|
|
|
|
|
|
|
|
| |||||||||||||
| (a) | Includes ₹ 30 Crore (31 March 2020: ₹ 30 Crore), being Company’s share of gross amount of ₹ 86 Crore (31 March 2019: ₹ 86 Crore) paid under protest on account of Education Cess and Secondary Higher Education Cess for the financial year 2013-14. |
| (b) | Others include claim receivables, advance recoverable (oil and gas business), prepaid expenses and export incentive receivables. This also includes amounts receivable from KCM (Refer note 32). |
| (c) | During the previous year, an impairment charge of ₹ 196 Crore has been recognised relating to copper business. Refer note 32(b). |
314
| < BACK TO CONTENTS | Integrated Report | Statutory reports | Financial statements |
NOTES
forming part of the financial statements as at and for the year ended March 31, 2021
| 11 | INVENTORIES |
| (₹ in crores) | ||||||||
Particulars | As at 31 March 2021 | As at 31 March 2020 | ||||||
Raw Materials | 1,464 | 1,370 | ||||||
Goods-in transit | 871 | 595 | ||||||
Work-in-progress | 1,681 | 1,835 | ||||||
Finished goods | 548 | 465 | ||||||
Fuel Stock | 399 | 608 | ||||||
Goods-in transit | 88 | 258 | ||||||
Stores and Spares | 500 | 557 | ||||||
Goods-in transit | 4 | 1 | ||||||
|
|
|
| |||||
Total | 5,555 | 5,689 | ||||||
|
|
|
| |||||
| (a) | For method of valuation for each class of inventories, refer note 3(a)(J). |
| (b) | Inventory held at net realisable value amounted to ₹ 2,329 Crore (31 March 2020: ₹ 2,263 Crore). |
| (c) | The write down of inventories amounting to ₹ 42 Crore (31 March 2020: ₹ 56 Crore) has been charged to the Statement of Profit and Loss during the year. |
12 CURRENT FINANCIAL ASSETS - CASH AND CASH EQUIVALENTS
| (₹ in crores) | ||||||||
Particulars | As at 31 March 2021 | As at 31 March 2020 | ||||||
Balances with banks | 1,361 | 1,661 | ||||||
Deposits with original maturity of less than 3 months (including interest accrued thereon) a | 1,500 | 185 | ||||||
Cash on hand | 0 | 0 | ||||||
|
|
|
| |||||
Total | 2,861 | 1,846 | ||||||
|
|
|
| |||||
| (a) | Bank deposits earns interest at fixed rate based on respective deposit rate. |
| 13 | CURRENT FINANCIAL ASSETS - OTHER BANK BALANCES |
| (₹ in crores) | ||||||||
Particulars | As at 31 March 2021 | As at 31 March 2020 | ||||||
Bank deposits with original maturity of more than 12 months (including interest accrued thereon) | 0 | 0 | ||||||
Bank deposits with original maturity of more than 3 months but less than 12 months (including interest accrued thereon) a,b | 1,397 | 271 | ||||||
Earmarked unpaid dividend accounts d | 76 | 74 | ||||||
Earmarked escrow account e | 2 | 2 | ||||||
|
|
|
| |||||
Total | 1,475 | 347 | ||||||
|
|
|
| |||||
| (a) | Includes ₹ 633 Crore (31 March 2020: ₹ 256 Crore) on lien with banks and margin money ₹ 12 Crore (31 March 2020: ₹ 12 Crore). |
| (b) | Restricted funds of ₹ 460 Crore (31 March 2020: Nil) held as interest reserve created against interest payment on loans from banks and ₹ 21 Crore (31 March 2020: Nil) on lien with Others. |
| (c) | Bank deposits earns interest at fixed rate based on respective deposit rate. |
| (d) | Earmarked unpaid dividend accounts are restricted in use as it relates to unclaimed or unpaid dividend. |
| (e) | Earmarked escrow account is restricted in use as it relates to unclaimed redeemable preference shares. |
VEDANTA LIMITED | INTEGRATED REPORT AND ANNUAL ACCOUNTS 2020-21 | 315
STANDALONE CONTINUED...
NOTES
forming part of the financial statements as at and for the year ended March 31, 2021
| 14 | SHARE CAPITAL |
| As at 31 March 2021 | As at 31 March 2020 | |||||||||||||||
Particulars | Number (in crores) | Amount (₹ in crores) | Number (in crores) | Amount (₹ in crores) | ||||||||||||
A. Authorised equity share capital | ||||||||||||||||
Opening and Closing balance [equity shares of ₹ 1 each with voting rights] | 4,402 | 4,402 | 4,402 | 4,402 | ||||||||||||
Authorised preference share capital | ||||||||||||||||
Opening and Closing balance [preference shares of ₹ 10/- each] | 301 | 3,010 | 301 | 3,010 | ||||||||||||
B. Issued, subscribed and paid up | ||||||||||||||||
Equity shares of ₹ 1/- each with voting rights a,b | 372 | 372 | 372 | 372 | ||||||||||||
|
|
|
|
|
|
|
| |||||||||
| 372 | 372 | 372 | 372 | |||||||||||||
|
|
|
|
|
|
|
| |||||||||
| (a) | Includes 3,08,232 (31 March 2020: 3,08,232) equity shares kept in abeyance. These shares are not part of listed equity capital and pending allotment as they are sub-judice. |
| (b) | Includes 1,21,93,159 (31 March 2020: 1,43,78,261 ) equity shares held by Vedanta Limited ESOS Trust (Refer note 25). |
| C. | Shares held by the Ultimate holding company and its subsidiaries* |
| As at 31 March 2021 | As at 31 March 2020 | |||||||||||||||
Particulars | No. of Shares held (in crores) | % of holding | No. of Shares held (in crores) | % of holding | ||||||||||||
Twin Star Holdings Limited | 137.94 | 37.11 | 128.01 | 34.44 | ||||||||||||
Twin Star Holdings Limited (2) | — | — | 9.93 | 2.67 | ||||||||||||
Finsider International Company Limited | 40.15 | 10.80 | 40.15 | 10.80 | ||||||||||||
Westglobe Limited | 4.43 | 1.19 | 4.43 | 1.19 | ||||||||||||
Welter Trading Limited | 3.82 | 1.03 | 3.82 | 1.03 | ||||||||||||
Vedanta Holdings Mauritius II Limited(3) | 18.50 | 4.98 | — | — | ||||||||||||
|
|
|
|
|
|
|
| |||||||||
Total | 204.84 | 55.11 | 186.34 | 50.13 | ||||||||||||
|
|
|
|
|
|
|
| |||||||||
| * | The % of holding has been calculated on the issued and subscribed share capital as at the respective balance sheet date. |
| (1) | All the above entities are subsidiaries of Volcan Investments Limited, the ultimate holding Company. |
| (2) | Represented by 2,48,23,177 American Depository Shares (“ADS”) which got coverted to equity shares in FY 20-21. |
| (3) | Vedanta Holdings Mauritius II Limited (part of Promoter Group of Vedanta Limited) had purchased 185,000,000 equity shares aggregating to 4.98% of equity share capital of Vedanta Limited, on 24 December 2020 via bulk deal on stock exchange. |
| D. | Aggregate number of bonus shares issued, shares issued for consideration other than cash and shares bought back during the period of five years immediately preceding the reporting date |
| (₹ in crores) | ||||||||
Particulars | As at 31 March 2021 | As at 31 March 2020 | ||||||
Equity shares issued pursuant to Scheme of Amalgamation (in FY 2017-18) | 75 | 75 | ||||||
Preference shares issued pursuant to Scheme of Amalgamation (in FY 2017-18)* | 301 | 301 | ||||||
| * | These were redeemed on 27 October 2018. |
316
| < BACK TO CONTENTS | Integrated Report | Statutory reports | Financial statements |
Notes
forming part of the financial statements as at and for the year ended March 31, 2021
| E. | Details of shareholders holding more than 5% shares in the Company * |
| As at 31 March 2021 | As at 31 March 2020 | |||||||||||||||
Particulars | No. of Shares held (in crores) | % of holding | No. of Shares held (in crores) | % of holding | ||||||||||||
Twin Star Holdings Limited | 137.94 | 37.11 | 128.01 | 34.44 | ||||||||||||
Twin Star Holdings Limited # | — | — | 9.93 | 2.67 | ||||||||||||
Finsider International Company Limited | 40.15 | 10.80 | 40.15 | 10.80 | ||||||||||||
ICICI Prudential Equity Arbitrage Fund | 8.32 | 2.24 | 18.69 | 5.03 | ||||||||||||
Life Insurance Corporation of India | 24.40 | 6.56 | 23.67 | 6.37 | ||||||||||||
| * | The % of holding has been calculated on the issued and subscribed share capital as at the respective balance sheet date. |
| # | 2,48,23,177 ADS, held by CITI Bank N.A. New York as a depository which has been converted to equity shares in FY 20-21 |
As per the records of the Company, including its register of shareholders/members, the above shareholding represents legal ownership of shares.
| F. | Other disclosures |
| (i) | The Company has one class of equity shares having par value of ₹ 1 per share. Each shareholder is eligible for one vote per share held and dividend as and when declared by the Company. The dividend proposed by the Board of Directors is subject to the approval of the shareholders in the ensuing Annual General Meeting, except in case of interim dividend which is paid as and when declared by the Board of Directors. In the event of liquidation of the Company, the holders of equity shares will be entitled to receive any of the remaining assets of the Company, after distribution of all preferential amounts, in proportion to their shareholding. |
| (ii) | ADS shareholders do not have right to attend General meetings in person and also do not have right to vote. They are represented by depository, CITI Bank N.A. New York. As at 31 March 2021 - 16,09,03,244 equity shares were held in the form of 4,02,25,811 ADS (31 March 2020: 26,17,80,208 equity shares were held in the form of 6,54,45,052 ADS). |
| (iii) | In terms of Scheme of Arrangement as approved by the Hon’ble High Court of Judicature at Mumbai, vide its order dated 19 April 2002, the erstwhile Sterlite Industries (India) Limited (merged with the Company during 2013-14) during 2002-2003 reduced its paid up share capital by ₹ 10 Crore. There are 2,01,296 equity shares (31 March 2020: 2,01,711 equity shares) of ₹ 1 each pending clearance from NSDL. The Company has filed an application in Hon’ble High Court of Mumbai to cancel these shares, the final decision on which is pending. Hon’ble High Court of Judicature at Mumbai, vide its interim order dated 06 September 2002 restrained any transaction with respect to subject shares. |
| 15 | OTHER EQUITY (REFER STATEMENT OF CHANGES IN EQUITY) |
| a) | General reserve: Under the erstwhile Companies Act, 1956, general reserve was created through an annual transfer of net income at a specified percentage in accordance with applicable regulations. The purpose of these transfers was to ensure that if a dividend distribution in a given year is more than 10% of the paid-up capital of the Company for that year, then the total dividend distribution is less than the total distributable reserves for that year. Consequent to introduction of Companies Act, 2013, the requirement to mandatorily transfer a specified percentage of the net profit to general reserve has been withdrawn. |
| b) | Debenture redemption reserve: As per the earlier provision under the Indian Companies Act, companies that issue debentures were required to create debenture redemption reserve from annual profits until such debentures are redeemed. Companies are required to maintain 25% as a reserve of outstanding redeemable debentures. The amounts credited to the debenture redemption reserve may not be utilized except to redeem debentures.The MCA vide its Notification dated 16 August 2019, had amended the Companies (Share Capital and Debenture) Rules, 2014, wherein the requirement of creation of Debenture Redemption Reserve has been exempted for certain class of companies, hence, in view of the same, Vedanta Limited is not required to create Debenture Redemption Reserve. |
VEDANTA LIMITED | INTEGRATED REPORT AND ANNUAL ACCOUNTS 2020-21 | 317
STANDALONE CONTINUED...
NOTES
forming part of the financial statements as at and for the year ended March 31, 2021
| c) | Preference share redemption reserve: The Companies Act, 2013 provides that companies that issue preference shares may redeem those shares from profits of the Company which otherwise would be available for dividends, or from proceeds of a new issue of shares made for the purpose of redemption of the preference shares. If there is a premium payable on redemption, the premium must be provided for, either by reducing the additional paid in capital (securities premium account) or net income, before the shares are redeemed. If profits are used to redeem preference shares, the value of the nominal amount of shares redeemed should be transferred from profits (retained earnings) to the preference share redemption reserve. This amount should then be utilised for the purpose of redemption of redeemable preference shares. This reserve can be used to issue fully paid-up bonus shares to the shareholders of the Company. |
| d) | Capital reserve: The balance in capital reserve has mainly arisen consequent to merger of Cairn India Limited with the Company. |
| 16 | CAPITAL MANAGEMENT |
The Company’s objectives when managing capital is to safeguard continuity, maintain a strong credit rating and healthy capital ratios in order to support its business
and provide adequate return to shareholders through continuing growth. The Company’s overall strategy remains unchanged from previous year.
The Company sets the amount of capital required on the basis of annual business and long-term operating plans which include capital and other strategic investments. The funding requirements are met through a mixture of equity, internal fund generation and borrowings. The Company’s policy is to use current and non-current borrowings to meet anticipated funding requirements. The Company monitors capital on the basis of the gearing ratio which is net debt divided by total capital (equity plus net debt). The Company is not subject to any externally imposed capital requirements.
Net debt are non-current and current debts as reduced by cash and cash equivalents, other bank balances and current investments. Equity comprises all components including other comprehensive income.
The following table summarizes the capital of the Company:
| (₹ in crores) | ||||||||
Particulars | As at 31 March 2021 | As at 31 March 2020 | ||||||
Cash and cash equivalents (Refer note 12) | 2,861 | 1,846 | ||||||
Other bank balances a (Refer note 13) | 916 | 271 | ||||||
Non-current bank deposits (Refer note 9) | 59 | 717 | ||||||
Current investments (Refer note 6B) | 2,016 | 2,118 | ||||||
Total cash (a) | 5,852 | 4,952 | ||||||
Non-current borrowings (Refer note 17A) | 20,913 | 21,629 | ||||||
Current borrowings (Refer note 17B) | 1,140 | 10,819 | ||||||
Current maturities of long term debt (Refer note 19) | 10,113 | 6,489 | ||||||
Total borrowings (b) | 32,166 | 38,937 | ||||||
|
|
|
| |||||
Net debt c=(b-a) | 26,314 | 33,985 | ||||||
Total equity | 76,790 | 69,895 | ||||||
|
|
|
| |||||
Total capital (equity + net debt) (d) | 103,104 | 103,880 | ||||||
|
|
|
| |||||
Gearing ratio (times) (c/d) | 0.26 | 0.33 | ||||||
| (a) | The constituents of ‘total cash’ for the purpose of capital management disclosure to include only those amounts of restricted funds that are corresponding to liabilities (e.g. margin money deposits). Consequently, restricted funds amounting to ₹ 76 Crore (As at 31 March 2021: ₹ 559 Crore) have been excluded from ‘total cash’ in the capital management disclosures for the comparative year ended 31 March 2020 (Refer note 13(b),13(d) and 13(e)). |
318
| < BACK TO CONTENTS | Integrated Report | Statutory reports | Financial statements |
Notes
forming part of the financial statements as at and for the year ended March 31, 2021
| 17 | FINANCIAL LIABILITIES - BORROWINGS |
| A) | Non- current borrowings |
| (₹ in crores) | ||||||||
Particulars | As at 31 March 2021 | As at 31 March 2020 | ||||||
At amortised cost | ||||||||
Secured | ||||||||
Non convertible debentures | 10,909 | 13,013 | ||||||
Term loans from banks | ||||||||
- Rupee term loans | 18,868 | 11,724 | ||||||
- Foreign currency term loans | 1,137 | 3,227 | ||||||
Others | 48 | 75 | ||||||
Unsecured | ||||||||
Deferred sales tax liability | 62 | 77 | ||||||
Redeemable preference shares | 2 | 2 | ||||||
Non current borrowings (A) | 31,026 | 28,118 | ||||||
Less: Current maturities of long term debt (Refer note 19) | (10,113 | ) | (6,489 | ) | ||||
Total Non current borrowings (Net) | 20,913 | 21,629 | ||||||
|
|
|
| |||||
Current borrowings (B) (Refer note 17 B) | 1,140 | 10,819 | ||||||
|
|
|
| |||||
Total borrowings (A+B) | 32,166 | 38,937 | ||||||
|
|
|
| |||||
| B) | Current borrowings |
| (₹ in crores) | ||||||||
Particulars | As at 31 March 2021 | As at 31 March 2020 | ||||||
At amortised cost | ||||||||
Secured | ||||||||
Working capital loan | 300 | 12 | ||||||
Packing credit in foreign currencies from banks | 350 | — | ||||||
Term loans from banks (Foreign currency) | — | 1,041 | ||||||
Loans repayable on demand from banks | — | 1 | ||||||
Amounts due on factoring of receivables | — | 10 | ||||||
Others | — | 1,138 | ||||||
Unsecured | ||||||||
Loans repayable on demand from banks | 290 | 1,077 | ||||||
Loan from Related party | 200 | — | ||||||
Commercial paper | — | 7,524 | ||||||
Amounts due on factoring of receivables | — | 16 | ||||||
|
|
|
| |||||
Total | 1,140 | 10,819 | ||||||
|
|
|
| |||||
In the event Vedanta Resources Limited ceases to be the Company’s majority shareholder, the Company will be required to immediately repay some of its outstanding long term debt.
VEDANTA LIMITED | INTEGRATED REPORT AND ANNUAL ACCOUNTS 2020-21 | 319
STANDALONE CONTINUED...
NOTES
forming part of the financial statements as at and for the year ended March 31, 2021
a) Details of Non-convertible debentures issued by the Company have been provided below (Carrying Value):
| (₹ in crores) | ||||||||
Particulars | As at 31 March 2021 | As at 31 March 2020 | ||||||
9.2% due February-2030 | 2,000 | 2,000 | ||||||
9.2% due December-2022 | 749 | 748 | ||||||
8.75% due June-2022 | 1,269 | 1,268 | ||||||
7.5% due March-2022 | 493 | — | ||||||
8.9% due December-2021 | 899 | 898 | ||||||
8.75% due September-2021 | 250 | 250 | ||||||
9.18% due July-2021 | 1,000 | 1,000 | ||||||
8.5% due June-2021 | 1,650 | 1,650 | ||||||
8.75% due April-2021 | 250 | 250 | ||||||
8.5% due April-2021 | 2,349 | 2,349 | ||||||
9.45% due August-2020 | — | 2,000 | ||||||
8.7% due April-2020 | — | 600 | ||||||
|
|
|
| |||||
Total | 10,909 | 13,013 | ||||||
|
|
|
| |||||
| b) | Vedanta Limited has taken borrowings towards funding of its acquisitions, capital expenditure and working capital requirements. The borrowings comprise of funding arrangements from various banks and financial institution. The details of security provided by the Company to various lenders on the assets of the Company are as follows: |
| (₹ in crores) | ||||||||||
Particulars | As at 31 March 2021 | As at 31 March 2020 | ||||||||
Secured long term borrowings | 30,962 | 28,039 | ||||||||
Secured short term borrowings | 650 | 2,202 | ||||||||
|
|
|
| |||||||
Total secured borrowings | 31,612 | 30,241 | ||||||||
|
|
|
| |||||||
| (₹ in crores) | ||||||||||
Facility Category | Security details | As at 31 March 2021 | As at 31 March 2020 | |||||||
Working capital loans* | Secured by first pari passu charge on current assets of Vedanta Limited | 650 | 3 | |||||||
Other secured working capital loans | — | 20 | ||||||||
Non Convertible Debentures | Secured by the whole of the movable fixed assets of (i) Alumina Refinery having output of 1 MTPA along with co- generation captive power plant with an aggregate capacity of 90 MW at Lanjigarh, Odisha and (ii) Aluminium Smelter having output of 1.6 MTPA along with a 1,215 (9*135) MW CPP at Jharsuguda, Odisha. | 5,409 | 4,914 | |||||||
Non Convertible Debentures | Secured by a first pari passu charge on the whole of the present and future of the movable fixed assets of 2400 MW (600 MW*4) Power Plant of Vedanta Limited at Jharsuguda location. | 4,000 | 3,999 | |||||||
Secured by way of first ranking pari passu charge on movable fixed assets in relation to the Lanjigarh Refinery Expansion Project (having capacity beyond 2 MTPA and upto 6 MTPA) situated at Lanjigarh, Orissa. The Lanjigarh Refinery Expansion Project shall specifically exclude the 1 MTPA alumina refinery of Vedanta Limited along with 90 MW power plant in Lanjigarh and all its related capacity expansions. | 500 | 1,100 | ||||||||
320
| < BACK TO CONTENTS | Integrated Report | Statutory reports | Financial statements |
Notes
forming part of the financial statements as at and for the year ended March 31, 2021
| (₹ in crores) | ||||||||||
Facility Category | Security details | As at 31 March 2021 | As at 31 March 2020 | |||||||
Secured by way of first pari passu charge on all present and future of the movable fixed assets of 2400 MW (600 MW*4) Power Plant of Vedanta Limited at Jharsuguda location, as may be identified and notified by the Issuer to the Security Trustee from time to time, with minimum asset coverage of 1 time of the aggregate face value of debentures outstanding at any point of time. | 1,000 | 1,000 | ||||||||
Other secured non-convertible debuntures | — | 2,000 | ||||||||
Term loans from banks (includes rupee term loans and foreign currency term loans) | First pari passu charge by way of hypothecation/ equitable mortgage on the movable/ immovable assets of the Aluminium Division of Vedanta Limited comprising of alumina refinery having output of 1 MTPA along with co- generation captive power plant with an aggregate capacity of 90 MW at Lanjigarh, Orissa; aluminium smelter having output of 1.6 MTPA along with a 1215 (9x135) MW CPP at Jharsuguda, Orissa, both present and future | 1,883 | 3,384 | |||||||
Secured by a pari passu charge by way of hypothecation of all the movable fixed assets of Vedanta Limited pertaining to its Aluminium Division project consisting of (i) alumina refinery having output of 1 MTPA (Refinery) along with co- generation captive power plant with an aggregate capacity of 90 MW at Lanjigarh, Orissa (Power Plant); and (ii) aluminium smelter having output of 1.6 MTPA along with a 1215 (9x135) MW CPP at Jharsuguda, Orissa (Smelter) (the Refinery, Power Plant and Smelter). Also, a first pari passu charge by way of equitable mortgage on the land pertaining to the mentioned project of aluminium division | 2,194 | 2,885 | ||||||||
Secured by a pari passu charge by way of hypothecation on the movable fixed assets of the Lanjigarh Refinery Expansion Project including 210 MW Power Project. Lanjigarh Refinery Expansion Project shall specifically exclude the 1 MTPA alumina refinery of Vedanta Limited along with 90 MW power plant in Lanjigarh and all its related expansions | 436 | 458 | ||||||||
Term loans from banks (includes rupee term loans and foreign currency term loans) | Secured by a pari passu charge by way of hypothecation on the movable fixed assets of Vedanta Limited pertaining to its Aluminium Division comprising of 1 MTPA alumina refinery plant with 90 MW captive power plant at Lanjigarh, Odisha and 1.6 MTPA aluminium smelter plant with 1215 MW captive power plant at Jharsuguda, Odisha | 1,227 | 1,380 | |||||||
Secured by a pari passu charge by way of hypothecation/ equitable mortgage of the movable/ immovable fixed assets of Vedanta Limited pertaining to its Aluminium Division comprising of 1 MTPA alumina refinery plant with 90 MW captive power plant at Lanjigarh, Odisha and 1.6 MTPA aluminium smelter plant with 1215 MW captive power plant at Jharsuguda, Odisha | 2,801 | 2,984 | ||||||||
First pari passu charge by way of hypothecation/ equitable mortgage on the movable/ immovable assets of the Aluminium Division of Vedanta Limited comprising of alumina refinery having output of 1 MTPA along with co- generation captive power plant with an aggregate capacity of 90 MW at Lanjigarh, Orissa; aluminium smelter having output of 1.6 MTPA along with a 1215 (9x135) MW CPP at Jharsuguda, Orissa and additional charge on Lanjigarh Expansion project, both present and future | 1,092 | 1,137 | ||||||||
VEDANTA LIMITED | INTEGRATED REPORT AND ANNUAL ACCOUNTS 2020-21 | 321
STANDALONE CONTINUED...
NOTES
forming part of the financial statements as at and for the year ended March 31, 2021
| (₹ in crores) | ||||||||||
Facility Category | Security details | As at 31 March 2021 | As at 31 March 2020 | |||||||
Secured by first pari passu charge by way of hypothecation over all the movable assets (save and except Current Assets) of Vedanta Limited, present or future, pertaining to Lanjigarh refinery expansion project beyond 1.7 MTPA to 6.0 MTPA located at Lanjigarh, Odisha including but not limited to plant and machinery, machinery spares, tools and accessories in relation to aforementioned expansion project. Among others, the Lanjigarh Refinery Expansion Project shall specifically exclude the alumina refinery upto 1.7 MTPA of the company along with 90 MW power plant in Lanjigarh and all its related expansions | 686 | 736 | ||||||||
Secured by first pari passu charge by the way of whole of the movable fixed assets of (i) Alumina Refinery having output of 1 MTPA along with co-generation captive power plant with an aggregate capacity of 90MW at Lanjigarh, Odisha and (ii) Aluminium Smelter having output of 1.6 MTPA along with a 1,215 (9*135) MW CPP at Jharsuguda, Odisha. | 1,148 | 1,487 | ||||||||
Term loans from banks (includes rupee term loans and foreign currency term loans) | Secured by a first pari passu charge on the identified fixed assets of the Vedanta Limited both present and future, pertaining to its Aluminium business (Jharsuguda Plant, Lanjigarh Plant), 2400 MW power plant assets at Jharsuguda, Copper Plant assets at Silvasa, Iron ore business in the states of Karnataka and Goa, dividends receivable from Hindustan Zinc Limited (“HZL”) a subsidiary of the Vedanta Limited, and the debt service reserve account to be opened for the Facility along with the amount lying to the credit thereof. | 8,538 | — | |||||||
Other secured term loans | — | 1,541 | ||||||||
Others | First charge by way of hypothecation on the entire stocks of raw materials, semi-finished and finished goods, consumable stores and spares and such other movables including book-debts, bills whether documentary or clean, outstanding monies, receivables and all other current assets of Vedanta limited, both present and future, ranking pari passu with other participating banks | 48 | 1,145 | |||||||
Other secured borrowings | — | 68 | ||||||||
|
|
|
| |||||||
Total | 31,612 | 30,241 | ||||||||
|
|
|
| |||||||
| * | Includes loans repayable on demand from banks, export packing credit and amounts due on factoring. |
| c) | The Company facilities are subject to certain financial and non- financial covenants. The primary covenants which must be complied with include interest service coverage ratio, current ratio, debt service coverage ratio, total outside liabilities to total net worth, fixed assets coverage ratio, ratio of total term liabilities to net worth and return on fixed assets. The Company has complied with the covenants as per the terms of the loan agreement. |
322
| < BACK TO CONTENTS | Integrated Report | Statutory reports | Financial statements |
Notes
forming part of the financial statements as at and for the year ended March 31, 2021
| d) | Terms of repayment of total borrowings outstanding as at 31 March 2021 are provided below - |
| (₹ in crores) | ||||||||||||||||||||||||||
Borrowings | Weighted average of interest as at 31 March 2021 | Total carrying value | <1 year | 1-3 years | 3-5 years | >5 years | Remarks | |||||||||||||||||||
Foreign Currency term Loan | 3.93 | % | 1,137 | 541 | 596 | — | — | Repayable in 15 quarterly repayments | ||||||||||||||||||
Rupee term loan | 9.12 | % | 18,868 | 2,647 | 4,761 | 5,195 | 6,400 | Repayable in 464 quarterly installments and 1 half yearly payment | ||||||||||||||||||
Non convertible debentures | 8.77 | % | 10,909 | 6,900 | 2,020 | — | 2,000 | Repayable in 10 bullet payments | ||||||||||||||||||
Working capital loan* | 7.13 | % | 940 | 940 | — | — | — | Export packing credit, working capital loan and loan repayable on demand are repayable within one year from the date of drawal | ||||||||||||||||||
Deferred sales tax liability | NA | 62 | 13 | 46 | 12 | — | Repayable in 67 monthly installments | |||||||||||||||||||
Redeemable preference shares | NA | 2 | 2 | — | — | — | The redemption and dividend paid to the preference shares unclaimed if any, is payable on claim. | |||||||||||||||||||
Loan from Related party | 7.40 | % | 200 | 200 | — | — | — | Repayable in one bullet payment | ||||||||||||||||||
Others | 5.23 | % | 48 | 48 | — | — | — | Repayable in 7 bullet payments | ||||||||||||||||||
|
|
|
|
|
|
|
|
|
| |||||||||||||||||
Total | 32,166 | 11,291 | 7,423 | 5,207 | 8,400 | |||||||||||||||||||||
|
|
|
|
|
|
|
|
|
| |||||||||||||||||
The above maturity is based on the total principal outstanding gross of issue expenses and discounting impact of deferred sales tax liability.
| * | Includes loans repayable on demand from banks for ₹ 290 Crore. |
| e) | Terms of repayment of total borrowings outstanding as at 31 March 2020 are provided below - |
| (₹ in crores) | ||||||||||||||||||||||||||
Borrowings | Weighted average of interest as at 31 March 2020 | Total carrying value | <1 year | 1-3 years | 3-5 years | >5 years | Remarks | |||||||||||||||||||
Foreign Currency term Loan | 4.40 | % | 4,268 | 1,970 | 1,609 | 150 | 540 | Repayable in 69 quarterly repayments and one bullet payment | ||||||||||||||||||
Rupee term loan | 8.84 | % | 11,724 | 2,912 | 3,641 | 2,331 | 2,876 | Repayable in 264 quarterly installments and 3 half yearly installments | ||||||||||||||||||
Non convertible debentures | 8.92 | % | 13,013 | 2,600 | 8,420 | — | 2,000 | Repayable in 11 bullet payments | ||||||||||||||||||
Commercial paper | 6.20 | % | 7,524 | 7,524 | Repayable in 29 bullet payments | |||||||||||||||||||||
Working capital loan* | 7.91 | % | 1,090 | 1,090 | — | — | — | Export packing credit & loan repayable on demand is repayable within 1-6 months from the date of drawal and also includes working capital loan which is repayable in one bullet payment. | ||||||||||||||||||
Amounts due on factoring | 4.79 | % | 26 | 26 | — | — | — | Repayable within one month | ||||||||||||||||||
Deferred sales tax liability | NA | 77 | 20 | 42 | 28 | 1 | Repayable in 78 monthly installments | |||||||||||||||||||
Redeemable preference shares | NA | 2 | 2 | — | — | — | The redemption and dividend paid to the preference shares unclaimed if any, is payable on claim. | |||||||||||||||||||
Suppliers’ credit | 7.90 | % | 1,213 | 1,179 | 34 | — | — | Repayable within 6-12 months and 6 suppliers credit LC repayable in more than 12 months upto 36 months | ||||||||||||||||||
|
|
|
|
|
|
|
|
|
| |||||||||||||||||
Total | 38,937 | 17,323 | 13,746 | 2,509 | 5,417 | |||||||||||||||||||||
|
|
|
|
|
|
|
|
|
| |||||||||||||||||
The above maturity is based on the total principal outstanding gross of issue expenses and discounting impact of deferred sales tax liability.
| * | Includes loans repayable on demand from banks for ₹ 1078 Crore. |
VEDANTA LIMITED | INTEGRATED REPORT AND ANNUAL ACCOUNTS 2020-21 | 323
STANDALONE CONTINUED...
Notes
forming part of the financial statements as at and for the year ended March 31, 2021
| f) | Movement in borrowings during the year is provided below- |
| (₹ in crores) | ||||||||||||
Particulars | Short-term borrowing | Long-term borrowing* | Total debt | |||||||||
Opening balance at 01 April 2019 | 17,180 | 25,024 | 42,204 | |||||||||
Cash flow | (7,011 | ) | 2,955 | (4,056 | ) | |||||||
Other non-cash changes | 650 | 139 | 789 | |||||||||
|
|
|
|
|
| |||||||
As at 01 April 2020 | 10,819 | 28,118 | 38,937 | |||||||||
|
|
|
|
|
| |||||||
Cash flow | (10,135 | ) | 3,457 | (6,678 | ) | |||||||
Other non Cash Changes | 466 | (549 | ) | (83 | ) | |||||||
Foreign exchange Currency Translation differences | (10 | ) | — | (10 | ) | |||||||
|
|
|
|
|
| |||||||
As at 31 March 2021 | 1,140 | 31,026 | 32,166 | |||||||||
|
|
|
|
|
| |||||||
| * | including Current maturities of Long term borrowing |
Other non-cash changes comprised of amortisation of borrowing costs, foreign exchange difference on borrowings and reclassification between borrowings due within one year and borrowings due after one year.
| 18A | FINANCIAL LIABILITIES - TRADE PAYABLES a |
| (₹ in crores) | ||||||||||||||||||||||||
| As at 31 March 2021 | As at 31 March 2020 | |||||||||||||||||||||||
Particulars | Non-current | Current | Total | Non-current | Current | Total | ||||||||||||||||||
Total outstanding dues of micro, small and medium enterprises (Refer note 40(b)) | — | 209 | 209 | — | 182 | 182 | ||||||||||||||||||
Total outstanding dues of creditors other than micro, small and medium enterprises | — | 3,499 | 3,499 | — | 3,301 | 3,301 | ||||||||||||||||||
Total outstanding dues of related parties b | — | 95 | 95 | — | 27 | 27 | ||||||||||||||||||
|
|
|
|
|
|
|
|
|
|
|
| |||||||||||||
Total | — | 3,803 | 3,803 | — | 3,510 | 3,510 | ||||||||||||||||||
|
|
|
|
|
|
|
|
|
|
|
| |||||||||||||
| (a) | Trade payables are non- interest bearing and are normally settled upto 180 days terms. |
| (b) | For terms and conditions relating to related party payables, see note 37. |
18B Operational Buyers’ /Suppliers’ Credit is availed in foreign currency from offshore branches of Indian banks or foreign banks at an interest rate ranging from 0.4% to 3.5% per annum and in rupee from domestic banks at interest rate ranging from 4.25-6.65% per annum. These trade credits are largely repayable within 180 days from the date of draw down. Operational Buyers’ credit availed in foreign currency is backed by Standby Letter of Credit issued under working capital facilities sanctioned by domestic banks. Part of these facilities are secured by first pari passu charge over the present and future current assets of the Company.
| 19 | FINANCIAL LIABILITIES - OTHERS |
| (₹ in crores) | ||||||||||||||||||||||||
| As at 31 March 2021 | As at 31 March 2020 | |||||||||||||||||||||||
Particulars | Non-current | Current | Total | Non-current | Current | Total | ||||||||||||||||||
Liability for capital expenditure | 190 | 4,385 | 4,575 | 47 | 5,203 | 5,250 | ||||||||||||||||||
Security deposits and retentions | — | 26 | 26 | — | 28 | 28 | ||||||||||||||||||
Interest accrued but not due | — | 859 | 859 | 170 | 911 | 1,081 | ||||||||||||||||||
Current maturities of long term debt a | — | 10,113 | 10,113 | — | 6,489 | 6,489 | ||||||||||||||||||
Unpaid/unclaimed dividend b | — | 76 | 76 | — | 74 | 74 | ||||||||||||||||||
Unpaid matured deposits and interest accrued thereon c | — | 0 | 0 | — | 0 | 0 | ||||||||||||||||||
Profit petroleum payable | — | 862 | 862 | — | 396 | 396 | ||||||||||||||||||
Dues to related parties (Refer note 37) | — | 1,497 | 1,497 | — | 68 | 68 | ||||||||||||||||||
Lease liabilities e | 60 | 73 | 133 | 71 | 231 | 302 | ||||||||||||||||||
Other liabilities d | — | 1,464 | 1,464 | — | 1,461 | 1,461 | ||||||||||||||||||
|
|
|
|
|
|
|
|
|
|
|
| |||||||||||||
Total | 250 | 19,355 | 19,605 | 288 | 14,861 | 15,149 | ||||||||||||||||||
|
|
|
|
|
|
|
|
|
|
|
| |||||||||||||
324
| < BACK TO CONTENTS | Integrated Report | Statutory reports | Financial statements |
Notes
forming part of the financial statements as at and for the year ended March 31, 2021
| (a) | Current Maturities of long term debt consists of: |
| (₹ in crores) | ||||||||
Particulars | As at 31 March 2021 | As at 31 March 2020 | ||||||
Non-convertible debentures | 6,890 | 2,596 | ||||||
Deferred sales tax liability | 12 | 20 | ||||||
Term loans from banks | ||||||||
- Rupee term loans | 2,620 | 2,901 | ||||||
- Foreign currency term loans | 541 | 929 | ||||||
Redeemable preference shares | 2 | 2 | ||||||
Others | 48 | 41 | ||||||
|
|
|
| |||||
Total | 10,113 | 6,489 | ||||||
|
|
|
| |||||
| (b) | Does not include any amounts, due and outstanding, to be credited to Investor Education and Protection Fund except ₹0.10 Crore (31 March 2020: ₹0.10 Crore) which is held in abeyance due to a pending legal case. |
| (c) | Matured deposits of ₹0.01 Crore (March 31, 2020: ₹0.01 Crore) due for transfer to Investor Education and Protection Fund have not been transferred in view of pending litigation between the beneficiaries. |
| (d) | Includes revenue received in excess of entitlement interest of ₹737 Crore (31 March 2020: ₹765 Crore), reimbursement of expenses, provision for expenses, liabilities related to compensation/claim etc. |
| (e) | The movement in lease liabilities is as follows: |
| (₹ in crores) | ||||
At 01 April 2019 | 191 | |||
|
| |||
Additions during the year | 463 | |||
Interest on lease liabilities | 16 | |||
Payments made | 159 | |||
Deletions | 209 | |||
|
| |||
At 31 March 2020 | 302 | |||
|
| |||
Additions during the year | 9 | |||
Interest on lease liabilities | 14 | |||
Payments made | 164 | |||
Deletions | 28 | |||
|
| |||
At 31 March 2021 | 133 | |||
|
| |||
VEDANTA LIMITED | INTEGRATED REPORT AND ANNUAL ACCOUNTS 2020-21 | 325
STANDALONE CONTINUED...
Notes
forming part of the financial statements as at and for the year ended March 31, 2021
| 20 | FINANCIAL INSTRUMENTS |
| A. | Financial assets and liabilities: |
The accounting classification of each category of financial instruments, and their carrying amounts, are set out below:
As at 31 March 2021
| (₹ in crores) | ||||||||||||||||||||||||
Financial Assets | Fair value through profit or loss | Fair value through other comprehensive income | Derivatives designated as hedging instruments | Amortised cost | Total carrying value | Total fair value | ||||||||||||||||||
Investments* | 2,067 | 103 | — | — | 2,170 | 2,170 | ||||||||||||||||||
Trade receivables | 51 | — | — | 2,408 | 2,459 | 2,459 | ||||||||||||||||||
Cash and cash equivalents | — | — | — | 2,861 | 2,861 | 2,861 | ||||||||||||||||||
Other bank balances | — | — | — | 1,475 | 1,475 | 1,475 | ||||||||||||||||||
Loans | — | — | — | 703 | 703 | 703 | ||||||||||||||||||
Derivatives | 10 | — | 56 | — | 66 | 66 | ||||||||||||||||||
Other financial assets | — | — | — | 6,329 | 6,329 | 6,329 | ||||||||||||||||||
|
|
|
|
|
|
|
|
|
|
|
| |||||||||||||
Total | 2,128 | 103 | 56 | 13,776 | 16,063 | 16,063 | ||||||||||||||||||
|
|
|
|
|
|
|
|
|
|
|
| |||||||||||||
| (₹ in crores) | ||||||||||||||||||||
Financial Liabilities | Fair value through profit or loss | Derivatives designated as hedging instruments | Amortised cost | Total carrying value | Total fair value | |||||||||||||||
Borrowings | — | — | 32,166 | 32,166 | 32,107 | |||||||||||||||
Trade payables | 445 | — | 3,358 | 3,803 | 3,803 | |||||||||||||||
Operational buyers’ credit / suppliers’ credit | — | — | 6,029 | 6,029 | 6,029 | |||||||||||||||
Derivatives | 40 | 149 | 189 | 189 | ||||||||||||||||
Other financial liabilities** | — | — | 9,492 | 9,492 | 9,492 | |||||||||||||||
|
|
|
|
|
|
|
|
|
| |||||||||||
Total | 485 | 149 | 51,045 | 51,679 | 51,620 | |||||||||||||||
|
|
|
|
|
|
|
|
|
| |||||||||||
As at 31 March 2020
| (₹ in crores) | ||||||||||||||||||||||||
Financial Assets | Fair value through profit or loss | Fair value through other comprehensive income | Derivatives designated as hedging instruments | Amortised cost | Total carrying value | Total fair value | ||||||||||||||||||
Investments* | 2,169 | 41 | — | — | 2,210 | 2,210 | ||||||||||||||||||
Trade receivables | 9 | — | — | 2,169 | 2,178 | 2,178 | ||||||||||||||||||
Cash and cash equivalents | — | — | — | 1,846 | 1,846 | 1,846 | ||||||||||||||||||
Other bank balances | — | — | — | 347 | 347 | 347 | ||||||||||||||||||
Loans | — | — | — | 1,779 | 1,779 | 1,779 | ||||||||||||||||||
Derivatives | 222 | — | 329 | — | 551 | 551 | ||||||||||||||||||
Other financial assets | — | — | — | 5,499 | 5,499 | 5,499 | ||||||||||||||||||
|
|
|
|
|
|
|
|
|
|
|
| |||||||||||||
Total | 2,400 | 41 | 329 | 11,640 | 14,410 | 14,410 | ||||||||||||||||||
|
|
|
|
|
|
|
|
|
|
|
| |||||||||||||
326
| < BACK TO CONTENTS | Integrated Report | Statutory reports | Financial statements |
Notes
forming part of the financial statements as at and for the year ended March 31, 2021
| (₹ in crores) | ||||||||||||||||||||
Financial Liabilities | Fair value through profit or loss | Derivatives designated as hedging instruments | Amortised cost | Total carrying value | Total fair value | |||||||||||||||
Borrowings | — | — | 38,937 | 38,937 | 38,912 | |||||||||||||||
Trade payables | 343 | — | 3,167 | 3,510 | 3,510 | |||||||||||||||
Operational buyers’ credit / suppliers’ credit | — | — | 7,129 | 7,129 | 7,129 | |||||||||||||||
Derivatives | 9 | 38 | — | 47 | 47 | |||||||||||||||
Other financial liabilities** | — | — | 8,660 | 8,660 | 8,660 | |||||||||||||||
|
|
|
|
|
|
|
|
|
| |||||||||||
Total | 352 | 38 | 57,893 | 58,283 | 58,258 | |||||||||||||||
|
|
|
|
|
|
|
|
|
| |||||||||||
| * | Investment in note 6 also includes investments (in equity and preference shares) in subsidiaries, associates and joint ventures which are carried at cost and hence are not required to be disclosed as per Ind AS 107 “Financial Instruments Disclosures”. Hence, the same have been excluded from the above table. |
| ** | Include lease liabilities of ₹133 Crore as at 31 March 2021 (31 March 2020: ₹302 Crore). |
| B. | Fair value hierarchy |
The Company uses the following hierarchy for determining and/or disclosing the fair value of financial instruments by valuation techniques:
| (i) | Level 1: quoted prices (unadjusted) in active markets for identical assets or liabilities. |
| (ii) | Level 2: inputs other than quoted prices included within Level 1 that are observable for the asset or liability, either directly (i.e. as prices) or indirectly (i.e., derived from prices). |
| (iii) | Level 3: inputs for the asset or liability that are not based on observable market data (unobservable inputs). The below table summarises the categories of financial assets and liabilities as at 31 March 2021 and 31 March 2020 measured at fair value: |
As at 31 March 2021
| (₹ in crores) | ||||||||||||
Financial Assets | Level 1 | Level 2 | Level 3 | |||||||||
At fair value through profit or loss | ||||||||||||
-Investments | 2,016 | — | 51 | |||||||||
-Derivative financial assets* | — | 10 | — | |||||||||
-Trade receivables | — | 51 | — | |||||||||
At fair value through other comprehensive income | ||||||||||||
-Investments | 92 | — | 11 | |||||||||
Derivatives designated as hedging instruments | ||||||||||||
-Derivative financial assets* | — | 56 | — | |||||||||
|
|
|
|
|
| |||||||
Total | 2,108 | 117 | 62 | |||||||||
|
|
|
|
|
| |||||||
| (₹ in crores) | ||||||||||||
Financial Liabilities | Level 1 | Level 2 | Level 3 | |||||||||
At fair value through profit or loss | ||||||||||||
-Derivative financial liabilities* | — | 40 | — | |||||||||
-Trade payables | — | 445 | — | |||||||||
Derivatives designated as hedging instruments | ||||||||||||
-Derivative financial liabilities* | — | 149 | — | |||||||||
|
|
|
|
|
| |||||||
Total | — | 634 | — | |||||||||
|
|
|
|
|
| |||||||
VEDANTA LIMITED | INTEGRATED REPORT AND ANNUAL ACCOUNTS 2020-21 | 327
STANDALONE CONTINUED...
Notes
forming part of the financial statements as at and for the year ended March 31, 2021
As at 31 March 2020
| (₹ in crores) | ||||||||||||
Financial Assets | Level 1 | Level 2 | Level 3 | |||||||||
At fair value through profit or loss | ||||||||||||
-Investments | 589 | 1,529 | 51 | |||||||||
-Derivative financial assets* | — | 222 | — | |||||||||
-Trade receivables | — | 9 | — | |||||||||
At fair value through other comprehensive income | ||||||||||||
-Investments | 30 | — | 11 | |||||||||
Derivatives designated as hedging instruments | ||||||||||||
-Derivative financial assets* | — | 329 | — | |||||||||
|
|
|
|
|
| |||||||
Total | 619 | 2,089 | 62 | |||||||||
|
|
|
|
|
| |||||||
| (₹ in crores) | ||||||||||||
Financial Liabilities | Level 1 | Level 2 | Level 3 | |||||||||
At fair value through profit or loss | ||||||||||||
-Derivative financial liabilities* | — | 9 | — | |||||||||
-Trade payables | — | 343 | — | |||||||||
Derivatives designated as hedging instruments | ||||||||||||
-Derivative financial liabilities* | — | 38 | — | |||||||||
|
|
|
|
|
| |||||||
Total | — | 390 | — | |||||||||
|
|
|
|
|
| |||||||
| * | Refer “D” below. |
The below table summarises the fair value of borrowings which are carried at amortised cost as at 31 March 2021 and 31 March 2020:
As at 31 March 2021
| (₹ in crores) | ||||||||||||
Financial Liabilities | Level 1 | Level 2 | Level 3 | |||||||||
Borrowings | — | 32,107 | — | |||||||||
|
|
|
|
|
| |||||||
Total | — | 32,107 | — | |||||||||
|
|
|
|
|
| |||||||
As at 31 March 2020
| (₹ in crores) | ||||||||||||
Financial Liabilities | Level 1 | Level 2 | Level 3 | |||||||||
Borrowings | — | 38,912 | — | |||||||||
|
|
|
|
|
| |||||||
Total | — | 38,912 | — | |||||||||
|
|
|
|
|
| |||||||
The fair value of the financial assets and liabilities are at the amount that would be received to sell an asset and paid to transfer a liability in an orderly transaction between market participants at the measurement date. The following methods and assumptions were used to estimate the fair values:
Investments traded in active markets are determined by reference to quotes from the financial institutions; for example: Net asset value (NAV) for investments in mutual funds declared by mutual fund house. For other listed securities traded in markets which are not active, the quoted price is used wherever the pricing mechanism is same as for other marketable securities traded in
active markets. Other current investments are valued on the basis of market trades, poll and primary issuances for securities issued by the same or similar issuer and for similar maturities or based on the applicable spread movement for the security derived based on the aforementioned factor(s).
Trade receivables, cash and cash equivalents, other bank balances, loans, other financial assets, current borrowings, trade payables and other current financial liabilities: fair values approximate their carrying amounts largely due to the short-term maturities of these instruments.
328
| < BACK TO CONTENTS | Integrated Report | Statutory reports | Financial statements |
Notes
forming part of the financial statements as at and for the year ended March 31, 2021
Other non-current financial assets and liabilities: Fair value is calculated using a discounted cash flow model with market assumptions, unless the carrying value is considered to approximate to fair value.
Non-current fixed-rate and variable-rate borrowings: Fair value has been determined by the Company based on parameters such as interest rates, specific country risk factors, and the risk characteristics of the financed project.
Derivative financial assets/liabilities: The Company enters into derivative financial instruments with various counterparties. Interest rate swaps, foreign exchange forward contracts and commodity forward contracts are valued using valuation techniques, which employs the use of market observable inputs. The most frequently applied valuation techniques include the forward pricing and swap models, using present value calculations. The models incorporate various inputs including foreign exchange spot and forward rates, yield curves of the respective currencies, currency basis spreads between the respective currencies, interest rate curves and forward rate curves of the underlying commodity. Commodity contracts are valued using the forward LME rates of commodities actively traded on the listed metal exchange i.e. London Metal Exchange, United Kingdom (U.K.).
For all other financial instruments, the carrying amount either the fair value, or approximates the fair value.
The changes in counterparty credit risk had no material effect on the hedge effectiveness assessment for derivatives designated in hedge relationship and the value of other financial instruments recognised at fair value.
The estimated fair value amounts as at 31 March 2021 have been measured as at that date. As such, the fair values of these financial instruments subsequent to reporting date may be different than the amounts reported at each year-end.
There were no significant transfers between Level 1, Level 2 and Level 3 during the year.
| C. | Risk management framework |
The Company’s businesses are subject to several risks and uncertainties including financial risks.
The Company’s documented risk management policies act as an effective tool in mitigating the various financial risks to which the businesses are exposed in the course of their daily operations. The risk management policies cover areas such as liquidity risk, commodity price risk, foreign exchange risk, interest rate risk, counterparty credit risk and capital management. Risks are identified at both the corporate and individual subsidiary level
with active involvement of senior management. Each operating subsidiary in the Company has in place risk management processes which are in line with the Company’s policy. Each significant risk has a designated ‘owner’ within the Company at an appropriate senior level. The potential financial impact of the risk and its likelihood of a negative outcome are regularly updated.
The risk management process is coordinated by the Management Assurance function and is regularly reviewed by the Company’s Audit Committee. The Audit Committee is aided by the other Committees of the Board including the Risk Management Committee, which meets regularly to review risks as well as the progress against the planned actions. Key business decisions are discussed at the periodic meetings of the Executive Committee. The overall internal control environment and risk management programme including financial risk management is reviewed by the Audit Committee on behalf of the Board.
The risk management framework aims to:
| • | improve financial risk awareness and risk transparency |
| • | identify, control and monitor key risks |
| • | identify risk accumulations |
| • | provide management with reliable information on the Company’s risk situation |
| • | improve financial returns |
Treasury management
Treasury management focuses on liability management, capital protection, liquidity maintenance and yield maximisation. The treasury policies are approved by the Committee of the Board. Daily treasury operations of the business units are managed by their respective finance teams within the framework of the overall Group treasury policies. Long-term fund raising including strategic treasury initiatives are managed jointly by the business treasury team and the central team at corporate treasury while short-term funding for routine working capital requirements is delegated to business units. A monthly reporting system exists to inform senior management of the Company’s investments and debt position, exposure to currency, commodity and interest rate risk and their mitigants including the derivative position. The Company has a strong system of internal control which enables effective monitoring of adherence to Company’s policies. The internal control measures are effectively supplemented by regular internal audits.
VEDANTA LIMITED | INTEGRATED REPORT AND ANNUAL ACCOUNTS 2020-21 | 329
STANDALONE CONTINUED...
Notes
forming part of the financial statements as at and for the year ended March 31, 2021
The Company uses derivative instruments to manage the exposure in foreign currency exchange rates, interest rates and commodity prices. The Company does not acquire or issue derivative financial instruments for trading or speculative purposes. The Company does not enter into complex derivative transactions to manage the treasury and commodity risks. Both treasury and commodities derivative transactions are normally in the form of forward contracts, interest rate and currency swaps and these are in line with the Company’s policies.
Commodity price risk
The Company is exposed to the movement of base metal commodity prices on the London Metal Exchange. Any decline in the prices of the base metals that the Company produces and sells will have an immediate and direct impact on the profitability of the businesses. As a general policy, the Company aims to sell the products at prevailing market prices. The commodity price risk in imported input commodity such as of Alumina, anodes, etc., for our aluminium and copper business respectively, is hedged on back-to-back basis ensuring no price risk for the business. Hedging is used primarily as a risk management tool and, in some cases, to secure future cash flows in cases of high volatility by entering into forward contracts or similar instruments. The hedging activities are subject to strict limits set out by the Board and to a strictly defined internal control and monitoring mechanism. Decisions relating to hedging of commodities are taken at the Executive Committee level, basis clearly laid down guidelines.
Whilst the Company aims to achieve average LME prices for a month or a year, average realised prices may not necessarily reflect the LME price movements because of a variety of reasons such as uneven sales during the year and timing of shipments.
The Company is also exposed to the movement of international crude oil price and the discount in the price of Rajasthan crude oil to Brent price.
Financial instruments with commodity price risk are entered into in relation to following activities:
| • | economic hedging of prices realised on commodity contracts |
| • | cash flow hedging of revenues, forecasted highly probable transactions |
Aluminium
The requirement of the primary raw material, alumina, is partly met from own sources and the rest is purchased primarily on negotiated price terms. Sales prices are linked to the LME prices. At present the Company on selective basis hedges the aluminium content in outsourced alumina to protect its margins. The Company also enters into hedging arrangements for its aluminium sales to realise average month of sale LME prices.
Copper
The Company’s custom refining copper operations at Silvassa is benefitted by a natural hedge except to the extent of a possible mismatch in quotational periods between the purchase of anodes / blisters and the sale of finished copper. The Company’s policy on custom smelting is to generate margins from Refining Charges or “RC”, improving operational efficiencies, minimising conversion cost, generating a premium over LME on sale of finished copper, sale of by-products and from achieving import parity on domestic sales. Hence, mismatches in quotational periods are managed to ensure that the gains or losses are minimised. The Company hedges this variability of LME prices through forward contracts and tries to make the LME price a pass-through cost between purchases of anodes / blisters and sales of finished products, both of which are linked to the LME price.
RCs are a major source of income for the Indian copper refining operations. Fluctuations in Rcs are influenced by factors including demand and supply conditions prevailing in the market for smelters output. The Company’s copper business has a strategy of securing a majority of its anodes / blisters feed requirement under long-term contracts with smelters / traders.
Iron ore
The Company sells its Iron Ore production from Goa on the prevailing market prices and from Karnataka through e-auction route as mandated by State Government of Karnataka in India.
Oil and Gas
The prices of various crude oils are based upon the price of the key physical benchmark crude oil such as Dated Brent, West Texas Intermediate, and Dubai/Oman etc. The crude oil prices move based upon market factors like supply and demand. The regional producers price their crude basis these benchmark crude with a premium or discount over the benchmark based upon quality differential and competitiveness of various grades.
Natural gas markets are evolving differently in important geographical markets. There is no single global market for natural gas. This could be owing to difficulties in large- scale transportation over long distances as compared to crude oil. Globally, there are three main regional hubs for pricing of natural gas, which are USA (Henry Hub Prices), UK (NBP Price) and Japan (imported gas price, mostly linked to crude oil).
330
| < BACK TO CONTENTS | Integrated Report | Statutory reports | Financial statements |
Notes
forming part of the financial statements as at and for the year ended March 31, 2021
Provisionally priced financial instruments
On 31 March 2021, the value of net financial liabilities linked to commodities (excluding derivatives) accounted for on provisional prices was ₹394 Crore (31 March 2020: liabilities of ₹334 Crore). These instruments are subject to price movements at the time of final settlement and the final price of these instruments will be determined in the financial year beginning 01 April 2021.
Set out below is the impact of 10% increase in LME prices on pre-tax profit/ (loss) for the year and pre-tax total equity as a result of changes in value of the Company’s commodity financial instruments:
For the year ended 31 March 2021
| (₹ in crores) | ||||||||||||
| Total Exposure | Effect on profit/(loss) of a 10% increase in the LME | Effect on total equity of a 10% increase in the LME | ||||||||||
Copper | (713 | ) | (71 | ) | — | |||||||
For the year ended 31 March 2020
| (₹ in crores) | ||||||||||||
| Total Exposure | Effect on profit/(loss) of a 10% increase in the LME | Effect on total equity of a 10% increase in the LME | ||||||||||
Copper | (794 | ) | (79 | ) | — | |||||||
The above sensitivities are based on volumes, costs, exchange rates and other variables and provide the estimated impact of a change in LME prices on profit and equity assuming that all other variables remain constant. A 10% decrease in LME prices would have an equal and opposite effect on the Company’s financial statements.
The impact on pre-tax profit/(loss) mentioned above includes the impact of a 10% increase in closing copper LME for provisionally priced copper concentrate purchased at Copper division custom smelting operations in India of ₹87 Crore loss (31 March 2020: ₹79 Crore loss), which is pass through in nature and as such will not have any impact on the profitability.
Financial risk
The Company’s Board approved financial risk policies include monitoring, measuring and mitigating the liquidity, currency, interest rate and counterparty risk. The Company does not engage in speculative treasury activity but seeks to manage risk and optimize interest and commodity pricing through proven financial instruments.
| (a) | Liquidity |
The Company requires funds both for short-term operational needs as well as for long-term investment programmes mainly in growth projects. The Company generates sufficient cash flows from the current operations which together with the available cash and cash equivalents and short-term investments provide liquidity both in the short-term as well as in the long- term. The Company has been rated by CRISIL Limited (CRISIL) and India Ratings and Research Private Limited (India Rating) for its capital market issuance in the form of CPs and NCDs and for its banking facilities in line with Basel II norms.
CRISIL affirmed our rating for the Company’s long-term bank facilities and its Non-Convertible Debentures (NCD) programme to CRISIL AA / Stable during the year. India Ratings has revised the outlook on Vedanta Limited’s ratings to IND AA / Negative from IND AA/ Stable on account of delay in deleveraging due to sharp fall in commodity prices and delay in volume ramp-up in key business segments. Vedanta Limited has the highest short term rating on its working capital and Commercial Paper Programme at A1+ from CRISIL and India Ratings.
During FY2020, Moodys downgraded Corporate Family Rating of Vedanta Resources from Ba3 to B1 (and the rating of senior unsecured notes from B2 to B3) and subsequently placed the rating under review for downgrade in March 2020 on account of expectation of weaker credit metrics in low commodity price environment in wake of Covid-19. On 28 July 2020, Moody’s confirmed Vedanta Resources Limited’s B1 Corporate Family Rating and B3 rating on the senior unsecured notes of the company and changed the outlook on the rating to negative from ratings under review for downgrade. The confirmation of the ratings is driven by Moody’s expectation of stretched credit profile in fiscal year 2021 in wake of Covid 19 pandemic and recovery in credit metrics appropriate for current rating in fiscal year 2022. The negative outlook takes into account heightened refinancing risk in challenging market conditions. Further to the downgrade of VRL by S&P to B / Stable in November 2019, S&P downgraded the ratings to B- with stable outlook in March 2020 on account of weakened liquidity and increased refinancing risk due to volatility in commodity prices.
VEDANTA LIMITED | INTEGRATED REPORT AND ANNUAL ACCOUNTS 2020-21 | 331
STANDALONE CONTINUED...
Notes
forming part of the financial statements as at and for the year ended March 31, 2021
Anticipated future cash flows, together with undrawn fund based committed facilities of ‘1,084 Crore, and cash, bank and current investments of ₹2,994 Crore as at 31 March 2021, are expected to be sufficient to meet the liquidity requirement of the Company in the near future.
The Company remains committed to maintaining a healthy liquidity, a low gearing ratio, deleveraging and strengthening its balance sheet. The maturity profile of the Company’s financial liabilities based on the remaining period from the date of balance sheet to the contractual maturity date is given in the table below. The figures reflect the contractual undiscounted cash obligation of the Company.
As at 31 March 2021
| (₹ in crores) | ||||||||||||||||||||
Payments due by year | <1 year | 1-3 years | 3-5 years | >5 years | Total | |||||||||||||||
Borrowings* | 14,012 | 10,633 | 7,353 | 9,903 | 41,901 | |||||||||||||||
Derivative financial liabilities | 139 | 50 | — | — | 189 | |||||||||||||||
Lease liability | 73 | 27 | 13 | 20 | 133 | |||||||||||||||
Trade Payables and other financial liabilities** | 18,174 | 190 | — | — | 18,364 | |||||||||||||||
|
|
|
|
|
|
|
|
|
| |||||||||||
Total | 32,398 | 10,900 | 7,366 | 9,923 | 60,587 | |||||||||||||||
|
|
|
|
|
|
|
|
|
| |||||||||||
As at 31 March 2020
| (₹ in crores) | ||||||||||||||||||||
Payments due by year | <1 year | 1-3 years | 3-5 years | >5 years | Total | |||||||||||||||
Borrowings* | 20,416 | 16,105 | 3,725 | 7,033 | 47,279 | |||||||||||||||
Derivative financial liabilities | 38 | 9 | — | — | 47 | |||||||||||||||
Lease liability | 231 | 26 | 23 | 22 | 302 | |||||||||||||||
Trade Payables and other financial liabilities** | 17,937 | 47 | — | — | 17,984 | |||||||||||||||
|
|
|
|
|
|
|
|
|
| |||||||||||
Total | 38,622 | 16,187 | 3,748 | 7,055 | 65,612 | |||||||||||||||
|
|
|
|
|
|
|
|
|
| |||||||||||
| * | Includes Non-current borrowings, current borrowings, current maturities of non-current borrowings and committed interest payments on borrowings and interest accrued on borrowings. |
| ** | Includes both Non-current and current financial liabilities and committed interest payment, as applicable. Excludes current maturities of non-current borrowings and interest accrued on borrowings. |
The Company had access to following funding facilities:
As at 31 March 2021
| (₹ in crores) | ||||||||||||
Funding facilities | Total Facility | Drawn |
| |||||||||
Fund/non-fund based | 37,590 | 33,923 | 3,667 | |||||||||
As at 31 March 2020
| (₹ in crores) | ||||||||||||
Funding facility | Total Facility | Drawn | Undrawn | |||||||||
Fund/non-fund based | 40,620 | 33,281 | 7,339 | |||||||||
Collateral
The Company has pledged financial instruments with carrying amount of ₹13,147 Crore (31 March 2020: ₹11,069 Crore) and inventories with carrying amount of ₹5,555 Crore (31 March 2020: ₹5,689 Crore) as per the requirements specified in various financial facilities in place. The counterparties have an obligation to release the securities to the Company when financial facilities are surrendered.
| (b) | Foreign exchange risk |
Fluctuations in foreign currency exchange rates may have an impact on the statement of profit and loss, the statement of changes in equity, where any transaction references more than one currency or where assets/liabilities are denominated in a currency other than the functional currency of the Company.
332
| < BACK TO CONTENTS | Integrated Report | Statutory reports | Financial statements |
Notes
forming part of the financial statements as at and for the year ended March 31, 2021
Exposures on foreign currency loans are managed through the Company wide hedging policy, which is reviewed periodically to ensure that the results from fluctuating currency exchange rates are appropriately managed. The Company strives to achieve asset liability offset of foreign currency exposures and only the net position is hedged.
The Company’s presentation currency is the Indian Rupee (INR). The assets are located in India and the Indian Rupee is the functional currency except for Oil and Gas business operations which have a dual functional currency. Natural hedges available in the business are identified at each entity level and hedges are placed only for the net exposure. Short-term net exposures are hedged progressively based on their maturity. A more conservative approach has been adopted for project expenditures to avoid budget overruns, where cost of the project is calculated taking into account the hedge cost. The hedge mechanisms are reviewed periodically to ensure that the risk from fluctuating currency exchange rates is appropriately managed.
The following analysis is based on the gross exposure as at the reporting date which could affect the statement of profit and loss. The exposure is mitigated by some of the derivative contracts entered into by the Company as disclosed under the section on “Derivative financial instruments”.
The carrying amount of the Company’s financial assets and liabilities in different currencies are as follows:
| (₹ in crores) | ||||||||||||||||
| As at 31 March 2021 | As at 31 March 2020 | |||||||||||||||
Currency | Financial Asset | Financial liabilities | Financial Asset | Financial liabilities | ||||||||||||
INR | 12,319 | 38,218 | 8,611 | 40,961 | ||||||||||||
USD | 3,591 | 13,096 | 5,648 | 17,290 | ||||||||||||
Others | 153 | 364 | 151 | 32 | ||||||||||||
|
|
|
|
|
|
|
| |||||||||
Total | 16,063 | 51,678 | 14,410 | 58,283 | ||||||||||||
|
|
|
|
|
|
|
| |||||||||
The Company’s exposure to foreign currency arises where an entity holds monetary assets and liabilities denominated in a currency different to the functional currency of the respective business, with US dollar being the major non-functional currency.
The foreign exchange rate sensitivity is calculated by the aggregation of the net foreign exchange rate exposure with a simultaneous parallel foreign exchange rates shift in the foreign currencies by 10% against the functional currency of the respective businesses.
Set out below is the impact of a 10% strengthening in the functional currencies of the respective businesses on pre-tax profit/(loss) and pre-tax equity arising as a result of the revaluation of the Company’s foreign currency monetary financial assets/liabilities:
For the year ended 31 March 2021
| (₹ in crores) | ||||||||
| Effect of 10% strengthening of functional currency on pre-tax profit/ (loss) | Effect of 10% strengthening of foreign currency on equity | |||||||
USD | 678 | — | ||||||
INR | (282 | ) | — | |||||
For the year ended 31 March 2020
| (₹ in crores) | ||||||||
| Effect of 10% strengthening of functional currency on pre-tax profit/ (loss) | Effect of 10% strengthening of foreign currency on equity | |||||||
USD | 860 | — | ||||||
INR | 93 | — | ||||||
VEDANTA LIMITED | INTEGRATED REPORT AND ANNUAL ACCOUNTS 2020-21 | 333
STANDALONE CONTINUED...
Notes
forming part of the financial statements as at and for the year ended March 31, 2021
A 10% weakening of functional currencies of the respective businesses would have an equal and opposite effect on the Company’s financial statements.
(c) Interest rate risk
At 31 March 2021, the Company’s net debt of ₹26,314 Crore (31 March 2020: ₹33,985 Crore) comprises debt of ₹32,166 Crore (31 March 2020: ₹38,937 Crore) offset by cash, bank and investments of ₹5,852 Crore (31 March 2020: ₹4,952 Crore).
The Company is exposed to interest rate risk on short-term and long-term floating rate instruments and on the refinancing of fixed rate debt. The Company’s policy is to maintain a balance of fixed and floating interest rate borrowings and the proportion of fixed and floating rate debt is determined by current market interest rates. The borrowings of the Company are principally denominated in Indian Rupees and US dollars with mix of fixed and floating rates of interest. The USD floating rate debt is linked to US dollar LIBOR and INR Floating rate debt to Bank’s base rate.
The Company has a policy of selectively using interest rate swaps, option contracts and other derivative instruments to manage its exposure to interest rate movements. These exposures are reviewed by appropriate levels of management on a monthly basis. The Company invests cash and liquid investments in short-term deposits and debt mutual funds, some of which generate a tax-free return, to achieve the Company’s goal of maintaining liquidity, carrying manageable risk and achieving satisfactory returns.
Floating rate financial assets are largely mutual fund investments which have debt securities as underlying assets. The returns from these financial assets are linked to market interest rate movements; however the counterparty invests in the agreed securities with known maturity tenure and return and hence has manageable risk.
The exposure of the Company’s financial assets as at 31 March 2021 to interest rate risk is as follows:
As at 31 March 2021 | Total | Floating rate financial assets | Fixed rate financial assets | (₹ in crores) Non-interest bearing financial assets | ||||||||||||
Financial Assets | 16,063 | 2,016 | 4,292 | 9,755 | ||||||||||||
The exposure of the Company’s financial liabilities as at 31 March 2021 to interest rate risk is as follows: |
| |||||||||||||||
As at 31 March 2021 | Total | Floating rate financial liabilities | Fixed rate financial liabilities | (₹ in crores) Non-interest bearing financial liabilities | ||||||||||||
Financial Liabilities | 51,679 | 18,916 | 20,795 | 11,968 | ||||||||||||
The exposure of the Company’s financial assets as at 31 March 2020 to interest rate risk is as follows: |
| |||||||||||||||
As at 31 March 2020 | Total | Floating rate financial assets | Fixed rate financial assets | (₹ in crores) Non-interest bearing financial assets | ||||||||||||
Financial Assets | 14,410 | 1,121 | 4,466 | 8,823 | ||||||||||||
The exposure of the Company’s financial liabilities as at 31 March 2020 to interest rate risk is as follows: |
| |||||||||||||||
As at 31 March 2020 | Total | Floating rate financial liabilities | Fixed rate financial liabilities | (₹ in crores) Non-interest bearing financial liabilities | ||||||||||||
Financial Liabilities | 58,283 | 19,174 | 27,260 | 11,849 | ||||||||||||
Considering the net debt position as at 31 March 2021 and the investment in bank deposits, corporate bonds and debt mutual funds, any increase in interest rates would result in a net loss and any decrease in interest rates would result in a net gain. The sensitivity analysis below has been determined based on the exposure to interest rates for financial instruments at the balance sheet date.
334
| < BACK TO CONTENTS | Integrated Report | Statutory reports | Financial statements |
Notes
forming part of the financial statements as at and for the year ended March 31, 2021
The table below illustrates the impact of a 0.5% to 2.0% movement in interest rates on floating rate financial assets/ liabilities (net) on profit/(loss) and equity assuming that the changes occur at the reporting date and has been calculated based on risk exposure
outstanding as of that date. The year end balances are not necessarily representative of the average debt outstanding during the year. This analysis also assumes that all other variables, in particular foreign currency rates, remain constant.
Increase in interest rates | Effect on pre-tax profit/(loss) during the year ended 31 March 2021 | (₹ in crores) Effect on pre-tax profit/(loss) during the year ended 31 March 2020 | ||||||
0.50% | (85 | ) | (90 | ) | ||||
1.00% | (169 | ) | (181 | ) | ||||
2.00% | (338 | ) | (361 | ) | ||||
An equivalent reduction in interest rates would have an equal and opposite effect on the Company’s financial statements.
(d) Counterparty and concentration of credit risk Credit risk refers to the risk that counterparty will default on its contractual obligations resulting in financial loss to the Company. The Company has adopted a policy of only dealing with creditworthy counterparties and obtaining sufficient collateral, where appropriate, as a means of mitigating the risk of financial loss from defaults.
The Company is exposed to credit risk from trade receivables, contract assets, investments, loans, other financial assets, and derivative financial instruments.
Credit risk on receivables is limited as almost all credit sales are against letters of credit and guarantees of banks of national standing.
Moreover, given the diverse nature of the Company’s businesses trade receivables are spread over a number of customers with no significant concentration of credit risk. The history of trade receivables shows a negligible provision for bad and doubtful debts. Therefore, the Company does not expect any material risk on account of non-performance by any of the Company’s counterparties.
The Company has clearly defined policies to mitigate counterparty risks. For current investments, counterparty limits are in place to limit the amount of credit exposure to any one counterparty. This, therefore, results in diversification of credit risk for our mutual fund and bond investments. For derivative and financial instruments, the Company attempts to limit the credit risk by only dealing with reputable banks and financial institutions.
The carrying value of the financial assets represents the maximum credit exposure. The Company’s maximum exposure to credit risk is ₹16,063 Crore and ₹14,410 Crore as at 31 March 2021 and 31 March 2020 respectively.
The maximum credit exposure on financial guarantees given by the Company for various financial facilities is described in Note 36 on “Commitments, contingencies, and guarantees”.
None of the Company’s cash equivalents, including time deposits with banks, are past due or impaired. Regarding trade receivables, loans and other financial assets (both current and non-current), there were no indications as at 31 March 2021, that defaults in payment obligations will occur except as described in Note 7 and 9 on allowance for impairment of trade receivables and other financial assets.
Of the year end trade receivables, loans and other financial assets (excluding bank deposits, site restoration fund and derivatives) balance the following, though overdue, are expected to be realised in the normal course of business and hence, are not considered impaired as at 31 March 2021 and 31 March 2020:
Particulars | As at 31 March 2021 | (₹ in crores) As at 31 March 2020 | ||||||
Neither impaired nor past due | 6,464 | 5,792 | ||||||
Past due but not impaired | ||||||||
- Less than 1 month | 150 | 523 | ||||||
- Between 1–3 months | 77 | 664 | ||||||
- Between 3–12 months | 260 | 195 | ||||||
- Greater than 12 months | 1,986 | 1,154 | ||||||
|
|
|
| |||||
Total | 8,937 | 8,328 | ||||||
|
|
|
| |||||
VEDANTA LIMITED | INTEGRATED REPORT AND ANNUAL ACCOUNTS 2020-21 | 335
STANDALONE CONTINUED...
Notes
forming part of the financial statements as at and for the year ended March 31, 2021
Receivables are deemed to be past due or impaired with reference to the Company’s normal terms and conditions of business. These terms and conditions are determined on a case to case basis with reference to the customer’s credit quality and prevailing market conditions. Receivables that are classified as ‘past due’ in the above tables are those that have not been
settled within the terms and conditions that have been agreed with that customer. The Company based on past experiences does not expect any material loss on its receivables.
The credit quality of the Company’s customers is monitored on an ongoing basis. Where receivables have been impaired, the Group actively seeks to recover the amounts in question and enforce compliance with credit terms.
Movement in allowances for Financial Assets (Trade receivables and financial assets—others)
The changes in the allowance for financial assets (current and non-current) is as follows:
Particulars | Trade receivables | Financial assets – Others | (₹ in crores) Financial assets – Loans | |||||||||
As at 01 April 2019 | 525 | 248 | — | |||||||||
Allowance made during the year | 16 | 402 | — | |||||||||
Reversals/ write-off during the year | (17 | ) | — | — | ||||||||
Exchange differences | 0 | 21 | — | |||||||||
As at 31 March 2020 | 524 | 671 | — | |||||||||
Allowance made during the year | 61 | 61 | 5 | |||||||||
Exploration cost written off | — | 3 | — | |||||||||
Exchange differences | — | (5 | ) | — | ||||||||
|
|
|
|
|
| |||||||
As at 31 March 2021 | 585 | 730 | 5 | |||||||||
|
|
|
|
|
| |||||||
D. Derivative financial instruments
The Company uses derivative instruments as part of its management of exposure to fluctuations in foreign currency exchange rates, interest rates and commodity prices. The Company does not acquire or issue derivative financial instruments for trading or speculative purposes. The Company does not enter into complex derivative transactions to manage the treasury and commodity risks. Both treasury and commodities derivative transactions are normally in the form of forward contracts and these are subject to the Company guidelines and policies.
The fair values of all derivatives are separately recorded in the balance sheet within current and non-current assets and liabilities. Derivatives that are designated as hedges are classified as current or non-current depending on the maturity of the derivative.
The use of derivatives can give rise to credit and market risk. The Company tries to control credit risk as far as possible by only entering into contracts with reputable banks and financial institutions. The use of derivative instruments is subject to limits, authorities and regular monitoring by appropriate levels of management. The limits, authorities and monitoring systems are periodically reviewed by management and the Board.
The market risk on derivatives is mitigated by changes in the valuation of the underlying assets, liabilities or transactions, as derivatives are used only for risk management purposes.
(i) Cash flow hedges
The Company enters into forward exchange and commodity price contracts for hedging highly probable forecast transaction and account for them as cash flow hedges and states them at fair value. Subsequent changes in fair value are recognized in equity through OCI until the hedged transaction occurs, at which time, the respective gain or losses are reclassified to profit or loss. These hedges have been effective for the year ended 31 March 2021.
The Company uses foreign exchange contracts from time to time to optimize currency risk exposure on its foreign currency transactions. The Company hedged part of its foreign currency exposure on capital commitments during the year ended 2020. Fair value changes on such forward contracts are recognized in other comprehensive income.
The majority of cash flow hedges taken out by the Company during the year comprise non-derivative hedging instruments for hedging the foreign exchange rate of highly probable forecast transactions and commodity price contracts for hedging the commodity price risk of highly probable forecast transactions.
336
| < BACK TO CONTENTS | Integrated Report | Statutory reports | Financial statements |
Notes
forming part of the financial statements as at and for the year ended March 31, 2021
The cash flows related to above are expected to occur during the year ended 31 March 2022 and consequently may impact profit or loss for that year depending upon the change in the commodity prices and foreign exchange rates movements. For cash flow hedges regarded as basis adjustments to initial carrying value of the property, plant and equipment, the depreciation on the basis adjustments made is expected to affect profit or loss over the expected useful life of the property, plant and equipment.
(ii) Fair value hedge
The fair value hedges relate to forward covers taken to hedge currency exposure and commodity price risks.
The Company’s sales are on a quotational period basis, generally one month to three months after the date of delivery at a customer’s facility. The Company enters into forward contracts for the respective quotational period
to hedge its commodity price risk based on average LME prices. Gains and losses on these hedge transactions are substantially offset by the amount of gains or losses on the underlying sales. Net gains and losses are recognized in the statement of profit and loss.
The Company uses foreign exchange contracts from time to time to optimize currency risk exposure on its foreign currency transactions. Fair value changes on such forward contracts are recognized in the statement of profit and loss.
(iii) Non- designated economic hedge
The Company enters into derivative contracts which are not designated as hedges for accounting purposes, but provide an economic hedge of a particular transaction risk or a risk component of a transaction. Hedging instruments include copper, aluminium future contracts on the LME and certain other derivative instruments. Fair value changes on such derivative instruments are recognized in the statement of profit and loss.
The fair value of the Company’s derivative positions recorded under derivative financial assets and derivative financial liabilities are as follows:
Derivative Financial Instruments | As at 31 March 2021 Assets | Liabilities | As at 31 March 2020 Assets | (₹ in crores) Liabilities | ||||||||||||
Current | ||||||||||||||||
Cash flow hedge* | ||||||||||||||||
- Commodity contracts | 3 | 38 | 53 | — | ||||||||||||
- Forward foreign currency contracts | — | — | — | — | ||||||||||||
- Interest rate swap | — | 5 | — | — | ||||||||||||
Fair Value hedge | ||||||||||||||||
- Commodity contracts | 39 | 3 | 100 | 11 | ||||||||||||
- Forward foreign currency contracts | 14 | 54 | 173 | 19 | ||||||||||||
Non - qualifying hedges/economic hedge | ||||||||||||||||
- Commodity contracts | — | — | — | — | ||||||||||||
- Forward foreign currency contracts | 10 | 40 | 221 | 7 | ||||||||||||
- Cross currency swap | — | — | 1 | 1 | ||||||||||||
|
|
|
|
|
|
|
| |||||||||
Total | 66 | 140 | 548 | 38 | ||||||||||||
|
|
|
|
|
|
|
| |||||||||
Non-current | ||||||||||||||||
Cash flow hedge | ||||||||||||||||
- Interest rate swap | — | 5 | — | 8 | ||||||||||||
Fair value hedge | ||||||||||||||||
- Forward foreign currency contracts | — | 45 | 3 | 1 | ||||||||||||
|
|
|
|
|
|
|
| |||||||||
Total | — | 50 | 3 | 9 | ||||||||||||
|
|
|
|
|
|
|
| |||||||||
| * | Refer statement of profit and loss and statement of changes in equity for the changes in the fair value of cash flow hedges. |
VEDANTA LIMITED | INTEGRATED REPORT AND ANNUAL ACCOUNTS 2020-21 | 337
STANDALONE CONTINUED...
Notes
forming part of the financial statements as at and for the year ended March 31, 2021
E. Derivative contracts entered into by the Company and outstanding as at Balance Sheet date:
(i) To hedge currency risks and interest related risks, the Company has entered into various derivatives contracts.
The category wise break up of amount outstanding as at Balance Sheet date is given below:
Particulars | As at 31 March 2021 | (₹ in crores) As at 31 March 2020 | ||||||
Forex forward cover (buy) | 10,070 | 12,220 | ||||||
Forex forward cover (sell) | 188 | 2 | ||||||
(ii) For hedging commodity related risks:- Category wise break up is given below.
Particulars | As at 31 March 2021 Purchases | Sales | As at 31 March 2020 Purchases | (₹ in crores) Sales | ||||||||||||
Forwards / Futures | ||||||||||||||||
Copper (MT) | 6,900 | 24,150 | 1,950 | 28,050 | ||||||||||||
Gold (Oz) | — | 18,683 | — | 22,492 | ||||||||||||
Silver (Oz) | 17,418 | 95,596 | 6,018 | 100,320 | ||||||||||||
Aluminium (MT) | 1,825 | 67,075 | 9,575 | 37,450 | ||||||||||||
21 OTHER LIABILITIES
Particulars | As at 31 March 2021 Non-current | Current | Total | As at 31 March 2020 Non-current | Current | (₹ in crores) Total | ||||||||||||||||||
Amount payable to owned | — | 15 | 15 | — | 8 | 8 | ||||||||||||||||||
post-employment benefit trust (Refer note 37) | ||||||||||||||||||||||||
Other statutory Liabilities a | — | 883 | 883 | — | 977 | 977 | ||||||||||||||||||
Deferred government grant b | 2,360 | 78 | 2,438 | 2,369 | 74 | 2,443 | ||||||||||||||||||
Advance from customers c | — | 4,496 | 4,496 | 168 | 6,223 | 6,391 | ||||||||||||||||||
Advance from related party | — | — | — | — | 3 | 3 | ||||||||||||||||||
(Refer note 37) c | ||||||||||||||||||||||||
Other liabilities | — | 117 | 117 | 2 | 122 | 124 | ||||||||||||||||||
|
|
|
|
|
|
|
|
|
|
|
| |||||||||||||
Total | 2,360 | 5,589 | 7,949 | 2,539 | 7,407 | 9,946 | ||||||||||||||||||
|
|
|
|
|
|
|
|
|
|
|
| |||||||||||||
| (a) | Other statutory liabilities mainly includes contribution to PF, ESIC, withholding taxes, goods & service tax, VAT etc. |
| (b) | Represents government assistance in the form of the duty benefit availed under Export Promotion Capital Goods (EPCG) Scheme and Special Economic Zone (SEZ) scheme on purchase of property, plant and equipments accounted for as government grant and being amortised over the useful life of such assets. |
| (c) | Advance from customers are contract liabilities to be settled through delivery of goods. The amount of such balances as on 01 April 2019: ₹6,787 Crore. During the current year, the Company has refunded ₹Nil Crore (FY 2019-20:₹Nil crore) to the customers and recognised revenue of ₹6,244 Crore (FY 2019-20: ₹6,777 Crore) out of such opening balances. All other changes are either due to receipt of fresh advances or exchange differences. |
338
| < BACK TO CONTENTS | Integrated Report | Statutory reports | Financial statements |
Notes
forming part of the financial statements as at and for the year ended March 31, 2021
22 PROVISIONS
| (₹ in crores) | ||||||||||||||||||||||||
| As at 31 March 2021 | As at 31 March 2020 | |||||||||||||||||||||||
Particulars | Non-current | Current | Total | Non-current | Current | Total | ||||||||||||||||||
Provision for employee benefits a | ||||||||||||||||||||||||
- Retirement Benefit (Refer note 23) | — | 42 | 42 | — | 44 | 44 | ||||||||||||||||||
- Others | — | 56 | 56 | — | 51 | 51 | ||||||||||||||||||
Provision for restoration, rehabilitation and environmental costs b,c | 1,169 | — | 1,169 | 1,185 | — | 1,185 | ||||||||||||||||||
|
|
|
|
|
|
|
|
|
|
|
| |||||||||||||
Total | 1,169 | 98 | 1,267 | 1,185 | 95 | 1,280 | ||||||||||||||||||
|
|
|
|
|
|
|
|
|
|
|
| |||||||||||||
| a) | Provision for employee benefits includes gratuity, compensated absences, deferred cash bonus etc. |
| b) | The movement in provisions for restoration, rehabilitation and environmental costs is as follows [Refer note 3(a)(P)]: |
| (₹ in crores) | ||||
Particulars | Restoration, rehabilitation and environmental costs (Refer c) | |||
At 01 April 2019 | 986 | |||
|
| |||
Unwinding of discount (Refer note 30) | 31 | |||
Revision in estimates | 83 | |||
Exchange differences | 85 | |||
|
| |||
At 31 March 2020 | 1,185 | |||
|
| |||
Unwinding of discount (Refer note 30) | 23 | |||
Revision in estimates | (15 | ) | ||
Exchange differences | (24 | ) | ||
|
| |||
At 31 March 2021 | 1,169 | |||
|
| |||
| c) | Restoration, rehabilitation and environmental costs |
The provisions for restoration, rehabilitation and environmental liabilities represent the management’s best estimate of the costs which will be incurred in the future to meet the Company’s obligations under existing Indian law and the terms of the Company’s exploration and other licences and contractual arrangements.
The principal restoration and rehabilitation provisions are recorded within oil & gas business where a legal obligation exists relating to the oil and gas fields, where costs are expected to be incurred in restoring the site of production facilities at the end of the producing life of an oil field. The Company recognises the full cost of site restoration as a liability when the obligation to rectify environmental damage arises.
These amounts are calculated by considering discount rates within the range of 2% to 3%, and become payable
at the end of the producing life of an oil field and are expected to be incurred over a period of twenty one years.
An obligation to incur restoration, rehabilitation and environmental costs arises when environmental disturbance is caused by the development or ongoing production from a producing field.
| 23 | EMPLOYEE BENEFIT PLANS |
The Company participates in defined contribution and benefit plans, the assets of which are held (where funded) in separately administered funds.
For defined contribution plans the amount charged to the statement of profit and loss is the total amount of contributions payable in the year.
VEDANTA LIMITED | INTEGRATED REPORT AND ANNUAL ACCOUNTS 2020-21 | 339
STANDALONE CONTINUED...
Notes
forming part of the financial statements as at and for the year ended March 31, 2021
For defined benefit plans, the cost of providing benefits under the plans is determined by actuarial valuation separately each year for each plan using the projected unit credit method by independent qualified actuaries as at the year end. Remeasurement gains and losses arising in the year are recognised in full in other comprehensive income for the year.
| i) | Defined contribution plans |
The Company contributed a total of ₹62 Crore for the year ended 31 March 2021 and ₹68 Crore for the year ended 31 March 2020 to the following defined contribution plans.
| (₹ in crores) | ||||||||
Particulars | Year ended 31 March 2021 | Year ended 31 March 2020 | ||||||
Employer’s contribution to recognised provident fund and family pension fund | 47 | 50 | ||||||
Employer’s contribution to superannuation | 15 | 18 | ||||||
Employer’s contribution to National Pension Scheme (NPS) | 0 | — | ||||||
|
|
|
| |||||
Total | 62 | 68 | ||||||
|
|
|
| |||||
Central recognised provident fund
In accordance with the ‘The Employee’s Provident Funds and Miscellaneous Provisions Act, 1952’, employees are entitled to receive benefits under the Provident Fund. Both the employee and the employer make monthly contributions to the plan at a predetermined rate (12% for the year ended 31 March 2020 and 31 March 2019) of an employee’s basic salary. All employees have an option to make additional voluntary contributions. These contributions are made to the fund administered and managed by the Government of India (GOI) or to independently managed and approved funds. The Company has no further obligations under the fund managed by the GOI beyond its monthly contributions which are charged to the statement of profit and loss in the period they are incurred.
Family pension fund
The Pension Fund was established in 1995 and is managed by the Government of India. The employee makes no contribution to this fund but the employer makes a contribution of 8.33% of salary each month subject to a specified ceiling per employee. This is provided for every permanent employee on the payroll.
At the age of superannuation, contributions ceases and the individual receives a monthly payment based on the level of contributions through the years, and on their salary scale at the time they retire, subject to a maximum ceiling of salary level. The Government funds these payments, thus the Company has no additional liability beyond the contributions that it makes, regardless of whether the central fund is in surplus or deficit.
Superannuation
Superannuation, another pension scheme applicable in India, is applicable only to senior executives. The Company holds a policy with Life Insurance Corporation of India (“LIC”), to which it contributes a fixed amount relating to superannuation and the pension annuity is met by LIC as required, taking into consideration
the contributions made. The Company has no further obligations under the scheme beyond its monthly contributions which are charged to the statement of profit and loss in the year they are incurred.
National Pension Scheme
National Pension Scheme is a retirement savings account for social security and welfare applicable for executives covered under the superannuation benefit of Vedanta Limited, on a choice basis. It was introduced to enable employees to select the treatment of superannuation component of their fixed salaries and avail the benefits offered by National Pension Scheme launched by Government of India. Vedanta Limited holds a corporate account with one of the pension fund managers authorized by the Government of India to which the Company contributes a fixed amount relating to superannuation and the pension annuity will be met by the fund manager as per rules of National Pension Scheme. The Company has no further obligations under the scheme beyond its monthly contributions which are charged to the statement of profit and loss in the year they are incurred.
| ii) | Defined benefit plans |
| (a) | Contribution to provident fund trust (the “trust”) |
The provident fund of the Iron Ore division is exempted under Section 17 of The Employee’s Provident Funds and Miscellaneous Provisions Act, 1952. Conditions for grant of exemption stipulates that the employer shall make good deficiency, if any, between the return guaranteed by the statute and actual earning of the Fund. Based on actuarial valuation in accordance with Ind AS 19 and Guidance note issued by Institute of Actuaries of India for interest rate guarantee of exempted provident fund liability of employees, there is no interest shortfall in the funds managed by the trust and hence there is no further liability as on 31 March 2021 and 31 March 2020. Having regard to the assets of the Fund and the return on the investments, the Company does not expect any deficiency in the foreseeable future.
340
| < BACK TO CONTENTS | Integrated Report | Statutory reports | Financial statements |
Notes
forming part of the financial statements as at and for the year ended March 31, 2021
The Company contributed a total of ₹6 Crore for the year ended 31 March 2021 and ₹4 Crore for the year ended 31 March 2020, The present value of obligation and the fair value of plan assets of the trust are summarized below.
| (₹ in crores) | ||||||||
Particulars | Year ended 31 March 2021 | Year ended 31 March 2020 | ||||||
Fair value of plan assets | 233 | 208 | ||||||
Present value of defined benefit obligations | (225 | ) | (202 | ) | ||||
|
|
|
| |||||
Net liability arising from defined benefit obligation of trust | Nil | Nil | ||||||
|
|
|
| |||||
Percentage allocation of plan assets of trust
Assets by category | Year ended 31 March 2021 | Year ended 31 March 2020 | ||||||
Government Securities | 59 | % | 59 | % | ||||
Debentures / bonds | 38 | % | 36 | % | ||||
Equity | 3 | % | 5 | % | ||||
Fixed deposits | 0 | % | 0 | % | ||||
The remeasurement loss of ₹6 Crore and ₹7 Crore for the year ended 31 March 2021 and 31 March 2020 respectively have been charged to other comprehensive income (OCI).
(b) Gratuity plan
In accordance with the Payment of Gratuity Act, 1972, the Company contributes to a defined benefit plan (the “Gratuity
Plan”) covering certain categories of employees. The Gratuity Plan provides a lump sum payment to vested employees at retirement, disability or termination of employment being an amount based on the respective employee’s last drawn salary and the number of years of employment with the Company. The Gratuity plan is a funded plan and the Company makes contribution to recognised funds in India.
Based on actuarial valuations conducted as at year end using the projected unit credit method, a provision is recognised in full for the benefit obligation over and above the funds held in the Gratuity Plan.
The iron ore and oil & gas division of the Company have constituted a trust recognised by Indian Income Tax Authorities for gratuity to employees, contributions to the trust are funded with Life Insurance Corporation of India (LIC) and ICICI Prudential Life Insurance Company Limited.
Principal actuarial assumptions
Principal actuarial assumptions used to determine the present value of the Gratuity plan obligation are as follows:
Particulars | Year ended 31 March 2021 | Year ended 31 March 2020 | ||||||
Discount rate | 6.90 | 6.80% | ||||||
Expected rate of increase in compensation level of covered employees | 2%-10% | 2%-10% | ||||||
In service mortality | IALM (2012-14) | IALM (2012-14) | ||||||
Post retirement mortality | | LIC(1996-98) Ultimate |
| | LIC(1996-98) Ultimate |
| ||
Amount recognised in the balance sheet consists of:
| (₹ in crores) | ||||||||
Particulars | Year ended 31 March 2021 | Year ended 31 March 2020 | ||||||
Fair value of plan assets | 146 | 145 | ||||||
Present value of defined benefit obligations | (188 | ) | (189 | ) | ||||
|
|
|
| |||||
Net liability arising from defined benefit obligation | (42 | ) | (44 | ) | ||||
|
|
|
| |||||
VEDANTA LIMITED | INTEGRATED REPORT AND ANNUAL ACCOUNTS 2020-21 | 341
STANDALONE CONTINUED...
Notes
forming part of the financial statements as at and for the year ended March 31, 2021
Amount recognised in the statement of profit and loss in respect of the Gratuity plan are as follows:
| (₹ in crores) | ||||||||
Particulars | Year ended 31 March 2021 | Year ended 31 March 2020 | ||||||
Current service cost | 17 | 18 | ||||||
Net interest cost | 3 | 4 | ||||||
|
|
|
| |||||
Components of defined benefit costs recognised in profit or loss | 20 | 22 | ||||||
|
|
|
| |||||
Amount recognised in other comprehensive income in respect of the Gratuity plan are as follows:
| (₹ in crores) | ||||||||
Particulars | Year ended 31 March 2021 | Year ended 31 March 2020 | ||||||
Re-measurement of the net defined benefit obligation:- | ||||||||
Actuarial losses / (gains) arising from demographic adjustments | — | (1 | ) | |||||
Actuarial losses / (gains) arising from experience adjustments | (8 | ) | (6 | ) | ||||
Actuarial losses / (gains) arising from changes in financial assumptions | — | 10 | ||||||
Losses / (gains) on plan assets | 2 | 1 | ||||||
|
|
|
| |||||
Components of defined benefit costs recognised in other comprehensive income | (6 | ) | 4 | |||||
|
|
|
| |||||
Movement in present value of the Gratuity plan:
| (₹ in crores) | ||||||||
Particulars | Year ended 31 March 2021 | Year ended 31 March 2020 | ||||||
Opening balance | 189 | 178 | ||||||
Current service cost | 17 | 18 | ||||||
Benefits paid | (23 | ) | (24 | ) | ||||
Interest cost | 13 | 14 | ||||||
Actuarial losses / (gains) arising from changes in assumptions | (8 | ) | 3 | |||||
|
|
|
| |||||
Closing balance | 188 | 189 | ||||||
|
|
|
| |||||
Movement in the fair value of Gratuity plan assets is as follows:
| (₹ in crores) | ||||||||
Particulars | Year ended 31 March 2021 | Year ended 31 March 2020 | ||||||
Opening balance | 145 | 131 | ||||||
Contributions received | 16 | 29 | ||||||
Benefits paid | (23 | ) | (24 | ) | ||||
Re-measurement loss arising from return on plan assets | (2 | ) | (1 | ) | ||||
Interest income | 10 | 10 | ||||||
|
|
|
| |||||
Closing balance | 146 | 145 | ||||||
|
|
|
| |||||
The above plan assets have been invested in the qualified insurance policies.
The actual return on plan assets was ₹8 Crore for the year ended 31 March 2021 and ₹9 Crore for the year ended 31 March 2020.
The weighted average duration of the defined benefit obligation is 16.36 years and 16.5 years as at 31 March 2021 and
31 March 2020 respectively.
The Company expects to contribute ₹21 Crore to the funded defined benefit plans in during the year ended 31 March 2022.
342
| < BACK TO CONTENTS | Integrated Report | Statutory reports | Financial statements |
Notes
forming part of the financial statements as at and for the year ended March 31, 2021
Sensitivity analysis
Below is the sensitivity analysis determined for significant actuarial assumptions for the determination of defined benefit obligations and based on reasonably possible changes of the respective assumptions occurring at the end of the reporting period while holding all other assumptions constant.
| (₹ in crores) | ||||||||
Increase/(Decrease) in defined benefit obligation | Year ended 31 March 2021 | Year ended 31 March 2020 | ||||||
Discount rate | ||||||||
Increase by 0.50% | (9 | ) | (8 | ) | ||||
Decrease by 0.50% | 9 | 9 | ||||||
Expected rate of increase in compensation level of covered employees | ||||||||
Increase by 0.50% | 9 | 9 | ||||||
Decrease by 0.50% | (9 | ) | (8 | ) | ||||
The above sensitivity analysis may not be representative of the actual benefit obligation as it is unlikely that the change in assumptions would occur in isolation of one another as some of the assumptions may be correlated.
In presenting the above sensitivity analysis, the present value of defined benefit obligation has been calculated using the projected unit credit method at the end of reporting period, which is the same as that applied in calculating the defined benefit obligation liability recognized in the balance sheet.
Risk analysis
The Company is exposed to a number of risks in the defined benefit plans. Most significant risks pertaining to defined benefit plans and management’s estimation of the impact of these risks are as follows: Investment risk The Gratuity plan is funded with Life Insurance Corporation of India (LIC) and ICICI Prudential Life (ICICI). The Company does not have any liberty to manage the fund provided to LIC and ICICI.
The present value of the defined benefit plan obligation is calculated using a discount rate determined by reference to Government of India bonds. If the return on plan asset is below this rate, it will create a plan deficit.
Interest risk
A decrease in the interest rate on plan assets will increase the net plan obligation.
Longevity risk / Life expectancy
The present value of the defined benefit plan obligation is calculated by reference to the best estimate of the mortality of plan participants both during and at the end of the employment. An increase in the life expectancy of the plan participants will increase the plan obligation. Salary growth risk The present value of the defined benefit plan obligation is calculated by reference to the future salaries of plan participants. An increase in the salary of the plan participants will increase the plan obligation.
Code on Social Security, 2020
The Code on Social Security, 2020 (‘Code’) relating to employee benefits during employment and post- employment benefits received Presidential assent in September 2020. The Code has been published in the Gazette of India. However, the date on which the Code will come into effect has not been notified and the final rules/ interpretation have not yet been issued. The Company will assess the impact of the Code when it comes into effect and will record any related impact in the period the Code becomes effective.
24 EMPLOYEE BENEFITS EXPENSE a,b
Particulars | Year ended 31 March 2021 | (₹ in crores) Year ended | ||||||
Salaries and Wages | 1,241 | 1,119 | ||||||
Share based payments (Refer note 25) | 36 | 40 | ||||||
Contributions to provident and other funds (Refer Note 23) | 85 | 90 | ||||||
Staff welfare expenses | 71 | 92 | ||||||
Less: Cost allocated/directly booked in Joint ventures | (530 | ) | (576 | ) | ||||
|
|
|
| |||||
Total | 903 | 765 | ||||||
|
|
|
| |||||
| a. | Net of recoveries of ₹38 Crore ( 31 March 2020: ₹66 Crore) from subsidiaries. |
| b. | Net of capitalisation of ₹46 Crore ( 31 March 2020: 59 Crore). |
VEDANTA LIMITED | INTEGRATED REPORT AND ANNUAL ACCOUNTS 2020-21 | 343
STANDALONE CONTINUED...
Notes
forming part of the financial statements as at and for the year ended March 31, 2021
| 25 | SHARE BASED PAYMENTS |
The Company offers equity based and cash based option plans to its employees, officers and directors through the Company’s stock option plan introduced in 2016 and Cairn India’s stock option plan now administered by the Company pursuant to merger with the Company.
The Vedanta Limited Employee Stock Option Scheme (ESOS) 2016
The Company introduced an Employee Stock Option Scheme 2016 (“ESOS”), which was approved by the Vedanta Limited shareholders to provide equity settled incentive to all employees of the Company including subsidiary companies. The ESOS scheme includes tenure based, business performance based (EBITDA) and market performance based stock options. The maximum value of options that can be awarded to members of the wider management group is calculated by reference to the grade average cost-to-company (“CTC”) and individual grade of the employee. The performance conditions attached to the option is measured by comparing Company’s performance in terms of Total Shareholder Return (“TSR”) over the performance period with the performance of two group of comparator companies (i.e. Indian and global comparator companies) defined in the
scheme. The extent to which an option vests will depend on the Company’s TSR rank against a group or groups of peer companies at the end of the performance period and as moderated by the Remuneration Committee. The ESOS schemes are administered through VESOS trust and have underlying Vedanta Limited equity shares.
Options granted during the year ended 31 March 2021 includes business performance based, sustained individual performance based, management discretion and fatality multiplier based stock options. Business performances will be measured using Volume, Cost, Net Sales Realisation, EBITDA, ECG & Carbon footprint or a combination of these for the respective business/ SBU entities.
Options granted during the year ended 31 March 2020 includes business performance based, sustained individual performance based and market performance based stock options. Business performances will be measured using Volume, Cost, Net Sales Realisation, EBITDA or a combination of these for the respective business/ SBU entities.
The exercise price of the options is ₹1 per share and the performance period is three years, with no re-testing being allowed.
The details of share options for the year ended 31 March 2021 is presented below:
Financial Year of Grant | Exercise Period | Options outstanding 01 April 2020 | Options granted during the year | Options | Options forfeited during the year | Options exercised during the year* | Options outstanding 31 March 2021 | Options exercisable 31 March 2021 | ||||||||||||||||||||
2016-17 | 15 December 2019 - 14 June 2020 | 1,068,516 | — | — | 8,648 | 1,059,868 | — | — | ||||||||||||||||||||
2017-18 | 01 September 2020 - 28 February 2021 | 7,027,925 | — | — | 5,514,169 | 1,136,816 | 376,940 | 376,940 | ||||||||||||||||||||
2017-18 | 16 October 2020 - 15 April 2021 | 11,126 | — | — | 11,126 | — | — | — | ||||||||||||||||||||
2018-19 | 01 November 2021 - 30 April 2022 | 11,420,046 | — | — | 1,507,806 | — | 9,912,240 | — | ||||||||||||||||||||
2018-19 | Cash settled | 178,326 | — | (15,360) | 63,880 | — | 99,086 | — | ||||||||||||||||||||
2019-20 | 29 November 2022 - 28 May 2023 | 15,881,330 | — | — | 2,309,052 | — | 13,572,278 | — | ||||||||||||||||||||
2019-20 | Cash settled | 735,370 | 30,430 | 685,750 | 80,050 | — | ||||||||||||||||||||||
2020-21 | 06 November 2023 - 05 May 2024 | — | 12,711,112 | — | — | — | 12,711,112 | — | ||||||||||||||||||||
2020-21 | Cash settled | — | 87,609 | — | — | — | 87,609 | — | ||||||||||||||||||||
|
|
|
|
|
|
|
|
|
|
|
|
| ||||||||||||||||
| 36,322,639 | 12,798,721 | 15,070 | 10,100,431 | 2,196,684 | 36,839,315 | |||||||||||||||||||||||
|
|
|
|
|
|
|
|
|
|
|
|
| ||||||||||||||||
344
| < BACK TO CONTENTS | Integrated Report | Statutory reports | Financial statements |
Notes
forming part of the financial statements as at and for the year ended March 31, 2021
The details of share options for the year ended 31 March 2020 is presented below:
Financial Year of | Exercise Period | Options outstanding 01 April 2019 | Options granted during the year | Options transferred from Parent/fellow subsidiaries | Options forfeited during the year | Options exercised during the year* | Options outstanding 31 March 2020 | Options exercisable 31 March 2020 | ||||||||||||||||||||||
2016-17 | 15 December 2019 - 14 June 2020 | 6,508,226 | — | — | 4,819,269 | 620,441 | 1,068,516 | 1,068,516 | ||||||||||||||||||||||
2017-18 | 01 September 2020 - 28 February 2021 | 8,274,393 | — | — | 1,246,468 | — | 7,027,925 | — | ||||||||||||||||||||||
2017-18 | 16 October 2020 - 15 April 2021 | 11,126 | — | — | — | — | 11,126 | — | ||||||||||||||||||||||
2017-18 | 01 November 2020 - 30 April 2021 | 27,638 | — | — | 27,638 | — | — | — | ||||||||||||||||||||||
2018-19 | 01 November 2021 - 30 April 2022 | 13,566,200 | — | — | 2,146,154 | — | 11,420,046 | — | ||||||||||||||||||||||
2018-19 | Cash settled | 224,840 | — | 100,470 | 146,984 | — | 178,326 | — | ||||||||||||||||||||||
2019-20 | 29 November 2023 - 28 May 2024 | — | 16,713,640 | — | 832,310 | — | 15,881,330 | — | ||||||||||||||||||||||
2019-20 | Cash settled | — | 847,830 | — | 112,460 | — | 735,370 | — | ||||||||||||||||||||||
|
|
|
|
|
|
|
|
|
|
|
|
|
| |||||||||||||||||
| 28,612,424 | 17,561,470 | 100,470 | 9,331,283 | 620,441 | 36,322,639 | 1,068,516 | ||||||||||||||||||||||||
|
|
|
|
|
|
|
|
|
|
|
|
|
| |||||||||||||||||
| * | excludes 58,420 options exercised during the year regarding which the transaction could not be completed before 31 March 2020 and hence, the corresponding shares were were not transferred to the concerned employees. |
The fair value of all options has been determined at the date of grant of the option allowing for the effect of any market-based performance conditions. This fair value, adjusted by the Group’s estimate of the number of options that will eventually vest as a result of non-market conditions, is expensed over the vesting period.
Business Performance-Based and Sustained Individual Performance-Based Options:
The fair values of stock options following these types of vesting conditions have been estimating using the Black-Scholes-Merton Option Pricing model. The value arrived at under this model has been then multiplied by the expected % vesting based on business performance conditions (only for business performance-based options) and the expected multiplier on account of sustained individual performance (for both type of options). The inputs used in the Black-Scholes-Merton Option Pricing model include the share price considered as of the valuation date, exercise price as per the scheme/ plan of the options, expected dividend yield (estimated based on actual/ expected dividend trend of the company), expected tenure (estimated as the remaining vesting period of the options), the risk-free rate (considered as the zero coupon yield as of the valuation date for a term commensurate with the expected tenure of the options) and expected volatility (estimated based on the historical volatility of the return in company’s share prices for a term commensurate with the expected tenure of the options). The exercise period of 6 months post vesting period has not been considered as the
options are expected to be exercised immediately post the completion of the vesting period.
Total Shareholder Returns-Based Options:
The fair values of stock options following this type of vesting condition has been estimated using the Monte Carlo Simulation method. This method has been used to simulate the expected share prices for Vedanta Limited and the companies of the comparator group over the vesting period of the options. Based on the simulated prices, the expected pay-off at the end of the vesting period has been estimated and present valued to the valuation date. Further, based on the simulated share prices and expected dividends the relative rank of Vedanta Limited’s share price return has been estimated vis-à-vis the Indian and Global Group of the comparator group. This rank has been used to estimate expected % vesting of the options under this type of vesting condition. The inputs to the monte carlo simulation method include expected tenure (estimated as the remaining vesting period of the options), the risk-free rate (considered as the zero coupon yield as of the valuation date for a term commensurate with the expected tenure of the options), expected dividend yield (estimated based on the actual dividend trend of the companies), expected volatility (estimated based on the historical volatility of the return in the company’s share prices for a term commensurate with the expected tenure of the options). The exercise period of 6 months post the vesting period has not been considered as the options are expected to be exercised immediately post the completion of the vesting period.
VEDANTA LIMITED | INTEGRATED REPORT AND ANNUAL ACCOUNTS 2020-21 | 345
STANDALONE CONTINUED...
Notes
forming part of the financial statements as at and for the year ended March 31, 2021
The assumptions used in the calculations of the charge in respect of the ESOS options granted during the year ended 31 March 2021 and 31 March 2020 are set out below:
| Year ended 31 March 2021 | Year ended 31 March 2020 | |||||||
Particulars | ESOS 2020 | ESOS 2019 | ||||||
Number of Options | | Cash settled - 87,609 1,27,11,112 |
| | Cash settled - 847,830 equity settled - 1,67,13,640 |
| ||
Exercise Price | ₹ | 1 | ₹ | 1 | ||||
Share Price at the date of grant | ₹ | 228.75 | ₹ | 144.60 | ||||
Contractual Life | 2 years and 7 months | 3 years | ||||||
Expected Volatility | 49.28 | % | 36.6 | % | ||||
Expected option life | 2 years and 7 months | 3 years | ||||||
Expected dividends | 6.80 | % | 7.96 | % | ||||
Risk free interest rate | 4.84 | % | 5.68 | % | ||||
Expected annual forfeitures | 10%p.a. | 10%p.a. | ||||||
Fair value per option granted (Non-market performance based) | ₹ | 151 | ₹ | 102.30 | ||||
Fair value per option granted (Market performance based) | NA | ₹ | 72.12 | |||||
Weighted average share price at the date of exercise of stock options was ₹131.08 (31 March 2020: 126.02)
The weighted average remaining contractual life for the share options outstanding was 2.03 years (31 March 2020: 2.28 years).
The Company recognised total expenses of ₹58 Crore (31 March 2020: ₹75 Crore) related to equity settled share based payment transactions for the year ended 31 March 2021 out of which ₹19 Crore (31 March 2020: ₹33 Crore) was recovered from group companies. The total expense recognised on account of cash settled share based plan during the year ended 31 March 2021 is ₹1 Crore (31 March 2020: ₹0 Crore) and the carrying value of cash settled share based compensation liability as at 31 March 2021 is ₹1 Crore (31 March 2020: ₹0 Crore).
Employee stock option plans of erstwhile Cairn India Limited:
The Company has provided CIESOP share based payment scheme to its employees.
CIESOP plan
There are no specific vesting conditions under CIESOP plan other than completion of the minimum service period of 3 years from the date of grant. Phantom options are exercisable proportionate to the period of service rendered by the employee subject to completion of one year. The exercise period is 7 years from the vesting date.
Details of employees stock option plans is presented below
| Year ended 31 March 2021 | Year ended 31 March 2020 | |||||||||||||||
CIESOP Plan | Number of options | Weighted average exercise price in ₹ | Number of options | Weighted average exercise price in ₹ | ||||||||||||
Outstanding at the beginning of the year | 5,341,740 | 288.23 | 6,477,059 | 279.2 | ||||||||||||
Granted during the year | Nil | NA | Nil | NA | ||||||||||||
Expired during the year | 1,082,229 | 291.25 | 658,663 | 200.1 | ||||||||||||
Exercised during the year | Nil | NA | Nil | NA | ||||||||||||
Forfeited / cancelled during the year | 944,337 | 288.00 | 476,656 | 288.1 | ||||||||||||
Outstanding at the end of the year | 3,315,174 | 287.31 | 5,341,740 | 288.2 | ||||||||||||
Exercisable at the end of the year | 3,315,174 | 287.3 | 5,341,740 | 288.2 | ||||||||||||
346
| < BACK TO CONTENTS | Integrated Report | Statutory reports | Financial statements |
Notes
forming part of the financial statements as at and for the year ended March 31, 2021
Scheme | Range of exercise price in ₹ | Weighted average remaining contractual life of options (in years) | Weighted average exercise price in ₹ | |||||||||
The details of exercise price for stock options outstanding as at 31 March 2021 are: | �� | 286.85-287.75 | 0.80 | 287.3 | ||||||||
CIESOP Plan | ||||||||||||
The details of exercise price for stock options outstanding as at 31 March 2020 are: | ||||||||||||
CIESOP Plan | 286.85-291.25 | 1.46 | 288.2 | |||||||||
Out of the total expense of ₹38 Crore (31 March 2020: ₹42 Crore) pertaining to above options for the year ended 31 March 2021, the Company has capitalised ₹2 Crore (31 March 2020: ₹2 Crore) expense for the year ended 31 March 2021.
| 26 | REVENUE FROM OPERATIONS |
| (₹ in crores) | ||||||||
Particulars | Year ended 31 March 2021 | Year ended 31 March 2020 | ||||||
Sale of products | 37,019 | 34,986 | ||||||
Sale of services | 101 | 431 | ||||||
|
|
|
| |||||
Total | 37,120 | 35,417 | ||||||
|
|
|
| |||||
| a) | Revenue from sale of products and from sale of services for the year ended 31 March 2021 includes revenue from contracts with customers of ₹36,859 Crore (FY 2019-20: ₹35,125 Crore) and a net gain on mark-to-market of ₹261 Crore (FY 2019-20: loss of ₹346 Crore) on account of gains/ losses relating to sales that were provisionally priced as at the beginning of the year with the final price settled in the current year, gains/ losses relating to sales fully priced during the year, and marked to market gains/ losses relating to sales that were provisionally priced as at the end of the year. |
| b) | Government of India (GoI) vide Office Memorandum (“OM”) No. O-19025/10/2005-ONG-DV dated 01 February 2013 allowed for Exploration in the Mining Lease Area after expiry of Exploration period and prescribed the mechanism for recovery of such Exploration Cost incurred. Vide another Memorandum dated 24 October 2019, GoI clarified that all approved Exploration costs incurred on Exploration activities, both successful and unsuccessful, are recoverable in the manner as prescribed in the OM and as per the provisions of PSC. Accordingly, during the previous year, the Company had recognized revenue of ₹638 Crore, for past exploration costs, through increased share in the joint operations revenue as the Group believes that cost recovery mechanism prescribed under OM for profit petroleum payable to GOI is not applicable to its Joint operation partner, view which is also supported by an independent legal opinion. |
However, the Joint operation partner carries a different understanding and the matter is pending resolution.
| c) | Majority of the Company’s sales are against advance or are against letters of credit/ cash against documents/ guarantees of banks of national standing. Where sales are made on credit, the amount of consideration does not contain any significant financing component as payment terms are within three months. |
As per the terms of the contract with its customers, either all performance obligations are to be completed within one year from the date of such contracts or the Company has a right to receive consideration from its customers for all completed performance obligations. Accordingly, the Company has availed the practical expedient available under paragraph 121 of Ind AS 115 and dispensed with the additional disclosures with respect to performance obligations that remained unsatisfied (or partially unsatisfied) at the balance sheet date. Further, since the terms of the contracts directly identify the transaction price for each of the completed performance obligations there are no elements of transaction price which have not been included in the revenue recognised in the financial statements. Further, there is no material difference between the contract price and the revenue from contract with customers.
VEDANTA LIMITED | INTEGRATED REPORT AND ANNUAL ACCOUNTS 2020-21 | 347
STANDALONE CONTINUED...
Notes
forming part of the financial statements as at and for the year ended March 31, 2021
| 27 | OTHER OPERATING INCOME |
| (₹ in crores) | ||||||||
Particulars | Year ended 31 March 2021 | Year ended 31 March 2020 | ||||||
Export incentives | 173 | 291 | ||||||
Scrap sales | 55 | 76 | ||||||
Miscellaneous income | 92 | 74 | ||||||
|
|
|
| |||||
Total | 320 | 441 | ||||||
|
|
|
| |||||
| 28 | OTHER INCOME |
| (₹ in crores) | ||||||||
Particulars | Year ended 31 March 2021 | Year ended 31 March 2020 | ||||||
Net gain on investments measured at FVTPL | 93 | 152 | ||||||
Interest income from investments measured at FVTPL | 40 | 119 | ||||||
Interest income from financial assets at amortised cost | ||||||||
- Bank Deposits | 68 | 71 | ||||||
- Loans | 81 | 102 | ||||||
- Others | 123 | 163 | ||||||
Interest on income tax refund | 47 | — | ||||||
Dividend income from | ||||||||
- Financial Assets at FVTPL | — | 15 | ||||||
- Financial Assets at FVOCI | 2 | 2 | ||||||
- Investment in Subsidiaries | 10,369 | 2,125 | ||||||
Deferred government grant income | 75 | 74 | ||||||
Miscellaneous income | 50 | 47 | ||||||
|
|
|
| |||||
Total | 10,948 | 2,870 | ||||||
|
|
|
| |||||
| 29 | CHANGES IN INVENTORIES OF FINISHED GOODS, WORK-IN-PROGRESS AND STOCK-IN-TRADE |
| (₹ in crores) | ||||||||
Particulars | Year ended 31 March 2021 | Year ended 31 March 2020 | ||||||
Opening Stock: | ||||||||
Finished Goods | 465 | 880 | ||||||
Work in progess | 1,836 | 1,195 | ||||||
|
|
|
| |||||
Total | 2,301 | 2,075 | ||||||
|
|
|
| |||||
Add / (Less): Foreign exchange translation difference | (2 | ) | 4 | |||||
Less: Closing Stock | ||||||||
Finished Goods | 548 | 465 | ||||||
Work in progess | 1,681 | 1,835 | ||||||
|
|
|
| |||||
Total | 2,229 | 2,300 | ||||||
|
|
|
| |||||
Sub-total | 70 | (221 | ) | |||||
Add / (Less): Copper Concentrate (raw material) sold during the year | — | 1,651 | ||||||
|
|
|
| |||||
Changes in Inventory | 70 | 1,430 | ||||||
|
|
|
| |||||
348
| < BACK TO CONTENTS | Integrated Report | Statutory reports | Financial statements |
Notes
forming part of the financial statements as at and for the year ended March 31, 2021
| 30 | FINANCE COST |
| (₹ in crores) | ||||||||
Particulars | Year ended 31 March 2021 | Year ended 31 March 2020 | ||||||
Interest expense on financial liabilities at amortised cost b | 3,293 | 3,863 | ||||||
|
|
|
| |||||
Other finance costs | 110 | 111 | ||||||
Net interest on defined benefit arrangement | 3 | 4 | ||||||
Unwinding of discount on provisions (Refer note 22) | 23 | 31 | ||||||
Less: Allocated to Joint venture | (3 | ) | (8 | ) | ||||
Less: Capitalisation of finance costs a (Refer note 5) | (233 | ) | (673 | ) | ||||
|
|
|
| |||||
Total | 3,193 | 3,328 | ||||||
| a) | Interest rate of 6.91% (31 March 2020: 7.71%) was used to determine the amount of general borrowing costs eligible for capitalization in respect of qualifying asset for the year ended 31 March 2021. |
| b) | Includes interest expense on lease liabilities for the year ended 31 March 2021 ₹14 Crore (31 March 2020: ₹16 Crore). |
31 OTHER EXPENSES *
| (₹ in crores) | ||||||||
Particulars | Year ended 31 March 2021 | Year ended 31 March 2020 | ||||||
Cess on crude oil | 906 | 1,174 | ||||||
Royalty | 246 | 242 | ||||||
Consumption of stores and spare parts | 710 | 720 | ||||||
Repairs to plant and equipment | 384 | 404 | ||||||
Carriage | 558 | 424 | ||||||
Mine Expenses | 256 | 136 | ||||||
Net loss on foreign currency transactions and translation | 281 | 494 | ||||||
Other Selling Expenses | 2 | 2 | ||||||
Repairs to building | 43 | 56 | ||||||
Insurance | 80 | 76 | ||||||
Repairs others | 76 | 77 | ||||||
Loss on sale/ discard of property, plant and equipment (net) | 28 | 77 | ||||||
Rent d | 26 | 11 | ||||||
|
|
|
| |||||
Rates and taxes | 8 | 25 | ||||||
Exploration costs written off (Refer note 5) | 6 | 1 | ||||||
Directors sitting fees and commission | 5 | 8 | ||||||
Remuneration to Auditors a | 15 | 12 | ||||||
|
|
|
| |||||
Provision for doubtful advances/ expected credit loss | 125 | 51 | ||||||
Bad debts written off | 4 | 17 | ||||||
Share of expenses in producing oil & gas blocks | 1,149 | 1,323 | ||||||
Donation | 12 | 115 | ||||||
Miscellaneous expenses b,c | 2,205 | 2,045 | ||||||
|
|
|
| |||||
Less: Cost allocated/directly booked in Joint ventures | (275 | ) | (304 | ) | ||||
|
|
|
| |||||
Total | 6,850 | 7,186 | ||||||
|
|
|
| |||||
| * | Net of recoveries of ₹57 Crore (31 March 2020: ₹56 Crore) from subsidiaries |
VEDANTA LIMITED | INTEGRATED REPORT AND ANNUAL ACCOUNTS 2020-21 | 349
STANDALONE CONTINUED...
Notes
forming part of the financial statements as at and for the year ended March 31, 2021
| (a) | Remuneration to auditors comprises: |
| (₹ in crores) | ||||||||
Particulars | Year ended 31 March 2021 | Year ended 31 March 2020 | ||||||
Payment to auditors | ||||||||
For statutory audit (including quarterly reviews and international reporting) | 13 | 9 | ||||||
For parent company reporting | 2 | 2 | ||||||
For certification services | 0 | 1 | ||||||
For other services | 0 | 0 | ||||||
For reimbursement of expenses | 0 | 0 | ||||||
|
|
|
| |||||
Total | 15 | 12 | ||||||
|
|
|
| |||||
| (b) | Includes Corporate social responsibility expenses of ₹39 Crore (31 March 2020: ₹53 Crore) as detailed in note 40(a). |
| (c) | The Company made contributions through electoral bonds of Nil (31 March 2020: ₹114 Crore) for the year ended 31 March 2021, which is included in Miscellaneous expenses. |
| (d) | Rent represents expense on short term/ low value leases. |
| 32 | EXCEPTIONAL ITEMS |
| (₹ in crores) | ||||||||||||||||||||||||
| Year ended 31 March 2021 | Year ended 31 March 2020 | |||||||||||||||||||||||
Particulars | Exceptional Items | Tax effect of exceptional items | Exceptional items after tax | Exceptional Items | Tax effect of exceptional items | Exceptional items after tax | ||||||||||||||||||
Capital work-in-progress written off/ | ||||||||||||||||||||||||
Impairment charge relating to property, plant and equipment, exploration assets | ||||||||||||||||||||||||
(as applicable) and other assets in following segments: | ||||||||||||||||||||||||
- Oil and gas a | — | — | — | (8,273 | ) | 2,875 | (5,398 | ) | ||||||||||||||||
- Copper b | — | — | — | (669 | ) | 234 | (435 | ) | ||||||||||||||||
- Aluminium g | (181 | ) | 63 | (118 | ) | — | — | — | ||||||||||||||||
Provision on receivables subject to | (51 | ) | 18 | (33 | ) | (401 | ) | 93 | (308 | ) | ||||||||||||||
litigation c,d | ||||||||||||||||||||||||
Impairment charge relating to investments | — | — | — | (3,393 | ) | — | (3,393 | ) | ||||||||||||||||
in subsidiaries e | ||||||||||||||||||||||||
Revision of Renewable Purchase Obligation | — | — | — | 168 | (59 | ) | 109 | |||||||||||||||||
pursuant to respective state electricity regulation commission notifications f | ||||||||||||||||||||||||
|
|
|
|
|
|
|
|
|
|
|
| |||||||||||||
Total | (232 | ) | 81 | (151 | ) | (12,568 | ) | 3,143 | (9,425 | ) | ||||||||||||||
|
|
|
|
|
|
|
|
|
|
|
| |||||||||||||
| a. | During the year ended 31 March 2021 and 31 March 2020, the Company has recognized impairment charge of ₹Nil Crore and of ₹8,273 Crore respectively, on its assets in the oil and gas segment comprising of: |
| i) | During the previous year, impairment charge of ₹7,516 Crore relating to Rajasthan oil and gas block (“RJ CGU”) triggered by the significant fall in the crude oil prices. Of this charge, ₹7,071 Crore impairment charge has been recorded against oil and gas producing facilities and ₹445 Crore impairment charge has been recorded against exploration intangible assets under development. |
For oil & gas assets, CGU’s identified are on the basis of a production sharing contract (PSC) level, as it is the smallest group of assets that generates cash inflows that are largely independent of the cash inflows from other assets or group of assets.
350
| < BACK TO CONTENTS | Integrated Report | Statutory reports | Financial statements |
Notes
forming part of the financial statements as at and for the year ended March 31, 2021
The recoverable amount of the RJ CGU of ₹5,585 Crore (US$747 million) was determined based on the fair value less costs of disposal approach, a level-3 valuation technique in the fair value hierarchy, as it more accurately reflects the recoverable amount based on our view of the assumptions that would be used by a market participant. This is based on the cash flows expected to be generated by the projected oil and natural gas production profiles up to the expected dates of cessation of production sharing contract (PSC)/cessation of production from each producing field based on the current estimates of reserves and risked resources. Reserves assumptions for fair value less costs of disposal tests consider all reserves that a market participant would consider when valuing the asset, which are usually broader in scope than the reserves used in a value-in-use test. Discounted cash flow analysis used to calculate fair value less costs of disposal uses assumption for short-term oil price of US$38 per barrel for the next one year and scales upto long- term nominal price of US$57 per barrel, three years thereafter, derived from a consensus of various analyst recommendations. Thereafter, these have been escalated at a rate of 2% per annum. The cash flows are discounted using the post-tax nominal discount rate of 10.35% derived from the post-tax weighted average cost of capital after factoring the risks ascribed to PSC extension and the successful implementation of key growth projects. Additionally, in computing the recoverable value, the effects of market participant’s response on production sharing contract matters have also been appropriately considered. Based on the sensitivities carried out by the Company, change in crude price assumptions by US$1/bbl and changes to discount rate by 1% would lead to a change in recoverable value by ₹181 Crore (US$24 million) and ₹257 Crore (US$34 million) respectively.
| ii) | During the previous year, impairment charge of ₹225 Crore relating to KG-ONN-2003/1 CGU mainly due to the reduction in crude oil price forecast. |
The recoverable amount of the CGU was determined to be ₹147 Crore (US $20 million) based on fair value less cost of disposal approach as described in above paragraph. Discounted cash flow analysis used to calculate fair value less costs of disposal uses assumption for oil price as described in above paragraph. The cash flows are discounted using the post-tax nominal discount rate of 11.1% derived from post-tax weighted average cost of capital. The sensitivities around change in crude price and discount rate are not material to the financial statements.
| iii) | During the previous year, impairment charge of ₹532 Crore in exploration block KG-OSN-2009/3, was provided for as the Government of India approval on extension and grant of excusable delay is awaited for. |
| b. | Refer note 3(c)(A)(vii) for impairment in copper segment. |
| c. | As at 31 March 2021, the Company has an outstanding receivable equivalent to ₹55 Crore (net of provision of ₹103 Crore) (31 March 2020: ₹106 Crore (net of provision of ₹52 Crore)) from Konkola Copper Mines Plc (KCM), predominantly regarding monies advanced against future purchase of copper cathode/anode. |
A provisional liquidator was appointed to manage KCM’s affairs on 21 May 2019, after ZCCM Investments Holdings Plc (“ZCCM”), an entity majorly owned by the Government of Zambia and a 20.6% shareholder in KCM, filed a winding up petition against KCM. KCM’s majority shareholder, Vedanta Resources Holdings Limited (“VRHL”), and its parent company, Vedanta Resources Limited (“VRL”), are contesting the winding up petition in the Zambian courts. The local Court of Appeal (“CAZ”) has ruled in favor of VRHL/VRL, ordering a stay of the winding up proceedings and referring the matter for arbitration. In light of the orders from CAZ, VRL has also filed an application in the High Court of Zambia, asking for directions on the powers of the provision liquidator and the matter was argued on March 30, 2021. The ruling has been reserved.
VRHL and VRL had also commenced arbitration proceedings against ZCCM with seat in Johannesburg, South Africa, consistent with their position that arbitration is the agreed dispute resolution process. The procedural timetable for the arbitration envisages an initial hearing of prioritised issues commencing on 31 May 2021, with the substantive dispute being heard in November 2021 and February 2022. Meanwhile, KCM has not been supplying goods to the Group, which it was supposed to as per the terms of the advance.
The Company has recognised provisions for expected credit losses of ₹51 Crore during the current year (31 March 2020: ₹52 Crore) and based on its assessment of the merits of the case backed by legal opinions, the Company is of the view that VRL’s contractual position is upheld and continues to be strong on merits.
| d. | During the previous year, a parcel of land relating to the Iron Ore business having carrying value of ₹349 Crore was reclassified from freehold land to other financial asset due to an ongoing legal dispute relating to title of the land. Subsequently the financial asset was fully provided for and recognized under exceptional items. |
VEDANTA LIMITED | INTEGRATED REPORT AND ANNUAL ACCOUNTS 2020-21 | 351
STANDALONE CONTINUED...
Notes
forming part of the financial statements as at and for the year ended March 31, 2021
| e. | During the year ended 31 March 2021 and 31 March 2020 the Company has recognized net impairment charge of ₹Nil Crore and of ₹3,393 Crore respectively, on its investment in subsidiaries, comprising of: |
| (₹ in crores) | ||||||||
Particulars | Year ended 31 March 2021 | Year ended 31 March 2020 | ||||||
Impairment charge on investment in Cairn India Holdings Limited (Refer (i) below) | — | (3,339 | ) | |||||
Impairment charge on investment in Sesa Resources Limited (Refer (ii) below) | — | (54 | ) | |||||
|
|
|
| |||||
Net Impairment Charge on investment in subsidiaries | — | (3,393 | ) | |||||
|
|
|
| |||||
| (i) | During the year ended 31 March 2020, the Company has provided for diminution in value of its investment in CIHL (a 100% subsidiary of the Company) of ₹3,339 Crore consequent to a reduction in recoverable value of PPE in RJ block held through its step-down 100% subsidiary Cairn Energy Hydrocarbon Limited (CEHL) due to reduction in crude prices and also due to reduction in value of its investment in AvanStrate Inc. (ASI). |
| (ii) | During the year ended 31 March 2020, the Company has made a provision for impairment relating to investment in Sesa Resources Limited of ₹54 Crore based on expected realisation in view of prevailing mining ban in Goa pursuant to an order passed by the Hon’ble Supreme Court of India on 07 February 2018. |
| f. | During the previous year, the Company has restated its Renewable Power Obligation (RPO) liability pursuant to Odisha Electricity Regulatory Commission (OERC) notification dated December 31, 2019 which clarified that for CPP’s commissioned before 01 April 2016, RPO should be pegged at the RPO obligation applicable for 2015-16. Based on the notification, liability of the Company’s Jharsuguda and Lanjigarh plants have been revised and ₹168 Crore reversal relating to previous years have been recognised under exceptional items. |
| g. | During the year ended 31 March 2021, the Company has recognised a loss of ₹181 Crore relating to certain items of capital work-in-progress at the aluminium operations, which are no longer expected to be used. |
| 33 | TAX EXPENSE |
| (a) | Tax charge/(credit) recognised in profit or loss (including on exceptional items) |
| (₹ in crores) | ||||||||
Particulars | Year ended 31 March 2021 | Year ended 31 March 2020 | ||||||
Current tax: | ||||||||
Current tax on profit for the year | 104 | 4 | ||||||
|
|
|
| |||||
Total Current Tax (a) | 104 | 4 | ||||||
Deferred tax: | ||||||||
Origination and reversal of temporary differences | 3,138 | (592 | ) | |||||
Credit in respect of exceptional items (Refer Note 32) | (81 | ) | (3,143 | ) | ||||
|
|
|
| |||||
Total Deferred Tax (b) | 3,057 | (3,735 | ) | |||||
|
|
|
| |||||
Net tax charge/ (benefit) (a+b) | 3,161 | (3,731 | ) | |||||
|
|
|
| |||||
Profit/(Loss) before tax | 13,664 | (10,463 | ) | |||||
|
|
|
| |||||
Effective income tax rate (%) | 23 | % | 36 | % | ||||
Tax expense
| (₹ in crores) | ||||||||
Particulars | Year ended 31 March 2021 | Year ended 31 March 2020 | ||||||
Tax effect on exceptional items | (81 | ) | (3,143 | ) | ||||
Tax expense/(benefit)—others | 3,242 | (588 | ) | |||||
|
|
|
| |||||
Net tax charge/ (benefit) | 3,161 | (3,731 | ) | |||||
352
| < BACK TO CONTENTS | Integrated Report | Statutory reports | Financial statements |
Notes
forming part of the financial statements as at and for the year ended March 31, 2021
| (b) | A reconciliation of income tax expense/(credit) applicable to profit/(loss) before tax at the Indian statutory income tax rate to recognised income tax expense for the year indicated are as follows: |
| (₹ in crores) | ||||||||
Particulars | Year ended 31 March 2021 | Year ended 31 March 2020 | ||||||
Profit/(Loss) before tax | 13,664 | (10,463 | ) | |||||
Indian statutory income tax rate | 34.944 | % | 34.944 | % | ||||
Tax at statutory income tax rate | 4,775 | (3,656 | ) | |||||
Disallowable expenses | 18 | 69 | ||||||
Non-taxable income* | (1,193 | ) | (49 | ) | ||||
Tax holidays | (3 | ) | 58 | |||||
Change in deferred tax balances due to change in tax law** | (410 | ) | (865 | ) | ||||
Income subject to lower tax rate | — | (372 | ) | |||||
Unrecognised tax assets (Net) | — | 1,185 | ||||||
Charge transferred to Equity (Refer Note 35) | — | (252 | ) | |||||
Other permanent differences | (26 | ) | 151 | |||||
|
|
|
| |||||
Total | 3,161 | (3,731 | ) | |||||
|
|
|
| |||||
| * | Current year includes dividend income of ₹3,358 crore on which benefit under section 80M of the Income Tax Act, 1961 is availed. |
| ** | Deferred tax charge for the year ended 31 March 2020 included deferred tax credit of ₹834 crore on deferred tax balances as at 31 March 2019. Also refer note 3(c)(A)(ix). |
Certain businesses of the Company are eligible for specified tax incentives which are included in the table above as tax holidays and similar exemptions. These are briefly described as under:
The location based exemption: SEZ Operations
In order to boost industrial development and exports, provided certain conditions are met, profits of undertaking located in Special Economic Zone (‘SEZ’) may benefit from tax holiday. Such tax holiday works to exempt 100% of the profits for the first five years from the commencement of the tax holiday, 50% of profits for five years thereafter and 50% of the profits for further five years provided the amount allowable in respect of deduction is credited to Special Economic Zone Re-Investment Reserve account. However, such undertaking would continue to be subject to the Minimum Alternative tax (‘MAT’).
The Company has setup SEZ Operations in its aluminium division (where no benefit has been drawn).
Sectoral Benefit—Power Plants
To encourage the establishment of certain power plants, provided certain conditions are met, tax incentives exist to exempt 100% of profits and gains for any ten consecutive years within the 15 years period following commencement of the power plant’s operation subject to certain conditions under section 80IA of the Income Tax Act, 1961. However, such undertakings generating power would continue to be subject to the MAT provisions.
| (c) | Deferred tax assets/liabilities |
The Company has accrued significant amounts of deferred tax. The majority of the deferred tax liability represents accelerated tax relief for the depreciation of property, plant and equipment, net of losses carried forward by Vedanta Limited (post the re-organisation) and unused tax credit in the form of MAT credits carried forward. Significant components of Deferred tax (assets) & liabilities recognized in the balance sheet are as follows:
VEDANTA LIMITED | INTEGRATED REPORT AND ANNUAL ACCOUNTS 2020-21 | 353
STANDALONE CONTINUED...
Notes
forming part of the financial statements as at and for the year ended March 31, 2021
For the year ended 31 March 2021
| (₹ in crores) | ||||||||||||||||||||||||
Significant components of Deferred tax (assets) | Opening balance as at 01 April 2020 | Charged / (credited) to statement of profit and loss | Charged / (credited) to other comprehensive income | Exchange difference transferred to translation of foreign operation | Charged to equity | Closing balance as at March 31,2021 | ||||||||||||||||||
Property, Plant and Equipment | 4,143 | (308 | ) | — | 13 | — | 3,848 | |||||||||||||||||
Voluntary retirement scheme | (1 | ) | 1 | — | — | — | — | |||||||||||||||||
Employee benefits | (21 | ) | 2 | 2 | — | 32 | 15 | |||||||||||||||||
Fair valuation of derivative asset/liability | (16 | ) | — | (7 | ) | — | — | (23 | ) | |||||||||||||||
Fair valuation of other asset/liability | 85 | (121 | ) | — | — | — | (36 | ) | ||||||||||||||||
Unused tax asset MAT credit entitlement | (3,600 | ) | (101 | ) | — | — | — | (3,701 | ) | |||||||||||||||
Unabsorbed depreciation and tax losses | (3,652 | ) | 3,652 | — | — | — | — | |||||||||||||||||
Other temporary differences | (402 | ) | (68 | ) | 34 | — | — | (436 | ) | |||||||||||||||
|
|
|
|
|
|
|
|
|
|
|
| |||||||||||||
Total | (3,464 | ) | 3,057 | 29 | 13 | 32 | (333 | ) | ||||||||||||||||
|
|
|
|
|
|
|
|
|
|
|
| |||||||||||||
For the year ended 31 March 2020
| (₹ in crores) | ||||||||||||||||||||||||
Significant components of Deferred tax (assets) | Opening balance as at 01 April 2019 | Charged / (credited) to statement of profit and loss | Charged / (credited) to other comprehensive income | Exchange difference transferred to translation of foreign operation | Charged to equity | Closing balance as at March 31,2020 | ||||||||||||||||||
Property, Plant and Equipment | 7,766 | (3,691 | ) | — | 68 | — | 4,143 | |||||||||||||||||
Voluntary retirement scheme | (3 | ) | 2 | — | — | — | (1 | ) | ||||||||||||||||
Employee benefits | (19 | ) | 2 | (4 | ) | — | — | (21 | ) | |||||||||||||||
Fair valuation of derivative asset/liability | (33 | ) | — | 17 | — | — | (16 | ) | ||||||||||||||||
Fair valuation of other asset/liability | 112 | (27 | ) | — | — | — | 85 | |||||||||||||||||
Unused tax asset MAT credit entitlement | (3,971 | ) | 119 | — | — | 252 | (3,600 | ) | ||||||||||||||||
Unabsorbed depreciation and tax losses | (3,524 | ) | (128 | ) | — | — | — | (3,652 | ) | |||||||||||||||
Other temporary differences | (331 | ) | (12 | ) | (59 | ) | — | — | (402 | ) | ||||||||||||||
|
|
|
|
|
|
|
|
|
|
|
| |||||||||||||
Total | (3 | ) | (3,735 | ) | (46 | ) | 68 | 252 | (3,464 | ) | ||||||||||||||
|
|
|
|
|
|
|
|
|
|
|
| |||||||||||||
Recognition of deferred tax assets on MAT credit entitlement is based on the Company’s present estimates and business plans as per which the same is expected to be utilized within the stipulated fifteen year period from the date of origination. (Refer Note 3(c)(A)(vi))
In addition to above, the Company has not recognised deferred tax asset on deductible temporary differences aggregating to ₹3,393 crore (31 March 2020: ₹3,393 crore) on Impairment of investment in subsidiaries (Refer Note 32 (e)) as the realization of the same is not reasonably certain.
| (d) | Non- current tax assets |
Non- current tax assets of ₹1,787 Crore and ₹1,682 Crore as at 31 March 2021 and 31 March 2020 respectively mainly represents income tax receivable from Indian tax authorities by Vedanta Limited relating to the refund arising consequent to the Scheme of Amalgamation & Arrangement made effective in August 2013 pursuant to approval by the jurisdiction High Court and receivables relating to matters in tax disputes including tax holiday claim.
354
| < BACK TO CONTENTS | Integrated Report | Statutory reports | Financial statements |
Notes
forming part of the financial statements as at and for the year ended March 31, 2021
| 34 | EARNINGS PER EQUITY SHARE |
| (₹ in crores except otherwise stated) | ||||||||
Particulars | Year ended 31 March 2021 | ended 31 March 2020 | ||||||
Profit/(Loss) after tax attributable to equity share holders for Basic and Diluted EPS | 10,503 | (6,732 | ) | |||||
Weighted Average no. of equity shares outstanding during the year for Basic and Dilutive EPS (in Crore) | 372 | 372 | ||||||
|
|
|
| |||||
Basic and Diluted Earnings/ (Loss) per share (in ₹) | 28.23 | (18.10 | ) | |||||
Nominal value per share (in ₹) | 1.00 | 1.00 | ||||||
|
|
|
| |||||
| 35 | DIVIDENDS |
| (₹ in crores) | ||||||||
Particulars | Year ended 31 March 2021 | Year ended 31 March 2020 | ||||||
Amounts recognised as distributions to equity shareholders: | ||||||||
Interim dividend (31 March 2021: ₹9.50 per share, 31 March 2020: ₹3.90 per share) | 3,519 | 1,444 | ||||||
Attributable tax on dividend | — | 252 | ||||||
|
|
|
| |||||
Total | 3,519 | 1,696 | ||||||
|
|
|
| |||||
| 36 | COMMITMENTS, CONTINGENCIES AND GUARANTEES |
| A) | Commitments |
The Company has a number of continuing operational and financial commitments in the normal course of business including:
| • | Exploratory mining commitments; |
| • | Oil & gas commitments; |
| • | Mining commitments arising under production sharing agreements; and |
| • | Completion of the construction of certain assets. |
Estimated amount of contracts remaining to be executed on capital accounts and not provided for:
| (₹ in crores) | ||||||||
Particulars | As at 31 March 2021 | As at 31 March 2020 | ||||||
Oil & Gas sector | ||||||||
Cairn India | 855 | 1,816 | ||||||
Aluminium sector | ||||||||
Lanjigarh Refinery (Phase II) | 1,188 | 1,573 | ||||||
Jharsuguda 1.25 MTPA smelter | 463 | 414 | ||||||
Copper sector | ||||||||
Tuticorin Smelter 400 KTPA* | 2,995 | 2,791 | ||||||
Others | 705 | 732 | ||||||
|
|
|
| |||||
Total | 6,206 | 7,326 | ||||||
|
|
|
| |||||
| * | currently contracts are under suspension under the force majeure clause as per the contract |
VEDANTA LIMITED | INTEGRATED REPORT AND ANNUAL ACCOUNTS 2020-21 | 355
STANDALONE CONTINUED...
Notes
forming part of the financial statements as at and for the year ended March 31, 2021
Committed work programme (Other than capital commitment)
| (₹ in crores) | ||||||||
Particulars | As at 31 March 2021 | As at 31 March 2020 | ||||||
Oil & Gas sector | ||||||||
Cairn India (OALP—New Oil and Gas blocks) | 5,625 | 5,841 | ||||||
|
|
|
| |||||
Other Commitments
Power Division of the Company has signed a long term power purchase agreement (PPA) with Gridco Limited for supply of 25% of power generated from the power station with additional right to purchase power (5%/ 7 %) at variable cost as per the conditions referred to in PPA. The PPA has a tenure of twenty five years.
| B) | Guarantees |
The aggregate amount of indemnities and other guarantees on which the Company does not expect any material losses was ₹16,390 Crore (31 March 2020: ₹16,544 Crore). The Company has given guarantees in the normal course of business as stated below:
| a) | Guarantees and bonds advanced to the customs authorities in India of ₹632 Crore relating to the export and payment of import duties on purchases of raw material and capital goods (31 March 2020: ₹362 Crore). |
| b) | Guarantees issued for Company’s share of minimum work programme commitments of ₹2,889 Crore (31 March 2020: ₹2,906 Crore). |
| c) | Guarantees of ₹79 Crore (31 March 2020: ₹54 Crore) issued under bid bond. |
| d) | Bank guarantees of ₹115 Crore (31 March 2020: ₹115 Crore) has been provided by the Company on behalf of Volcan Investments Limited to Income tax department, India as a collateral in respect of certain tax disputes. |
| e) | The Company has given corporate guarantees, bank guarantees and also assigned its bank limits to other group companies majorly in respect of certain short-term and long-term borrowings amounting to ₹11,051 Crore (31 March 2020: ₹10,816 Crore). Refer Note 37 |
| f) | Other guarantees worth ₹1,624 Crore (31 March 2020: ₹2,291 Crore) issued for securing supplies of materials and services, in lieu of advances received from customers, litigation, for provisional valuation of custom duty and also to various agencies, suppliers and government authorities for various purposes. The Company does not anticipate any liability on these guarantees. |
| C) | Export Obligations |
The Company has export obligations of ₹285 Crore (31 March 2020: ₹612 Crore) on account of concessional rates of import duty paid on capital goods under the Export Promotion Capital Goods Scheme and under the Advance Licence Scheme for the import of raw material laid down by the Government of India.
In the event of the Company’s inability to meet its obligations, the Company’s liability would be ₹46 Crore (31 March 2020: ₹84 Crore) reduced in proportion to actual exports, plus applicable interest.
The Company has given bonds of ₹50 Crore (31 March 2020: ₹88 Crore) to custom authorities against these export obligations.
| D) | Contingent Liabilities |
The Company discloses the following legal and tax cases as contingent liabilities:
a) Vedanta Limited: Income tax
Vedanta Limited (notice was served on Cairn India Limited which subsequently merged with Vedanta Limited, accordingly now referred to as Vedanta Limited/ Company) received a demand totalling ₹20,495 Crore (including interest of ₹10,247 Crore) holding the Company as ‘assessee in default’ as per Section 201 of Indian Income Tax Act. The Company has challenged the said order and presently pending before the Income Tax Appellate Tribunal (ITAT).
The Company also filed a writ petition before the Delhi High Court wherein it has raised several grounds against the order said order. The matter came up for hearing on
05 February 2020 before Delhi High Court but adjourned and the next date of hearing is 29 July 2021.
Separately, Vedanta Resources Limited has filed a Notice of Claim against the Government of India (‘GOI’) under the BIT. Hearing already concluded in May 2019 and award awaited.
356
| < BACK TO CONTENTS | Integrated Report | Statutory reports | Financial statements |
Notes
forming part of the financial statements as at and for the year ended March 31, 2021
Separately Cairn UK Holdings Limited (“CUHL”), on whom the primary liability of income tax lies, had received an Order from the ITAT in the financial year 2016-17 holding that the transaction is taxable in view of the clarificatory amendment in the Act but also acknowledged that amendment being a retrospective transaction, interest would not be levied. Hence affirming a demand of ₹10,247 Crore excluding the interest portion that had previously been claimed. Against this demand Tax authorities have recovered ₹5,863 Crore from the CUHL. Vedanta has also paid interim dividend of ₹5 Crore to the Tax authorities and thus reducing the liability to ₹4,384 Crore (March 31,2020: ₹4,384 Crore).
In related proceedings, the International Arbitration Tribunal ruled unanimously in the case of Cairn Energy Plc that India had breached its obligations under the UK- India Bilateral Investment Treaty (the BIT). The Company understands that Government of India has challenged the ruling before the International Court of Justice at The Hague. As the Cairn Energy Plc Arbitration award received on 23 December 2020 regarding retrospective tax will have a direct influence upon Company’s case, due to the fact that primary liability of paying the income tax is CUHL’s and in this case there is expected to be no income tax liability in the hands of CUHL, the claim of amounts assessed as in default against Company should be eliminated. Further going by the recent ruling of Supreme court in an another unrelated matter, it was held that person under sec 195 can’t be held responsible to do impossible in case of retrospective act. Thus it was impossible for Vedanta Limited (successor in the business of Cairn India Limited) to deduct income tax and can’t be held responsible for default under Section 201. The Company believes that owing to the similarity in the facts of the case it has a good case to argue and accordingly it is unlikely that any liability will devolve upon the Company.
| b) | Ravva Joint Operations arbitration proceedings ONGC Carry |
The Ravva Production Sharing Contract (PSC) obliges the contractor parties to pay a proportionate share of ONGC’s exploration, development, production and contract costs in consideration for ONGC’s payment of costs related to the construction and other activities it conducted in Ravva prior to the effective date of the Ravva PSC (the ONGC Carry). The question as to how the ONGC Carry is to be recovered and calculated, along with other issues, was submitted to an International Arbitration Tribunal in August 2002 which rendered a decision on the ONGC Carry in favour of the contractor parties (including Vedanta Limited (Cairn India Limited which subsequently merged with Vedanta Limited, accordingly now referred to as Vedanta Limited)) whereas four other issues were decided in favour of Government of India (GOI) in October 2004 (Partial Award). The GOI then proceeded to challenge the ONGC Carry decision before the Malaysian courts, as Kuala Lumpur was the seat of the arbitration. The Federal Court of Malaysia upheld the Partial Award. As the Partial Award did not quantify the sums, therefore, contractor parties approached the same Arbitration Tribunal to pass a Final Award in the subject matter since it had retained the jurisdiction to do so. The Arbitral Tribunal was reconstituted and the Final Award was passed in October 2016 in Company’s favour. GOI’s challenge of the Final Award has been dismissed by the Malaysian High Court and the next appellate court in Malaysia i.e. Malaysian Court of Appeal. GOI then filed an appeal at Federal Court of Malaysia. The matter was heard on 28 February 2019 and the Federal Court dismissed GOI’s leave to appeal. The Company has also filed for the enforcement of the Partial Award and Final Award before the Hon’ble Delhi High Court. The matter is now listed for hearing on 13 July 2021.
Base Development Cost
Ravva joint operations had received a claim from the Ministry of Petroleum and Natural Gas, Government of India (GOI) for the period from 2000-2005 for ₹946 Crore (US$129 million) for an alleged underpayment of profit petroleum (by recovering higher Base Development
Costs (“BDC”) against the cap imposed in the PSC) to the Government of India (GOI), out of which, Vedanta Limited’s (Cairn India Limited which subsequently merged with Vedanta Limited, accordingly now referred to as Vedanta Limited) share will be ₹213 Crore (US$29 million) plus interest. Joint venture partners initiated the arbitration proceedings and Arbitration Tribunal published the Award in January 2011 allowing claimants (including the Company) to recover the development costs spent to the tune of ₹2,038 Crore (US$278 million) and disallowed over run of ₹161 Crore (US$22 million) spent in respect of BDC along with 50% legal costs. Finally, Supreme Court of India on 16 September 2020 pronounced the order in favour of Vedanta, rejecting all objections of the GOI and allowed enforcement of the Arbitration Award. With the Supreme Court order the Ravva BDC Matter stands closed.
VEDANTA LIMITED | INTEGRATED REPORT AND ANNUAL ACCOUNTS 2020-21 | 357
STANDALONE CONTINUED...
Notes
forming part of the financial statements as at and for the year ended March 31, 2021
In connection with the above two matters, the Company has received an order dated 22 October 2018 from the GOI directing oil marketing companies (OMCs) who are the offtakers of Ravva Crude to divert the sale proceeds to GOI’s account. GOI alleges that the Ravva Joint Operations (consisting of four joint venture partners) has short paid profit petroleum of ₹2,302 Crore (US$314 million) (the Company’s share approximately—₹682 Crore (US$93 million)) on account of the two disputed issues of ONGC Carry and BDC matters, out of which ₹469 Crore (US$64 million) pertains to ONGC Carry and ₹213 Crore (US$29 million) pertains to BDC Matter. Against an interim application, filed by the Company along with one of its joint venture partner, for seeking stay of such action from GOI, before the Hon’ble Delhi High Court, the Court directed the OMCs to deposit above sums to the Delhi High Court for both BDC and ONGC Carry matters. However, the Company (and other joint venture partner) has been given the liberty to seek withdrawal of the amounts from the Court upon furnishing a bank guarantee of commensurate value. On the basis of the above direction, the OMCs have deposited ₹682 Crore (US$93 million) out of which ₹616 Crore (US$84 million) has been withdrawn post submission of bank guarantee. The Hon’ble Delhi High Court vide its order dated 28 May 2020 read with order dated 04 June 2020 has directed that all future sale proceeds of Ravva Crude w.e.f. 05 June 2020 be paid directly to Vedanta Limited by the OMCs. In view of the closure of the BDC matter, the Company has also filed an application in HC on 22 September 2020 seeking refund of remaining ₹66 Crore (US$9 million) and release of bank guarantees submitted in Court pertaining to the BDC matter, out of which ₹147 Crore (US$20 million) have since been received by Vedanta.
During the proceedings of the above matter, GOI has also filed an interim application seeking deposit by the said OMCs of an amount of ₹638 Crore (US$87 million) (Company’s share of ₹410 Crore (US$56 million)) towards interest on the alleged short payment of profit petroleum by the petitioners i.e. the Company (and other joint venture partner). The matter has been listed for hearing on 13 July 2021 along with ONGC carry case.
While the Company does not believe the GOI will be successful in its challenge, if the Arbitral Awards in above matters are reversed and such reversals are binding, Company would be liable for approximately ₹469 Crore (US$64 million) plus interest. (31 March 2020: ₹479 Crore (US$64 million) plus interest).
| c) | Proceedings related to the imposition of entry tax |
The Company challenged the constitutional validity of the local statutes and related notifications in the states of Odisha and Rajasthan pertaining to the levy of entry tax on the entry of goods brought into the respective states from outside. Post some contradictory orders of High Courts across India adjudicating on similar challenges, the Supreme Court referred the matters to a nine judge bench. Post a detailed hearing, although the bench rejected the compensatory nature of tax as a ground of challenge, it maintained status quo with respect to all other issues which have been left open for adjudication by regular benches hearing the matters.
Following the order of the nine judge bench, the regular bench of the Supreme Court proceeded with hearing the matters. The regular bench remanded the entry tax matters relating to the issue of discrimination against domestic goods bought from other States to the respective High Courts for final determination but retained the issue of jurisdiction for levy on imported goods, for determination by the regular bench of the Supreme Court. Following the order of the Supreme Court, the Company filed writ petitions in respective High Courts.
On 09 October 2017, the Supreme Court has held that states have the jurisdiction to levy entry tax on imported goods. With this Supreme Court judgement, imported goods will rank pari-passu with domestic goods for the purpose of levy of Entry tax. The Company has amended its appeal (writ petitions) in Odisha to include imported goods as well.
The issue pertaining to the levy of entry tax on the movement of goods into a Special Economic Zone (SEZ) remains pending before the Odisha High Court. The Company has challenged the levy of entry tax on any movement of goods into SEZ based on the definition of ‘local area’ under the Odisha Entry Tax Act which is very clear and does not include a SEZ. In addition, the Government of Odisha further through its SEZ Policy 2015 and the operational guidelines for administration of this policy dated 22 August 2016, exempted the entry tax levy on SEZ operations.
The total claims against the Company are ₹1,158 Crore (31 March 2020: ₹1,112 Crore) net of provisions made.
| d) | Miscellaneous disputes- Income tax |
The Company is involved in various tax disputes amounting to ₹528 Crore (31 March 2020: ₹527 Crore) relating to income tax for the periods for which initial assessments have been completed. These mainly relate to the disallowance of tax holiday for 100% Export Oriented Undertaking under section 10B of the Income Tax Act, 1961, disallowance of tax holiday benefit on production of gas under section 80IB of the Income Tax Act, 1961, on account of depreciation disallowances under the Income Tax Act and interest thereon which are pending at various appellate levels.
The Company believes that these disallowances are not tenable and accordingly no provision is considered necessary.
| e) | Miscellaneous disputes- Others |
The Company is subject to various claims and exposures which arise in the ordinary course of conducting and financing its business from the excise, indirect tax authorities and others. These claims and exposures mostly relate to the assessable values of sales and purchases or to incomplete documentation supporting the Company’s returns or other claims.
The approximate value of claims (excluding the items as set out separately above) against the Company totals to ₹2,596 Crore (31 March 2020: ₹2,139 Crore)
Based on evaluations of the matters and legal advice obtained, the Company believes that it has strong merits in its favor. Accordingly, no provision is considered at this stage.
358
| < BACK TO CONTENTS | Integrated Report | Statutory reports | Financial statements |
Notes
forming part of the financial statements as at and for the year ended March 31, 2021
| 37 | RELATED PARTY DISCLOSURES |
List of related parties and relationships
| A) | Entities controlling the Company (Holding Companies) |
Volcan Investments Limited
Volcan Investments Cyprus Limited
Intermediate Holding Companies
Finsider International Company Limited
Richter Holdings Limited
Twin Star Holdings Limited
Vedanta Resources Cyprus Limited
Vedanta Resources Finance Limited
Vedanta Resources Holdings Limited
Vedanta Resources Limited
Welter Trading Limited
Westglobe Limited
Vedanta Holdings Mauritius II Limited (a)
| B) | Fellow Subsidiaries (with whom transactions have taken place) |
Konkola Copper Mines Plc (e)
Sterlite Iron and Steel Company Limited (f)
Sterlite Technologies Limited
Sterlite Power Grid Ventures Limited
Sterlite Power Transmission limited
| C) | Associates and Joint ventures (Refer note 39) |
| D) | Subsidiaries |
Amica Guesthouse (Proprietary) Limited
AvanStrate Inc, Japan
AvanStrate Korea Inc, Korea
AvanStrate Taiwan Inc, Taiwan
Bharat Aluminium Company Limited
Black Mountain Mining (Proprietary) Limited
Bloom Fountain Limited
Cairn Energy Discovery Limited (b)
Cairn Energy Gujarat Block 1 Limited
Cairn Energy Hydrocarbons Limited
Cairn Energy India (Proprietary) Limited (b)
Cairn Exploration (No. 2) Limited (b)
Cairn India Holdings Limited
Cairn Lanka (Private) Limited
Cairn South Africa (Pty) Limited (c)
CIG Mauritius Holdings Private Limited (c)
CIG Mauritius Private Limited (c)
Copper Mines of Tasmania (Proprietary) Limited
ESL Steel Limited
Fujairah Gold FZC
Goa Sea Port Private Limited
Hindustan Zinc Limited
Killoran Lisheen Finance Limited
Killoran Lisheen Mining Limited
Lakomasko BV
Lisheen Milling Limited
Lisheen Mine Partnership
Malco Energy Limited
Maritime Ventures Private Limited
Monte Cello BV
Namzinc (Proprietary) Limited
Paradip Multi Cargo Berth Private Limited
Sesa Mining Corporation Limited
Sesa Resources Limited
Skorpion Mining Company (Proprietary) Limited
Skorpion Zinc (Proprietary) Limited
Sterlite Ports Limited
Talwandi Sabo Power Limited
Thalanga Copper Mines (Proprietary) Limited
THL Zinc Holding BV
THL Zinc Limited
THL Zinc Ventures Limited
THL Zinc Namibia Holdings (Proprietary) Limited
Vedanta Exploration Ireland Limited
Vedanta Lisheen Holdings Limited
Vedanta Lisheen Mining Limited
Vizag General Cargo Berth Private Limited
Western Cluster Limited
Ferro Alloys Corporation Limited (d)
Facor Power Limited
Facor Realty and Infrastructure Limited
| E) | Post retirement benefit plan |
Sesa Group Employees Provident Fund
Sesa Group Employees Gratuity Fund and Sesa Group
Executives Gratuity Fund
Sesa Group Executives Superannuation Scheme Fund
| F) | Others (with whom transactions have taken place) |
| I) | Enterprises over which key management personnel/ their |
relatives have control or sinificant influence.
Vedanta Foundation
Sesa Community Development Foundation
Vedanta Limited ESOS Trust
Cairn Foundation
Runaya Refinery LLP
Janhit Electoral Trust
| II) | Enterprises which are Associates/Joint Ventures of entities under common control |
India Grid trust (g)
| a. | On 24 December 2020, Vedanta Holdings Mauritius II Limited purchased shares of Vedanta Limited (Refer note 14(c)(3)). |
| b. | Liquidated during the year. |
| c. | Under liquidation. |
| d. | Acquired during the year. |
| e. | Konkola Copper Mines Plc (KCM) ceased to be a related party w.e.f. 21 May 2019. The Company has total receivable of ₹51 |
Crore (net of provision of ₹103 Crore) as at 31 March 2021 (As at 31 March 2020: ₹106 Crore (net of provision of ₹52 Crore)).
| f. | Sterlite Power Grid Ventures Limited (SPGVL) has been amalgamated with Sterlite Power Transmission Limited (SPTL) effective from 15 November 2020. |
| g. | Ceased to be related party during the previous year. |
VEDANTA LIMITED | INTEGRATED REPORT AND ANNUAL ACCOUNTS 2020-21 | 359
STANDALONE CONTINUED...
Notes
forming part of the financial statements as at and for the year ended March 31, 2021
Ultimate Controlling party
Vedanta Limited is a majority-owned and controlled subsidiary of Vedanta Resources Limited (‘VRL’). Volcan Investments Limited (‘Volcan’) and its wholly owned subsidiary together hold 100 % of the share capital and 100 % of the voting rights of VRL. Volcan is 100 % beneficially owned and controlled by the Anil Agarwal Discretionary Trust (‘Trust’). Volcan Investments Limited, Volcan Investments Cyprus Limited and other intermediate holding companies except VRL do not produce Group financial statements.
| I) | For the Year ended 31 March 2021 |
| (₹ in crores) | ||||||||||||||||
Particulars | Entities controlling the Company/Fellow subsidiaries | Associates/ Joint ventures | Others | Total | ||||||||||||
Income: | ||||||||||||||||
(i) Revenue from operations | 660 | 792 | — | 1,452 | ||||||||||||
(ii) Other Income | ||||||||||||||||
a) Interest and guarantee commission | 14 | 113 | — | 126 | ||||||||||||
b) Dividend income | 2 | 10,369 | — | 10,371 | ||||||||||||
c) Outsourcing service fees | 4 | — | — | 4 | ||||||||||||
Expenditure and other transactions: | ||||||||||||||||
(i) Purchase of goods/ Services | 76 | 592 | 28 | 697 | ||||||||||||
(ii) Stock options expenses/(recovery) | — | (21 | ) | — | (21 | ) | ||||||||||
(iii) Allocation of Corporate Expenses | — | 96 | — | 96 | ||||||||||||
(iv) Management and Brand Fees paid(c) | 766 | — | — | 766 | ||||||||||||
|
|
|
|
|
|
|
| |||||||||
(v) Reimbursement for other expenses (net of recovery) | (13 | ) | 96 | (0 | ) | 82 | ||||||||||
(vi) Corporate Social Responsibility expenditure/ Donation | — | — | 15 | 15 | ||||||||||||
(vii) Contribution to Post retirement employee benefit trust | — | — | 7 | 7 | ||||||||||||
(viii) Sale/ (Purchase) of fixed assets | — | (0 | ) | — | (0 | ) | ||||||||||
(ix) Dividend paid | ||||||||||||||||
-To Holding companies | 1,770 | — | 0 | 1,770 | ||||||||||||
To key management personnel | — | — | 0 | 0 | ||||||||||||
-To relatives of key management personnel | — | — | 0 | 0 | ||||||||||||
(x) Commission/Sitting Fees | ||||||||||||||||
-To Independent directors | — | — | 3 | 3 | ||||||||||||
-To key management personnel | — | — | 1 | 1 | ||||||||||||
(xi) Interest and guarantee commission expense | 115 | 93 | — | 207 | ||||||||||||
Transactions during the year: | ||||||||||||||||
a) Financial guarantees given | 1 | 2,393 | — | 2,394 | ||||||||||||
b) Financial guarantees relinquished | — | 1,995 | — | 1,995 | ||||||||||||
c) Banking Limits assigned/utilised/renewed/ (relinquished) to/for group companies | — | (25 | ) | — | (25 | ) | ||||||||||
d) Loans given during the year | 0 | 601 | — | 601 | ||||||||||||
e) Loans repaid during the year (a) | — | (1,672 | ) | (57 | ) | (1,729 | ) | |||||||||
|
|
|
|
|
|
|
| |||||||||
f) Short-term borrowings (taken)/ repaid during the year | — | 200 | — | 200 | ||||||||||||
g) Sale of investments to Hindustan Zinc Limited | — | 1,407 | — | 1,407 | ||||||||||||
h) Security deposits received (Net of repayment of ₹130 crore) | — | 1,170 | — | 1,170 | ||||||||||||
Balances as at year end: | ||||||||||||||||
a) Trade Receivables | 46 | 17 | — | 63 | ||||||||||||
b) Loans given | — | 702 | 277 | 979 | ||||||||||||
c) Other receivables and advances | 166 | 220 | 2 | 388 | ||||||||||||
360
| < BACK TO CONTENTS | Integrated Report | Statutory reports | Financial statements |
Notes
forming part of the financial statements as at and for the year ended March 31, 2021
| (₹ in crores) | ||||||||||||||||
Particulars | Entities controlling the Company/Fellow subsidiaries | Associates/ Joint ventures | Others | Total | ||||||||||||
d) Trade Payables | 54 | 27 | 15 | 95 | ||||||||||||
e) Other payables (including brand fee payable and security deposit) | 96 | 1,307 | 15 | 1,418 | ||||||||||||
f) Financial guarantee given | 1 | 10,988 | — | 10,989 | ||||||||||||
g) Banking Limits assigned/utilised to/for group companies | 115 | 62 | — | 177 | ||||||||||||
h) Sitting fee, Commission and consultancy fees payable | ||||||||||||||||
-To Independent directors | — | — | 3 | 3 | ||||||||||||
-To key management personnel | — | — | 1 | 1 | ||||||||||||
i) Short-term borrowings | — | 200 | — | 200 | ||||||||||||
| a. | The Company reduced its loan receivable from Vedanta Limited ESOS Trust by ₹57 Crore on exercise of stock options by employees during the year ended 31 March 2021. |
| b. | Bank gaurantee given by Vedanta Limited on behalf of Volcan Investments Limited in favour of Income Tax department, India as collateral in respect of certain tax disputes of Volcan Investments Limited. |
| c. | In 2017, the Company had executed a three year brand license agreement (“the Agreement”) with Vedanta Resources Ltd (‘VRL’) for the use of brand ‘Vedanta’ which envisaged payment of brand fee to VRL at 0.75% of turnover of the Company. During the current year, the Agreement was renewed between the parties and certain additional services were also agreed to be provided by VRL. Based on updated benchmarking analysis conducted by independent experts, the brand and strategic service fee was re-negotiated at 2% of turnover of the Company. Accordingly, the Company has recorded an expense of ₹728 Crore (31 March 2020: ₹259 Crore) for the year ended 31 March 2021. The Company pays such fee in advance at the start of the year, based on its estimated annual turnover. |
| d. | Vedanta Resources Limited (“VRL”), as a parent company, has provided financial and performance guarantee to the Government of India for erstwhile Cairn India group’s (“Cairn”) obligations under the Production Sharing Contract (‘PSC’) provided for onshore block RJ-ON-90/1, for making available financial resources equivalent to Cairn’s share for its obligations under the PSC, personnel and technical services in accordance with industry practices and any other resources in case Cairn is unable to fulfil its obligations under the PSC. |
During the current year, the Board of Directors of the Company has approved a consideration to be paid for this guarantee at an annual charge of 1.2% of net exploration and development spend, subject to a minimum annual fee of ₹37 crore ($5 million), applicable from April 2020 onwards to be paid in ratio of participating interests held equally by the Company and its step-down subsidiary, Cairn Energy Hydrocarbons Ltd (“CEHL”).
Similarly, VRL has also provided financial and performance guarantee to the Government of India for the Company’s obligations under the Revenue Sharing Contract (‘RSC’) in respect of 51 Blocks awarded under the Open Acreage Licensing Policy (“OALP”) by the Government of India. During the current year, the Board of Directors of the Company has approved a consideration to be paid for this guarantee consisting of one-time charge of ₹183 crore ($25 million), i.e., 2.5% of the total estimated cost of initial exploration phase of approx. ₹7,330 crore ($1 billion) and an annual charge of 1% of spend, subject to a minimum fee of ₹73 crore ($10 million) and maximum fee of ₹147 crore ($20 million) per annum.
Accordingly, the Company has recorded a guarantee commission expense of ₹133 crore ($18 million) [2020: Nil] for the year ended 31 March 2021 and ₹161 crore ($22 million) (PY Nil) is outstanding as a pre-payment.
| e. | During the year, the Company has recognised a provision of ₹16 Crore (Including accrued interest of ₹11 Crore) against said loan. e. During the year ended 31 March 2021, the Company had renewed loan provided to Sterlite Iron and Steel Company Limited to finance project in earlier years. The loan balance as at 31 March 2021 was ‘5 Crore (March 31,2020: ‘5 Crore). The loan is unsecured in nature and carries an interest rate of 7.15% per annum. The loan was due in March 2021 and the agreement was renewed for a further period of 12 months. |
During the year, the Company has recognised a provision of ‘16 Crore (Including accrued interest of ‘11 Crore) against said loan.
VEDANTA LIMITED | INTEGRATED REPORT AND ANNUAL ACCOUNTS 2020-21 | 361
STANDALONE CONTINUED...
Notes
forming part of the financial statements as at and for the year ended March 31, 2021
Remuneration of key management personnel
| (₹ in crores) | ||||
Particulars | For the Year ended 31 March 2021 | |||
Short-term employee benefits | 27 | |||
Post employment benefits (f) | 1 | |||
Share based payments | 0 | |||
|
| |||
Total | 28 | |||
|
| |||
| f. | Does not include the provision made for gratuity and leave benefits, as they are determined on an actuarial basis for all the employees together. |
| I) | For the year ended 31 March 2020 |
| (₹ in crores) | ||||||||||||||||
Particulars | Entities controlling the Company/Fellow subsidiaries | Associates/ Joint ventures | Others | Total | ||||||||||||
Income: | ||||||||||||||||
(i) Revenue from operations | 671 | 969 | — | 1,640 | ||||||||||||
(ii) Other Income | ||||||||||||||||
a) Interest and guarantee commission | 17 | 135 | 0 | 152 | ||||||||||||
b) Dividend income | 2 | 2,125 | 4 | 2,131 | ||||||||||||
c) Outsourcing service fees | 3 | — | — | 3 | ||||||||||||
Expenditure and other transactions: | ||||||||||||||||
(i) Purchase of goods/ Services | 56 | 651 | 7 | 714 | ||||||||||||
(ii) Stock options expenses/(recovery) | (0 | ) | (37 | ) | (0 | ) | (37 | ) | ||||||||
(iii) Allocation of Corporate Expenses | — | (87 | ) | — | (87 | ) | ||||||||||
(iv) Management and Brand Fees paid | 313 | — | — | 313 | ||||||||||||
(v) (Recovery of)/ Reimbursement to/for other expenses | 48 | (104 | ) | 0 | (56 | ) | ||||||||||
(vi) Corporate Social Responsibility expenditure/ Donation | — | — | 25 | 25 | ||||||||||||
(vii) Contribution to Post retirement employee benefit trust | — | — | 6 | 6 | ||||||||||||
(viii) Sale/ (Purchase) of fixed assets | — | 1 | — | 1 | ||||||||||||
(ix) Dividend paid. | ||||||||||||||||
-To Holding companies | 727 | — | — | 727 | ||||||||||||
-To key management personnel | — | — | 0 | 0 | ||||||||||||
-To relatives of key management personnel | — | — | 0 | 0 | ||||||||||||
(x) Commission/Sitting Fees | ||||||||||||||||
-To Independent directors | — | — | 4 | 4 | ||||||||||||
-To key management personnel | — | — | 4 | 4 | ||||||||||||
Transactions during the year: | ||||||||||||||||
a) Financial guarantees given | — | 91 | — | 91 | ||||||||||||
b) Financial guarantees relinquished | — | 6,233 | — | 6,233 | ||||||||||||
c) Banking Limits assigned/utilised/renewed/ (relinquished) to/ for group companies | — | (100 | ) | — | (100 | ) | ||||||||||
d) Loans given during the year | 0 | 2,870 | — | 2,870 | ||||||||||||
e) Loans repaid during the year (a) | — | (1,403 | ) | (17 | ) | (1,420 | ) | |||||||||
|
|
|
|
|
|
|
| |||||||||
362
| < BACK TO CONTENTS | Integrated Report | Statutory reports | Financial statements |
Notes
forming part of the financial statements as at and for the year ended March 31, 2021
| (₹ in crores) | ||||||||||||||||
Particulars | Entities controlling the Company/Fellow subsidiaries | Associates/ Joint ventures | Others | Total | ||||||||||||
Balances as at year end: | ||||||||||||||||
a) Trade Receivables | 0 | 42 | — | 42 | ||||||||||||
b) Loans given | 5 | 1,773 | 334 | 2,112 | ||||||||||||
c) Other receivables and advances | 17 | 267 | 2 | 286 | ||||||||||||
d) Trade Payables | 19 | 7 | 1 | 27 | ||||||||||||
e) Other payables | 43 | 16 | 17 | 76 | ||||||||||||
f) Other Current liabilities- Advance from Customers | 3 | — | — | 3 | ||||||||||||
g) Financial guarantee given | — | 10,526 | — | 10,526 | ||||||||||||
h) Banking Limits assigned/utilised to/for group companies (b) | 115 | 290 | — | 405 | ||||||||||||
i) Commission and consultancy fees payable to KMP and their relatives | — | — | 5 | 5 | ||||||||||||
| a. | The Company reduced its loan receivable from Vedanta Limited ESOS Trust by ₹17 Crore on exercise of stock options by employees during the year ended 31 March 2020. |
| b. | Bank gaurantee given by Vedanta Limited on behalf of Volcan Investments Limited in favour of Income Tax department, India as collateral in respect of certain tax disputes of Volcan Investments Limited. |
Remuneration of key management personnel
| (₹ in crores) | ||||
Particulars | For the year ended 31 March 2020 | |||
Short-term employee benefits (c) | 40 | |||
Post employment benefits (d) | 8 | |||
Share based payments | 1 | |||
|
| |||
Total | 49 | |||
|
| |||
| c. | This includes reimbursement to the parent company for remuneration paid to the then CEO and Whole Time Director of the Company aggregating to ₹11 crore for the year ended 31 March 2020. |
| d. | Does not include the provision made for gratuity and leave benefits, as they are determined on an actuarial basis for all the employees together. |
There are no outstanding debts or loans due from directors or other officers (as defined under Section 2(59) of the Companies Act, 2013) of the Company.
| 38 | SUBSEQUENT EVENTS |
As per information received from Vedanta Resources Limited (“VRL” or “Acquirer”), VRL together with Twin Star
Holdings Limited, Vedanta Holdings Mauritius Limited and Vedanta Holdings Mauritius II Limited, as persons acting in concert with the Acquirer (“PACs”), have acquired 374,231,161 equity shares of the Company under the voluntary open offer made to the public shareholders of the Company in accordance with the Securities and Exchange Board of India (Substantial Acquisition of Shares and Takeovers) Regulations, 2011 and thereby increasing the shareholding of VRL and its subsidiaries in the Company from the current 55.1% to 65.18%.
There are no other material adjusting or non-adjusting subsequent events, except as already disclosed.
VEDANTA LIMITED | INTEGRATED REPORT AND ANNUAL ACCOUNTS 2020-21 | 363
STANDALONE CONTINUED...
Notes
forming part of the financial statements as at and for the year ended March 31, 2021
| 39 | INTEREST IN OTHER ENTITIES |
| a) | Subsidiaries |
The Group consists of a parent company, Vedanta Limited, incorporated in India and a number of subsidiaries held directly and indirectly by the Group which operate and are incorporated around the world. Following are the details of shareholdings in the subsidiaries.
| The Company’s/Immediate holding company’s percentage holding (in %) | ||||||||||||||||
Sr. No. | Subsidiaries | Principal activities | Country of | Immediate holding company | As at 31 March 2021 | As at 31 March 2020 | ||||||||||
1 | Cairn Energy India Pty Limited2 | Exploration for and development and production of oil & gas | Australia | Cairn India Holdings Limited | — | 100.00 | ||||||||||
2 | Copper Mines of Tasmania Pty Limited (“CMT”) | Copper mining | Australia | Monte Cello BV | 100.00 | 100.00 | ||||||||||
3 | Thalanga Copper Mines Pty Limited (“TCM”) | Copper mining | Australia | Monte Cello BV | 100.00 | 100.00 | ||||||||||
4 | Bharat Aluminium Company Limited (“BALCO”) | Aluminium mining and smelting | India | Vedanta Limited | 51.00 | 51.00 | ||||||||||
5 | Electrosteel Steels Limited | Manufacturing of Steel & DI Pipe | India | Vedanta Limited | 95.49 | 95.49 | ||||||||||
6 | Goa Sea Port Private Limited | Infrastructure | India | Sterlite Ports Limited | 100.00 | 100.00 | ||||||||||
7 | Hindustan Zinc Limited (“HZL”) | Zinc mining and smelting | India | Vedanta Limited | 64.92 | 64.92 | ||||||||||
8 | MALCO Energy Limited (“MEL”) | Power generation | India | Vedanta Limited | 100.00 | 100.00 | ||||||||||
9 | Maritime Ventures Private Limited | Infrastructure | India | Sterlite Ports Limited | 100.00 | 100.00 | ||||||||||
10 | Paradip Multi Cargo Berth Private Limited | Infrastructure | India | Vedanta Limited | 100.00 | 100.00 | ||||||||||
11 | Sesa Mining Corporation Limited | Iron ore mining | India | Sesa Resources Limited | 100.00 | 100.00 | ||||||||||
12 | Sesa Resources Limited (“SRL”) | Iron ore mining | India | Vedanta Limited | 100.00 | 100.00 | ||||||||||
13 | Sterlite Ports Limited | Infrastructure | India | Vedanta Limited | 100.00 | 100.00 | ||||||||||
14 | Talwandi Sabo Power Limited (“TSPL”) | Power generation | India | Vedanta Limited | 100.00 | 100.00 | ||||||||||
15 | Vizag General Cargo Berth Private Limited | Infrastructure | India | Vedanta Limited | 100.00 | 100.00 | ||||||||||
16 | Killoran Lisheen Finance Limited(a) | Investment company | Republic of Ireland | Vedanta Lisheen Holdings Limited | 100.00 | 100.00 | ||||||||||
17 | Killoran Lisheen Mining Limited | Development of a zinc/ lead mine | Republic of Ireland | Vedanta Lisheen Holdings Limited | 100.00 | 100.00 | ||||||||||
18 | Lisheen Milling Limited | Manufacturing3 | Republic of Ireland | Vedanta Lisheen Holdings Limited | 100.00 | 100.00 | ||||||||||
19 | Lisheen Mine Partnership | Development and operation of a zinc/lead mine | Republic of Ireland | 50% each held by Killoran Lisheen Mining Limited & Vedanta Lisheen Mining Limited | 100.00 | 100.00 | ||||||||||
20 | Vedanta Exploration Ireland Limited(a) | Exploration company | Republic of Ireland | Vedanta Lisheen Holdings Limited | 100.00 | 100.00 | ||||||||||
21 | Vedanta Lisheen Holdings Limited | Investment company | Netherlands | THL Zinc Holing BV | 100.00 | 100.00 | ||||||||||
22 | Vedanta Lisheen Mining Limited | Zinc and lead mining | Republic of Ireland | Vedanta Lisheen Holdings Limited | 100.00 | 100.00 | ||||||||||
364
| < BACK TO CONTENTS | Integrated Report | Statutory reports | Financial statements |
Notes
forming part of the financial statements as at and for the year ended March 31, 2021
| The Company’s/Immediate holding company’s percentage holding (in %) | ||||||||||||||||
Sr. No. | Subsidiaries | Principal activities | Country of | Immediate holding company | As at 31 March 2021 | As at 31 March 2020 | ||||||||||
23 | AvanStrate Inc. (‘ASI’) | Holding Company | Japan | Cairn India Holdings Limited | 51.63 | 51.63 | ||||||||||
24 | Cairn India Holdings Limited | Investment company | Jersey | Vedanta Limited | 100.00 | 100.00 | ||||||||||
25 | Western Cluster Limited | Iron ore mining | Liberia | Bloom Fountain Limited | 100.00 | 100.00 | ||||||||||
26 | Bloom Fountain Limited | Operating (Iron ore) and Investment Company | Mauritius | Vedanta Limited | 100.00 | 100.00 | ||||||||||
27 | CIG Mauritius Holdings Private Limited (a) | Investment Company | Mauritius | Cairn Energy Hydrocarbons Limited | 100.00 | 100.00 | ||||||||||
28 | CIG Mauritius Private Limited (a) | Investment Holding Company and to provide services and resources relevant to oil & gas exploration, production and development | Mauritius | CIG Mauritius Holdings Private Limited | 100.00 | 100.00 | ||||||||||
29 | THL Zinc Ltd | Investment company | Mauritius | THL Zinc Ventures Ltd | 100.00 | 100.00 | ||||||||||
30 | THL Zinc Ventures Limited | Investment company | Mauritius | Vedanta Limited | 100.00 | 100.00 | ||||||||||
31 | Amica Guesthouse (Proprietary) Limited | Accommodation and Catering services | Namibia | Skorpion Zinc (Proprietary) Limited | 100.00 | 100.00 | ||||||||||
32 | Namzinc (Proprietary) Limited | Owns and operates zinc refinery | Namibia | Skorpion Zinc (Proprietary) Limited | 100.00 | 100.00 | ||||||||||
33 | Skorpion Mining Company (Proprietary) Limited (‘NZ’) | Exploration, development, production and sale of zinc ore | Namibia | Skorpion Zinc (Proprietary) Limited | 100.00 | 100.00 | ||||||||||
34 | Skorpion Zinc (Proprietary) Limited (‘SZPL’) | Operating (Zinc) and Investment Company | Namibia | THL Zinc Namibia Holdings (Proprietary) Limited | 100.00 | 100.00 | ||||||||||
35 | THL Zinc Namibia Holdings (Proprietary) Limited (“VNHL”) | Mining and Exploration and Investment company | Namibia | THL Zinc Ltd | 100.00 | 100.00 | ||||||||||
36 | Lakomasko BV | Investment company | Netherlands | THL Zinc Holding BV | 100.00 | 100.00 | ||||||||||
37 | Monte Cello BV (“MCBV”) | Holding Company | Netherlands | Vedanta Limited | 100.00 | 100.00 | ||||||||||
38 | THL Zinc Holding BV | Investment company | Netherlands | Vedanta Limited | 100.00 | 100.00 | ||||||||||
39 | Cairn Energy Discovery Limited2 | Oil and gas exploration, development and production | Scotland | Cairn India Holdings Limited | — | 100.00 | ||||||||||
40 | Cairn Energy Gujarat Block 1 Limited | Oil and gas exploration, development and production | Scotland | Cairn India Holdings Limited | 100.00 | 100.00 | ||||||||||
41 | Cairn Energy Hydrocarbons Limited | Oil and gas exploration, development and production | Scotland(b) | Cairn India Holdings Limited | 100.00 | 100.00 | ||||||||||
VEDANTA LIMITED | INTEGRATED REPORT AND ANNUAL ACCOUNTS 2020-21 | 365
STANDALONE CONTINUED...
Notes
forming part of the financial statements as at and for the year ended March 31, 2021
| The Company’s/Immediate holding company’s percentage holding (in %) | ||||||||||||||||
Sr. No. | Subsidiaries | Principal activities | Country of | Immediate holding company | As at 31 March 2021 | As at 31 March 2020 | ||||||||||
42 | Cairn Exploration (No. 2) Limited2 | Oil and gas exploration, development and production | Scotland | Cairn India Holdings Limited | — | 100.00 | ||||||||||
43 | Black Mountain Mining (Proprietary) Limited | Exploration, development, production and sale of zinc, lead, copper and associated mineral concentrates | South Africa | THL Zinc Ltd | 74.00 | 74.00 | ||||||||||
44 | Cairn South Africa Pty Limited4 | Oil and gas exploration, development and production | South Africa | Cairn Energy Hydrocarbons Limited | 100.00 | 100.00 | ||||||||||
45 | AvanStrate Korea Inc | Manufacturer of LCD glass substrate | South Korea | Avanstrate (Japan) Inc. | 100.00 | 100.00 | ||||||||||
46 | Cairn Lanka Private Limited | Oil and gas exploration, development and production | Sri Lanka | CIG Mauritius Private Limited | 100.00 | 100.00 | ||||||||||
47 | AvanStrate Taiwan Inc | Manufacturer of LCD glass substrate | Taiwan | Avanstrate (Japan) Inc. | 100.00 | 100.00 | ||||||||||
48 | Fujairah Gold FZC | Manufacturing of Copper Rod and Refining of Precious Metals (Gold & Silver) | United Arab Emirates | Malco Energy Limited | 100.00 | 100.00 | ||||||||||
49 | Sterlite (USA) Inc.(a) | Investment company | United States of America | Vedanta Limited | 100.00 | 100.00 | ||||||||||
50 | Ferro Alloy Corporation Limited (FACOR)(c) | Manufacturing of Ferro Alloys and Mining | India | Vedanta Limited | 100.00 | — | ||||||||||
51 | Facor Realty and Infrastructure Limited(c) | Real estate | India | FACOR | 100.00 | — | ||||||||||
52 | FACOR power Limited(c) | Power generation | India | FACOR | 90.00 | — | ||||||||||
| (a) | Under liquidation (b)Principal place of business is in India (c)Acquired with effect from 21 September 2020 |
| 1 | The Group also has interest in certain trusts which are neither significant nor material to the Group. |
| 2 | Cairn Exploration (No. 2) Limited and Cairn Energy Discovery Limited have been dissolved w.e.f. 22 September 2020 and Cairn Energy India (Pty) Ltd. w.e.f. 26 August 2020. |
| 3 | Activity of the company ceased in February 2016 |
| 4 | Cairn South Africa Pty Limited has been deregistered w.e.f. 06 April 2021. |
| b) | Joint operations |
| (%) Participating Interest | ||||||||||
Oil & Gas blocks/fields Operating Blocks | Area | As at 31 March 2021 | As at 31 March 2020 | |||||||
Ravva block-Exploration, Development and Production | Krishna Godavari | 22.50 | 22.50 | |||||||
CB-OS/2 – Exploration | Cambay Offshore | 60.00 | 60.00 | |||||||
CB-OS/2 – Development & production | Cambay Offshore | 40.00 | 40.00 | |||||||
RJ-ON-90/1 – Exploration | Rajasthan Onshore | 50.00 | 50.00 | |||||||
RJ-ON-90/1 – Development & production | Rajasthan Onshore | 35.00 | 35.00 | |||||||
KG-OSN-2009/3 – Exploration | Krishna Godavari Offshore | 100.00 | 100.00 | |||||||
Non-Operating Blocks | ||||||||||
KG-ONN-2003/1 | Krishna Godavari Onshore | 49.00 | 49.00 | |||||||
(1) South Africa Block1-Exploration was relinquished on 10 September 2019. | ||||||
366
| < BACK TO CONTENTS | Integrated Report | Statutory reports | Financial statements |
Notes
forming part of the financial statements as at and for the year ended March 31, 2021
| c) | Interest in associates and joint ventures |
Set out below are the associates and joint ventures of the Company as at 31 March 2021 which, in the opinion of the management, are not material to the Company. The country of incorporation or registration is also their principal place of business, and the proportion of ownership interest is the same as the proportion of voting rights held.
| % Ownership interest | ||||||||||
Sr. No. | Associates | Country of | As at 31 March 2021 | As at | ||||||
| 1 | RoshSkor Township (Pty) Limited | Namibia | 50.00 | 50.00 | ||||||
| 2 | Gaurav Overseas Private Limited | India | 50.00 | 50.00 | ||||||
| 3 | Raykal Aluminium Company Private Limited | India | 24.50 | 24.50 | ||||||
| 4 | Rampia Coal Mines and Energy Private Limited(a) | India | 17.39 | 17.39 | ||||||
| (a) | Struck off by the Ministry of Corporate affairs on 19 April 2021 |
| % Ownership interest | ||||||||||
Sr. | Jointly controlled entities | Country of | As at 31 March 2021 | As at | ||||||
| 1 | Madanpur South Coal Company Limited | India | 17.62 | 17.62 | ||||||
| 2 | Goa Maritime Private Limited | India | 50.00 | 50.00 | ||||||
| 3 | Rosh Pinah Health Care (Proprietary) Limited | Namibia | 69.00 | 69.00 | ||||||
| 4 | Gergarub Exploration and Mining (Pty) Limited | Namibia | 51.00 | 51.00 | ||||||
40 (a) The Company has incurred an amount of ₹39 Crore (31 March 2020: ₹53 Crore) towards Corporate Social Responsibility (CSR) as per Section 135 of the Companies Act, 2013 and is included in other expenses:
| (₹ in Crore) | ||||||||||||||||
| Year ended 31 March 2021 | Year ended 31 March 2020 | |||||||||||||||
Particulars | In- Cash | Yet to be Paid in Cash | In- Cash | Yet to be Paid in Cash | ||||||||||||
(a) Gross amount required to be spend by the Company during the year | 17 | 13 | ||||||||||||||
(b) Amount approved by the Board to be spent during the year | 45 | 137 | ||||||||||||||
(c) Amount spent on: * | ||||||||||||||||
i) Construction/acquisition of assets | — | — | — | — | ||||||||||||
ii) On purposes other than (i) above (for CSR projects) | 34 | 5 | 39 | 14 | ||||||||||||
Total | 34 | 5 | 39 | 14 | ||||||||||||
| * | includes ₹15 Crore (31 March 2020: ₹25 Crore) paid to related party (Refer note 37). |
| In case of Section 135(5) of Companies Act, 2013 | ||||||||||||
Opening Balance | Amount required to be spent during the year | Amount spent during the year | Closing Balance | |||||||||
0 | 17 | 39 | 22 | * | ||||||||
| * | Asset has not been recognised on the amount spent in excess of CSR Liability |
VEDANTA LIMITED | INTEGRATED REPORT AND ANNUAL ACCOUNTS 2020-21 | 367
STANDALONE CONTINUED...
Notes
forming part of the financial statements as at and for the year ended March 31, 2021
| (b) | Disclosures under Section 22 of the Micro, Small and Medium Enterprises Development Act 2006 |
| (₹ in crores) | ||||||||||
Particulars |
| Year ended 31 March 2021 | Year ended 31 March 2020 | |||||||
(i) | Principal amount remaining unpaid to any supplier as at the end of the accounting year | 205 | 182 | |||||||
(ii) | Interest due thereon remaining unpaid to any supplier as at the end of the accounting year | 4 | — | |||||||
(iii) | The amount of interest paid along with the amounts of the payment made to the supplier beyond the appointed day | — | — | |||||||
(iv) | The amount of interest due and payable for the year | — | — | |||||||
(v) | The amount of interest accrued and remaining unpaid at the end of the accounting year | — | — | |||||||
(vi) | The amount of further interest due and payable even in the succeeding year, until such date when the interest dues as above are actually paid | — | — | |||||||
| (c) | Loans and Advance(s) in the nature of Loan (Regulation 34 (3) and 53 (f) read together with Para A of Schedule V of Listing Obligations & Disclosure Requirements): |
| (₹ in Crore) | ||||||||||||
(a) | Name of the Company | Relationship | Balance as at 31 March 2021 | Maximum | Balance as at | |||||||
Sterlite Iron and Steel Company Limited (Refer note 37(e)) | Fellow Subsidiary | — | 5 | 5 | ||||||||
Vizag General Cargo Berth Private Limited | Wholly owned Subsidiary | 425 | 425 | — | ||||||||
Sesa Resources Limited | Wholly owned Subsidiary | 68 | 87 | 87 | ||||||||
Sterlite Ports Limited | Wholly owned Subsidiary | 4 | 4 | 4 | ||||||||
Paradip Multi Cargo Berth Private Limited | Wholly owned Subsidiary | 0 | 0 | 0 | ||||||||
Sesa Mining Corporation Limited | Wholly owned Subsidiary | — | 45 | 45 | ||||||||
ESL Steel Limited | Wholly owned Subsidiary | 183 | 197 | 197 | ||||||||
Talwandi Sabo Power Limited | Wholly owned Subsidiary | — | 1,440 | 1,440 | ||||||||
| Ferro Alloys Corporation Limited | Wholly owned Subsidiary | 22 | 22 | — | ||||||||
| (a) | None of the loanee have made, per se, investment in the shares of the Company. |
| (b) | Investments made by Sterlite Ports Limited in Maritime Ventures Private Limited – 10,000 equity shares and Goa Sea Port – 50,000 equity shares |
Investments made by Sesa Resources Limited in Sesa Mining Corporation Limited – 11,50,000 equity shares and Goa Maritime Private Limited- 5,000 Shares
| 41 | OIL & GAS RESERVES AND RESOURCES |
The Company’s gross reserve estimates are updated atleast annually based on the forecast of production profiles, determined on an asset-by-asset basis, using appropriate petroleum engineering techniques. The estimates of reserves and resources have been derived in accordance with the Society for Petroleum Engineers “Petroleum Resources Management System (2018)”. The changes to the reserves are generally on account of future development projects, application of technologies such as enhanced oil recovery techniques and true up of the estimates. The management’s internal estimates of hydrocarbon reserves and resources at the year end, are as follows:
368
| < BACK TO CONTENTS | Integrated Report | Statutory reports | Financial statements |
Notes
forming part of the financial statements as at and for the year ended March 31, 2021
| Gross proved and probable | Gross proved and probable | Net working interest proved | ||||||||||||||||||||||||||
| hydrocarbons initially in place | reserves and resources | and probable reserves and | ||||||||||||||||||||||||||
| (mmboe) | (mmboe) | resources (mmboe) | ||||||||||||||||||||||||||
| As at | As at | As at | As at | As at | As at | |||||||||||||||||||||||
Particulars | Country | 31 March 2021 | 31 March 2020 | 31 March 2021 | 31 March 2020 | 31 March 2021 | 31 March 2020 | |||||||||||||||||||||
Rajasthan MBA Fields | India | 2,307 | 2,288 | 266 | 317 | 93 | 111 | |||||||||||||||||||||
Rajasthan MBA EOR | India | — | — | 388 | 317 | 136 | 111 | |||||||||||||||||||||
Rajasthan Block Other Fields | India | 3,603 | 3,535 | 470 | 449 | 164 | 157 | |||||||||||||||||||||
Ravva Fields | India | 704 | 692 | 27 | 28 | 6 | 6 | |||||||||||||||||||||
CBOS/2 Fields | India | 298 | 292 | 34 | 40 | 14 | 16 | |||||||||||||||||||||
Other fields | India | 352 | 348 | 44 | 43 | 26 | 25 | |||||||||||||||||||||
Total | 7,264 | 7,155 | 1,229 | 1,194 | 439 | 426 | ||||||||||||||||||||||
The Company’s net working interest proved and probable reserves is as follows:
| Proved and probable reserves | Proved and probable reserves | |||||||||||||||
| (developed) | ||||||||||||||||
| Oil | Gas | Oil | Gas | |||||||||||||
Particulars | (mmstb) | (bscf) | (mmstb) | (bscf) | ||||||||||||
Reserves as of 31 March 2019* | 164 | 140 | 94 | 71 | ||||||||||||
Additions / (revision) during the year | 12 | 30 | 12 | 20 | ||||||||||||
Production during the year | (20 | ) | (13 | ) | (20 | ) | (13 | ) | ||||||||
Reserves as of 31 March 2020** | 156 | 157 | 86 | 78 | ||||||||||||
Additions / (revision) during the year | (6 | ) | (8 | ) | 15 | 25 | ||||||||||
Production during the year | (18 | ) | (16 | ) | (18 | ) | (16 | ) | ||||||||
Reserves as of 31 March 2021*** | 132 | 133 | 83 | 87 | ||||||||||||
| * | Includes probable oil reserves of 60.77 mmstb (of which 9.80 mmstb is developed) and probable gas reserves of 47.86 bscf (of which 15.07 bscf is developed) |
| ** | Includes probable oil reserves of 67.78 mmstb (of which 12.36 mmstb is developed) and probable gas reserves of 59.36 bscf (of which 23.29 bscf is developed) |
| *** | Includes probable oil reserves of 56.83 mmstb (of which 12.80 mmstb is developed) and probable gas reserves of 65.39 bscf (of which 27.22 bscf is developed) |
mmboe = million barrels of oil equivalent
mmstb = million stock tank barrels
bscf = billion standard cubic feet
1 million metric tonnes = 7.4 mmstb
1 standard cubic meter =35.315 standard cubic feet
MBA = Mangala, Bhagyam & Aishwarya
EOR = Enhanced Oil Recovery
VEDANTA LIMITED | INTEGRATED REPORT AND ANNUAL ACCOUNTS 2020-21 | 369
STANDALONE CONTINUED...
Notes
forming part of the financial statements as at and for the year ended March 31, 2021
| 42 | OTHER MATTERS |
| a) | The Company is purchasing bauxite under long term linkage arrangement with Orissa Mining Corporation Ltd (hereafter referred as OMC) at provisional price of ₹1,000/MT from October 2020 onwards based on interim order dated 08 October 2020 of the Hon’ble High Court of Odisha, which is subject to final outcome of the writ petition filed by the Company as mentioned below. |
The last successful e-auction based price discovery was done by OMC in April 2019 at INR 673/MT and supplied bauxite at this rate from Sep 2019 to Sep 2020 against an undertaking furnished by the Company to compensate any differential price discovered through future successful national e-auctions. Though OMC conducted the next e-auction on 31 August 2020 with floor price of ₹1,707/MT determined on the basis of Rule 45 of Minerals Concession Rules, 2016 (hereafter referred as the Rules), no bidder participated at that floor price and hence the auction was not successful. However, OMC raised demand of ₹281 Crore on the Company towards differential pricing and interest for bauxite supplied till Sep 2020 considering the auction base price of INR 1,707/MT.
The Company had then filed a writ petition before Hon’ble High Court of Odisha in September 2020 for resumption of bauxite supply in accordance with applicable Government of Odisha Gazette notification dated 24 February 2018. Hon’ble High Court has issued interim Order dated 08 October 2020 directing that the petitioner shall be permitted to lift the quantity of bauxite mutually agreed under the terms of the long-term linkage arrangement for the remaining period of the financial year 2020- 21 on payment of ₹1,000/MT and furnishing an undertaking for the differential amount, with the floor price arrived at by OMC under the rules, along with applicable interest, subject to final outcome of the writ petition.
OMC re-conducted e-auction on March 9, 2021 with floor price of ₹2,011/MT determined on the basis of the Rules. However, again as no bidder participated at that floor price, the auction was not successful. On 18th Mar-21, Cuttack HC issued an order disposing off the writ petition, directing that the current arrangement of bauxite price @ 1000/T will continue for the FY 2021-22.
Supported by legal opinions obtained, management believes that the provisions of Rule 45 of Minerals Concession Rules, 2016 are not applicable to commercial sale of bauxite ore and hence, it is not probable that the Company will have any financial obligation towards the aforesaid commitments over and above the price of ₹673/MT discovered vide last successful e-auction. Accordingly, the Company has not recognised above referred OMC debit note of ₹281 Crore in respect of bauxite procured till September 2020 and further differential price of ₹130 Crore for subsequent procurements from 01 October 2020 till 31 March 2021.
However, as an abundant precaution, the company has recognised purchase of Bauxite from October 2020 onwards at the at the aforesaid rate of INR 1,000/MT in line with the Odisha High court interim order dated 08 October 2020.
| b) | In terms of various notifications issued by the Ministry of Environment, Forest and Climate Change (MoEF&CC), ash produced from thermal power plant is required to be disposed of by the Company in the manner specified in those notifications. However compliance with manner of disposal as specified in those notifications is not fully achieved due to lack of demand from user agencies side. Consequently, the Company is storing the ash produced in ash dyke in accordance with conditions of the Environmental Clearance & Consent to Operate granted by the MOEF&CC, Office of State Pollution Control Board (OSPCB) & Chhattisgarh Environment Conservation Board (CECB) respectively as well as supplying the same to user agencies. Management believes storage of ash in ash dykes/ ash pond in accordance with environmental clearances received by the Company are sufficient compliance with the applicable notifications issued by MoEF&CC which is supported by a legal opinion obtained. |
The National Green Tribunal (NGT) has also taken cognizance of the matter and vide its order dated 12 February 2020 has ordered for levy of environmental compensation on generating companies on account of their failure to comply the aforesaid notifications. The Company has filed SLPs before the Hon’ble Supreme Court challenging
370
| < BACK TO CONTENTS | Integrated Report | Statutory reports | Financial statements |
Notes
forming part of the financial statements as at and for the year ended March 31, 2021
the order of the NGT and the same was heard by the Court on 11 September 2020 and granted an ad interim stay against recoveries in pursuance of NGT order. Management believes that the outcome of the appeal will not have any significant adverse financial impact on the Company which is supported by a legal opinion obtained.
| (c | ) Ministry of Environment, Forest and Climate Change (“MOEF&CC”) has revised emission norms for coal- based power plants in India Accordingly, both captive and independent coal-based power plants in India are required to comply with these revised norms for reduction of sulphur oxide (SOx) emissions for which the current plant infrastructure is to be modified or new equipments have to be installed. The regulatory authorities vide notification dated 31 March 2021 have extended the timelines and now power plants of Vedanta Limited is required to comply with the norms by December 2024. |
| (d) | During the current year, the Company entered into a ₹10,000 Crore long-term syndicated loan facility agreement. This loan is secured by the way of pledge over the shares held by the Company in Hindustan Zinc Limited (HZL) representing 14.82% of the paid up share capital of HZL along-with a non-disposal undertaking in respect of its shareholding in HZL to the extent of 50.1% of the paid up share capital of HZL. As at 31 March 2021 the principal amount participated for and outstanding under the facility is ₹8,650 Crore. |
| As per our report of even date | For and on behalf of the Board of Directors | |||
| For S.R. Batliboi & Co. LLP | Navin Agarwal | Sunil Duggal | ||
| Chartered Accountants | Executive Vice-Chairman and | Whole-Time Director and | ||
| ICAI Firm Registration No. 301003E/ | Whole-Time Director | Chief Executive Officer | ||
| E300005 | DIN 00006303 | DIN 07291685 | ||
| per Sudhir Soni | Prerna Halwasiya | |||
| Partner | Company Secretary and Compliance Officer | |||
| Membership No: 41870 | ICSI Membership No. A20856 | |||
| Place: Mumbai | Place: New Delhi | |||
| Date: 13 May 2021 | Date: 13 May 2021 | |||
VEDANTA LIMITED | INTEGRATED REPORT AND ANNUAL ACCOUNTS 2020-21 | 371
CONSOLIDATED
FINANCIAL
STATEMENTS
372
| < BACK TO CONTENTS | Integrated Report | Statutory reports | Financial statements |
Independent Auditor’s Report
To the Members of Vedanta Limited
REPORT ON THE AUDIT OF THE CONSOLIDATED IND AS FINANCIAL STATEMENTS
OPINION
We have audited the accompanying consolidated Ind AS financial statements of Vedanta Limited (hereinafter referred to as “the Holding Company”), its subsidiaries (the Holding Company and its subsidiaries together referred to as “the Group”) its associates and joint ventures comprising of the consolidated Balance sheet as at 31 March 2021, the consolidated Statement of Profit and Loss, including other comprehensive income, the consolidated Cash Flow Statement and the consolidated Statement of Changes in Equity for the year then ended, and notes to the consolidated Ind AS financial statements, including a summary of significant accounting policies and other explanatory information (hereinafter referred to as “the consolidated Ind AS financial statements”).
In our opinion and to the best of our information and according to the explanations given to us and based on the consideration of reports of other auditors on separate financial statements and on the other financial information of the subsidiaries, associates and joint ventures, the aforesaid consolidated Ind AS financial statements give the information required by the Companies Act, 2013, as amended (“the Act”) in the manner so required and give a true and fair view in conformity with the accounting principles generally accepted in India, of the consolidated state of affairs of the Group, its associates and joint ventures as at 31 March 2021, their consolidated profit including other comprehensive income, their consolidated cash flows and the consolidated statement of changes in equity for the year ended on that date.
BASIS FOR OPINION
We conducted our audit of the consolidated Ind AS financial statements in accordance with the Standards on Auditing (SAs), as specified under Section 143(10) of the Act. Our responsibilities under those Standards are further described in the ‘Auditor’s Responsibilities for the Audit of the Consolidated Ind AS Financial Statements’ section of our report. We are independent of the Group, its associates and joint ventures in accordance with the ‘Code of Ethics’ issued by the Institute of Chartered Accountants of India together with the ethical requirements that are relevant to our audit of the financial statements under the provisions of the Act and the Rules thereunder, and we have fulfilled our other ethical responsibilities in accordance with these requirements and the Code of Ethics. We believe that the audit evidence we have obtained is sufficient and appropriate to provide a basis for our audit opinion on the consolidated Ind AS financial statements.
EMPHASIS OF MATTER
We draw attention to note 3(c)(A)(viii) of the accompanying consolidated Ind AS financial statements which describes the uncertainty arising out of the demands that have been raised on the Group, with respect to government’s share of profit oil by the Director General of Hydrocarbons and one of the pre-conditions for the extension of the Production Sharing Contract (PSC) for the Rajasthan oil block is the settlement of these demands. While the Government has granted permission to the Group to continue operations in the block till 31 July 2021 or signing of the PSC addendum, whichever is earlier, the Group, based on external legal advice, believes it is in compliance with the necessary conditions to secure an extension of this PSC and that the demands are untenable and hence no provision is required in respect of these demands. Our opinion is not modified in respect of this matter.
KEY AUDIT MATTERS
Key audit matters are those matters that, in our professional judgement, were of most significance in our audit of the consolidated Ind AS financial statements for the financial year ended 31 March 2021. These matters were addressed in the context of our audit of the consolidated Ind AS financial statements as a whole, and in forming our opinion thereon, and we do not provide a separate opinion on these matters. For each matter below, our description of how our audit addressed the matter is provided in that context.
We have determined the matters described below to be the key audit matters to be communicated in our report. We have fulfilled the responsibilities described in the Auditor’s responsibilities for the audit of the consolidated Ind AS financial statements section of our report, including in relation to these matters. Accordingly, our audit included the performance of procedures designed to respond to our assessment of the risks of material misstatement of the consolidated Ind AS financial statements. The results of audit procedures performed by us and by other auditors of components not audited by us, as reported by them in their audit reports furnished to us by the management, including those procedures performed to address the matters below, provide the basis for our audit opinion on the accompanying consolidated Ind AS financial statements.
VEDANTA LIMITED | INTEGRATED REPORT AND ANNUAL ACCOUNTS 2020-21 | 373
CONSOLIDATED
Key audit matters | How our audit addressed the key audit matter | |
| Recoverability of carrying value of property plant and equipment at Tuticorin (as described in note 3(c)(A)(vii) of the consolidated Ind AS financial statements) | ||
As at 31 March 2021, the Group had significant amounts of property, plant and equipment, capital work-in- progress and exploration intangible assets under development which were carried at historical cost less depreciation.
We focused our efforts on the Cash Generating Unit (“CGU”) at Tuticorin within the copper segment as it had identified impairment indicators and had a total carrying value of ₹2,144 crores.
Recoverability of property plant and equipment has been identified as a key audit matter due to:
• The significance of the carrying value of assets being assessed.
The withdrawal of the Holding Company’s licenses to operate the copper plant.
• The fact that the assessment of the recoverable amount of the Group’s CGU involves significant judgements about the future cash flow forecasts, start date of the plant and the discount rate that is applied.
The key judgements and estimates centered on the likely outcome of the litigations, cash flow forecasts and discount rate assumptions. | Audit procedures included the following:
• Assessed through an analysis of internal and external factors impacting the Company, whether there were any indicators of impairment in line with Ind AS 36.
• Specifically, in relation to the CGU at Tuticorin where impairment indicators were identified, obtained and evaluated the valuation models used to determine the recoverable amount by assessing the key assumptions used by management, which included:
- Assessed the basis for estimating the forecasted volumes and the expected start date of the plant.
- Tested the inputs used to compute the weighted average cost of capital used to discount the impairment model.
- Tested the valuation models for arithmetical accuracy.
- Engaged valuation experts to assist in performance of some of the above procedures.
- Assessed the implications of withdrawal of Company’s license to operate the copper plant including sensitivities of key assumptions. Also, read the court judgement s in respect of the case and external legal opinions in respect of the merits of the appeal filed by the Company and assessed management’s position through discussions with the legal counsel to determine the basis of their conclusion.
• Assessed the competence and objectivity of the experts engaged by us.
• Assessed the disclosures made by the Group in this regard. | |
| Evaluation of Going Concern assumption of accounting (as described in note 3(c)(A)(xii) and 3(c)(A)(viii) of the consolidated Ind AS financial statements) | ||
The consolidated financial statements of the Group are prepared on the going concern basis of accounting. The evaluation of the appropriateness of adoption of going concern assumption for preparation of these consolidated financial statements performed has been performed by the management of the Group because of uncertainties in the market conditions including future economic outlook on account of the prevailing global pandemic COVID-19 and the uncertainty around the extension of the Production Sharing Contract (PSC) of the Rajasthan oil and gas block.
The Group has prepared a cash flow forecast for next eighteen months from year end which involves judgement and estimation of key variables.
The above has been considered as a key audit matter as auditing the Group’s going concern assessment as described above is complex and involves a high degree of judgement to assess the reasonableness of the cash flow forecasts, planned refinancing actions and other assumptions used in the Group’s going concern analysis. | Audit procedures in relation to evaluation of going concern included the following:
• Obtained an understanding of the process followed by the management and tested the internal controls over the liquidity assessment, compliance with the debt covenants and preparation of the cash flow forecast, and validation of the assumptions and inputs used in the model to estimate the future cash flows.
• Tested the inputs and assumptions used by the management in the cash flow forecast against historical performance, budgets, economic and industry indicators, publicly available information, the Group’s strategic plans and benchmarking of key market related conditions.
• Assessed the key assumptions including those pertaining to revenue and the timing of significant payments in the cash flow forecast for the following eighteen months.
• Tested management’s sensitivity analysis on key assumptions like input prices, discount rate and selling prices to determine their impact on the projections of future cash flows also on any possible cash outgo for securing the extension of the Rajasthan oil and gas block.
• Compared the details of the Group’s long-term credit facilities to the supporting documentation.
• Assessed the relationship between the parent company and the Group including inspection of various financings agreements to examine whether the same were impacted by the affairs of the parent company. Additionally, we assessed whether there are any pre-existing arrangements between the parent and the Group to alleviate the financial difficulties of the parent.
• Assessed the disclosures made by the Group in this regard. | |
374
| < BACK TO CONTENTS | Integrated Report | Statutory reports | Financial statements |
Key audit matters | How our audit addressed the key audit matter | |
| Recoverability of disputed trade receivables in Power segment (as described in note 3(c)(B)(iii) and note 8 of the consolidated Ind AS financial statements) | ||
As of 31 March 2021 the value of disputed receivables in the power segment aggregated to ₹3,206 crores.
Due to disagreements over the quantification or timing of the receivables with customers, the recovery of said receivables are subject to increased risk. Some of these balances are also subject to litigation. The risk is specifically related to receivables from Punjab State Power Corporation Limited (PSPCL), GRIDCO and Tamil Nadu Electricity Board. These receivables include long outstanding balances as well and are also subject to counter party credit risk and hence considered as a key audit matter. | Audit procedures included the following:
• Examined the underlying power purchase agreements.
• Examined the relevant state regulatory commission, appellate tribunal and court rulings.
• Examined external legal opinions in respect of the merits of the case and assessed management’s position through discussions with the management’s in-house legal team to determine the basis of their conclusion.
• Examined management’s assessment of recoverability of receivables.
• Obtained independent external lawyer confirmation from Legal Counsel of the Group who is contesting the cases.
• Assessed the competence and objectivity of the Group’s experts.
• Assessed the disclosures made by the Group in this regard. | |
Accounting and disclosure of transactions with the parent company and its affiliates (as described in note 40(H), 40(I), 40(L), 40(M) and 40(N) of the consolidated Ind AS financial statements) | ||
The Group has undertaken transactions with Vedanta Resources Limited (‘VRL’), its parent company and its affiliates pertaining to extension of loans and guarantees; payment of brand and management fee; obtaining guarantees and payment of commission in consideration thereof; and payment of transaction costs associated to the sale of structured investment.
Accounting and disclosure of such related party transactions has been identified as a key audit matter due to:
• Significance of such related party transactions;
• Risk of such transactions being executed without proper authorisations;
• Judgments and estimation involved in determination of fair value on initial recognition of loans and guarantees given and expected credit losses on subsequent measurement; and
• Risk of material information relating to such transactions not getting disclosed in the financial statements. | Audit procedures included the following:
• Obtained and read the Group’s policies, processes and procedures in respect of identification of such related parties, obtaining approval, recording and disclosure of related party transactions.
• Tested such related party transactions and balances with the underlying contracts, confirmation letters and other supporting documents provided by the Company.
• Obtained and assessed the reports issued by experts engaged by the management for estimation of initial fair value of loans and guarantees granted by it to VRL and its affiliates. We also tested the methodology adopted by the Group for determination of subsequent credit losses on such loans. We engaged valuation experts to assist us in performing the said procedures.
• Assessed the competence and objectivity of the external experts engagement by the Company and experts engaged by us.
• Held discussions and obtained representations from the management in relation to such transactions.
• Examined the approvals of the board and/or audit committee for entering into these transactions.
• Read the disclosures made in this regard in the financial statements to assess whether relevant and material information have been disclosed. | |
Claims and exposures relating to taxation and litigation (as described in note 3(c)(B)(ii), 3(c)(A)(viii), 35(e),38(D) and 39 of the consolidated Ind AS financial statements) | ||
The Group is subject to a large number of tax and legal disputes, including objections raised by auditors appointed by the Director General Hydrocarbons in the oil and gas segment, which have been disclosed/ provided for in the financial statements based on the facts and circumstances of each case.
Taxation and litigation exposures have been identified as a key audit matter due to the complexities involved in these matters, timescales involved for resolution and the potential financial impact of these on the financial statements. Further, significant management judgement is involved in assessing the exposure of each case and thus a higher risk involved on adequacy of provision or disclosure of such cases. | Audit procedures included the following:-
• Obtained an understanding of the process of identification of claims, litigations and contingent liabilities and identified key controls in the process. For selected controls we have performed tests of controls.
• Obtained the summary of Group’s legal and tax cases and critically assessed management’s position through discussions with the Legal Counsel, Head of Tax and operational management, on both the probability of success in significant cases, and the magnitude of any potential loss.
• Examined external legal opinions (where considered necessary) and other evidence to corroborate management’s assessment of the legal claims.
• Assessed the competence and objectivity of the Company’s experts.
• Engaged tax specialists to technically appraise the tax positions taken by management with respect to local tax issues. | |
VEDANTA LIMITED | INTEGRATED REPORT AND ANNUAL ACCOUNTS 2020-21 | 375
CONSOLIDATED CONTINUED...
| Key audit matters | How our audit addressed the key audit matter | |
• Assessed whether management assessment of similar cases is consistent across the divisions and obtained management’s explanations for differences, if any.
• Assessed the relevant disclosures made within the financial statements to address whether they reflect the facts and circumstances of the respective tax and legal exposures and the requirements of relevant accounting standards. | ||
| Recognition and measurement of Deferred Tax Assets including Minimum Alternate Tax (MAT) (as described in note 3(c)(A)(vi) and 35 of the consolidated Ind AS financial statements) | ||
Deferred tax assets as at 31 March 2021 includes MAT credits of ₹8,232 crores which is available for utilisation against future tax liabilities. Of the same, we focused our efforts on MAT assets of ₹3,701 crores which belong to the Holding company out of which ₹340 crores is expected to be utilised in the fourteenth year, fifteen years being the maximum permissible time period to utilise the same.
Additionally, ESL Steel Limited, one of the constituents of the Group, has recognised deferred tax assets of ₹3,184 crores during the current year.
The analysis of the recognition and recoverability of such deferred tax assets has been identified as a key audit matter because the assessment process involves judgement regarding the future profitability and likelihood of the realisation of these assets, in particular whether there will be taxable profits in future periods that support the recognition of these assets. This requires assumptions regarding future profitability, which is inherently uncertain. Accordingly, the same is considered as a key audit matter. | Audit procedures included the following:-
• Obtained an understanding of the management’s process for estimating the recoverability of deferred tax assets and identified key controls in the process. For selected controls we have performed tests of controls.
• Obtained and analysed the future projections of taxable profits estimated by management assessed key assumptions used, including the analysis of the consistency of the actual results obtained by the various segments with those projected in the previous year. We further obtained evidence of the approval of the budgeted results included in the current year’s projections, and the future cash flow projections.
• Tested the computation of the amounts recognised as deferred tax assets.
• Assessed the disclosures made by the Group in this regard. | |
We have determined that there are no other key audit matters to communicate in our report.
INFORMATION OTHER THAN THE FINANCIAL STATEMENTS AND AUDITOR’S REPORT THEREON
The Holding Company’s Board of Directors is responsible for the other information. The other information comprises the information included in the Annual report, but does not include the consolidated financial statements and our auditor’s report thereon.
Our opinion on the consolidated financial statements does not cover the other information and we do not express any form of assurance conclusion thereon.
In connection with our audit of the consolidated financial statements, our responsibility is to read the other information and, in doing so, consider whether such other information is materially inconsistent with the consolidated financial statements or our knowledge obtained in the audit or otherwise appears to be materially misstated. If, based on the work we have performed, we conclude that there is a material misstatement of this other information, we are required to report that fact. We have nothing to report in this regard. | RESPONSIBILITIES OF MANAGEMENT AND THOSE CHARGED WITH GOVERNANCE FOR THE CONSOLIDATED IND AS FINANCIAL STATEMENTS
The Holding Company’s Board of Directors is responsible for the preparation and presentation of these consolidated Ind AS financial statements in terms of the requirements of the Act that give a true and fair view of the consolidated financial position, consolidated financial performance including other comprehensive income, consolidated cash flows and consolidated statement of changes in equity of the Group including its associates and joint ventures in accordance with the accounting principles generally accepted in India, including the Indian Accounting Standards (Ind AS) specified under Section 133 of the Act read with the Companies (Indian Accounting Standards) Rules, 2015, as amended. The respective Board of Directors of the companies included in the Group and of its associates and joint ventures are responsible for maintenance of adequate accounting records in accordance with the provisions of the Act for safeguarding of the assets of the Group and of its associates and joint ventures and for preventing and detecting frauds and other irregularities; selection and application of appropriate accounting policies; making judgements and estimates that are reasonable and prudent; and the design, implementation and maintenance of adequate internal financial controls, that were operating effectively for ensuring the accuracy and completeness of the accounting records, relevant to the preparation and presentation of the consolidated Ind AS financial statements that give a true and fair view and are free from material misstatement, whether due to fraud or error, which have been used for the purpose of preparation of the consolidated Ind AS financial statements by the Directors of the Holding Company, as aforesaid. | |
376
| < BACK TO CONTENTS | Integrated Report | Statutory reports | Financial statements |
In preparing the consolidated Ind AS financial statements, the respective Board of Directors of the companies included in the Group and of its associates and joint ventures are responsible for assessing the ability of the Group and of its associates and joint ventures to continue as a going concern, disclosing, as applicable, matters related to going concern and using the going concern basis of accounting unless management either intends to liquidate the Group or to cease operations, or has no realistic alternative but to do so.
Those respective Board of Directors of the companies included in the Group and of its associates and Joint ventures are also responsible for overseeing the financial reporting process of the Group and of its associates and joint ventures.
AUDITOR’S RESPONSIBILITIES FOR THE AUDIT OF THE CONSOLIDATED IND AS FINANCIAL STATEMENTS
Our objectives are to obtain reasonable assurance about whether the consolidated Ind AS financial statements as a whole are free from material misstatement, whether due to fraud or error, and to issue an auditor’s report that includes our opinion. Reasonable assurance is a high level of assurance, but is not a guarantee that an audit conducted in accordance with SAs will always detect a material misstatement when it exists. Misstatements can arise from fraud or error and are considered material if, individually or in the aggregate, they could reasonably be expected to influence the economic decisions of users taken on the basis of these consolidated Ind AS financial statements.
As part of an audit in accordance with SAs, we exercise professional judgement and maintain professional skepticism throughout the audit. We also:
| • | Identify and assess the risks of material misstatement of the consolidated Ind AS financial statements, whether due to fraud or error, design and perform audit procedures responsive to those risks, and obtain audit evidence that is sufficient and appropriate to provide a basis for our opinion. The risk of not detecting a material misstatement resulting from fraud is higher than for one resulting from error, as fraud may involve collusion, forgery, intentional omissions, misrepresentations, or the override of internal control. |
| • | Obtain an understanding of internal control relevant to the audit in order to design audit procedures that are appropriate in the circumstances. Under Section 143(3)(i) of the Act, we are also responsible |
for expressing our opinion on whether the Holding Company has adequate internal financial controls with reference to financial statements in place and the operating effectiveness of such controls. |
| • | Evaluate the appropriateness of accounting policies used and the reasonableness of accounting estimates and related disclosures made by management. |
| • | Conclude on the appropriateness of management’s use of the going concern basis of accounting and, based on the audit evidence obtained, whether a material uncertainty exists related to events or conditions that may cast significant doubt on the ability of the Group and its associates and joint ventures to continue as a going concern. If we conclude that a material uncertainty exists, we are required to draw attention in our auditor’s report to the related disclosures in the consolidated Ind AS financial statements or, if such disclosures are inadequate, to modify our opinion. Our conclusions are based on the audit evidence obtained up to the date of our auditor’s report. However, future events or conditions may cause the Group and its associates and joint ventures to cease to continue as a going concern. |
| • | Evaluate the overall presentation, structure and content of the consolidated Ind AS financial statements, including the disclosures, and whether the consolidated Ind AS financial statements represent the underlying transactions and events in a manner that achieves fair presentation. |
| • | Obtain sufficient appropriate audit evidence regarding the financial information of the entities or business activities within the Group and its associates and joint ventures of which we are the independent auditors and whose financial information we have audited, to express an opinion on the consolidated Ind AS financial statements. We are responsible for the direction, supervision and performance of the audit of the financial statements of such entities included in the consolidated financial statements of which we are the independent auditors. For the other entities included in the consolidated Ind AS financial statements, which have been audited by other auditors, such other auditors remain responsible for the direction, supervision and performance of the audits carried out by them. We remain solely responsible for our audit opinion. |
We communicate with those charged with governance of the Holding Company and such other entities included in the consolidated Ind AS financial statements of which we are the independent auditors regarding, among other matters, the planned scope and timing of the audit and significant audit findings, including any significant deficiencies in internal control that we identify during our audit.
VEDANTA LIMITED | INTEGRATED REPORT AND ANNUAL ACCOUNTS 2020-21 | 377
CONSOLIDATED CONTINUED...
We also provide those charged with governance with a statement that we have complied with relevant ethical requirements regarding independence, and to communicate with them all relationships and other
matters that may reasonably be thought to bear on our independence, and where applicable, related safeguards.
From the matters communicated with those charged with governance, we determine those matters that were of most significance in the audit of the consolidated Ind AS financial statements for the financial year ended 31 March 2021 and are therefore the key audit matters. We describe these matters in our auditor’s report unless law or regulation precludes public disclosure about the matter or when, in extremely rare circumstances, we determine that a matter should not be communicated in our report because the adverse consequences of doing so would reasonably be expected to outweigh the public interest benefits of such communication.
OTHER MATTER
(a) We did not audit the financial statements and other financial information, in respect of 16 subsidiaries, whose Ind AS financial statements include total assets of ₹22,617 crores as at 31 March 2021, and total revenues of ₹7,956 crores and net cash outflows of ₹142 crores for the year ended on that date. These Ind AS financial statement and other financial information have been audited by other auditors, which financial statements, other financial information and auditor’s reports have been furnished to us by the management. The consolidated Ind AS financial statements also include the Group’s share of net profit of ₹Nil for the year ended 31 March 2021, as considered in the consolidated Ind AS financial statements, in respect of 1 associate and 1 joint venture whose financial statements, other financial information have been audited by other auditors and whose reports have been furnished to us by the Management. Our opinion on the consolidated Ind AS financial statements, in so far as it relates to the amounts and disclosures included in respect of these subsidiaries, associate and joint venture our report in terms of sub-Sections (3) of Section 143 of the Act, in so far as it relates to the aforesaid subsidiaries, and associate, is based solely on the report(s) of such other auditors.
Certain of these subsidiaries, associate and joint venture are located outside India whose financial statements and other financial information have been prepared in accordance with accounting principles generally accepted in their respective countries and which have been audited by other auditors under generally accepted auditing standards applicable in their respective countries. The Holding Company’s management has converted the financial statements of such subsidiaries and associate located outside India from accounting principles generally accepted in their respective countries to accounting principles generally accepted in India. We have audited these conversion adjustments made by the Holding Company’s management. Our opinion in so far as it relates to the balances and affairs of such subsidiaries, associate and joint venture located outside India is based on the report of other auditors and the conversion adjustments prepared by the management of the Holding Company and audited by us.
(b) The accompanying consolidated Ind AS financial statements include unaudited financial statements and other unaudited financial information in respect of 3 subsidiaries whose financial statements and other financial information reflect total assets of ₹2,108 crores as at 31 March 2021, and total revenues of ₹317 crores and net cash outflows of ₹5 crores for the year ended on that date. These unaudited financial statements and other unaudited financial information have been furnished to us by the management. The consolidated Ind AS financial statements also include the Group’s share of net profit of ₹Nil for the year ended 31 March 2021, as considered in the consolidated Ind AS financial statements, in respect of 1 associate and 3 joint ventures, whose financial statements other financial information have not been audited and whose unaudited financial statements and other unaudited financial information have been furnished to us by the Management. The consolidated Ind AS financial statements also include the Group’s share of total assets of ₹115 crores as at 31 March 2021 in respect of an unincorporated joint venture not operated by the Group. The Ind AS financial statements and other financial information of the said unincorporated joint venture have not been audited and such unaudited financial statements and other unaudited financial information have been furnished to us by the management.
Our opinion, in so far as it relates amounts and disclosures included in respect of these subsidiaries, unincorporated joint venture, associate and joint ventures, and our report in terms of sub-Sections (3) of Section 143 of the Act in so far as it relates to the aforesaid subsidiaries, unincorporated joint venture, associate and joint ventures, is based solely on such unaudited financial statements and other unaudited financial information. In our opinion and according to the information and explanations given to us by the Management, these financial statements and other financial information are not material to the Group.
Our opinion above on the consolidated Ind AS financial statements, and our report on Other Legal and Regulatory Requirements below, is not modified in respect of the above matters with respect to our reliance on the work done and the reports of the other auditors and the unaudited financial statements and unaudited other financial information certified by the Management.
REPORT ON OTHER LEGAL AND REGULATORY REQUIREMENTS
As required by Section 143(3) of the Act, based on our audit and on the consideration of report of the other auditors on separate financial statements and the other financial information of subsidiaries, associates and joint ventures, as noted in the ‘other matter’ paragraph we report, to the extent applicable, that:
378
| < BACK TO CONTENTS | Integrated Report | Statutory reports | Financial statements |
(a) We/the other auditors whose report we have relied upon have sought and obtained all the information and explanations which to the best of our knowledge and belief were necessary for the purposes of our audit of the aforesaid consolidated Ind AS financial statements;
(b) In our opinion, proper books of account as required by law relating to preparation of the aforesaid consolidation of the financial statements have been kept so far as it appears from our examination of those books and reports of the other auditors;
(c) The Consolidated Balance Sheet, the Consolidated Statement of Profit and Loss including the Statement of Other Comprehensive Income, the Consolidated Cash Flow Statement and Consolidated Statement of Changes in Equity dealt with by this Report are in agreement with the books of account maintained for the purpose of preparation of the consolidated Ind AS financial statements;
(d) In our opinion, the aforesaid consolidated Ind AS financial statements comply with the Accounting Standards specified under Section 133 of the Act, read with Companies (Indian Accounting Standards) Rules, 2015, as amended;
(e) On the basis of the written representations received from the directors of the Holding Company as on 31 March 2021 taken on record by the Board of Directors of the Holding Company and the reports of the statutory auditors who are appointed under Section 139 of the Act, of its subsidiary companies, associate companies and joint ventures, none of the directors of the Group’s companies, its associates and joint controlled entities, incorporated in India, is disqualified as on 31 March 2021 from being appointed as a director in terms of Section 164 (2) of the Act;
(f) The matter described in Qualified opinion paragraph in “Annexure 1” to this report, in our opinion, may have an adverse effect on the functioning of the Company;
(g) With respect to the adequacy and the operating effectiveness of the internal financial controls over financial reporting with reference to these consolidated Ind AS financial statements of the Holding Company and its subsidiary companies, associate companies and joint ventures , incorporated in India, refer to our separate Report in “Annexure 1” to this report;
(h) In our opinion and based on the consideration of reports of other statutory auditors of the subsidiaries, associates and joint ventures in India, the managerial remuneration for the year ended 31 March 2021 has been paid/provided by the Holding Company, its subsidiaries, associates and joint ventures incorporated in India to their directors in accordance with the provisions of Section 197 read with Schedule V to the Act;
(i) With respect to the other matters to be included in the Auditor’s Report in accordance with Rule 11 of the Companies (Audit and Auditors) Rules, 2014, as amended, in our opinion and to the best of our information and according to the explanations given to us and based on the consideration of the report of the other auditors on separate financial statements as also the other financial information of the subsidiaries, associates and joint ventures, as noted in the ‘Other matter’ paragraph:
i. The consolidated Ind AS financial statements disclose the impact of pending litigations on its consolidated financial position of the Group, its associates and joint ventures in its consolidated Ind AS financial statements – Refer Note 3(c)(A)(viii), 35(e), 38(D) and 39 to the consolidated Ind AS financial statements;
ii. The Group, its associates and joint ventures did not have any material foreseeable losses in long-term contracts including derivative contracts during the year ended 31 March 2021;
iii. There has been no delay in transferring amounts, required to be transferred, to the Investor Education and Protection Fund by the Holding Company, its subsidiaries, associates and joint ventures, incorporated in India during the year ended 31 March 2021.
| For S.R. Batliboi & Co. LLP | ||
| Chartered Accountants | ||
| ICAI Firm Registration Number: 301003E/E300005 | ||
| per Sudhir Soni | ||
| Partner | ||
| Place: Mumbai | Membership Number: 41870 | |
| Date: 13 May 2021 | UDIN: 21041870AAAAAQ2392 | |
VEDANTA LIMITED | INTEGRATED REPORT AND ANNUAL ACCOUNTS 2020-21 | 379
CONSOLIDATED CONTINUED...
Annexure 1 to the Independent Auditor’s Report of even date on the Consolidated Ind AS Financial Statements of Vedanta Limted
Report on the Internal Financial Controls under Clause (i) of sub-section 3 of Section 143 of the Companies Act, 2013 (“the Act”)
In conjunction with our audit of the consolidated Ind AS financial statements of Vedanta Limited as of and for the year ended 31 March 2021, we have audited the internal financial controls over financial reporting of Vedanta Limited (hereinafter referred to as the “Holding Company”) and its subsidiary companies (collectively referred to as the “Group”), its associate companies and joint ventures, which are companies incorporated in India, as of that date.
MANAGEMENT’S RESPONSIBILITY FOR INTERNAL FINANCIAL CONTROLS
The respective Board of Directors of the Holding Company, its 15 subsidiary companies, its 1 associate company and 3 joint ventures, which are companies incorporated in India, are responsible for establishing and maintaining internal financial controls based on the internal control over financial reporting criteria established by the Holding Company considering the essential components of internal control stated in the Committee of Sponsoring Organisations of the Treadway
Commission (2013 Framework) (“COSO 2013 Criteria”). These responsibilities include the design, implementation and maintenance of adequate internal financial controls that were operating effectively for ensuring the orderly and efficient conduct of its business, including adherence to the respective company’s policies, the safeguarding of its assets, the prevention and detection of frauds and errors, the accuracy and completeness of the accounting records, and the timely preparation of reliable financial information, as required under the Act.
AUDITOR’S RESPONSIBILITY
Our responsibility is to express an opinion on the Company’s internal financial controls over financial reporting with reference to these consolidated financial statements based on our audit. We conducted our audit in accordance with the Guidance Note on Audit of Internal Financial Controls Over Financial Reporting (the “Guidance Note”) and the Standards on Auditing, both, issued by Institute of Chartered Accountants of India, and deemed to be prescribed under Section 143(10) of the Act, to the extent applicable to an audit of internal financial controls. Those Standards and the Guidance Note require that we comply with ethical requirements and plan and perform the audit to obtain reasonable assurance about whether adequate internal financial controls over financial reporting with reference to these consolidated Ind AS financial statements was established and maintained and if such controls operated effectively in all material respects.
Our audit involves performing procedures to obtain audit evidence about the adequacy of the internal financial controls over financial reporting with reference to these consolidated Ind AS financial statements and their operating effectiveness. Our audit of internal financial controls over financial reporting included obtaining an understanding of internal financial controls over financial reporting with reference to these consolidated Ind AS financial statements, assessing the risk that a material weakness exists, and testing and evaluating the design and operating effectiveness of internal control based on the assessed risk. The procedures selected depend on the auditor’s judgement, including the assessment of the risks of material misstatement of the financial statements, whether due to fraud or error.
We believe that the audit evidence we have obtained and the audit evidence obtained by the other auditors in terms of their reports referred to in the Other Matters paragraph below, is sufficient and appropriate to provide a basis for our qualified audit opinion on the internal financial controls over financial reporting with reference to these consolidated Ind AS financial statements.
MEANING OF INTERNAL FINANCIAL CONTROLS OVER FINANCIAL REPORTING WITH REFERENCE TO CONSOLIDATED IND AS FINANCIAL STATEMENTS
A company’s internal financial control over financial reporting with reference to these consolidated Ind AS financial statements is a process designed to provide reasonable assurance regarding the reliability of financial reporting and the preparation of financial statements for external purposes in accordance with generally accepted accounting principles. A company’s internal financial control over financial reporting with reference to these consolidated financial statements includes those policies and procedures that (1) pertain to the maintenance of records that, in reasonable detail, accurately and fairly reflect the transactions and dispositions of the assets of the Company; (2) provide reasonable assurance that transactions are recorded as necessary to permit preparation of financial statements in accordance with generally accepted accounting principles, and that receipts and expenditures of the Company are being made only in accordance with authorisations of management and directors of the Company; and (3) provide reasonable assurance regarding prevention or timely detection of unauthorised acquisition, use, or disposition of the Company’s assets that could have a material effect on the financial statements.
380
| < BACK TO CONTENTS | Integrated Report | Statutory reports | Financial statements |
INHERENT LIMITATIONS OF INTERNAL FINANCIAL CONTROLS OVER FINANCIAL REPORTING WITH REFERENCE TO CONSOLIDATED FINANCIAL STATEMENTS
Because of the inherent limitations of internal financial controls over financial reporting with reference to these consolidated Ind AS financial statements, including the possibility of collusion or improper management override of controls, material misstatements due to error or fraud may occur and not be detected. Also, projections of any evaluation of the internal financial controls over financial reporting with reference to these consolidated Ind AS financial statements to future periods are subject to the risk that the internal financial control over financial reporting with reference to these consolidated financial statements may become inadequate because of changes in conditions, or that the degree of compliance with the policies or procedures may deteriorate.
QUALIFIED OPINION
According to the information and explanations given to us and based on our audit, the following material weakness has been identified in the effectiveness of the Company’s internal financial controls over financial reporting as at 31 March 2021: The Group’s internal controls for benchmarking the terms and authorisation of loans and guarantees between itself and its controlling shareholders and their affiliates were not effective, which could potentially result in loans being advanced and guarantees being issued in a manner which may impact the recognition, measurement and disclosure of such transactions in the financial statements.
A ‘material weakness’ is a deficiency, or a combination of deficiencies, in internal financial control over financial reporting, such that there is a reasonable possibility that a material misstatement of the Company’s annual or interim financial statements will not be prevented or detected on a timely basis.
In our opinion, except for the possible effects of the material weakness described above on the achievement of the objectives of the control criteria, the Holding Company, its subsidiary companies, its associate company and joint ventures, which are companies incorporated in India, have, maintained in all material respects, adequate internal financial controls over
financial reporting with reference to these consolidated Ind AS financial statements and such internal financial controls over financial reporting with reference to these consolidated Ind AS financial statements were operating effectively as at 31 March 2021, based on the internal control over financial reporting criteria established by the Holding Company considering the essential components of internal control stated in the COSO 2013 criterion.
OTHER MATTERS
Our report under Section 143(3)(i) of the Act on the adequacy and operating effectiveness of the internal financial controls over financial reporting with reference to these consolidated financial statements of the Holding Company, insofar as it relates to 4 subsidiary companies, which is a company incorporated in India, is based on the corresponding reports of the auditors of such subsidiary.
EXPLANATORY PARAGRAPH
We also have audited, in accordance with the Standards on Auditing issued by the Institute of Chartered Accountants of India, as specified under Section 143(10) of the Act, the consolidated financial statements of the Holding Company, which comprise the Balance Sheet as at 31 March 2021, and the related Statement of Profit and Loss including the statement of Other Comprehensive Income, the Cash Flow Statement and the Statement of Changes in Equity for the year then ended, and notes to the consolidated financial statements, including a summary of significant accounting policies and other explanatory information. The above stated material weakness was considered in determining the nature, timing and extent of audit tests applied in our audit of the 31 March 2021 consolidated financial statements of the Holding Company and, this report does not affect our report of even date, which expressed an unmodified opinion on those consolidated financial statements.
| For S.R. Batliboi & Co. LLP | ||
| Chartered Accountants | ||
| ICAI Firm Registration Number: 301003E/E300005 | ||
| per Sudhir Soni | ||
| Partner | ||
| Place: Mumbai | Membership Number: 41870 | |
| Date: 13 May 2021 | UDIN: 21041870AAAAAQ2392 | |
VEDANTA LIMITED | INTEGRATED REPORT AND ANNUAL ACCOUNTS 2020-21 | 381
CONSOLIDATED CONTINUED...
Balance Sheet
as at 31 March 2021
Particulars | Note | As at 31 March 2021 | (₹ in crores) As at 31 March 2020 | |||||||||
ASSETS | ||||||||||||
Non-current assets | ||||||||||||
Property, Plant and Equipment | 6 | 89,429 | 88,022 | |||||||||
Capital work-in-progress | 6 | 13,880 | 16,837 | |||||||||
Intangible assets | 6 | 1,041 | 882 | |||||||||
Exploration intangible assets under development | 6 | 2,434 | 1,748 | |||||||||
Financial assets | ||||||||||||
Investments | 7A | 156 | 95 | |||||||||
Trade receivables | 8 | 3,158 | 3,111 | |||||||||
Loans | 9 | 5,069 | 17 | |||||||||
Derivatives | — | 3 | ||||||||||
Others | 10 | 2,520 | 2,523 | |||||||||
Deferred tax assets (net) | 35 | 5,860 | 6,889 | |||||||||
Income tax assets (net) | 35 | 2,748 | 2,645 | |||||||||
Other non-current assets | 11 | 3,210 | 3,330 | |||||||||
|
|
|
| |||||||||
Total non-current assets | 1,29,505 | 1,26,102 | ||||||||||
|
|
|
| |||||||||
Current assets | ||||||||||||
Inventories | 12 | 9,923 | 11,335 | |||||||||
Financial assets | ||||||||||||
Investments | 7B | 16,504 | 24,658 | |||||||||
Trade receivables | 8 | 3,491 | 2,697 | |||||||||
Cash and cash equivalents | 13 | 4,854 | 5,117 | |||||||||
Other bank balances | 14 | 11,775 | 7,385 | |||||||||
Loans | 9 | 2,019 | 85 | |||||||||
Derivatives | 70 | 692 | ||||||||||
Others | 10 | 4,245 | 2,406 | |||||||||
Income tax assets (net) | 7 | 7 | ||||||||||
Other current assets | 11 | 3,304 | 3,138 | |||||||||
|
|
|
| |||||||||
Total current assets | 56,192 | 57,520 | ||||||||||
|
|
|
| |||||||||
Total Assets | 1,85,697 | 1,83,622 | ||||||||||
|
|
|
| |||||||||
EQUITY AND LIABILITIES | ||||||||||||
Equity | ||||||||||||
Equity Share Capital | 15 | 372 | 372 | |||||||||
Other Equity | 16 | 61,906 | 54,263 | |||||||||
|
|
|
| |||||||||
Equity attributable to owners of Vedanta Limited | 62,278 | 54,635 | ||||||||||
|
|
|
| |||||||||
Non-controlling interests | 17 | 15,138 | 17,112 | |||||||||
|
|
|
| |||||||||
Total Equity | 77,416 | 71,747 | ||||||||||
|
|
|
| |||||||||
Liabilities | ||||||||||||
Non-current liabilities | ||||||||||||
Financial liabilities | ||||||||||||
Borrowings | 19A | 37,962 | 36,724 | |||||||||
Derivatives | 76 | 45 | ||||||||||
Other financial liabilities | 21 | 1,445 | 1,501 | |||||||||
Provisions | 23 | 3,132 | 2,828 | |||||||||
Deferred tax liabilities (net) | 35 | 2,215 | 2,885 | |||||||||
Other non-current liabilities | 24 | 4,327 | 4,570 | |||||||||
|
|
|
| |||||||||
Total non-current liabilities | 49,157 | 48,553 | ||||||||||
|
|
|
| |||||||||
Current liabilities | ||||||||||||
Financial liabilities | ||||||||||||
Borrowings | 19B | 3,715 | 13,076 | |||||||||
Operational buyers’ credit/suppliers’ credit | 20B,2 | (C) | 7,983 | 8,945 | ||||||||
Trade payables | 20A,2 | (C) | 7,892 | 8,027 | ||||||||
Derivatives | 279 | 96 | ||||||||||
Other financial liabilities | 21 | 28,803 | 21,162 | |||||||||
Prvisions | 23 | 353 | 355 | |||||||||
Income tax liabilities (net) | 277 | 188 | ||||||||||
Other current liabilities | 24 | 9,822 | 11,473 | |||||||||
|
|
|
| |||||||||
Total current liabilities | 59,124 | 63,322 | ||||||||||
|
|
|
| |||||||||
Total Equity and Liabilities | 1,85,697 | 1,83,622 | ||||||||||
|
|
|
| |||||||||
See accompanying notes to the financial statements | ||||
| As per our report of even date | For and on behalf of the Board of Directors | |||
| For S.R. Batliboi & Co. LLP | Navin Agarwal | Sunil Duggal | ||
| Chartered Accountants | Executive Vice-Chairman and | Whole-Time Director and | ||
| ICAI Firm Registration No. 301003E/E300005 | Whole-Time Director DIN 00006303 | Chief Executive Officer DIN 07291685 | ||
| per Sudhir Soni | Prerna Halwasiya | |||
| Partner | Company Secretary and Compliance Officer | |||
| Membership No: 41870 | ICSI Membership No. A20856 | |||
| Place: Mumbai | Place: New Delhi | |||
| Date: 13 May 2021 | Date: 13 May 2021 | |||
382
| < BACK TO CONTENTS | Integrated Report | Statutory reports | Financial statements |
Statement of Profit and Loss
for the year ended 31 March 2021
| (₹ in crores except otherwise stated) | ||||||||||||
Particulars | Note | Year ended 31 March 2021 | Year ended 31 March 2020 | |||||||||
Revenue from operations | 25 | 86,863 | 83,545 | |||||||||
Other operating income | 26 | 1,158 | 902 | |||||||||
Other income | 27 | 3,421 | 2,510 | |||||||||
|
|
|
| |||||||||
Total Income | 91,442 | 86,957 | ||||||||||
|
|
|
| |||||||||
EXPENSES | ||||||||||||
Cost of materials consumed | 22,849 | 21,261 | ||||||||||
Purchases of stock-in-trade | 41 | 225 | ||||||||||
Changes in inventories of finished goods, work-in-progress and stock-in-trade | 28 | 792 | 1,017 | |||||||||
Power & fuel charges | 13,674 | 16,606 | ||||||||||
Employee benefits expense | 29 | 2,861 | 2,672 | |||||||||
Finance costs | 32 | 5,210 | 4,977 | |||||||||
Depreciation, depletion and amortisation expense | 6 | 7,638 | 9,093 | |||||||||
Other expenses | 33 | 20,486 | 21,979 | |||||||||
|
|
|
| |||||||||
Total expenses | 73,551 | 77,830 | ||||||||||
|
|
|
| |||||||||
Profit before exceptional items and tax | 17,891 | 9,127 | ||||||||||
Net exceptional loss | 34 | (678 | ) | (17,386 | ) | |||||||
Profit/(Loss) before tax | 17,213 | (8,259 | ) | |||||||||
|
|
|
| |||||||||
Tax expense/(benefit): | 35 | |||||||||||
On other than exceptional items | ||||||||||||
Net current tax expense | 2,066 | 1,788 | ||||||||||
Net deferred tax expense | 268 | 1,217 | ||||||||||
Deferred tax on intra group profit distribution (including from accumulated profits) | 869 | 1,701 | ||||||||||
Other deferred tax benefit | (601 | ) | (484 | ) | ||||||||
On exceptional items | ||||||||||||
Net Deferred tax benefit | (154 | ) | (6,521 | ) | ||||||||
Net tax expense/(benefit): | 2,180 | (3,516 | ) | |||||||||
|
|
|
| |||||||||
Profit/(Loss) after tax for the year before share in loss of jointly controlled entities and associates and non-controlling interests | 15,033 | (4,743 | ) | |||||||||
|
|
|
| |||||||||
Add: Share in loss of jointly controlled entities and associates | (1 | ) | (1 | ) | ||||||||
Profit/(Loss) for the year after share in loss of jointly controlled entities and associates (A) | 15,032 | (4,744 | ) | |||||||||
|
|
|
| |||||||||
Other Comprehensive Income | ||||||||||||
Items that will not be reclassified to profit or loss | ||||||||||||
Re-measurement loss on defined benefit plans | (1 | ) | (210 | ) | ||||||||
Tax (expense)/credit | (11 | ) | 71 | |||||||||
Gain/(loss) on FVOCI equity investment | 63 | (74 | ) | |||||||||
| 51 | (213 | ) | ||||||||||
|
|
|
| |||||||||
Items that will be reclassified to profit or loss | ||||||||||||
Net (loss)/gain on cash flow hedges recognised during the year | (253 | ) | 127 | |||||||||
Tax credit/(expense) | 87 | (44 | ) | |||||||||
Net gain/(loss) on cash flow hedges recycled to profit or loss | 188 | (33 | ) | |||||||||
Tax (expense)/credit | (61 | ) | 12 | |||||||||
Exchange differences on translation | 252 | 833 | ||||||||||
Tax (expense)/credit | (61 | ) | 34 | |||||||||
| 152 | 929 | |||||||||||
|
|
|
| |||||||||
Total other comprehensive income (B) | 203 | 716 | ||||||||||
|
|
|
| |||||||||
Total comprehensive income/(loss) for the year (A+B) | 15,235 | (4,028 | ) | |||||||||
|
|
|
| |||||||||
Profit/(Loss) attributable to: | ||||||||||||
Owners of Vedanta Limited | 11,602 | (6,664 | ) | |||||||||
Non-controlling interests | 17 | 3,430 | 1,920 | |||||||||
Other comprehensive income attributable to: | ||||||||||||
Owners of Vedanta Limited | 110 | 839 | ||||||||||
Non-controlling interests | 17 | 93 | (123 | ) | ||||||||
Total comprehensive income/(loss) attributable to: | ||||||||||||
Owners of Vedanta Limited | 11,712 | (5,825 | ) | |||||||||
Non-controlling interests | 17 | 3,523 | 1,797 | |||||||||
Earnings/(Loss) per equity share (₹): | ||||||||||||
- Basic | 36 | 31.32 | (18.00 | ) | ||||||||
- Diluted | 31.13 | (18.00 | ) | |||||||||
| See accompanying notes to the financial statements | ||||
| As per our report of even date | For and on behalf of the Board of Directors | |||
| For S.R. Batliboi & Co. LLP | Navin Agarwal | Sunil Duggal | ||
| Chartered Accountants | Executive Vice-Chairman and | Whole-Time Director and | ||
| ICAI Firm Registration No. 301003E/E300005 | Whole-Time Director DIN 00006303 | Chief Executive Officer DIN 07291685 | ||
| per Sudhir Soni | Prerna Halwasiya | |||
| Partner | Company Secretary and Compliance Officer | |||
| Membership No: 41870 | ICSI Membership No. A20856 | |||
| Place: Mumbai | Place: New Delhi | |||
| Date: 13 May 2021 | Date: 13 May 2021 | |||
VEDANTA LIMITED | INTEGRATED REPORT AND ANNUAL ACCOUNTS 2020-21 | 383
CONSOLIDATED CONTINUED...
Statement of Cash Flows
for the year ended 31 March 2021
| (₹ in crores) | ||||||||
Particulars | Year ended 31 March 2021 | Year ended 31 March 2020 | ||||||
CASH FLOWS FROM OPERATING ACTIVITIES | ||||||||
Profit/(Loss) before taxation | 17,213 | (8,259 | ) | |||||
Adjustments for: | ||||||||
Depreciation, depletion and amortisation | 7,662 | 9,152 | ||||||
Capital work-in-progress written off/impairment charge | 244 | 17,080 | ||||||
Other exceptional items | 434 | 306 | ||||||
Provision for doubtful debts/advance/bad debts written off | 308 | 121 | ||||||
Exploration costs written off | 7 | 3 | ||||||
Fair value gain on financial assets held at fair value through profit or loss | (934 | ) | (558 | ) | ||||
(Profit)/Loss on sale/discard of property, plant and equipment (net) | (75 | ) | 56 | |||||
Foreign exchange (gain)/loss (net) | (119 | ) | 317 | |||||
Unwinding of discount on decommissioning liability | 72 | 96 | ||||||
Share based payment expense | 59 | 72 | ||||||
Interest and dividend income | (2,107 | ) | (1,683 | ) | ||||
Interest expenses | 5,123 | 4,874 | ||||||
Deferred government grant | (228 | ) | (205 | ) | ||||
Changes in assets and liabilities | ||||||||
(Increase)/decrease in trade and other receivables | (3,215 | ) | 462 | |||||
Decrease in inventories | 1,409 | 1,990 | ||||||
Increase/(decrease) in trade and other payable | 235 | (3,389 | ) | |||||
Cash generated from operation | 26,088 | 20,435 | ||||||
Income taxes paid (net of refund) | (2,108 | ) | (1,135 | ) | ||||
Net cash generated from operating activities | 23,980 | 19,300 | ||||||
CASH FLOWS FROM INVESTING ACTIVITIES | ||||||||
Consideration paid for business acquisition (net of cash and cash equivalents acquired) | (45 | ) | (33 | ) | ||||
Purchases of property, plant and equipment (including intangibles) | (6,886 | ) | (7,814 | ) | ||||
Proceeds from sale of property, plant and equipment | 168 | 145 | ||||||
Loans repaid by related parties (Refer note 40) | 1,112 | — | ||||||
Loans given to related parties (Refer note 40) | (7,660 | ) | — | |||||
Short-term deposits made | (18,040 | ) | (11,190 | ) | ||||
Proceeds from redemption short-term deposits | 14,563 | 4,564 | ||||||
Short-term investments made | (75,160 | ) | (98,358 | ) | ||||
Proceeds from sale of short-term investments | 83,330 | 1,03,339 | ||||||
Interest received | 2,035 | 830 | ||||||
Dividends received | 2 | 18 | ||||||
Payment made to site restoration fund | (169 | ) | (37 | ) | ||||
Proceeds on liquidation of structured investments | — | 3,077 | ||||||
Payment towards structured investments | — | (435 | ) | |||||
Net cash used in investing activities | (6,750 | ) | (5,894 | ) | ||||
384
| < BACK TO CONTENTS | Integrated Report | Statutory reports | Financial statements |
Statement of Cash Flows
for the year ended 31 March 2021
| (₹ in crores) | ||||||||
Particulars | Year ended 31 March 2021 | Year ended 31 March 2020 | ||||||
CASH FLOWS FROM FINANCING ACTIVITIES | ||||||||
Repayment of short-term borrowings (net) | (9,593 | ) | (11,264 | ) | ||||
Proceeds from current borrowings | 11,298 | 4,473 | ||||||
Repayment of current borrowings | (11,056 | ) | (4,397 | ) | ||||
Proceeds from long-term borrowings | 16,707 | 11,826 | ||||||
Repayment of long-term borrowings | (9,577 | ) | (8,996 | ) | ||||
Interest paid | (5,348 | ) | (5,322 | ) | ||||
Payment of dividends to equity holders of the parent, including dividend distribution tax | (3,519 | ) | (1,444 | ) | ||||
Loan given to parent and its affiliates in excess of fair value (Refer note 40(I)) | (536 | ) | — | |||||
Payment of dividends to non-controlling interests | (5,603 | ) | — | |||||
Payment for acquiring non-controlling interest | — | (107 | ) | |||||
Payment of lease liabilities | (338 | ) | (316 | ) | ||||
Net cash used in financing activities | (17,565 | ) | (15,547 | ) | ||||
Effect of exchange rate changes on cash and cash equivalents | 72 | (31 | ) | |||||
Net decrease in cash and cash equivalents | (263 | ) | (2,172 | ) | ||||
Cash and cash equivalents at the beginning of the year (Refer note 13) | 5,117 | 7,289 | ||||||
Cash and cash equivalents at end of the year (Refer note 13) | 4,854 | 5,117 | ||||||
| Notes: |
| 1. | The figures in parentheses indicate outflow. |
| 2. | The above cash flow has been prepared under the “Indirect Method” as set out in Indian Accounting Standard (Ind AS) 7 – statement of cash flows |
See accompanying notes to the financial statements
| As per our report of even date | For and on behalf of the Board of Directors | |||
| For S.R. Batliboi & Co. LLP | Navin Agarwal | Sunil Duggal | ||
| Chartered Accountants | Executive Vice-Chairman and | Whole-Time Director and | ||
| ICAI Firm Registration No. 301003E/ E300005 | Whole-Time Director DIN 00006303 | Chief Executive Officer DIN 07291685 | ||
| per Sudhir Soni | Prerna Halwasiya | |||
| Partner | Company Secretary and Compliance Officer | |||
| Membership No: 41870 | ICSI Membership No. A20856 | |||
| Place: Mumbai | Place: New Delhi | |||
| Date: 13 May 2021 | Date: 13 May 2021 | |||
VEDANTA LIMITED | INTEGRATED REPORT AND ANNUAL ACCOUNTS 2020-21 | 385
CONSOLIDATED CONTINUED...
Statement of Changes in Equity
for the year ended 31 March 2021
| A. | EQUITY SHARE CAPITAL |
Equity shares of ₹1 each issued, subscribed and fully paid | Number of shares (in crores) | Amount (₹ in crores) | ||||||
As at 31 March 2021 and 31 March 2020 | 372 | 372 | ||||||
| B. | OTHER EQUITY |
| (₹ in crores) | ||||||||||||||||||||||||||||||||||||||||
| Reserves and surplus | Items of OCI | |||||||||||||||||||||||||||||||||||||||
Particulars | Capital Securities Retained reserve premium earnings | Other reserves (Refer note below) | Foreign currency translation reserve | Equity instruments through OCI | Effective portion of cash flow hedges | Total other equity | Non- controlling interests | Total | ||||||||||||||||||||||||||||||||
Balance as at 01 April 2019 | 18,768 | 19,009 | 1,711 | 20,395 | 2,011 | 104 | (73 | ) | 61,925 | 15,227 | 77,152 | |||||||||||||||||||||||||||||
|
|
|
|
|
|
|
|
|
|
|
|
|
|
|
|
|
|
|
| |||||||||||||||||||||
Loss for the year | — | — | (6,664 | ) | — | — | — | — | (6,664 | ) | 1,920 | (4,744 | ) | |||||||||||||||||||||||||||
|
|
|
|
|
|
|
|
|
|
|
|
|
|
|
|
|
|
|
| |||||||||||||||||||||
Other comprehensive income for the year (net of tax impact) | — | — | (92 | ) | — | 959 | (74 | ) | 46 | 839 | (123 | ) | 716 | |||||||||||||||||||||||||||
|
|
|
|
|
|
|
|
|
|
|
|
|
|
|
|
|
|
|
| |||||||||||||||||||||
Total comprehensive income for the year | — | — | (6,756 | ) | — | 959 | (74 | ) | 46 | (5,825 | ) | 1,797 | (4,028 | ) | ||||||||||||||||||||||||||
|
|
|
|
|
|
|
|
|
|
|
|
|
|
|
|
|
|
|
| |||||||||||||||||||||
Recognition of share based payment | — | — | — | 75 | — | — | — | 75 | — | 75 | ||||||||||||||||||||||||||||||
|
|
|
|
|
|
|
|
|
|
|
|
|
|
|
|
|
|
|
| |||||||||||||||||||||
Stock options cancelled during the year | — | — | 52 | (52 | ) | — | — | — | — | — | — | |||||||||||||||||||||||||||||
|
|
|
|
|
|
|
|
|
|
|
|
|
|
|
|
|
|
|
| |||||||||||||||||||||
Exercise of stock option | — | — | 7 | (7 | ) | — | — | — | — | — | — | |||||||||||||||||||||||||||||
|
|
|
|
|
|
|
|
|
|
|
|
|
|
|
|
|
|
|
| |||||||||||||||||||||
Transfer from debenture redemption reserve (net) | — | — | 191 | (191 | ) | — | — | — | — | — | — | |||||||||||||||||||||||||||||
|
|
|
|
|
|
|
|
|
|
|
|
|
|
|
|
|
|
|
| |||||||||||||||||||||
Recognition of put option liability/derecognition of non-controlling interest | (343 | ) | — | — | — | — | — | — | (343 | ) | 322 | (21 | ) | |||||||||||||||||||||||||||
|
|
|
|
|
|
|
|
|
|
|
|
|
|
|
|
|
|
|
| |||||||||||||||||||||
Acquisition of non-controlling interests in Electrosteel Steel Limited | 127 | — | — | — | — | — | — | 127 | (234 | ) | (107 | ) | ||||||||||||||||||||||||||||
|
|
|
|
|
|
|
|
|
|
|
|
|
|
|
|
|
|
|
| |||||||||||||||||||||
Dividend, including tax on dividend (Refer note 37) | — | — | (1,696 | ) | — | — | — | — | (1,696 | ) | — | (1,696 | ) | |||||||||||||||||||||||||||
|
|
|
|
|
|
|
|
|
|
|
|
|
|
|
|
|
|
|
| |||||||||||||||||||||
Balance as at 31 March 2020 | 18,552 | 19,009 | (6,491 | ) | 20,220 | 2,970 | 30 | (27 | ) | 54,263 | 17,112 | 71,375 | ||||||||||||||||||||||||||||
|
|
|
|
|
|
|
|
|
|
|
|
|
|
|
|
|
|
|
| |||||||||||||||||||||
Profit for the year | — | — | 11,602 | — | — | — | — | 11,602 | 3,430 | 15,032 | ||||||||||||||||||||||||||||||
|
|
|
|
|
|
|
|
|
|
|
|
|
|
|
|
|
|
|
| |||||||||||||||||||||
Other comprehensive income for the year (net of tax impact) | — | — | (7 | ) | — | 75 | 63 | (21 | ) | 110 | 93 | 203 | ||||||||||||||||||||||||||||
|
|
|
|
|
|
|
|
|
|
|
|
|
|
|
|
|
|
|
| |||||||||||||||||||||
Total comprehensive income for the year | — | — | 11,595 | — | 75 | 63 | (21 | ) | 11,712 | 3,523 | 15,235 | |||||||||||||||||||||||||||||
|
|
|
|
|
|
|
|
|
|
|
|
|
|
|
|
|
|
|
| |||||||||||||||||||||
Recognition of share based payment | — | — | — | 58 | — | — | — | 58 | — | 58 | ||||||||||||||||||||||||||||||
|
|
|
|
|
|
|
|
|
|
|
|
|
|
|
|
|
|
|
| |||||||||||||||||||||
Stock options cancelled during the year | — | — | 60 | (92 | ) | — | — | — | (32 | ) | — | (32 | ) | |||||||||||||||||||||||||||
|
|
|
|
|
|
|
|
|
|
|
|
|
|
|
|
|
|
|
| |||||||||||||||||||||
Exercise of stock option | — | — | (14 | ) | 14 | — | — | — | 0 | — | 0 | |||||||||||||||||||||||||||||
|
|
|
|
|
|
|
|
|
|
|
|
|
|
|
|
|
|
|
| |||||||||||||||||||||
Transfer from debenture redemption reserve (net) | — | — | 528 | (528 | ) | — | — | — | — | — | — | |||||||||||||||||||||||||||||
|
|
|
|
|
|
|
|
|
|
|
|
|
|
|
|
|
|
|
| |||||||||||||||||||||
Recognition of put option liability/derecognition of non-controlling interest | (163 | ) | — | — | — | — | — | — | (163 | ) | 137 | (26 | ) | |||||||||||||||||||||||||||
|
|
|
|
|
|
|
|
|
|
|
|
|
|
|
|
|
|
|
| |||||||||||||||||||||
Effect of fair valuation of inter-company loan* | — | — | (536 | ) | — | — | — | — | (536 | ) | (536 | ) | ||||||||||||||||||||||||||||
|
|
|
|
|
|
|
|
|
|
|
|
|
|
|
|
|
|
|
| |||||||||||||||||||||
Acquisition of FACOR (Refer note 4(a)) | 123 | — | — | — | — | — | — | 123 | (31 | ) | 92 | |||||||||||||||||||||||||||||
|
|
|
|
|
|
|
|
|
|
|
|
|
|
|
|
|
|
|
| |||||||||||||||||||||
Dividend (Refer note 37) | — | — | (3,519 | ) | — | — | — | — | (3,519 | ) | (5,603 | ) | (9,122 | ) | ||||||||||||||||||||||||||
|
|
|
|
|
|
|
|
|
|
|
|
|
|
|
|
|
|
|
| |||||||||||||||||||||
Balance as at 31 March 2021 | 18,512 | 19,009 | 1,623 | 19,672 | 3,045 | 93 | (48 | ) | 61,906 | 15,138 | 77,044 | |||||||||||||||||||||||||||||
|
|
|
|
|
|
|
|
|
|
|
|
|
|
|
|
|
|
|
| |||||||||||||||||||||
| * | An amount of US$46 million (₹336 crores) was originally recognised as a transaction with the shareholder and the same was increased by US$79 million (₹581 crores) upon revision in terms. Of the same, US$52 million (₹381 crores) was reversed on a subsequent modification during the year. Refer note 40(I) for further details. |
386
| < BACK TO CONTENTS | Integrated Report | Statutory reports | Financial statements |
Statement of Changes in Equity
for the year ended 31 March 2021
Note:
Other reserves comprises:
| (₹ in crores) | ||||||||||||||||||||||||||||||||||||
Particulars | Capital redemption reserve | Debenture redemption reserve | Preference share redemption reserve | Capital reserve on consolidation | Share based payment reserve | Legal reserve | Treasury shares | General reserve | Total | |||||||||||||||||||||||||||
Balance as at 01 April 2019 | 23 | 1,303 | 3,087 | 10 | 249 | 25 | (397 | ) | 16,095 | 20,395 | ||||||||||||||||||||||||||
Recognition of share based payment | — | — | — | — | 75 | — | — | — | 75 | |||||||||||||||||||||||||||
Stock options cancelled during the year | — | — | — | — | (52 | ) | — | — | — | (52 | ) | |||||||||||||||||||||||||
Exercise of stock options | — | — | — | — | (23 | ) | — | 16 | — | (7 | ) | |||||||||||||||||||||||||
Transfer to retained earnings | — | (191 | ) | — | — | — | — | — | — | (191 | ) | |||||||||||||||||||||||||
Balance as at 31 March | 23 | 1,112 | 3,087 | 10 | 249 | 25 | (381 | ) | 16,095 | 20,220 | ||||||||||||||||||||||||||
2020 | ||||||||||||||||||||||||||||||||||||
Recognition of share based payment | — | — | — | — | 58 | — | — | — | 58 | |||||||||||||||||||||||||||
Stock options cancelled during the year | — | — | — | — | (92 | ) | — | — | — | (92 | ) | |||||||||||||||||||||||||
Exercise of stock options | — | — | — | — | (44 | ) | — | 58 | — | 14 | ||||||||||||||||||||||||||
Transfer to retained earnings | — | (528 | ) | — | — | — | — | — | — | (528 | ) | |||||||||||||||||||||||||
Balance as at 31 March 2021 | 23 | 584 | 3,087 | 10 | 171 | 25 | (323 | ) | 16,095 | 19,672 | ||||||||||||||||||||||||||
| See accompanying notes to the financial statements | ||||
| As per our report of even date | For and on behalf of the Board of Directors | |||
| For S.R. Batliboi & Co. LLP | Navin Agarwal | Sunil Duggal | ||
| Chartered Accountants | Executive Vice-Chairman and | Whole-Time Director and | ||
| ICAI Firm Registration No. 301003E/ | Whole-Time Director | Chief Executive Officer | ||
| E300005 | DIN 00006303 | DIN 07291685 | ||
| per Sudhir Soni | Prerna Halwasiya | |||
| Partner | Company Secretary and Compliance Officer | |||
| Membership No: 41870 | ICSI Membership No. A20856 | |||
| Place: Mumbai | Place: New Delhi | |||
| Date: 13 May 2021 | Date: 13 May 2021 | |||
VEDANTA LIMITED | INTEGRATED REPORT AND ANNUAL ACCOUNTS 2020-21 | 387
CONSOLIDATED CONTINUED...
Notes
forming part of the consolidated financial statements as at and for the year ended 31 March 2021
1 GROUP OVERVIEW
Vedanta Limited (“the Company”) and its consolidated subsidiaries (collectively, the “Group”) is a diversified natural resource group engaged in exploring, extracting and processing minerals and oil and gas. The Group engages in the exploration, production and sale of zinc, lead, silver, copper, aluminium, iron ore and oil and gas and have a presence across India, South Africa, Namibia, Ireland, Australia, Liberia and UAE. The Group is also in the business of commercial power generation, steel manufacturing and port operations in India and manufacturing of glass substrate in South Korea and Taiwan.
The Company was incorporated on 08 September 1975 under the laws of the Republic of India. The registered office of the Company is situated at 1st Floor, ‘C’ wing, Unit 103, Corporate Avenue, Atul Projects, Chakala, Andheri (East), Mumbai – 400 092, Maharashtra. The Company’s shares are listed on National Stock Exchange and Bombay Stock Exchange in India. In June 2007, the Company completed its initial public offering of American Depositary Shares, or ADS, each representing four equity shares, and listed its ADSs on the New York Stock Exchange. In July 2009, the Company completed its follow-on offering of an additional 131,906,011 ADSs, each representing four equity shares, which are listed on the New York Stock Exchange.
The Company is majority owned by Twin Star Holdings Limited (“Twin Star”), Finsider International Company Limited (“Finsider”), Vedanta Holdings Mauritius II Limited
(“VHM2L”), West Globe Limited (“West Globe”) and Welter Trading Limited (“Welter”) which are in turn wholly-owned subsidiaries of Vedanta Resources PLC (“VRPLC”), which was a public limited company incorporated in the United Kingdom and listed on the London Stock Exchange (VRPLC has been delisted from London Stock Exchange on 01 October 2018 and is renamed as “Vedanta Resources Limited” (“VRL”) with effect from 29 October 2018). Twin Star, Finsider, VHM2L, West Globe and Welter held 37.1%, 10.8%, 5.0%, 1.2% and 1.0% respectively of the Company’s equity as at 31 March 2021.
Details of Group’s various businesses are as follows. The Group’s percentage holdings in each of the below businesses are disclosed in note 42.
| • | Zinc India business is owned and operated by Hindustan Zinc Limited (“HZL”). |
| • | Zinc international business is comprised of Skorpion mine and refinery in Namibia operated through THL Zinc Namibia Holdings (Proprietary) Limited (“Skorpion”), Lisheen mine in Ireland operated through Vedanta Lisheen Holdings Limited (“Lisheen”) (Lisheen mine ceased operations in December 2015) and Black Mountain Mining (Proprietary) Limited (“BMM”), whose assets include the operational Black Mountain mine and the Gamsberg mine project located in South Africa. |
| • | The Group’s oil and gas business is owned and operated by the Company and its subsidiary, Cairn Energy Hydrocarbons Limited and consists of exploration and development and production of oil and gas. |
| • | The Group’s iron ore business is owned by the Company, and by two wholly-owned subsidiaries of the Company i.e. Sesa Resources Limited and Sesa Mining Corporation Limited and consists of exploration, mining and processing of iron ore, pig iron and metallurgical coke and generation of power for captive use. Pursuant to Honourable Supreme Court of India order, mining operations in the state of Goa are currently suspended. The Group’s iron ore business includes Western Cluster Limited (“WCL”) in Liberia which has iron ore assets and is wholly-owned by the Group. WCL’s assets include development rights to Western Cluster and a network of iron ore deposits in West Africa. WCL’s assets have been fully impaired. |
| • | The Group’s copper business is owned and operated by the Company, Copper Mines of Tasmania Pty Ltd. (“CMT”) and Fujairah Gold FZC and is principally one of custom smelting and includes captive power plants at Tuticorin in Southern India. |
The Group’s copper business in Tamil Nadu, India has received an order from the Tamil Nadu Pollution Control Board (“TNPCB”) on 09 April 2018, rejecting the Company’s application for renewal of consent to operate under the Air and Water Acts for the 400,000 tpa copper smelter plant in Tuticorin for want of further clarification and consequently the operations were suspended. The Company has filed an appeal with TNPCB Appellate authority against the said order. During the pendency of the appeal, TNPCB through its order dated 23 May 2018 ordered for disconnection of electricity supply and closure of copper smelter plant. Post such order, the state government on 28 May 2018 ordered the permanent closure of the plant. We continue to engage with the Government of India and relevant authorities to enable the restart of operations at Copper India. [Refer note 3(c)(A)(vii)].
Further, the Company’s copper business includes refinery and rod plant Silvassa consisting of a 133,000 MT of blister/secondary material processing plant, a 216,000 tpa copper refinery plant and a copper rod mill with an installed capacity of 258,000 tpa. The plant continues to operate as usual, catering to the domestic market.
388
| < BACK TO CONTENTS | Integrated Report | Statutory reports | Financial statements |
Notes
forming part of the consolidated financial statements as at and for the year ended 31 March 2021
In addition, the Group owns and operates the Mt. Lyell copper mine in Tasmania, Australia through its subsidiary, CMT and a precious metal refinery and copper rod plant in Fujairah, UAE through its subsidiary Fujairah Gold FZC. The operations of Mt Lyell copper mine were suspended in January 2014 following a mud slide incident and were put into care and maintenance since 09 July 2014 following a rock fall incident in June 2014.
| • | The Group’s Aluminium business is owned and operated by the Company and by Bharat Aluminium Company Limited (“BALCO”). The aluminium operations include a refinery and captive power plant at Lanjigarh and a smelter and captive power plants at Jharsuguda both situated in the State of Odisha in Eastern India. BALCO’s partially integrated aluminium operations are comprised of two bauxite mines, captive power plants, smelting and fabrication facilities in the State of Chhattisgarh in central India. |
| • | The Group’s power business is owned and operated by the Company, BALCO, and Talwandi Sabo Power Limited (“TSPL”), a wholly-owned subsidiary of the Company, which are engaged in the power generation business in India. The Company’s power operations include a thermal coal- based commercial power facility of 600 MW at Jharsuguda in the State of Odisha in Eastern India. BALCO power operations included 600 MW (2 units of 300 MW each) thermal coal based power plant at Korba, of which a unit of 300 MW was converted to be used for captive consumption vide order from Central Electricity Regulatory Commission (CERC) dated 01 January 2019. Talwandi Sabo Power Limited (“TSPL”) power operations include 1,980 MW (three units of 660 MW each) thermal coal- based commercial power facilities. Power business also includes the wind power plants commissioned by HZL and a power plant at MALCO Energy Limited (“MEL”) (under care and maintenance) situated at Mettur Dam in the State of Tamil Nadu in southern India. |
| • | The Group’s other activities include ESL Steel Limited (“ESL”) (formerly known as Electrosteel Steels Limited). ESL is engaged in the manufacturing and supply of billets, TMT bars, wire rods and ductile iron pipes in India. |
The Group’s other activities also include Vizag General Cargo Berth Private Limited (“VGCB”) and Maritime Ventures Private Limited (“MVPL”). Vizag port project includes mechanisation of coal handling facilities and upgradation of general cargo berth for handling coal at the outer harbour of Visakhapatnam Port on the east coast of India. MVPL is engaged in the business of rendering logistics and other allied services inter alia rendering stevedoring, and other allied services in ports and other allied sectors. VGCB commenced operations in the fourth quarter of fiscal 2013. The Group’s other activities also include AvanStrate Inc. (“ASI”) and Ferro Alloys Corporation Limited (“FACOR”). ASI is involved in the manufacturing of glass substrate in South Korea and Taiwan. FACOR is involved in business of producing Ferro Alloys and owns a Ferro Chrome plant with capacity of 72,000 TPA, two operational Chrome mines and 100 MW of Captive Power Plant through its subsidiary, FACOR Power Limited (FPL).
Delisting of Vedanta Limited
The Company vide letter dated 12 May 2020 had informed the stock exchanges that it has received a letter dated 12 May 2020 from its Holding Company, Vedanta Resources Ltd. (“VRL”), wherein VRL had expressed its intention to, either individually or along with one or more subsidiaries, acquire all fully paid-up equity shares of the Company (“Equity Shares”) that are held by the public shareholders of the Company (as defined under the Delisting Regulations, to be referred to as “Public Shareholders”) and consequently voluntarily delist the Equity Shares from BSE Limited and National Stock Exchange of India Limited, the recognised stock exchanges where the Equity Shares are presently listed (“Stock Exchanges”), in accordance with the Delisting Regulations (“Delisting Proposal”) and if such delisting is successful, then to also delist the Company’s American Depositary Shares from the New York Stock Exchange (“NYSE”) and deregister the Company from the Securities and Exchange Commission (“SEC”), subject to the requirements of the NYSE and the SEC.
After obtaining due approvals, the Public Shareholders holding Equity Shares were invited to submit Bids pursuant to the reverse book building process conducted through the Stock Exchange Mechanism made available by BSE during the bid period (29 October 2020 to 09 October 2020), in accordance with the Delisting Regulations.
The total number of Offer Shares validly tendered by the Public Shareholders in the Delisting Offer was 1,25,47,16,610 Offer Shares, which was less than the minimum number of Offer Shares required to be accepted by the Acquirers in order for the Delisting Offer to be successful in terms of Regulation 17(1)(a) of the Delisting Regulations. Thus, the Delisting Offer is deemed to have failed in terms of Regulation 19(1) of the Delisting Regulations.
VEDANTA LIMITED | INTEGRATED REPORT AND ANNUAL ACCOUNTS 2020-21 | 389
CONSOLIDATED CONTINUED...
Notes
forming part of the consolidated financial statements as at and for the year ended 31 March 2021
2 BASIS OF PREPARATION AND BASIS OF MEASUREMENT OF FINANCIAL STATEMENTS
(A) Basis of preparation
i) These consolidated financial statements have been prepared in accordance with Indian Accounting Standards (Ind AS) notified under the Companies (Indian Accounting Standards) Rules, 2015 and other relevant provisions of the Companies Act, 2013 (the “Act”) (as amended from time to time) and Guidance Note on Accounting for Oil and Gas Producing Activities issued by the Institute of Chartered Accountants of India.
These consolidated financial statements have been prepared in accordance with the accounting policies, set out below and were consistently applied to all periods presented unless otherwise stated.
These financial statements are approved for issue by the Board of Directors on 13 May 2021.
All financial information presented in Indian Rupees has been rounded off to the nearest crores except when indicated otherwise. Amounts less than ₹0.50 crores have been presented as “0”.
ii) Certain comparative figures appearing in these consolidated financial statements have been regrouped and/or reclassified to better reflect the nature of those items (Refer note 2(C) below).
(B) Basis of measurement
The consolidated financial statements have been prepared on a going concern basis using historical cost convention and on an accrual method of accounting, except for certain financial assets and liabilities which are measured at fair value as explained in the accounting policies below.
(C) Reclassifications
On an ongoing basis, the management reviews the changes in the nature of the Group’s operations, selection and application of accounting policies and recent accounting pronouncements to assess appropriateness of presentation or classifications of items in the financial statements. For the year ended 31 March 2021, the Group has revised the presentation of the following items, neither of which has any material impact, individually or in the aggregate, on the financial statements:
i) Fly ash disposal expenses amounting to ₹214 crores (Year ended 31 March 2021: ₹406 crores) has been reclassified from ‘Other Expenses’ to ‘Power and Fuel expense’ for the comparative year ended 31 March 2020.
ii) The Group from the current year has decided to present liabilities with respect to operational buyer’s/ suppliers credit and vendor financing (Refer note 20(B)) on the face of the balance sheet, which were previously included under trade payables to enhance the understanding of the financial statements. The value of such liabilities as at 01 April 2019 and 01 April 2020 was ₹8,116 crores and ₹8,945 crores respectively (As at 31 March 2021: ₹7,983 crores).
iii) The constituents of cash and cash equivalents for the purpose of cash flow statement to not consider the earmarked unpaid dividend accounts hitherto included in other bank balance. Consequently, such accounts amounting to ₹96 crores and ₹94 crores as at 31 March 2019 and 31 March 2020 respectively have been excluded from opening and closing cash and cash equivalents in the statement of cash flows for the comparative year ended 31 March 2020.
3(a) SIGNIFICANT ACCOUNTING POLICIES
(A) Basis of Consolidation
i) Subsidiaries:
The consolidated financial statements incorporate the results of the Company and all its subsidiaries (the “Group”), being the entities that it controls. Control is evidenced where the Group has power over the investee, is exposed, or has rights, to variable returns from its involvement with the investee and has the ability to affect those returns through its power over the investee. Power is demonstrated through existing rights that give the ability to direct relevant activities, which significantly affect the entity’s returns.
The financial statements of subsidiaries are prepared for the same reporting year as the parent company. Where necessary, adjustments are made to the financial statements of subsidiaries to align the accounting policies in line with accounting policies of the Group.
For non-wholly-owned subsidiaries, a share of the profit/(loss) for the financial year and net assets is attributed to the non-controlling interests as shown in the consolidated statement of profit and loss and consolidated balance sheet.
Liability for put option issued to non-controlling interests which do not grant present access to ownership interest to the Group is recognised at present value of the redemption amount and is reclassified from equity. At the end of each reporting period, the non-controlling interests subject to put option is derecognised and the difference between the amount derecognised and present value of the redemption amount, which is recorded as a financial liability, is accounted for as an equity transaction.
390
| < BACK TO CONTENTS | Integrated Report | Statutory reports | Financial statements |
Notes
forming part of the consolidated financial statements as at and for the year ended 31 March 2021
For acquisitions of additional interests in subsidiaries, where there is no change in control, the Group recognises a reduction to the non-controlling interest of the respective subsidiary with the difference between this figure and the cash paid, inclusive of transaction fees, being recognised in equity. Similarly, upon dilution of controlling interests the difference between the cash received from sale or listing of the subsidiary shares and the increase to non-controlling interest is also recognised in equity. The results of subsidiaries acquired or disposed off during the year are included in the consolidated statement of profit and loss from the effective date of acquisition or up to the effective date of disposal, as appropriate.
Intra-Group balances and transactions, and any unrealised profit arising from intra-Group transactions, are eliminated. Unrealised losses are eliminated unless costs cannot be recovered.
ii) Joint arrangements
A Joint arrangement is an arrangement of which two or more parties have joint control. Joint control is considered when there is contractually agreed sharing of control of an arrangement, which exists only when decisions about the relevant activities require the unanimous consent of the parties sharing control. Investments in joint arrangements are classified as either joint operations or joint venture. The classification depends on the contractual rights and obligations of each investor, rather than the legal structure of the joint arrangement. A joint operation is a joint arrangement whereby the parties that have joint control of the arrangement have rights to the assets, and obligations for the liabilities, relating to the arrangement. A joint venture is a joint arrangement whereby, the parties that have joint control of the arrangement have rights to the net assets of the arrangement.
The Group has both joint operations and joint ventures.
Joint operations
The Group has joint operations within its Oil and gas segment. It participates in several unincorporated joint operations which involve the joint control of assets used in oil and gas exploration and producing activities. The Group accounts for its share of assets, liabilities, income and expenditure of joint operations in which the Group holds an interest. Liabilities in unincorporated joint operations, where the Group is the operator, is accounted for at gross values (including share of other partners) with a corresponding receivable from the venture partner. These have been included in the consolidated financial statements under the appropriate headings. Details of joint operations are set out in Note 42.
Joint venture
The Group accounts for its interest in joint venture using the equity method (see (iv) below), after initially being recognised at cost in the consolidated balance sheet. Goodwill arising on the
acquisition of joint venture is included in the carrying value of investments in joint venture.
iii) Investments in associates
An associate is an entity over which the Group has significant influence. Significant influence is the power to participate in the financial and operating policy decisions of the investee, but is not control or joint control over those policies. Investments in associates are accounted for using the equity method (see (iv) below). Goodwill arising on the acquisition of associate is included in the carrying value of investments in associate.
iv) Equity method of accounting
Under the equity method of accounting applicable for investments in associates and joint ventures, investments are initially recorded at the cost to the Group and then, in subsequent periods, the carrying value is adjusted to reflect the Group’s share of the post-acquisition profits or losses of the investee, and the Group’s share of other comprehensive income of the investee, other changes to the investee’s net assets and is further adjusted for impairment losses, if any. Dividend received or receivable from associates and joint-ventures are recognised as a reduction in carrying amount of the investment.
The consolidated statement of profit and loss include the Group’s share of investee’s results, except where the investee is generating losses, share of such losses in excess of the Group’s interest in that investee are not recognised. Losses recognised under the equity method in excess of the Group’s investment in ordinary shares are applied to the other components of the Group’s interest that forms part of Group’s net investment in the investee in the reverse order of their seniority (i.e. priority in liquidation).
If the Group’s share of losses in an associate or joint venture equals or exceeds its interests in the associate or joint venture, the Group discontinues the recognition of further losses. Additional losses are provided for, only to the extent that the Group has incurred legal or constructive obligations or made payments on behalf of the associate/joint venture.
Unrealised gains arising from transactions with associates and joint ventures are eliminated against the investment to the extent of the Group’s interest in these entities. Unrealised losses are eliminated in the same way as unrealised gains, but only to the extent that there is no evidence of impairment of the asset transferred. Accounting policies of equity accounted investees is changed where necessary to ensure consistency with the policies adopted by the Group.
The carrying amount of equity accounted investments are tested for impairment in accordance with the policy described in Note below 3(a)(H).
VEDANTA LIMITED | INTEGRATED REPORT AND ANNUAL ACCOUNTS 2020-21 | 391
CONSOLIDATED CONTINUED...
Notes
forming part of the consolidated financial statements as at and for the year ended 31 March 2021
(B) Business combination
Business combinations are accounted for under the purchase method. The acquiree’s identifiable assets, liabilities and contingent liabilities that meet the conditions for recognition under Ind AS 103 ‘Business Combinations’ are recognised at their fair value at the acquisition date, except certain assets and liabilities required to be measured as per the applicable standards.
Excess of fair value of purchase consideration and the acquisition date non-controlling interest over the acquisition date fair value of identifiable assets acquired and liabilities assumed is recognised as goodwill. Goodwill arising on acquisitions is reviewed for impairment annually. Where the fair values of the identifiable assets and liabilities exceed the purchase consideration, the Group re-assesses whether it has correctly identified all of the assets acquired and all of the liabilities assumed and reviews the procedures used to measure the amounts to be recognised at the acquisition date. If the reassessment still results in an excess of the fair value of net assets acquired over the aggregate consideration transferred, then the gain is recognised in other comprehensive income and accumulated in equity as capital reserve. However, if there is no clear evidence of bargain purchase, the Group recognises the gain directly in equity as capital reserve, without routing the same through other comprehensive income.
Where it is not possible to complete the determination of fair values by the date on which the first post-acquisition financial statements are approved, a provisional assessment of fair value is made and any adjustments required to those provisional fair values are finalised within 12 months of the acquisition date.
Those provisional amounts are adjusted through goodwill during the measurement period, or additional assets or liabilities are recognised, to reflect new information obtained about facts and circumstances that existed at the acquisition date that, if known, would have affected the amounts recognised at that date. These adjustments are called as measurement period adjustments. The measurement period does not exceed twelve months from the acquisition date.
Any non-controlling interest in an acquiree is measured at fair value or at the non-controlling interest’s proportionate share of the acquiree’s net identifiable assets. This accounting choice is made on a transaction by transaction basis.
Acquisition expenses are charged to the consolidated statement of profit and loss.
If the Group acquires a group of assets in a company that does not constitute a business combination in accordance with Ind AS 103 ‘Business Combinations’, the cost of the acquired group of assets is allocated to the individual identifiable assets acquired based on their relative fair value.
Common control transactions
A business combination involving entities or businesses under common control is a business combination in which all of the combining entities or businesses are ultimately controlled by the same party or parties both before and after the business combination and the control is not transitory. The transactions between entities under common control are specifically covered by Ind AS 103. Such transactions are accounted for using the pooling- of-interest method. The assets and liabilities of the acquired entity are recognised at their carrying amounts recorded in the parent entity’s consolidated financial statements with the exception of certain income tax and deferred tax assets. No adjustments are made to reflect fair values, or recognise any new assets or liabilities. The only adjustments that are made are to harmonise accounting policies.
The components of equity of the acquired companies are added to the same components within Group equity. The difference, if any, between the amounts recorded as share capital issued plus any additional consideration in the form of cash or other assets and the amount of share capital of the transferor is transferred to capital reserve and is presented separately from other capital reserves. The Company’s shares issued in consideration for the acquired companies are recognised at face value from the moment the acquired companies are included in these financial statements and the financial statements of the commonly controlled entities would be combined, retrospectively, as if the transaction had occurred at the beginning of the earliest reporting period presented. However, the prior year comparative information is only adjusted for periods during which entities were under common control.
(C) Revenue recognition
| • | Sale of goods/rendering of services (Including Revenue from contracts with customers) |
The Group’s revenue from contracts with customers is mainly from the sale of copper, aluminium, iron ore, zinc, oil and gas, power, steel, glass substrate and port operations. Revenue from contracts with customers is recognised when control of the goods or services is transferred to the customer which usually is on delivery of the goods to the shipping agent at an amount that reflects the consideration to which the Group expects to be entitled in exchange for those goods or services. Revenue is recognised net of discounts, volume rebates, outgoing sales taxes/goods and service tax and other indirect taxes. Revenues from sale of by-products are included in revenue.
392
| < BACK TO CONTENTS | Integrated Report | Statutory reports | Financial statements |
Notes
forming part of the consolidated financial statements as at and for the year ended 31 March 2021
Certain of the Group’s sales contracts provide for provisional pricing based on the price on the London Metal Exchange (LME) and crude index, as specified in the contract. Revenue in respect of such contracts is recognised when control passes to the customer and is measured at the amount the entity expects to be entitled – being the estimate of the price expected to be received at the end of the measurement period. Post transfer of control of goods, provisional pricing features are accounted in accordance with Ind AS 109 ‘Financial Instruments’ rather than Ind AS 115 ‘Revenue from contracts with customers’ and therefore the Ind AS 115 rules on variable consideration do not apply. These
‘provisional pricing’ adjustments i.e. the consideration adjusted post transfer of control are included in total revenue from operations on the face of the consolidated statement of profit and loss and disclosed by way of note to the financial statements. Final settlement of the price is based on the applicable price for a specified future period. The Group’s provisionally priced sales are marked to market using the relevant forward prices for the future period specified in the contract and is adjusted in revenue.
Revenue from oil, gas and condensate sales represent the Group’s share in the revenue from sale of such products, by the joint operations, and is recognised as and when control in these products gets transferred to the customers. In computing its share of revenue, the Group excludes government’s share of profit oil which gets accounted for when the obligation in respect of the same arises.
Revenue from sale of power is recognised when delivered and measured based on rates as per bilateral contractual agreements with buyers and at a rate arrived at based on the principles laid down under the relevant Tariff Regulations as notified by the regulatory bodies, as applicable.
Where the Group acts as a port operator, revenues relating to operating and maintenance phase of the port contract are measured at the amount that Group expects to be entitled to for the services provided.
A contract asset is the right to consideration in exchange for goods or services transferred to the customer. If the Group performs part of its obligation by transferring goods or services to a customer before the customer pays consideration or before payment is due, a contract asset is recognised for the earned consideration when that right is conditional on the Group’s future performance.
A contract liability is the obligation to transfer goods or services to a customer for which the Group has received consideration from the customer. If a customer pays consideration before the Group transfers goods or services to the customer, a contract liability is recognised when the payment is received. The advance payments received plus a specified rate of return/discount, at the prevailing market rates, is settled by supplying respective goods over a period of up to twenty four months under an agreed delivery schedule as per the terms of the respective agreements. As these are contracts that the Group expects, and has the ability, to fulfil through delivery of a non-financial item, these are presented as advance from customers and are recognised as revenue as and when control of respective commodities is transferred to customers under the agreements. The fixed rate of return/discount is treated as finance cost. The portion of the advance where either the Group does not have a unilateral right to defer settlement beyond 12 months or expects settlement within 12 months from the balance sheet date is classified as current liability.
• Interest income
Interest income from debt instruments is recognised using the effective interest rate method. The effective interest rate is the rate that exactly discounts estimated future cash receipts through the expected life of the financial asset to the gross carrying amount of a financial asset. When calculating the effective interest rate, the Group estimates the expected cash flows by considering all the contractual terms of the financial instrument (for example, prepayment, extension, call and similar options) but does not consider the expected credit losses.
• Dividends
Dividend income is recognised in the consolidated statement of profit and loss only when the right to receive payment is established, provided it is probable that the economic benefits associated with the dividend will flow to the Group, and the amount of the dividend can be measured reliably.
(D) Property, Plant and Equipment
i) Mining properties and leases
When a decision is taken that a mining property is viable for commercial production (i.e. when the Group determines that the mining property will provide sufficient and sustainable return relative to the risks and the Group decided to proceed with the mine development), all further pre-production primary development expenditure other than that on land, buildings, plant, equipment and capital work-in-progress is capitalised as property, plant and equipment under the heading “Mining properties and leases” together with any amount transferred from “Exploration and evaluation” assets. The costs of mining properties and leases include the costs of acquiring and developing mining properties and mineral rights.
VEDANTA LIMITED | INTEGRATED REPORT AND ANNUAL ACCOUNTS 2020-21 | 393
CONSOLIDATED CONTINUED...
Notes
forming part of the consolidated financial statements as at and for the year ended 31 March 2021
The stripping cost incurred during the production phase of a surface mine is deferred to the extent the current period stripping cost exceeds the average period stripping cost over the life of mine and recognised as an asset if such cost provides a benefit in terms of improved access to ore in future periods and certain criteria are met. When the benefit from the stripping costs are realised in the current period, the stripping costs are accounted for as the cost of inventory. If the costs of inventory produced and the stripping activity asset are not separately identifiable, a relevant production measure is used to allocate the production stripping costs between the inventory produced and the stripping activity asset. The Group uses the expected volume of waste compared with the actual volume of waste extracted for a given value of ore/mineral production for the purpose of determining the cost of the stripping activity asset.
Deferred stripping costs are included in mining properties within property, plant and equipment and disclosed as a part of mining properties. After initial recognition, the stripping activity asset is depreciated on a unit of production method over the expected useful life of the identified component of the ore body.
In circumstances where a mining property is abandoned, the cumulative capitalised costs relating to the property are written off in the period in which it occurs i.e. when the Group determines that the mining property will not provide sufficient and sustainable returns relative to the risks and the Group decides not to proceed with the mine development.
Commercial reserves are proved and probable reserves as defined by the ‘JORC’ Code, ‘MORC’ code or ‘SAMREC’ Code. Changes in the commercial reserves affecting unit of production calculations are dealt with prospectively over the revised remaining reserves.
| ii) | Oil and gas assets – (developing/producing assets) |
For oil and gas assets, a “successful efforts” based accounting policy is followed. Costs incurred prior to obtaining the legal rights to explore an area are expensed immediately to the consolidated statement of profit and loss.
All costs incurred after the technical feasibility and commercial viability of producing hydrocarbons has been demonstrated are capitalised within property, plant and equipment – development/producing assets on a field- by-field basis. Subsequent expenditure is capitalised only where it either enhances the economic benefits of the development/ producing asset or replaces part of the existing development/ producing asset. Any remaining costs associated with the part replaced are expensed.
Net proceeds from any disposal of development/ producing assets are credited against the previously capitalised cost. A gain or loss on disposal of a development/producing asset is recognised in the consolidated statement of profit and loss to the extent that the net proceeds exceed or are less than the appropriate portion of the net capitalised costs of the asset.
| iii) | Other property, plant and equipment |
The initial cost of property, plant and equipment comprises its purchase price, including import duties and non-refundable purchase taxes, and any directly attributable costs of bringing an asset to working condition and location for its intended use. It also includes the initial estimate of the costs of dismantling and removing the item and restoring the site on which it is located.
Land acquired free of cost or at below market rate from the government is recognised at fair value with corresponding credit to deferred income.
If significant parts of an item of property, plant and equipment have different useful lives, then they are accounted for as separate items (major components) of property, plant and equipment. All other expenses on existing property, plant and equipment, including day-to-day repair and maintenance expenditure and cost of replacing parts, are charged to the consolidated statement of profit and loss for the period during which such expenses are incurred.
Gains and losses on disposal of an item of property, plant and equipment computed as the difference between the net disposal proceeds and the carrying amount of the asset is included in the consolidated statement of profit and loss when the asset is derecognised. Major inspection and overhaul expenditure is capitalised, if the recognition criteria are met.
| iv) | Assets under construction |
Assets under construction are capitalised in the assets under construction account. At the point when an asset is capable of operating in the manner intended by management, the cost of construction is transferred to the appropriate category of property, plant and equipment. Costs associated with the commissioning of an asset and any obligatory decommissioning costs are capitalised until the period of commissioning has been completed and the asset is ready for its intended use.
| v) | Depreciation, depletion and amortisation expense |
Mining properties and other assets in the course of development or construction and freehold land and goodwill are not depreciated or amortised.
394
| < BACK TO CONTENTS | Integrated Report | Statutory reports | Financial statements |
Notes
forming part of the consolidated financial statements as at and for the year ended 31 March 2021
| • | Mining properties |
The capitalised mining properties are amortised on a unit-of-production basis over the total estimated remaining commercial proved and probable reserves of each property or group of properties and are subject to impairment review. Costs used in the unit of production calculation comprise the net book value of capitalised costs plus the estimated future capital expenditure required to access the commercial reserves. Changes in the estimates of commercial reserves or future capital expenditure are dealt with prospectively.
| • | Oil and gas producing facilities |
All expenditures carried within each field are amortised from the commencement of production on a unit of production basis, which is the ratio of oil and gas production in the period to the estimated quantities of depletable reserves at the end of the period plus the production in the period, generally on a field-by-field basis or group of fields which are reliant on common infrastructure.
Depletable reserves are proved reserves for acquisition costs and proved and developed reserves for successful exploratory wells, development wells, processing facilities, distribution assets, estimated future abandonment cost and all other related costs. These assets are depleted within each cost centre. Reserves for this purpose are considered on working interest basis which are reassessed atleast annually. Impact of changes to reserves are accounted for prospectively.
| • | Other assets |
Depreciation on other Property, plant and equipment is calculated using the straight-line method (SLM) to allocate their cost, net of their residual values, over their estimated useful lives (determined by the management) as given below.
Management’s assessment takes into account, inter alia, the nature of the assets, the estimated usage of the assets, the operating conditions of the assets, past history of replacement and maintenance support. Estimated useful life of assets are as follows:
Asset | Useful life (in years) | |||
Buildings (Residential; factory etc.) | 3-60 | |||
Plant and equipment | 15-40 | |||
Railway siding | 15 | |||
Office equipment | 3-6 | |||
Furniture and fixture | 8-10 | |||
Vehicles | 8-10 | |||
Major inspection and overhaul costs are depreciated over the estimated life of the economic benefit to be derived from such costs. The carrying amount of the remaining previous overhaul cost is charged to the consolidated
statement of profit and loss if the next overhaul is undertaken earlier than the previously estimated life of the economic benefit.
The Group reviews the residual value and useful life of an asset at least at each financial year-end and, if expectations differ from previous estimates, the change is accounted for as a change in accounting estimate.
| (E) | Intangible assets |
Intangible assets acquired separately are measured on initial recognition at cost. Subsequently, intangible assets are measured at cost less accumulated amortisation and accumulated impairment losses, if any.
The Group recognises port concession rights as “Intangible Assets” arising from a service concession arrangements, in which the grantor controls or regulates the services provided and the prices charged, and also controls any significant residual interest in the infrastructure such as property, plant and equipment, irrespective whether the infrastructure is existing infrastructure of the grantor or the infrastructure is constructed or purchased by the Group as part of the service concession arrangement. Such an intangible asset is recognised by the Group initially at cost determined as the fair value of the consideration received or receivable for the construction service delivered and is capitalised when the project is complete in all respects. Port concession rights are amortised on straight line basis over the balance of license period. The concession period is 30 years from the date of the award. Any addition to the port concession rights are measured at fair value on recognition. Port concession rights also include certain property, plant and equipment in accordance with Appendix C of Ind AS 115 “service concession arrangements.”
Intangible assets are amortised over their estimated useful life on a straight line basis. Software is amortised over the estimated useful life ranging from 2-5 years. Amounts paid for securing mining rights are amortised over the period of the mining lease ranging from 16-25 years. Technological know-how and acquired brand are amortised over the estimated useful life of ten years.
Gains or losses arising from derecognition of an intangible asset are measured as the difference between the net disposal proceeds and the carrying amount of the asset and are recognised in the consolidated statement of profit and loss when the asset is derecognised.
The amortisation period and the amortisation method are reviewed at least at each financial year end. If the expected useful life of the asset is different from previous estimates, the change is accounted for prospectively as a change in accounting estimate.
VEDANTA LIMITED | INTEGRATED REPORT AND ANNUAL ACCOUNTS 2020-21 | 395
CONSOLIDATED CONTINUED...
Notes
forming part of the consolidated financial statements as at and for the year ended 31 March 2021
| (F) | Exploration and evaluation intangible assets |
Exploration and evaluation expenditure incurred prior to obtaining the mining right or the legal right to explore are expensed as incurred.
Exploration and evaluation expenditure incurred after obtaining the mining right or the legal right to explore are capitalised as exploration and evaluation assets (intangible assets) and stated at cost less impairment, if any. Exploration and evaluation intangible assets are transferred to the appropriate category of property, plant and equipment when the technical feasibility and commercial viability has been determined. Exploration intangible assets under development are assessed for impairment and impairment loss, if any, is recognised prior to reclassification.
Exploration expenditure includes all direct and allocated indirect expenditure associated with finding specific mineral resources which includes depreciation and applicable operating costs of related support equipment and facilities and other costs of exploration activities:
| • | Acquisition costs – costs associated with acquisition of licenses and rights to explore, including related professional fees. |
| • | General exploration costs – costs of surveys and studies, rights of access to properties to conduct those studies (e.g. costs incurred for environment clearance, defence clearance, etc.), and salaries and other expenses of geologists, geophysical crews and other personnel conducting those studies. |
| • | Costs of exploration drilling and equipping exploration and appraisal wells. |
Exploration expenditure incurred in the process of determining oil and gas exploration targets is capitalised within “Exploration and evaluation assets” (intangible assets) and subsequently allocated to drilling activities. Exploration drilling costs are initially capitalised on a well-by-well basis until the success or otherwise of the well has been established. The success or failure of each exploration effort is judged on a well-by-well basis. Drilling costs are written off on completion of a well unless the results indicate that hydrocarbon reserves exist and there is a reasonable prospect that these reserves are commercial.
Following appraisal of successful exploration wells, if commercial reserves are established and technical feasibility for extraction demonstrated, then the related capitalised exploration costs are transferred into a single field cost centre within property, plant and equipment—development/producing assets (oil and gas properties) after testing for impairment. Where results of exploration
drilling indicate the presence of hydrocarbons which are ultimately not considered commercially viable, all related costs are written off to the consolidated statement of profit and loss.
Expenditure incurred on the acquisition of a license interest is initially capitalised on a license-by-license basis. Costs are held, undepleted, within exploration and evaluation assets until such time as the exploration phase on the license area is complete or commercial reserves have been discovered.
Net proceeds from any disposal of an exploration asset are initially credited against the previously capitalised costs. Any surplus/deficit is recognised in the consolidated statement of profit and loss.
| (G) | Non-current assets held for sale |
Non-current assets and disposal groups are classified as held for sale if their carrying amount will be recovered through a sale transaction rather than through continuing use. This condition is regarded as met only when the sale is highly probable and the asset (or disposal group) is available for immediate sale in its present condition. Management must be committed to the sale which should be expected to qualify for recognition as a completed sale within one year from the date of classification.
Non-current assets and disposal groups classified as held for sale are not depreciated and are measured at the lower of carrying amount and fair value less costs to sell. Such assets and disposal groups are presented separately on the face of the consolidated balance sheet.
| (H) | Impairment of non-financial assets |
Impairment charges and reversals are assessed at the level of cash-generating units. A cash-generating unit (CGU) is the smallest identifiable group of assets that generate cash inflows that are largely independent of the cash inflows from other assets or group of assets. The Group assesses at each reporting date, whether there is an indication that an asset may be impaired.
The Group conducts an internal review of asset values annually, which is used as a source of information to assess for any indications of impairment or reversal of previously recognised impairment losses. Internal and external factors, such as worse economic performance than expected, changes in expected future prices, costs and other market factors are also monitored to assess for indications of impairment or reversal of previously recognised impairment losses.
396
| < BACK TO CONTENTS | Integrated Report | Statutory reports | Financial statements |
Notes
forming part of the consolidated financial statements as at and for the year ended 31 March 2021
If any such indication exists or in case of goodwill where annual testing of impairment is required, then an impairment review is undertaken and the recoverable amount is calculated, as the higher of fair value less costs of disposal and the asset’s value in use.
Fair value less costs of disposal is the price that would be received to sell the asset in an orderly transaction between market participants and does not reflect the effects of factors that may be specific to the Group and not applicable to entities in general. Fair value for mineral and oil and gas assets is generally determined as the present value of the estimated future cash flows expected to arise from the continued use of the asset, including any expansion prospects, and its eventual disposal, using assumptions that an independent market participant may take into account. These cash flows are discounted at an appropriate post tax discount rate to arrive at the net present value.
Value in use is determined as the present value of the estimated future cash flows expected to arise from the continued use of the asset in its present form and its eventual disposal. The cash flows are discounted using a pre-tax discount rate that reflects current market assessments of the time value of money and the risks specific to the asset for which estimates of future cash flows have not been adjusted. Value in use is determined by applying assumptions specific to the Group’s continued use and cannot take into account future development. These assumptions are different to those used in calculating fair value and consequently the value in use calculation is likely to give a different result to a fair value calculation.
The carrying amount of the CGU is determined on a basis consistent with the way the recoverable amount of the CGU is determined. The carrying value is net of deferred tax liability recognised in the fair value of assets acquired in the business combination.
If the recoverable amount of an asset or CGU is estimated to be less than its carrying amount, the carrying amount of the asset or CGU is reduced to its recoverable amount. An impairment loss is recognised in the consolidated statement of profit and loss.
Any reversal of the previously recognised impairment loss is limited to the extent that the asset’s carrying amount does not exceed the carrying amount that would have been determined if no impairment loss had previously been recognised except if initially attributed to goodwill.
Exploration and evaluation intangible assets:
In assessing whether there is any indication that an exploration and evaluation asset may be impaired, the Group considers, as a minimum, the following indicators:
| • | the period for which the Group has the right to explore in the specific area has expired during the period or will expire in the near future, and is not expected to be renewed; |
| • | substantive expenditure on further exploration for and evaluation of mineral resources in the specific area is neither budgeted nor planned; |
| • | exploration for and evaluation of mineral resources in the specific area have not led to the discovery of commercially viable quantities of mineral resources and the Group has decided to discontinue such activities in the specific area; |
| • | sufficient data exist to indicate that, although a development in the specific area is likely to proceed, the carrying amount of the exploration and evaluation asset is unlikely to be recovered in full from successful development or by sale; and |
| • | reserve information prepared annually by external experts. |
When a potential impairment is identified, an assessment is performed for each area of interest in conjunction with the group of operating assets (representing a cash-generating unit) to which the exploration and evaluation assets is attributed. Exploration areas in which reserves have been discovered but require major capital expenditure before production can begin, are continually evaluated to ensure that commercial quantities of reserves exist or to ensure that additional exploration work is underway or planned. To the extent that capitalised expenditure is no longer expected to be recovered, it is charged to the consolidated statement of profit and loss.
| (I) | Financial instruments |
A financial instrument is any contract that gives rise to a financial asset of one entity and a financial liability or equity instrument of another entity.
| (i) | Financial Assets – recognition & subsequent measurement |
All financial assets are recognised initially at fair value plus, in the case of financial assets not recorded at fair value through profit or loss, transaction costs that are attributable to the acquisition of the financial asset. Purchases or sales of financial assets that require delivery of assets within a time frame established by regulation or convention in the market place (regular way trades) are recognised on the trade date, i.e. the date that the Group commits to purchase or sell the asset.
For purposes of subsequent measurement, financial assets are classified in four categories:
| • | Debt instruments at amortised cost |
A ‘debt instrument’ is measured at amortised cost if both the following conditions are met:
VEDANTA LIMITED | INTEGRATED REPORT AND ANNUAL ACCOUNTS 2020-21 | 397
CONSOLIDATED CONTINUED...
Notes
forming part of the consolidated financial statements as at and for the year ended 31 March 2021
| a) | The asset is held within a business model whose objective is to hold assets for collecting contractual cash flows, and |
| b) | Contractual terms of the asset give rise on specified dates to cash flows that are solely payments of principal and interest (SPPI) on the principal amount outstanding. |
After initial measurement, such financial assets are subsequently measured at amortised cost using the Effective Interest Rate (EIR) method. Amortised cost is calculated by taking into account any discount or premium on acquisition and fees or costs that are an integral part of the EIR. The EIR amortisation is included in interest income in consolidated statement of profit and loss. The losses arising from impairment are recognised in consolidated statement of profit and loss.
| • | Debt instruments at fair value through other comprehensive income (FVOCI) |
A ‘debt instrument’ is classified as at FVOCI if both of the following criteria are met:
| a) | The objective of the business model is achieved both by collecting contractual cash flows and selling the financial assets, and |
| b) | The asset’s contractual cash flows represent SPPI. |
Debt instruments included within the FVOCI category are measured initially as well as at each reporting date at fair value. Fair value movements are recognised in other comprehensive income (OCI). However, interest income, impairment losses and reversals and foreign exchange gain or loss are recognised in the consolidated statement of profit and loss. On derecognition of the asset, cumulative gain or loss previously recognised in other comprehensive income is reclassified from the equity to consolidated statement of profit and loss. Interest earned whilst holding fair value through other comprehensive income debt instrument is reported as interest income using the EIR method.
| • | Debt instruments at fair value through profit or loss (FVTPL) FVTPL is a residual category for debt instruments. Any debt instrument, which does not meet the criteria for categorisation as at amortised cost or as FVOCI, is classified as at FVTPL. |
In addition, the Group may elect to designate a debt instrument, which otherwise meets amortised cost or FVOCI criteria, as at FVTPL. However, such election is allowed only if doing so reduces or eliminates a measurement or recognition inconsistency (referred to as ‘accounting mismatch’). The Group has not designated any debt instrument as at FVTPL.
Debt instruments included within the FVTPL category are measured at fair value with all changes being recognised in consolidated statement of profit and loss.
| • | Equity instruments |
All equity investments in the scope of Ind AS 109 are measured at fair value. Equity instruments which are held for trading and contingent consideration recognised by an acquirer in a business combination to which Ind AS 103 applies are classified as at FVTPL. For all other equity instruments, the Group may make an irrevocable election to present in other comprehensive income subsequent changes in the fair value. The Group makes such election on an instrument-by-instrument basis. The classification is made on initial recognition and is irrevocable.
If the Group decides to classify an equity instrument as at FVOCI, then all fair value changes on the instrument, excluding dividends, are recognised in the OCI. There is no recycling of the amounts from OCI to profit and loss, even on sale of investment. However, the Group may transfer the cumulative gain or loss within equity. For equity instruments which are classified as FVTPL, all subsequent fair value changes are recognised in the consolidated statement of profit and loss.
| (ii) | Financial Assets – derecognition |
The Group derecognises a financial asset when the contractual rights to the cash flows from the asset expire, or it transfers the rights to receive the contractual cash flows on the financial asset in a transaction in which substantially all the risks and rewards of ownership of the financial asset are transferred.
| (iii) | Impairment of financial assets |
In accordance with Ind AS 109, the Group applies expected credit loss (“ECL”) model for measurement and recognition of impairment loss on the following financial assets:
| a) | Financial assets that are debt instruments, and are measured at amortised cost e.g. loans, debt securities and deposits |
| b) | Financial assets that are debt instruments and are measured as at FVOCI |
| c) | Trade receivables or any contractual right to receive cash or another financial asset that result from transactions that are within the scope of Ind AS 115. |
The Group follows ‘simplified approach’ for recognition of impairment loss allowance on trade receivables, contract assets and lease receivables. The application of simplified approach does not require the Group to track changes in credit risk. Rather, it recognises impairment loss allowance based on lifetime ECLs at each reporting date, right from its initial recognition.
398
| < BACK TO CONTENTS | Integrated Report | Statutory reports | Financial statements |
Notes
forming part of the consolidated financial statements as at and for the year ended 31 March 2021
At each reporting date, for recognition of impairment loss on other financial assets and risk exposure, the Group determines whether there has been a significant increase in the credit risk since initial recognition. If credit risk has not increased significantly, 12-month ECL is used to provide for impairment loss. However, if credit risk has increased significantly, lifetime ECL is used. If, in a subsequent period, credit quality of the instrument improves such that there is no longer a significant increase in credit risk since initial recognition, then the Group reverts to recognising impairment loss allowance based on 12-month ECL.
Lifetime ECL are the expected credit losses resulting from all possible default events over the expected life of a financial instrument. The 12-month ECL is a portion of the lifetime ECL which results from default events that are possible within 12 months after the reporting date.
ECL is the difference between all contractual cash flows that are due to the Group in accordance with the contract and all the cash flows that the entity expects to receive, discounted at the original EIR.
ECL impairment loss allowance (or reversal) during the year is recognised as income/expense in consolidated statement of profit and loss. The balance sheet presentation for various financial instruments is described below:
| a) | Financial assets measured at amortised cost: ECL is presented as an allowance, i.e. as an integral part of the measurement of those assets. The Group does not reduce impairment allowance from the gross carrying amount. |
| b) | Debt instruments measured at FVOCI: Since financial assets are already reflected at fair value, impairment allowance is not further reduced from its value. Rather, ECL amount is presented as ‘accumulated impairment amount’ in the OCI. |
For assessing increase in credit risk and impairment loss, the Group combines financial instruments on the basis of shared credit risk characteristics with the objective of facilitating an analysis that is designed to enable significant increases in credit risk to be identified on a timely basis.
The Group does not have any purchased or originated credit-impaired (POCI) financial assets, i.e. financial assets which are credit impaired on purchase/origination.
(iv) Financial liabilities – Recognition & Subsequent measurement
Financial liabilities are classified, at initial recognition, as financial liabilities at fair value through profit or loss, or as loans and borrowings, payables, or as derivatives designated as hedging instruments in an effective hedge, as appropriate.
All financial liabilities are recognised initially at fair value, and in the case of financial liabilities at amortised cost, net of directly attributable transaction costs.
The Group’s financial liabilities include trade and other payables, loans and borrowings including bank overdrafts, financial guarantee contracts and derivative financial instruments.
The measurement of financial liabilities depends on their classification, as described below:
| • | Financial liabilities at fair value through profit or loss |
Financial liabilities at fair value through profit or loss include financial liabilities held for trading and financial liabilities designated upon initial recognition as at fair value through profit or loss. Financial liabilities are classified as held for trading if they are incurred for the purpose of repurchasing in the near term. This category also includes derivative financial instruments entered into by the Group that are not designated as hedging instruments in hedge relationships as defined by Ind AS 109. Separated embedded derivatives are also classified as held for trading unless they are designated as effective hedging instruments.
Gains or losses on liabilities held for trading are recognised in the consolidated statement of profit and loss.
Financial liabilities designated upon initial recognition at fair value through profit or loss are designated as such at the initial date of recognition, and only if the criteria in Ind AS 109 are satisfied. For liabilities designated as FVTPL, fair value gains/losses attributable to changes in own credit risk are recognised in OCI. These gains/ losses are not subsequently transferred to consolidated income statement. However, the Group may transfer the cumulative gain or loss within equity. All other changes in fair value of such liability are recognised in the consolidated statement of profit and loss. The Group has not designated any financial liability as at fair value through profit or loss.
| • | Financial liabilities at amortised cost (Loans and Borrowings and Trade and Other payables) |
After initial recognition, interest-bearing loans and borrowings and trade and other payables are subsequently measured at amortised cost using the EIR method. Gains and losses are recognised in the consolidated statement of profit and loss when the liabilities are derecognised as well as through the EIR amortisation process.
Amortised cost is calculated by taking into account any discount or premium on acquisition and fees or costs that are an integral part of the EIR. The EIR amortisation is included as finance costs in the consolidated statement of profit and loss.
VEDANTA LIMITED | INTEGRATED REPORT AND ANNUAL ACCOUNTS 2020-21 | 399
CONSOLIDATED CONTINUED...
Notes
forming part of the consolidated financial statements as at and for the year ended 31 March 2021
(v) Financial liabilities – Derecognition
A financial liability is derecognised when the obligation under the liability is discharged or cancelled or expires. When an existing financial liability is replaced by another from the same lender on substantially different terms, or the terms of an existing liability are substantially modified, such an exchange or modification is treated as the derecognition of the original liability and the recognition of a new liability. The difference in the respective carrying amounts is recognised in the consolidated statement of profit and loss.
(vi) Embedded derivatives
An embedded derivative is a component of a hybrid (combined) instrument that also includes a non- derivative host contract – with the effect that some of the cash flows of the combined instrument vary in a way similar to a stand-alone derivative. An embedded derivative causes some or all of the cash flows that otherwise would be required by the contract to be modified according to a specified interest rate, financial instrument price, commodity price, foreign exchange rate, index of prices or rates, credit rating or credit index, or other variable, provided in the case of a non-financial variable that the variable is not specific to a party to the contract. Reassessment only occurs if there is either a change in the terms of the contract that significantly modifies the cash flows that would otherwise be required or a reclassification of a financial asset out of the fair value through profit or loss.
If the hybrid contract contains a host that is a financial asset within the scope of Ind AS 109, the Group does not separate embedded derivatives. Rather, it applies the classification requirements contained in Ind AS 109 to the entire hybrid contract. Derivatives embedded in all other host contracts are accounted for as separate derivatives and recorded at fair value if their economic characteristics and risks are not closely related to those of the host contracts and the host contracts are not held for trading or designated at fair value though profit or loss. These embedded derivatives are measured at fair value with changes in fair value recognised in consolidated statement of profit and loss, unless designated as effective hedging instruments.
(vii) Equity instruments
An equity instrument is any contract that evidences a residual interest in the assets of an entity after deducting all of its liabilities. Equity instruments issued by the Group are recognised at the proceeds received, net of direct issue costs.
(viii) Offsetting of financial instruments
Financial assets and financial liabilities are offset and the net amount is reported in the consolidated balance sheet if there is a currently enforceable legal right to offset the recognised amounts and there is an intention to settle on a net basis or to realise the asset and settle the liability simultaneously.
(J) Derivative financial instruments and hedge accounting
Initial recognition and subsequent measurement
In order to hedge its exposure to foreign exchange, interest rate, and commodity price risks, the Group enters into forward, option, swap contracts and other derivative financial instruments. The Group does not hold derivative financial instruments for speculative purposes. Such derivative financial instruments are initially recognised at fair value on the date on which a derivative contract is entered into and are subsequently re-measured at fair value. Derivatives are carried as financial assets when the fair value is positive and as financial liabilities when the fair value is negative.
Any gains or losses arising from changes in the fair value of derivatives are taken directly to consolidated statement of profit and loss, except for the effective portion of cash flow hedges, which is recognised in OCI and later reclassified to consolidated statement of profit and loss when the hedge item affects profit or loss or treated as basis adjustment if a hedged forecast transaction subsequently results in the recognition of a non-financial asset or non-financial liability.
For the purpose of hedge accounting, hedges are classified as:
| • | Fair value hedges when hedging the exposure to changes in the fair value of a recognised asset or liability or an unrecognised firm commitment |
| • | Cash flow hedges when hedging the exposure to variability in cash flows that is either attributable to a particular risk associated with a recognised asset or liability or a highly probable forecast transaction or the foreign currency risk in an unrecognised firm commitment |
| • | Hedges of a net investment in a foreign operation |
400
| < BACK TO CONTENTS | Integrated Report | Statutory reports | Financial statements |
Notes
forming part of the consolidated financial statements as at and for the year ended 31 March 2021
At the inception of a hedge relationship, the Group formally designates and documents the hedge relationship to which the Group wishes to apply hedge accounting. The documentation includes the Group’s risk management objective and strategy for undertaking hedge, the hedging/economic relationship, the hedged item or transaction, the nature of the risk being hedged, hedge ratio and how the Group will assess the effectiveness of changes in the hedging instrument’s fair value in offsetting the exposure to changes in the hedged item’s fair value or cash flows attributable to the hedged risk. Such hedges are expected to be highly effective in achieving offsetting changes in fair value or cash flows and are assessed on an ongoing basis to determine that they actually have been highly effective throughout the financial reporting periods for which they were designated.
Hedges that meet the strict criteria for hedge accounting are accounted for, as described below:
| (i) | Fair value hedges |
Changes in the fair value of derivatives that are designated and qualify as fair value hedges are recognised in consolidated statement of profit and loss immediately, together with any changes in the fair value of the hedged asset or liability that are attributable to the hedged risk.
When an unrecognised firm commitment is designated as a hedged item, the subsequent cumulative change in the fair value of the firm commitment attributable to the hedged risk is recognised as an asset or liability with a corresponding gain or loss recognised in consolidated statement of profit and loss. Hedge accounting is discontinued when the group revokes the hedge relationship, the hedging instrument or hedged item expires or is sold, terminated, or exercised or no longer meets the criteria for hedge accounting.
| (ii) | Cash flow hedges |
The effective portion of the gain or loss on the hedging instrument is recognised in OCI in the cash flow hedge reserve, while any ineffective portion is recognised immediately in the consolidated statement of profit and loss.
Amounts recognised in OCI are transferred to consolidated statement of profit and loss when the hedged transaction affects profit or loss, such as when the hedged financial income or financial expense is recognised or when a forecast sale occurs. When the hedged item is the cost of a non-financial asset or non-financial liability, the amounts recognised in OCI are transferred to the initial carrying amount of the non-financial asset or liability.
If the hedging instrument expires or is sold, terminated or exercised without replacement or rollover (as part of the hedging strategy), or if its designation as a hedge is revoked, or when the hedge no longer meets the criteria for hedge accounting, any cumulative gain or loss previously recognised in OCI remains separately in equity until the forecast transaction occurs or the foreign currency firm commitment is met.
| (iii) | Hedges of a net investment |
Hedges of a net investment in a foreign operation, including a hedge of a monetary item that is accounted for as part of the net investment, are accounted for in a way similar to cash flow hedges. Gains or losses on the hedging instrument relating to the effective portion of the hedge are recognised in OCI while any gains or losses relating to the ineffective portion are recognised in the consolidated statement of profit and loss. On disposal of the foreign operation, the cumulative value of any such gains or losses recorded in equity is reclassified to the consolidated statement of profit and loss (as a reclassification adjustment).
| (K) | Leases |
The Group assesses at contract inception, all arrangements to determine whether they are, or contain, a lease. That is, if the contract conveys the right to control the use of an identified asset for a period of time in exchange for consideration.
| (a) | Group as a lessor |
Leases in which the Group does not transfer substantially all the risks and rewards of ownership of an asset are classified as operating leases. Rental income from operating lease is recognised on a straight-line basis over the term of the relevant lease. Initial direct costs incurred in negotiating and arranging an operating lease are added to the carrying amount of the leased asset and recognised over the lease term on the same basis as rental income. Contingent rents are recognised as revenue in the period in which they are earned.
Leases are classified as finance leases when substantially all of the risks and rewards of ownership transfer from the Group to the lessee. Amounts due from lessees under finance leases are recorded as receivables at the Group’s net investment in the leases. Finance lease income is allocated to accounting periods so as to reflect a constant periodic rate of return on the net investment outstanding in respect of the lease.
| (b) | Group as a lessee |
The Group applies a single recognition and measurement approach for all leases, except for short-term leases and leases of low-value assets. The Group recognises lease liabilities towards future lease payments and right-of- use assets representing the right to use the underlying assets.
VEDANTA LIMITED | INTEGRATED REPORT AND ANNUAL ACCOUNTS 2020-21 | 401
CONSOLIDATED CONTINUED...
Notes
forming part of the consolidated financial statements as at and for the year ended 31 March 2021
| (i) | Right-of-use assets |
The Group recognises right-of-use assets at the commencement date of the lease (i.e. the date when the underlying asset is available for use). Right-of-use assets are measured at cost, less any accumulated depreciation and impairment losses, and adjusted for any remeasurement of lease liabilities. The cost of right-of-use assets includes the amount of lease liabilities recognised, initial direct costs incurred, and lease payments made at or before the commencement date less any lease incentives received. The right-of-use assets are also subject to impairment.
Right-of-use assets are depreciated on a straight-line basis over the shorter of the lease term and the estimated useful lives of the assets as described in ‘D’ above.
| (ii) | Lease liabilities |
At the commencement date of the lease, the Group recognises lease liabilities measured at the present value of lease payments to be made over the lease term. The lease payments include fixed payments (and, in some instances, in-substance fixed payments) less any lease incentives receivable, variable lease payments that depend on an index or a rate, and amounts expected to be paid under residual value guarantees. The lease payments also include the exercise price of a purchase option reasonably certain to be exercised by the Group and payments of penalties for terminating the lease, if the lease term reflects the Group exercising the option to terminate. Variable lease payments that do not depend on an index or a rate are recognised as expenses (unless they are incurred to produce inventories) in the period in which the event or condition that triggers the payment occurs.
In calculating the present value of lease payments, the Group uses its incremental borrowing rate at the lease commencement date because the interest rate implicit in the lease is generally not readily determinable. After the commencement date, the amount of lease liabilities is increased to reflect the accretion of interest and reduced for the lease payments made. In addition, the carrying amount of lease liabilities is remeasured if there is a modification, a change in the lease term, a change in the lease payments (e.g. changes to future payments resulting from a change in an index or rate used to determine such lease payments) or a change in the assessment of an option to purchase the underlying asset.
The Group’s lease liabilities are included in Other Financial Liabilities.
| (iii) | Short-term leases and leases of low-value assets |
The Group applies the short-term lease recognition exemption to its short-term leases of equipment (i.e. those leases that have a lease term of 12 months or less from the commencement date and do not contain a purchase option). It also applies the lease of low- value assets recognition exemption to leases of office equipment that are considered to be low value. Lease payments on short-term leases and leases of low-value
assets are recognised as expense on a straight-line basis over the lease term.
| (L) | Inventories |
Inventories and work-in-progress are stated at the lower of cost and net realisable value.
Cost is determined on the following basis:
| • | Purchased copper concentrate is recorded at cost on a first-in, first-out (“FIFO”) basis; all other materials including stores and spares are valued on weighted average basis except in Oil and Gas business where stores and spares are valued on FIFO basis. |
| • | Finished products are valued at raw material cost plus costs of conversion, comprising labour costs and an attributable proportion of manufacturing overheads based on normal levels of activity and are moved out of inventory on a weighted average basis (except in copper business where FIFO basis is followed) and |
| • | By-products and scrap are valued at net realisable value. |
Net realisable value is determined based on estimated selling price, less further costs expected to be incurred for completion and disposal.
(M) Government grants
Grants and subsidies from the government are recognised when there is reasonable assurance that (i) the Group will comply with the conditions attached to them, and (ii) the grant/subsidy will be received.
When the grant or subsidy relates to revenue, it is recognised as income on a systematic basis in the consolidated statement of profit and loss over the periods necessary to match them with the related costs, which they are intended to compensate.
Where the grant relates to an asset, it is recognised as deferred income and released to income in equal amounts over the expected useful life of the related asset and presented within other income.
When the Group receives grants of non-monetary assets, the asset and the grant are recorded at fair value amounts and released to profit or loss over the expected useful life in a pattern of consumption of the benefit of the underlying asset.
402
| < BACK TO CONTENTS | Integrated Report | Statutory reports | Financial statements |
Notes
forming part of the consolidated financial statements as at and for the year ended 31 March 2021
When loans or similar assistance are provided by governments or related institutions, with an interest rate below the current applicable market rate, the effect of this favourable interest is regarded as a government grant. The loan or assistance is initially recognised and measured at fair value and the government grant is measured as the difference between the initial carrying value of the loan and the proceeds received. The loan is subsequently measured as per the accounting policy applicable to financial liabilities.
| (N) | Taxation |
Tax expense represents the sum of current tax and deferred tax.
Current tax is provided at amounts expected to be paid (or recovered) using the tax rates and laws that have been enacted or substantively enacted by the reporting date and includes any adjustment to tax payable in respect of previous years.
Subject to the exceptions below, deferred tax is provided, using the balance sheet method, on all temporary differences at the reporting date between the tax bases of assets and liabilities and their carrying amounts for financial reporting purposes and on carry forward of unused tax credits and unused tax losses:
| • | tax payable on the future remittance of the past earnings of subsidiaries where the timing of the reversal of the temporary differences can be controlled and it is probable that the temporary differences will not reverse in the foreseeable future; |
| • | deferred income tax is not recognised on initial recognition as well as on the impairment of goodwill which is not deductible for tax purposes or on the initial recognition of an asset or liability in a transaction that is not a business combination and, at the time of the transaction, affects neither the accounting profit nor taxable profit (tax loss); and |
| • | deferred tax assets (including MAT credit entitlement) are recognised only to the extent that it is more likely than not that they will be recovered. |
Deferred tax assets and liabilities are measured at the tax rates that are expected to apply to the year when the asset is realised or the liability is settled, based on tax rates (and tax laws) that have been enacted or substantively enacted at the reporting date. Tax relating to items recognised outside consolidated statement of profit and loss is recognised outside consolidated statement of profit and loss (either in other comprehensive income or equity).
The carrying amount of deferred tax assets (including MAT credit entitlement) is reviewed at each reporting date and is adjusted to the extent that it is no longer probable that sufficient taxable profit will be available to allow all or part of the asset to be recovered.
Deferred tax assets and deferred tax liabilities are offset, if a legally enforceable right exists to set off current income tax assets against current income tax liabilities and the deferred taxes relate to the same taxable entity and the same taxation authority.
Deferred tax is provided on temporary differences arising on acquisitions that are categorised as Business Combinations. Deferred tax is recognised at acquisition as part of the assessment of the fair value of assets and liabilities acquired. Subsequently deferred tax is charged or credited in the consolidated statement of profit and loss/other comprehensive income as the underlying temporary difference is reversed.
Further, management periodically evaluates positions taken in the tax returns with respect to situations in which applicable tax regulations are subject to interpretation and considers whether it is probable that a taxation authority will accept an uncertain tax treatment. The Group shall reflect the effect of uncertainty for each uncertain tax treatment by using either most likely method or expected value method, depending on which method predicts better resolution of the treatment.
| (O) | Retirement benefit schemes |
The Group operates or participates in a number of defined benefits and defined contribution schemes, the assets of which (where funded) are held in separately administered funds. For defined benefit schemes, the cost of providing benefits under the plans is determined by actuarial valuation each year separately for each plan using the projected unit credit method by third party qualified actuaries.
Remeasurement including, effects of asset ceiling and return on plan assets (excluding amounts included in interest on the net defined benefit liability) and actuarial gains and losses arising in the year are recognised in full in other comprehensive income and are not recycled to the consolidated statement of profit and loss.
Past service costs are recognised in the consolidated statement of profit and loss on the earlier of:
| • | the date of the plan amendment or curtailment, and |
| • | the date that the Group recognises related restructuring costs. |
Net interest is calculated by applying a discount rate to the net defined benefit liability or asset at the beginning of the period. Defined benefit costs are split into current service cost, past service cost, net interest expense or income and remeasurement and gains and losses on curtailments and settlements. Current service cost and past service cost are recognised within employee benefit expense. Net interest expense or income is recognised within finance costs.
For defined contribution schemes, the amount charged to the consolidated statement of profit and loss in respect of pension costs and other post retirement benefits is the contributions payable in the year, recognised as and when the employee renders related services.
VEDANTA LIMITED | INTEGRATED REPORT AND ANNUAL ACCOUNTS 2020-21 | 403
CONSOLIDATED CONTINUED...
Notes
forming part of the consolidated financial statements as at and for the year ended 31 March 2021
| (P) | Share-based payments |
Certain employees (including executive directors) of the Group receive part of their remuneration in the form of share-based payment transactions, whereby employees render services in exchange for shares or rights over shares (‘equity-settled transactions’).
The cost of equity-settled transactions with employees is measured at fair value of share awards at the date at which they are granted. The fair value of share awards is determined with the assistance of an external valuer and the fair value at the grant date is expensed on a proportionate basis over the vesting period based on the Group’s estimate of shares that will eventually vest.
The estimate of the number of awards likely to vest is reviewed at each balance sheet date up to the vesting date at which point the estimate is adjusted to reflect the current expectations.
The resultant increase in equity is recorded in share- based payment reserve.
In case of cash-settled transactions, a liability is recognised for the fair value of cash-settled transactions. The fair value is measured initially and at each reporting date up to and including the settlement date, with changes in fair value recognised in employee benefits expense. The fair value is expensed over the period until the vesting date with recognition of a corresponding liability. The fair value is determined with the assistance of an external valuer.
| (Q) | Provisions, contingent liabilities and contingent assets |
The assessments undertaken in recognising provisions and contingencies have been made in accordance with the applicable Ind AS.
Provisions represent liabilities for which the amount or timing is uncertain. Provisions are recognised when the Group has a present obligation (legal or constructive), as a result of past events, and it is probable that an outflow of resources, that can be reliably estimated, will be required to settle such an obligation.
If the effect of the time value of money is material, provisions are determined by discounting the expected future cash flows to net present value using an appropriate pre-tax discount rate that reflects current market assessments of the time value of money and, where appropriate, the risks specific to the liability. Unwinding of the discount is recognised in consolidated statement of profit and loss as a finance cost. Provisions are reviewed at each reporting date and are adjusted to reflect the current best estimate.
A contingent liability is a possible obligation that arises from past events whose existence will be confirmed by the occurrence or non-occurrence of one or more uncertain future events beyond the control of the Group or a present obligation that is not recognised because it is not probable that an outflow of resources will be required to settle the obligation. A contingent liability also arises in extremely rare cases where there is a liability that cannot be recognised because it cannot be measured reliably. The Group does not recognize a contingent liability but discloses its existence in the consolidated balance sheet. Contingent assets are not recognised but disclosed in the financial statements when an inflow of economic benefit is probable.
The Group has significant capital commitments in relation to various capital projects which are not recognised in the balance sheet.
| (R) | Restoration, rehabilitation and environmental costs |
An obligation to incur restoration, rehabilitation and environmental costs arises when environmental disturbance is caused by the development or ongoing production of a mine or oil fields. Such costs, discounted to net present value, are provided for and a corresponding amount is capitalised at the start of each project, as soon as the obligation to incur such costs arises. These costs are charged to the consolidated statement of profit and loss over the life of the operation through the depreciation of the asset and the unwinding of the discount on the provision. The cost estimates are reviewed periodically and are adjusted to reflect known developments which may have an impact on the cost estimates or life of operations. The cost of the related asset is adjusted for changes in the provision due to factors such as updated cost estimates, changes to lives of operations, new disturbance and revisions to discount rates. The adjusted cost of the asset is depreciated prospectively over the lives of the assets to which they relate. The unwinding of the discount is shown as finance cost in the consolidated statement of profit and loss.
Costs for the restoration of subsequent site damage, which is caused on an ongoing basis during production, are provided for at their net present value and charged to the consolidated statement of profit and loss as extraction progresses. Where the costs of site restoration are not anticipated to be material, they are expensed as incurred.
404
| < BACK TO CONTENTS | Integrated Report | Statutory reports | Financial statements |
Notes
forming part of the consolidated financial statements as at and for the year ended 31 March 2021
| (S) | Accounting for foreign currency transactions and translations |
The functional currency for each entity in the Group is determined as the currency of the primary economic environment in which it operates. For all principal operating subsidiaries, the functional currency is normally the local currency of the country in which it operates with the exception of oil and gas business operations which have a US dollar functional currency as that is the currency of the primary economic environment in which it operates. The financial statements are presented in Indian rupee (₹).
In the financial statements of individual group companies, transactions in currencies other than the respective functional currencies are translated into their functional currencies at the exchange rates ruling at the date of the transaction. Monetary assets and liabilities denominated in other currencies are translated into functional currencies at exchange rates prevailing on the reporting date. Non-monetary assets and liabilities denominated in other currencies and measured at historical cost or fair value are translated at the exchange rates prevailing on the dates on which such values were determined.
All exchange differences are included in the consolidated statement of profit and loss except those where the monetary item is designated as an effective hedging instrument of the currency risk of designated forecasted sales or purchases, which are recognised in the other comprehensive income.
Exchange differences which are regarded as an adjustment to interest costs on foreign currency borrowings, are capitalised as part of borrowing costs in qualifying assets.
For the purposes of the consolidation of financial statements, items in the consolidated statement of profit and loss of those businesses for which the Indian Rupees is not the functional currency are translated into Indian Rupees at the average rates of exchange during the year/exchange rates as on the date of transaction. The related consolidated balance sheet is translated into Indian rupees at the rates as at the reporting date. Exchange differences arising on translation are recognised in consolidated statements of other comprehensive income. On disposal of such entities the deferred cumulative exchange differences recognised in equity relating to that particular foreign operation are recognised in the consolidated statement of profit and loss.
The Group had applied paragraph 46A of AS 11 under Previous GAAP. Ind AS 101 gives an option, which has been exercised by the Group, whereby a first time adopter can continue its Indian GAAP policy for accounting for exchange differences arising from translation of long-term foreign currency monetary items recognised in the Indian GAAP financial statements for the period ending immediately before the beginning of the first Ind AS financial reporting period. Hence, foreign exchange
gain/loss on long-term foreign currency monetary items recognised up to 31 March 2016 has been deferred/ capitalised. Such exchange differences arising on translation/settlement of long-term foreign currency monetary items and pertaining to the acquisition of a depreciable asset are amortised over the remaining useful lives of the assets.
Exchange differences arising on translation/settlement of long-term foreign currency monetary items, acquired post 01 April 2016, pertaining to the acquisition of a depreciable asset are charged to the consolidated statement of profit and loss.
| (T) | Earnings per share |
The Group presents basic and diluted earnings per share (“EPS”) data for its equity shares. Basic EPS is calculated by dividing the profit or loss attributable to equity shareholders of the Company by the weighted average number of equity shares outstanding during the period. Diluted EPS is determined by adjusting the profit or loss attributable to equity shareholders and the weighted average number of equity shares outstanding for the effects of all dilutive potential equity shares.
| (U) | Buyers’ Credit/Suppliers’ Credit and vendor financing |
The Group enters into arrangements whereby banks and financial institutions make direct payments to suppliers for raw materials and project materials. The banks and financial institutions are subsequently repaid by the Group at a later date providing working capital timing benefits. These are normally settled up to twelve months (for raw materials) and up to 36 months (for project and materials). Where these arrangements are with a maturity of up to twelve months, the economic substance of the transaction is determined to be operating in nature and these are recognised as operational buyers’ credit/ suppliers’ credit and disclosed on the face of the balance sheet (Refer note 2(C)(ii)). Interest expense on these are recognised in the finance cost. Payments made by banks and financial institutions to the operating vendors are treated as a non-cash item and settlement of operational buyer’s credit/suppliers’ credit by the Group is treated as cash flows from operating activity reflecting the subtsance of the payment.
Where such arrangements are with a maturity beyond twelve months and up to thirty six months, the economic substance of the transaction is determined to be financing in nature, and these are presented within borrowings in the consolidated balance sheet. Payments made to vendors are treated as cash item and disclosed as cash flows from operating/investing activity depending on the nature of the underlying transaction. Settlement of dues to banks and financial institution are treated as cash flows from financing activity.
VEDANTA LIMITED | INTEGRATED REPORT AND ANNUAL ACCOUNTS 2020-21 | 405
CONSOLIDATED CONTINUED...
Notes
forming part of the consolidated financial statements as at and for the year ended 31 March 2021
| (V) | Current and non-current classification |
The Group presents assets and liabilities in the consolidated balance sheet based on current/non- current classification.
An asset is classified as current when it satisfies any of the following criteria:
| • | it is expected to be realised in, or is intended for sale or consumption in, the Group’s normal operating cycle; |
| • | it is held primarily for the purpose of being traded; |
| • | it is expected to be realised within 12 months after the reporting date; or |
| • | it is cash or cash equivalent unless it is restricted from being exchanged or used to settle a liability for at least 12 months after the reporting date. |
All other assets are classified as non-current.
A liability is classified as current when it satisfies any of the following criteria:
| • | it is expected to be settled in the Group’s normal operating cycle; |
| • | it is held primarily for the purpose of being traded; |
| • | it is due to be settled within 12 months after the reporting date; or |
| • | the Group does not have an unconditional right to defer settlement of the liability for at least 12 months after the reporting date. Terms of a liability that could, at the option of the counterparty, result in its settlement by the issue of equity instruments do not affect its classification. |
All other liabilities are classified as non-current.
Deferred tax assets and liabilities are classified as non current only.
| (W) | Borrowing costs |
Borrowing cost includes interest expense as per effective interest rate (EIR) and exchange differences arising from foreign currency borrowings to the extent they are regarded as an adjustment to the interest cost.
Borrowing costs directly relating to the acquisition, construction or production of a qualifying capital project under construction are capitalised and added to the project cost during construction until such time that the assets are substantially ready for their intended use, i.e. when they are capable of commercial production. Borrowing costs relating to the construction phase of a service concession arrangement is capitalised as part of the cost of the intangible asset. Where funds are borrowed specifically to finance a qualifying capital project, the amount capitalised represents the actual borrowing costs incurred. Where surplus funds are
available out of money borrowed specifically to finance a qualifying capital project, the income generated from such short-term investments is deducted from the total capitalised borrowing cost. If any specific borrowing remains outstanding after the related asset is ready for its intended use or sale, that borrowing then becomes part of general borrowing. Where the funds used to finance a project form part of general borrowings, the amount capitalised is calculated using a weighted average of rates applicable to relevant general borrowings of the Group during the year.
All other borrowing costs are recognised in the consolidated statement of profit and loss in the year in which they are incurred.
Capitalisation of interest on borrowings related to construction or development projects is ceased when substantially all the activities that are necessary to make the assets ready for their intended use are complete or when delays occur outside of the normal course of business.
EIR is the rate that exactly discounts the estimated future cash payments or receipts over the expected life of the financial liability or a shorter period, where appropriate, to the amortised cost of a financial liability. When calculating the effective interest rate, the Group estimates the expected cash flows by considering all the contractual terms of the financial instrument (for example, prepayment, extension, call and similar options).
| (X) | Treasury shares |
The Group has created an Employee Benefit Trust (EBT) for providing share-based payment to its employees. The Group uses EBT as a vehicle for distributing shares to employees under the employee remuneration schemes. The EBT buys shares of the Company from the market, for giving shares to employees. The shares held by EBT are treated as treasury shares.
Own equity instruments that are reacquired (treasury shares) are recognised at cost and deducted from equity. No gain or loss is recognised in profit or loss on the purchase, sale, issue or cancellation of the Group’s own equity instruments. Any difference between the carrying amount and the consideration, if reissued, is recognised in equity. Share options whenever exercised, would be satisfied with treasury shares.
| (Y) | Cash and cash equivalents |
Cash and cash equivalents comprise cash at bank and on hand and short-term money market deposits which have maturity of three months or less from the date of acquisition, that are readily convertible to known amounts of cash and which are subject to an insignificant risk of changes in value.
406
| < BACK TO CONTENTS | Integrated Report | Statutory reports | Financial statements |
Notes
forming part of the consolidated financial statements as at and for the year ended 31 March 2021
For the purpose of the consolidated statement of cash flows, cash and cash equivalents consist of cash and short-term deposits, as defined above.
| (Z) | Exceptional items |
Exceptional items are those items that management considers, by virtue of their size or incidence (including but not limited to impairment charges and acquisition and restructuring related costs), should be disclosed separately to ensure that the financial information allows an understanding of the underlying performance of the business in the year, so as to facilitate comparison with prior periods. Also tax charges related to exceptional items and certain one-time tax effects are considered exceptional. Such items are material by nature or amount to the year’s result and require separate disclosure in accordance with Ind AS.
| 3(b) | APPLICATION OF NEW AND AMENDED STANDARDS |
(A) The Group has adopted, with effect from 01 April 2020, the following new and revised standards and interpretations. Their adoption has not had any significant impact on the amounts reported in the consolidated financial statements.
| 1. | Amendments to Ind AS 103 regarding definition of a Business |
| 2. | Amendments to Ind AS 107 and 109 regarding Interest Rate Benchmark Reform |
| 3. | Amendments to Ind AS 1 and Ind AS 8 regarding definition of Material |
| 4. | Amendments to Ind AS 116 regarding COVID-19 related rent concessions |
Other Amendments
A number of other minor amendments to existing standards also became effective on 01 April 2020 and have been adopted by the Group. The adoption of these new accounting pronouncements did not have a material impact on the accounting policies, methods of computation or presentation applied by the Group.
| (B) | Standards notified but not yet effective |
There are no new standards that are notified, but not yet effective, up to the date of issuance of the Group’s financial statements.
3(c) SIGNIFICANT ACCOUNTING ESTIMATES AND JUDGEMENTS
The preparation of consolidated financial statements in conformity with Ind AS requires management to make judgements, estimates and assumptions that affect the application of accounting policies and the reported amounts of assets, liabilities, income, expenses and
disclosures of contingent assets and liabilities at the date of these consolidated financial statements and the reported amounts of revenues and expenses for the years presented. These judgements and estimates are based on management’s best knowledge of the relevant facts and circumstances, having regard to previous experience, but actual results may differ materially from the amounts included in the financial statements.
Estimates and underlying assumptions are reviewed on an ongoing basis. Revisions to accounting estimates are recognised in the period in which the estimate is revised and future periods affected.
The information about significant areas of estimation uncertainty and critical judgements in applying accounting policies that have the most significant effect on the amounts recognised in the financial statements are as given below:
| (A) | Significant estimates |
| i) | Impact of COVID-19 |
The outbreak of novel Coronavirus (COVID-19) pandemic globally and in India and the consequent lockdown restrictions imposed by national governments is causing significant disturbance and slowdown of economic activity across the globe. The commodity prices including oil have seen significant volatility with downward price pressures due to major demand centers affected by lockdown.
The Group is in the business of metals and mining, Oil & gas and generation of power which are considered as either essential goods and services or were generally allowed to continue to carry out the operations with adequate safety measures. The Group has taken proactive measures to comply with various regulations/ guidelines issued by the Government and local bodies to ensure safety of its workforce and the society in general. The Group has considered possible effects of Covid-19 on the recoverability of its investments, property, plant and equipment (PPE), inventories, loans and receivables, etc in accordance with Ind AS. The Group has considered forecast consensus, industry reports, economic indicators and general business conditions to make an assessment of the implications of the Pandemic. The Group has also performed sensitivity analysis on the assumptions used basis the internal and external information/indicators of future economic condition. Based on the assessment, the Group had recorded necessary adjustments, including impairment to the extent the carrying amount exceeds the recoverable amount and has disclosed the same as exceptional item during the previous year ended 31 March 2020. No such impairments were identified during the current year. The actual effects of COVID-19 could be different from what is presently assessed and would be known only in due course of time, however no further adjustments are considered necessary at this stage.
VEDANTA LIMITED | INTEGRATED REPORT AND ANNUAL ACCOUNTS 2020-21 | 407
CONSOLIDATED CONTINUED...
Notes
forming part of the consolidated financial statements as at and for the year ended 31 March 2021
| ii) | Oil and gas reserves |
Significant technical and commercial judgements are required to determine the Group’s estimated oil and natural gas reserves. Reserves considered for computing depletion are proved reserves for acquisition costs and proved and developed reserves for successful exploratory wells, development wells, processing facilities, distribution assets, estimated future abandonment cost and all other related costs. Reserves for this purpose are considered on working interest basis which are reassessed atleast annually. Details of such reserves are given in note 43.
Changes in reserves as a result of change in management assumptions could impact the depreciation rates and the carrying value of assets (refer note 6).
| iii) | Carrying value of exploration and evaluation assets |
Exploration assets are assessed by comparing the carrying value to higher of fair value less cost of disposal or value in use if impairment indicators, as contained in Ind AS 106, exists. Change to the valuation of exploration assets is an area of judgement. Further details on the Group’s accounting policies on this are set out in accounting policy above. The amounts for exploration and evaluation assets represent active exploration projects. These amounts will be written off to the consolidated statement of profit and loss as exploration costs unless commercial reserves are established or the determination process is not completed and there are no indications of impairment. The outcome of ongoing exploration, and therefore whether the carrying value of exploration and evaluation assets will ultimately be recovered, is inherently uncertain.
Details of carrying values are disclosed in note 6.
| iv) | Carrying value of developing/producing oil and gas assets |
Management performs impairment tests on the Company’s developing/producing oil and gas assets where indicators of impairment or impairment reversal of previously recorded impairment are identified in accordance with Ind AS 36.
In the current year, the management has reviewed the key assumptions i.e. future production, oil prices, discount to price, Production sharing contract (PSC) life, discount rates, etc. for all of its oil and gas assets. Based on analysis of events that have occurred since then, there did not exist any indication that the assets may be impaired or previously recorded impairment charge may reverse. Hence, detailed impairment analysis has not been conducted in the current financial
year. However during the year ended 31 March 2020, management had performed impairment tests on the Company’s developing/producing oil and gas assets and the impairment assessments were based on a range of estimates and assumptions, including:
Estimates/ assumptions | Basis | |
| Future production | proved and probable reserves, production facilities, resource estimates and expansion projects | |
| Commodity prices | management’s best estimate benchmarked with external sources of information, to ensure they are within the range of available analyst forecast | |
| Discount to price | management’s best estimate based on historical prevailing discount and updated sales contracts | |
| Extension of PSC | granted till 2030 on the expected commercial terms (Refer note 3(c)(A)(viii) | |
| Discount rates | cost of capital risk-adjusted for the risk specific to the asset/CGU | |
Details of carrying values are disclosed in note 6.
| v) | Mining properties and leases |
The carrying value of mining property and leases is arrived at by depreciating the assets over the life of the mine using the unit of production method based on proved & developed reserves. The estimate of reserves is subject to assumptions relating to life of the mine and may change when new information becomes available. Changes in reserves as a result of factors such as production cost, recovery rates, grade of reserves or commodity prices could thus impact the carrying values of mining properties and leases and environmental and restoration provisions.
Management performs impairment tests when there is an indication of impairment. The impairment assessments are based on a range of estimates and assumptions, including:
Estimates/ assumptions | Basis | |
| Future Production | Proved and probable reserves, resource estimates (with an appropriate conversion factor) considering the expected permitted mining volumes and, in certain cases, expansion projects. | |
| Commodity Prices | Management’s best estimate benchmarked with external sources of information, to ensure they are within the range of available analyst forecast | |
| Exchange Rates | Management best estimate benchmarked with external sources of information | |
| Discount Rates | Cost of capital risk-adjusted for the risk specific to the asset/CGU | |
408
| < BACK TO CONTENTS | Integrated Report | Statutory reports | Financial statements |
Notes
forming part of the consolidated financial statements as at and for the year ended 31 March 2021
There is no impairment recognised during the year. For the year ended 31 March 2020, details of impairment charge and the assumptions used and carrying value are disclosed in note 34 and 6 respectively.
| vi) | Recoverability of deferred tax and other income tax assets |
The Group has carry forward tax losses, unabsorbed depreciation and MAT credit that are available for offset against future taxable profit. Deferred tax assets are recognised only to the extent that it is probable that taxable profit will be available against which the unused tax losses or tax credits can be utilised. This involves an assessment of when those assets are likely to reverse, and a judgement as to whether or not there will be sufficient taxable profits available to offset the assets. This requires assumptions regarding future profitability, which is inherently uncertain. To the extent assumptions regarding future profitability change, there can be an increase or decrease in the amounts recognised in respect of deferred tax assets and consequential impact in the consolidated statement of profit and loss.
The total deferred tax assets recognised in these financial statement (refer note 35) includes MAT credit entitlements of ₹8,232 crores (FY19-20: ₹9,122 crores), of which ₹340 crores is expected to be utilised in the fourteenth year (FY19-20: ₹3,600 crores was expected to be utilised in fourteenth and fifteenth year), fifteen years being the maximum permissible time period to utilise the MAT credits.
Additionally, the Group has tax receivables on account of refund arising on account of past amalgamation and relating to various tax disputes. The recoverability of these receivables involve application of judgement as to the ultimate outcome of the tax assessment and litigations. This pertains to the application of the legislation, which in certain cases is based upon management’s interpretation of country specific tax law, in particular India, and the likelihood of settlement. Management uses in-house and external legal professionals to make informed decision.
| (vii) | Copper operations in Tamil Nadu, India |
In an appeal filed by the Group against the closure order of the Tuticorin Copper smelter by Tamil Nadu
Pollution Control Board (“TNPCB”), the appellate authority National Green Tribunal (“NGT”) passed an interim order on 31 May 2013 allowing the copper smelter to recommence operations and appointed an Expert Committee to submit a report on the plant operations. Post the interim order, the plant recommenced operations on 23 June 2013. Based on Expert Committee’s report on the operations of the plant stating that the plant’s emission were within prescribed
standards and based on this report, NGT ruled on 08 August 2013 that the Copper smelter could continue its operations and recommendations made by the Expert Committee be implemented in a time bound manner. The Group has implemented all of the recommendations. TNPCB has filed an appeal against the order of the NGT before the Supreme Court of India.
In the meanwhile, the application for renewal of Consent to Operate (CTO) for existing copper smelter, required as per procedure established by law was rejected by TNPCB in April 2018. Vedanta Limited has filed an appeal before the TNPCB Appellate Authority challenging the Rejection Order. During the pendency of the appeal, there were protests by a section of local community raising environmental concerns and TNPCB vide its order dated 23 May 2018 ordered closure of existing copper smelter plant with immediate effect. Further, the Government of Tamil Nadu, issued orders dated 28 May 2018 with a direction to seal the existing copper smelter plant permanently. The Company believes these actions were not taken in accordance with the procedure prescribed under applicable laws. Subsequently, the Directorate of Industrial Safety and Health passed orders dated 30 May 2018, directing the immediate suspension and revocation of the Factory License and the Registration Certificate for the existing smelter plant.
The Company appealed this before the National Green Tribunal (NGT). NGT vide its order on 15 December 2018 has set aside the impugned orders and directed the TNPCB to pass fresh orders for renewal of consent and authorisation to handle hazardous substances, subject to appropriate conditions for protection of environment in accordance with law.
The State of Tamil Nadu and TNPCB approached Supreme Court in Civil Appeals on 02 January 2019 challenging the judgement of NGT dated 15 December 2018 and the previously passed judgement of NGT dated 08 August 2013. The Supreme Court vide its judgement dated 18 February 2019 set aside the judgements of NGT dated 15 December 2018 and 08 August 2013 solely on the basis of maintainability and directed the Company to file an appeal in High court.
VEDANTA LIMITED | INTEGRATED REPORT AND ANNUAL ACCOUNTS 2020-21 | 409
CONSOLIDATED CONTINUED...
Notes
forming part of the consolidated financial statements as at and for the year ended 31 March 2021
The Company has filed a writ petition before Madras High Court challenging the various orders passed against the Company in 2018 and 2013. On 18 August 2020, the Madras High Court delivered the judgement wherein it dismissed all the Writ Petitions filed by the Company. The Company has approached the Supreme Court and challenged the said High Court order by way of a Special Leave Petition (SLP) to Appeal and also filed an interim relief for care & maintenance of the plant. The matter was then listed on 02 December 2020 before Supreme Court Bench. The Bench after having heard both the sides concluded that at this stage the interim relief in terms of trial run could not be allowed. Further, considering the voluminous nature of documents and pleadings, the matter shall be finally heard on merits.The matter was again mentioned before the bench on 17 March 2021, wherein the matter was posted for hearing on
17 August 2021.
However, subsequent to the year end, the Company approached the Supreme Court offering to supply medical oxygen from the said facility in view of prevailing COVID-19 situation, which was allowed by the Supreme Court, under supervision of a committee constituted by the Government of Tamil Nadu.
As per the Company’s assessment, it is in compliance with the applicable regulations and expects to get the necessary approvals in relation to the existing operations and hence the Company does not expect any material adjustments to these financial statements as a consequence of above actions.
The Company has carried out an impairment analysis for existing plant assets during the period ended 31 March 2021 considering the key variables and concluded that there exists no impairment. The Company has done an additional sensitivity analysis with commencement of operations of the existing plant w.e.f. 01 April 2024 and noted that the recoverable amount of the assets would still be in excess of their carrying values.
The carrying value of the assets as at 31 March 2020 is ₹2,328 crores and 31 March 2021 is ₹2,144 crores. Expansion Project: Separately, the Company has filed a fresh application for renewal of the Environmental Clearance for the proposed Copper Smelter Plant 2 (Expansion Project) dated March 12, 2018 before the Expert Appraisal Committee of the MoEFCC wherein a sub-committee was directed to visit the Expansion Project site prior to prescribing the Terms of Reference.
In the meantime, the Madurai Bench of the High Court of Madras in a Public Interest Litigation held vide its order dated 23 May 2018 that the application for renewal of the Environmental Clearance for the Expansion Project shall be processed after a mandatory public hearing and in the interim, ordered the Company to cease construction and all other activities on site for the proposed Expansion Project with immediate effect. The Ministry of Environment, Forests and Climate Change (MoEFCC) has delisted the Expansion Project since the matter is sub- judice. Separately, SIPCOT vide its letter dated 29 May 2018, cancelled 342.22 acres of the land allotted for the proposed Expansion Project. Further, the TNPCB issued orders on 07 June 2018 directing the withdrawal of the
Consent to Establish (CTE) which was valid till 31 March 2023.
The Company has approached Madras High Court by way of writ petition challenging the cancellation of lease deeds by SIPCOT pursuant to which an interim stay has been granted. The Company has also filed Appeals before the TNPCB Appellate Authority challenging withdrawal of CTE by the TNPCB, the matter is pending for adjudication. Considering the delay in existing plant matter and accordingly delay in getting the required approval for Expansion Project, management considered to make provision for impairment for Expansion Project basis fair value less cost of disposal and accordingly made impairment provision of ₹669 crores in March 2020. During the current period, there are no updates in the expansion matter and impairment provision of ₹669 crores is adequate and the net carrying value of ₹97 crores as at 31 March 2021 approximates its recoverable value.
Impairment recognised during the year ended 31 March 2020
For the expansion plant, the project activities are on halt since May 2018. Further, the project EC for the expansion plant got expired on 31 December 2018 and fresh application is filed before the competent authority, however, the process will start only after reopening of the existing plant and after obtaining all statutory approvals, the timing of which is uncertain.
Keeping in view the above factors and the fact that value in use cannot be reasonably ascertained, the Company has carried out recoverability assessment of the items of property, plant and equipment, capital work-in-progress (CWIP) and capital advances. Based on the realisable value estimate of ₹288 crores, the Company has recognised an impairment of ₹669 crores (comprising of CWIP balances of ₹435 crores, capital advances of ₹196 crores and other assets of ₹38 crores) during the year.
Property, plant and equipment of ₹1,337 crores and inventories of ₹284 crores, pertaining to existing and expansion plant, could not be physically verified, anytime during the year, as the access to the plant is presently restricted. However, since operations are suspended and access to the plant restricted, any difference between book and physical quantities is unlikely to be material.
410
| < BACK TO CONTENTS | Integrated Report | Statutory reports | Financial statements |
Notes
forming part of the consolidated financial statements as at and for the year ended 31 March 2021
| (viii) | PSC Extension |
Rajasthan Block
The Company operates an oil and gas production facility in Rajasthan under a Production Sharing Contract (“PSC”). The management is of the opinion that the Company is eligible for automatic extension of the PSC for Rajasthan (“RJ”) block on same terms w.e.f. 15 May 2020, while Government of India (“GoI”) in October 2018, accorded its approval for extension of the PSC, under the Pre-NELP Extension policy as per notification dated 07 April 2017 (“Pre-NELP Policy”), for RJ block by a period of 10 years, w.e.f. 15 May 2020. As per the said policy and extension letter, the Company is required to comply with certain conditions and pay an additional 10% profit oil to GoI. The Company had challenged the applicability of Pre NELP Policy to the RJ block. The Division Bench of the Delhi High Court in March 2021 set aside the single judge order of May 2018 which allowed automatic extension of PSC. The Company is studying the order and all available legal remedies are being evaluated for further action as appropriate.
One of the conditions for extension of PSC relates to notification of certain audit exceptions raised for FY16- 17 as per PSC provisions and provides for payment of amounts, if such audit exceptions result into any creation of liability.
The Directorate General of Hydrocarbons (“DGH”) in May 2018 raised a demand on the Company and its subsidiary for the period up to 31 March 2017 for Government’s additional share of Profit oil based on its computation of disallowance of costs incurred in excess of the initially approved Field Development Plan (“FDP”) of the pipeline project for ₹1,477 crores (US$202 million) and retrospective re-allocation of certain common costs between Development Areas (“DAs”) of RJ block aggregating to ₹2,669 crores (US$364 million). The DGH vide its letter dated 12 May 2020, reiterated its demand only with respect to the retrospective re-allocation of certain common costs between DAs of the RJ block of ₹2,669 crores (US$364 million towards contractor share for the period up to 31 March 2017. This amount was subsequently revised to ₹3,360 crores (US$458 million) till March 2018 vide DGH letter dated 24 December 2020.
The Company in January 2020 received notifications from the DGH on audit exceptions arising out of its audit for the FY2017-18, which comprises the consequential effects on profit oil due to the aforesaid matters and certain new matters on cost allowability plus interest aggregating to US$645 million, representing share of the Company and its subsidiary, CEHL (“the Claimants”), which have been suitably responded to by the Company.
The Company believes that it has sufficient as well as reasonable basis pursuant to the PSC provisions and related approvals, supported by legal advice, for having claimed such costs and for allocating common costs between different DAs. In the Company’s opinion, these computations of the aforesaid demand/audit exceptions are not appropriate, and the accounting adjustments sought for issues pertaining to Year 2007 and onwards are based on assumptions that are not in consonance with the approvals already in place. The Company’s view
is also supported by independent legal opinion and the Company has been following the process set out in PSC to resolve these aforesaid matters. The Company has also invoked the PSC process for resolution of disputed exceptions and has issued notice for arbitration and the tribunal stands constituted. Further, on 23 September 2020, the GoI had filed an application for interim relief before Delhi High Court seeking payment of all disputed dues. This matter is now scheduled for hearing on
20 May 2021.
Also, on Vedanta’s application under Section 17 of the Arbitration and Conciliation Act, 1996, the tribunal in December 2020 ordered that GoI should not take any action to enforce any of the amounts at issue in this arbitration against the Claimants during the arbitral period. The GoI has challenged the said order before the Delhi High Court under the said Act. This matter is also scheduled for hearing on 20 May 2021.
In management’s view, the above mentioned condition on demand raised by the DGH for additional petroleum linked to PSC extension is untenable and has not resulted in creation of any liability and cannot be a ground for non-extension. In addition, all necessary procedures prescribed in the PSC including invocation of arbitration, in respect of the stated audit observation have also been fulfilled. Accordingly, the PSC extension approval granted vide DGH letter dated 26 October 2018 upholds with all conditions addressed and no material liability would devolve upon the Group.
Simultaneously, the Company is also pursuing with the GoI for executing the RJ PSC addendum at the earliest. In view of extenuating circumstances surrounding COVID-19 and pending signing of the PSC addendum for extension after complying with all stipulated conditions, the GoI has been granting interim permission to the Company to continue Petroleum operations in the RJ block. The latest permission is valid up to 31 July 2021 or signing of the PSC addendum, whichever is earlier.
VEDANTA LIMITED | INTEGRATED REPORT AND ANNUAL ACCOUNTS 2020-21 | 411
CONSOLIDATED CONTINUED...
Notes
forming part of the consolidated financial statements as at and for the year ended 31 March 2021
Ravva Block
The Government of India (GoI) has granted its approval for a ten-year extension of PSC for Ravva Block with effect from 28 October 2019, in terms of the provision of the “Policy on the Grant of the extension to Production Sharing Contract Signed by Government awarding small, medium-sized and discovered field to private joint ventures” dated 28 March 2016. The PSC addendum recording this extension has been executed by all parties. The Ravva Extension Policy, amongst others, provides for an increased share of profit petroleum of 10% for the GoI during the extended term of the Ravva PSC and payment of royalty and cess as per prevailing rate in accordance with the PNG Rules, 1959 and OIDB Act. Under the Ravva PSC, –the Company’s oil and gas business is entitled to recover 100% of cost of production and development from crude oil and natural gas sales before any profit is allocated among the parties. Cost recovery for exploration cost during extension period shall be governed as per the provision of Office Memorandum 2013, 2019 issued by MoPNG on exploration in mining lease area post expiry of the exploration period.
| (ix) | Impact of Taxation Laws (Amendment) Act, 2019 |
Pursuant to the introduction of Section 115BAA of the Income Tax Act, 1961 which is effective 01 April 2019, companies in India have the option to pay corporate income tax at the rate of 22% plus applicable surcharge and cess as against the earlier rate of 30% plus applicable surcharge and cess, subject to certain conditions like, the Company has to forego all benefits like tax holidays, brought forward losses generated through tax incentives/additional depreciation and outstanding MAT credit. Considering all the provisions under Section 115BAA and based on the expected timing of exercising of the option under Section 115BAA, the Group has re- measured its deferred tax balances as at 31 March 2021. This computation required assessment of assumptions regarding future profitability, which is inherently uncertain. To the extent assumptions regarding future profitability change, there can be increase or decrease in the amounts recognised. Refer note 35(b) for details.
(x) ESL Steel Limited (formerly known as Electrosteel Steels Limited) (ESL), had filed application for renewal of
Consent to Operate (‘CTO’) on 24 August 2017 for the period of five years which was denied by Jharkhand State Pollution Control Board (‘JSPCB’) on 23 August 2018, as JSPBC awaited response from MoEFCC over a 2012 show-cause notice. After a personal hearing towards the show cause notice, the Ministry of Environment, Forests and Climate Change revoked the Environmental Clearance (EC) on 20 September 2018. The Hon’ble High Court of Jharkhand granted stay against both revocation orders, and allowed the continuous running of the plant operations under regulatory supervision of the JSPCB. Jharkhand High Court on 16 September 2020 passed an order vacating the interim stay in place beyond 23 September 2020, while listed the matter for final hearing. ESL filed an Special Leave Petition (SLP) in the Supreme Court, and on 22 September 2020, ESL was granted permission to run the plant till further orders. Next date of High Court hearing is 25 June 2021 and Supreme Court hearing is yet to be listed.
The Forest Advisory Committee (FAC) of MoEFCC granted the Stage 1 clearance and the MoEF&CC approved the related Terms of Reference (TOR) on 25 August 2020. As per Stage 1 clearance, the Company is required to provide non-forest land in addition to the afforestation cost. The Company, based on the report of an EIA consultant, has recognised a provision of ₹213
crores as an exceptional item in these financial statement with respect to the costs to be incurred by the Company for obtaining Enviornment Clearance.
| (xi) | Assessment of impairment of assets at Aluminium division |
During year ended 31 March 2020, considering lower sales realisation, an impairment trigger was identified in the aluminium division of the Group. The impairment assessments are based on a range of estimates and assumptions, including:
Estimates/ assumptions | Basis | |
| Future production | Proved and probable reserves, production facilities, resource estimates and expansion projects | |
| Commodity prices | management’s best estimate benchmarked with external sources of information, to ensure they are within the range of available analyst forecast | |
| Discount rates | cost of capital risk-adjusted for the risk specific to the asset/CGU | |
During the previous year, the Group had carried out an impairment analysis, based on value in use approach, considering the key variables and concluded that there existed no impairment. The Group had carried out sensitivity analysis on key assumptions including commodity price, discount rate and delay in expansion of refinery. Based on sensitivity analysis, the recoverable amount was expected to exceed the carrying value as at 31 March 2020 of ₹36,992 crores. No negative developments have occurred since the previous year, while the commodity price have increased. Accordingly, it is not expected that the carrying amount would exceed the recoverable amount and hence the recoverable value for the year ended 31 March 2021 was not re-determined.
| (xii) | Going Concern |
Considering the uncertainties caused due to Covid-19, the Group prepared its cash flow forecasts under various scenarios and has performed additional sensitivities on certain key assumptions. Based on such an analysis and assessment of its ability to raise additional capital, the Group continues to prepare its financial statements on a going concern basis.
| (B) | Significant judgements |
| (i) | Determining whether an arrangement contains a lease: |
The Group has ascertained that the Power Purchase Agreement (PPA) entered into between one of the subsidiaries and a State grid qualifies to be an operating lease under Ind AS 116 “Leases”. Accordingly, the consideration receivable under the PPA relating to recovery of capacity charges towards capital cost have been recognised as operating lease rentals and in respect of variable cost that includes fuel costs, operations and maintenance, etc. is considered as revenue from sale of products/services.
412
| < BACK TO CONTENTS | Integrated Report | Statutory reports | Financial statements |
Notes
forming part of the consolidated financial statements as at and for the year ended 31 March 2021
Significant judgement is required in segregating the capacity charges due from the State grid, between fixed and contingent payments. The Group has determined that since the capacity charges under the PPA are based on the number of units of electricity made available by its Subsidiary which would be subject to variation on account of various factors like availability of coal and water for the plant, there are no fixed minimum payments under the PPA, which requires it to be accounted for on a straight line basis. The contingent rents recognised are disclosed in Note 25.
| (ii) | Contingencies |
In the normal course of business, contingent liabilities may arise from litigation, taxation and other claims against the Group. A provision is recognised when the Group has a present obligation as a result of past events and it is probable that the Group will be required to settle that obligation.
Where it is management’s assessment that the outcome cannot be reliably quantified or is uncertain, the claims are disclosed as contingent liabilities unless the likelihood of an adverse outcome is remote. Such liabilities are disclosed in the notes but are not provided for in the financial statements.
When considering the classification of legal or tax cases as probable, possible or remote, there is judgement involved. This pertains to the application of the legislation, which in certain cases is based upon management’s interpretation of country specific applicable law, in particular India, and the likelihood of settlement. Management uses in-house and external legal professionals to make informed decision. Although
there can be no assurance regarding the final outcome of the legal proceedings, the Group does not expect them to have a materially adverse impact on the Group’s financial position or profitability. These are set out in note 38.
| (iii) | Revenue recognition and receivable recovery in relation to the power division |
In certain cases, the Group’s power customers are disputing various contractual provisions of Power Purchase Agreements (PPA). Significant judgement is required in both assessing the tariff to be charged under the PPA in accordance with Ind AS 115 and to assess the recoverability of withheld revenue currently accounted for as receivables.
In assessing this critical judgement, management considered favourable external legal opinions that the Group has obtained in relation to the claims. In addition, the fact that the contracts are with government owned companies implies the credit risk is low (refer note 8(c)).
| (iv) | Exceptional Items |
Exceptional items are those items that management considers, by virtue of their size or incidence (including but not limited to impairment charges and acquisition and restructuring related costs), should be disclosed separately to ensure that the financial information allows an understanding of the underlying performance of the business in the year, so as to facilitate comparison with prior periods. Also tax charges related to exceptional items and certain one-time tax effects are considered exceptional. Such items are material by nature or amount to the year’s result and require separate disclosure in accordance with Ind AS.
The determination as to which items should be disclosed separately requires a degree of judgement. The details of exceptional items are set out in note 34.
VEDANTA LIMITED | INTEGRATED REPORT AND ANNUAL ACCOUNTS 2020-21 | 413
CONSOLIDATED CONTINUED...
Notes
forming part of the consolidated financial statements as at and for the year ended 31 March 2021
| 4 | BUSINESS COMBINATION AND OTHERS |
| a) | Ferro Alloys Corporation Limited - Business Combination |
On 21 September 2020, the Company acquired control over Ferro Alloys Corporation Limited (“FACOR”). FACOR was admitted under Corporate insolvency resolution process in terms of the Insolvency and Bankruptcy Code, 2016 of India. The National Company Law Tribunal (NCLT) vide its order dated 30 January 2020 approved the resolution plan for acquiring controlling stake in FACOR. Pursuant to the approved resolution plan, FACOR has become a wholly-owned subsidiary of the Company. FACOR holds 90% equity in its subsidiary, Facor Power Limited (FPL).
FACOR is in the business of producing Ferro Alloys and owns a Ferro Chrome plant with capacity of 72,000 TPA, two operational Chrome mines and 100 MW of Captive Power Plant through its subsidiary, FACOR Power Limited (FPL). The acquisition will complement the Group’s existing steel business as the vertical integration of ferro manufacturing capabilities has the potential to generate significant efficiencies.
The fair value of the identifiable assets and liabilities of FACOR as at the date of the acquisition were as follows:
| (₹ in Crore) | ||||
Particulars | Fair Value at Acquisition | |||
Property, Plant and Equipment including Capital work-in-progress | 134 | |||
Intangible assets | 220 | |||
Bank deposits | 9 | |||
|
| |||
Non-current assets | 363 | |||
|
| |||
Inventories | 46 | |||
Trade and other receivables | 5 | |||
Cash and cash equivalents | 11 | |||
Other bank balances | 69 | |||
Other financial assets | 1 | |||
Other current assets | 31 | |||
|
| |||
Current assets | 163 | |||
|
| |||
Total Assets (A) | 526 | |||
|
| |||
Borrowings | 9 | |||
Deferred tax liabilities | 60 | |||
Trade payables | 10 | |||
Other financial liabilities | 19 | |||
Provisions | 7 | |||
Other current liabilities | 37 | |||
|
| |||
Total Liabilities (B) | 142 | |||
|
| |||
Net Assets (C = A-B) | 384 | |||
|
| |||
Satisfied by: | ||||
Cash Consideration Paid for Equity acquired | 34 | |||
Cash Consideration Paid for Debt acquired | 22 | |||
Zero coupon Non-Convertible Debentures issued by FACOR repayable equally over 4 years commencing March 2021 (Nominal value ₹287 crores)* | 236 | |||
|
| |||
Total Purchase consideration (D) | 292 | |||
|
| |||
Non-Controlling interest on acquisition (10% of net liabilities of FPL) (E) | (31 | ) | ||
|
| |||
Bargain Gain recognised directly in equity (capital reserve) (C-D-E) | 123 | |||
|
| |||
| * | Includes NCDs of nominal value ₹3 crores yet to be issued as part of purchase consideration. |
Since the date of acquisition, FACOR has contributed ₹274 crores and ₹40 crores to the Group revenue and profit before taxation respectively for the year ended 31 March 2021.
If FACOR had been acquired at the beginning of the year, the Group revenue would have been ₹87,087 crores and the profit before exceptional items and tax of the Group would have been ₹17,823 crores.
414
| < BACK TO CONTENTS | Integrated Report | Statutory reports | Financial statements |
Notes
forming part of the consolidated financial statements as at and for the year ended 31 March 2021
The carrying amount of all assets and liabilities within the working capital equals their fair value. None of the Trade receivables was impaired and the full contractual amount were expected to be realised. Mining Rights have been valued considering the With or Without method, i.e. based on the cost savings resulting from the usage of the mines vis a vis procurement of raw material (chrome ore) from external vendors. Land has been valued based on the Right to Fair Compensation and Transparency in Land Acquisition, Rehabilitation and Resettlement Act. Buildings, Plant & Machinery, Other Tangible Assets, Capital Work-in-Progress and Capital Advances pertaining to the Tangible Assets together have been estimated based on the Value in Use of FACOR under the Income Approach.
Non-controlling interest has been measured at the non-controlling interest’s proportionate share of FPL’s identifiable net assets.
Acquisition costs of ₹3 crores have been charged to the consolidated statement of profit and loss.
| b) | Acquisition of Global coke plant |
On 28 July 2019, the Group acquired Sindhudurg plant of Global Coke Limited which was under liquidation as per the Insolvency and Bankruptcy Code 2016 (including all amendments for the time being in force) for a cash consideration of ₹33 crores. The assets acquired mainly included Land, Building and Plant & Machinery of similar value as the cash consideration. The acquisition complements backward integration opportunity for the Group’s existing pig iron division and also increase Group’s footprint in met coke market in south western part of India. Detailed disclosure of fair value of the identifiable assets and liabilities of Sindhudurg plant has not been provided as the same is not material.
Acquisition costs related to the same were not material.
| 5 | SEGMENT INFORMATION |
| A) | Description of segment and principal activities |
The Group is a diversified natural resource group engaged in exploring, extracting and processing minerals and oil and gas. The Group produces zinc, lead, silver, copper, aluminium, iron ore, oil and gas, ferro alloys and steel and commercial power and has a presence across India, South Africa, Namibia, U.A.E, Ireland, Australia, Japan,
South Korea, Taiwan and Liberia. The Group is also in the business of port operations and manufacturing of glass substrate. The Group has seven reportable segments: copper, aluminium, iron ore, power, Zinc India (comprises of zinc and lead India), Zinc international, oil and gas and others. The management of the Group is organised by its main products: copper, Zinc (comprises of zinc and lead India, silver India and zinc international), aluminium, iron ore, oil and gas, power and others. “Others” segment mainly comprises of port/berth, steel, glass substrate and ferro alloys business and those segments which do not meet the quantitative threshold for separate reporting. Each of the reportable segments derives its revenues from these main products and hence these have been identified as reportable segments by the Group’s chief operating decision maker (“CODM”).
Segment Revenue, Results, Assets and Liabilities include the respective amounts identifiable to each of the segments and amount allocated on a reasonable basis. Unallocated expenditure consist of common expenditure incurred for all the segments and expenses incurred at corporate level. The assets and liabilities that cannot be allocated between the segments are shown as unallocated assets and unallocated liabilities respectively.
The accounting policies of the reportable segments are the same as the Group’s accounting policies described in Note 3. The operating segments reported are the segments of the Group for which separate financial information is available. Earnings before interest, depreciation and amortisation and tax (EBITDA) are evaluated regularly by the CODM in deciding how to allocate resources and in assessing performance. The Group’s financing (including finance costs and finance income) and income taxes are reviewed on an overall basis and are not allocated to operating segments.
Pricing between operating segments are on an arm’s length basis in a manner similar to transactions with third parties.
The following table presents revenue and profit information and certain assets and liabilities information regarding the Group’s business segments as at and for the year ended 31 March 2021 and 31 March 2020 respectively.
VEDANTA LIMITED | INTEGRATED REPORT AND ANNUAL ACCOUNTS 2020-21 | 415
CONSOLIDATED CONTINUED...
Notes
forming part of the consolidated financial statements as at and for the year ended 31 March 2021
For the year ended 31 March 2021
| (₹ in crores) | ||||||||||||||||||||||||||||||||||||||||
| Business Segments | ||||||||||||||||||||||||||||||||||||||||
Particulars | Zinc India | Zinc International | Oil & Gas | Aluminium | Copper | Iron Ore | Power | Others | Eliminations | Total | ||||||||||||||||||||||||||||||
Revenue | ||||||||||||||||||||||||||||||||||||||||
External Revenue | 21,932 | 2,729 | 7,531 | 28,575 | 10,888 | 4,487 | 5,375 | 5,346 | — | 86,863 | ||||||||||||||||||||||||||||||
Inter segment revenue | — | — | — | 69 | 2 | 41 | — | 31 | (143 | ) | — | |||||||||||||||||||||||||||||
|
|
|
|
|
|
|
|
|
|
|
|
|
|
|
|
|
|
|
| |||||||||||||||||||||
Segment revenue | 21,932 | 2,729 | 7,531 | 28,644 | 10,890 | 4,528 | 5,375 | 5,377 | (143 | ) | 86,863 | |||||||||||||||||||||||||||||
Results | ||||||||||||||||||||||||||||||||||||||||
EBITDA* | 11,620 | 811 | 3,206 | 7,751 | (177 | ) | 1,804 | 1,407 | 919 | — | 27,341 | |||||||||||||||||||||||||||||
Depreciation, depletion and amortisation | 2,592 | 320 | 1,223 | 1,928 | 218 | 96 | 693 | 568 | — | 7,638 | ||||||||||||||||||||||||||||||
Other income ** | 125 | — | — | 75 | 3 | 8 | 17 | 1 | — | 229 | ||||||||||||||||||||||||||||||
|
|
|
|
|
|
|
|
|
|
|
|
|
|
|
|
|
|
|
| |||||||||||||||||||||
Segment Results | 9,153 | 491 | 1,983 | 5,898 | (392 | ) | 1,716 | 731 | 352 | — | 19,932 | |||||||||||||||||||||||||||||
Less: Unallocated expenses | 129 | |||||||||||||||||||||||||||||||||||||||
Less: Finance costs | 5,210 | |||||||||||||||||||||||||||||||||||||||
Add: Other income (excluding exchange difference and those included in segment results) | 3,040 | |||||||||||||||||||||||||||||||||||||||
Add: Net exceptional loss | (678 | ) | ||||||||||||||||||||||||||||||||||||||
Net profit/(loss) before tax | 17,213 | |||||||||||||||||||||||||||||||||||||||
Other information | ||||||||||||||||||||||||||||||||||||||||
Segment assets | 21,302 | 6,065 | 18,915 | 54,764 | 6,273 | 2,722 | 17,565 | 7,862 | — | 1,35,468 | ||||||||||||||||||||||||||||||
Financial Assets investments | 16,660 | |||||||||||||||||||||||||||||||||||||||
Deferred tax Assets | 5,860 | |||||||||||||||||||||||||||||||||||||||
Income tax Assets | 2,755 | |||||||||||||||||||||||||||||||||||||||
Cash and bank balances | 16,744 | |||||||||||||||||||||||||||||||||||||||
(Including restricted cash and bank balances) | ||||||||||||||||||||||||||||||||||||||||
Others | 8,210 | |||||||||||||||||||||||||||||||||||||||
|
|
|
|
|
|
|
|
|
|
|
|
|
|
|
|
|
|
|
| |||||||||||||||||||||
Total assets | 1,85,697 | |||||||||||||||||||||||||||||||||||||||
|
|
|
|
|
|
|
|
|
|
|
|
|
|
|
|
|
|
|
| |||||||||||||||||||||
Segment liabilities | 5,929 | 1,067 | 11,178 | 18,565 | 4,388 | 1,319 | 2,123 | 2,126 | — | 46,695 | ||||||||||||||||||||||||||||||
Deferred tax liabilities | 2,215 | |||||||||||||||||||||||||||||||||||||||
Borrowing | 57,028 | |||||||||||||||||||||||||||||||||||||||
Income tax liabilities (net of payments) | 277 | |||||||||||||||||||||||||||||||||||||||
Others | 2,066 | |||||||||||||||||||||||||||||||||||||||
|
|
|
|
|
|
|
|
|
|
|
|
|
|
|
|
|
|
|
| |||||||||||||||||||||
Total liabilities | 1,08,281 | |||||||||||||||||||||||||||||||||||||||
|
|
|
|
|
|
|
|
|
|
|
|
|
|
|
|
|
|
|
| |||||||||||||||||||||
Capital expenditure*** | 2,333 | 390 | 1,523 | 1,782 | 58 | 112 | 57 | 598 | — | 6,855 | ||||||||||||||||||||||||||||||
|
|
|
|
|
|
|
|
|
|
|
|
|
|
|
|
|
|
|
| |||||||||||||||||||||
Capital work-in-progress written off/Impairment charge – net/provision | — | — | (181 | ) | — | (63 | ) | — | (244 | ) | ||||||||||||||||||||||||||||||
|
|
|
|
|
|
|
|
|
|
|
|
|
|
|
|
|
|
|
| |||||||||||||||||||||
| * | EBITDA is a non-GAAP measure. |
| ** | Amortisation of duty benefits relating to assets recognised as government grant. |
| *** | Total of capital expenditure includes capital expenditure of ₹2 crores which is not allocable to any segment. It also includes ₹354 crores acquired through business combination. |
416
| < BACK TO CONTENTS | Integrated Report | Statutory reports | Financial statements |
Notes
forming part of the consolidated financial statements as at and for the year ended 31 March 2021
For the year ended 31 March 2020
| (₹ in crores) | ||||||||||||||||||||||||||||||||||||||||
| Business Segments | ||||||||||||||||||||||||||||||||||||||||
Particulars | Zinc India | Zinc International | Oil & Gas | Aluminium | Copper | Iron Ore | Power | Others | Eliminations | Total | ||||||||||||||||||||||||||||||
Revenue | ||||||||||||||||||||||||||||||||||||||||
External Revenue | 18,159 | 3,128 | 12,661 | 26,544 | 9,053 | 3,450 | 5,860 | 4,690 | — | 83,545 | ||||||||||||||||||||||||||||||
Inter segment revenue | — | — | — | 33 | — | 13 | — | 92 | (138 | ) | — | |||||||||||||||||||||||||||||
|
|
|
|
|
|
|
|
|
|
|
|
|
|
|
|
|
|
|
| |||||||||||||||||||||
Segment revenue | 18,159 | 3,128 | 12,661 | 26,577 | 9,053 | 3,463 | 5,860 | 4,782 | (138 | ) | 83,545 | |||||||||||||||||||||||||||||
Results | ||||||||||||||||||||||||||||||||||||||||
EBITDA* | 8,714 | 380 | 7,271 | 1,998 | (300 | ) | 878 | 1,649 | 471 | — | 21,061 | |||||||||||||||||||||||||||||
Depreciation, depletion and | 2,367 | 633 | 2,714 | 1,896 | 214 | 109 | 687 | 473 | — | 9,093 | ||||||||||||||||||||||||||||||
amortisation | ||||||||||||||||||||||||||||||||||||||||
Other income ** | 101 | — | — | 73 | 5 | 8 | 17 | 1 | — | 205 | ||||||||||||||||||||||||||||||
|
|
|
|
|
|
|
|
|
|
|
|
|
|
|
|
|
|
|
| |||||||||||||||||||||
Segment Results | 6,448 | (253 | ) | 4,557 | 175 | (509 | ) | 777 | 979 | (1 | ) | — | 12,173 | |||||||||||||||||||||||||||
Less: Unallocated expenses | (307 | ) | ||||||||||||||||||||||||||||||||||||||
Less: Finance costs | 4,977 | |||||||||||||||||||||||||||||||||||||||
Add: Other income (excluding exchange difference and those included in segment results) | 2,238 | |||||||||||||||||||||||||||||||||||||||
Add: Net exceptional gain | (17,386 | ) | ||||||||||||||||||||||||||||||||||||||
Net profit/(loss) before tax | (8,259 | ) | ||||||||||||||||||||||||||||||||||||||
Other information | ||||||||||||||||||||||||||||||||||||||||
Segment assets | 21,989 | 5,175 | 15,474 | 55,876 | 6,867 | 2,738 | 18,712 | 8,087 | — | 1,34,918 | ||||||||||||||||||||||||||||||
Financial Assets investments | 24,753 | |||||||||||||||||||||||||||||||||||||||
Deferred tax Assets | 6,889 | |||||||||||||||||||||||||||||||||||||||
Income tax Assets | 2,652 | |||||||||||||||||||||||||||||||||||||||
Cash and bank balances (Including restricted cash and bank balances) | 13,256 | |||||||||||||||||||||||||||||||||||||||
Others | 1,154 | |||||||||||||||||||||||||||||||||||||||
|
|
|
|
|
|
|
|
|
|
|
|
|
|
|
|
|
|
|
| |||||||||||||||||||||
Total assets | 1,83,622 | |||||||||||||||||||||||||||||||||||||||
|
|
|
|
|
|
|
|
|
|
|
|
|
|
|
|
|
|
|
| |||||||||||||||||||||
Segment liabilities | 5,996 | 1,226 | 10,206 | 20,811 | 4,599 | 1,268 | 1,942 | 1,574 | — | 47,622 | ||||||||||||||||||||||||||||||
Deferred tax liabilities | 2,885 | |||||||||||||||||||||||||||||||||||||||
Borrowing | 59,187 | |||||||||||||||||||||||||||||||||||||||
Income tax liabilities (net of | 188 | |||||||||||||||||||||||||||||||||||||||
payments) | ||||||||||||||||||||||||||||||||||||||||
Others | 1,993 | |||||||||||||||||||||||||||||||||||||||
|
|
|
|
|
|
|
|
|
|
|
|
|
|
|
|
|
|
|
| |||||||||||||||||||||
Total liabilities | 1,11,875 | |||||||||||||||||||||||||||||||||||||||
|
|
|
|
|
|
|
|
|
|
|
|
|
|
|
|
|
|
|
| |||||||||||||||||||||
Capital expenditure*** | 4,220 | 721 | 4,610 | 1,406 | 61 | 105 | 66 | 238 | — | 11,430 | ||||||||||||||||||||||||||||||
|
|
|
|
|
|
|
|
|
|
|
|
|
|
|
|
|
|
|
| |||||||||||||||||||||
Impairment reversal/ (charge) - net/provision | — | — | (15,907 | ) | — | (669 | ) | — | (504 | ) | — | (17,080 | ) | |||||||||||||||||||||||||||
|
|
|
|
|
|
|
|
|
|
|
|
|
|
|
|
|
|
|
| |||||||||||||||||||||
| * | EBITDA is a non-GAAP measure. |
| ** | Amortisation of duty benefits relating to assets recognised as government grant. |
| *** | Total of capital expenditure includes capital expenditure of ₹3 crores which is not allocable to any segment. It also includes acquisition through business combination. |
VEDANTA LIMITED | INTEGRATED REPORT AND ANNUAL ACCOUNTS 2020-21 | 417
CONSOLIDATED CONTINUED...
Notes
forming part of the consolidated financial statements as at and for the year ended 31 March 2021
| B) | Geographical segment analysis |
The following table provides an analysis of the Group’s sales by region in which the customer is located, irrespective of
the origin of the goods.
| (₹ in crores) | ||||||||
Geographical Segments | Year ended 31 March 2021 | Year ended 31 March 2020 | ||||||
Revenue by geographical segment | ||||||||
India | 53,621 | 54,226 | ||||||
China | 5,221 | 2,694 | ||||||
UAE | 698 | 820 | ||||||
Malaysia | 7,109 | 7,648 | ||||||
Others | 20,214 | 18,157 | ||||||
|
|
|
| |||||
Total | 86,863 | 83,545 | ||||||
|
|
|
| |||||
The following is an analysis of the carrying amount of non-current assets, excluding deferred tax assets and financial
assets, analysed by the geographical area in which the assets are located:
| (₹ in crores) | ||||||||
Geographical Segments | As at 31 March 2021 | As at 31 March 2020 | ||||||
Carrying amount of non-current assets | ||||||||
India | 1,05,615 | 1,06,844 | ||||||
South Africa | 4,449 | 3,723 | ||||||
Namibia | 887 | 750 | ||||||
Taiwan | 1,002 | 1,162 | ||||||
Other | 789 | 985 | ||||||
|
|
|
| |||||
Total | 1,12,742 | 1,13,464 | ||||||
|
|
|
| |||||
| C) | Information about major customer |
Revenue from one customer amounted to ₹10,477 crores for the year ended 31 March 2021 (31 March 2020: No
customer), arising from sales made in the Aluminium, Zinc and Copper segment. No other customer contributed to
more than 10% of revenues.
| D) | Disaggregation of Revenue |
Below table summarises the disaggregated revenue from contracts with customers:
| (₹ in crores) | ||||||||
Particulars | Year ended 31 March 2021 | Year ended 31 March 2020 | ||||||
Oil | 6,480 | 10,906 | ||||||
Gas | 684 | 795 | ||||||
Zinc Metal | 16,634 | 15,756 | ||||||
Lead Metal | 3,880 | 3,470 | ||||||
Silver Metals and bars | 4,395 | 2,476 | ||||||
Iron Ore | 2,173 | 1,482 | ||||||
Metallurgical coke | 257 | 55 | ||||||
Pig Iron | 2,425 | 2,239 | ||||||
Copper products | 10,205 | 7,349 | ||||||
Aluminium products | 28,394 | 25,429 | ||||||
Power | 3,651 | 4,406 | ||||||
Steel products | 3,966 | 3,785 | ||||||
Ferro Alloys | 274 | — | ||||||
Others | 2,126 | 3,748 | ||||||
|
|
|
| |||||
Revenue from contracts with customers* | 85,544 | 81,896 | ||||||
|
|
|
| |||||
Revenue from contingent rents | 1,515 | 1,673 | ||||||
Loss on provisionally priced contracts under Ind AS 109 | (196 | ) | (1,300 | ) | ||||
JV partner’s share of the exploration costs approved under the OM (Refer note 25) | — | 1,276 | ||||||
|
|
|
| |||||
Total revenue | 86,863 | 83,545 | ||||||
|
|
|
| |||||
| * | includes revenues from sale of services aggregating to ₹224 crores (FY2019-20: ₹216 crores) which is recorded over a period of time. The balance revenue from contracts with customers is recognised at a point in time. |
418
| < BACK TO CONTENTS | Integrated Report | Statutory reports | Financial statements |
Notes forming part of the financial statements
as at and for the year ended March 31, 2021
| 6 | PROPERTY, PLANT AND EQUIPMENT, INTANGIBLE ASSETS, CAPITAL WORK-IN-PROGRESS AND EXPLORATION INTANGIBLE ASSETS UNDER DEVELOPMENT |
| (₹ in crores) | ||||||||||||||||||||||||||||||||||||||||||||||||||||
Particulars | Freehold land | Buildings | Plant and equipment | Mining property | Oil & gas producing facilities | Furniture and fixtures | Vehicles | Office equipment | Right of use assets | Total | Capital work-in- progress (CWIP) | Exploration intangible assets under development | Total including capital work-in- progress and Exploration intangible assets under development | |||||||||||||||||||||||||||||||||||||||
Property, Plant & equipment | ||||||||||||||||||||||||||||||||||||||||||||||||||||
Gross Block | ||||||||||||||||||||||||||||||||||||||||||||||||||||
As at 01 April 2019 | 2,558 | 14,030 | 99,853 | 12,737 | 82,434 | 384 | 359 | 831 | — | 213,186 | 44,495 | 7,906 | 2,65,587 | |||||||||||||||||||||||||||||||||||||||
ROU Assets as at 01 April 2019 | (16 | ) | — | — | — | — | — | 577 | 561 | — | — | 561 | ||||||||||||||||||||||||||||||||||||||||
Additions | 10 | 357 | 2,335 | 1,491 | 186 | 12 | 41 | 123 | 1,021 | 5,576 | 5,800 | 509 | 11,885 | |||||||||||||||||||||||||||||||||||||||
Acquisition through business Combination | 12 | 7 | 14 | — | — | — | — | — | — | 33 | — | — | 33 | |||||||||||||||||||||||||||||||||||||||
Transfers/Reclassifications n | (330 | ) | 61 | 1,545 | 693 | 1,400 | 2 | 26 | 10 | — | 3,407 | (3,812 | ) | 18 | (387 | ) | ||||||||||||||||||||||||||||||||||||
Disposals/Adjustments | - | (6 | ) | (724 | ) | (126 | ) | (14 | ) | (4 | ) | (22 | ) | (8 | ) | (224 | ) | (1,128 | ) | (3 | ) | (84 | ) | (1,215 | ) | |||||||||||||||||||||||||||
Unsuccessful Exploration cost (Refer Note 33) | — | — | — | — | — | — | — | — | — | — | — | (3 | ) | (3 | ) | |||||||||||||||||||||||||||||||||||||
Exchange differences | 28 | 175 | 773 | (526 | ) | 6,812 | 16 | (10 | ) | 18 | 46 | 7,332 | 2,588 | 663 | 10,583 | |||||||||||||||||||||||||||||||||||||
|
|
|
|
|
|
|
|
|
|
|
|
|
|
|
|
|
|
|
|
|
|
|
|
|
| |||||||||||||||||||||||||||
As at 31 March 2020 | 2,278 | 14,624 | 1,03,780 | 14,269 | 90,818 | 410 | 394 | 974 | 1,420 | 2,28,967 | 49,068 | 9,009 | 2,87,044 | |||||||||||||||||||||||||||||||||||||||
|
|
|
|
|
|
|
|
|
|
|
|
|
|
|
|
|
|
|
|
|
|
|
|
|
| |||||||||||||||||||||||||||
Additions | 7 | 153 | 1,780 | 1,301 | — | 40 | 27 | 95 | 107 | 3,510 | 2,270 | 723 | 6,503 | |||||||||||||||||||||||||||||||||||||||
Acquisition through business combination | 132 | — | — | — | — | — | — | — | — | 132 | 2 | — | 134 | |||||||||||||||||||||||||||||||||||||||
(Refer note 4(a)) | ||||||||||||||||||||||||||||||||||||||||||||||||||||
Transfers/Reclassifications | (252 | ) | 105 | 3,882 | 457 | 1,009 | 21 | (32 | ) | 10 | 253 | 5,453 | (5,465 | ) | 8 | (4 | ) | |||||||||||||||||||||||||||||||||||
Disposals/Adjustments | (20 | ) | (13 | ) | (543 | ) | (5 | ) | (7 | ) | (10 | ) | (21 | ) | (8 | ) | (3 | ) | (630 | ) | (630 | ) | ||||||||||||||||||||||||||||||
Unsuccessful Exploration cost (Refer note 33) | — | — | — | — | — | — | — | — | — | — | — | (7 | ) | (7 | ) | |||||||||||||||||||||||||||||||||||||
Exchange differences | (7 | ) | 31 | 234747 | (1,852 | ) | (5 | ) | 8 | 7 | (17 | ) | (854 | ) | (645 | ) | (185 | ) | (1,684 | ) | ||||||||||||||||||||||||||||||||
|
|
|
|
|
|
|
|
|
|
|
|
|
|
|
|
|
|
|
|
|
|
|
|
|
| |||||||||||||||||||||||||||
As at 31 March 2021 | 2,138 | 14,900 | 1,09,133 | 16,769 | 89,968 | 456 | 376 | 1,078 | 1,760 | 2,36,578 | 45,230 | 9,548 | 2,91,356 | |||||||||||||||||||||||||||||||||||||||
|
|
|
|
|
|
|
|
|
|
|
|
|
|
|
|
|
|
|
|
|
|
|
|
|
| |||||||||||||||||||||||||||
Accumulated depreciation, depletion, amortisation and impairment | ||||||||||||||||||||||||||||||||||||||||||||||||||||
As at 01 April 2019 | 322 | 5,513 | 31,808 | 6,667 | 72,364 | 273 | 87 | 637 | — | 1,17,671 | 22,259 | 5,183 | 1,45,113 | |||||||||||||||||||||||||||||||||||||||
ROU Assets as at 01 April 2019 | — | — | (1 | ) | — | — | — | — | — | 1 | — | — | — | — | ||||||||||||||||||||||||||||||||||||||
Charge for the year | 10 | 547 | 4,181 | 1,634 | 2,359 | 46 | 37 | 116 | 133 | 9,063 | — | — | 9,063 | |||||||||||||||||||||||||||||||||||||||
Disposals/Adjustments | — | (1 | ) | (407 | ) | — | — | (3 | ) | (16 | ) | (7 | ) | (28 | ) | (462 | ) | — | — | (462 | ) | |||||||||||||||||||||||||||||||
Impairment charge/(reversal) for the year | — | 17 | 507 | — | 6,912 | — | — | — | 22 | 7,458 | 7,857 | 1,569 | 16,884 | |||||||||||||||||||||||||||||||||||||||
(Refer note 34) | ||||||||||||||||||||||||||||||||||||||||||||||||||||
Transfers/Reclassification | — | — | (6 | ) | — | — | — | 6 | — | — | — | — | — | — | ||||||||||||||||||||||||||||||||||||||
Exchange differences | 21 | 166 | 805 | (216 | ) | 6,406 | 14 | (6 | ) | 20 | 5 | 7,215 | 2,115 | 509 | 9,839 | |||||||||||||||||||||||||||||||||||||
|
|
|
|
|
|
|
|
|
|
|
|
|
|
|
|
|
|
|
|
|
|
|
|
|
| |||||||||||||||||||||||||||
As at 31 March 2020 | 353 | 6,242 | 36,887 | 8,085 | 88,041 | 330 | 108 | 766 | 133 | 1,40,945 | 32,231 | 7,261 | 1,80,437 | |||||||||||||||||||||||||||||||||||||||
|
|
|
|
|
|
|
|
|
|
|
|
|
|
|
|
|
|
|
|
|
|
|
|
|
| |||||||||||||||||||||||||||
Charge for the year | 6 | 535 | 4,395 | 1,516 | 772 | 32 | 38 | 122 | 194 | 7,610 | 7,610 | |||||||||||||||||||||||||||||||||||||||||
Disposals/Adjustments | (9 | ) | (13 | ) | (418 | ) | — | (7 | ) | (9 | ) | (17 | ) | (5 | ) | (1 | ) | (479 | ) | (479 | ) | |||||||||||||||||||||||||||||||
Capital work-in-progress written off/ | — | — | — | — | — | — | — | — | — | — | 244 | — | 244 | |||||||||||||||||||||||||||||||||||||||
Impairment charge for the year (Refer note 34) | ||||||||||||||||||||||||||||||||||||||||||||||||||||
Transfers/Reclassification | — | — | 35 | — | 490 | — | (7 | ) | — | — | 518 | (518 | ) | — | — | |||||||||||||||||||||||||||||||||||||
Exchange differences | (5 | ) | (6 | ) | 25 | 335 | (1,796 | ) | (5 | ) | 5 | 5 | (3 | ) | (1,445 | ) | (607 | ) | (147 | ) | (2,199 | ) | ||||||||||||||||||||||||||||||
|
|
|
|
|
|
|
|
|
|
|
|
|
|
|
|
|
|
|
|
|
|
|
|
|
| |||||||||||||||||||||||||||
As at 31 March 2021 | 345 | 6,758 | 40,924 | 9,936 | 87,500 | 348 | 127 | 888 | 323 | 1,47,149 | 31,350 | 7,114 | 1,85,613 | |||||||||||||||||||||||||||||||||||||||
|
|
|
|
|
|
|
|
|
|
|
|
|
|
|
|
|
|
|
|
|
|
|
|
|
| |||||||||||||||||||||||||||
Net Book Value/Carrying Amount | ||||||||||||||||||||||||||||||||||||||||||||||||||||
As at 01 April 2019 | 2,236 | 8,517 | 68,045 | 6,070 | 10,070 | 111 | 272 | 194 | — | 95,515 | 22,236 | 2,723 | 1,20,474 | |||||||||||||||||||||||||||||||||||||||
As at 31 March 2020 | 1,925 | 8,382 | 66,893 | 6,184 | 2,777 | 80 | 286 | 208 | 1,287 | 88,022 | 16,837 | 1,748 | 1,06,607 | |||||||||||||||||||||||||||||||||||||||
|
|
|
|
|
|
|
|
|
|
|
|
|
|
|
|
|
|
|
|
|
|
|
|
|
| |||||||||||||||||||||||||||
As at 31 March 2021 | 1,793 | 8,142 | 68,209 | 6,833 | 2,468 | 108 | 249 | 190 | 1,437 | 89,429 | 13,880 | 2,434 | 1,05,743 | |||||||||||||||||||||||||||||||||||||||
|
|
|
|
|
|
|
|
|
|
|
|
|
|
|
|
|
|
|
|
|
|
|
|
|
| |||||||||||||||||||||||||||
VEDANTA LIMITED | INTEGRATED REPORT AND ANNUAL ACCOUNTS 2020-21 | 419
CONSOLIDATED CONTINUED...
Notes
forming part of the consolidated financial statements as at and for the year ended 31 March 2021
| 6 | RIGHT OF USE (ROU) ASSETS |
| ROU Land | ROU Building | ROU Plant and Equipment | Total | |||||||||||||
Gross Block | ||||||||||||||||
As at 01 April 2019 | — | — | — | — | ||||||||||||
ROU Assets as at 01 April 2019 | 311 | 239 | 27 | 577 | ||||||||||||
Additions | 302 | 40 | 679 | 1,021 | ||||||||||||
Disposals/Adjustments | — | (224 | ) | — | (224 | ) | ||||||||||
Exchange differences | 9 | 9 | 28 | 46 | ||||||||||||
|
|
|
|
|
|
|
| |||||||||
As at 31 March 2020 | 622 | 64 | 734 | 1,420 | ||||||||||||
|
|
|
|
|
|
|
| |||||||||
Additions | 91 | — | 16 | 107 | ||||||||||||
Transfers/Reclassification | 253 | — | — | 253 | ||||||||||||
Disposals/Adjustments | — | (2 | ) | (1 | ) | (3 | ) | |||||||||
Exchange differences | (4 | ) | (1 | ) | (12 | ) | (17 | ) | ||||||||
|
|
|
|
|
|
|
| |||||||||
As at 31 March 2021 | 962 | 61 | 737 | 1,760 | ||||||||||||
|
|
|
|
|
|
|
| |||||||||
Accumulated depreciation & impairment As at 01 April 2019 | ||||||||||||||||
ROU Assets as at 01 April 2019 | — | — | 1 | 1 | ||||||||||||
Charge for the year | 51 | 42 | 40 | 133 | ||||||||||||
Disposals/Adjustments | — | (28 | ) | — | (28 | ) | ||||||||||
Impairment charge/(reversal) for the year | 22 | — | — | 22 | ||||||||||||
Exchange differences | 1 | 2 | 2 | 5 | ||||||||||||
|
|
|
|
|
|
|
| |||||||||
As at 31 March 2020 | 74 | 16 | 43 | 133 | ||||||||||||
|
|
|
|
|
|
|
| |||||||||
ROU Assets as at 01 April 2019 | ||||||||||||||||
Charge for the year | 48 | 14 | 132 | 194 | ||||||||||||
Disposals/Adjustments | — | (1 | ) | 0 | (1 | ) | ||||||||||
Exchange differences | (2 | ) | — | (1 | ) | (3 | ) | |||||||||
|
|
|
|
|
|
|
| |||||||||
As at 31 March 2021 | 120 | 29 | 174 | 323 | ||||||||||||
|
|
|
|
|
|
|
| |||||||||
Net Book Value | ||||||||||||||||
As at 01 April 2019 | — | — | — | — | ||||||||||||
As at 31 March 2020 | 548 | 48 | 691 | 1,287 | ||||||||||||
|
|
|
|
|
|
|
| |||||||||
As at 31 March 2021 | 842 | 32 | 563 | 1,437 | ||||||||||||
|
|
|
|
|
|
|
| |||||||||
| (₹ in crores) | ||||||||||||||||||||||||
Particulars | Software License | Right to use* | Mining Rights | Port concession rights (refer note k) | Brand & Technological know-how | Total | ||||||||||||||||||
Intangible assets | ||||||||||||||||||||||||
Gross Block | ||||||||||||||||||||||||
As at 01 April 2019 | 342 | 69 | 381 | 678 | 224 | 1,694 | ||||||||||||||||||
Additions | 21 | 6 | — | 6 | — | 33 | ||||||||||||||||||
Transfers from Property, Plant and Equipment | 1 | 37 | — | — | — | 38 | ||||||||||||||||||
Disposals/Adjustments | — | — | — | (1 | ) | — | (1 | ) | ||||||||||||||||
Exchange differences | 15 | — | — | — | 23 | 38 | ||||||||||||||||||
|
|
|
|
|
|
|
|
|
|
|
| |||||||||||||
As at 31 March 2020 | 379 | 112 | 381 | 683 | 247 | 1,802 | ||||||||||||||||||
|
|
|
|
|
|
|
|
|
|
|
| |||||||||||||
Additions | 9 | 32 | — | 1 | — | 42 | ||||||||||||||||||
Acquisition through business combination (Refer note 4(a)) | — | — | 220 | — | — | 220 | ||||||||||||||||||
Transfers from Property, Plant and Equipment | 4 | — | — | — | — | 4 | ||||||||||||||||||
420
| < BACK TO CONTENTS | Integrated Report | Statutory reports | Financial statements |
Notes
forming part of the financial statements as at and for the year ended March 31, 2021
| (₹ in crores) | ||||||||||||||||||||||||
Particulars | Software License | Right to use* | Mining Rights | Port concession rights (refer note k) | Brand & Technological know-how | Total | ||||||||||||||||||
Disposals/Adjustments | (6 | ) | — | — | — | — | (6 | ) | ||||||||||||||||
Exchange differences | (2 | ) | — | — | — | (11 | ) | (13 | ) | |||||||||||||||
|
|
|
|
|
|
|
|
|
|
|
| |||||||||||||
As at 31 March 2021 | 384 | 144 | 601 | 684 | 236 | 2,049 | ||||||||||||||||||
|
|
|
|
|
|
|
|
|
|
|
| |||||||||||||
Accumulated amortisation and impairment | ||||||||||||||||||||||||
As at 01 April 2019 | 302 | 14 | 324 | 145 | 27 | 812 | ||||||||||||||||||
Charge for the year | 32 | 5 | 4 | 25 | 23 | 89 | ||||||||||||||||||
Disposals/Adjustments | — | — | — | — | — | — | ||||||||||||||||||
Transfers from Property, Plant and | 0 | — | — | — | — | 0 | ||||||||||||||||||
Equipment | ||||||||||||||||||||||||
Exchange differences | 15 | — | — | — | 4 | 19 | ||||||||||||||||||
|
|
|
|
|
|
|
|
|
|
|
| |||||||||||||
As at 31 March 2020 | 349 | 19 | 328 | 170 | 54 | 920 | ||||||||||||||||||
|
|
|
|
|
|
|
|
|
|
|
| |||||||||||||
Charge for the year | 16 | 6 | 32 | 25 | 23 | 102 | ||||||||||||||||||
Disposals/Adjustments | (6 | ) | — | — | — | — | (6 | ) | ||||||||||||||||
Transfers from Property, Plant and Equipment | — | — | — | — | — | — | ||||||||||||||||||
Exchange differences | (4 | ) | — | — | — | (4 | ) | (8 | ) | |||||||||||||||
|
|
|
|
|
|
|
|
|
|
|
| |||||||||||||
As at 31 March 2021 | 355 | 25 | 360 | 195 | 73 | 1,008 | ||||||||||||||||||
|
|
|
|
|
|
|
|
|
|
|
| |||||||||||||
Net Book Value/Carrying Amount | ||||||||||||||||||||||||
As at 01 April 2019 | 40 | 55 | 57 | 533 | 197 | 882 | ||||||||||||||||||
As at 31 March 2020 | 30 | 93 | 53 | 513 | 193 | 882 | ||||||||||||||||||
|
|
|
|
|
|
|
|
|
|
|
| |||||||||||||
As at 31 March 2021 | 29 | 119 | 241 | 489 | 163 | 1,041 | ||||||||||||||||||
|
|
|
|
|
|
|
|
|
|
|
| |||||||||||||
| a) | Plant and equipment include refineries, smelters, power plants, railway sidings, ships, aircrafts, river fleets and related facilities. |
| b) | During the year ended 31 March 2021, interest capitalised was ₹316 crores (31 March 2020: ₹1,017 crores). |
| c) | Freehold land includes ₹289 crores (31 March 2020: ₹293 crores), accumulated depreciation ₹255 crores (31 March 2020: ₹254 crores), which is available for use during the lifetime of the Production Sharing Contract of the respective Oil and Gas blocks and title deed for the same is in the name of the licensee of the block. |
| d) | Certain property, plant and equipment are pledged as collateral against borrowings, the details related to which have been described in Note 19 on “Borrowings”. |
| e) | Freehold land includes 40 quarters at Bidhan Bagh Unit and 300.88 acres of land at Korba and Bidhan Bagh which have been occupied without authorisation for which Group is evaluating evacuation options and the Group has filed the civil suits for the same. |
| f) | The land transferred to BALCO by National Thermal Power Corporation Ltd. (NTPC) vide agreement dated 20 June 2002 comprising of 171.44 acres land for BALCO’s 270 MW captive power plant and its allied facilities and 34.74 acres land for staff quarters of the said captive power plant is yet to be registered in favour of BALCO due to non-availability of title deeds from NTPC. The arbitration is pending between Balco and NTPC (presently in appeal before Delhi High Court), in which transfer of title deeds is also sub-judice and is posted for hearing on 27 July 2021. |
VEDANTA LIMITED | INTEGRATED REPORT AND ANNUAL ACCOUNTS 2020-21 | 421
CONSOLIDATED CONTINUED...
Notes
forming part of the consolidated financial statements as at and for the year ended 31 March 2021
| g) | The Division Bench of the Hon’ble High Court of Chhattisgarh has vide its order dated 25 February 2010, upheld that BALCO is in legal possession of 1,804.67 acres of Government land. Subsequent to the said order, the State Government has decided to issue the lease deed in favour of BALCO after the issue of forest land is decided by the Hon’ble Supreme Court. In the proceedings before the Hon’ble Supreme Court, pursuant to public interest litigations filed, it has been alleged that land in possession of BALCO is being used in contravention of the Forest Conservation Act, 1980 even though the said land has been in its possession prior to the promulgation of the Forest Conservation Act, 1980 on which its Aluminium complex, allied facilities and township were constructed between 1971-76. The Central Empowered Committee of the Supreme Court has already recommended ex-post facto diversion of the forest land in possession of BALCO. BALCO has also filed two IA before the Supreme Court, 1st challenging the order of the Tehsildar Korba whereby he rejected BALCO’S applications for eviction of illegal encroachers on BALCO’S land on the ground that land matter is subjudice before the Supreme Court and the other application whereby BALCO has challenged the state government’s action for allotment of land to illegal encroachers under the Rajiv Ashray Yojna. No next date is there and the matter is to be listed in due course. |
| h) | Property, Plant and Equipment, Capital work-in- progress and exploration and evaluation assets net block includes |
| share of jointly owned assets with the joint venture partners ₹11,327 crores (31 March 2020: ₹11,154 crores). |
| i) | In accordance with the exemption given under Ind AS 101, which has been exercised by the Group, a first time adopter can continue its previous GAAP policy for accounting for exchange differences arising from translation of long-term foreign currency monetary items recognised in the previous GAAP financial statements for the period ending immediately before the beginning of the first Ind AS financial reporting period, i.e. 01 April 2016. |
Accordingly, foreign currency exchange loss arising on translation/settlement of long-term foreign currency monetary items acquired before 01 April 2016 pertaining to the acquisition of a depreciable asset amounting to ₹56 crores (31 March 2020: ₹65 crores) are adjusted to the cost of respective item of property, plant and equipment.
| j) | Reconciliation of depreciation, depletion and amortisation expense |
| (₹ in Crore) | ||||||||
Particulars | For the year ended 31 March 2021 | For the year ended 31 March 2020 | ||||||
Depreciation/ Depletion/ Amortisation expense on: | ||||||||
Property, Plant and equipment | 7,610 | 9,063 | ||||||
Intangible assets | 102 | 89 | ||||||
|
|
|
| |||||
As per Property, Plant and Equipment and Intangibles schedule | 7,712 | 9,152 | ||||||
|
|
|
| |||||
Less: Depreciation capitalised | (50 | ) | — | |||||
Less: Cost allocated to joint ventures | (24 | ) | (59 | ) | ||||
|
|
|
| |||||
As per Consolidated Statement of Profit and Loss | 7,638 | 9,093 | ||||||
|
|
|
| |||||
| k) | Vizag General Cargo Berth Private Limited (VGCB), a special purpose vehicle and wholly-owned by the Company, was incorporated for the coal berth mechanisation and upgradation at Visakhapatnam port. The project was to be carried out on a design, build, finance, operate, transfer basis and the concession agreement between Visakhapatnam Port Trust (‘VPT’) and the Company was signed in June 2010. In October 2010, the Company was awarded with the concession after fulfilling conditions stipulated as a precedent to the concession agreement. Visakhapatnam port trust has provided, in lieu of license fee an exclusive license to the Company for designing, engineering, financing, constructing, equipping, operating, maintaining, and replacing the project/project facilities and services. The concession period is 30 years from the date of the award. The upgraded capacity is 10.18 mmtpa and the Visakhapatnam port trust would be entitled to receive 38.10% share of the gross revenue as royalty. The Company |
is entitled to recover a tariff from the user(s) of the project facilities and services as per its Tariff Authority for Major Ports(TAMP) notification. The tariff rates are linked to the Wholesale Price Index (WPI) and would accordingly be adjusted as specified in the concession agreement every year. The ownership of all infrastructure assets, buildings, structures, berths, wharfs, equipment and other immovable and movable assets constructed, installed, located, created or provided by the Company at the project site and/or in the port’s assets pursuant to concession agreement would be with the Company until expiry of this concession agreement. The cost of any repair, replacement or restoration of the project facilities and services shall be borne by the Company during the concession period. The Company has to transfer all its rights, titles and interest in the project facilities and services free of cost to VPT at the end of the concession period. Intangible asset port concession rights represents consideration for construction services. No Revenue from construction contract of service concession arrangments on exchanging construction services for the port concession rights was recognised for the year ended 31 March 2021 and 31 March 2020.
422
| < BACK TO CONTENTS | Integrated Report | Statutory reports | Financial statements |
Notes
forming part of the financial statements as at and for the year ended March 31, 2021
| l) | Title deed of freehold land of 264 acres relating to ESL Steel Limited was not available with the Group up to previous year. During the year the Group has got it regularised. |
| m) | As at 31 March 2021, TSPL’s assets consisting of land (including ROU land), building and plant and machinery having net carrying value of ₹394 crores (31 March 2020: ₹397 crores), ₹183 crores (31 March 2020: ₹200 crores) and ₹9,026 crores (31 March 2020: ₹9,435 crores) respectively have been given on operating lease (Refer note 3(c)(B)(i)). |
| n) | A parcel of land aggregating to ₹349 croress relating to Iron Ore business was reclassified during the previous year, due to existence of litigation, to Financial Assets and later impaired (Refer note 33) and ₹4 crores transferred to intangible assets from CWIP (31 March 2020: ₹38 croress). |
| 7 | FINANCIAL ASSETS - INVESTMENTS |
| A) | Non-current Investments |
| (₹ in crores) | ||||||||||
Particulars | As at 31 March 2021 | As at 31 March 2020 | ||||||||
| (I) | Investments at fair value through other comprehensive income | |||||||||
Investment in Equity Shares - Quoted | ||||||||||
Sterlite Technologies Limited - 47,64,295 shares of ₹2 each (including 60 shares held jointly with nominees) | 92 | 30 | ||||||||
Investment in Equity Shares - unquoted | ||||||||||
Sterlite Power Transmission Limited - 9,52,859 equity shares of ₹2 each (including 12 shares held jointly with nominees) | 11 | 11 | ||||||||
Other Investments | 0 | 0 | ||||||||
| (II) | Investments at fair value through profit and loss | |||||||||
Investment in Bonds - Quoted - Infrastructure Leasing & Financial Services Limited | 51 | 51 | ||||||||
| (III) | Investment in Equity Shares (fully paid) | |||||||||
Associate Companies - Unquoted | ||||||||||
Gaurav Overseas Private Limited - 3,23,000 equity shares of ₹10 each | 0 | 0 | ||||||||
RoshSkor Township (Proprietary) Limited - 50 equity shares of NAD 1 each | 2 | 3 | ||||||||
Rampia Coal Mines and Energy Private Limited - 2,72,29,539 equity shares of ₹1 each | 3 | 3 | ||||||||
Raykal Aluminium Company Private Limited - 12,250 shares of ₹10 each | 0 | 0 | ||||||||
Joint ventures - Unquoted | ||||||||||
Madanpur South Coal Company Limited - 1,14,421 equity shares of ₹10 each | 2 | 2 | ||||||||
Goa Maritime Private Limited - 5,000 equity shares of ₹10 each | 0 | 0 | ||||||||
Rosh Pinah Health Care (Proprietary) Limited - 69 equity shares of NAD 1 each | 0 | 0 | ||||||||
Gergarub Exploration and Mining (Pty) Limited - 51 equity shares of NAD 1 each | 0 | 0 | ||||||||
Less: Impairment in the value of investment in joint ventures | (5 | ) | (5 | ) | ||||||
|
|
|
| |||||||
Total | 156 | 95 | ||||||||
|
|
|
| |||||||
| (₹ in crores) | ||||||||
a) Particulars | As at 31 March 2021 | As at 31 March 2020 | ||||||
| Aggregate amount of quoted investments, and market value thereof | 143 | 81 | ||||||
| Aggregate amount of unquoted investments | 18 | 19 | ||||||
| Aggregate amount of impairment in the value of investments | (5 | ) | (5 | ) | ||||
|
|
|
| |||||
Total | 156 | 95 | ||||||
|
|
|
| |||||
VEDANTA LIMITED | INTEGRATED REPORT AND ANNUAL ACCOUNTS 2020-21 | 423
CONSOLIDATED CONTINUED...
Notes
forming part of the consolidated financial statements as at and for the year ended March 31, 2021
| B) | Current Investments |
| (₹ in crores) | ||||||||
Particulars | 31 March 2021 As at | As at 31 March 2020 | ||||||
Investments carried at fair value through profit and loss (fully paid) | ||||||||
Investment in mutual funds – quoted | 5,419 | 5,149 | ||||||
Investment in mutual funds – unquoted | 6,318 | 7,597 | ||||||
Investment in bonds – quotedb | 4,767 | 11,911 | ||||||
|
|
|
| |||||
Investment in India Grid trust – quotedb | 0 | 1 | ||||||
|
|
|
| |||||
Total | 16,504 | 24,658 | ||||||
|
|
|
| |||||
| (₹ in crores) | ||||||||
a) Particulars | As at 31 March 2021 | As at 31 March 2020 | ||||||
Aggregate amount of quoted investments, and market value thereof | 10,186 | 17,061 | ||||||
Aggregate amount of unquoted investments | 6,318 | 7,597 | ||||||
|
|
|
| |||||
Total | 16,504 | 24,658 | ||||||
|
|
|
| |||||
| b) | Investment in related parties are sold during the year. Refer note 40(J). |
| 8 | FINANCIAL ASSETS – TRADE RECEIVABLES |
| (₹ in crores) | ||||||||||||||||||||||||
| As at 31 March 2021 | As at 31 March 2020 | |||||||||||||||||||||||
Particulars | Non-current | Current | Total | Non-current | Current | Total | ||||||||||||||||||
Unsecured | 3,799 | 3,515 | 7,314 | 3,658 | 2,720 | 6,378 | ||||||||||||||||||
Less: Provision for expected credit loss | (641 | ) | (24 | ) | (665 | ) | (547 | ) | (23 | ) | (570 | ) | ||||||||||||
|
|
|
|
|
|
|
|
|
|
|
| |||||||||||||
Total | 3,158 | 3,491 | 6,649 | 3,111 | 2,697 | 5,808 | ||||||||||||||||||
|
|
|
|
|
|
|
|
|
|
|
| |||||||||||||
| a) | The credit period given to customer is up to 180 days. Also refer note 22(C)(d). |
| b) | For amount due and terms and conditions of related party receivables refer note 40. |
| c) | In July 2017, the Appellate Tribunal for Electricity dismissed the appeal filed by one of the Group’s subsidiaries, Talwandi Sabo Power Limited (TSPL) with respect to the interpretation of how the calorific value of coal and costs associated with it should be determined. However, APTEL had allowed payment of shunting and unloading charges. TSPL filed an appeal before the Honourable Supreme Court (SC), which by an order dated March 07, 2018 has decided the matter in favour of TSPL. Consequently, PSPCL has paid majority of the dues. The outstanding dues (included in trade receivables) and interest receivable in relation to this dispute as at 31 March 2021 is ₹17 crores (31 March 2020: ₹247 crores) and ₹65 crores (31 March 2020: ₹139 crores) respectively. |
In another matter relating to assessment of whether there has been a change in law following the execution of the Power Purchase Agreement, the Appellate Tribunal for Electricity has dismissed the appeal in July 2017 filed by TSPL. TSPL filed an appeal before the Honourable Supreme Court to seek relief which is yet to be listed. The outstanding trade receivables in relation to this dispute and other matters is ₹1,605 crores as at 31 March 2021 (31 March 2020: ₹1,298 crores). The Group, based on external legal opinion and its own assessment of the merits of the case, remains confident that it is highly probable that the Supreme court will uphold TSPL’s appeal and has thus continued to treat these balances as recoverable.
Additionally, as at 31 March 2021, trade receivables amounting to ₹1,323 crores (31 March 2020: ₹1,349 crores) withheld by GRIDCO (‘GRIDCO’ or ‘the Customer’) on account of certain disputes relating to computation of power tariffs pending adjudication by Appellate Tribunal for Electricity (APTEL), which the Company is confident of recovering fully. The Customer has also raised claims of ₹413 crores on the Company in respect of short supply of power for which a provision of ₹218 crores has been made. Various minutes of meetings were signed with the Customer for computing the short supply claims, which were subject to approval of Odisha State Electricity
424
| < BACK TO CONTENTS | Integrated Report | Statutory reports | Financial statements |
Notes
forming part of the consolidated financial statements as at and for the year ended March 31, 2021
Regulatory Commission (‘OERC’). On 22 June 2020 OERC pronounced its order on computation methodology for short supply claims, basis which both the parties had to recompute the amount of claim and settle the matter in two months from the date of the order. On initial impact assessment of the said Order by the Company, it believes that no further provisioning is required in this regard.
Further, the Company filed an appeal before APTEL against the OERC Order. The matter is now listed before registrar court on 14 July 2021. The Customer has also sought review of the OERC Order. The matter has been posted for order by OERC in due course. In the meanwhile, power supply to GRIDCO has resumed and GRIDCO has been making regular payments against monthly energy invoices.
| d) | The total trade receivables as at 01 April 2019 were ₹7,670 crores (net of provision for expected credit loss). |
| 9 | FINANCIAL ASSETS – LOANS |
| (₹ in crores) | ||||||||||||||||||||||||
| As at 31 March 2021 | As at 31 March 2020 | |||||||||||||||||||||||
Particulars | Non-current | Current | Total | Non-current | Current | Total | ||||||||||||||||||
Unsecured, considered good | ||||||||||||||||||||||||
Loans to related parties | 5,056 | 2,015 | 7,071 | 4 | 80 | 84 | ||||||||||||||||||
(Refer note 40) | ||||||||||||||||||||||||
Loans and advances to employees | 1 | 4 | 5 | 1 | 5 | 6 | ||||||||||||||||||
Security Deposit | 12 | — | 12 | 12 | — | 12 | ||||||||||||||||||
Unsecured, considered credit impaired | ||||||||||||||||||||||||
Loans to related parties | — | 78 | 78 | — | — | — | ||||||||||||||||||
(Refer note 40(N)) | ||||||||||||||||||||||||
Less: Provision for expected credit loss | — | (78 | ) | (78 | ) | — | — | — | ||||||||||||||||
|
|
|
|
|
|
|
|
|
|
|
| |||||||||||||
Total | 5,069 | 2,019 | 7,088 | 17 | 85 | 102 | ||||||||||||||||||
|
|
|
|
|
|
|
|
|
|
|
| |||||||||||||
| 10 | FINANCIAL ASSETS – OTHERS |
| (₹ in crores) | ||||||||||||||||||||||||
| As at 31 March 2021 | As at 31 March 2020 | |||||||||||||||||||||||
Particulars | Non-current | Current | Total | Non-current | Current | Total | ||||||||||||||||||
Bank deposits a,b | 115 | — | 115 | 754 | — | 754 | ||||||||||||||||||
Site Restoration asset b | 822 | — | 822 | 617 | — | 617 | ||||||||||||||||||
Unsecured, considered good | ||||||||||||||||||||||||
Receivables from related parties | — | 101 | 101 | — | 115 | 115 | ||||||||||||||||||
(Refer note 40) | ||||||||||||||||||||||||
Security deposits | 169 | 16 | 185 | 157 | 28 | 185 | ||||||||||||||||||
Others | ||||||||||||||||||||||||
Advance recoverable (oil and gas | — | 3,908 | 3,908 | — | 1,371 | 1,371 | ||||||||||||||||||
business) | ||||||||||||||||||||||||
Others (Refer note 25(b)) | 1,414 | 220 | 1,634 | 995 | 892 | 1,887 | ||||||||||||||||||
Unsecured, considered credit impaired | ||||||||||||||||||||||||
Security deposits | 42 | 1 | 43 | 42 | 1 | 43 | ||||||||||||||||||
Balance with government authorities | — | 3 | 3 | — | 2 | 2 | ||||||||||||||||||
Receivables from related parties (Refer | — | 20 | 20 | — | — | — | ||||||||||||||||||
note 40(N)) | ||||||||||||||||||||||||
Others c | 558 | 396 | 954 | 444 | 477 | 921 | ||||||||||||||||||
Less: Provision for expected credit loss | (600 | ) | (420 | ) | (1,020 | ) | (486 | ) | (480 | ) | (966 | ) | ||||||||||||
|
|
|
|
|
|
|
|
|
|
|
| |||||||||||||
Total | 2,520 | 4,245 | 6,765 | 2,523 | 2,406 | 4,929 | ||||||||||||||||||
|
|
|
|
|
|
|
|
|
|
|
| |||||||||||||
| a) | Bank deposits includes fixed deposit with maturity more than twelve months of ₹30 crores (31 March 2020: ₹25 crores) under lien with bank, ₹5 crores (31 March 2020: Nil) fixed deposit under lien with Others, ₹21 crores (31 March 2020: Nil) reserve created against principal payment on loans from banks and margin money of ₹4 crores (31 March 2020: ₹5 crores). |
VEDANTA LIMITED | INTEGRATED REPORT AND ANNUAL ACCOUNTS 2020-21 | 425
CONSOLIDATED CONTINUED...
Notes
forming part of the consolidated financial statements as at and for the year ended March 31, 2021
| b) | Bank deposits and site restoration asset earns interest at fixed rate based on respective deposit rate. |
| c) | A parcel of land amounting to ₹349 crores relating to Iron Ore business has been reclassified during the previous year, due to existing litigation, from Property, plant and equipment and was later provided for (Refer note 34(d)). |
| 11 | OTHER ASSETS |
| (₹ in crores) | ||||||||||||||||||||||||
| As at 31 March 2021 | As at 31 March 2020 | |||||||||||||||||||||||
Particulars | Non-current | Current | Total | Non-current | Current | Total | ||||||||||||||||||
Unsecured, considered good | ||||||||||||||||||||||||
Capital advances | 1,186 | — | 1,186 | 1,230 | — | 1,230 | ||||||||||||||||||
Advances other than capital advances | ||||||||||||||||||||||||
Security deposits | 0 | — | 0 | 0 | — | 0 | ||||||||||||||||||
Advances to related party | 94 | 227 | 321 | — | 21 | 21 | ||||||||||||||||||
(Refer note 40) | ||||||||||||||||||||||||
Advances for supplies | — | 1,221 | 1,221 | — | 1,400 | 1,400 | ||||||||||||||||||
Others | ||||||||||||||||||||||||
Balance with government authorities a | 610 | 729 | 1,339 | 553 | 976 | 1,529 | ||||||||||||||||||
Others b | 1,320 | 1,127 | 2,447 | 1,547 | 741 | 2,288 | ||||||||||||||||||
Unsecured, considered doubtful | ||||||||||||||||||||||||
Capital advances c | 220 | — | 220 | 208 | — | 208 | ||||||||||||||||||
Advance for supplies | — | 51 | 51 | — | 48 | 48 | ||||||||||||||||||
Balance with government authorities | 3 | 5 | 8 | 3 | — | 3 | ||||||||||||||||||
Others b | 799 | 5 | 804 | 602 | 5 | 607 | ||||||||||||||||||
Less: Provision for doubtful advances | (1,022 | ) | (61 | ) | (1,083 | ) | (813 | ) | (53 | ) | (866 | ) | ||||||||||||
|
|
|
|
|
|
|
|
|
|
|
| |||||||||||||
Total | 3,210 | 3,304 | 6,514 | 3,330 | 3,138 | 6,468 | ||||||||||||||||||
|
|
|
|
|
|
|
|
|
|
|
| |||||||||||||
| a) | Includes ₹58 crores (31 March 2020: ₹58 crores), being Company’s share of gross amount of ₹86 crores (31 March 2020: ₹86 crores) paid under protest on account of Education Cess and Secondary Higher Education Cess for the year ended 2013-14. |
| b) | Others include claim receivables, advance recoverable (oil and gas business), prepaid expenses and export incentive receivables. This also includes amounts receivable from KCM (Refer note 34(e)). |
| c) | During the previous year, an impairment charge of ₹196 crores has been recognised relating to copper business (Refer note 34(c)). |
| 12 | INVENTORIES |
| (₹ in crores) | ||||||||
Particulars | As at | As at | ||||||
Raw materials | 2,070 | 2,013 | ||||||
Goods-in transit | 1,303 | 1,010 | ||||||
Work-in-progress | 3,012 | 3,319 | ||||||
Goods-in transit | 1 | 4 | ||||||
Finished good | 823 | 1,222 | ||||||
Goods-in transit | 32 | 48 | ||||||
Fuel stock | 798 | 1,386 | ||||||
Goods-in transit | 190 | 352 | ||||||
Stores and spares | 1,668 | 1,955 | ||||||
Goods-in transit | 26 | 26 | ||||||
|
|
|
| |||||
Total | 9,923 | 11,335 | ||||||
|
|
|
| |||||
| a) | Inventory held at net realisable value ₹2,399 crores (31 March 2020: ₹2,358 crores) as at 31 March 2021. |
| b) | The write down of inventories amounting to ₹159 crores (31 March 2020: ₹118 crores) has been charged to the consolidated statement of profit and loss during the year. |
| c) | For method of valuation for each class of inventories, refer Note 3(a)(L). |
426
| < BACK TO CONTENTS | Integrated Report | Statutory reports | Financial statements |
Notes
forming part of consolidated the financial statements as at and for the year ended March 31, 2021
| 13 | CASH AND CASH EQUIVALENTS |
| (₹ in crores) | ||||||||
Particulars | As at | As at | ||||||
Balances with banks | 2,661 | 2,392 | ||||||
Bank deposits with original maturity of less than 3 months (including interest accrued thereon) a,b | 2,193 | 2,725 | ||||||
Cash on Hand | 0 | 0 | ||||||
|
|
|
| |||||
Total | 4,854 | 5,117 | ||||||
|
|
|
| |||||
| a) | Bank deposits include restricted funds of Nil (31 March 2020: ₹57 crores) held as collateral in respect of closure costs. |
| b) | Bank deposits earns interest at fixed rate based on respective deposit rate. |
| 14 | OTHER BANK BALANCES |
| (₹ in crores) | ||||||||
Particulars | As at | As at | ||||||
Bank deposits with original maturity of more than 3 months but less than 12 months | 11,212 | 7,249 | ||||||
(including interest accrued thereon) a,b | ||||||||
Bank deposits with original maturity of more than 12 months (including interest accrued thereon) c | 461 | 40 | ||||||
Earmarked unpaid dividend accounts e | 100 | 94 | ||||||
|
|
|
| |||||
Earmarked escrow account f | 2 | 2 | ||||||
|
|
|
| |||||
Total | 11,775 | 7,385 | ||||||
|
|
|
| |||||
| a) | The above bank deposits includes ₹657 crores (31 March 2020: ₹256 crores) on lien with banks and margin money of ₹272 crores (31 March 2020: ₹99 crores). |
| b) | Restricted funds of ₹460 crores (31 March 2020: Nil ) held as interest reserve created against interest payment on loans from banks, ₹46 crores (31 March 2020: ₹57 crores) held as collateral in respect of closure costs and ₹21 crores (31 March 2020: Nil) held as lien with Others. |
| c) | Includes ₹1 crores (31 March 2020: ₹40 crores) margin money with banks. |
| d) | Bank deposits earn interest at fixed rate based on respective deposit rate. |
| e) | Earmarked unpaid dividend accounts are restricted in use as it relates to unclaimed dividends or unpaid dividend. |
| f) | Earmarked escrow account includes amount restricted in use as it relates to unclaimed redeemable preference shares. |
| 15 | SHARE CAPITAL |
| As at 31 March 2021 | As at 31 March 2020 | |||||||||||||||
Particulars | Number | Amount | Number | Amount | ||||||||||||
A) Authorised equity share capital | ||||||||||||||||
Opening and closing balance (equity shares of ₹1 each with voting rights) | 4,402 | 4,402 | 4,402 | 4,402 | ||||||||||||
Authorised preference share capital | ||||||||||||||||
Opening and closing balance (preference shares of ₹10 each) | 301 | 3,010 | 301 | 3,010 | ||||||||||||
B) Issued , subscribed and paid up | ||||||||||||||||
Equity shares of ₹1 each with voting rights a.b | 372 | 372 | 372 | 372 | ||||||||||||
|
|
|
|
|
|
|
| |||||||||
Total | 372 | 372 | 372 | 372 | ||||||||||||
|
|
|
|
|
|
|
| |||||||||
| a) | Includes 3,08,232 (31 March 2020: 3,08,232) equity shares kept in abeyance. These shares are not part of listed equity capital and pending allotment as they are sub-judice. |
| b) | Includes 1,21,93,159 (31 March 2020: 1,43,78,261 ) equity shares held by Vedanta Limited ESOS Trust (Refer Note 16). |
VEDANTA LIMITED | INTEGRATED REPORT AND ANNUAL ACCOUNTS 2020-21 | 427
CONSOLIDATED CONTINUED...
Notes
forming part of the financial statements as at and for the year ended March 31, 2021
| C) | Shares held by ultimate holding company and its subsidiaries/associates * |
| As at 31 March 2021 | As at 31 March 2020 | |||||||||||||||
Particulars | No. of Shares held | % of holding | No. of Shares held | % of holding | ||||||||||||
| (in crores) | (in crores) | |||||||||||||||
Twin Star Holdings Limited | 137.94 | 37.11 | 128.01 | 34.44 | ||||||||||||
Twin Star Holdings Limited(2) | — | — | 9.93 | 2.67 | ||||||||||||
Finsider International Company Limited | 40.15 | 10.80 | 40.15 | 10.80 | ||||||||||||
Westglobe Limited | 4.43 | 1.19 | 4.43 | 1.19 | ||||||||||||
Welter Trading Limited | 3.82 | 1.03 | 3.82 | 1.03 | ||||||||||||
Vedanta Holdings Mauritius II Limited(3) | 18.50 | 4.98 | — | — | ||||||||||||
|
|
|
|
|
|
|
| |||||||||
Total | 204.84 | 55.11 | 186.34 | 50.13 | ||||||||||||
|
|
|
|
|
|
|
| |||||||||
| * | The % of holding has been calculated on the issued and subscribed share capital as at the respective balance sheet date. |
| (1) | All the above entities are subsidiaries of Volcan Investments Limited, the ultimate holding company. |
| (2) | Represented by 2,48,23,177 American Depository Shares (“ADS”) which got coverted to equity shares in FY2020-21. |
| (3) | Vedanta Holdings Mauritius II Limited (part of Promoter Group of Vedanta Limited) had purchased 185,000,000 equity shares aggregating to 4.98% of equity share capital of Vedanta Limited, on 24 December 2020 via bulk deal on stock exchange. |
| D) | Aggregate number of bonus shares issued, shares issued for consideration other than cash and shares bought back during the period of five years immediately preceding the reporting date |
| (₹ in crores) | ||||||||
Particulars | As at | As at | ||||||
Equity shares issued pursuant to Scheme of Amalgamation (in FY2017-18) | 75 | 75 | ||||||
Preference shares issued pursuant to Scheme of Amalgamation (in FY2017-18)* | 301 | 301 | ||||||
| * | These were redeemed on 27 October 2018. |
| E) | Details of shareholders holding more than 5% shares in the Company * |
| As at 31 March 2021 | As at 31 March 2020 | |||||||||||||||
Particulars | No. of Shares held | % of holding | No. of Shares held | % of holding | ||||||||||||
| (in crores) | (in crores) | |||||||||||||||
Twin Star Holdings Limited | 137.94 | 37.11 | 128.01 | 34.44 | ||||||||||||
Twin Star Holdings Limited # | — | — | 9.93 | 2.67 | ||||||||||||
Finsider International Company Limited | 40.15 | 10.80 | 40.15 | 10.80 | ||||||||||||
ICICI Prudential Equity Arbitrage Fund | 8.32 | 2.24 | 18.69 | 5.03 | ||||||||||||
Life Insurance Corporation of India | 24.40 | 6.56 | 23.67 | 6.37 | ||||||||||||
| # | 2,48,23,177 ADS, held by CITI Bank N.A. New York as a depository which has been converted to equity shares in FY2020-21. |
| * | The % of holding has been calculated on the issued and subscribed share capital as at respective balance sheet date. |
As per the records of the Company, including its register of shareholders/members, the above shareholding represents legal ownership of shares.
F) Other disclosures
i) The Company has one class of equity shares having a par value of ₹1 per share. Each shareholder is eligible for one vote per share held and dividend as and when declared by the Company. The dividend proposed by the Board of Directors is subject to the approval of the shareholders in the ensuing Annual General Meeting, except in case of interim dividend which is paid as and when declared by the Board of Directors. In the event of liquidation of the Company, the holders of equity shares will be entitled to receive
any of the remaining assets of the Company, after distribution of all preferential amounts, in proportion to their shareholding.
ii) ADS shareholders do not have right to attend General meetings in person and also do not have right to vote. They are represented by depository, CITI Bank N.A. New York. As at 31 March 2021 – 16,09,03,244 equity shares were held in the form of 4,02,25,811 ADS (31 March 2020: 26,17,80,208 equity shares were held in the form of 6,54,45,052 ADS).
428
| < BACK TO CONTENTS | Integrated Report | Statutory reports | Financial statements |
Notes
forming part of the consolidated financial statements as at and for the year ended 31 March 2021
| iii) | In terms of Scheme of Arrangement as approved by the Hon’ble High Court of Judicature at Mumbai, vide its order dated 19 April 2002, the erstwhile Sterlite Industries (India) Limited (merged with the Company during 2013-14) during 2002-2003 reduced its paid up share capital by ₹10 crores. There are 2,01,296 equity shares (31 March 2020: 2,01,711 equity shares) of ₹1 each pending clearance from NSDL. The Company has filed an application in Hon’ble High Court of Mumbai to cancel these shares, the final decision on which is pending. Hon’ble High Court of Judicature at Mumbai, vide its interim order dated 06 September 2002 restrained any transaction with respect to subject shares. |
| 16 | OTHER EQUITY (REFER CONSOLIDATED STATEMENT OF CHANGES IN EQUITY) |
| a) | General reserve: Under the erstwhile Companies Act, 1956, a general reserve was created through an annual transfer of net income at a specified percentage in accordance with applicable regulations. The purpose of these transfers was to ensure that if a dividend distribution in a given year is more than 10.0% of the paid-up capital of the Company for that year, then the total dividend distribution is less than the total distributable reserves for that year. Consequent to introduction of Companies Act, 2013, the requirement to mandatory transfer a specified percentage of the net profit to general reserve has been withdrawn. |
| b) | Debenture redemption reserve: As per the earlier provision under the Indian Companies Act, companies that issue debentures were required to create debenture redemption reserve from annual profits until such debentures are redeemed. Companies are required to maintain 25% as a reserve of outstanding redeemable debentures. The amounts credited to the debenture redemption reserve may not be utilised except to redeem debentures. The MCA vide its Notification dated 16 August 2019, had amended the Companies (Share Capital and Debenture) Rules, 2014, wherein the requirement of creation of Debenture Redemption Reserve has been exempted for certain class of companies, hence, in view of the same, Vedanta Limited is not required to create Debenture Redemption Reserve. |
| c) | Preference share redemption reserve: The Companies Act, 2013 provides that companies that issue preference shares may redeem those shares from profits of the Company which otherwise would be available for dividends, or from proceeds of a new issue of shares made for the purpose of redemption of the preference shares. If there is a premium payable on redemption, the premium must be provided for, either by reducing the additional paid in capital (securities premium account) or net income, before the shares are redeemed. If profits are used to redeem preference shares, the value of the nominal amount of shares redeemed should be transferred from profits (retained earnings) to the preference share redemption reserve. This amount should then be utilised for the purpose of redemption of redeemable preference shares. This reserve can be used to issue fully paid-up bonus shares to the shareholders of the Company. |
| d) | Capital reserve: The balance in capital reserve has mainly arisen pursuant to extinguishment of non-controlling interests of erstwhile Cairn India Limited and acquisition of ASI. Further, changes in capital reserve are due to recognition/derecognition of put option liability and non-controlling interests pertaining to ASI. Furthemore, acquisition of FACOR Group during the year has also resulted in capital reserves of ₹123 crores. |
| e) | Legal reserve is created at Fujairah Gold FZC in accordance with free zone regulations. |
| f) | Treasury share represents 1,21,93,159 (31 March 2020: 1,43,78,261) equity shares (face value of ₹1 each) of the Company purchased by Vedanta Limited ESOP Trust pursuant to the Company’s stock option scheme as detailed in note 30. |
| 17 | NON-CONTROLLING INTERESTS (NCI) |
The Non-controlling interests that are material to the Group relate to Hindustan Zinc Limited (HZL) and Bharat Aluminium Company Limited (“BALCO”).
As at 31 March 2021, NCIs hold an economic interest by virtue of their shareholding of 35.08%, 49.00%, 26.00%, 48.37%, 4.51% and 10% in Hindustan Zinc Limited (HZL), Bharat Aluminium Company Limited (BALCO), Black Mountain Mining (BMM), Avanstrate Inc. (ASI), Electrosteel Steels Limited (ESL) and Facor Power Limited (FPL) respectively (Refer Note 4(a)). As at 31 March 2020, NCIs hold an economic interest by virtue of their shareholding of 35.08%, 49.00%, 26.00% ,48.37% and 4.51% in HZL, BALCO, BMM, ASI and Electrosteel Steels Limited (ESL) respectively.
The principal place of business of HZL, BALCO, ESL and FPL is in India, that of BMM is in South Africa, that of Avanstrate Inc. is in Japan, South Korea and Taiwan.
VEDANTA LIMITED | INTEGRATED REPORT AND ANNUAL ACCOUNTS 2020-21 | 429
CONSOLIDATED CONTINUED...
Notes
forming part of the financial statements as at and for the year ended March 31, 2021
The table below shows summarised financial information of subsidiaries of the Group that have non-controlling interests. The amounts are presented before inter-company elimination.
| (₹ in Crore) | ||||||||||||||||
| As at 31 March 2021 | ||||||||||||||||
Particulars | HZL | BALCO | Others | Total | ||||||||||||
Non-current assets | 21,596 | 12,376 | 13,983 | 47,955 | ||||||||||||
Current assets | 24,570 | 2,875 | 4,160 | 31,605 | ||||||||||||
Non-current liabilities | 5,590 | 3,854 | 8,501 | 17,945 | ||||||||||||
Current liabilities | 7,873 | 5,425 | 3,757 | 17,055 | ||||||||||||
Equity attributable to owners of the Group | 21,231 | 3,046 | 5,679 | 29,956 | ||||||||||||
Non-controlling interests a | 11,472 | 2,926 | 740 | 15,138 | ||||||||||||
| a) | ₹534 crores loss attributable to NCI of ASI transferred to put option liability. Refer note 21. |
| (₹ in Crore) | ||||||||||||||||
| As at 31 March 2020 | ||||||||||||||||
Particulars | HZL | BALCO | Others | Total | ||||||||||||
Non-current assets | 22,665 | 12,617 | 9,963 | 45,245 | ||||||||||||
Current assets | 24,815 | 2,724 | 3,389 | 30,928 | ||||||||||||
Non-current liabilities | 1,306 | 4,201 | 7,380 | 12,887 | ||||||||||||
Current liabilities | 5,413 | 6,229 | 3,155 | 14,797 | ||||||||||||
Equity attributable to owners of the Group | 26,462 | 2,505 | 2,807 | 31,774 | ||||||||||||
Non-controlling interests a | 14,299 | 2,406 | 407 | 17,112 | ||||||||||||
| (₹ in Crore) | ||||||||||||||||
| For the year ended 31 March 2021 | ||||||||||||||||
Particulars | HZL | BALCO | Others | Total | ||||||||||||
Total Income | 24,452 | 9,868 | 8,287 | 42,607 | ||||||||||||
Profit/(loss) after tax for the year | 7,918 | 1,108 | 3,378 | 12,404 | ||||||||||||
Profit/(loss) attributable to the equity shareholders of the Company | 5,140 | 565 | 3,269 | 8,974 | ||||||||||||
Profit/(loss) attributable to the non-controlling interests | 2,778 | 543 | 109 | 3,430 | ||||||||||||
Other comprehensive income during the year | (4 | ) | (46 | ) | 402 | 352 | ||||||||||
Other comprehensive income attributable to the equity shareholders of the Company | (2 | ) | (23 | ) | 284 | 259 | ||||||||||
Other comprehensive income attributable to non- controlling interests | (2 | ) | (23 | ) | 118 | 93 | ||||||||||
Total comprehensive income during the year | 7,914 | 1,062 | 3,781 | 12,757 | ||||||||||||
Total comprehensive income attributable to the equity shareholders of the Company | 5,138 | 542 | 3,553 | 9,233 | ||||||||||||
Total comprehensive income attributable to non- controlling interests | 2,776 | 520 | 227 | 3,523 | ||||||||||||
Dividends paid/payable to non-controlling interests, including dividend tax | 5,603 | — | — | 5,603 | ||||||||||||
Net cash inflow/(outflow) from operating activities | 10,579 | 2,621 | 766 | 13,966 | ||||||||||||
Net cash (outflow)/inflow from investing activities | (2,446 | ) | (1,030 | ) | 225 | (3,251 | ) | |||||||||
Net cash (outflow)/inflow from financing activities | (9,699 | ) | (1,646 | ) | (930 | ) | (12,275 | ) | ||||||||
Net cash (outflow)/inflow | (1,566 | ) | (55 | ) | 61 | (1,560 | ) | |||||||||
430
| < BACK TO CONTENTS | Integrated Report | Statutory reports | Financial statements |
Notes
forming part of the financial statements as at and for the year ended March 31, 2021
| (₹ in Crore) | ||||||||||||||||
| For the year ended 31 March 2020 | ||||||||||||||||
Particulars | HZL | BALCO | Others | Total | ||||||||||||
Total Income | 20,499 | 8,926 | 7,170 | 36,595 | ||||||||||||
Profit after tax for the year | 6,771 | (171 | ) | (846 | ) | 5,754 | ||||||||||
Profit attributable to the equity shareholders of the Company | 4,396 | (87 | ) | (475 | ) | 3,834 | ||||||||||
Profit attributable to the non-controlling interests | 2,375 | (84 | ) | (371 | ) | 1,920 | ||||||||||
Other comprehensive income during the year | (100 | ) | 4 | (299 | ) | (395 | ) | |||||||||
Other comprehensive income attributable to the equity shareholders of the Company | (65 | ) | 2 | (209 | ) | (272 | ) | |||||||||
Other comprehensive income attributable to non-controlling interests | (35 | ) | 2 | (90 | ) | (123 | ) | |||||||||
Total comprehensive income during the year | 6,671 | (167 | ) | (1,145 | ) | 5,359 | ||||||||||
Total comprehensive income attributable to the equity shareholders of the Company | 4,331 | (85 | ) | (684 | ) | 3,562 | ||||||||||
Total comprehensive income attributable to non-controlling interests | 2,340 | (82 | ) | (461 | ) | 1,797 | ||||||||||
Dividends paid/payable to non-controlling interests, including dividend tax | — | — | — | — | ||||||||||||
Net cash inflow from operating activities | 6,957 | 155 | 2,568 | 9,680 | ||||||||||||
Net cash outflow from investing activities | (3,154 | ) | (339 | ) | (3,000 | ) | (6,493 | ) | ||||||||
Net cash inflow/(outflow) from financing activities | (1,928 | ) | 13 | 3 | (1,912 | ) | ||||||||||
Net cash (outflow)/inflow | 1,875 | (171 | ) | (429 | ) | 1,275 | ||||||||||
The effect of changes in ownership interests in subsidiaries that did not result in a loss of control is as follows:
| (₹ in Crore) | ||||||||||||||||
| For the year ended 31 March 2021 | ||||||||||||||||
Particulars | HZL | BALCO | Others | Total | ||||||||||||
Changes in NCI | — | — | — | — | ||||||||||||
| (₹ in Crore) | ||||||||||||||||
| For the year ended 31 March 2020 | ||||||||||||||||
Particulars | HZL | BALCO | Others | Total | ||||||||||||
Changes in NCI | — | — | (234 | ) | (234 | ) | ||||||||||
| 18 | CAPITAL MANAGEMENT |
The Group’s objectives when managing capital is to safeguard continuity, maintain a strong credit rating and healthy capital ratios in order to support its business and provide adequate return to shareholders through continuing growth. The Group’s overall strategy remains unchanged from previous year.
The Group sets the amount of capital required on the basis of annual business and long-term operating plans which include capital and other strategic investments.
The funding requirements are met through a mixture of equity, internal fund generation and borrowings. The Group’s policy is to use current and non-current borrowings to meet anticipated funding requirements.
The Group monitors capital on the basis of the net gearing ratio which is Net debt/Total Capital (equity + net debt). The Group is not subject to any externally imposed capital requirements.
Net debt are non-current and current debt as reduced by cash and cash equivalents, other bank balances and current investments. Equity comprises all components including other comprehensive income.
VEDANTA LIMITED | INTEGRATED REPORT AND ANNUAL ACCOUNTS 2020-21 | 431
CONSOLIDATED CONTINUED...
Notes
forming part of the financial statements as at and for the year ended March 31, 2021
The following table summarises the capital of the Group:
| (₹ in crores except otherwise stated) | ||||||||
Particulars | As at 31 March 2021 | As at 31 March 2020 | ||||||
Cash and cash equivalents a (Refer note 13) | 4,854 | 5,060 | ||||||
|
|
|
| |||||
Other bank balances a (including interest accrued)(Refer note 14) | 11,146 | 7,289 | ||||||
|
|
|
| |||||
Non-current Bank deposits a (Refer note 10) | 110 | 754 | ||||||
|
|
|
| |||||
Current investments (Refer note 7B) | 16,504 | 24,658 | ||||||
Total cash (a) | 32,614 | 37,761 | ||||||
Non-current borrowings (Note 19) | 37,962 | 36,724 | ||||||
Current borrowings (Note 19) | 3,715 | 13,076 | ||||||
Current maturities of long-term debt (Note 21) | 15,351 | 9,387 | ||||||
|
|
|
| |||||
Total borrowings (b) | 57,028 | 59,187 | ||||||
|
|
|
| |||||
Net debt (c=(b-a)) | 24,414 | 21,426 | ||||||
|
|
|
| |||||
Total equity (d) | 77,416 | 71,747 | ||||||
|
|
|
| |||||
Total capital (e = equity + net debt) | 1,01,830 | 93,173 | ||||||
|
|
|
| |||||
Gearing ratio (times) (c/e) | 0.24 | 0.23 | ||||||
| a) | The constituents of ‘total cash’ for the purpose of capital management disclosure to include only those amounts of restricted funds that are corresponding to liabilities (e.g. margin money deposits). Consequently, restricted funds amounting to ₹153 crores (As at 31 March 2021:₹635 crores) have been excluded from ‘total cash’ in the capital management disclosures for the comparative year ended 31 March 2020. (Refer note 13(a), 14(b), 14(e) and 14(f)). |
| 19 | FINANCIAL LIABILITIES – BORROWINGS |
| A) | Non-current borrowings |
| (₹ in Crore) | ||||||||
Particulars | As at 31 March 2021 | As at 31 March 2020 | ||||||
At amortised cost | ||||||||
Secured | ||||||||
Non-convertible debentures | 13,076 | 16,387 | ||||||
Term loans from banks | ||||||||
- Rupee term loans | 29,393 | 20,918 | ||||||
- Foreign currency term loans | 4,563 | 7,824 | ||||||
- External commercial borrowings | 388 | 611 | ||||||
Others | 584 | 75 | ||||||
Unsecured | ||||||||
Non-convertible debentures | 3,516 | — | ||||||
Deferred sales tax liability | 62 | 77 | ||||||
Non-convertible bonds | 156 | 146 | ||||||
Term loans from banks | ||||||||
- Rupee term loans | 1,501 | — | ||||||
- Foreign currency term loans | 72 | 71 | ||||||
Redeemable preference shares | 2 | 2 | ||||||
Non-current Borrowings (A) | 53,313 | 46,111 | ||||||
Less: Current maturities of long-term debt (Refer note 21(b)) | (15,351 | ) | (9,387 | ) | ||||
|
|
|
| |||||
Total non-current Borrowings (Net) | 37,962 | 36,724 | ||||||
|
|
|
| |||||
Current Borrowings (Refer Note 19B) | 3,715 | 13,076 | ||||||
|
|
|
| |||||
Total Borrowings (A+B) | 57,028 | 59,187 | ||||||
|
|
|
| |||||
432
| < BACK TO CONTENTS | Integrated Report | Statutory reports | Financial statements |
Notes
forming part of the financial statements as at and for the year ended March 31, 2021
| B) | Current borrowings |
| (₹ in Crore) | ||||||||
Particulars | As at 31 March 2021 | As at 31 March 2020 | ||||||
At amortised cost | ||||||||
Secured | ||||||||
Working capital loan | 349 | 513 | ||||||
Packing credit in foreign currencies from banks | 350 | — | ||||||
Term loans from banks (Foreign currency) | — | 1,041 | ||||||
Amounts due on factoring of receivables | — | 14 | ||||||
Loans repayable on demand from banks | — | 1 | ||||||
Others | 106 | 1,884 | ||||||
Unsecured | ||||||||
Loans repayable on demand from banks | 298 | 1,077 | ||||||
Commercial paper | 2,162 | 7,524 | ||||||
Working capital loan | 318 | 918 | ||||||
Amounts due on factoring of receivables | 27 | 16 | ||||||
Others | 105 | 88 | ||||||
|
|
|
| |||||
Total | 3,715 | 13,076 | ||||||
|
|
|
| |||||
In the event Vedanta Resources Limited ceases to be the Company’s majority shareholder, the Group will be required to immediately repay some of its outstanding long-term debt.
| a) | Details of Non-convertible debentures issued by Group have been provided below (Carrying value) – |
| (₹ in Crore) | ||||||||
Particulars | As at 31 March 2021 | As at 31 March 2020 | ||||||
9.2% due February-2030 | 2,000 | 2,000 | ||||||
9.2% due December-2022 | 749 | 748 | ||||||
8.75% due June-2022 | 1,269 | 1,268 | ||||||
7.5% due March-2022 | 493 | — | ||||||
8.9% due December-2021 | 899 | 898 | ||||||
8.75% due September-2021 | 250 | 250 | ||||||
5.35% due September-2021 | 3,516 | — | ||||||
9.18% due July-2021 | 1,000 | 1,000 | ||||||
9.27% due July-2021 | 1,000 | 999 | ||||||
8.5% due June-2021 | 1,650 | 1,650 | ||||||
8.75% due April-2021 | 250 | 250 | ||||||
8.5% due April-2021 | 2,349 | 2,349 | ||||||
8.55% due April-2021 | 1,000 | 1,000 | ||||||
0% due March-2021 | 167 | — | ||||||
9% due November-2020 | — | 150 | ||||||
8.25% due september-2020 | — | 425 | ||||||
7.85% due August-2020 | — | 500 | ||||||
9.45% due August-2020 | — | 2,000 | ||||||
7.9% due July-2020 | — | 300 | ||||||
8.7% due April-2020 | — | 600 | ||||||
|
|
|
| |||||
Total | 16,592 | 16,387 | ||||||
|
|
|
| |||||
VEDANTA LIMITED | INTEGRATED REPORT AND ANNUAL ACCOUNTS 2020-21 | 433
CONSOLIDATED CONTINUED...
Notes
forming part of the financial statements as at and for the year ended March 31, 2021
| b) | The Group has taken borrowings in various countries towards funding of its acquisitions, capital expenditure and working capital requirements. The borrowings comprises funding arrangements from various banks and financial institutions taken by the parent and subsidiaries. The details of security provided by the Group in various countries, to various lenders on the asset of the parent and subsidiaries are as follows - |
| (₹ in Crore) | ||||||||
Particulars | As at 31 March 2021 | As at 31 March 2020 | ||||||
Secured long-term borrowings | 48,004 | 45,815 | ||||||
Secured short-term borrowings | 805 | 3,453 | ||||||
|
|
|
| |||||
Total | 48,809 | 49,268 | ||||||
|
|
|
| |||||
| (₹ in Crore) | ||||||||||
Facility Category | Security details | As at 31 March 2021 | As at 31 March 2020 | |||||||
Working capital loans* | Secured by first pari passu charge on current assets of Vedanta Limited | 650 | 3 | |||||||
Secured by second pari passu charge on fixed assets of TSPL and first pari passu charge on current assets of the Company, both present and future# | 49 | 247 | ||||||||
Other secured working capital loans | — | 278 | ||||||||
External Commercial Borrowings | The facility is secured by first pari passu charge on all movable property, plant and equipments related to power plants and aluminium smelters of BALCO located at Korba both present and future along with secured lenders | 219 | 335 | |||||||
The facility is secured by first pari passu charge on all movable project assets related to 1200 MW power project and 3.25 LTPA smelter project both present and future along with secured lenders at BALCO | 169 | 276 | ||||||||
Non-convertible debentures | Secured by the whole of the movable fixed assets of (i) Alumina Refinery having output of 1 MTPA along with co- generation captive power plant with an aggregate capacity of 90 MW at Lanjigarh, Odisha and (ii) Aluminium Smelter having output of 1.6 MTPA along with a 1,215 (9*135) MW CPP at Jharsuguda, Odisha | 5,409 | 4,914 | |||||||
Secured by way of charge against all existing assets of FACOR | 167 | — | ||||||||
Secured by a first pari passu charge on the whole of the present and future of the movable fixed assets of 2400 MW (600 MW*4) Power Plant of Vedanta Limited at Jharsuguda location | 4,000 | 3,998 | ||||||||
Secured by way of first ranking pari passu charge on movable fixed assets in relation to the Lanjigarh Refinery Expansion Project (having capacity beyond 2 MTPA and up to 6 MTPA) situated at Lanjigarh, Orissa. The Lanjigarh Refinery Expansion Project shall specifically exclude the 1 MTPA alumina refinery of Vedanta Limited along with 90 MW power plant in Lanjigarh and all its related capacity expansions | 500 | 1,100 | ||||||||
Secured by way of first pari passu charge on all present and future of the movable fixed assets of 2400 MW (600 MW*4) Power Plant of Vedanta Limited at Jharsuguda location, as may be identified and notified by the Issuer to the Security Trustee from time to time, with minimum asset coverage of 1 time of the aggregate face value of debentures outstanding at any point of time | 1,000 | 1,000 | ||||||||
434
| < BACK TO CONTENTS | Integrated Report | Statutory reports | Financial statements |
Notes
forming part of the financial statements as at and for the year ended March 31, 2021
| (₹ in Crore) | ||||||||||
Facility Category | Security details | As at 31 March 2021 | As at 31 March 2020 | |||||||
Secured by first pari passu charge on movable and/or immovable fixed assets of TSPL with a minimum asset cover of 1 times during the tenure of NCD | 2,000 | 2,650 | ||||||||
Other secured non-convertible debuntures | — | 2,725 | ||||||||
Term loans from banks (Includes rupee term loans and foreign currency term loans) | Secured by first pari passu charge on fixed assets of TSPL and second pari passu charge on current assets of TSPL, both present and future# | 5,140 | 3,190 | |||||||
First pari passu charge by way of hypothecation/equitable mortgage on the movable/immovable assets of the Aluminium Division of Vedanta Limited comprising of alumina refinery having output of 1 MTPA along with co- generation captive power plant with an aggregate capacity of 90 MW at Lanjigarh, Orissa; aluminium smelter having output of 1.6 MTPA along with a 1215 (9x135) MW CPP at Jharsuguda, Orissa, both present and future | 1,883 | 3,384 | ||||||||
Secured by a pari passu charge by way of hypothecation of all the movable fixed assets of Vedanta Limited pertaining to its Aluminium Division project consisting of (i) alumina refinery having output of 1 MTPA (Refinery) along with co- generation captive power plant with an aggregate capacity of 90 MW at Lanjigarh, Orissa (Power Plant); and (ii) aluminium smelter having output of 1.6 MTPA along with a 1215 (9x135) MW CPP at Jharsuguda, Orissa (Smelter) (the Refinery, Power Plant and Smelter). Also, a first pari passu charge by way of equitable mortgage on the land pertaining to the mentioned project of aluminium division | 2,194 | 2,885 | ||||||||
Secured by a pari passu charge by way of hypothecation on the movable fixed assets of the Lanjigarh Refinery Expansion Project including 210 MW Power Project. Lanjigarh Refinery Expansion Project shall specifically exclude the 1 MTPA alumina refinery of Vedanta Limited along with 90 MW power plant in Lanjigarh and all its related expansions | 436 | 458 | ||||||||
Secured by a pari passu charge by way of hypothecation on the movable fixed assets of Vedanta Limited pertaining to its Aluminium Division comprising of 1 MTPA alumina refinery plant with 90 MW captive power plant at Lanjigarh, Odisha and 1.6 MTPA aluminium smelter plant with 1215 MW captive power plant at Jharsuguda, Odisha | 1,227 | 1,379 | ||||||||
First pari passu charge by way of hypothecation/equitable mortgage on the movable/immovable assets of the Aluminium Division of Vedanta Limited comprising of alumina refinery having output of 1 MTPA along with co- generation captive power plant with an aggregate capacity of 90 MW at Lanjigarh, Orissa; aluminium smelter having output of 1.6 MTPA along with a 1215 (9x135) MW CPP at Jharsuguda, Orissa and additional charge on Lanjigarh Expansion project, both present and future | 1,092 | 1,137 | ||||||||
Secured by a pari passu charge by way of hypothecation/ equitable mortgage of the movable/immovable fixed assets of Vedanta Limited pertaining to its Aluminium Division comprising of 1 MTPA alumina refinery plant with 90 MW captive power plant at Lanjigarh, Odisha and 1.6 MTPA aluminium smelter plant with 1215 MW captive power plant at Jharsuguda, Odisha | 2,801 | 2,985 | ||||||||
VEDANTA LIMITED | INTEGRATED REPORT AND ANNUAL ACCOUNTS 2020-21 | 435
CONSOLIDATED CONTINUED...
Notes
forming part of the financial statements as at and for the year ended March 31, 2021
| (₹ in Crore) | ||||||||||
Facility Category | Security details | As at 31 March 2021 | As at 31 March 2020 | |||||||
Secured by (i) floating charge on borrower collection account and associated permitted investments and (ii) corporate guarantee from CEHL and floating charge on collection account and current assets of CEHL | 2,810 | 3,692 | ||||||||
Pledge of 49% of shares & other securities and rights to any claims held by THL Zinc Limited in and against BMM | 220 | 404 | ||||||||
The facility is secured by first pari passu charge on all movable property, plant and equipments related to power plants and aluminium smelters of BALCO located at Korba both present and future along with secured lenders | 147 | 224 | ||||||||
Secured by first pari passu charge on all present and future moveable fixed assets including but not limited to plant & machinery ,spares, tools and accessories of BALCO by way of a deed of hypothecation | 1,053 | 1,293 | ||||||||
Secured by first pari passu charge on all present and future movable fixed assets including but not limited to plant & machinery ,spares, tools and accessories of BALCO (excluding of coal block assets) by way of a deed of hypothecation | 1,447 | 1,615 | ||||||||
First ranking pari passu charge by way of hypothecation/ mortgage on all fixed/immovable assets of ESL Steel Limited but excluding any current assets or pledge over any shares. | 3,134 | 3,373 | ||||||||
Secured by first pari passu charge by way of hypothecation over all the movable assets (save and except Current Assets) of Vedanta Limited, present or future, pertaining to Lanjigarh refinery expansion project beyond 1.7 MTPA to 6.0 MTPA located at Lanjigarh, Odisha including but not limited to plant and machinery, machinery spares, tools and accessories in relation to aforementioned expansion project. Among others, the Lanjigarh Refinery Expansion Project shall specifically exclude the alumina refinery up to 1.7 MTPA of the Company along with 90 MW power plant in Lanjigarh and all its related expansions | 686 | 736 | ||||||||
Secured by first pari passu charge by the way of whole of the movable fixed assets of (i) Alumina Refinery having output of 1 MTPA along with co-generation captive power plant with an aggregate capacity of 90MW at Lanjigarh, Odisha and (ii) Aluminium Smelter having output of 1.6 MTPA along with a 1,215 (9*135) MW CPP at Jharsuguda, Odisha | 1,148 | 1,487 | ||||||||
Secured by a first pari passu charge on the identified fixed assets of the Vedanta Limited both present and future, pertaining to its Aluminium business (Jharsuguda Plant, Lanjigarh Plant), 2400 MW power plant assets at Jharsuguda, Copper Plant assets at Silvasa, Iron ore business in the states of Karnataka and Goa, dividends receivable from Hindustan Zinc Limited (“HZL”) a subsidiary of Vedanta Limited, and the DSRA to be opened for the Facility along with the amount lying to the credit thereof. | 8,538 | — | ||||||||
Other secured term loans | — | 1,541 | ||||||||
436
| < BACK TO CONTENTS | Integrated Report | Statutory reports | Financial statements |
Notes
forming part of the financial statements as at and for the year ended March 31, 2021
| (₹ in Crore) | ||||||||||
Facility Category | Security details | As at 31 March 2021 | As at 31 March 2020 | |||||||
Others | First charge by way of hypothecation on the entire stocks of raw materials, semi-finished and finished goods, consumable stores and spares and such other movables including book-debts, bills whether documentary or clean, outstanding monies, receivables and all other current assets of Vedanta limited, both present and future, ranking pari passu with other participating banks | 48 | 1,146 | |||||||
Secured by hypothecation of stock of raw materials, work- in-progress, semi-finished, finished products, consumable stores and spares, bills receivables, book debts and all other movables, both present and future in BALCO. The charges rank pari passu among banks under the multiple banking arrangements, for fund based facilities | 106 | 179 | ||||||||
Secured by Fixed asset (platinum) of AvanStrate | 536 | 566 | ||||||||
Other secured borrowings | — | 68 | ||||||||
|
|
|
| |||||||
| 48,809 | 49,268 | |||||||||
|
|
|
| |||||||
| * | Includes loans repayable on demand from banks, export packing credit from banks and amounts due on factoring. |
| # | As compared to previous year, TSPL has given an additional charge i.e. second pari passu charge on its current assets on all the working capital loan and and second pari passu charge on its fixed assets on ruppee term loans outstanding as on 31 March 2021. |
| c) | The Company facilities are subject to certain financial and non- financial convenants. The primary convenants which must be complied with include interest service coverage ratio, current ratio, debt service coverage ratio, total outside liabilities to total net worth, fixed assets coverage ratio, ratio of total term liabilities to net worth, debt to EBITDA ratio and return on fixed assets. The Group has complied with the covenants as per the terms of the loan agreement. |
| d) | Term of repayment of total borrowings outstanding as at 31 March 2021 are provided below – |
| (₹ in Crore) | ||||||||||||||||||||||||||
Borrowings | Weighted average of interest as at 31 March 2021 | Total carrying value | <1 year | 1-3 years | 3-5 years | >5 years | Remarks | |||||||||||||||||||
Foreign Currency term Loan | 3.85 | % | 4,635 | 1,098 | 2,655 | 701 | 209 | Repayable in 69 quarterly installments and 12 annual installments | ||||||||||||||||||
Rupee Term Loan | 9.00 | % | 30,894 | 3,754 | 9,181 | 7,772 | 10,352 | Repayable in 177 monthly repayments, 663 quarterly installments, 1 half yearly installments and 1 bullet payments | ||||||||||||||||||
External Commercial Borrowings | 4.34 | % | 388 | 279 | 110 | — | — | Repayable in 2 annual installments | ||||||||||||||||||
Non-convertible debentures | 7.97 | % | 16,592 | 9,675 | 4,978 | — | 2,000 | Repayable in 12 bullet payments and 6 annual installments | ||||||||||||||||||
Commercial paper | 4.21 | % | 2,161 | 2,161 | — | — | — | Repayable in 1 bullet payments | ||||||||||||||||||
Working capital loan* | 6.06 | % | 1,315 | 1,315 | — | — | — | Export packing credit and working capital loan are repayable within one year from the date of drawal, cash credit can be repaid anytime as per the availability of business surplus during the validity of the facility | ||||||||||||||||||
Amounts due on factoring | 4.65 | % | 27 | 27 | — | — | — | Repayable within one month | ||||||||||||||||||
Deferred sales tax liability | NA | 62 | 13 | 46 | 12 | — | Repayable in 67 monthly installments | |||||||||||||||||||
VEDANTA LIMITED | INTEGRATED REPORT AND ANNUAL ACCOUNTS 2020-21 | 437
CONSOLIDATED CONTINUED...
Notes
forming part of the financial statements as at and for the year ended March 31, 2021
| (₹ in Crore) | ||||||||||||||||||||||||||
Borrowings | Weighted average of interest as at 31 March 2021 | Total carrying value | <1 year | 1-3 years | 3-5 years | >5 years | Remarks | |||||||||||||||||||
Redeemable Preference shares | NA | 2 | 2 | — | — | — | The redemption and dividend paid to the preference shares unclaimed if any, is payable on claim. | |||||||||||||||||||
Non-convertible bonds | 0.00 | %** | 156 | — | 17 | 20 | 119 | Repayable in 10 annual installment starting from FY2023-24 | ||||||||||||||||||
Others | 5.10 | % | 796 | 796 | — | — | — | Suppliers credit is repayable in seven bullet payments and one annual repayments; Loan repayable on demand and others payable in one annual payment | ||||||||||||||||||
|
|
|
|
|
|
|
|
|
| |||||||||||||||||
Total | 57,028 | 19,120 | 16,987 | 8,505 | 12,680 | |||||||||||||||||||||
|
|
|
|
|
|
|
|
|
| |||||||||||||||||
The above maturity is based on the total principal outstanding gross of issue expenses and discounting impact of deferred sales tax liability.
| * | Includes loans repayable on demand from banks of ₹298 crores and packing credit in foreign currency from banks of ₹350 crores. |
| ** | Increasing interest rate from 0.00% to 0.50% till maturity. |
| e) | Term of repayment of total borrowings outstanding as at 31 March 2020 are provided below - |
| (₹ in Crore) | ||||||||||||||||||||||||||
Borrowings | Weighted average of interest as at 31 March 2020 | Total carrying value | <1 year | 1-3 years | 3-5 years | >5 years | Remarks | |||||||||||||||||||
Foreign Currency term Loan | 4.49 | % | 8,936 | 2,169 | 3,135 | 2,903 | 779 | Repayable in 130 quarterly installments , 13 annual installments and one bullet payment | ||||||||||||||||||
Rupee Term Loan | 9.00 | % | 20,918 | 3,839 | 6,081 | 4,795 | 6,256 | Repayable in 724 quarterly installments, 3 half yearly installments and 2 bullet payments | ||||||||||||||||||
External Commercial Borrowings | 4.34 | % | 611 | 217 | 396 | — | — | Repayable in 8 annual installments for three external commercial borrowings | ||||||||||||||||||
Non-convertible debentures | 8.85 | % | 16,387 | 3,975 | 10,420 | — | 2,000 | Repayable in 17 bullet payments | ||||||||||||||||||
Commercial paper | 6.20 | % | 7,524 | 7,524 | Repayable in 29 bullet payments | |||||||||||||||||||||
Working capital loan* | 7.45 | % | 2,509 | 2,509 | — | — | — | Export packing credit and loan repayable on demand is repayable within 1-6 months from the date of drawal, overdraft can be paid anytime as per the availability of business surplus during the validity of the facility and working capital loan is repayable in 5 bullet payment. | ||||||||||||||||||
Amounts due on factoring | 4.50 | % | 30 | 30 | — | — | — | Repayable within one month | ||||||||||||||||||
Deferred sales tax liability | NA | 77 | 20 | 42 | 28 | 1 | Repayable in 78 monthly installments | |||||||||||||||||||
Redeemable Preference shares | NA | 2 | 2 | — | — | — | The redemption and dividend paid to the preference shares unclaimed if any, is payable on claim. | |||||||||||||||||||
Non-convertible bonds | 0.00 | %** | 146 | — | 7 | 28 | 111 | Repayable in 10 annual installment starting from FY2023-24 | ||||||||||||||||||
Others | 7.09 | % | 2,047 | 2,013 | 34 | — | — | Suppliers credit is repayable within 6-12 months ,6 suppliers credit LC repayable in more than 12 months up to 36 months; Loan repayable within one year on demand and others repayable within one month | ||||||||||||||||||
|
|
|
|
|
|
|
|
|
| |||||||||||||||||
Total | 59,187 | 22,299 | 20,115 | 7,754 | 9,147 | |||||||||||||||||||||
|
|
|
|
|
|
|
|
|
| |||||||||||||||||
The above maturity is based on the total principal outstanding gross of issue expenses and discounting impact of deferred sales tax liability.
| * | Includes loans repayable on demand from banks for ₹1,078 crores and packing credit in foreign currency from banks. |
| ** | Increasing interest rate from 0.00% to 0.50% till maturity. |
438
| < BACK TO CONTENTS | Integrated Report | Statutory reports | Financial statements |
Notes
forming part of the consolidated financial statements as at and for the year ended 31 March 2021
f) Movement in borrowings during the year is provided below –
Particulars | Short-term borrowing | Long-term borrowing* | (₹ in crores) Total | |||||||||
Opening balance at 01 April 2019 | 22,982 | 43,244 | 66,226 | |||||||||
Cash flow | (11,188 | ) | 2,830 | (8,358 | ) | |||||||
Other non-cash changes | 1,211 | (206 | ) | 1,005 | ||||||||
Foreign exchange Currency Translation differences | 71 | 243 | 314 | |||||||||
|
|
|
|
|
| |||||||
As at 01 April 2020 | 13,076 | 46,111 | 59,187 | |||||||||
|
|
|
|
|
| |||||||
Cash flow | (9,351 | ) | 7,130 | (2,221 | ) | |||||||
Debt on acquisition through business combination | 8 | — | 8 | |||||||||
Other non-cash Changes | (7 | ) | 126 | 119 | ||||||||
Foreign exchange Currency Translation differences | (11 | ) | (54 | ) | (65 | ) | ||||||
|
|
|
|
|
| |||||||
As at 31 March 2021 | 3,715 | 53,313 | 57,028 | |||||||||
|
|
|
|
|
| |||||||
| * | including Current maturities of Long-term borrowing. |
Other non-cash changes comprises amortisation of borrowing costs, foreign exchange difference on borrowings.
20 A) FINANCIAL LIABILITIES – TRADE PAYABLES ª
Particulars | As at 31 March 2021 | (₹ in crores) As at 31 March 2020 | ||||||
Trade Payables | 7,773 | 7,906 | ||||||
Trade Payables to related party | 119 | 121 | ||||||
|
|
|
| |||||
Total | 7,892 | 8,027 | ||||||
|
|
|
| |||||
| a) | Trade Payables are majorly non-interest bearing and are normally settled up to 180 days terms. b) For amount due and terms and conditions of related party payables refer note 40. |
20 B) Operational Buyers’/Suppliers’ Credit is availed in foreign currency from offshore branches of Indian banks or foreign banks at an interest rate ranging from 0.4% to 3.5% per annum and in rupee from domestic banks at interest rate ranging from 4.25%—6.65% per annum. These trade credits are largely repayable within 180 days from the date of draw down. Operational Buyers’ credit availed in foreign currency is backed by Standby Letter of Credit issued under working capital facilities sanctioned by domestic banks. Part of these facilities are secured by first pari passu charge over the present and future current assets of the Group.
21 FINANCIAL LIABILITIES – OTHERS
Particulars | As at 31 March 2021 Non-current | Current | Total | As at 31 March 2020 Non-current | Current | (₹ in crores) Total | ||||||||||||||||||
Liabilities for capital expenditure | 936 | 7,009 | 7,945 | 811 | 5,910 | 6,721 | ||||||||||||||||||
Security deposits from vendors and others | — | 218 | 218 | — | 202 | 202 | ||||||||||||||||||
Interest Accrued but not due | — | 1,217 | 1,217 | 171 | 1,277 | 1,448 | ||||||||||||||||||
Put option liability with non-controlling interest a | 263 | — | 263 | 247 | — | 247 | ||||||||||||||||||
Current maturities of long-term debt b | — | 15,351 | 15,351 | — | 9,387 | 9,387 | ||||||||||||||||||
Unpaid/unclaimed dividend | — | 101 | 101 | — | 94 | 94 | ||||||||||||||||||
Profit petroleum payable | — | 1,468 | 1,468 | — | 689 | 689 | ||||||||||||||||||
Dues to related parties (Refer note 40) | — | 294 | 294 | — | 56 | 56 | ||||||||||||||||||
Lease liabilitiesd | 160 | 481 | 641 | 203 | 457 | 660 | ||||||||||||||||||
Other Liabilities c | 86 | 2,664 | 2,750 | 69 | 3,090 | 3,159 | ||||||||||||||||||
|
|
|
|
|
|
|
|
|
|
|
| |||||||||||||
Total | 1,445 | 28,803 | 30,248 | 1,501 | 21,162 | 22,663 | ||||||||||||||||||
|
|
|
|
|
|
|
|
|
|
|
| |||||||||||||
VEDANTA LIMITED | INTEGRATED REPORT AND ANNUAL ACCOUNTS 2020-21 | 439
CONSOLIDATED CONTINUED...
Notes
forming part of the consolidated financial statements as at and for the year ended 31 March 2021
| a) | The non-controlling shareholders of ASI have an option to offload their shareholding to the Group. The option is exercisable at any time within the period of three years following the fifth anniversary of the date of shareholders’ agreement (22 December 2017) at a price higher of ₹52 (US$0.757) per share and the fair market value of the share. Therefore, the liability is carried at higher of the two. Subsequent changes to the put option liability are treated as equity transaction and hence accounted for in equity. |
| b) | Current maturities of long-term debt consist of: |
Particulars | As at 31 March 2021 | (₹ in crores) As at 31 March 2020 | ||||||
Deferred sales tax liability | 12 | 20 | ||||||
Term loans from banks | ||||||||
- Rupee term loans | 3,724 | 3,829 | ||||||
- Foreign currency term loans | 1,097 | 1,307 | ||||||
External commercial borrowings | 279 | 217 | ||||||
Non-convertible debentures | 9,653 | 3,971 | ||||||
Others | 584 | 41 | ||||||
Redeemable preference shares | 2 | 2 | ||||||
|
|
|
| |||||
Total | 15,351 | 9,387 | ||||||
|
|
|
| |||||
| c) | Includes revenue received in excess of entitlement interest of ₹1,482 crores (31 March 2020: ₹1,594 crores) and reimbursement of expenses, interest accrued on other than borrowings, liabilities related to claim, liability for stock options etc. |
| d) | Movement in Lease liabilites is as follows: |
Particulars | (₹ in crores) Amount | |||
At 01 April 2019 | 139 | |||
|
| |||
Additions during the year | 1,021 | |||
Interest on Lease Liabilities | 25 | |||
Payments made | (316 | ) | ||
Deletions | (209 | ) | ||
|
| |||
As at 31 March 2020 | 660 | |||
|
| |||
Additions during the year | 360 | |||
Interest on Lease Liabilities | 28 | |||
Payments made | (338 | ) | ||
Deletions | (69 | ) | ||
|
| |||
As at 31 March 2021 | 641 | |||
|
| |||
| 22 | FINANCIAL INSTRUMENTS |
| A. | Financial assets and liabilities: |
The accounting classification of each category of financial instruments, their carrying amounts and their fair values are set out below:
As at 31 March 2021
Financial Assets | Fair value through profit or loss | Fair value through other comprehensive income | Derivatives designated as hedging instruments | Amortised cost | Total carrying value | (₹ in crores) Total fair value | ||||||||||||||||||
Investments* | 16,555 | 103 | — | — | 16,658 | 16,658 | ||||||||||||||||||
Trade receivables | 163 | — | — | 6,486 | 6,649 | 6,649 | ||||||||||||||||||
Loans | — | — | — | 7,088 | 7,088 | 7,609 | ||||||||||||||||||
Other financial assets | — | — | — | 6,765 | 6,765 | 6,765 | ||||||||||||||||||
Derivatives | 13 | — | 57 | — | 70 | 70 | ||||||||||||||||||
Cash and cash equivalents | — | — | — | 4,854 | 4,854 | 4,854 | ||||||||||||||||||
Other bank balances | — | — | — | 11,775 | 11,775 | 11,775 | ||||||||||||||||||
|
|
|
|
|
|
|
|
|
|
|
| |||||||||||||
Total | 16,731 | 103 | 57 | 36,968 | 53,859 | 54,380 | ||||||||||||||||||
|
|
|
|
|
|
|
|
|
|
|
| |||||||||||||
440
| < BACK TO CONTENTS | Integrated Report | Statutory reports | Financial statements |
Notes
forming part of the consolidated financial statements as at and for the year ended 31 March 2021
Financial Liabilities | Fair value through profit or loss | Fair value through other comprehensive income | Derivatives designated as hedging instruments | Amortised cost | Total carrying value | (₹ in crores) Total fair value | ||||||||||||||||||
Borrowings | — | — | 57,028 | — | 57,028 | 56,700 | ||||||||||||||||||
Trade payables | 707 | — | 7,185 | — | 7,892 | 7,892 | ||||||||||||||||||
Operational buyers’ credit/ suppliers’ credit | — | — | 7,983 | — | 7,983 | 7,983 | ||||||||||||||||||
Derivatives | 93 | 262 | — | — | 355 | 355 | ||||||||||||||||||
Other financial liabilities** | — | — | 14,634 | 263 | 14,897 | 14,897 | ||||||||||||||||||
|
|
|
|
|
|
|
|
|
|
|
| |||||||||||||
Total | 800 | 262 | 86,830 | 263 | 88,155 | 87,827 | ||||||||||||||||||
|
|
|
|
|
|
|
|
|
|
|
| |||||||||||||
As at 31 March 2020 | ||||||||||||||||||||||||
Financial Assets | Fair value through profit or loss | Fair value through other comprehensive income | Derivatives designated as hedging instruments | Amortised cost | Total carrying value | (₹ in crores) Total fair value | ||||||||||||||||||
Investments* | 24,709 | 41 | — | — | 24,750 | 24,750 | ||||||||||||||||||
Trade receivables | 51 | — | — | 5,757 | 5,808 | 5,808 | ||||||||||||||||||
Loans | — | — | — | 102 | 102 | 102 | ||||||||||||||||||
Other financial assets | — | — | — | 4,929 | 4,929 | 4,929 | ||||||||||||||||||
Derivatives | 279 | — | 416 | — | 695 | 695 | ||||||||||||||||||
Cash and cash equivalents | — | — | — | 5,117 | 5,117 | 5,117 | ||||||||||||||||||
Other bank balances | — | — | — | 7,385 | 7,385 | 7,385 | ||||||||||||||||||
|
|
|
|
|
|
|
|
|
|
|
| |||||||||||||
Total | 25,039 | 41 | 416 | 23,290 | 48,786 | 48,786 | ||||||||||||||||||
|
|
|
|
|
|
|
|
|
|
|
| |||||||||||||
Financial Liabilities | Fair value through profit or loss | Fair value through other comprehensive income | Derivatives designated as hedging instruments | Amortised cost | Total carrying value | (₹ in crores) Total fair value | ||||||||||||||||||
Borrowings | — | — | 59,187 | — | 59,187 | 59,292 | ||||||||||||||||||
Trade payables | 517 | — | 7,510 | — | 8,027 | 8,027 | ||||||||||||||||||
Operational buyers’ credit/ suppliers’ credit | — | — | 8,945 | — | 8,945 | 8,945 | ||||||||||||||||||
Derivatives | 83 | 58 | — | — | 141 | 141 | ||||||||||||||||||
Other financial liabilities** | — | — | 13,029 | 247 | 13,276 | 13,276 | ||||||||||||||||||
|
|
|
|
|
|
|
|
|
|
|
| |||||||||||||
Total | 600 | 58 | 88,671 | 247 | 89,576 | 89,681 | ||||||||||||||||||
|
|
|
|
|
|
|
|
|
|
|
| |||||||||||||
| * | Investments exclude equity investment in associates and joint ventures which are accounted as per the equity method of accounting and hence not considered. |
| ** | includes lease liability of ₹641 crores (31 March 2020: ₹660 crores). |
| *** | Represents net put option liability with non-controlling interests accounted for at fair value. (Refer note 21). |
B. Fair value hierarchy
The Group uses the following hierarchy for determining and disclosing the fair value of financial instruments by valuation technique:
| (i) | Level 1: quoted prices (unadjusted) in active markets for identical assets or liabilities. |
| (ii) | Level 2: inputs other than quoted prices included within Level 1 that are observable for the asset or liability, either directly (i.e. as prices) or indirectly (i.e. derived from prices). |
| (iii) | Level 3: inputs for the asset or liability that are not based on observable market data (unobservable inputs) The below table summarises the categories of financial assets and liabilities as at 31 March 2021 and 31 March 2020 measured at fair value: |
VEDANTA LIMITED | INTEGRATED REPORT AND ANNUAL ACCOUNTS 2020-21 | 441
CONSOLIDATED CONTINUED...
Notes
forming part of the consolidated financial statements as at and for the year ended 31 March 2021
As at 31 March 2021 | ||||||||||||
| (₹ in crores) | ||||||||||||
Financial Assets | Level 1 | Level 2 | Level 3 | |||||||||
At fair value through profit or loss | ||||||||||||
Investments | 6,318 | 10,186 | 51 | |||||||||
Derivative financial assets** | — | 13 | — | |||||||||
Trade receivables | — | 163 | — | |||||||||
At fair value through other comprehensive income | ||||||||||||
Investments | 92 | — | 11 | |||||||||
Derivatives designated as hedging instruments | ||||||||||||
Derivative financial assets** | — | 57 | — | |||||||||
|
|
|
|
|
| |||||||
Total | 6,410 | 10,419 | 62 | |||||||||
|
|
|
|
|
| |||||||
| (₹ in crores) | ||||||||||||
Financial Liabilities | Level 1 | Level 2 | Level 3 | |||||||||
At fair value through profit or loss | ||||||||||||
Derivative financial liabilities** | — | 93 | — | |||||||||
Trade payables | — | 707 | — | |||||||||
Derivatives designated as hedging instruments | ||||||||||||
Derivative financial liabilities** | — | 262 | — | |||||||||
Other financial liabilities - Net put option liability with non-controlling interests accounted for at fair value. (Refer note 21). | — | — | 263 | |||||||||
|
|
|
|
|
| |||||||
Total | — | 1,062 | 263 | |||||||||
|
|
|
|
|
| |||||||
As at 31 March 2020 | ||||||||||||
| (₹ in crores) | ||||||||||||
Financial Assets | Level 1 | Level 2 | Level 3 | |||||||||
At fair value through profit or loss | ||||||||||||
Investments | 7,598 | 17,060 | 51 | |||||||||
Derivative financial assets** | — | 279 | — | |||||||||
Trade receivables | — | 51 | — | |||||||||
At fair value through other comprehensive income | ||||||||||||
Investments | 30 | — | 11 | |||||||||
Derivatives designated as hedging instruments | ||||||||||||
Derivative financial assets** | — | 416 | — | |||||||||
|
|
|
|
|
| |||||||
Total | 7,628 | 17,806 | 62 | |||||||||
|
|
|
|
|
| |||||||
| (₹ in crores) | ||||||||||||
Financial Liabilities | Level 1 | Level 2 | Level 3 | |||||||||
At fair value through profit or loss | ||||||||||||
Derivative financial liabilities** | — | 83 | — | |||||||||
Trade payable | — | 517 | — | |||||||||
Derivatives designated as hedging instruments | ||||||||||||
Derivative financial liabilities** | — | 58 | — | |||||||||
Other financial liabilities – Net put option liability with non-controlling interests accounted for at fair value. (Refer note 21). | — | — | 247 | |||||||||
|
|
|
|
|
| |||||||
Total | — | 658 | 247 | |||||||||
|
|
|
|
|
| |||||||
| ** | Refer D below. |
442
| < BACK TO CONTENTS | Integrated Report | Statutory reports | Financial statements |
Notes
forming part of the consolidated financial statements as at and for the year ended 31 March 2021
The below table summarises the fair value of loans and borrowings which are carried at amortised cost as at 31 March 2021 and 31 March 2020
As at 31 March 2021
| (₹ in crores) | ||||||||||||
Financial Assets | Level 1 | Level 2 | Level 3 | |||||||||
Loans* | — | 7,609 | — | |||||||||
|
|
|
|
|
| |||||||
Total | — | 7,609 | — | |||||||||
|
|
|
|
|
| |||||||
| (₹ in crores) | ||||||||||||
Financial Liabilities | Level 1 | Level 2 | Level 3 | |||||||||
Borrowings | — | 56,700 | — | |||||||||
|
|
|
|
|
| |||||||
Total | — | 56,700 | — | |||||||||
|
|
|
|
|
| |||||||
As at 31 March 2020 | ||||||||||||
| (₹ in crores) | ||||||||||||
Financial Liabilities | Level 1 | Level 2 | Level 3 | |||||||||
Borrowings | — | 59,292 | — | |||||||||
|
|
|
|
|
| |||||||
Total | — | 59,292 | — | |||||||||
|
|
|
|
|
| |||||||
| * | Refer Note 40(I). |
The fair value of the financial assets and liabilities are at the amount that would be received to sell an asset and paid to transfer a liability in an orderly transaction between market participants at the measurement date. The following methods and assumptions were used to estimate the fair values:
| • | Investments traded in active markets are determined by reference to quotes from the financial institutions; for example: Net asset value (NAV) for investments in mutual funds declared by mutual fund house. For other listed securities traded in markets which are not active, the quoted price is used wherever the pricing mechanism is same as for other marketable securities traded in active markets. Other current investments and structured investments are valued by referring to market inputs including quotes, trades, poll, primary issuances for securities and /or underlying securities issued by the same or similar issuer for similar maturities and movement in benchmark security etc. |
| • | Trade receivables, cash and cash equivalents, other bank balances, other financial assets, current borrowings, trade payables, operational buyers’ credit and other current financial liabilities: Fair values approximate their carrying amounts largely due to the short-term maturities of these instruments. |
| • | Non-current fixed-rate and variable-rate borrowings: Fair value has been determined by the Group based on parameters such as interest rates, specific country risk factors, and the risk characteristics of the financed project. |
| • | Derivative financial assets/liabilities: The Group enters into derivative financial instruments with various counterparties. Interest rate swaps, foreign exchange forward contracts and commodity forward contracts are valued using valuation techniques, which employs the use of market observable inputs. The most frequently applied valuation techniques include the forward pricing and swap models, using present value calculations. The models incorporate various inputs including foreign exchange spot and forward rates, yield curves of the respective currencies, currency basis spreads between the respective currencies, interest rate curves and forward rate curves of the underlying commodity. Commodity contracts are valued using the forward LME rates of commodities actively traded on the listed metal exchange i.e. London Metal Exchange, United Kingdom (U.K.). |
| • | Other non-current financial assets and liabilities: Fair value is calculated using a discounted cash flow model with market assumptions, unless the carrying value is considered to approximate to fair value. |
For all other financial instruments, the carrying amount is either the fair value, or approximates the fair value.
The changes in counterparty credit risk had no material effect on the hedge effectiveness assessment for derivatives designated in hedge relationship and the value of other financial instruments recognised at fair value.
The estimated fair value amounts as at 31 March 2021 and 31 March 2020 have been measured as at respective date.
VEDANTA LIMITED | INTEGRATED REPORT AND ANNUAL ACCOUNTS 2020-21 | 443
CONSOLIDATED CONTINUED...
Notes
forming part of the consolidated financial statements as at and for the year ended 31 March 2021
As such, the fair values of these financial instruments subsequent to reporting date may be different than the amounts reported at each year-end.
There were no significant transfers between Level 1, Level 2 and Level 3 during the year.
C. Risk management framework
The Group’s businesses are subject to several risks and uncertainties including financial risks.
The Group’s documented risk management policies act as an effective tool in mitigating the various financial risks to which the businesses are exposed in the course of their daily operations. The risk management policies cover areas such as liquidity risk, commodity price risk, foreign exchange risk, interest rate risk, counterparty credit risk and capital management. Risks are identified at both the corporate and individual subsidiary level with active involvement of senior management. Each operating subsidiary in the Group has in place risk management processes which are in line with the Group’s policy. Each significant risk has a designated ‘owner’ within the Group at an appropriate senior level. The potential financial impact of the risk and its likelihood of a negative outcome are regularly updated.
The risk management process is coordinated by the Management Assurance function and is regularly reviewed by the Group’s Audit Committee. The Audit
Committee is aided by the other Committees of the Board including the Risk Management Committee, which meets regularly to review risks as well as the progress against the planned actions. Key business decisions are discussed at the periodic meetings of the Executive Committee. The overall internal control environment and risk management programme including financial risk management is reviewed by the Audit Committee on behalf of the Board.
The risk management framework aims to:
| - | improve financial risk awareness and risk transparency |
| - | identify, control and monitor key risks |
| - | identify risk accumulations |
| - | provide management with reliable information on the Group’s risk situation |
| - | improve financial returns |
Treasury management
Treasury management focuses on liability management, capital protection, liquidity maintenance and yield maximisation. The treasury policies are approved by the Committee of the Board. Daily treasury operations of the subsidiary companies are managed by their respective finance teams within the framework of the overall Group treasury policies. Long-term fund raising including strategic treasury initiatives are managed jointly by the business treasury team and the central team at
corporate treasury while short-term funding for routine working capital requirements is delegated to subsidiary companies. A monthly reporting system exists to inform senior management of the Group’s investments and debt position, exposure to currency, commodity and interest rate risk and their mitigants including the derivative position. The Group has a strong system of internal control which enables effective monitoring of adherence to Group’s policies. The internal control measures are effectively supplemented by regular internal audits. The Group uses derivative instruments to manage the exposure in foreign currency exchange rates, interest rates and commodity prices. The Group does not acquire or issue derivative financial instruments for trading or speculative purposes. The Group does not enter into complex derivative transactions to manage the treasury and commodity risks. Both treasury and commodities derivative transactions are normally in the form of forward contracts, interest rate and currency swaps and these are in line with the Group’s policies.
Commodity price risk
The Group is exposed to the movement of base metal commodity prices on the London Metal Exchange. Any decline in the prices of the base metals that the Group produces and sells will have an immediate and direct impact on the profitability of the businesses. As a general policy, the Group aims to sell the products at prevailing market prices. The commodity price risk in imported input commodity such as Alumina, anodes, etc., for our aluminium and Copper business respectively, is hedged on back-to-back basis ensuring no price risk for the business. Hedging is used primarily as a risk management tool and, in some cases, to secure future cash flows in cases of high volatility by entering into forward contracts or similar instruments. The hedging activities are subject to strict limits set out by the Board and to a strictly defined internal control and monitoring mechanism. Decisions relating to hedging of commodities are taken at the Executive Committee level, basis clearly laid down guidelines.
Whilst the Group aims to achieve average LME prices for a month or a year, average realised prices may not necessarily reflect the LME price movements because of a variety of reasons such as uneven sales during the year and timing of shipments.
Group is also exposed to the movement of international crude oil price and the discount in the price of Rajasthan crude oil to Brent price.
Financial instruments with commodity price risk are entered into in relation to following activities:
| • | economic hedging of prices realised on commodity contracts |
444
| < BACK TO CONTENTS | Integrated Report | Statutory reports | Financial statements |
Notes
forming part of the consolidated financial statements as at and for the year ended 31 March 2021
| • | cash flow hedging of revenues, forecasted highly probable transactions. |
Aluminium
The requirement of the primary raw material, alumina, is partly met from own sources and the rest is purchased primarily on negotiated price terms. Sales prices are linked to the LME prices. At present the Group on selective basis hedges the aluminium content in outsourced alumina to protect its margins. The Group also enters into hedging arrangements for its aluminium sales to realise average month of sale LME prices.
Copper
The Group’s custom refining copper operations at
Silvassa is benefitted by a natural hedge except to the extent of a possible mismatch in quotational periods between the purchase of anodes/blisters and the sale of finished copper. The Group’s policy on custom smelting is to generate margins from Refining Charges or “ RC”, improving operational efficiencies, minimising conversion cost, generating a premium over LME on sale of finished copper, sale of by-products and from achieving import parity on domestic sales. Hence, mismatches in quotational periods are managed to ensure that the gains or losses are minimised. The Group hedges this variability of LME prices through forward contracts and tries to make the LME price a pass-through cost between purchases of anodes/blisters and sales of finished products, both of which are linked to the LME price. RCs are a major source of income for the Indian copper refining operations. Fluctuations in Rcs are influenced by factors including demand and supply conditions prevailing in the market for smelters output. The Group’s copper business has a strategy of securing a majority of its anodes/blisters feed requirement under long-term contracts with smelters/traders.
Zinc, lead and silver
The sales prices are linked to the LME prices. The Group also enters into hedging arrangements for its Zinc, Lead and Silver sales to realise average month of sale LME prices.
Zinc International
Raw material for zinc and lead is mined in Namibia and South Africa with sales prices linked to the LME prices.
Iron ore
The Group sells its Iron Ore production from Goa on the prevailing market prices and from Karnataka through e-auction route as mandated by State Government of Karnataka in India.
Oil and gas
The prices of various crude oils are based upon the price of the key physical benchmark crude oil such as Dated Brent, West Texas Intermediate, and Dubai/Oman etc. The crude oil prices move based upon market factors like supply and demand. The regional producers price their crude basis these benchmark crude with a premium or discount over the benchmark based upon quality differential and competitiveness of various grades. Natural gas markets are evolving differently in important geographical markets. There is no single global market for natural gas. This could be owing to difficulties in large- scale transportation over long distances as compared to crude oil. Globally, there are three main regional hubs for pricing of natural gas, which are USA (Henry Hub Prices), UK (NBP Price) and Japan (imported gas price, mostly linked to crude oil).
Provisionally priced financial instruments
On 31 March 2021, the value of net financial liabilities linked to commodities (excluding derivatives) accounted for on provisional prices was ₹544 crores (31 March 2020: ₹466 crores). These instruments are subject to price movements at the time of final settlement and the final price of these instruments will be determined in the financial year beginning 01 April 2021.
Set out below is the impact of 10% increase in LME prices on pre-tax profit/(loss) for the year and pre-tax equity as a result of changes in value of the Group’s commodity financial instruments:
| For the year ended 31 March 2021 | Total Exposure | Effect on pre-tax profit/(loss) of a 10% increase in the LME | (₹ in crores) Effect on equity of a 10% increase in the LME | |||||||||
Copper | (1,002 | ) | (100 | ) | — | |||||||
| For the year ended 31 March 2020 | Total Exposure | Effect on pre-tax profit/(loss) of a 10% increase in the LME | (₹ in crores) Effect on equity of a 10% increase in the LME | |||||||||
Copper | (1,028 | ) | (103 | ) | — | |||||||
VEDANTA LIMITED | INTEGRATED REPORT AND ANNUAL ACCOUNTS 2020-21 | 445
CONSOLIDATED CONTINUED...
Notes forming part of the consolidated financial statements as at and for the year ended March 31, 2021
The above sensitivities are based on volumes, costs, exchange rates and other variables and provide the estimated impact of a change in LME prices on profit and equity assuming that all other variables remain constant. A 10% decrease in LME prices would have an equal and opposite effect on the Group’s financial statements. The impact on pre-tax profit/(loss) mentioned above includes the impact of a 10% increase in closing copper LME for provisionally priced copper concentrate purchased at Copper division custom smelting operations in India of ‘87 crores loss (31 March 2020: ₹‘79 crores loss), which is pass through in nature and as such will not have any impact on the profitability.
| (a) | Financial risk |
The Group’s Board approved financial risk policies include monitoring, measuring and mitigating the liquidity, currency, interest rate and counterparty risk. The Group does not engage in speculative treasury activity but seeks to manage risk and optimise interest and commodity pricing through proven financial instruments.
Liquidity risk
The Group requires funds both for short-term operational needs as well as for long-term investment programmes mainly in growth projects. The Group generates sufficient cash flows from the current operations which together with the available cash and cash equivalents, short-term investments and structured investment net of deferred consideration payable for such investments provide liquidity both in the short-term as well as in the long-term. The Group has been rated by CRISIL Limited (CRISIL) and India Ratings and Research Private Limited (India Rating) for its capital market issuance in the form of CPs and NCDs and for its banking facilities in line with Basel II norms.
In May 2020, India Ratings downgraded its ratings on the Company’s long-term facilities to ‘IND AA-’ from ‘IND AA’ with a negative outlook on account of higher expected balance sheet leverage and elevated refinancing risk in risk averse debt markets in COVID environment. CRISIL also downgraded its rating on the Company’s long- term facilities and its Non-current Debentures (NCD) programme to ‘CRISIL AA-’ from ‘CRISIL AA’ in October 2020 while revising the outlook to ‘Stable’ from ‘Negative’ on expectation of higher financial leverage and cash outflow from VEDL towards debt maturities at VRL post failure of take private transaction.
In February 2021, India Ratings revised its outlook to ‘Stable’ from ‘Negative’ while affirming the long-term issuer ratings at ‘IND AA-’. The Outlook revision reflects the VDL group’s improved liquidity position, supported by the moderated refinancing risks at VRL.
Vedanta Limited has the highest short-term rating on its working capital and Commercial Paper Programme at A1+ from CRISIL and India Ratings.
Anticipated future cash flows, together with undrawn fund based committed facilities of ‘11,412 crores, and cash, bank and current investments of ‘32,614 crores as at 31 March 2021, are expected to be sufficient to meet the liquidity requirement of the Group in the near future.
The Group remains committed to maintaining a healthy liquidity, a low gearing ratio, deleveraging and strengthening its balance sheet. The maturity profile of the Group’s financial liabilities based on the remaining period from the date of balance sheet to the contractual maturity date is given in the table below. The figures reflect the contractual undiscounted cash obligation of the Group.
As at 31 March 2021
| (₹ in crores) | ||||||||||||||||||||
Payments due by year | <1 year | 1-3 years | 3-5 years | >5 years | Total | |||||||||||||||
Borrowings* | 23,571 | 22,088 | 11,673 | 15,503 | 72,835 | |||||||||||||||
Derivative financial liabilities | 279 | 76 | — | — | 355 | |||||||||||||||
Lease liability | 481 | 60 | 22 | 78 | 641 | |||||||||||||||
Trade Payables, Operational Buyers’ Credit and Other financial liabilities** | 27,848 | 1,114 | 0 | — | 28,962 | |||||||||||||||
|
|
|
|
|
|
|
|
|
| |||||||||||
| 52,179 | 23,338 | 11,695 | 15,581 | 1,02,793 | ||||||||||||||||
|
|
|
|
|
|
|
|
|
| |||||||||||
446
| < BACK TO CONTENTS | Integrated Report | Statutory reports | Financial statements |
Notes
forming part of the consolidated financial statements as at and for the year ended 31 March 2021
As at 31 March 2020
| (₹ in crores) | ||||||||||||||||||||
Payments due by year | <1 year | 1-3 years | 3-5 years | >5 years | Total | |||||||||||||||
Borrowings* | 27,156 | 24,482 | 9,547 | 11,536 | 72,721 | |||||||||||||||
Derivative financial liabilities | 96 | 45 | — | — | 141 | |||||||||||||||
Lease liability | 457 | 95 | 40 | 68 | 660 | |||||||||||||||
Trade Payables, Operational Buyers’ Credit and Other financial liabilities** | 27,100 | 1,132 | 0 | — | 28,232 | |||||||||||||||
|
|
|
|
|
|
|
|
|
| |||||||||||
| 54,809 | 25,754 | 9,587 | 11,604 | 1,01,754 | ||||||||||||||||
|
|
|
|
|
|
|
|
|
| |||||||||||
| * | Includes Non-current borrowings, current borrowings, current maturities of non-current borrowings, committed interest payments on borrowings and interest accrued on borrowings. |
| ** | Includes both Non-current and current financial liabilities and committed interest payment, as applicable. Excludes current maturities of non-current borrowings and interest accrued on borrowings. |
The Group had access to following funding facilities:
As at 31 March 2021
| (₹ in crores) | ||||||||||||
Funding facility | Total Facility | Drawn | Undrawn | |||||||||
Fund/non-fund based | 72,752 | 56,232 | 16,520 | |||||||||
As at 31 March 2020
| (₹ in crores) | ||||||||||||
Funding facility | Total Facility | Drawn | Undrawn | |||||||||
Fund/non-fund based | 63,726 | 52,611 | 11,115 | |||||||||
Collateral
The Group has pledged financial instruments with carrying amount of ₹21,990 crores (31 March 2020: ₹21,595 crores) and inventories with carrying amount of ₹7,654 crores (31 March 2020: ₹8,514 crores) as per the requirements specified in various financial facilities in place. The counterparties have an obligation to release the securities to the Group when financial facilities are surrendered.
| (b) | Foreign exchange risk |
Fluctuations in foreign currency exchange rates may have an impact on the consolidated statement of profit and loss, the consolidated statement of change in equity, where any transaction references more than one currency or where assets/liabilities are denominated in a currency other than the functional currency of the respective consolidated entities.
Considering the countries and economic environment in which the Group operates, its operations are subject to risks arising from the fluctuations primarily in the US dollar, Australian dollar, Namibian dollar, AED, ZAR, GBP, JPY, INR and Euro against the functional currencies of Vedanta Limited and its subsidiaries.
Exposures on foreign currency loans are managed through the Group wide hedging policy, which is reviewed periodically to ensure that the results from fluctuating currency exchange rates are appropriately managed. The Group strives to achieve asset liability offset of foreign currency exposures and only the net position is hedged.
The Group’s presentation currency is the Indian Rupee (INR). The majority of the assets are located in India and the Indian Rupee is the functional currency for the Indian operating subsidiaries except for Oil and Gas business operations which have a US dollar functional currency. Natural hedges available in the business are identified at each entity level and hedges are placed only for the net exposure. Short-term net exposures are hedged progressively based on their maturity. A more conservative approach has been adopted for project expenditures to avoid budget overruns, where cost of the project is calculated taking into account the hedge cost. The hedge mechanisms are reviewed periodically to ensure that the risk from fluctuating currency exchange rates is appropriately managed.
The following analysis is based on the gross exposure as at the reporting date which could affect the consolidated statement of profit and loss. The exposure is mitigated by some of the derivative contracts entered into by the Group as disclosed under the section on “Derivative financial instruments”.
VEDANTA LIMITED | INTEGRATED REPORT AND ANNUAL ACCOUNTS 2020-21 | 447
CONSOLIDATED CONTINUED...
Notes forming part of the consolidated financial statements as at and for the year ended 31 March 2021
The carrying amount of the Group’s financial assets and liabilities in different currencies are as follows:
| (₹ in crores) | ||||||||||||||||
| As at 31 March 2021 | As at 31 March 2020 | |||||||||||||||
Currency | Financial Asset | Financial liabilities | Financial Asset | Financial liabilities | ||||||||||||
INR | 40,236 | 63,657 | 35,298 | 60,539 | ||||||||||||
USD | 12,802 | 21,982 | 12,762 | 26,764 | ||||||||||||
Others | 821 | 2,516 | 726 | 2,273 | ||||||||||||
|
|
|
|
|
|
|
| |||||||||
Total | 53,859 | 88,155 | 48,786 | 89,576 | ||||||||||||
|
|
|
|
|
|
|
| |||||||||
The Group’s exposure to foreign currency arises where a Group entity holds monetary assets and liabilities denominated in a currency different to the functional currency of the respective business, with US dollar being the major non-functional currency.
The foreign exchange rate sensitivity is calculated by the aggregation of the net foreign exchange rate exposure with a simultaneous parallel foreign exchange rates shift in the foreign currencies by 10% against the functional currency of the respective entities.
Set out below is the impact of a 10% strengthening in the functional currencies of the respective businesses on pre-tax profit/(loss) and pre-tax equity arising as a result of the revaluation of the Group’s foreign currency monetary financial assets/liabilities:
For the year ended 31 March 2021
| (₹ in crores) | ||||||||
| Effect of 10% strengthening of functional currency on pre-tax profit/(loss) | Effect of 10% strengthening of functional currency on equity | |||||||
USD | 1,132 | — | ||||||
INR | (307 | ) | — | |||||
For the year ended 31 March 2020
| (₹ in crores) | ||||||||
| Effect of 10% strengthening of functional currency on pre-tax profit/(loss) | Effect of 10% strengthening of functional currency on equity | |||||||
USD | 1,321 | — | ||||||
INR | 28 | — | ||||||
A 10% weakening of functional currencies of the respective businesses would have an equal and opposite effect on the Group’s financial statements.
| (c) | Interest rate risk |
At 31 March 2021, the Group’s net debt of ₹24,414 crores (31 March 2020: ₹21,426 crores) comprises debt of ₹57,028 crores (31 March 2020: ₹59,187 crores) offset by cash, bank and current investments of ₹32,614 crores (31 March 2020: ₹37,761 crores).
The Group is exposed to interest rate risk on short-term and long-term floating rate instruments and on the refinancing of fixed rate debt. The Group’s policy is to maintain a balance of fixed and floating interest rate borrowings and the proportion of fixed and floating rate debt is determined by current market interest rates. The borrowings of the Group are principally denominated in Indian Rupees and US dollars with mix of fixed and floating rates of interest. The USD floating rate debt is linked to US dollar LIBOR and INR Floating rate debt to Bank’s base rate. The Group has a policy of selectively using interest rate swaps, option contracts and other derivative instruments to manage its exposure to interest rate movements. These exposures are reviewed by appropriate levels of management on a monthly basis. The
448
| < BACK TO CONTENTS | Integrated Report | Statutory reports | Financial statements |
Notes
forming part of the consolidated financial statements as at and for the year ended 31 March 2021
Group invests cash and liquid investments in short-term deposits and debt mutual funds, some of which generate a tax-free return, to achieve the Group’s goal of maintaining liquidity, carrying manageable risk and achieving satisfactory returns.
Floating rate financial assets are largely mutual fund investments which have debt securities as underlying assets. The returns from these financial assets are linked to market interest rate movements; however the counterparty invests in the agreed securities with known maturity tenure and return and hence has manageable risk.
The exposure of the Group’s financial assets as at 31 March 2021 to interest rate risk is as follows:
| (₹ in crores) | ||||||||||||||||
| Total | Floating rate financial assets | Fixed rate financial assets | Non-interest bearing financial assets | |||||||||||||
Financial Assets | 53,859 | 11,332 | 27,060 | 15,467 | ||||||||||||
The exposure of the Group’s financial liabilities as at 31 March 2021 to interest rate risk is as follows:
| (₹ in crores) | ||||||||||||||||
| Total | Floating rate financial liabilities | Fixed rate financial liabilities | Non-interest bearing financial liabilities | |||||||||||||
Financial Liabilities | 88,155 | 32,391 | 32,857 | 22,907 | ||||||||||||
The exposure of the Group’s financial assets as at 31 March 2020 to interest rate risk is as follows:
| (₹ in crores) | ||||||||||||||||
| Total | Floating rate financial assets | Fixed rate financial assets | Non-interest bearing financial assets | |||||||||||||
Financial Assets | 48,786 | 12,106 | 24,434 | 12,246 | ||||||||||||
The exposure of the Group’s financial liabilities as at 31 March 2020 to interest rate risk is as follows:
| (₹ in crores) | ||||||||||||||||
| Total | Floating rate financial liabilities | Fixed rate financial liabilities | Non-interest bearing financial liabilities | |||||||||||||
Financial Liabilities | 89,576 | 31,354 | 37,415 | 20,807 | ||||||||||||
Considering the net debt position as at 31 March 2021 and the investment in Bank deposits, corporate bonds and debt mutual funds, any increase in interest rates would result in a net loss and any decrease in interest rates would result in a net gain. The sensitivity analysis below has been determined based on the exposure to interest rates for financial instruments at the balance sheet date.
The table below illustrates the impact of a 0.5% to 2.0% movement in interest rates on floating rate financial assets/ liabilities (net) on profit/(loss) and equity assuming that the changes occur at the reporting date and has been calculated based on risk exposure outstanding as of that date. The year end balances are not necessarily representative of the average debt outstanding during the year. This analysis also assumes that all other variables, in particular foreign currency rates, remain constant.
Increase in interest rates | Effect on pre-tax profit/(loss) during the year ended 31 March 2021 | (₹ in crores) Effect on pre-tax profit/(loss) during the year ended 31 March 2020 | ||||||
0.50% | (105 | ) | (96 | ) | ||||
1.00% | (211 | ) | (192 | ) | ||||
2.00% | (421 | ) | (385 | ) | ||||
VEDANTA LIMITED | INTEGRATED REPORT AND ANNUAL ACCOUNTS 2020-21 | 449
CONSOLIDATED CONTINUED...
Notes
forming part of the consolidated financial statements as at and for the year ended 31 March 2021
An equivalent reduction in interest rates would have an equal and opposite effect on the Group’s financial statements.
(d) Counterparty and concentration of credit risk Credit risk refers to the risk that counterparty will default on its contractual obligations resulting in financial loss to the Group. The Group has adopted a policy of only dealing with creditworthy counterparties and obtaining sufficient collateral, where appropriate, as a means of mitigating the risk of financial loss from defaults.
The Group is exposed to credit risk from trade receivables, contract assets, investments, loans, other financial assets, and derivative financial instruments. Credit risk on receivables is limited as almost all credit sales are against letters of credit and guarantees of banks of national standing.
Moreover, given the diverse nature of the Group’s businesses, trade receivables are spread over a number of customers with no significant concentration of credit risk. The history of trade receivables shows a negligible provision for bad and doubtful debts. Therefore, the Group does not expect any material risk on account of non-performance by any of the Group’s counterparties.
The Group has clearly defined policies to mitigate counterparty risks. For short-term investments, counterparty limits are in place to limit the amount of credit exposure to any one counterparty. This, therefore, results in diversification of credit risk for our mutual fund and bond investments. For derivative and financial instruments, the Group attempts to limit the credit risk by only dealing with reputable banks and financial institutions.
The carrying value of the financial assets represents the maximum credit exposure. The Group’s maximum exposure to credit risk as at 31 March 2021 and 31 March 2020 is ₹ 53,859 crores and ₹ 48,786 crores respectively. The maximum credit exposure on financial guarantees given by the Group for various financial facilities is described in Note 37 on “Contingent liability and capital commitments”.
None of the Group’s cash equivalents, including time deposits with banks, are past due or impaired. Regarding trade receivables, loans and other financial assets (both current and non-current), there were no indications as at
31 March 2021, that defaults in payment obligations will occur except as described in Note 8 and 10 on allowance for impairment of trade receivables and other financial assets.
Of the year end trade receivables, loans and other financial assets (excluding Bank deposits, site restoration fund and derivatives) balance the following, though overdue, are expected to be realised in the normal course of business and hence, are not considered impaired as at 31 March 2021 and 31 March 2020:
| (₹ in crores) | ||||||||
Particulars | As at 31 March 2021 | As at 31 March 2020 | ||||||
Neither impaired nor past due | 13,433 | 2,964 | ||||||
Past due but not impaired | ||||||||
- Less than 1 month | 612 | 794 | ||||||
- Between 1–3 months | 276 | 1,427 | ||||||
- Between 3–12 months | 842 | 1,686 | ||||||
- Greater than 12 months | 4,402 | 2,597 | ||||||
Total | 19,565 | 9,468 | ||||||
Receivables are deemed to be past due or impaired with reference to the Group’s normal terms and conditions of business. These terms and conditions are determined on a case to case basis with reference to the customer’s credit quality and prevailing market conditions.
Receivables that are classified as ‘past due’ in the above tables are those that have not been settled within the terms and conditions that have been agreed with that
customer. The Group based on past experiences does not expect any material loss on its receivables.
The credit quality of the Group’s customers is monitored on an ongoing basis. Where receivables have been impaired, the Group actively seeks to recover the amounts in question and enforce compliance with credit terms.
450
| < BACK TO CONTENTS | Integrated Report | Statutory reports | Financial statements |
Notes
forming part of the consolidated financial statements as at and for the year ended 31 March 2021
Movement in allowances for Financial Assets (Trade receivables and Financial assets - others)
The change in the allowance for financial assets (current and non-current) is as follows:
| (₹ in crores) | ||||||||||||
Particulars | Trade receivables | Financial assets - Others | Financial assets - Loans | |||||||||
As at 01 April 2019 | 569 | 476 | — | |||||||||
Allowance made during the year | 18 | 470 | — | |||||||||
Reversals/write-off during the year | (17 | ) | (18 | ) | — | |||||||
Exchange differences | 0 | 38 | — | |||||||||
As at 31 March 2020 | 570 | 966 | 0 | |||||||||
Allowance made during the year | 95 | 122 | 78 | |||||||||
Reversals/write-off during the year | (0 | ) | (58 | ) | — | |||||||
Exploration cost written off | 0 | 2 | — | |||||||||
Exchange differences | (0 | ) | (12 | ) | — | |||||||
As at 31 March 2021 | 665 | 1,020 | 78 | |||||||||
| D. | Derivative financial instruments |
The Group uses derivative instruments as part of its management of exposure to fluctuations in foreign currency exchange rates, interest rates and commodity prices. The Group does not acquire or issue derivative financial instruments for trading or speculative purposes. The Group does not enter into complex derivative transactions to manage the treasury and commodity risks. Both treasury and commodities derivative transactions are normally in the form of forward contracts and these are subject to the Group guidelines and policies.
The fair values of all derivatives are separately recorded in the consolidated balance sheet within current and non-current assets and liabilities. Derivatives that are designated as hedges are classified as current or non- current depending on the maturity of the derivative.
The use of derivatives can give rise to credit and market risk. The Group tries to control credit risk as far as possible by only entering into contracts with reputable banks and financial institutions. The use of derivative instruments is subject to limits, authorities and regular monitoring by appropriate levels of management. The limits, authorities and monitoring systems are periodically reviewed by management and the Board. The market risk on derivatives is mitigated by changes in the valuation of the underlying assets, liabilities or transactions, as derivatives are used only for risk management purposes.
Cash flow hedges
The Group enters into forward exchange and commodity price contracts for hedging highly probable forecast transaction and account for them as cash flow hedges and states them at fair value. Subsequent changes in fair value are recognised in equity through OCI until the
hedged transaction occurs, at which time, the respective gain or losses are reclassified to profit or loss. These hedges have been effective for the year ended 31 March 2021 and 31 March 2020.
The Group uses foreign exchange contracts from time to time to optimise currency risk exposure on its foreign currency transactions. The Group hedged part of its foreign currency exposure on capital commitments during the year ended 2021. Fair value changes on such forward contracts are recognised in other comprehensive income.
The majority of cash flow hedges taken out by the Group during the year comprise non-derivative hedging instruments for hedging the foreign exchange rate of highly probable forecast transactions and commodity price contracts for hedging the commodity price risk of highly probable forecast transactions.
The cash flows related to above are expected to occur during the year ending 31 March 2022 and consequently may impact profit or loss for that year depending upon the change in the commodity prices and foreign exchange rates movements. For cash flow hedges regarded as basis adjustments to initial carrying value of the property, plant and equipment, the depreciation on the basis adjustments made is expected to affect profit or loss over the expected useful life of the property, plant and equipment.
Fair value hedges
The fair value hedges relate to forward covers taken to hedge currency exposure and commodity price risks.
VEDANTA LIMITED | INTEGRATED REPORT AND ANNUAL ACCOUNTS 2020-21 | 451
CONSOLIDATED CONTINUED...
Notes
forming part of the consolidated financial statements as at and for the year ended 31 March 2021
The Group’s sales are on a quotational period basis, generally one month to three months after the date of delivery at a customer’s facility. The Group enters into forward contracts for the respective quotational period to hedge its commodity price risk based on average LME prices. Gains and losses on these hedge transactions are substantially offset by the amount of gains or losses on the underlying sales. Net gains and losses are recognised in the consolidated statement of profit and loss.
The Group uses foreign exchange contracts from time to time to optimise currency risk exposure on its foreign currency transactions. Fair value changes on such forward contracts are recognised in the consolidated statement of profit and loss.
Non-designated economic hedges
The Group enters into derivative contracts which are not designated as hedges for accounting purposes, but provide an economic hedge of a particular transaction risk or a risk component of a transaction. Hedging instruments include copper, aluminium future contracts on the LME and certain other derivative instruments. Fair value changes on such derivative instruments are recognised in the consolidated statement of profit and loss.
The fair value of the Group’s derivative positions recorded under derivative financial assets and derivative financial liabilities are as follows:
| (₹ in crores) | ||||||||||||||||
| As at 31 March 2021 | As at 31 March 2020 | |||||||||||||||
Derivative Financial Instruments | Assets | Liabilities | Assets | Liabilities | ||||||||||||
Current | ||||||||||||||||
Cash flow hedge* | ||||||||||||||||
- Commodity contracts | 3 | 55 | 104 | — | ||||||||||||
- Forward foreign currency contracts | — | — | — | — | ||||||||||||
- Interest rate swap | — | 5 | — | 3 | ||||||||||||
Fair Value hedge | ||||||||||||||||
- Commodity contracts | 41 | 9 | 100 | 11 | ||||||||||||
- Forward foreign currency contracts | 14 | 116 | 212 | 36 | ||||||||||||
Non-qualifying hedges/economic hedge | ||||||||||||||||
- Commodity contracts | 1 | 3 | 6 | 20 | ||||||||||||
- Forward foreign currency contracts | 12 | 91 | 269 | 25 | ||||||||||||
- Cross currency swap | — | — | 1 | 1 | ||||||||||||
Total | 70 | 279 | 692 | 96 | ||||||||||||
Non-current | ||||||||||||||||
Cash flow hedge* | ||||||||||||||||
- Interest rate swap | — | 5 | — | 8 | ||||||||||||
Fair Value hedge | ||||||||||||||||
- Forward foreign currency contracts | — | 71 | — | — | ||||||||||||
Non-qualifying hedges | ||||||||||||||||
- Forward foreign currency contracts | — | — | 3 | 37 | ||||||||||||
Total | — | 76 | 3 | 45 | ||||||||||||
| * | Refer consolidated statements of profit and loss and consolidated statement of changes in equity for the change in the fair value of cash flow hedges. |
452
| < BACK TO CONTENTS | Integrated Report | Statutory reports | Financial statements |
Notes
forming part of the consolidated financial statements as at and for the year ended 31 March 2021
| 23 | PROVISIONS |
| (₹ in crores) | ||||||||||||||||||||||||
| As at 31 March 2021 | As at 31 March 2020 | |||||||||||||||||||||||
Particulars | Non-current | Current | Total | Non-current | Current | Total | ||||||||||||||||||
Provision for employee benefits a (Refer note 31) | ||||||||||||||||||||||||
- Retirement benefit | 146 | 115 | 261 | 156 | 112 | 268 | ||||||||||||||||||
- Others | 12 | 154 | 166 | 14 | 170 | 184 | ||||||||||||||||||
Provision for restoration, | 2,974 | 28 | 3,002 | 2,658 | 19 | 2,677 | ||||||||||||||||||
rehabilitation and environmental costs b | ||||||||||||||||||||||||
Other provisions b | — | 56 | 56 | — | 54 | 54 | ||||||||||||||||||
|
|
|
|
|
|
|
|
|
|
|
| |||||||||||||
Total | 3,132 | 353 | 3,485 | 2,828 | 355 | 3,183 | ||||||||||||||||||
|
|
|
|
|
|
|
|
|
|
|
| |||||||||||||
| a) | Provision for employee benefits includes gratuity, compensated absences, deferred cash bonus etc. |
| (₹ in crores) | ||||||||
b) Particulars | Restoration, rehabilitation and environmental costs (Refer c) | Others (Refer d) | ||||||
As at 01 April 2019 | 2,454 | 52 | ||||||
| Additions | 69 | 2 | ||||||
| Amounts Utilised | (14 | ) | — | |||||
| Unused amounts reversed | — | — | ||||||
| Unwinding of discount (Refer note 31) | 96 | — | ||||||
| Revision in estimates | (50 | ) | — | |||||
| Exchange differences | 122 | — | ||||||
As at 31 March 2020 | 2,677 | 54 | ||||||
| Additions | 270 | 2 | ||||||
| Amounts Utilised | (2 | ) | — | |||||
| Unused amounts reversed | (24 | ) | — | |||||
| Unwinding of discount (Refer note 31) | 72 | — | ||||||
| Revision in estimates | (12 | ) | — | |||||
| Exchange differences | 21 | — | ||||||
| As at 31 March 2021 | 3,002 | 56 | ||||||
| c) | Restoration, rehabilitation and environmental costs |
The provisions for restoration, rehabilitation and environmental liabilities represent the management’s best estimate of the costs which will be incurred in the future to meet the Group’s obligations under existing Indian, Australian, Namibian, South African and Irish law and the terms of the Group’s exploration and other licences and contractual arrangements.
Within India, the principal restoration and rehabilitation provisions are recorded within Oil & Gas business where a legal obligation exists relating to the oil and gas fields, where costs are expected to be incurred in restoring the site of production facilities at the end of the producing life of an oil field. The Group recognises the full cost of site restoration as a liability when the obligation to rectify environmental damage arises.
These amounts are calculated by considering discount rates within the range of 2% to 10%, and become payable on closure of mines and are expected to be incurred over a period of one to thirty years . The lower range of discount rate is at Cairn India & Zinc International operations in Ireland and higher range is at Zinc International operations in African Countries.
VEDANTA LIMITED | INTEGRATED REPORT AND ANNUAL ACCOUNTS 2020-21 | 453
CONSOLIDATED CONTINUED...
Notes
forming part of the consolidated financial statements as at and for the year ended 31 March 2021
An obligation to incur restoration, rehabilitation and environmental costs arises when environmental disturbance is caused by the development or ongoing production from a producing field.
| d) | Other provisions |
Other provisions include provision for disputed cases and claims.
| 24 | OTHER LIABILITIES |
| (₹ in crores) | ||||||||||||||||||||||||
| As at 31 March 2021 | As at 31 March 2020 | |||||||||||||||||||||||
Particulars | Non-current | Current | Total | Non-current | Current | Total | ||||||||||||||||||
Amount payable to owned post – employment benefit trust (Refer note 40) | — | 32 | 32 | — | 28 | 28 | ||||||||||||||||||
Other Statutory Liabilities a | — | 3,144 | 3,144 | — | 3,155 | 3,155 | ||||||||||||||||||
Deferred government grants b | 4,327 | 229 | 4,556 | 4,399 | 213 | 4,612 | ||||||||||||||||||
Advance from customer c | — | 6,233 | 6,233 | 168 | 7,887 | 8,055 | ||||||||||||||||||
Advance from related party | — | — | — | — | 21 | 21 | ||||||||||||||||||
Other liabilities | — | 184 | 184 | 3 | 169 | 172 | ||||||||||||||||||
|
|
|
|
|
|
|
|
|
|
|
| |||||||||||||
Total | 4,327 | 9,822 | 14,149 | 4,570 | 11,473 | 16,043 | ||||||||||||||||||
|
|
|
|
|
|
|
|
|
|
|
| |||||||||||||
| a) | Statutory liabilities mainly includes contribution to Provident fund, ESIC, withholding taxes, goods & services tax, VAT, service tax etc. |
| b) | Represents government assistance in the form of the duty benefit availed under Export Promotion Capital Goods (EPCG) Scheme and SEZ scheme on purchase of property, plant and equipment accounted for as government grant and being amortised over the useful life of such assets. |
| c) | Advance from customers are contract liabilities to be settled through delivery of goods. The amount of such balances as on 01 April 2019: ₹ 9,196 crores. During the current year, the Group has refunded ₹ 5 crores (FY2019-20 ₹ 650 crores) to the customers and recognised revenue of ₹ 7,878 crores (FY2019-20: ₹ 8,489 crores) out of such opening balances. All other changes are either due to receipt of fresh advances or exchange differences. |
| 25 | REVENUE FROM OPERATIONS |
| (₹ in crores) | ||||||||
Particulars | Year ended 31 March 2021 | Year ended 31 March 2020 | ||||||
Sale of products | 85,124 | 81,656 | ||||||
Sale of services | 224 | 216 | ||||||
Revenue from contingent rents | 1,515 | 1,673 | ||||||
|
|
|
| |||||
Total | 86,863 | 83,545 | ||||||
|
|
|
| |||||
| a) | Revenue from sale of products and from sale of services for the year ended 31 March 2021 includes revenue from contracts with customers of ₹ 85,544 crores (31 March 2020: ₹ 81,896 crores) and a net loss on mark-to-market of ₹ 196 crores (31 March 2020: ₹ 1,300 crores) on account of gains/losses relating to sales that were provisionally priced as at 31 March 2020 with the final price settled in the current year, gains/losses relating to sales fully priced during the year, and marked to market gains/losses relating to sales that were provisionally priced as at 31 March 2021. |
| b) | Government of India (GoI) vide Office Memorandum (“OM”) No. O-19025/10/2005-ONG-DV dated 01 February 2013 allowed for Exploration in the Mining Lease Area after expiry of Exploration period and prescribed the mechanism for recovery of such Exploration Cost incurred. Vide another Memorandum dated 24 October 2019, GoI clarified that all approved Exploration costs incurred on Exploration activities, both successful and unsuccessful, are recoverable in the manner as prescribed in the OM and as per the provisions of PSC. Accordingly, during the previous year, the Group had recognised revenue of ₹ 1,276 crores, for past exploration costs, through increased share in the joint operations revenue as the Group believes that cost recovery mechanism prescribed under OM for profit petroleum payable to GOI is not applicable to its Joint operation partner, view which is also supported by an independent legal opinion. However, the Joint operation partner carries a different understanding and the matter is pending resolution. |
454
| < BACK TO CONTENTS | Integrated Report | Statutory reports | Financial statements |
Notes
forming part of the consolidated financial statements as at and for the year ended 31 March 2021
| c) | Majority of the Group’s sales are against advance or are against letters of credit/cash against documents/guarantees of banks of national standing. Where sales are made on credit, the amount of consideration does not contain any significant financing component as payment terms are within three months. |
As per the terms of the contract with its customers, either all performance obligations are to be completed within one year from the date of such contracts or the Group has a right to receive consideration from its customers for all completed
performance obligations. Accordingly, the Group has availed the practical expedient available under paragraph 121 of Ind AS 115 and dispensed with the additional disclosures with respect to performance obligations that remained unsatisfied (or partially unsatisfied) at the balance sheet date. Further, since the terms of the contracts directly identify the transaction price for each of the completed performance obligations, in all material respects, there are no elements of transaction price which have not been included in the revenue recognised in the financial statements.
Further, there is no material difference between the contract price and the revenue from contract with customers.
| 26 | OTHER OPERATING INCOME |
| (₹ in crores) | ||||||||
Particulars | Year ended 31 March 2021 | Year ended 31 March 2020 | ||||||
Export incentives | 303 | 409 | ||||||
Scrap sales | 527 | 316 | ||||||
Miscellaneous income | 328 | 177 | ||||||
|
|
|
| |||||
Total | 1,158 | 902 | ||||||
|
|
|
| |||||
| 27 | OTHER INCOME |
| (₹ in crores) | ||||||||
Particulars | Year ended 31 March 2021 | Year ended 31 March 2020 | ||||||
Net gain on investment measured at FVTPL | 934 | 558 | ||||||
Interest income from investments measured at FVTPL | 478 | 1,015 | ||||||
Interest income from financial assets at amortised cost | ||||||||
- Bank deposits | 565 | 218 | ||||||
- Loans (Refer note 40) | 629 | 2 | ||||||
- Others | 351 | 367 | ||||||
Interest on income tax refund | 80 | 29 | ||||||
Dividend Income from | ||||||||
- financial assets at FVTPL | 1 | 48 | ||||||
- financial assets at FVOCI | 2 | 4 | ||||||
Profit on sale of assets | 75 | — | ||||||
Deferred government grant income (Refer note 24) | 229 | 205 | ||||||
Miscellaneous income | 77 | 64 | ||||||
|
|
|
| |||||
Total | 3,421 | 2,510 | ||||||
|
|
|
| |||||
VEDANTA LIMITED | INTEGRATED REPORT AND ANNUAL ACCOUNTS 2020-21 | 455
CONSOLIDATED CONTINUED...
Notes
forming part of the consolidated financial statements as at and for the year ended 31 March 2021
| 28 | CHANGES IN INVENTORIES OF FINISHED GOODS AND WORK-IN-PROGRESS* |
| (₹ in crores) | ||||||||
Particulars | Year ended 31 March 2021 | Year ended 31 March 2020 | ||||||
Opening Stock: | ||||||||
Finished Goods | 1,270 | 1,438 | ||||||
Work-in-Progress | 3,323 | 2,527 | ||||||
| 4,593 | 3,965 | |||||||
Add: Foreign exchange translation | 40 | (6 | ) | |||||
Add: Acquired as part of business combination | 23 | — | ||||||
Add: Capitalisation | 4 | — | ||||||
Less: Closing Stock | ||||||||
Finished Goods | 855 | 1,270 | ||||||
Work-in-Progress | 3,013 | 3,323 | ||||||
|
|
|
| |||||
| 3,868 | 4,593 | |||||||
|
|
|
| |||||
Sub-total | 792 | (634 | ) | |||||
|
|
|
| |||||
Total | 792 | 1,017 | ||||||
|
|
|
| |||||
| * | Inventories include goods-in-transit |
| 29. | EMPLOYEE BENEFITS EXPENSEA |
| (₹ in crores) | ||||||||
Particulars | Year ended 31 March 2021 | Year ended 31 March 2020 | ||||||
Salaries and Wages | 2,895 | 2,760 | ||||||
Share based payments (Refer note 30) | 60 | 73 | ||||||
Contributions to provident and other funds (Refer note 31) | 208 | 173 | ||||||
Staff welfare expenses | 228 | 242 | ||||||
Less: Cost allocated/directly booked in joint ventures | (530 | ) | (576 | ) | ||||
|
|
|
| |||||
Total | 2,861 | 2,672 | ||||||
|
|
|
| |||||
| (a) | net of capitalisation of ₹ 127 crores (31 March 2020: ₹ 159 crores). |
| 30 | SHARE BASED PAYMENTS |
The Company offers equity based and cash based option plans to its employees, officers and directors through the Company’s stock option plan introduced in 2016 and Cairn India’s stock option plan now administered by the Company pursuant to merger with the Company.
The Vedanta Limited Employee Stock Option Scheme (ESOS) 2016
The Company introduced an Employee Stock Option Scheme 2016 (“ESOS”), which was approved by the Vedanta
Limited shareholders to provide equity settled incentive to all employees of the Company including subsidiary companies. The ESOS scheme includes tenure based, business performance based (EBITDA) and market performance based stock options. The maximum value of options that can be awarded to members of the wider management group is calculated by reference to the grade average cost-to-company (“CTC”) and individual grade of the employee. The performance conditions attached to the option is measured by comparing Company’s performance in terms of Total Shareholder Return (“TSR”) over the performance period with the performance of two group of comparator companies (i.e. Indian and global comparator companies) defined in the scheme. The extent to which an option vests will depend on the Company’s TSR rank against a group or groups of peer companies at the end of the performance period and as moderated by the Remuneration Committee. The ESOS schemes are administered through VESOS trust and have underlying Vedanta Limited equity shares.
456
| < BACK TO CONTENTS | Integrated Report | Statutory reports | Financial statements |
Notes
forming part of the consolidated financial statements as at and for the year ended 31 March 2021
Options granted during the year ended 31 March 2021 includes business performance based, sustained individual performance based, management discretion and fatality multiplier based stock options. Business performances will be measured using Volume, Cost, Net Sales Realisation, EBITDA, ECG & Carbon footprint or a combination of these for the respective business/SBU entities.
Options granted during the year ended 31 March 2020 includes business performance based, sustained individual performance based and market performance based stock options. Business performances will be measured using Volume, Cost, Net Sales Realisation, EBITDA, free cash flow or a combination of these for the respective business/SBU entities.
The exercise price of the options is ₹ 1 per share and the performance period is three years, with no re-testing being allowed.
The details of share options for the year ended 31 March 2021 is presented below:
Financial Year | Exercise Period | Options | Options | Options | Options | Options | Options | Options | Options | |||||||||
2016-17 | 15 December 2019 - 14 June 2020 | 10,68,516 | — | — | 8,648 | 10,59,868 | — | — | — | |||||||||
2017-18 | 01 September 2020 - 28 February 2021 | 70,27,925 | — | — | 55,14,169 | 11,36,816 | — | 3,76,940 | 3,76,940 | |||||||||
2017-18 | 16 October 2020 - 15 April 2021 | 11,126 | — | — | 11,126 | — | — | — | — | |||||||||
2018-19 | 01 November 2021 - 30 April 2022 | 1,14,20,046 | — | — | 15,07,806 | — | — | 99,12,240 | — | |||||||||
2018-19 | Cash settled | 10,69,156 | — | — | 3,40,300 | — | — | 7,28,856 | — | |||||||||
2019-20 | 29 November 2022 - 28 May 2023 | 1,58,81,330 | — | — | 23,09,052 | — | — | 1,35,72,278 | — | |||||||||
2019-20 | Cash settled | 18,96,700 | — | 10,19,249 | — | 8,77,451 | — | |||||||||||
2020-21 | 06 November 2023 - 05 May 2024 | — | 1,27,11,112 | — | — | — | — | 1,27,11,112 | — | |||||||||
2020-21 | Cash settled | — | 8,80,000 | — | — | — | — | 8,80,000 | — | |||||||||
|
|
|
|
|
|
|
| |||||||||||
| 3,83,74,799 | 1,35,91,112 | — | 1,07,10,350 | 21,96,684 | — | 3,90,58,877 | 3,76,940 | |||||||||||
|
|
|
|
|
|
|
|
The details of share options for the year ended 31 March 2020 is presented below:
Financial Year | Exercise Period | Options | Options | Options | Options | Options | Options | Options | Options | |||||||||
2016-17 | 15 December 2019 - 14 June 2020 | 65,08,226 | — | — | 48,19,269 | 6,20,441 | — | 10,68,516 | 10,68,516 | |||||||||
2017-18 | 01 September 2020 - 28 February 2021 | 82,74,393 | — | — | 12,46,468 | — | — | 70,27,925 | — | |||||||||
2017-18 | 16 October 2020 - 15 April 2021 | 11,126 | — | — | — | — | — | 11,126 | — | |||||||||
2017-18 | 01 November 2020 - 30 April 2021 | 27,638 | — | — | 27,638 | — | — | — | — | |||||||||
2018-19 | 01 November 2021 - 30 April 2022 | 1,35,66,200 | — | — | 21,46,154 | — | — | 1,14,20,046 | — | |||||||||
2018-19 | Cash settled | 10,47,660 | — | 2,11,170 | 1,89,674 | — | — | 10,69,156 | — | |||||||||
2019-20 | 29 November 2023 - 28 May 2024 | — | 1,67,13,640 | — | 8,32,310 | — | — | 1,58,81,330 | — | |||||||||
2019-20 | Cash settled | — | 20,37,690 | — | 1,40,990 | — | — | 18,96,700 | — | |||||||||
|
|
|
|
|
|
|
| |||||||||||
| 2,94,35,243 | 1,87,51,330 | 2,11,170 | 94,02,503 | 6,20,441 | — | 3,83,74,799 | 10,68,516 | |||||||||||
|
|
|
|
|
|
|
|
| * | excludes 58,420 options exercised during the year regarding which the transaction could not be completed before 31 March 2020 and hence, the corresponding shares were were not transferred to the concerned employees. |
VEDANTA LIMITED | INTEGRATED REPORT AND ANNUAL ACCOUNTS 2020-21 | 457
CONSOLIDATED CONTINUED...
Notes
forming part of the consolidated financial statements as at and for the year ended 31 March 2021
The fair value of all options has been determined at the date of grant of the option allowing for the effect of any market-based performance conditions. This fair value, adjusted by the Group’s estimate of the number of options that will eventually vest as a result of non-market conditions, is expensed over the vesting period.
Business Performance-Based and Sustained Individual Performance-Based Options:
The fair values of stock options following these types of vesting conditions have been estimating using the Black-Scholes-Merton Option Pricing model. The value arrived at under this model has been then multiplied by the expected % vesting based on business performance conditions (only for business performance-based options) and the expected multiplier on account of sustained individual performance (for both type of options). The inputs used in the Black-Scholes-Merton Option Pricing model include the share price considered as of the valuation date, exercise price as per the scheme/ plan of the options, expected dividend yield (estimated based on actual/expected dividend trend of the Company), expected tenure (estimated as the remaining vesting period of the options), the risk-free rate (considered as the zero coupon yield as of the valuation date for a term commensurate with the expected tenure of the options) and expected volatility (estimated based on the historical volatility of the return in company’s share prices for a term commensurate with the expected tenure of the options). The exercise period of 6 months post vesting period has not been considered as the options are expected to be exercised immediately post the completion of the vesting period.
Total Shareholder Returns-Based Options:
The fair values of stock options following this type of vesting condition has been estimated using the Monte Carlo Simulation method. This method has been used to simulate the expected share prices for Vedanta Limited and the companies of the comparator group over the vesting period of the options. Based on the simulated prices, the expected pay-off at the end of the vesting period has been estimated and present valued to the valuation date. Further, based on the simulated share prices and expected dividends the relative rank of Vedanta Limited’s share price return has been estimated vis-à-vis the Indian and Global Group of the comparator group. This rank has been used to estimate expected % vesting of the options under this type of vesting condition. The inputs to the monte carlo simulation method include expected tenure (estimated as the remaining vesting period of the options), the risk-free rate (considered as the zero coupon yield as of the valuation date for a term commensurate with the expected tenure of the options), expected dividend yield (estimated based on the actual dividend trend of the companies), expected volatility (estimated based on the historical volatility of the return in the Company’s share prices for a term commensurate with the expected tenure of the options). The exercise period of 6 months post the vesting period has not been considered as the options are expected to be exercised immediately post the completion of the vesting period.
The assumptions used in the calculations of the charge in respect of the ESOS options granted during the year ended
31 March 2021 and 31 March 2020 are set out below:
Year ended 31 March 2021 | Year ended 31 March 2020 | |||
Particulars | ESOS 2020 | ESOS 2019 | ||
Number of Options | Cash settled - 8,80,000 equity settled – 1,27,11,112 | Cash settled - 20,37,690 Equity settled – 1,67,13,640 | ||
Exercise Price | ₹ 1 | ₹ 1 | ||
Share Price at the date of grant | ₹ 228.75 | ₹ 144.60 | ||
Contractual Life | 2 years and 7 months | 3 years | ||
Expected Volatility | 49.28% | 36.64% | ||
Expected option life | 2 years and 7 months | 3 years | ||
Expected dividends | 6.80% | 7.96% | ||
Risk free interest rate | 4.84% | 5.68% | ||
Expected annual forfeitures | 10% p.a. | 10% p.a. | ||
Fair value per option granted (Non-market performance based) | 150.73 | ₹ 102.30 | ||
Fair value per option granted (Market performance based) | NA | ₹ 72.12 |
Weighted average share price at the date of exercise of stock options was ₹ 131.08 (31 March 2020: ₹ 126.02)
458
| < BACK TO CONTENTS | Integrated Report | Statutory reports | Financial statements |
Notes
forming part of the consolidated financial statements as at and for the year ended 31 March 2021
The weighted average remaining contractual life for the share options outstanding was 2.03 years (31 March 2020: 2.28 years).
The Group recognised total expenses of ₹58 crores (31 March 2020 ₹75 crores) related to equity settled share-based payment transactions for the year ended 31 March 2021. The total expense recognised on account of cash settled share based plan during the year ended 31 March 2021 is ₹6 crores (31 March 2020: ₹2 crores) and the carrying value of cash settled share based compensation liability as at 31 March 2021 is ₹7 crores (31 March 2020: 1 crores).
Employee stock option plans of erstwhile Cairn India Limited:
The Company has provided CIESOP share based payment scheme to its employees.
CIESOP plan
There are no specific vesting conditions under CIESOP plan other than completion of the minimum service period of 3 years from the date of grant. Phantom options are exercisable proportionate to the period of service rendered by the employee subject to completion of one year. The exercise period is 7 years from the vesting date.
Details of employees stock option plans is presented below:
| Year ended 31 March 2021 | Year ended 31 March 2020 | |||||||||||||||
CIESOP Plan | Number of options | Weighted average exercise price in ₹ | Number of options | Weighted average exercise price in ₹ | ||||||||||||
Outstanding at the beginning of the year | 53,41,740 | 288.2 | 64,77,059 | 279.2 | ||||||||||||
Granted during the year | Nil | NA | Nil | NA | ||||||||||||
Expired during the year | 10,82,229 | 291.3 | 6,58,663 | 200.1 | ||||||||||||
Exercised during the year | Nil | NA | Nil | NA | ||||||||||||
Forfeited/cancelled during the year | 9,44,337 | 288.0 | 4,76,656 | 288.1 | ||||||||||||
Outstanding at the end of the year | 33,15,174 | 287.3 | 53,41,740 | 288.2 | ||||||||||||
Exercisable at the end of the year | 33,15,174 | 287.3 | 53,41,740 | 288.2 | ||||||||||||
| Scheme | Range of exercise price in ₹ | Weighted average remaining contractual life of options (in years) | Weighted average exercise price in ₹ | |||||||||
The details of exercise price for stock options outstanding as at 31 March 2021 are: | ||||||||||||
CIESOP Plan | 286.85-287.75 | 0.80 | 287.3 | |||||||||
The details of exercise price for stock options outstanding as at 31 March 2020 are: | ||||||||||||
CIESOP Plan | 286.85-291.25 | 1.46 | 288.2 | |||||||||
The Group has awarded certain cash settled share based options indexed to Parents’ shares (Vedanta Resources Limited shares) and shares of any of its subsidiaries. The total expense recognised on account of cash settled share based plan during the year ended 31 March 2021 is ₹22 crores (31 March 2020: ₹21 crores) and the carrying value of cash settled share based compensation liability as at 31 March 2021 is ₹86 crores (31 March 2020: ₹51 crores).
Out of the total expense of ₹86 crores (31 March 2020: ₹98 crores) pertaining to equity settled and cash settled options for the year ended 31 March 2021 the Group has capitalised ₹26 crores (31 March 2020: ₹25 crores) expense for the year ended 31 March 2021.
31 EMPLOYEE BENEFIT PLANS
The Group participates in defined contribution and benefit plans, the assets of which are held (where funded) in separately administered funds.
For defined contribution plans the amount charged to the consolidated statement of profit and loss is the total amount of contributions payable in the year.
VEDANTA LIMITED | INTEGRATED REPORT AND ANNUAL ACCOUNTS 2020-21 | 459
CONSOLIDATED CONTINUED...
Notes
forming part of the consolidated financial statements as at and for the year ended 31 March 2021
For defined benefit plans, the cost of providing benefits under the plans is determined by actuarial valuation separately each year for each plan using the projected unit credit method by independent qualified actuaries as
at the year end. Remeasurement gains and losses arising in the year are recognised in full in other comprehensive income for the year.
| i) | Defined contribution plans |
The Group contributed a total of ₹119 crores and ₹84 crores for the year ended 31 March 2021 and 31 March 2020 respectively to the following defined contribution plans.
| Particulars | Year ended 31 March 2021 | (₹ in crores) Year ended 31 March 2020 | ||||||
Employer’s contribution to recognised provident fund and family pension fund | 98 | 63 | ||||||
Employer’s contribution to superannuation | 21 | 21 | ||||||
Employer’s contribution to National Pension Scheme | 0 | — | ||||||
|
|
|
| |||||
| 119 | 84 | |||||||
|
|
|
| |||||
Indian pension plans
Central recognised provident fund
In accordance with the ‘The Employee’s Provident Funds and Miscellaneous Provisions Act, 1952’, employees are entitled to receive benefits under the Provident Fund. Both the employee and the employer make monthly contributions to the plan at a predetermined rate (12% for 2021 and 2020) of an employee’s basic salary. All employees have an option to make additional voluntary contributions. These contributions are made to the fund administered and managed by the Government of India (GOI) or to independently managed and approved funds. The Group has no further obligations under the fund managed by the GOI beyond its monthly contributions which are charged to the consolidated statement of profit and loss in the year they are incurred.
Family pension fund
The Pension Fund was established in 1995 and is managed by the Government of India. The employee makes no contribution to this fund but the employer makes a contribution of 8.33% of salary each month subject to a specified ceiling per employee. This is provided for every permanent employee on the payroll.
At the age of superannuation, contributions ceases and the individual receives a monthly payment based on the level of contributions through the years, and on their salary scale at the time they retire, subject to a maximum ceiling of salary level. The Government funds these payments, thus the Group has no additional liability beyond the contributions that it makes, regardless of whether the central fund is in surplus or deficit.
Superannuation
Superannuation, another pension scheme, is applicable only to executives above certain grade. However, in case of the oil & gas business (applicable from the second year of employment) and Iron Ore Segment, the benefit
is applicable to all executives. Vedanta Limited and each relevant Indian subsidiary holds a policy with Life Insurance Corporation of India (“LIC”), to which each of these entities contributes a fixed amount relating to superannuation and the pension annuity is met by LIC as required, taking into consideration the contributions made. The Group has no further obligations under the scheme beyond its monthly contributions which are charged to the consolidated statement of profit and loss in the year they are incurred.
National Pension Scheme
National Pension Scheme is a retirement savings account for social security and welfare applicable for executives covered under the superannuation benefit of Vedanta Limited and each relevant Indian subsidiary, on a choice basis. It was introduced to enable employees to select the treatment of superannuation component of their fixed salaries and avail the benefits offered by National Pension Scheme launched by Government of India. Vedanta Limited and each relevant entity holds a corporate account with one of the pension fund managers authorized by the Government of India to which each of the entity contributes a fixed amount relating to superannuation and the pension annuity will be met by the fund manager as per rules of National Pension Scheme. The Group has no further obligations under the scheme beyond its monthly contributions which are charged to the consolidated statement of profit and loss in the year they are incurred.
Australian pension scheme
The Group also participates in defined contribution superannuation schemes in Australia. The contribution of a proportion of an employee’s salary in a superannuation fund is a compulsory legal requirement in Australia. The employer contributes, into the employee’s fund of choice, 9.50% of an employee’s gross remuneration where the employee is covered by an industrial agreement and 12.50% of the basic remuneration for all other employees. All employees have an option to make additional voluntary contributions. The Group has no further obligations under the scheme beyond its monthly contributions which are charged to the consolidated statement of profit and loss in the year they are incurred.
460
| < BACK TO CONTENTS | Integrated Report | Statutory reports | Financial statements |
Notes
forming part of the consolidated financial statements as at and for the year ended 31 March 2021
Skorpion Zinc Provident Fund, Namibia
The Skorpion Zinc Provident Fund is a defined contribution fund and is compulsory to all full time employees under the age of 60. The Group contribution to the fund is a fixed percentage of 9% per month of pensionable salary, whilst the employee contributes 7% with the option of making additional contributions, over and above the normal contribution, up to a maximum of 12%.
Normal retirement age is 60 years and benefit payable is the member’s fund credit which is equal to all employer and employee contributions plus interest. The same applies when an employee resigns from Skorpion Zinc. The Fund provides disability cover which is equal to the member’s fund credit and a death cover of two times annual salary in the event of death before retirement. The Group has no additional liability beyond the contributions that it makes. Accordingly, this scheme has been accounted for on a defined contribution basis and contributions are charged directly to the consolidated statement of profit and loss in the year they are incurred.
Black Mountain (Pty) Limited, South Africa Pension and Provident Funds
Black Mountain Mining (Pty) Ltd. has two retirement funds, both administered by Alexander Forbes, a registered financial service provider. The purpose of the funds is to provide retirement and death benefits to all eligible employees.
Group contributes at a fixed percentage of 10.5% for up to supervisor grade and 15% for others.
Membership of both funds is compulsory for all permanent employees under the age of 60.
The Group has no additional liability beyond the contributions that it makes. Accordingly, this scheme has been accounted for on a defined contribution basis and contributions are charged directly to the consolidated statement of profit and loss in the year they are incurred.
ii) Defined benefit plans
(a) Contribution to provident fund trust (the “trusts”) of Iron ore division, Bharat Aluminium Company Limited (BALCO), Hindustan Zinc Limited (HZL), Sesa Resources Limited (SRL) and Sesa Mining Corporation Limited (SMCL)
The provident funds of Iron ore division, BALCO, HZL, SRL and SMCL are exempted under Section 17 of The Employees Provident Fund and Miscellaneous Provisions Act, 1952. Conditions for grant of exemption stipulates that the employer shall make good deficiency, if any, between the return guaranteed by the statute and actual earning of the Fund. Based on actuarial valuation in accordance with Ind AS 19 and Guidance note issued by Institute of Actuaries of India for interest rate guarantee of exempted provident fund liability of employees, there is no interest shortfall that is required to be met by Iron ore division, BALCO, HZL, SRL and SMCL as of 31 March 2021 and 31 March 2020. Having regard to the assets of the fund and the return on the investments, the Group does not expect any deficiency in the foreseeable future.
The Group contributed a total of ₹48 crores for the year ended 31 March 2021 and ₹47 crores for the year ended 31 March 2020 in relation to the independently managed and approved funds. The present value of obligation and the fair value of plan assets of the trust are summarised below.
| Particulars | Year ended 31 March 2021 | (₹ in crores) Year ended 31 March 2020 | ||||||
Fair value of plan assets of trusts | 2,421 | 2,344 | ||||||
Present value of defined benefit obligation | (2,375 | ) | (2,299 | ) | ||||
Net liability arising from defined benefit obligation | NIL | NIL | ||||||
| Percentage allocation of plan assets of the trust | Year ended 31 March 2021 | (₹ in crores) Year ended 31 March 2020 | ||||||
Assets by category | ||||||||
Government Securities | 63.19 | % | 61.68 | % | ||||
Debentures/bonds | 34.36 | % | 36.66 | % | ||||
Equity | 1.63 | % | 1.65 | % | ||||
Money Market Instruments | 0.83 | % | 0.00 | % | ||||
Fixed deposits | 0.00 | % | 0.00 | % | ||||
VEDANTA LIMITED | INTEGRATED REPORT AND ANNUAL ACCOUNTS 2020-21 | 461
CONSOLIDATED CONTINUED...
Notes
forming part of the consolidated financial statements as at and for the year ended 31 March 2021
The remeasurement loss of ₹6 crores and ₹152 crores have been charged to Other Comprehensive Income (OCI) during the year ended 31 March 2021 and 31 March 2020 respectively.
(b) Post-Retirement Medical Benefits:
The Group has a scheme of medical benefits for employees at BMM and BALCO subsequent to their retirement on completion of tenure including retirement on medical grounds and voluntary retirement on contributory basis. The scheme includes employee’s spouses as well. Based on an actuarial valuation conducted as at year-end, a provision is recognised in full for the benefit obligation. The obligation relating to post-retirement medical benefits as at 31 March 2021 was ₹86 crores (31 March 2020: ₹79 crores). The obligation under this plan is unfunded. The Group considers these amounts as not material and accordingly has not provided further disclosures as required by Ind AS 19 ‘Employee benefits’. The current service cost for the year ending 31 March 2021 of ₹1 crores (31 March 2020: ₹1 crores) has been recognised in consolidated statement of profit and loss. The remeasurement (gains)/losses and net interest on the obligation of post-retirement medical benefits of ₹2 crores gain (31 March 2020: ₹14 crores loss) and ₹7 crores (31 March 2020: ₹6 crores) for the year ended 31 March 2021 have been recognised in other comprehensive income and finance cost respectively.
(c) Other Post-employment Benefits:
India – Gratuity plan
In accordance with the Payment of Gratuity Act of 1972, Vedanta Limited and its Indian subsidiaries contribute to a defined benefit plan (the “Gratuity Plan”) covering certain categories of employees. The Gratuity Plan provides a lump sum payment to vested employees at retirement, disability or termination of employment being an amount based on the respective employee’s last drawn salary and the number of years of employment with the Group.
Based on actuarial valuations conducted as at year end using the projected unit credit method, a provision is recognised in full for the benefit obligation over and above the funds held in the Gratuity Plan. For entities where the plan is unfunded, full provision is recognised in the consolidated balance sheet.
The iron ore and oil & gas division of Vedanta Limited, SRL, SMCL, HZL and FACOR have constituted a trust recognised by Income Tax Authorities for gratuity to employees and contributions to the trust are funded with Life Insurance Corporation of India (LIC), ICICI Prudential Life Insurance Company Limited and HDFC Life Insurance Company Limited.
Principal actuarial assumptions
Principal actuarial assumptions used to determine the present value of the Other post-employment benefit Plan obligation are as follows:
Particulars | Year ended 31 March 2021 | Year ended 31 March 2020 | ||||||
Discount rate | 6.90% | 6.80% | ||||||
Expected rate of increase in compensation level of covered employees | 2%-15% | 2%-15% | ||||||
Mortality table | IALM (2012-14) | IALM (2012-14) | ||||||
Amount recognised in the consolidated balance sheet consists of:
| Particulars | Year ended 31 March 2021 | (₹ in crores) Year ended 31 March 2020 | ||||||
Fair value of plan assets | 401 | 442 | ||||||
Present value of defined benefit obligations | (576 | ) | (631 | ) | ||||
Net liability arising from defined benefit obligation | (175 | ) | (189 | ) | ||||
Amounts recognised in consolidated statement of profit and loss in respect of Other post-employment benefit plan are as follows:
Particulars | Year ended 31 March 2021 | (₹ in crores) Year ended 31 March 2020 | ||||||
Current service cost | 40 | 41 | ||||||
Net interest cost | 13 | 15 | ||||||
Components of defined benefit costs recognised in consolidated statement of profit and loss | 53 | 56 | ||||||
462
| < BACK TO CONTENTS | Integrated Report | Statutory reports | Financial statements |
Notes
forming part of the consolidated financial statements as at and for the year ended 31 March 2021
Amounts recognised in other comprehensive income in respect of Other post-employment benefit plan are as follows:
Particulars | Year ended 31 March 2021 | (₹ in crores) Year ended 31 March 2020 | ||||||
Re-measurement of the net defined benefit obligation:- | ||||||||
Actuarial losses arising from changes in financial assumptions | 1 | 28 | ||||||
Actuarial (gains)/losses arising from experience adjustments | (10 | ) | 16 | |||||
Actuarial gains arising from changes in demographic assumptions | — | (1 | ) | |||||
Actuarial losses on plan assets (excluding amounts included in net interest cost) | 6 | 1 | ||||||
Components of defined benefit costs recognised in Other comprehensive income | (3 | ) | 44 | |||||
The movement of the present value of the Other post-employment benefit plan obligation is as follows:
| Particulars | Year ended 31 March 2021 | (₹ in crores) Year ended 31 March 2020 | ||||||
Opening balance | 631 | 589 | ||||||
Acquired in business combination | 18 | — | ||||||
Current service cost | 40 | 41 | ||||||
Benefits paid | (148 | ) | (87 | ) | ||||
Interest cost | 44 | 45 | ||||||
Actuarial losses/(gains) arising from changes in assumptions | (9 | ) | 43 | |||||
Closing balance | 576 | 631 | ||||||
The movement in the fair value of Other post-employment benefit plan assets is as follows:
Particulars | Year ended 31 March 2021 | (₹ in crores) Year ended 31 March 2020 | ||||||
Opening balance | 442 | 387 | ||||||
Acquired in business combination | 16 | — | ||||||
Contributions received | 18 | 86 | ||||||
Benefits paid | (100 | ) | (60 | ) | ||||
Re-measurement gain/(loss) arising from return on plan assets | (6 | ) | (1 | ) | ||||
Interest income | 31 | 30 | ||||||
Closing balance | 401 | 442 | ||||||
The above plan assets have been invested in the qualified insurance policies.
The actual return on plan assets was ₹25 crores for the year ended 31 March 2021 and ₹29 crores for the year ended 31 March 2020.
The weighted average duration of the defined benefit obligation is 14 years and 14.3 years as at 31 March 2021 and 31 March 2020 respectively.
The Group expects to contribute ₹52 crores to the funded defined benefit plans during the year ending 31 March 2022.
Sensitivity analysis for Defined Benefit Plan
Below is the sensitivity analysis determined for significant actuarial assumptions for the determination of defined benefit obligation and based on reasonably possible changes of the respective assumptions occurring at the end of the reporting period while holding all other assumptions constant.
VEDANTA LIMITED | INTEGRATED REPORT AND ANNUAL ACCOUNTS 2020-21 | 463
CONSOLIDATED CONTINUED...
Notes
forming part of the consolidated financial statements as at and for the year ended 31 March 2021
| (₹ in crores) | ||||||||
| Increase/(Decrease) in defined benefit obligation | ||||||||
Particulars | Year ended 31 March 2021 | Year ended 31 March 2020 | ||||||
Discount rate | ||||||||
Increase by 0.50% | (21 | ) | (21 | ) | ||||
Decrease by 0.50% | 23 | 23 | ||||||
Expected rate of increase in compensation level of covered employees | ||||||||
Increase by 0.50% | 21 | 20 | ||||||
Decrease by 0.50% | (20 | ) | (20 | ) | ||||
The above sensitivity analysis may not be representative of the actual benefit obligation as it is unlikely that the change in assumptions would occur in isolation of one another as some of the assumptions may be correlated.
In presenting the above sensitivity analysis, the present value of defined benefit obligation has been calculated using the projected unit credit method at the end of reporting period, which is the same as that applied in calculating the defined obligation liability recognised in the consolidated balance sheet.
Risk analysis
Group is exposed to a number of risks in the defined benefit plans. Most significant risks pertaining to defined benefit plans and management estimation of the impact of these risks are as follows:
Investment risk
Most of the Indian defined benefit plans are funded with Life Insurance Corporation of India (LIC), ICICI Prudential Life (ICICI) and HDFC Standard Life. Group does not have any liberty to manage the fund provided to LIC, ICICI prudential and HDFC Standard Life.
The present value of the defined benefit plan obligation is calculated using a discount rate determined by reference to Government of India bonds for Group’s Indian operations. If the return on plan asset is below this rate, it will create a plan deficit.
Interest risk
A decrease in the interest rate on plan assets will increase the net plan obligation.
Longevity risk/Life expectancy
The present value of the defined benefit plan obligation is calculated by reference to the best estimate of the mortality of plan participants both during and at the end of the employment. An increase in the life expectancy of the plan participants will increase the plan obligation.
Salary growth risk
The present value of the defined benefit plan obligation is calculated by reference to the future salaries of plan participants. An increase in the salary of the plan participants will increase the plan obligation.
# Code on Social Security, 2020
The Code on Social Security, 2020 (‘Code’) relating to employee benefits during employment and post- employment benefits received Presidential assent in September 2020. The Code has been published in the Gazette of India. However, the date on which the Code will come into effect has not been notified and the final rules/ interpretation have not yet been issued. The Group will assess the impact of the Code when it comes into effect and will record any related impact in the period the Code becomes effective.
32 FINANCE COST
| (₹ in crores) | ||||||||
Particulars | Year ended 31 March 2021 | Year ended 31 March 2020 | ||||||
Interest expense on financial liabilities at amortised cost b | 5,185 | 5,617 | ||||||
Other finance costs | 238 | 261 | ||||||
Net interest on defined benefit arrangement | 19 | 21 | ||||||
Unwinding of discount on provisions (Refer note 23) | 72 | 96 | ||||||
Exchange difference regarded as an adjustment to borrowing cost | 15 | 7 | ||||||
Less: Capitalisation of finance cost/borrowing cost a (Refer note 6) | (316 | ) | (1,017 | ) | ||||
Less: Cost allocated/directly booked in joint ventures | (3 | ) | (8 | ) | ||||
|
|
|
| |||||
Total | 5,210 | 4,977 | ||||||
|
|
|
| |||||
464
| < BACK TO CONTENTS | Integrated Report | Statutory reports | Financial statements |
Notes
forming part of the consolidated financial statements as at and for the year ended 31 March 2021
| a) | Interest rate of 6.91 % (31 March 2020: 7.49%) was used to determine the amount of general borrowing costs eligible for capitalisation in respect of qualifying asset for the year ended 31 March 2021. |
| b) | Interest expense on lease liabilities for the year ended 31 March 2021 is ₹28 crores (31 March 2020: ₹25 crores) |
| 33 | OTHER EXPENSES |
| (₹ in crores) | ||||||||
Particulars | Year ended 31 March 2021 | Year ended 31 March 2020 | ||||||
Cess on crude oil | 1,743 | 2,315 | ||||||
Royalty | 3,090 | 2,670 | ||||||
Consumption of stores and spare parts | 2,387 | 2,601 | ||||||
Share of expenses in producing oil and gas blocks | 2,118 | 2,471 | ||||||
Repairs to Plant and equipment | 2,357 | 2,505 | ||||||
Repairs to building | 161 | 196 | ||||||
Repairs others | 161 | 161 | ||||||
Carriage | 1,600 | 1,539 | ||||||
Mine Expenses | 2,064 | 2,242 | ||||||
Net loss on foreign currency transactions and translation | 65 | 733 | ||||||
Other Selling Expenses | 18 | 16 | ||||||
Insurance | 219 | 193 | ||||||
Loss on sale/disposal of fixed asset (net) | — | 56 | ||||||
Rent* | 47 | 42 | ||||||
Rates and taxes | 58 | 80 | ||||||
Exploration costs written off (Refer note 6) | 7 | 3 | ||||||
Bad trade receivables and advances written off | 12 | 17 | ||||||
Provision for doubtful advances/expected credit loss | 296 | 104 | ||||||
Miscellaneous expenses | 4,358 | 4,340 | ||||||
Less: Cost allocated/directly booked in joint ventures | (275 | ) | (305 | ) | ||||
|
|
|
| |||||
Total | 20,486 | 21,979 | ||||||
|
|
|
| |||||
| * | Rent represents expense on short-term/low value leases. |
| 34 | EXCEPTIONAL ITEMS |
| (₹ in crores) | ||||||||||||||||||||||||
| Year ended 31 March 2021 | Year ended 31 March 2020 | |||||||||||||||||||||||
Particulars | Exceptional items | Tax effect of Exceptional items | Exceptional items after tax | Exceptional items | Tax effect of Exceptional items | Exceptional items after tax | ||||||||||||||||||
Capital work-in-progress written off and impairment charge relating to property, plant and equipment, exploration assets (as applicable) and other assets in following segments: | ||||||||||||||||||||||||
- Oil & gas a | — | — | — | (15,907 | ) | 6,197 | (9,710 | ) | ||||||||||||||||
- Copper c | — | — | — | (669 | ) | 234 | (435 | ) | ||||||||||||||||
- Aluminiumj | (181 | ) | 63 | (118 | ) | — | — | — | ||||||||||||||||
- Other segment b,k | (63 | ) | 22 | (41 | ) | (504 | ) | 77 | (427 | ) | ||||||||||||||
Provision on receivables subject to Litigation d,e | (213 | ) | 18 | (195 | ) | (556 | ) | 93 | (463 | ) | ||||||||||||||
Revision of Renewable Purchase Obligation pursuant to respective state electricity regulation commission notifications f | 95 | (24 | ) | 71 | 168 | (59 | ) | 109 | ||||||||||||||||
VEDANTA LIMITED | INTEGRATED REPORT AND ANNUAL ACCOUNTS 2020-21 | 465
CONSOLIDATED CONTINUED...
Notes
forming part of the consolidated financial statements as at and for the year ended 31 March 2021
| (₹ in crores) | ||||||||||||||||||||||||
| Year ended 31 March 2021 | Year ended 31 March 2020 | |||||||||||||||||||||||
Particulars | Exceptional items | Tax effect of Exceptional items | Exceptional items after tax | Exceptional items | Tax effect of Exceptional items | Exceptional items after tax | ||||||||||||||||||
Provision for settlement of dispute | (213 | ) | 75 | (138 | ) | — | — | — | ||||||||||||||||
regarding environmental clearance h Transaction costs paid to the ultimate | (103 | ) | — | (103 | ) | — | — | — | ||||||||||||||||
parent company on structured investment sold in previous yeari Interest income on claims based on Supreme Court order g | — | — | — | 82 | (21 | ) | 61 | |||||||||||||||||
|
|
|
|
|
|
|
|
|
|
|
| |||||||||||||
Total | (678 | ) | 154 | (524 | ) | (17,386 | ) | 6,521 | (10,926 | ) | ||||||||||||||
|
|
|
|
|
|
|
|
|
|
|
| |||||||||||||
| a) | During the year ended 31 March 2021 and 31 March 2020, the Group had recognised impairment charge of Nil and ₹15,907 crores on its assets in the oil and gas segment comprising of: |
| (i) | During the year ended 31 March 2020, impairment charge of ₹15,150 crores relating to Rajasthan oil and gas block (“RJ CGU”) triggered by the significant fall in the crude oil prices. Of this charge, ₹14,113 crores impairment charge had been recorded against oil and gas producing facilities and ₹1,037 crores impairment charge had been recorded against exploration intangible assets under development. |
For oil & gas assets, CGU’s identified are on the basis of a production sharing contract (PSC) level, as it is the smallest group of assets that generates cash inflows that are largely independent of the cash inflows from other assets or group of assets.
The recoverable amount of the RJ CGU of ₹10,514 crores (US$1,405 million) was determined based on the fair value less costs of disposal approach, a level-3 valuation technique in the fair value hierarchy, as it more accurately reflects the recoverable amount based on our view of the assumptions that would be used by a market participant. This is based on the cash flows expected to be generated by the projected oil and natural gas production profiles up to the expected dates of cessation of production sharing contract (PSC)/ cessation of production from each producing field based on the current estimates of reserves and risked resources. Reserves assumptions for fair value less costs of disposal tests consider all reserves that a market participant would consider when valuing the asset, which are usually broader in scope than the reserves used in a value-in-use test. Discounted cash flow analysis used to calculate fair value less costs of disposal uses assumption for short-term oil price of US$38 per barrel for the next one year and scales up to long-term nominal price of US$57 per barrel three years thereafter derived from
a consensus of various analyst recommendations. Thereafter, these have been escalated at a rate of 2% per annum. The cash flows are discounted using the post-tax nominal discount rate of 10.35% derived from the post-tax weighted average cost of capital after factoring the risks ascribed to the successful implementation of key growth projects. Additionally, in computing the recoverable value, the effects of market participant’s response on production sharing contract matters have also been appropriately considered. Based on the sensitivities carried out by the Group, change in crude price assumptions by US$1/bbl and changes to discount rate by 1% would lead to a change in recoverable value by ₹337 crores (US$45 million) and ₹494 crores (US$66 million) respectively.
| (ii) | During the year ended 31 March 2020, impairment charge of ₹225 crores relating to KG-ONN-2003/1 CGU mainly due to the reduction in crude oil price forecast. |
The recoverable amount of the CGU, ₹147 crores (US$20 million) were determined based on fair value less cost of disposal approach as described in above paragraph. Discounted cash flow analysis used to calculate fair value less costs of disposal uses assumption for oil price as described in above paragraph. The cash flows are discounted using the post-tax nominal discount rate of 11.1% derived from the post-tax weighted average cost of capital. The sensitivities around change in crude price and discount rate are not material to the financial statements.
| (iii) | During the year ended 31 March 2020, impairment charge of ₹532 crores, in exploration block KG- OSN-2009/3, were provided for as the Government of India approval on extension and grant of excusable delay is awaited for. |
466
| < BACK TO CONTENTS | Integrated Report | Statutory reports | Financial statements |
Notes
forming part of the consolidated financial statements as at and for the year ended 31 March 2021
| b) | During the year ended 31 March 2020, the Group had recognised impairment charge of ₹504 crores on the assets of AvanStrate Inc (ASI) mainly due to the significant changes in the market and economic enviroment in which ASI operates leading to decrease in demand and profitability in the glass substrate business. The charge relates to ASI business in Japan, Taiwan and Korea classified in the ‘others’ segment. Given the significant interdependence of these entities on each other, these were considered as a single cash-generating unit. |
The net recoverable value of assets and liabilities had been assessed at ₹ 1,536 crores based on the value in use approach. Based on the sensitivities carried out by the Group, decrease in volume assumptions by 1% would lead to decrease in recoverable value by ₹ 17 crores and increase in discount rate by 1% would lead to a decrease in recoverable value by ₹ 48 crores.
| c) | Refer note 3(c)(A)(vii) for impairment in copper segment. |
| d) | During the year ended 31 March 2020, a parcel of land relating to the Iron Ore business having carrying value of ₹ 349 crores were reclassified from freehold land to other financial asset due to an ongoing legal dispute relating to title of the land. Subsequently, during the previous year, the financial asset were fully provided for impairment and recognised under exceptional items. |
| e) | As at 31 March 2021, the Company and its subsidiaries have an outstanding receivable equivalent to ₹ 211 crores (net of provision of ₹ 423 crores) (31 March 2020: ₹ 437 crores (net of provision of ₹ 207 crores)) from Konkola Copper Mines Plc (KCM), predominantly regarding monies advanced against future purchase of copper cathode/anode. |
A provisional liquidator was appointed to manage KCM’s affairs on 21 May 2019, after ZCCM Investments Holdings Plc (“ZCCM”), an entity majorly owned by the Government of Zambia and a 20.6% shareholder in KCM, filed a winding up petition against KCM. KCM’s majority shareholder, Vedanta Resources Holdings Limited (“VRHL”), and its parent company, Vedanta Resources Limited (“VRL”), are contesting the winding up petition in the Zambian courts. The local Court of Appeal (“CAZ”) has ruled in favour of VRHL/VRL, ordering a stay of the winding up proceedings and referring the matter for arbitration. In light of the orders from CAZ, VRL has also filed an application in the High Court of Zambia, asking for directions on the powers of the provision liquidator and the matter was argued on March 30, 2021. The ruling has been reserved.
VRHL and VRL had also commenced arbitration proceedings against ZCCM with seat in Johannesburg, South Africa, consistent with their position that arbitration is the agreed dispute resolution process. The procedural timetable for the arbitration envisages an initial hearing of prioritised issues commencing on 31 May 2021, with the substantive dispute being heard in November 2021 and February 2022. Meanwhile, KCM has not been supplying goods to the Group, which it was supposed to as per the terms of the advance.
During the year, the Group has recognised provisions for expected credit losses of ₹ 213 crores (31 March 2020: ₹ 207 crores) and based on its assessment of the merits of the case backed by legal opinions, the Group is of the view that VRL’s contractual position is upheld and continues to be strong on merits.
| f) | During the year, the Company has recomputed its Renewable Power Obligation (RPO) pursuant to Chhattisgarh State Electricity Regulatory Commission (CSERC) notification dated 13 July 2020 (published on 22 July 2020) which clarified that for Captive Power Plants commissioned before 01 April 2016, RPO should be pegged at the RPO obligation percentage rates (both for solar and non-solar) applicable for FY2015-16. Consequent to the aforesaid notification, the Company’s obligation towards RPO relating to the period up to 31 March 2020 has been reversed to the extent of ₹95 crores during this year. |
During the previous year, the Company has restated its Renewable Power Obligation (RPO) liability pursuant to Odisha Electricity Regulatory Commission (OERC) notification dated 31 December 2019 which clarified that for CPP’s commissioned before 01 April 2016, RPO should be pegged at the RPO obligation applicable for 2015-16. Based on the notification, liability of Vedanta Limited Jharsuguda and Lanjigarh plants have been revised and ₹168 crores reversal relating to previous years have been recognised under exceptional items in the previous year.
| g) | On the contempt petition filed by TSPL, the Hon’ble Supreme Court of India vide its order dated 07 August 2019 allowed gross calorific value (GCV) on as received basis (ARB) and actual cost of coal in the Energy Charge Formula and directed Punjab State Power Corporation Limited (PSPCL) to make the payments within 8 weeks. Pursuant to the order, PSPCL has paid ₹1,002 crores in September 2019 and October 2019. TSPL has booked an interest of ₹140 crores due to the delay in receipt of payment as per the Supreme Court order dated March 07, 2018 allowing the interest on delay in payment. Of this interest ₹82 crores pertaining to period prior to 31 March 2019 is booked under exceptional items and amount of ₹58 crores for the year ended 31 March 2020 was booked in Other income. |
VEDANTA LIMITED | INTEGRATED REPORT AND ANNUAL ACCOUNTS 2020-21 | 467
CONSOLIDATED CONTINUED...
Notes
forming part of the consolidated financial statements as at and for the year ended 31 March 2021
| h) | Refer note 3(c)(A)(x). |
| i) | Refer note 40(M). |
| j) | During the year ended 31 March 2021, the Company has recognised a loss of ₹181 crores relating to certain items of capital work-in-progress at the aluminium operations, which are no longer expected to be used. |
| k) | During the year ended 31 March 2021, ESL Steel Limited conducted a detailed physical verification and evaluation of project equipment and material being carried forward as capital work-in-progress at a carrying value of ₹835 crores. Pending completion of entire exercise, an interim provision of ₹63 crores has been recognised relating to certain items of capital work-in-progress, which are no longer expected to be used. |
| 35 | TAX |
| (a) | Tax charge/(credit) recognised in profit or loss (including on exceptional items) |
| (₹ in crores) | ||||||||
Particulars | Year ended 31 March 2021 | Year ended 31 March 2020 | ||||||
Current tax: | ||||||||
Current tax on profit for the year | 2,067 | 1,791 | ||||||
Credit in respect of current tax for earlier years | (1 | ) | (3 | ) | ||||
|
|
|
| |||||
Total Current Tax (a) | 2,066 | 1,788 | ||||||
|
|
|
| |||||
Deferred tax: | ||||||||
Reversal of temporary differences | (598 | ) | (475 | ) | ||||
Credit in respect of deferred tax for earlier years | (3 | ) | (9 | ) | ||||
Credit in respect of exceptional items (Refer note 34) | (154 | ) | (6,521 | ) | ||||
|
|
|
| |||||
Deferred Tax (b) | (755 | ) | (7,005 | ) | ||||
|
|
|
| |||||
Deferred Tax on distributable reserve of/dividend from subsidiary (c ) | 869 | 1,701 | ||||||
|
|
|
| |||||
Total Deferred Tax [(d)=(b+c)] | 114 | (5,304 | ) | |||||
|
|
|
| |||||
Total income tax expense/(benefit) for the year (a+d) | 2,180 | (3,516 | ) | |||||
|
|
|
| |||||
Profit/(Loss) before tax | 17,213 | (8,259 | ) | |||||
|
|
|
| |||||
Effective income tax rate (%) | 13 | % | 43 | % | ||||
|
|
|
| |||||
Tax expense/(benefit)
| (₹ in crores) | ||||||||
Particulars | Year ended 31 March 2021 | Year ended 31 March 2020 | ||||||
Tax effect on exceptional items | (154 | ) | (6,521 | ) | ||||
Tax expense – others | 2,334 | 3,005 | ||||||
|
|
|
| |||||
Net tax expense/(benefit) | 2,180 | (3,516 | ) | |||||
|
|
|
| |||||
| (b) | A reconciliation of income tax expense/(credit) applicable to profit/(loss) before tax at the Indian statutory income tax rate to recognise income tax expense for the year indicated are as follows: |
| (₹ in crores) | ||||||||
Particulars | Year ended 31 March 2021 | Year ended 31 March 2020 | ||||||
Profit/(Loss) before tax | 17,213 | (8,259 | ) | |||||
Indian statutory income tax rate | 34.944 | % | 34.944 | % | ||||
Tax at statutory income tax rate | 6,015 | (2,886 | ) | |||||
Disallowable expenses | 128 | 189 | ||||||
468
| < BACK TO CONTENTS | Integrated Report | Statutory reports | Financial statements |
Notes
forming part of the consolidated financial statements as at and for the year ended 31 March 2021
| (₹ in crores) | ||||||||
| Particulars | Year ended 31 March 2021 | Year ended 31 March 2020 | ||||||
Non-taxable income | (123 | ) | (141 | ) | ||||
Tax holidays and similar exemptions | (771 | ) | (501 | ) | ||||
Effect of tax rate differences of subsidiaries operating at other tax rates | (326 | ) | (107 | ) | ||||
Deferred Tax on distributable reserve of/dividend from subsidiary | 869 | 1,701 | ||||||
Unrecognised tax assets (net)** | (3,193 | ) | (70 | ) | ||||
Change in deferred tax balances due to change in tax law* | (335 | ) | (1,912 | ) | ||||
Capital Gains/Other Income subject to lower tax rate | (176 | ) | (273 | ) | ||||
Credit in respect of earlier years | (4 | ) | (12 | ) | ||||
Other permanent differences | 96 | 496 | ||||||
|
|
|
| |||||
Total | 2,180 | (3,516 | ) | |||||
|
|
|
| |||||
| * | Deferred tax for the year ended 31 March 2020 includes a credit of ₹1,774 crores on remeasurement of deferred tax balances as at 31 March 2019. Also refer note 3(c)(A)(ix). |
| ** | In June 2018, the Company acquired majority stake in ESL Steel Limited (“ESL”), which has since been focusing on operational turnaround. Based on management’s estimate of future outlook, financial projections and requirements of Ind AS 12 – Income taxes, ESL has recognised deferred tax assets of ₹3,184 crores during the year ended 31 March 2021. |
Certain businesses of the Group within India are eligible for specified tax incentives which are included in the table above as tax holidays and similar exemptions. Most of such tax exemptions are relevant for the companies operating in India. These are briefly described as under:
The location based exemption
In order to boost industrial and economic development in undeveloped regions, provided certain conditions are met, profits of newly established undertakings located in certain areas in India may benefit from tax holiday under Section 80IC of the Income Tax Act, 1961. Such tax holiday works to exempt 100% of the profits for the first five years from the commencement of the tax holiday, and 30% of profits for the subsequent five years. This deduction is available only for units established up to 31 March 2012. However, such undertaking would continue to be subject to the Minimum Alternative tax (‘MAT’).
In the current year, undertaking at Pantnagar, which is part of Hindustan Zinc Limited (Zinc India), is the only unit eligible for deduction at 30% of taxable profit.
The location based exemption: SEZ Operations
In order to boost industrial development and exports, provided certain conditions are met, profits of undertaking located in Special Economic Zone (‘SEZ’) may benefit from tax holiday. Such tax holiday works to exempt 100% of the profits for the first five years from the commencement of the tax holiday, 50% of profits for five years thereafter and 50% of the profits for further five years provided the amount allowable in respect of deduction is credited to Special Economic Zone Re-Investment Reserve account. However, such undertaking would continue to be subject to the Minimum Alternative tax (‘MAT’).
The Group has setup SEZ Operations in its aluminium division of Vedanta Limited (where no benefit has been drawn).
Sectoral Benefit – Power Plants and Port Operations
To encourage the establishment of infrastructure certain power plants and ports have been offered income tax exemptions of up to 100% of profits and gains for any ten consecutive years within the 15 year period following commencement of operations subject to certain conditions under Section 80IA of the Income Tax Act, 1961. The Group currently has total operational capacity of 8.4 Giga Watts (GW) of thermal based power generation facilities and wind power capacity of 274 Mega Watts (MW) and port facilities. However, such undertakings would continue to be subject to MAT provisions.
The Group has power plants which benefit from such deductions, at various locations of Hindustan Zinc Limited (where such benefits has been drawn), Talwandi Sabo Power Limited, Vedanta Limited and Bharat Aluminium Company Limited (where no benefit has been drawn).
The Group operates a zinc refinery in Export Processing Zone, Namibia which has been granted tax exempt status by the Namibian government.
In addition, the subsidiaries incorporated in Mauritius are eligible for tax credit to the extent of 80% of the applicable tax rate on foreign source income.
VEDANTA LIMITED | INTEGRATED REPORT AND ANNUAL ACCOUNTS 2020-21 | 469
CONSOLIDATED CONTINUED...
Notes
forming part of the consolidated financial statements as at and for the year ended 31 March 2021
The total effect of such tax holidays and exemptions was ₹771 crores for the year ended 31 March 2021 (31 March 2020: ₹501 crores)
(c) Deferred tax assets/liabilities
The Group has accrued significant amounts of deferred tax. The majority of the deferred tax liability represents accelerated tax relief for the depreciation of property, plant and equipment, the depreciation of mining reserves and the fair value uplifts created on acquisitions, net of losses carried forward by the Group and unused tax credits in the form of MAT credits carried forward in the Group. Significant components of Deferred tax (assets) and liabilities recognised in the consolidated balance sheet are as follows:
For the year ended 31 March 2021
| (₹ in crores) | ||||||||||||||||||||||||||||
Significant components of Deferred tax | Opening balance as to at 01 April 2020 | Charged/ (credited) statement of profit or loss | Charged/ (credited) to other comprehensive income | Charged to equity | Deferred tax on Acquisition through business combination (Refer Note 4) | Exchange difference transferred to translation of foreign operation | Closing balance as at 31 March 2021 | |||||||||||||||||||||
Property, Plant and Equipment | 9,182 | 279 | — | — | 50 | 172 | 9,683 | |||||||||||||||||||||
Voluntary retirement scheme | (29 | ) | (25 | ) | — | — | — | — | (54 | ) | ||||||||||||||||||
Employee benefits | (186 | ) | (22 | ) | 11 | 32 | — | (9 | ) | (174 | ) | |||||||||||||||||
Fair valuation of derivative asset/ liability | (20 | ) | 9 | (26 | ) | — | — | — | (37 | ) | ||||||||||||||||||
Fair valuation of other asset/ liability | | 970 | | | (242 | ) | | 1 | | | — | | | — | | | (28 | ) | | 701 | | |||||||
MAT credit entitlement | (9,122 | ) | 862 | 25 | — | — | 3 | (8,232 | ) | |||||||||||||||||||
Unabsorbed depreciation and business losses | (5,482 | ) | 784 | — | — | — | — | (4,698 | ) | |||||||||||||||||||
Taxes on distributable reserve of subsidiary | 1,582 | (1,582 | ) | — | — | — | — | — | ||||||||||||||||||||
Other temporary differences | (899 | ) | 51 | 35 | — | 10 | (31 | ) | (834 | ) | ||||||||||||||||||
|
|
|
|
|
|
|
|
|
|
|
|
|
| |||||||||||||||
Total | (4,004 | ) | 114 | 46 | 32 | 60 | 107 | (3,645 | ) | |||||||||||||||||||
|
|
|
|
|
|
|
|
|
|
|
|
|
| |||||||||||||||
| For the year ended 31 March 2020 |
| |||||||||||||||||||||||||||
| (₹ in crores) | ||||||||||||||||||||||||||||
Significant components of Deferred tax | Opening balance as at 01 April 2019 | Charged/ (credited) to statement of profit or loss | Charged/ (credited) to other comprehensive income | Charged/ (credited) to equity | Deferred tax on Acquisition through business combination | Exchange difference transferred to translation of foreign operation | Closing balance as at 31 March 2020 | |||||||||||||||||||||
Property, Plant and Equipment | 15,958 | (6,783 | ) | — | — | — | 7 | 9,182 | ||||||||||||||||||||
Voluntary retirement scheme | (40 | ) | 11 | — | — | — | — | (29 | ) | |||||||||||||||||||
Employee benefits | (120 | ) | 1 | (71 | ) | — | — | 4 | (186 | ) | ||||||||||||||||||
Fair valuation of derivative asset/ liability | (45 | ) | (7 | ) | 32 | — | — | — | (20 | ) | ||||||||||||||||||
Fair valuation of other asset/ liability | 820 | 91 | 1 | — | — | 58 | 970 | |||||||||||||||||||||
MAT credit entitlement | (10,321 | ) | 910 | 23 | 252 | — | 14 | (9,122 | ) | |||||||||||||||||||
Unabsorbed depreciation and tax losses | (4,560 | ) | (922 | ) | — | — | — | — | (5,482 | ) | ||||||||||||||||||
Taxes on distributable reserve of subsidiary | — | 1,582 | — | — | — | — | 1,582 | |||||||||||||||||||||
Other temporary differences | (683 | ) | (187 | ) | (58 | ) | — | — | 29 | (899 | ) | |||||||||||||||||
|
|
|
|
|
|
|
|
|
|
|
|
|
| |||||||||||||||
Total | 1,009 | (5,304 | ) | (73 | ) | 252 | — | 112 | (4,004 | ) | ||||||||||||||||||
|
|
|
|
|
|
|
|
|
|
|
|
|
| |||||||||||||||
470
| < BACK TO CONTENTS | Integrated Report | Statutory reports | Financial statements |
Notes
forming part of the consolidated financial statements as at and for the year ended 31 March 2021
Deferred tax assets and liabilities have been offset where they arise in the same taxing jurisdiction with a legal right to offset current income tax assets against current income tax liabilities but not otherwise. Accordingly the net deferred tax (assets)/liability has been disclosed in the Consolidated Balance Sheet as follows:
| (₹ in crores) | ||||||||
| Particulars | As at 31 March 2021 | As at 31 March 2020 | ||||||
Deferred tax assets | (5,860 | ) | (6,889 | ) | ||||
Deferred tax liabilities | 2,215 | 2,885 | ||||||
|
|
|
| |||||
Net Deferred tax (assets)/Liabilities | (3,645 | ) | (4,004 | ) | ||||
|
|
|
| |||||
Recognition of deferred tax assets on MAT credit entitlement is based on the respective legal entity’s present estimates and business plans as per which the same is expected to be utilised within the stipulated fifteen year period from the date of origination (Refer note 3(c)(A)(vi)).
Deferred tax assets in the Group have been recognised to the extent there are sufficient taxable temporary differences relating to the same taxation authority and the same taxable entity which are expected to reverse. For certain components of the Group, deferred tax assets on carry forward unused tax losses have been recognised to the extent of deferred tax liabilities on taxable temporary differences available. It is expected that any reversals of the deferred tax liability would be offset against the reversal of the deferred tax asset at respective entities.
Unused tax losses/unused tax credit for which no deferred tax asset has been recognised amount to ₹10,153 crores and ₹17,658 crores as at 31 March 2021 and 31 March 2020 respectively.
As at 31 March 2021
| (₹ in crores) | ||||||||||||||||||||
Unused tax losses/unused tax credit | Within one year | Greater than one year, less than five years | Greater than five years | No expiry date | Total | |||||||||||||||
Unutilised business losses | 197 | 2,222 | 3,075 | 1,887 | 7,381 | |||||||||||||||
Unabsorbed depreciation | 10 | 101 | 298 | 2,353 | 2,762 | |||||||||||||||
Unutilised R&D credit | — | — | — | 10 | 10 | |||||||||||||||
|
|
|
|
|
|
|
|
|
| |||||||||||
Total | 207 | 2,323 | 3,373 | 4,250 | 10,153 | |||||||||||||||
|
|
|
|
|
|
|
|
|
| |||||||||||
| As at 31 March 2020 | ||||||||||||||||||||
| (₹ in crores) | ||||||||||||||||||||
Unused tax losses/unused tax credit | Within one year | Greater than one year, less than five years | Greater than five years | No expiry date | Total | |||||||||||||||
Unutilised business losses | 555 | 2,588 | 4,916 | 1,574 | 9,633 | |||||||||||||||
Unabsorbed depreciation | — | — | — | 8,016 | 8,016 | |||||||||||||||
Unutilised R&D credit | — | — | — | 9 | 9 | |||||||||||||||
|
|
|
|
|
|
|
|
|
| |||||||||||
Total | 555 | 2,588 | 4,916 | 9,599 | 17,658 | |||||||||||||||
|
|
|
|
|
|
|
|
|
| |||||||||||
No deferred tax assets has been recognised on these unused tax losses/unused tax credit as there is no evidence that sufficient taxable profit will be available in future against which these can be utilised by the respective entities.
MAT credits are taxes paid to Indian tax authorities which can be offset against future tax liabilities, subject to certain restrictions, within a period of 15 years from the year of origination. The Group recognises MAT assets only to the extent it expects to realise the same within the prescribed period.
VEDANTA LIMITED | INTEGRATED REPORT AND ANNUAL ACCOUNTS 2020-21 | 471
CONSOLIDATED CONTINUED...
Notes
forming part of the consolidated financial statements as at and for the year ended 31 March 2021
Further, the Group had unused MAT credit amounting to ₹400 crores as at 31 March 2020. Such tax credits were not been recognised on the basis that recovery is not probable in the foreseeable future. However, As per the amendments to the tax laws in September, 2019, a new tax provision has been introduced whereby a company can claim the benefits of reduced tax rates, provided it forgoes certain incentives/exemptions under Income Tax Act, 1961. One of the subsidiaries of the group has opted for the same and foregoes the unrecognised MAT Credit for the earlier years. Unrecognised MAT credit expires, if unutilised, based on the year of origination was as follows:
| (₹ in crores) | ||||||||
| Year of Expiry | As at 31 March 2021 | As at 31 March 2020 | ||||||
2022 | — | 104 | ||||||
2023 | — | 14 | ||||||
2024 | — | 52 | ||||||
2025 | — | 52 | ||||||
2026 | — | 103 | ||||||
2027 | — | 63 | ||||||
2028 | — | 8 | ||||||
2029 | — | 4 | ||||||
|
|
|
| |||||
Total | — | 400 | ||||||
|
|
|
| |||||
The Group has not recognised any deferred tax liabilities for taxes that would be payable on the Group’s share in unremitted earnings of certain of its subsidiaries because the Group controls when the liability will be incurred and it is probable that the liability will not be incurred in the foreseeable future. The amount of unremitted earnings are ₹32,240 crores and ₹33,618 crores as at 31 March 2021 and 31 March 2020 respectively.
(d) Non-current tax assets
Non-current tax assets of ₹2,748 crores (31 March 2020: ₹2,645 crores) mainly represents income tax receivable from Indian tax authorities by Vedanta Limited relating to the refund arising consequent to the Scheme of Amalgamation & Arrangement made effective in August 2013 pursuant to approval by the jurisdiction High Court and receivables relating to matters in tax disputes in Group companies including tax holiday claim.
(e) The tax department had raised demands on account of remeasurement of certain tax incentives, as described above, under Section 80IA and 80 IC of the Income tax Act. During the current year, based on the favourable orders from Income Tax Appellate Tribunal relating to AY 09-10 to AY 12-13, the Commissioner of Income Tax (Appeals) has allowed these claims for AY 14-15 to AY 15-16, which were earlier disallowed and has granted refund of amounts deposited under protest. Against the Tribunal order, department had filed an appeal in Hon’ble Rajasthan High Court in financial year 17-18 which is yet to be admitted. As per the view of external legal counsel, Department’s appeal seeks re-examination of facts rather than raising any substantial question of law and hence it is unlikely that appeal will be admitted by the High Court. Due to this there is a strong prima facie case that ITAT order will stand confirmed and department’s appeal would be dismissed. The amount involved in this dispute as of 31 March 2021 is ₹11,271 crores (31 March 2020: ₹10,566 crores) plus applicable interest up to the date of settlement of the dispute.
36 EARNINGS PER EQUITY SHARE (EPS)
| (₹ in crores except otherwise stated) | ||||||||||
Particulars | Year ended 31 March 2021 | ended 31 March 2020 | ||||||||
Profit/(Loss) after tax attributable to equity share holders for Basic and Diluted EPS | A | 11,602 | (6,664 | ) | ||||||
Computation of weighted average number of shares (in crores) | ||||||||||
Weighted average number of ordinary shares outstanding during the year excluding shares acquired for ESOP for basic earnings per share | B | 370.42 | 370.26 | |||||||
Effect of dilution: | ||||||||||
Potential ordinary shares relating to share option awards * | 2.33 | 2.12 | ||||||||
Adjusted weighted average number of shares of the Company in issue | C | 372.75 | 370.26 | |||||||
Basic earnings/(loss) per equity share (₹) | A/B | 31.32 | (18.00 | ) | ||||||
Diluted earnings/(loss) per equity share (₹) | A/C | 31.13 | (18.00 | ) | ||||||
Nominal Value per Share (in ₹) | 1.00 | 1.00 | ||||||||
| * | Potential dilutive shares have been considered as anti dilutive for year ended 31 March 2020. |
472
| < BACK TO CONTENTS | Integrated Report | Statutory reports | Financial statements |
Notes
forming part of the consolidated financial statements as at and for the year ended 31 March 2021
| 37 | DISTRIBUTIONS MADE AND PROPOSED |
| �� | (₹ in crores) | |||||||
| Particulars | Year ended 31 March 2021 | Year ended 31 March 2020 | ||||||
Amounts recognised as distributions to equity share holders: | ||||||||
Interim dividend (31 March 2021: ₹9.50/- per share, 31 March 2020: ₹3.90/- per share) | 3,519 | 1,444 | ||||||
Dividend distribution tax (DDT) on above | — | 252 | ||||||
|
|
|
| |||||
| 3,519 | 1,696 | |||||||
|
|
|
| |||||
| 38 | COMMITMENTS, CONTINGENCIES AND GUARANTEES |
| A) | Commitments |
The Group has a number of continuing operational and financial commitments in the normal course of business including:
| • | Exploratory mining commitments; |
| • | Oil & gas commitments; |
| • | Mining commitments arising under production sharing agreements; and |
| • | Completion of the construction of certain assets. |
| a) | Estimated amount of contracts remaining to be executed on capital accounts and not provided for: |
| (₹ in crores) | ||||||||
Particulars | As at 31 March 2021 | As at 31 March 2020 | ||||||
Oil & Gas sector | ||||||||
Cairn India | 1,555 | 3,360 | ||||||
Aluminium sector | ||||||||
Lanjigarh Refinery (Phase II) | 1,188 | 1,573 | ||||||
Jharsuguda 1.25 MTPA smelter | 463 | 414 | ||||||
Zinc sector | ||||||||
Zinc India (mines expansion and smelter) | 362 | 912 | ||||||
Gamsberg mining & milling project | 94 | 131 | ||||||
Copper sector | ||||||||
Tuticorin Smelter 400 KTPA* | 2,995 | 2,791 | ||||||
Others | 1,872 | 1,611 | ||||||
|
|
|
| |||||
Total | 8,529 | 10,792 | ||||||
|
|
|
| |||||
| * | currently contracts are under suspension under the force majeure clause as per the contract. |
| b) | Committed work programme (Other than capital commitment): |
| (₹ in crores) | ||||||||
Particulars | As at 31 March 2021 | As at 31 March 2020 | ||||||
Oil & Gas sector | ||||||||
Cairn India (OALP – New Oil and Gas blocks) | 5,625 | 5,841 | ||||||
VEDANTA LIMITED | INTEGRATED REPORT AND ANNUAL ACCOUNTS 2020-21 | 473
CONSOLIDATED CONTINUED...
Notes
forming part of the consolidated financial statements as at and for the year ended 31 March 2021
| c) | Other Commitments |
| (i) | Power Division of the Company has signed a long- term power purchase agreement (PPA) with Gridco Limited for supply of 25% of power generated from the power station with additional right to purchase power (5%/7%) at variable cost as per the conditions referred to in PPA . The PPA has a tenure of twenty five years, expiring in FY2037. |
| (ii) | TSPL has signed a long-term power purchase agreement (PPA) with Punjab State Power Corporation Limited (PSPCL) for supply of power generated from the power plant. The PPA has tenure of twenty five years, expring in FY2042. |
| B) | Guarantees |
The aggregate amount of indemnities and other guarantees on which the Group does not expect any material losses, was ₹6,281 crores (31 March 2020: ₹6,487 crores).
| a) | Guarantees and bonds advanced to the customs authorities in India of ₹648 crores relating to the export and payment of import duties on purchases of raw material and capital goods (31 March 2020: ₹471 crores). |
| b) | Guarantees issued for Group’s share of minimum work programme commitments of ₹2,889 crores (31 March 2020: ₹2,906 crores). |
| c) | Guarantees of ₹79 crores issued under bid bond (31 March 2020: ₹54 crores). |
| d) | Bank guarantees of ₹115 crores (31 March 2020: ₹115 crores) has been provided by the Group on behalf of Volcan Investments Limited to Income tax department, India as a collateral in respect of certain tax disputes. |
| e) | Other guarantees worth ₹2,550 crores (31 March 2020: ₹2,941 crores) issued for securing supplies of materials and services, in lieu of advances received from customers, litigation, for provisional valuation of custom duty and also to various agencies, suppliers and government authorities for various purposes. The Group does not anticipate any liability on these guarantees. |
| C) | Export Obligations |
The Indian entities of the Group have export obligations of ₹2,165 crores (31 March 2020: ₹3,827 crores) on account of concessional rates of import duty paid on capital goods under the Export Promotion Capital Goods Scheme and under the Advance Licence Scheme for the import of raw material laid down by the Government of India.
In the event of the Group’s inability to meet its obligations, the Group’s liability would be ₹353 crores (31 March 2020: ₹607 crores) reduced in proportion to actual exports, plus applicable interest.
The Group has given bonds of ₹1,775 crores (31 March 2020: ₹1,695 crores) to custom authorities against these export obligations.
| D) | Contingent Liabilities |
| a) | Hindustan Zinc Limited (HZL): Department of Mines and Geology |
The Department of Mines and Geology of the State of Rajasthan issued several show cause notices to HZL in August, September and October 2006 aggregating ₹334 crores claiming unlawful occupation and unauthorised mining of associated minerals other than zinc and lead at HZL’s Rampura Agucha, Rajpura Dariba and Zawar mines in Rajasthan during the period from July 1968 to March 2006. In response, HZL filed a writ petition against these show cause notices before the High Court of Rajasthan in Jodhpur. In October 2006, the High Court issued an order granting a stay and restrained the Department of Mines and Geology from undertaking any coercive measures to recover the penalty. In January 2007, the High Court issued another order granting the Department of Mines and Geology additional time to file their reply and also ordered the Department of Mines and Geology not to issue any orders cancelling the lease. The State Government filed for an early hearing application in the High Court. The High Court has passed an order rejecting the application stating that Central Government should file their replies. HZL believes it is unlikely that the claim will lead to a future obligation and thus no provision has been made in the financial statements.
| b) | Vedanta Limited: Income tax |
Vedanta Limited (notice was served on Cairn India Limited which subsequently merged with Vedanta Limited, accordingly now referred to as Vedanta Limited/ Company) received a demand totalling ₹20,495 crores (including interest of ₹10,247 crores) holding the Company as ‘assessee in default’ as per Section 201 of Indian Income Tax Act. The Group has challenged the said order and presently pending before the Income Tax Appellate Tribunal (ITAT).
The Group also filed a writ petition before the Delhi High Court wherein it has raised several grounds against the order said order. The matter came up for hearing on 05 February 2020 before Delhi High Court but adjourned and the next date of hearing is 29 July 2021.
Separately, Vedanta Resources Limited has filed a Notice of Claim against the Government of India (‘GOI’) under the BIT. Hearing already concluded in May 2019 and award awaited.
474
| < BACK TO CONTENTS | Integrated Report | Statutory reports | Financial statements |
Notes
forming part of the consolidated financial statements as at and for the year ended 31 March 2021
Separately Cairn UK Holdings Limited (“CUHL”), on whom the primary liability of income tax lies, had received an Order from the ITAT in the financial year 2016-17 holding that the transaction is taxable in view of the clarificatory amendment in the Act but also acknowledged that amendment being a retrospective transaction, interest would not be levied. Hence affirming a demand of ₹10,247 crores excluding the interest portion that had previously been claimed. Against this demand Tax authorities have recovered ₹5,863 crores from the CUHL and thus reducing the liability to ₹4,389 crores. Vedanta has also paid interim dividend of ₹5 crores to the Tax authorities and thus reducing the liability to ₹4,384 crores (31 March 2020: ₹4,384 crores).
In related proceedings, the International Arbitration Tribunal ruled unanimously in the case of Cairn Energy Plc that India had breached its obligations under the UK-India Bilateral Investment Treaty (the BIT). The Group understands that Government of India has challenged the ruling before the International Court of Justice at The Hague. As the Cairn Energy Plc Arbitration award received on 23 December 2020 regarding retrospective tax will have a direct influence upon the Group’s case, due to the fact that primary liability of paying the income tax is CUHL’s and in this case there is expected to be no income tax liability in the hands of CUHL, the claim of amounts assessed as in default against the Group should be eliminated. Further going by the recent ruling of Supreme court in an another unrelated matter, it was held that person under sec 195 can’t be held responsible to do impossible in case of retrospective act. Thus it was impossible for Vedanta Limited (successor in the business of Cairn India Limited) to deduct income tax and can’t be held responsible for default under Section 201. The Group believes that owing to the similarity in the facts of the case it has a good case to argue and accordingly it is unlikely that any liability will devolve upon the group.
| c) | Ravva Joint Operations arbitration proceedings |
ONGC Carry
The Ravva Production Sharing Contract (PSC) obliges the contractor parties to pay a proportionate share of
ONGC’s exploration, development, production and contract costs in consideration for ONGC’s payment of costs related to the construction and other activities it conducted in Ravva prior to the effective date of the Ravva PSC (the ONGC Carry). The question as to how the ONGC Carry is to be recovered and calculated, along with other issues, was submitted to an International Arbitration Tribunal in August 2002 which rendered a decision on the ONGC Carry in favour of the contractor parties (including Vedanta Limited (Cairn India Limited which subsequently merged with Vedanta Limited, accordingly now referred to as Vedanta Limited)) whereas four other issues were decided in favour of Government of India (GOI) in October 2004 (Partial Award).
The GOI then proceeded to challenge the ONGC Carry decision before the Malaysian courts, as Kuala Lumpur was the seat of the arbitration. The Federal Court of Malaysia upheld the Partial Award. As the Partial Award did not quantify the sums, therefore, contractor parties approached the same Arbitration Tribunal to pass a Final Award in the subject matter since it had retained the jurisdiction to do so. The Arbitral Tribunal was reconstituted and the Final Award was passed in October 2016 in Company’s favour. GOI’s challenge of the Final Award has been dismissed by the Malaysian High Court and the next appellate court in Malaysia i.e. Malaysian Court of Appeal. GOI then filed an appeal at Federal Court of Malaysia. The matter was heard on 28 February 2019 and the Federal Court dismissed GOI’s leave to appeal. The Company has also filed for the enforcement of the Partial Award and Final Award before the Hon’ble Delhi High Court. The matter is now listed for hearing on
13 July 2021.
Base Development Cost
Ravva joint operations had received a claim from the Ministry of Petroleum and Natural Gas, Government of India (GOI) for the period from 2000-2005 for ₹946 crores (US$129 million) for an alleged underpayment of profit petroleum (by recovering higher Base Development Costs (“BDC”) against the cap imposed in the PSC) to the Government of India (GOI), out of which, Vedanta Limited’s (Cairn India Limited which subsequently merged with Vedanta Limited, accordingly now referred to as Vedanta Limited) share will be ₹213 crores (US$29 million) plus interest. Joint venture partners initiated the arbitration proceedings and Arbitration Tribunal published the Award in January 2011 allowing claimants (including the Company) to recover the development costs spent to the tune of ₹2,038 crores (US$278 million) and disallowed over run of ₹161 crores (US$22 million) spent in respect of BDC along with 50% legal costs. Finally, Supreme Court of India on 16 September 2020 pronounced the order in favour of Vedanta, rejecting all objections of the GOI and allowed enforcement of the Arbitration Award. With the Supreme Court order the Ravva BDC Matter stands closed.
VEDANTA LIMITED | INTEGRATED REPORT AND ANNUAL ACCOUNTS 2020-21 | 475
CONSOLIDATED CONTINUED...
Notes
forming part of the consolidated financial statements as at and for the year ended 31 March 2021
In connection with the above two matters, the Company has received an order dated 22 October 2018 from the GOI directing oil marketing companies (OMCs) who are the offtakers of Ravva Crude to divert the sale proceeds to GOI’s account. GOI alleges that the Ravva Joint Operations (consisting of four joint venture partners) has short paid profit petroleum of ₹2,302 crores (US$314 million) (the Company’s share approximately - ₹682 crores (US$93 million)) on account of the two disputed issues of ONGC Carry and BDC matters, out of which ₹469 crores (US$64 million) pertains to ONGC Carry and ₹213 crores (US$29 million) pertains to BDC Matter. Against an interim application filed by the Company along with one of its joint venture partner for seeking stay of such action from GOI before the Hon’ble Delhi High Court, the Court directed the OMCs to deposit above sums to the Delhi High Court for both BDC and ONGC Carry matters. However, the Company (and other joint venture partner) has been given the liberty to seek withdrawal of the amounts from the Court upon furnishing a bank guarantee of commensurate value. On the basis of the above direction, the OMC’s have deposited ₹682 crores (US$93 million) out of which ₹616 crores (US$84 million) has been withdrawn post submission of bank guarantee. The Hon’ble Delhi High Court vide its order dated 28 May 2020 read with order dated 04 June 2020 has directed that all future sale proceeds of Ravva Crude w.e.f. 05 June 2020 be paid directly to Vedanta Limited by the OMCs. In view of the closure of the BDC matter, the Company has also filed an application in HC on 22 September 2020 seeking refund of remaining ₹66 crores (US$9 million) and release of bank guarantees submitted in Court pertaining to the BDC matter, out of which ₹147 crores (US$20 million) have since been received by Vedanta.
During the proceedings of the above matter, GOI has also filed an interim application seeking deposit by the said OMCs of an amount of ₹638 crores (US$87 million) (Company’s share of ₹410 crores (US$56 million)) towards interest on the alleged short payment of profit petroleum by the petitioners i.e. the Company (and other joint venture partner). The matter has been listed for hearing on 13 July 2021 along with ONGC carry case.
While the Company does not believe the GOI will be successful in its challenge, if the Arbitral Awards in above matters are reversed and such reversals are binding, Company would be liable for approximately ₹469 crores (US$64 million) plus interest. (31 March 2020: ₹479 crores (US$64 million) plus interest).
| d) | Proceedings related to the imposition of entry tax |
Vedanta Limited and other Group companies i.e. Bharat Aluminium Company Limited (BALCO) and Hindustan Zinc Limited (HZL) challenged the constitutional validity of the local statutes and related notifications in the states of Odisha and Rajasthan pertaining to the levy of entry tax on the entry of goods brought into the respective states from outside.
Post some contradictory orders of High Courts across India adjudicating on similar challenges, the Supreme Court referred the matters to a nine judge bench. Post a detailed hearing, although the bench rejected the compensatory nature of tax as a ground of challenge, it maintained status quo with respect to all other issues which have been left open for adjudication by regular benches hearing the matters.
Following the order of the nine judge bench, the regular bench of the Supreme Court proceeded with hearing the matters. The regular bench remanded the entry tax matters relating to the issue of discrimination against domestic goods bought from other States to the respective High Courts for final determination but retained the issue of jurisdiction for levy on imported goods, for determination by the regular bench of the Supreme Court. Following the order of the Supreme Court, the Group filed writ petitions in respective High Courts.
On 09 October 2017, the Supreme Court has held that states have the jurisdiction to levy entry tax on imported goods. With this Supreme Court judgement, imported goods will rank pari-passu with domestic goods for the purpose of levy of Entry tax. Vedanta Limited and its subsidiaries have amended their appeals (writ petitions) in Odisha and Chhattisgarh to include imported goods as well.
The issue pertaining to the levy of entry tax on the movement of goods into a Special Economic Zone (SEZ) remains pending before the Odisha High Court. The Group has challenged the levy of entry tax on any movement of goods into SEZ based on the definition of ‘local area’ under the Odisha Entry Tax Act which is very clear and does not include a SEZ. In addition, the Government of Odisha further through its SEZ Policy 2015 and the operational guidelines for administration of this policy dated 22 August 2016, exempted the entry tax levy on SEZ operations.
The total claims against Vedanta Limited and its subsidiaries are ₹1,412 crores (31 March 2020: ₹1,366 crores) net of provisions made.
| e) | BALCO: Challenge against imposition of Energy Development Cess |
BALCO challenged the imposition of Energy Development Cess levied on generators and distributors of electrical energy @ 10 paise per unit on the electrical energy sold or supplied before the High Court on the grounds that the Cess is effectively on production and not on consumption or sale since the figures of consumption are not taken into account and the Cess is discriminatory since captive power plants are required to pay @ 10 paise while the State Electricity Board is required to pay @ 5 paise. The High Court of Chhattisgarh by order dated 15 December 2006 declared the provisions imposing ED Cess on CPPs as discriminatory and therefore ultra vires the Constitution. BALCO has sought refund of ED Cess paid till March 2006 amounting to ₹35 crores.
476
| < BACK TO CONTENTS | Integrated Report | Statutory reports | Financial statements |
Notes
forming part of the consolidated financial statements as at and for the year ended 31 March 2021
The State of Chhattisgarh moved an SLP in the Supreme Court and whilst issuing notice has stayed the refund of the Cess already deposited and the Supreme Court has also directed the State of Chhattisgarh to raise the bills but no coercive action be taken for recovery for the same. Final argument in this matter started before the Supreme Court. In case the Supreme Court overturns the decision of the High Court, the Group would be liable to pay an additional amount of ₹930 crores (31 March 2020: ₹841 crores). Accordingly the total exposure on the Group would be ₹965 crores (31 March 2020: ₹876 crores).
| f) | Miscellaneous disputes – Income tax |
The Group is involved in various tax disputes amounting to ₹1,966 crores (31 March 2020: ₹1,909 crores) relating to income tax. It also includes similar matters where initial assessment is pending for subsequent periods and where the Group has made claims and assessments are in progress. These mainly relate to the disallowance of tax holiday for 100% Export Oriented Undertaking under Section 10B of the Income Tax Act, 1961, disallowance of tax holiday benefit on production of gas under Section 80IB of the Income Tax Act, 1961, on account of depreciation disallowances under the Income Tax Act and interest thereon which are pending at various appellate levels. Interest and penalty, if any would be additional. Refer note 35 for other income tax disputes.
The Group believes that these disallowances are not tenable and accordingly no provision is considered necessary.
| g) | Miscellaneous disputes – Others |
The Group is subject to various claims and exposures which arise in the ordinary course of conducting and financing its business from the excise, indirect tax authorities and others. These claims and exposures mostly relate to the assessable values of sales and purchases or to incomplete documentation supporting the companies’ returns or other claims.
The approximate value of claims (excluding the items as set out separately above) against the Group companies total ₹4,782 crores (31 March 2020: ₹3,996 crores).
Based on evaluations of the matters and legal advice obtained, the Group believes that it has strong merits in its favour. Accordingly, no provision is considered at this stage.
Except as described above, there are no pending litigations which the Group believes could reasonably be expected to have a material adverse effect on the results of operations, cash flows or the financial position of the Group.
| 39 | OTHER MATTERS |
a) The Company is purchasing bauxite under long-term linkage arrangement with Orissa Mining Corporation Ltd. (hereafter referred as OMC) at provisional price of ₹1,000/MT from October 2020 onwards based on interim order dated 08 October 2020 of the Hon’ble High Court of Odisha, which is subject to final outcome of the writ petition filed by the Company as mentioned below.
The last successful e-auction based price discovery was done by OMC in April 2019 at INR 673/MT and supplied bauxite at this rate from Sep 2019 to Sep 2020 against an undertaking furnished by the Company to compensate any differential price discovered through future successful national e-auctions. Though OMC conducted the next e-auction on 31 August 2020 with floor price of ₹1,707/MT determined on the basis of Rule 45 of Minerals Concession Rules, 2016 (hereafter referred as the Rules), no bidder participated at that floor price and hence the auction was not successful. However, OMC raised demand of ₹281 crores on the Company towards differential pricing and interest for bauxite supplied till Sep 2020 considering the auction base price of INR 1,707/MT.
The Company had then filed a writ petition before Hon’ble High Court of Odisha in September 2020 for resumption of bauxite supply in accordance with applicable Government of Odisha Gazette notification dated 24 February 2018. Hon’ble High Court has issued interim Order dated 08 October 2020 directing that the petitioner shall be permitted to lift the quantity of bauxite mutually agreed under the terms of the long-term linkage arrangement for the remaining period of the financial year 2020-21 on payment of ₹1,000/MT and furnishing an undertaking for the differential amount, with the floor price arrived at by OMC under the rules, along with applicable interest, subject to final outcome of the writ petition.
OMC re-conducted e-auction on March 9, 2021 with floor price of ₹2,011/MT determined on the basis of the Rules. However, again as no bidder participated at that floor price, the auction was not successful. On 18 March 2021, Cuttack HC issued an order disposing off the writ petition, directing that the current arrangement of bauxite price @ 1000/T will continue for the FY2021-22.
VEDANTA LIMITED | INTEGRATED REPORT AND ANNUAL ACCOUNTS 2020-21 | 477
CONSOLIDATED CONTINUED...
Notes
forming part of the consolidated financial statements as at and for the year ended 31 March 2021
Supported by legal opinions obtained, management believes that the provisions of Rule 45 of Minerals Concession Rules, 2016 are not applicable to commercial sale of bauxite ore and hence, it is not probable that the Company will have any financial obligation towards the aforesaid commitments over and above the price of ₹673/MT discovered vide last successful e-auction. Accordingly, the Company has not recognised above referred OMC debit note of ₹281 crores in respect of bauxite procured till September 2020 and further differential price of ₹130 crores for subsequent procurements from 01 October 2020 till 31 March 2021.
However, as an abundant precaution, the Company has recognised purchase of Bauxite from October 2020 onwards at the at the aforesaid rate of INR 1,000/MT in line with the Odisha High court interim order dated 08 October 2020.
b) In terms of various notifications issued by the Ministry of Environment, Forest and Climate Change (MoEF&CC), ash produced from thermal power plant is required to be disposed of by the Group in the manner specified in those notifications. However compliance with manner of disposal as specified in those notifications is not fully achieved due to lack of demand from user agencies. Consequently, the Group is storing some of the ash produced in ash dyke in accordance with conditions of the Environmental Clearance & Consent to Operate granted by the MOEF&CC & Odisha State Pollution Control Board & Chhattisgarh Environment Conservation Board (OSPCB & CECB) respectively while giving preference to supplying the same to user agencies. Management believes storage of ash in ash dykes/ash pond in accordance with environmental clearances received by the Group are sufficient compliance with the applicable notifications issued by MoEF&CC which is supported by a legal opinion obtained. The National Green Tribunal (NGT) has also taken cognisance of the matter and vide its order dated 12 February 2020 has ordered for levy of environmental compensation on generating companies on account of their failure to comply the aforesaid notifications. The Group has filed SLPs before the Hon’ble Supreme Court challenging the order of the NGT and the same was heard by the Court on 11 September 2020 and granted an ad interim stay against recoveries in pursuance of NGT order. Management believes that the outcome of the appeal will not have any significant adverse financial impact on the Group which is supported by a legal opinion obtained.
c) The Department of Mines and Geology (DMG) of the State of Rajasthan initiated the royalty assessment process from January 2008 to 2019 and issued a show cause notice vide an office order dated 31 January 2020 amounting to ₹1,925 croress, further an additional demand was issued vide an office order dated 14 December 2020 for ₹311 croress on similar questions of law. The Company has challenged the show cause notice and computation mechanism of the royalty on the ground that the state has not complied with the previous orders of Rajasthan High court where a similar computation mechanism was challenged and court had directed DMG to reassess basis the judicial precedents and mining concession rules. Pending compliance of previous orders, High court has granted a stay on the notice and directed DMG not to take any coercive action. State Government has also been directed to not take any coercive action in order to recover such miscomputed dues. Based on the opinion of external counsel, the Company believes that it has strong grounds of a successful appeal, and the chances of an outcome which is not if favour of the Company is remote.
d) During the current year, the Company entered into a ₹10,000 crores long-term syndicated loan facility agreement. This loan is secured by the way of pledge over the shares held by the Company in Hindustan Zinc Limited (HZL) representing 14.82% of the paid up share capital of HZL along-with a non-disposal undertaking in respect of its shareholding in HZL to the extent of 50.1% of the paid up share capital of HZL. As at 31 March 2021, the principal amount participated for and outstanding under the facility is ₹8,650 crores.
e) The Scheme of Amalgamation and Arrangement amongst Sterlite Energy Limited (‘SEL’), Sterlite Industries (India) Limited (‘Sterlite’), Vedanta Aluminium Limited (‘VAL’), Ekaterina Limited (‘Ekaterina’), Madras Aluminium Company Limited (‘Malco’) and the Company (the “Scheme”) had been sanctioned by the Honourable High Court of Madras and the Honourable High Court of Judicature of Bombay at Goa and was given effect to in the year ended 31 March 2014.
Subsequently the above orders of the honourable High Court of Bombay and Madras have been challenged by Commissioner of Income Tax, Goa and Ministry of Corporate Affairs through a Special Leave Petition before the honourable Supreme Court and also by a creditor and a shareholder of the Company. The said petitions are currently pending for hearing.
f) i) Pursuant to the Government of India’s policy of disinvestment, the Company in April 2002 acquired 26% equity interest in Hindustan Zinc Limited (HZL) from the Government of India. Under the terms of the Shareholder’s Agreement (‘SHA’),the Company had two call options to purchase all of the Government of India’s shares in HZL at fair market value. The Company exercised the first call option on 29 August 2003 and acquired an additional 18.9% of HZL’s issued share capital. The Company also acquired an additional 20% of the equity capital in HZL through an open offer, increasing its shareholding to 64.9%. The second call option provides the Company the right to acquire the Government of India’s remaining 29.5% share in HZL. This call option was subject to the right of the Government of India to sell 3.5% of HZL shares to HZL employees.
478
| < BACK TO CONTENTS | Integrated Report | Statutory reports | Financial statements |
Notes forming part of the consolidated financial statements as at and for the year ended March 31, 2021
The Company exercised the second call option on 21 July 2009. The Government of India disputed the validity of the call option and refused to act upon the second call option. Consequently the Company invoked arbitration which is in the early stages. The next date of hearing is to be notified. The Government of India without prejudice to the position on the Put/Call option issue has received approval from the Cabinet for divestment and the Government is looking to divest through the auction route. Meanwhile, the Supreme Court has, in January 2016, directed status quo pertaining to disinvestment of Government of India’s residual shareholding in a public interest petition filed which is currently pending and sub-judice.
ii) Pursuant to the Government of India’s policy of divestment, the Company in March 2001 acquired 51% equity interest in BALCO from the Government of India. Under the terms of the SHA, the Company had a call option to purchase the Government of India’s remaining ownership interest in BALCO at any point from March 2, 2004. The Company exercised this option on March 19, 2004. However, the Government of India contested the valuation and validity of the option and contended that the clauses of the SHA violate the erstwhile Companies Act, 1956 by restricting the rights of the Government of India to transfer its shares and that as a result such provisions of the SHA were null and void. In the arbitration filed by the Company, the arbitral tribunal by a majority award rejected the claims of the Company on the ground that the clauses relating to the call option, the right of first refusal, the “tag along” rights and the restriction on the transfer of shares violate the erstwhile Companies Act, 1956 and are not enforceable.
The Company has challenged the validity of the majority award before the Hon’ble High Court at Delhi and sought for setting aside the arbitration award to the extent that it holds these clauses ineffective and inoperative. The Government of India also filed an application before the High Court to partially set aside the arbitral award in respect of certain matters involving valuation. The matter is currently scheduled for hearing by the Delhi High Court on 11 August 2020. Meanwhile, the Government of India without prejudice to its position on the Put/Call option issue has received approval from the Cabinet for divestment and the Government is looking to divest through the auction route.
On 9 January 2012, the Company offered to acquire the Government of India’s interests in HZL and BALCO for ₹15,492 crores and ₹1,782 crores respectively. This offer was separate from the contested exercise of the call options, and Company proposed to withdraw the ongoing litigations in relation to the contested exercise of the options should the offer be accepted. To date, the offer has not been accepted by the Government of India and therefore, there is no certainty that the acquisition will proceed.
In view of the lack of resolution on the options, the non-response to the exercise and valuation request from the Government of India, the resultant uncertainty surrounding the potential transaction and the valuation of the consideration payable, the Company considers the strike price of the options to be at the fair value, which is effectively nil, and hence the call options have not been recognised in the financial statements.
g) Flue-gas desulfurisation (FGD) implementation:
Ministry of Environment, Forest and Climate Change (MOEF&CC) has revised emission norms for coal- based power plants in India. Accordingly, both captive and independent coal-based power plants in India are required to comply with these revised norms for reduction of sulphur oxide (SOx) emissions for which the current plant infrastructure is to be modified or new equipment have to be installed. Timelines for compliance to the revised norm for various plants in the Group range from December 2023 to December 2024. Different power plants are at different stages of the implementation process.
Ministry of Power issued notification dated 02 July 2020 to restrict imports from China. Power China SEPCO1 has communicated their inability to execute the FGD project quoting aforementioned MOP notification and prevailing COVID situation in India. TSPL is proceeding with further steps for retendering the FGD project.
TSPL filed a petition before Punjab State Electricity Regulatory Commission (PSERC) for approval of MoEF notification as change in law in terms of Article 13 of PPA on 30 June 2017. PSERC vide its order dated 21 December 2018 has held that MoEF notification is not a change in law as it does not impose any new requirements. TSPL had filed an appeal before Hon’ble Appellate Tribunal for Electricity (APTEL) challenging the said order of PSERC. APTEL has pronounced the order 28 August 2020 in favour of TSPL allowing the cost pass through. PSPCL has filed an appeal against this order in Supreme Court.
VEDANTA LIMITED | INTEGRATED REPORT AND ANNUAL ACCOUNTS 2020-21 | 479
CONSOLIDATED CONTINUED ...
Notes
forming part of the consolidated financial statements as at and for the year ended March 31, 2021
| 40 | RELATED PARTY DISCLOSURES |
List of related parties and relationships
| A) | Entities controlling the Company (Holding Companies) |
Volcan Investments Limited (Volcan)
Volcan Investments Cyprus Limited
Intermediate Holding Companies
Finsider International Company Limited
Richter Holdings Limited
Twin Star Holdings Limited
Vedanta Resources Cyprus Limited
Vedanta Resources Finance Limited
Vedanta Resources Holdings Limited
Vedanta Resources Limited (formerly
Vedanta Resources Plc)
Welter Trading Limited
Westglobe Limited
Vedanta Holdings Mauritius II Limited(c)
| B) | Fellow subsidiaries |
(with whom transactions have taken place)
Konkola Copper Mines Plc (a)
Sterlite Iron and Steel Company Limited
Sterlite Power Transmission limited
Sterlite Technologies Limited
Sterlite Power Grid Ventures Limited
Twin Star Technologies Limited
| C) | Post retirement benefit plan |
BALCO Employees Provident Fund Trust
HZL Employee Group Gratuity Trust
HZL Superannuation Trust
Hindustan Zinc Ltd. Employees Contributory
Provident Fund Trust
Sesa Group Employees Gratuity Fund and Sesa Group Executives Gratuity Fund
Sesa Group Employees Provident Fund
Sesa Group Executives Superannuation Scheme Fund
Sesa Mining Corporation Limited Employees Gratuity Fund
Sesa Mining Corporation Limited Employees Provident Fund Trust
Sesa Resources Limited Employees Gratuity Fund
Sesa Resources Limited and Sesa Mining Corporation Limited
Employees Superannuation Fund
Sesa Resources Limited Employees Provident Fund Trust
FACOR Superannuation Trust (d)
FACOR Employees Gratuity Scheme (d)
| D) | Associates and Joint Ventures (with whom transactions have taken place) |
RoshSkor Township (Pty) Limited
Goa Maritime Private Limited
| E) | Others (with whom transactions have taken place) |
| i) | Enterprises over which key management personnel/their relatives have control or significant influence |
Cairn Foundation
Fujairah Gold Ghana
Janhit Electoral Trust
Sesa Community Development Foundation
Runaya Refinery LLP
Vedanta Foundation
Vedanta Medical Research Foundation
Minova Runaya Private Limited
| ii) | Enterprises which are Associates/Joint Ventures of entities under common control |
India Grid trust(b)
| (a) | Konkola Copper Mines Plc (KCM) ceased to be a related party w.e.f. 21 May 2019. The Company has total receivable of ₹211 crores (net of provision of ₹420 crores) as at 31 March 2021 (As at 31 March 2020 - ₹437 crores (net of provision of ₹207 crores)). |
| (b) | Ceased to be related party during the year ended 31 March 2020. |
| (c) | On 24 December 2020, Vedanta Holdings Mauritius II Limited purchased shares of Vedanta Limited (Refer note 15(c)(3). |
| (d) | Acquired during the year. |
Ultimate Controlling party
Vedanta Limited is a majority-owned and controlled subsidiary of Vedanta Resources Limited (‘VRL’). Volcan
Investments Limited (‘Volcan’) and its wholly-owned subsidiary together hold 100 % of the share capital and 100 % of the voting rights of VRL. Volcan is 100 % beneficially owned and controlled by the Anil Agarwal Discretionary Trust (‘Trust’). Volcan Investments Limited, Volcan Investments Cyprus Limited and other intermediate holding companies except VRL do not produce Group financial statements.
F) The Group enters into transactions with its related parties, including its parent Vedanta Resources Limited, and the companies over which it has significant influence. A summary of significant related party transactions for the year ended 31 March 2021 are noted below.
480
| < BACK TO CONTENTS | Integrated Report | Statutory reports | Financial statements |
Notes
forming part of the consolidated financial statements as at and for the year ended March 31, 2021
Transactions and balances with own subsidiaries are eliminated on consolidation.
| (₹ in crores) | ||||||||||||||||
Particulars | Entities controlling the Company/Fellow subsidiaries | Associates/ Joint ventures | Others | Total | ||||||||||||
| Income: | ||||||||||||||||
(i) Revenue from operations | 736 | — | 4 | 739 | ||||||||||||
(ii) Other income | ||||||||||||||||
a) Interest and guarantee commission (40(I)) | 670 | — | — | 670 | ||||||||||||
b) Outsourcing service fees | 4 | — | — | 4 | ||||||||||||
c) Dividend income | 2 | — | — | 2 | ||||||||||||
| Expenditure and other transactions: | ||||||||||||||||
(i) Purchase of goods/services | 76 | — | 55 | 131 | ||||||||||||
(ii) Stock options (recovery) | — | — | — | — | ||||||||||||
(iii) Management fees and Brand fees charged (40 (L)) | 985 | — | — | 985 | ||||||||||||
(iv) Reimbursement for other expenses (net of recovery) | 90 | — | (0 | ) | 90 | |||||||||||
(v) Corporate Social Responsibility expenditure/Donation | — | — | 63 | 63 | ||||||||||||
(vi) Contribution to Post retirement employee benefit trust/fund | — | — | 59 | 59 | ||||||||||||
vii) Remuneration to relatives of key management personnel | — | — | 13 | 13 | ||||||||||||
(viii) Commission/Sitting Fees | ||||||||||||||||
- To Independent directors | — | — | 3 | 3 | ||||||||||||
- To Key management personnel | — | — | 1 | 1 | ||||||||||||
- To relatives of key management personnel | — | — | 0 | 0 | ||||||||||||
(ix) Dividend paid | ||||||||||||||||
- To Holding companies | 1,770 | — | — | 1,770 | ||||||||||||
- To Key management personnel | — | — | 0 | 0 | ||||||||||||
- To relatives of key management personnel | — | — | 0 | 0 | ||||||||||||
(x) Guarantee Commission Expense (40(H)) | 133 | — | — | 133 | ||||||||||||
Other Transactions during the year: | ||||||||||||||||
(i) Loans given (Net of repayment of ₹1,117 crores) (40(I)) | 7,165 | — | — | 7,165 | ||||||||||||
(ii) Financial Guarantees (taken)/given during the year (40(I)) | 3,147 | — | — | 3,147 | ||||||||||||
(iii) Financial Guarantees relinquished during the year (40(I)) | 3,146 | — | 11 | 3,157 | ||||||||||||
Balances as at year end: | ||||||||||||||||
(i) Trade receivables | 47 | — | — | 47 | ||||||||||||
(ii) Loan Given (40(I)) | 7,066 | 5 | — | 7,071 | ||||||||||||
(iii) Other receivables and advances (including brand fee prepaid) (40(H,M,L)) | 927 | 1 | 2 | 930 | ||||||||||||
(iv) Trade payables | 97 | — | 21 | 119 | ||||||||||||
(v) Other payables (including brand fee payable) (40(L)) | 208 | — | 87 | 294 | ||||||||||||
(vi) Investments (40(J)) | — | — | — | — | ||||||||||||
(vii) Financial guarantee given (40(I)) | 1 | — | 5 | 6 | ||||||||||||
(viii) Bank guarantee given (40(K)) | 115 | — | — | 115 | ||||||||||||
(ix) Sitting fee, Remuneration, Commission and consultancy fees payable to KMP and their relatives | — | — | 6 | 6 | ||||||||||||
VEDANTA LIMITED | INTEGRATED REPORT AND ANNUAL ACCOUNTS 2020-21 | 481
CONSOLIDATED CONTINUED..
Notes
forming part of the consolidated financial statements as at and for the year ended March 31, 2021
Remuneration of key management personnel
| (₹ in crores) | ||||
Particulars | For the Year ended 31 March 2021 | |||
Short-term employee benefits | 28 | |||
Post employment benefits * | 1 | |||
Share based payments | 0 | |||
|
| |||
| 29 | ||||
|
| |||
| * | Does not include the provision made for gratuity and leave benefits, as they are determined on an actuarial basis for all the employees together. |
G) The Group enters into transactions with its related parties, including its parent Vedanta Resources Limited, and the companies over which it has significant influence. A summary of significant related party transactions for the year ended March 31, 2020 are noted below.
Transactions and balances with own subsidiaries are eliminated on consolidation.
Particulars | Entities controlling the Company/ Fellow subsidiaries | Associates/ Joint ventures | Others | (₹ in crores) Total | ||||||||||||
Income: | ||||||||||||||||
(i) Revenue from operations | 855 | — | 2 | 857 | ||||||||||||
(ii) Other income | ||||||||||||||||
a) Interest and guarantee commission | 42 | — | — | 42 | ||||||||||||
b) Outsourcing service fees | 3 | — | — | 3 | ||||||||||||
c) Dividend income | 2 | — | 4 | 6 | ||||||||||||
Expenditure and other transactions: | ||||||||||||||||
(i) Purchase of goods/services | 58 | — | 7 | 65 | ||||||||||||
(ii) Stock options (recovery) | (0 | ) | — | (0 | ) | (0 | ) | |||||||||
(iii) Management fees and Brand fees charged | 526 | — | — | 526 | ||||||||||||
(iv) Reimbursement for other expenses (net of recovery) | 48 | — | 0 | 48 | ||||||||||||
(v) Corporate Social Responsibility expenditure/Donation | — | — | 111 | 111 | ||||||||||||
(vi) Contribution to Post retirement employee benefit trust/fund | — | — | 112 | 112 | ||||||||||||
(vii) Remuneration to relatives of key management personnel | — | — | 17 | 17 | ||||||||||||
(viii) Commission/Sitting Fees | ||||||||||||||||
- To Independent directors | — | — | 4 | 4 | ||||||||||||
- To Key management personnel | — | — | 4 | 4 | ||||||||||||
- To relatives of key management personnel | — | — | 0 | 0 | ||||||||||||
(ix) Dividend paid | ||||||||||||||||
- To Holding companies | 727 | — | — | 727 | ||||||||||||
- To Key management personnel | — | — | 0 | 0 | ||||||||||||
- To relatives of key management personnel | — | — | 0 | 0 | ||||||||||||
Other Transactions during the year: | ||||||||||||||||
(i) Loans given/(repayment thereof) | 0 | (0 | ) | — | (0 | ) | ||||||||||
(ii) Financial Guarantees (taken)/given during the year | — | — | 0 | 0 | ||||||||||||
(iii) Financial Guarantees relinquished during the year | — | — | 25 | 25 | ||||||||||||
(iv) Investments (redeemed) during the year (40(M)) | (4,485 | ) | — | — | (4,485 | ) | ||||||||||
Balances as at year end: | ||||||||||||||||
482
| < BACK TO CONTENTS | Integrated Report | Statutory reports | Financial statements |
Notes
forming part of the consolidated financial statements as at and for the year ended March 31, 2021
| (₹ in crores) | ||||||||||||||||
Particulars | Entities controlling the Company/Fellow subsidiaries | Associates/ Joint ventures | Others | Total | ||||||||||||
(i) Trade receivables | 3 | — | — | 3 | ||||||||||||
(ii) Loans given | 80 | 4 | — | 84 | ||||||||||||
(iii) Other receivables and advances | 133 | 1 | 2 | 136 | ||||||||||||
(iv) Trade payables | 114 | — | 7 | 121 | ||||||||||||
(v) Other payables | 60 | — | 68 | 128 | ||||||||||||
(vi) Investments | 101 | — | — | 101 | ||||||||||||
(vii) Financial guarantee given | — | — | 26 | 26 | ||||||||||||
(viii) Bank guarantee given (40(K)) | 115 | — | — | 115 | ||||||||||||
(ix) Remuneration, Commission and consultancy fees payable to KMP and their relatives | — | — | 6 | 6 | ||||||||||||
Remuneration of key management personnel
| (₹ in crores) | ||||
Particulars | For the year ended 31 March 2020 | |||
Short-term employee benefits* | 40 | |||
Post employment benefits** | 8 | |||
Share based payments | 1 | |||
|
| |||
Total | 49 | |||
|
| |||
| * | This includes reimbursement to the parent company for remuneration paid to the then CEO and Whole Time Director of the Company aggregating to ₹11 crores for the year ended 31 March 2020. |
| ** | Does not include the provision made for gratuity and leave benefits, as they are determined on an actuarial basis for all the employees together. |
H) Cairn PSC and OALP guarantee to Government
Vedanta Resources Limited (“VRL”), as a parent company, has provided financial and performance guarantee to the
Government of India for erstwhile Cairn India group’s (“Cairn”) obligations under the Production Sharing Contract (‘PSC’) provided for onshore block RJ-ON-90/1, for making available financial resources equivalent to Cairn’s share for its obligations under the PSC, personnel and technical services in accordance with industry practices and any other resources in case Cairn is unable to fulfil its obligations under the PSC.
During the current year, the Board of Directors of the Company has approved a consideration to be paid for this guarantee at an annual charge of 1.2% of net exploration and development spend, subject to a minimum annual fee of ₹37 crores ($5 million), applicable from April 2020 onwards to be paid in ratio of participating interests held equally by the Company and its step-down subsidiary, Cairn Energy Hydrocarbons Ltd. (“CEHL”).
Similarly, VRL has also provided financial and performance guarantee to the Government of India for the Company’s obligations under the Revenue Sharing Contract (‘RSC’) in respect of 51 Blocks awarded under the Open Acreage Licensing Policy (“OALP”) by the Government of India.
During the current year, the Board of Directors of the Company has approved a consideration to be paid for this guarantee consisting of one-time charge of ₹183 crores ($25 million), i.e. 2.5% of the total estimated cost of initial exploration phase of approx. ₹7,330 crores ($1 billion) and an annual charge of 1% of spend, subject to a minimum fee of ₹73 crores ($10 million) and maximum fee of ₹147 crores ($20 million) per annum.
Accordingly, the Company has recorded a guarantee commission expense of ₹133 crores ($18 million) [2020: Nil] for the year ended 31 March 2021 and ₹161 crores ($22 million) (PY Nil) is outstanding as a pre-payment.
VEDANTA LIMITED | INTEGRATED REPORT AND ANNUAL ACCOUNTS 2020-21 | 483
CONSOLIDATED CONTINUED...
Notes
forming part of the consolidated financial statements as at and for the year ended 31 March 2021
I) In June 2020, as part of its cash management activities, the Company through its overseas subsidiaries extended certain loans and guarantee facilities, for a period up to 12 months, to Vedanta Resources Limited (“VRL”) and its subsidiaries (collectively “the VRL group”) which were drawn over a period of time carrying interest ranging from 3% to 7% and guarantee fee at 1%. In October 2020, certain terms of the facilities were modified primarily comprising extension of the tenor and making it repayable in instalments by December 2023, which resulted in substantial modification of the instruments. Further, the guarantee was also extinguished. The difference in the fair value of the loan was debited to equity as a transaction with the shareholder. The provisions of Ind AS 109 – ‘Financial Instruments’ as applicable for assets which are credit impaired on initial recognition were applicable to loans aggregating to US$122 million (₹894 crores) to one of the subsidiaries of VRL.
Subsequently, the contractual rate of interest on these instruments were increased with retrospective effect to 14% to 17.5% to enable the Group to earn the fair market rate of interest, as was determined on the date of the origination of the transaction.
Thereafter, in March 2021, since the credit default swap rates had stabilised, the Group revised the interest rate to 9.6% using a level 2 valuation approach by applying the prevailing US Dollar treasury rates and the Company specific credit default swaps. The Group also benchmarked the said rate to the coupon rate on bonds issued to non-related third parties by the VRL group during the same period. As per the accounting requirements of Ind AS 109 with respect to modification of loans, the net excess of loan amount over the present value of the modified contractual cash flows discounted at the original effective interest rate aggregating to US$73 million (₹536 crores) is reflected in the statements of changes in equity and cash flow as a transaction with the shareholder.
As of 31 March 2021, loans of US$966 million (approx. ₹7,081 crores) are outstanding. The loans are now entirely held by a single subsidiary of VRL, which holds 37.1% shares (increased to 43.6% subsequent to the year-end) in the Company and is required to maintain the said level of shareholding during the tenure of the loans. The said entity also has a contractual ceiling on its borrowings, which is lower than the market value of its investments and other assets. Further, an accretive interest of US$2 million (₹15 crores) over and above the contractual interest has been accounted for in the statement of profit and loss. Subsequent to the year end, the VRL group has repaid US$207 million (₹1,534 crores) of the aforesaid loans.
J) Cairn India Holdings Limited held bonds issued by Vedanta Resources Limited, the carrying value of which at the start of the year was ₹228 crores (US$31 million), which had maturities ranging from June 2021 to May 2023 at coupon ranging from 7.13% to 8.25% p.a. During the year, investments in bonds of Vedanta Resources Limited have been disposed off in the open market for a consideration of ₹215 crores (US $29 million).
K) Bank guarantee given by Vedanta Limited on behalf of Volcan Investments Limited in favour of Income Tax department, India as collateral in respect of certain tax disputes of Volcan Investments Limited.
L) In 2017, the Group had executed a three-year brand license agreement (“the Agreement”) with Vedanta Resources Ltd. (‘VRL’) for the use of brand ‘Vedanta’ which envisaged payment of brand fee to VRL at 0.75% of turnover of the Company. Later, certain subsidiaries of the Company executed similar agreements with VRL to pay brand fee ranging between 0.75% -1.50 % of their respective turnover. During the current year, the Agreement with the Company and some of its subsidiaries was renewed and certain additional services were also agreed to be provided by VRL. Based on updated benchmarking analysis conducted by independent experts, the brand and strategic service fee was re-negotiated at 2% of the turnover, while for the remaining subsidiaries the previous rates remain unchanged. Accordingly, the Group has recorded an expense of ₹939 crores (2020: ₹313 crores) for the year ended 31 March 2021. The Group pays such fee in advance, at the start of the year based on estimated annual turnover.
M) During the financial year ended 31 March 2019, as part of its cash management activities, CIHL purchased an economic interest in a structured investment for the equity shares of Anglo American Plc (“AA Plc”), a company listed on the London Stock Exchange, from Volcan for a total consideration of ₹3,812 crores (GBP 428 million, USD 541 million) determined based on an independent third-party valuation. In July 2019, the transaction was unwound and the investments were redeemed for a total consideration of ₹4,485 crores (GBP 519 million, USD 639 million), representing the actual price Volcan realised from selling the shares of AA Plc. CIHL was informed that the said realisation was net of applicable transaction costs of ₹93 crores (GBP 10 million, USD 12 million), which in January 2021, CIHL agreed to bear. Accordingly, this amount has been recorded in the statement of profit and loss in the current year as exceptional item.
N) During the year ended 31 March 2021, the Group had renewed loan provided to Sterlite Iron and Steel Company Limited to finance project in earlier years. The loan balance as at 31 March 2021 was ₹5 crores (March 31,2020: ₹5 crores). The loan is unsecured in nature and carries an interest rate of 7.15% per annum. The loan was due in March 2021 and the agreement was renewed for a further period of 12 months.
In 2016, a subsidiary of the Company had executed an agreement with Twin Star Holding Limited, the intermediate parent of the Group, to provide an unsecured loan of ₹67 crores (US $10 million) at an interest rate of 2.1% per annum. The loan balance of the loan as at 31 March 2021 and 31 March 2020 is ₹73 crores and ₹75 crores respectively.
484
| < BACK TO CONTENTS | Integrated Report | Statutory reports | Financial statements |
Notes
forming part of the consolidated financial statements as at and for the year ended 31 March 2021
During the year, these companies have recognised a provision of ₹98 crores (Including accrued interest of ₹20 crores) against said loans.
41 SUBSEQUENT EVENTS
As per information received from Vedanta Resources Limited (“VRL” or “Acquirer”), VRL together with Twin
Star Holdings Limited, Vedanta Holdings Mauritius Limited and Vedanta Holdings Mauritius II Limited, as persons acting in concert with the Acquirer (“PACs”), have acquired 374,231,161 equity shares of the Company under the voluntary open offer made to the public shareholders of the Company in accordance with the Securities and Exchange Board of India (Substantial Acquisition of Shares and Takeovers) Regulations, 2011 and thereby increasing their shareholding in the Company from the current 55.1% to 65.18%.
There are no other material adjusting or non-adjusting subsequent events, except as already disclosed.
42 INTEREST IN OTHER ENTITIES
a) Subsidiaries
The Group consists of a parent company, Vedanta Limited, incorporated in India and a number of subsidiaries held directly and indirectly by the Group which operate and are incorporated around the world. Following are the details of shareholdings in the subsidiaries.
Sr. | Subsidiaries | Principal activities | Country of | Immediate holding | The Company’s/Immediate holding company’s percentage holding (in %) | |||||||||||
| As at 31 March 2021 | As at 31 March 2020 | |||||||||||||||
| 1 | Cairn Energy India Pty Limited2 | Exploration for and development and production of oil & gas | Australia | Cairn India Holdings Limited | — | 100.00 | ||||||||||
| 2 | Copper Mines of Tasmania Pty Limited (“CMT”) | Copper Mining | Australia | Monte Cello BV | 100.00 | 100.00 | ||||||||||
| 3 | Thalanga Copper Mines Pty Limited (“TCM”) | Copper Mining | Australia | Monte Cello BV | 100.00 | 100.00 | ||||||||||
| 4 | Bharat Aluminium Company Limited (“BALCO”) | Aluminium mining and smelting | India | Vedanta Limited | 51.00 | 51.00 | ||||||||||
| 5 | Electrosteel Steels Limited | Manufacturing of Steel & DI Pipe | INDIA | Vedanta Limited | 95.49 | 95.49 | ||||||||||
| 6 | Goa Sea Port Private Limited | Infrastructure | India | Sterlite Ports Limited | 100.00 | 100.00 | ||||||||||
| 7 | Hindustan Zinc Limited (“HZL”) | Zinc Mining & Smelting | India | Vedanta Limited | 64.92 | 64.92 | ||||||||||
| 8 | MALCO Energy Limited (“MEL”) | Power Generation | India | Vedanta Limited | 100.00 | 100.00 | ||||||||||
| 9 | Maritime Ventures Private Limited | Infrastructure | India | Sterlite Ports Limited | 100.00 | 100.00 | ||||||||||
| 10 | Paradip Multi Cargo Berth Private Limited | Infrastructure | India | Vedanta Limited | 100.00 | 100.00 | ||||||||||
| 11 | Sesa Mining Corporation Limited | Iron ore mining | India | Sesa Resources Limited | 100.00 | 100.00 | ||||||||||
| 12 | Sesa Resources Limited (“SRL”) | Iron ore mining | India | Vedanta Limited | 100.00 | 100.00 | ||||||||||
| 13 | Sterlite Ports Limited | Infrastructure | India | Vedanta Limited | 100.00 | 100.00 | ||||||||||
| 14 | Talwandi Sabo Power Limited (“TSPL”) | Power Generation | India | Vedanta Limited | 100.00 | 100.00 | ||||||||||
| 15 | Vizag General Cargo Berth Private Limited | Infrastructure | India | Vedanta Limited | 100.00 | 100.00 | ||||||||||
| 16 | Killoran Lisheen Finance Limited(a) | Investment company | Republic of Ireland | Vedanta Lisheen Holdings Limited | 100.00 | 100.00 | ||||||||||
| 17 | Killoran Lisheen Mining Limited | Development of a zinc/lead mine | Republic of Ireland | Vedanta Lisheen Holdings Limited | 100.00 | 100.00 | ||||||||||
VEDANTA LIMITED | INTEGRATED REPORT AND ANNUAL ACCOUNTS 2020-21 | 485
CONSOLIDATED CONTINUED...
Notes
forming part of the consolidated financial statements as at and for the year ended 31 March 2021
Sr. | Subsidiaries | Principal activities | Country of | Immediate holding | The Company’s/Immediate holding company’s percentage holding (in %) | |||||||||||
| As at 31 March 2021 | As at 31 March 2020 | |||||||||||||||
| 18 | Lisheen Milling Limited | Manufacturing3 | Republic of Ireland | Vedanta Lisheen Holdings Limited | 100.00 | 100.00 | ||||||||||
| 19 | Lisheen Mine Partnership | Development and operation of a zinc/lead mine | Republic of Ireland | 50% each held by Killoran Lisheen Mining Limited & Vedanta Lisheen Mining Limited | 100.00 | 100.00 | ||||||||||
| 20 | Vedanta Exploration Ireland Limited(a) | Exploration activities | Republic of Ireland | Vedanta Lisheen Holdings Limited | 100.00 | 100.00 | ||||||||||
| 21 | Vedanta Lisheen Holdings Limited | Investment company | Netherlands | THL Zinc Holding BV | 100.00 | 100.00 | ||||||||||
| 22 | Vedanta Lisheen Mining Limited | Zinc and lead mining | Republic of Ireland | Vedanta Lisheen Holdings Limited | 100.00 | 100.00 | ||||||||||
| 23 | AvanStrate Inc. (‘ASI’) | Holding Company | Japan | Cairn India Holdings Limited | 51.63 | 51.63 | ||||||||||
| 24 | Cairn India Holdings Limited | Investment company | Jersey | Vedanta Limited | 100.00 | 100.00 | ||||||||||
| 25 | Western Cluster Limited | Iron ore mining | Liberia | Bloom Fountain Limited | 100.00 | 100.00 | ||||||||||
| 26 | Bloom Fountain Limited | Operating (Iron ore) and Investment Company | Mauritius | Vedanta Limited | 100.00 | 100.00 | ||||||||||
| 27 | CIG Mauritius Holdings Private Limited (a) | Investment Company | Republic of Mauritius | Cairn Energy Hydrocarbons Ltd. | 100.00 | 100.00 | ||||||||||
| 28 | CIG Mauritius Private Limited (a) | Investment Holding Company and to provide services and resources relevant to oil & gas exploration, production and development | Republic of Mauritius | CIG Mauritius Holding Private Ltd. | 100.00 | 100.00 | ||||||||||
| 29 | THL Zinc Ltd. | Investment Company | Mauritius | THL Zinc Ventures Limited | 100.00 | 100.00 | ||||||||||
| 30 | THL Zinc Ventures Limited | Investment Company | Mauritius | Vedanta Limited | 100.00 | 100.00 | ||||||||||
| 31 | Amica Guesthouse (Properietary) Limited | Accomodation and catering services | Nambia | Skorpion Zinc (Proprietary) Limited | 100.00 | 100.00 | ||||||||||
| 32 | Namzinc (Proprietary) Limited | Owns and operates a zinc refinery | Nambia | Skorpion Zinc (Proprietary) Limited | 100.00 | 100.00 | ||||||||||
| 33 | Skorpion Mining Company (Proprietary) Limited (‘NZ’) | Exploration, development, treatment, production and sale of zinc ore | Nambia | Skorpion Zinc (Proprietary) Limited | 100.00 | 100.00 | ||||||||||
| 34 | Skorpion Zinc (Proprietary) Limited (‘SZPL’) | Operates (zinc) and investing company | Nambia | THL Zinc Namibia Holdings (Proprietary) Ltd. | 100.00 | 100.00 | ||||||||||
| 35 | THL Zinc Namibia Holdings (Proprietary) Limited (“VNHL”) | Mining and Exploration and Investment company | Nambia | THLZ Zinc Ltd. | 100.00 | 100.00 | ||||||||||
| 36 | Lakomasko BV | Investment company | Netherlands | THL Zinc Holding BV | 100.00 | 100.00 | ||||||||||
486
| < BACK TO CONTENTS | Integrated Report | Statutory reports | Financial statements |
Notes
forming part of the consolidated financial statements as at and for the year ended 31 March 2021
Sr. | Subsidiaries | Principal activities | Country of | Immediate holding | The Company’s/Immediate holding company’s percentage holding (in %) | |||||||||||
| As at 31 March 2021 | As at 31 March 2020 | |||||||||||||||
| 37 | Monte Cello BV (“MCBV”) | Holding company | Netherlands | Vedanta Limited | 100.00 | 100.00 | ||||||||||
| 38 | THL Zinc Holding BV | Investment company | Netherlands | Vedanta Limited | 100.00 | 100.00 | ||||||||||
| 39 | Cairn Energy Discovery Limited2 | Oil and gas exploration, development and production | Scotland | Cairn India Holdings Limited | — | 100.00 | ||||||||||
| 40 | Cairn Energy Gujarat Block 1 Limited | Oil and gas exploration, development and production | Scotland | Cairn India Holdings Limited | 100.00 | 100.00 | ||||||||||
| 41 | Cairn Energy Hydrocarbons Limited | Oil and gas exploration, development and production | Scotland(b) | Cairn India Holdings Limited | 100.00 | 100.00 | ||||||||||
| 42 | Cairn Exploration (No. 2) Limited2 | Oil and gas exploration, development and production | Scotland | Cairn India Holdings Limited | — | 100.00 | ||||||||||
| 43 | Black Mountain Mining (Proprietary) Limited | Exploration, development, production and sale of zinc, lead, copper and associated mineral concentrates | South Africa | THL Zinc Ltd. | 74.00 | 74.00 | ||||||||||
| 44 | Cairn South Africa Pty Limited4 | Oil and gas exploration, development and production | South Africa | Cairn Energy Hydrocarbons Ltd. | 100.00 | 100.00 | ||||||||||
| 45 | AvanStrate Korea Inc | Manufacturing of LCG Glass Substrate | Korea | Avanstrate (Japan) Inc. | 100.00 | 100.00 | ||||||||||
| 46 | Cairn Lanka Private Limited | Oil and gas exploration, development and production | Sri Lanka | CIG Mauritius Private Ltd. | 100.00 | 100.00 | ||||||||||
| 47 | AvanStrate Taiwan Inc | Manufacturing of LCG Glass Substrate | Taiwan | Avanstrate (Japan) Inc. | 100.00 | 100.00 | ||||||||||
| 48 | Fujairah Gold FZC | Manufacturing of Copper Rod and Refining of Precious Metals (Gold & Silver) | United Arab Emirates | Malco Energy Limited | 100.00 | 100.00 | ||||||||||
| 49 | Sterlite (USA) Inc.(a) | Investment company | United States of America | Vedanta Limited | 100.00 | 100.00 | ||||||||||
| 50 | Ferro Alloy Corporation Limited (FACOR)(c) | Manufacturing of Ferro Alloys and Mining | India | Vedanta Limited | 100.00 | — | ||||||||||
| 51 | FACOR Alloys corporation Ltd.(c) Real estate | India | FACOR | 100.00 | — | |||||||||||
| 52 | FACOR power Ltd.(c) | Power Generation | India | FACOR | 90.00 | — | ||||||||||
| (a) | Under liquidation (b)Principal place of business is in India (c)Acquired with effect from 21 September 2020 |
| 1 | The Group also has interest in certain trusts which are neither significant nor material to the Group. |
| 2 | Cairn Exploration (No. 2) Limited and Cairn Energy Discovery Limited have been dissolved w.e.f. 22 September 2020 and Cairn Energy India (Pty) Ltd. w.e.f. 26 August 2020. |
| 3 | Activity of the Company ceased in February 2016. |
| 4 | Cairn South Africa Pty Limited has been deregistered w.e.f. 06 April 2021. |
VEDANTA LIMITED | INTEGRATED REPORT AND ANNUAL ACCOUNTS 2020-21 | 487
CONSOLIDATED CONTINUED...
Notes
forming part of the consolidated financial statements as at and for the year ended 31 March 2021
b) Joint operations
The Group participates in several unincorporated joint operations which involve the joint control of assets used in oil and gas exploration and producing activities which are as follows:
| (%) Participating Interest | ||||||||||
Oil & Gas blocks/fields Operating Blocks | Area | As at 31 March 2021 | As at 31 March 2020 | |||||||
Ravva block-Exploration, Development and Production | Krishna Godavari | 22.50 | 22.50 | |||||||
CB-OS/2 – Exploration | Cambay Offshore | 60.00 | 60.00 | |||||||
CB-OS/2 - Development & production | Cambay Offshore | 40.00 | 40.00 | |||||||
RJ-ON-90/1 – Exploration | Rajasthan Onshore | 100.00 | 100.00 | |||||||
RJ-ON-90/1 – Development & production | Rajasthan Onshore | 70.00 | 70.00 | |||||||
KG-OSN-2009/3 – Exploration | Krishna Godavari Offshore | 100.00 | 100.00 | |||||||
Non-Operating Blocks | ||||||||||
KG-ONN-2003/1 | Krishna Godavari Onshore | 49.00 | 49.00 | |||||||
| (1) | South Africa Block1-Exploration was relinquished on 10 September 2019. |
c) Interest in associates and joint ventures
Set out below are the associates and joint ventures of the Group as at 31 March 2021 which, in the opinion of the management, are not material to the Group. The country of incorporation or registration is also their principal place of business, and the proportion of ownership interest is the same as the proportion of voting rights held.
| % Ownership interest | ||||||||||
Sr. | Associates | Country of | As at 31 March 2021 | As at | ||||||
| 1 | RoshSkor Township (Pty) Limited | Namibia | 50.00 | 50.00 | ||||||
| 2 | Gaurav Overseas Private Limited | India | 50.00 | 50.00 | ||||||
| 3 | Raykal Aluminium Company Private Limited | India | 24.50 | 24.50 | ||||||
| 4 | Rampia Coal Mines and Energy Private Limited(a) | India | 17.39 | 17.39 | ||||||
| (a) | Struck off by the Ministry of Corporate affairs on 19 April 2021 |
| % Ownership interest | ||||||||||
Sr. | Jointly controlled entities | Country of incorporation | As at 31 March 2021 | As at | ||||||
| 1 | Madanpur South Coal Company Limited | India | 17.62 | 17.62 | ||||||
| 2 | Goa Maritime Private Limited | India | 50.00 | 50.00 | ||||||
| 3 | Rosh Pinah Health Care (Proprietary) Limited | Namibia | 69.00 | 69.00 | ||||||
| 4 | Gergarub Exploration and Mining (Pty) Limited | Namibia | 51.00 | 51.00 | ||||||
43 OIL & GAS RESERVES AND RESOURCES
The Group’s gross reserve estimates are updated atleast annually based on the forecast of production profiles, determined on an asset-by-asset basis, using appropriate petroleum engineering techniques. The estimates of reserves and resources have been derived in accordance with the Society for Petroleum Engineers “Petroleum Resources Management System (2018)”. The changes to the reserves are generally on account of future development
488
| < BACK TO CONTENTS | Integrated Report | Statutory reports | Financial statements |
Notes
forming part of the consolidated financial statements as at and for the year ended 31 March 2021
projects, application of technologies such as enhanced oil recovery techniques and true up of the estimates. The management’s internal estimates of hydrocarbon reserves and resources at the year end, are as follows:
Particulars | Country | Gross proved and probable hydrocarbons initially in place (mmboe) | Gross proved and probable reserves and resources (mmboe) | Net working interest proved and probable reserves and resources (mmboe) | ||||||||||||||||||||||||
| As at | As at | As at | As at | As at | As at | |||||||||||||||||||||||
| 31 March 2021 | 31 March 2020 | 31 March 2021 | 31 March 2020 | 31 March 2021 | 31 March 2020 | |||||||||||||||||||||||
Rajasthan MBA Fields | India | 2,307 | 2,288 | 266 | 317 | 186 | 222 | |||||||||||||||||||||
Rajasthan MBA EOR | India | — | — | 388 | 317 | 271 | 222 | |||||||||||||||||||||
Rajasthan Block Other Fields | India | 3,603 | 3,535 | 470 | 449 | 329 | 314 | |||||||||||||||||||||
Ravva Fields | India | 704 | 692 | 27 | 28 | 6 | 6 | |||||||||||||||||||||
CBOS/2 Fields | India | 298 | 292 | 34 | 40 | 14 | 16 | |||||||||||||||||||||
Other fields | India | 352 | 348 | 44 | 43 | 26 | 25 | |||||||||||||||||||||
|
|
|
|
|
|
|
|
|
|
|
| |||||||||||||||||
Total | 7,264 | 7,155 | 1,229 | 1,194 | 832 | 805 | ||||||||||||||||||||||
|
|
|
|
|
|
|
|
|
|
|
| |||||||||||||||||
The Group’s net working interest proved and probable reserves is as follows:
| Proved and probable reserves | Proved and probable reserves (developed) | |||||||||||||||
Particulars | Oil (mmstb) | Gas (bscf) | Oil (mmstb) | Gas (bscf) | ||||||||||||
Reserves as of 01 April 2019* | 315 | 264 | 178 | 129 | ||||||||||||
Additions/revision during the year | 25 | 61 | 22 | 38 | ||||||||||||
Production during the year | (36 | ) | (24 | ) | (36 | ) | (24 | ) | ||||||||
|
|
|
|
|
|
|
| |||||||||
Reserves as of 31 March 2020** | 304 | 301 | 164 | 143 | ||||||||||||
|
|
|
|
|
|
|
| |||||||||
Additions/revision during the year | (11 | ) | (14 | ) | 30 | 51 | ||||||||||
Production during the year | (32 | ) | (28 | ) | (32 | ) | (28 | ) | ||||||||
|
|
|
|
|
|
|
| |||||||||
Reserves as of 31 March 2021*** | 261 | 259 | 162 | 166 | ||||||||||||
|
|
|
|
|
|
|
| |||||||||
| * | Includes probable oil reserves of 116.21 mmstb (of which 16.03 mmstb is developed) and probable gas reserves of 89.00 bscf (of which 24.19 bscf is developed). |
| ** | Includes probable oil reserves of 132.23 mmstb (of which 21.94 mmstb is developed) and probable gas reserves of 114.73 bscf (of which 42.64 bscf is developed). |
| *** | Includes probable oil reserves of 111.14 mmstb (of which 23.08 mmstb is developed) and probable gas reserves of 128.41 bscf (of which 52.06 bscf is developed). |
mmboe = million barrels of oil equivalent
mmstb = million stock tank barrels
bscf = billion standard cubic
feet 1 million metric
tonnes = 7.4 mmstb
1 standard cubic meter = 35.315 standard cubic feet
MBA = Mangala, Bhagyam & Aishwarya
EOR = Enhanced Oil Recovery
VEDANTA LIMITED | INTEGRATED REPORT AND ANNUAL ACCOUNTS 2020-21 | 489
CONSOLIDATED CONTINUED...
Notes
forming part of the consolidated financial statements as at and for the year ended 31 March 2021
44 FINANCIAL INFORMATION PURSUANT TO SCHEDULE III OF COMPANIES ACT, 2013
| Net Assets | Share in other | Share in total | ||||||||||||||||||||||||||||||||
| (Total assets less total liabilities) | Share in profit and loss | comprehensive income (OCI) | comprehensive income (TCI) | |||||||||||||||||||||||||||||||
Sr. | Name of the entity | As at 31 March 2021 | Year ended 31 March 2021 | Year ended 31 March 2021 | Year ended 31 March 2021 | |||||||||||||||||||||||||||||
| As % of consolidated net assets | Amount (₹ in crores) | As % of consolidated profit | Amount (₹ in crores) | As % of consolidated OCI | Amount (₹ in crores) | As % of consolidated TCI | Amount (₹ in crores) | |||||||||||||||||||||||||||
| Parent | ||||||||||||||||||||||||||||||||||
| Vedanta Limited | 123.30 | % | 76,790 | 90.53 | % | 10,503 | (51.82 | %) | (57 | ) | 89.19 | % | 10,446 | |||||||||||||||||||||
| Indian Subsidiaries | ||||||||||||||||||||||||||||||||||
| 1 | Hindustan Zinc Limited | 51.89 | % | 32,313 | 68.78 | % | 7,980 | (4.55 | %) | (5 | ) | 68.09 | % | 7,975 | ||||||||||||||||||||
| 2 | Bharat Aluminium Company Limited | 7.95 | % | 4,952 | 9.05 | % | 1,050 | (41.77 | %) | (46 | ) | 8.57 | % | 1,004 | ||||||||||||||||||||
| 3 | MALCO Energy Limited | 0.44 | % | 275 | 0.39 | % | 45 | 0.05 | % | 0 | 0.38 | % | 45 | |||||||||||||||||||||
| 4 | Talwandi Sabo Power Limited | 5.16 | % | 3,213 | (0.63 | %) | (73 | ) | 0.00 | % | — | (0.62 | %) | (73 | ) | |||||||||||||||||||
| 5 | Sesa Resources Limited | 0.04 | % | 28 | 0.16 | % | 18 | 0.00 | % | — | 0.15 | % | 18 | |||||||||||||||||||||
| 6 | Sesa Mining Corporation Limited | (0.26 | %) | (165 | ) | 0.59 | % | 69 | (3.10 | %) | (3 | ) | 0.56 | % | 66 | |||||||||||||||||||
| 7 | Sterlite Ports Limited | (0.01 | %) | (5 | ) | (0.00 | %) | (0 | ) | 0.00 | % | — | (0.00 | %) | (0 | ) | ||||||||||||||||||
| 8 | Vizag General Cargo Berth Private Limited | 0.02 | % | 11 | (0.08 | %) | (9 | ) | 0.11 | % | 0 | (0.08 | %) | (9 | ) | |||||||||||||||||||
| 9 | Paradip Multi Cargo Berth Private Limited | (0.00 | %) | (2 | ) | (0.00 | %) | (0 | ) | 0.00 | % | — | (0.00 | %) | (0 | ) | ||||||||||||||||||
| 10 | Maritime Ventures Private Limited | 0.03 | % | 20 | 0.10 | % | 12 | 0.00 | % | — | 0.10 | % | 12 | |||||||||||||||||||||
| 11 | Goa Sea Port Private Limited | (0.00 | %) | (3 | ) | (0.02 | %) | (2 | ) | 0.00 | % | — | (0.02 | %) | (2 | ) | ||||||||||||||||||
| 12 | Vedanta Limited ESOS Trust | 0.08 | % | 47 | 0.00 | % | — | 0.01 | % | 0 | 0.00 | % | 0 | |||||||||||||||||||||
| 13 | Electrosteel Steels Limited | 10.00 | % | 6,225 | 23.55 | % | 2,732 | (0.48 | %) | (1 | ) | 23.32 | % | 2,731 | ||||||||||||||||||||
| Foreign Subsidiaries | ||||||||||||||||||||||||||||||||||
| 1 | Copper Mines of Tasmania Pty Limited | (0.85 | %) | (531 | ) | 0.19 | % | 22 | 0.00 | % | — | 0.19 | % | 22 | ||||||||||||||||||||
| 2 | Thalanga copper mines Pty Limited | (0.05 | %) | (30 | ) | (0.08 | %) | (9 | ) | 0.00 | % | — | (0.08 | %) | (9 | ) | ||||||||||||||||||
| 3 | Monte Cello BV | 0.30 | % | 188 | 0.03 | % | 3 | 0.00 | % | — | 0.03 | % | 3 | |||||||||||||||||||||
| 4 | Bloom Fountain Limited | (12.49 | %) | (7,780 | ) | (2.01 | %) | (233 | ) | 0.00 | % | — | (1.99 | %) | (233 | ) | ||||||||||||||||||
| 5 | Western Cluster Limited | (1.43 | %) | (891 | ) | (0.19 | %) | (22 | ) | 0.00 | % | — | (0.19 | %) | (22 | ) | ||||||||||||||||||
| 6 | Sterlite (USA) Inc. (b) | 0.00 | % | — | 0.00 | % | — | 0.00 | % | — | 0.00 | % | — | |||||||||||||||||||||
|
|
|
|
|
|
|
|
|
|
|
|
|
|
|
| |||||||||||||||||||
| 7 | Fujairah Gold FZC | (0.57 | %) | (355 | ) | (1.76 | %) | (204 | ) | 12.73 | % | 14 | (1.62 | %) | (190 | ) | ||||||||||||||||||
| 8 | THL Zinc Ventures Limited | 2.41 | % | 1,501 | 0.00 | % | — | 0.00 | % | — | 0.00 | % | — | |||||||||||||||||||||
| 9 | THL Zinc Limited | 5.74 | % | 3,572 | (0.02 | %) | (2 | ) | 0.00 | % | — | (0.02 | %) | (2 | ) | |||||||||||||||||||
| 10 | THL Zinc Holding BV | 2.54 | % | 1,581 | 0.05 | % | 6 | 0.00 | % | — | 0.05 | % | 6 | |||||||||||||||||||||
| 11 | THL Zinc Namibia Holdings (Proprietary) Limited | 0.99 | % | 615 | 3.69 | % | 428 | 0.00 | % | — | 3.65 | % | 428 | |||||||||||||||||||||
| 12 | Skorpion Zinc (Proprietary) Limited | 0.01 | % | 9 | 3.78 | % | 439 | 0.00 | % | — | 3.75 | % | 439 | |||||||||||||||||||||
| 13 | Skorpion Mining Company (Proprietary) Limited | (2.43 | %) | (1,511 | ) | (0.40 | %) | (46 | ) | 0.00 | % | — | (0.39 | %) | (46 | ) | ||||||||||||||||||
| 14 | Namzinc (Proprietary) Limited | 1.12 | % | 699 | (0.91 | %) | (106 | ) | 0.00 | % | — | (0.91 | %) | (106 | ) | |||||||||||||||||||
| 15 | Amica Guesthouse (Proprietary) Limited | 0.00 | % | 2 | 0.01 | % | 1 | 0.00 | % | — | 0.01 | % | 1 | |||||||||||||||||||||
490
| < BACK TO CONTENTS | Integrated Report | Statutory reports | Financial statements |
Notes
forming part of the consolidated financial statements as at and for the year ended 31 March 2021
| Net Assets | Share in other | Share in total | ||||||||||||||||||||||||||||||||
| (Total assets less total liabilities) | Share in profit and loss | comprehensive income (OCI) | comprehensive income (TCI) | |||||||||||||||||||||||||||||||
Sr. | Name of the entity | As at 31 March 2021 | Year ended 31 March 2021 | Year ended 31 March 2021 | Year ended 31 March 2021 | |||||||||||||||||||||||||||||
| As % of consolidated net assets | Amount (₹ in crores) | As % of consolidated profit | Amount (₹ in crores) | As % of consolidated OCI | Amount (₹ in crores) | As % of consolidated TCI | Amount (₹ in crores) | |||||||||||||||||||||||||||
| 16 | Black Mountain Mining Proprietary Limited | 3.30 | % | 2,058 | 4.86 | % | 564 | 2.63 | % | 3 | 4.84 | % | 567 | |||||||||||||||||||||
| 17 | Vedanta Lisheen Holdings Limited | 0.04 | % | 24 | 0.00 | % | — | 0.00 | % | — | 0.00 | % | — | |||||||||||||||||||||
| 18 | Vedanta Lisheen Mining Limited | 0.11 | % | 67 | 0.03 | % | 3 | 0.00 | % | — | 0.03 | % | 3 | |||||||||||||||||||||
| 19 | Killoran Lisheen Mining Limited | 0.02 | % | 14 | (0.01 | %) | (1 | ) | 0.00 | % | — | (0.01 | %) | (1 | ) | |||||||||||||||||||
| 20 | Killoran Lisheen Finance Limited(b) | 0.00 | % | — | 0.00 | % | — | 0.00 | % | — | 0.00 | % | — | |||||||||||||||||||||
|
|
|
|
|
|
|
|
|
|
|
|
|
|
|
| |||||||||||||||||||
| 21 | Lisheen Milling Limited | 0.13 | % | 82 | (0.56 | %) | (65 | ) | 0.00 | % | — | (0.55 | %) | (65 | ) | |||||||||||||||||||
| 22 | Lisheen Mine Partnership | 0.00 | % | — | (0.13 | %) | (15 | ) | 0.00 | % | — | (0.13 | %) | (15 | ) | |||||||||||||||||||
| 23 | Lakomasko BV | (0.00 | %) | (0 | ) | (0.00 | %) | (0 | ) | 0.00 | % | — | (0.00 | %) | (0 | ) | ||||||||||||||||||
| 24 | Vedanta Exploration Ireland Limited(b) | 0.00 | % | — | 0.00 | % | — | 0.00 | % | — | 0.00 | % | — | |||||||||||||||||||||
|
|
|
|
|
|
|
|
|
|
|
|
|
|
|
| |||||||||||||||||||
| 25 | Cairn India Holdings Limited | 20.16 | % | 12,557 | 7.64 | % | 886 | 0.00 | % | — | 7.56 | % | 886 | |||||||||||||||||||||
| 26 | Cairn Energy Hydrocarbons Limited | 7.13 | % | 4,441 | 2.86 | % | 332 | 0.00 | % | — | 2.83 | % | 332 | |||||||||||||||||||||
| 27 | Cairn Lanka (Private) Limited | (0.76 | %) | (476 | ) | 0.01 | % | 1 | 0.00 | % | — | 0.01 | % | 1 | ||||||||||||||||||||
| 28 | Cairn South Africa (Pty) Limited | 0.00 | % | — | 0.01 | % | 1 | 0.00 | % | — | 0.01 | % | 1 | |||||||||||||||||||||
| 29 | CIG Mauritius Holding Private Limited(b) | 0.00 | % | 0 | (0.00 | %) | (0 | ) | 0.00 | % | — | (0.00 | %) | (0 | ) | |||||||||||||||||||
|
|
|
|
|
|
|
|
|
|
|
|
|
|
|
| |||||||||||||||||||
| 30 | CIG Mauritius Private Limited(b) | 0.00 | % | 0 | (0.00 | %) | (0 | ) | 0.00 | % | — | (0.00 | %) | (0 | ) | |||||||||||||||||||
|
|
|
|
|
|
|
|
|
|
|
|
|
|
|
| |||||||||||||||||||
| 31 | Cairn Energy Discovery Limited(d) | 0.00 | % | 0 | (0.00 | %) | (0 | ) | 0.00 | % | — | (0.00 | %) | (0 | ) | |||||||||||||||||||
|
|
|
|
|
|
|
|
|
|
|
|
|
|
|
| |||||||||||||||||||
| 32 | Cairn Exploration (No. 2) Limited(d) | 0.00 | % | — | 0.00 | % | — | 0.00 | % | — | 0.00 | % | — | |||||||||||||||||||||
|
|
|
|
|
|
|
|
|
|
|
|
|
|
|
| |||||||||||||||||||
| 33 | Cairn Energy Gujarat Block 1 Limited | 0.00 | % | 2 | 0.00 | % | 0 | 0.00 | % | — | 0.00 | % | 0 | |||||||||||||||||||||
| 34 | Cairn Energy India Pty Limited(d) | 0.00 | % | — | 0.00 | % | — | 0.00 | % | — | 0.00 | % | — | |||||||||||||||||||||
|
|
|
|
|
|
|
|
|
|
|
|
|
|
|
| |||||||||||||||||||
| 35 | AvanStrate Inc | (3.36 | %) | (2,095 | ) | 0.40 | % | 46 | 0.00 | % | — | 0.39 | % | 46 | ||||||||||||||||||||
| 36 | AvanStrate Korea Inc | (3.11 | %) | (1,934 | ) | (1.20 | %) | (139 | ) | 0.00 | % | — | (1.19 | %) | (139 | ) | ||||||||||||||||||
| 37 | AvanStrate Taiwan Inc | 4.57 | % | 2,845 | (0.88 | %) | (102 | ) | 0.00 | % | — | (0.87 | %) | (102 | ) | |||||||||||||||||||
| 38 | Ferro Alloy Corporation Limited (FACOR)(c) | 0.61 | % | 378 | (6.80 | %) | (789 | ) | 2.73 | % | 3 | (6.71 | %) | (786 | ) | |||||||||||||||||||
|
|
|
|
|
|
|
|
|
|
|
|
|
|
|
| |||||||||||||||||||
| 39 | Facor Realty and Infrastructure Limited (c) | 0.00 | % | — | 0.00 | % | — | 0.00 | % | — | 0.00 | % | — | |||||||||||||||||||||
|
|
|
|
|
|
|
|
|
|
|
|
|
|
|
| |||||||||||||||||||
| 40 | FACOR power Ltd. (c) | (1.05 | %) | (654 | ) | (0.97 | %) | (113 | ) | 0.00 | % | — | (0.96 | %) | (113 | ) | ||||||||||||||||||
|
|
|
|
|
|
|
|
|
|
|
|
|
|
|
| |||||||||||||||||||
| Non-controlling interests in all subsidiaries | (24.31 | %) | (15,138 | ) | (29.56 | %) | (3,430 | ) | (84.55 | %) | (93 | ) | (30.08 | %) | (3,523 | ) | ||||||||||||||||||
| Associates (per Equity method) | ||||||||||||||||||||||||||||||||||
| Indian | ||||||||||||||||||||||||||||||||||
| 1 | Gaurav Overseas Private Limited | 0.00 | % | 0 | (0.00 | %) | (0 | ) | 0.00 | % | — | (0.00 | %) | (0 | ) | |||||||||||||||||||
| 2 | Raykal Aluminium Company Private Limited | 0.00 | % | — | 0.00 | % | — | 0.00 | % | — | 0.00 | % | — | |||||||||||||||||||||
| 3 | Rampia Coal Mines & Energy Private Limited | 0.00 | % | — | 0.00 | % | — | 0.00 | % | — | 0.00 | % | — | |||||||||||||||||||||
| Foreign | ||||||||||||||||||||||||||||||||||
| 1 | RoshSkor Township (Pty) Ltd. | 0.00 | % | 3 | (0.00 | %) | (0 | ) | 0.00 | % | — | (0.00 | %) | (0 | ) | |||||||||||||||||||
VEDANTA LIMITED | INTEGRATED REPORT AND ANNUAL ACCOUNTS 2020-21 | 491
CONSOLIDATED CONTINUED...
Notes
forming part of the consolidated financial statements as at and for the year ended 31 March 2021
| Net Assets | ||||||||||||||||||||||||||||||||||
| (Total assets less total | Share in profit and loss | Share in other | Share in total | |||||||||||||||||||||||||||||||
| liabilities) | comprehensive income (OCI) | comprehensive income (TCI) | ||||||||||||||||||||||||||||||||
Sr. | Name of the entity | As at 31 March 2021 | Year ended 31 March 2021 | Year ended 31 March 2021 | Year ended 31 March 2021 | |||||||||||||||||||||||||||||
| As % of consolidated net assets | Amount (₹ in crores) | As % of consolidated profit | Amount (₹ in crores) | As % of consolidated OCI | Amount (₹ in crores) | As % of consolidated TCI | Amount (₹ in crores) | |||||||||||||||||||||||||||
Joint ventures (per Equity method) | ||||||||||||||||||||||||||||||||||
Indian | ||||||||||||||||||||||||||||||||||
| 1 | Madanpur South Coal Company Limited | 0.00 | % | 1 | 0.00 | % | 0 | 0.00 | % | — | 0.00 | % | 0 | |||||||||||||||||||||
| 2 | Goa Maritime Private Limited | (0.00 | %) | (0 | ) | 0.00 | % | 0 | 0.00 | % | — | 0.00 | % | 0 | ||||||||||||||||||||
Foreign | ||||||||||||||||||||||||||||||||||
| 1 | Rosh Pinah Health Care (Proprietary) Limited | 0.00 | % | 1 | (0.00 | %) | (0 | ) | 0.00 | % | — | (0.00 | %) | (0 | ) | |||||||||||||||||||
| 2 | Gergarub Exploration and Mining (Pty) Limited | 0.00 | % | 0 | 0.00 | % | — | 0.00 | % | — | 0.00 | % | — | |||||||||||||||||||||
Consolidation Adjustments/Eliminations (a) | (97.41 | %) | (60,666 | ) | (70.48 | %) | (8,177 | ) | 268.01 | % | 295 | (67.30 | %) | (7,883 | ) | |||||||||||||||||||
|
|
|
|
|
|
|
|
|
|
|
|
|
|
|
| |||||||||||||||||||
| Total | 100.00 | % | 62,278 | 100.00 | % | 11,602 | 100.00 | % | 110 | 100.00 | % | 11,712 | ||||||||||||||||||||||
|
|
|
|
|
|
|
|
|
|
|
|
|
|
|
| |||||||||||||||||||
| (a) | Consolidation adjustments/eliminations include intercompany eliminations , consolidation adjustments and GAAP differences. |
| (b) | Under liquidation (c)Acquired during the year (d)liquidated during the year |
Exchange Rates as at 31 March 2021: 1 AUD= ₹55.7611, 1 USD = ₹73.2973, 1 AED = ₹19.953, 1 NAD = ₹4.9432, 1 ZAR = ₹4.9432, 1 JPY = ₹0.662126
Average Exchange Rates for the year ended 31 March 2021: 1 AUD= ₹53.2235, 1 USD = ₹74.1056, 1 AED = ₹20.173, 1 NAD = ₹4.5269, 1 ZAR = ₹4.5269, 1 JPY = ₹0.699023
492
| < BACK TO CONTENTS | Integrated Report | Statutory reports | Financial statements |
Notes
forming part of the consolidated financial statements as at and for the year ended 31 March 2021
Net Assets (Total assets less total | Share in profit and loss | Share in other comprehensive income (OCI) | Share in total comprehensive income (TCI) | |||||||||||||||||||||||||||||||
Sr. | Name of the entity | As at 31 March 2020 | Year ended 31 March 2020 | Year ended 31 March 2020 | Year ended 31 March 2020 | |||||||||||||||||||||||||||||
| As % of consolidated net assets | Amount (₹ in crores) | As % of consolidated profit | Amount (₹ in crores) | As % of consolidated OCI | Amount (₹ in crores) | As % of consolidated TCI | Amount (₹ in crores) | |||||||||||||||||||||||||||
Parent | ||||||||||||||||||||||||||||||||||
Vedanta Limited | 127.93 | % | 69,895 | 101.02 | % | (6,732 | ) | 45.77 | % | 384 | 108.98 | % | (6,348 | ) | ||||||||||||||||||||
Indian Subsidiaries | ||||||||||||||||||||||||||||||||||
| 1 | Hindustan Zinc Limited | 73.78 | % | 40,311 | (102.12 | %) | 6,805 | (11.92 | %) | (100 | ) | (115.11 | %) | 6,705 | ||||||||||||||||||||
| 2 | Bharat Aluminium Company Limited | 7.23 | % | 3,948 | 1.77 | % | (118 | ) | 0.44 | % | 4 | 1.96 | % | (114 | ) | |||||||||||||||||||
| 3 | MALCO Energy Limited | 0.42 | % | 230 | 3.47 | % | (231 | ) | 0.00 | % | 0 | 3.96 | % | (231 | ) | |||||||||||||||||||
| 4 | Talwandi Sabo Power Limited | 6.01 | % | 3,285 | (10.95 | %) | 730 | (0.05 | %) | (0 | ) | (12.53 | %) | 730 | ||||||||||||||||||||
| 5 | Sesa Resources Limited | 0.02 | % | 10 | 0.72 | % | (48 | ) | (0.15 | %) | (1 | ) | 0.85 | % | (49 | ) | ||||||||||||||||||
| 6 | Sesa Mining Corporation Limited | (0.43 | %) | (233 | ) | 0.57 | % | (38 | ) | (0.41 | %) | (3 | ) | 0.71 | % | (41 | ) | |||||||||||||||||
| 7 | Sterlite Ports Limited | (0.01 | %) | (5 | ) | 0.01 | % | (0 | ) | 0.00 | % | — | 0.01 | % | (0 | ) | ||||||||||||||||||
| 8 | Vizag General Cargo Berth Private Limited | 0.04 | % | 20 | (0.48 | %) | 32 | (0.03 | %) | (0 | ) | (0.54 | %) | 32 | ||||||||||||||||||||
| 9 | Paradip Multi Cargo Berth Private Limited | (0.00 | %) | (2 | ) | 0.00 | % | (0 | ) | 0.00 | % | — | 0.00 | % | (0 | ) | ||||||||||||||||||
| 10 | Maritime Ventures Private Limited | 0.01 | % | 8 | (0.15 | %) | 10 | 0.00 | % | — | (0.17 | %) | 10 | |||||||||||||||||||||
| 11 | Goa Sea Port Private Limited | (0.00 | %) | (1 | ) | 0.00 | % | — | 0.00 | % | — | 0.00 | % | — | ||||||||||||||||||||
| 12 | Vedanta Limited ESOS Trust | 0.09 | % | 47 | 0.00 | % | — | 0.00 | % | — | 0.00 | % | — | |||||||||||||||||||||
| 13 | Electrosteel Steels Limited** | 6.39 | % | 3,493 | 0.33 | % | (22 | ) | (0.06 | %) | (1 | ) | 0.38 | % | (22 | ) | ||||||||||||||||||
Foreign Subsidiaries | ||||||||||||||||||||||||||||||||||
| 1 | Copper Mines of Tasmania Pty Limited | (0.83 | %) | (456 | ) | 1.68 | % | (112 | ) | 0.00 | % | — | 1.92 | % | (112 | ) | ||||||||||||||||||
| 2 | Thalanga copper mines Pty Limited | (0.03 | %) | (17 | ) | 0.06 | % | (4 | ) | 0.00 | % | — | 0.07 | % | (4 | ) | ||||||||||||||||||
| 3 | Monte Cello BV | 0.35 | % | 189 | (0.03 | %) | 2 | 0.00 | % | — | (0.03 | %) | 2 | |||||||||||||||||||||
| 4 | Bloom Fountain Limited | (14.11 | %) | (7,710 | ) | 3.12 | % | (208 | ) | 0.00 | % | — | 3.57 | % | (208 | ) | ||||||||||||||||||
| 5 | Western Cluster Limited | (1.62 | %) | (886 | ) | 0.35 | % | (23 | ) | 0.00 | % | — | 0.39 | % | (23 | ) | ||||||||||||||||||
| 6 | Sterlite (USA) Inc. *** | 0.00 | % | — | 0.00 | % | — | 0.00 | % | — | 0.00 | % | — | |||||||||||||||||||||
| 7 | Fujairah Gold FZC | (0.31 | %) | (170 | ) | 3.23 | % | (215 | ) | 0.00 | % | — | 3.69 | % | (215 | ) | ||||||||||||||||||
| 8 | THL Zinc Ventures Limited | 2.81 | % | 1,533 | 0.00 | % | — | 0.00 | % | — | 0.00 | % | — | |||||||||||||||||||||
| 9 | THL Zinc Limited | 6.68 | % | 3,649 | 0.06 | % | (4 | ) | 0.00 | % | — | 0.07 | % | (4 | ) | |||||||||||||||||||
| 10 | THL Zinc Holding BV | 3.10 | % | 1,692 | (0.03 | %) | 2 | 0.00 | % | — | (0.03 | %) | 2 | |||||||||||||||||||||
| 11 | THL Zinc Namibia Holdings (Proprietary) Limited | 0.95 | % | 520 | 0.00 | % | — | 0.00 | % | — | 0.00 | % | — | |||||||||||||||||||||
| 12 | Skorpion Zinc (Proprietary) Limited | (0.00 | %) | (2 | ) | 0.00 | % | — | 0.00 | % | — | 0.00 | % | — | ||||||||||||||||||||
| 13 | Skorpion Mining Company (Proprietary) Limited | (2.26 | %) | (1,236 | ) | 4.47 | % | (298 | ) | 0.00 | % | — | 5.12 | % | (298 | ) | ||||||||||||||||||
| 14 | Namzinc (Proprietary) Limited | 2.00 | % | 1,094 | 0.78 | % | (52 | ) | 0.00 | % | — | 0.89 | % | (52 | ) | |||||||||||||||||||
| 15 | Amica Guesthouse (Proprietary) Limited | 0.00 | % | 1 | (0.02 | %) | 1 | 0.00 | % | — | (0.02 | %) | 1 | |||||||||||||||||||||
VEDANTA LIMITED | INTEGRATED REPORT AND ANNUAL ACCOUNTS 2020-21 | 493
CONSOLIDATED CONTINUED...
Notes
forming part of the consolidated financial statements as at and for the year ended 31 March 2021
Net Assets (Total assets less total | Share in profit and loss | Share in other comprehensive income (OCI) | Share in total comprehensive income (TCI) | |||||||||||||||||||||||||||||||
Sr. | Name of the entity | As at 31 March 2020 | Year ended 31 March 2020 | Year ended 31 March 2020 | Year ended 31 March 2020 | |||||||||||||||||||||||||||||
| As % of consolidated net assets | Amount (₹ in crores) | As % of consolidated profit | Amount (₹ in crores) | As % of consolidated OCI | Amount (₹ in crores) | As % of consolidated TCI | Amount (₹ in crores) | |||||||||||||||||||||||||||
| 16 | Black Mountain Mining Proprietary Limited | 2.23 | % | 1,218 | 3.23 | % | (215 | ) | 0.16 | % | 1 | 3.67 | % | (214 | ) | |||||||||||||||||||
| 17 | Vedanta Lisheen Holdings Limited | 0.05 | % | 25 | (0.26 | %) | 17 | 0.00 | % | — | (0.29 | %) | 17 | |||||||||||||||||||||
| 18 | Vedanta Lisheen Mining Limited | 0.12 | % | 64 | 0.06 | % | (4 | ) | 0.00 | % | — | 0.07 | % | (4 | ) | |||||||||||||||||||
| 19 | Killoran Lisheen Mining Limited | 0.03 | % | 15 | 0.02 | % | (1 | ) | 0.00 | % | — | 0.02 | % | (1 | ) | |||||||||||||||||||
| 20 | Killoran Lisheen Finance Limited | 0.00 | % | — | 0.00 | % | — | 0.00 | % | — | 0.00 | % | — | |||||||||||||||||||||
| 21 | Lisheen Milling Limited | 0.27 | % | 148 | 0.08 | % | (5 | ) | 0.00 | % | — | 0.09 | % | (5 | ) | |||||||||||||||||||
| 22 | Lisheen Mine Partnership | (0.01 | %) | (8 | ) | 0.09 | % | (6 | ) | 0.00 | % | — | 0.10 | % | (6 | ) | ||||||||||||||||||
| 23 | Lakomasko BV | 0.00 | % | — | 0.00 | % | — | 0.00 | % | — | 0.00 | % | — | |||||||||||||||||||||
| 24 | Vedanta Exploration Ireland Limited | 0.00 | % | 0 | 0.00 | % | — | 0.00 | % | — | 0.00 | % | — | |||||||||||||||||||||
| 25 | Cairn India Holdings Limited | 18.23 | % | 9,961 | (12.58 | %) | 838 | 0.00 | % | — | (14.39 | %) | 838 | |||||||||||||||||||||
| 26 | Cairn Energy Hydrocarbons Limited | 11.53 | % | 6,297 | (11.61 | %) | 774 | 0.00 | % | — | (13.29 | %) | 774 | |||||||||||||||||||||
| 27 | Cairn Lanka (Private) Limited | (0.90 | %) | (492 | ) | 0.02 | % | (1 | ) | 0.00 | % | — | 0.02 | % | (1 | ) | ||||||||||||||||||
| 28 | Cairn South Africa (Pty) Limited | (0.00 | %) | (1 | ) | 0.00 | % | — | 0.00 | % | — | 0.00 | % | — | ||||||||||||||||||||
| 29 | CIG Mauritius Holding Private Limited | 0.00 | % | — | 0.02 | % | (1 | ) | 0.00 | % | — | 0.02 | % | (1 | ) | |||||||||||||||||||
| 30 | CIG Mauritius Private Limited | 0.00 | % | 1 | 0.00 | % | — | 0.00 | % | — | 0.00 | % | — | |||||||||||||||||||||
| 31 | Cairn Energy Discovery Limited | 0.00 | % | 0 | 0.00 | % | (0 | ) | 0.00 | % | — | 0.00 | % | (0 | ) | |||||||||||||||||||
| 32 | Cairn Exploration (No. 2) Limited | 0.00 | % | — | 0.00 | % | — | 0.00 | % | — | 0.00 | % | — | |||||||||||||||||||||
| 33 | Cairn Energy Gujarat Block 1 Limited | 0.00 | % | 2 | 0.00 | % | — | 0.00 | % | — | 0.00 | % | — | |||||||||||||||||||||
| 34 | Cairn Energy India Pty Limited | 0.00 | % | — | 0.00 | % | — | 0.00 | % | — | 0.00 | % | — | |||||||||||||||||||||
| 35 | AvanStrate Inc | (4.09 | %) | (2,235 | ) | 1.05 | % | (70 | ) | 0.00 | % | — | 1.20 | % | (70 | ) | ||||||||||||||||||
| 36 | AvanStrate Korea Inc | (3.53 | %) | (1,926 | ) | (6.60 | %) | 440 | 0.00 | % | — | (7.55 | %) | 440 | ||||||||||||||||||||
| 37 | AvanStrate Taiwan Inc | 6.08 | % | 3,321 | 5.19 | % | (346 | ) | 0.00 | % | — | 5.94 | % | (346 | ) | |||||||||||||||||||
Non-controlling interests in all subsidiaries | (31.32 | %) | (17,112 | ) | 28.81 | % | (1,920 | ) | 14.66 | % | 123 | 30.85 | % | (1,797 | ) | |||||||||||||||||||
Associates (per Equity method) | ||||||||||||||||||||||||||||||||||
Indian | ||||||||||||||||||||||||||||||||||
| 1 | Gaurav Overseas Private Limited | 0.00 | % | 0 | 0.00 | % | (0 | ) | 0.00 | % | — | 0.00 | % | (0 | ) | |||||||||||||||||||
| 2 | Rampia Coal Mines & Energy Private Limited | 0.00 | % | — | 0.00 | % | — | 0.00 | % | — | 0.00 | % | — | |||||||||||||||||||||
Foreign | ||||||||||||||||||||||||||||||||||
| 1 | RoshSkor Township (Pty) Ltd. | 0.00 | % | 3 | 0.00 | % | (0 | ) | 0.00 | % | — | 0.00 | % | (0 | ) | |||||||||||||||||||
Joint ventures (per Equity method) | ||||||||||||||||||||||||||||||||||
Indian | ||||||||||||||||||||||||||||||||||
| 1 | Madanpur South Coal Company Limited | 0.00 | % | 1 | 0.00 | % | (0 | ) | (0.00 | %) | (0 | ) | 0.00 | % | (0 | ) | ||||||||||||||||||
| 2 | Goa Maritime Private Limited | (0.00 | %) | (0 | ) | (0.00 | %) | 0 | 0.00 | % | — | (0.00 | %) | 0 | ||||||||||||||||||||
494
| < BACK TO CONTENTS | Integrated Report | Statutory reports | Financial statements |
Notes
forming part of the consolidated financial statements as at and for the year ended 31 March 2021
Net Assets (Total assets less total | Share in profit and loss | Share in other comprehensive income (OCI) | Share in total comprehensive income (TCI) | |||||||||||||||||||||||
Sr. | Name of the entity | As at 31 March 2020 | Year ended 31 March 2020 | Year ended 31 March 2020 | Year ended 31 March 2020 | |||||||||||||||||||||
| As % of consolidated net assets | Amount | As % of consolidated profit | Amount | As % of consolidated OCI | Amount | As % of consolidated TCI | Amount | |||||||||||||||||||
| Foreign | ||||||||||||||||||||||||||
| 1 | Rosh Pinah Health Care (Proprietary) Limited | 0.00 | % | 1 | (0.01 | %) | 0 | 0.00 | % | — | (0.01 | %) | 0 | |||||||||||||
| Consolidation Adjustments/Eliminations a | (116.88 | %) | (63,859) | 84.71 | % | (5,645) | 51.61 | % | 433 | 89.48 | % | (5,212) | ||||||||||||||
|
|
|
|
|
|
|
|
|
|
|
| |||||||||||||||
| Total | 100.00 | % | 54,635 | 100.00 | % | (6,664) | 100.00 | % | 839 | 100.00 | % | (5,825) | ||||||||||||||
|
|
|
|
|
|
|
|
|
|
|
| |||||||||||||||
| * | Incorporated during the current year **Purchased during the year ***Under liquidation |
| a | Consolidation adjustments/eliminations include intercompany eliminations , consolidation adjustments and GAAP differences. |
Exchange Rates as at 31 March 2020: 1 AUD= ₹45.9423, 1 USD = ₹74.8109, 1 AED = ₹20.365, 1 NAD = ₹4.1812, 1 ZAR = ₹4.1812, 1 JPY = ₹0.691972
Average Exchange Rates for the year ended 31 March 2020: 1 AUD= ₹48.3013, 1 USD = ₹70.8601, 1 AED = ₹19.2895, 1 NAD = ₹4.7931, 1 ZAR = ₹4.7931, 1 JPY = ₹0.651998
As per our report of even date
For S.R. Batliboi & Co. LLP
Chartered Accountants
ICAI Firm Registration No. 301003E/E300005
per Sudhir Soni
Partner
Membership No: 41870
Place: Mumbai
Date: 13 May 2021
For and on behalf of the Board of Directors
Navin Agarwal
Executive Vice-Chairman and Whole-Time Director DIN 00006303
Place: New Delhi
Date: 13 May 2021
Sunil Duggal
Whole-Time Director and Chief Executive Officer
DIN 07291685
Prerna Halwasiya
Company Secretary and Compliance Officer
ICSI Membership No. A20856
VEDANTA LIMITED | INTEGRATED REPORT AND ANNUAL ACCOUNTS 2020-21 | 495
CONSOLIDATED CONTINUED...
Notes
forming part of the consolidated financial statements as at and for the year ended 31 March 2021
FORM AOC-I
Salient features of Subsidiaries pursuant to first proviso to sub-section (3) of Section 129 read with rule 5 of Companies (Accounts) Rules, 2014
| (₹ in crores) | ||||||||||||||||||||||||||||||||||||||||||||||||||
SI. | Name of the | Reporting Period | Reporting currency | Share Capital | Reserves & Surplus | Total Assets | Total Liabilities | Investments (excluding Investment in Subsidiary) | Turnover | Profit/ (Loss) Before Taxation | Provision for Taxation/ (credit) | Profit/ (Loss) After Taxation | Proposed Dividend Proposed - Final Dividend | % of shareholding | ||||||||||||||||||||||||||||||||||||
| 1 | Bharat Aluminium Company Limited | April to March | INR - INDIAN RUPEE | 221 | 4,731 | 13,742 | 8,790 | 1,025 | 9,784 | 1,767 | 717 | 1,050 | 0.00 | 51 | ||||||||||||||||||||||||||||||||||||
| 2 | Copper Mines of Tasmania Pty Limited | April to March | AUD - Australian Dollar | 0 | (531 | ) | 98 | 629 | — | — | 23 | 1 | 22 | 0.00 | 100 | |||||||||||||||||||||||||||||||||||
| 3 | Thalanga Copper Mines Pty Limited | April to March | AUD - Australian Dollar | 3 | (33 | ) | 5 | 35 | — | — | (10 | ) | (1 | ) | (9 | ) | 0.00 | 100 | ||||||||||||||||||||||||||||||||
| 4 | Monte Cello BV | April to March | USD - United States Dollar | 0 | 188 | 208 | 20 | — | — | 3 | — | 3 | 0.00 | 100 | ||||||||||||||||||||||||||||||||||||
| 5 | Hindustan Zinc Limited | April to March | INR - INDIAN RUPEE | 845 | 31,468 45,727 | 13,414 | — | 22,629 | 10,574 | 2,594 | 7,980 | 0.00 | 64.92 | |||||||||||||||||||||||||||||||||||||
| 6 | MALCO Energy Limited | April to March | INR - INDIAN RUPEE | 5 | 270 | 332 | 57 | 2 | — | 45 | — | 45 | 0.00 | 100 | ||||||||||||||||||||||||||||||||||||
| 7 | Fujairah Gold FZC | April to March | AED - Emirati Dirham | 6,702 | (7,057 | ) | 920 | 1,275 | — | 3,267 | (204 | ) | — | (204 | ) | 0.00 | 100 | |||||||||||||||||||||||||||||||||
| 8 | Talwandi Sabo Power Limited | April to March | INR - INDIAN RUPEE | 3,207 | 6 12,278 | 9,065 | — | 3,853 | (97 | ) | (24 | ) | (73 | ) | 0.00 | 100 | ||||||||||||||||||||||||||||||||||
| 9 | Sterlite (USA) Inc.1 | April to March | USD - United States Dollar | 0.00 | 0.00 | — | — | — | — | — | — | — | 0.00 | 100 | ||||||||||||||||||||||||||||||||||||
| 10 | THL Zinc Ventures Limited | April to March | USD - United States Dollar | 125 | 1,376 | 1,503 | 2 | — | — | — | — | — | 0.00 | 100 | ||||||||||||||||||||||||||||||||||||
| 11 | THL Zinc Ltd. | April to March | USD - United States Dollar | 132 | 3,440 | 3,638 | 66 | — | — | (2 | ) | — | (2 | ) | 0.00 | 100 | ||||||||||||||||||||||||||||||||||
| 12 | THL Zinc Holding BV | April to March | USD - United States Dollar | 93 | 1,489 | 3,096 | 1,515 | — | — | 7 | 1 | 6 | 0.00 | 100 | ||||||||||||||||||||||||||||||||||||
| 13 | THL Zinc Namibia Holdings (Proprietary) Ltd. | April to March | NAD - Namibian Dollar | 7 | 607 | 622 | 7 | — | — | 428 | — | 428 | 0.00 | 100 | ||||||||||||||||||||||||||||||||||||
| 14 | Skorpion Zinc (Proprietary) Limited | April to March | NAD - Namibian Dollar | 0 | 10 | 495 | 486 | 7 | — | 439 | — | 439 | 0.00 | 100 | ||||||||||||||||||||||||||||||||||||
| 15 | Skorpion Mining Company (Proprietary) Limited | April to March | NAD - Namibian Dollar | 0 | (1,511 | ) | 1,580 | 3,091 | — | 13 | (46 | ) | — | (46 | ) | 0.00 | 100 | |||||||||||||||||||||||||||||||||
| 16 | Namzinc (Proprietary) Limited | April to March | NAD - Namibian Dollar | 0 | 698 | 2,300 | 1,601 | — | 27 | (106 | ) | — | (106 | ) | 0.00 | 100 | ||||||||||||||||||||||||||||||||||
| 17 | Amica Guesthouse (Proprietary) Limited | April to March | NAD - Namibian Dollar | 0 | 2 | 3 | 1 | — | 4 | 1 | — | 1 | 0.00 | 100 | ||||||||||||||||||||||||||||||||||||
| 18 | Black Mountain Mining (Proprietary) Limited | April to March | ZAR - South African Rand | 0 | 2,058 | 4,715 | 2,657 | — | 2,686 | 790 | 226 | 564 | 0.00 | 74 | ||||||||||||||||||||||||||||||||||||
496
| < BACK TO CONTENTS | Integrated Report | Statutory reports | Financial statements |
Notes
forming part of the consolidated financial statements as at and for the year ended 31 March 2021
FORM AOC-I
Salient features of Subsidiaries pursuant to first proviso to sub-section (3) of Section 129 read with rule 5 of Companies (Accounts) Rules, 2014
| (₹ in crores) | ||||||||||||||||||||||||||||||||||||||||||||||||||
SI. | Name of the | Reporting Period | Reporting | Share Capital | Reserves & Surplus | Total Assets | Total Liabilities | Investments (excluding Investment in Subsidiary) | Turnover | Profit/ (Loss) Before Taxation | Provision for Taxation/ (credit) | Profit/ (Loss) After Taxation | Proposed Dividend - Proposed Final Dividend | % of shareholding | ||||||||||||||||||||||||||||||||||||
19 | Vedanta Lisheen Holdings Limited | April to March | USD - United States Dollar | 0 | 25 | 25 | 1 | — | — | — | — | — | 0.00 | 100 | ||||||||||||||||||||||||||||||||||||
20 | Vedanta Lisheen Mining Limited | April to March | USD - United States Dollar | 0 | 67 | 67 | — | — | — | 3 | 0 | 3 | 0.00 | 100 | ||||||||||||||||||||||||||||||||||||
21 | Killoran Lisheen Mining Limited | April to March | USD - United States Dollar | 0 | 14 | 14 | — | — | — | (0 | ) | 0 | (1 | ) | 0.00 | 100 | ||||||||||||||||||||||||||||||||||
22 | Killoran Lisheen Finance Limited1 | April to March | USD - United States Dollar | — | — | — | — | — | — | — | — | — | 0.00 | 100 | ||||||||||||||||||||||||||||||||||||
23 | Lisheen Milling Limited | April to March | USD - United States Dollar | 0 | 81 | 96 | 14 | — | — | (64 | ) | 1 | (65 | ) | 0.00 | 100 | ||||||||||||||||||||||||||||||||||
24 | Lisheen Mine Partnership | April to March | USD - United States Dollar | — | — | 45 | 45 | — | — | (15 | ) | — | (15 | ) | 0.00 | 100 | ||||||||||||||||||||||||||||||||||
25 | Sterlite Ports Limited | April to March | INR - INDIAN RUPEE | 0 | (5 | ) | 0 | 5 | — | — | (0 | ) | — | (0 | ) | 0.00 | 100 | |||||||||||||||||||||||||||||||||
26 | Vizag General Cargo Berth Private Limited | April to March | INR - INDIAN RUPEE | 47 | (36 | ) | 528 | 517 | 10 | 109 | (24 | ) | (15 | ) | (9 | ) | 0.00 | 100 | ||||||||||||||||||||||||||||||||
27 | Cairn India Holdings Limited | April to March | USD - United States Dollar | 5,538 | 7,019 | 15,568 | 3,011 | 56 | — | 892 | 7 | 886 | 0.00 | 100 | ||||||||||||||||||||||||||||||||||||
28 | Cairn Energy Hydrocarbons Limited | April to March | USD - United States Dollar | 2,522 | 1,919 | 9,995 | 5,554 | 913 | 3,445 | 609 | 276 | 332 | 0.00 | 100 | ||||||||||||||||||||||||||||||||||||
29 | Cairn Lanka (Private) Limited | April to March | USD - United States Dollar | 1,249 | (1,725 | ) | (457 | ) | 19 | — | — | 1 | 0 | 1 | 0.00 | 100 | ||||||||||||||||||||||||||||||||||
30 | Cairn South Africa (Pty) Limited | April to March | USD - United States Dollar | 282 | (282 | ) | — | — | — | — | 1 | — | 1 | 0.00 | 100 | |||||||||||||||||||||||||||||||||||
31 | CIG Mauritius Holding | April to March | USD - United States Dollar | 1,720 | (1,720 | ) | 0 | — | — | — | (0 | ) | — | (0 | ) | 0.00 | 100 | |||||||||||||||||||||||||||||||||
| Private Limited 1 | April to March | USD - United States Dollar | ||||||||||||||||||||||||||||||||||||||||||||||||
32 | CIG Mauritius Private Limited 1 | April to March | USD - United States Dollar | 1,717 | (1,717 | ) | 0 | — | — | — | (0 | ) | — | (0 | ) | 0.00 | 100 | |||||||||||||||||||||||||||||||||
33 | Cairn Energy Discovery Limited3 | April to March | USD - United States Dollar | 0 | (0 | ) | 0 | (0 | ) | — | — | (0 | ) | — | (0 | ) | 0.00 | 100 | ||||||||||||||||||||||||||||||||
34 | Cairn Exploration (No. 2) Limited3 | April to March | USD - United States Dollar | 4 | (4 | ) | 0 | (0 | ) | — | — | — | — | — | 0.00 | 100 | ||||||||||||||||||||||||||||||||||
35 | Cairn Energy Gujarat Block 1 Limited | April to March | USD - United States Dollar | 2 | 0 | 2 | (0 | ) | 2 | — | 0 | — | 0 | 0.00 | 100 | |||||||||||||||||||||||||||||||||||
36 | Cairn Energy India Pty Limited3 | January to December | USD - United States Dollar | (0 | ) | (0 | ) | (0 | ) | 0 | — | — | 0 | — | 0 | 0.00 | 100 | |||||||||||||||||||||||||||||||||
VEDANTA LIMITED | INTEGRATED REPORT AND ANNUAL ACCOUNTS 2020-21 | 497
CONSOLIDATED CONTINUED...
Notes
forming part of the consolidated financial statements as at and for the year ended 31 March 2021
FORM AOC-I
Salient features of Subsidiaries pursuant to first proviso to sub-section (3) of Section 129 read with rule 5 of Companies (Accounts) Rules, 2014
| (₹ in crores) | ||||||||||||||||||||||||||||||||||||||||||||||||||
SI. | Name of the | Reporting Period | Reporting | Share Capital | Reserves & Surplus | Total Assets | Total Liabilities | Investments (excluding Investment in Subsidiary) | Turnover | Profit/ (Loss) Before Taxation | Provision for Taxation/ (credit) | Profit/ (Loss) After Taxation | Proposed Dividend - Proposed Final Dividend | % of shareholding | ||||||||||||||||||||||||||||||||||||
37 | Paradip Multi Cargo Berth Private Limited | April to March | INR - INDIAN RUPEE | 0 | (2 | ) | 4 | 6 | — | — | (0 | ) | — | (0 | ) | 0.00 | 100 | |||||||||||||||||||||||||||||||||
38 | Bloom Fountain Limited | April to March | USD - United States Dollar | 16,411 | (24,190 | ) | 1 | 7,781 | — | — | (233 | ) | — | (233 | ) | 0.00 | 100 | |||||||||||||||||||||||||||||||||
39 | Western Cluster Limited | April to March | USD - United States Dollar | — | (891 | ) | 1 | 892 | — | — | (22 | ) | — | (22 | ) | 0.00 | 100 | |||||||||||||||||||||||||||||||||
40 | Sesa Resources Limited | April to March | INR - INDIAN RUPEE | 1 | 27 | 127 | 99 | — | 58 | 18 | — | 18 | 0.00 | 100 | ||||||||||||||||||||||||||||||||||||
41 | Sesa Mining Corporation Limited | April to March | INR - INDIAN RUPEE | 12 | (176 | ) | 147 | 312 | — | 145 | 69 | — | 69 | 0.00 | 100 | |||||||||||||||||||||||||||||||||||
42 | Vedanta Exploration Ireland Limited1 | April to March | USD - United States Dollar | 0 | — | — | — | — | — | — | — | — | 0.00 | 100 | ||||||||||||||||||||||||||||||||||||
43 | Maritime Vengtures Private Limited | April to March | INR - INDIAN RUPEE | 0 | 20 | 29 | 9 | 18 | 42 | 17 | 5 | 12 | 0.00 | 100 | ||||||||||||||||||||||||||||||||||||
44 | Lakomasko BV | April to March | USD - United States Dollar | 0 | (0 | ) | 0 | 0 | — | — | (0 | ) | — | (0 | ) | 0.00 | 100 | |||||||||||||||||||||||||||||||||
45 | Goa Sea Port Private Limited | April to March | INR - INDIAN RUPEE | 0 | (3 | ) | — | 3 | — | — | (2 | ) | — | (2 | ) | 0.00 | 100 | |||||||||||||||||||||||||||||||||
46 | Vedanta Limited ESOS Trust | April to March | INR - INDIAN RUPEE | 0 | 47 | 324 | 277 | 0.00 | — | 0 | — | 0 | 0.00 | 100 | ||||||||||||||||||||||||||||||||||||
47 | AvanStrate Inc | April to March | JPY -Japanese Yen | 7 | (2,101 | ) | 3,000 | 5,095 | — | — | 42 | (4 | ) | 46 | 0.00 | 51.63 | ||||||||||||||||||||||||||||||||||
48 | AvanStrate Korea Inc | April to March | JPY -Japanese Yen | 848 | (2,782 | ) | 479 | 2,413 | — | 80 | (139 | ) | — | (139 | ) | 0.00 | 51.63 | |||||||||||||||||||||||||||||||||
49 | AvanStrate Taiwan Inc | April to March | JPY -Japanese Yen | 346 | 2,499 | 3,402 | 557 | — | 225 | (102 | ) | — | (102 | ) | 0.00 | 51.63 | ||||||||||||||||||||||||||||||||||
50 | Ferro Alloy Corporation Limited (FACOR)2 | April to March | INR - INDIAN RUPEE | 34 | 343 | 661 | 283 | — | 503 | (753 | ) | 36 | (789 | ) | 0.00 | 100 | ||||||||||||||||||||||||||||||||||
51 | Facor Realty and Infrastructure Limited 2 | April to March | INR - INDIAN RUPEE | — | — | — | — | — | — | — | — | — | 0.00 | 100 | ||||||||||||||||||||||||||||||||||||
52 | FACOR power Ltd.2 | April to March | INR - INDIAN RUPEE | 241 | (895 | ) | 632 | 1,286 | — | (122 | ) | (113 | ) | — | (113 | ) | 0.00 | 100 | ||||||||||||||||||||||||||||||||
53 | Electrosteel Steels Limited | April to March | INR - INDIAN RUPEE | 1,849 | 4,375 11,331 | 5,106 | 409 | 4,771 | (22 | ) | (2,754 | ) | 2,732 | 0.00 | 95.74 | |||||||||||||||||||||||||||||||||||
| a) | Exchange Rates as at 31 March 2021: 1 AUD= ₹55.7611, 1 USD = ₹73.2973, 1 AED = ₹19.953, 1 NAD = ₹4.9432, 1 ZAR = ₹4.9432, 1 JPY = ₹0.662126 |
| b) | Average Exchange Rates for the year ended 31 March 2021: 1 AUD= ₹53.2235, 1 USD = ₹74.1056, 1 AED = ₹20.173, 1 NAD = ₹4.5269, 1 ZAR = ₹4.5269, 1 JPY = ₹0.699023 |
| 1 | Under liquidation |
| 2 | Acquired during the year. |
| 3 | liquidated during the year. |
498
| < BACK TO CONTENTS | Integrated Report | Statutory reports | Financial statements |
Notes
forming part of the consolidated financial statements as at and for the year ended 31 March 2021
FORM AOC-I
Salient features of Associate companies and Joint Ventures pursuant to first proviso to sub-section (3) of Section 129 read with rule 5 of Companies (Accounts) Rules, 2014
| (₹ in crores) | ||||||||||||||||||||||||||||||||||
Sr. No. | Name of Associates/Joint | RoshSkor Township (Pty) Ltd. | Gaurav Overseas Private Limited | Madanpur South Coal Company Limited | Goa Maritime Private Limited | Rampia Coal Mines & Energy Private Limited(a) | Raykal Aluminium Company Private Limited | Rosh Pinah Health Care (Proprietary) Limited | Gergarub Exploration and Mining (Pty) Limited | |||||||||||||||||||||||||
1 | Latest audited Balance sheet date | | 30 June 2020 | | | 31 March 2021 | | | 31 March 2021 | | | 31 March 2021 | | | 31 March 2021 | | | 31 March 2016 | | | 31 December 2020 | | | 30 April 2021 | | |||||||||
2 | Shares of Associate/Joint Ventures held by the Company at the year end | |||||||||||||||||||||||||||||||||
| - Number | 50 | 3,23,000 | 114420.756 | 5,000 | 2,72,29,539 | 12,250 | 69 | 51 | ||||||||||||||||||||||||||
| - Amount of investment (₹ crores) | 0.00 | 0.32 | 1.96 | 0 | 3 | 0 | 0.00 | 0.00 | ||||||||||||||||||||||||||
| - % of holding | 50.00 | % | 50.00 | % | 17.62 | % | 50.00 | % | 17.39 | % | 24.50 | % | 69.00 | % | 51.00 | % | ||||||||||||||||||
3 | Description of how there is significant influence | | By way of ownership | | | By way of ownership | | N.A. | N.A. | N.A. | N.A. | | Joint control of the entity | | | Joint control of the entity | | |||||||||||||||||
4 | Networth attributable to shareholding as per | 2.98 | 0 | 1.21 | -0.06 | — | — | 1.05 | 0.00 | |||||||||||||||||||||||||
| latest audited Balance sheet (₹ crores) | ||||||||||||||||||||||||||||||||||
5 | Profit/(Loss) for the year (₹ crores) | -0.12 | (0 | ) | 0.03 | 0.12 | — | — | -0.09 | 0.00 | ||||||||||||||||||||||||
| (a) | Struck off by the Ministry of Corporate affairs on 19 April 2021. |
For and on behalf of the Board of Directors
| Navin Agarwal | Sunil Duggal | Prerna Halwasiya | ||
| Executive Vice-Chairman and Whole-Time Director | Whole-Time Director and Chief Executive Officer | Company Secretary and Compliance Officer | ||
| DIN 00006303 | DIN 07291685 | ICSI Membership No. A20856 | ||
| Place: New Delhi | ||||
| Date: 13 May 2021 | ||||
VEDANTA LIMITED | INTEGRATED REPORT AND ANNUAL ACCOUNTS 2020-21 | 499