Q2 FY2022 Earnings Presentation VEDANTA LIMITED INVESTOR PRESENTATION 29th Oct 2021 Exhibit 99.5
Cautionary Statement and Disclaimer The views expressed here may contain information derived from publicly available sources that have not been independently verified. No representation or warranty is made as to the accuracy, completeness, reasonableness or reliability of this information. Any forward-looking information in this presentation including, without limitation, any tables, charts and/or graphs, has been prepared on the basis of a number of assumptions which may prove to be incorrect. This presentation should not be relied upon as a recommendation or forecast by Vedanta Resources plc and Vedanta Limited and any of their subsidiaries. Past performance of Vedanta Resources plc and Vedanta Limited and any of their subsidiaries cannot be relied upon as a guide to future performance. This presentation contains 'forward-looking statements' – that is, statements related to future, not past, events. In this context, forward-looking statements often address our expected future business and financial performance, and often contain words such as 'expects,' 'anticipates,' 'intends,' 'plans,' 'believes,' 'seeks,' or 'will.' Forward–looking statements by their nature address matters that are, to different degrees, uncertain. For us, uncertainties arise from the behaviour of financial and metals markets including the London Metal Exchange, fluctuations in interest and or exchange rates and metal prices; from future integration of acquired businesses; and from numerous other matters of national, regional and global scale, including those of a environmental, climatic, natural, political, economic, business, competitive or regulatory nature. These uncertainties may cause our actual future results to be materially different that those expressed in our forward-looking statements. We do not undertake to update our forward-looking statements. We caution you that reliance on any forward-looking statement involves risk and uncertainties, and that, although we believe that the assumption on which our forward-looking statements are based are reasonable, any of those assumptions could prove to be inaccurate and, as a result, the forward-looking statement based on those assumptions could be materially incorrect. This presentation is not intended, and does not, constitute or form part of any offer, invitation or the solicitation of an offer to purchase, otherwise acquire, subscribe for, sell or otherwise dispose of, any securities in Vedanta Resources plc and Vedanta Limited and any of their subsidiaries or undertakings or any other invitation or inducement to engage in investment activities, nor shall this presentation (or any part of it) nor the fact of its distribution form the basis of, or be relied on in connection with, any contract or investment decision.
Contents Section Presenter Page Q2 FY22 Review & Business Update Sunil Duggal, CEO 4 Financial Update Ajay Goel, Acting CFO 22 Appendix 29
Q2 FY2022 Review and Business Update Sunil Duggal Group CEO & Chief Safety Officer VEDANTA LIMITED INVESTOR PRESENTATION Q2 FY2022
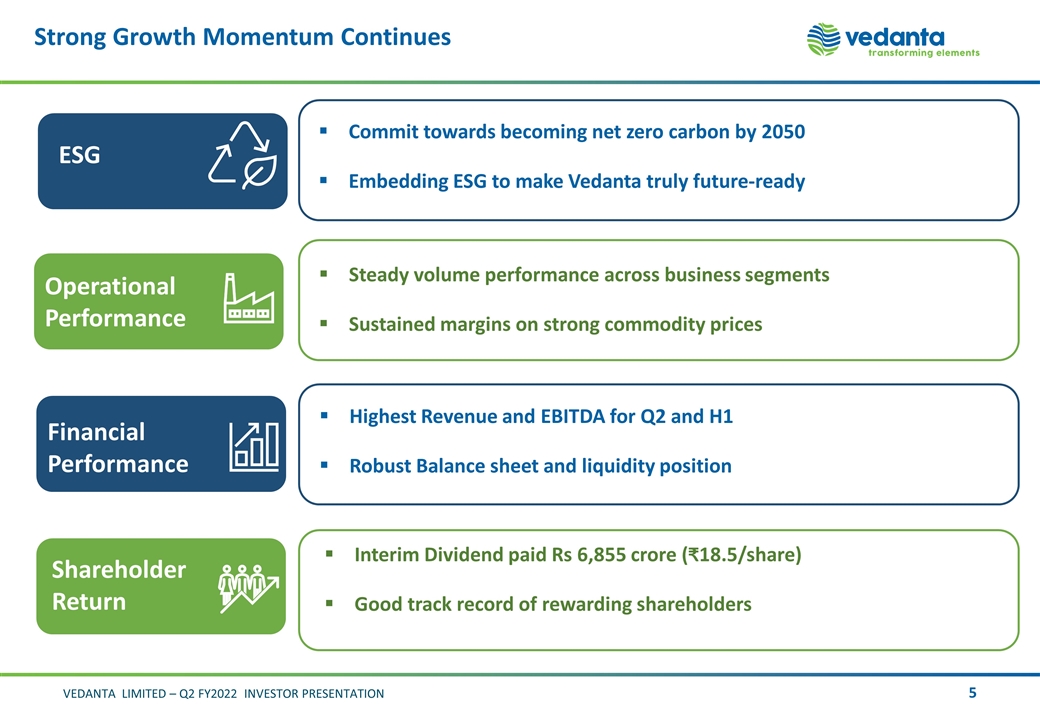
Strong Growth Momentum Continues ESG Operational Performance Financial Performance Shareholder Return Commit towards becoming net zero carbon by 2050 Embedding ESG to make Vedanta truly future-ready Steady volume performance across business segments Sustained margins on strong commodity prices Highest Revenue and EBITDA for Q2 and H1 Robust Balance sheet and liquidity position Interim Dividend paid Rs 6,855 crore ( 18.5/share) Good track record of rewarding shareholders
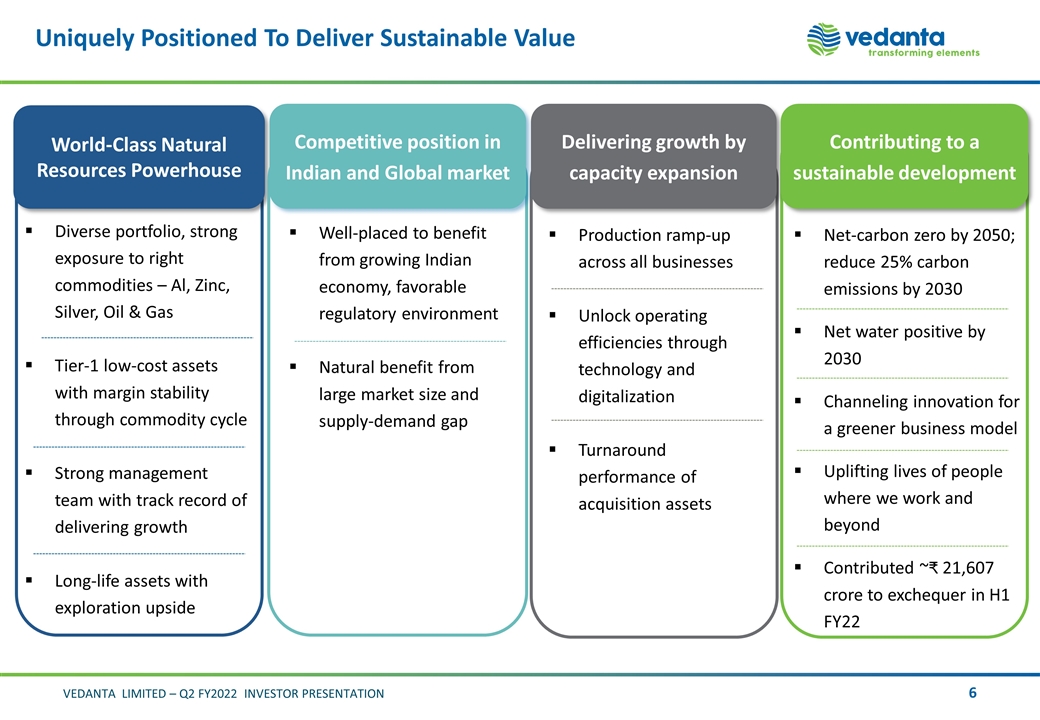
Uniquely Positioned To Deliver Sustainable Value Delivering growth by capacity expansion Contributing to a sustainable development World-Class Natural Resources Powerhouse Competitive position in Indian and Global market Diverse portfolio, strong exposure to right commodities – Al, Zinc, Silver, Oil & Gas Tier-1 low-cost assets with margin stability through commodity cycle Strong management team with track record of delivering growth Long-life assets with exploration upside Well-placed to benefit from growing Indian economy, favorable regulatory environment Natural benefit from large market size and supply-demand gap Production ramp-up across all businesses Unlock operating efficiencies through technology and digitalization Turnaround performance of acquisition assets Net-carbon zero by 2050; reduce 25% carbon emissions by 2030 Net water positive by 2030 Channeling innovation for a greener business model Uplifting lives of people where we work and beyond Contributed ~ 21,607 crore to exchequer in H1 FY22
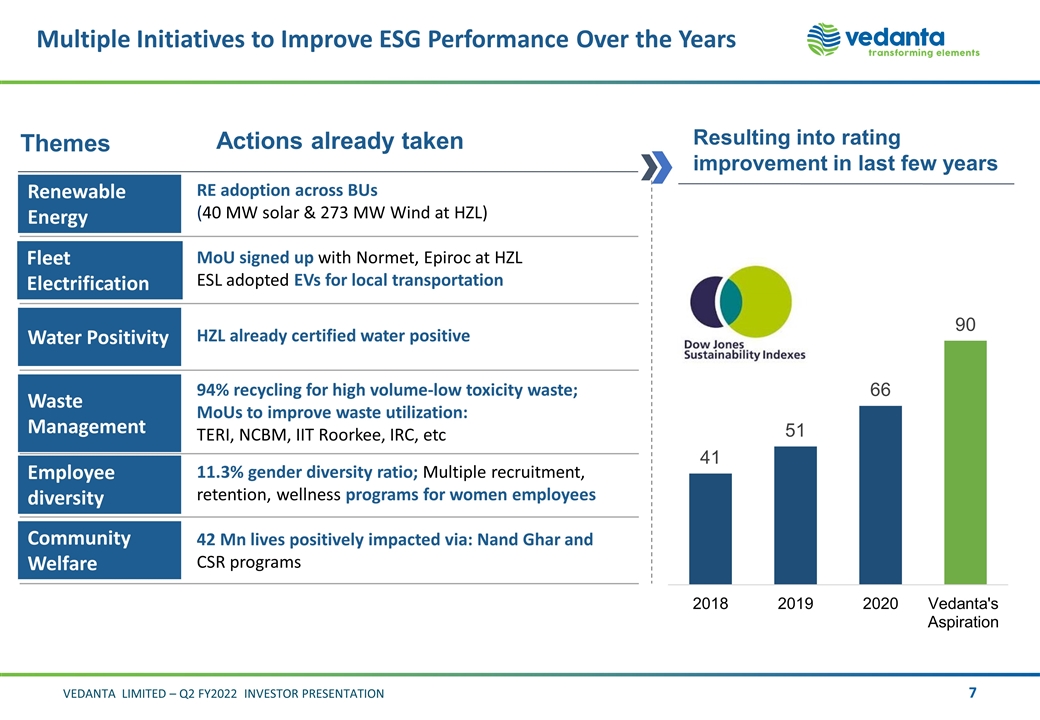
Themes Resulting into rating improvement in last few years RE adoption across BUs (40 MW solar & 273 MW Wind at HZL) Renewable Energy Fleet Electrification MoU signed up with Normet, Epiroc at HZL ESL adopted EVs for local transportation Water Positivity HZL already certified water positive Waste Management 94% recycling for high volume-low toxicity waste; MoUs to improve waste utilization: TERI, NCBM, IIT Roorkee, IRC, etc Employee diversity 11.3% gender diversity ratio; Multiple recruitment, retention, wellness programs for women employees Community Welfare 42 Mn lives positively impacted via: Nand Ghar and CSR programs Actions already taken Multiple Initiatives to Improve ESG Performance Over the Years
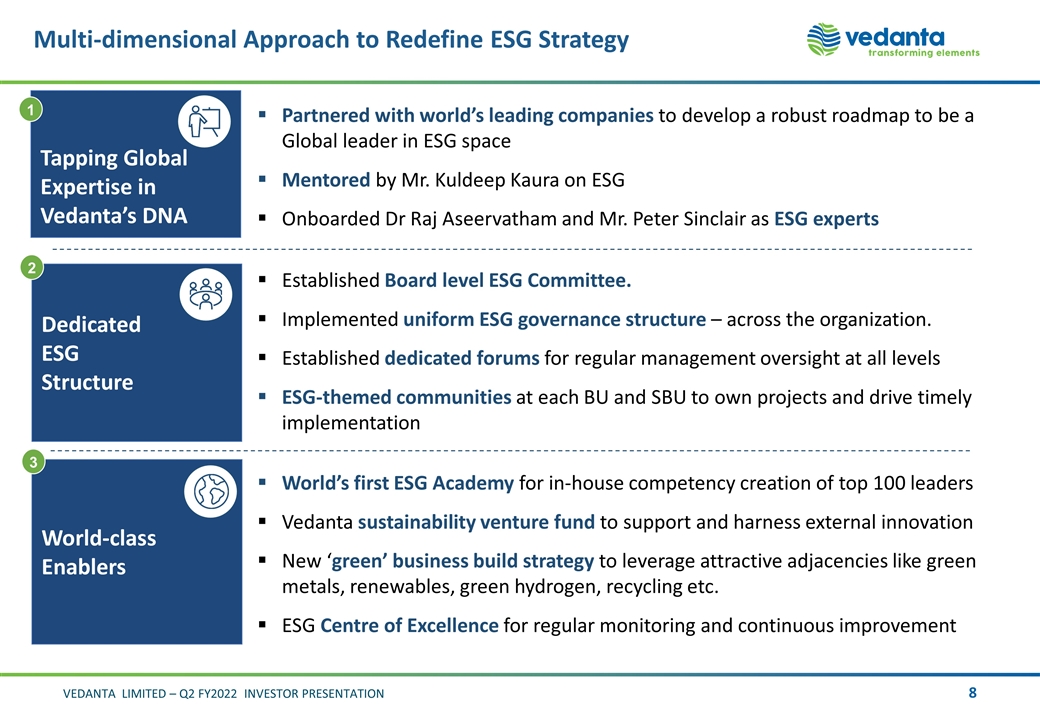
Multi-dimensional Approach to Redefine ESG Strategy Partnered with world’s leading companies to develop a robust roadmap to be a Global leader in ESG space Mentored by Mr. Kuldeep Kaura on ESG Onboarded Dr Raj Aseervatham and Mr. Peter Sinclair as ESG experts Tapping Global Expertise in Vedanta’s DNA 1 Dedicated ESG Structure 2 Established Board level ESG Committee. Implemented uniform ESG governance structure – across the organization. Established dedicated forums for regular management oversight at all levels ESG-themed communities at each BU and SBU to own projects and drive timely implementation World’s first ESG Academy for in-house competency creation of top 100 leaders Vedanta sustainability venture fund to support and harness external innovation New ‘green’ business build strategy to leverage attractive adjacencies like green metals, renewables, green hydrogen, recycling etc. ESG Centre of Excellence for regular monitoring and continuous improvement World-class Enablers 3
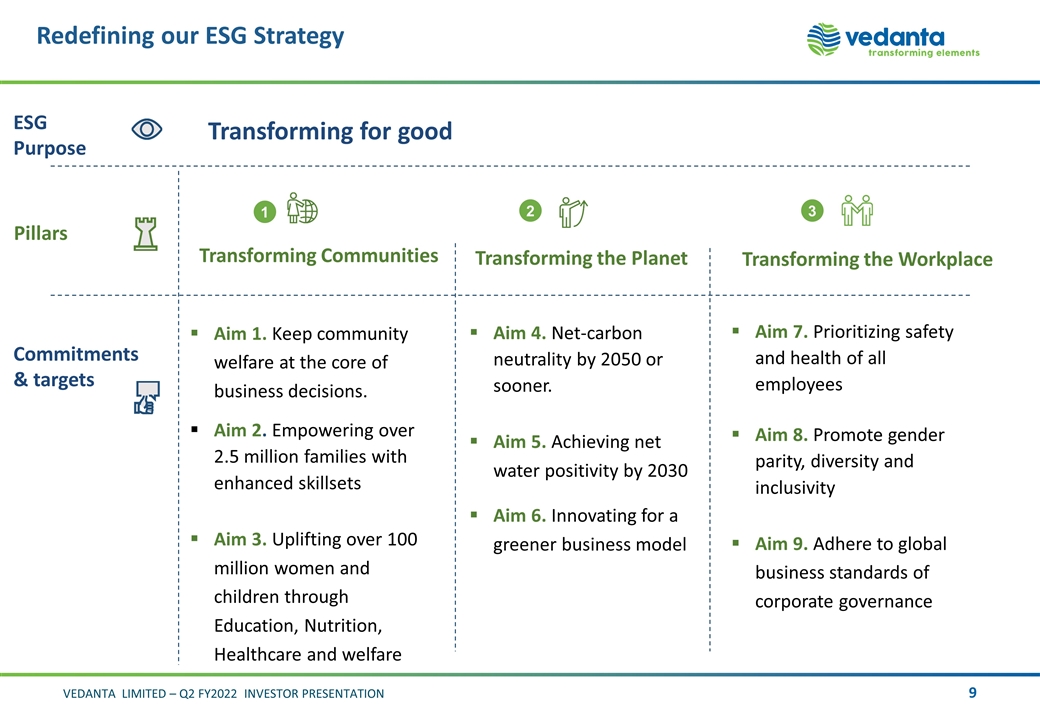
Redefining our ESG Strategy Commitments & targets Pillars 3 2 1 Transforming for good ESG Purpose Transforming Communities Transforming the Planet Transforming the Workplace Aim 1. Keep community welfare at the core of business decisions. Aim 2. Empowering over 2.5 million families with enhanced skillsets Aim 3. Uplifting over 100 million women and children through Education, Nutrition, Healthcare and welfare Aim 4. Net-carbon neutrality by 2050 or sooner. Aim 5. Achieving net water positivity by 2030 Aim 6. Innovating for a greener business model Aim 7. Prioritizing safety and health of all employees Aim 8. Promote gender parity, diversity and inclusivity Aim 9. Adhere to global business standards of corporate governance
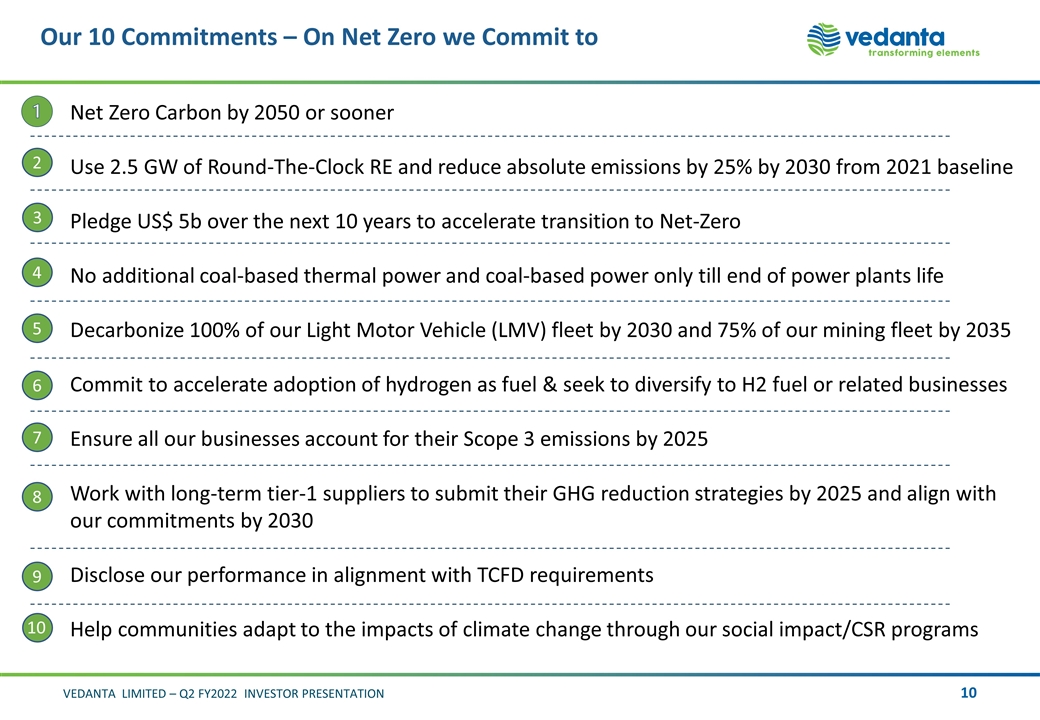
Our 10 Commitments – On Net Zero we Commit to Net Zero Carbon by 2050 or sooner Use 2.5 GW of Round-The-Clock RE and reduce absolute emissions by 25% by 2030 from 2021 baseline Pledge US$ 5b over the next 10 years to accelerate transition to Net-Zero No additional coal-based thermal power and coal-based power only till end of power plants life Decarbonize 100% of our Light Motor Vehicle (LMV) fleet by 2030 and 75% of our mining fleet by 2035 Commit to accelerate adoption of hydrogen as fuel & seek to diversify to H2 fuel or related businesses Ensure all our businesses account for their Scope 3 emissions by 2025 Work with long-term tier-1 suppliers to submit their GHG reduction strategies by 2025 and align with our commitments by 2030 Disclose our performance in alignment with TCFD requirements Help communities adapt to the impacts of climate change through our social impact/CSR programs 2 3 4 5 6 7 8 9 10
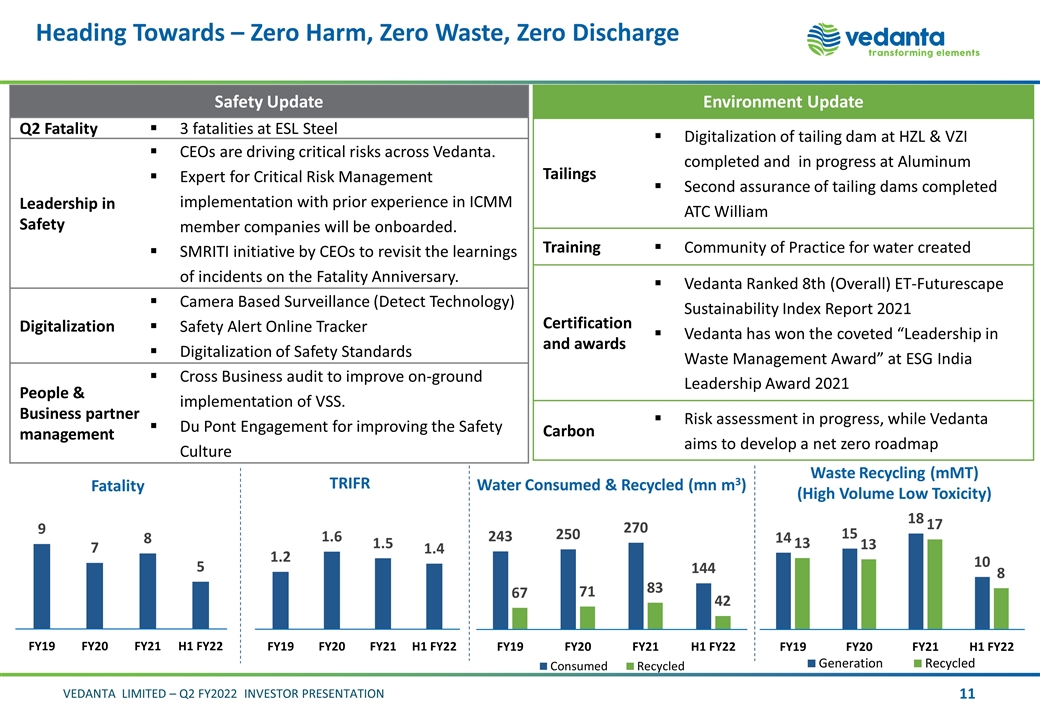
Heading Towards – Zero Harm, Zero Waste, Zero Discharge Water Consumed & Recycled (mn m3) Waste Recycling (mMT) (High Volume Low Toxicity) Safety Update Q2 Fatality 3 fatalities at ESL Steel Leadership in Safety CEOs are driving critical risks across Vedanta. Expert for Critical Risk Management implementation with prior experience in ICMM member companies will be onboarded. SMRITI initiative by CEOs to revisit the learnings of incidents on the Fatality Anniversary. Digitalization Camera Based Surveillance (Detect Technology) Safety Alert Online Tracker Digitalization of Safety Standards People & Business partner management Cross Business audit to improve on-ground implementation of VSS. Du Pont Engagement for improving the Safety Culture Environment Update Tailings Digitalization of tailing dam at HZL & VZI completed and in progress at Aluminum Second assurance of tailing dams completed ATC William Training Community of Practice for water created Certification and awards Vedanta Ranked 8th (Overall) ET-Futurescape Sustainability Index Report 2021 Vedanta has won the coveted “Leadership in Waste Management Award” at ESG India Leadership Award 2021 Carbon Risk assessment in progress, while Vedanta aims to develop a net zero roadmap TRIFR Fatality
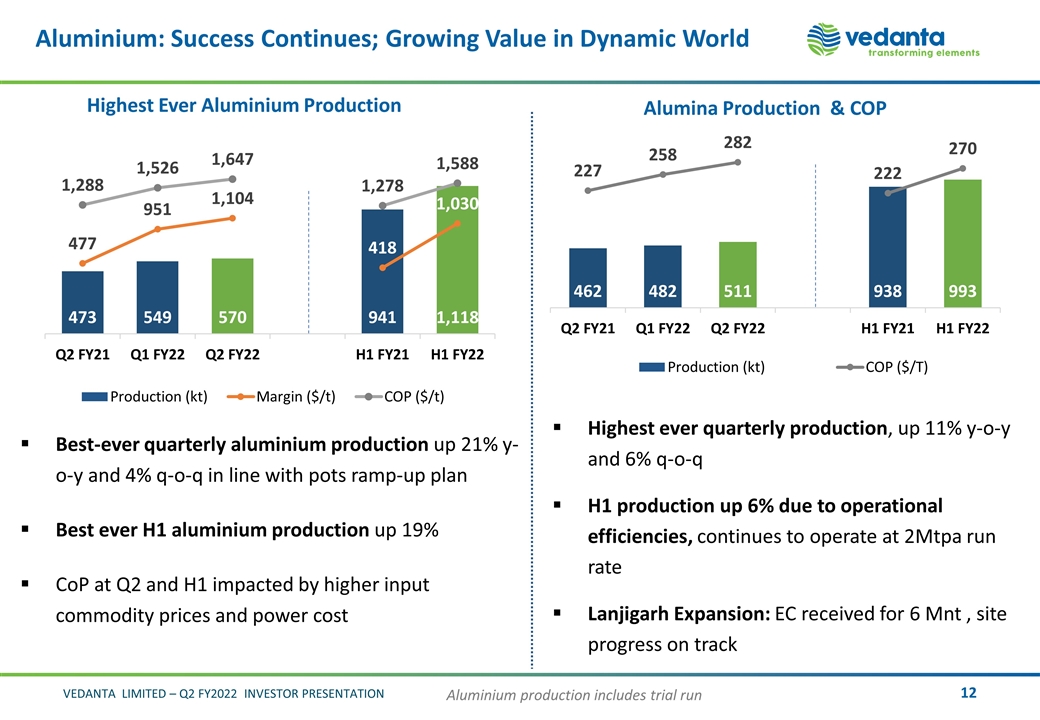
Aluminium: Success Continues; Growing Value in Dynamic World Highest Ever Aluminium Production Alumina Production & COP Aluminium production includes trial run Best-ever quarterly aluminium production up 21% y-o-y and 4% q-o-q in line with pots ramp-up plan Best ever H1 aluminium production up 19% CoP at Q2 and H1 impacted by higher input commodity prices and power cost Highest ever quarterly production, up 11% y-o-y and 6% q-o-q H1 production up 6% due to operational efficiencies, continues to operate at 2Mtpa run rate Lanjigarh Expansion: EC received for 6 Mnt , site progress on track
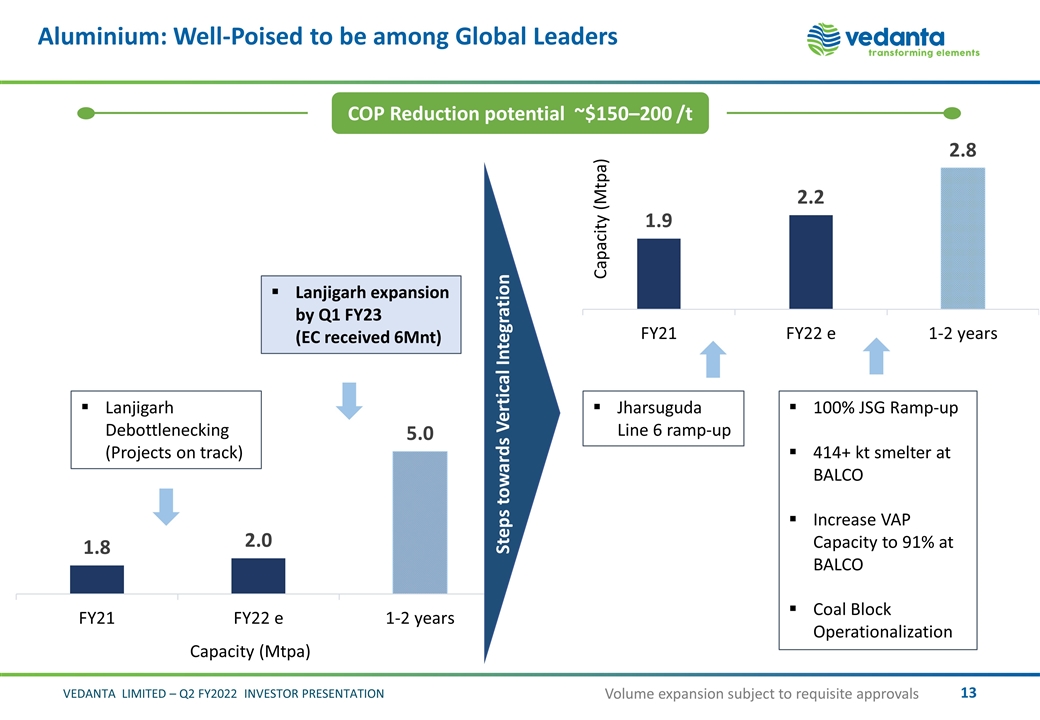
Jharsuguda Line 6 ramp-up 100% JSG Ramp-up 414+ kt smelter at BALCO Increase VAP Capacity to 91% at BALCO Coal Block Operationalization Step towards Vertical Integration Lanjigarh expansion by Q1 FY23 (EC received 6Mnt) Lanjigarh Debottlenecking (Projects on track) Aluminium: Well-Poised to be among Global Leaders Steps towards Vertical Integration COP Reduction potential ~$150–200 /t Volume expansion subject to requisite approvals
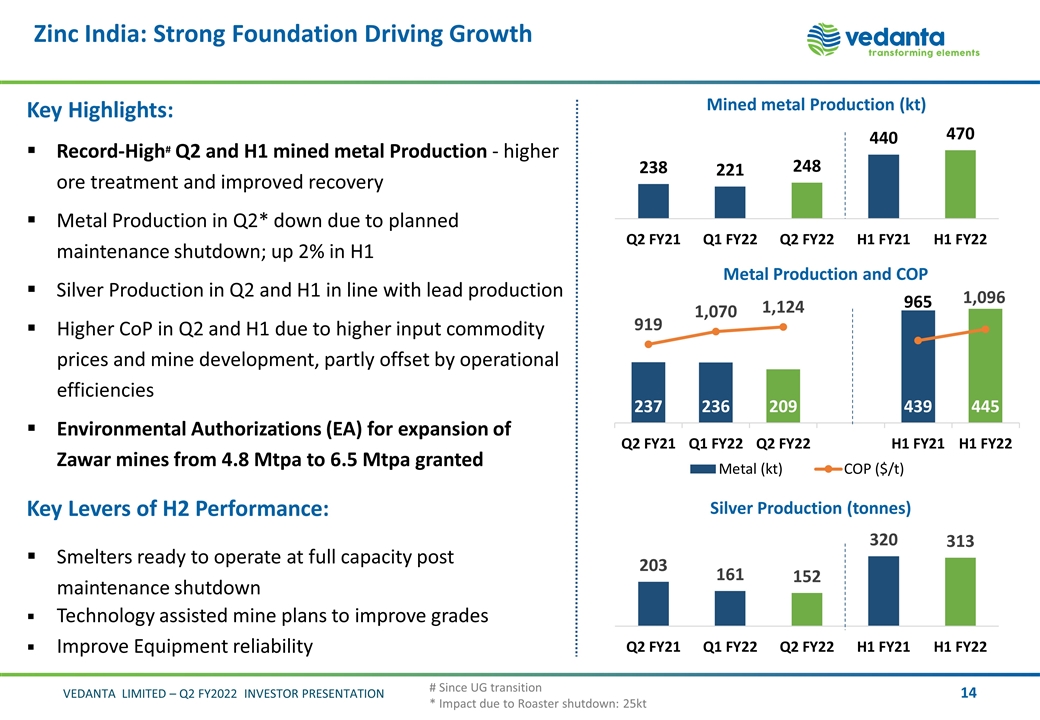
Mined metal Production (kt) Metal Production and COP Key Highlights: Record-High# Q2 and H1 mined metal Production - higher ore treatment and improved recovery Metal Production in Q2* down due to planned maintenance shutdown; up 2% in H1 Silver Production in Q2 and H1 in line with lead production Higher CoP in Q2 and H1 due to higher input commodity prices and mine development, partly offset by operational efficiencies Environmental Authorizations (EA) for expansion of Zawar mines from 4.8 Mtpa to 6.5 Mtpa granted Key Levers of H2 Performance: Smelters ready to operate at full capacity post maintenance shutdown Technology assisted mine plans to improve grades Improve Equipment reliability # Since UG transition * Impact due to Roaster shutdown: 25kt Zinc India: Strong Foundation Driving Growth Silver Production (tonnes)
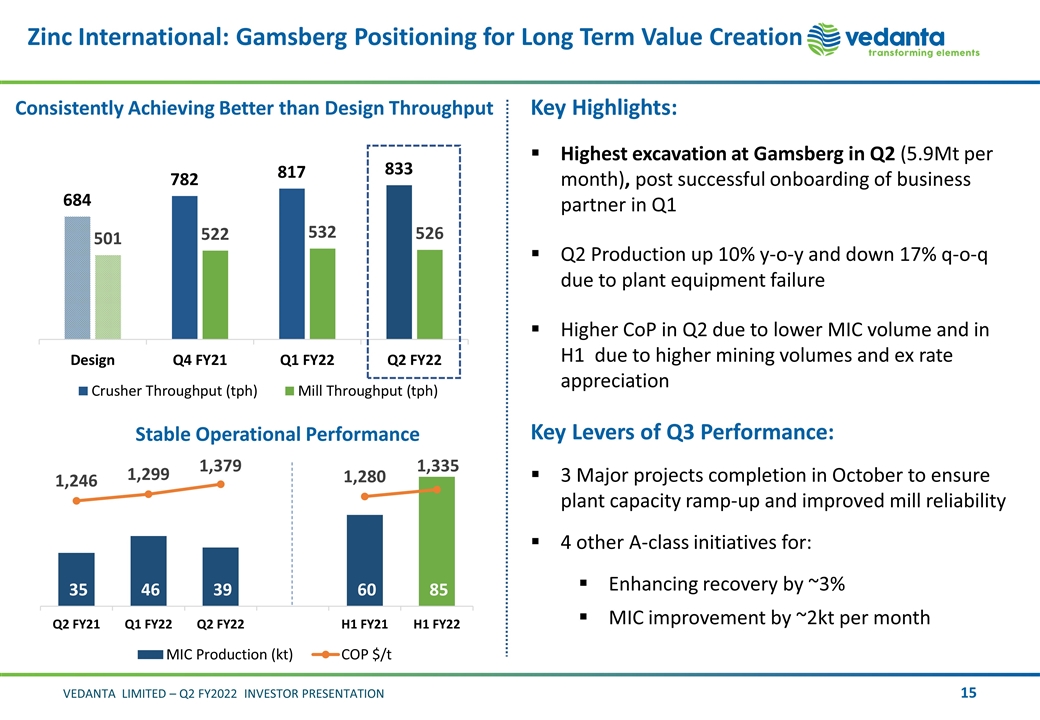
Zinc International: Gamsberg Positioning for Long Term Value Creation Consistently Achieving Better than Design Throughput Stable Operational Performance Key Highlights: Highest excavation at Gamsberg in Q2 (5.9Mt per month), post successful onboarding of business partner in Q1 Q2 Production up 10% y-o-y and down 17% q-o-q due to plant equipment failure Higher CoP in Q2 due to lower MIC volume and in H1 due to higher mining volumes and ex rate appreciation Key Levers of Q3 Performance: 3 Major projects completion in October to ensure plant capacity ramp-up and improved mill reliability 4 other A-class initiatives for: Enhancing recovery by ~3% MIC improvement by ~2kt per month
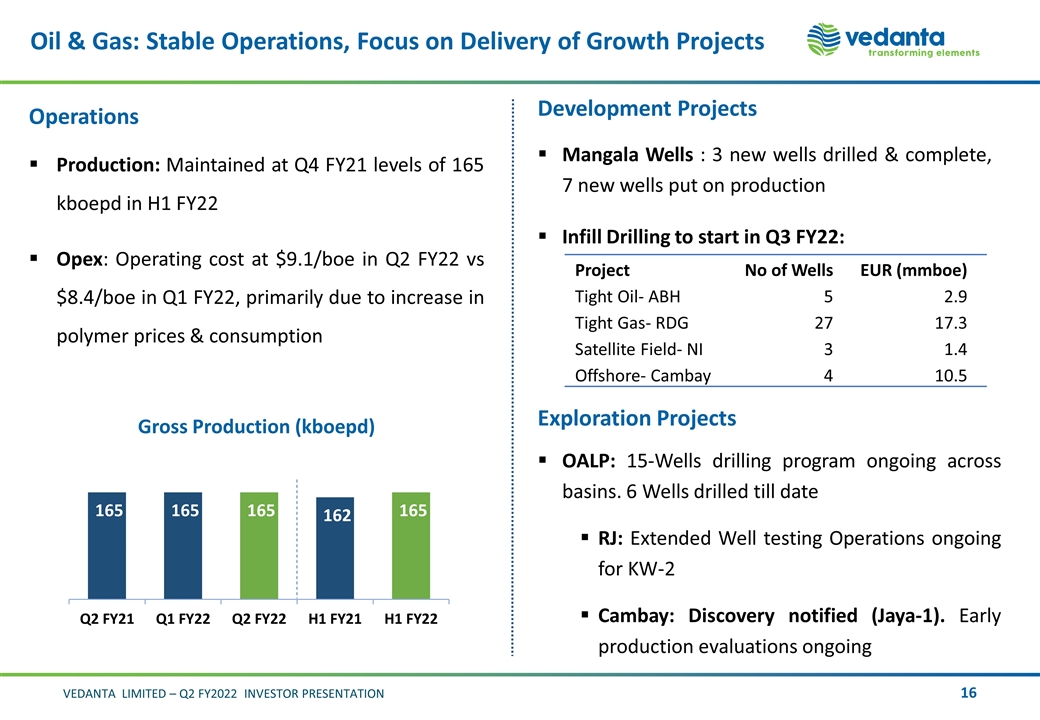
Oil & Gas: Stable Operations, Focus on Delivery of Growth Projects Gross Production (kboepd) Operations Production: Maintained at Q4 FY21 levels of 165 kboepd in H1 FY22 Opex: Operating cost at $9.1/boe in Q2 FY22 vs $8.4/boe in Q1 FY22, primarily due to increase in polymer prices & consumption Development Projects Mangala Wells : 3 new wells drilled & complete, 7 new wells put on production Infill Drilling to start in Q3 FY22: Exploration Projects OALP: 15-Wells drilling program ongoing across basins. 6 Wells drilled till date RJ: Extended Well testing Operations ongoing for KW-2 Cambay: Discovery notified (Jaya-1). Early production evaluations ongoing Project No of Wells EUR (mmboe) Tight Oil- ABH 5 2.9 Tight Gas- RDG 27 17.3 Satellite Field- NI 3 1.4 Offshore- Cambay 4 10.5
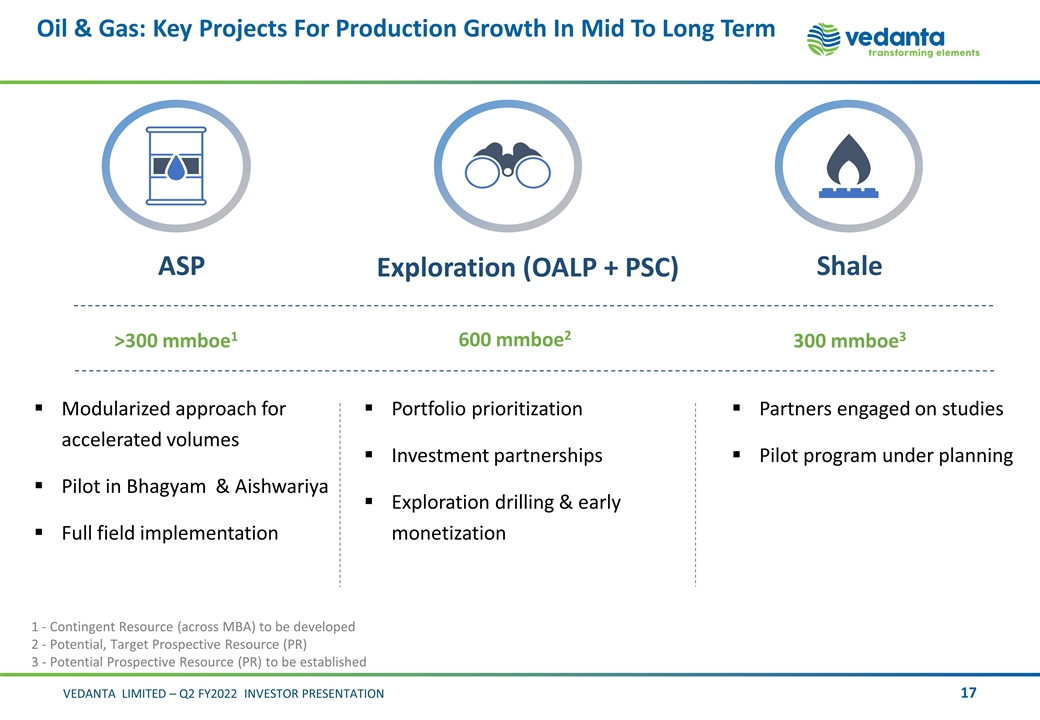
Oil & Gas: Key Projects For Production Growth In Mid To Long Term Modularized approach for accelerated volumes Pilot in Bhagyam & Aishwariya Full field implementation Portfolio prioritization Investment partnerships Exploration drilling & early monetization Partners engaged on studies Pilot program under planning ASP Exploration (OALP + PSC) >300 mmboe1 300 mmboe3 600 mmboe2 Shale 1 - Contingent Resource (across MBA) to be developed 2 - Potential, Target Prospective Resource (PR) 3 - Potential Prospective Resource (PR) to be established
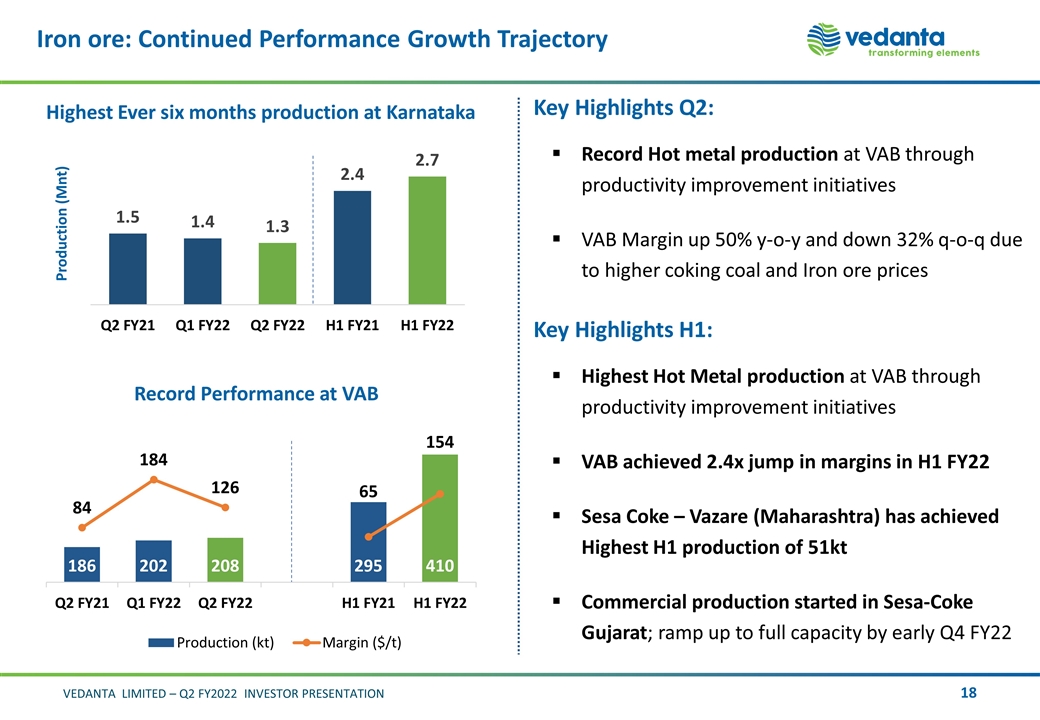
Iron ore: Continued Performance Growth Trajectory Highest Ever six months production at Karnataka Production (Mnt) Key Highlights Q2: Record Hot metal production at VAB through productivity improvement initiatives VAB Margin up 50% y-o-y and down 32% q-o-q due to higher coking coal and Iron ore prices Key Highlights H1: Highest Hot Metal production at VAB through productivity improvement initiatives VAB achieved 2.4x jump in margins in H1 FY22 Sesa Coke – Vazare (Maharashtra) has achieved Highest H1 production of 51kt Commercial production started in Sesa-Coke Gujarat; ramp up to full capacity by early Q4 FY22 Record Performance at VAB
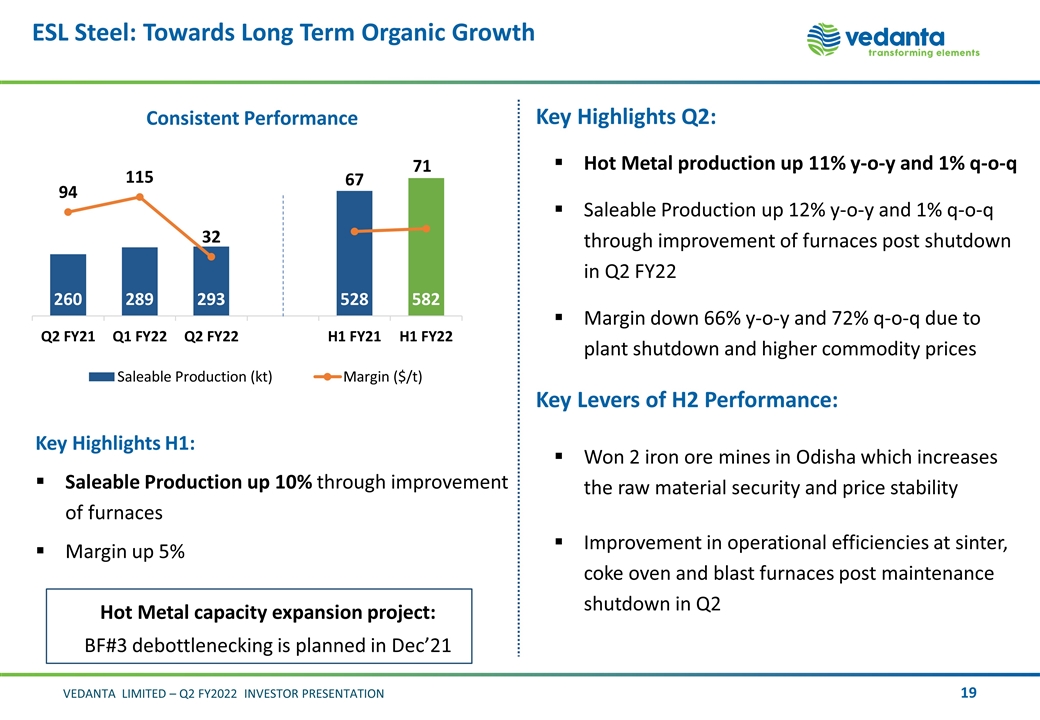
ESL Steel: Towards Long Term Organic Growth Key Highlights Q2: Hot Metal production up 11% y-o-y and 1% q-o-q Saleable Production up 12% y-o-y and 1% q-o-q through improvement of furnaces post shutdown in Q2 FY22 Margin down 66% y-o-y and 72% q-o-q due to plant shutdown and higher commodity prices Key Levers of H2 Performance: Won 2 iron ore mines in Odisha which increases the raw material security and price stability Improvement in operational efficiencies at sinter, coke oven and blast furnaces post maintenance shutdown in Q2 Key Highlights H1: Saleable Production up 10% through improvement of furnaces Margin up 5% Consistent Performance Hot Metal capacity expansion project: BF#3 debottlenecking is planned in Dec’21

FACOR: Delivering Stronger Growth Key Highlights Q2: Achieved highest quarterly Fe Chrome production; plant productivity enhancement by ~10% Highest quarterly EBITDA margin ~14x y-o-y and 54% q-o-q supported by increase in NSR Ore production up 119% y-o-y through continuous operations of both the mines and down 81% q-o-q due to monsoon Key Highlights H1: Fe Chrome production up 17% with Record Ore production 3x Highest EBITDA margin ~9.6x Ore Production (kt) Strong Performance Continues FACOR is reviving its project for another furnace to increase production by 60 ktpa
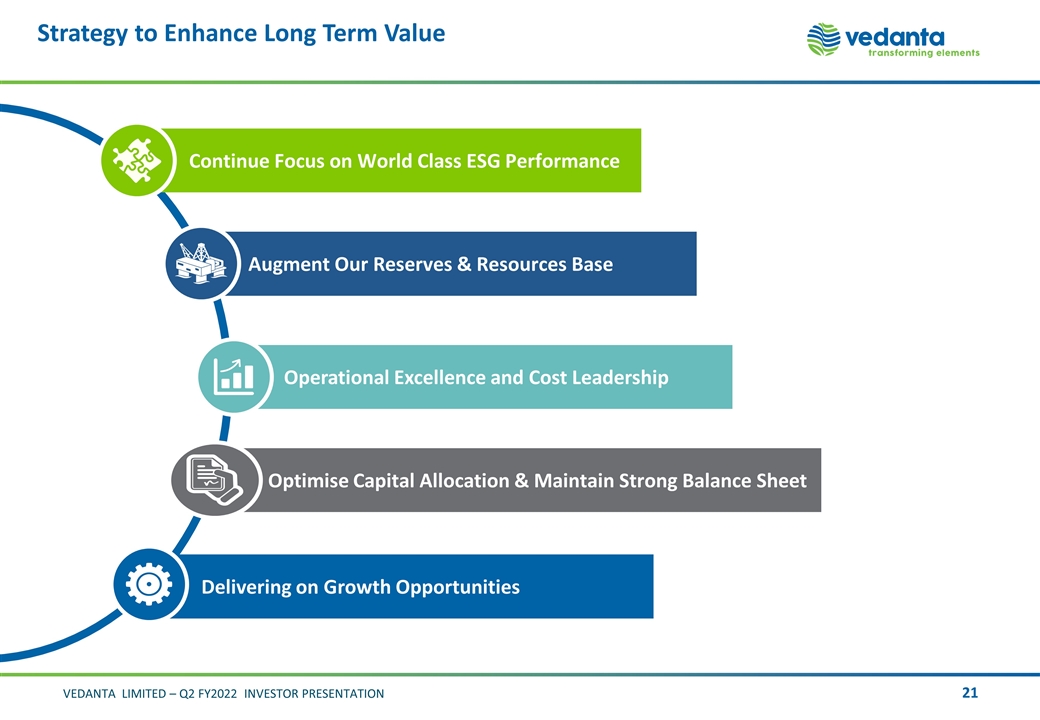
Strategy to Enhance Long Term Value Continue Focus on World Class ESG Performance Augment Our Reserves & Resources Base Delivering on Growth Opportunities Optimise Capital Allocation & Maintain Strong Balance Sheet Operational Excellence and Cost Leadership
Finance Update Ajay Goel Acting Chief Financial Officer VEDANTA LIMITED INVESTOR PRESENTATION Q2 FY2022
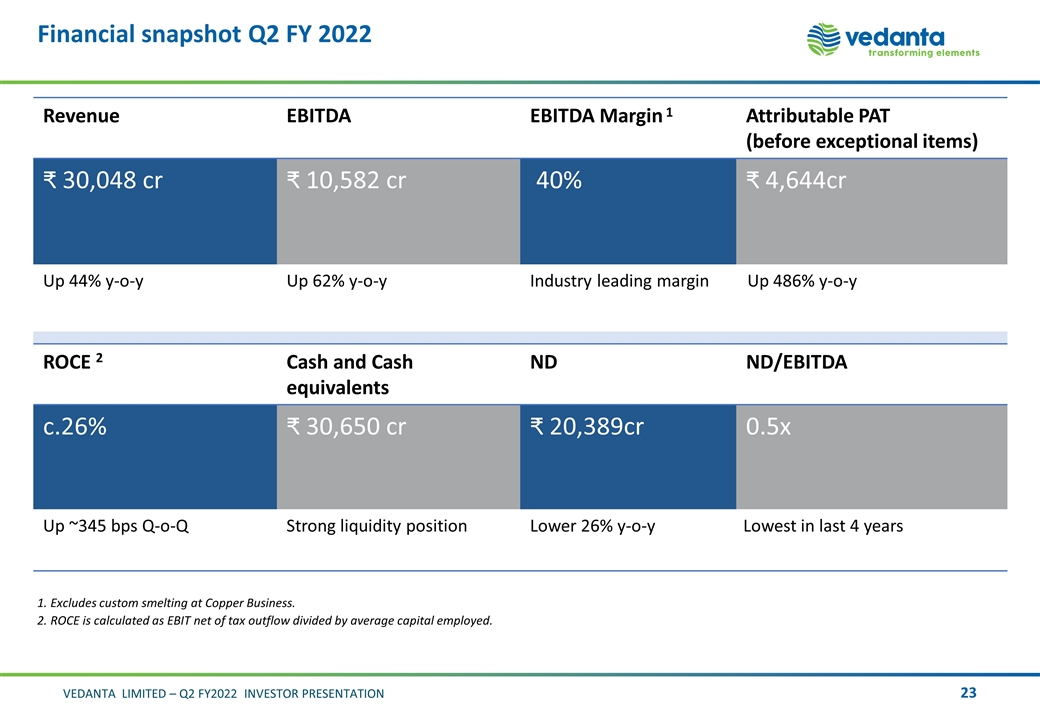
Financial snapshot Q2 FY 2022 Revenue EBITDA EBITDA Margin 1 Attributable PAT (before exceptional items) ₹ 30,048 cr ₹ 10,582 cr 40% 4,644cr Up 44% y-o-y Up 62% y-o-y Industry leading margin Up 486% y-o-y ROCE 2 Cash and Cash equivalents ND ND/EBITDA c.26% ₹ 30,650 cr 20,389cr 0.5x Up ~345 bps Q-o-Q Strong liquidity position Lower 26% y-o-y Lowest in last 4 years 1. Excludes custom smelting at Copper Business. 2. ROCE is calculated as EBIT net of tax outflow divided by average capital employed.
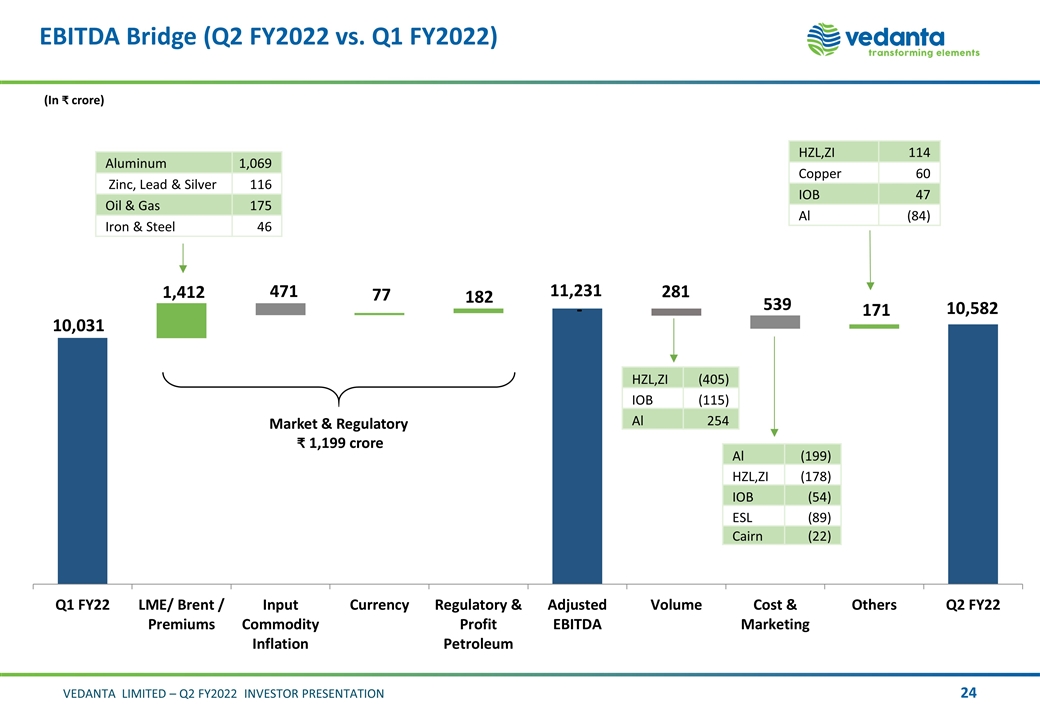
(In crore) Market & Regulatory 1,199 crore Aluminum 1,069 Zinc, Lead & Silver 116 Oil & Gas 175 Iron & Steel 46 HZL,ZI 114 Copper 60 IOB 47 Al (84) HZL,ZI (405) IOB (115) Al 254 Al (199) HZL,ZI (178) IOB (54) ESL (89) Cairn (22) EBITDA Bridge (Q2 FY2022 vs. Q1 FY2022)
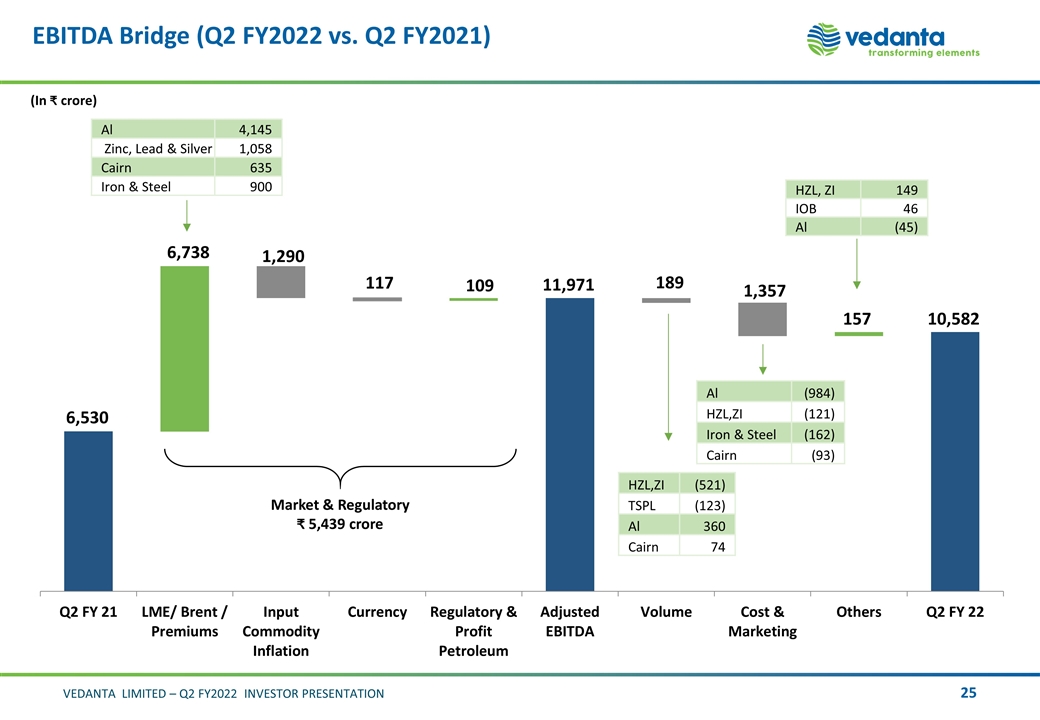
(In crore) Market & Regulatory 5,439 crore Al 4,145 Zinc, Lead & Silver 1,058 Cairn 635 Iron & Steel 900 HZL,ZI (521) TSPL (123) Al 360 Cairn 74 HZL, ZI 149 IOB 46 Al (45) 11,971 Al (984) HZL,ZI (121) Iron & Steel (162) Cairn (93) 6,530 EBITDA Bridge (Q2 FY2022 vs. Q2 FY2021)
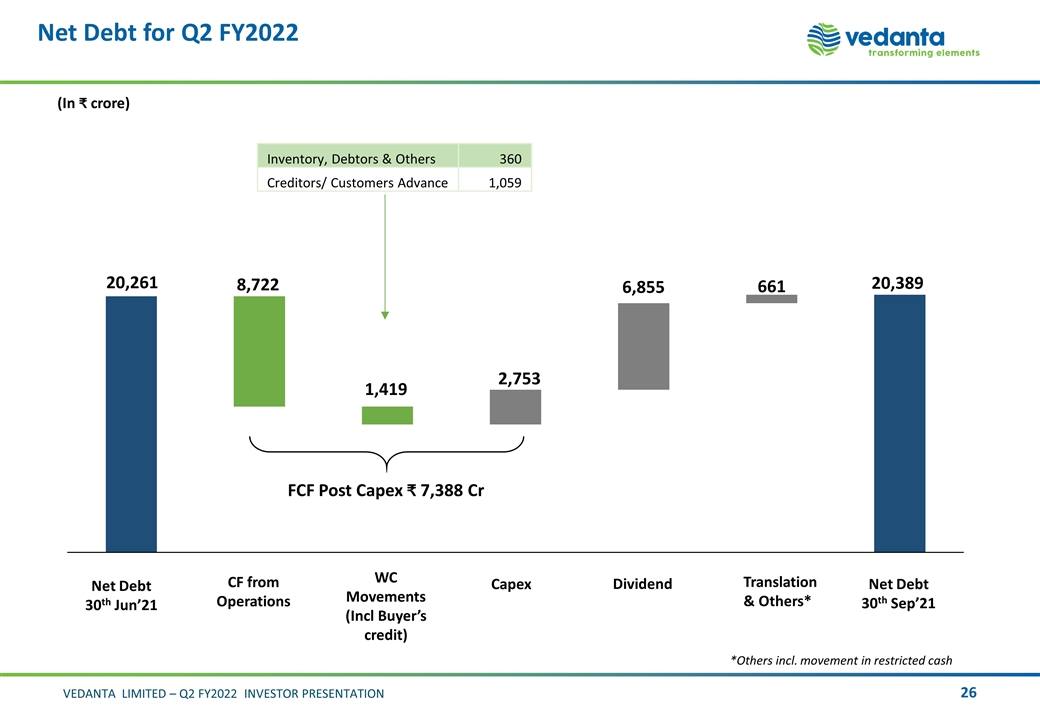
Net Debt for Q2 FY2022 (In ₹ crore) (Incl Buyer’s credit) Capex Net Debt 30th Sep’21 Net Debt 30th Jun’21 Dividend Translation & Others* *Others incl. movement in restricted cash Inventory, Debtors & Others 360 Creditors/ Customers Advance 1,059
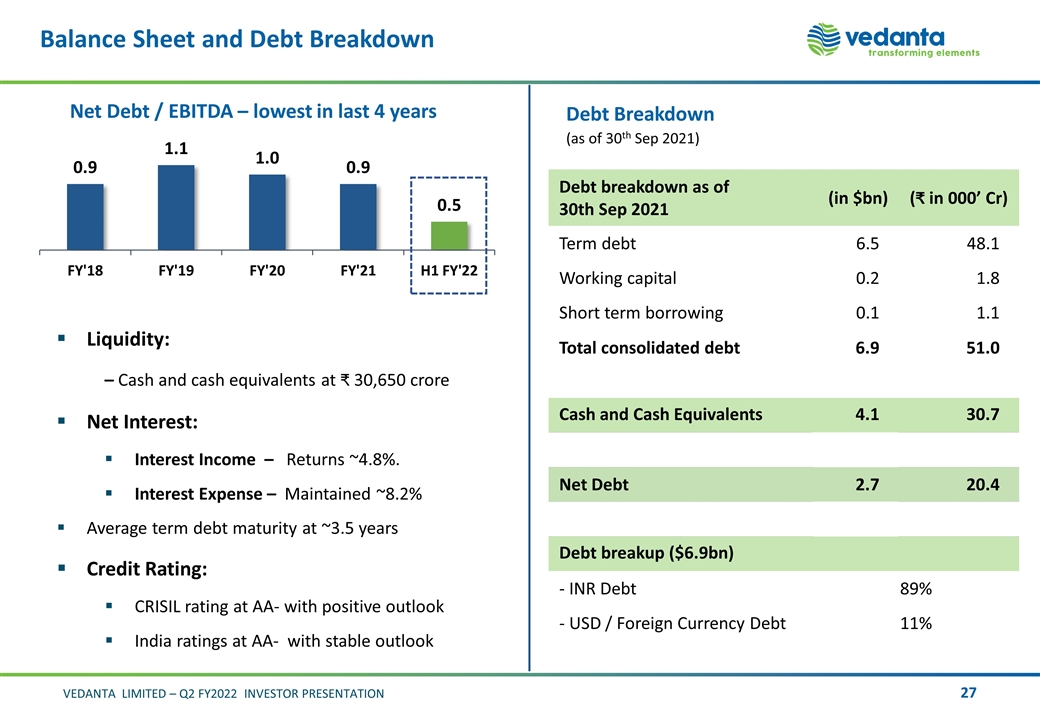
Balance Sheet and Debt Breakdown Net Debt / EBITDA – lowest in last 4 years Liquidity: – Cash and cash equivalents at 30,650 crore Net Interest: Interest Income – Returns ~4.8%. Interest Expense – Maintained ~8.2% Average term debt maturity at ~3.5 years Credit Rating: CRISIL rating at AA- with positive outlook India ratings at AA- with stable outlook Debt breakdown as of 30th Sep 2021 (in $bn) ( in 000’ Cr) Term debt 6.5 48.1 Working capital 0.2 1.8 Short term borrowing 0.1 1.1 Total consolidated debt 6.9 51.0 Cash and Cash Equivalents 4.1 30.7 Net Debt 2.7 20.4 Debt breakup ($6.9bn) - INR Debt 89% - USD / Foreign Currency Debt 11% Debt Breakdown (as of 30th Sep 2021)
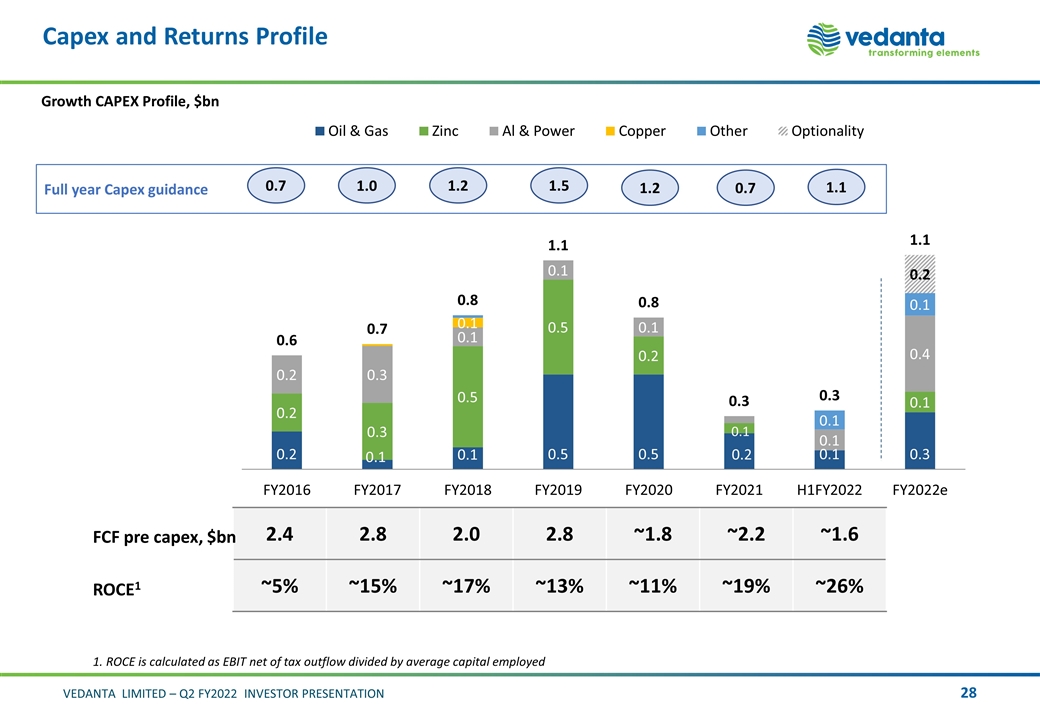
Full year Capex guidance ROCE1 2.4 2.8 2.0 2.8 ~1.8 ~2.2 ~1.6 ~5% ~15% ~17% ~13% ~11% ~19% ~26% Capex and Returns Profile Growth CAPEX Profile, $bn 0.7 1.0 1.2 1.5 FCF pre capex, $bn 1. ROCE is calculated as EBIT net of tax outflow divided by average capital employed 0.7 1.2 1.1
VEDANTA LIMITED INVESTOR PRESENTATION Q2 FY2022 Appendix
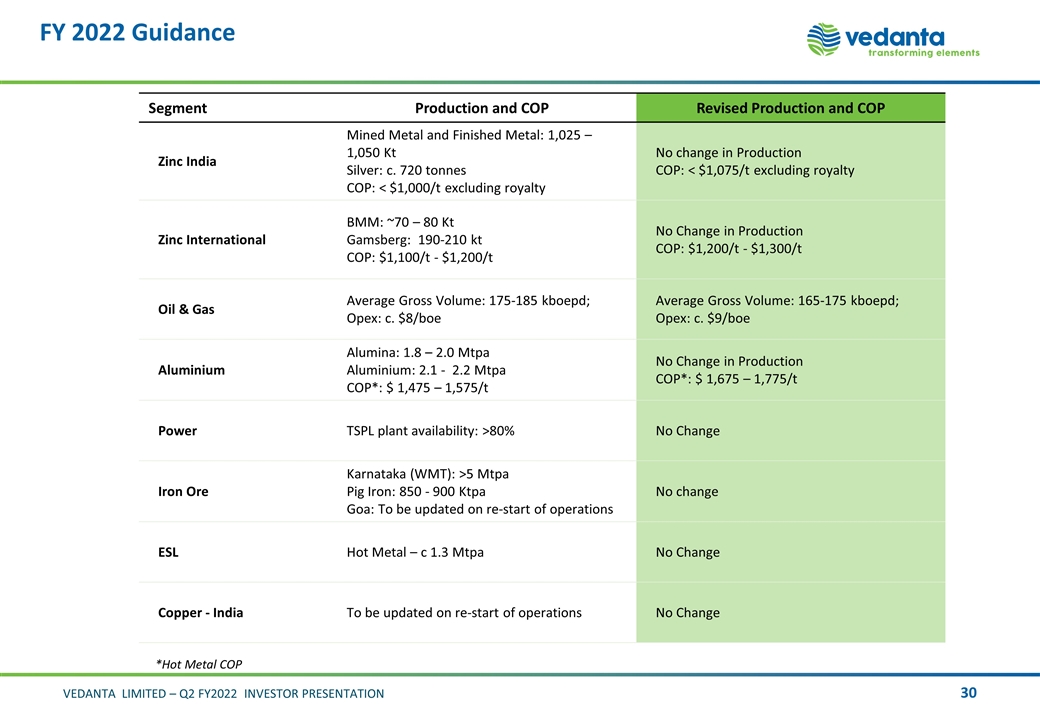
FY 2022 Guidance Segment Production and COP Revised Production and COP Zinc India Mined Metal and Finished Metal: 1,025 – 1,050 Kt Silver: c. 720 tonnes COP: < $1,000/t excluding royalty No change in Production COP: < $1,075/t excluding royalty Zinc International BMM: ~70 – 80 Kt Gamsberg: 190-210 kt COP: $1,100/t - $1,200/t No Change in Production COP: $1,200/t - $1,300/t Oil & Gas Average Gross Volume: 175-185 kboepd; Opex: c. $8/boe Average Gross Volume: 165-175 kboepd; Opex: c. $9/boe Aluminium Alumina: 1.8 – 2.0 Mtpa Aluminium: 2.1 - 2.2 Mtpa COP*: $ 1,475 – 1,575/t No Change in Production COP*: $ 1,675 – 1,775/t Power TSPL plant availability: >80% No Change Iron Ore Karnataka (WMT): >5 Mtpa Pig Iron: 850 - 900 Ktpa Goa: To be updated on re-start of operations No change ESL Hot Metal – c 1.3 Mtpa No Change Copper - India To be updated on re-start of operations No Change *Hot Metal COP
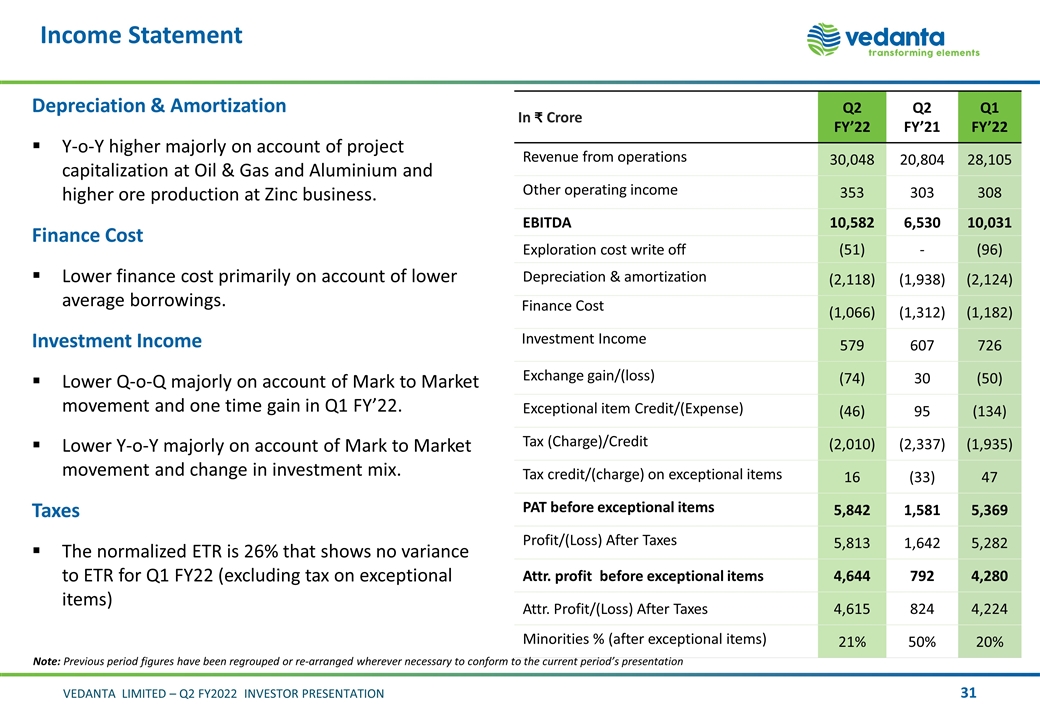
In Crore Q2 FY’22 Q2 FY’21 Q1 FY’22 Revenue from operations 30,048 20,804 28,105 Other operating income 353 303 308 EBITDA 10,582 6,530 10,031 Exploration cost write off (51) - (96) Depreciation & amortization (2,118) (1,938) (2,124) Finance Cost (1,066) (1,312) (1,182) Investment Income 579 607 726 Exchange gain/(loss) (74) 30 (50) Exceptional item Credit/(Expense) (46) 95 (134) Tax (Charge)/Credit (2,010) (2,337) (1,935) Tax credit/(charge) on exceptional items 16 (33) 47 PAT before exceptional items 5,842 1,581 5,369 Profit/(Loss) After Taxes 5,813 1,642 5,282 Attr. profit before exceptional items 4,644 792 4,280 Attr. Profit/(Loss) After Taxes 4,615 824 4,224 Minorities % (after exceptional items) 21% 50% 20% Income Statement Depreciation & Amortization Y-o-Y higher majorly on account of project capitalization at Oil & Gas and Aluminium and higher ore production at Zinc business. Finance Cost Lower finance cost primarily on account of lower average borrowings. Investment Income Lower Q-o-Q majorly on account of Mark to Market movement and one time gain in Q1 FY’22. Lower Y-o-Y majorly on account of Mark to Market movement and change in investment mix. Taxes The normalized ETR is 26% that shows no variance to ETR for Q1 FY22 (excluding tax on exceptional items) Note: Previous period figures have been regrouped or re-arranged wherever necessary to conform to the current period’s presentation
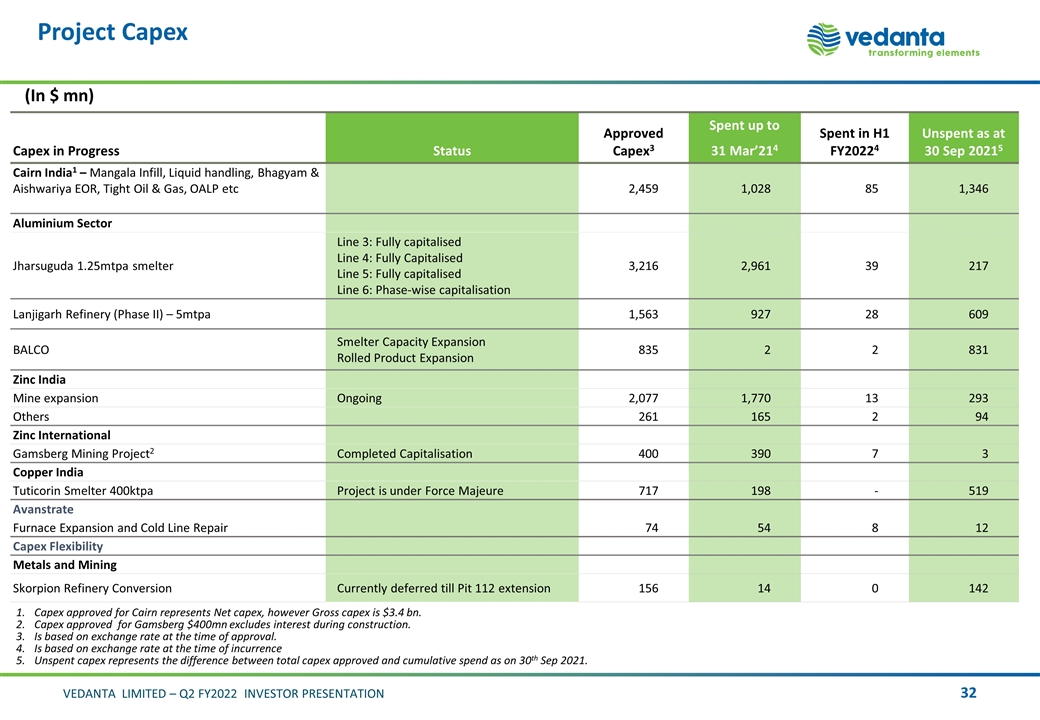
Project Capex Capex in Progress Status Approved Capex3 Spent up to 31 Mar’214 Spent in H1 FY20224 Unspent as at 30 Sep 20215 Cairn India1 – Mangala Infill, Liquid handling, Bhagyam & Aishwariya EOR, Tight Oil & Gas, OALP etc 2,459 1,028 85 1,346 Aluminium Sector Jharsuguda 1.25mtpa smelter Line 3: Fully capitalised Line 4: Fully Capitalised Line 5: Fully capitalised Line 6: Phase-wise capitalisation 3,216 2,961 39 217 Lanjigarh Refinery (Phase II) – 5mtpa 1,563 927 28 609 BALCO Smelter Capacity Expansion Rolled Product Expansion 835 2 2 831 Zinc India Mine expansion Ongoing 2,077 1,770 13 293 Others 261 165 2 94 Zinc International Gamsberg Mining Project2 Completed Capitalisation 400 390 7 3 Copper India Tuticorin Smelter 400ktpa Project is under Force Majeure 717 198 - 519 Avanstrate Furnace Expansion and Cold Line Repair 74 54 8 12 Capex Flexibility Metals and Mining Skorpion Refinery Conversion Currently deferred till Pit 112 extension 156 14 0 142 Capex approved for Cairn represents Net capex, however Gross capex is $3.4 bn. Capex approved for Gamsberg $400mn excludes interest during construction. Is based on exchange rate at the time of approval. Is based on exchange rate at the time of incurrence Unspent capex represents the difference between total capex approved and cumulative spend as on 30th Sep 2021. (In $ mn)
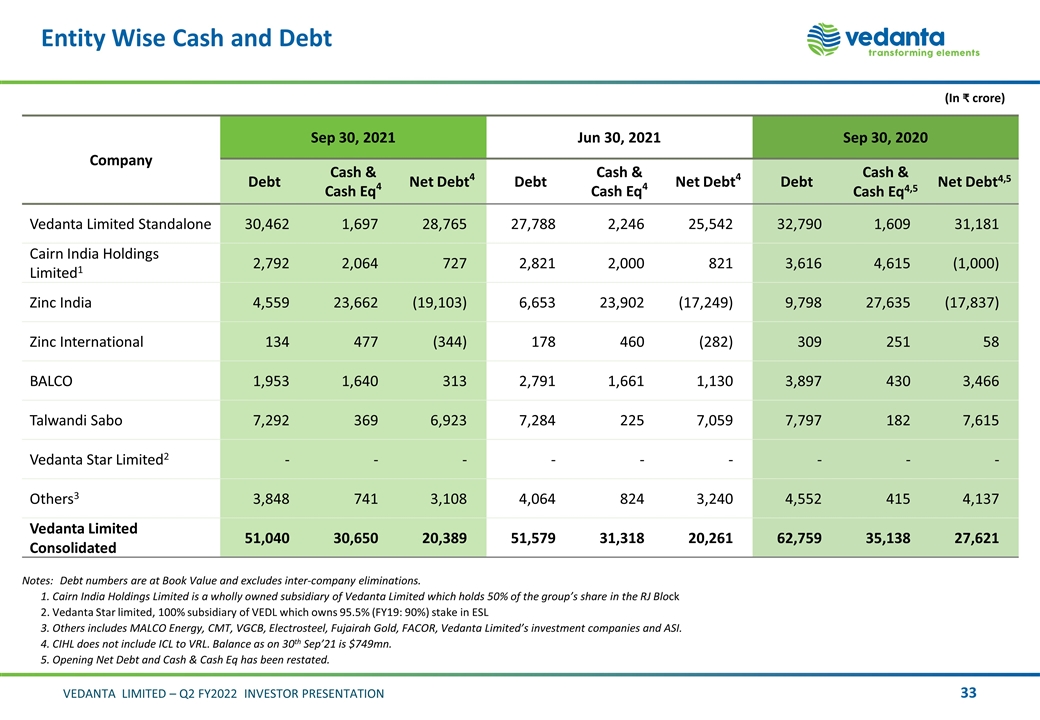
Entity Wise Cash and Debt Notes:Debt numbers are at Book Value and excludes inter-company eliminations. 1. Cairn India Holdings Limited is a wholly owned subsidiary of Vedanta Limited which holds 50% of the group’s share in the RJ Block 2. Vedanta Star limited, 100% subsidiary of VEDL which owns 95.5% (FY19: 90%) stake in ESL 3. Others includes MALCO Energy, CMT, VGCB, Electrosteel, Fujairah Gold, FACOR, Vedanta Limited’s investment companies and ASI. 4. CIHL does not include ICL to VRL. Balance as on 30th Sep’21 is $749mn. 5. Opening Net Debt and Cash & Cash Eq has been restated. (In crore) Company Sep 30, 2021 Jun 30, 2021 Sep 30, 2020 Debt Cash & Cash Eq4 Net Debt4 Debt Cash & Cash Eq4 Net Debt4 Debt Cash & Cash Eq4,5 Net Debt4,5 Vedanta Limited Standalone 30,462 1,697 28,765 27,788 2,246 25,542 32,790 1,609 31,181 Cairn India Holdings Limited1 2,792 2,064 727 2,821 2,000 821 3,616 4,615 (1,000) Zinc India 4,559 23,662 (19,103) 6,653 23,902 (17,249) 9,798 27,635 (17,837) Zinc International 134 477 (344) 178 460 (282) 309 251 58 BALCO 1,953 1,640 313 2,791 1,661 1,130 3,897 430 3,466 Talwandi Sabo 7,292 369 6,923 7,284 225 7,059 7,797 182 7,615 Vedanta Star Limited2 - - - - - - - - - Others3 3,848 741 3,108 4,064 824 3,240 4,552 415 4,137 Vedanta Limited Consolidated 51,040 30,650 20,389 51,579 31,318 20,261 62,759 35,138 27,621
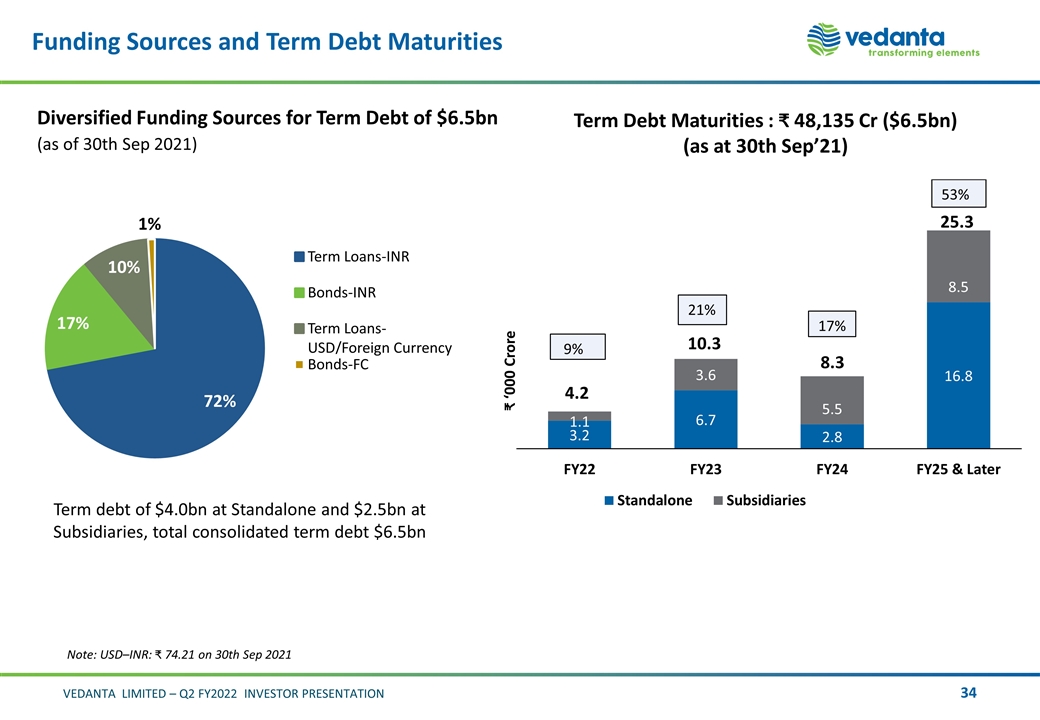
Funding Sources and Term Debt Maturities Diversified Funding Sources for Term Debt of $6.5bn (as of 30th Sep 2021) Note: USD–INR: 74.21 on 30th Sep 2021 Term debt of $4.0bn at Standalone and $2.5bn at Subsidiaries, total consolidated term debt $6.5bn Term Debt Maturities : 48,135 Cr ($6.5bn) (as at 30th Sep’21)
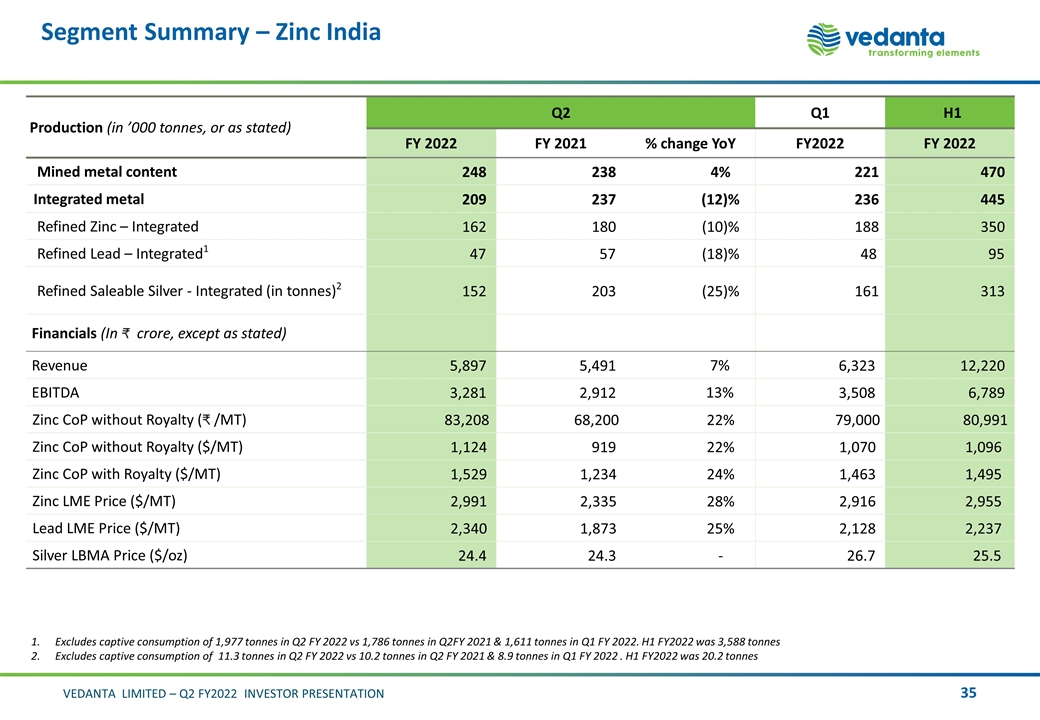
Segment Summary – Zinc India Production (in ’000 tonnes, or as stated) Q2 Q1 H1 FY 2022 FY 2021 % change YoY FY2022 FY 2022 Mined metal content 248 238 4% 221 470 Integrated metal 209 237 (12)% 236 445 Refined Zinc – Integrated 162 180 (10)% 188 350 Refined Lead – Integrated1 47 57 (18)% 48 95 Refined Saleable Silver - Integrated (in tonnes)2 152 203 (25)% 161 313 Financials (In crore, except as stated) Revenue 5,897 5,491 7% 6,323 12,220 EBITDA 3,281 2,912 13% 3,508 6,789 Zinc CoP without Royalty ( /MT) 83,208 68,200 22% 79,000 80,991 Zinc CoP without Royalty ($/MT) 1,124 919 22% 1,070 1,096 Zinc CoP with Royalty ($/MT) 1,529 1,234 24% 1,463 1,495 Zinc LME Price ($/MT) 2,991 2,335 28% 2,916 2,955 Lead LME Price ($/MT) 2,340 1,873 25% 2,128 2,237 Silver LBMA Price ($/oz) 24.4 24.3 - 26.7 25.5 Excludes captive consumption of 1,977 tonnes in Q2 FY 2022 vs 1,786 tonnes in Q2FY 2021 & 1,611 tonnes in Q1 FY 2022. H1 FY2022 was 3,588 tonnes Excludes captive consumption of 11.3 tonnes in Q2 FY 2022 vs 10.2 tonnes in Q2 FY 2021 & 8.9 tonnes in Q1 FY 2022 . H1 FY2022 was 20.2 tonnes
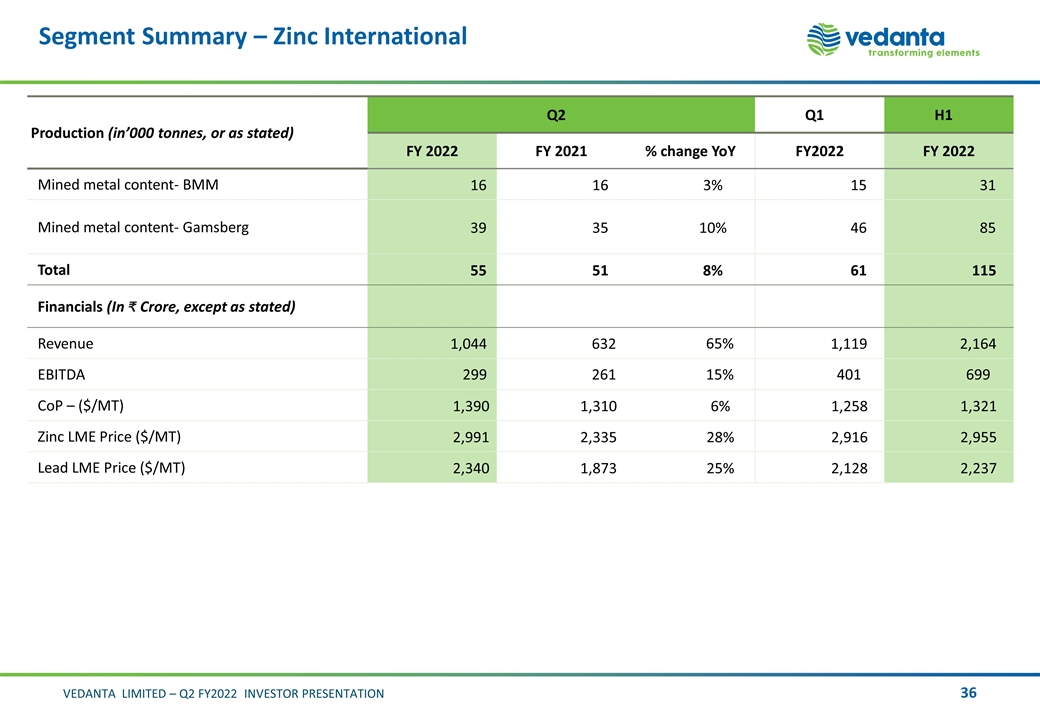
Segment Summary – Zinc International Production (in’000 tonnes, or as stated) Q2 Q1 H1 FY 2022 FY 2021 % change YoY FY2022 FY 2022 Mined metal content- BMM 16 16 3% 15 31 Mined metal content- Gamsberg 39 35 10% 46 85 Total 55 51 8% 61 115 Financials (In Crore, except as stated) Revenue 1,044 632 65% 1,119 2,164 EBITDA 299 261 15% 401 699 CoP – ($/MT) 1,390 1,310 6% 1,258 1,321 Zinc LME Price ($/MT) 2,991 2,335 28% 2,916 2,955 Lead LME Price ($/MT) 2,340 1,873 25% 2,128 2,237
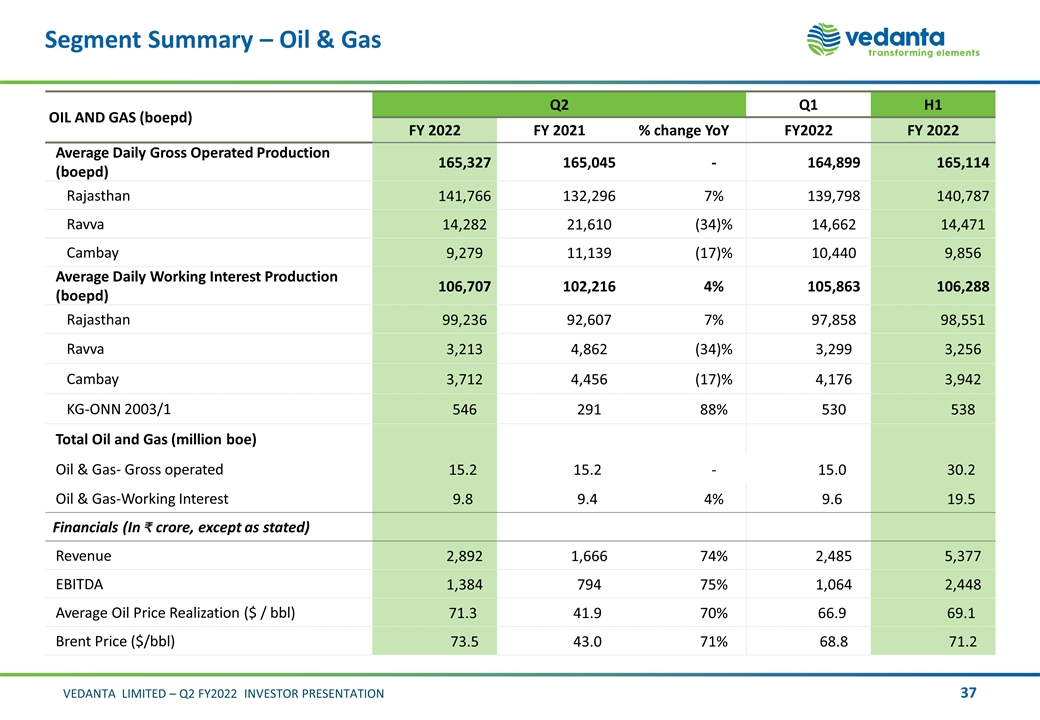
Segment Summary – Oil & Gas OIL AND GAS (boepd) Q2 Q1 H1 FY 2022 FY 2021 % change YoY FY2022 FY 2022 Average Daily Gross Operated Production (boepd) 165,327 165,045 - 164,899 165,114 Rajasthan 141,766 132,296 7% 139,798 140,787 Ravva 14,282 21,610 (34)% 14,662 14,471 Cambay 9,279 11,139 (17)% 10,440 9,856 Average Daily Working Interest Production (boepd) 106,707 102,216 4% 105,863 106,288 Rajasthan 99,236 92,607 7% 97,858 98,551 Ravva 3,213 4,862 (34)% 3,299 3,256 Cambay 3,712 4,456 (17)% 4,176 3,942 KG-ONN 2003/1 546 291 88% 530 538 Total Oil and Gas (million boe) Oil & Gas- Gross operated 15.2 15.2 - 15.0 30.2 Oil & Gas-Working Interest 9.8 9.4 4% 9.6 19.5 Financials (In crore, except as stated) Revenue 2,892 1,666 74% 2,485 5,377 EBITDA 1,384 794 75% 1,064 2,448 Average Oil Price Realization ($ / bbl) 71.3 41.9 70% 66.9 69.1 Brent Price ($/bbl) 73.5 43.0 71% 68.8 71.2
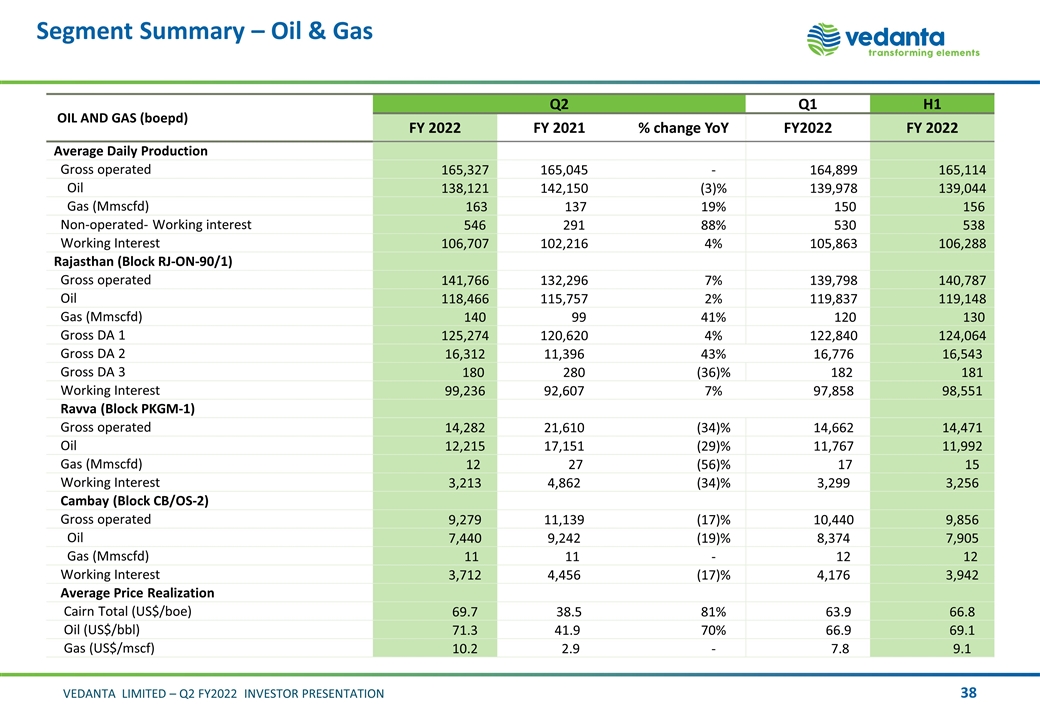
Segment Summary – Oil & Gas OIL AND GAS (boepd) Q2 Q1 H1 FY 2022 FY 2021 % change YoY FY2022 FY 2022 Average Daily Production Gross operated 165,327 165,045 - 164,899 165,114 Oil 138,121 142,150 (3)% 139,978 139,044 Gas (Mmscfd) 163 137 19% 150 156 Non-operated- Working interest 546 291 88% 530 538 Working Interest 106,707 102,216 4% 105,863 106,288 Rajasthan (Block RJ-ON-90/1) Gross operated 141,766 132,296 7% 139,798 140,787 Oil 118,466 115,757 2% 119,837 119,148 Gas (Mmscfd) 140 99 41% 120 130 Gross DA 1 125,274 120,620 4% 122,840 124,064 Gross DA 2 16,312 11,396 43% 16,776 16,543 Gross DA 3 180 280 (36)% 182 181 Working Interest 99,236 92,607 7% 97,858 98,551 Ravva (Block PKGM-1) Gross operated 14,282 21,610 (34)% 14,662 14,471 Oil 12,215 17,151 (29)% 11,767 11,992 Gas (Mmscfd) 12 27 (56)% 17 15 Working Interest 3,213 4,862 (34)% 3,299 3,256 Cambay (Block CB/OS-2) Gross operated 9,279 11,139 (17)% 10,440 9,856 Oil 7,440 9,242 (19)% 8,374 7,905 Gas (Mmscfd) 11 11 - 12 12 Working Interest 3,712 4,456 (17)% 4,176 3,942 Average Price Realization Cairn Total (US$/boe) 69.7 38.5 81% 63.9 66.8 Oil (US$/bbl) 71.3 41.9 70% 66.9 69.1 Gas (US$/mscf) 10.2 2.9 - 7.8 9.1
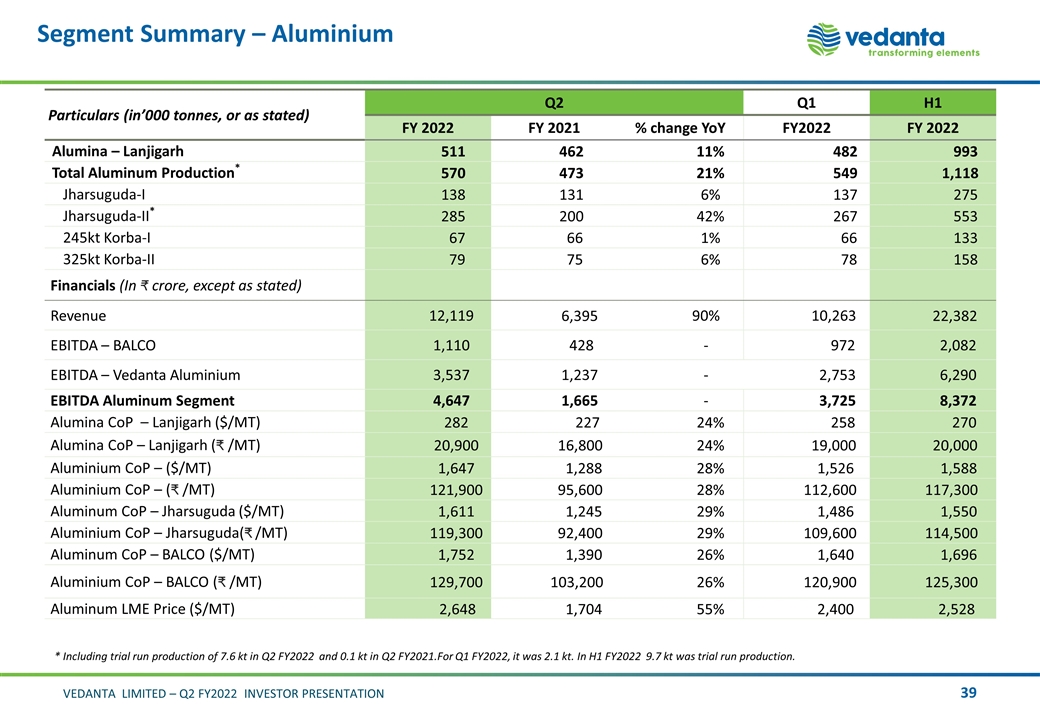
Segment Summary – Aluminium Particulars (in’000 tonnes, or as stated) Q2 Q1 H1 FY 2022 FY 2021 % change YoY FY2022 FY 2022 Alumina – Lanjigarh 511 462 11% 482 993 Total Aluminum Production* 570 473 21% 549 1,118 Jharsuguda-I 138 131 6% 137 275 Jharsuguda-II* 285 200 42% 267 553 245kt Korba-I 67 66 1% 66 133 325kt Korba-II 79 75 6% 78 158 Financials (In crore, except as stated) Revenue 12,119 6,395 90% 10,263 22,382 EBITDA – BALCO 1,110 428 - 972 2,082 EBITDA – Vedanta Aluminium 3,537 1,237 - 2,753 6,290 EBITDA Aluminum Segment 4,647 1,665 - 3,725 8,372 Alumina CoP – Lanjigarh ($/MT) 282 227 24% 258 270 Alumina CoP – Lanjigarh ( /MT) 20,900 16,800 24% 19,000 20,000 Aluminium CoP – ($/MT) 1,647 1,288 28% 1,526 1,588 Aluminium CoP – ( /MT) 121,900 95,600 28% 112,600 117,300 Aluminum CoP – Jharsuguda ($/MT) 1,611 1,245 29% 1,486 1,550 Aluminium CoP – Jharsuguda( /MT) 119,300 92,400 29% 109,600 114,500 Aluminum CoP – BALCO ($/MT) 1,752 1,390 26% 1,640 1,696 Aluminium CoP – BALCO ( /MT) 129,700 103,200 26% 120,900 125,300 Aluminum LME Price ($/MT) 2,648 1,704 55% 2,400 2,528 * Including trial run production of 7.6 kt in Q2 FY2022 and 0.1 kt in Q2 FY2021.For Q1 FY2022, it was 2.1 kt. In H1 FY2022 9.7 kt was trial run production.
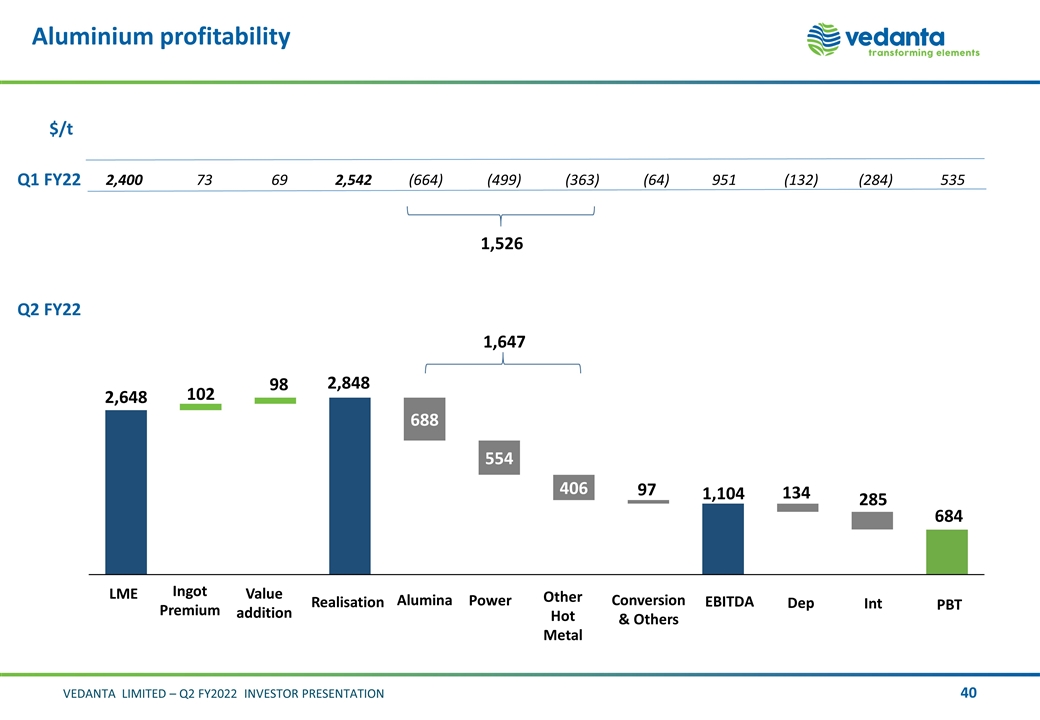
Aluminium profitability Q1 FY22 $/t Q2 FY22 98 102 285 1,104 684 2,400 73 69 2,542 (664) (499) (363) (64) 951 (132) (284) 535 1,526 1,647
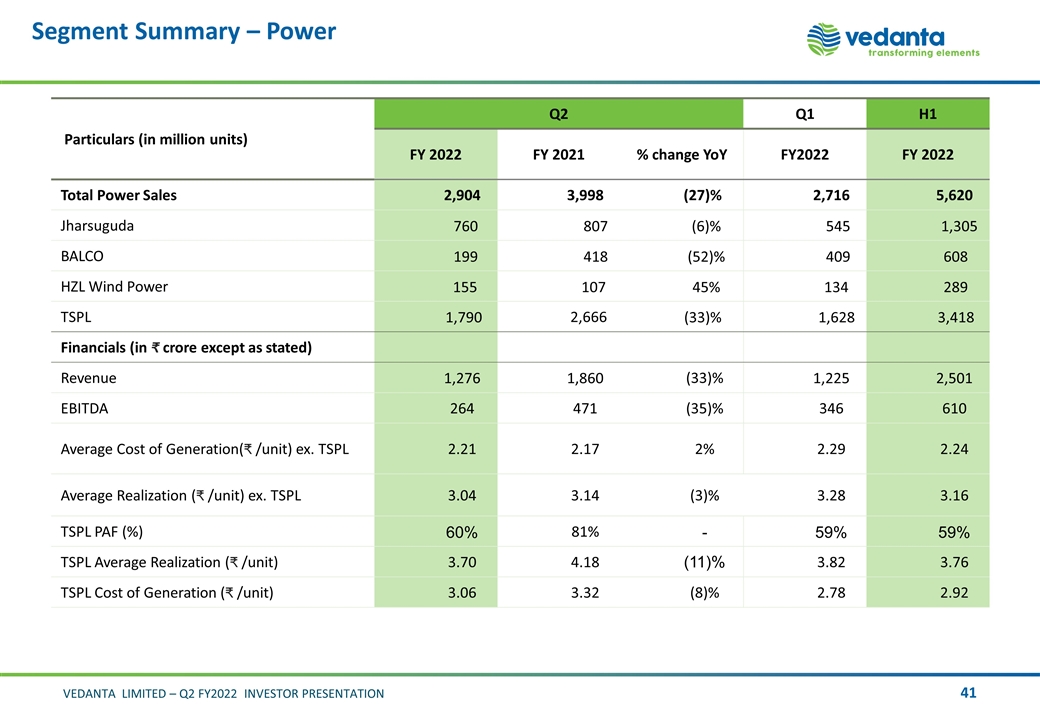
Segment Summary – Power Particulars (in million units) Q2 Q1 H1 FY 2022 FY 2021 % change YoY FY2022 FY 2022 Total Power Sales 2,904 3,998 (27)% 2,716 5,620 Jharsuguda 760 807 (6)% 545 1,305 BALCO 199 418 (52)% 409 608 HZL Wind Power 155 107 45% 134 289 TSPL 1,790 2,666 (33)% 1,628 3,418 Financials (in crore except as stated) Revenue 1,276 1,860 (33)% 1,225 2,501 EBITDA 264 471 (35)% 346 610 Average Cost of Generation( /unit) ex. TSPL 2.21 2.17 2% 2.29 2.24 Average Realization ( /unit) ex. TSPL 3.04 3.14 (3)% 3.28 3.16 TSPL PAF (%) 60% 81% - 59% 59% TSPL Average Realization ( /unit) 3.70 4.18 (11)% 3.82 3.76 TSPL Cost of Generation ( /unit) 3.06 3.32 (8)% 2.78 2.92
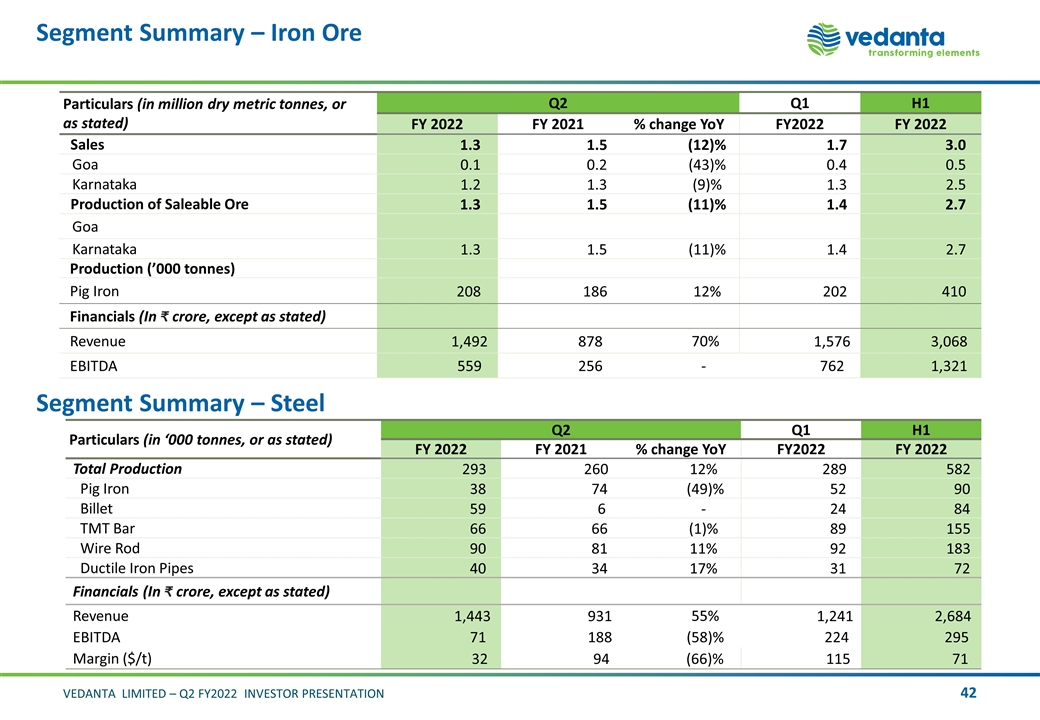
Segment Summary – Iron Ore Particulars (in million dry metric tonnes, or as stated) Q2 Q1 H1 FY 2022 FY 2021 % change YoY FY2022 FY 2022 Sales 1.3 1.5 (12)% 1.7 3.0 Goa 0.1 0.2 (43)% 0.4 0.5 Karnataka 1.2 1.3 (9)% 1.3 2.5 Production of Saleable Ore 1.3 1.5 (11)% 1.4 2.7 Goa Karnataka 1.3 1.5 (11)% 1.4 2.7 Production (’000 tonnes) Pig Iron 208 186 12% 202 410 Financials (In crore, except as stated) Revenue 1,492 878 70% 1,576 3,068 EBITDA 559 256 - 762 1,321 Segment Summary – Steel Particulars (in ‘000 tonnes, or as stated) Q2 Q1 H1 FY 2022 FY 2021 % change YoY FY2022 FY 2022 Total Production 293 260 12% 289 582 Pig Iron 38 74 (49)% 52 90 Billet 59 6 - 24 84 TMT Bar 66 66 (1)% 89 155 Wire Rod 90 81 11% 92 183 Ductile Iron Pipes 40 34 17% 31 72 Financials (In crore, except as stated) Revenue 1,443 931 55% 1,241 2,684 EBITDA 71 188 (58)% 224 295 Margin ($/t) 32 94 (66)% 115 71
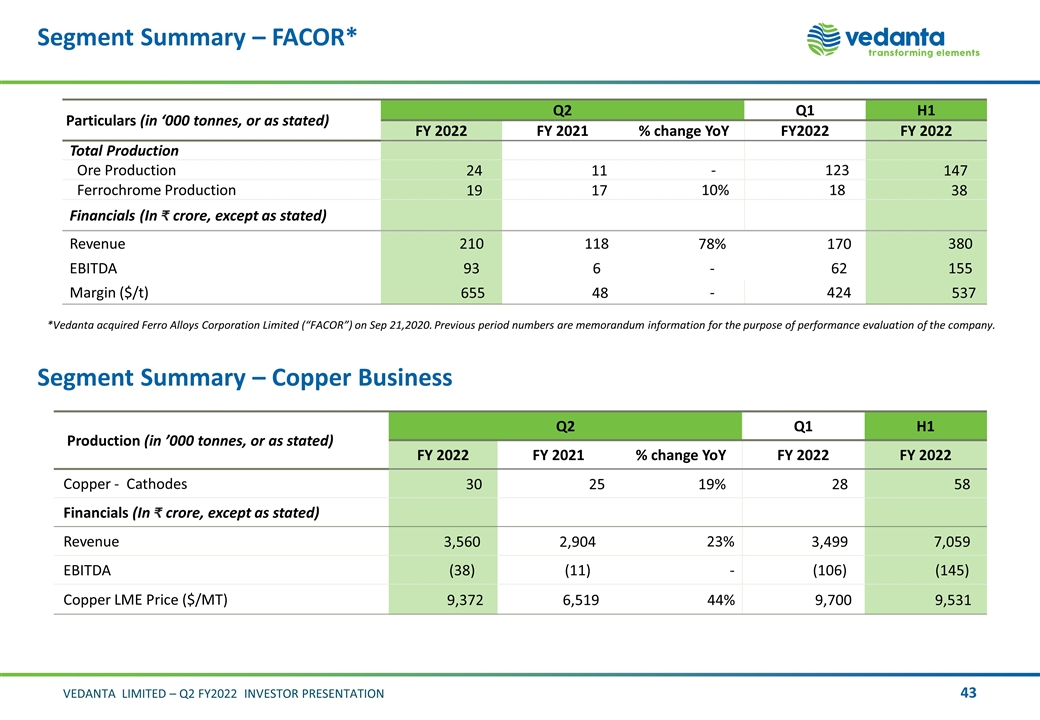
Segment Summary – FACOR* Segment Summary – Copper Business Particulars (in ‘000 tonnes, or as stated) Q2 Q1 H1 FY 2022 FY 2021 % change YoY FY2022 FY 2022 Total Production Ore Production 24 11 - 123 147 Ferrochrome Production 19 17 10% 18 38 Financials (In crore, except as stated) Revenue 210 118 78% 170 380 EBITDA 93 6 - 62 155 Margin ($/t) 655 48 - 424 537 Production (in ’000 tonnes, or as stated) Q2 Q1 H1 FY 2022 FY 2021 % change YoY FY 2022 FY 2022 Copper - Cathodes 30 25 19% 28 58 Financials (In crore, except as stated) Revenue 3,560 2,904 23% 3,499 7,059 EBITDA (38) (11) - (106) (145) Copper LME Price ($/MT) 9,372 6,519 44% 9,700 9,531 *Vedanta acquired Ferro Alloys Corporation Limited (“FACOR”) on Sep 21,2020. Previous period numbers are memorandum information for the purpose of performance evaluation of the company.
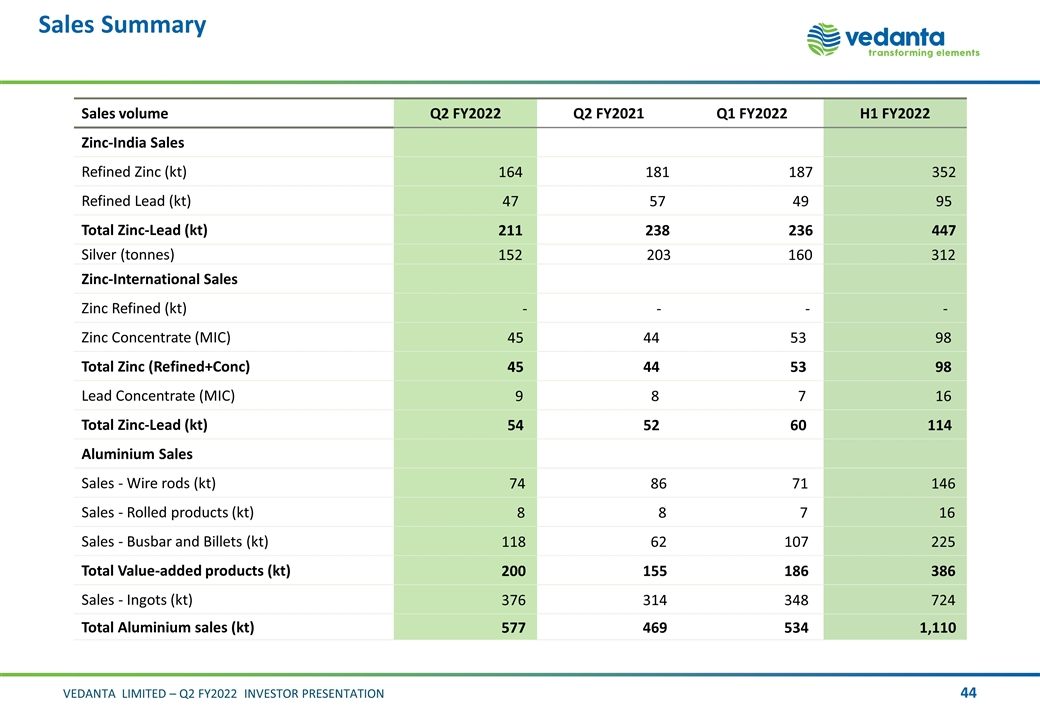
Sales Summary Sales volume Q2 FY2022 Q2 FY2021 Q1 FY2022 H1 FY2022 Zinc-India Sales Refined Zinc (kt) 164 181 187 352 Refined Lead (kt) 47 57 49 95 Total Zinc-Lead (kt) 211 238 236 447 Silver (tonnes) 152 203 160 312 Zinc-International Sales Zinc Refined (kt) - - - - Zinc Concentrate (MIC) 45 44 53 98 Total Zinc (Refined+Conc) 45 44 53 98 Lead Concentrate (MIC) 9 8 7 16 Total Zinc-Lead (kt) 54 52 60 114 Aluminium Sales Sales - Wire rods (kt) 74 86 71 146 Sales - Rolled products (kt) 8 8 7 16 Sales - Busbar and Billets (kt) 118 62 107 225 Total Value-added products (kt) 200 155 186 386 Sales - Ingots (kt) 376 314 348 724 Total Aluminium sales (kt) 577 469 534 1,110
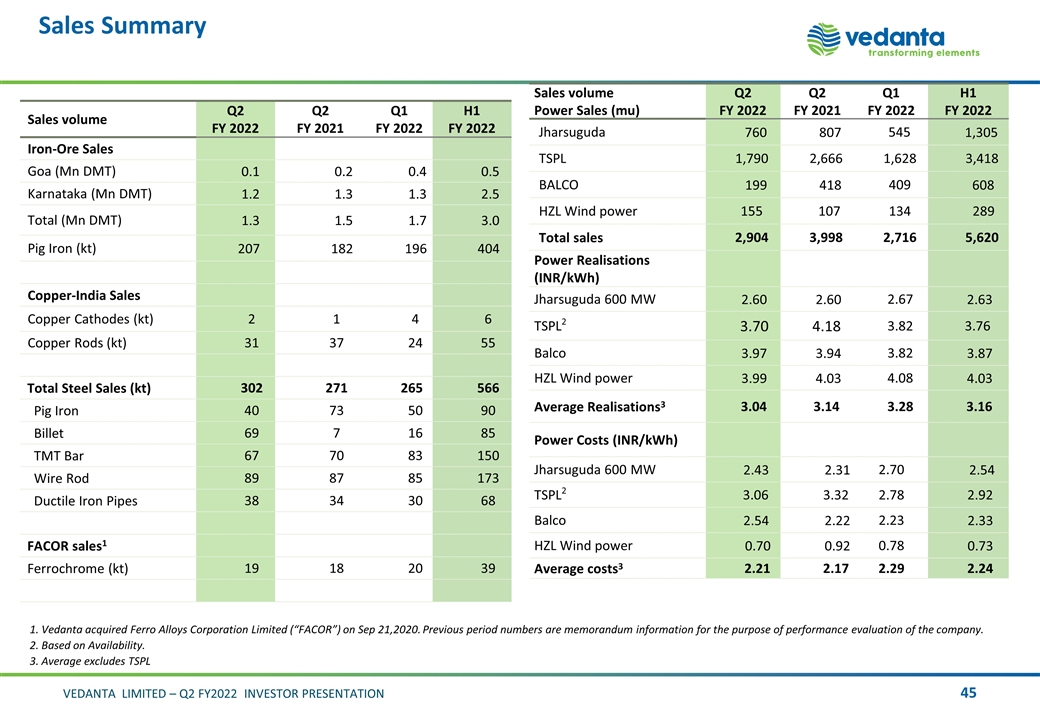
Sales Summary Sales volume Q2 FY 2022 Q2 FY 2021 Q1 FY 2022 H1 FY 2022 Iron-Ore Sales Goa (Mn DMT) 0.1 0.2 0.4 0.5 Karnataka (Mn DMT) 1.2 1.3 1.3 2.5 Total (Mn DMT) 1.3 1.5 1.7 3.0 Pig Iron (kt) 207 182 196 404 Copper-India Sales Copper Cathodes (kt) 2 1 4 6 Copper Rods (kt) 31 37 24 55 Total Steel Sales (kt) 302 271 265 566 Pig Iron 40 73 50 90 Billet 69 7 16 85 TMT Bar 67 70 83 150 Wire Rod 89 87 85 173 Ductile Iron Pipes 38 34 30 68 FACOR sales1 Ferrochrome (kt) 19 18 20 39 Sales volume Power Sales (mu) Q2 FY 2022 Q2 FY 2021 Q1 FY 2022 H1 FY 2022 Jharsuguda 760 807 545 1,305 TSPL 1,790 2,666 1,628 3,418 BALCO 199 418 409 608 HZL Wind power 155 107 134 289 Total sales 2,904 3,998 2,716 5,620 Power Realisations (INR/kWh) Jharsuguda 600 MW 2.60 2.60 2.67 2.63 TSPL2 3.70 4.18 3.82 3.76 Balco 3.97 3.94 3.82 3.87 HZL Wind power 3.99 4.03 4.08 4.03 Average Realisations3 3.04 3.14 3.28 3.16 Power Costs (INR/kWh) Jharsuguda 600 MW 2.43 2.31 2.70 2.54 TSPL2 3.06 3.32 2.78 2.92 Balco 2.54 2.22 2.23 2.33 HZL Wind power 0.70 0.92 0.78 0.73 Average costs3 2.21 2.17 2.29 2.24 1. Vedanta acquired Ferro Alloys Corporation Limited (“FACOR”) on Sep 21,2020. Previous period numbers are memorandum information for the purpose of performance evaluation of the company. 2. Based on Availability. 3. Average excludes TSPL
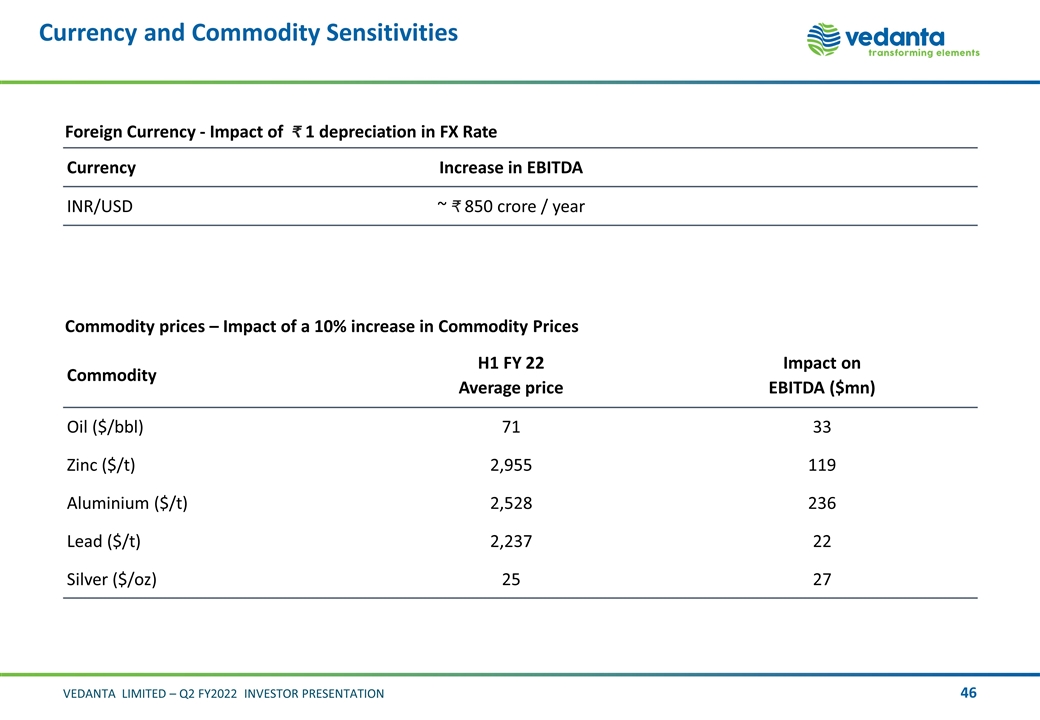
Currency and Commodity Sensitivities Commodity prices – Impact of a 10% increase in Commodity Prices Commodity H1 FY 22 Average price Impact on EBITDA ($mn) Oil ($/bbl) 71 33 Zinc ($/t) 2,955 119 Aluminium ($/t) 2,528 236 Lead ($/t) 2,237 22 Silver ($/oz) 25 27 Foreign Currency - Impact of ₹ 1 depreciation in FX Rate Currency Increase in EBITDA INR/USD ~ 850 crore / year
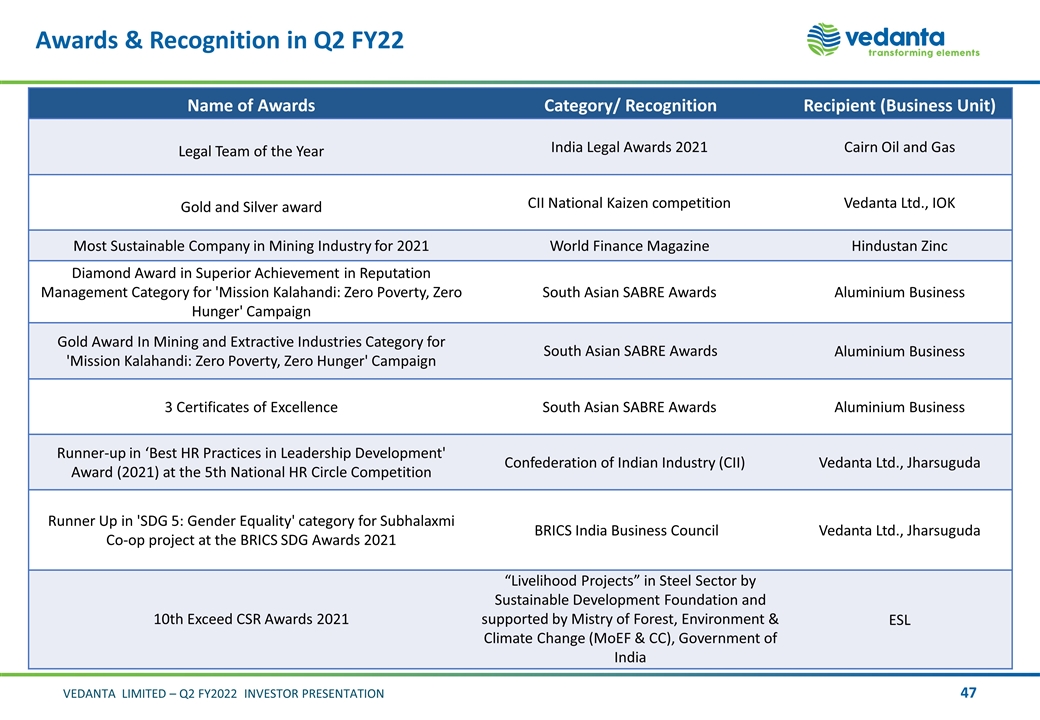
Awards & Recognition in Q2 FY22 Name of Awards Category/ Recognition Recipient (Business Unit) Legal Team of the Year India Legal Awards 2021 Cairn Oil and Gas Gold and Silver award CII National Kaizen competition Vedanta Ltd., IOK Most Sustainable Company in Mining Industry for 2021 World Finance Magazine Hindustan Zinc Diamond Award in Superior Achievement in Reputation Management Category for 'Mission Kalahandi: Zero Poverty, Zero Hunger' Campaign South Asian SABRE Awards Aluminium Business Gold Award In Mining and Extractive Industries Category for 'Mission Kalahandi: Zero Poverty, Zero Hunger' Campaign South Asian SABRE Awards Aluminium Business 3 Certificates of Excellence South Asian SABRE Awards Aluminium Business Runner-up in ‘Best HR Practices in Leadership Development' Award (2021) at the 5th National HR Circle Competition Confederation of Indian Industry (CII) Vedanta Ltd., Jharsuguda Runner Up in 'SDG 5: Gender Equality' category for Subhalaxmi Co-op project at the BRICS SDG Awards 2021 BRICS India Business Council Vedanta Ltd., Jharsuguda 10th Exceed CSR Awards 2021 “Livelihood Projects” in Steel Sector by Sustainable Development Foundation and supported by Mistry of Forest, Environment & Climate Change (MoEF & CC), Government of India ESL
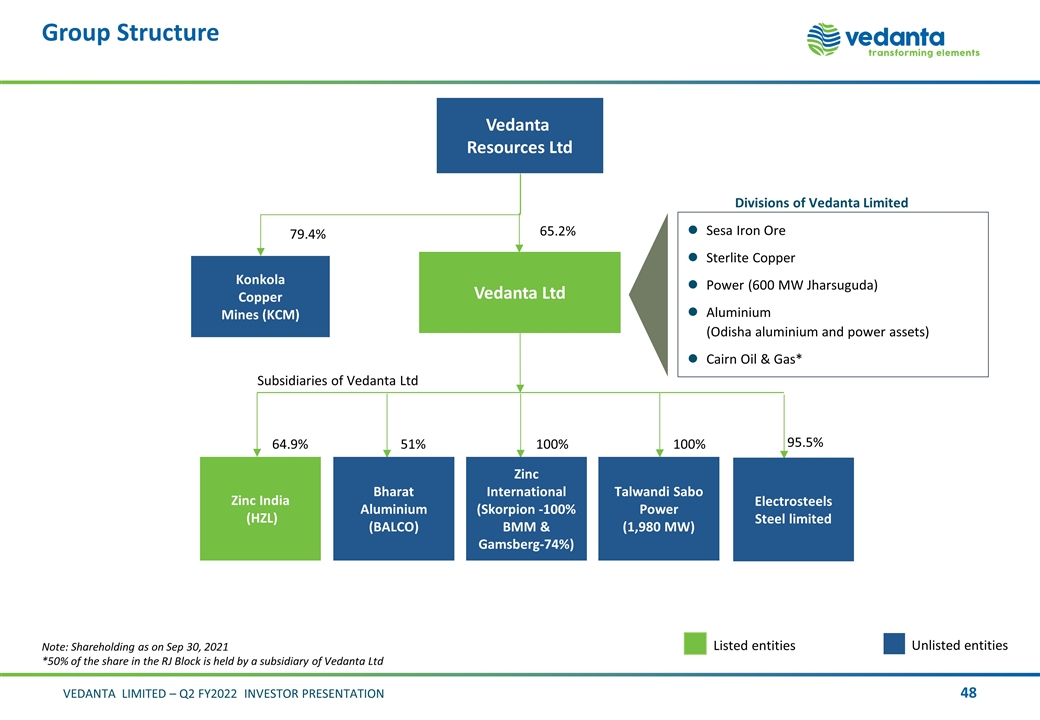
Group Structure Konkola Copper Mines (KCM) 65.2% Vedanta Resources Ltd 64.9% Zinc India (HZL) Vedanta Ltd 79.4% Subsidiaries of Vedanta Ltd Sesa Iron Ore Sterlite Copper Power (600 MW Jharsuguda) Aluminium (Odisha aluminium and power assets) Cairn Oil & Gas* Divisions of Vedanta Limited Unlisted entities Listed entities Talwandi Sabo Power (1,980 MW) 100% Zinc International (Skorpion -100% BMM & Gamsberg-74%) 100% 51% Bharat Aluminium (BALCO) Note: Shareholding as on Sep 30, 2021 *50% of the share in the RJ Block is held by a subsidiary of Vedanta Ltd 95.5% Electrosteels Steel limited
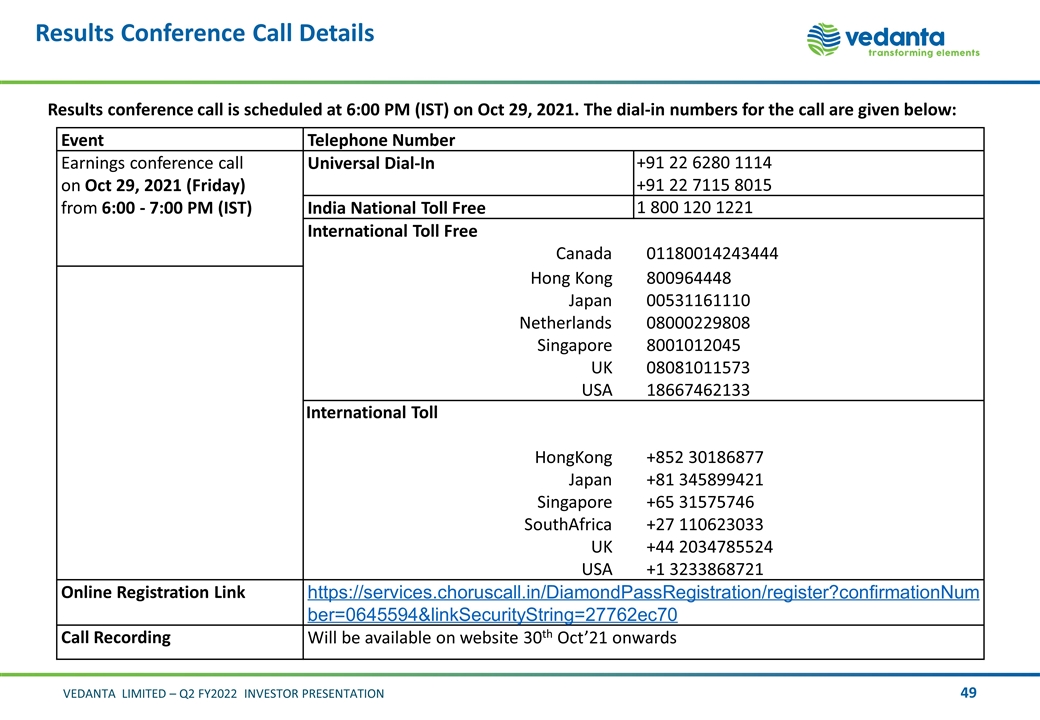
Results Conference Call Details Results conference call is scheduled at 6:00 PM (IST) on Oct 29, 2021. The dial-in numbers for the call are given below: Event Telephone Number Earnings conference call on Oct 29, 2021 (Friday) from 6:00 - 7:00 PM (IST) Universal Dial-In +91 22 6280 1114 +91 22 7115 8015 India National Toll Free 1 800 120 1221 International Toll Free Canada 01180014243444 Hong Kong 800964448 Japan 00531161110 Netherlands 08000229808 Singapore 8001012045 UK 08081011573 USA 18667462133 International Toll HongKong +852 30186877 Japan +81 345899421 Singapore +65 31575746 SouthAfrica +27 110623033 UK +44 2034785524 USA +1 3233868721 Online Registration Link https://services.choruscall.in/DiamondPassRegistration/register?confirmationNumber=0645594&linkSecurityString=27762ec70 Call Recording Will be available on website 30th Oct’21 onwards


