- VEDL Dashboard
- Financials
- Filings
-
Holdings
- Transcripts
-
ETFs
-
Insider
- Institutional
- Shorts
-
6-K Filing
Vedanta (VEDL) 6-KReview Report to
Filed: 1 Feb 22, 10:26am
Q3 FY2022 Earnings Presentation VEDANTA LIMITED INVESTOR PRESENTATION 28th Jan 2022 Exhibit 99.4
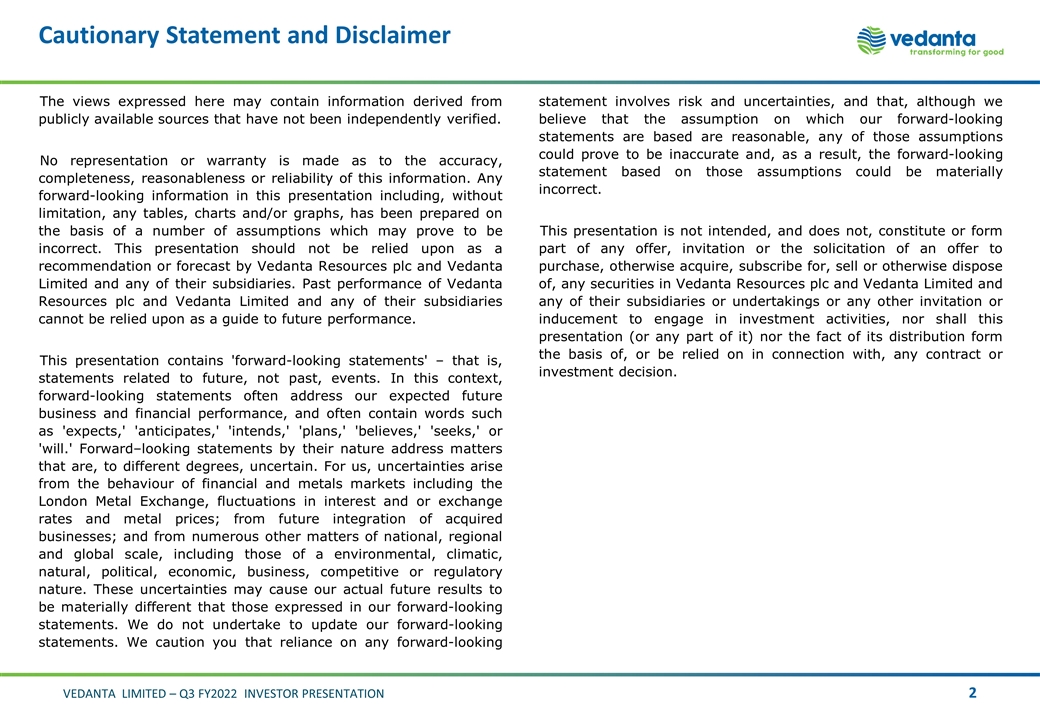
Cautionary Statement and Disclaimer The views expressed here may contain information derived from publicly available sources that have not been independently verified. No representation or warranty is made as to the accuracy, completeness, reasonableness or reliability of this information. Any forward-looking information in this presentation including, without limitation, any tables, charts and/or graphs, has been prepared on the basis of a number of assumptions which may prove to be incorrect. This presentation should not be relied upon as a recommendation or forecast by Vedanta Resources plc and Vedanta Limited and any of their subsidiaries. Past performance of Vedanta Resources plc and Vedanta Limited and any of their subsidiaries cannot be relied upon as a guide to future performance. This presentation contains 'forward-looking statements' – that is, statements related to future, not past, events. In this context, forward-looking statements often address our expected future business and financial performance, and often contain words such as 'expects,' 'anticipates,' 'intends,' 'plans,' 'believes,' 'seeks,' or 'will.' Forward–looking statements by their nature address matters that are, to different degrees, uncertain. For us, uncertainties arise from the behaviour of financial and metals markets including the London Metal Exchange, fluctuations in interest and or exchange rates and metal prices; from future integration of acquired businesses; and from numerous other matters of national, regional and global scale, including those of a environmental, climatic, natural, political, economic, business, competitive or regulatory nature. These uncertainties may cause our actual future results to be materially different that those expressed in our forward-looking statements. We do not undertake to update our forward-looking statements. We caution you that reliance on any forward-looking statement involves risk and uncertainties, and that, although we believe that the assumption on which our forward-looking statements are based are reasonable, any of those assumptions could prove to be inaccurate and, as a result, the forward-looking statement based on those assumptions could be materially incorrect. This presentation is not intended, and does not, constitute or form part of any offer, invitation or the solicitation of an offer to purchase, otherwise acquire, subscribe for, sell or otherwise dispose of, any securities in Vedanta Resources plc and Vedanta Limited and any of their subsidiaries or undertakings or any other invitation or inducement to engage in investment activities, nor shall this presentation (or any part of it) nor the fact of its distribution form the basis of, or be relied on in connection with, any contract or investment decision.
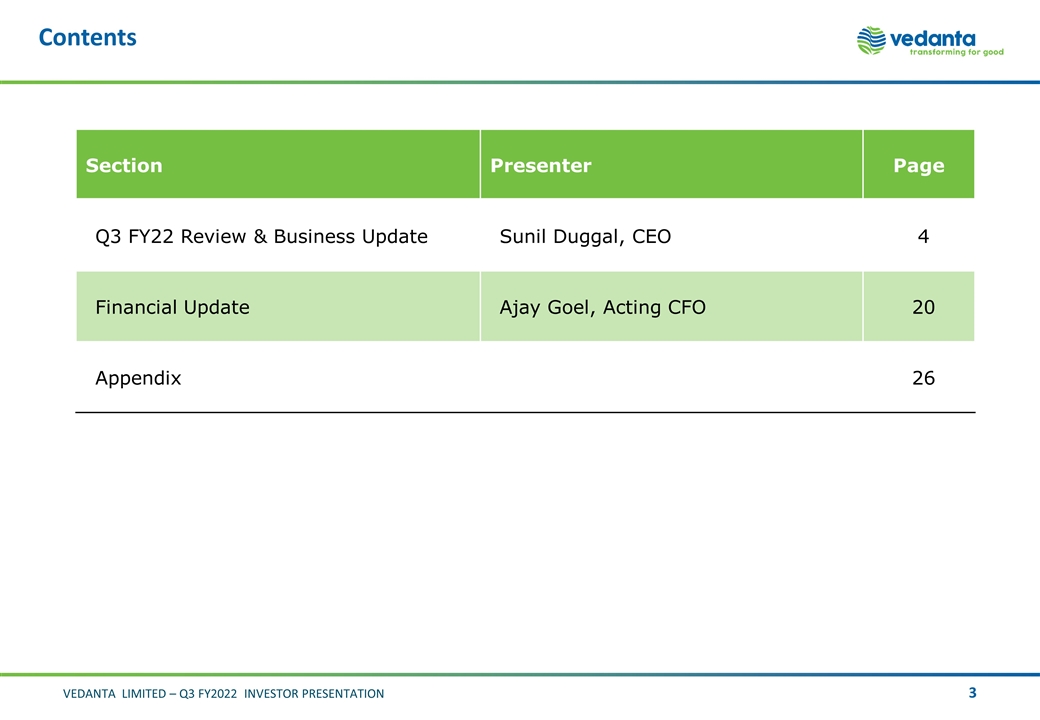
Contents Section Presenter Page Q3 FY22 Review & Business Update Sunil Duggal, CEO 4 Financial Update Ajay Goel, Acting CFO 20 Appendix 26
Q3 FY2022 Review and Business Update Sunil Duggal Group CEO & Chief Safety Officer VEDANTA LIMITED INVESTOR PRESENTATION Q3 FY2022
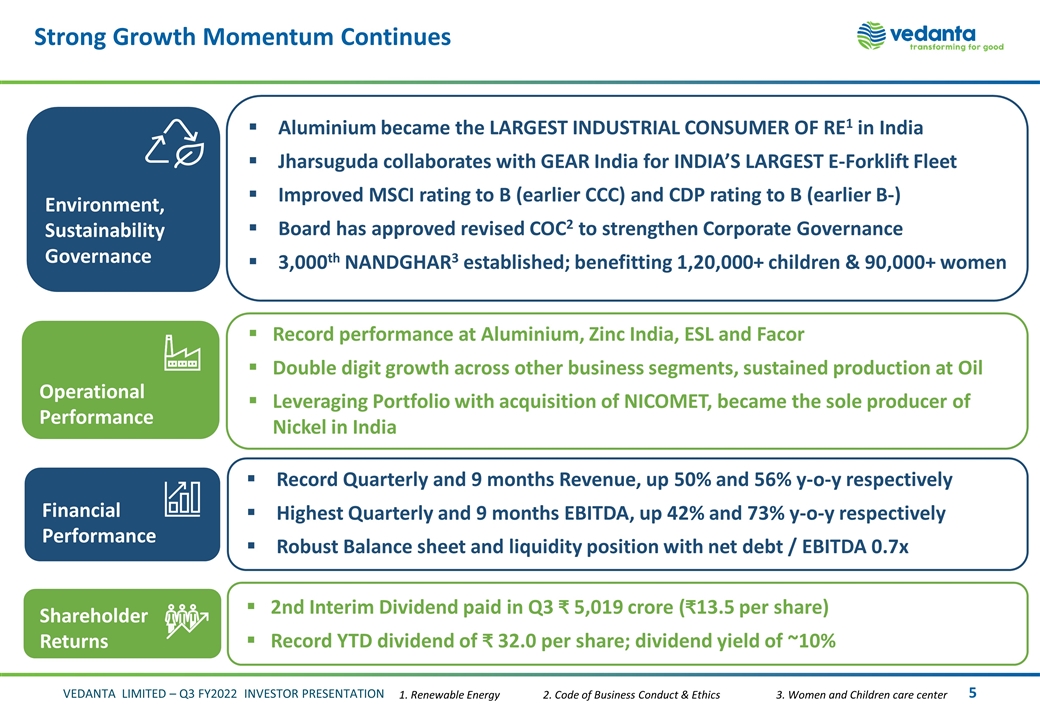
Strong Growth Momentum Continues Environment, Sustainability Governance Operational Performance Financial Performance Aluminium became the LARGEST INDUSTRIAL CONSUMER OF RE1 in India Jharsuguda collaborates with GEAR India for INDIA’S LARGEST E-Forklift Fleet Improved MSCI rating to B (earlier CCC) and CDP rating to B (earlier B-) Board has approved revised COC2 to strengthen Corporate Governance 3,000th NANDGHAR3 established; benefitting 1,20,000+ children & 90,000+ women Record performance at Aluminium, Zinc India, ESL and Facor Double digit growth across other business segments, sustained production at Oil Leveraging Portfolio with acquisition of NICOMET, became the sole producer of Nickel in India Shareholder Returns 2nd Interim Dividend paid in Q3 5,019 crore ( 13.5 per share) Record YTD dividend of ₹ 32.0 per share; dividend yield of ~10% 1. Renewable Energy 2. Code of Business Conduct & Ethics 3. Women and Children care center Record Quarterly and 9 months Revenue, up 50% and 56% y-o-y respectively Highest Quarterly and 9 months EBITDA, up 42% and 73% y-o-y respectively Robust Balance sheet and liquidity position with net debt / EBITDA 0.7x
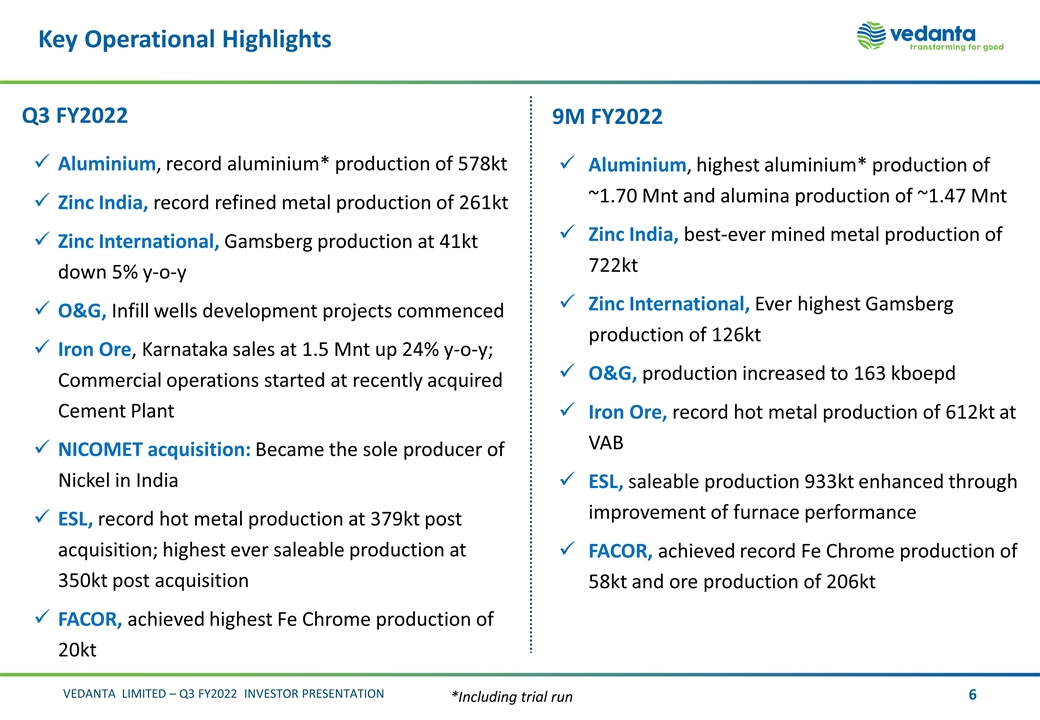
Key Operational Highlights Q3 FY2022 Aluminium, record aluminium* production of 578kt Zinc India, record refined metal production of 261kt Zinc International, Gamsberg production at 41kt down 5% y-o-y O&G, Infill wells development projects commenced Iron Ore, Karnataka sales at 1.5 Mnt up 24% y-o-y; Commercial operations started at recently acquired Cement Plant NICOMET acquisition: Became the sole producer of Nickel in India ESL, record hot metal production at 379kt post acquisition; highest ever saleable production at 350kt post acquisition FACOR, achieved highest Fe Chrome production of 20kt *Including trial run 9M FY2022 Aluminium, highest aluminium* production of ~1.70 Mnt and alumina production of ~1.47 Mnt Zinc India, best-ever mined metal production of 722kt Zinc International, Ever highest Gamsberg production of 126kt O&G, production increased to 163 kboepd Iron Ore, record hot metal production of 612kt at VAB ESL, saleable production 933kt enhanced through improvement of furnace performance FACOR, achieved record Fe Chrome production of 58kt and ore production of 206kt
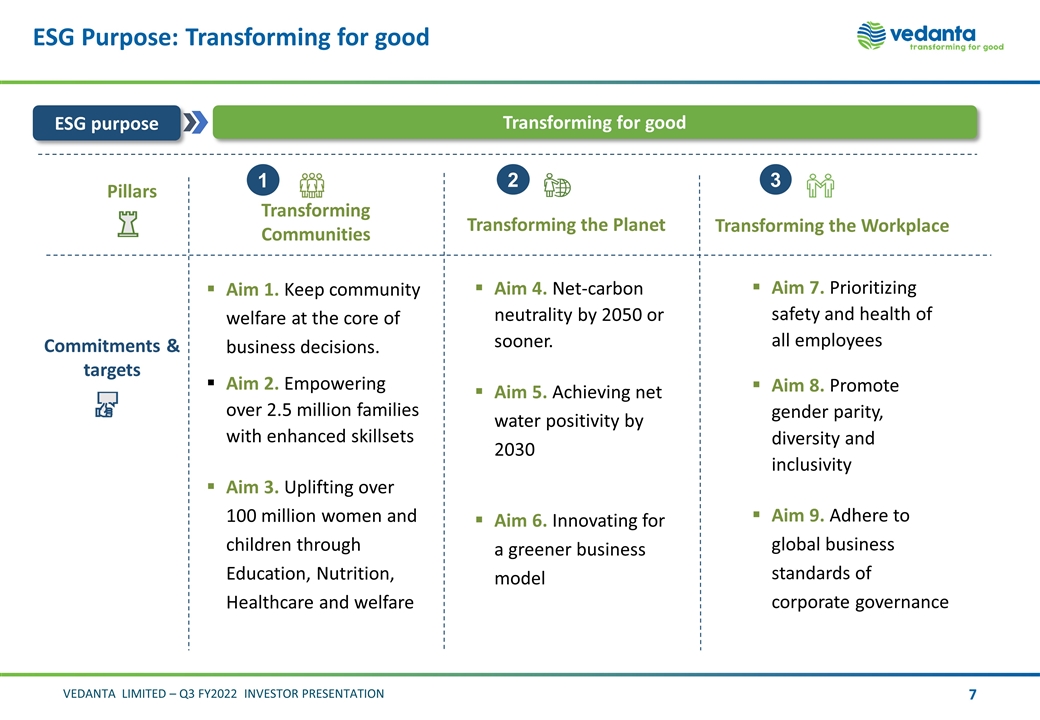
ESG Purpose: Transforming for good Commitments & targets Pillars 3 2 1 Transforming Communities Transforming the Planet Transforming the Workplace Aim 1. Keep community welfare at the core of business decisions. Aim 2. Empowering over 2.5 million families with enhanced skillsets Aim 3. Uplifting over 100 million women and children through Education, Nutrition, Healthcare and welfare Aim 4. Net-carbon neutrality by 2050 or sooner. Aim 5. Achieving net water positivity by 2030 Aim 6. Innovating for a greener business model Aim 7. Prioritizing safety and health of all employees Aim 8. Promote gender parity, diversity and inclusivity Aim 9. Adhere to global business standards of corporate governance Transforming for good ESG purpose
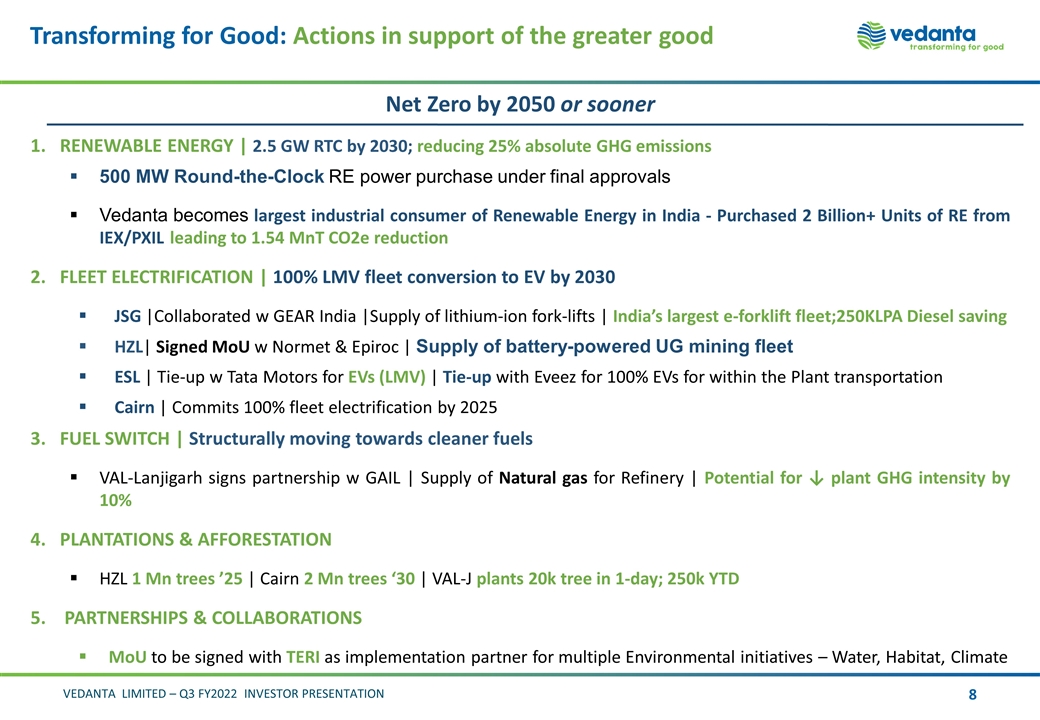
Transforming for Good: Actions in support of the greater good Net Zero by 2050 or sooner RENEWABLE ENERGY | 2.5 GW RTC by 2030; reducing 25% absolute GHG emissions 500 MW Round-the-Clock RE power purchase under final approvals Vedanta becomes largest industrial consumer of Renewable Energy in India - Purchased 2 Billion+ Units of RE from IEX/PXIL leading to 1.54 MnT CO2e reduction FLEET ELECTRIFICATION | 100% LMV fleet conversion to EV by 2030 JSG |Collaborated w GEAR India |Supply of lithium-ion fork-lifts | India’s largest e-forklift fleet;250KLPA Diesel saving HZL| Signed MoU w Normet & Epiroc | Supply of battery-powered UG mining fleet ESL | Tie-up w Tata Motors for EVs (LMV) | Tie-up with Eveez for 100% EVs for within the Plant transportation Cairn | Commits 100% fleet electrification by 2025 FUEL SWITCH | Structurally moving towards cleaner fuels VAL-Lanjigarh signs partnership w GAIL | Supply of Natural gas for Refinery | Potential for ↓ plant GHG intensity by 10% PLANTATIONS & AFFORESTATION HZL 1 Mn trees ’25 | Cairn 2 Mn trees ‘30 | VAL-J plants 20k tree in 1-day; 250k YTD PARTNERSHIPS & COLLABORATIONS MoU to be signed with TERI as implementation partner for multiple Environmental initiatives – Water, Habitat, Climate
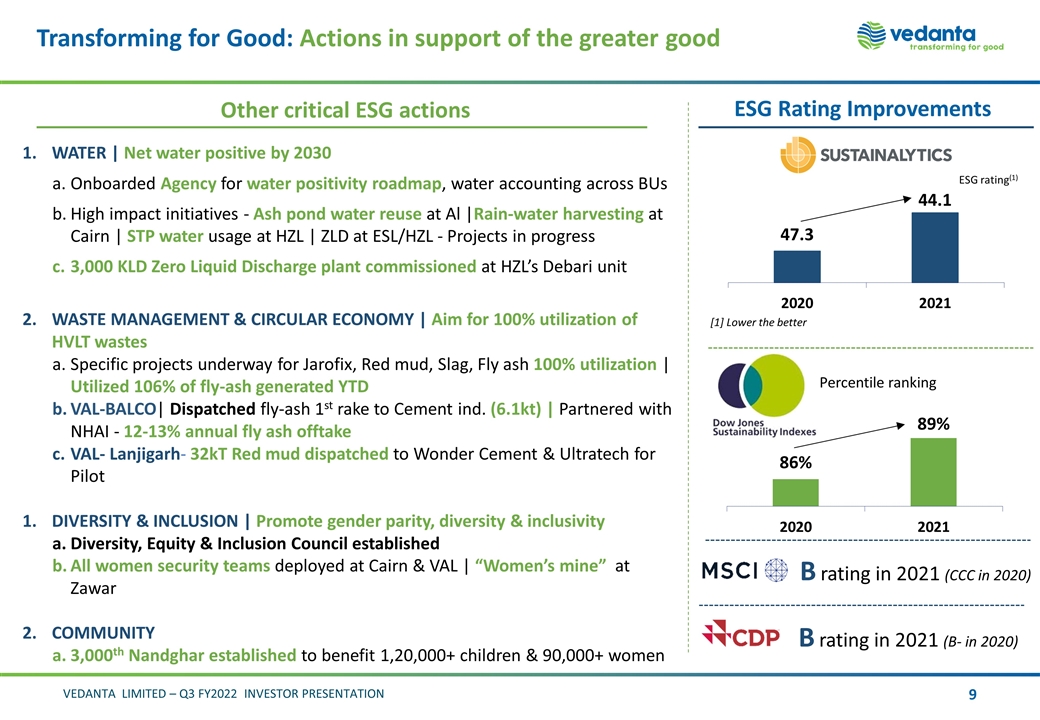
Transforming for Good: Actions in support of the greater good Other critical ESG actions WATER | Net water positive by 2030 Onboarded Agency for water positivity roadmap, water accounting across BUs High impact initiatives - Ash pond water reuse at Al |Rain-water harvesting at Cairn | STP water usage at HZL | ZLD at ESL/HZL - Projects in progress 3,000 KLD Zero Liquid Discharge plant commissioned at HZL’s Debari unit WASTE MANAGEMENT & CIRCULAR ECONOMY | Aim for 100% utilization of HVLT wastes Specific projects underway for Jarofix, Red mud, Slag, Fly ash 100% utilization | Utilized 106% of fly-ash generated YTD VAL-BALCO| Dispatched fly-ash 1st rake to Cement ind. (6.1kt) | Partnered with NHAI - 12-13% annual fly ash offtake VAL- Lanjigarh- 32kT Red mud dispatched to Wonder Cement & Ultratech for Pilot DIVERSITY & INCLUSION | Promote gender parity, diversity & inclusivity Diversity, Equity & Inclusion Council established All women security teams deployed at Cairn & VAL | “Women’s mine” at Zawar COMMUNITY 3,000th Nandghar established to benefit 1,20,000+ children & 90,000+ women ESG Rating Improvements ESG rating(1) Percentile ranking B rating in 2021 (CCC in 2020) B rating in 2021 (B- in 2020) [1] Lower the better
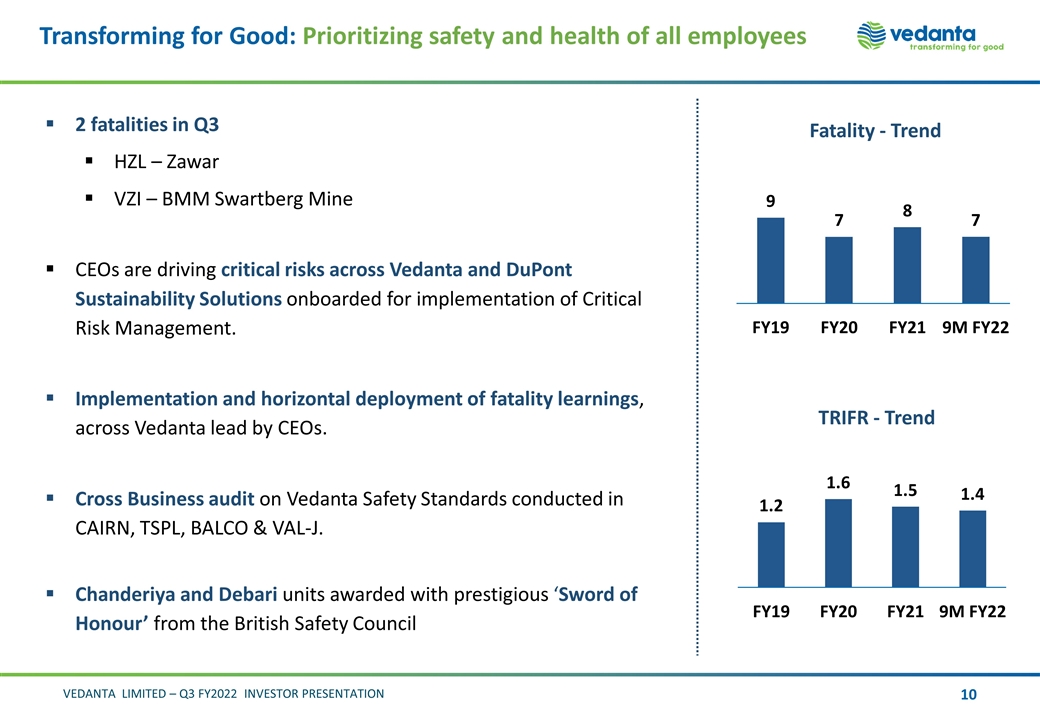
Transforming for Good: Prioritizing safety and health of all employees TRIFR - Trend Fatality - Trend 2 fatalities in Q3 HZL – Zawar VZI – BMM Swartberg Mine CEOs are driving critical risks across Vedanta and DuPont Sustainability Solutions onboarded for implementation of Critical Risk Management. Implementation and horizontal deployment of fatality learnings, across Vedanta lead by CEOs. Cross Business audit on Vedanta Safety Standards conducted in CAIRN, TSPL, BALCO & VAL-J. Chanderiya and Debari units awarded with prestigious ‘Sword of Honour’ from the British Safety Council
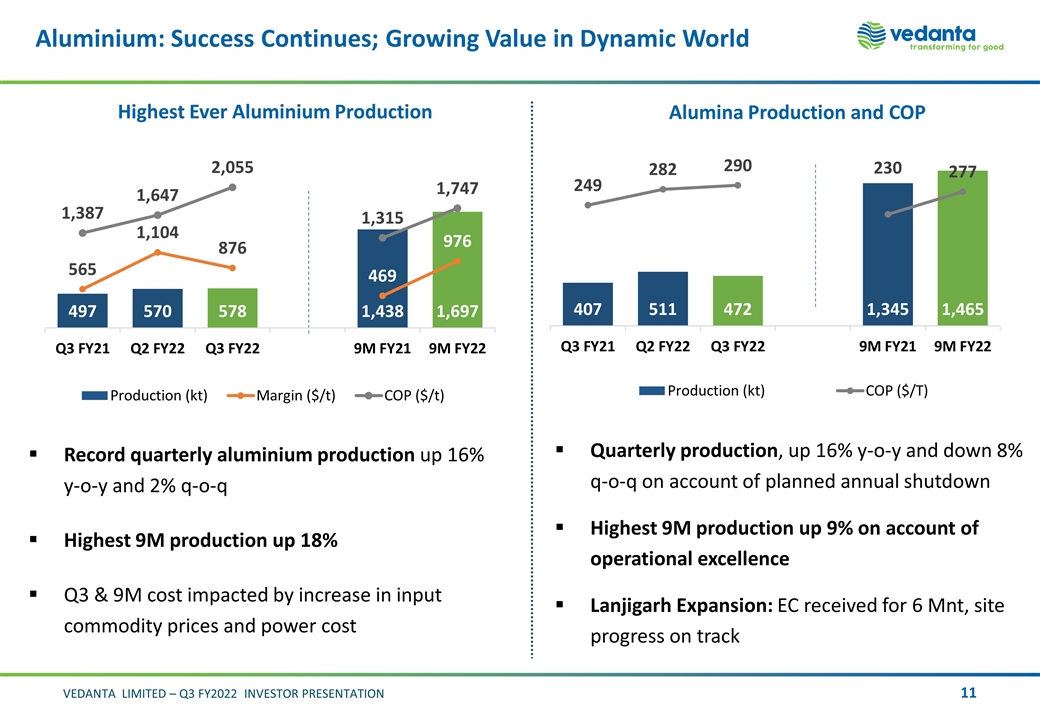
Aluminium: Success Continues; Growing Value in Dynamic World Highest Ever Aluminium Production Alumina Production and COP Record quarterly aluminium production up 16% y-o-y and 2% q-o-q Highest 9M production up 18% Q3 & 9M cost impacted by increase in input commodity prices and power cost Quarterly production, up 16% y-o-y and down 8% q-o-q on account of planned annual shutdown Highest 9M production up 9% on account of operational excellence Lanjigarh Expansion: EC received for 6 Mnt, site progress on track
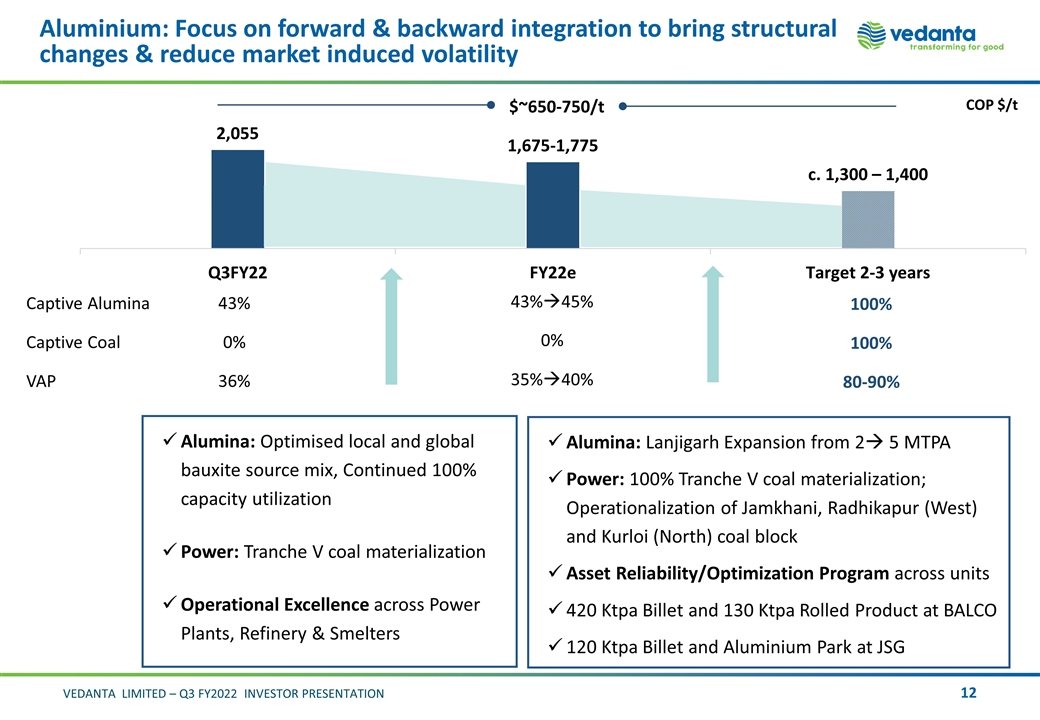
Aluminium: Focus on forward & backward integration to bring structural changes & reduce market induced volatility Alumina: Optimised local and global bauxite source mix, Continued 100% capacity utilization Power: Tranche V coal materialization Operational Excellence across Power Plants, Refinery & Smelters Alumina: Lanjigarh Expansion from 2à 5 MTPA Power: 100% Tranche V coal materialization; Operationalization of Jamkhani, Radhikapur (West) and Kurloi (North) coal block Asset Reliability/Optimization Program across units 420 Ktpa Billet and 130 Ktpa Rolled Product at BALCO 120 Ktpa Billet and Aluminium Park at JSG COP $/t Captive Alumina Captive Coal VAP 43% 0% 36% 43%à45% 0% 35%à40% 100% 100% 80-90% $~650-750/t
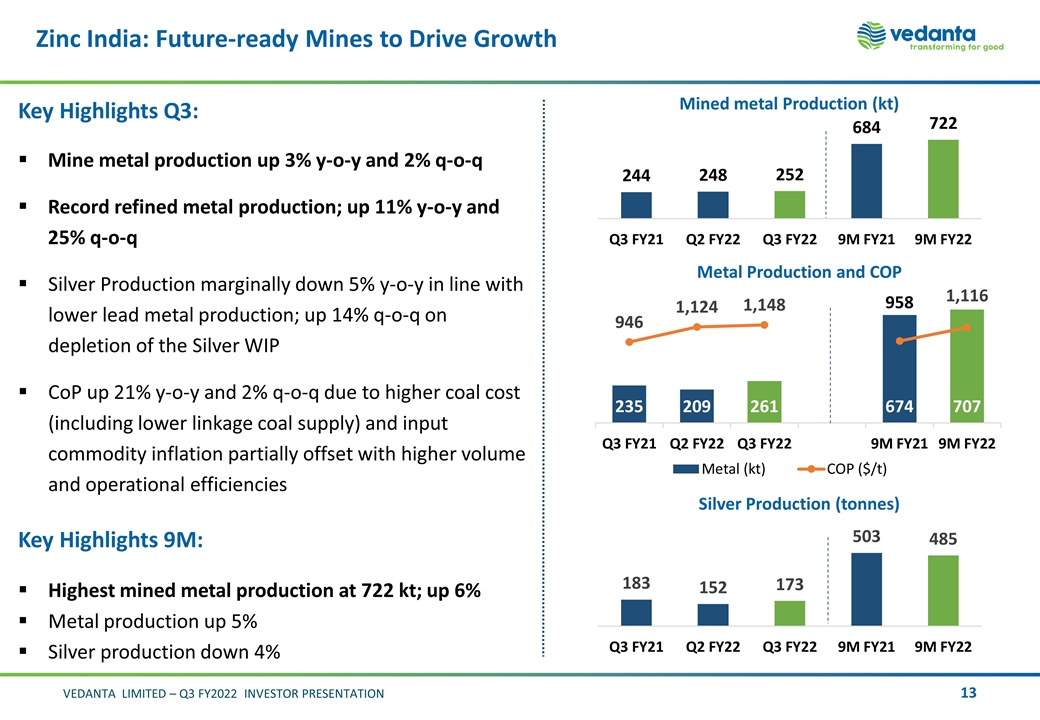
Mined metal Production (kt) Metal Production and COP Key Highlights Q3: Mine metal production up 3% y-o-y and 2% q-o-q Record refined metal production; up 11% y-o-y and 25% q-o-q Silver Production marginally down 5% y-o-y in line with lower lead metal production; up 14% q-o-q on depletion of the Silver WIP CoP up 21% y-o-y and 2% q-o-q due to higher coal cost (including lower linkage coal supply) and input commodity inflation partially offset with higher volume and operational efficiencies Key Highlights 9M: Highest mined metal production at 722 kt; up 6% Metal production up 5% Silver production down 4% Zinc India: Future-ready Mines to Drive Growth Silver Production (tonnes)
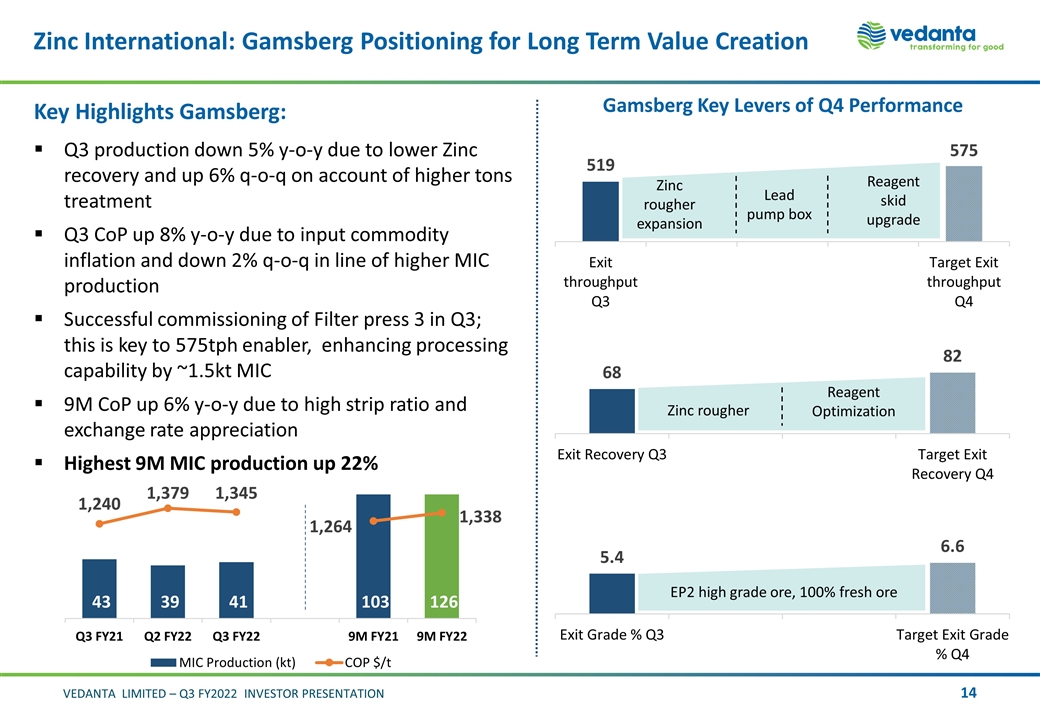
Zinc International: Gamsberg Positioning for Long Term Value Creation Zinc rougher expansion Lead pump box Reagent skid upgrade Zinc rougher Reagent Optimization EP2 high grade ore, 100% fresh ore Gamsberg Key Levers of Q4 Performance Key Highlights Gamsberg: Q3 production down 5% y-o-y due to lower Zinc recovery and up 6% q-o-q on account of higher tons treatment Q3 CoP up 8% y-o-y due to input commodity inflation and down 2% q-o-q in line of higher MIC production Successful commissioning of Filter press 3 in Q3; this is key to 575tph enabler, enhancing processing capability by ~1.5kt MIC 9M CoP up 6% y-o-y due to high strip ratio and exchange rate appreciation Highest 9M MIC production up 22%
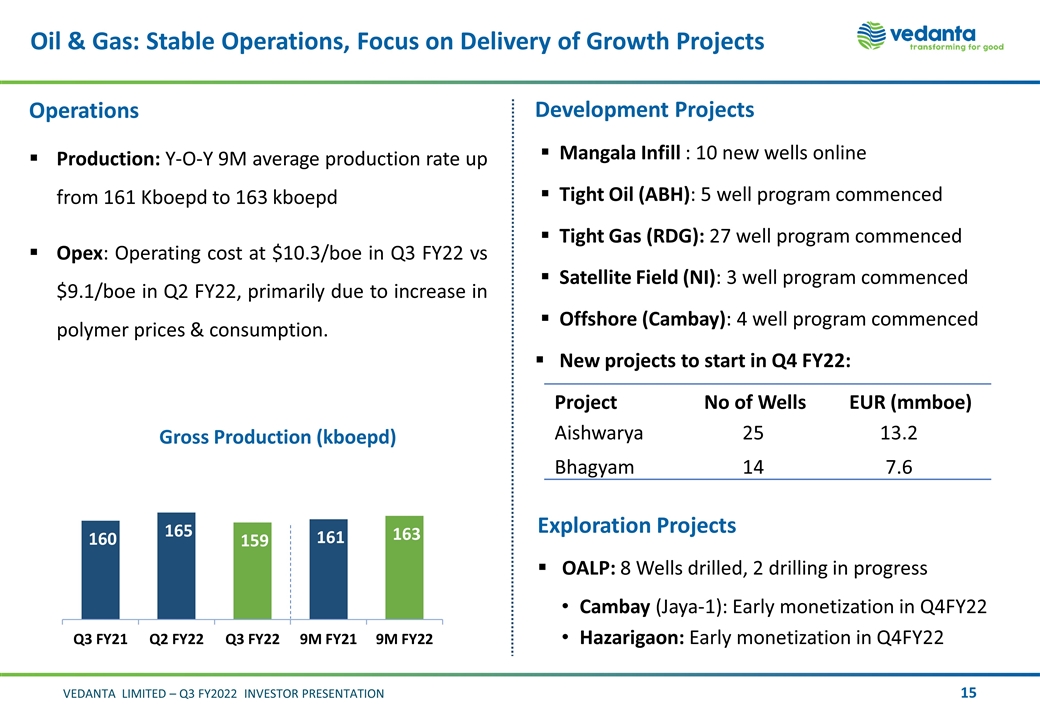
Oil & Gas: Stable Operations, Focus on Delivery of Growth Projects Gross Production (kboepd) Operations Production: Y-O-Y 9M average production rate up from 161 Kboepd to 163 kboepd Opex: Operating cost at $10.3/boe in Q3 FY22 vs $9.1/boe in Q2 FY22, primarily due to increase in polymer prices & consumption. Development Projects Mangala Infill : 10 new wells online Tight Oil (ABH): 5 well program commenced Tight Gas (RDG): 27 well program commenced Satellite Field (NI): 3 well program commenced Offshore (Cambay): 4 well program commenced New projects to start in Q4 FY22: Exploration Projects OALP: 8 Wells drilled, 2 drilling in progress Cambay (Jaya-1): Early monetization in Q4FY22 Hazarigaon: Early monetization in Q4FY22 Project No of Wells EUR (mmboe) Aishwarya 25 13.2 Bhagyam 14 7.6
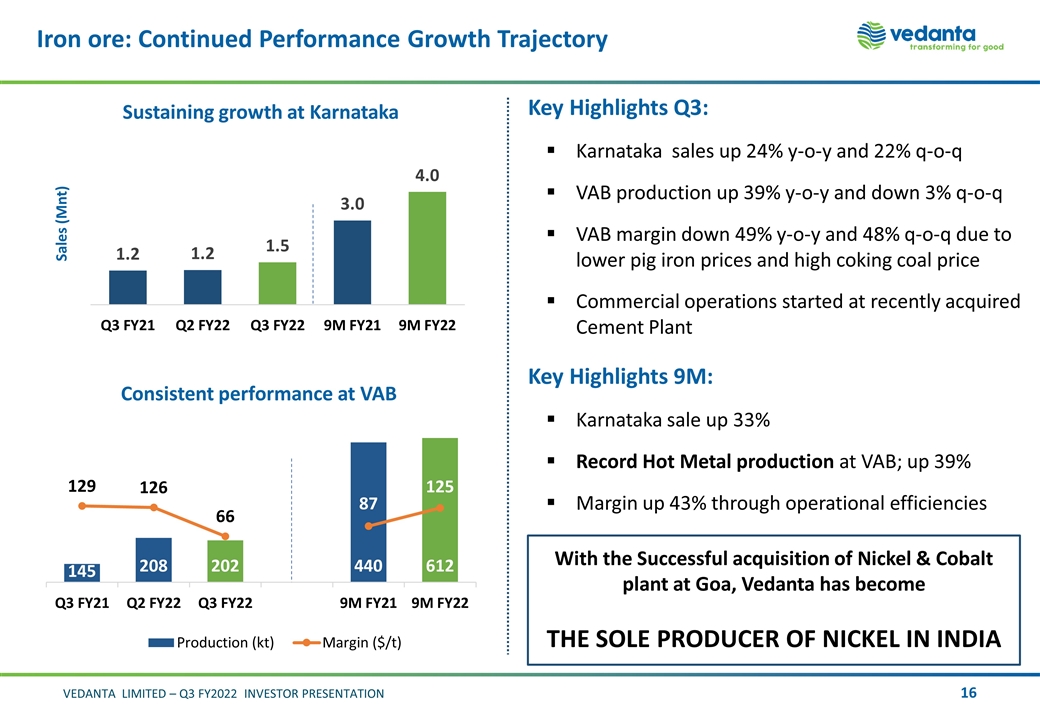
Iron ore: Continued Performance Growth Trajectory Sustaining growth at Karnataka Sales (Mnt) Key Highlights Q3: Karnataka sales up 24% y-o-y and 22% q-o-q VAB production up 39% y-o-y and down 3% q-o-q VAB margin down 49% y-o-y and 48% q-o-q due to lower pig iron prices and high coking coal price Commercial operations started at recently acquired Cement Plant Key Highlights 9M: Karnataka sale up 33% Record Hot Metal production at VAB; up 39% Margin up 43% through operational efficiencies Consistent performance at VAB With the Successful acquisition of Nickel & Cobalt plant at Goa, Vedanta has become THE SOLE PRODUCER OF NICKEL IN INDIA
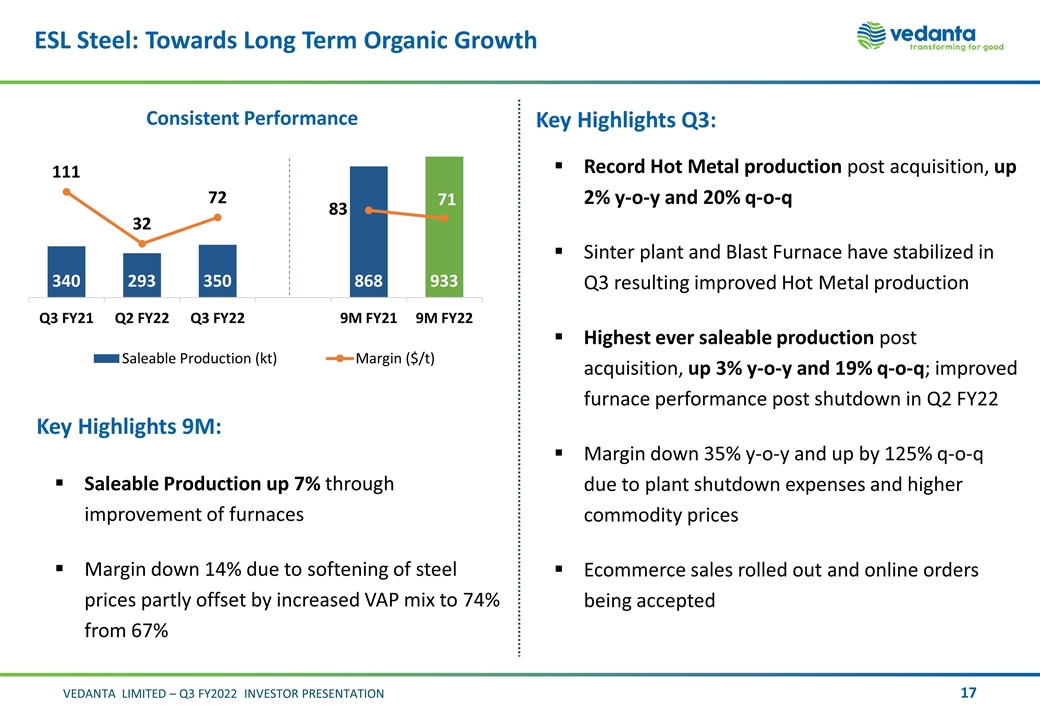
ESL Steel: Towards Long Term Organic Growth Key Highlights Q3: Record Hot Metal production post acquisition, up 2% y-o-y and 20% q-o-q Sinter plant and Blast Furnace have stabilized in Q3 resulting improved Hot Metal production Highest ever saleable production post acquisition, up 3% y-o-y and 19% q-o-q; improved furnace performance post shutdown in Q2 FY22 Margin down 35% y-o-y and up by 125% q-o-q due to plant shutdown expenses and higher commodity prices Ecommerce sales rolled out and online orders being accepted Consistent Performance Key Highlights 9M: Saleable Production up 7% through improvement of furnaces Margin down 14% due to softening of steel prices partly offset by increased VAP mix to 74% from 67%
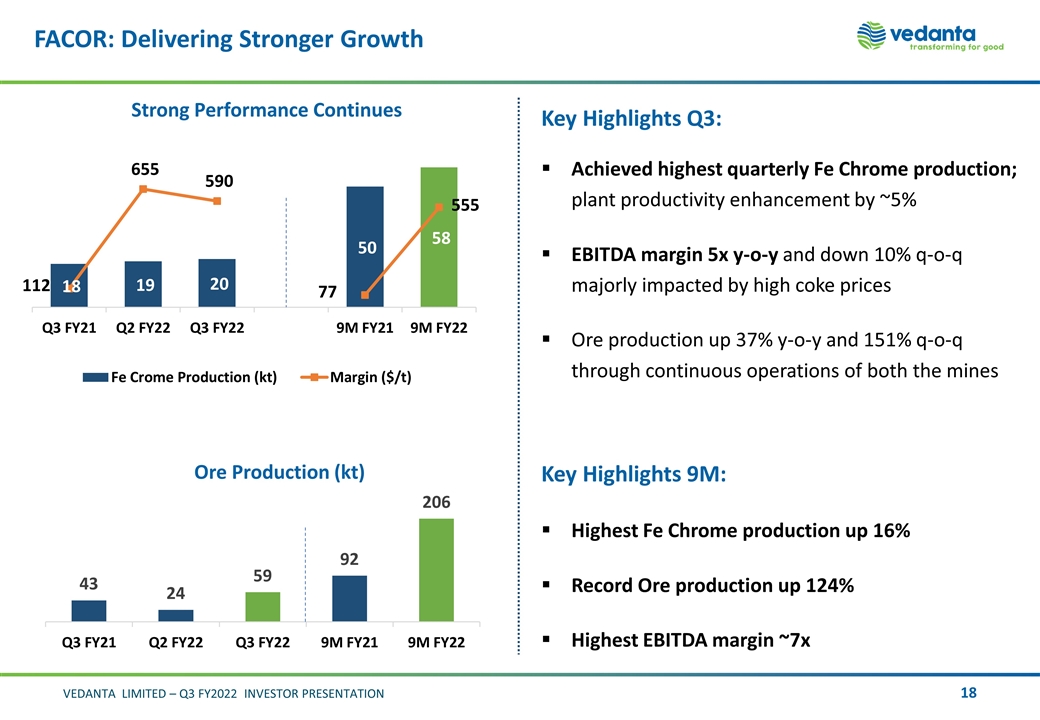
FACOR: Delivering Stronger Growth Key Highlights Q3: Achieved highest quarterly Fe Chrome production; plant productivity enhancement by ~5% EBITDA margin 5x y-o-y and down 10% q-o-q majorly impacted by high coke prices Ore production up 37% y-o-y and 151% q-o-q through continuous operations of both the mines Key Highlights 9M: Highest Fe Chrome production up 16% Record Ore production up 124% Highest EBITDA margin ~7x Ore Production (kt) Strong Performance Continues
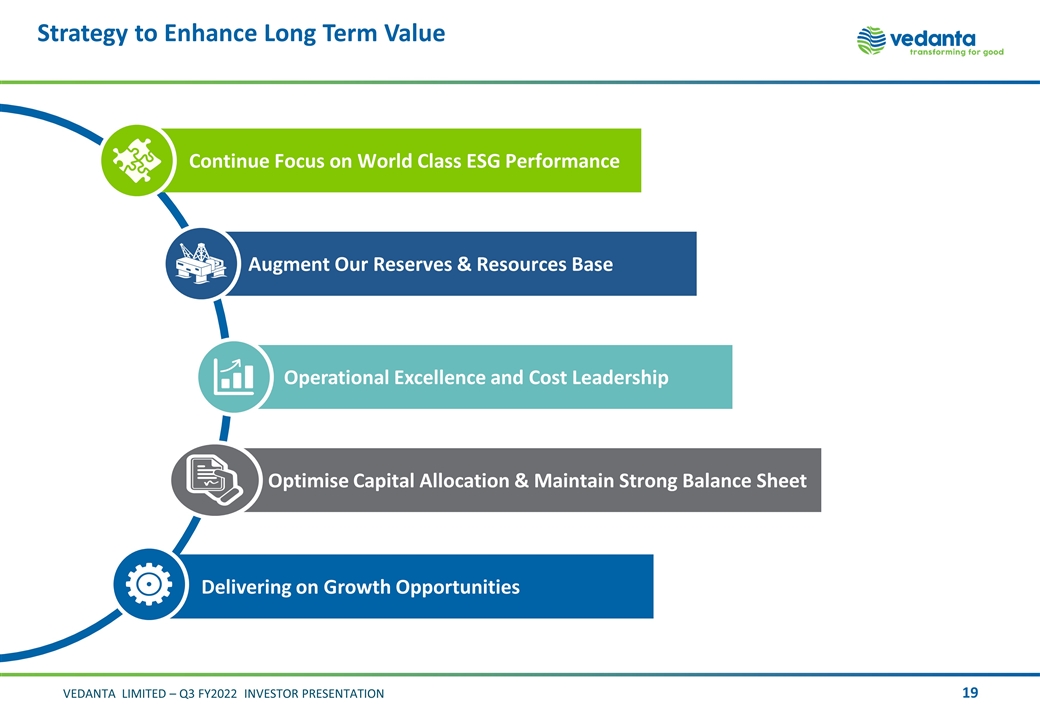
Strategy to Enhance Long Term Value Continue Focus on World Class ESG Performance Augment Our Reserves & Resources Base Delivering on Growth Opportunities Optimise Capital Allocation & Maintain Strong Balance Sheet Operational Excellence and Cost Leadership
Finance Update Ajay Goel Acting Chief Financial Officer VEDANTA LIMITED INVESTOR PRESENTATION Q3 FY2022

Financial snapshot Q3 FY 2022 Revenue EBITDA EBITDA Margin 1 Attributable PAT (before exceptional items) ₹ 33,697 cr ₹ 10,938 cr 37% 4,189 cr Up 50% y-o-y Up 42% y-o-y Industry leading margin Up 27% y-o-y ROCE 2 Cash and Cash equivalents ND ND/EBITDA c.25% ₹ 25,207 cr 27,576 cr 0.7x Up ~1,250 bps y-o-y Strong liquidity position Lower 22% y-o-y Maintained at low level 1. Excludes custom smelting at Copper Business. 2. ROCE is calculated as EBIT net of tax outflow divided by average capital employed.
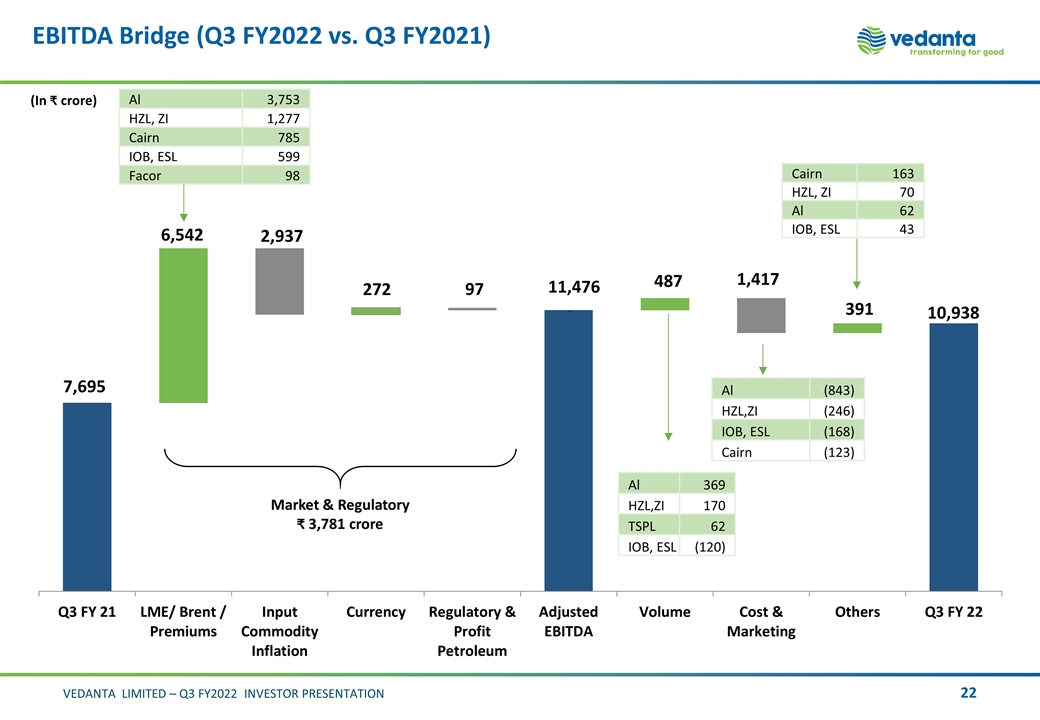
(In crore) Market & Regulatory 3,781 crore Al 3,753 HZL, ZI 1,277 Cairn 785 IOB, ESL 599 Facor 98 Al 369 HZL,ZI 170 TSPL 62 IOB, ESL (120) Cairn 163 HZL, ZI 70 Al 62 IOB, ESL 43 Al (843) HZL,ZI (246) IOB, ESL (168) Cairn (123) EBITDA Bridge (Q3 FY2022 vs. Q3 FY2021)
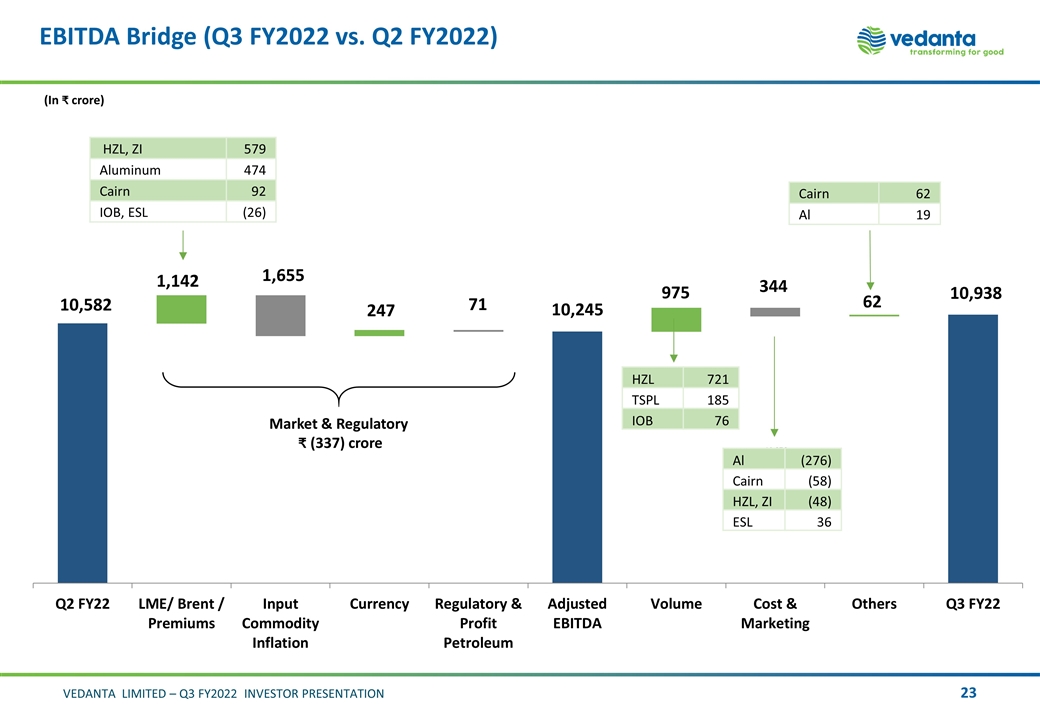
(In crore) Market & Regulatory ₹ (337) crore HZL, ZI 579 Aluminum 474 Cairn 92 IOB, ESL (26) Cairn 62 Al 19 HZL 721 TSPL 185 IOB 76 Al (276) Cairn (58) HZL, ZI (48) ESL 36 EBITDA Bridge (Q3 FY2022 vs. Q2 FY2022)
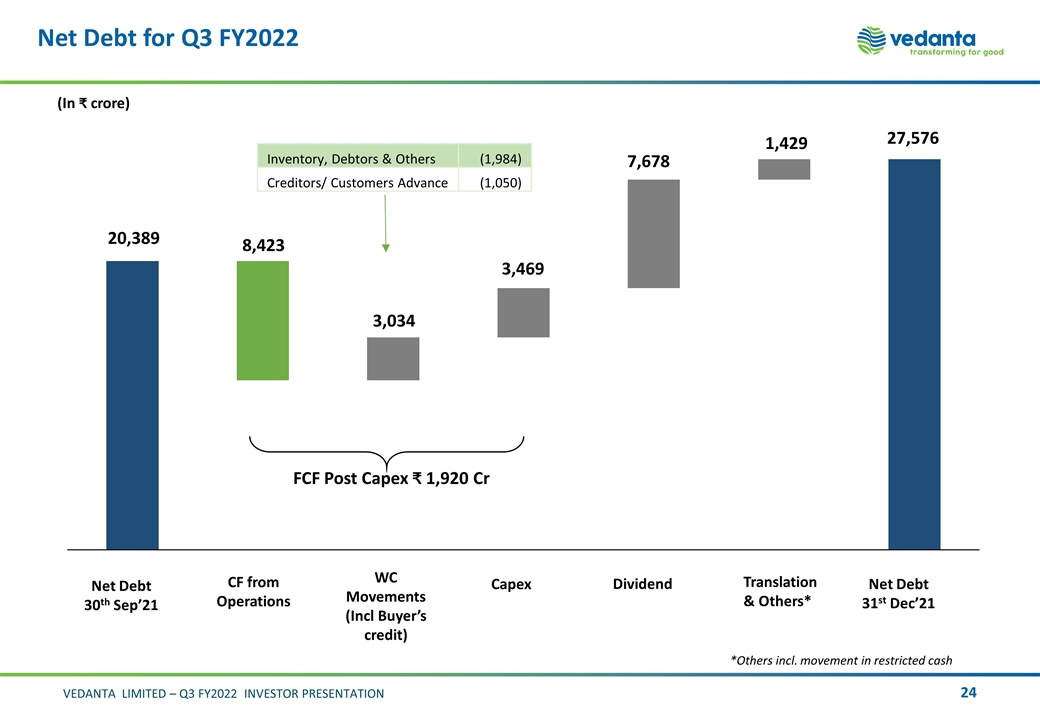
Net Debt for Q3 FY2022 (In ₹ crore) (Incl Buyer’s credit) Capex Net Debt 31st Dec’21 Net Debt 30th Sep’21 Dividend Translation & Others* *Others incl. movement in restricted cash Inventory, Debtors & Others (1,984) Creditors/ Customers Advance (1,050)
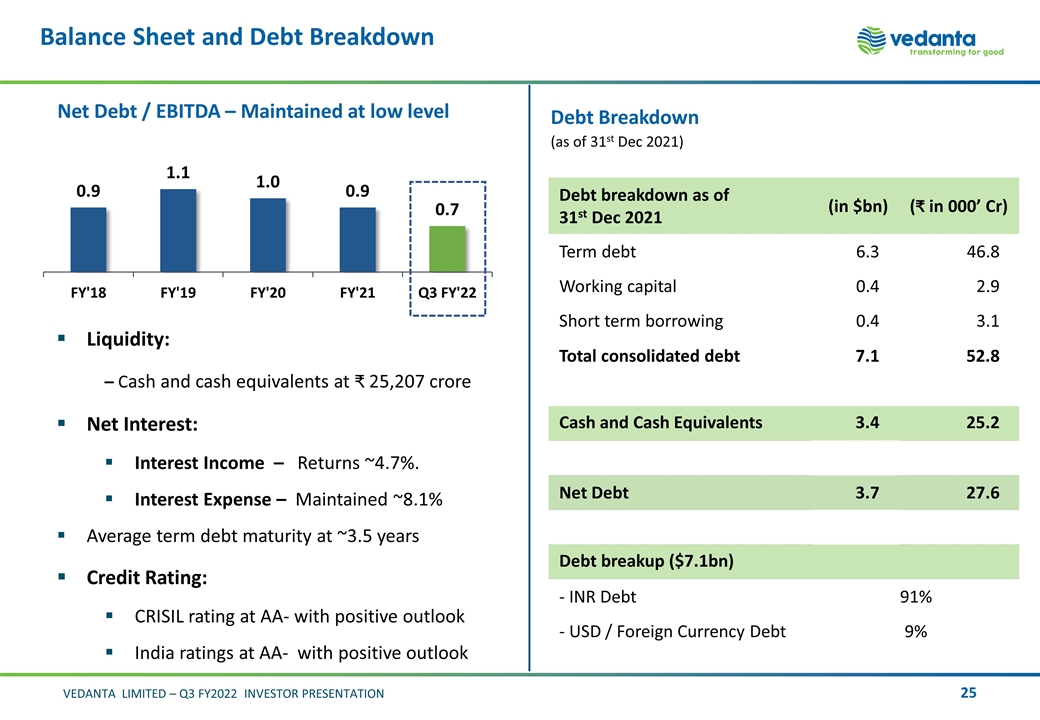
Balance Sheet and Debt Breakdown Net Debt / EBITDA – Maintained at low level Liquidity: – Cash and cash equivalents at 25,207 crore Net Interest: Interest Income – Returns ~4.7%. Interest Expense – Maintained ~8.1% Average term debt maturity at ~3.5 years Credit Rating: CRISIL rating at AA- with positive outlook India ratings at AA- with positive outlook Debt Breakdown (as of 31st Dec 2021) Debt breakdown as of 31st Dec 2021 (in $bn) ( in 000’ Cr) Term debt 6.3 46.8 Working capital 0.4 2.9 Short term borrowing 0.4 3.1 Total consolidated debt 7.1 52.8 Cash and Cash Equivalents 3.4 25.2 Net Debt 3.7 27.6 Debt breakup ($7.1bn) - INR Debt 91% - USD / Foreign Currency Debt 9%
VEDANTA LIMITED INVESTOR PRESENTATION Q3 FY2022 Appendix
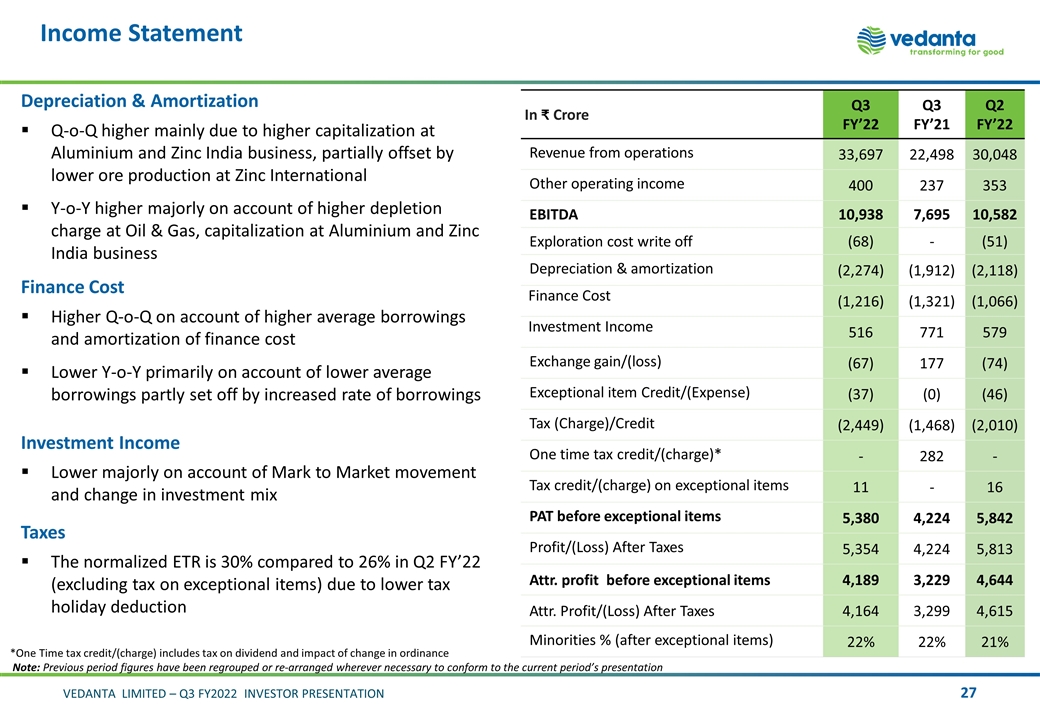
In Crore Q3 FY’22 Q3 FY’21 Q2 FY’22 Revenue from operations 33,697 22,498 30,048 Other operating income 400 237 353 EBITDA 10,938 7,695 10,582 Exploration cost write off (68) - (51) Depreciation & amortization (2,274) (1,912) (2,118) Finance Cost (1,216) (1,321) (1,066) Investment Income 516 771 579 Exchange gain/(loss) (67) 177 (74) Exceptional item Credit/(Expense) (37) (0) (46) Tax (Charge)/Credit (2,449) (1,468) (2,010) One time tax credit/(charge)* - 282 - Tax credit/(charge) on exceptional items 11 - 16 PAT before exceptional items 5,380 4,224 5,842 Profit/(Loss) After Taxes 5,354 4,224 5,813 Attr. profit before exceptional items 4,189 3,229 4,644 Attr. Profit/(Loss) After Taxes 4,164 3,299 4,615 Minorities % (after exceptional items) 22% 22% 21% Income Statement Depreciation & Amortization Q-o-Q higher mainly due to higher capitalization at Aluminium and Zinc India business, partially offset by lower ore production at Zinc International Y-o-Y higher majorly on account of higher depletion charge at Oil & Gas, capitalization at Aluminium and Zinc India business Finance Cost Higher Q-o-Q on account of higher average borrowings and amortization of finance cost Lower Y-o-Y primarily on account of lower average borrowings partly set off by increased rate of borrowings Investment Income Lower majorly on account of Mark to Market movement and change in investment mix Taxes The normalized ETR is 30% compared to 26% in Q2 FY’22 (excluding tax on exceptional items) due to lower tax holiday deduction *One Time tax credit/(charge) includes tax on dividend and impact of change in ordinance Note: Previous period figures have been regrouped or re-arranged wherever necessary to conform to the current period’s presentation
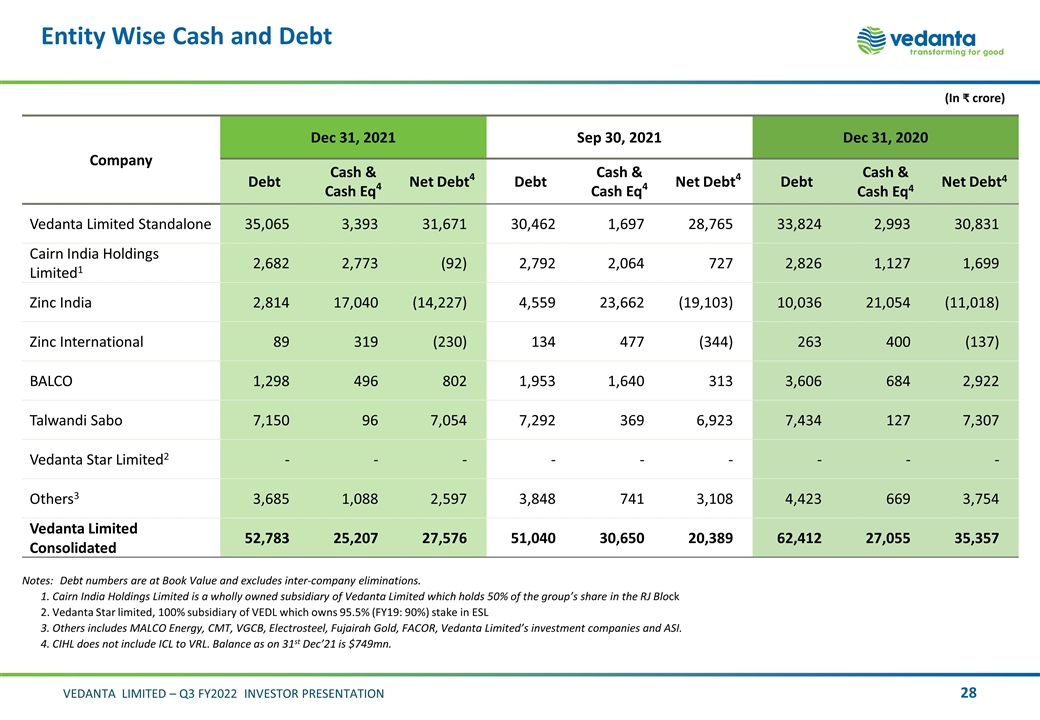
Entity Wise Cash and Debt Notes:Debt numbers are at Book Value and excludes inter-company eliminations. 1. Cairn India Holdings Limited is a wholly owned subsidiary of Vedanta Limited which holds 50% of the group’s share in the RJ Block 2. Vedanta Star limited, 100% subsidiary of VEDL which owns 95.5% (FY19: 90%) stake in ESL 3. Others includes MALCO Energy, CMT, VGCB, Electrosteel, Fujairah Gold, FACOR, Vedanta Limited’s investment companies and ASI. 4. CIHL does not include ICL to VRL. Balance as on 31st Dec’21 is $749mn. (In crore) Company Dec 31, 2021 Sep 30, 2021 Dec 31, 2020 Debt Cash & Cash Eq4 Net Debt4 Debt Cash & Cash Eq4 Net Debt4 Debt Cash & Cash Eq4 Net Debt4 Vedanta Limited Standalone 35,065 3,393 31,671 30,462 1,697 28,765 33,824 2,993 30,831 Cairn India Holdings Limited1 2,682 2,773 (92) 2,792 2,064 727 2,826 1,127 1,699 Zinc India 2,814 17,040 (14,227) 4,559 23,662 (19,103) 10,036 21,054 (11,018) Zinc International 89 319 (230) 134 477 (344) 263 400 (137) BALCO 1,298 496 802 1,953 1,640 313 3,606 684 2,922 Talwandi Sabo 7,150 96 7,054 7,292 369 6,923 7,434 127 7,307 Vedanta Star Limited2 - - - - - - - - - Others3 3,685 1,088 2,597 3,848 741 3,108 4,423 669 3,754 Vedanta Limited Consolidated 52,783 25,207 27,576 51,040 30,650 20,389 62,412 27,055 35,357
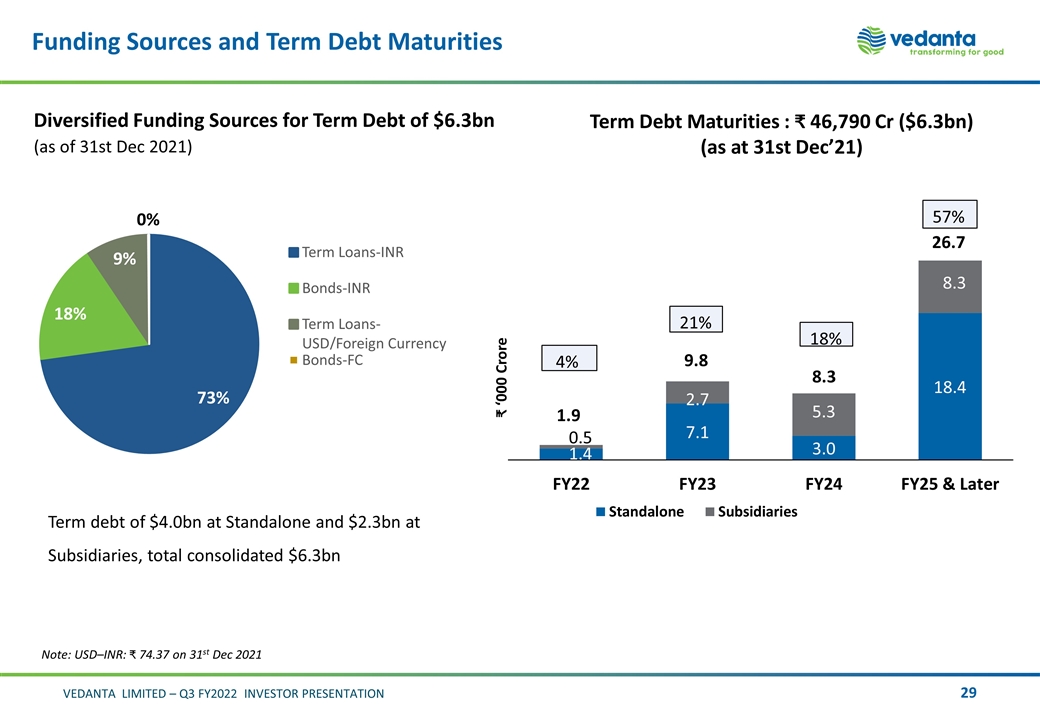
Funding Sources and Term Debt Maturities Diversified Funding Sources for Term Debt of $6.3bn (as of 31st Dec 2021) Note: USD–INR: 74.37 on 31st Dec 2021 Term Debt Maturities : 46,790 Cr ($6.3bn) (as at 31st Dec’21) Term debt of $4.0bn at Standalone and $2.3bn at Subsidiaries, total consolidated $6.3bn
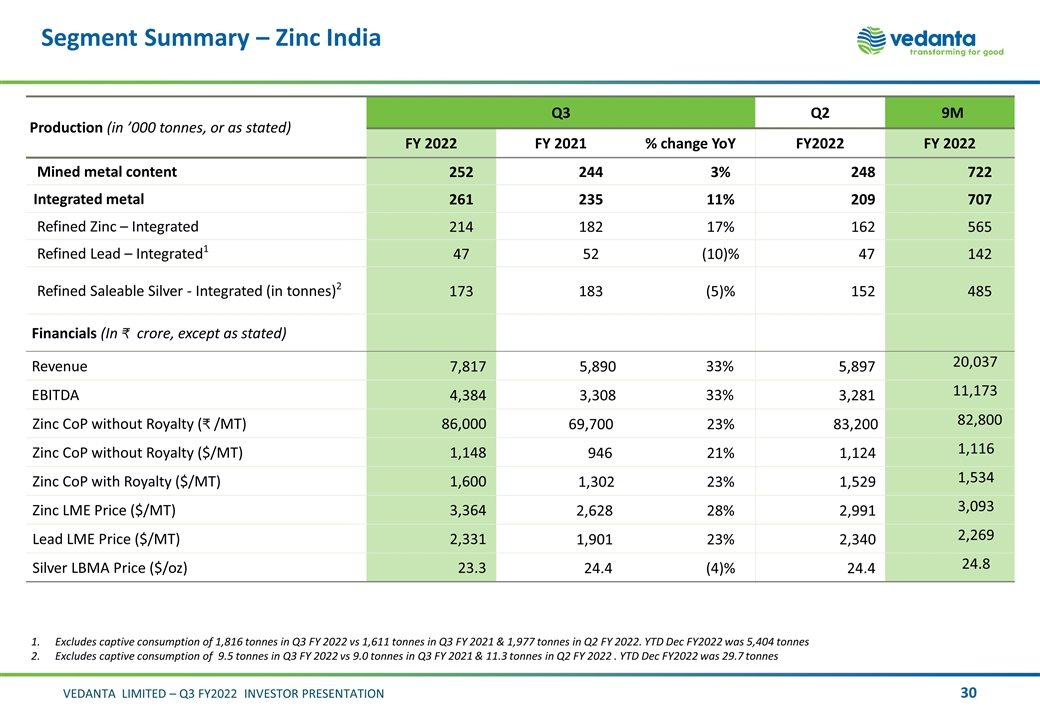
Segment Summary – Zinc India Production (in ’000 tonnes, or as stated) Q3 Q2 9M FY 2022 FY 2021 % change YoY FY2022 FY 2022 Mined metal content 252 244 3% 248 722 Integrated metal 261 235 11% 209 707 Refined Zinc – Integrated 214 182 17% 162 565 Refined Lead – Integrated1 47 52 (10)% 47 142 Refined Saleable Silver - Integrated (in tonnes)2 173 183 (5)% 152 485 Financials (In crore, except as stated) Revenue 7,817 5,890 33% 5,897 20,037 EBITDA 4,384 3,308 33% 3,281 11,173 Zinc CoP without Royalty ( /MT) 86,000 69,700 23% 83,200 82,800 Zinc CoP without Royalty ($/MT) 1,148 946 21% 1,124 1,116 Zinc CoP with Royalty ($/MT) 1,600 1,302 23% 1,529 1,534 Zinc LME Price ($/MT) 3,364 2,628 28% 2,991 3,093 Lead LME Price ($/MT) 2,331 1,901 23% 2,340 2,269 Silver LBMA Price ($/oz) 23.3 24.4 (4)% 24.4 24.8 Excludes captive consumption of 1,816 tonnes in Q3 FY 2022 vs 1,611 tonnes in Q3 FY 2021 & 1,977 tonnes in Q2 FY 2022. YTD Dec FY2022 was 5,404 tonnes Excludes captive consumption of 9.5 tonnes in Q3 FY 2022 vs 9.0 tonnes in Q3 FY 2021 & 11.3 tonnes in Q2 FY 2022 . YTD Dec FY2022 was 29.7 tonnes
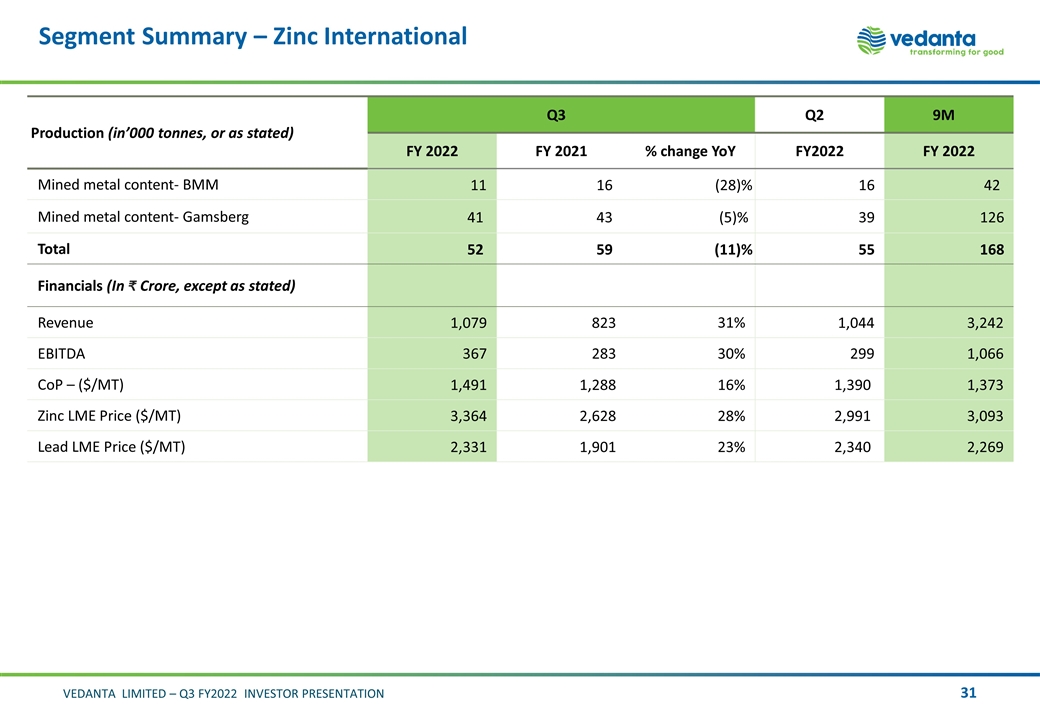
Segment Summary – Zinc International Production (in’000 tonnes, or as stated) Q3 Q2 9M FY 2022 FY 2021 % change YoY FY2022 FY 2022 Mined metal content- BMM 11 16 (28)% 16 42 Mined metal content- Gamsberg 41 43 (5)% 39 126 Total 52 59 (11)% 55 168 Financials (In Crore, except as stated) Revenue 1,079 823 31% 1,044 3,242 EBITDA 367 283 30% 299 1,066 CoP – ($/MT) 1,491 1,288 16% 1,390 1,373 Zinc LME Price ($/MT) 3,364 2,628 28% 2,991 3,093 Lead LME Price ($/MT) 2,331 1,901 23% 2,340 2,269
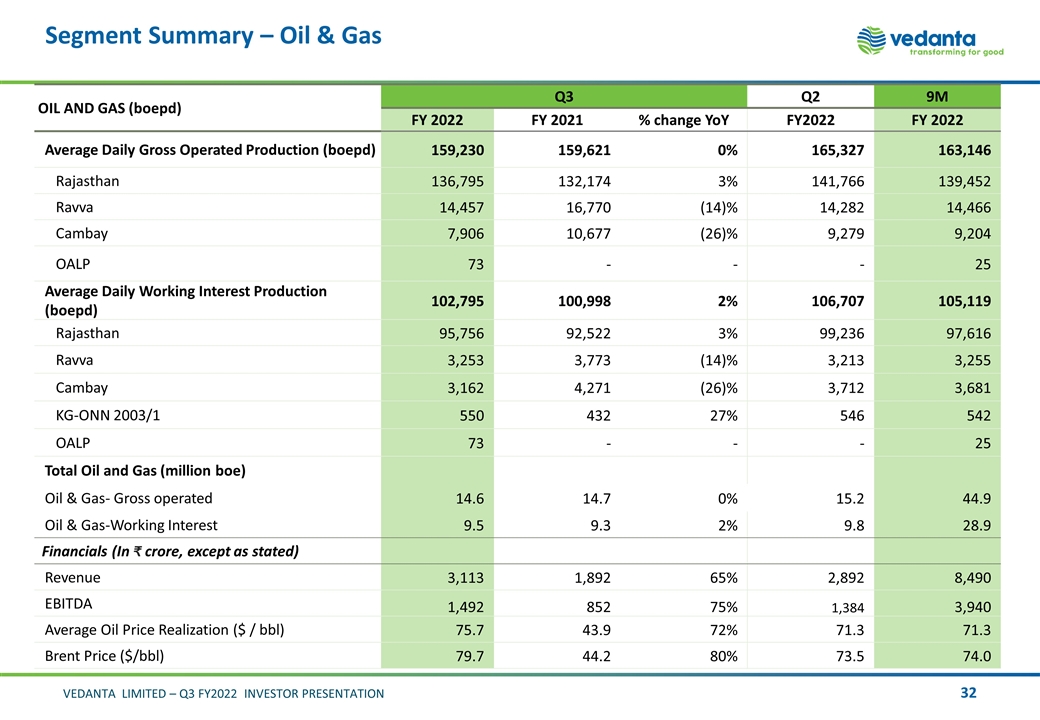
Segment Summary – Oil & Gas OIL AND GAS (boepd) Q3 Q2 9M FY 2022 FY 2021 % change YoY FY2022 FY 2022 Average Daily Gross Operated Production (boepd) 159,230 159,621 0% 165,327 163,146 Rajasthan 136,795 132,174 3% 141,766 139,452 Ravva 14,457 16,770 (14)% 14,282 14,466 Cambay 7,906 10,677 (26)% 9,279 9,204 OALP 73 - - - 25 Average Daily Working Interest Production (boepd) 102,795 100,998 2% 106,707 105,119 Rajasthan 95,756 92,522 3% 99,236 97,616 Ravva 3,253 3,773 (14)% 3,213 3,255 Cambay 3,162 4,271 (26)% 3,712 3,681 KG-ONN 2003/1 550 432 27% 546 542 OALP 73 - - - 25 Total Oil and Gas (million boe) Oil & Gas- Gross operated 14.6 14.7 0% 15.2 44.9 Oil & Gas-Working Interest 9.5 9.3 2% 9.8 28.9 Financials (In crore, except as stated) Revenue 3,113 1,892 65% 2,892 8,490 EBITDA 1,492 852 75% 1,384 3,940 Average Oil Price Realization ($ / bbl) 75.7 43.9 72% 71.3 71.3 Brent Price ($/bbl) 79.7 44.2 80% 73.5 74.0
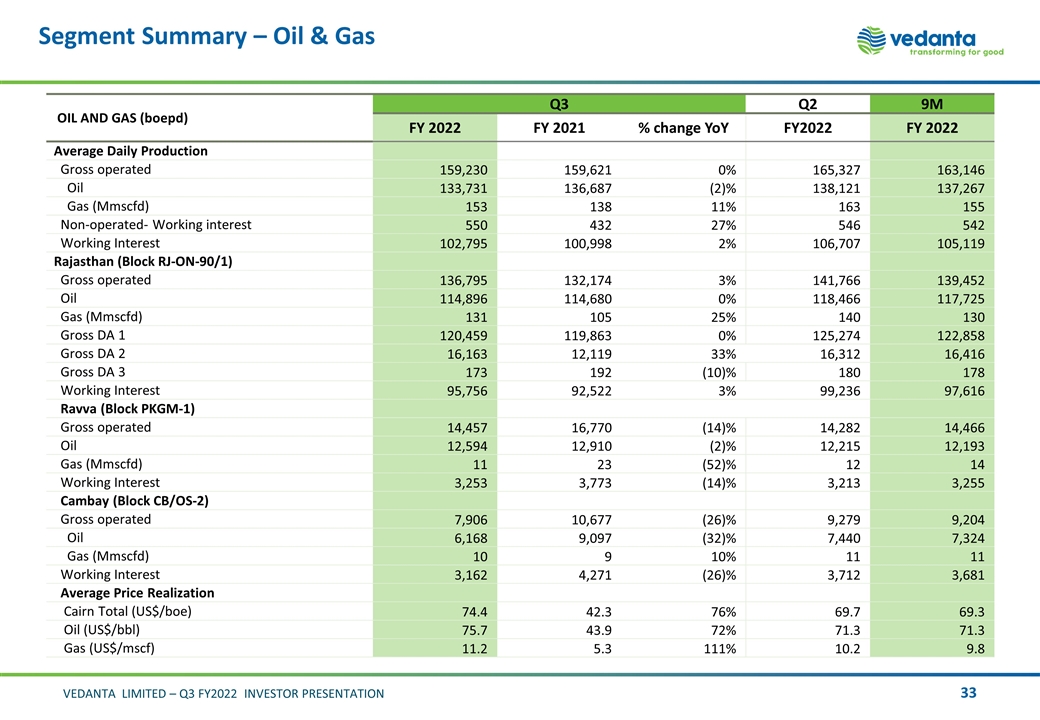
Segment Summary – Oil & Gas OIL AND GAS (boepd) Q3 Q2 9M FY 2022 FY 2021 % change YoY FY2022 FY 2022 Average Daily Production Gross operated 159,230 159,621 0% 165,327 163,146 Oil 133,731 136,687 (2)% 138,121 137,267 Gas (Mmscfd) 153 138 11% 163 155 Non-operated- Working interest 550 432 27% 546 542 Working Interest 102,795 100,998 2% 106,707 105,119 Rajasthan (Block RJ-ON-90/1) Gross operated 136,795 132,174 3% 141,766 139,452 Oil 114,896 114,680 0% 118,466 117,725 Gas (Mmscfd) 131 105 25% 140 130 Gross DA 1 120,459 119,863 0% 125,274 122,858 Gross DA 2 16,163 12,119 33% 16,312 16,416 Gross DA 3 173 192 (10)% 180 178 Working Interest 95,756 92,522 3% 99,236 97,616 Ravva (Block PKGM-1) Gross operated 14,457 16,770 (14)% 14,282 14,466 Oil 12,594 12,910 (2)% 12,215 12,193 Gas (Mmscfd) 11 23 (52)% 12 14 Working Interest 3,253 3,773 (14)% 3,213 3,255 Cambay (Block CB/OS-2) Gross operated 7,906 10,677 (26)% 9,279 9,204 Oil 6,168 9,097 (32)% 7,440 7,324 Gas (Mmscfd) 10 9 10% 11 11 Working Interest 3,162 4,271 (26)% 3,712 3,681 Average Price Realization Cairn Total (US$/boe) 74.4 42.3 76% 69.7 69.3 Oil (US$/bbl) 75.7 43.9 72% 71.3 71.3 Gas (US$/mscf) 11.2 5.3 111% 10.2 9.8
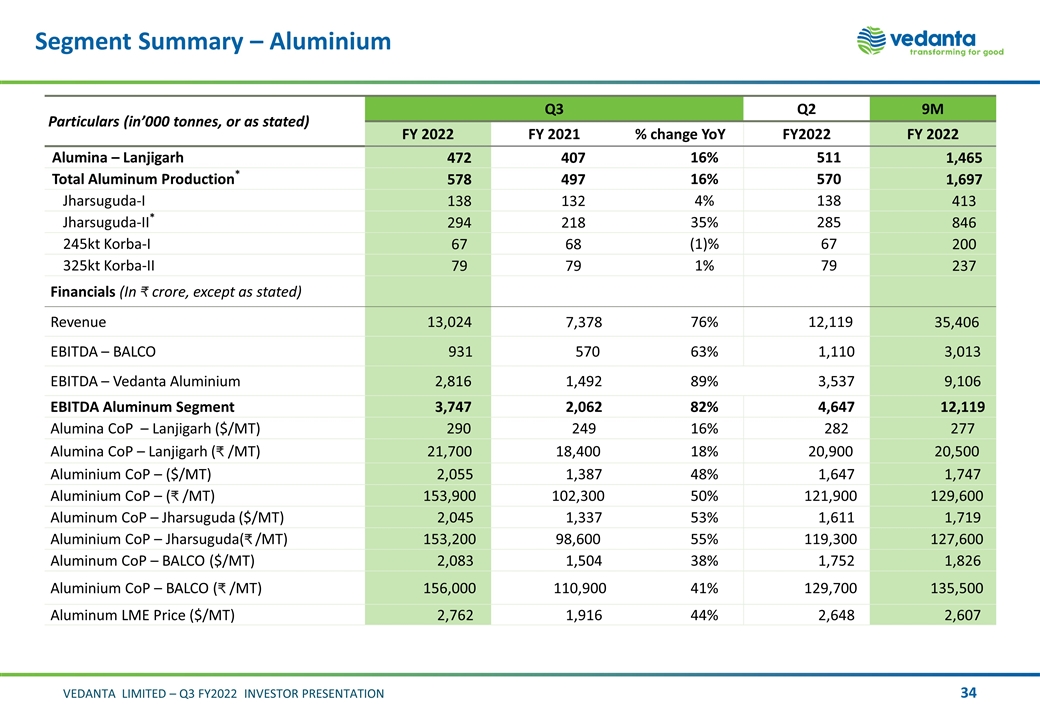
Segment Summary – Aluminium Particulars (in’000 tonnes, or as stated) Q3 Q2 9M FY 2022 FY 2021 % change YoY FY2022 FY 2022 Alumina – Lanjigarh 472 407 16% 511 1,465 Total Aluminum Production* 578 497 16% 570 1,697 Jharsuguda-I 138 132 4% 138 413 Jharsuguda-II* 294 218 35% 285 846 245kt Korba-I 67 68 (1)% 67 200 325kt Korba-II 79 79 1% 79 237 Financials (In crore, except as stated) Revenue 13,024 7,378 76% 12,119 35,406 EBITDA – BALCO 931 570 63% 1,110 3,013 EBITDA – Vedanta Aluminium 2,816 1,492 89% 3,537 9,106 EBITDA Aluminum Segment 3,747 2,062 82% 4,647 12,119 Alumina CoP – Lanjigarh ($/MT) 290 249 16% 282 277 Alumina CoP – Lanjigarh ( /MT) 21,700 18,400 18% 20,900 20,500 Aluminium CoP – ($/MT) 2,055 1,387 48% 1,647 1,747 Aluminium CoP – ( /MT) 153,900 102,300 50% 121,900 129,600 Aluminum CoP – Jharsuguda ($/MT) 2,045 1,337 53% 1,611 1,719 Aluminium CoP – Jharsuguda( /MT) 153,200 98,600 55% 119,300 127,600 Aluminum CoP – BALCO ($/MT) 2,083 1,504 38% 1,752 1,826 Aluminium CoP – BALCO ( /MT) 156,000 110,900 41% 129,700 135,500 Aluminum LME Price ($/MT) 2,762 1,916 44% 2,648 2,607
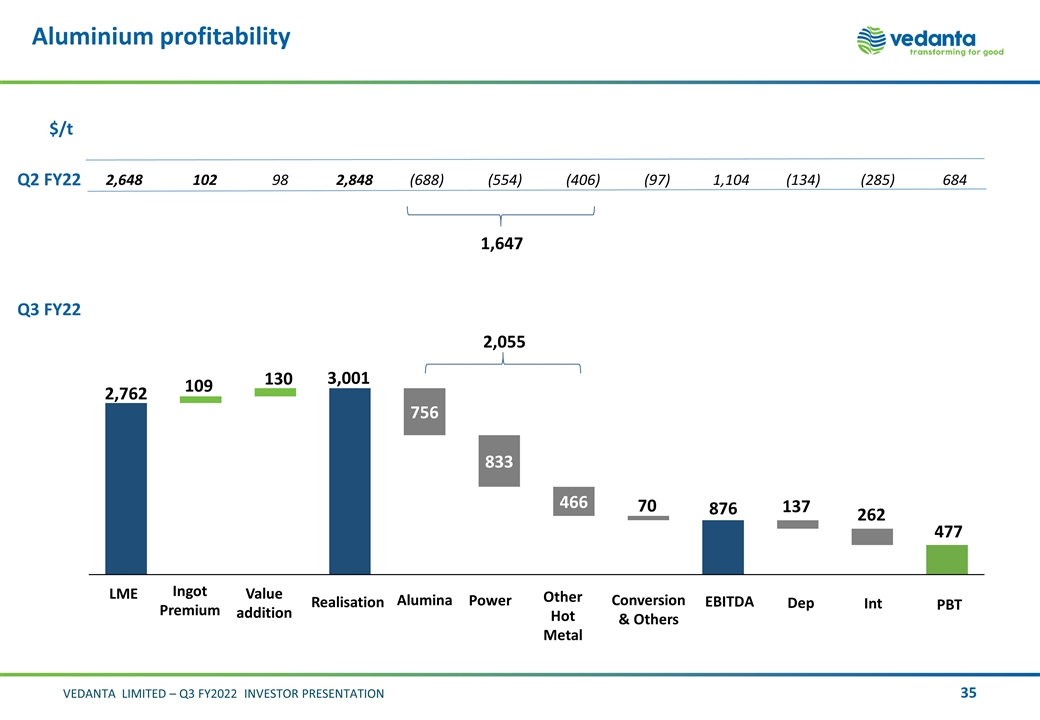
Aluminium profitability Q2 FY22 $/t Q3 FY22 130 109 262 876 477 2,648 102 98 2,848 (688) (554) (406) (97) 1,104 (134) (285) 684 1,647 2,055
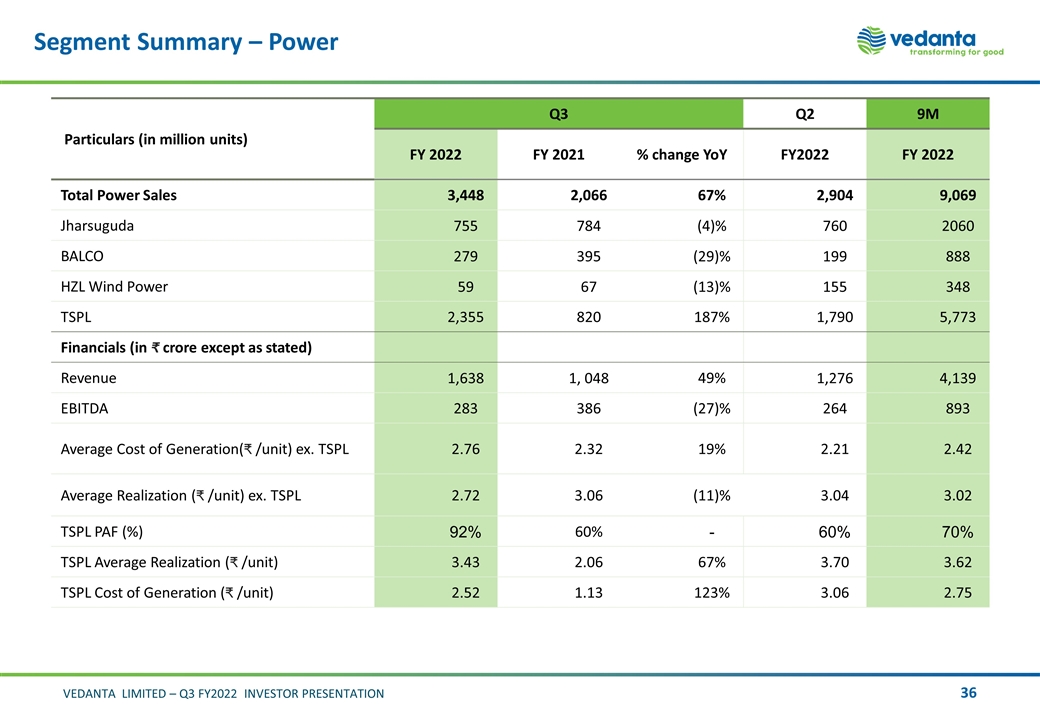
Segment Summary – Power Particulars (in million units) Q3 Q2 9M FY 2022 FY 2021 % change YoY FY2022 FY 2022 Total Power Sales 3,448 2,066 67% 2,904 9,069 Jharsuguda 755 784 (4)% 760 2060 BALCO 279 395 (29)% 199 888 HZL Wind Power 59 67 (13)% 155 348 TSPL 2,355 820 187% 1,790 5,773 Financials (in crore except as stated) Revenue 1,638 1, 048 49% 1,276 4,139 EBITDA 283 386 (27)% 264 893 Average Cost of Generation( /unit) ex. TSPL 2.76 2.32 19% 2.21 2.42 Average Realization ( /unit) ex. TSPL 2.72 3.06 (11)% 3.04 3.02 TSPL PAF (%) 92% 60% - 60% 70% TSPL Average Realization ( /unit) 3.43 2.06 67% 3.70 3.62 TSPL Cost of Generation ( /unit) 2.52 1.13 123% 3.06 2.75
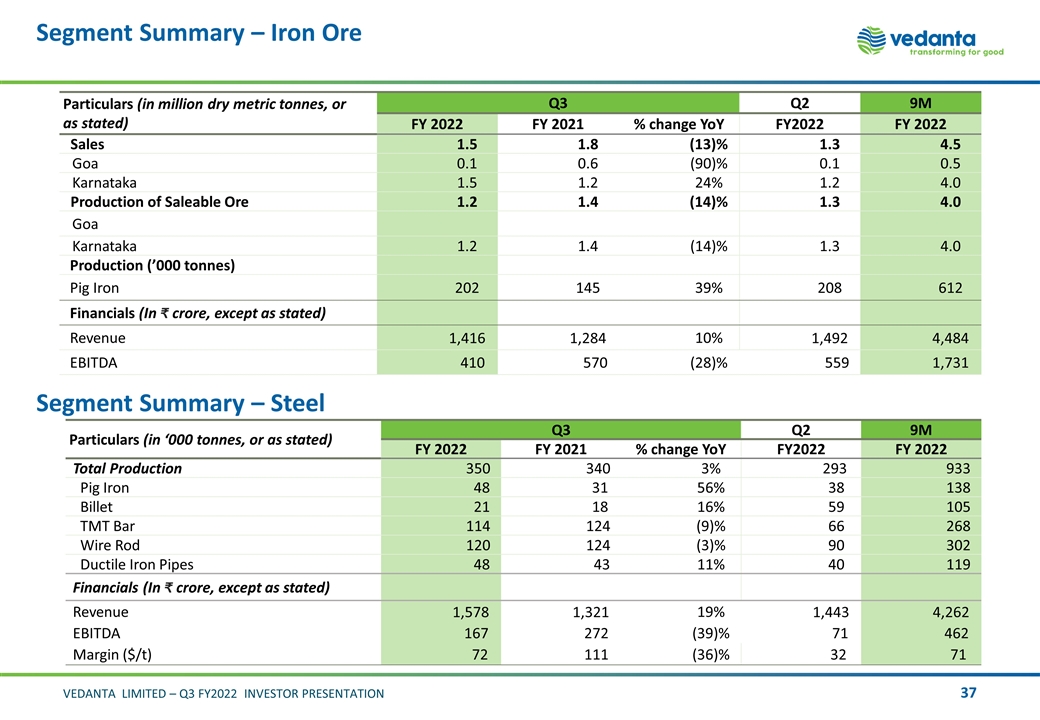
Segment Summary – Iron Ore Particulars (in million dry metric tonnes, or as stated) Q3 Q2 9M FY 2022 FY 2021 % change YoY FY2022 FY 2022 Sales 1.5 1.8 (13)% 1.3 4.5 Goa 0.1 0.6 (90)% 0.1 0.5 Karnataka 1.5 1.2 24% 1.2 4.0 Production of Saleable Ore 1.2 1.4 (14)% 1.3 4.0 Goa Karnataka 1.2 1.4 (14)% 1.3 4.0 Production (’000 tonnes) Pig Iron 202 145 39% 208 612 Financials (In crore, except as stated) Revenue 1,416 1,284 10% 1,492 4,484 EBITDA 410 570 (28)% 559 1,731 Segment Summary – Steel Particulars (in ‘000 tonnes, or as stated) Q3 Q2 9M FY 2022 FY 2021 % change YoY FY2022 FY 2022 Total Production 350 340 3% 293 933 Pig Iron 48 31 56% 38 138 Billet 21 18 16% 59 105 TMT Bar 114 124 (9)% 66 268 Wire Rod 120 124 (3)% 90 302 Ductile Iron Pipes 48 43 11% 40 119 Financials (In crore, except as stated) Revenue 1,578 1,321 19% 1,443 4,262 EBITDA 167 272 (39)% 71 462 Margin ($/t) 72 111 (36)% 32 71

Segment Summary – FACOR* Segment Summary – Copper Business Particulars (in ‘000 tonnes, or as stated) Q3 Q2 9M FY 2022 FY 2021 % change YoY FY2022 FY 2022 Total Production Ore Production 59 43 37% 24 206 Ferrochrome Production 20 18 13% 19 58 Financials (In crore, except as stated) Revenue 229 123 86% 210 609 EBITDA 88 15 - 93 243 Margin ($/t) 590 112 - 655 555 Production (in ’000 tonnes, or as stated) Q3 Q2 9M FY 2022 FY 2021 % change YoY FY 2022 FY 2022 Copper - Cathodes 33 25 32% 30 91 Financials (In crore, except as stated) Revenue 3,741 2,664 40% 3,560 10,800 EBITDA 14 (31) (145)% (38) (131) Copper LME Price ($/MT) 9,699 7,166 35% 9,372 9,587 *Vedanta acquired Ferro Alloys Corporation Limited (“FACOR”) in Sep 21,2020
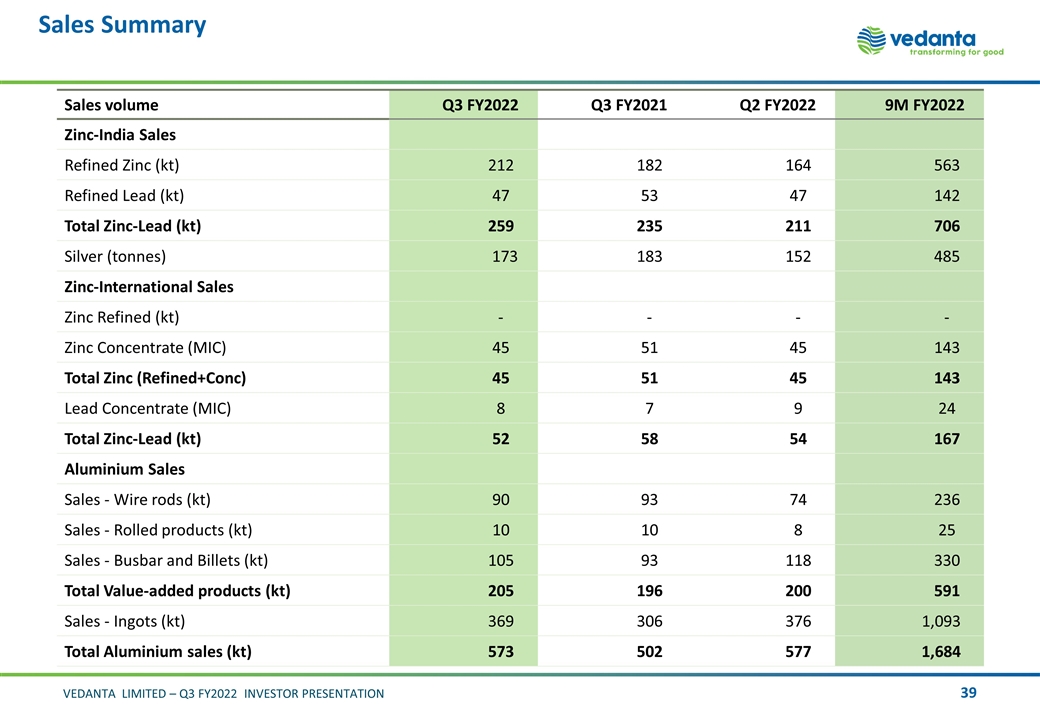
Sales Summary Sales volume Q3 FY2022 Q3 FY2021 Q2 FY2022 9M FY2022 Zinc-India Sales Refined Zinc (kt) 212 182 164 563 Refined Lead (kt) 47 53 47 142 Total Zinc-Lead (kt) 259 235 211 706 Silver (tonnes) 173 183 152 485 Zinc-International Sales Zinc Refined (kt) - - - - Zinc Concentrate (MIC) 45 51 45 143 Total Zinc (Refined+Conc) 45 51 45 143 Lead Concentrate (MIC) 8 7 9 24 Total Zinc-Lead (kt) 52 58 54 167 Aluminium Sales Sales - Wire rods (kt) 90 93 74 236 Sales - Rolled products (kt) 10 10 8 25 Sales - Busbar and Billets (kt) 105 93 118 330 Total Value-added products (kt) 205 196 200 591 Sales - Ingots (kt) 369 306 376 1,093 Total Aluminium sales (kt) 573 502 577 1,684
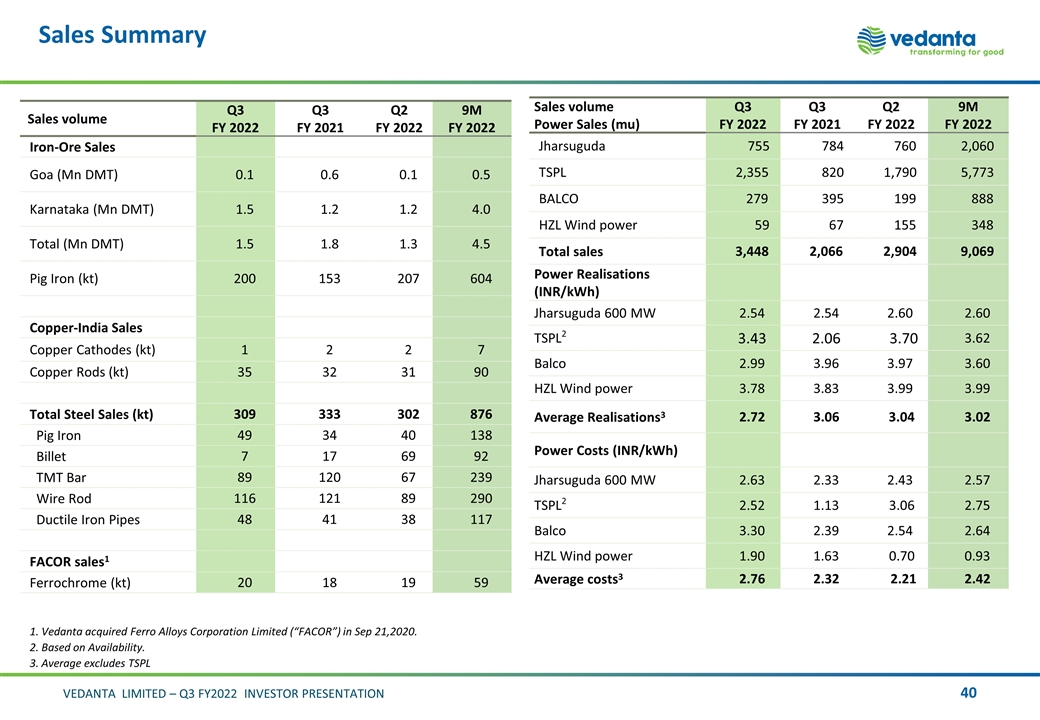
Sales Summary Sales volume Q3 FY 2022 Q3 FY 2021 Q2 FY 2022 9M FY 2022 Iron-Ore Sales Goa (Mn DMT) 0.1 0.6 0.1 0.5 Karnataka (Mn DMT) 1.5 1.2 1.2 4.0 Total (Mn DMT) 1.5 1.8 1.3 4.5 Pig Iron (kt) 200 153 207 604 Copper-India Sales Copper Cathodes (kt) 1 2 2 7 Copper Rods (kt) 35 32 31 90 Total Steel Sales (kt) 309 333 302 876 Pig Iron 49 34 40 138 Billet 7 17 69 92 TMT Bar 89 120 67 239 Wire Rod 116 121 89 290 Ductile Iron Pipes 48 41 38 117 FACOR sales1 Ferrochrome (kt) 20 18 19 59 Sales volume Power Sales (mu) Q3 FY 2022 Q3 FY 2021 Q2 FY 2022 9M FY 2022 Jharsuguda 755 784 760 2,060 TSPL 2,355 820 1,790 5,773 BALCO 279 395 199 888 HZL Wind power 59 67 155 348 Total sales 3,448 2,066 2,904 9,069 Power Realisations (INR/kWh) Jharsuguda 600 MW 2.54 2.54 2.60 2.60 TSPL2 3.43 2.06 3.70 3.62 Balco 2.99 3.96 3.97 3.60 HZL Wind power 3.78 3.83 3.99 3.99 Average Realisations3 2.72 3.06 3.04 3.02 Power Costs (INR/kWh) Jharsuguda 600 MW 2.63 2.33 2.43 2.57 TSPL2 2.52 1.13 3.06 2.75 Balco 3.30 2.39 2.54 2.64 HZL Wind power 1.90 1.63 0.70 0.93 Average costs3 2.76 2.32 2.21 2.42 1. Vedanta acquired Ferro Alloys Corporation Limited (“FACOR”) in Sep 21,2020. 2. Based on Availability. 3. Average excludes TSPL
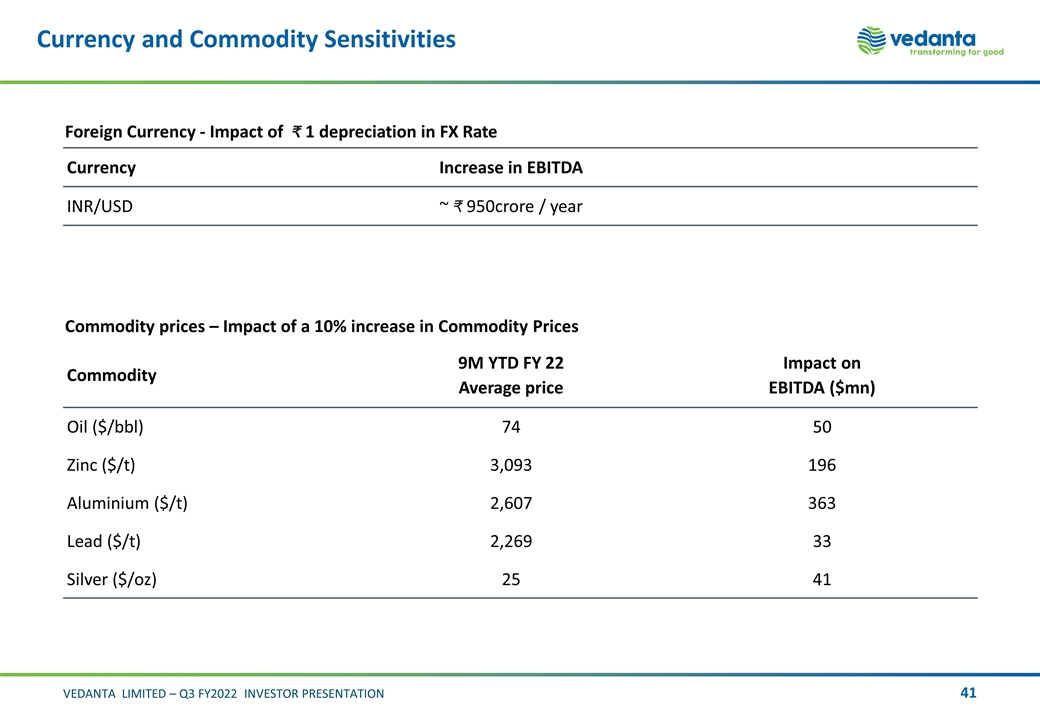
Currency and Commodity Sensitivities Commodity prices – Impact of a 10% increase in Commodity Prices Commodity 9M YTD FY 22 Average price Impact on EBITDA ($mn) Oil ($/bbl) 74 50 Zinc ($/t) 3,093 196 Aluminium ($/t) 2,607 363 Lead ($/t) 2,269 33 Silver ($/oz) 25 41 Foreign Currency - Impact of ₹ 1 depreciation in FX Rate Currency Increase in EBITDA INR/USD ~ 950crore / year
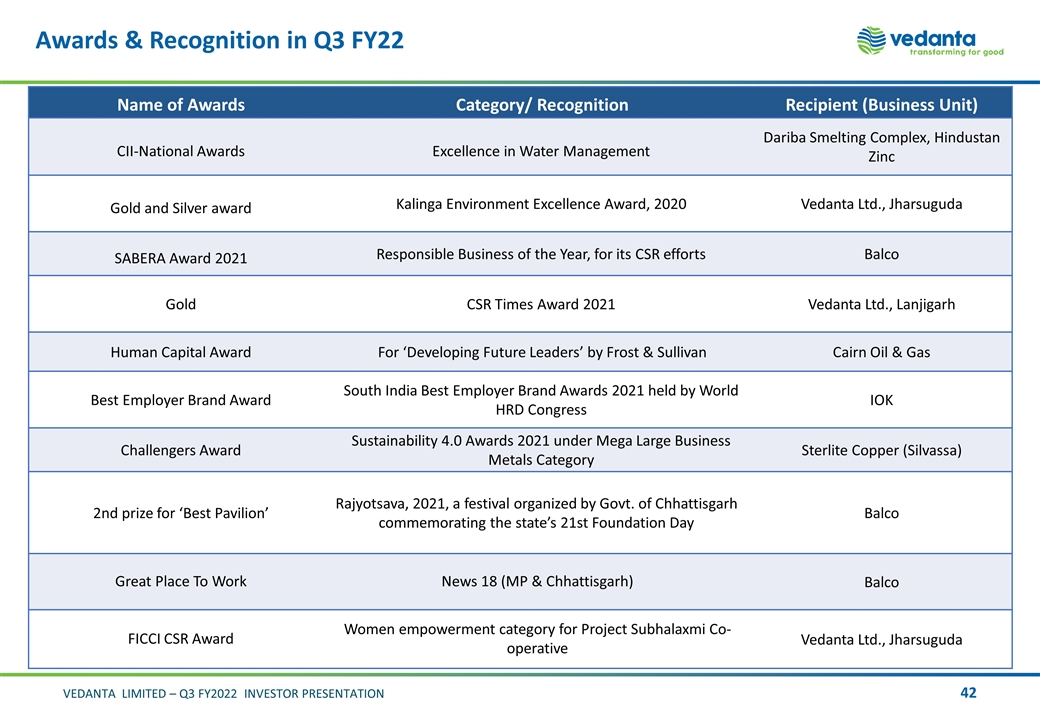
Awards & Recognition in Q3 FY22 Name of Awards Category/ Recognition Recipient (Business Unit) CII-National Awards Excellence in Water Management Dariba Smelting Complex, Hindustan Zinc Gold and Silver award Kalinga Environment Excellence Award, 2020 Vedanta Ltd., Jharsuguda SABERA Award 2021 Responsible Business of the Year, for its CSR efforts Balco Gold CSR Times Award 2021 Vedanta Ltd., Lanjigarh Human Capital Award For ‘Developing Future Leaders’ by Frost & Sullivan Cairn Oil & Gas Best Employer Brand Award South India Best Employer Brand Awards 2021 held by World HRD Congress IOK Challengers Award Sustainability 4.0 Awards 2021 under Mega Large Business Metals Category Sterlite Copper (Silvassa) 2nd prize for ‘Best Pavilion’ Rajyotsava, 2021, a festival organized by Govt. of Chhattisgarh commemorating the state’s 21st Foundation Day Balco Great Place To Work News 18 (MP & Chhattisgarh) Balco FICCI CSR Award Women empowerment category for Project Subhalaxmi Co-operative Vedanta Ltd., Jharsuguda
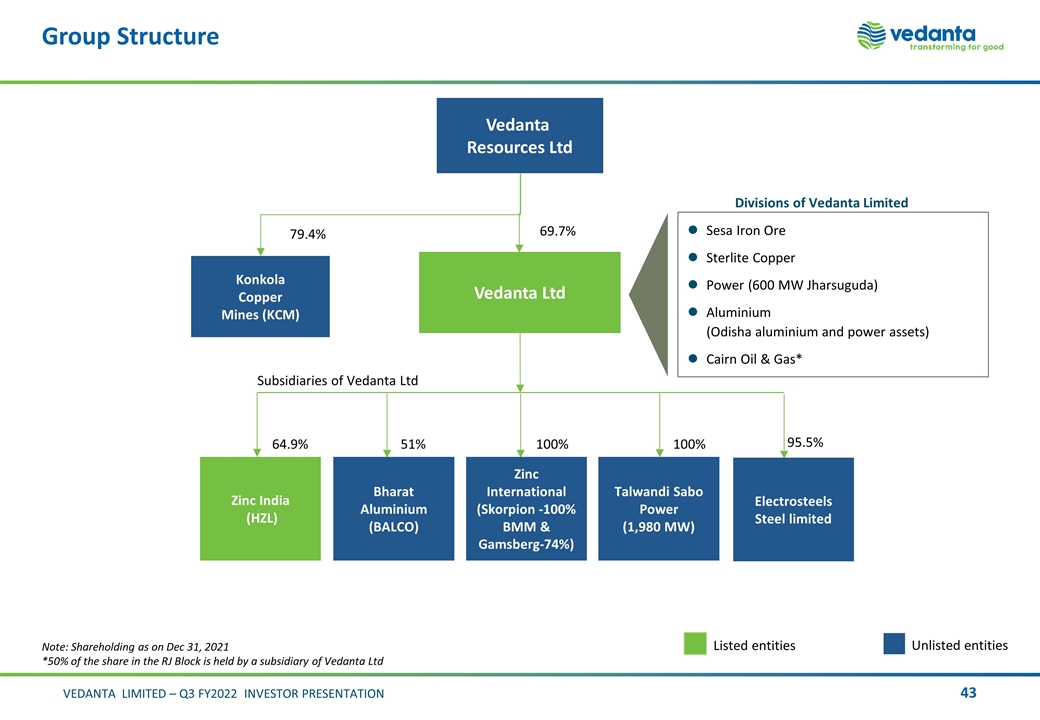
Group Structure Konkola Copper Mines (KCM) 69.7% Vedanta Resources Ltd 64.9% Zinc India (HZL) Vedanta Ltd 79.4% Subsidiaries of Vedanta Ltd Sesa Iron Ore Sterlite Copper Power (600 MW Jharsuguda) Aluminium (Odisha aluminium and power assets) Cairn Oil & Gas* Divisions of Vedanta Limited Unlisted entities Listed entities Talwandi Sabo Power (1,980 MW) 100% Zinc International (Skorpion -100% BMM & Gamsberg-74%) 100% 51% Bharat Aluminium (BALCO) Note: Shareholding as on Dec 31, 2021 *50% of the share in the RJ Block is held by a subsidiary of Vedanta Ltd 95.5% Electrosteels Steel limited
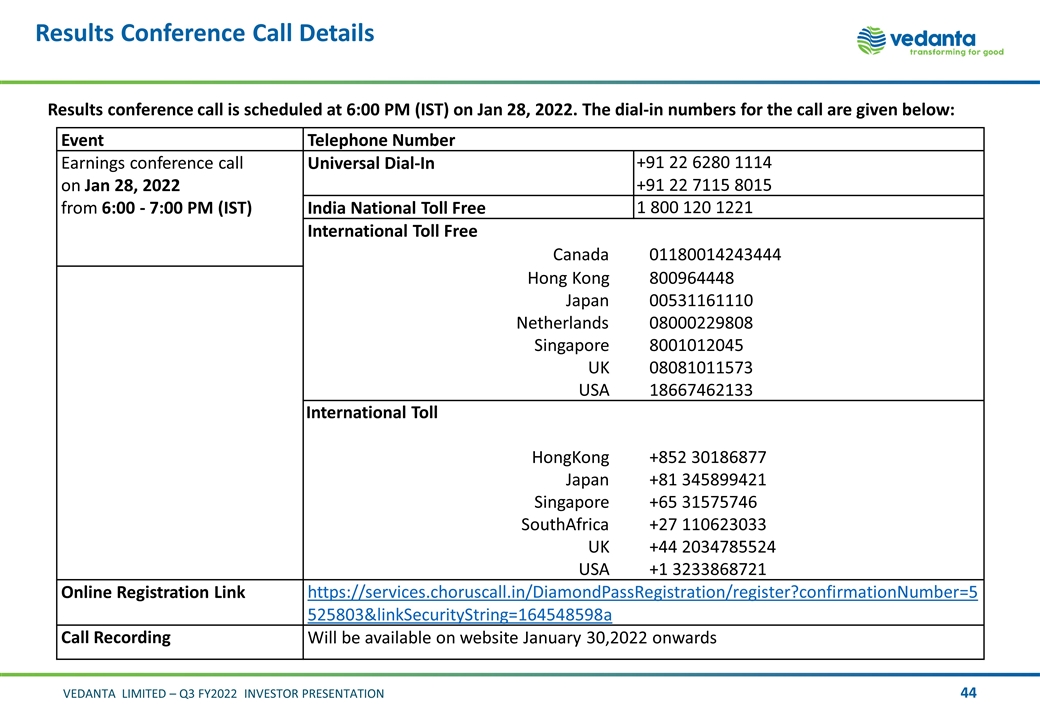
Results Conference Call Details Results conference call is scheduled at 6:00 PM (IST) on Jan 28, 2022. The dial-in numbers for the call are given below: Event Telephone Number Earnings conference call on Jan 28, 2022 from 6:00 - 7:00 PM (IST) Universal Dial-In +91 22 6280 1114 +91 22 7115 8015 India National Toll Free 1 800 120 1221 International Toll Free Canada 01180014243444 Hong Kong 800964448 Japan 00531161110 Netherlands 08000229808 Singapore 8001012045 UK 08081011573 USA 18667462133 International Toll HongKong +852 30186877 Japan +81 345899421 Singapore +65 31575746 SouthAfrica +27 110623033 UK +44 2034785524 USA +1 3233868721 Online Registration Link https://services.choruscall.in/DiamondPassRegistration/register?confirmationNumber=5525803&linkSecurityString=164548598a Call Recording Will be available on website January 30,2022 onwards