4QFY22 Earnings Presentation VEDANTA LIMITED INVESTOR PRESENTATION 28th April 2022 Exhibit 99.4
Cautionary statement and disclaimer The views expressed here may contain information derived from publicly available sources that have not been independently verified. No representation or warranty is made as to the accuracy, completeness, reasonableness or reliability of this information. Any forward-looking information in this presentation including, without limitation, any tables, charts and/or graphs, has been prepared on the basis of a number of assumptions which may prove to be incorrect. This presentation should not be relied upon as a recommendation or forecast by Vedanta Resources Limited and Vedanta Limited and any of their subsidiaries. Past performance of Vedanta Resources Limited and Vedanta Limited and any of their subsidiaries cannot be relied upon as a guide to future performance. This presentation contains 'forward-looking statements' – that is, statements related to future, not past, events. In this context, forward-looking statements often address our expected future business and financial performance, and often contain words such as 'expects,' 'anticipates,' 'intends,' 'plans,' 'believes,' 'seeks,' or 'will.' Forward–looking statements by their nature address matters that are, to different degrees, uncertain. For us, uncertainties arise from the behaviour of financial and metals markets including the London Metal Exchange, fluctuations in interest and or exchange rates and metal prices; from future integration of acquired businesses; and from numerous other matters of national, regional and global scale, including those of a environmental, climatic, natural, political, economic, business, competitive or regulatory nature. These uncertainties may cause our actual future results to be materially different that those expressed in our forward-looking statements. We do not undertake to update our forward-looking statements. We caution you that reliance on any forward-looking statement involves risk and uncertainties, and that, although we believe that the assumption on which our forward-looking statements are based are reasonable, any of those assumptions could prove to be inaccurate and, as a result, the forward-looking statement based on those assumptions could be materially incorrect. This presentation is not intended, and does not, constitute or form part of any offer, invitation or the solicitation of an offer to purchase, otherwise acquire, subscribe for, sell or otherwise dispose of, any securities in Vedanta Resources Limited and Vedanta Limited and any of their subsidiaries or undertakings or any other invitation or inducement to engage in investment activities, nor shall this presentation (or any part of it) nor the fact of its distribution form the basis of, or be relied on in connection with, any contract or investment decision.
4QFY22 Review and Business Update Sunil Duggal Group CEO & Chief Safety Officer VEDANTA LIMITED INVESTOR PRESENTATION 4QFY22
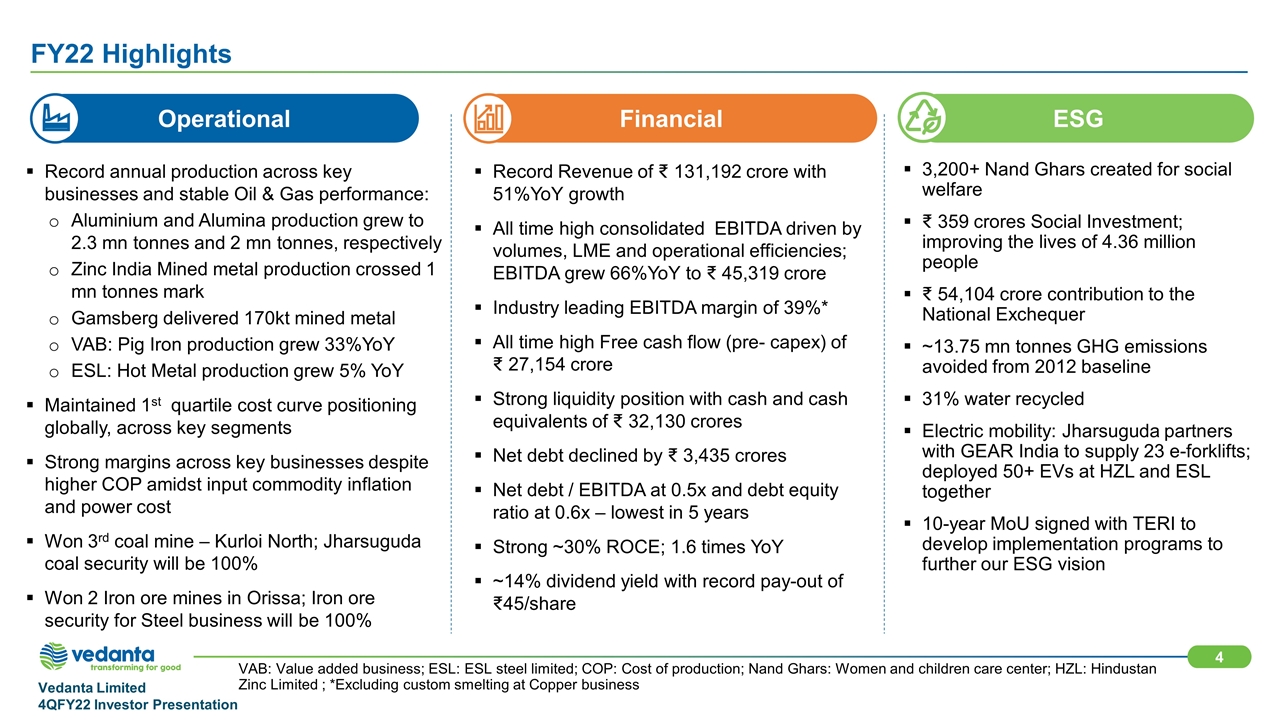
Record annual production across key businesses and stable Oil & Gas performance: Aluminium and Alumina production grew to 2.3 mn tonnes and 2 mn tonnes, respectively Zinc India Mined metal production crossed 1 mn tonnes mark Gamsberg delivered 170kt mined metal VAB: Pig Iron production grew 33%YoY ESL: Hot Metal production grew 5% YoY Maintained 1st quartile cost curve positioning globally, across key segments Strong margins across key businesses despite higher COP amidst input commodity inflation and power cost Won 3rd coal mine – Kurloi North; Jharsuguda coal security will be 100% Won 2 Iron ore mines in Orissa; Iron ore security for Steel business will be 100% Record Revenue of ₹ 131,192 crore with 51%YoY growth All time high consolidated EBITDA driven by volumes, LME and operational efficiencies; EBITDA grew 66%YoY to 45,319 crore Industry leading EBITDA margin of 39%* All time high Free cash flow (pre- capex) of ₹ 27,154 crore Strong liquidity position with cash and cash equivalents of 32,130 crores Net debt declined by ₹ 3,435 crores Net debt / EBITDA at 0.5x and debt equity ratio at 0.6x – lowest in 5 years Strong ~30% ROCE; 1.6 times YoY ~14% dividend yield with record pay-out of ₹45/share 3,200+ Nand Ghars created for social welfare ₹ 359 crores Social Investment; improving the lives of 4.36 million people ₹ 54,104 crore contribution to the National Exchequer ~13.75 mn tonnes GHG emissions avoided from 2012 baseline 31% water recycled Electric mobility: Jharsuguda partners with GEAR India to supply 23 e-forklifts; deployed 50+ EVs at HZL and ESL together 10-year MoU signed with TERI to develop implementation programs to further our ESG vision Operational VAB: Value added business; ESL: ESL steel limited; COP: Cost of production; Nand Ghars: Women and children care center; HZL: Hindustan Zinc Limited ; *Excluding custom smelting at Copper business FY22 Highlights Financial ESG
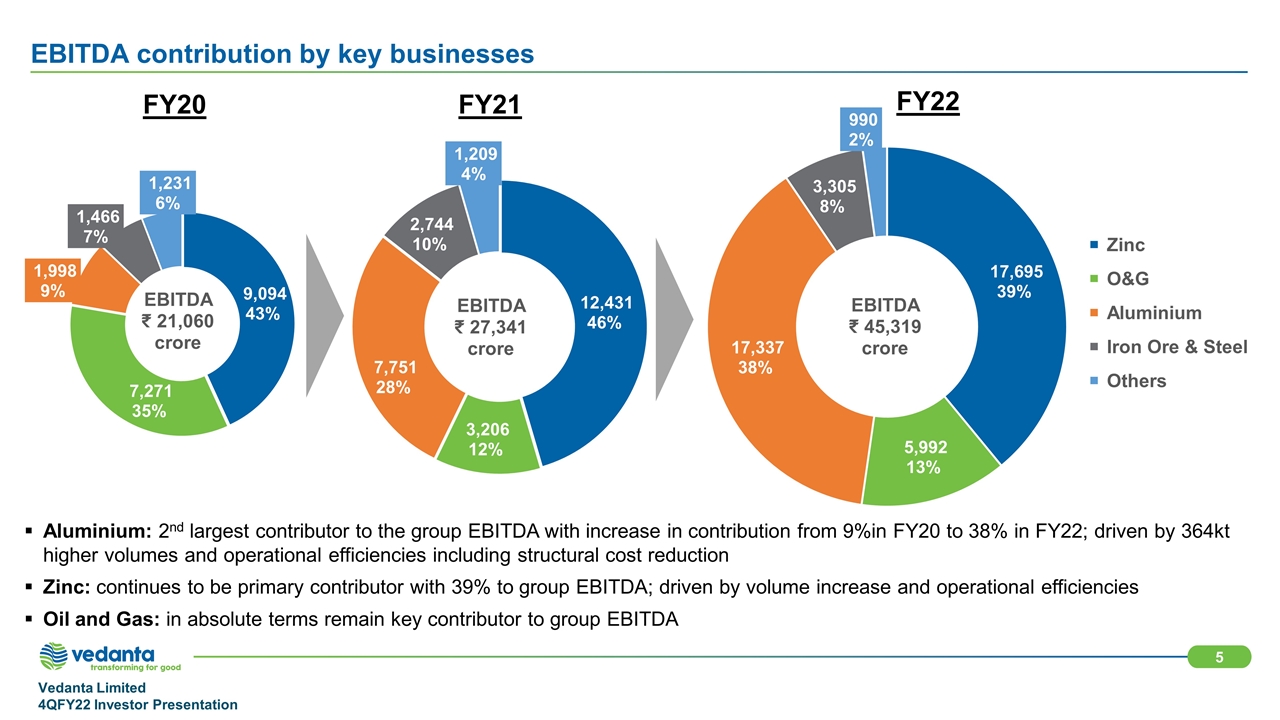
FY20 FY21 FY22 EBITDA contribution by key businesses Aluminium: 2nd largest contributor to the group EBITDA with increase in contribution from 9%in FY20 to 38% in FY22; driven by 364kt higher volumes and operational efficiencies including structural cost reduction Zinc: continues to be primary contributor with 39% to group EBITDA; driven by volume increase and operational efficiencies Oil and Gas: in absolute terms remain key contributor to group EBITDA
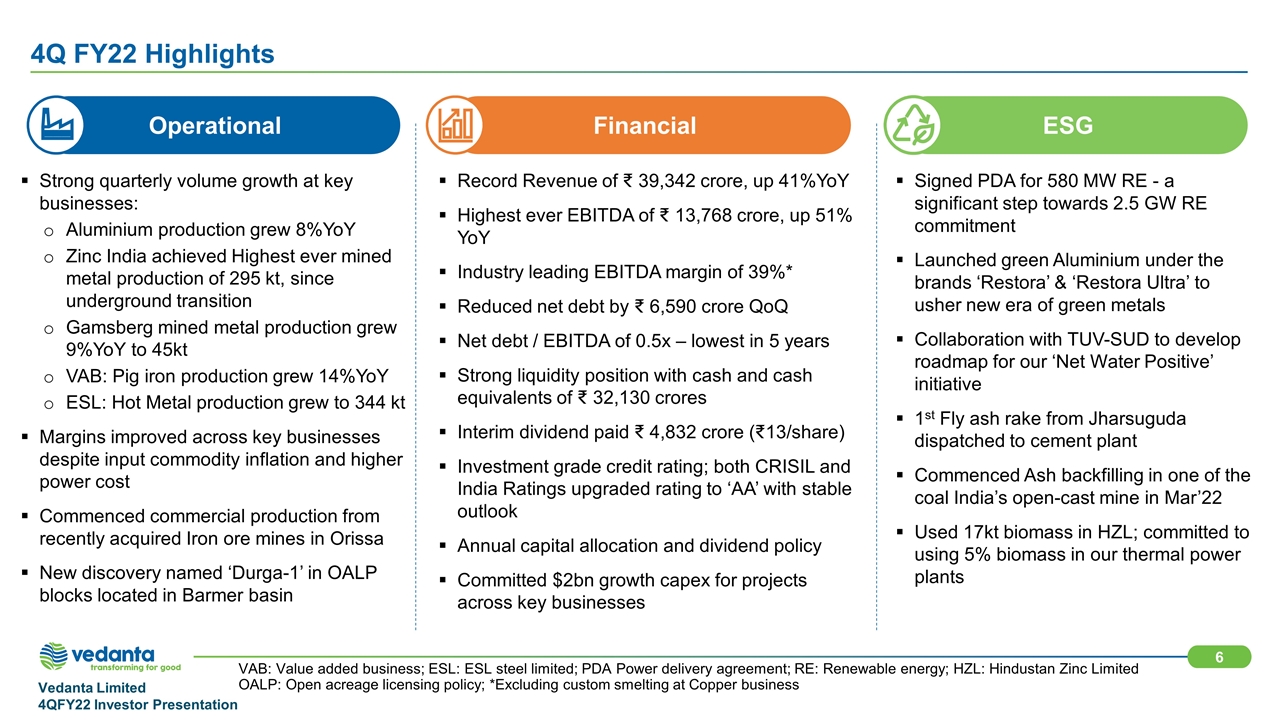
Strong quarterly volume growth at key businesses: Aluminium production grew 8%YoY Zinc India achieved Highest ever mined metal production of 295 kt, since underground transition Gamsberg mined metal production grew 9%YoY to 45kt VAB: Pig iron production grew 14%YoY ESL: Hot Metal production grew to 344 kt Margins improved across key businesses despite input commodity inflation and higher power cost Commenced commercial production from recently acquired Iron ore mines in Orissa New discovery named ‘Durga-1’ in OALP blocks located in Barmer basin Record Revenue of ₹ 39,342 crore, up 41%YoY Highest ever EBITDA of 13,768 crore, up 51% YoY Industry leading EBITDA margin of 39%* Reduced net debt by ₹ 6,590 crore QoQ Net debt / EBITDA of 0.5x – lowest in 5 years Strong liquidity position with cash and cash equivalents of 32,130 crores Interim dividend paid ₹ 4,832 crore (₹13/share) Investment grade credit rating; both CRISIL and India Ratings upgraded rating to ‘AA’ with stable outlook Annual capital allocation and dividend policy Committed $2bn growth capex for projects across key businesses Signed PDA for 580 MW RE - a significant step towards 2.5 GW RE commitment Launched green Aluminium under the brands ‘Restora’ & ‘Restora Ultra’ to usher new era of green metals Collaboration with TUV-SUD to develop roadmap for our ‘Net Water Positive’ initiative 1st Fly ash rake from Jharsuguda dispatched to cement plant Commenced Ash backfilling in one of the coal India’s open-cast mine in Mar’22 Used 17kt biomass in HZL; committed to using 5% biomass in our thermal power plants Operational VAB: Value added business; ESL: ESL steel limited; PDA Power delivery agreement; RE: Renewable energy; HZL: Hindustan Zinc Limited OALP: Open acreage licensing policy; *Excluding custom smelting at Copper business 4Q FY22 Highlights Financial ESG
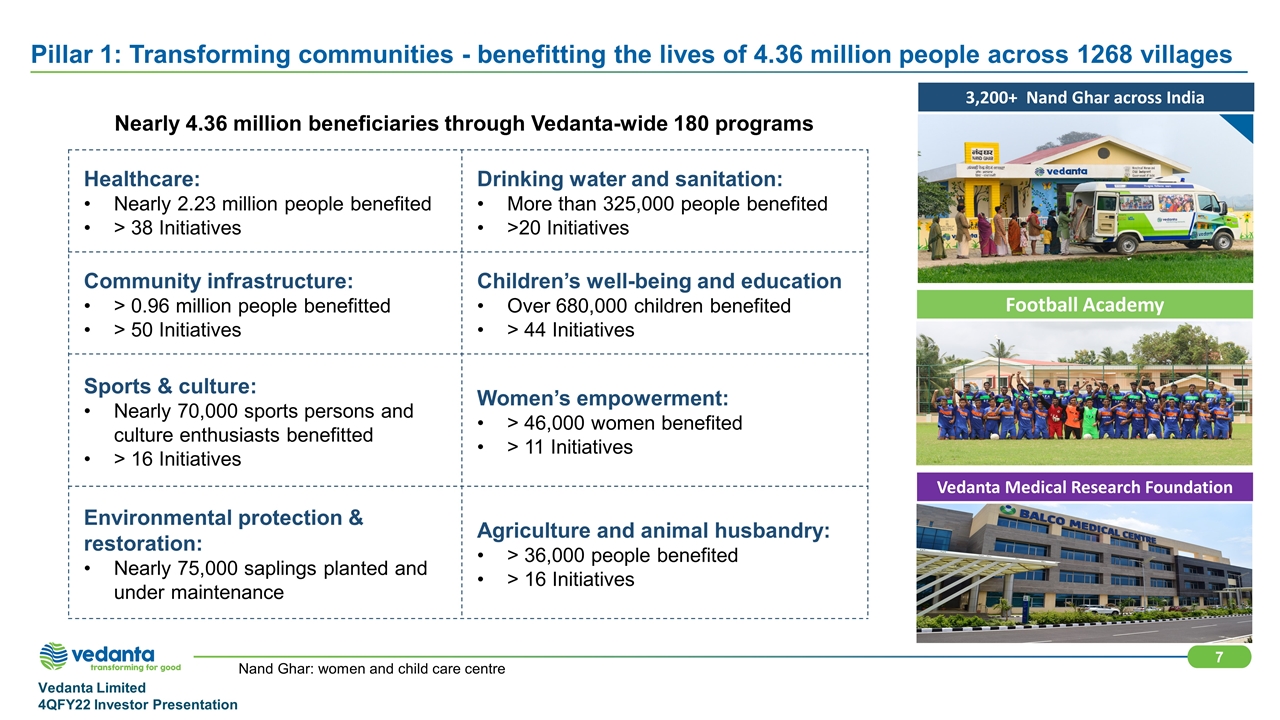
Healthcare: Nearly 2.23 million people benefited > 38 Initiatives Drinking water and sanitation: More than 325,000 people benefited >20 Initiatives Community infrastructure: > 0.96 million people benefitted > 50 Initiatives Children’s well-being and education Over 680,000 children benefited > 44 Initiatives Sports & culture: Nearly 70,000 sports persons and culture enthusiasts benefitted > 16 Initiatives Women’s empowerment: > 46,000 women benefited > 11 Initiatives Environmental protection & restoration: Nearly 75,000 saplings planted and under maintenance Agriculture and animal husbandry: > 36,000 people benefited > 16 Initiatives Nand Ghar: women and child care centre Pillar 1: Transforming communities - benefitting the lives of 4.36 million people across 1268 villages 3,200+ Nand Ghar across India Vedanta Medical Research Foundation Football Academy Nearly 4.36 million beneficiaries through Vedanta-wide 180 programs
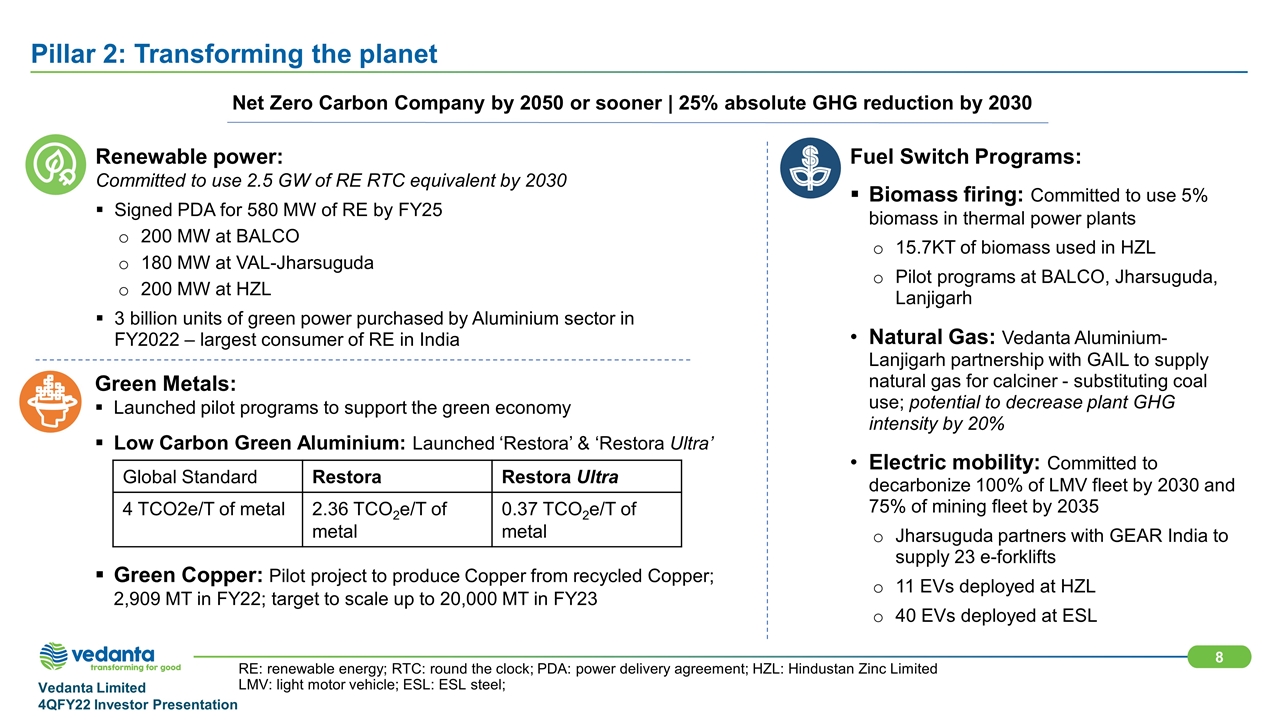
RE: renewable energy; RTC: round the clock; PDA: power delivery agreement; HZL: Hindustan Zinc Limited LMV: light motor vehicle; ESL: ESL steel; Pillar 2: Transforming the planet Net Zero Carbon Company by 2050 or sooner | 25% absolute GHG reduction by 2030 Renewable power: Committed to use 2.5 GW of RE RTC equivalent by 2030 Signed PDA for 580 MW of RE by FY25 200 MW at BALCO 180 MW at VAL-Jharsuguda 200 MW at HZL 3 billion units of green power purchased by Aluminium sector in FY2022 – largest consumer of RE in India Green Metals: Launched pilot programs to support the green economy Low Carbon Green Aluminium: Launched ‘Restora’ & ‘Restora Ultra’ Green Copper: Pilot project to produce Copper from recycled Copper; 2,909 MT in FY22; target to scale up to 20,000 MT in FY23 Global Standard Restora Restora Ultra 4 TCO2e/T of metal 2.36 TCO2e/T of metal 0.37 TCO2e/T of metal Fuel Switch Programs: Biomass firing: Committed to use 5% biomass in thermal power plants 15.7KT of biomass used in HZL Pilot programs at BALCO, Jharsuguda, Lanjigarh Natural Gas: Vedanta Aluminium-Lanjigarh partnership with GAIL to supply natural gas for calciner - substituting coal use; potential to decrease plant GHG intensity by 20% Electric mobility: Committed to decarbonize 100% of LMV fleet by 2030 and 75% of mining fleet by 2035 Jharsuguda partners with GEAR India to supply 23 e-forklifts 11 EVs deployed at HZL 40 EVs deployed at ESL
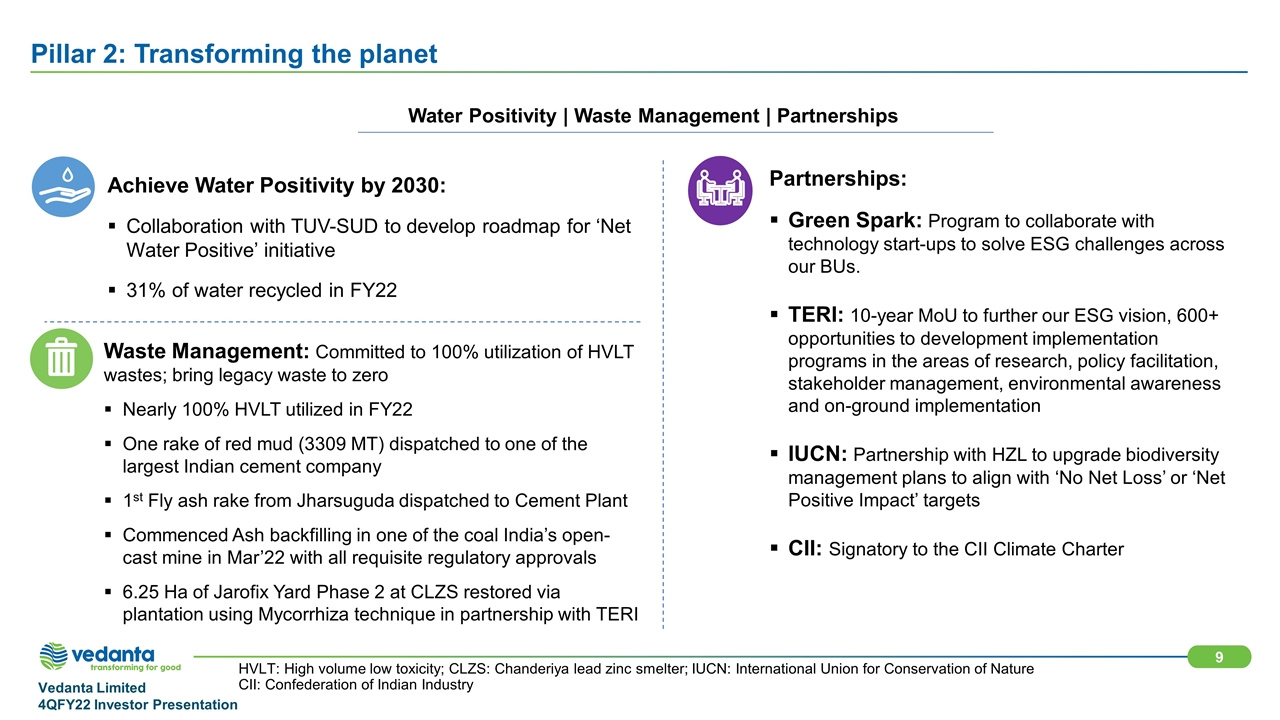
HVLT: High volume low toxicity; CLZS: Chanderiya lead zinc smelter; IUCN: International Union for Conservation of Nature CII: Confederation of Indian Industry Pillar 2: Transforming the planet Achieve Water Positivity by 2030: Collaboration with TUV-SUD to develop roadmap for ‘Net Water Positive’ initiative 31% of water recycled in FY22 Waste Management: Committed to 100% utilization of HVLT wastes; bring legacy waste to zero Nearly 100% HVLT utilized in FY22 One rake of red mud (3309 MT) dispatched to one of the largest Indian cement company 1st Fly ash rake from Jharsuguda dispatched to Cement Plant Commenced Ash backfilling in one of the coal India’s open-cast mine in Mar’22 with all requisite regulatory approvals 6.25 Ha of Jarofix Yard Phase 2 at CLZS restored via plantation using Mycorrhiza technique in partnership with TERI Water Positivity | Waste Management | Partnerships Partnerships: Green Spark: Program to collaborate with technology start-ups to solve ESG challenges across our BUs. TERI: 10-year MoU to further our ESG vision, 600+ opportunities to development implementation programs in the areas of research, policy facilitation, stakeholder management, environmental awareness and on-ground implementation IUCN: Partnership with HZL to upgrade biodiversity management plans to align with ‘No Net Loss’ or ‘Net Positive Impact’ targets CII: Signatory to the CII Climate Charter
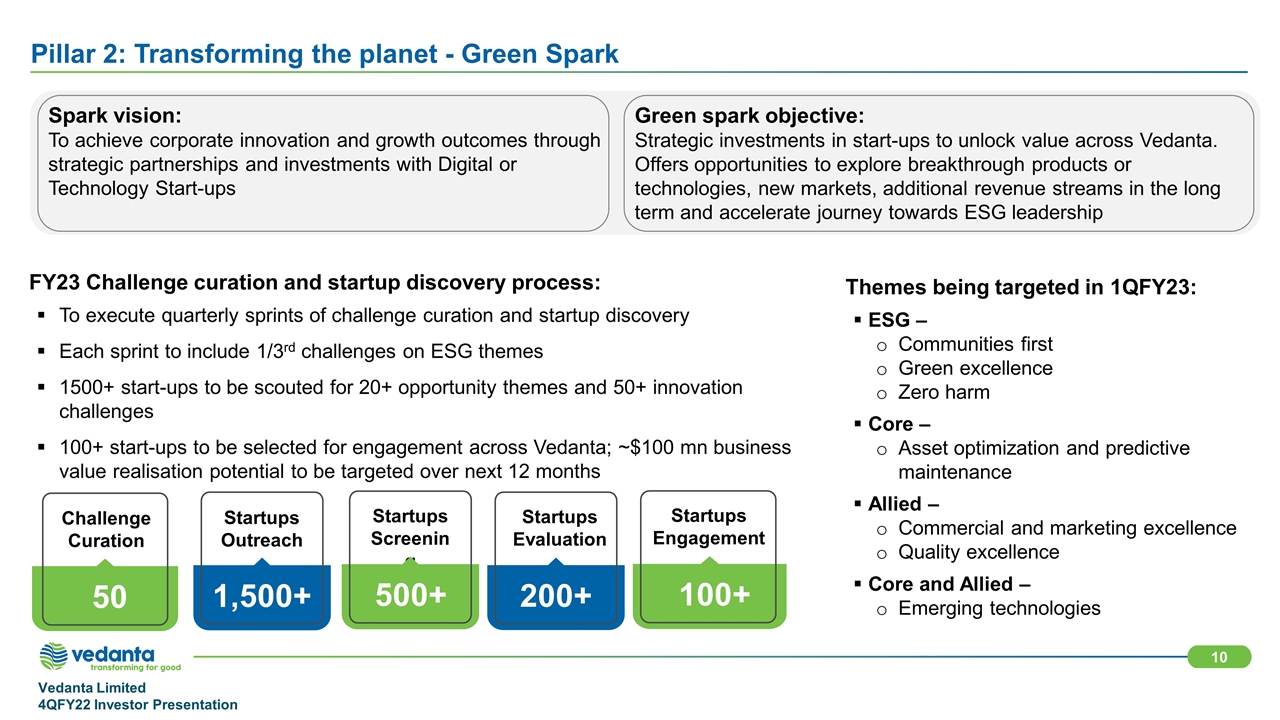
Pillar 2: Transforming the planet - Green Spark Spark vision: To achieve corporate innovation and growth outcomes through strategic partnerships and investments with Digital or Technology Start-ups Green spark objective: Strategic investments in start-ups to unlock value across Vedanta. Offers opportunities to explore breakthrough products or technologies, new markets, additional revenue streams in the long term and accelerate journey towards ESG leadership FY23 Challenge curation and startup discovery process: To execute quarterly sprints of challenge curation and startup discovery Each sprint to include 1/3rd challenges on ESG themes 1500+ start-ups to be scouted for 20+ opportunity themes and 50+ innovation challenges 100+ start-ups to be selected for engagement across Vedanta; ~$100 mn business value realisation potential to be targeted over next 12 months ChallengeCuration Startups Screening 50 500+ Startups Outreach 1,500+ Startups Engagement 100+ Startups Evaluation 200+ Themes being targeted in 1QFY23: ESG – Communities first Green excellence Zero harm Core – Asset optimization and predictive maintenance Allied – Commercial and marketing excellence Quality excellence Core and Allied – Emerging technologies
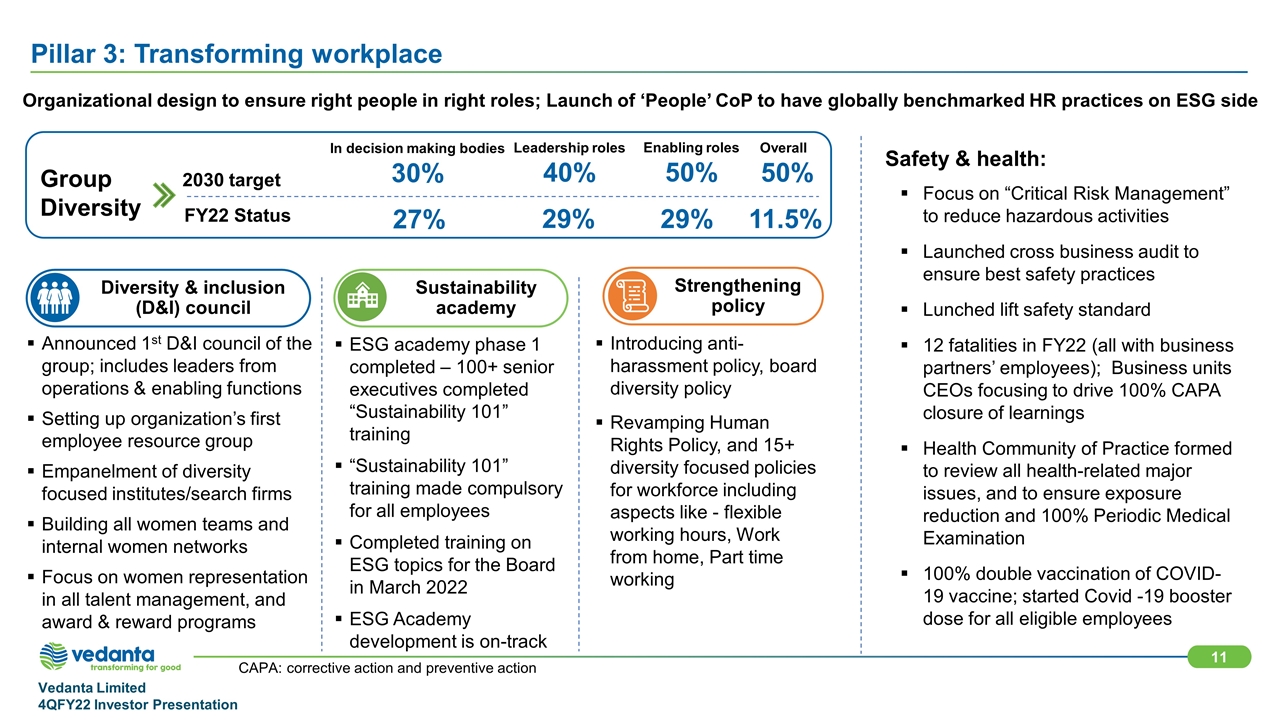
In decision making bodies 30% Diversity & inclusion (D&I) council CAPA: corrective action and preventive action Pillar 3: Transforming workplace Safety & health: Focus on “Critical Risk Management” to reduce hazardous activities Launched cross business audit to ensure best safety practices Lunched lift safety standard 12 fatalities in FY22 (all with business partners’ employees); Business units CEOs focusing to drive 100% CAPA closure of learnings Health Community of Practice formed to review all health-related major issues, and to ensure exposure reduction and 100% Periodic Medical Examination 100% double vaccination of COVID-19 vaccine; started Covid -19 booster dose for all eligible employees Sustainability academy Strengthening policy Announced 1st D&I council of the group; includes leaders from operations & enabling functions Setting up organization’s first employee resource group Empanelment of diversity focused institutes/search firms Building all women teams and internal women networks Focus on women representation in all talent management, and award & reward programs Introducing anti-harassment policy, board diversity policy Revamping Human Rights Policy, and 15+ diversity focused policies for workforce including aspects like - flexible working hours, Work from home, Part time working Organizational design to ensure right people in right roles; Launch of ‘People’ CoP to have globally benchmarked HR practices on ESG side 2030 target FY22 Status Overall 50% 27% 29% 11.5% Leadership roles 40% 29% Group Diversity Enabling roles 50% ESG academy phase 1 completed – 100+ senior executives completed “Sustainability 101” training “Sustainability 101” training made compulsory for all employees Completed training on ESG topics for the Board in March 2022 ESG Academy development is on-track
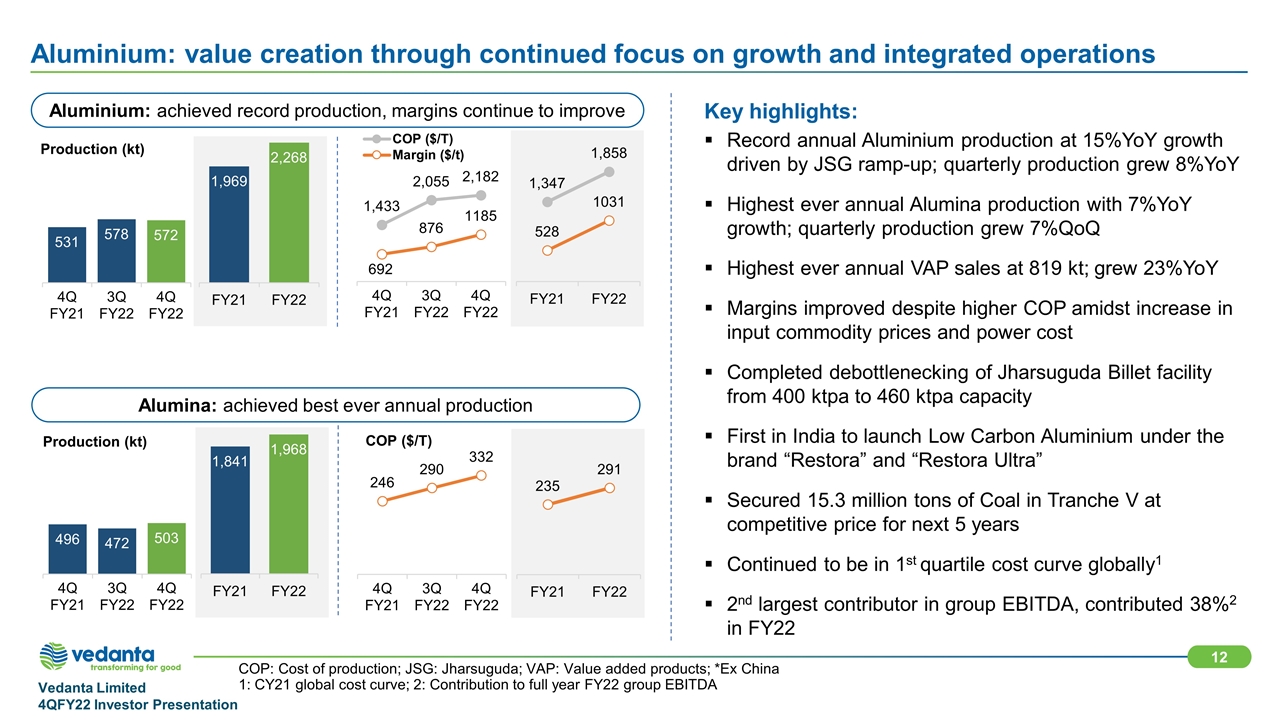
Alumina: achieved best ever annual production COP: Cost of production; JSG: Jharsuguda; VAP: Value added products; *Ex China 1: CY21 global cost curve; 2: Contribution to full year FY22 group EBITDA Aluminium: value creation through continued focus on growth and integrated operations Key highlights: Record annual Aluminium production at 15%YoY growth driven by JSG ramp-up; quarterly production grew 8%YoY Highest ever annual Alumina production with 7%YoY growth; quarterly production grew 7%QoQ Highest ever annual VAP sales at 819 kt; grew 23%YoY Margins improved despite higher COP amidst increase in input commodity prices and power cost Completed debottlenecking of Jharsuguda Billet facility from 400 ktpa to 460 ktpa capacity First in India to launch Low Carbon Aluminium under the brand “Restora” and “Restora Ultra” Secured 15.3 million tons of Coal in Tranche V at competitive price for next 5 years Continued to be in 1st quartile cost curve globally1 2nd largest contributor in group EBITDA, contributed 38%2 in FY22 Aluminium: achieved record production, margins continue to improve
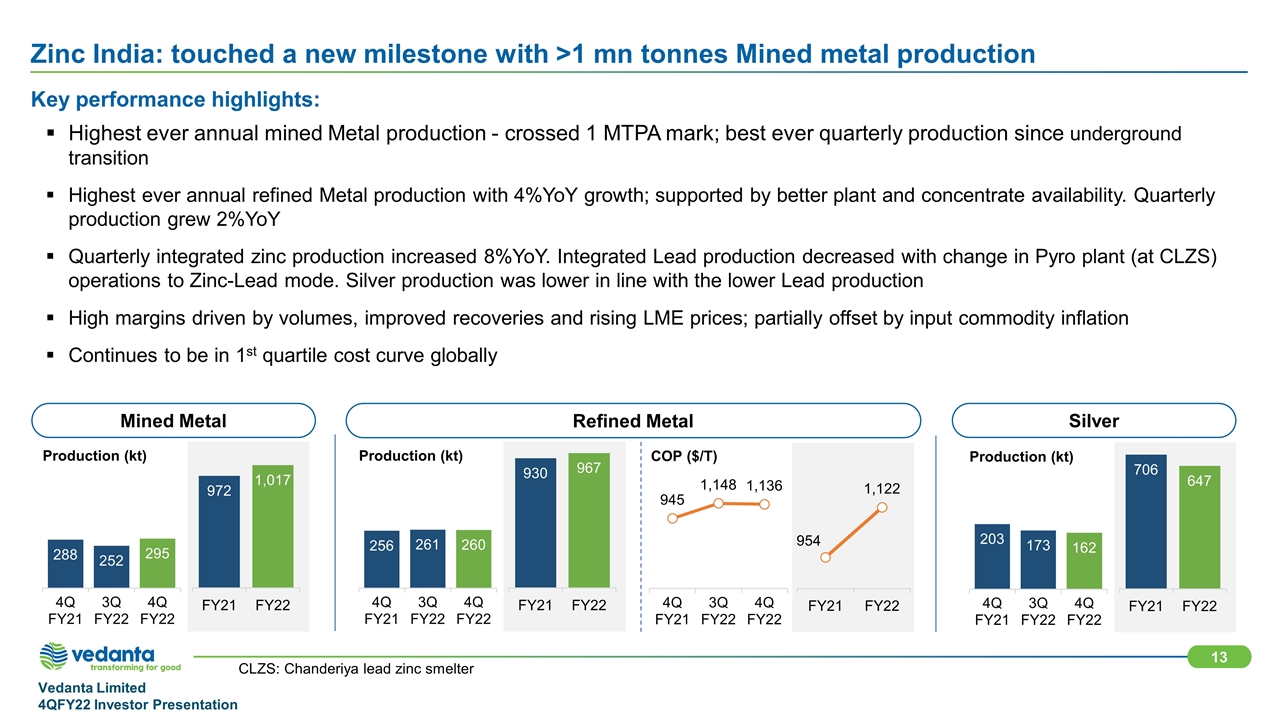
CLZS: Chanderiya lead zinc smelter Zinc India: touched a new milestone with >1 mn tonnes Mined metal production Key performance highlights: Highest ever annual mined Metal production - crossed 1 MTPA mark; best ever quarterly production since underground transition Highest ever annual refined Metal production with 4%YoY growth; supported by better plant and concentrate availability. Quarterly production grew 2%YoY Quarterly integrated zinc production increased 8%YoY. Integrated Lead production decreased with change in Pyro plant (at CLZS) operations to Zinc-Lead mode. Silver production was lower in line with the lower Lead production High margins driven by volumes, improved recoveries and rising LME prices; partially offset by input commodity inflation Continues to be in 1st quartile cost curve globally Mined Metal Refined Metal Silver

MIC: Metal in concentrate; COP: Cost of production Zinc International: Gamsberg achieved 220 kt annualized run rate of MIC production in Mar’22 Key highlights: Achieved highest ever annual production of mined metal with 18%YoY growth; Crushing throughput increased to 827tph in FY22 from 767tph in FY21 Quarterly mined metal production grew 10%QoQ with highest ever quarterly Ore production of 935kt; Throughput & recovery improvement projects in beneficiation plant completed in 4Q: Zinc Rougher Cell and lead pump box commissioning resulted in 3% to 5% recovery improvement Reagent skid upgrade to meet requirement of 600tph throughput COP increased mainly due to spend on south pit recovery project, exchange rate appreciation and input commodity inflation Gamsberg - Production Gamsberg - COP
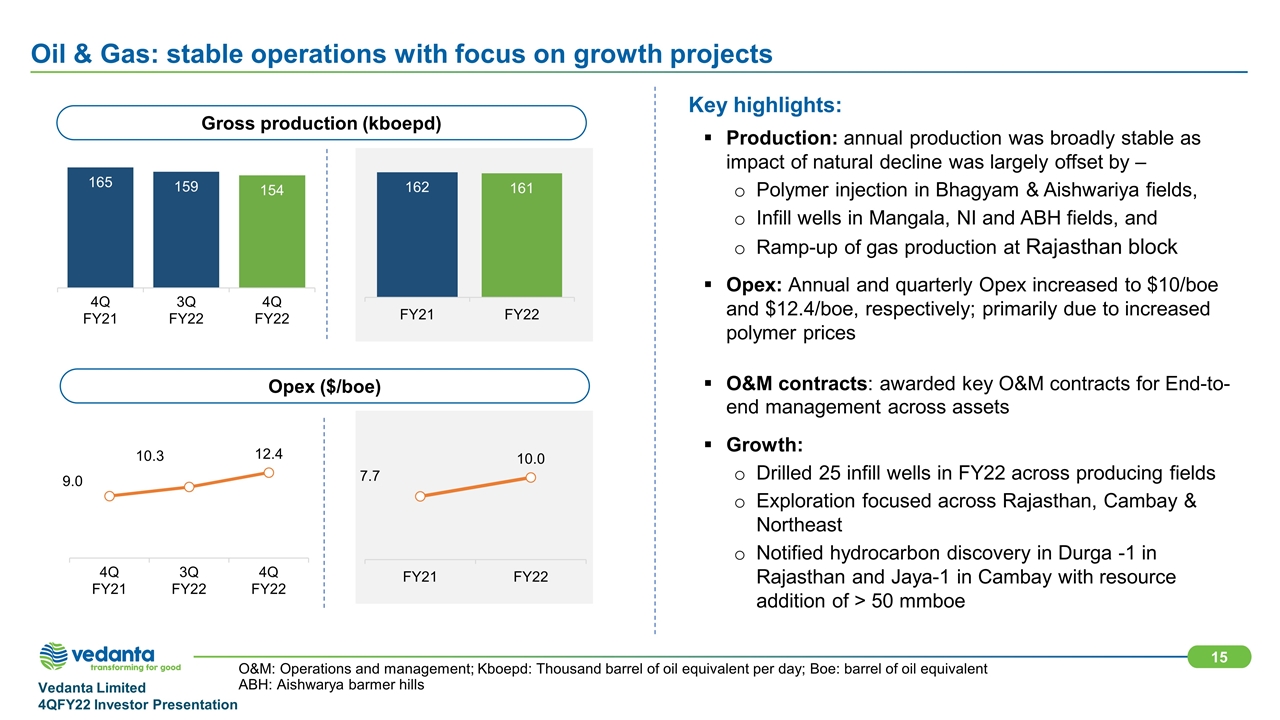
O&M: Operations and management; Kboepd: Thousand barrel of oil equivalent per day; Boe: barrel of oil equivalent ABH: Aishwarya barmer hills Oil & Gas: stable operations with focus on growth projects Gross production (kboepd) Key highlights: Production: annual production was broadly stable as impact of natural decline was largely offset by – Polymer injection in Bhagyam & Aishwariya fields, Infill wells in Mangala, NI and ABH fields, and Ramp-up of gas production at Rajasthan block Opex: Annual and quarterly Opex increased to $10/boe and $12.4/boe, respectively; primarily due to increased polymer prices O&M contracts: awarded key O&M contracts for End-to-end management across assets Growth: Drilled 25 infill wells in FY22 across producing fields Exploration focused across Rajasthan, Cambay & Northeast Notified hydrocarbon discovery in Durga -1 in Rajasthan and Jaya-1 in Cambay with resource addition of > 50 mmboe Opex ($/boe)
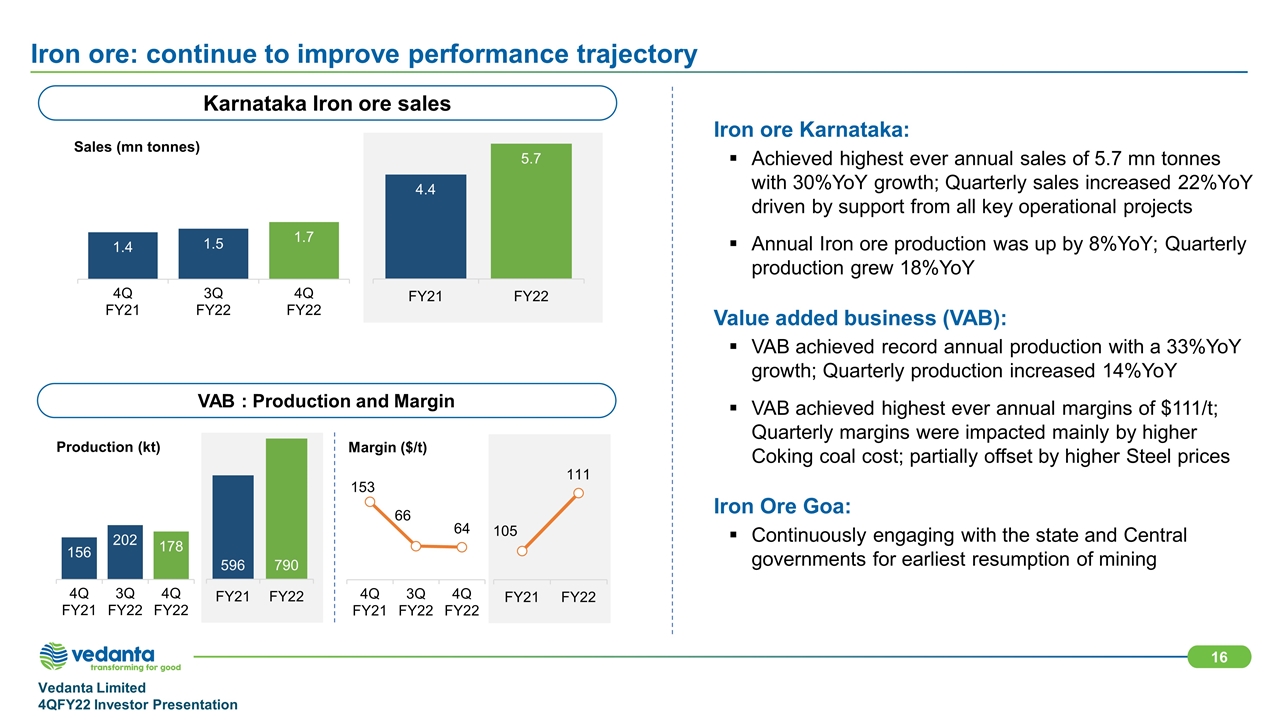
Iron ore: continue to improve performance trajectory VAB : Production and Margin Karnataka Iron ore sales Iron ore Karnataka: Achieved highest ever annual sales of 5.7 mn tonnes with 30%YoY growth; Quarterly sales increased 22%YoY driven by support from all key operational projects Annual Iron ore production was up by 8%YoY; Quarterly production grew 18%YoY Value added business (VAB): VAB achieved record annual production with a 33%YoY growth; Quarterly production increased 14%YoY VAB achieved highest ever annual margins of $111/t; Quarterly margins were impacted mainly by higher Coking coal cost; partially offset by higher Steel prices Iron Ore Goa: Continuously engaging with the state and Central governments for earliest resumption of mining
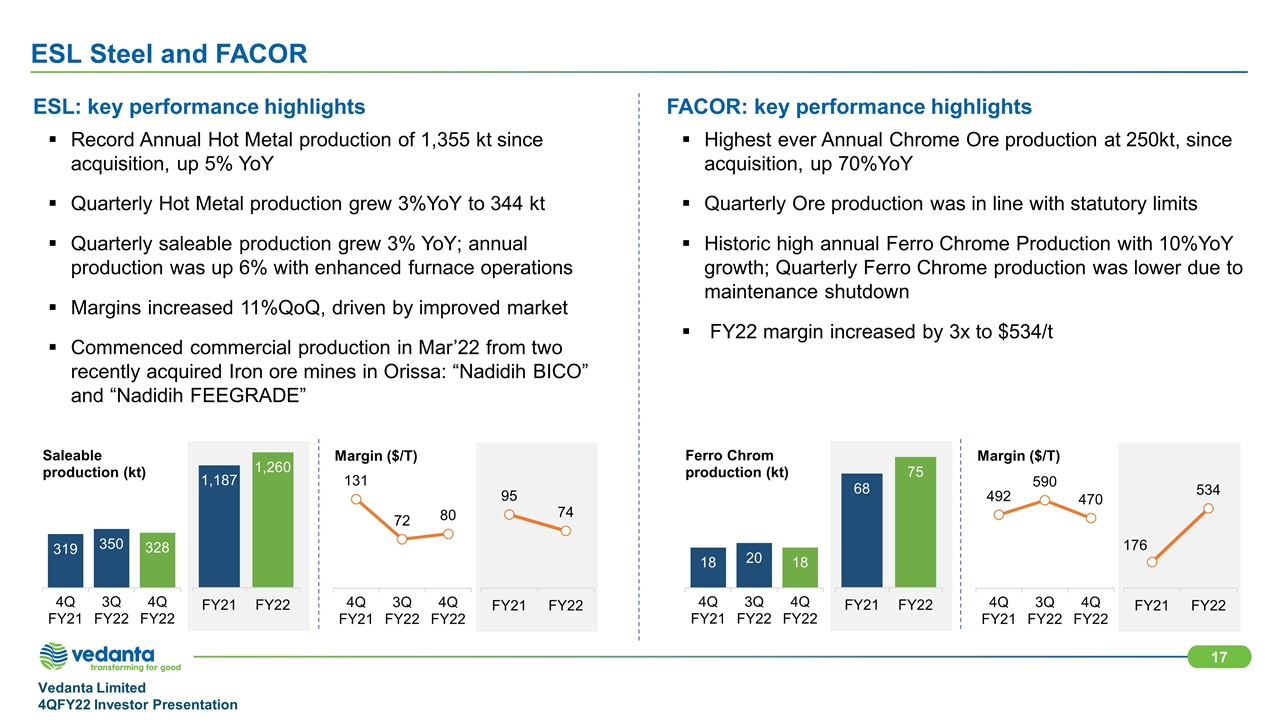
ESL Steel and FACOR ESL: key performance highlights Record Annual Hot Metal production of 1,355 kt since acquisition, up 5% YoY Quarterly Hot Metal production grew 3%YoY to 344 kt Quarterly saleable production grew 3% YoY; annual production was up 6% with enhanced furnace operations Margins increased 11%QoQ, driven by improved market Commenced commercial production in Mar’22 from two recently acquired Iron ore mines in Orissa: “Nadidih BICO” and “Nadidih FEEGRADE” FACOR: key performance highlights Highest ever Annual Chrome Ore production at 250kt, since acquisition, up 70%YoY Quarterly Ore production was in line with statutory limits Historic high annual Ferro Chrome Production with 10%YoY growth; Quarterly Ferro Chrome production was lower due to maintenance shutdown FY22 margin increased by 3x to $534/t
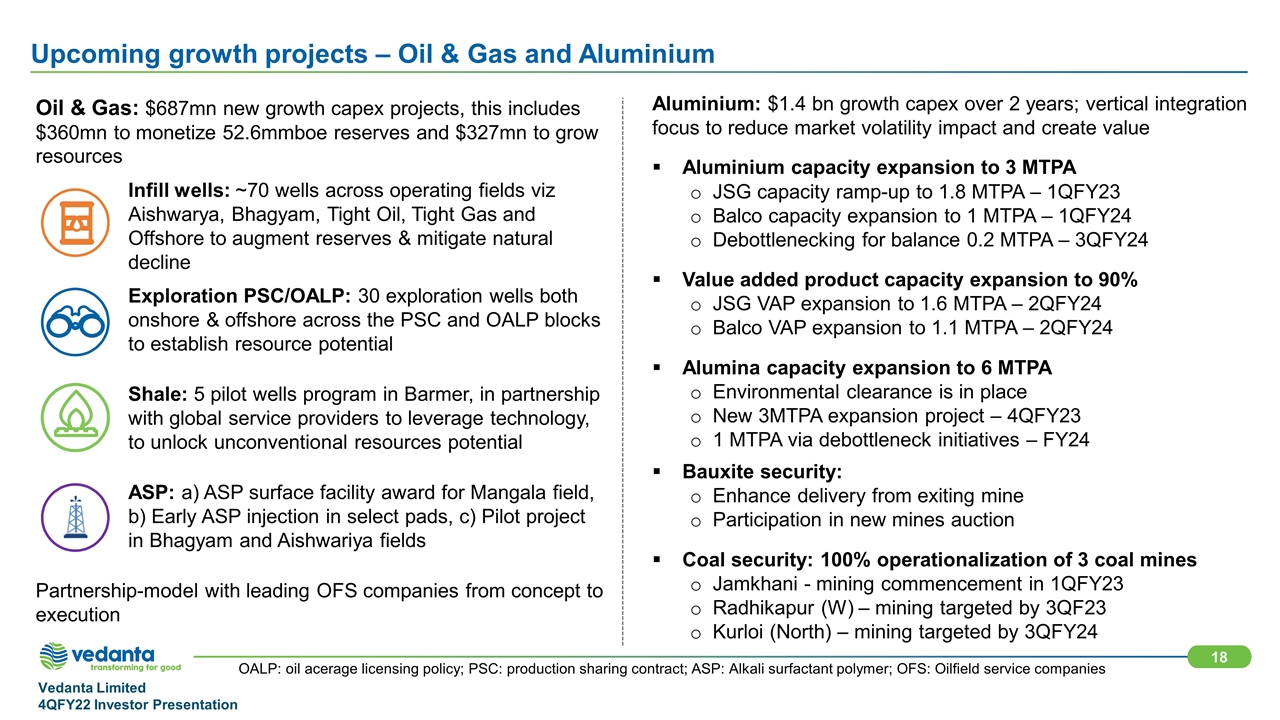
Aluminium: $1.4 bn growth capex over 2 years; vertical integration focus to reduce market volatility impact and create value Aluminium capacity expansion to 3 MTPA JSG capacity ramp-up to 1.8 MTPA – 1QFY23 Balco capacity expansion to 1 MTPA – 1QFY24 Debottlenecking for balance 0.2 MTPA – 3QFY24 Value added product capacity expansion to 90% JSG VAP expansion to 1.6 MTPA – 2QFY24 Balco VAP expansion to 1.1 MTPA – 2QFY24 Alumina capacity expansion to 6 MTPA Environmental clearance is in place New 3MTPA expansion project – 4QFY23 1 MTPA via debottleneck initiatives – FY24 Bauxite security: Enhance delivery from exiting mine Participation in new mines auction Coal security: 100% operationalization of 3 coal mines Jamkhani - mining commencement in 1QFY23 Radhikapur (W) – mining targeted by 3QF23 Kurloi (North) – mining targeted by 3QFY24 Oil & Gas: $687mn new growth capex projects, this includes $360mn to monetize 52.6mmboe reserves and $327mn to grow resources Infill wells: ~70 wells across operating fields viz Aishwarya, Bhagyam, Tight Oil, Tight Gas and Offshore to augment reserves & mitigate natural decline Exploration PSC/OALP: 30 exploration wells both onshore & offshore across the PSC and OALP blocks to establish resource potential Shale: 5 pilot wells program in Barmer, in partnership with global service providers to leverage technology, to unlock unconventional resources potential ASP: a) ASP surface facility award for Mangala field, b) Early ASP injection in select pads, c) Pilot project in Bhagyam and Aishwariya fields Partnership-model with leading OFS companies from concept to execution OALP: oil acerage licensing policy; PSC: production sharing contract; ASP: Alkali surfactant polymer; OFS: Oilfield service companies Upcoming growth projects – Oil & Gas and Aluminium

MIC: metal in concentrate; VAP: value added product; HDPE: high density polyethylene; MLD: million of liter per day Upcoming growth projects – Zinc International and ESL $466 mn capex on Gamsberg phase 2 project New 4 MTPA Concentrator (200 kt MIC) Completion by 1HFY24 and commissioning in 3QFY24 Key facilities include: Open cast mine expansion from 4 MTPA to 8 MTPA New 4 MTPA concentrator for additional MIC of 200ktpa New tailing dam – adjacent to current dam with HDPE lining as per environmental regulations New 20km, 22 MVA power line to site 6.5km line for 7.5 MLD water Capex investment of $348 mn Doubling Hot Metal Capacity to 3.0 MTPA from 1.5 MTPA Completion of project by end of FY23 Key project activities: Debottlenecking of Blast furnace - 3 by 0.2 MTPA Additional blast furnace of ~ 1.1 MTPA Additional Coke oven capacity of 0.5 MTPA Pellet plant 1.8 MPTA Oxygen plant 800tpd New ductile Iron plant 0.18 MTPA to maximize the VAP Other auxiliary and infrastructure upgradation Zinc International ESL Steel
Finance Update Ajay Goel Acting Chief Financial Officer VEDANTA LIMITED INVESTOR PRESENTATION 4QFY22
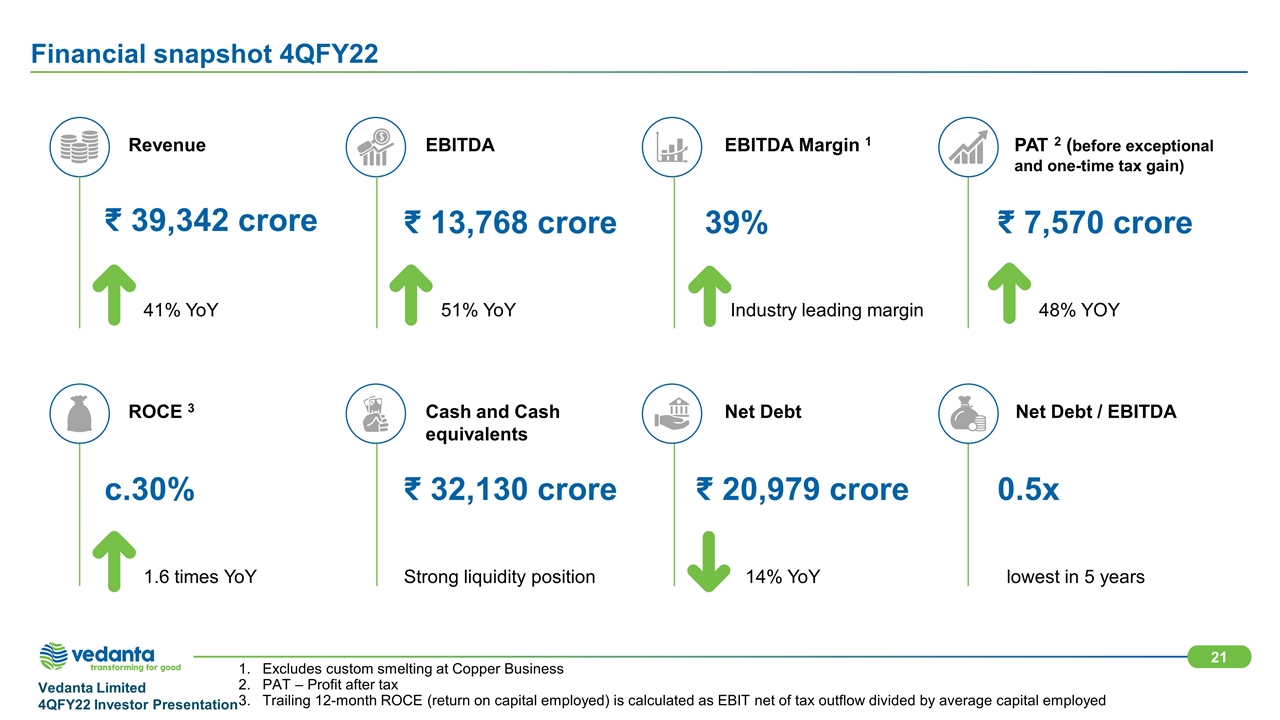
Excludes custom smelting at Copper Business PAT – Profit after tax Trailing 12-month ROCE (return on capital employed) is calculated as EBIT net of tax outflow divided by average capital employed Financial snapshot 4QFY22 Revenue EBITDA EBITDA Margin 1 PAT 2 (before exceptional and one-time tax gain) ₹ 39,342 crore ₹ 13,768 crore 39% ₹ 7,570 crore 41% YoY 51% YoY Industry leading margin 48% YOY ROCE 3 Cash and Cash equivalents Net Debt Net Debt / EBITDA c.30% ₹ 32,130 crore ₹ 20,979 crore 0.5x 1.6 times YoY Strong liquidity position 14% YoY lowest in 5 years
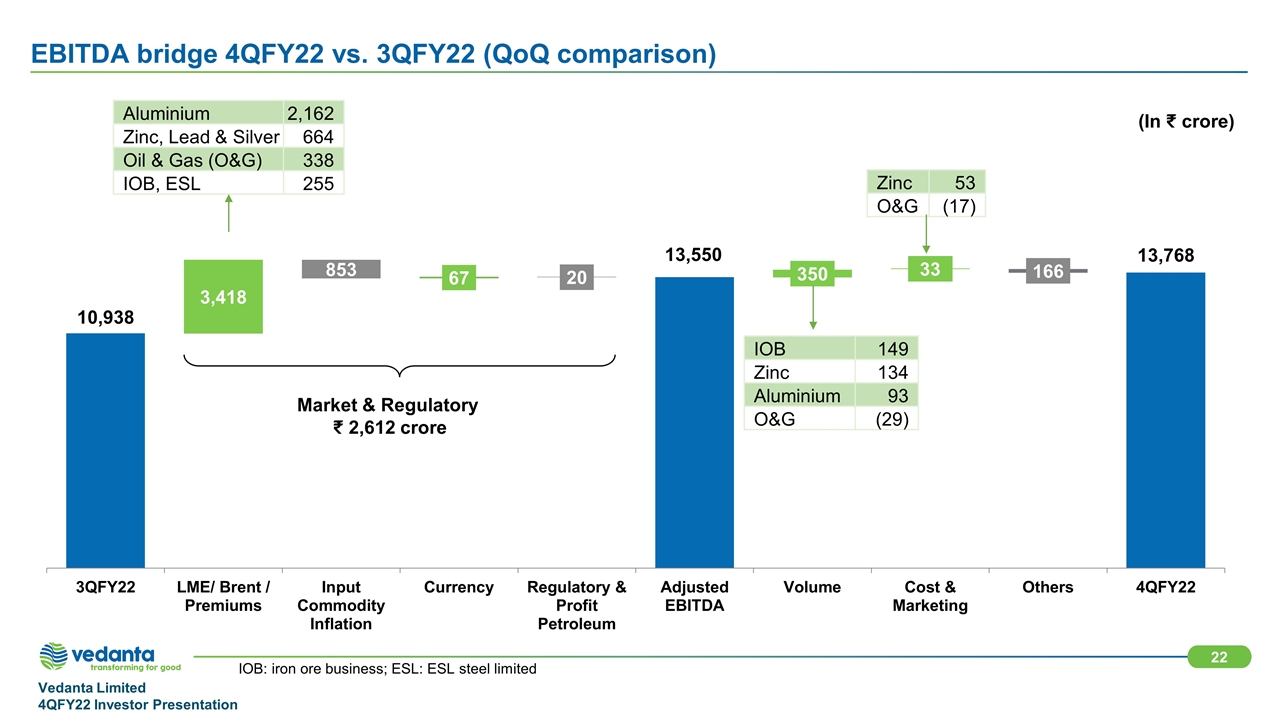
(In crore) Market & Regulatory 2,612 crore Aluminium 2,162 Zinc, Lead & Silver 664 Oil & Gas (O&G) 338 IOB, ESL 255 IOB 149 Zinc 134 Aluminium 93 O&G (29) Zinc 53 O&G (17) IOB: iron ore business; ESL: ESL steel limited EBITDA bridge 4QFY22 vs. 3QFY22 (QoQ comparison)
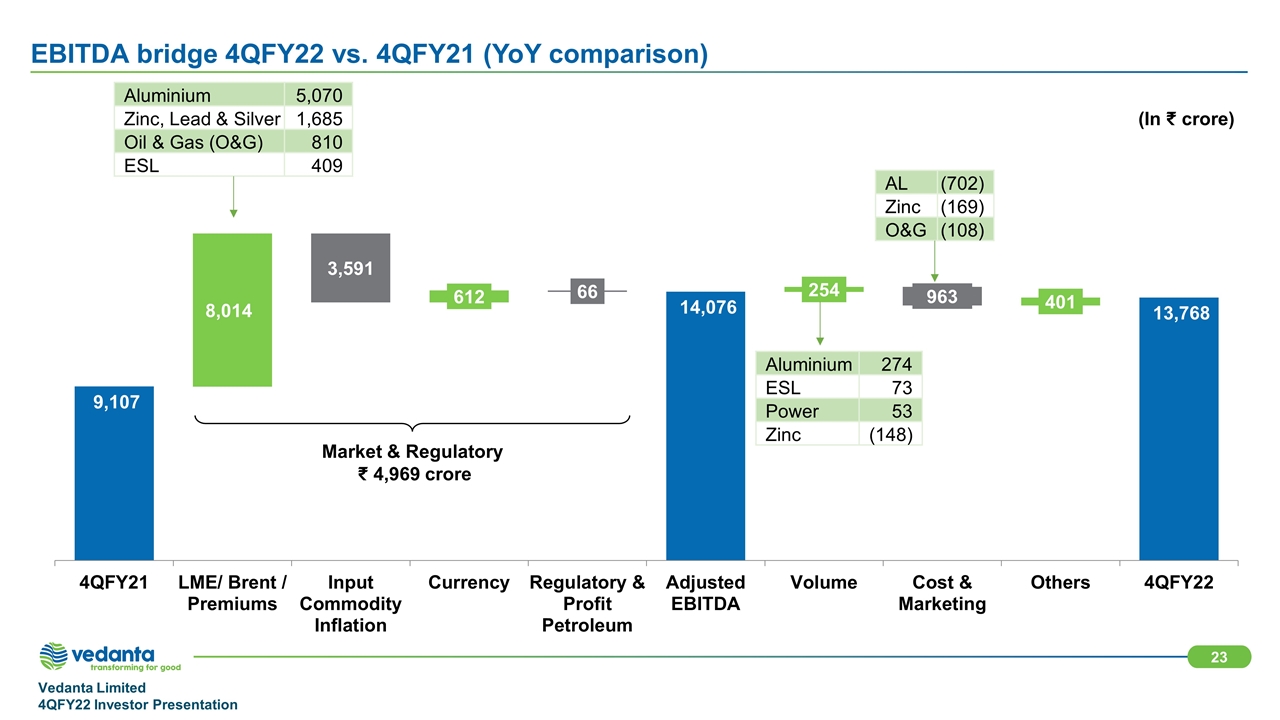
Market & Regulatory 4,969 crore Aluminium 5,070 Zinc, Lead & Silver 1,685 Oil & Gas (O&G) 810 ESL 409 Aluminium 274 ESL 73 Power 53 Zinc (148) AL (702) Zinc (169) O&G (108) EBITDA bridge 4QFY22 vs. 4QFY21 (YoY comparison) (In crore)
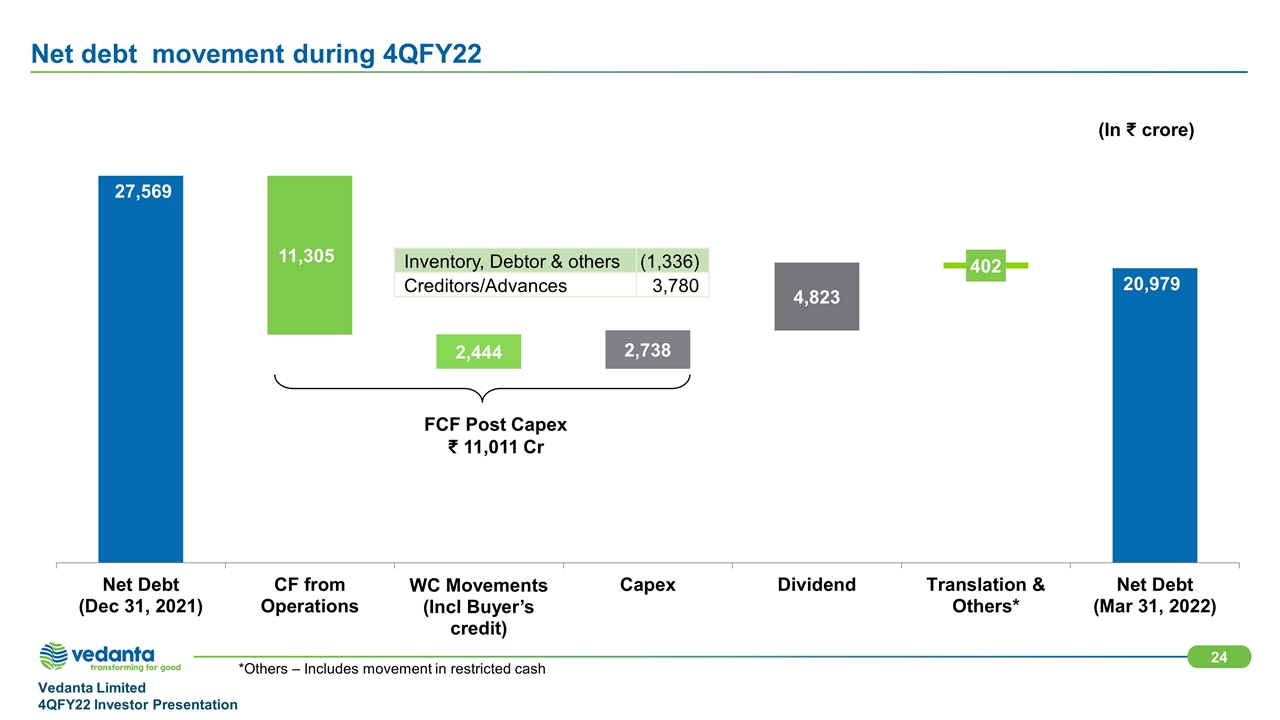
*Others – Includes movement in restricted cash Net debt movement during 4QFY22 (In crore) Inventory, Debtor & others (1,336) Creditors/Advances 3,780 FCF Post Capex 11,011 Cr
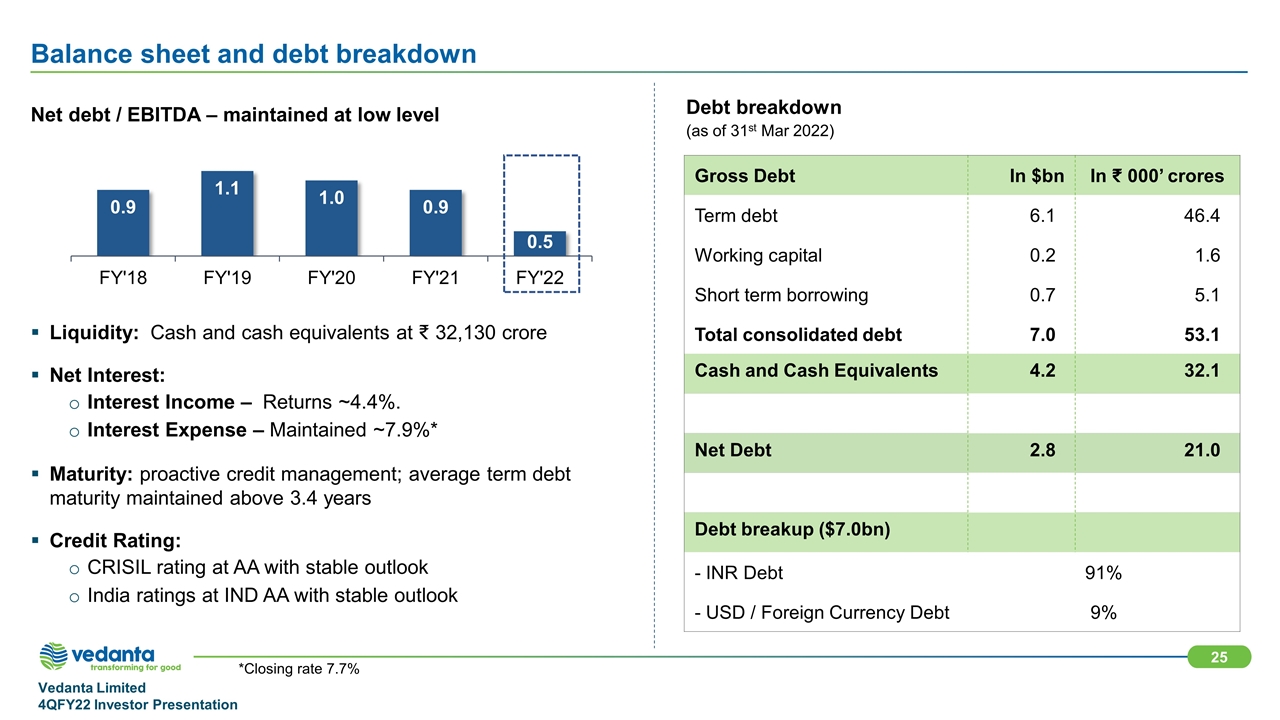
*Closing rate 7.7% Balance sheet and debt breakdown Net debt / EBITDA – maintained at low level Liquidity: Cash and cash equivalents at 32,130 crore Net Interest: Interest Income – Returns ~4.4%. Interest Expense – Maintained ~7.9%* Maturity: proactive credit management; average term debt maturity maintained above 3.4 years Credit Rating: CRISIL rating at AA with stable outlook India ratings at IND AA with stable outlook Gross Debt In $bn In ₹ 000’ crores Term debt 6.1 46.4 Working capital 0.2 1.6 Short term borrowing 0.7 5.1 Total consolidated debt 7.0 53.1 Cash and Cash Equivalents 4.2 32.1 Net Debt 2.8 21.0 Debt breakup ($7.0bn) - INR Debt 91% - USD / Foreign Currency Debt 9% Debt breakdown (as of 31st Mar 2022)
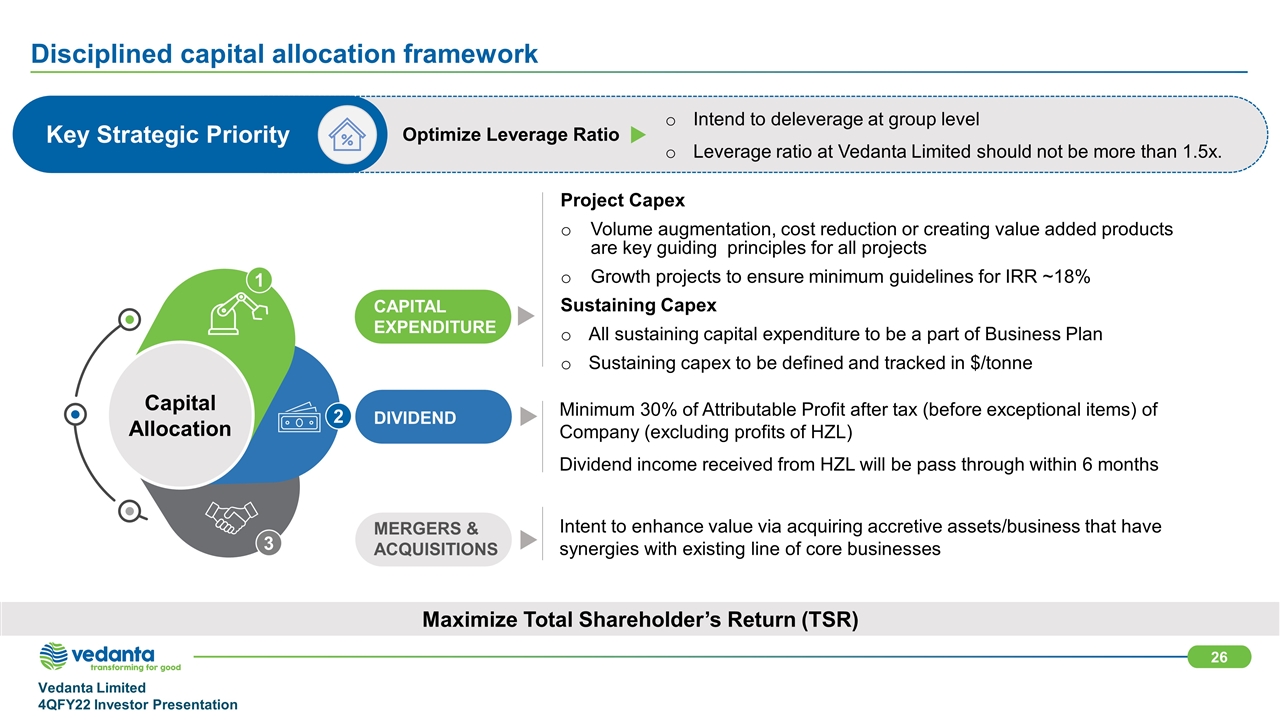
Disciplined capital allocation framework Key Strategic Priority Optimize Leverage Ratio Intend to deleverage at group level Leverage ratio at Vedanta Limited should not be more than 1.5x. Capital Allocation CAPITAL EXPENDITURE Project Capex Volume augmentation, cost reduction or creating value added products are key guiding principles for all projects Growth projects to ensure minimum guidelines for IRR ~18% Sustaining Capex All sustaining capital expenditure to be a part of Business Plan Sustaining capex to be defined and tracked in $/tonne DIVIDEND Minimum 30% of Attributable Profit after tax (before exceptional items) of Company (excluding profits of HZL) Dividend income received from HZL will be pass through within 6 months MERGERS & ACQUISITIONS Intent to enhance value via acquiring accretive assets/business that have synergies with existing line of core businesses Maximize Total Shareholder’s Return (TSR) 1 2 3
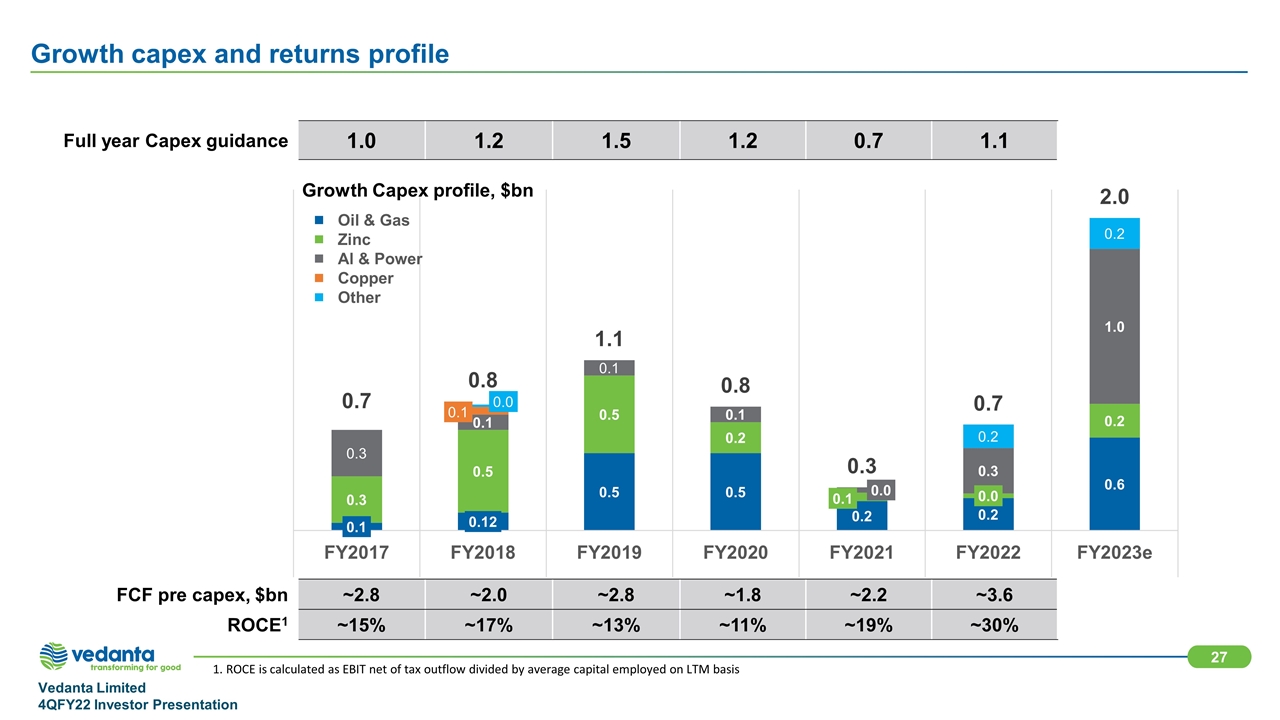
Growth capex and returns profile Full year Capex guidance 1.0 1.2 1.5 1.2 0.7 1.1 FCF pre capex, $bn ~2.8 ~2.0 ~2.8 ~1.8 ~2.2 ~3.6 ROCE1 ~15% ~17% ~13% ~11% ~19% ~30% Growth Capex profile, $bn 1. ROCE is calculated as EBIT net of tax outflow divided by average capital employed on LTM basis
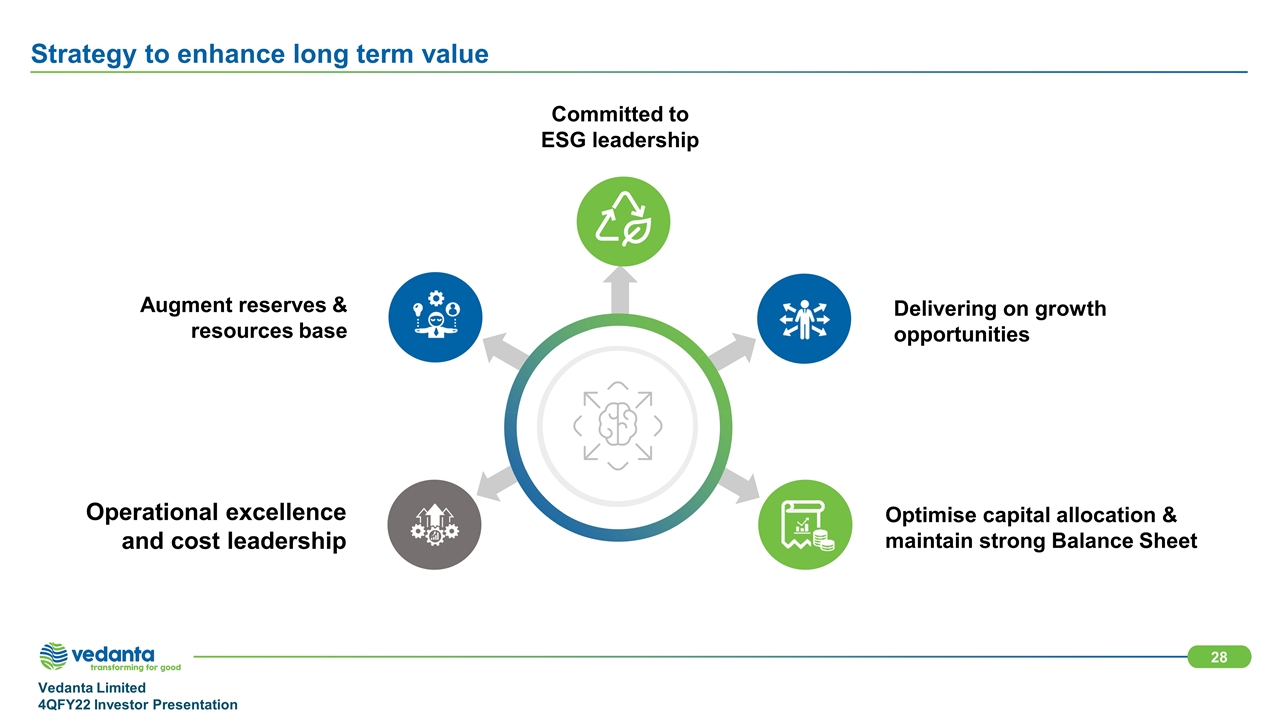
Strategy to enhance long term value Committed to ESG leadership Augment reserves & resources base Operational excellence and cost leadership Optimise capital allocation & maintain strong Balance Sheet Delivering on growth opportunities
Appendix VEDANTA LIMITED INVESTOR PRESENTATION 4QFY22
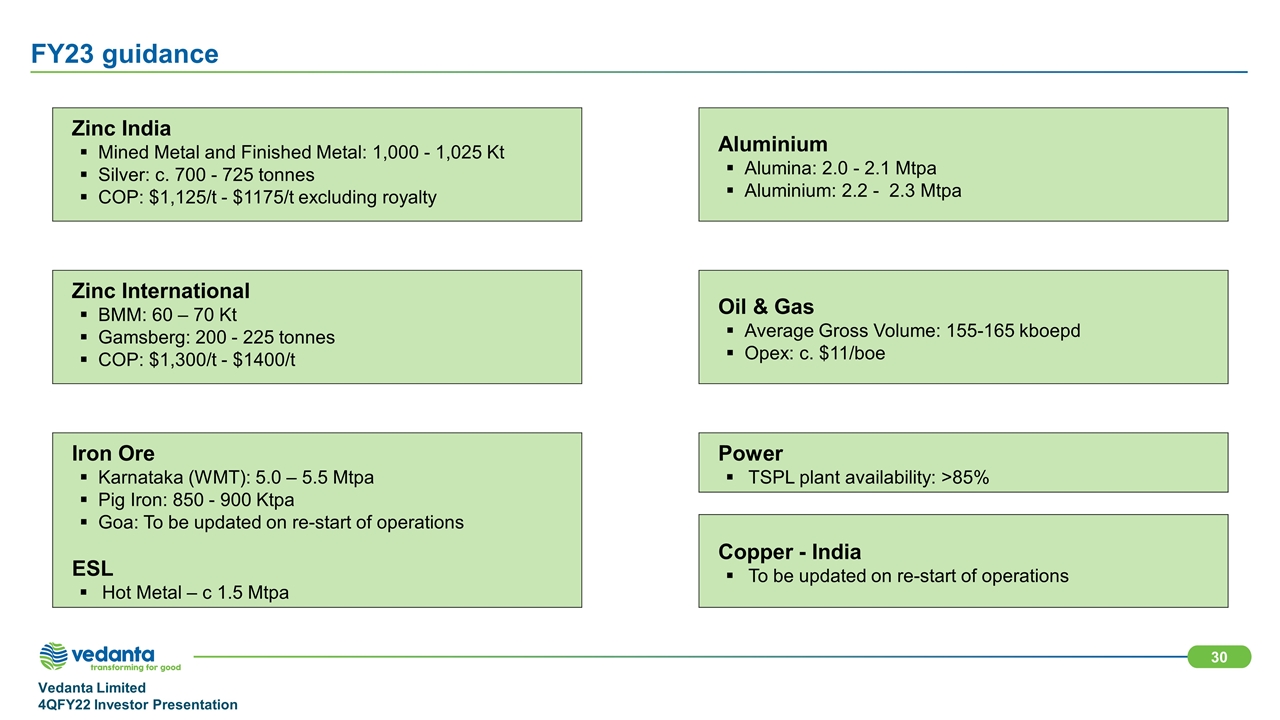
FY23 guidance Zinc India Mined Metal and Finished Metal: 1,000 - 1,025 Kt Silver: c. 700 - 725 tonnes COP: $1,125/t - $1175/t excluding royalty Aluminium Alumina: 2.0 - 2.1 Mtpa Aluminium: 2.2 - 2.3 Mtpa Zinc International BMM: 60 – 70 Kt Gamsberg: 200 - 225 tonnes COP: $1,300/t - $1400/t Oil & Gas Average Gross Volume: 155-165 kboepd Opex: c. $11/boe Iron Ore Karnataka (WMT): 5.0 – 5.5 Mtpa Pig Iron: 850 - 900 Ktpa Goa: To be updated on re-start of operations ESL Hot Metal – c 1.5 Mtpa Power TSPL plant availability: >85% Copper - India To be updated on re-start of operations
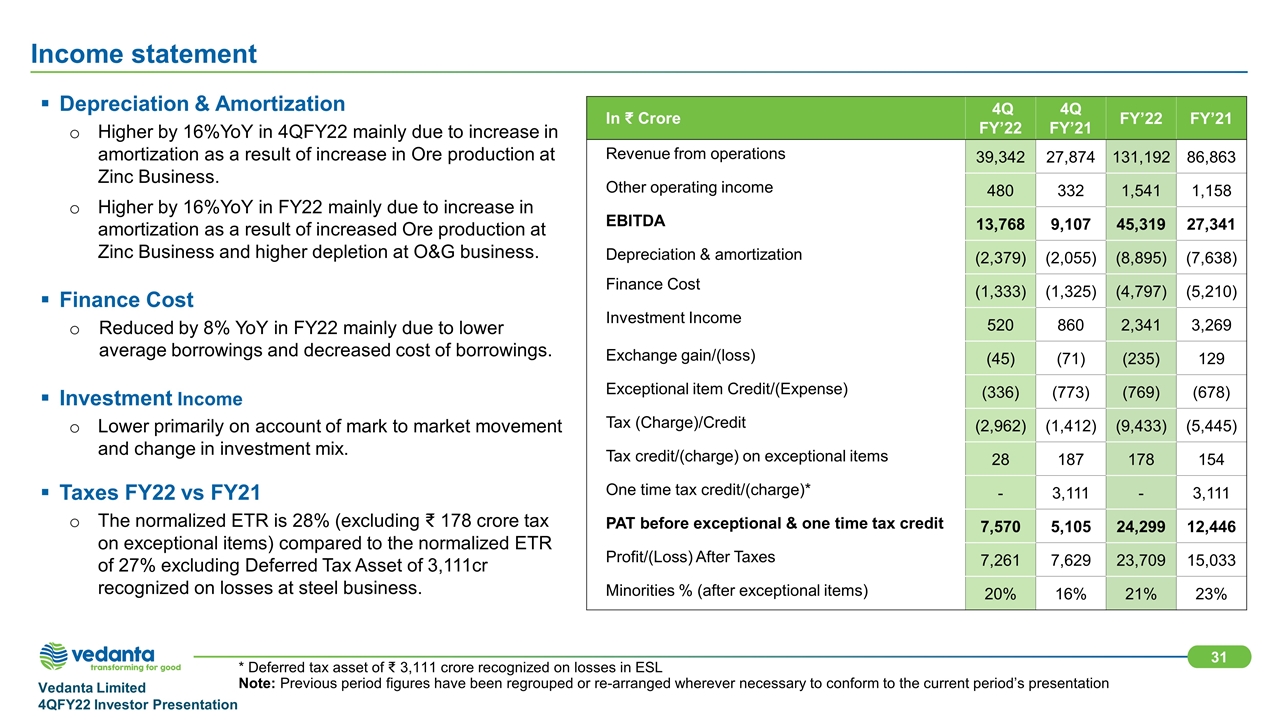
* Deferred tax asset of ₹ 3,111 crore recognized on losses in ESL Note: Previous period figures have been regrouped or re-arranged wherever necessary to conform to the current period’s presentation Income statement In Crore 4Q FY’22 4Q FY’21 FY’22 FY’21 Revenue from operations 39,342 27,874 131,192 86,863 Other operating income 480 332 1,541 1,158 EBITDA 13,768 9,107 45,319 27,341 Depreciation & amortization (2,379) (2,055) (8,895) (7,638) Finance Cost (1,333) (1,325) (4,797) (5,210) Investment Income 520 860 2,341 3,269 Exchange gain/(loss) (45) (71) (235) 129 Exceptional item Credit/(Expense) (336) (773) (769) (678) Tax (Charge)/Credit (2,962) (1,412) (9,433) (5,445) Tax credit/(charge) on exceptional items 28 187 178 154 One time tax credit/(charge)* - 3,111 - 3,111 PAT before exceptional & one time tax credit 7,570 5,105 24,299 12,446 Profit/(Loss) After Taxes 7,261 7,629 23,709 15,033 Minorities % (after exceptional items) 20% 16% 21% 23% Depreciation & Amortization Higher by 16%YoY in 4QFY22 mainly due to increase in amortization as a result of increase in Ore production at Zinc Business. Higher by 16%YoY in FY22 mainly due to increase in amortization as a result of increased Ore production at Zinc Business and higher depletion at O&G business. Finance Cost Reduced by 8% YoY in FY22 mainly due to lower average borrowings and decreased cost of borrowings. Investment Income Lower primarily on account of mark to market movement and change in investment mix. Taxes FY22 vs FY21 The normalized ETR is 28% (excluding ₹ 178 crore tax on exceptional items) compared to the normalized ETR of 27% excluding Deferred Tax Asset of 3,111cr recognized on losses at steel business.
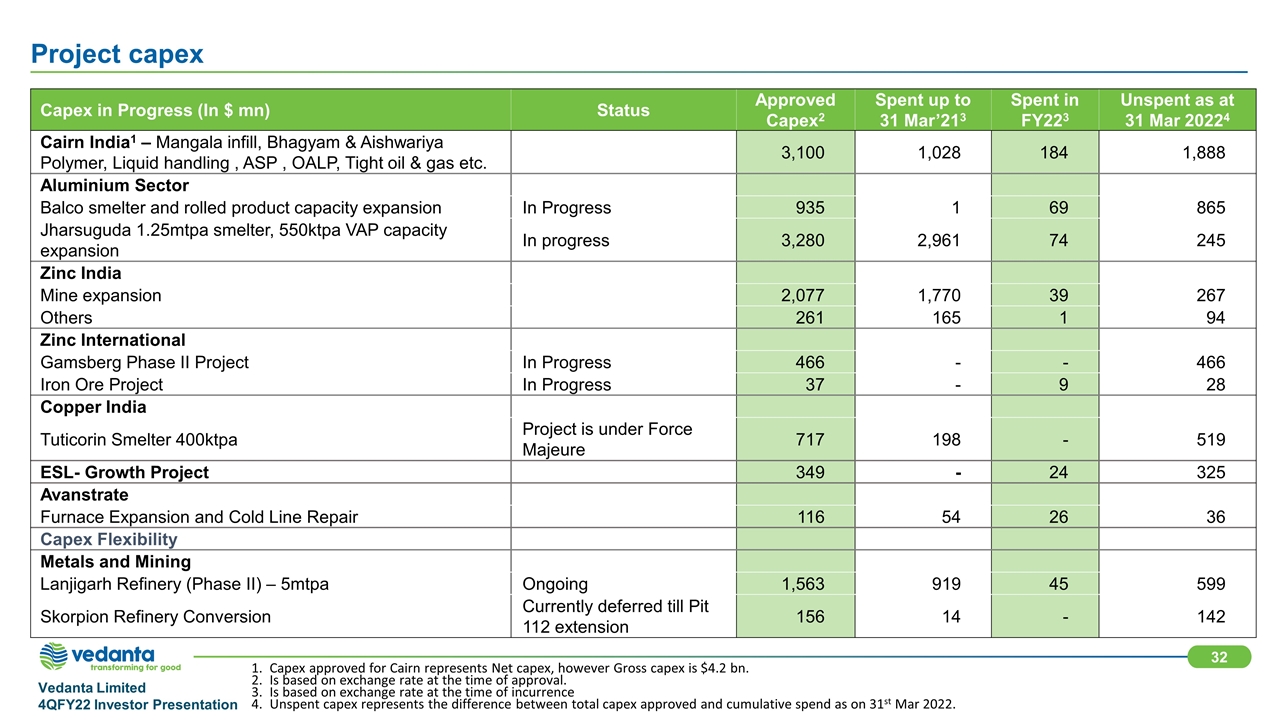
Capex approved for Cairn represents Net capex, however Gross capex is $4.2 bn. Is based on exchange rate at the time of approval. Is based on exchange rate at the time of incurrence Unspent capex represents the difference between total capex approved and cumulative spend as on 31st Mar 2022. Project capex Capex in Progress (In $ mn) Status Approved Capex2 Spent up to 31 Mar’213 Spent in FY223 Unspent as at 31 Mar 20224 Cairn India1 – Mangala infill, Bhagyam & Aishwariya Polymer, Liquid handling , ASP , OALP, Tight oil & gas etc. 3,100 1,028 184 1,888 Aluminium Sector Balco smelter and rolled product capacity expansion In Progress 935 1 69 865 Jharsuguda 1.25mtpa smelter, 550ktpa VAP capacity expansion In progress 3,280 2,961 74 245 Zinc India Mine expansion 2,077 1,770 39 267 Others 261 165 1 94 Zinc International Gamsberg Phase II Project In Progress 466 - - 466 Iron Ore Project In Progress 37 - 9 28 Copper India Tuticorin Smelter 400ktpa Project is under Force Majeure 717 198 - 519 ESL- Growth Project 349 - 24 325 Avanstrate Furnace Expansion and Cold Line Repair 116 54 26 36 Capex Flexibility Metals and Mining Lanjigarh Refinery (Phase II) – 5mtpa Ongoing 1,563 919 45 599 Skorpion Refinery Conversion Currently deferred till Pit 112 extension 156 14 - 142
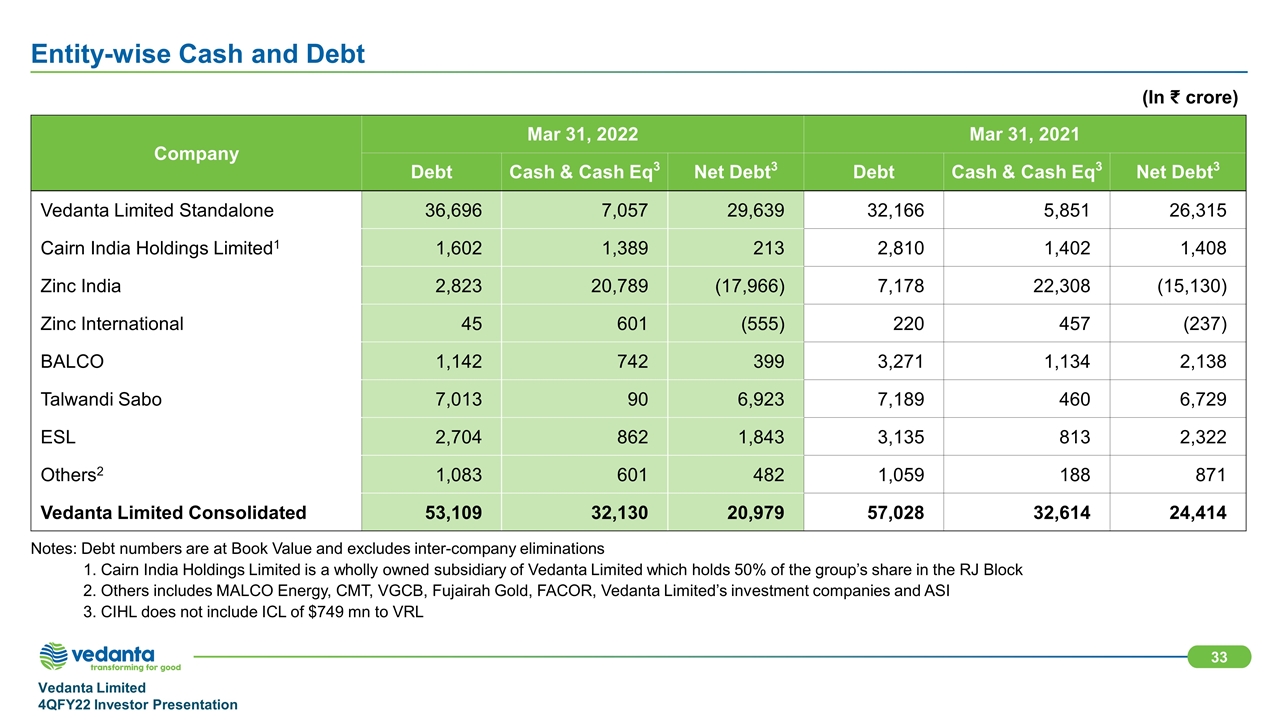
Entity-wise Cash and Debt Company Mar 31, 2022 Mar 31, 2021 Debt Cash & Cash Eq3 Net Debt3 Debt Cash & Cash Eq3 Net Debt3 Vedanta Limited Standalone 36,696 7,057 29,639 32,166 5,851 26,315 Cairn India Holdings Limited1 1,602 1,389 213 2,810 1,402 1,408 Zinc India 2,823 20,789 (17,966) 7,178 22,308 (15,130) Zinc International 45 601 (555) 220 457 (237) BALCO 1,142 742 399 3,271 1,134 2,138 Talwandi Sabo 7,013 90 6,923 7,189 460 6,729 ESL 2,704 862 1,843 3,135 813 2,322 Others2 1,083 601 482 1,059 188 871 Vedanta Limited Consolidated 53,109 32,130 20,979 57,028 32,614 24,414 Notes: Debt numbers are at Book Value and excludes inter-company eliminations 1. Cairn India Holdings Limited is a wholly owned subsidiary of Vedanta Limited which holds 50% of the group’s share in the RJ Block 2. Others includes MALCO Energy, CMT, VGCB, Fujairah Gold, FACOR, Vedanta Limited’s investment companies and ASI 3. CIHL does not include ICL of $749 mn to VRL (In crore)
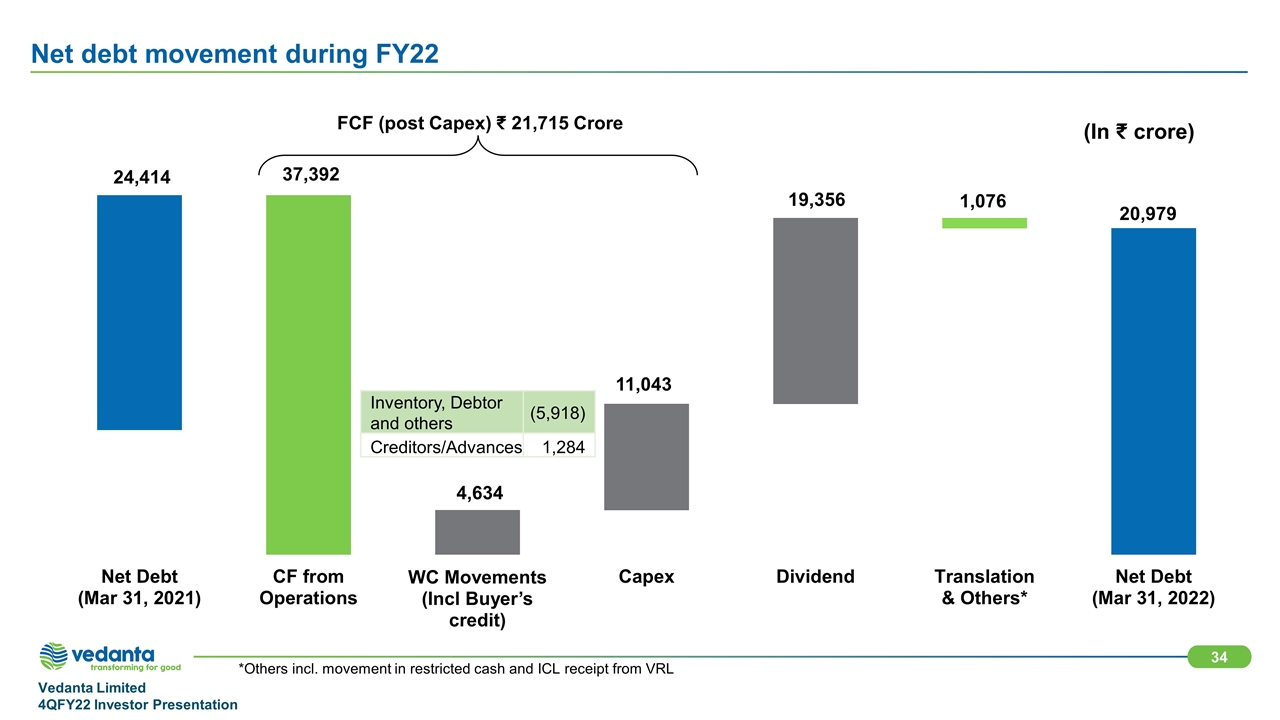
*Others incl. movement in restricted cash and ICL receipt from VRL Net debt movement during FY22 (In crore) FCF (post Capex) 21,715 Crore Inventory, Debtor and others (5,918) Creditors/Advances 1,284
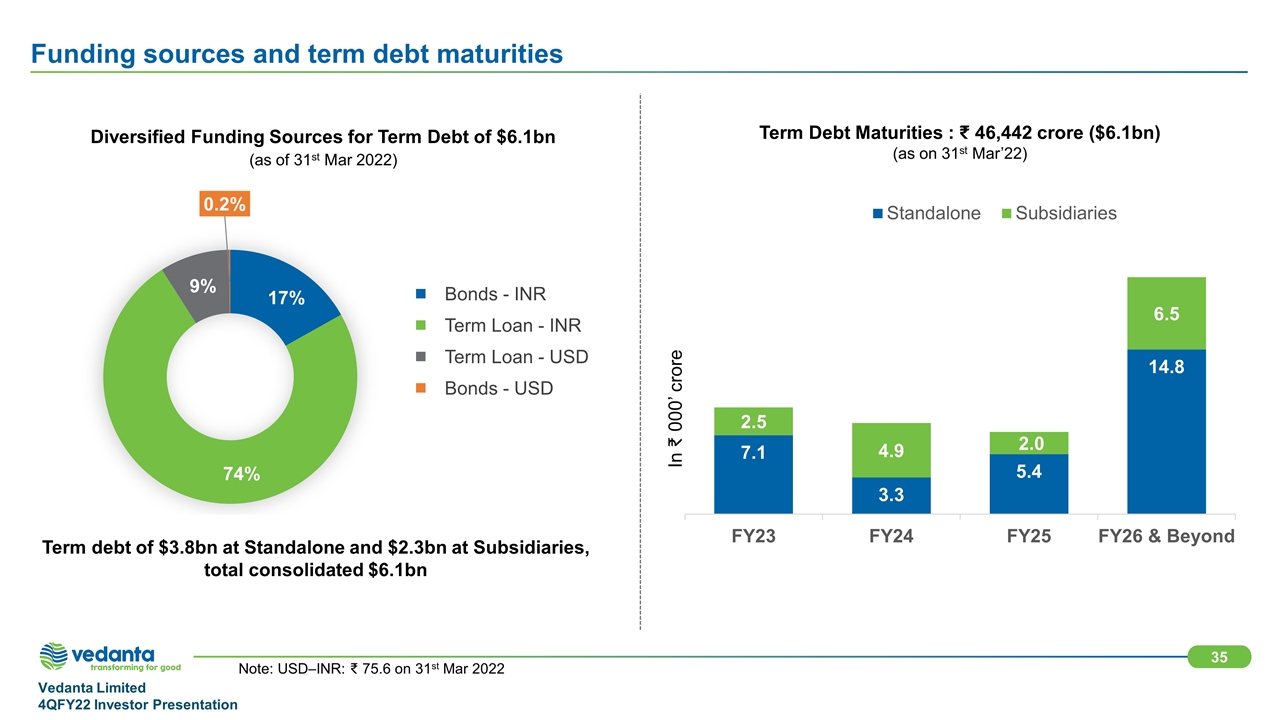
Note: USD–INR: 75.6 on 31st Mar 2022 Funding sources and term debt maturities Term debt of $3.8bn at Standalone and $2.3bn at Subsidiaries, total consolidated $6.1bn Diversified Funding Sources for Term Debt of $6.1bn (as of 31st Mar 2022) Term Debt Maturities : 46,442 crore ($6.1bn) (as on 31st Mar’22) In ₹ 000’ crore
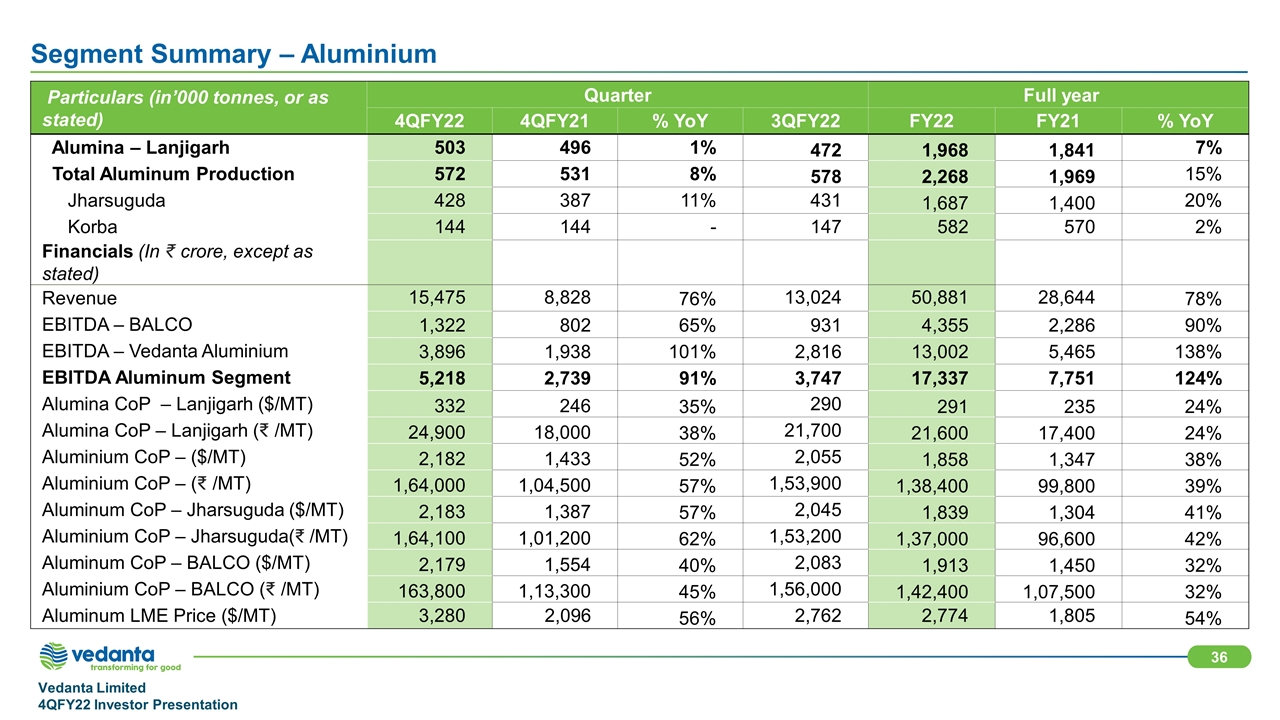
Segment Summary – Aluminium Particulars (in’000 tonnes, or as stated) Quarter Q4 Q3 Full year Full year 4QFY22 4QFY21 % YoY 3QFY22 FY22 FY21 % YoY Alumina – Lanjigarh 503 496 1% 472 1,968 1,841 7% Total Aluminum Production 572 531 8% 578 2,268 1,969 15% Jharsuguda 428 387 11% 431 1,687 1,400 20% Korba 144 144 - 147 582 570 2% Financials (In crore, except as stated) Revenue 15,475 8,828 76% 13,024 50,881 28,644 78% EBITDA – BALCO 1,322 802 65% 931 4,355 2,286 90% EBITDA – Vedanta Aluminium 3,896 1,938 101% 2,816 13,002 5,465 138% EBITDA Aluminum Segment 5,218 2,739 91% 3,747 17,337 7,751 124% Alumina CoP – Lanjigarh ($/MT) 332 246 35% 290 291 235 24% Alumina CoP – Lanjigarh ( /MT) 24,900 18,000 38% 21,700 21,600 17,400 24% Aluminium CoP – ($/MT) 2,182 1,433 52% 2,055 1,858 1,347 38% Aluminium CoP – ( /MT) 1,64,000 1,04,500 57% 1,53,900 1,38,400 99,800 39% Aluminum CoP – Jharsuguda ($/MT) 2,183 1,387 57% 2,045 1,839 1,304 41% Aluminium CoP – Jharsuguda( /MT) 1,64,100 1,01,200 62% 1,53,200 1,37,000 96,600 42% Aluminum CoP – BALCO ($/MT) 2,179 1,554 40% 2,083 1,913 1,450 32% Aluminium CoP – BALCO ( /MT) 163,800 1,13,300 45% 1,56,000 1,42,400 1,07,500 32% Aluminum LME Price ($/MT) 3,280 2,096 56% 2,762 2,774 1,805 54%
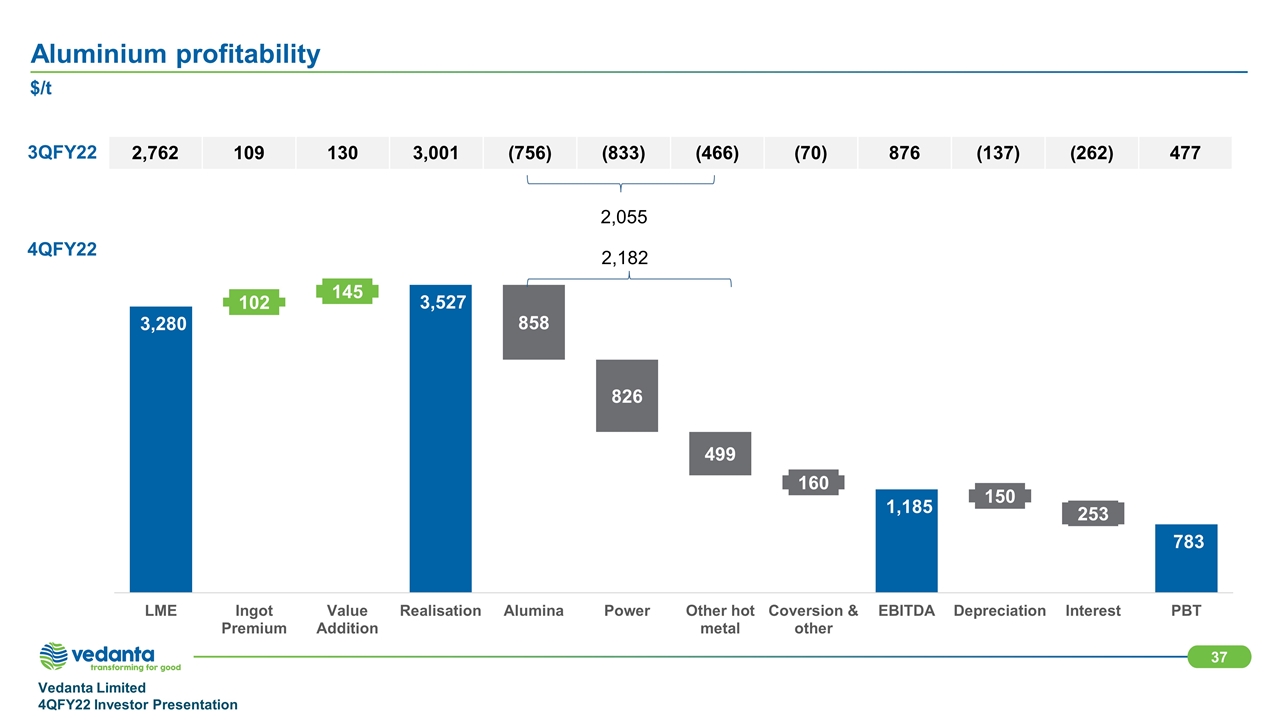
Aluminium profitability 3QFY22 $/t 4QFY22 2,055 2,762 109 130 3,001 (756) (833) (466) (70) 876 (137) (262) 477 2,182 116: 191: 69 0: 99: 168 237: 125: 49 109: 110: 113
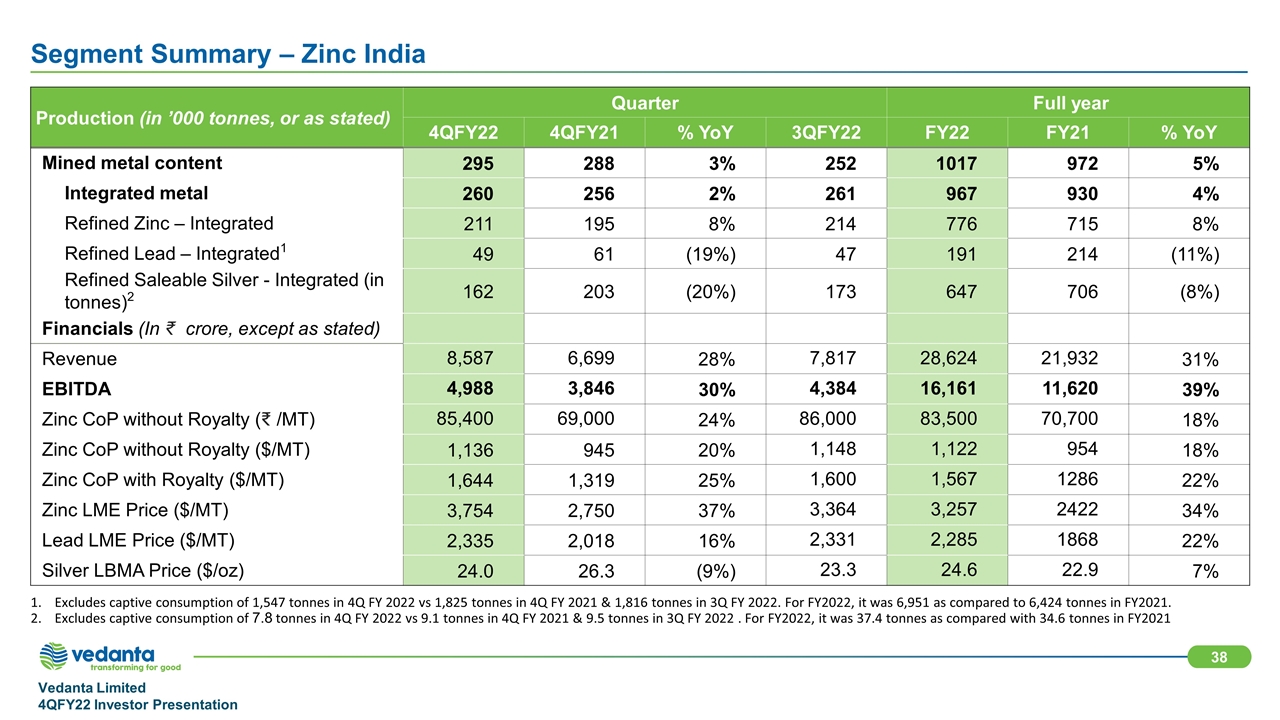
Excludes captive consumption of 1,547 tonnes in 4Q FY 2022 vs 1,825 tonnes in 4Q FY 2021 & 1,816 tonnes in 3Q FY 2022. For FY2022, it was 6,951 as compared to 6,424 tonnes in FY2021. Excludes captive consumption of 7.8 tonnes in 4Q FY 2022 vs 9.1 tonnes in 4Q FY 2021 & 9.5 tonnes in 3Q FY 2022 . For FY2022, it was 37.4 tonnes as compared with 34.6 tonnes in FY2021 Segment Summary – Zinc India Production (in ’000 tonnes, or as stated) Quarter Q4 Q3 Full year Full year 4QFY22 4QFY21 % YoY 3QFY22 FY22 FY21 % YoY Mined metal content 295 288 3% 252 1017 972 5% Integrated metal 260 256 2% 261 967 930 4% Refined Zinc – Integrated 211 195 8% 214 776 715 8% Refined Lead – Integrated1 49 61 (19%) 47 191 214 (11%) Refined Saleable Silver - Integrated (in tonnes)2 162 203 (20%) 173 647 706 (8%) Financials (In crore, except as stated) Revenue 8,587 6,699 28% 7,817 28,624 21,932 31% EBITDA 4,988 3,846 30% 4,384 16,161 11,620 39% Zinc CoP without Royalty ( /MT) 85,400 69,000 24% 86,000 83,500 70,700 18% Zinc CoP without Royalty ($/MT) 1,136 945 20% 1,148 1,122 954 18% Zinc CoP with Royalty ($/MT) 1,644 1,319 25% 1,600 1,567 1286 22% Zinc LME Price ($/MT) 3,754 2,750 37% 3,364 3,257 2422 34% Lead LME Price ($/MT) 2,335 2,018 16% 2,331 2,285 1868 22% Silver LBMA Price ($/oz) 24.0 26.3 (9%) 23.3 24.6 22.9 7%
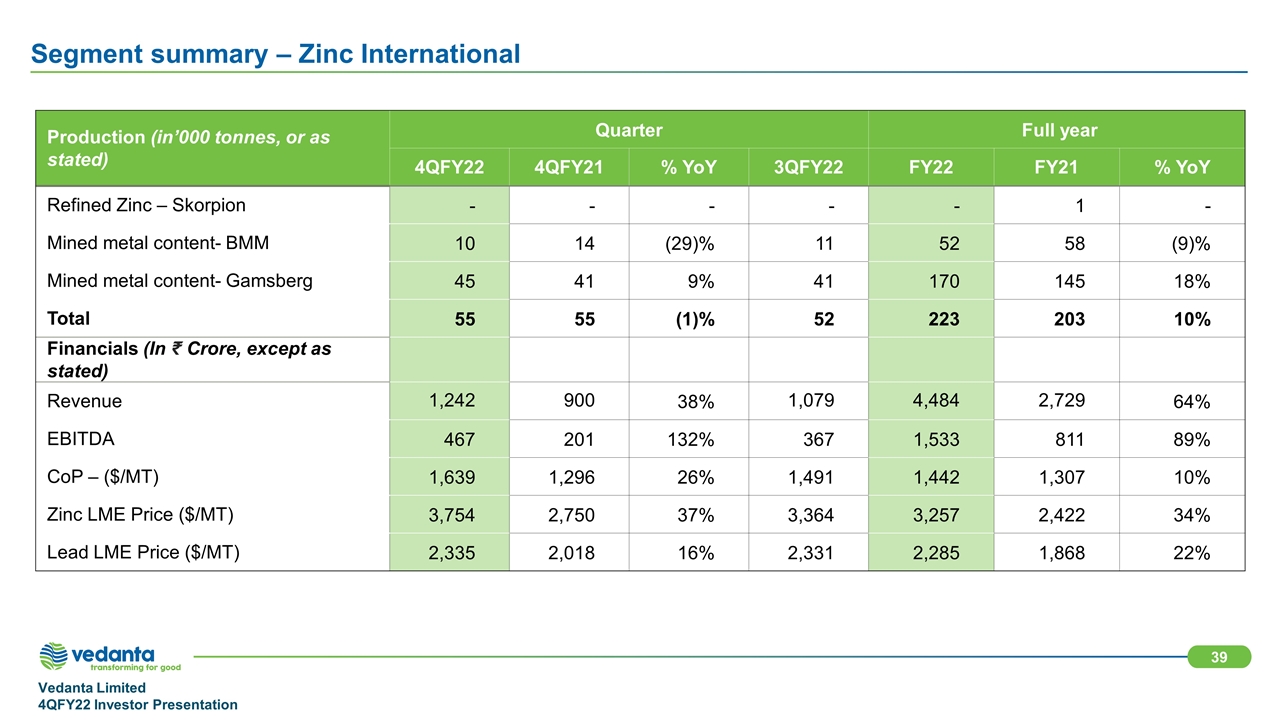
Segment summary – Zinc International Production (in’000 tonnes, or as stated) Quarter Q4 Q3 Full year Full year 4QFY22 4QFY21 % YoY 3QFY22 FY22 FY21 % YoY Refined Zinc – Skorpion - - - - - 1 - Mined metal content- BMM 10 14 (29)% 11 52 58 (9)% Mined metal content- Gamsberg 45 41 9% 41 170 145 18% Total 55 55 (1)% 52 223 203 10% Financials (In Crore, except as stated) Revenue 1,242 900 38% 1,079 4,484 2,729 64% EBITDA 467 201 132% 367 1,533 811 89% CoP – ($/MT) 1,639 1,296 26% 1,491 1,442 1,307 10% Zinc LME Price ($/MT) 3,754 2,750 37% 3,364 3,257 2,422 34% Lead LME Price ($/MT) 2,335 2,018 16% 2,331 2,285 1,868 22%

Segment Summary – Oil & Gas Oil & Gas (boepd) Quarter Q4 Q3 Full year Full year 4QFY22 4QFY21 % YoY 3QFY22 FY22 FY21 % YoY Average Daily Gross Operated Production (boepd) 153,840 165,000 (7%) 159,230 160,851 162,104 (1%) Rajasthan 132,443 138,057 (4%) 136,795 137,723 132,599 4% Ravva 13,248 16,258 (19%) 14,457 14,166 19,177 (26%) Cambay 8,065 10,685 (25%) 7,906 8,923 10,329 (14%) OALP 84 - - 73 39 - - Average Daily Working Interest Production (boepd) 99,513 105,123 (5%) 102,795 103,737 101,706 2% Rajasthan 92,710 96,640 (4%) 95,756 96,406 92,819 4% Ravva 2,981 3,658 (19%) 3,253 3,187 4,315 (26%) Cambay 3,226 4,274 (25%) 3,162 3,569 4,131 (14%) KG-ONN 2003/1 513 552 (7%) 550 535 441 21% OALP 84 - - 73 39 - - Total Oil and Gas (million boe) Oil & Gas- Gross operated 13.8 14.8 (7%) 14.6 58.7 59.2 (1%) Oil & Gas-Working Interest 9.0 9.5 (5%) 9.5 37.9 37.1 2% Financials (In crore, except as stated) Revenue 3,940 2,584 52% 3,113 12,430 7,531 65% EBITDA 2,052 1,069 92% 1,492 5,992 3,206 87% Average Oil Price Realization ($/bbl) 95.7 59.4 61% 75.7 77.1 43.8 76% Brent Price ($ / bbl) 102.2 60.9 68% 79.7 81.2 44.3 83%
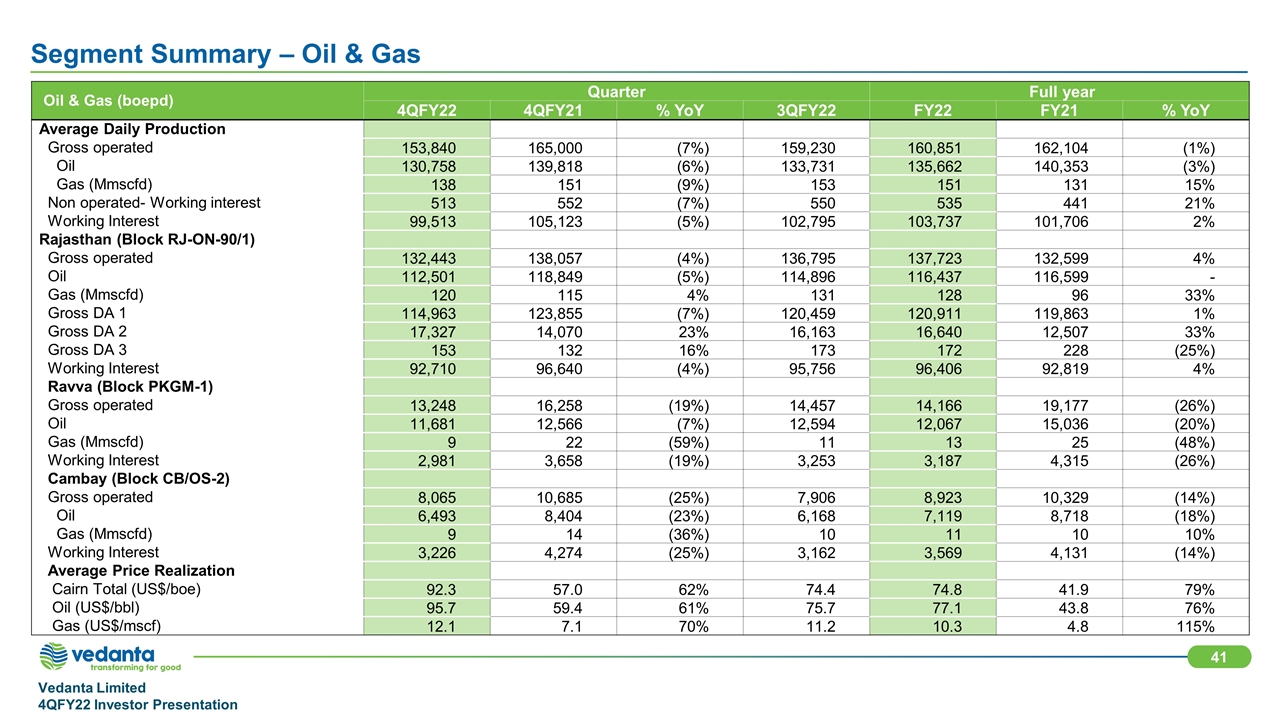
Segment Summary – Oil & Gas Oil & Gas (boepd) Quarter Q4 Q3 Full year Full year 4QFY22 4QFY21 % YoY 3QFY22 FY22 FY21 % YoY Average Daily Production Gross operated 153,840 165,000 (7%) 159,230 160,851 162,104 (1%) Oil 130,758 139,818 (6%) 133,731 135,662 140,353 (3%) Gas (Mmscfd) 138 151 (9%) 153 151 131 15% Non operated- Working interest 513 552 (7%) 550 535 441 21% Working Interest 99,513 105,123 (5%) 102,795 103,737 101,706 2% Rajasthan (Block RJ-ON-90/1) Gross operated 132,443 138,057 (4%) 136,795 137,723 132,599 4% Oil 112,501 118,849 (5%) 114,896 116,437 116,599 - Gas (Mmscfd) 120 115 4% 131 128 96 33% Gross DA 1 114,963 123,855 (7%) 120,459 120,911 119,863 1% Gross DA 2 17,327 14,070 23% 16,163 16,640 12,507 33% Gross DA 3 153 132 16% 173 172 228 (25%) Working Interest 92,710 96,640 (4%) 95,756 96,406 92,819 4% Ravva (Block PKGM-1) Gross operated 13,248 16,258 (19%) 14,457 14,166 19,177 (26%) Oil 11,681 12,566 (7%) 12,594 12,067 15,036 (20%) Gas (Mmscfd) 9 22 (59%) 11 13 25 (48%) Working Interest 2,981 3,658 (19%) 3,253 3,187 4,315 (26%) Cambay (Block CB/OS-2) Gross operated 8,065 10,685 (25%) 7,906 8,923 10,329 (14%) Oil 6,493 8,404 (23%) 6,168 7,119 8,718 (18%) Gas (Mmscfd) 9 14 (36%) 10 11 10 10% Working Interest 3,226 4,274 (25%) 3,162 3,569 4,131 (14%) Average Price Realization Cairn Total (US$/boe) 92.3 57.0 62% 74.4 74.8 41.9 79% Oil (US$/bbl) 95.7 59.4 61% 75.7 77.1 43.8 76% Gas (US$/mscf) 12.1 7.1 70% 11.2 10.3 4.8 115%
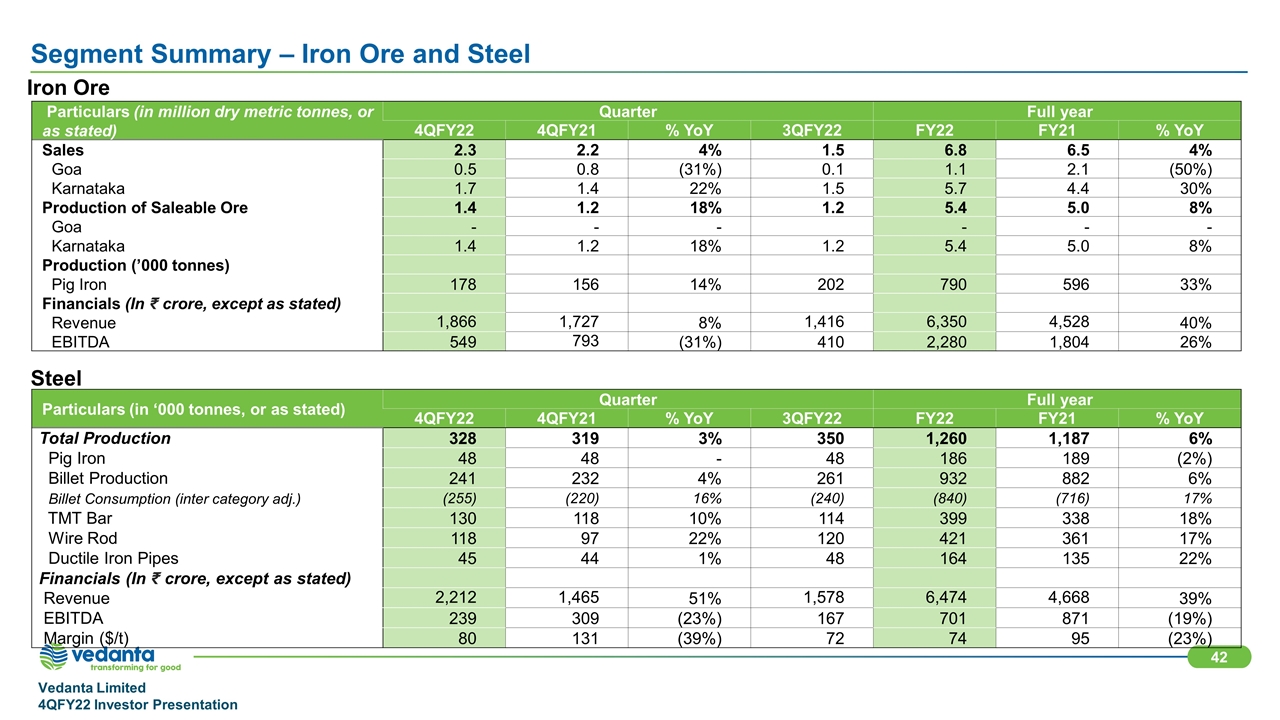
Segment Summary – Iron Ore and Steel Steel Particulars (in million dry metric tonnes, or as stated) Quarter Q4 Q3 Full year Full year as stated) 4QFY22 4QFY21 % YoY 3QFY22 FY22 FY21 % YoY Sales 2.3 2.2 4% 1.5 6.8 6.5 4% Goa 0.5 0.8 (31%) 0.1 1.1 2.1 (50%) Karnataka 1.7 1.4 22% 1.5 5.7 4.4 30% Production of Saleable Ore 1.4 1.2 18% 1.2 5.4 5.0 8% Goa - - - - - - Karnataka 1.4 1.2 18% 1.2 5.4 5.0 8% Production (’000 tonnes) Pig Iron 178 156 14% 202 790 596 33% Financials (In crore, except as stated) Revenue 1,866 1,727 8% 1,416 6,350 4,528 40% EBITDA 549 793 (31%) 410 2,280 1,804 26% Iron Ore Particulars (in ‘000 tonnes, or as stated) Quarter Q4 Q3 Full year Full year as stated) 4QFY22 4QFY21 % YoY 3QFY22 FY22 FY21 % YoY Total Production 328 319 3% 350 1,260 1,187 6% Pig Iron 48 48 - 48 186 189 (2%) Billet Production 241 232 4% 261 932 882 6% Billet Consumption (inter category adj.) (255) (220) 16% (240) (840) (716) 17% TMT Bar 130 118 10% 114 399 338 18% Wire Rod 118 97 22% 120 421 361 17% Ductile Iron Pipes 45 44 1% 48 164 135 22% Financials (In crore, except as stated) Revenue 2,212 1,465 51% 1,578 6,474 4,668 39% EBITDA 239 309 (23%) 167 701 871 (19%) Margin ($/t) 80 131 (39%) 72 74 95 (23%)
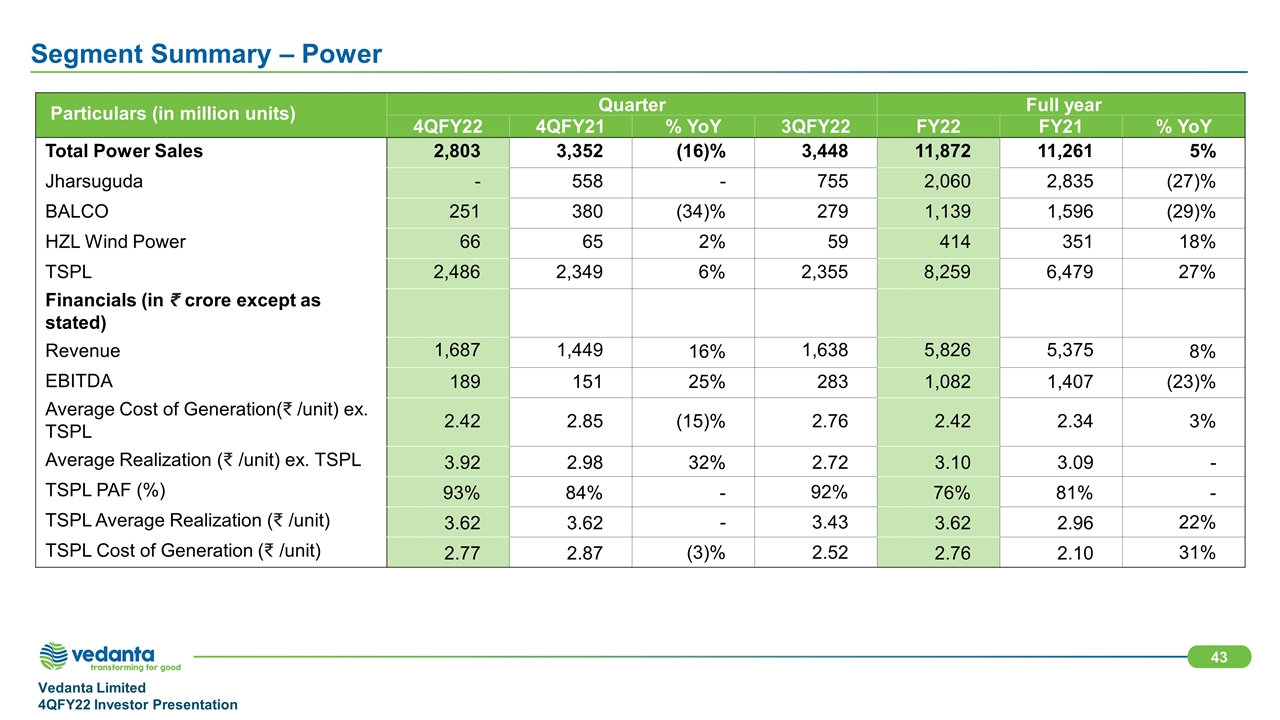
Segment Summary – Power Particulars (in million units) Quarter Q4 Q3 Full year Full year 4QFY22 4QFY21 % YoY 3QFY22 FY22 FY21 % YoY Total Power Sales 2,803 3,352 (16)% 3,448 11,872 11,261 5% Jharsuguda - 558 - 755 2,060 2,835 (27)% BALCO 251 380 (34)% 279 1,139 1,596 (29)% HZL Wind Power 66 65 2% 59 414 351 18% TSPL 2,486 2,349 6% 2,355 8,259 6,479 27% Financials (in crore except as stated) Revenue 1,687 1,449 16% 1,638 5,826 5,375 8% EBITDA 189 151 25% 283 1,082 1,407 (23)% Average Cost of Generation( /unit) ex. TSPL 2.42 2.85 (15)% 2.76 2.42 2.34 3% Average Realization ( /unit) ex. TSPL 3.92 2.98 32% 2.72 3.10 3.09 - TSPL PAF (%) 93% 84% - 92% 76% 81% - TSPL Average Realization ( /unit) 3.62 3.62 - 3.43 3.62 2.96 22% TSPL Cost of Generation ( /unit) 2.77 2.87 (3)% 2.52 2.76 2.10 31%
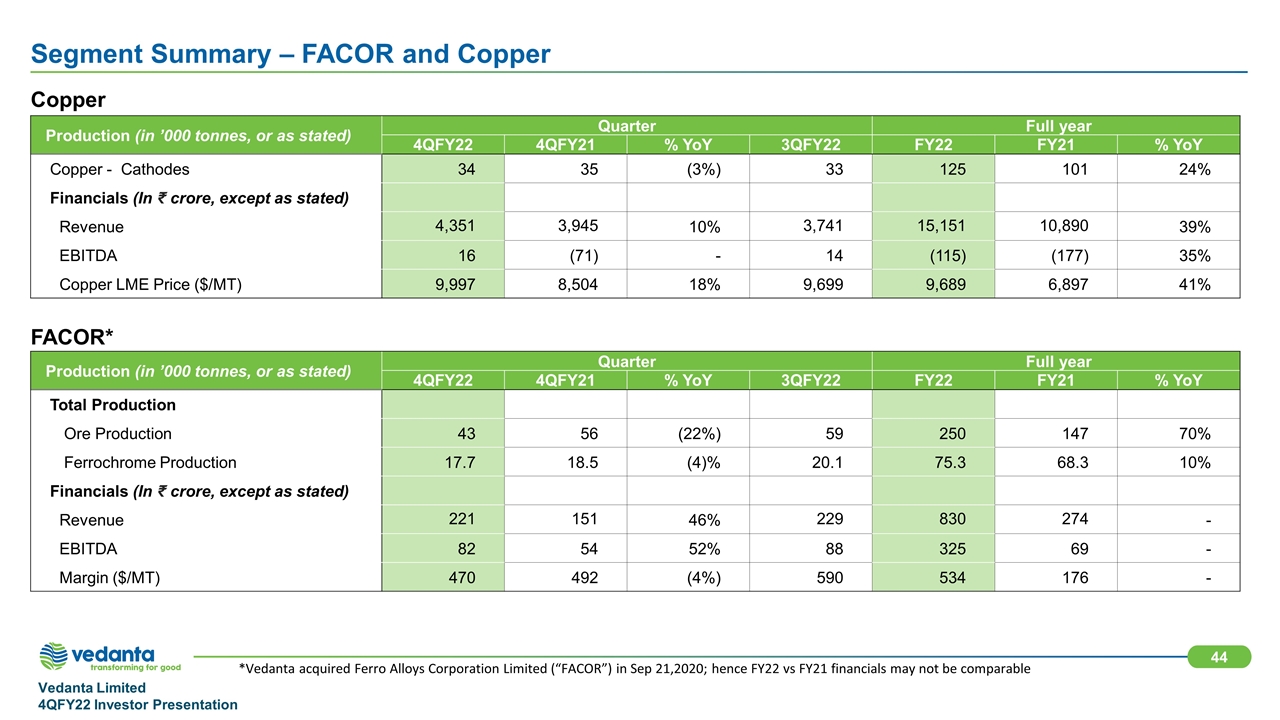
Production (in ’000 tonnes, or as stated) Quarter Q4 Q3 Full year Full year as stated) 4QFY22 4QFY21 % YoY 3QFY22 FY22 FY21 % YoY Total Production Ore Production 43 56 (22%) 59 250 147 70% Ferrochrome Production 17.7 18.5 (4)% 20.1 75.3 68.3 10% Financials (In crore, except as stated) Revenue 221 151 46% 229 830 274 - EBITDA 82 54 52% 88 325 69 - Margin ($/MT) 470 492 (4%) 590 534 176 - *Vedanta acquired Ferro Alloys Corporation Limited (“FACOR”) in Sep 21,2020; hence FY22 vs FY21 financials may not be comparable Segment Summary – FACOR and Copper FACOR* Copper Production (in ’000 tonnes, or as stated) Quarter Q4 Q3 Full year Full year as stated) 4QFY22 4QFY21 % YoY 3QFY22 FY22 FY21 % YoY Copper - Cathodes 34 35 (3%) 33 125 101 24% Financials (In crore, except as stated) Revenue 4,351 3,945 10% 3,741 15,151 10,890 39% EBITDA 16 (71) - 14 (115) (177) 35% Copper LME Price ($/MT) 9,997 8,504 18% 9,699 9,689 6,897 41%
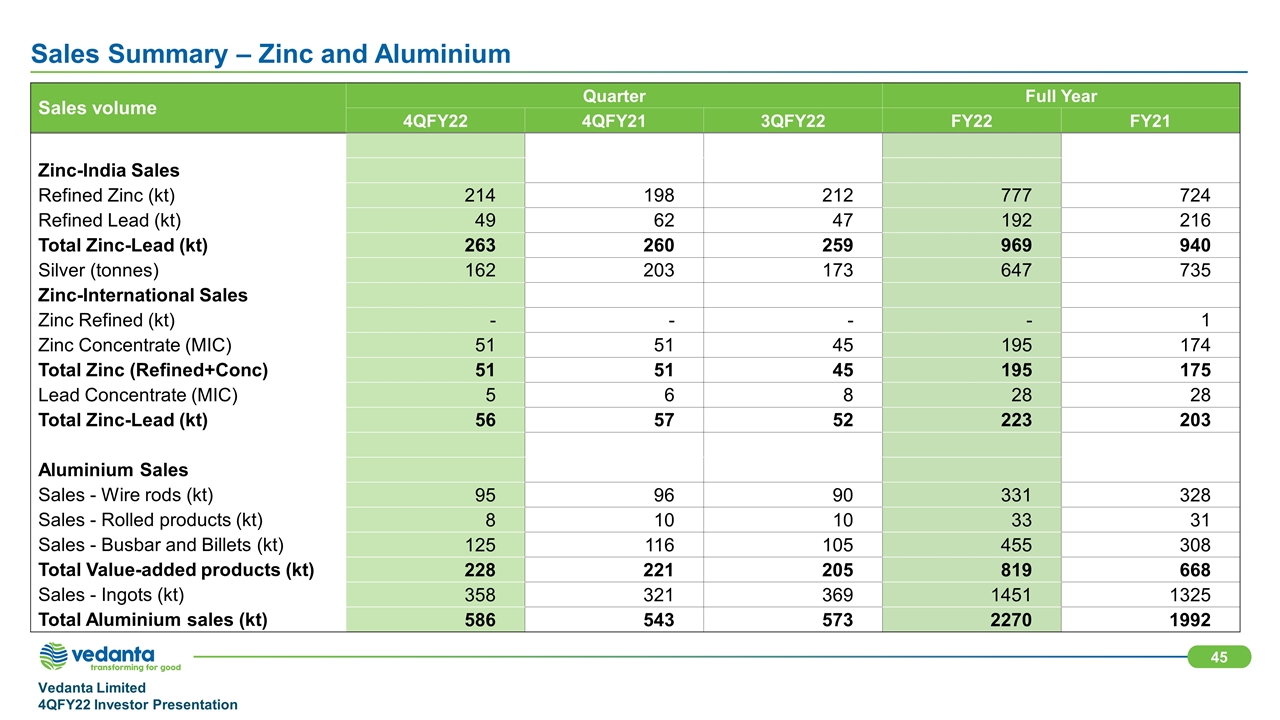
Sales Summary – Zinc and Aluminium Sales volume Quarter Full Year 4QFY22 4QFY21 3QFY22 FY22 FY21 Zinc-India Sales Refined Zinc (kt) 214 198 212 777 724 Refined Lead (kt) 49 62 47 192 216 Total Zinc-Lead (kt) 263 260 259 969 940 Silver (tonnes) 162 203 173 647 735 Zinc-International Sales Zinc Refined (kt) - - - - 1 Zinc Concentrate (MIC) 51 51 45 195 174 Total Zinc (Refined+Conc) 51 51 45 195 175 Lead Concentrate (MIC) 5 6 8 28 28 Total Zinc-Lead (kt) 56 57 52 223 203 Aluminium Sales Sales - Wire rods (kt) 95 96 90 331 328 Sales - Rolled products (kt) 8 10 10 33 31 Sales - Busbar and Billets (kt) 125 116 105 455 308 Total Value-added products (kt) 228 221 205 819 668 Sales - Ingots (kt) 358 321 369 1451 1325 Total Aluminium sales (kt) 586 543 573 2270 1992
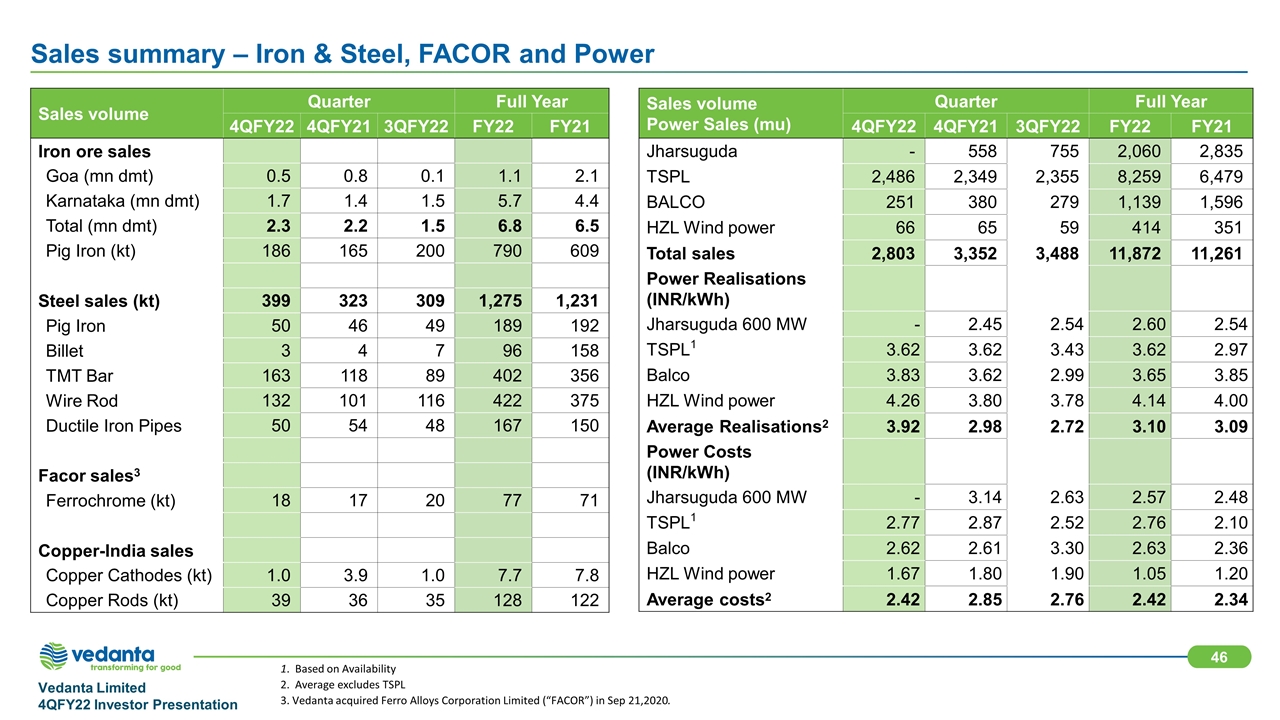
Sales summary – Iron & Steel, FACOR and Power Sales volume Quarter Full Year Sales volume 4QFY22 4QFY21 3QFY22 FY22 FY21 Iron ore sales Goa (mn dmt) 0.5 0.8 0.1 1.1 2.1 Karnataka (mn dmt) 1.7 1.4 1.5 5.7 4.4 Total (mn dmt) 2.3 2.2 1.5 6.8 6.5 Pig Iron (kt) 186 165 200 790 609 Steel sales (kt) 399 323 309 1,275 1,231 Pig Iron 50 46 49 189 192 Billet 3 4 7 96 158 TMT Bar 163 118 89 402 356 Wire Rod 132 101 116 422 375 Ductile Iron Pipes 50 54 48 167 150 Facor sales3 Ferrochrome (kt) 18 17 20 77 71 Copper-India sales Copper Cathodes (kt) 1.0 3.9 1.0 7.7 7.8 Copper Rods (kt) 39 36 35 128 122 Sales volume Power Sales (mu) Quarter Full Year 4QFY22 4QFY21 3QFY22 FY22 FY21 Jharsuguda - 558 755 2,060 2,835 TSPL 2,486 2,349 2,355 8,259 6,479 BALCO 251 380 279 1,139 1,596 HZL Wind power 66 65 59 414 351 Total sales 2,803 3,352 3,488 11,872 11,261 Power Realisations (INR/kWh) Jharsuguda 600 MW - 2.45 2.54 2.60 2.54 TSPL1 3.62 3.62 3.43 3.62 2.97 Balco 3.83 3.62 2.99 3.65 3.85 HZL Wind power 4.26 3.80 3.78 4.14 4.00 Average Realisations2 3.92 2.98 2.72 3.10 3.09 Power Costs (INR/kWh) Jharsuguda 600 MW - 3.14 2.63 2.57 2.48 TSPL1 2.77 2.87 2.52 2.76 2.10 Balco 2.62 2.61 3.30 2.63 2.36 HZL Wind power 1.67 1.80 1.90 1.05 1.20 Average costs2 2.42 2.85 2.76 2.42 2.34 1. Based on Availability 2. Average excludes TSPL 3. Vedanta acquired Ferro Alloys Corporation Limited (“FACOR”) in Sep 21,2020.
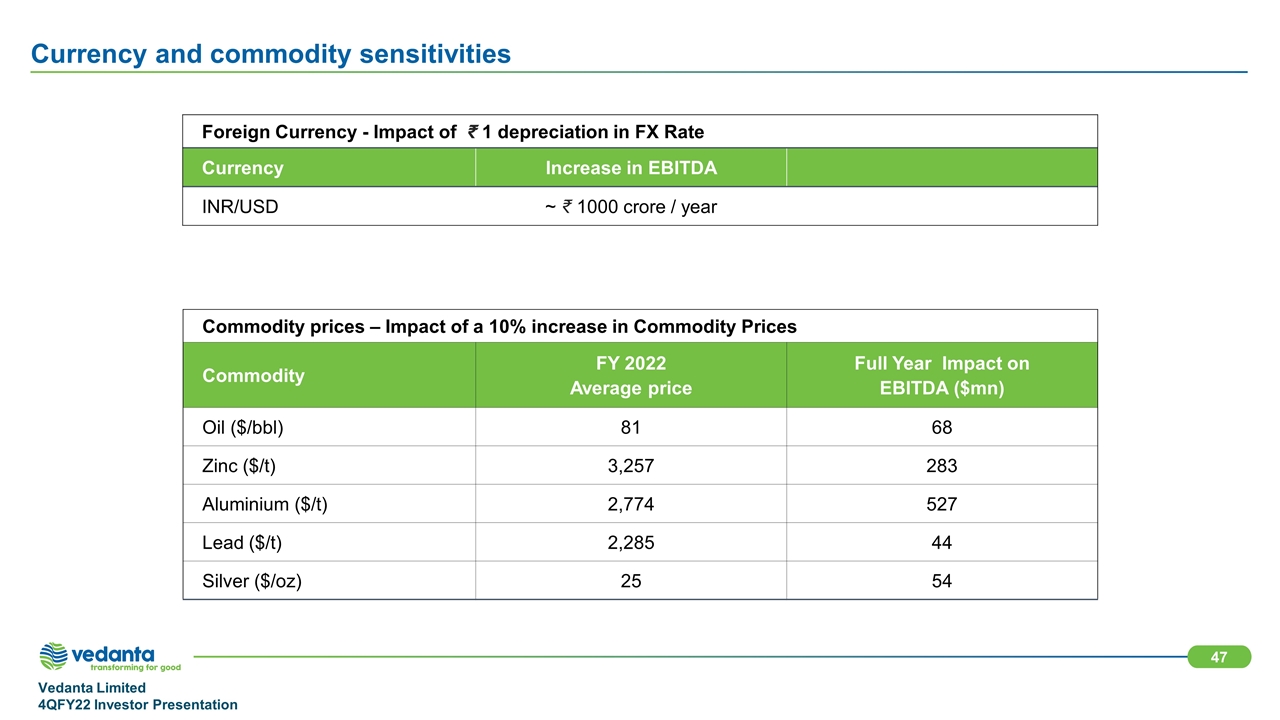
Currency and commodity sensitivities Commodity prices – Impact of a 10% increase in Commodity Prices Commodity FY 2022 Average price Full Year Impact on EBITDA ($mn) Oil ($/bbl) 81 68 Zinc ($/t) 3,257 283 Aluminium ($/t) 2,774 527 Lead ($/t) 2,285 44 Silver ($/oz) 25 54 Foreign Currency - Impact of ₹ 1 depreciation in FX Rate Currency Increase in EBITDA INR/USD ~ 1000 crore / year 116: 191: 69 0: 99: 168 237: 125: 49 109: 110: 113
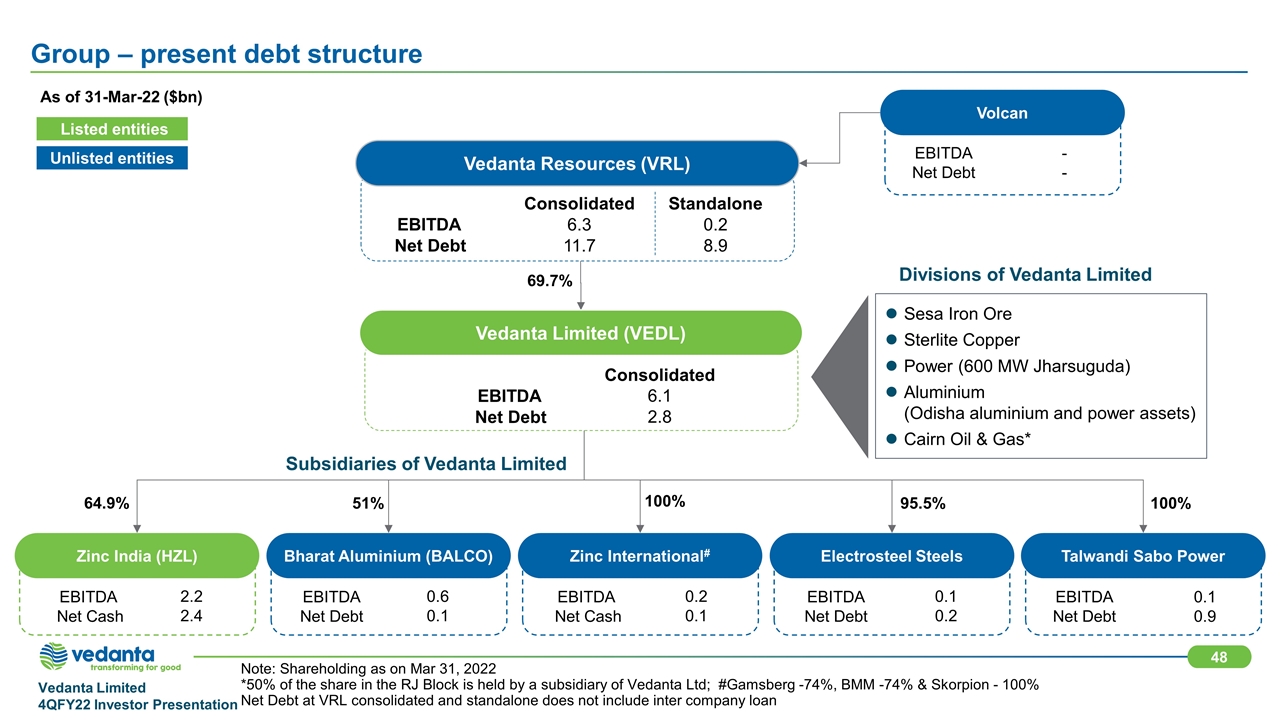
64.9% Zinc India (HZL) Bharat Aluminium (BALCO) Zinc International# Electrosteel Steels Talwandi Sabo Power 51% 95.5% 100% As of 31-Mar-22 ($bn) Unlisted entities Listed entities EBITDA 2.2 Net Cash 2.4 EBITDA 0.6 Net Debt 0.1 EBITDA 0.2 Net Cash 0.1 EBITDA 0.1 Net Debt 0.2 EBITDA 0.1 Net Debt 0.9 116: 191: 69 0: 99: 168 237: 125: 49 109: 110: 113 Sesa Iron Ore Sterlite Copper Power (600 MW Jharsuguda) Aluminium (Odisha aluminium and power assets) Cairn Oil & Gas* Divisions of Vedanta Limited Note: Shareholding as on Mar 31, 2022 *50% of the share in the RJ Block is held by a subsidiary of Vedanta Ltd; #Gamsberg -74%, BMM -74% & Skorpion - 100% Net Debt at VRL consolidated and standalone does not include inter company loan Group – present debt structure 100% Vedanta Resources (VRL) Consolidated Standalone EBITDA 6.3 0.2 Net Debt 11.7 8.9 Vedanta Limited (VEDL) Consolidated EBITDA 6.1 Net Debt 2.8 69.7% Subsidiaries of Vedanta Limited Volcan EBITDA - Net Debt -
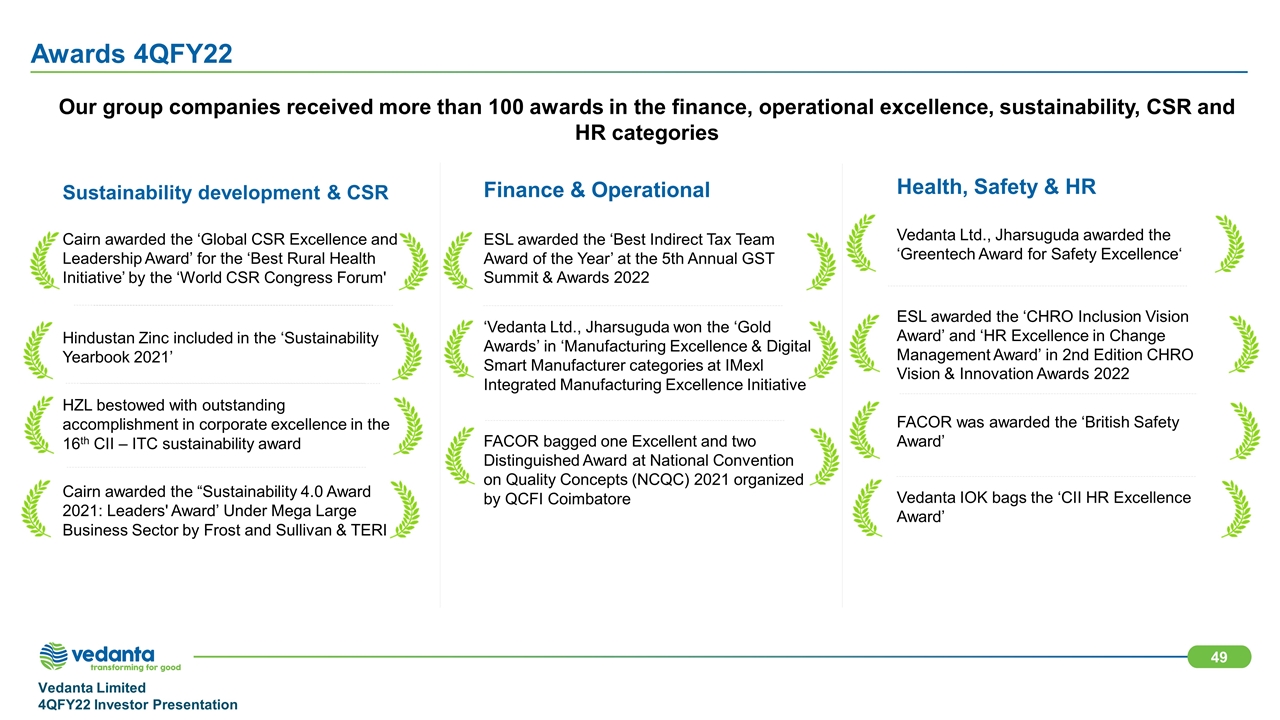
Sustainability development & CSR Cairn awarded the ‘Global CSR Excellence and Leadership Award’ for the ‘Best Rural Health Initiative’ by the ‘World CSR Congress Forum' Hindustan Zinc included in the ‘Sustainability Yearbook 2021’ HZL bestowed with outstanding accomplishment in corporate excellence in the 16th CII – ITC sustainability award Cairn awarded the “Sustainability 4.0 Award 2021: Leaders' Award’ Under Mega Large Business Sector by Frost and Sullivan & TERI Finance & Operational ESL awarded the ‘Best Indirect Tax Team Award of the Year’ at the 5th Annual GST Summit & Awards 2022 ‘Vedanta Ltd., Jharsuguda won the ‘Gold Awards’ in ‘Manufacturing Excellence & Digital Smart Manufacturer categories at IMexl Integrated Manufacturing Excellence Initiative FACOR bagged one Excellent and two Distinguished Award at National Convention on Quality Concepts (NCQC) 2021 organized by QCFI Coimbatore Health, Safety & HR Vedanta Ltd., Jharsuguda awarded the ‘Greentech Award for Safety Excellence‘ ESL awarded the ‘CHRO Inclusion Vision Award’ and ‘HR Excellence in Change Management Award’ in 2nd Edition CHRO Vision & Innovation Awards 2022 FACOR was awarded the ‘British Safety Award’ Vedanta IOK bags the ‘CII HR Excellence Award’ Our group companies received more than 100 awards in the finance, operational excellence, sustainability, CSR and HR categories Awards 4QFY22
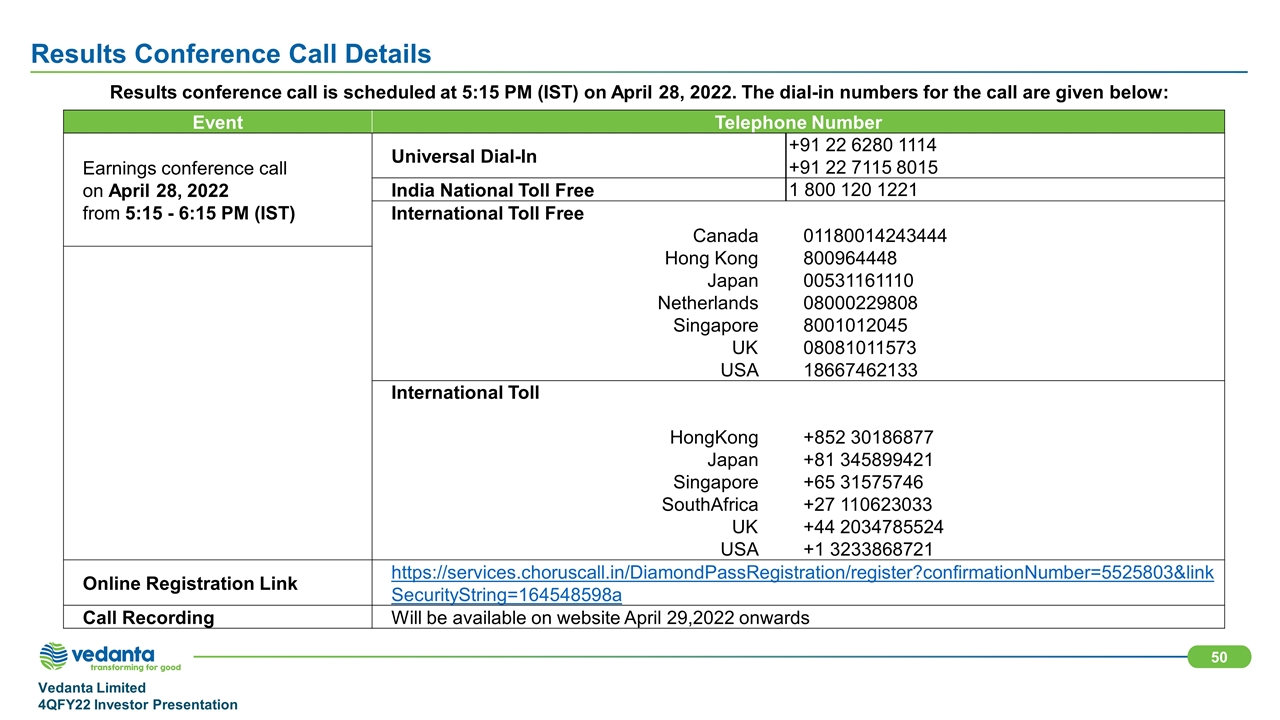
Results Conference Call Details Results conference call is scheduled at 5:15 PM (IST) on April 28, 2022. The dial-in numbers for the call are given below: Event Telephone Number Earnings conference call on April 28, 2022 from 5:15 - 6:15 PM (IST) Universal Dial-In +91 22 6280 1114 +91 22 7115 8015 India National Toll Free 1 800 120 1221 International Toll Free Canada 01180014243444 Hong Kong 800964448 Japan 00531161110 Netherlands 08000229808 Singapore 8001012045 UK 08081011573 USA 18667462133 International Toll HongKong +852 30186877 Japan +81 345899421 Singapore +65 31575746 SouthAfrica +27 110623033 UK +44 2034785524 USA +1 3233868721 Online Registration Link https://services.choruscall.in/DiamondPassRegistration/register?confirmationNumber=5525803&linkSecurityString=164548598a Call Recording Will be available on website April 29,2022 onwards 116: 191: 69 0: 99: 168 237: 125: 49 109: 110: 113


