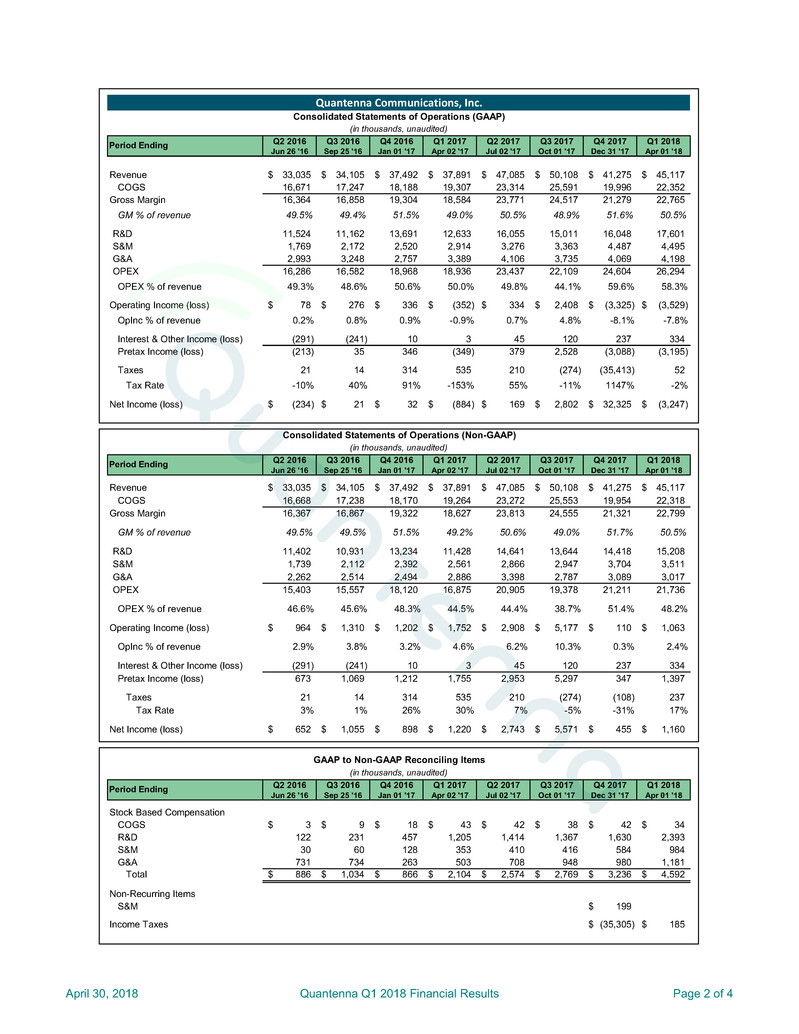
Q2 2016 Q3 2016 Q4 2016 Q1 2017 Q2 2017 Q3 2017 Q4 2017 Q1 2018 Jun 26 '16 Sep 25 '16 Jan 01 '17 Apr 02 '17 Jul 02 '17 Oct 01 '17 Dec 31 '17 Apr 01 '18 Revenue 33,035$ 34,105$ 37,492$ 37,891$ 47,085$ 50,108$ 41,275$ 45,117$ COGS 16,671 17,247 18,188 19,307 23,314 25,591 19,996 22,352 Gross Margin 16,364 16,858 19,304 18,584 23,771 24,517 21,279 22,765 GM % of revenue 49.5% 49.4% 51.5% 49.0% 50.5% 48.9% 51.6% 50.5% R&D 11,524 11,162 13,691 12,633 16,055 15,011 16,048 17,601 S&M 1,769 2,172 2,520 2,914 3,276 3,363 4,487 4,495 G&A 2,993 3,248 2,757 3,389 4,106 3,735 4,069 4,198 OPEX 16,286 16,582 18,968 18,936 23,437 22,109 24,604 26,294 OPEX % of revenue 49.3% 48.6% 50.6% 50.0% 49.8% 44.1% 59.6% 58.3% Operating Income (loss) 78$ 276$ 336$ (352)$ 334$ 2,408$ (3,325)$ (3,529)$ OpInc % of revenue 0.2% 0.8% 0.9% -0.9% 0.7% 4.8% -8.1% -7.8% Interest & Other Income (loss) (291) (241) 10 3 45 120 237 334 Pretax Income (loss) (213) 35 346 (349) 379 2,528 (3,088) (3,195) Taxes 21 14 314 535 210 (274) (35,413) 52 Tax Rate -10% 40% 91% -153% 55% -11% 1147% -2% Net Income (loss) (234)$ 21$ 32$ (884)$ 169$ 2,802$ 32,325$ (3,247)$ Q2 2016 Q3 2016 Q4 2016 Q1 2017 Q2 2017 Q3 2017 Q4 2017 Q1 2018 Jun 26 '16 Sep 25 '16 Jan 01 '17 Apr 02 '17 Jul 02 '17 Oct 01 '17 Dec 31 '17 Apr 01 '18 Revenue 33,035$ 34,105$ 37,492$ 37,891$ 47,085$ 50,108$ 41,275$ 45,117$ COGS 16,668 17,238 18,170 19,264 23,272 25,553 19,954 22,318 Gross Margin 16,367 16,867 19,322 18,627 23,813 24,555 21,321 22,799 GM % of revenue 49.5% 49.5% 51.5% 49.2% 50.6% 49.0% 51.7% 50.5% R&D 11,402 10,931 13,234 11,428 14,641 13,644 14,418 15,208 S&M 1,739 2,112 2,392 2,561 2,866 2,947 3,704 3,511 G&A 2,262 2,514 2,494 2,886 3,398 2,787 3,089 3,017 OPEX 15,403 15,557 18,120 16,875 20,905 19,378 21,211 21,736 OPEX % of revenue 46.6% 45.6% 48.3% 44.5% 44.4% 38.7% 51.4% 48.2% Operating Income (loss) 964$ 1,310$ 1,202$ 1,752$ 2,908$ 5,177$ 110$ 1,063$ OpInc % of revenue 2.9% 3.8% 3.2% 4.6% 6.2% 10.3% 0.3% 2.4% Interest & Other Income (loss) (291) (241) 10 3 45 120 237 334 Pretax Income (loss) 673 1,069 1,212 1,755 2,953 5,297 347 1,397 Taxes 21 14 314 535 210 (274) (108) 237 Tax Rate 3% 1% 26% 30% 7% -5% -31% 17% Net Income (loss) 652$ 1,055$ 898$ 1,220$ 2,743$ 5,571$ 455$ 1,160$ Q2 2016 Q3 2016 Q4 2016 Q1 2017 Q2 2017 Q3 2017 Q4 2017 Q1 2018 Jun 26 '16 Sep 25 '16 Jan 01 '17 Apr 02 '17 Jul 02 '17 Oct 01 '17 Dec 31 '17 Apr 01 '18 Stock Based Compensation COGS 3$ 9$ 18$ 43$ 42$ 38$ 42$ 34$ R&D 122 231 457 1,205 1,414 1,367 1,630 2,393 S&M 30 60 128 353 410 416 584 984 G&A 731 734 263 503 708 948 980 1,181 Total 886$ 1,034$ 866$ 2,104$ 2,574$ 2,769$ 3,236$ 4,592$ Non-Recurring Items S&M 199$ Income Taxes (35,305)$ 185$ Quantenna Communications, Inc. Consolidated Statements of Operations (GAAP) (in thousands, unaudited) Period Ending Period Ending Period Ending Consolidated Statements of Operations (Non-GAAP) GAAP to Non-GAAP Reconciling Items (in thousands, unaudited) (in thousands, unaudited) April 30, 2018 Quantenna Q1 2018 Financial Results Page 2 of 4

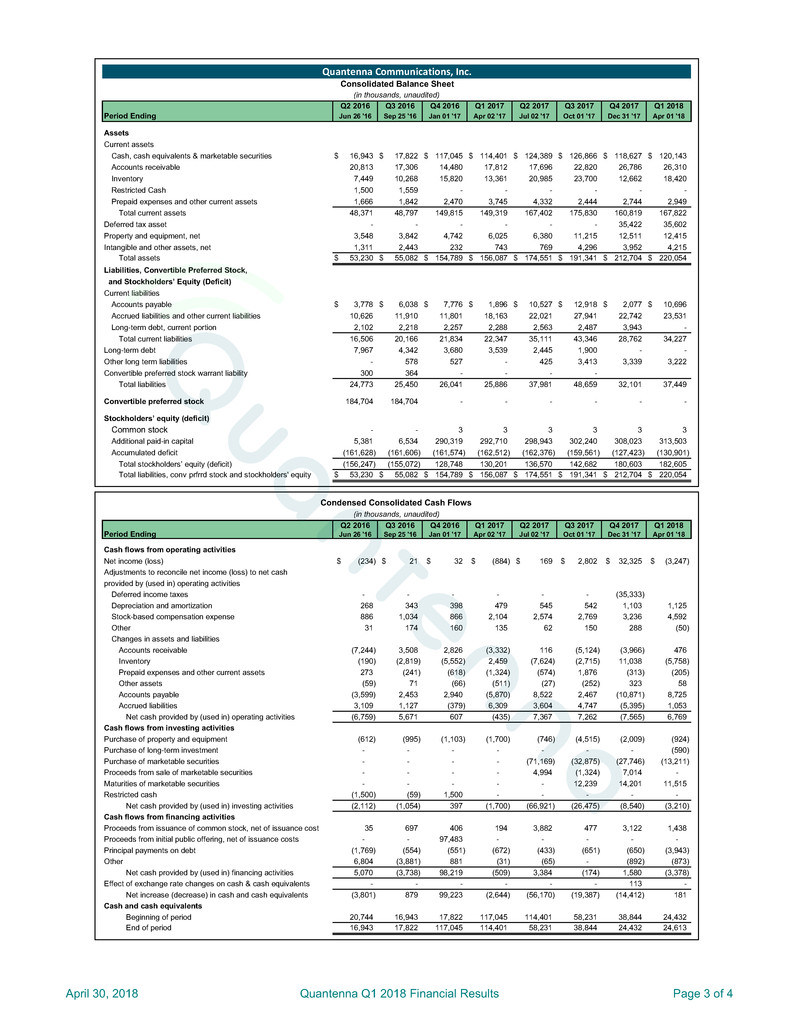
Q2 2016 Q3 2016 Q4 2016 Q1 2017 Q2 2017 Q3 2017 Q4 2017 Q1 2018 Period Ending Jun 26 '16 Sep 25 '16 Jan 01 '17 Apr 02 '17 Jul 02 '17 Oct 01 '17 Dec 31 '17 Apr 01 '18 Assets Current assets Cash, cash equivalents & marketable securities 16,943$ 17,822$ 117,045$ 114,401$ 124,389$ 126,866$ 118,627$ 120,143$ Accounts receivable 20,813 17,306 14,480 17,812 17,696 22,820 26,786 26,310 Inventory 7,449 10,268 15,820 13,361 20,985 23,700 12,662 18,420 Restricted Cash 1,500 1,559 - - - - - - Prepaid expenses and other current assets 1,666 1,842 2,470 3,745 4,332 2,444 2,744 2,949 Total current assets 48,371 48,797 149,815 149,319 167,402 175,830 160,819 167,822 Deferred tax asset - - - - - - 35,422 35,602 Property and equipment, net 3,548 3,842 4,742 6,025 6,380 11,215 12,511 12,415 Intangible and other assets, net 1,311 2,443 232 743 769 4,296 3,952 4,215 Total assets 53,230$ 55,082$ 154,789$ 156,087$ 174,551$ 191,341$ 212,704$ 220,054$ Liabilities, Convertible Preferred Stock, and Stockholders’ Equity (Deficit) Current liabilities Accounts payable 3,778$ 6,038$ 7,776$ 1,896$ 10,527$ 12,918$ 2,077$ 10,696$ Accrued liabilities and other current liabilities 10,626 11,910 11,801 18,163 22,021 27,941 22,742 23,531 Long-term debt, current portion 2,102 2,218 2,257 2,288 2,563 2,487 3,943 - Total current liabilities 16,506 20,166 21,834 22,347 35,111 43,346 28,762 34,227 Long-term debt 7,967 4,342 3,680 3,539 2,445 1,900 - - Other long term liabilities - 578 527 - 425 3,413 3,339 3,222 Convertible preferred stock warrant liability 300 364 - - - - Total liabilities 24,773 25,450 26,041 25,886 37,981 48,659 32,101 37,449 Convertible preferred stock 184,704 184,704 - - - - - - Stockholders’ equity (deficit) Common stock - - 3 3 3 3 3 3 Additional paid-in capital 5,381 6,534 290,319 292,710 298,943 302,240 308,023 313,503 Accumulated deficit (161,628) (161,606) (161,574) (162,512) (162,376) (159,561) (127,423) (130,901) Total stockholders’ equity (deficit) (156,247) (155,072) 128,748 130,201 136,570 142,682 180,603 182,605 Total liabilities, conv prfrrd stock and stockholders' equity 53,230$ 55,082$ 154,789$ 156,087$ 174,551$ 191,341$ 212,704$ 220,054$ Q2 2016 Q3 2016 Q4 2016 Q1 2017 Q2 2017 Q3 2017 Q4 2017 Q1 2018 Period Ending Jun 26 '16 Sep 25 '16 Jan 01 '17 Apr 02 '17 Jul 02 '17 Oct 01 '17 Dec 31 '17 Apr 01 '18 Cash flows from operating activities Net income (loss) (234)$ 21$ 32$ (884)$ 169$ 2,802$ 32,325$ (3,247)$ Adjustments to reconcile net income (loss) to net cash provided by (used in) operating activities Deferred income taxes - - - - - - (35,333) Depreciation and amortization 268 343 398 479 545 542 1,103 1,125 Stock-based compensation expense 886 1,034 866 2,104 2,574 2,769 3,236 4,592 Other 31 174 160 135 62 150 288 (50) Changes in assets and liabilities Accounts receivable (7,244) 3,508 2,826 (3,332) 116 (5,124) (3,966) 476 Inventory (190) (2,819) (5,552) 2,459 (7,624) (2,715) 11,038 (5,758) Prepaid expenses and other current assets 273 (241) (618) (1,324) (574) 1,876 (313) (205) Other assets (59) 71 (66) (511) (27) (252) 323 58 Accounts payable (3,599) 2,453 2,940 (5,870) 8,522 2,467 (10,871) 8,725 Accrued liabilities 3,109 1,127 (379) 6,309 3,604 4,747 (5,395) 1,053 Net cash provided by (used in) operating activities (6,759) 5,671 607 (435) 7,367 7,262 (7,565) 6,769 Cash flows from investing activities Purchase of property and equipment (612) (995) (1,103) (1,700) (746) (4,515) (2,009) (924) Purchase of long-term investment - - - - - - - (590) Purchase of marketable securities - - - - (71,169) (32,875) (27,746) (13,211) Proceeds from sale of marketable securities - - - - 4,994 (1,324) 7,014 - Maturities of marketable securities - - - - - 12,239 14,201 11,515 Restricted cash (1,500) (59) 1,500 - - - - - Net cash provided by (used in) investing activities (2,112) (1,054) 397 (1,700) (66,921) (26,475) (8,540) (3,210) Cash flows from financing activities Proceeds from issuance of common stock, net of issuance cost 35 697 406 194 3,882 477 3,122 1,438 Proceeds from initial public offering, net of issuance costs - - 97,483 - - - - - Principal payments on debt (1,769) (554) (551) (672) (433) (651) (650) (3,943) Other 6,804 (3,881) 881 (31) (65) - (892) (873) Net cash provided by (used in) financing activities 5,070 (3,738) 98,219 (509) 3,384 (174) 1,580 (3,378) Effect of exchange rate changes on cash & cash equivalents - - - - - - 113 - Net increase (decrease) in cash and cash equivalents (3,801) 879 99,223 (2,644) (56,170) (19,387) (14,412) 181 Cash and cash equivalents Beginning of period 20,744 16,943 17,822 117,045 114,401 58,231 38,844 24,432 End of period 16,943 17,822 117,045 114,401 58,231 38,844 24,432 24,613 Quantenna Communications, Inc. Consolidated Balance Sheet (in thousands, unaudited) Condensed Consolidated Cash Flows (in thousands, unaudited) April 30, 2018 Quantenna Q1 2018 Financial Results Page 3 of 4


